
Cement 1 - Energy Management Centre Kerala
40
Cement 1
-
Upload
khangminh22 -
Category
Documents
-
view
0 -
download
0
Transcript of Cement 1 - Energy Management Centre Kerala
Cement 1

Cement 2
Bureau of Energy Efficiency (BEE), Ministry of Power, Govt. of India4th Floor, Sewa Bhawan, Sector-1, R.K. Puram New Delhi, 110066, India
Deutsche Gesellschaft für Internationale Zusammenarbeit (GIZ) GmbH Registered offices: Bonn and Eschborn, Germany Indo-German Energy Programme (IGEN) C/o Bureau of Energy Efficiency West Block-2, Sector-1, R.K. Puram, New Delhi, 110066, India
We acknowledge the cooperation extended by Ministry of Power, Government of India
Responsible Winfried Damm E: [email protected]
Contributing Authors Bureau of Energy Efficiency (BEE) Abhay Bakre, Pankaj Kumar, Ashok Kumar, Sunil Khandare, Vivek Negi
Indo-German Energy Programme (IGEN) Arvind Kumar Asthana, Rita Acharya, Nitin Jain, Piyush Sharma, Ravinder Kumar
Confederation of Indian Industry (CII) K S Venkatagiri, P V Kiran Ananth, K Muralikrishnan, Balasubramanian M B and Team
Acknowledgement JK Lakshmi Cement Limited, Ramco Cements, K. N. Rao (ACC Cements), CMA
Study by: Confederation of Indian Industry (CII) CII – Sohrabji Godrej Green Business Centre Survey No. 64, Kothaguda Post, Near Hi-tech City, Hyderabad, 500084, India
Version: New Delhi, September 2018
All rights reserved. Any use of the content is subject to consent by Bureau of Energy Efficiency (BEE), and Indo-German energy Programme (IGEN), GIZ. All content has been prepared with the greatest possible care and is provided in good faith. The data has been taken from PAT cycle-I. and the projections have been done by taking the data of Ministries, wherever available. CAGR has been considered where the data from Ministry or another authentic source was not available. Historic data for key indices has been taken from various references which has been provided in the footnote of the relevant sections. BEE, GIZ and CII accepts no liability for damage of tangible or intangible nature caused directly or indirectly by the use of or failure to use the information provided.
Imprint
Dr. Winfried Damm
Head of Energy, GIZ India
Cement is an essential part of our daily lives Cement production contributes significantly to annual anthropogenic global CO
2 emissions, mainly because such vast quantities are used. Thus, energy efficiency
becomes very important in its production to reduce this carbon footprint. India, being the 2nd largest global cement producer, is amongst the world’s most energy efficient cement manufacturer. Needless to say, it has lower carbon footprint per unit of cement produced. The cement production in India is likely to grow at around 6% annually, thereby adding significant amount of CO
2 to the atmosphere. However, the
current trend in technological advancement in the industry sustains hope that the carbon footprint per unit of production will continue to decrease as has been in past decades.
Germany has been playing a very active role in promoting energy efficiency in not only its own land, but also supporting the other countries to adopt the same. Germany has been supporting India in various fields since last 60 years, with an aim of promoting cooperation and involving public-private sectors of both sides in the areas of energy, environment and sustainable economic development. The Indo-German Energy Programme (IGEN), works as a partner of Bureau of Energy Efficiency (BEE) in supporting policies and programmes envisaged under the Energy Conservation Act, 2001.
It has been a privilege to work with BEE, the organization spearheading activities on energy efficiency in India. IGEN has been involved with BEE in the Perform Achieve and Trade since its inception, and hence it is blissful to know that the outcome of this scheme led to a huge savings in terms of CO
2 emission
reduction and coal.
However, the real outcome of PAT scheme is not only the savings in terms of toe and CO2, but it is the
change in behavior towards energy efficiency. It is astonishing to see the amount of resources and concepts the industries have put together in achieving the target. Some state-of-the-art projects implemented in PAT cycle-I are cross cutting and could have significant potential across the sectors. Some of the positive outcomes of this scheme were the utilization of waste heat in generation of steam and power, adoption of cogeneration, use of alternate fuel and raw material, etc. This report analyses the outcome of PAT scheme in Cement sector in multidimensional ways and forecasts the future savings along with innovative case studies having high replication potential. The estimate suggests the cumulative energy savings from the sector till 2030 to be 34.46 million TOE, which is quite impressive.
We are delighted to be a part of this historic journey where India has been a forerunner in implementing an exceptional scheme, customized to the benefit of the industries as well as the nation. I personally feel that the deepening of this scheme in Cement sectors would prove a game changer in the times to come. This scheme has tremendous opportunities for regional synergies and its adaptation by other countries could lead to address the global climate issues.
Dr. Winfried Damm
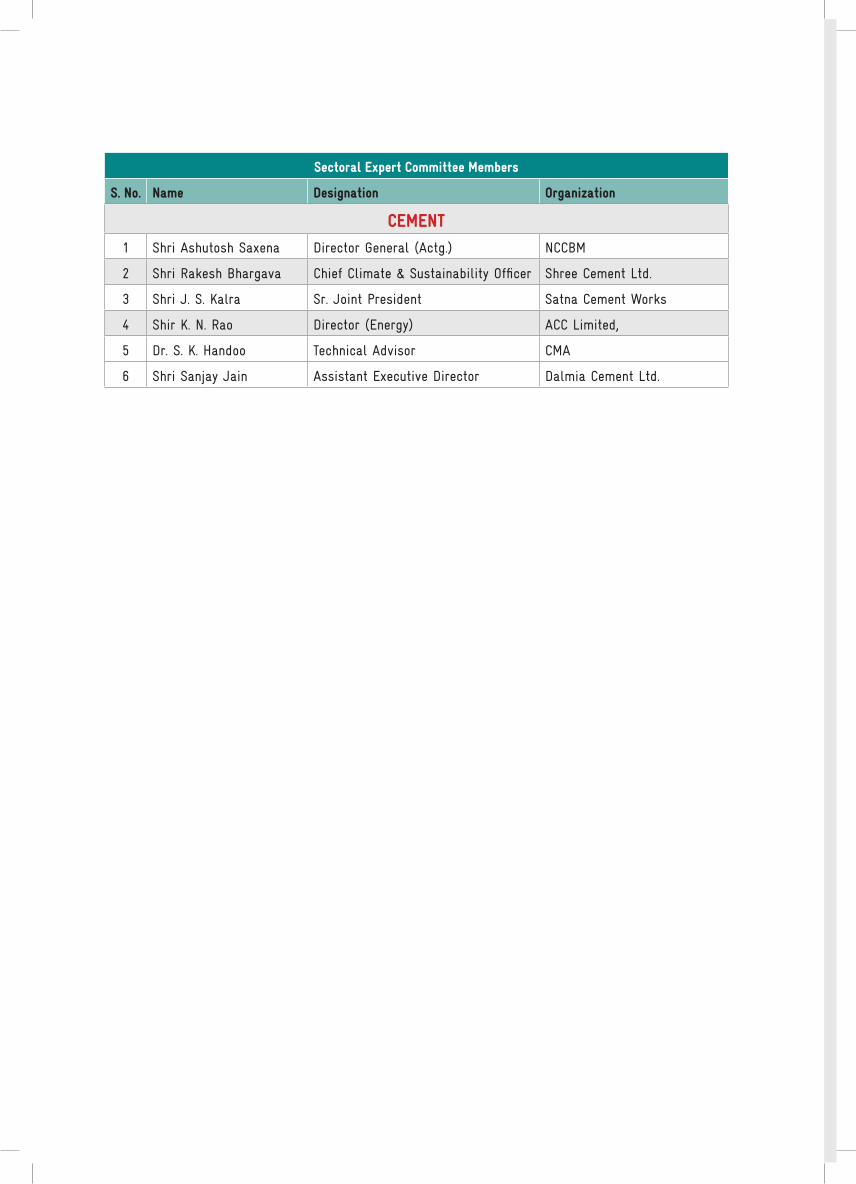
Sectoral Expert Committee Members
S. No. Name Designation Organization
CEMENt1 Shri Ashutosh Saxena Director General (Actg.) NCCBM
2 Shri Rakesh Bhargava Chief Climate & Sustainability Officer Shree Cement Ltd.
3 Shri J. S. Kalra Sr. Joint President Satna Cement Works
4 Shir K. N. Rao Director (Energy) ACC Limited,
5 Dr. S. K. Handoo Technical Advisor CMA
6 Shri Sanjay Jain Assistant Executive Director Dalmia Cement Ltd.
2.2.1 Sectoral Contribution to Country’s Energy Intensity 4
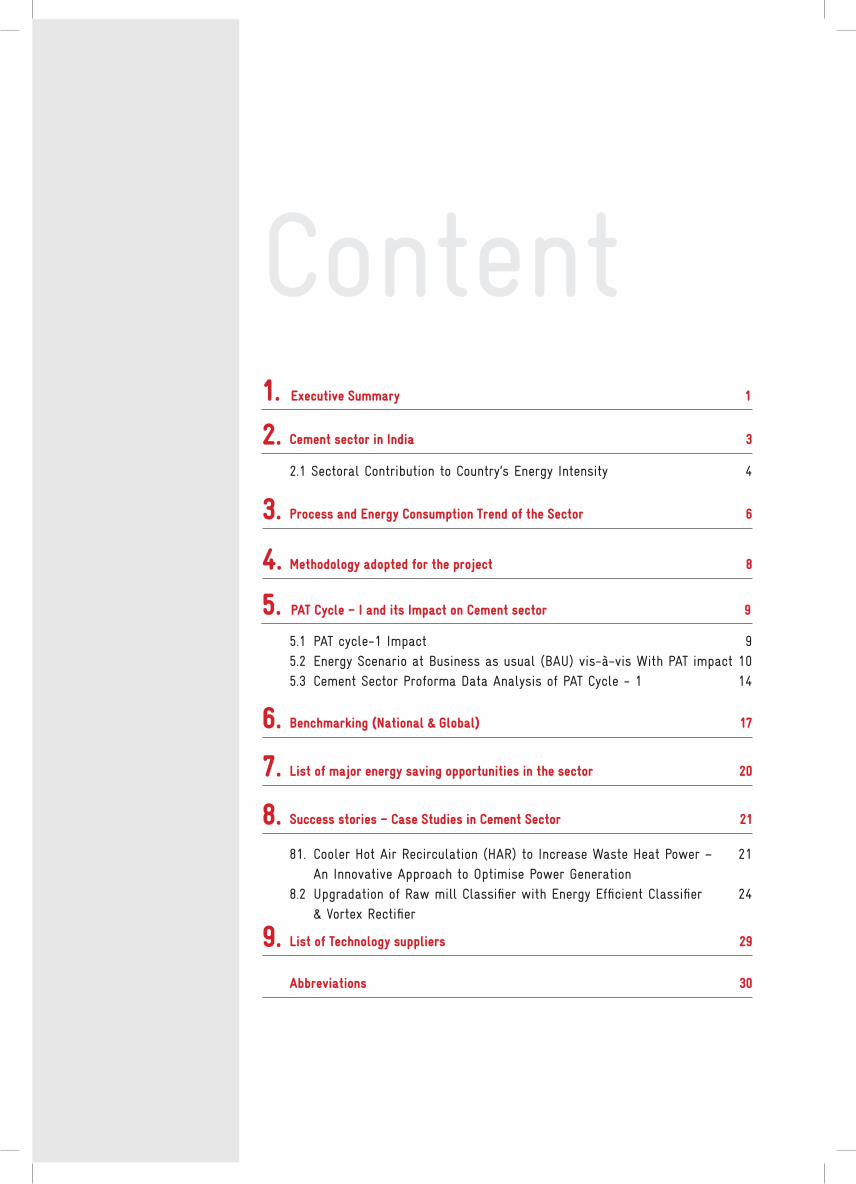
Cement sector in India 3
3. Process and Energy Consumption trend of the Sector 6
6.
7.
8.
9.
Benchmarking (National & Global) 17
List of major energy saving opportunities in the sector 20
Success stories – Case Studies in Cement Sector 21
List of technology suppliers 29
Abbreviations 30
4. Methodology adopted for the project 8
1.
5.5.1 PAT cycle-1 Impact 95.2 Energy Scenario at Business as usual (BAU) vis-à-vis With PAT impact 105.3 Cement Sector Proforma Data Analysis of PAT Cycle - 1 14
81. Cooler Hot Air Recirculation (HAR) to Increase Waste Heat Power – 21 An Innovative Approach to Optimise Power Generation8.2 Upgradation of Raw mill Classifier with Energy Efficient Classifier 24 & Vortex Rectifier
Executive Summary 1
PAt Cycle – I and its Impact on Cement sector 9
Content
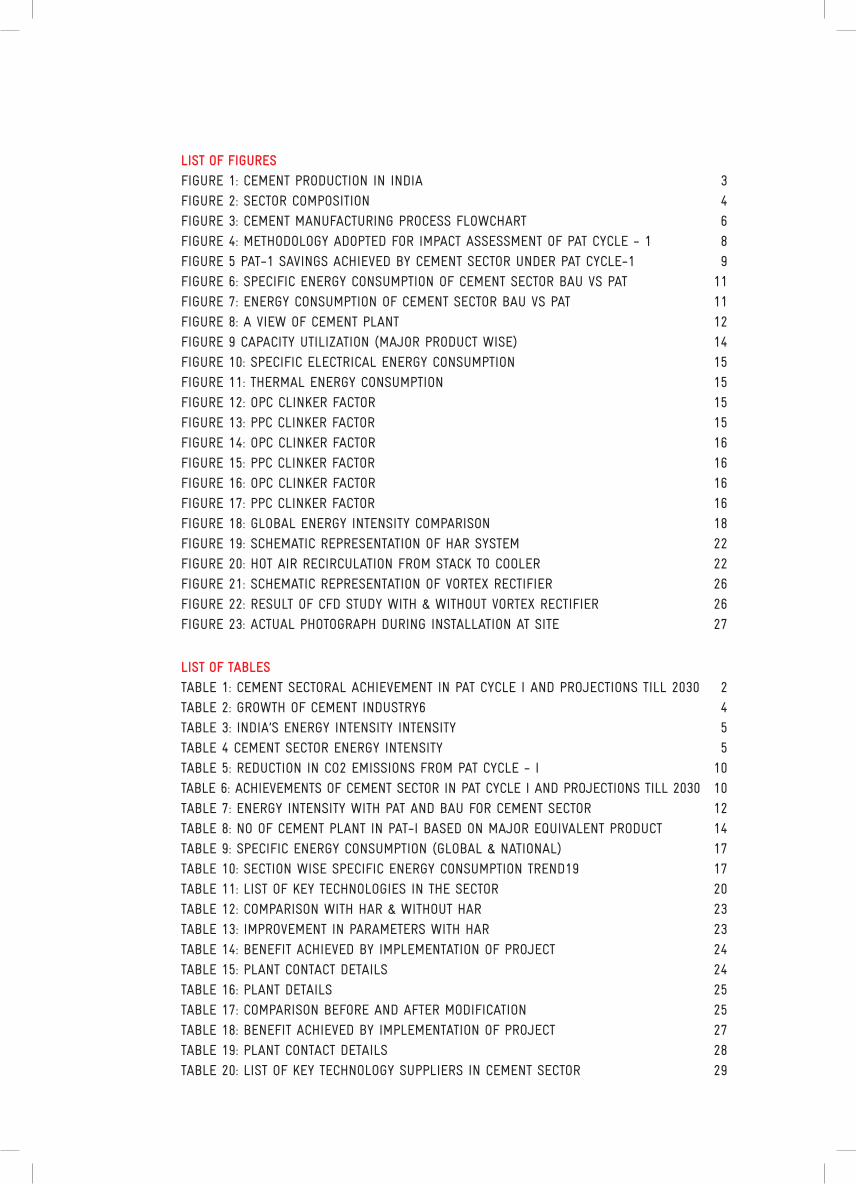
List of figuresFIGURE 1: CEMENT PRODUCTION IN INDIA 3FIGURE 2: SECTOR COMPOSITION 4FIGURE 3: CEMENT MANUFACTURING PROCESS FLOWCHART 6FIGURE 4: METHODOLOGy ADOPTED FOR IMPACT ASSESSMENT OF PAT CyCLE - 1 8FIGURE 5 PAT-1 SAVINGS ACHIEVED By CEMENT SECTOR UNDER PAT CyCLE-1 9FIGURE 6: SPECIFIC ENERGy CONSUMPTION OF CEMENT SECTOR BAU VS PAT 11FIGURE 7: ENERGy CONSUMPTION OF CEMENT SECTOR BAU VS PAT 11FIGURE 8: A VIEW OF CEMENT PLANT 12FIGURE 9 CAPACITy UTILIZATION (MAJOR PRODUCT WISE) 14FIGURE 10: SPECIFIC ELECTRICAL ENERGy CONSUMPTION 15FIGURE 11: THERMAL ENERGy CONSUMPTION 15FIGURE 12: OPC CLINKER FACTOR 15FIGURE 13: PPC CLINKER FACTOR 15FIGURE 14: OPC CLINKER FACTOR 16FIGURE 15: PPC CLINKER FACTOR 16FIGURE 16: OPC CLINKER FACTOR 16FIGURE 17: PPC CLINKER FACTOR 16FIGURE 18: GLOBAL ENERGy INTENSITy COMPARISON 18FIGURE 19: SCHEMATIC REPRESENTATION OF HAR SySTEM 22FIGURE 20: HOT AIR RECIRCULATION FROM STACK TO COOLER 22FIGURE 21: SCHEMATIC REPRESENTATION OF VORTEx RECTIFIER 26FIGURE 22: RESULT OF CFD STUDy WITH & WITHOUT VORTEx RECTIFIER 26FIGURE 23: ACTUAL PHOTOGRAPH DURING INSTALLATION AT SITE 27
List of tabLesTABLE 1: CEMENT SECTORAL ACHIEVEMENT IN PAT CyCLE I AND PROJECTIONS TILL 2030 2TABLE 2: GROWTH OF CEMENT INDUSTRy6 4TABLE 3: INDIA’S ENERGy INTENSITy INTENSITy 5TABLE 4 CEMENT SECTOR ENERGy INTENSITy 5TABLE 5: REDUCTION IN CO2 EMISSIONS FROM PAT CyCLE - I 10TABLE 6: ACHIEVEMENTS OF CEMENT SECTOR IN PAT CyCLE I AND PROJECTIONS TILL 2030 10TABLE 7: ENERGy INTENSITy WITH PAT AND BAU FOR CEMENT SECTOR 12TABLE 8: NO OF CEMENT PLANT IN PAT-I BASED ON MAJOR EqUIVALENT PRODUCT 14TABLE 9: SPECIFIC ENERGy CONSUMPTION (GLOBAL & NATIONAL) 17TABLE 10: SECTION WISE SPECIFIC ENERGy CONSUMPTION TREND19 17TABLE 11: LIST OF KEy TECHNOLOGIES IN THE SECTOR 20TABLE 12: COMPARISON WITH HAR & WITHOUT HAR 23TABLE 13: IMPROVEMENT IN PARAMETERS WITH HAR 23TABLE 14: BENEFIT ACHIEVED By IMPLEMENTATION OF PROJECT 24TABLE 15: PLANT CONTACT DETAILS 24TABLE 16: PLANT DETAILS 25TABLE 17: COMPARISON BEFORE AND AFTER MODIFICATION 25TABLE 18: BENEFIT ACHIEVED By IMPLEMENTATION OF PROJECT 27TABLE 19: PLANT CONTACT DETAILS 28TABLE 20: LIST OF KEy TECHNOLOGy SUPPLIERS IN CEMENT SECTOR 29
Cement 1
1.0 Executive SummaryIn a bid to combat increasing energy consumption and related carbon emissions, the Government of India released the National Action Plan on Climate Change (NAPCC) in 2008 to promote and enable sustainable development of the country by promoting a low carbon and high resilience development path. Under the NAPCC, eight national missions were framed to focus on various aspects related to water, solar energy, sustainable habitat, agricultural, energy efficiency, ecosystems, etc. Perform Achieve and Trade scheme (PAT) is a component of the National Mission for Enhanced Energy Efficiency (NMEEE) which is one of the eight missions under the NAPCC.
PAT is a regulatory instrument to reduce specific energy consumption (SEC) in energy intensive industries, with an associated market-based mechanism to enhance cost effectiveness through certification of excess energy savings, which could be traded. Energy Savings Certificate (ESCerts) are issued to the industries which reduce their SEC beyond their target. Those companies which fail to achieve their target are required to purchase ESCerts for compliance, or are liable to be penalised. Trading of ESCerts are conducted on existing power exchanges.
PAT Cycle - I, which was operationalized in April 2012, included 478 units, known as “Designated Consumers” (DCs), from eight energy-intensive sectors viz. Aluminium, Cement, Chlor- Alkali, Fertilizer, Iron &Steel, Pulp & Paper, Thermal Power Plant and Textile were included. The annual energy consumption of these DCs in eight sectors was around 164 million TOE. The overall SEC reduction target in the eight sectors was about 4.05% with an expected energy saving of 6.68
million TOE by the end of 2014-15.
With the completion of the PAT Cycle - I in 2015, the reported overall achievement was 8.67 million TOE, exceeding the target for cycle 1 by almost 30%. The total energy saving of 8.67 million TOE is equivalent to saving of about 20 million tonnes of coal and avoided emissions of about 31 million tonnes of CO
2. In terms of monetary value, saving
in energy consumption corresponds to Rs. 95,000 million.
PAT Cycle - I has witnessed an exceptional performance from all the sectors in terms of reducing their energy consumption. The DCs have made commendable efforts to achieve energy efficiency targets by adopting various improvement measures in technology, operational and maintenance practices, and application of management techniques.
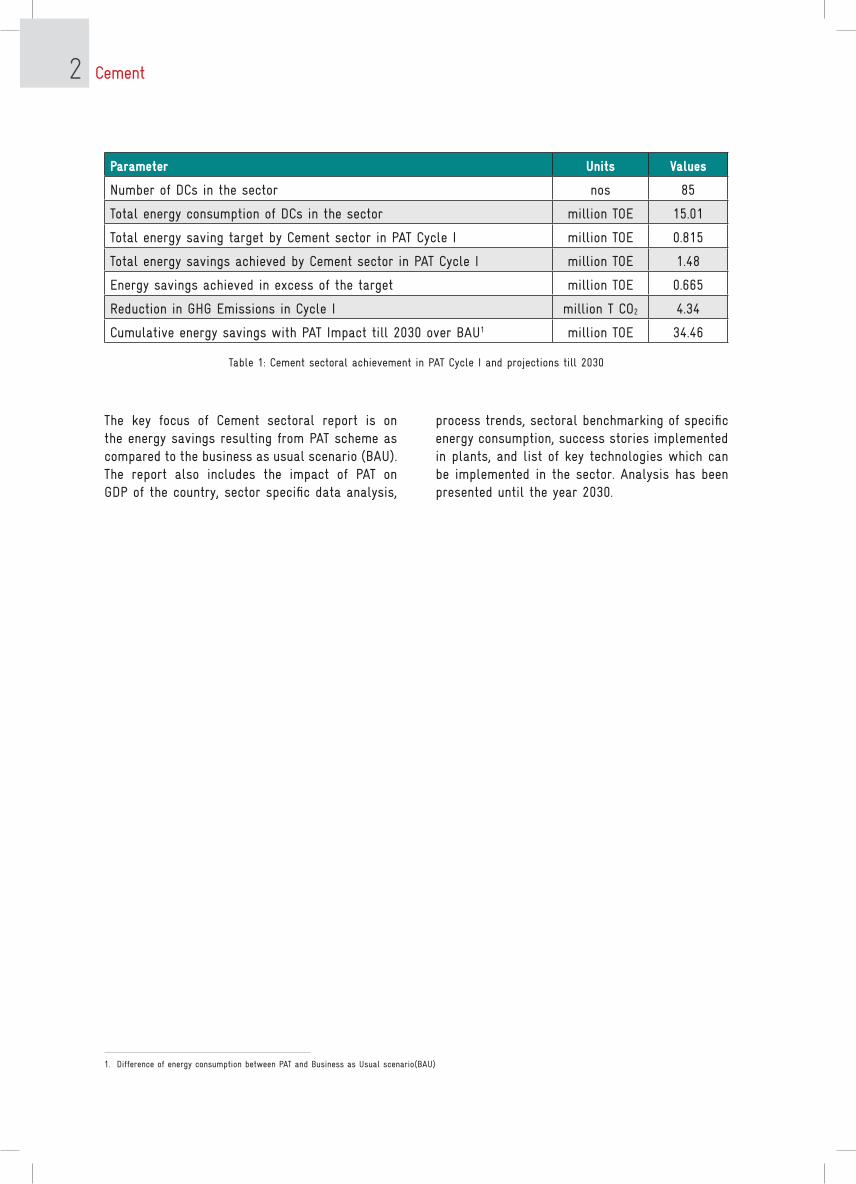
India is the second largest producer of cement in the world and is one of the major energy consumers. For the PAT scheme, cement plants having annual energy consumption greater than 30,000 million TOE were included under PAT Cycle – I. Based on the threshold defined, 85 cement plants were included as DCs and their cumulative energy consumption was 15.01 million TOE. Based on their specific energy consumption level, these DCs were given SEC target reduction of an average 5.43% resulting in 0.815 million TOE energy consumption reduction in absolute terms.
Cement sector constituted 12.19% of the overall energy saving target under PAT Cycle – I. Table 1 broadly highlights the achievement of the cement sector.
Cement 2
1. Difference of energy consumption between PAT and Business as Usual scenario(BAU)
Parameter Units Values
Number of DCs in the sector nos 85
Total energy consumption of DCs in the sector million TOE 15.01
Total energy saving target by Cement sector in PAT Cycle I million TOE 0.815
Total energy savings achieved by Cement sector in PAT Cycle I million TOE 1.48
Energy savings achieved in excess of the target million TOE 0.665
Reduction in GHG Emissions in Cycle I million T CO2 4.34
Cumulative energy savings with PAT Impact till 2030 over BAU1 million TOE 34.46
Table 1: Cement sectoral achievement in PAT Cycle I and projections till 2030
The key focus of Cement sectoral report is on the energy savings resulting from PAT scheme as compared to the business as usual scenario (BAU). The report also includes the impact of PAT on GDP of the country, sector specific data analysis,
process trends, sectoral benchmarking of specific energy consumption, success stories implemented in plants, and list of key technologies which can be implemented in the sector. Analysis has been presented until the year 2030.
Cement 3
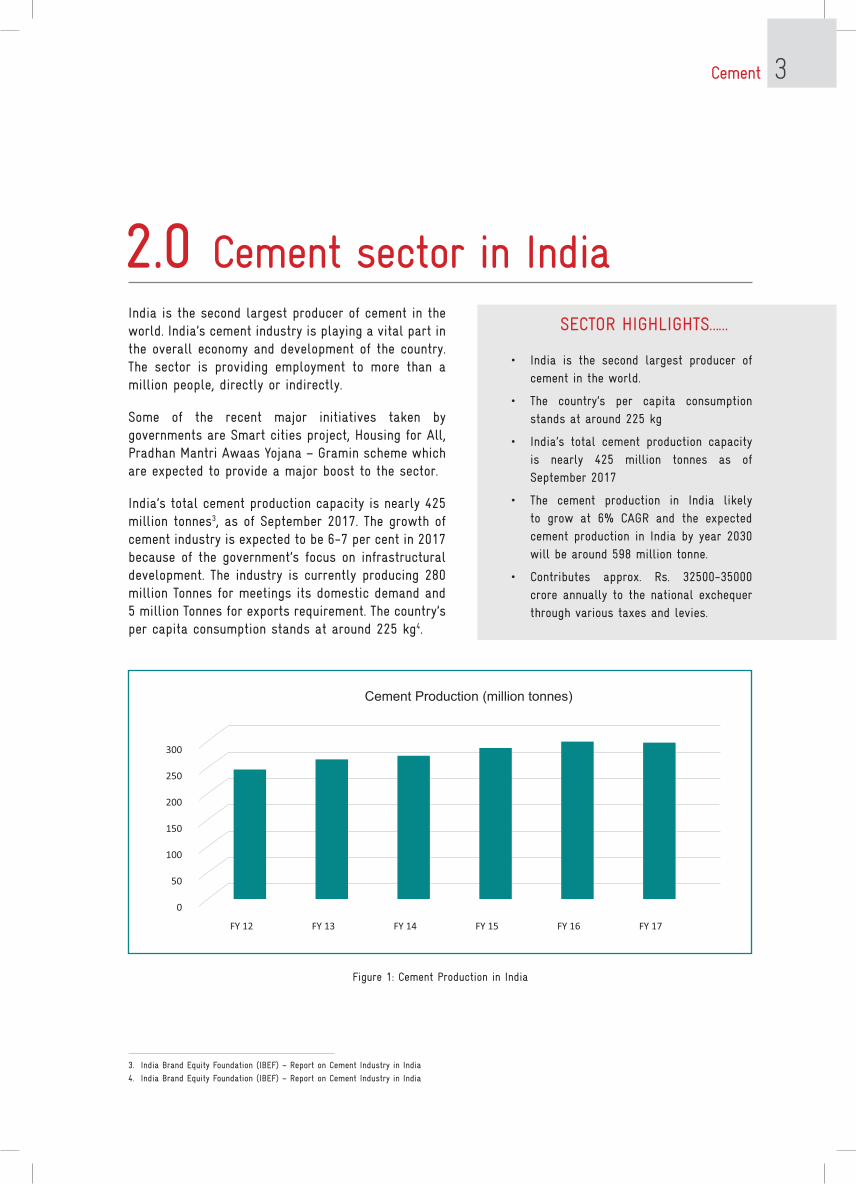
2.0 Cement sector in IndiaIndia is the second largest producer of cement in the world. India’s cement industry is playing a vital part in the overall economy and development of the country. The sector is providing employment to more than a million people, directly or indirectly.
Some of the recent major initiatives taken by governments are Smart cities project, Housing for All, Pradhan Mantri Awaas yojana – Gramin scheme which are expected to provide a major boost to the sector.
India’s total cement production capacity is nearly 425 million tonnes3, as of September 2017. The growth of cement industry is expected to be 6-7 per cent in 2017 because of the government’s focus on infrastructural development. The industry is currently producing 280 million Tonnes for meetings its domestic demand and 5 million Tonnes for exports requirement. The country’s per capita consumption stands at around 225 kg4.
SECTOR HIGHLIGHTS……
• India is the second largest producer of cement in the world.
• The country’s per capita consumption stands at around 225 kg
• India’s total cement production capacity is nearly 425 million tonnes as of September 2017
• The cement production in India likely to grow at 6% CAGR and the expected cement production in India by year 2030 will be around 598 million tonne.
• Contributes approx. Rs. 32500-35000 crore annually to the national exchequer through various taxes and levies.
3. India Brand Equity Foundation (IBEF) – Report on Cement Industry in India
4. India Brand Equity Foundation (IBEF) – Report on Cement Industry in India
Figure 1: Cement Production in India
0
50
100
150
200
250
300
FY 12 FY 13 FY 14 FY 15 FY 16 FY 17
Cement Production (million tonnes)
Figure 1: Cement Producon in India (million tonne)
Cement 4
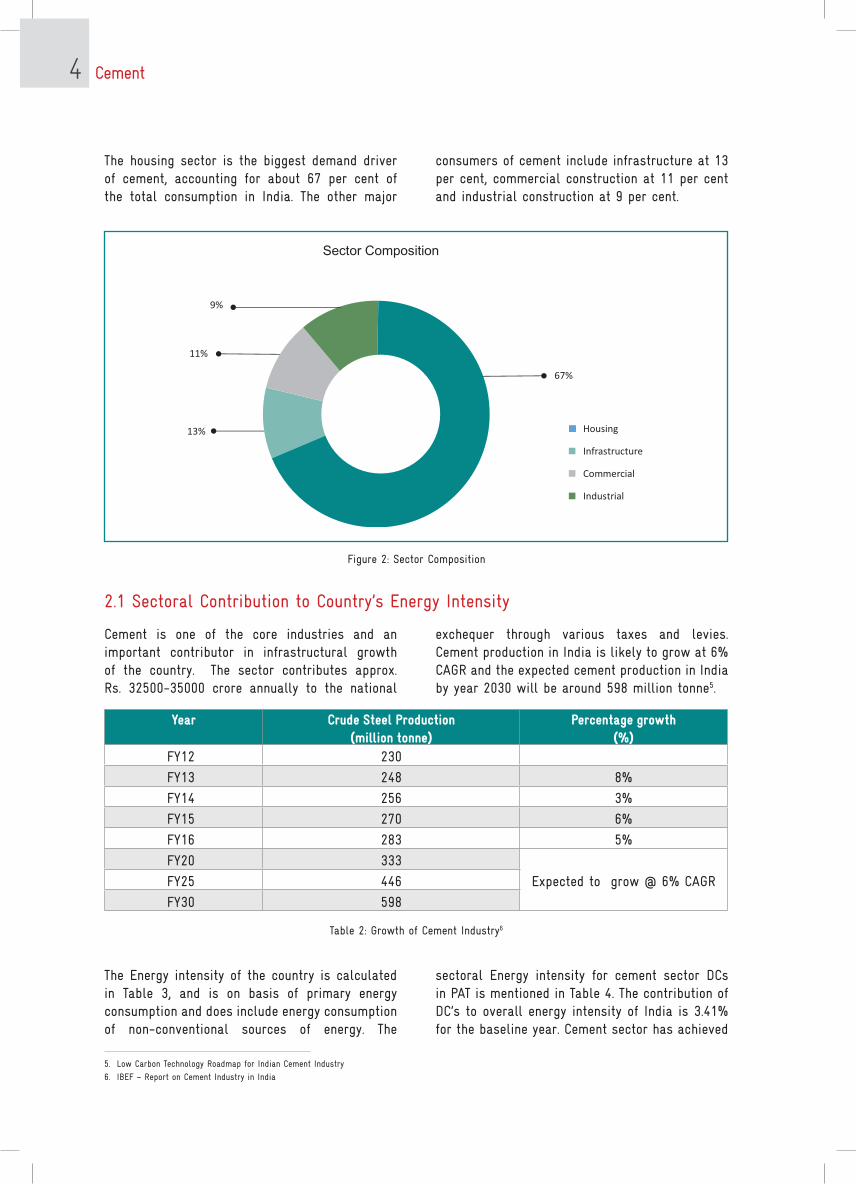
The housing sector is the biggest demand driver of cement, accounting for about 67 per cent of the total consumption in India. The other major
consumers of cement include infrastructure at 13 per cent, commercial construction at 11 per cent and industrial construction at 9 per cent.
2.1 Sectoral Contribution to Country’s Energy Intensity
5. Low Carbon Technology Roadmap for Indian Cement Industry
6. IBEF – Report on Cement Industry in India
Figure 2: Sector Composition
Sector Composition
Housing
Infrastructure
Commercial
Industrial
13%
11%
9%
67%
Cement is one of the core industries and an important contributor in infrastructural growth of the country. The sector contributes approx. Rs. 32500-35000 crore annually to the national
exchequer through various taxes and levies. Cement production in India is likely to grow at 6% CAGR and the expected cement production in India by year 2030 will be around 598 million tonne5.
Year Crude Steel Production (million tonne)
Percentage growth (%)
Fy12 230
Fy13 248 8%
Fy14 256 3%
Fy15 270 6%
Fy16 283 5%
Fy20 333
Expected to grow @ 6% CAGRFy25 446
Fy30 598
Table 2: Growth of Cement Industry6
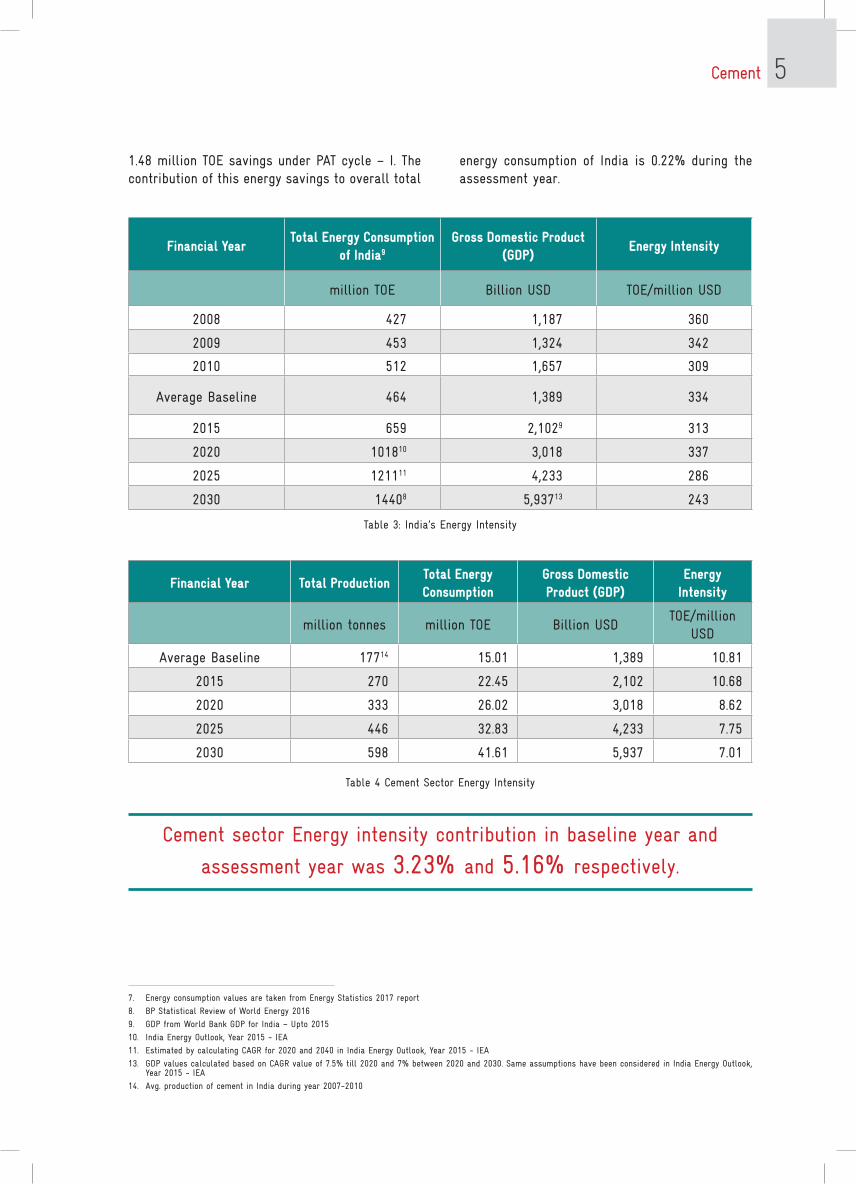
The Energy intensity of the country is calculated in Table 3, and is on basis of primary energy consumption and does include energy consumption of non-conventional sources of energy. The
sectoral Energy intensity for cement sector DCs in PAT is mentioned in Table 4. The contribution of DC’s to overall energy intensity of India is 3.41% for the baseline year. Cement sector has achieved
Cement 5
Financial Year total Productiontotal Energy Consumption
Gross Domestic Product (GDP)
Energy Intensity
million tonnes million TOE Billion USDTOE/million
USD
Average Baseline 17714 15.01 1,389 10.81
2015 270 22.45 2,102 10.68
2020 333 26.02 3,018 8.62
2025 446 32.83 4,233 7.75
2030 598 41.61 5,937 7.01
Table 4 Cement Sector Energy Intensity
7. Energy consumption values are taken from Energy Statistics 2017 report
8. BP Statistical Review of World Energy 2016
9. GDP from World Bank GDP for India – Upto 2015
10. India Energy Outlook, year 2015 - IEA
11. Estimated by calculating CAGR for 2020 and 2040 in India Energy Outlook, year 2015 - IEA
13. GDP values calculated based on CAGR value of 7.5% till 2020 and 7% between 2020 and 2030. Same assumptions have been considered in India Energy Outlook, year 2015 - IEA
14. Avg. production of cement in India during year 2007-2010
Cement sector Energy intensity contribution in baseline year and
assessment year was 3.23% and 5.16% respectively.
Financial Yeartotal Energy Consumption
of India9
Gross Domestic Product (GDP)
Energy Intensity
million TOE Billion USD TOE/million USD
2008 427 1,187 360
2009 453 1,324 342
2010 512 1,657 309
Average Baseline 464 1,389 334
2015 659 2,1029 313
2020 101810 3,018 337
2025 121111 4,233 286
2030 14408 5,93713 243
Table 3: India’s Energy Intensity
1.48 million TOE savings under PAT cycle – I. The contribution of this energy savings to overall total
energy consumption of India is 0.22% during the assessment year.
Cement 6
3.0 Process, Technologies and Energy consumption trend of the sector
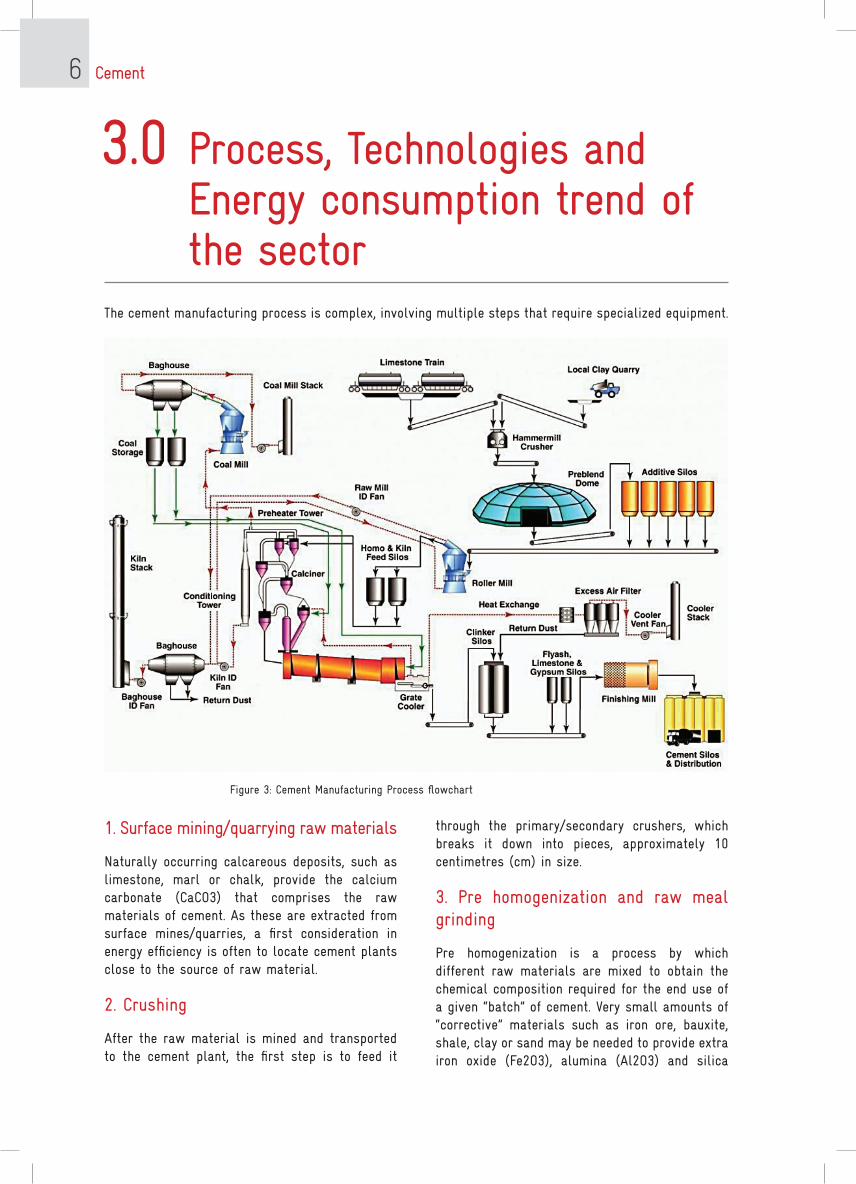
The cement manufacturing process is complex, involving multiple steps that require specialized equipment.
1. Surface mining/quarrying raw materials
Naturally occurring calcareous deposits, such as limestone, marl or chalk, provide the calcium carbonate (CaCO3) that comprises the raw materials of cement. As these are extracted from surface mines/quarries, a first consideration in energy efficiency is often to locate cement plants close to the source of raw material.
2. Crushing
After the raw material is mined and transported to the cement plant, the first step is to feed it
Figure 3: Cement Manufacturing Process flowchart
through the primary/secondary crushers, which breaks it down into pieces, approximately 10 centimetres (cm) in size.
3. Pre homogenization and raw meal grinding
Pre homogenization is a process by which different raw materials are mixed to obtain the chemical composition required for the end use of a given “batch” of cement. Very small amounts of “corrective” materials such as iron ore, bauxite, shale, clay or sand may be needed to provide extra iron oxide (Fe2O3), alumina (Al2O3) and silica
Cement 7
(SiO2) to adapt the chemical composition of the raw mix to the process and product requirements of cement manufacturing. The crushed pieces are then milled together to produce a “raw meal”. To ensure high cement quality, the chemistry of the raw materials and raw meal is very carefully monitored and controlled.
4. Coal grinding/kiln fuel preparation
Coal is grounded into fine powder to enable it to feed into the kiln as a fuel, to generate the required heat for calcination.
5. Preheating
One of the means to improve the efficiency of the process is to pre-heat the raw meal before it enters the kiln, which stimulates faster chemical reactions. A pre-heater is a series of vertical cyclones through which the raw meal is passed, coming into contact with swirling hot gases moving in the opposite direction. As these gases exhaust from the kilns, efficiency is gained by using heat generated by one production process to provide energy needed for another. Depending on the moisture content of the raw material, a kiln may have up to six stages of cyclones with higher temperatures – obtained through increased heat recovery – at each extra stage.
6. Precalcination
Calcination is the decomposition of limestone to lime. The required reactions, which also need heat energy inputs, are stimulated at two points in the manufacturing process: within the “precalciner”, a combustion chamber at the bottom of the pre-heater above the kiln, and within the kiln itself. This is the first point of the manufacturing process at which emissions are produced: the chemical decomposition of limestone typically accounts for 60% to 65% of total emissions. The fuel combustion needed to generate heat in the precalciner also produces emissions, accounting for about 65% of the remainder of total emissions.
7. Clinker production in the rotary kiln
The precalcined meal then enters the kiln, where intense heat – up to 1 450°C – causes chemical and physical reactions that partially melt the meal
into “clinker”, an intermediate product in cement manufacturing that becomes the main substance in cement and is commonly traded. Fuel is fired directly into the kiln: as the kiln rotates, about three to five times per minute, the material slides and tumbles down towards the flame, through progressively hotter zones.
8. Cooling and storing
From the kiln, the hot clinker falls onto a grate cooler where it is cooled by incoming combustion air, thereby minimising energy loss from the system. A typical cement plant will have clinker storage facilities between clinker production and the plant components that handle blending and/or grinding.
9. Blending
Increasingly, cement producers are using materials such as slag, fly ash, limestone or other mineral components to reduce the amount of clinker required for a given batch of cement. In such cases, the end product is called “blended cement”; it can be customised to provide characteristics needed for the end-use. For example, all cement types contain around 4% to 5% gypsum to control the setting time of the product.
10. Cement grinding
The cooled clinker and/or blended mixture is grounded into a grey powder, known as Ordinary Portland Cement (OPC), or ground with other mineral components to make blended cement. Traditionally, cement plants used “ball mills” for grinding. Today, more efficient technologies – including roller presses and vertical mills – are used in many modern plants. Wider deployment could further improve efficiency of the industry as a whole.
11. Storing in the cement silo
Once homogenized, the final product is stored in cement silos, ready to be dispatched either to a packing station (for bagged cement) or to a silo truck.
Refer Chapter 6 Benchmarking (National & Global) for Energy consumption trends in Indian Cement plants.
Cement 8
4.0 Methodology adopted for the project
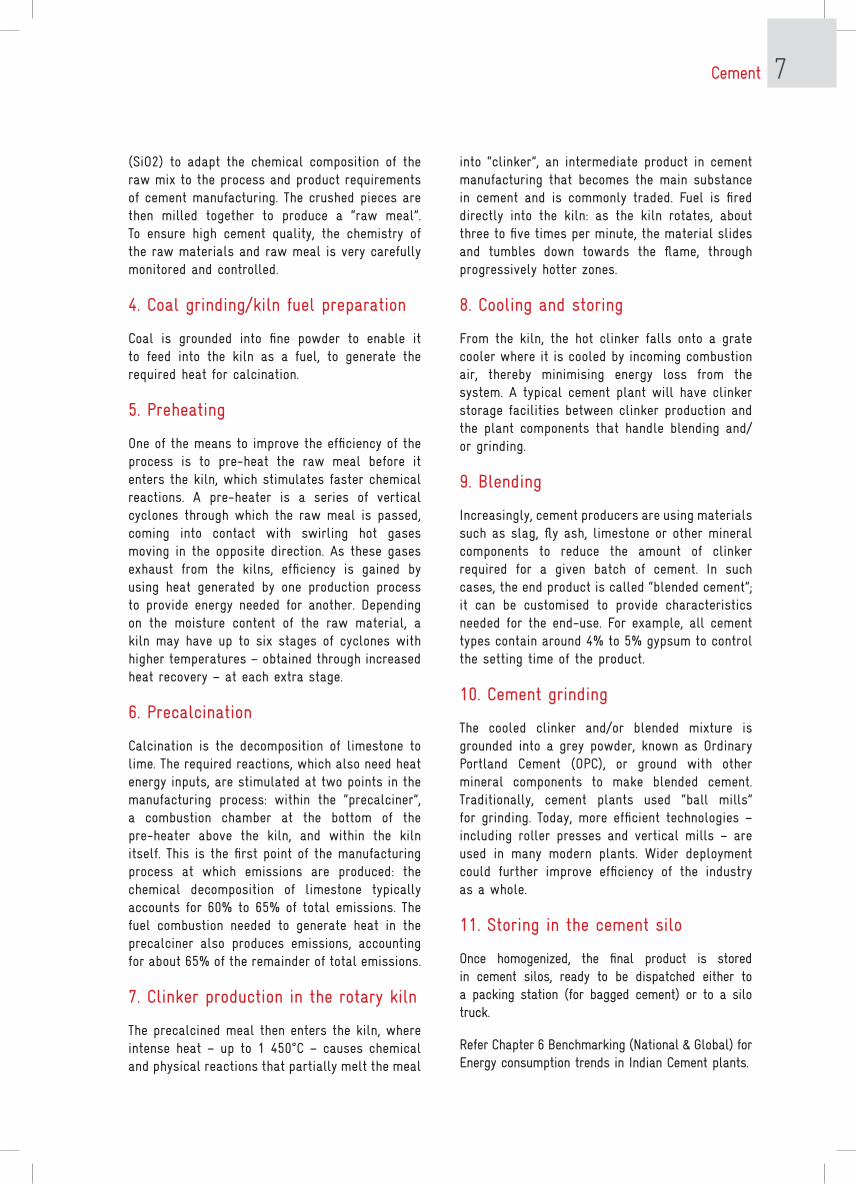
The activities were initiated with the collection of sector specific data from Bureau of Energy Efficiency (BEE). In addition, data was also collected through secondary research. Data analysis was conducted to assess the impact of PAT Cycle – I on energy intensity in the BAU v/s
PAT scenario, GDP of the country, trend analysis for energy efficiency, quantification of energy saving in terms of TOE and coal saving. Feedback was also collected from DCs on benefits and the challenges experienced through the PAT scheme.
DAtA COLLECtION
• Sector specific data from Bureau of Energy efficiency
• GDP of the country
• Benchmarking
• Additional data through CII experience and Secondary research
DAtA ANALYSIS
• Analysis of sector specific data and finding out specific energy consumption of individual processes based on PAT scheme
• Identifying GDP contribution of the sector• Impact on energy intensity• Assumptions considered for calculations for the sector
FEEDBACK FROM PAt
StAKEHOLDERS
• Identifying key senior people from sectors
• Contacting Designated consumers and collecting feedback on PAT scheme
SUCCESS StORIES
• Shortlisting of case studies
• Visit to specific plants to obtain information on Case studies
• Preparation of case studies and sharing case studies with plant team
Figure 4: Methodology adopted for Impact assessment of PAT Cycle - 1
The case studies were shortlisted based on higher savings, low cost implementation, innovative projects and high replication potential across the sector. With the assistance of BEE and GIZ, various plant visits were scheduled and conducted across
various sectors to study the technical benefits and challenges faced by designated consumers in implementing their projects. Based on the feedback from the respective plants, success stories were developed on the same.
Cement 9
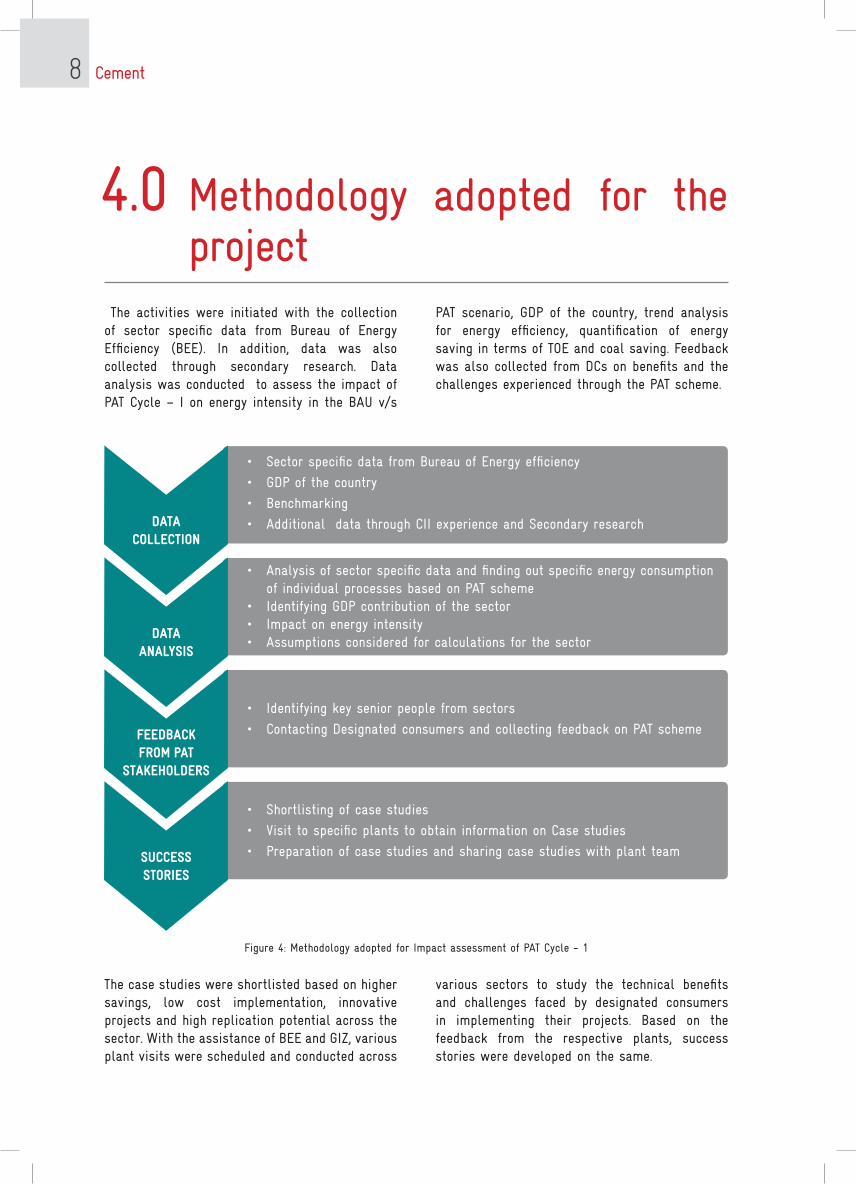
Figure 5 PAT-1 Savings achieved by Cement Sector under PAT Cycle-1
5.0 PAT Cycle – I and its Impact on Cement sector
PAT is a regulatory instrument to reduce specific energy consumption (SEC) in energy intensive industries, with an associated market-based mechanism to enhance cost effectiveness through certification of excess energy savings, which could be traded. Energy Savings Certificate (ESCerts) are issued to the industries which reduces their SEC beyond the target. Plants which do not achieve the specified target will be obliged to purchase the certificate for compliance or will be liable for penalisation. The existing power exchangers are platforms for trading of ECerts.
PAT Cycle – I started from 2012, with its baseline
from Financial years 2007 – 08 to 2009-10. The average value of specific energy consumed by the plant was taken for three years. The minimum threshold considered were based on the sectors. The minimum energy consumption of Cement sector is 30, 000 MTOE above which the plant is declared as a Designated Consumer (DC).
The total reported energy consumption of these designated consumers was about 15.01 million TOE. These DCs were given a target of 0.815 million TOE energy consumption reduction, which was around 12% of the total energy saved under PAT Cycle – I.
5.1 PAT Cycle-1 ImpactCement sector has achieved 1.48 million TOE in comparison to the target of 0.815 million TOE. This achievement has estimated GHG emission
reduction of 4.34 million tonnes of CO2 equivalent.
The results of PAT Cycle–I are summarised in Figure 5.
The savings are attributed to a number of measures adopted by the DCs. Some of the DCs have implemented short term measures with minimal investment, others have opted for medium and long-term measures requiring considerable investment. Investment of 25.68 billion INR was reported by 76% of DCs in the sector against implementation of energy conservation.
Energy Savings2.1 million tonnesof oil equivalent
4.9 milliontonnes of
coal
6.51 milliontonnes of Co2
equivalent
Savings23 billion
INR
ReportedInvestment
61.75 billion INR
`
The emissions reduction for the sector due to energy savings achieved under PAT Cycle – I and contribution of these emissions to overall GHG reduction achieved are mentioned in Table 5. The emission reduction due to reduction in fossil fuel consumption only is considered for reduction in GHG emissions.
Energy Savings 1.48 million tonnes of oil equivalent
3.42 million tonnes of coal
4.34 million tonnes of CO
2 equivalent
Savings 16 billion INR
Reported Investment
25.68 billion INR
Cement 10
Parameter Value
Reduction of CO2 emission due to implementation of PAT Cycle – I (All sectors)
31 million Tonnes of CO2 equivalent
Reduction of CO2 emission due to implementation of PAT Cycle – I Cement sector
4.34 million Tonnes of CO2 equivalent
Contribution to CO2 emission reduction in overall PAT Cycle – I
14%
Table 5: Reduction in CO2 emissions from PAT cycle - I
Particulars Unit Value
Number of plants in the sector Nos. 85
Baseline Energy Consumption in PAT Cycle I million TOE 15.01
Energy reduction target for the sector million TOE 0.815
Energy Savings achieved in PAT Cycle I million TOE 1.48
Energy Saving achieved in excess of target million TOE 0.665
Reduction in GHG Emissions in Cycle I million T CO2 4.34
Cumulative energy savings with PAT Impact till 2030 over BAU15
million TOE 34.46
Table 6: Achievements of Cement sector in PAT Cycle I and Projections till 2030
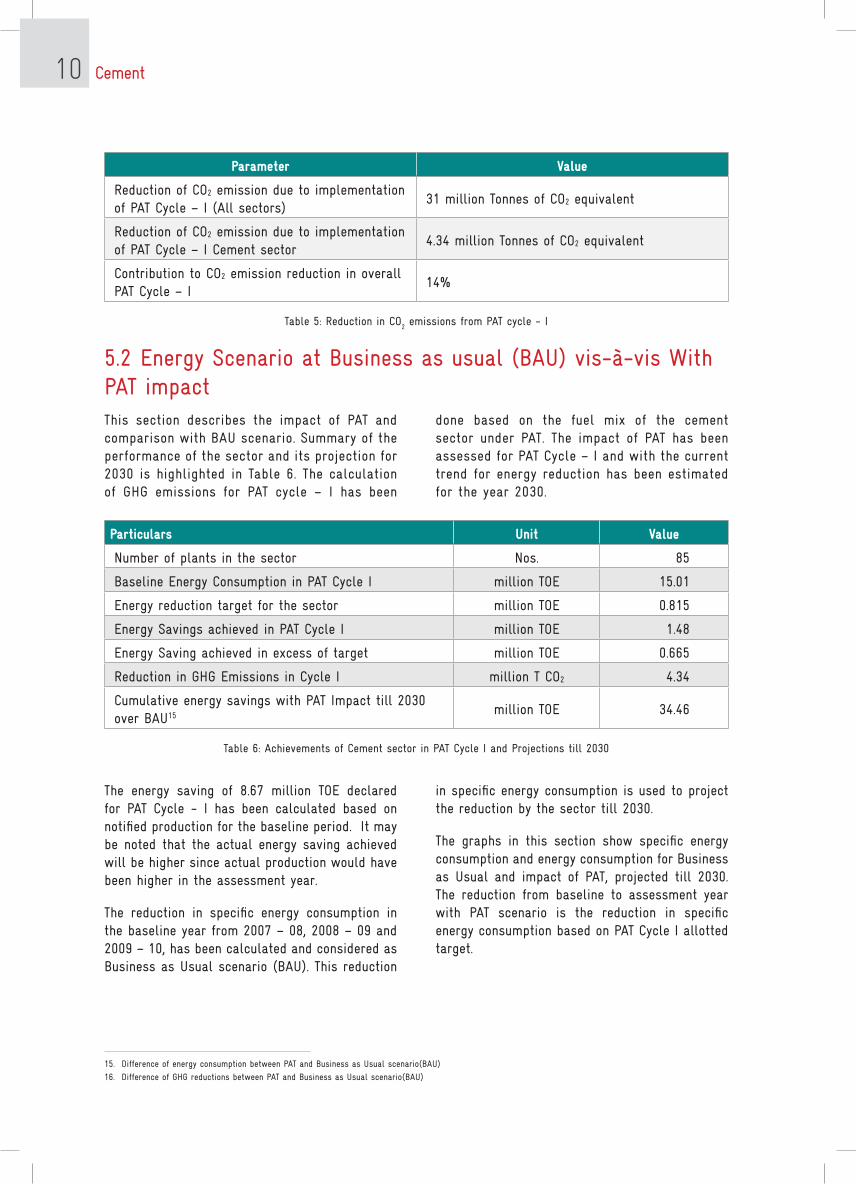
5.2 Energy Scenario at Business as usual (BAU) vis-à-vis With PAT impact
done based on the fuel mix of the cement sector under PAT. The impact of PAT has been assessed for PAT Cycle – I and with the current trend for energy reduction has been estimated for the year 2030.
This section describes the impact of PAT and comparison with BAU scenario. Summary of the performance of the sector and its projection for 2030 is highlighted in Table 6. The calculation of GHG emissions for PAT cycle – I has been
The energy saving of 8.67 million TOE declared for PAT Cycle - I has been calculated based on notified production for the baseline period. It may be noted that the actual energy saving achieved will be higher since actual production would have been higher in the assessment year.
The reduction in specific energy consumption in the baseline year from 2007 – 08, 2008 – 09 and 2009 – 10, has been calculated and considered as Business as Usual scenario (BAU). This reduction
in specific energy consumption is used to project the reduction by the sector till 2030.
The graphs in this section show specific energy consumption and energy consumption for Business as Usual and impact of PAT, projected till 2030. The reduction from baseline to assessment year with PAT scenario is the reduction in specific energy consumption based on PAT Cycle I allotted target.
15. Difference of energy consumption between PAT and Business as Usual scenario(BAU)
16. Difference of GHG reductions between PAT and Business as Usual scenario(BAU)
Cement 11
Figure 6 shows the specific energy consumption trend for the sector till 2030. Blue colour line indicates reduction in specific energy consumption
in business as usual scenario and Red colour line indicates reduction in specific energy consumption in PAT scenario.
Figure 6: Specific Energy consumption of Cement Sector BAU vs PAT
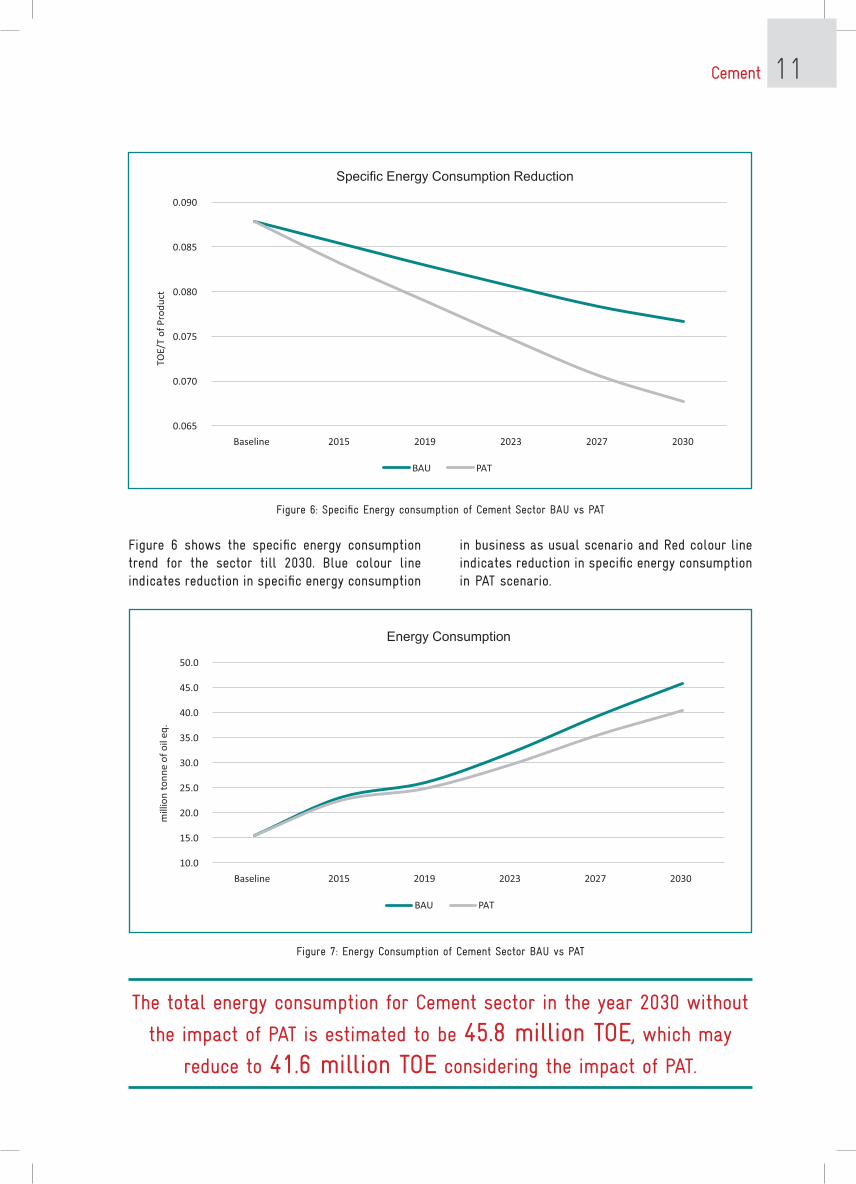
Figure 7: Energy Consumption of Cement Sector BAU vs PAT
The total energy consumption for Cement sector in the year 2030 without
the impact of PAT is estimated to be 45.8 million TOE, which may
reduce to 41.6 million TOE considering the impact of PAT.
0.065
0.070
0.075
0.080
0.085
0.090
Baseline 2015 2019 2023 2027 2030
TOE/
T o
f P
rod
uct
Specic Energy Consumption Reduction
BAU PAT
Figure 6: Specific Energy consumpon of Cement Sector BAU vs PAT
10.0
15.0
20.0
25.0
30.0
35.0
40.0
45.0
50.0
Baseline 2015 2019 2023 2027 2030
mill
ion
to
nn
e o
f o
il eq
.
Energy Consumption
BAU PAT
Cement 12
Figure 7 shows the energy consumption trend for the sector till 2030. Blue colour line indicates energy consumption of the sector (million tonne
of oil eq.) in business as usual scenario and Red colour line indicates energy consumption of the sector (million tonne of oil eq.) in PAT scenario.
Year GDP Business as usual With PAt
Billion USD Energy Intensity Energy Intensity
toe/million USD toe/million USD
Baseline 1389 10.81 10.81
2015 2102 10.96 10.68
2020 3018 9.10 8.62
2025 4233 8.38 7.75
2030 5937 7.72 7.01
Table 7: Energy Intensity with PAT and BAU for Cement Sector
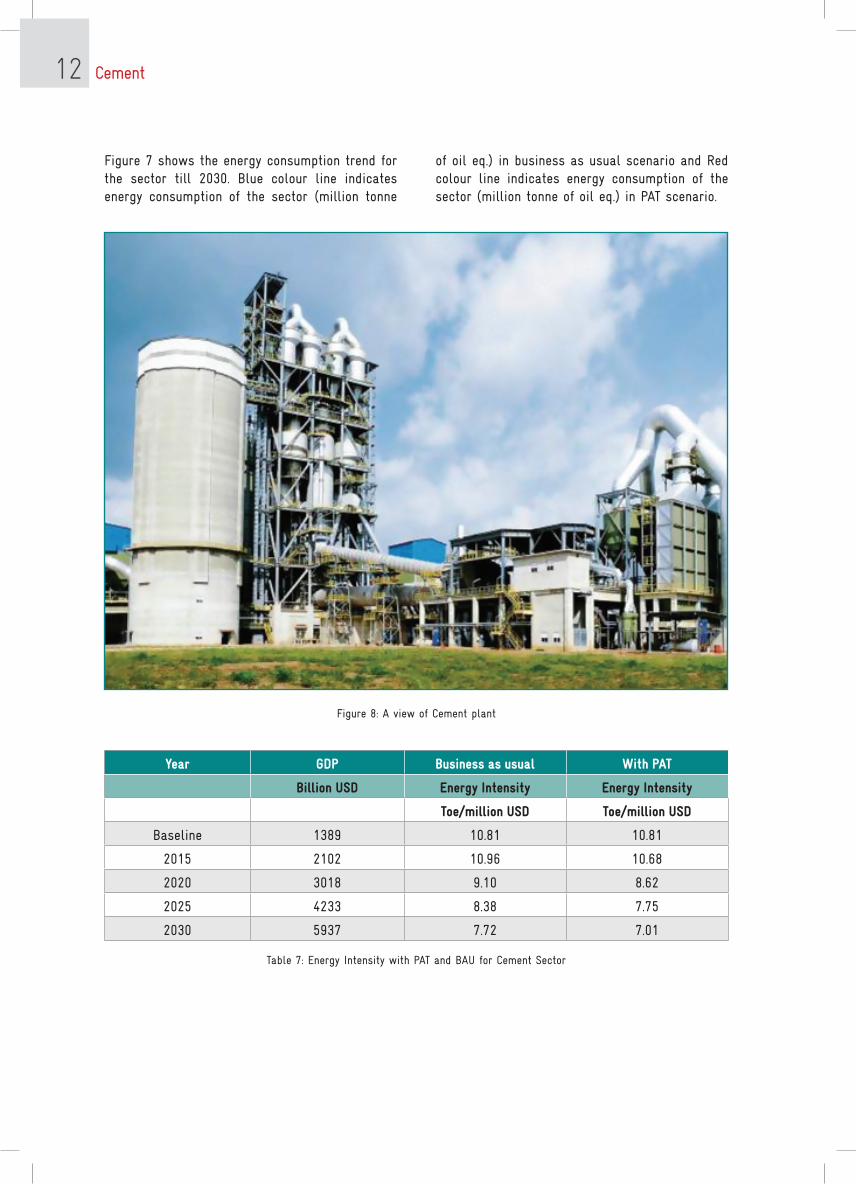
Figure 8: A view of Cement plant
Cement 13
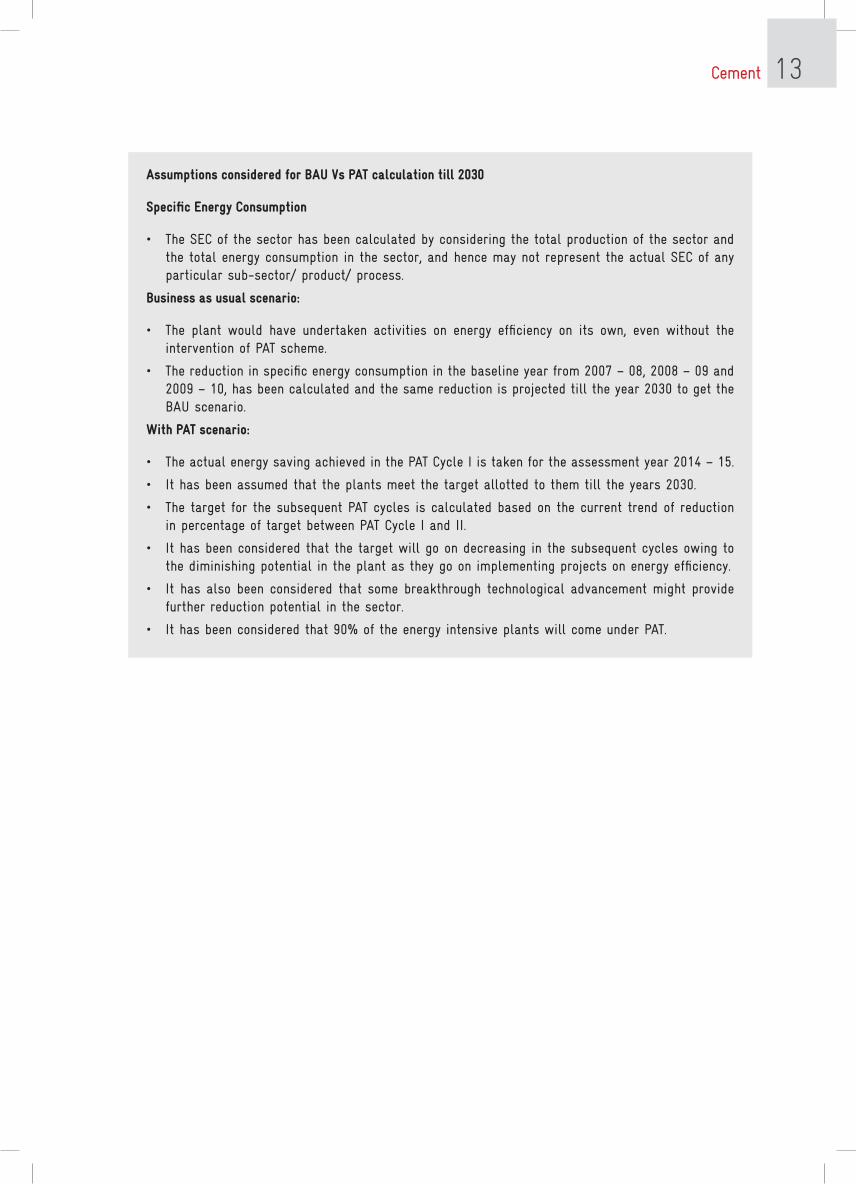
Assumptions considered for BAU Vs PAt calculation till 2030
Specific Energy Consumption
• The SEC of the sector has been calculated by considering the total production of the sector and the total energy consumption in the sector, and hence may not represent the actual SEC of any particular sub-sector/ product/ process.
Business as usual scenario:
• The plant would have undertaken activities on energy efficiency on its own, even without the intervention of PAT scheme.
• The reduction in specific energy consumption in the baseline year from 2007 – 08, 2008 – 09 and 2009 – 10, has been calculated and the same reduction is projected till the year 2030 to get the BAU scenario.
With PAt scenario:
• The actual energy saving achieved in the PAT Cycle I is taken for the assessment year 2014 – 15.
• It has been assumed that the plants meet the target allotted to them till the years 2030.
• The target for the subsequent PAT cycles is calculated based on the current trend of reduction in percentage of target between PAT Cycle I and II.
• It has been considered that the target will go on decreasing in the subsequent cycles owing to the diminishing potential in the plant as they go on implementing projects on energy efficiency.
• It has also been considered that some breakthrough technological advancement might provide further reduction potential in the sector.
• It has been considered that 90% of the energy intensive plants will come under PAT.
Cement 14
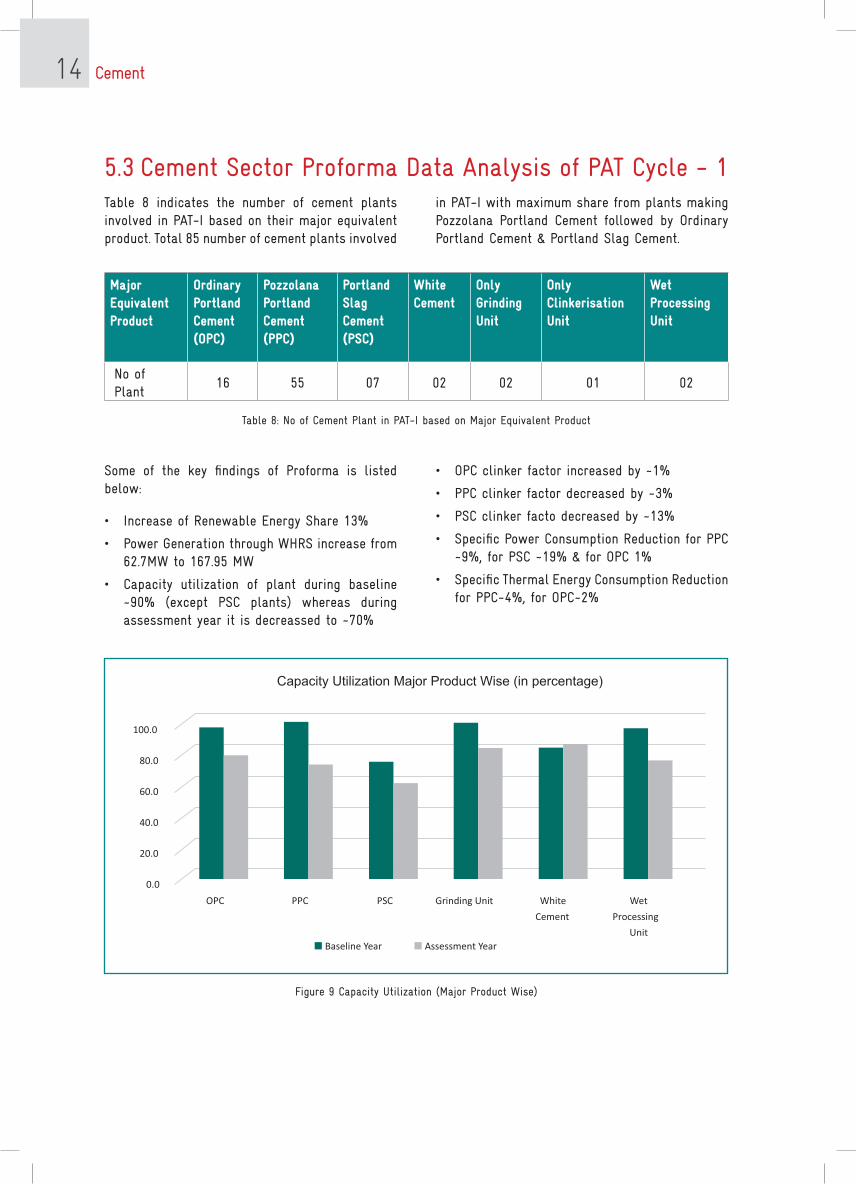
5.3 Cement Sector Proforma Data Analysis of PAT Cycle - 1 Table 8 indicates the number of cement plants involved in PAT-I based on their major equivalent product. Total 85 number of cement plants involved
Some of the key findings of Proforma is listed below:
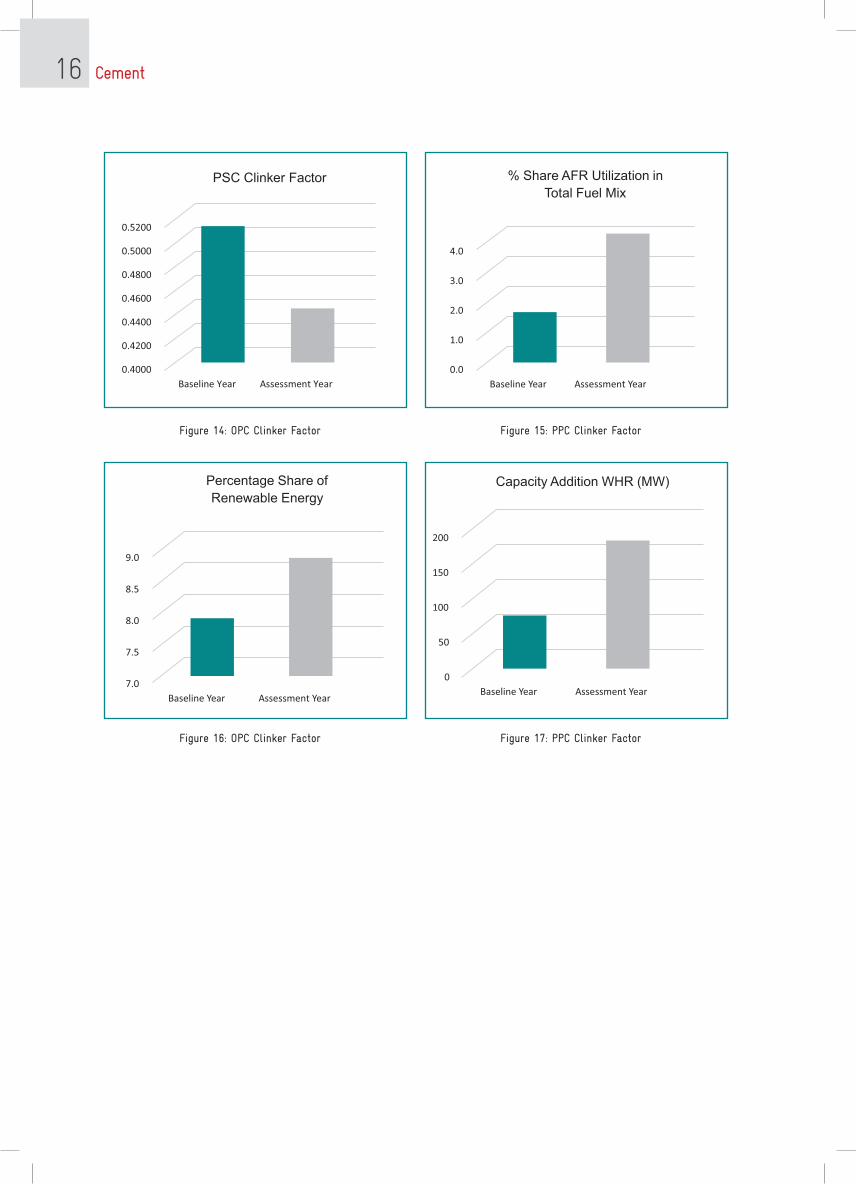
• Increase of Renewable Energy Share 13%
• Power Generation through WHRS increase from 62.7MW to 167.95 MW
• Capacity utilization of plant during baseline ~90% (except PSC plants) whereas during assessment year it is decreassed to ~70%
in PAT-I with maximum share from plants making Pozzolana Portland Cement followed by Ordinary Portland Cement & Portland Slag Cement.
Major Equivalent Product
Ordinary Portland Cement (OPC)
Pozzolana Portland Cement (PPC)
Portland Slag Cement (PSC)
White Cement
Only Grinding Unit
Only Clinkerisation Unit
Wet Processing Unit
No of Plant
16 55 07 02 02 01 02
Table 8: No of Cement Plant in PAT-I based on Major Equivalent Product
Figure 9 Capacity Utilization (Major Product Wise)
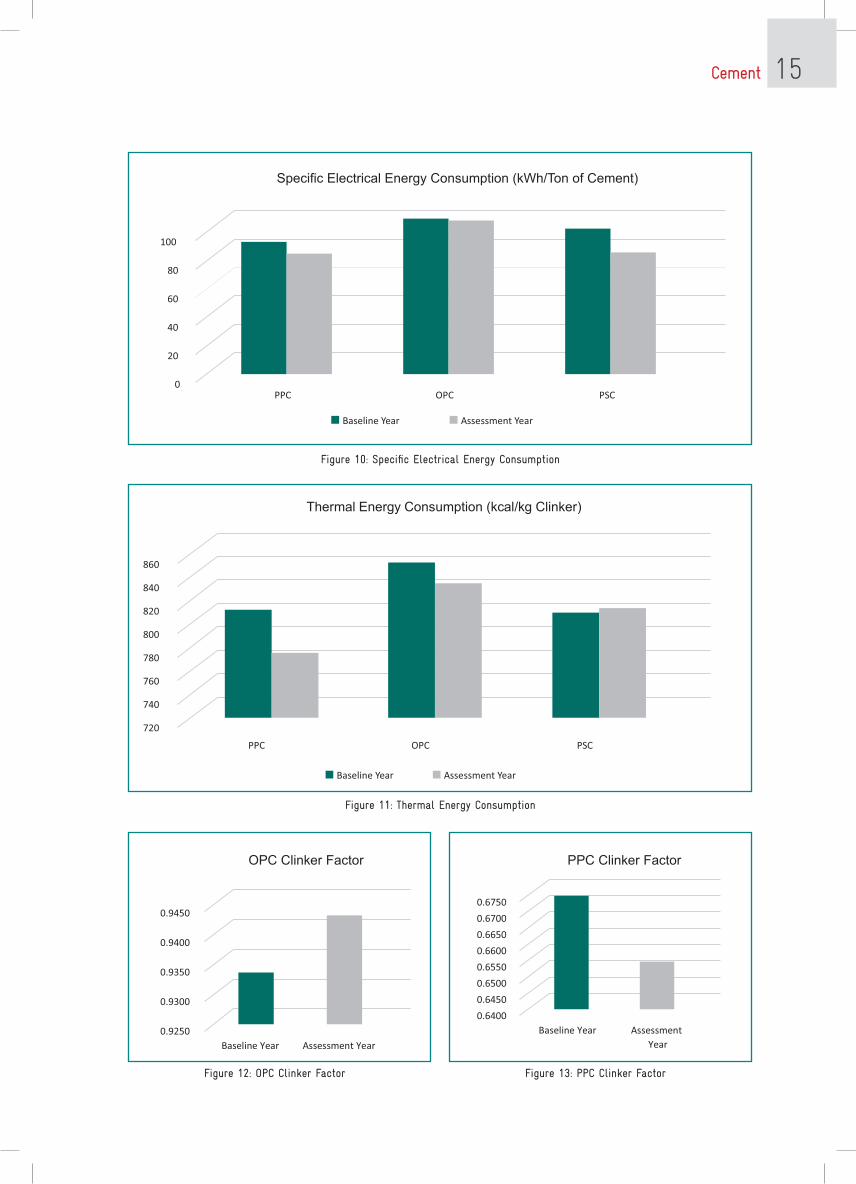
• OPC clinker factor increased by ~1%
• PPC clinker factor decreased by ~3%
• PSC clinker facto decreased by ~13%
• Specific Power Consumption Reduction for PPC ~9%, for PSC ~19% & for OPC 1%
• Specific Thermal Energy Consumption Reduction for PPC~4%, for OPC~2%
0.0
20.0
40.0
60.0
80.0
100.0
OPC PPC PSC Grinding Unit White
Cement
Wet
Processing
Unit
Capacity Utilization Major Product Wise (in percentage)
Baseline Year Assessment Year
Figure 9 Percentage Capacity Utilization
Cement 15
0
20
40
60
80
100
PPC OPC PSC
Specific Electrical Energy Consumption (kWh/Ton of Cement)
Baseline Year Assessment Year
g-10Figure 10: Specific Electrical Energy Consumption
Figure 11: Thermal Energy Consumption
Figure 12: OPC Clinker Factor Figure 13: PPC Clinker Factor
Figure 11: Thermal Energy Consumpon (kcal/kg clinker)
720
740
760
780
800
820
840
860
Thermal Energy Consumption (kcal/kg Clinker)
Baseline Year Assessment Year
PPC OPC PSC
Figure 12
PPC Clinker Factor
Figure 13
OPC Clinker Factor
0.6400
0.6450
0.6500
0.6550
0.6600
0.6650
0.6700
0.6750
Baseline Year Assessment
Year
PPC Clinker Factor
0.9250
0.9300
0.9350
0.9400
0.9450
Baseline Year Assessment Year
OPC Clinker Factor
Cement 16
Figure 14: OPC Clinker Factor
Figure 16: OPC Clinker Factor
Figure 15: PPC Clinker Factor
Figure 17: PPC Clinker Factor
0.4000
0.4200
0.4400
0.4600
0.4800
0.5000
0.5200
Baseline Year Assessment Year
PSC Clinker Factor
7.0
7.5
8.0
8.5
9.0
Baseline Year Assessment Year
Percentage Share of
Renewable Energy
0.0
1.0
2.0
3.0
4.0
Baseline Year Assessment Year
% Share AFR Utilization in
Total Fuel Mix
0
50
100
150
200
Baseline Year Assessment Year
Capacity Addition WHR (MW)
Figure 14: PSC Clinker Factor
Figure 15:
% Share AFR
ulizaon in total fuel mix
Figure 16: % share of Renewable Energy
Figure 17: Capacity
Addion
through WHR
Cement 17
6.0 Benchmarking (National & Global)
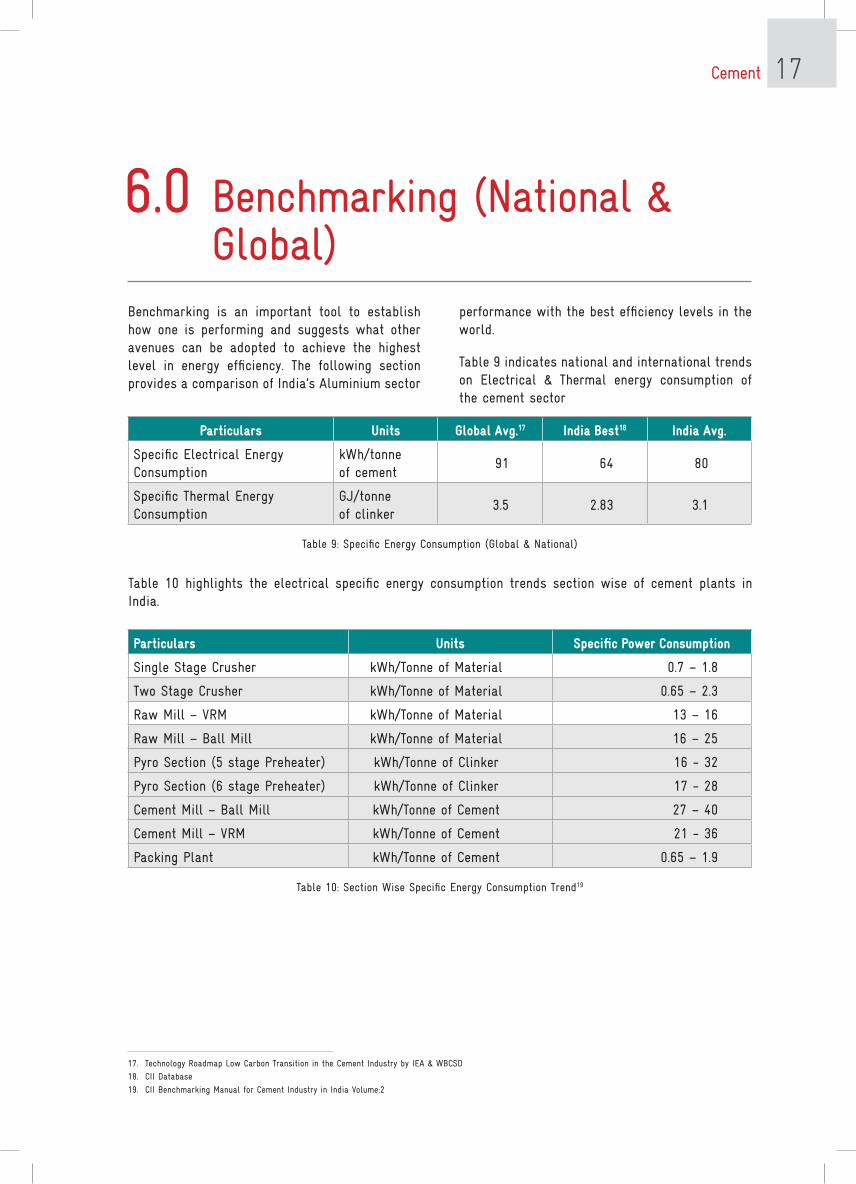
Benchmarking is an important tool to establish how one is performing and suggests what other avenues can be adopted to achieve the highest level in energy efficiency. The following section provides a comparison of India’s Aluminium sector
Particulars Units Global Avg.17 India Best18 India Avg.
Specific Electrical Energy Consumption
kWh/tonne of cement
91 64 80
Specific Thermal Energy Consumption
GJ/tonne of clinker
3.5 2.83 3.1
Table 9: Specific Energy Consumption (Global & National)
17. Technology Roadmap Low Carbon Transition in the Cement Industry by IEA & WBCSD
18. CII Database
19. CII Benchmarking Manual for Cement Industry in India Volume:2
performance with the best efficiency levels in the world.
Table 9 indicates national and international trends on Electrical & Thermal energy consumption of the cement sector
Particulars Units Specific Power Consumption
Single Stage Crusher kWh/Tonne of Material 0.7 – 1.8
Two Stage Crusher kWh/Tonne of Material 0.65 – 2.3
Raw Mill – VRM kWh/Tonne of Material 13 – 16
Raw Mill – Ball Mill kWh/Tonne of Material 16 – 25
Pyro Section (5 stage Preheater) kWh/Tonne of Clinker 16 - 32
Pyro Section (6 stage Preheater) kWh/Tonne of Clinker 17 - 28
Cement Mill – Ball Mill kWh/Tonne of Cement 27 – 40
Cement Mill – VRM kWh/Tonne of Cement 21 - 36
Packing Plant kWh/Tonne of Cement 0.65 – 1.9
Table 10: Section Wise Specific Energy Consumption Trend19
Table 10 highlights the electrical specific energy consumption trends section wise of cement plants in India.
Cement 18
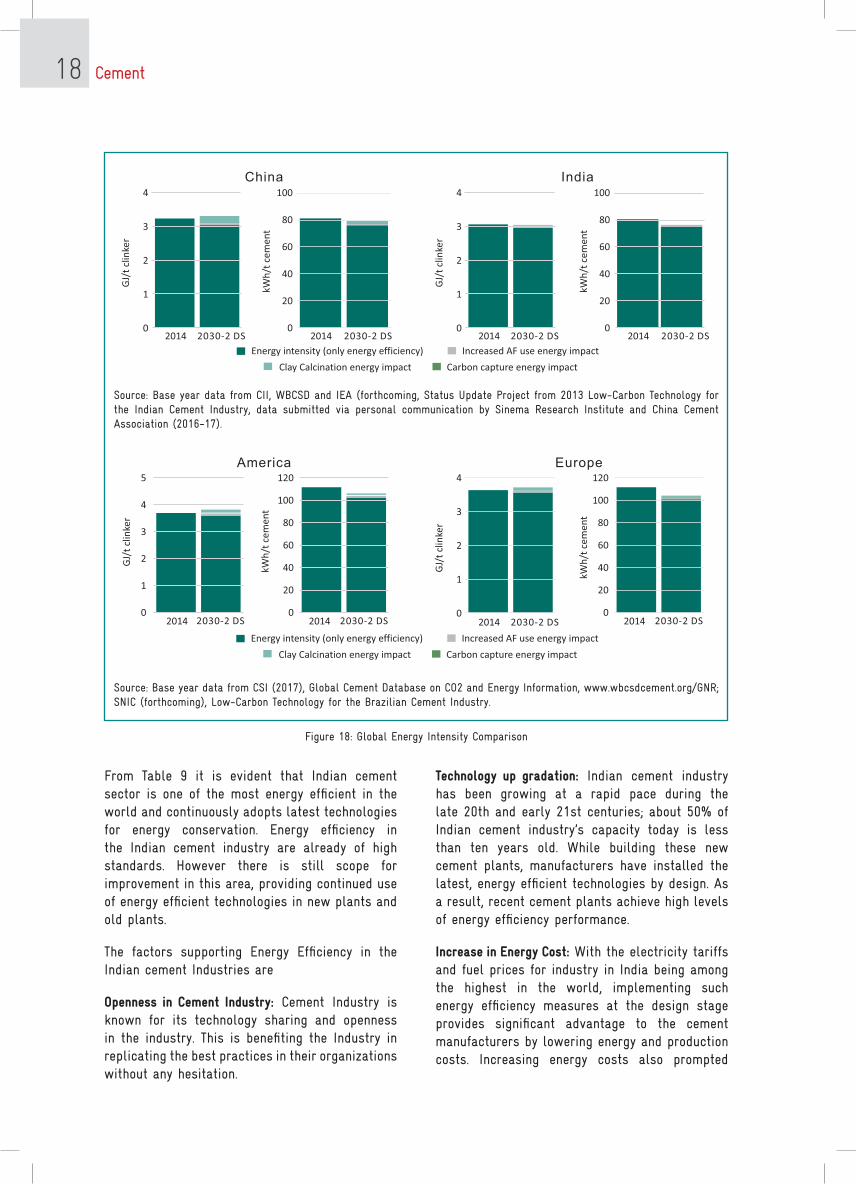
Figure 18: Global Energy Intensity Comparison
4
3
2
1
0
100
80
60
40
20
0
GJ/
t cl
inke
r
kWh
/t c
emen
t
2014 2030-2 DS 2014 2030-2 DS
China4
3
2
1
0
100
80
60
40
20
0
GJ/
t cl
inke
r
kWh
/t c
emen
t
2014 2030-2 DS 2014 2030-2 DS
India
Energy intensity (only energy efficiency)
Clay Calcination energy impact
Increased AF use energy impact
Carbon capture energy impact
5
4
3
2
1
0
GJ/
t cl
inke
r
2014 2030-2 DS
120
100
80
60
40
20
02014 2030-2 DS
America120
100
80
60
40
20
02014 2030-2 DS
Europe
kWh
/t c
emen
t
4
3
2
1
0
GJ/
t cl
inke
r
kWh
/t c
emen
t
2014 2030-2 DS
Energy intensity (only energy efficiency)
Clay Calcination energy impact
Increased AF use energy impact
Carbon capture energy impact
Source: Base year data from CII, WBCSD and IEA (forthcoming, Status Update Project from 2013 Low-Carbon Technology for the Indian Cement Industry, data submitted via personal communication by Sinema Research Institute and China Cement Association (2016-17).
Source: Base year data from CSI (2017), Global Cement Database on CO2 and Energy Information, www.wbcsdcement.org/GNR; SNIC (forthcoming), Low-Carbon Technology for the Brazilian Cement Industry.
Figure 18: Global Energy Intensity Comparison
From Table 9 it is evident that Indian cement sector is one of the most energy efficient in the world and continuously adopts latest technologies for energy conservation. Energy efficiency in the Indian cement industry are already of high standards. However there is still scope for improvement in this area, providing continued use of energy efficient technologies in new plants and old plants.
The factors supporting Energy Efficiency in the Indian cement Industries are
Openness in Cement Industry: Cement Industry is known for its technology sharing and openness in the industry. This is benefiting the Industry in replicating the best practices in their organizations without any hesitation.
technology up gradation: Indian cement industry has been growing at a rapid pace during the late 20th and early 21st centuries; about 50% of Indian cement industry’s capacity today is less than ten years old. While building these new cement plants, manufacturers have installed the latest, energy efficient technologies by design. As a result, recent cement plants achieve high levels of energy efficiency performance.
Increase in Energy Cost: With the electricity tariffs and fuel prices for industry in India being among the highest in the world, implementing such energy efficiency measures at the design stage provides significant advantage to the cement manufacturers by lowering energy and production costs. Increasing energy costs also prompted

Cement 19
owners of older manufacturing facilities to adopt gradually the latest energy efficient technologies and improve their energy performance.
Government Policies: Another factor which is enabling energy efficiency movement in India is Ministry of Power’s- Bureau of Energy Efficiency (BEE) - Perform Achieve and Trade scheme. The key goal of the scheme is to mandate reduction in specific energy consumption for the most energy-intensive industries, and incentivize them to achieve more than their specified specific energy consumption improvement targets. The star rating program for the equipment is also bringing revolutionary changes in the energy consumption levels.
technology Suppliers: Due to concerted efforts in bringing innovations and advancement in the technology, some of the most efficient global technologies have been adopted in major Indian cement plants. There is growing interest evinced by international suppliers to enter the Indian market to supply energy efficient technologies.
Associations: Industry Associations like CII, CMA and NCBM are continuously working for the benefit of the cement industry. These associations are closely working with government and other stakeholders in promoting the growth of the industry.
Cement 20
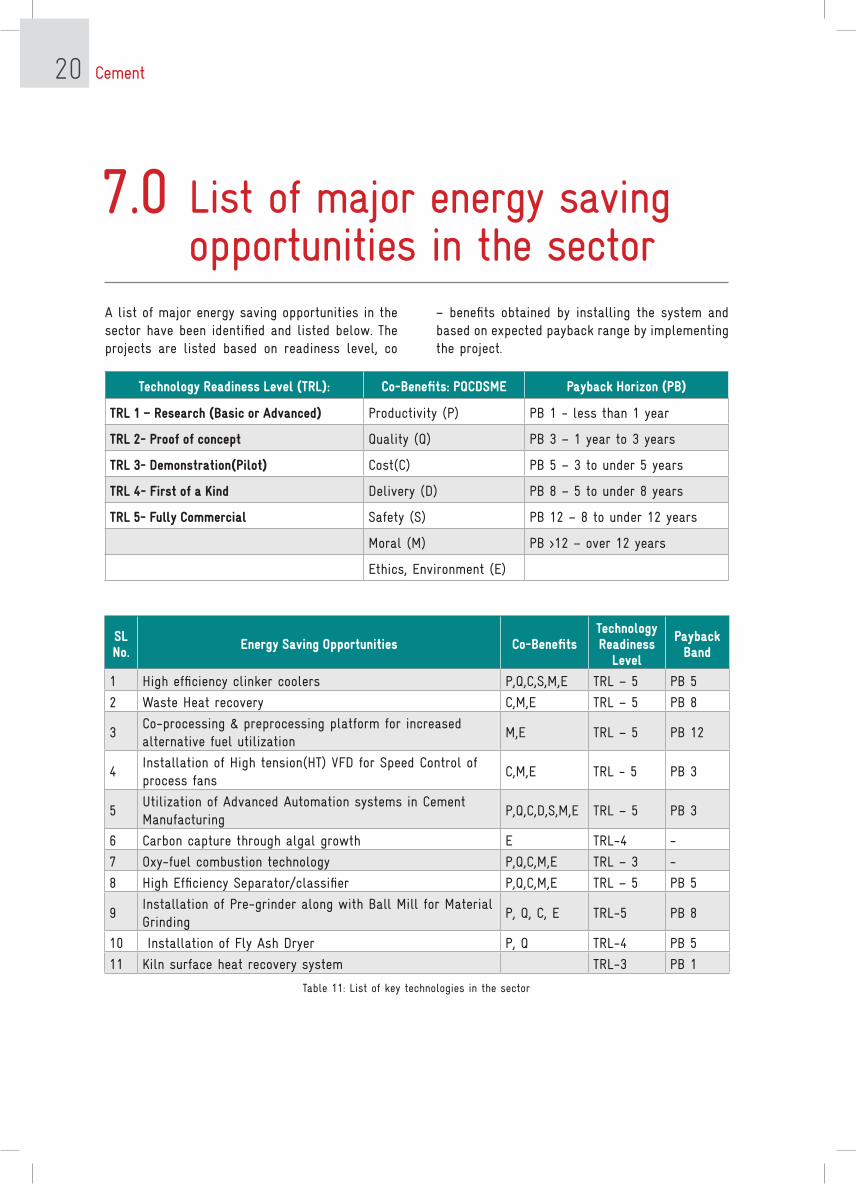
7.0 List of major energy saving opportunities in the sector
A list of major energy saving opportunities in the sector have been identified and listed below. The projects are listed based on readiness level, co
– benefits obtained by installing the system and based on expected payback range by implementing the project.
technology Readiness Level (tRL): Co-Benefits: PQCDSME Payback Horizon (PB)
tRL 1 – Research (Basic or Advanced) Productivity (P) PB 1 - less than 1 year
tRL 2- Proof of concept quality (q) PB 3 – 1 year to 3 years
tRL 3- Demonstration(Pilot) Cost(C) PB 5 – 3 to under 5 years
tRL 4- First of a Kind Delivery (D) PB 8 – 5 to under 8 years
tRL 5- Fully Commercial Safety (S) PB 12 – 8 to under 12 years
Moral (M) PB >12 – over 12 years
Ethics, Environment (E)
SL No. Energy Saving Opportunities Co-Benefits
technology Readiness
Level
Payback Band
1 High efficiency clinker coolers P,q,C,S,M,E TRL – 5 PB 5
2 Waste Heat recovery C,M,E TRL – 5 PB 8
3Co-processing & preprocessing platform for increased alternative fuel utilization
M,E TRL – 5 PB 12
4Installation of High tension(HT) VFD for Speed Control of process fans
C,M,E TRL - 5 PB 3
5Utilization of Advanced Automation systems in Cement Manufacturing
P,q,C,D,S,M,E TRL – 5 PB 3
6 Carbon capture through algal growth E TRL-4 -
7 Oxy-fuel combustion technology P,q,C,M,E TRL – 3 -
8 High Efficiency Separator/classifier P,q,C,M,E TRL – 5 PB 5
9Installation of Pre-grinder along with Ball Mill for Material Grinding
P, q, C, E TRL-5 PB 8
10 Installation of Fly Ash Dryer P, q TRL-4 PB 5
11 Kiln surface heat recovery system TRL-3 PB 1
Table 11: List of key technologies in the sector
Cement 21
8.0 Success stories – Case Studies in Cement Sector
8.1 Cooler Hot Air Recirculation (HAR) to Increase Waste Heat Power – An Innovative Approach to Optimise Power Generation
Introduction
The JK Lakshmi Cement Jaykaypuram plant is located in the southwest part of Rajasthan, India. It has three kilns, which share an annual clinker production capacity of 4.8 million tonnes. Kiln 1 was originally designed as a 1500 tonnes/day line in 1982 but currently has a rated capacity of 4500 tonnes/day. Kiln 2 was originally designed for 2500 tonnes/day in 1995 but has doubled in size to 5000 tonnes/day at present. Kiln 3 was similarly designed for 2500 tonnes/day in 1996, but has since also doubled to an operating capacity of 5000 tonnes/day.
The heart of cement manufacturing process are Kiln, Preheater and Cooler systems. The kilns include multi-stage preheaters and pre-calciners to pre-process raw materials before they enter the kiln, and as the hot clinker is produced from kiln in a cooler through an air-quench system to cool the clinker product. The exhaust streams from Preheater and cooler contain useful thermal energy that can be converted to power through waste heat recovery systems and the generated power can offset a portion of power purchased from the grid, or captive power generated by fuel consumption at the site. Many of the cement plants in India have utlilised these potential and have implemented waste heat recovery system.
Description of the Project
J K Lakshmi Cement has been continuously innovating and pioneering the implementation of energy efficient technologies and various environment improvement initiatives. To further improve the waste heat recovery from cooler vent and increase the power generation, the plant implemented an innovative measure to circulate the hot air in cooler. Recirculating hot air from the cooler vent stack to the cooler improves the available heat at boiler inlet due to additional mass flow and constant temperature or at constant mass flow and increased temperature. The project was conceptualised internally (Engineering and process team at the plant). This unique adaptation was installed on Kiln 1 in and the project was commissioned in 2014. As this was the first of its kind project in India, the project team anticipated many challenges for implementation and were able to overcome those challenges with appropriate technology upgradation and optimisation. Before the project implementation, the following challenges were foreseen and addressed:
Dealing with the high clinker temperature;
1. Volume of air for recirculation and working out how many cooler fans should be used to recirculate the hot air;
2. Selecting fan motors considering both hot and cold air condition and also high level of dust concentration.
Cement 22
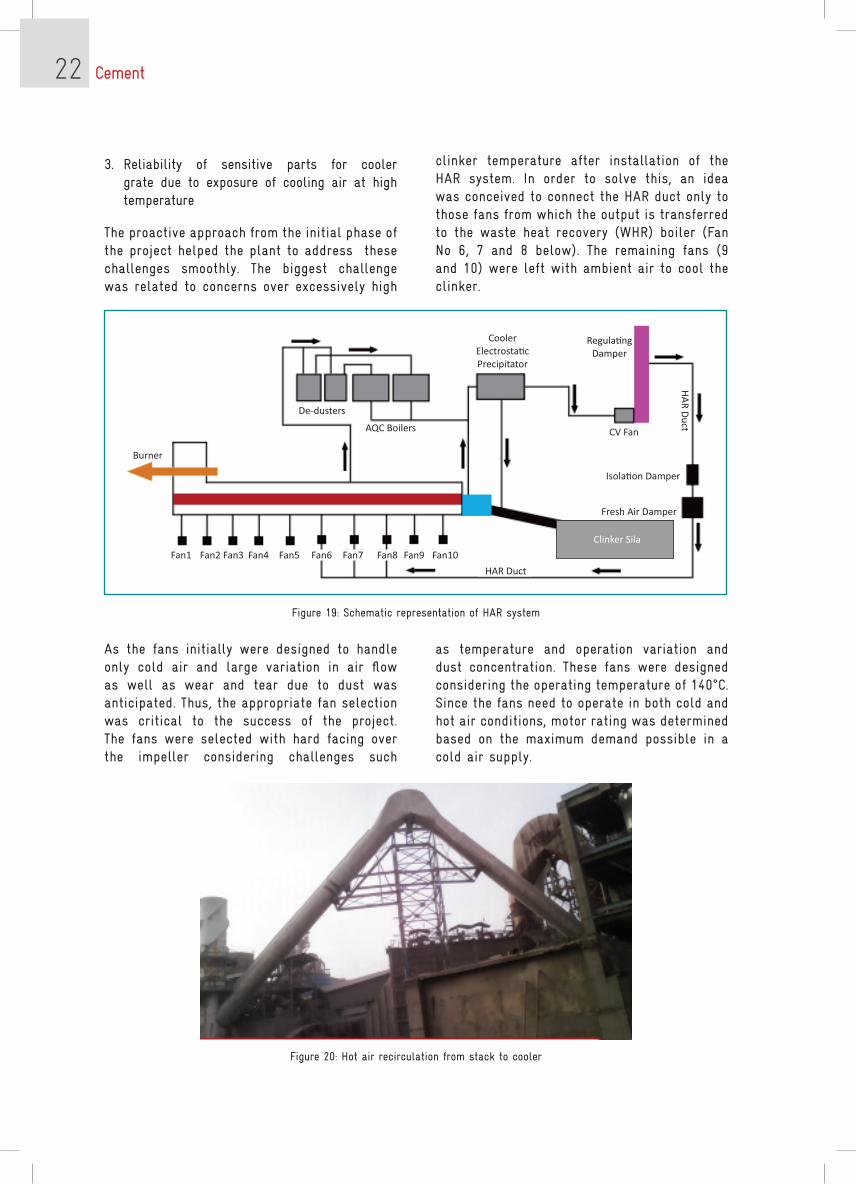
Figure 19: Schematic representation of HAR system
Figure 20: Hot air recirculation from stack to cooler
3. Reliability of sensitive parts for cooler grate due to exposure of cooling air at high temperature
The proactive approach from the initial phase of the project helped the plant to address these challenges smoothly. The biggest challenge was related to concerns over excessively high
clinker temperature after installation of the HAR system. In order to solve this, an idea was conceived to connect the HAR duct only to those fans from which the output is transferred to the waste heat recovery (WHR) boiler (Fan No 6, 7 and 8 below). The remaining fans (9 and 10) were left with ambient air to cool the clinker.
As the fans initially were designed to handle only cold air and large variation in air flow as well as wear and tear due to dust was anticipated. Thus, the appropriate fan selection was critical to the success of the project. The fans were selected with hard facing over the impeller considering challenges such
CoolerElectrostacPrecipitator
RegulangDamper
AQC Boilers
De-dusters
Burner
CV Fan
Isolaon Damper
Fresh Air Damper
Clinker Sila
HAR Duct
HA
R D
uct
Fan1 Fan2 Fan3 Fan4 Fan5 Fan6 Fan7 Fan8 Fan9 Fan10
as temperature and operation variation and dust concentration. These fans were designed considering the operating temperature of 140°C. Since the fans need to operate in both cold and hot air conditions, motor rating was determined based on the maximum demand possible in a cold air supply.
Cement 23
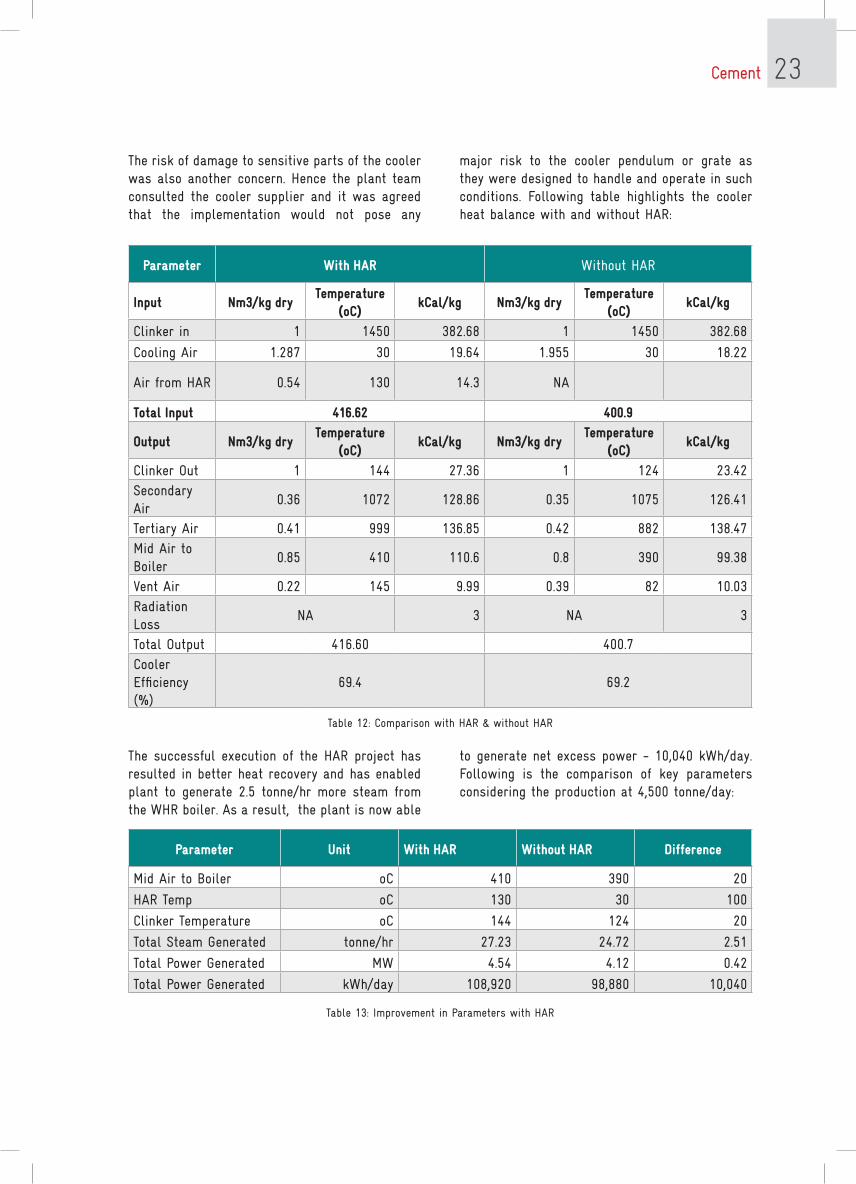
The risk of damage to sensitive parts of the cooler was also another concern. Hence the plant team consulted the cooler supplier and it was agreed that the implementation would not pose any
major risk to the cooler pendulum or grate as they were designed to handle and operate in such conditions. Following table highlights the cooler heat balance with and without HAR:
Parameter With HAR Without HAR
Input Nm3/kg drytemperature
(oC)kCal/kg Nm3/kg dry
temperature (oC)
kCal/kg
Clinker in 1 1450 382.68 1 1450 382.68
Cooling Air 1.287 30 19.64 1.955 30 18.22
Air from HAR 0.54 130 14.3 NA
total Input 416.62 400.9
Output Nm3/kg drytemperature
(oC)kCal/kg Nm3/kg dry
temperature (oC)
kCal/kg
Clinker Out 1 144 27.36 1 124 23.42Secondary Air
0.36 1072 128.86 0.35 1075 126.41
Tertiary Air 0.41 999 136.85 0.42 882 138.47Mid Air to Boiler
0.85 410 110.6 0.8 390 99.38
Vent Air 0.22 145 9.99 0.39 82 10.03Radiation Loss
NA 3 NA 3
Total Output 416.60 400.7Cooler Efficiency (%)
69.4 69.2
Table 12: Comparison with HAR & without HAR
The successful execution of the HAR project has resulted in better heat recovery and has enabled plant to generate 2.5 tonne/hr more steam from the WHR boiler. As a result, the plant is now able
to generate net excess power - 10,040 kWh/day. Following is the comparison of key parameters considering the production at 4,500 tonne/day:
Parameter Unit With HAR Without HAR Difference
Mid Air to Boiler oC 410 390 20
HAR Temp oC 130 30 100
Clinker Temperature oC 144 124 20
Total Steam Generated tonne/hr 27.23 24.72 2.51
Total Power Generated MW 4.54 4.12 0.42
Total Power Generated kWh/day 108,920 98,880 10,040
Table 13: Improvement in Parameters with HAR
Cement 24
Parameter
Improved Power Generation 10,040 kWh/dayMTOE equivalent savings 1,127 MTOETotal benefit Rs 16.7 millionInvestment Rs. 15.0 millionPayback 1 yearGHG reduction 3,850 tCO2
Replicability
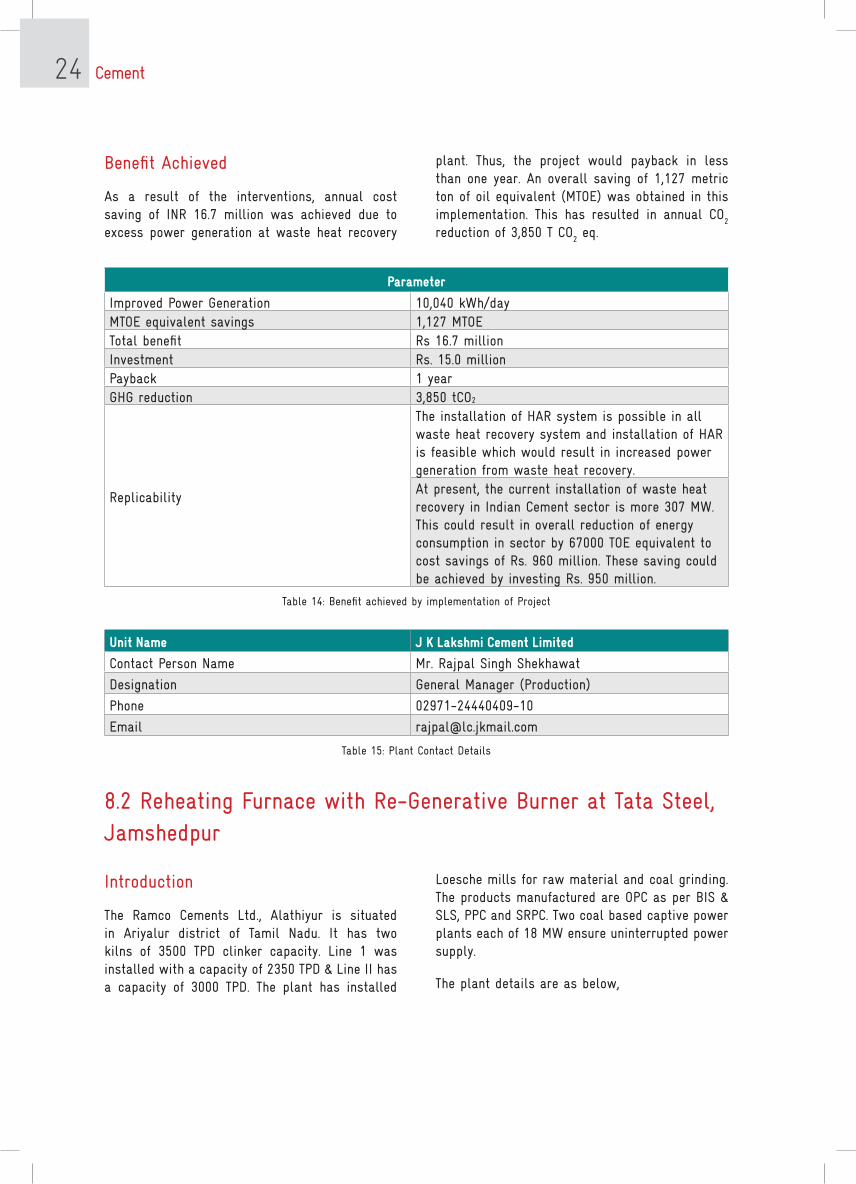
The installation of HAR system is possible in all waste heat recovery system and installation of HAR is feasible which would result in increased power generation from waste heat recovery.At present, the current installation of waste heat recovery in Indian Cement sector is more 307 MW. This could result in overall reduction of energy consumption in sector by 67000 TOE equivalent to cost savings of Rs. 960 million. These saving could be achieved by investing Rs. 950 million.
Table 14: Benefit achieved by implementation of Project
Unit Name J K Lakshmi Cement Limited
Contact Person Name Mr. Rajpal Singh Shekhawat
Designation General Manager (Production)
Phone 02971-24440409-10
Email [email protected]
Table 15: Plant Contact Details
Benefit Achieved
As a result of the interventions, annual cost saving of INR 16.7 million was achieved due to excess power generation at waste heat recovery
plant. Thus, the project would payback in less than one year. An overall saving of 1,127 metric ton of oil equivalent (MTOE) was obtained in this implementation. This has resulted in annual CO
2
reduction of 3,850 T CO2 eq.
8.2 Reheating Furnace with Re-Generative Burner at Tata Steel, Jamshedpur
Introduction
The Ramco Cements Ltd., Alathiyur is situated in Ariyalur district of Tamil Nadu. It has two kilns of 3500 TPD clinker capacity. Line 1 was installed with a capacity of 2350 TPD & Line II has a capacity of 3000 TPD. The plant has installed
Loesche mills for raw material and coal grinding. The products manufactured are OPC as per BIS & SLS, PPC and SRPC. Two coal based captive power plants each of 18 MW ensure uninterrupted power supply.
The plant details are as below,
Cement 25
The plant has upgraded the raw mill classifier with energy efficient classifier & vortex rectifier and has achieved significant savings in power consumption.
Description of the project
The raw mill was designed for feed moisture of 5% normal % 10% maximum. Over a period of time the normal feed moisture increased to more than 10% causing a reduced raw mill output to 205-210 TPH from 215-220 TPH.
Line 1 Line 2
Commissioned year 1997 2001
Kiln FLS-3500 TPD FLS-3500 TPD
Raw Mill Loesche LM 38.3 Loesche LM 38.3
Coal Mill Loesche LM 20.2D Loesche LM 20.2D
Cement mill OK 33.4 Loesche LM 56.2+2C
Table 16: Plant Details
During monsoon, mill output was further reduced to 190 TPH. Hot gas generator (HGG) had to be operated to get the output of 210 TPH to meet clinker production. HGG was consuming about 2 TPH of fine coal. Since more heat was required for drying, the gas volume was to be increased in mill thereby causing higher product residue. To overcome this problem raw mill classifiers of both units were changed from LSKS 52 to LSKS 57.Details of the project before and after modifications is as below,
Description Raw Mill 1 Raw Mill 2
Before Modification
After ModificationBefore
ModificationAfter Modification
Classifier size LSKS 52 LSKS 57 LSKS 52 LSKS 57
Feed Moisture (%) >=10 >=10 >=10 >=10
Mill output (TPH) dry 207 231 210 233
Residue (212 mic) % 2.3-3.0 1.5-2.0 2.3-3.0 1.5-2.0Product residue (90 mic) %
19-20 16-17 19-20 15-16
Mill Sp. Power (kWh/MT)
5.56 4.55 5.57 4.42
Fan Sp. Power (kWh/MT)
6.33 6.28 7.29 6.52
Total specific power 11.89 10.83 12.86 10.94
Table 17: Comparison before and after modification
This has resulted in saving of about 1.2 kWh/ MT in specific power drawn by mill & fan
Details of modification done
1. Modified louvre and armor ring to maintain uniform gas flow/velocity profile inside the mill.
2. Increase the capacity of the raw mill fan by
replacement/ retrofitting
3. Increase the size of the following ducts due to higher gas flow
4. Mill inlet duct, Mill Outlet duct & Duct from Cyclone to mill fan inlet
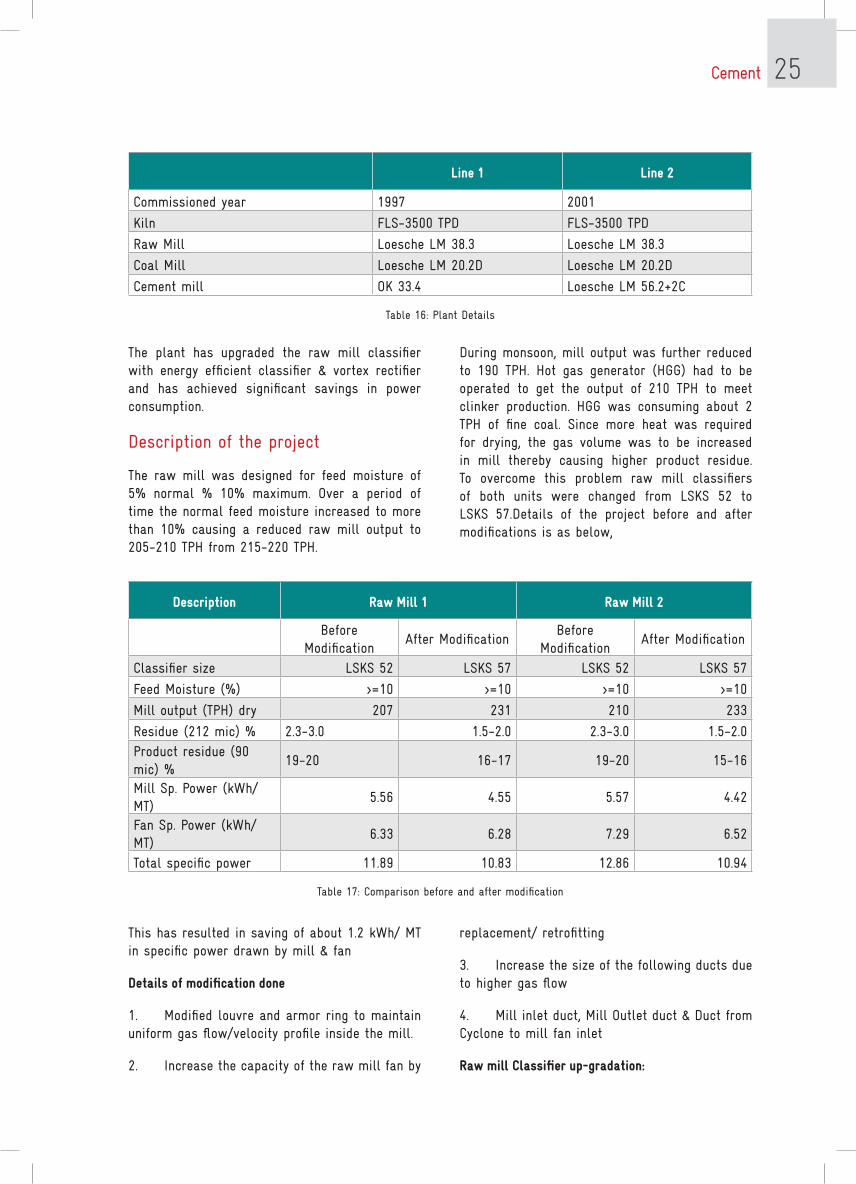
Raw mill Classifier up-gradation:
Cement 26
Figure 21: Schematic representation of Vortex rectifier
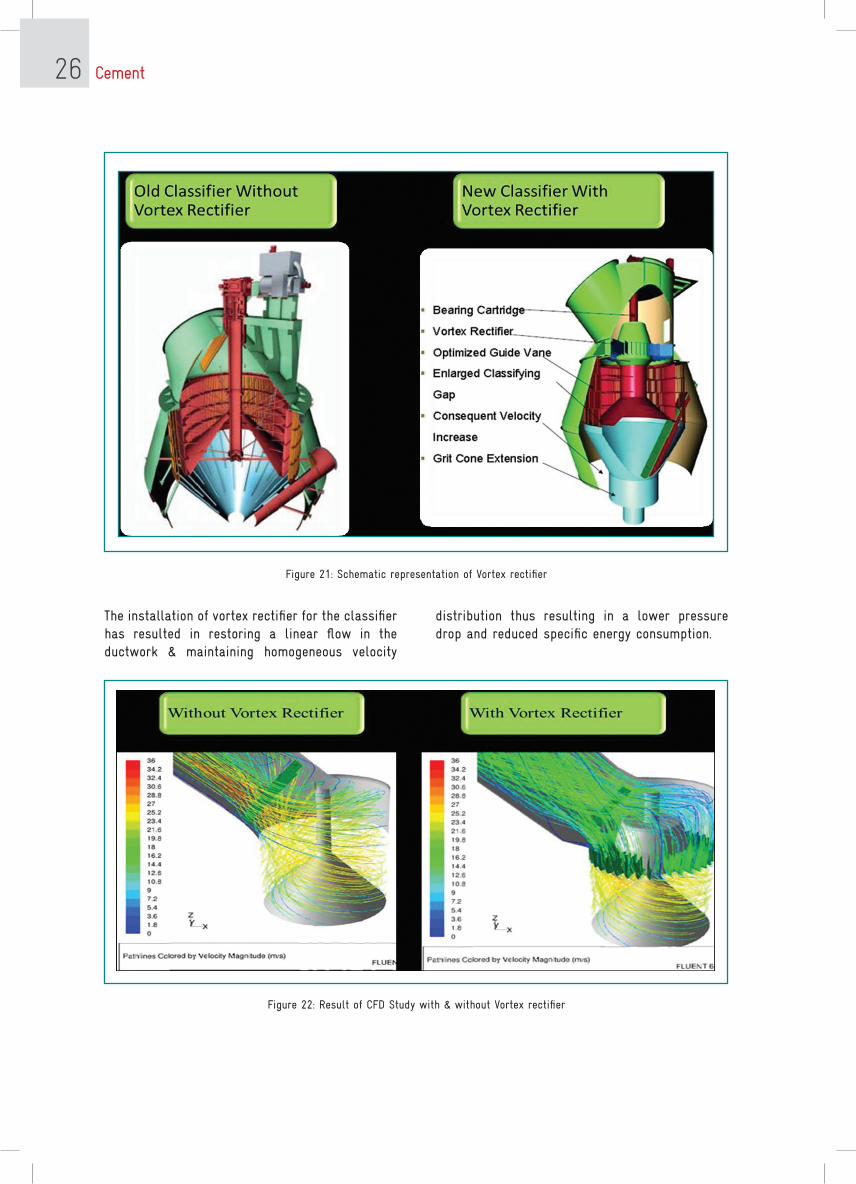
Figure 22: Result of CFD Study with & without Vortex rectifier
The installation of vortex rectifier for the classifier has resulted in restoring a linear flow in the ductwork & maintaining homogeneous velocity
distribution thus resulting in a lower pressure drop and reduced specific energy consumption.
Cement 27
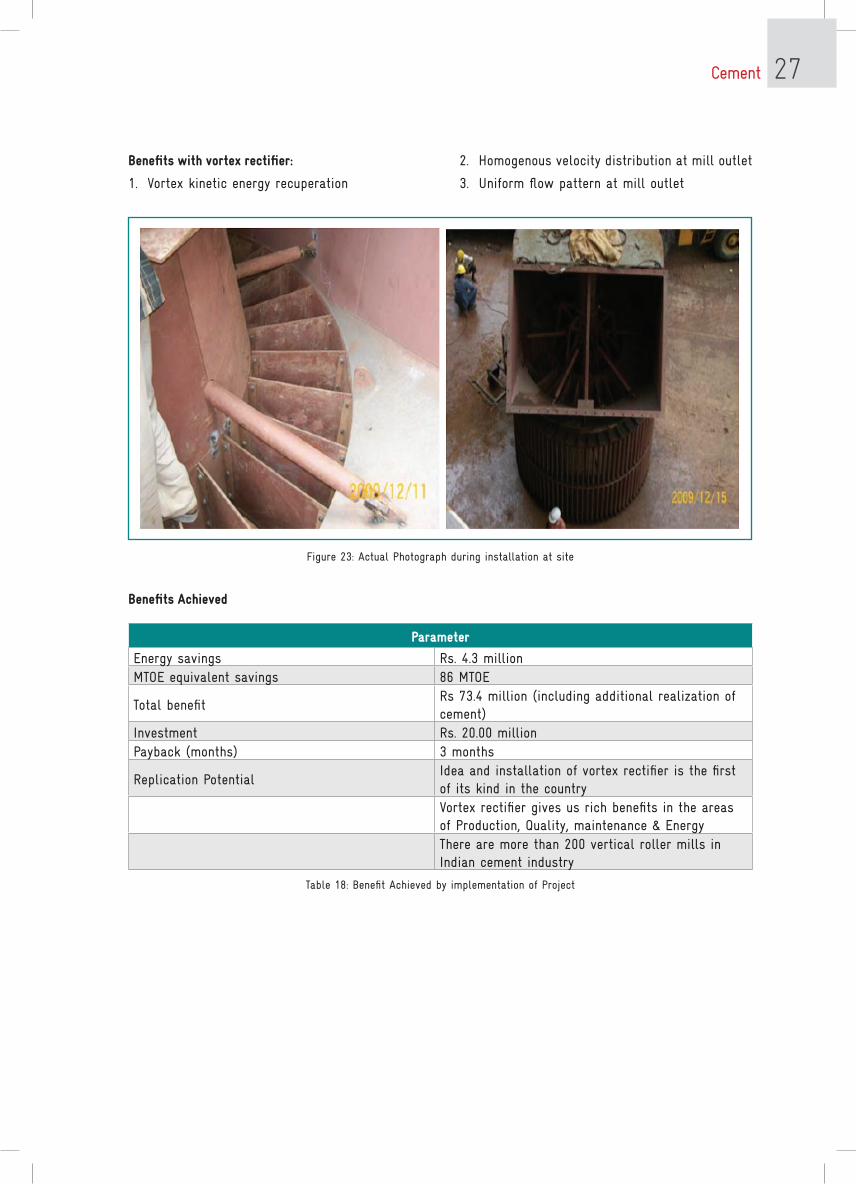
Benefits with vortex rectifier:
1. Vortex kinetic energy recuperation
2. Homogenous velocity distribution at mill outlet
3. Uniform flow pattern at mill outlet
Figure 23: Actual Photograph during installation at site
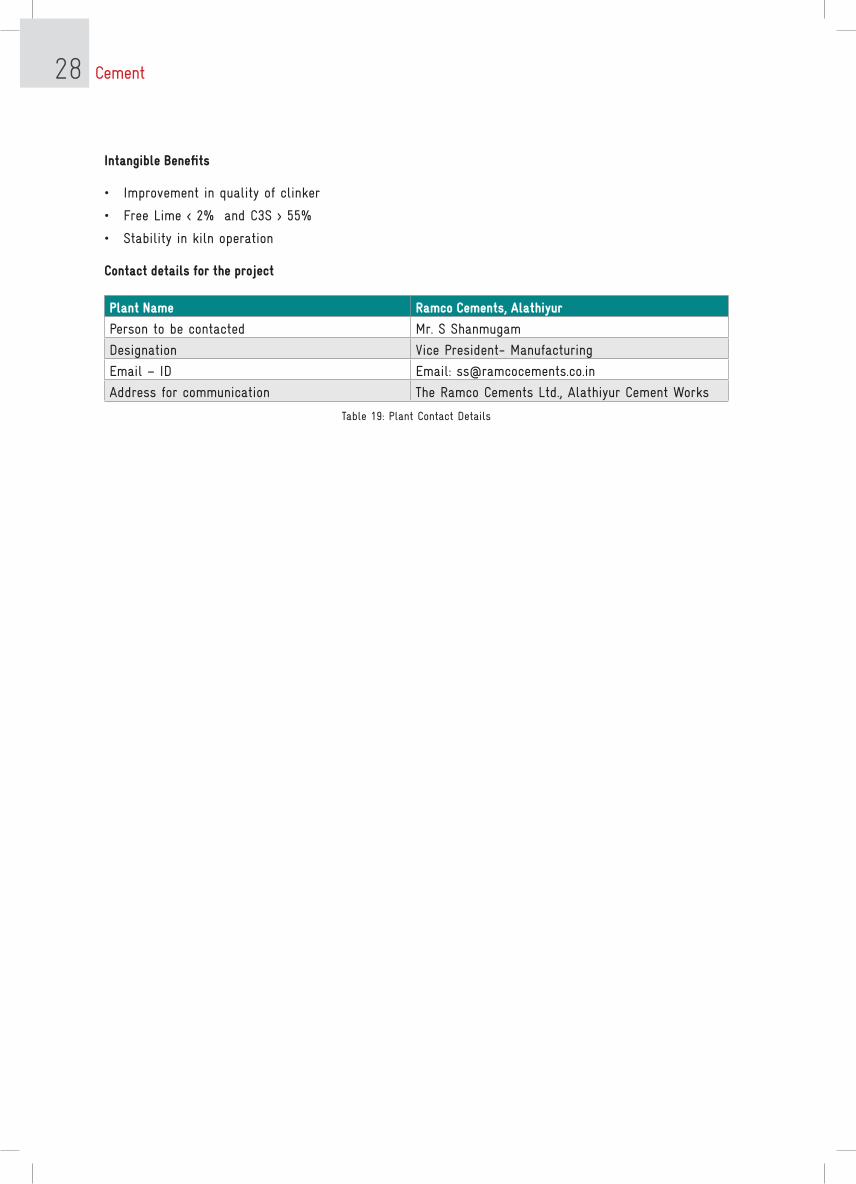
Benefits Achieved
Parameter
Energy savings Rs. 4.3 millionMTOE equivalent savings 86 MTOE
Total benefitRs 73.4 million (including additional realization of cement)
Investment Rs. 20.00 millionPayback (months) 3 months
Replication PotentialIdea and installation of vortex rectifier is the first of its kind in the countryVortex rectifier gives us rich benefits in the areas of Production, quality, maintenance & EnergyThere are more than 200 vertical roller mills in Indian cement industry
Table 18: Benefit Achieved by implementation of Project
Cement 28
Intangible Benefits
• Improvement in quality of clinker
• Free Lime < 2% and C3S > 55%
• Stability in kiln operation
Contact details for the project
Plant Name Ramco Cements, Alathiyur
Person to be contacted Mr. S Shanmugam
Designation Vice President- Manufacturing
Email – ID Email: [email protected]
Address for communication The Ramco Cements Ltd., Alathiyur Cement Works
Table 19: Plant Contact Details
Cement 29
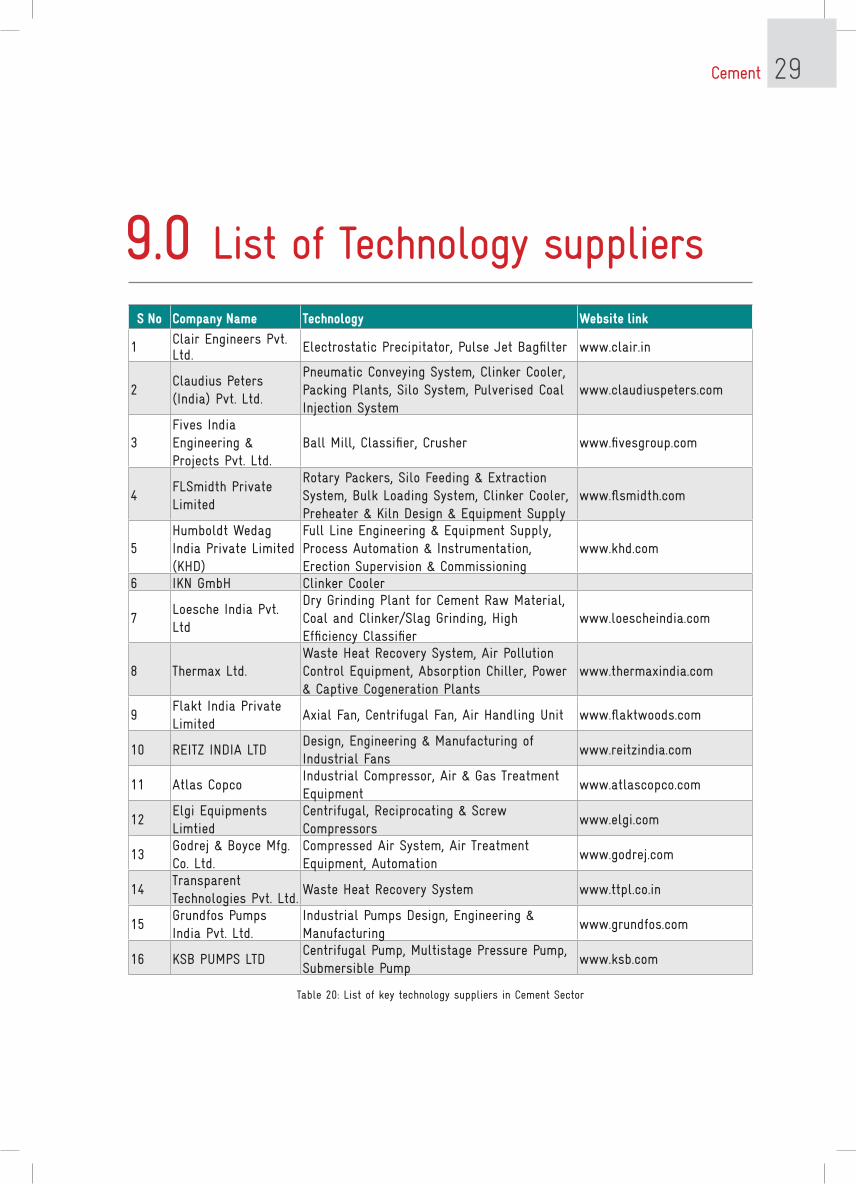
S No Company Name technology Website link
1 Clair Engineers Pvt. Ltd. Electrostatic Precipitator, Pulse Jet Bagfilter www.clair.in
2Claudius Peters (India) Pvt. Ltd.
Pneumatic Conveying System, Clinker Cooler, Packing Plants, Silo System, Pulverised Coal Injection System
www.claudiuspeters.com
3Fives India Engineering & Projects Pvt. Ltd.
Ball Mill, Classifier, Crusher www.fivesgroup.com
4FLSmidth Private Limited
Rotary Packers, Silo Feeding & Extraction System, Bulk Loading System, Clinker Cooler, Preheater & Kiln Design & Equipment Supply
www.flsmidth.com
5Humboldt Wedag India Private Limited (KHD)
Full Line Engineering & Equipment Supply, Process Automation & Instrumentation, Erection Supervision & Commissioning
www.khd.com
6 IKN GmbH Clinker Cooler
7Loesche India Pvt. Ltd
Dry Grinding Plant for Cement Raw Material, Coal and Clinker/Slag Grinding, High Efficiency Classifier
www.loescheindia.com
8 Thermax Ltd.Waste Heat Recovery System, Air Pollution Control Equipment, Absorption Chiller, Power & Captive Cogeneration Plants
www.thermaxindia.com
9Flakt India Private Limited
Axial Fan, Centrifugal Fan, Air Handling Unit www.flaktwoods.com
10 REITZ INDIA LTDDesign, Engineering & Manufacturing of Industrial Fans
www.reitzindia.com
11 Atlas CopcoIndustrial Compressor, Air & Gas Treatment Equipment
www.atlascopco.com
12Elgi Equipments Limtied
Centrifugal, Reciprocating & Screw Compressors
www.elgi.com
13Godrej & Boyce Mfg. Co. Ltd.
Compressed Air System, Air Treatment Equipment, Automation
www.godrej.com
14Transparent Technologies Pvt. Ltd.
Waste Heat Recovery System www.ttpl.co.in
15Grundfos Pumps India Pvt. Ltd.
Industrial Pumps Design, Engineering & Manufacturing
www.grundfos.com
16 KSB PUMPS LTDCentrifugal Pump, Multistage Pressure Pump, Submersible Pump
www.ksb.com
Table 20: List of key technology suppliers in Cement Sector
9.0 List of Technology suppliers
Cement 30
Abbreviations
AFR
Alternate Fuel and Raw Material, 3, 20
BAU
Business As Usual, 2, 3, 5, 14, 17
BEE
Bureau of Energy Efficiency, 12, 22
CAGR
Compounded Annual Growth Rate, 7, 8
CII
Confederation of Indian Industry, 21, 22
CMA
Cement Manufacturers’ Association, 8, 22
CO2
Carbon dioxide, 7, 8, 13, 14, 17
DCs
Designated Consumers, 4, 7, 13
ESCerts
Energy Saving Certificates, 13
GDP
Gross Domestic Product, 5, 8, 12, 17
GHG
Greenhouse Gas, 8, 13
HAR
Hot Air Recirculation, 2, 25, 26, 27, 28
INR
Indian Ruppee, 7, 8, 13, 17
mic
micron, 29
million TOE
million Metric Tonnes of Oil Equivalent, 4, 8
MW
Mega Watt, 18, 27, 28, 29
NAPCC
National action plan on climate change, 4
NCBM
National Council for Cement & Building Materials, 22
NMEEE
National mission for Enhanced energy efficiency, 4
OPC
Ordinary Portland Cement, 3, 11, 18, 19, 29
PAT
Perform Achieve and Trade, 2, 3, 4, 5, 7, 12, 13, 14, 15, 16, 17, 18
PPC
Pozzolana Portland Cement, 3, 18, 19, 29
PSC
Portland Slag Cement, 3, 18, 20
SEC
Specific Energy Consumption, 4, 13
toe
Tonne of oil equivalent, 7
TPH
Tonne per Hour, 29
UOM
Unit of Measurement, 21
WHR
Waste Heat Recovery, 3, 20, 26, 27
WHRS
Waste Heat Recovery System, 18

Cement 31

Cement 32