CATAMARANS-TECHNOLOGICAL LIMITS TO SIZE AND ...
81
SSC-222 CATAMARANS-TECHNOLOGICAL LIMITS TO SIZE AND APPRAISAL OF STRUCTURAL DESIGN INFORMATION AND PROCEDURES This document has been approved for public release and sale; its distribution is unlimited. SHIP STRUCTURE COMMITTEE 1971
-
Upload
khangminh22 -
Category
Documents
-
view
5 -
download
0
Transcript of CATAMARANS-TECHNOLOGICAL LIMITS TO SIZE AND ...

SSC-222
CATAMARANS-TECHNOLOGICAL LIMITSTO SIZE AND APPRAISAL OF STRUCTURALDESIGN INFORMATION AND PROCEDURES
This document has been approvedfor public release and sale; its
distribution is unlimited.
SHIP STRUCTURE COMMITTEE
1971

SH&P STRUCTURE COMMITTEEAN INTERAGENCY ADVISORY
COMMITTEE DEDICATED TO IMPROVINGTHE STRUCTURE OF SHIPS
SR 1921971
The Ship Structure Committee has completed a project thatassesses the present state of the art for designing Catamarans,large platform, twin hulled ships. The purpose of the projectwas to collect and analyze design techniques and data presently
available and assess their usefulness for catamarans approaching1000 feet in length.
This report contains procedure for the initial design of a largecatamaran and indicates where additional tests should be made
before the final design stage is completed.
W. F. REA IIIRear Admiral U.S. Coast GuardChairman, Ship Structure Committee
MEMBER AGENCIES: ADDRESS CORRESPONDENCE TO
uNI TED STATES COAST GUARD SECRETARY
NAVAl SHIP SYSTEMS COMMAND SHIP STRUCTURE COMMITTEE
MILITARY SEALIFT COMMAND U.S. COAST GUARD HEADQUARTERS
MARITIME ADMINISTRATION WASHINGTON. D.C. 20590AMERICAN BUREAU OF SHIPPING

SSC- 222
Final Report
on
Project SR-192, 'Catamaran Designs"
to the
Ship Structure Committee
CATAMARANS - TECHNOLOGICAL LIMITS TO
SIZE AND APPRAISAL OF STRUCTURAL DESIGN
INFORMATION AND PROCEDURES
by
Naresh M. Maniar and Wei P. ChiangM. Rosenblatt & Son, Inc.
under
Department of the NavyNaval Ship Engineering CenterContract No. N00024-7O-C-5145
This document has been approved for public release andsale; its distribution is unlimited.
U. S. Coast Guard HeadquartersWashington, D. C.
1971
SS(-22Z
ABSTRACT
Existing United States shipbuilding facilities can handle 1000-foot catamarans with up to 140-foot individual hull beams on the premise
that the hulls would be joined afloat. Major harbors and channels of theworld suggest an overall beam limit of 400 feet and 35-foot draft. Dry-
docking for catamarans over 140-foot in breadth will require new facili-
ties or extensive modification to existing facilities. Scantlings of a
1000-foot catamaran cargo liner can be expected to be within current
shipbuilding capabilities. The uniqueness of the catamaran design lies
in the cross-structure and the important facets of the cross-structure
design are the prediction of the wave-induced loads and the method of
structural analysis. The primary loads are the transverse vertical bend-ing moments, axial force, shear, and torsion moments. Designers have re-
lied heavily on model tests to obtain design loads and have used general
structures principles and individual ingenuity to perform the structuralanalysis in the absence of established guidelines. Simple semi-empiricalequations are proposed for predicting maximum primary loads. A structur-
al analysis method such as the one proposed by Lankford may be employed
for conceptual design purposes. The Lankford method assumes the hulls to
be rigid and the cross-structure loads to be absorbed by a group of
transverse bulkheads and associated effective deck plating. This proce-
dure in general should provide an overall conservative design and not
necessarily an economic or optimized design. Additional research and de-velopment work including systematic model test programs are necessary foraccumulating additional knowledge in areas of uncertainty and for the es-
tablishment of reliable design methods for catamaran structure.

CONTENTS
Page
INTRODUCTION i
ANALYSIS OF FEATURES THAT MAY IMPOSE SIZE LIMITS 2
EXISTING STRUCTURAL DESIGN METHODS 4
3.1 GENERAL 43.2 CROSS-STRUCTURE LOADS 43.3 SURVEY OF EXISTING DESIGN METHODS 7
MODEL TEST DATA ANALYSIS 17
4.1 TEST BACKGROUND 174.2 DATA CONSOLIDATION AND COMPARISON 214.3 DISCUSSION OF THE PLOTS 26
CONDITION FOR MAXIMUM RESPONSE AND RECOMMENDEDMETHOD FOR DESIGN LOADS ESTIMATE 27
5.1 CONDITION FOR MAXIMUM RESPONSE IN BEAM SEAS 275.2 DEVELOPMENT OF DESIGN LOAD EQUATIONS 305.3 COMPARISON OF LOADS CALCULATED BY PROPOSED
EQUATIONS AND BY OTHER METHOD 355.4 METHOD FOR DESIGN LOADS ESTIMATE 35
HULL FLEXIBILITY AND CROSS-STRUCTURE STRESSES 38
DESIGN SHIP 40
7.1 PURPOSE 407.2 DESIGN DESCRIPTION 437.3 EXPLANATION FOR EFFECTIVE STRUCTURE 437.4 CROSS-STRUCTURE LOADS AND STRESSES 457.5 DESIGN CONCLUSIONS 45
TOPICS FOR FUTURE RESEARCH AND DEVELOPMENT PROGRAM 47
CONCLUSIONS 50
ACKNOWLEDGEMENTS 50
REFERENCES 52
APPENDICES
CATAMARAN RESISTANCE 54REPRODUCTION OF PORTIONS OF REFERENCE (8), THE STRUC-TURAL DESIGN OF THE ASR CATAMARAN CROSS-STRUCTURE"BY BENJAMIN W. LANKFORD, JR 56REPRODUCTION OF "SUMMARY AND DISCUSSION" OF REFER-ENCE (13), "A METHOD FOR ESTIMATING LOADS ONCATAMARAN CROSS-STRUCTURE" BY A. L. DISENBACHER 62

LIST OF TABLES
Table Page
i CATA1ARAN LOAD AND STRUCTURE ANALYSIS 7
2 PROTOTYPE CHARACTERISTICS OF MODEL TEST VESSELS 19
3 PARTICULARS OF "E. W. THORNTON" SERIES SHIS 20
4 PARTICULARS OF "ASR" SERIES SHIPS 20
5 PARTICULARS OF THE UNIVERSITY OF MIAMI SERIES SHIPS 20
6 RATIOS OF MAXIMUM LOADS IN BEAM SEAS AND OBLIQUE SEAS . . . 25
7 WAVE-INDUCED TRANSVERSE VERTICAL BENDING MOMENTS IN
BEAM SEAS 36
8 WAVE-INDUCED SHEAR IN BEAM SEAS 36
9 WAVE-INDUCED TORSION MOMENT IN OBLIQUE SEAS 36
10 DESIGN LOAD SCHEDULE 37
ii T-AGOR16 CATAMARAN STRESS SUMMARY 40
12 DESIGN SHIP PARTICULARS 41
13 DESIGN SHIP WAVE-INDUCED CROSS-STRUCTURE LOADS 46
14 DESIGN SHIP, CROSS-STRUCTURE STRESS SUMMARY 47
iv

LIST OF FIGURES
Figure Page
i CATAMARAN RESPONSE IN A REGULAR BEAM SEA 15M
2d(A+A)/2 VERSUS A, BEAM SEAS 23
M3 C)
-K)/2 VERSUS L, BEAM SEAS 23
M4 0
d(A+A)/2 VERSUS b, BEAM SEAS 23
F5 so
A/2 VERSUS A, BEAM SEAS 23
F6 so
-C VERSUS A, BEAM SEAS 24
7 TÇ/T1 VERSUS A, OBLIQUE SEAS 24
8 T0/T1 VERSUS AL, OBLIQUE SEAS 24
9 ADDED MASS FOR SWAY DIRECTION, SERIES 60, FROMREFERENCE (23) 25
10 CATAMARAN IN BENI WAVES OF DIFFERENT LENGTH 28
11 LOADING CONDITION FOR MAXIMUM VERTICAL BENDINGMOMENT IN BEAM SEAS 30
12 T-AGOR16 STRUCTURAL CONFIGURATION 39
13 STRUCTURAL MODEL OF T-AGOR16 FOR IBM-1130STRESS" PROGRAM 39
14 DESIGN SHIP PROFILE AND PLAN 42
15 DESIGN SHIP TYPICAL BULKHEAD STRUCTURE 42
16 DESIGN SHIP SECTION MODULI 44
V

Capt. J. E. Rasmussen, USNNaval Ship Engineering CenterPrince Georges Center
Capt. L. L. Jackson, USNMaintenance and Repair OfficerMilitary Sealift Command
SHIP STRUCTURE COMMITTEE
The SHIP STRUCTURE COMMITTEE is constituted to prosecute a research
program to improve the hull structures of ships by an extension of knowledge
pertaining to design, materials and methods of fabrication.
RADM W. F. Rea, III, USCG, ChairmanChief, Office of Merchant Marine Safety
U. S. Coast Guard Headquarters
SHIP STRUCTURE SUBCOMMITTEE
The SHIP STRUCTURE SUBCOMMITTEE acts for the Ship Structure Committee
on technical matters by providing technical coordination for the determination
of goals and objectives of the program, and by evaluating and interpreting the
results in terms of ship structural design, construction and operation.
1AVAL SHIP ENGINEERING CENTER U. S. COAST GUARD
Mr. E. S. DillonChiefOffice of Ship ConstructionMaritime Administration
Mr. K. Morland, Vice PresidentAmerican Bureau of Shipping
Mr. P. M. Palermo - ChairmanMr. J. B. OBrien - Contract AdministratorMr. G. Sorkin - MemberMr. H. S. Sayre - AlternateMr. I. Fioriti - Alternate
MARITIME ADMINISTRATION
Mr. F. Dashnaw - MemberMr. A. Maillar - MemberMr. R. Falls - AlternateMr. R. F. Coombs - Alternate
AMERICAN BUREAU OF SHIPPING
Mr. S. G. Stiansen - MemberMr. F. J. Crum - Member
OFFICE OF NAVAL RESEARCH
Mr. J. M. Crowley - MemberDr. W. G. Rauch - Alternate
NAVAL SHIP RESEARCH & DEVELOPMENT CENTER
Mr. A. B. Stavovy - Alternate
MILITARY SEALIFT COMMAND
Mr. R. R. Askren - MemberLt. j.g. E. T. Powers, USNR - Member
LCDR C. S. Loosmore, USCG - SecretaryCDR C. R. Thompson, USCG - MemberCDR J. W. Kime, USCG - AlternateCDR J. L. Coburn, USCG - Alternate
NATIONAL ACADEMY OF SCIENCES
Mr. R. W. Rumke, LiaisonProf. R. A. Yagle, Liaison
SOCIETY OF NAVAL ARCHITECTS & MARINEENGINEERS
Mr. T. M. Buermann, Liaison
BRITISH NAVY STAFF
Dr. V. Flint, LiaisonCDR P. H. H. Ablett, RCNC, Liaison
WELDING RESEARCH COUNCIL
Mr. K. H. Koopman, LiaisonMr. C. Larson, Liaison

Where equations are reproduced from references, definitions of their symbols arealso provided. Each appendix has its own list of symbols.
Symbol Definition
Aggregate horizontal accelerationB Beam of each hullb Hull centerline spacingCb Block coefficientCLA Centerplane area coefficientCw Waterplane coefficientC Oblique wave coefficient
S+B
LIST OF SYMBOLS
J (5+ B)2+()2
C Midship coefficientD0 Draftd di-O.65D0di Distance of cross-structure neutral axis above base lineFsc Vertical shear at juncture of cross-structure and hull due to
total cross-structure weightMaximum shear at juncture of cross-structure and hull
F50 Maximum wave-induced shear at juncture of cross-structure and hull,weightless cross-structure
g Gravitational accelerationH Wave height1Ri/3 Significant wave heightHL Side hydrostatic force on outboard shellHR Side hydrostatic force inboard shellh Horizontal shift of center of buoyancy of one hullL Length between perpendicularMi Maximum vertical bending moment at juncture of cross-structure
and hullMc Moment at juncture of cross-structure and hull due to weight of
cross-structureM0 Maximum wave-induced bending moment on cross-structure, weight-
less cross-structureP Maximum axial forceS Clear hull spacing
vii

Symbol Definition
Ti Cb-O.6J X1 L/21îTc Maximum torque on cross-structure about its twst center, t o
Maximum torque on cross-structure about its twist center, t = ot Longitudinal distance between ship LCG and cross-structure twist centerVL Centroid of HL below neutral axk of cross-structureVR Centroid of HR below neutral axis of cross structure
W Total width of catamaranYL Wave surface above still waterline at outboard shellYR Wave surface below still waterline at inboard shell
Total (both hulls) displacementg x added mass in sway of both hullsWave lengthLCMass density of waterCircular wave frequency

INTRODUCTION
The history of catamarans is old, references (1) and (2). However, in this century,it is only ¡n the last decade that there has been a revival of serious interest in catamaransresulting ¡n the construction of some sixteen vessels.
Except for one cargo vessel for use on the Volga, all these vessels are special pur-pose vessels, such as ferries, oceanographic research ships, fishing boats, drilling rigsand pipe-laying barges. Also, ¡fis pertinent to note that these ships are under 315 feetin length, except for two, the 400-foot Duplus (Dutch) and the 425-foot Kyor Ogly(Russian). lt may be recognized that for the special purposes ¡n question, catamaranswere selected over monohulls mainly to take advantage of the large deck area, hightransverse stability,and good maneuverability at low speeds offered by the catamaranconfiguration.
The question has been raised, "why not large catamarans?" - both in the commer-cial sector and the Navy. In both groups, the interest ¡s related to high-speed vesselsfor low density pay load. To answer this question, the Maritime Administration beganwith the Catamaran Study (1), performed by General Dynamics, and the Navy has under-taken a comprehensive assessment of catamaran technology (2), (3) and (4). LittonIndustries claim an actual design of a semi-submerged catamaran container ship (5) and(6), and Fisher, et al, have prepared a preliminary design of a catamaran container shipfor the Trans-Atlantic trade (7).
A salient obstacle in assessing the desirability of large catamarans has been the lackof technical information to establish the structural requirements. The purpose of theproject reported here was to investigate into the technological limits to size and propor-fions of catamarans, appraise existing design procedures, and determine the additionalstructural knowledge required to insure their structural adequacy.
The features examined that could impose size limits were powering and propulsion,cross structure scantlings, construction problems, repair facilities, and harbor and pierlimitations.
In order to estimate the cross-structure scantlings ¡t was necessary to accomplishat least the first cycle of the preliminary design of a large catamaran of a size indicatedby considerations other than cross-structure scantl ings.
The major effort of the project was centered around the procedure for the structuraldesign of the cross-structure. The task was divided info three parts, viz: (a) Assemblyand comparison of all available model test data on the loads on the cross structure; (b)Evaluation of the analytical methods for estimate of cross-structure load and (c) Struc-ture analysis methods.
Numbers in parentheses refer to references listed.

2
New equat ions are proposed for the estimate of wave-induced vertical bendingmoment, axial force and shear force. Modifications are proposed to an existing equa-tion for torsion
The project scope was limited to conventional surface catamarans as opposed tosemi-submersible catamarans (column-stabilized or strut-stabilized). No attempt wasmade to analyze the influence of symmetrical hulls or non-symmetrical hulls on the sizelimit or the cross-structure of catamarans.
Of all the aspects of catamaran design, resistance has received the most atten-tion in the past. Considerable work has been done in the areas of theoretical predictionand model test measurements, as well as their correlation. A brief statement on the mcstimportant aspects of catamaran resistance as gathered from the literature ¡s provided inAppendix 1,
Recommendations are made for the future research and development program forlarge catamarans.
2. ANALYSIS OF FEATURES THAT MAY IMPOSE SIZE LIMITS
It appears, in principle, that there are no insoluble technical considerations whichwould preclude the design and construction of a 1000-foot catamaran in the United States.This does not imply that the facilities exist to build many ships immediately, that therewill not be special problems to overcome, or that there is no need for future research anddevelopment effort necessary to build an efficient vessel . What is meant is that if eco-nomics strongly favor a large catamaran, the venture to design and build one may be un-dertaken without a strong reservation that some unknown technological problem wouldforce the premature termination of the venture.
The features considered in reaching the foregoing conclusion are as follows:
Resistance-Powering-Propulsion:
Main machinery and propulsion system for a large catamaran does not present asituation not found ¡n large monohull designs. Depending on speed and draft, very largecatamarans may require more than one propeller per hull . However, this need not set anupper limit to the catamaran size, assuming that hull beam ¡s sufficient, and form can bedesigned to accommodate more than one propeller. Machinery weight and volume should
be acceptable.
Wave Loads, Cross-Structure Scantling and Structural Material:
The hydrodynamic effect unique to catamarans and of prime consideration is, ofcourse, the differential wave loading on the hulls to be absorbed by the cross-structure.Design checks for up to approximately 1000-foot catamaran with 100-foot clear hull spac-ing show that cross-structure with practical scantlings can be designed to absorb the waveloads. With full transverse bulkheads at approximately 50-foot spacing and making theconservative estimate of effective flange, the maximum steel (100,000 psi yield) plate
thickness is 1-1/4 inches. There is no doubt that the cross-structure material would haveto be steel.
Drafts:
Wafer depths at existing cargo piers around the world suggest draft limitation ofapproximately 35 feet.
Construction:
Existing United States drydock Facilities can build up to approximately 1050' x140' monohu Ils. Bethlehem Steel Company's new drydock at Sparrows Point, Marylandwill measure 1200' x 200' . One million ton drydocks under construction in Japan andNorthern Ireland will be approximately 1965' x 329' . Catamarans with overall beamlarger than the wIdth of the available dock would have to have the hulls and the center-body assembled with hulls afloat. The latter technique was used ¡n the E.W. Thorntonconstruction. Twin docks with equal depth, just the correct depth and ¡ust the correctwidth, may be an answer, if available.
Drydocking:
Drydocking poses a problem ¡f the desired catamarans are too large for the dry-dock sizes mentioned in the previous paragraph. Modification of existing facilities orconstruction of new Facilities will be required. From a technical viewpoint, use of twofloating docks may be feasible.
One must not underestimate the ingenuity of shipyards to solve the drydockingproblem. Evidently no serious reservation was held regarding drydocking when the con-struction of the 250-ft wide Mohole Platform was initiated.
The Levingston Shipbuilding Company has drydocked the 105-ft wide E.W,Thornton on a single floating drydock split into two longitudinal halves held togetherby spacer beams.
lt is believed that the Russians have a scheme for dismantling their relativelysmall catamarans for maintenance and repairs.
Cargo Handling and Piers:
The problems of cargo handling and piers are economic problems. They can besolved, at a price, if the economics of catamarans were so attractive. Use of twinpiers or discharge of cargo offshore have possibilities.
Channels and Harbors:
Certain unpublished studies claimthat the majority of major harbors around theworld can accept 1000' x 400' catamarans.
Economics:
The General Dynamics study (1) and certain unpublished studies claim that the eco-nomics of catamarans as compared to economics of monohu Ils are unfavorable or at themost marginal. Captain M. ftkhart, Jr. reporting on the Navy's findings to date (3)
3

4
states "No compelling reason is yet in sight for a general shift from the monohull to themuitihull or catamaran configuration."
3. EXISTING STRUCTURAL DESIGN METHODS
3.1 General
The coverage of existing design procedures ¡s limited to the cross-structure sincewithout exception individual hulls have been treated as monohulls.
Neither the classification societies nor the governmental agencies have estab-lished design criteria or guidelines for cross-structure design and designers must followgeneral structural engineering techniques. In the case of the T-AGOR 16 CatamaranResearch Ship design the Navy did suggest the use of the paper "The Structural Design ofthe ASR Catamaran Construction" by Lankford (8) as guidance.
3.2 Cross-Structure Loads
As for any structure, there are two phases to the cross-structure design, namely,the determination of the loads and the design of the structure to absorb the loads.
The loads experienced by the cross-structure are:
Calm water load due to the weight (lightship weight and dead-weight) of the cross-structure.
Wave-induced loads due to differential wave loads on the indi-vidual hulls.
Transverse vertical Bending Moment, usually referred toas just the Bending Moment or sometimes even as the RollMoment.
Vertical Shear Force, usually referred to as just the ShearForce.

5
1;;. Torsion Moment, sometimes referred to as the PitchMoment.
iv. Transverse in-plane Horizontal Force or Side Force.
y. Horizontal in-plane Moments or Yaw Moment.
Water impact loads.
C. Grounding and Docking Loads
The controlling loads in the cross-structure design are the wave-induced loads
numbered i, ii, and ¡ii, grounding and docking loads (if grounding and docking is con-sidered a design criteria) and the calm water loads. Impact loads are treated as localloads and require reinforcement of the cross-structure bottom and inboard shell of the in-
dividual hulls.
Side forces which appear to be instrumental in causing the maximum verticalbending moments are of sufficient magnitude to be included in the direct stress calcula-
tion. Earlier designers tended to neglect them and only ¡n one conventional catamaranmodel test (9) (report unpublished) were the side forces measured. Loads (y) and (vi)
cause negligible stresses.
The rest of this section ¡s devoted to the survey of the existing structural de-sign methods. However, at this point ¡t may be desirable to point out that the projectinvestigators' conclusions as to the vessel positions with respect to the waves that are
likely to give rise to the maximum response and the recommended method for design
load estimate appear in Section 5.
6
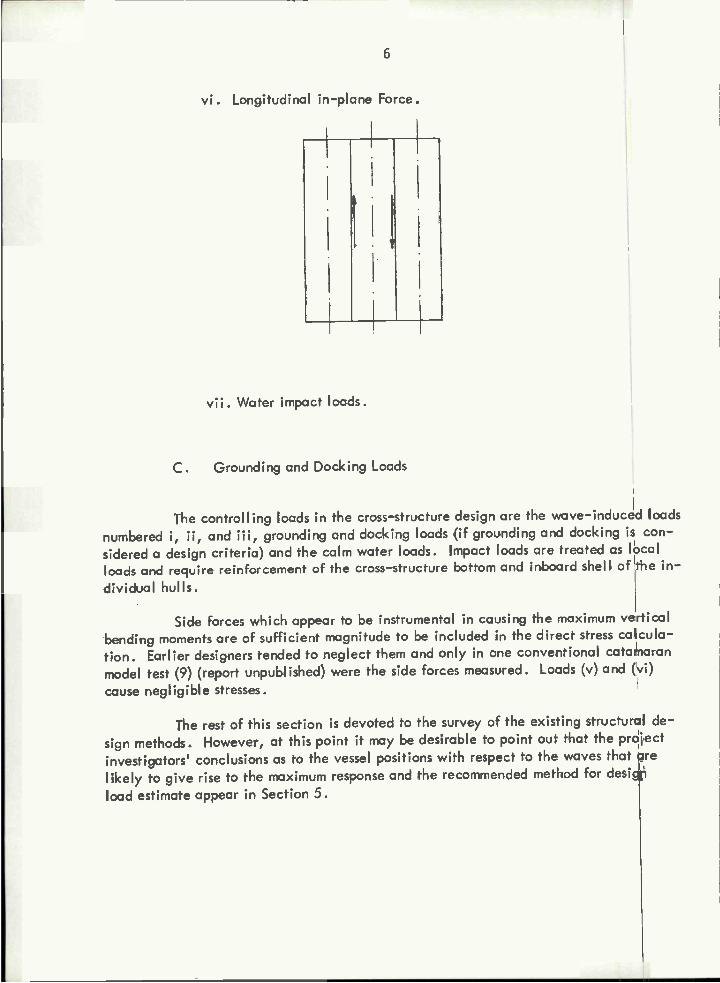
Longitudinal ¡n-plane Force.

7
Table i - Catamaran Load and Structure Analysis
Arecs of ContributionC-S Wave Loads
Steel Ground- Bend-Wt ¡ng ¡ng Shear Torsion Structure Analysis
Ref. Est. Loads Mom. Force Moment Bending Shear Torsion
R. Scott IO + + + +
B.W.Lankford,Jr. 8 + + + +
H.A. Schade 12&13 + + +
A.L. Dinsenbacher 13 + + +
G.O.Thomas 4 + + + +
J.L.Glaeser 14 + +
C.W. Levingston15 Description of E.W. Thornton Structureand W.H. Michel
W.H. Michel 16 Description of Univ. of Miami Catamaran Design Structure
3.3 Survey of Existing Design Methods
Table 1 lists load and structure analysts and their published contributons. ltis emphasized that designers of catamarans actually built have relied heavily on modeltests to provide the numbers for wave loads. Model test data analysis is covered in Sec-tion 4. Brief description and discussion on the work of each structure analyst listed inTable i follow. However, any calculations performed to assess their methods are in-cluded in tables of Section 5. These tables compare model test predictions, calculationsby existing methods and calculations by new equations presented ¡n this report.
3.3.1 R. SCOTT
While still a Naval Architectural student at the University of Michigan,Scott proposed expressions for the stresses due to torque and transverse bending of a cato-moran cross-structure (10). They are as follows:
To rs ¡ on:
To obtain the torsional bending moment, a fine-lined 300-foot longvessel was poised obliquely on a trochoidal wave, 170' x 10'. The crest coincided with

S- T
2 At
8
the forward quarter point of one hull and the aft quarter point of the other hull, withthe trough at the extremities. (Scott has not provided additional information on thevessel or the basis for selecting a 10-foot high wave.) Under this attitude of the vessel,the center of buoyancy of the hulls moved toward the crest by an amount equal to 4percent of the length. Thus, each hull had a torque of 0.04L times the displacement perhull and the total torque on the cross-structure was given by T 0.04LL
Where t, Total displacement of catamaran
Assuming the wing structure as a thin walled rectangular tube in tor-sion, the stress, S, was given by
where A Area of the tube and
t = Tube thickness
The approach to obtain the total torque moment, as simple as it maybe, has merit for application in early stages of the design. Torque as given by 0.O4LLhave been compared with model test results in Table 9. Except ¡n the case of one vesselwhere the test value ¡s 16% higher, in all other cases, 0.04LL would provide conserva-tive estimates.
Little application can be found for the stress expression as all knowncatamarans have longitudinally discontinuous cross-structure which can not be idealizedas a single tube.
Transverse Bending:
It was assumed that during severe rolling in beam seas one of the hullscan become partially emerged where one-half of the entire displacement of one hull ¡scantilevered from the end of the cross-structure. Under this assumption the stress on thecross-structure is expressed os
Stress - Hull separation x 1/2 displacement of one hullSection modulus of cross-structure on centerline
(Note: Here S clear hull spacng)
(W-2B)A/4 =
Section modulus Section modulus
A portion of Table 7 is a comparison of bending moments given byS L /4 with available model test results. lt shows that the test value for ASR ¡s higherthan S L /4 while for other vessels S A /4 ¡s higher than the test values.

9
Even though Scott's assumption provides bending moment valueshigher than the model tests ¡t ¡s questionable whether the particular assumption of theship-wave relationship generates the maximum bending moment. A more detailed dis-cussion on the condition for maximum bending moment appears ¡n Section 5.
3.3.2 B.W. LANKFORD, JR.
Lankford's well-known and valuable paper, "The Structural Designof ASR Catamaran Cross-Structure" (8) includes the following:
i Analytical approach to sea load prediction
Distribution of the design sea loads
Drydocking and grounding loads
Structural configuration of the ASR
The design procedure
The design wave-induced vertical bending moments were obtainedby making a long term prediction. The prediction calculations used response ampi Rudeoperators provided by model tests (11), ocean wave spectrum derived from data on 12most severe storms at the National Institute of Oceanography (Great Britain), and wavefrequency occurrence in the North Atlantic.
The part of the paper which covers points (ii) through (y) mentionedabove, together with the references, is reproduced in Appendix 2 of this report.
Lankford uses drydocking and grounding loads as design criteria.Based on the assumption that the vessel is docked or grounded with maximum weight insuch a manner that one hull is supported forward at station 4 and the other ¡s supportedaft at station 18, the design torque is given by Ad/4 0.175 L This criteria isconsidered overly conservative and it gives torque values which are much higher thanwave induced torque as can be seen in Table 9. The assumed loading condition whereno buoyancy support is available can occur during docking only. Further, one mustassume that the hull flexibility ¡s not such that the vessel weight can force the keeldown to the blocks.
The Lankford method of cross-structure analysis ¡s likely to attractdesigners for two reasons, viz:
i. if is neatly stated and simple and quick to apply.
¡f. lt is the only available method which has been applied tovessels actually built, namely the ASR and the 1-AGOR 16.

'o
However, the readers must be cautioned against the unreservedacceptance of this method as it appears to oversimplify the structure and make some
questionable assumptions. Further, the method does not assure an economic nor a con-
servative structure. The primary oversimplification is that the hulls are rigid. The pri-
mary questionable assumption ¡s that there is no relative rotation between the hulls andthe cross-structure at the junction of the hulls and the cross-structure.
3.3.3 H.A. SCHADE and AoL. DINSENBACHER
Schade's and Dinsenbocher's works (12) and (13) are considered to-gether since the methods employed by Dinsenbacher to develop equations for axialforces, vertical moment, shear and torsion moment are refinements of methods devel-
oped by Schade. The Ship Structure Committee project reported here benefited fromthe information and style of presentation in these two references. The following para-
graphs are taken directly from the Introduction and Analysis section of Dinsenbacher's
paper and they state the refinements made to Schade's methods, and the assumption of
the methods. The Summary and Discussion (from the same paper) which include theequations developed are reproduced in Appendix 3 of this report. (The reference num-
bers in the quotation refer to the references ¡n the paper which are also included n
Appendix 3.)
"In 1965 Professor H.A. Schade made a feasibility study of an ocean-going catamaran in which equations were developed for estimating thecross-structure loads (1). The author assumed the hulls to be prismaticforms acted upon by vertically fronted waves. It was decided to comperethe loads resulting from this method to results from a model test of an
ASR catamaran (2). The comparison showed Schade's loads to be some-what higher than those found from the model test. Also, Schade's methodrelates wave height only to ship dimensions, and not to wave length. lt
was thus decided to employ many of the general aspects of Schade's method
but to modify the waves used in his study. Sinusoidal waves are substituted
for the vertically fronted waves. The wave lengths are related to the shipdimensions in an effort to optimize loads. Also, the wave amplitudes arerelated to the current design wave height-length relationship and to theloads measured on the ASR catamaran model
"The resulting empirical equations devised herein are simple and quickto employ. They are founded on a combination of a more realistic waveshape, the current design wave height-length relationship used for longi-tudinal strength, model and full-scale evaluations of current surface-ship hull girder design loads, and loads measured on a catamaran model
¡n waves. A procedure for estimating primary stresses resulting from the
gross loads ¡s also included."
Assumptions: (Quotation Continued)
1'For this study, in a manner similar to that of Schade, the ship is idea I-
¡zed as two rectangular prisms (representing the hulls) connected by arectangular box (the cross-structure). The longitudinal and transverse dis-

11
tributions of weight are taken as uniform in the hulls and ¡n the cross-structure. The length, beam, draft, and weight of the prismatic represen-tation of the hulls are taken os those of the actual hulls. The intercon-necting box has the same length (span between hulls), width, depth,weight, clearance above still water, and vertical location of neutral axisas does the actual cross-structure. The fluid density used for the computa-tion of vertical forces ¡s modified here to compensate for the difference indisplaced fluid between the rectangular blocks and the actual hull forms aswas done by Schade; however, the fluid density is not modified in the com-putation of transverse loads. Also, the drafts are found for the prismaticforms which produce vertical accelerations of 0.4g, and these accelera-tions and drafts are used ¡n computing the loads on the prismatic idealiza-tion. These heave acceleration amplutudes of ±0.4g are not unrealisticmaxima to expect for the ship's service life (3). Sinusoidal waves ratherthan vertically fronted waves are used. Pressures are assumed hydrostatic.Inertia forces on the ship mass are included in calculating loads. Slammingand whipping are ignored. lt is further assumed herein that relative posi-tions of wave and ship similar to those which produced the highest cross-structure loads in Schade's work will result in the worst conditions. There-fore, only the loading conditions shown in Figures 1 and 2 will be considered."
Figures 1 and 2 are included in Appendix 3.
Comments on the equations developed and their associated assumptions follow:
Axial Force:
The equation for axial force ¡n beam seas does not account for the pos-sible force contribution due to the horizontal acceleration, which can be substantial
Detailed discussion on the probable conditions for maximum loads asconcluded from some independent analysis and available test data is covered in Section 5.
Bending Moment and Shear:
Although not stated specifically the bending moment equationsdevelopment assume that maximum side hydrostatic force and maximum vertical ac-celeration occur at the same time for the relative wave and ship position of LoadingCondition i (see Appendix 3, Figure 1). Also that the sense of the acceleration onboth hulls is the some.
The second term on the right side of equation (75), Appen-dix 3, for maximum shear ¡s obtained by relating the shear and bending moment RMSvalues in 40-knot wind beam seas for the ASR catamaran. Intrinsic to this operation isthe assumption that shear and moment are in phase or that the particular shear is the re-sult of the particular moment.
The validity of the foregoing two assumptions is doubted. The tweassumptions do ploy a very important part in the resulting equations for maximum bend-ing moments and shear. The reasoning behind the oblections will be found in Sec-tion 5.

Torque:
Equation (79) Appendix 3, developed for maximum torque (which
occurs ¡n oblique seas) about the twist center of the cross-structure is
Cbg BAL 2/2U + 0.14 MQ t/S
The first term on the right represents the torsion about the center of gravity of the ship,
while the second terni represents the torsion due to shear acting through the ship's cen-
ter of gravity, which tends to differentially heave the hulls. The latter term is ob-
tained by relating the maximum shear to the maximum bending moment (for a catamaran
with weightless cross-structure) in the same oblique wave which causes the maximum tor-
sion. This assumption is the same as the second assumption listed under bending moment
and shear and its validity is doubted also. Attention is drawn to the fact that the term
¡n question is not likely to be large unless t, the distance from center of center of
gravity of the ship to the center of twist of the cross-structure, is large.$
The development of the first term in the torsion equation is found to be logical and pre-
ferred over Scott's expression for torque. lt seems to take in as many details as possible
without beginning with the fundamental equations of motions. The first term is em-
ployed to nondimensiorialize the test data (Section 4).
3.3.4 G.O. THOMAS
12
G.O. Thomas delivered a lecture (4) entitled "Structural Analysis
of Catamarans" as one part of a short course on "Modern Techniques of Ship Structural
Analysis and Design" at the University of California in September 1970. lt was a gen-
eralized lecture based on the conceptual design of a naval strike platform for which con-
siderable design information was collected and design criteria developed.
The material on design load derivation was as presented by
Dinsenbacher and discussed earlier in this report.
In developing the design criteria for aircraft carriers, Thomas was
able to refer to some very recent work performed at the British National Physkal Labora-
tories (unpublished) and at the Naval Ship Research and Development Center. The sec-
tion on structural design criteria selection contained formulas for cross-structure clearance
and slamming loads which are applicable to catamarans in general.
Thomas' formula for cross-structure clearance above load waterline is
C=3+1.1 2(S+B) butC(20
The clearance as calculated by this formula compared quite closely to the actual clear-
ance for the E.W. Thornton and the ASR but it gave much higher values than actual for
the University of Miami design and the Rdgely Warfeld. In this respect ¡t is pertinent
to note that the forward end of the Ridgely Warfield's cross-structure ¡s bow shaped and
designed for low clearance. lt is suspected that for very large catamarans the cross-

13
structure clearance may be controlled by the minimum depth and freeboard requirementsfor the individual hulls. Also, the designer is likely to pay some penalty ¡n terms ofadditional clearance if the ends of the cross-structure are within approximately 0.15 Lof the ends of the hulls.
Thomas provides a fairly lengthy discussion on the design criteria forcross-structure slamming. He elects to treat the relatively small forward-and-aft areasas local areas since they are of minor importance to the overall cross-structure weight.The following discussion on the slamming loads on the large middle areas (referred to asRegion 2) is quoted directly from Thomas' lecture notes (4).
"In Region 2, slamming of the largest area of cross-structure bottom plat-¡ng was assumed to be caused by the descent of the cross-structure righton top of a wave passing through the catamaran flume. This may not bestrictly the case, but lacking specific information, it was taken to be so.Wave buildup within the tunnel was neglected since it primarily effectsslamming aft. A second unpublished report by the National Physical Lab-oratory shows that high-impact pressures aft for a catamaran with water pile-up and without anti-pitching fins were a little less than at the forwardquarter point."
"Loads from slamming on the cross-structure bottom in Region 2 can bedivided into two kinds: (a) short-term high-impact pressures acting lo-cally in the lateral direction for panels and on the edges of floors and(b) longer duration for lower pressures used for cross-structure bottombent and overall cross-structure bottom grillage design h1
"The highest pressures for short-term slamming can be taken as for flatbottom impact. This can be justified by considering that welding dis-tortion can cause a slightly concave appearance to the cross-structurebottom plating which could then slam on wave crests as a flat bottom.The equation used for flat-bottom slamming is from Chuang*
p =4.5V 64/62.4
where p ¡s the flat bottom slamming pressure in pounds per square inch,V is the relative motion between ship and fluid in feet per second, andthe value 64/62.4 converts pressures from those for fresh water fo thosefor sea water. The slamming station for relative motion was taken at0.46L forward of amidships and, since impact pressures are assumed tooccur when the ship descends on top of the wave, impact velocitieswere bosed on design maximum pitch motion. Pressures greater than thosefrom flat-bottom slamming can be experienced as transients for rela-tively shallow deadrise angles of hull to fluid. However, these pressuresare usually very localized to the water-structure interface and were as-sumed to carry insufficient momentum to affect the design of the plating."
*chuang, S.L., "Experiments on Flat-Bottom Slamming," Journal of Ship Research(March 1966)

14
"The first mentioned unpublished NPL report showed that raising thecross-structure on a catamaran model reduced the frequency of slams ofa given severity but did not reduce the intensity when they did occt.r.Pritchett** has confirmed this conclusion in more recent testing atNSRDC. The general concensus so far is that for the higher most prob-able sea conditions (Beaufort 6 in one case and State 7 sea in another),short-term, high-impact slamming pressures can be assumed to be between80 and 120 psi, regardless of the size of the ship or height of the cross-structure (within reason). Slamming pressures from the Chuang equationfell within this range for all catamarans of the series
"High impact flat-bottom slamming pressures were applied over singlepanels of bottom plating which were then designed as for boundaries oftanks, and to floors and double bottom longitudinal girders to designagainst local collapse."
"Following the initial slam on the bottom plating of the cross-structure, the pressure can be assumed to drop very rapidly to thatgiven by 1/2 V2 where is the mass density of sea water, i.e.,
P = 0.994 V2
where P is the flat bottom pressure in pounds per square foot and V¡s the relof ive motion between ship and fluid in feet per second
"For this relationship the relative velocity between ship and fluidcan be taken to include the orbital velocity of particles in the wavesince the cross-structure bottom might now be well below the crestof the wave. Pressures from this equation ranged from 600 to 900pounds per square foot for the catamaran series studied. These pres-sures were then applied to the overall cross-structure bottom grillagedesign."
Thomas has also developed a weight equation for the cross-structureof a catamaran but its application is extremely restricted. Actually, it was developedfor the conceptual design on aircraft carriers. The equation is not presented here dueto its acknowledged limitations and high probability of involving large errors when ap-plying it to nonaircraft carrier type structure.
3.3.5 JOHN L. GLAESER
While at the Webb Institute of Naval Architecture, Glaeser pre-pared an undergraduate thesis entitled "A Theoretical Investigation Into the Motionsof a Cal-amaran and the Shear and Bending Moments on its Cross-Structure" (14). Theresponses considered were heave, roll, shear and vertical bending moment. As a checkon his theory, Glaeser calculated the responses for the ASR and compared them with themodel fest results (11). Figure 1 (taken from the summary of the thesis) shows the compari-son.
**pritchett, C., "Model Studies of ASR-Catamaran Impact Pressures on Between HullStructure," Naval Ship Research and Development Center T &E Report 340-H-01
(January 1970).

û.'
4w ô>4
,trzZZ
w
- HEAVE E5POÑ5E
- cROss 5TUCTUEEÑ1ÑG MOMENTRSPOSE
.4
ROLL RESPONSE
15
TI.4EOy C)JL..'1'
i i i i¡.4 ¡.(c? ¡.6 2.0
T1EOY (VrrO ¡-cr3)MODELTEST (v=t5 KTS)
THEORY (v=oKTs)MODEL TEST (voKr)MODEL TE5T (VKTs)
.2 .4 .6 M ¡.0 ¡.2 ¡.4 ¡.6 ¡.8 2.0
FREQUENCY (.&DJ5EC)I I I I
¡000 4o0 2 o loO .50WAVE LEGT4 (Fr)
Fig. i - Catamaran Response in a Regular Beam Sea(Reproduced from Ref. 14)
.5 LO ¡2 ¡.4 ¡.8 2.0FREQUÑCY (R,DJsEc)

16
To permit the most basic analysis the problem was simplified by tak-ing a catamaran at zero speed in a two-dimensional cosine wave. This is reasonable asmaximum roll and vertical moments appear to occur in beam seas. Other primary as-sumptions of the theory are as follows:
Motion Calculations:
The hulls are thin enough, and the roll small enough so thatthe wave height at the center of a hull is the same as at thesides. The catamaran is wall sided.
All the hydrodynamic, hydrostatic and inertial forces actthrough a point on the centerline of each hull
The catamaran ¡s not pitching and there is no cross couplingeffect between heave and roll.
Shear and Bending Moment Calculations:
All hydrodynamic and hydrostatic forces act through the centerof buoyancy of each hull as ¡t moves.
The cross-structure is weightless (in accordance with the modeltest).
The catamaran rolls about its center of gravity and is wall sided.
First, Glaeser wrote and solved the differential equations for heaveand roll. Then knowing the motions of the vessel, the forces on each individual hullwere calculated, the forces being those which made up the original differential equa-tions. The constants of proportionality, added mass and damping were calculated usingGrim's coefficients.
Comments on the Comparison of Theoretical Calculationand Model Test Results for the ASR:
See Figure 1 . Although the shear response comparison is not in-cluded in the summary, it is included in the principle thesis. However, the shear com-parison is nearly identical to the roll motion comparison.
The roll and shear correlations are very respectable except that thetheoretical maximum occurs at W 1 .2 ( » 2 hull centerline spacing) while theexperimental maximum occurs at W i ( ,> 2 overall width). lt is suspected thatthis ¡s due to the simplification that the hulls are thin and that the vertical force actsthrough a single point. The agreement in magnitude leads one to conclude that thetheory has succeeded in identifying, at least, the principle parameters which influenceroll motion and shear force.
17
Figure 1 does riot show the model test heave. In this respect it isvaluable to note that the theoretical heave curve is very much like the Thornton modeltest curve in which heave/wave height is approximately zero at that wave frequencywhen roll, shear and bending moment are maximum nd approximately unity at low fre-quencies.
The bending moment correlation is poor casting a doubt on thetheory. As Glaeser himself suspected it is most likely due to neglecting both the hydro-static and hydrodynamic side forces. lt will be observed that locations of maximumsare the same as for roll motion.
4. MODEL TEST DATA ANALYSIS
As mentioned earlier model tests have assisted greatly in the estimation of wave-induced loads on the cross-structure of catamarans. What ¡s more important to recog-nize ¡s that they will continue to do so until theoretical and semi-empirical methodshave been proven to a high degree of confidence (which takes time).
This section consolidates and compares the available model test data on the loadsimposed by sea waves on the catamaran cross-structure. Limitations of the varioustest programs and the consequent limitations of the data comparison are enumerated.The purpose of the comparison was to determine the gross relationship between the loadsand the major parameters of the catamaran design and waves.
4. 1 Test Background
4,1 .1 Test Vessels
The prototype characteristics of the vessels whose model fest datawere available to this project, are provided in Table 2. lt will be observed that withinthe data plots appearing in the report are data points marked "Undisclosed Series."These are from an unpublished test report of a conventional catamaran.
The bulk of the analysis has been centered around the "Thornton"and the "ASR" whose test programs included a large range of sea conditions and thedata, as reported, are amenable to extrapolation and comparison. The amenability toextrapolation was most valuable as it was helpful in estimating loads on large catamarans.
The portion of the Mohole and the Levingston 6-column semi-submersible platforms fest data which were useable were the data for the ocean tow con-dition, In this condition the water lines are below the top of the lower longitudinalhulls and the vessels are essentially surface catamarans. Test program for the Universityof Miami Research Vessel Design was quite limited.
4.1 2 Loads Compared
The loads compared were the two moment and one force measuredin each test with model at zero speed, viz:

18
Vertical Bending Moment ¡n Beam SeasVertical Shear Force ¡n Beam SeasTorsion Moment ¡n Oblique Seas
The crucial side forces which are the major cause of the maximumvertical moment were measured ¡n the Levingston test only. The reported accelerationdata for the various tests are inadequate to attempt a meaningful comparison
4.1.3 Pertinent Notes on the Tests
a All the test models simulated the total weight, centers and g>'-radii of the catamaran as a rigid body. None of the modelssimulated the structural rigidities of the centerbody or the crossmembers.
b. The ASR report (11) provides random wave test results (only) ¡nterms of response amplitude operators and response spectralenergy.
The other tests which were all performed at the Davidson Lab-oratory reports both regular wave and random wave test results.However, the random wave test results are in terms of averagesonly.
c The all important information on phase relationship between thevarious loads and the wave are available for the Mohole and theLevingston tests only.
Each test was performed for a specific configuration and one load-¡ng condition only.
Load measurement system: The ASR test used four strain gagesmounted on two rigid aluminum bars, one forward and one aft tomeasure loads.
The Davidson Laboratory used Schaevitz force measurement dyna-mometers which are linear variable differential transformers to measure loads. (Thedynamometers have a core mounted between two springs and the voltage output ¡s pro-portional to the displacement of the core.) Although the actual instrumentation ar-rangement was not the same for every Davidson Laboratory test, the following para-graph from the ;IThorfltontl Report (17) is informative of the principle of the system.
The hulls were connected by a rigid bridge structure which was apart of the force and moments measuring system. The bridge wasfixed to the port hull and was connected to linear force measurement-dynamometers ¡n the starboard hull. The bridge was made up of threeframes which spanned the hulls at the L.0 .G. and at two points 12inches forward and aft of the L.C.G. The frame at the L.C.G. was

* Assumed value
19
Table 2 - Prototype Characteristics of Model Test Vessels
EE .2- cE0v)i -
-g'-O
w D V) V) O..
Reference Number 15,17 11,18 16,19 20,21 22
Test Facility Davidson NSRDC Davidson Davidson Davidson
Hull Symmetry Unsym Unsym Unsym Sym Sym
Length Overall - - 14.6-8" 390-0" 260'-O"
Length Bet. Perp, L 255'-O" 210-O" 136'-6" * 355'-O'
Beam Overall, W 105-0" 86-0" 50'-5" 250-O" 200'-O"
Beam Each Hull, B 37-0" 24-0" loi-10,' 35-0" 36-0"Hull , Spacing, b 68'-O" 62'-O" 33'-i" 215-0" 164-O"
Clear Hull Spacing, S 31'-O" 38-O" 16,-10,' 180'-O" 128-0"
Test Draft, D0 17'-O" 18-O" 9-5" 28'-7" io-o»
Total Displacement,L 6700 1 2797 T 695 T 16,800 T 7700 T
Block Coef, Cb 0.73 0.54 0.56 0.75 0.90
Waterplane Coef, C 0.84 0.737 - 1 .0 1 .0
Centerplane Coef, CLA 0.92 0.92 - 1 .0 1 .0
L/b 3.75 3.387 4.063 1.163 1.220
L/D0 15.00 11.67 14.44 13.64 16.25
B/D0 2.18 1.33 1.78 1.24 2.25
L/B 6.89 8.75 8.13 11.14 7.22
b/W 0.648 0.721 0.667 0.860 0.820
Oblique Wave Coef, C) 0.47 0.51 0.46 0.77 0.78

20
Table 3 - Particulars of 'E. W. Thornton" Series Ships
Table 4 - Particulars of "ASR" Series Ships
TABLE . - PARTICULARS Of "ASE" SERIES SHIPS
Table S - Particulars of the University of Miami Series Ships
TAELS 5- PARTICULARS OF THE UNIVERSITY OF MIAMI SERIES SHIPS
3
Ship A Ship B Ship C ASR
Scale 1:3.19 1:2.675 1:1.71 1:1
LBP, L 669.90' 561.75' 359.1' 210.0'
Beam Overall, W 274.34' 230.05' 147.06' 86.0'
Seam Each Hull, B 76.56' 64.20' 41.04' 24.0'
Hull Spacing, 5 121 .22' 110.65' 64.98' 38.0'
Hull Spacing, b 197.78' 165.85' 106.02' 62.0'
Draft, D 57.42' 48.15' 30.78' 18.0'
Diplacernerrt,A 90,800T 53.600T 14,0001 2,797T
d 93.79' 78.65' 50.27' 29.4'
2 (W-B) = 2b 395.56 331.70 212.04 124.0
Ship A Ship B Ship CUniv.o(Miarr,i
Shipu
Scale 1:5.080 1:3.339 1:1.143 1:1
LBP, L 693.4' 455.8' 156.0' 136.5'
Bean, Overall, W 256.0' 168.3' 57.6' 50.4'
Bean, Eoch Hull, B 85.3' 56.1' 19.2' 16.8'
Hull Spacing, 5 85.3 56.1' 19.2' 16.8'
Hull Spacing, b 170.7' 112.2' 38.4' 33.6'
Draft, D0 48.0' 31.5' 10.8' 9.45'
DispIacement,5 91,1081 25,8271 1,0421 6951
106.2' 69.8' 23.9' 20.9'
2 (W-B) = 2b 341.4 224.4 76.8 67.2
Significant Wcue Hf, 45.7 30.0 10.3 9.0H1
TABLE 3 - PARTICULARS OF "E.W. THORNTON" SERIES SHIPS
E.W. Thorrrtoc
Scale
Ship A Ship B Ship C
1:2.383 1:2 1:1 .278 1:1
LBP, L 607.67' 510.0' 325.89' 255.0'
Beam Overall, W 250.22' 210.0 134.19' 105.0'
Beam Each Hull, B 88.17' 74.0 47.29' 37.0
Hull Spaciag, 5 73.87' 62.0' 39.62' 31.0'
Hull Spacirrg, b 162.05' 136.0' 86.9' 68.0'
Draft, D0 40.51' 34.0' 21.73' 17'-O"
DisplacemectA 90,800 T 53,680 T 14,000 T 6,7001
d 52.43' 44.0' 28.12' 22.0
2(','I-B)=2b 324.10 272.0 173.8 136.0

21
attached to two dynamometers spaced three inches apart while the twoother frames were attached to single dynamometers located on the cen-terline plane of the starboard hull . All dynamometers gave the rela-tive shear force and the relative pitch moment, while the outputs ofthe two dynamometers at the L .0 L. registered relative roll moments."
lt should be clarified that the ASR System measured the total ver-tical bending moments, i.e., primary moments and secondary moments due to shear,whereas the Davidson Laboratory System measured primary bending moments only.
4.2 Data Consolidation and Comparison
As mentioned previously the data analysis is centered around the "Thornton"and the ASR tests. To accomplish data extrapolation, the "Thornton" and the ASRprototypes were expanded into o series of geometric ships up to 90,800-ton displace-ment. Tables 3 and 4 provide the particulars of the series. The wave loads responseamplitude operators were expanded by Froude scaling. The ASR test report providedthe R.A.O.s* while the Thornton R.A.O.s were based on the regular wave data. ltshould be clarified that the ASR R.A.O.s picked from the report were the mean valuesof two runs for each condition. The response of each ship in the series was obtained inseo state 5 (H 1/3 = 10'), sea state 7 (î 1/3 = 30') and sea state 8 (1/3 = 50') usingthe Pierson-Moskowitz spectrum represented as follows:
33.564S (w), ft2 sec2 16.78 e - fl1/3
(4)5
Area under curve of S (u.') vs equals ¡1]/3/2.832
The University of Miami Research Vessel design test data was too limited todeduce response amplitude operators. For the one random wave test, the wave and re-sponse information is reported in terms of averages only. To make the most of the data,it was expanded to three prototype ships which had test significant wave height equiva-lent to 10.3 feet (sea state 5), 30.0 feet (sea state 7) and 45.7 feet (sea state 8). Par-ticulars of these ships appear in Table 5. The Undisclosed Series was developed in thesame manner.
The semi-submersible platform data was used "as ¡s'
All the test data assembled are for zero speed. In case of the ASR modeltests (11), the load measurements were made in forward speeds up to 20 knots and it wasfound that the maximum loads occurred at zero speed. This finding need not be appli-cable to all craft, particularly very high speed craft.
* Response Amplitude Operators

There is general agreement among the different test data that maximum wave-induced bending moments and shear force occur in beam seas while the maximum torsionmoment occur in oblique seas (45° to 60° off 00 or 80° heading). A significant cor-relation between the "Thornton" and the ASR tests, the two tests for which R.A.O.s areavailable, is that the maximum bending moment and shear occur in waves with lengthequal to approximately .8 to 2.0 times the overall beam.
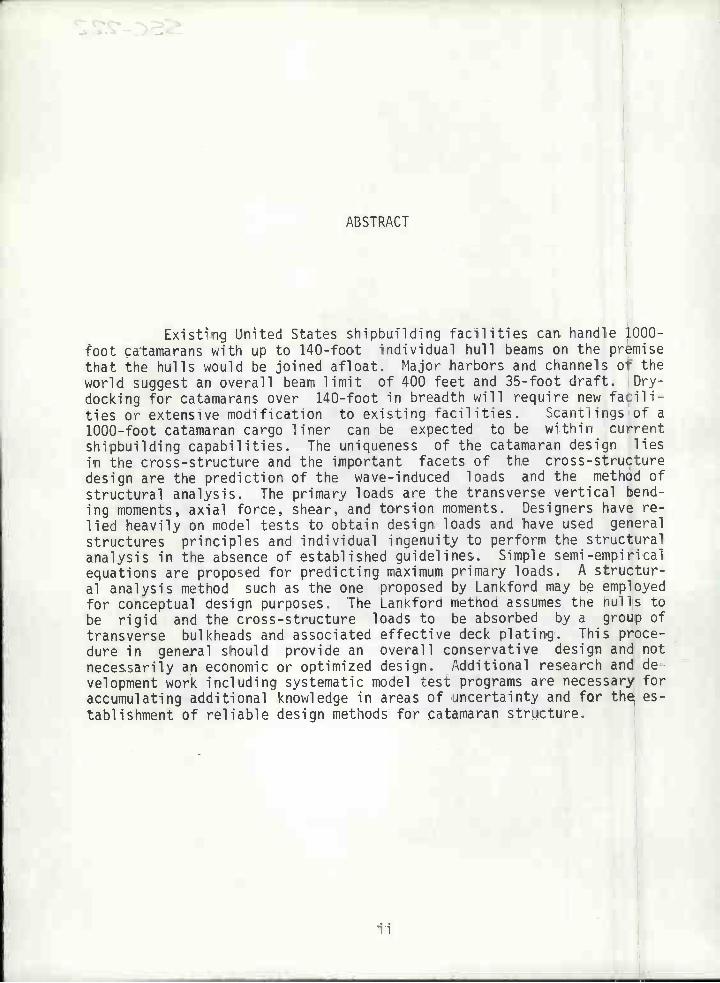
Non-dimensonalized data is presented ¡n the following plots:
Figure 2:
Figure 3:
Figure 4:
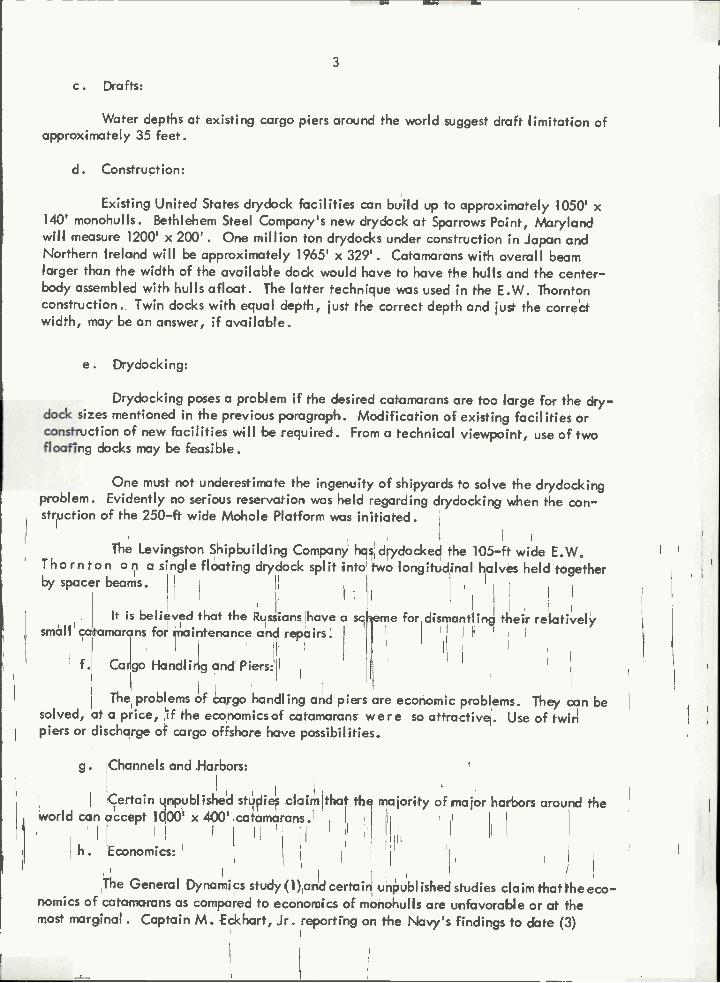
Max. shear forceFigure 5.
Max. shear forceb
w
Max. torsion mom.Figure 7. fI
Figure 6:
Fgure 8:Max. torsion mom.
Ti
22
Max. vert, bend. mom.d (L + L ) /2
Max. vert, bend. mom.d ( + ) /2
Max. vert, bend. mom.- d(+1)/2
Versus , , Beam Seas
Versus L , Beam Seas
Versus ¿, , Oblique Seas
Where Ti = ' C '. B x o.oJÇ' L2 /2TT
Versus , Beam Seas
Versus L, Beam Seas
Versus b, Beam Seas
Versus L, Oblique Seas
Each figure includes data from all the tests in three sea states. The symbols used ¡ri the
plots for the various tests are as follows:
- + -+ Thornton Series
-3--- ASR SeriesUniv. of M'ami Catamaran Series
D Undisclosed SeriesMohole PlatformLevingston Platform

04
05
02
o-' e, --- -'."- -----e- -
®SOE4 srare-_e- - -
Q
.SS.0/Q5 70R S).t4SOLS
Ño
'0'
o.,O Ó 20 50 4-0 50 GO - 'Q 80/t' OIS..4t'c0 Tc''5 - -
444% '77C'4 S S544.l SE-ISd(.a)/2
Fig. 2 - Max. Vertical B.M. vs. A,d(A+A1 )/2
Beam Seas
5ff qs .'o
o
X
All Other Tests:
-b'-.----e-'
-.4S05 " a.s'4-OEA stares®
-e___ -p-i. s.s\\
0!0 20 4-0 GO So W f20 4-0 'GO /90 ¿00
r-4.: 444ç Y T'C,4L SA4 vs b e4-4-f SEASó( -,)/2
Fig. 4 - Max. Vertical B.M. vs. b,d(A+A1)/2
Beam Seas
23
0.!O /& 2«!0 O 5Ò0 eo ,,o
v«e - -. M .'e.r,cA/54-r_
Fig. 3 - Max. Vertical B.M. vs. L,d(AA1 )/2
Beam Seas
.20
.83
Ñ.8 5'
2'9,.
.O2ES'
Maximum measured or average 1/1000 highest(obtained from significant or i/io highest av-erage values), whichever is greater.
9.5,4 574f' 4
40 50 Go 70a ,,v rous.a,-_'o to,,i.3
--eSEE ,°/. 5 ,°0R S>'AISOL,S
\\\
5y0-'4 77-lO8t,iTOt.d St?X,ES
-e- --e- - e ,454' SE®/CSQ. OC 441,444/ CAT 55®.-E-5
O LItJOISCCOSO -St® /550 4-q000Lr A/57/ ,O.
- --eH30
The plots are for loads ¡n terms of maximum single amplitudes where maximum is taken asfollows:
Thornton and ASR: Average of the i/i 000 highest calculated forthe Pierson Moskowitz spectrum.
O,
-e
C/0® -5 -44AX. ,%/-/E4® PC.S/ '3 5A49 E3$
Fig. 5 - Max Shear Force/i vs. A,Beam Seas
\ 450'\\
X
\
H
x
Ofr 52'
0,4
O-2

.50
Lb)
2
-'1' ,30'® SA 5A 72 2
ro/0 20 30 4ò 50 00 70 'Q 90
1cv F/j& fP , 4S
--e-----
SEE S X-);,, s>-44ö0'L .5
s.-
644 65 A.,0S0.'QL.'E EAX
X_z (7t4-IS.Fr)
fl20OC-. MAX 7t.0,v MaMcnr VS .0..t 4JQJ SAS
-e
24
Fig. 6 - Max. Shear Force vs. L,
{- Cr}w
Fig. 7 - Max. Torsion Moment vs.T1
Oblique Seas
Fig. 8 - Max. Torsion Moment vs.T i
Oblique Seas
Beam Seas
xL,
20 O 0 50 60 0 Ro ro.0 'N SMO,ISA,.,O roNs

The reported phase relationships between cross-structure loads for Levingston 6-column platform (in towing condition) in both beam seas as well as oblique seas are asbliows:
ø Maximum shear 90° out of phase with bending momento Maximum side force in phase with bending moment
Maximum yaw moment 90° out of phase with bending momente Maximum torsion moment 180° out of phase with bending moment
o 0.2
25
os
Fig. 9 - Added Mass For Sway Direction,Series 60 (Ref. 23)
Table 6 gives the ratios of maximum magnitude of each load in beam seasand oblique seas for the Thornton, ASR and the Levingston Platform. They were valu-able in deducing the load schedule, Table 10.
Table 6 - Ratios of Maximum Loads in Beam Seas and Oblique Seas
1.0
lt was realized that added mass ( ' 1/g) was an important term contributingto the vertical bending moments. However, the scope of the prolect would not permit de-tailed added mass calculation for each test vessel . Also, a literature search for referencematerial on the added mass ¡n sway of unsymmetrical vessel was futile. In view of this itwas decided to calculate the added mass based on Series 60 coefficients provided by Edoand Crane (23) and reproduced ¡n Figure 9 here.
Thornton ASR Levingston Mean
Bending Moment, Oblique Seas0.54 0.36 0.55 0.48Beam Seas
Oblique SeasShear, 0.52 0.55 0.53 0.53Beam Seas
Beam Seas0.55 0.36 0.55 0.49Torsion Moment,
Oblique Seas
X7-,Afc,IA0.2
01
4.3 Discussion of the Plots
26
4.3.1 Vertical Bending Moments
The first observation that can be made of the plots is that theASR series coefficients are consistently higher than the Thornton series, and that the dif-ferences are large enough not to be attributed to experimental inaccuracies alone.
The plots of coefficient against length and centerline hull spac-ing in addition to displacement do not help to explain the data distribution.
lt is recognized that ¡n plotting ASR test data together with theother test data, ¡t is assumed that shear is 900 out of phase with the bending moment im-plying that the contribution of secondary moments to the total maximum bending momentis zero. This assumption is in accordance with the Levingston Platform tests results. ltshould be pointed out that the Levingston Platform hulls are much more widely spacedthan the ASR hulls (see Table 2), and that this assumption may be inaccurate for theASR. Further, that the inaccuracy of this assumption may be one of the reasons whythe ASR bending moment coefficient is much higher than for other ships.
The data is too insufficient to deduce the influence of formcoefficients on the difference noted above or the general trends. For the same reasonit is not possible to develop a better representation of size than just displacement tothe first power.
The bending moments are non-linear with respect to signifi-cant wave height. Also that the non-linearity increases with decrease in vessel size.There is a plausible explanation for this trend. Maximum bending moments are experi-enced ¡n waves with )N = 1 .8 to 2.0W (2 W range from 100 feet to 548 feet for ves-sels represented on the plot). Now, as the sea state rises, the maximum spectral energyshifts to longer waves and wave height for waves with .8 to 2.0W does not in-crease proportionally resulting in the non-linear load response.
4.3.2 Shear Force
Discussions of items (a), (d), and (e) under Vertical Bending Mo-ments apply to shear force also.
Aw . .The purpose of using both - and -- -- to nondimensionalize
force was ¡n the hope of explaining the reason for the high values of MAX Fso/ /2for the semisubmersible platforms. The apparent differences between the platform andthe other vessels which could particularly influence the shear force are their very widehull centerline spacing, b, and high waterplane coefficients, C,. lt is realized thatthe introduction of Cw tends to increase the differences in the ASR and Thornton coef-ficients in the higher sea states.

4.3.3 Torsion Moment
The Thornton series torsion moment coefficients are higher thanthe ASR series, whereas, in the case of the vertical bending moment and shear force,the opposite is true.
Just as the vertical bending moment and shear, the torsion mo-ments are no niinear with respect to significant wave height, but not to the same degree.
No apparent explanation ¡s available as to why the data pointrepresenting the University of Miami design and the Undisclosed design are much higherthan the other ships, although they are both conventional catamarans similar to theThornton and ASR.
At the upper end of the L\ and . L scale the correlation be-tween the ASR and Thornton series is good. Further, in sea state 8 the torsion momentcoefficient approaches unity implying that the expression used to nondimensionalize themoment is most promising to estimate maximum torsion moments.
5. CONDITION FOR MAXIMUM RESPONSE AND RECOMMENDEDMETHOD FOR DESIGN LOADS ESTIMATE
27
The purpose of this section is (i), to determine the probable wave and ship posi-tion in which the maximum catamaran motions and cross-structure loads are caused,(ii) develop simple load equations and (iii) suggest a design load schedule. lt is in-tended to concentrate on the beam sea condition in items (i) and (ii) since it ¡s proposedto use the torsion equation in nearly the same form as developed by Dinsenbacher (Ap-pendix 3).
5 . i Condition for Maximum Response in Beam Seos
Figure 10 depicts a catamaran poised in several locations in three differentwaves. In Figure 10-I, the wave length equals b, the centerline hull spacing; in Figure10-II, the wave length equals 2b, and in Figure 10-Ill, the wve length is supposed tobe several times bigger than b.
By inspection it can be seen that when ,X b, the wave-induced forces (hy-drostatic, inertial and damping) on bath the hulls have the same direction and magni-tude. Since the loads on the cross-structure are due to the differential loading on thetwo hulls (besides the loads due to the mass of the cross-structure), in this particular con-dition the cross-structure loading should be small . Intuitively, the heave magnificationshould be high and roll magnification small.
When wave length is much bigger than the catamaran width, as in Figure10-Ill, the differential loading on the hulls should be small and consequently the cross-structure loading should be small. Also, the roll and heave magnification should beroughly unity.

-= ACCELETOÑV= VELOCITY
28
j A4)t Q,Mb-X V
'AA V
f M.- MA' V
i M( V.u.!MA)e a,
MAXV ¿M1V..-MAX&' --MA<O'
Fig. lo - Catamaran in Beam Waves of Different Length
IXb

29
Waves of ,X . 2b, Figure 10-lI, have the potential for generating condi-tions for high differential loading on the hulls. When one hull ¡s on the crest and theother in the trough they experience maximum vertical acceleration of opposite sense gen-erating high shear force on the cross-structure and at the same time inducing large cata-maran roll. The velocity dependent (damping) force would induce bending moment, how-ever, it ¡s believed to be small. If the wave is considered to be of highest steepness pos-sible, then the roll and shear should be maximum. When the hulls are at the nodes (withcrest or trough on the catamaran centerline), they experience maximum equal and oppo-site side forces, both hydrostatic and hydrodynamic, which result in maximum moment onthe cross-structure. Further, when the crest is on the centerline the moment at thejuncture of the cross-structure and the hulls due to side forces have the same sense as themoment due to the weight of the cross-structure, whereas when the trough is on the cen-terline the particular two moments have opposite sense. Figure 10-lI makes anothervaluable suggestion; that a catamaran heave should be small when ). 2b becausethe vertical wave force on the hulls cancel one another.
In the foregoing paragraphs, tentative conclusions were reached as to thewave and ship locations in which maximum response are caused. Now the model testresults will be inspected for the same purpose.
The principal clues from the model test results regarding the conditions formaximum response in beam seas are as follows:
There is general agreement among the different test results thatmaximum roll, shear force and vertical bending moment occurwith vessel at zero forward speed in beam wave with ,\ - 1 .8width to 2 .0 width.
In both the Thornton and the Levingston Platform test, whereheave was measured as well as other responses ¡n a wide rangeof regular waves, ¡t was found that heave approached zero inwaves when shear, roll and bending moment were maximum.
¡ii. Phase data from the Levngston Platform test ¡n beam seas ¡s asfollows:
Maximum shear 900 out of phase with bending momentMaximum side force in phase with bending momentMaximum yaw moment 900 out of phase with bending
moment
Maximum torsion moment 1800 out of phase with bend-ing moment
This implies that maximum bending moments are caused by side forces and notby vertical forces since heave ¡s minimum or zero ¡n waves which cause maximum bend-ing moment, and shear is 9Q0 out of phase with maximum bending moment.
-fO.5 D0
h
30
lt can be stated that there is good agreement between the conclusions reachedon the basis of the model test results and the visual inspection. This agreement pro-vided the encouragement to set up simple equations for maximum vertkal bending mo-ment, axial force and shear force, whose presentation follow, Indeed, it is admittedthat the test data available to reach the conclusions is limited.
5 .2 Development of Design Load Equations
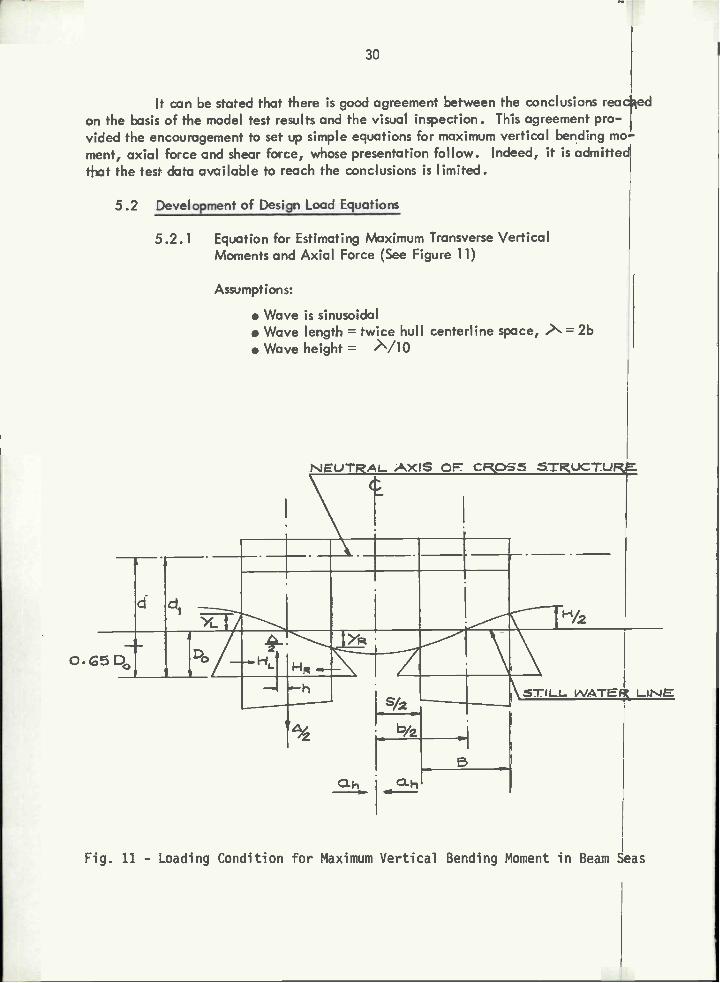
5.2.1 Equation for Estimating Maximum Transverse VerticalMoments and Axial Force (See Figure 1 1)
Assumptions:
Wave is sinusoidalWave length = twice hull centerline space, .X = 2bWave height =
N.JEUT.AL AXIS OF CROS5 5TUCTUR
sì2
b,'2
STILL WAT LIN-JE
Fig. 11 - Loading Condition for Maximum Vertical Bending Moment in Beam Seas

31
L +M0 = (HLVL-HRVR)--'-h( 2g
Trough at centerline of catamaranVertical acceleration is lg (displacement of one hull
equals half weight of catamaran)Magnitude and distribution of side hydrostatic force per
foot of length remain constant as at transverse sec-tion with maximum beam
The aggregate magnitude of the horizontal accelerationcausing the dynamic side force equals the intact waveacceleration at a point 1/4 beam off the centerline ofeach hull and 0.65 draft above keel
Cross-structure weight is evenly distributedCross-structure extends between inboard shell of hulls
and the ends are built in.Velocity dependent forces and impact of water particles
on the hulls are negligible.
Maximum Vertical Bending Moment:
M0 = Wave-induced bending moment for a weightless cross-structure, constantover the breadth of cross-structure
M0 Side hydrostatic force moment - couple due to the horizontal shift incenter of buoyancy + side inertia force moment
)and ........(El)
(D0 +HL = = Side hydrostatic force on outboard shell2
VL = di - (D + YL) = Centroid of HL below neutral axis ofcross-structure
= H-cos(TT.) = Wave surface above still waterline at out-board shell
HR =(D0. ''R)2
= Side hydrostatic force on inboard shell.gL
VR d1 - (D0 YR) = Centroid of HR below neutral axis of cross-stru ctu re

M1
M1
h
Hy cos ( = Wave surface below still waterline at in-board shell
- B_I [2(DO+YL)+(Do_YR)..- 3 [ (D0 + YL) + (D0 - YR)
[ 3D0+YL1h
= 2 3 2 D0 J Horizontal shift in center of buoyancy
= Added mass of one hull ¡n horizontal direction2g
ah Aggregate horizontal acceleration
d = d1 - 0.65 D0 = lever arm for inertia force
M Moment at ends due to weight of cross-structure
WcS12
= Maximum vertical bending moment at juncture ofcross-structure and hull
= Mo+Mc
Maximum Side Force
P = Maximum axial compression
-
p = HL - HR+ 2g
ah (E4)
Due to the symmetry of the assumed wave and vessel, ¡t is possible, by intuition,to set down the equations of moment and axial force for the condition of wave crest atcenterline.
M1 = Maximum vertical bending moment at the juncture of cross-structure and hull
Ml = I(M0)I + IMc)WS
M1 = (HLVL - HRVR)- -- h + (.--- + _J-) and 12
/+i \P Maximum axial tension = H - H + ( J ahL R 2g /
32
(E 2)
(E3)
lt is important to note that absolute values are signified since symbols refer to figure Il
for trough at centerline.

33
lt should be recognized that whether crest at centerline or trough at cepterlinewill result in the higher direct stress will depend on the relative size of stress due toMc and P. However, by rough checks, it was found that for existing catamaransstress due to axial force was greater than stress due to cross-structure weight (or localloads).
52.2 Equation for Estimating Maximum Shear Force
According to the analysis at the beginning of this section, maximumshear occurs, probably, when one hull is on the crest and the other in the trough. In
this position the hulls experience maximum vertical acceleration in opposite direction toone another. Again, according to the analysis, maximum roll should occur at the sametime as maximum shear.
Combination of vertical acceleration and roll will not permit an im-mediate Writing of a shear force equation as it was possible ¡n the case of vertical bend-¡ng moment and axial force. lt is proposed to resort to the model test data to obtain anexpression for maximum shear. This is done simply by picking the highest nondimension-alized shear coefficient for a weightless cross-structure from Figure 6. Since the verti-cal wave-induced acceleration on the hulls are of opposite sense, the cross-structurecan be assumed to have ig acceleration only. Then,
F50 = 0.41 4- -b- C (E5)
= Wave induced shear at ends, weightlesscross structure
F5 C=
2(E 6)
Fsc = Shear at ends due to cross-structure weight
F1 = Maximum shear at ¡uncture of cross-structureand hull
F51 = F, +Fsc (E7)
5.2.3 Equation for Estimating Maximum Torsion Moment
Dinsenbacher's torsion moment equation which is also reproducedin Appendix 3 is
Tc = Torque about center of twist of cross-structure
= Torque about center of gravity of ship + torque due toshear acting through the ship's center of gravity
= tCbg B0.6 TL2 /2TT + 0.14Mqt/s

34
Torsion values as provided by the first item, Ti, can be comparedwith the model test results, as was done ¡ri Figure 7, since t for model was zero exceptfor the ASR model . Even for the ASR model, t was relatively small making the secondterm of secondary importance.
lt can be seen from Figure 7 that if the constant 0.6 ¡n T was re-placed by 0.7 then Ti would provide torsion values at least as large as any test valuein an irregular sea with 50-foot significant wave height if the data scatter due to theUniversity of Miami model test and the undisclosed test is neglected. A 50-foot sig-nificant wave height represents sea state 8 and it is considered sufficiently severe fordesign purposes. lt is pertinent to point out at this time that Dinsenbacher selected0.6 to suit the ASR long term prediction of torsion moments. Even though the use of0.7 may overestimate torsion, conservativeness is justified ¡n light of the limited testdata and the many simplifications that had to be made to derive the equation.
lt is proposed to replace the second term in light of the objectionraised to it ¡n Section 3 of this report. According to the model test results, maximumshear and torsion are out of phase, and maximum shear in oblique seas is approximately53 percent of maximum shear in beam seas. (This applies to a weightless cross-structure.)It ¡s conjectured that ¡t would be conservative to assume that shear in phase with torsionis half of maximum shear. Then, using the symbols of this report, the torsion equationwould be
Tc = Cbg 0.7 5Z7 L2/2u1 + (t) (0.53x0.5xmax shear ¡n beam seas)
Tc Cbg 0.7 fL2/2TT + (t) 0.11 -r wi(E8)
If t = Longitudinal distance from ship LCG to cross-structure twist center = O
then
T T Cg L2/2T1
5 .2 .4 Comments on the Proposed Equations
The equations are quasi-dynamic and semi-empirkal ¡n nature. Theyneglect velocity dependent forces as well as the impact of water par-ticles on the hulls.
Although any other assumption than that wave form remains intact as¡t passes the catamaran vould be difficult to handle, in reality, ¡t isseen that wave form does deform between the hulls. It ¡s conjecturedthat the deformed wave would not cause higher acceleration dependentforces or larger hydrostatic loadings than a wave which remains intact.
The new equations presented do not have any back-up derivation asso-ciated with them.

35
e The procedure for calculating side hydrostatic force is the same asused by Schade and Dinsenbacher (12) and (13).
The use of )\ = 2b ¡n beam sea condition is not quite ¡n accordancewith the model test results which suggest ,X.1 .8W to 2.0W. Thepossible refinement ¡s sacrificed to sustain symmetry and simplicity.
e The method does not account for unsymmetrical hulls and form of hulls.
As far as it can be determined, there ¡s no published information onthe added mass in the horizontal direction for catamarans. Whetherit ¡s satisfactory to consider the added mass of each hull as ¡f theywere independent hulls ¡s quite questionable since they can constrainone another's sway motion. This should be particularly true in waveswith )2b where the horizontal acceleration of the two hulls haveopposite sense. Unfortunately, model test results gathered do nothave sway results to evaluate this. Until new information on addedmass in sway at low frequencies (wave encounter frequencies) and forunsymmetrical hulls is forthcoming, estimates using Series 60 data,Figure 9, will have to suffice.
It is suspected that for small catamarans the proposed method couldvery much overestimate the bending moment. The reason being thatfrequency of occurrence of the critical wave with ,\c 2W andH 2W/10 is likely to be slim.
5.3 Comparison of Loads Calculated by Proposed Equationsand by Other Method
Tables 7, 8 and 9 provide for the catamarans listed in Table 2, the verticalbending moment, shear, and torsion moment respectively, as calculated by the pro-posed equation and other methods. Other methods include model tests, Scott's methodfor bending moment and torsion, and Lankford's method for torsion moment due togrounding. All calculations are for catamarans with weightless cross-structure sincemodel tests results are for weightless cross-structure.
As a matter of interest, shear and bending moment for the Thornton, ASR,and Levingston Platform were also calculated for a wave with )\ = 2b and H rr/10assuming load/wave height remains constant. The values of maximum load/wave heightwere obtained from the test reports.
5.4 Method for Design Loads Estimate
Table 10 presents a recommended design load schedule which is based on theequations developed ¡n Section 5.2 and the ratios of the maximum load in the beam seasand the oblique seas as given in Table 6.

36
Table 7 - Wave-Induced Transverse VerticalBending Moment in Beam Seas
Note: All values are single amplitudes in foot tons and for weight less cross-structure
Mao. or 1/1000 highest, whichever is greaterRAO from model tests and sea state described by Pierson-Mosbowita SpectrumFrom Reference (8)
Table 8 - Wave-Induced Shear in Beam Seas
Note, AI) vo)ces are siegle amplitude in fool tons and for weight less cross-strucrus
° Mao. or 1/1 000 highest, whichever is greeterRAO From mode) tests and seo stete described by Piersoc-Moskowitz Spectrum
Table 9 Wave-Induced Torsion Moment in Oblique Seas
Noto, Ali vaRses, ere sirrg+m errrpf irs,de, fe Reel tosse end Ro, w.istRoos seo*c-rootuoe
o Moo, ot 1/1000 highest, whichever is greorerRAO from model tests and sea state described by Pierson-Maskewita Speotraes
000 CbRu 0.7f L2/211*00* As*umedLLBP=3S5Ft
Note: All values asingle ampli
in foot tonsfor weightiecross-s truct
re
tude
andSS
u re
I) * Model Test Mao. inSeo Stase 8
E.W.ThornfonE.W. Thornton
Ship A ASR
ASRShip A
U. of MianriShip A
MoholePlatform
LenirsgstonPlatform
- - - - 1,820,000 729 000 199,286
7)** Cale. 1/1000 High-est in Ses, State g
33,240 1,045,344 32,547 3,091,982 -
Note: All values are sin-1) SR 192 Method 50,438 1,626,323 40,518 4,195,760 4,325,545 220,764
gle amplitudes infoot tons and fo r
I)(Scott's Method)
51,925 - 26,572 - 1,942,828 756,000 246,400weightless cro SS-
i) J(2b/lQ) 1/2 54,040 - 55,051 - 200,607 structure
I) (1)/(3) or (2)/(3) 0.659 0.643 0.803 0.737 0.421 0.903
7) )l)/(4) or (2)/(4) 0.640 - 1.255 0.936 0.964 0.806
I) (3)/(5) 0.933 - 0.736 - - 1.100
1)00* Long Tern, Predictionof Mauimum
- 63,300
)1)*Model Test Mac.in Seo Stase B
E .W. ThorntonThornton
Ship A ASR
ASR
Ship AU. of Miami
Ship AMohole
PlatformLecingston
Platform
- 1,625,000 193,452 93,304
)2)** Calo. 1/1000 High-est in Seo Osase 8
58,545 1,044,577 9,536 809,401
(3)°°° SR 192 MeShed 61,400 1,280,000 18,810 1,090,000 1,285,000 192,000 99,500
(4)0.04 LA 68,340 2,206,828 23,495 2,433,077 2,526.971 238,560 80,000
(Scares Method)
(5) 0.175 LIS. )Groonding) 298,988 9,655,002 102,790 10,644,711 11,055,500 1,043,700 350,350
)6) (1)/(3) at )2)/(3) 0.95 0.82 0.51 0,74 .26 1.01 0.94
(7) (1)/)4) or 0.86 0.47 0.64 0.33 0.6.4 0.81 1.16
Note: All values are
(1) oModel Test Max.in Seo Stase 8
E.W. ThorsmtonE .W. Thornton
Ship A ASP
single anlplitud6 )2) O*Cok. 1/1000 551 6,964 302
in foot tons andHighest in SeaState 8
for weightlesscross-structure
(3) 0.41(/2»/W)(C)SR 192 Method
749 10,110 304
(4) .fö (2b/lo) 1/2 605 - 349
(5) (1)/(3) or (2)/(3) 0.726 0.686 1.0
ASR U. of Miami Mohole LevingstonShip A Ship A Platform Platform
6,450 2,480 1,190
9,134
9,880 2,960 lr400
- 890
0.923 0.837 0.850

Axial Force
Moment, WeightlessCross- Stru cture
Local Load (Cross-Structure Weight)
Torsion
37
Table 10 - Design Load Schedule
Loading for Direct Stress at Midspan of Cross-Structure
Load Beam Waves
Axial Force P from (E4)
Moment, Weightless M0 from (E 1)Cross-Structure
Local Load (Cross- W WStructure Weight)
Loading for Direct Stress at Juncture of Cross-Structure and Hull
Oblique Seas
0.48 of P from (E4)
0.48 of M0 from (El)
P from (E4) 0.48 of P from (E4)
M0 from (E 1) 0.48 of M0 from (El)
WC WC
0.49 of Tc from (E8) T from (E8)
Loading for Shear at Juncture of Cross-Structure and Hull,Acting Concurrently with Moment
Torsion 0.49 of T from (E8) T from (E8)
Local Load W w c
Loading for Shear at Juncture of Cross-Structure and Hull,Acting Out of Phase th Moment
Shear F0 from (E 5) 0.53 of F0 from (E 5)
Local Load W W
The method is considered satisfactory for conceptual designs.
lt will be noted that the grounding and docking loads are not ¡ncluded ¡n theschedule. In the opinion of the authors, grounding torsion loads are nearly impossibleto estimate as they are so subjective to vessel speed, shape, size and strength of strikingobjects and water depth. As far as torsion loads due to docking are concerned it is sug-gested that individual designer consider oblique docking with most likely dockingweight and realistic support points appropriate to his vessel

38
6. HULL FLEXIBILITY AND CROSS-STRUCTURE STRESSES
lt was apparent at the beginning of the project that in order to attempt the estab-lishment of catamaran size limits it was necessary fo select a suitable method for thepreliminary structural analysis of the cross-structure of a large catamaran, once thecritical loads were estimated.
Lankford's method, discussed in Section 3 and detailed ¡n Appendix 2, was readilyavailable. However, as mentioned previously, it appeared to have two major weak-nesses. It assumes the hulls to be rigid and there is no relative rotation between thehulls and the cross-structure at their junction. Hence, it was deemed desirable to finda method which did not have these weaknesses and fo try it out on a vessel for whichstructural calculations using Lankford's method were available.
The method of space frame analysis had an immediate attraction and ¡t was decidedto try it ouf on the T-AGOR 16 Oceanographic Research Catamaran for which struc-turai calculations based on Lankford's method were available in-house. lt must be men-tioned at once that only the hull bending flexibility and shear deformation in the longi-tudinal direction were simulated in the mathematical model . The space frame analysishad the following advantages:
Representation of structure partially by its flexibility is inherent tothe method. It should provide, at least, indicative numerical valueson the influence of hull flexibility and the relative rotation betweenthe hulls and the cross-structure on the cross-structure, and the in-fluence of the cross-structure on the individual hull structure in thetransition area.
The method is computerized hch could be a great asset later in theprolect ¡f structural analysis was necessary for several shps.
It can assume several different types of loading at once and permitsquick changes in the structural configuration.
It can include maximum amount of structure effective in taking pri-mary and secondary loads by employing progressively more detailedmathematical model.
lt can conveniently handle structure with more than one material, saysteel and aluminum.
Figure 12 shows the bare outline of the T-AGOR structure and Figure 13 deline-ates its mathematical model incorporated in the space frame analysis which employedthe IBM-1130 Stress" program.
The analysis used the original T-AGOR 16 design loads. The loadings whichcontrolled the primary members of the cross-structure were the grounding loads andthe transverse vertical bending moments ¡n beam seas. The former were obtained assuggested by Lankford and the latter were obtained from the ASR load estimates (withnecessary modification to reflect different principal characteristics).

39
I,
NuTgAL 4S OF T4ErA sTzçcrL
NEJ16J. A.3 OF T4E .ULL
7Z sz 37
LEÑGT#4 BET. PEF. 22O NULL LE4R 5PACÑG Z 7BEAu OVEEALL - 0EPTH TO ML PK AT 5tDEBEAM EA NULL - EPTN OF CO&B STUCT AT zHULL SPAÑ 4T
Fig. 12 - T-AGOR16 Structural Configuration
ÑOTE: CECLE FIEUEES EE .4EM5 NUUS.HULL L0405 iMTOUcE ICLfOUE5EE NT NUIE5.4.1 JOTS ALOÑ TNE NLJTALAXIS OF TN NULLE
Fig. 13 - Structural Model of T-AGOR16 For IBM - 1130"Stress" Program
The resulting moments and shear forces ¡n the beam sea condition and groundingcondition for the cross-structure from the "Stress" program output are provided inTable 11. Other less critical conditions are omitted. The flexural stresses and shearstresses ¡n the six cross-structure members based on the stress program output and thoseas calculated ¡n the T-AGOR 6 Structural Design are also tabulated for comparison.Stresses ¡n the structures other than the cross-structure are not tabulated, since thestructural design for those members were based on American Bureau Rule and their stressescan not be calculated readily.
From the tabulation, the following conclusions can be drawn with respect to hullflexibility and cross-structure stresses:
The flexural stresses calculated based on the structural model are ingood agreement with those taken from the T-AGOR 6 structuralanalysis using Lankford's method.
The shear stresses for grounding condition are ¡n fair agreement.Those for beam condition show less a g r e eme nf. Since the shearstresses are less critical than flexural stresses in beam sea condition,the discrepancy in shear stresses is not considered important.

40
lt appears, admittedly based on this limited check only, that the intro-duction of the longitudinal flexibility of the hulls has small influenceon the stress in cross-structure, i .e., the simplification which assumesthe hulls to be rigid would not affect the scantlings selection.
Since the hulls can be assumed rigid the mathematical model can begreatly simplified. For a preliminary study, all the transverse cross-structure bulkheads can be assumed structurally similar, i .e., they allhave the same section modulus, moment of inertia, shear area, etc.
In light of the last two conclusions, ¡t may be stated that the preliminary analysisof a catamaran cross-structure can be conveniently handled with a conventionalmethod, such as Lankford's method, with about the same accuracy ¡n results, and aboutthe same time requirement as the space frame analysis. Detail design analysis shouldconsider,in addition to hull longitudinal flexibility, such structure response as the hulltransverse and torsional deformation, cross-structure deformation in various directionsand component structure (decks, bulkheads, etc.) deformation.
7. DESIGN SHIP
7.1 Purpose
The analysis of the features that may impose catamaran size limits, Section 2,indicated that existing U.S. shipbuilding facilities could handle approximately 1000-foot catamarans on the premise that individual hulls would be built ¡na drydock and¡oined together afloat. Whether 1000-foot length should be proposed as a present prob-able upper limit was dependent on whether the necessary scantling size and the weight ofthe cross-structure were practical . Hence, once the available methods for cross-structure loads prediction and structural analysis were evaluated, the logical next stepwas to make a preliminary design of an approximately 1000-foot catamaran. Also, it isbelieved that in the course of the design, the inadequacies, if there be any, of the avail-able structural design information would become apparent.
Table 11
Section
- T-AGOR16 Catamaran
Shear Bend.
Stress Summary
Stress, Kips/1n2
Modulus Area Mom. Shear Stress Program Design Caics
Bhd Member Irr2 Ft 2 Ft Kips Kips Flexural Shear Flexural Shear
Beam Sea Condition
96 6 & 7 650.0 105.0 16,900 74 24.6 0.7 23.6 3.3
84 15 & 16 833.3 102.0 19,244 67 23.1 0.7 23.9 3.1
72 24 &25 632.9 82.5 19,749 68 31.2 0.8 24.1 2.8
52 32 & 33 784.6 94.9 24,951 55 31 .8 0.5 26.5 2.8
37 41 &42 833.0 102.0 21,901 74 26.3 0.7 23.9 3.1
23 50 &51 853.0 120.0 20,471 70 24.0 0.7 26.5 3.2
Grounding Condition
96 6 & 7 650.0 105.0 13,619 952 21.0 9.1 21.4 10.5
84 15 &16 833.3 102.0 9,216 506 11.0 5.0 11.5 7.772 24&25 632.9 82.5 4,187 118 6.6 1.4 8.1 4.6
52 32 & 33 784.6 94.9 2,535 24 3.2 0.3 4.2 3.6
37 41 42 833.0 102.0 10,999 554 13.2 5.4 10.8 7.6
23 50&51 853.0 120.0 15,780 1,114 18.5 9.3 8.9 10.8

41
Tab'e 12 - Design Ship Particulars
Block Coefficient, Cb 0.54Midship Coefficient, C 0.952Prismatic Coefficient, C 0.572Waterplane Coefficient, C 0.701
Service Speed (corresponding to -- 0.24) 25 KnotsInstall Shaft Horsepower 150,000
Lightship Weight 52,687 TonsHull Structure 28,439Cross-Structure 5,598Electric Plant 1,150Propulsion 2,680Communication & Controls 280Auxiliary Systems 5,950Outfit & Furnishings 3,800Margin, 10% 4,790
Deadweight 38,113 TonsContainer Capacity@ 11 Tons/Container 3,101 ContainersContainer Capacity @ 15 Tons/Container 2,247 ContainersContainer Capacity on Upper Deck, 8' x 8' x 20' 3,136 Containers
Hull SymmetryLength Bet. Perp., LBeam Overall, WBeam Each Hull, B
Symmetrical942'- 0"300'- 0"loo'- 0"
Hull Space, b (corresponding to - = 0.21) 200'- 0"Clear Hull Spacing, L 100'- 0"Depth to Upper Deck at Side 106'- 0"Depth of Cross-Structure 45' - 0"Length of Cross-Structure 800'- 0"Draft 31' - 0"Cross-Structure Clearance from Waterline 30' - 0"Displacement 90,800 Tons

I I i i I i I I I I tLWLIl-Oí
a-aa-e-aa-Sa_aaC-a--aa_--aa--ea--a_a--ae_-a--a
JOG O"
_r.; '()-
LBP=942-ODAFT 3i-0
DECK HOUSE
L
-i:fJ5:s)2jj LA'(EeA6E HULL BkD Z5
WIDTH 300 FT DEPTH = IOC-QDI5PLACEMENT O,BOO TOÑ5
-- -- -- --- -- -- -- ---- ----a n eaa aeaaesCaaa__a_c__aaaea -- --- sa ea_a eaa_es__a_aa ea n eaC_a-eaa ee aa cc eaa ea aeneae_e_a-_a_a -ea_a__e_e_ceaa ea aa ea e eaea_a_a_a_e_aea__ea_a_e_e_a_e_en ea ea ea ea eaCa n sa a e aaa sa ea ea ea eaea__e_ea_a_aaa ea cacaea n ea ea caca-- -- -- -- __
Fig. 14 - Design Ship Profile and Plan
.50YM$L
.4t5(HT)
42
2Go'- 0"loo'- Q
ea n eaaaaaaa_- a-a - aaaa== =_ea ac eaea aea_e__ea-aa_aea cenaa a__aea ca eacae_aaaea_aeaaa-
ea ac cc e_a uaceaa aeacaaea__ce_aca eaaa ae_aa_a au ea ea eaea caca sea acea eea ca ae eaaaaasasCuaaae
r. C.24T')
ç.Z(8u)
BAE.LIE
SHIP
eaaa aaa__aaaaaaaaaaaeca cc Ceea aa easa sacaaa_e eaea ea eaea aa nea u naa ea eaaa_e_e
Fig. 15 - Design Ship - Typical Bulkhead Structure
sencaesea_ae__aeccacacaaeaaaeean seacaceauas_a Sa__a
5MBOL F0 5TEEL.:(H T.) )1INIMuM 00 000 PI YIELD
T!NGTH STEEL= A5 3ADE E.H. STEEL
A.5.) MILD STEEL
.75(T)
I'-oWL
43
7.2 Design Description
The preliminary design presented here is not optimized (or recycled) by far.The readers can expect no more defense from the authors for the design other than for itssuitability to provide the limited information desired. The selected shape coefficient,bulkhead and deck arrangements, assumed framing system, etc., cari all absorb consider-able improvement.
lt ¡s assumed that the vessel would be a container ship since it ¡s well acceptedthat ¡f large catamarans are at all found superior to monohults it would be as high-speed,payload carriers. Table 12 lists the design particulars and Figure 14 shows the profileand plan views. A rough set of lines were made to obtain hydrostatic properties and vari-ous plating areas.
It will be observed that the design's Froude number of 0.24 and the hull cen-terline spacing to ship length ratio of 0.21 do not correspond to the values of 0.3 to0.4 and 0.3 respectively, suggested for good resistance characteristics (see Appendix 1).To design for Froude number of 0.35 would require a speed of 36 knots. lt was felt thata 36-knot speed would render the design uneconomical. To design for hull centerlinespacing to ship length ratio of 0.3 would require hull centerline spacing of 314 feetwhich was considered impractical
The 100' x 800' cross-structure is composed of four structural decks, includ-ing the upper deck and the bottom, and seventeen identica' full structural transverse bulk-heads spaced at 50 feet. The cross-structure is assumed to be fixed at the inboard shellof the hulls. In order to validate this assumption, four of the decks and seventeen of thefull transverse bulkheads in the hulls are aligned with decks and bulkheads of the cross-structure. Figure 15 depicts the catamaran structure at a bulkhead.
Figure 16 provides the information on the section moduli of the individualhulls and the cross-structure. lt includes sketches of the assumed effective structures,calculated section moduli and the required section modulus for the hulls based on theAmerican Bureau of Shipping rules. lt will be noted that the minimum permissiblescantlings result in a section modulus considerably in excess of that required. This isdue to the increased depth as compared to a monohull to have sufficient cross-structureclearance above the waterline.
7.3 Explanation for Effective Structure
Explanation ¡s warranted for the structure assumed effective ¡n cross-structurebending. On the face of it an immediate question may come fo the mind of the reader;why should all the deck plating be considered effective in bending just as in the conven-tional longitudinal strength calculation, rather than just 24-foot breadth with each bulk-head. The structural analysis (as distinct from the design load estimate) was performedfollowing Lankford's method, Appendix 2. In Lankford's method, all the principle loads,vertical bending moment, axial force, shear as well as the torsion moment, are absorbedby the bulkheads together with effective deck plating acting as fixed-end beams betweenthe two hulls. The effective deck plating breadth of 24 feet was calculated by reference

1QQ"
0 625" Mn Dk
0.50" Dk
050"Dk
i 0.50" Dk
jI 0.50" Dk
Cross-Structure
0.75" IB
«z---60"xl .25"
Main Hulls
-Pr-iiJ
Effective Deck Pl (H.T.)
b i>12x6_1/2'1x27# I/T(H.T.)2 í'0.625" Bhd Pl (H.T.)'' (BH)
''Active in ShearNot active ¡n
li.J..._ ßending
0.50" Bhd Pl'' (MS)
(BH)
0.625" Bhd PI (H.T.,
(H . T.)
44
¡
f-f
Shell Pl0.75"
Fig. 16 - Design Ship Section Moduli
Main Hull
Section Modulus Required by ABS= 198,500 In2 Ft per Hull
Section Modulus, Including 10% forLongitudinal s:
Deck: 269,000 In2 FtBottom: 266,090 In2 Ft
Section Modulus 148,800 130,056In3
Shear Area, In2 300 300
Axial Load Area 923 803
In2
Symbol for Steel:(H.T.) = Minimum 100,000 psi yield
Strength Steel(B.H.) ABS Grade B.H.Stee(M.S.) = Mild Steel
o
oo
Cross Structure
Effective PlatingFour Decks
5/8" x24' l-1/4" x 10'

45
fo the well-known paper (24) on the subject by Professor Schade. The bulkheads wereconsidered as multiple webs for each deck with length of 100 feet and plating width of50 feet between webs. Among the various combinations of load and end fixity consid-ered by Professor Schade, two were applicable to the structure in question, viz: - equalmoment at both ends or uniform load and fixed ends. Even though the structure's maor
E loading is due to equal moment at both ends, the latter combination was used as it gavethe smaller effective breadth. Using the same reference, Professor Adams proved (seediscussion to Professor Schade's paper) that for a monohull with no centerline bulkheadand with side shell as double webs, the effective breadth of the deck plating ¡s 97%.
The 20-inch effective web plating at top and bottom of the center web, Figure16, was reached by taking one-sixth of the length of the outer webs. The reasoning forthis is provided by Lankford, Appendix 2.
Figure 16 also shows that ¡f arbitrarily a 10-foot deck plating width were tobe considered effective, 1-1/4 inch plate thickness would be necessary to provide ap-proximately the same section modulus as available with 5/8-inch x 24-foot effectiveplate; 10 feet should be quite conservative.
Although 24-foot effective breadth was arrived at with probably adequateinterpretation of the structure, it is acknowledged that the structure in question is reallyintegrated box structures. Further, that there ¡s insufficient test data on box girdersto derive effective structure directly in lieu of the method employed.
7.4 Cross-Structure Loads and Stresses
The wave-induced design loads as deduced from the method (labeled SR-192)proposed in Section 5 of this report, by Dinsenbacher's (13) method and from theThornton and ASR Series, Section 4, are summarized ¡n Table 13. The stresses which aresummarized in Table 14 were calculated by using maximum loadings predicted by SR-192equations. The stresses are within the allowable stresses for 100,000 psi yield strengthsteel.
Although grounding ¡s not considered a design criteria, stresses were alsocalculated for the grounding condition and are included in Table 14. If grounding wasto be considered os a design criteria the selected scantling would be quite inadequateas the shear stress is 47,280 lb/in2.
7.5 Design Conclusions
Direct stresses are higher in beam seas than ¡n oblique seas.Shear stress ¡s higher in oblique seas than in beam seas.
Required largest deck plating thickness is very much dependenton the assumptions related to value of effective plating.
The required largest scantling of approximately 1.-1/4 inch, basedon a hopefully conservative assumption and steel yield strength of100,000 psi, are common to shipbuilding today. Of course, this istrue only for the particular structural configuration employed.

46
If grounding vs to be considered a design criteria the assumedstructure would be quite inadequate.
The imperative need to sustain the continuity of structural members(17 bulkheads and four decks) of the cross-structure into the mainhulls causes the main hulls structural configuration to be uneconomi-cal, e.g., unlikely that a 1000-foot monohull would require 50-foot main bulkhead spacing.
Table 13 - Design Ship, Wave-Induced Cross-Structure Loads
BEAM SEAS: MAXIMUM TRANSVERSE VERTICAL BENDING MOMENTSSingle Amplitude in Foot Tons
Weightless Cross-Structure,Constant
** *With Cross-Structure Weight, 3,427,439 3,966,364
At ends of At MidspcnCross-Structure
BEAM SEAS: MAXIMUM SHEAR AT ENDSSingle Amplitude ¡n Tons
SR-192 Dinsenbacher Thornton Series ASR Series
*3,061,106 1,658,464
Method
* Used for Structural Analysis** Assumed Cross-Structure Weight = Steel + Ship's Deadweight
Assumed LCG of Ship Coincides with Longitudinal Location ofCross-Structure Twist Center
2,042,785 2,869,346
Weightless Cross-Structure 8,666 5,636 5,978 8,032
With Cross-Structure Weight 0,646 36,411
BEAM SEAS: MAXIMUM AXIAL FORCESingle Amplitude in Tons
52,367 33,074
OBLIQUE SEAS: MAXIMUM TORSION MOMENTSSingle Amplitude in Foot Tons
* ***2,948,449 2,527,242 2,403,794 2,188,600

8. TOPICS FOR FUTURE RESEARCH AND DEVELOPMENT PROGRAM
Researchers (1*), (2), (4), 8) ond (13), who have appraised catamaran technologyhave generally reached very similar conclusions as to the deficiencies in the technologyand the topics for the desirable future research and development program. A significantconclusion of this project ¡s that a safe large catamaran structure can be designed nowby conducting model tests, using existing design information and generally adopting aconservative approach. However, by nature of the design method the resulting structurewould be unduly heavy. Also, such an approach would be unacceptable ¡f o large num-
Table 14 - Design Ship, Cross-Structure Stress Summary
Stress on End Bulkheads:Primary BendingBending due to Shear due to TorsionBending due to Local Load
Axial Compression
Shear due to TorsionShear due to Local LoadTotal ShearShear Stress
Shear Out of Phase with Bending and Torsion
47
Section Modulus = 148,800 In3Shear Area = 300 In2Axial Load Area = 923 In2
BEAM SEA CONDITION (Trough at Centerline)
Total Loading on Cross Structure:Vertical Bending Moment Without Cross-Structure Weight 3,061,106 Ft TonsTorsion Moment = 0.53 x Max. in Oblique Seas 1,562,000 TonsLocal Load (Cross-Structure Weight) 43,960 TonsAxial Load 52,367 Tons
Subtotal
(See Figure 16)
32,527 Lb/In25,535 Lb/In2
- 3,893 Lb/In2
34,169 Lb/In27,473 Lb/In2
Total Stress 41,642 Lb/In2
Shear Acting Concurrently with Bending and Torsion:
1,371 Kips2,897 Kips4,268 Kips
14,230 Lb/In2
Shear 4,039 KipsShear Stress 13,463 Lb/In2

Total Loading on Cross Structure:Torsion MomentLocal Load
Stress on End Bulkheads:Bending due to Shear due to TorsionBending due to Local Load
Total Stress
Shear due to TorsionShear due to Local LoadTotal Shear
Shear Stress
Table 14 - Design Ship, Cross-Structure Stress Summary, (Cont'd)
OBLIQUE SEA CONDITION
48
Total Loading on Cross-Structure:Vertical Bending Moment Without Cross-Structure Weight
0.48 x Max. in Beam SeasTorsion MomentLocal Load (Cross-Structure Weight)Axial Load, 0.48 x Max. in Beam Seas
Stress on End Bulkheads:Primary BendingBending due to Shear due to TorsionBending due to Local Loads
SubtotalAxial Tension
Total Stress
Shear Acting Concurrently with Bending and Torsion:
Shear due to TorsionShear due to Local Load
Total Shear
Shear Stress
GROUNDING CONDITIONS
For Reference Only - Not Used as a Design Criteria
1,469,331 Ft Tons
2,948,449 Ff Tons43,960 Tons25, 13 6 Tons
15,613 Lb/In210,430 Lb/In23,893 Lb/In2
29,936 Lb/In2- 3,587 Lb/In226,349 Lb/In2
2,587 Kips2,897 Kips
5,484 Kips18,280 Kips
12,850,000 Ft Tons43,970 Tons
45,500 Lb/In23,893 Lb/In2
49,393 Lb/In2
11,288 Kips2,897 Kips
14,185 Kips47,280 Lb/In2

49
ber of vessels were contemplated. In view of this conclusion, a following comprehen-sive list of study topics ¡s prepared to close the maìor gaps ¡n catamaran technology,andensure the availability systematic design information to develop catamaran structurewhich would tend towards the optimum.
The nature, magnitude, location and frequency of hydrodynamic loadson the hulls; the distribution of loads in the cross-structure or thecenterbody; magnitude and location of local wave impacts on the cen-terbody and the hulls. These will require theoretical and experimentalprograms.
Model Test Program:
e Series tests which would include symmetrical and unsym-metrical hull forms; range of hull spacing; variations ¡nvertical location; longitudinal extent and longitudinal lo-cating of centerbody.
s Series suitable for ships from 100 feet to 1000 feet.
Model test methods which can simulate the centerbody, atleast its weight and weight distribution.
Full scale centerbody load measurement program. (Necessary to developacceptable measurement technique and data analysis once the data isgathered.) lt would be prudent fo select a catamaran whose cross-structure is relatively simple and amenable to clean analysis.
Dynamics of structural response ¡n various vibratory modes.
Hull form and spacing for minimum resistance and ship motions in a sea-way. Hull form, particularly unsymmetrical, for multi-screw installation.
Added mass and mass moment of inertia for the horizontal motion of sym-metrical and unsymmetrical bodies at wave encounter frequencies (indi-vidually and as catamarans). Added mass and mass moment of inertia forthe vertical motion of unsymmetrical bodies.
Damaged stability and compartmentation requirements.
Construction techniques to minimize need for new facilities (ship-yard responsibilities). Drydock in9 facilities.
Contribution by cross-structure to the longitudinal strength of thevessel.
Behavior of box girders under combined bending, torsion and shearloads.
Stress concentration at the hull and cross-structure juncture. Natureand extent of necessary reinforcement and structural details.

9. CONCLUSIONS
50
The major constraints to catamaran size will be imposed by economics,individual shipyard construction capabilities, drydock facilities and pierfacilities.
Existing United States yard facilities can handle individual hulls of ap-proximately 1050 ft x 140 ft. The hulls and the centerbody would have tobe joined with hulls afloat; 35-foot draft is acceptable in most major har-bors. New drydocking facilities and modified or new pier facilities willbe essential . Discharge of cargo in the streams could remove the pierproblem.
Existing design information for the estimation of loads on the cross-structureis just adequate to provide guidance to make preliminary prediction ofloads on large catamarans.
With respect fo scantlings, a 1000-foot long catamaran with 100-foot beamhulls, 100-foot hull spacing and 31-foot draft is feasible. This does notimply that the structural configuration will necessarily be attractive.
The available model test data for predicting cross-structure loads are notsufficient and the existing analytical methods are not adequately developedto provide great confidence in either.
Model tests to date have been performed for specific designs only and havehad the drawback of not simulating the centerbody.
Additional research and development work including systematic model testprograms are necessary for the establishment of reliable design methods foroptimum catamaran structure.
ACK NOWLEDGEME NTS
To an appreciable degree, the accomplishment of the project is due to the avail-ability of unpublished model test data belonging to private companies. In this respect,special acknowledgement ¡s due to the Reading & Bates Offshore Drilling Company fortheir permission to use the complete model test data on the E.W. THORNTON, cind toFriede and Goldman Inc. through whom the tests were contracted. Friede and Goldman Inc.are also fo be thanked for permission to use the model test data on their catamaran designfor the University of Miami . Thanks are due to the Levingston Shipbuilding Company forproviding the model test data for their drilling platform design. Mr. John L. Glaeser Sup-plied a copy of his senior thesis which was appreciated.

51
The authors wish to thank Messrs. Sam T. Tsui and N . K . K . Raman of the BasicShip Design Division, M. Rosenblatt & Son, Inc., who assisted with several tasks of theproject.
Nippon Kaiji Kyokai, Germanischer Lloyd and Det Norske Ventas provided writ-ten descriptions of their general approach to catamaran design review which were appre-ciated.
Mr. Walter H. Michel and Dr. Haruzo Eda willingly contributed with informal dis-cussions of some aspects of the project for which the authors are grateful
Appendix 2 is quoted from "The Structural Design of the ASR Catamaran Cross-Structure" by Benjamin W. Lankford, Jr., published in August 1967, Naval EngineersJournal, pages 625-635, by permission of the American Society of Naval Engineers.
Appendix 3 ¡s quoted from "A Method for Estimating Loads on Catamaran CrossStructure" by Alfred L . Dinsenbacher published in October 1970 Marine Technology,Vol. 7, No. 4, pages 477-489, by permission of The Society of Naval Architects andMarine Engineers.
Last, but not least, acknowledgements are due to all the members of the AdvisoryGroup Il, Ship Structural Design, Ship Research Committee who provided enthusiasticand practical guidance to the prolect.

52
REFERENCES
General Dynamics (Quincy Division), 'Catamaran Study' prepared for U .S.Department of Commerce, Maritime Administration under ConJrct No. MA-43130 April 1969. National Technical Information Service Publications NumberPB 183787 to PB 183793.
Bond, John R., "Catamarans - Dream or Reality," American Society of NavalEngineers Journal, June 1970
3 Eckhart, M. Jr., "Comment on ASNE Paper, Catamarans - Dream or Reality,"American Society of Naval Engineers Journal, August 1970
Thomas, Geoffrey O., Outline Notes for Lecture Entitled "Structural Analysis ofCatamarans," Naval Ship Research and Development Center, n167, July 1970
Leopold, Reuven A., "A New Hull Form for High-Speed Volume-LimitedDisplacement-Type Ships," Society of Naval Architects and Marine Engineers,Spring Meeting, 1969
Litton Industries Twin-Hull Ship, Maritime Reporter and Engineering News,January 15, 1970
7 Fisher, Peter A.; Praught, Michael W.; Soden, James E ; "A Catamaran Contaiship for Trans-Atlantic Trade," Society of Naval Architects and Marine EngineeGulf Section Meeting, April 18, 1969
8 Lankford, Benjamin W., Jr., "The Structural Design of the ASR Catamaran CrosStructure," American Society of Naval Engineers Journal, August 1967
Maniar, Naresh M., "Motions and Structural Loading of a 106-Foot Catamaranin Irregular Waves," Davidson Laboratory Report LR-823, January 1965.
Scott, Robert, Catamaran Structure: Strength and Hull Weght, Appendix 4 to"A Comparative Evaluation of Novel Ship Types," by Philip Mandel, Societyof Naval Architects and Marine Engineers Transactions, Volume 70, 1962
Dinsenbacher, Alfred L.; Andrews, John N.; Pincus, Daniel S.; "Model TestDetermination of Sea Loads on Catamaran Cross Structure," Naval Ship Researciand Development Center Report 2378, May 1967
Schade, H.A., "Feasibility Study for Ocean-Going Catamaran," Prepared forthe Crowley Launch and Tugboat Company, California, June 1965
8,
ner-rs,
s-

53
Dinsenbacher, Alfred L., "A Method for Estimating Loads on Catamaran Cross-Structure," Marine Technology, Volume 7, No. 4, October 1970
Glaeser, John L., "A Theoretical Investigation Into the Motions of a Catamaranand the Shear and Bending Moments on its Cross-Structure," Senior Thesis,Webb Institute of Naval Architecture, May 1968
Levingston, C.W. and Michel, Walter H ., "The Catamaran Drill Ship -E .W. Thornton," The Society of Naval Architects and Marine Engineers, GulfSection Meeting, February 1966
Michel, Walter H., "The Sea-Going Catamaran Ship, Its Features and ItsFeasibility," The Society of Naval Architects and Marine Engineers, Gulf Sec-tion Meeting, April 1961
Manjar, Naresh M., "Model Test ofa Catamaran Drilling Ship," Davidson Lab-oratory Letter Report 1052, January 1965
Meier, Herbert A., "Preliminary Design of a Catamaran Submarine Rescue Ship(ASR)," Marine Technology, Volume 5, No. 1, January 1968
Chey, Young H., "Model Tests to Evaluate Seakeeping Qualities and StructuralLoading of a Catamaran Oceanographic Vessel," Davidson Laboratory LetterReport 891, April 1962
Numata E., "1/100-Scale Model Tests of Mohole Drilling Platform in Waves,"Davidson Laboratory Letter Report 1084, January 1967
McClure, Alan C., "Development of the Project Mohole Drilling Platform,"Society of Naval Architects and Marine Engineers," Transactions Volume 73,1965.
Numata E., "Model Test of a 6-Column Semi-Submersible Drilling Vessel,"Davidson Laboratory Letter Report 1234
Eda, Haruzo and Crane, Jr.; C. Lincoln, "Steering Characteristics of Shipsin Calm Water," The Society of Naval Architects and Marine Engineers, Tran-sactions Volume 73, 1965
Schade, H.A., "The Effective Breadth of Stiffened Plating Under BendingLoads," The Society of Naval Architects and Marine Engineers, Transactions,Volume 59, 1951
54
APPENDIX i
CATAMARAN RESISTANCE
Of all the aspects of catamaran design, resistance has received the most atten-tion. Considerable work has been done, both in the areas of theoretical predictionand model test measurements, as well as their correlation. References listed at the endof this appendix represent valuable published information on the subject.
The main reason for the interest in resistance is because it has been shown thatunder certain conditions, net resistance of catamarans can be made smaller than the to-tal resistance of the two hulls considered singly.
According to general practice, ¡t is assumed here that resistance can be sepa-rated into two independent components, namely, frictional or viscous and wave-makingContributions to resistance by other phenomena, including the influence of wave-making on viscous resistance, are relatively small and are omitted in this discussion.
Frictional resistance is a function of the wetted surface, degree of surface rojgh-ness and speed, and, for the catamarans, it ¡s equal to the sum of the frictional resis-tance of the individual hulls.
Catamaran calm water wave-making resistance is a function of the Froude number(V/J[), hull form and hull spacing. Eggers (references 1 and 2) has demonstratedtheoretically that the wave-making effects between the hulls can interfere favorably toreduce the catamaran wave drag to below the level appropriate to the two hulls runningin isolation. This is possible where given frequency components of the combined wavepattern are out of phase by approximately 1800.
There is general agreement between theory and model test data that the beneficialinterference can occur in the Froude number range of approximately 0 .3 4 v/JE< 0.4,irrespective of hull separation. Beneficial hull separation ¡n terms of the center to centerspacing as a ratio of the ship's length appears to be in the order of 0.3. Further, opti-mum spacing varies with speed. Of course, what may be beneficial for resistance maynot be compatible with the rest of the design.
The purpose of the foregoing discussion is to show that beneficial wave-patterninterference effects are obtained in a narrow range of Froude number and hull separation.From a practical design viewpoint the net resistance benefit has to be appreciable toconstrain the design within the above narrow range of Froude number and hull separation.
The conclusion reached on the basis of data available to date ¡s that no more than15% net reduction in total resistance of large catamarans should be expected in ¡dealconditions when compared to the total resistance of two hulls running independently. Atthe same time, the increase is not expected to be more than 15%.
REFERENCES
55
General Dynamics (Quincy Division), "Catamaran Study" preparedfor U.S. Department of Commerce, Maritime Administration underContract No. MA-4318, 30April1969
Eggers, K., "Resistance Conditions of Two-Body Ships," BSRATranslation 1860 (Uber Widerstandsverhaltnisse von Zweikorperschiffen,J. Schiffbautech Gesellschaft (1955)).
Eggers, K., "Uber die Ermittlung des Wellenwiderstandes einesSchiffsmodells durch Analyse Seines Wellensysfems, "SchiffstechnikBd 9, 1962
L Everett, J .1., "Some Research on the Hydrodynamics of Catamaransand Multi-Hulled Vessels ¡n Calm Water," North East Coast Institutionof Eiigneers and Shipbuilders, Transactions 1967-1968
5. Turner, H. and Tapl ¡n, A., "The Resistance of Large Powered Catamarans,"Society of Naval Architects and Marine Engineers Transactions, Volume 76,
1968

56
APPENDIX 2
This ¡Sa reproduction of reference (8), "The Structural Design of the ASR Cata-maran Cross-Structure" by Benjamin W. Lankford, Jr.," excluding the first part vvhichis devoted to the description of the statistical methods used to predict the response ofthis ship's hull to sea condition beyond the capabilities of model tests.
SHEAR FORCES
The foregoing discussion has only described the bending moment resulting from abeam sea condition. There is, however, a slight shear force ¡n the beam sea condition.The shear force is of a higher value in the quarter sea heading, but the associated mo-ment results in a negligible design value. The shear force used ¡s approximately 600tons. Shear becomes more of a design problem from loads of other sources which willbe described ¡n another paragraph.
Shear or any other design response can be determined in the same way as thE mo-ment in the foregoing discussion. All the designer needs to do is to use the proper re -sponse amplitude operators from the model test.
DISTRIBUTION OF THE DESIGN SEA LOADS
The final bending moment predicted of 63,300 foot tons represents the total mo-ment on one side of the ship. Since this moment is independent of any bending causedby the weight of the structure, a dead load bending moment must be added to this moment.The dead load moment for the ASR was calculated assuming this ship in still water sincethe effect of any sea waves has already been determined. The total maximum moment in-cluding the dead load effect ¡s 72,000 foot tons (nearest 1000 foot tons). Since deadload opposes the sea forces ¡n the upward direction the design load is less, or about55,000 foot tons. The distribution of this moment to each major cross-structure memberwas ba5ed on a ratio of the assumed moments of inertia of each member. The shearloads were distrbuted as a ratio of assumed web areas. A summary of the sea loads foreach bulkhead will be given in a later paragraph.
OTHER LOADS CONSIDERED
As a separate condition, the cross-structure was designed for what was consideredthe maximum possible torsional load on the cross-structure. To determine these loads,
the following conditions were considered:
a. The ship could be drydocked with the port hull blocks andstarboard hull blocks out of plane or the keel could be outof plane.

The ASR is a 251 foot LOA catamaran with an 86 foot maximum breadth (26foot wide hulls) and full load displacement of 3600 tons. Figure 9 shows a typicalcross-section of one of the transverse support bulkheads for the ASR. The transversebulkheads between the two hulls along with an effective breadth of plating as theupper and lower flanges is considered the primary supporting cross-structural mem-ber. There are six of these bulkheads similar to Figure 9 carrying the loads. Locationsof these bulkheads are shown on Figure 8. The use of six bulkheads has no specialsignificance other than that it provides a satisfactory arrangement for structure commen-surate with compartment and access requirements and distributes the loads into the hullgirders through scantlings of normal dimension. The three bulkheads forward and thethree bulkheads aft form two separate deckhouses with an open well between for rescueoperations.
Ìp4 1Pz P.
u)
d
$ETC FORCALcuL..TION OF SHA .OAD5
(DoCKtÑC -ROUÑDtN )
/
57
b. The ship may possibly run aground.
For these conditions the ship was assumed to be supported on one hull forward (Sta-tion 4) and on the other hull aft (Station 18). The load distribution of the appliedtorsional moment to each bulkhead ¡n the cross-structure is assumed to be a functionof the linear distance from the center of torsion and the vertical deflection in eachloaded bulkhead.
STRUCTURAL CONFIGURATION OF THE ASR
Fig. 8 - Forces Caused by theSettlement of Supports

CL.,S.P --1
ASI PtAflI4OZ
The calculation of the load distribution to each bulkhead from the grounding-dock condition is as follows (See Figure 8):
Assumptions
The algebraic sum of moments about the center of torsion = O, where center oftorsion is assumed to be the centroidal axis of the assumed bulkhead a-eas.
Where:
Total ship displacement (both hulls)d = Distance Station 4 to Station 18
P = Shear Load on Bulkhead n.X, = Distance to Bulkhead n.
2. Deflection ¡n each bulkhead is directly proportional to the linear distance (X)from center of torsion.
C= xn
Where:
= Deflection of Bulkhead n.
C = Tangent of the Angle (for small angles)
I-I_. ? T.J.*øZ LtI.
420.4- 4,
58
7
THE DESIGN PROCEDURE
Fig. 9 - Typical TransverseBulkhead for ASR
-
Torque =4
(EQUATION 1)

In order to evaluate forces in the bulkheads it is convenient to compute spring con-stants, Kn, due to support settlement. Bending and shear strains were included ¡n thespring constant. lt was assumed that the torsional strength of the hull is large compared tothe spring constants.
or
n = _i2_ , hence: C -Kn
Pl Pn
K1X1 K2X2
3. The cross-structure bulkheads are assumed to be fixed ended beams undergoing asettlement of the support. (See Figure 8)
Calculations
Equating the externally applied forces and internal resisting forces -
Ld ¡y(Equation 1) Torque = -i-- -
ere:
y2
59
Pn
K nXn
r- A"L --J Y = PiXi + P2X2 +
LTJY = pi [xiK2X22
K1 X1
PnXn
From Equation 2:
P1X2K2 P1X3K3 KnXnP1
= KX1 K1X1' n - K1X1
The equation is solved for P1. All other P, values can now be obtained fromEquation 3. From the shear loads (Pn), bending moments in the bulkheads are attainedfrom:
PL nMoment - -
Where:
L = Span of cross-structure between the hulls (Figure 8).
(EQUATION 2)
(EQUATION 3)
K X 21K >i j (EQUATION 4)

60
The final moments and shear values for each bulkhead ¡n the cross-structure calcu-lated by the foregoing condition and the predicted sea forces are recorded below andrepresent the actual values used for the ASR design. lt must be noted however that afteran initial scantling selection has been made the design loads were re-cycled and checkedfor the new inertias and web areas obtained as opposed to those assumed originally.
As can be seen from the resulting loads above, the docking-grounding conditiongives the highest combination of shear and moment which governs the forward and aftbulkhead especially the web plating to resist buckling. The large variance of loads onBulkhead 21 resulted from the fact that there was a deck height difference in depth fromthe other bulkheads.
CalculatedPredicted Sea Loads Docking-Grounding Loads
The resisting cross-structure bulkheads (21, 37, 49, 84, 86 and 110) have beendesigned similar to transverse bents on aircraft carriers. Of the total plate girder, theouter flange plus about i/o of the depth of the web assumed to entirely resist the bend-ing moment. The total shearing force was assumed to be equally distributed to the en-tire web. For stability, the outer 1/6 portion of the web was sized to develop thethe necessary shear or compressing buckling strength, whichever was worse, whilethe remaining 2/3 portion of the web was designed to develop a shear bucklingstrength equal to the shearing yield stress of the material . The above plate girdertheory ¡s based on actual tests indicating that the moment ¡n a plate girder is concen-trated ¡n the flanges but drops off rapidly toward the neutral axis, unlike the straightline distribution used generally. As a result, the center portion of the web cannot beassumed to contribute. The i/o web depth used is an approximate value covering theactual moment. Reference (8) describes this method and test results.
As mentioned above, the upper and lower levels form a flange for the major
cross-structure bulkheads. The actual width of plating, or "effective breadth" consid-ered in the design is probably somewhat conservative.
Approximately four feet of normal deck plating ¡s considered to act with the bulk-
heads as an effective breadth. The cross-structure, however, is more of a box girderwith stiffened plating. Although under torsional and bending loads it is assumed thatmuch more plating is effective, test data of large box girders is limited. lt was, there-fore, decided to consider the plating between bulkheads to provide an additional factor
MomentFt. Tons
ShearTons
MomentFt. Tons
ShearTons
Frame 21 4,600 80 5,180 305
Frame 37 11,600 104 6,650 342
Frame 49 13,200 104 3,900 230Frame 84 13,200 104 4,150 244Frame 86 14,700 104 6,900 406Frame 110 14,700 104 10,200 596
Total 72,000 600 36,980 2,173

61
of safety rather than including it in the design at this time. lt is hoped that structuralmodel tests can be conducted on box structures in the near future to determine a moreprecise effective breadth. With the assumption that plating between bulkheads is inef-fective, the design is then reduced from a torsional box girder problem to one of bulk-heads resisting the loads imposed through pure bending and shear. With only four feetconsidered for the effective breadth, it was necessary to use inserts to provide the neces-sary section modulus for the structure shown on Figure 9.
The joint between the cross-structure and main hull was considered a most criticalarea. Additional web plating was added in the cross-sftucture and main hull bulkheadsto reduce the nominal stress resulting from stress conentrations. There was also a prob-lem of plate delamination. If the cross-structure was made intercostal to the hull, theshell plate could delaminate, and vice versa. To solve this problem, the insert plateacting as the lower flange of the cross-structure was carried continuously through the in-board shell into the second deck and the transverse bulkhead plating was carried continu-ously through the inboard shell and second deck. This provides an interlacing of thehighly stressed structure so plate delamination would not lead to a major failure.
Since the cross-structure presented most of the problems, and s the basis for thispaper, little has been said about the main hull and local loads. The hulls are designedusing standard longitudinal strength calculations. Design of structure for local hydro-static loads is similar to that found on conventional ships except for the shell platinginboard and bottom of the cross structure. During a visit to the catamaran drilling rig,E .W. Thornton, ¡n the Gulf of Mexico, it was discovered that shell stiffening wasbadly damaged as a result of the pocketing effect of seas between the two hulls whilethe ship was moored. These f3rces somewhat resembled the effect found by the modeltest for the ASR. However, no effect on local stiffening could be predicted by themodel test. As a result of the local damage found on the drilling rig, the shell in-board on the ASR was designed for 1500 pounds per square foot. The drilling rig hadframing members intermittently welded. These welds suffered cracking throughoutthe length of the ship. For the ASR, continuous welding is specified.
CONCLUSION
The primary purpose of tFis paper has been to provide the ship design engineer withsome basic knowledge of the problems encountered with catamaran hull structure and asimple approach to the solution of these problems. If will be necessary to conduct moretests on various hull forms and spacings before a completely analytical solution can bedeveloped. lt will then become important to instrument these hulls once they are builtand attempt to correlate analytical predictions with full scale ship tests. The ASR andthe commercial ship E.W. Thornton, along with a new oceanographic research cata-moran now being designed, will provide valuable information for future designs.

62
REFERENCES
A.L. Dinsenbacher, J. Andrews and D. Pincus, "Model Test Determination ofSea Loads on Catamaran Cross Structure (Preliminary)," DMB Report of Sept.1966.J. Williamson, "Long Term Distribution of Bending Moment on ASR CatamaranCross Structure," Webb Institute Report dated 14 Oct. 1966.Moskowitz, "Estimates of the Power Spectra for Fully Developed Seas for WindSpeeds of 20 to 40 Knots," New York University Technical Report to ONR,Sept. 1963.R.H. Compton, "The Prediction of Long-Term Distributions of Wave-Induced Bend-ing Moment from Model Tests," Webb Report, dated July 1966.Nils Nordenstrom, "An Estimation of Long-Term Distribution of Wave-InducedMidship Bending Moments on Ships," Chalmers Tekniska Hogskola, dated Aug.1963.Warnsinck et al, "Report of Committee i on Environmental Conditions," ISSC Pro-ceedings, Vol. 1, dated July 1964.H .U. Roll, "Height, Length and Steepness of Seawaves in the North Atlantic andDimensions of Seawaves as Functions of Wind Force," SNAME T. & R. Bulletin,No. 1-19, dated Dec. 1958.L .S. Beedle and others, "Structural Steel Design," Fritz Engineering Report No.354.3, Lehigh University, dated Spring 1962.Samuel B. Richmond, "Statistical Analysis" 2nd Edbld Press Co., New York 1964.W.J. Pierson, Jr., and Others, "Practical Method for Observing and ForecastingOcean Waves by Means of Wave Spectra and Statistics," Hydrographic Office Pub-lication No. 603-1958.L. Moskowitz, W.J. Pierson, and E. Mehr, "Wave Spectra Estimated from WaveRecords Obtained by OWS Weather Explorer and the OWS Weather Reporter," NewYork University Technical Report to ONR, 3 Vols., Nov. 1962, Mar.1963, June1965.

63
APPENDIX 3
This ¡s a reproduction of the "Summary and Discussion" section with the asso-ciated nomenclature for reference (13), "A Method for Estimating Loads on CatamaranCross-Structure" by A .L. Dinsenbacher.
NOME NCLATU RE(For Appendix 3 Only)
wave amplitudewave amplitude for computing bending loadwave amplitude for computing torque loadbeam of one hullhalf beam of entire shipcenter of twist of cross-structureinstantaneous mean draftstillwater draftdistance from top of cross-structure down to neutral axis of cross-structurecenter of gravity of shipgravitational accelerationdepth (keel to top of cross-structure)horizontal hydrostatic force on outboard side of a hullhorizontal hydrostatic force on inboard side of a hullship length (LBp)wave length
M(y) = cross structure bending moment at transverse coordinate yM(0) = bending moment at midspan of cross-structureMQ = moment at junction of cross-structure and hull, not ¡ncluding effects of
weight and mass of cross-structureP = transverse axial load on cross-structurep horizontal hydrostatic pressureQ vertical shear forceS = clear span between hullsTc = torque on cross-structure about its twist centert = horizontal distance (positive forward) from cross-structure twist center to
ship's CGvL = distance from keel to center of pressure of horizontal hydrostatic force on
outboard side of a hull
vR = distance from keel to center of pressure of horizontal hydrostatic force oninboard side of a hull
W = ship weightWC = weight of cross-structurex,y,z coordinate system fixed on ship representation with origin at center of
gravityM half the clear span between hulls
= instantaneous displacement or buoyancy= density of water= distance, positive downward, from mean surface elevation to wave surface
A =
Ab=
B =b =C =
D =
D0d
=
G =
g =
Hi =
HL =
HR =
L =
Lw =

64
SUMMARY AND DISCUSSION
The equations obtained thus far for estimating cross-structure loads will now besummarized. The symbols have been defined in the Nomenclature, and some are illus-trated in Figs. i and 2. In several of the equations given in the following, the term(1 ± 0.4) appears; the positive Sign indicates the ship accelerating upward, the negativesign corresponds to downward acceleration. Also, we have now substituted S/2 for/Sand (S/2) + B for b in the equations developed previously ¡n the text.
For loading condition 1, the waves are approaching from the beam and are as-sumed to produce the greatest axial, vertical bending and shear loads. The directionsof positive loads are shown in Fig. 3.
The wave length and amplitude, A (wave height = 2 jA( ), for this loading caseare taken to be
Lw = 2(SB) (70)
A =Ab = ±1.0 JT (71)
The axial load on the cross-structure is
P = -2gLA (1 ± 0.4) D0fIB
The moment at the transverse mid-span of the cross-structure is
fIBM(0)=_LAsin2(5) [2D0(i±o.4)(H]_d)
A2 2 liB i W(S+B)A- D02 (1 ± 0.4)2 - sin
2(S + B) J 2flD0
r2(s+ B)LTTB
JiBsin2(S+B)
2(S + B)
+(1±O.4) W(S+2B)8
where A is given in (71). The sign of A is positive for a wave trough between the hulls,and negative for a crest.
The moment at the junction of cross-structure and hull is
M(± fl= M(0) -(1 ±04)W5/ (74)
where M(0) is obtained from (73). Whichever sign is chosen in the term of (1 ± 0.4)in (72), the same sign must be employed in that same term in (73) and (74).
TTBco s
2(S + B)

NOTES: View looking forward from stern
Coordinate system fixed on ship with origin atcenter of gravic' (G) or shipWave length. = 2(-) = 2(SB)A is wave amplitude (if A negative, crest between hulls)
-b
MEAN SURFACE ELEVATION
8 ø
CENTER PLANEOF HULL
_ÇNEUTRAL AXIS
65
ß
tH1
- z
D is height of wave surface above keel at center plane of hull (also dis-tance from keel to mean surface elevation)
(F) is vertical location of wave surface from mean elevation, at transversecoordinate F (epositi'.e in trough)
For wave surface: let () =A cos----(b. ß)
lmrncrsion of hull at D-(fl = D-A cos-1--
Fig. i - Loading Condition i
The estimate for maximum shear, in beam waves, at the junction of cross-structureand hull, ¡s
Q (1±0.4) + 0.34s
(75)
¡n which
MQ = M(0) -(1 ± 0.4) Wc (5+2B)/8 (76)
+M(0) in (76) is obtained from (73). Again, the choice of sign in (1 -0.4) must be keptconsistent throughout (73-76).
lt is important, in estimating the shear and moment acting on the cross-structure,thaf the various combinations resulting from the choices of ± A and (1 ± 0.4) be computed.This is to insure that the maximum loads are found.

66
L /2e = tan1
.Vf(S.8)2 + (L/2)2
At point p (On port hull centerplare), distance from mean surface elevation to wave
surface is
I 2iru
\ Lw! Lw
But, u =( - cose
so =A
2,ixand immersion D - ¿ D - A sin-.-._!
Fig. 2 - Loading Conditior 2
For loading condition 2 (for maximum torsion), the wave advances obliquely asas shown in Fig. 2. The wave length and amplitude are
= L(S + B)/J (S + B)2 + (2)2 ()A = A=O.ó Jt ()
The reader ¡s reminded that the wave height is twice the magnitude of the amplitude.
The estimate for maximum torsional load in waves is
IC = BAL2/21T+
OJ4Mqt/S (79)
Lw 2(SB)sinû =L(S-8)

Load
Axial Force
Moment
Shear
Tors io n
67
Table i - Loading Schedule A - For Direct Stress atMid-Span of Cross-Structure
Load Beam Waves Quartering Waves
Axial Force P from (72) 0.4 of P from (72)
Moment M (0) from (73) 0.4 of M (0) from (73)
Shear Not Applicable (N.A.) N.A.
Torsion N.A. N.A.
Table 2 - Loading Schedule B - For Direct Stress atJunction of Cross-Structure and Hull
Beam Waves Quartering Waves
Table 3 - Loading Schedule C - For Shear Stress atJunction of Cross-Structure and Hull
Locid Beam Waves Quartering Waves
Axial Force N.A. N.A.
Moment N.A. N.A.
Shear Q from (75) 0.4 of Q from (75)
Torsion 0.4 of T from (79) T from (79)
P from (72) 0.4 of P from (72)
M (±f) from (74) 0.4 of M(± + from (74)
N.A. N.A.
0.4 of Tc from (79) Tc from (79)

68
P!NTRNAL LOAOS
ViEW LOOKING FORWARDFROM STERN
Fig. 3 - Positive Internal Loads
in which A is defined by (78), M0 is computed from (76), and I is the magnitude of thetorque about the center of twist of the cross-structure.
To estimate the maximum stresses on the cross-structure ¡t is necessary to apply si-multaneously, in certain proportions, the loads found ¡n the foregoing. As has beenstated in the text, the model test results showed moments and shears ¡n quartering seas tobe about 0.4 of their magnitude ¡n beam waves. Also the torque in beam seas wasfound to be about 0.4 of its value in quartering waves. Therefore, to obtain estimatesof maximum stresses, ¡t is suggested that the loads should be applied ¡n accordance withthe loading schedules ¡n Tables 1, 2 and 3. Each loading schedule ¡s for a specificstress, and for the ship operating ¡n both beam and oblique waves. For each case thestresses of interest, which are produced by the loads in the "Load'1 column, are calcu-lated and summed. The equation to use to obtain a particular load is indicated in therow in which that load ¡s designated.
lt may be observed ¡n Loading Schedule B, Table 2, that torsion loads are used incomputing the direct stresses at the junction of the cross-structure and hulls. The reasonfor this ¡s that the torsional load can produce bending moments on the ends of the trans-verse bulkheads spanning the hulls (2, 9).
CONCLUDING REMARKS
An attempt has been made herein to develop simple expressions for estimating grossloads on the structure linking the hulls of a catamaran. Although several gross assump-fions and approximations have been made, some compensation for these has been ini ro-duced by relating, albeit empirically and/or heuristically, to model test results andcurrent design practices for longitudinal strength.
REFERE NCES
H.A. Schade, "Feasibility Study for an Ocean-Going Catamaran," prepared forthe Crowley Launch and Tugboat Company, California, June 1965.
A.L. Dinsenbacher, J .N. Andrews, and D.S. Pincus, "Model Test Determinationof Sea Loads on Catamaran Cross Structure," Naval Ship Research and Develop-ment Center (NSRDC) Report 2378, May 1967.

69
J .1. Birmingham and A.L. Dinsenbacher, "Stresses and Motions of a Liberty Shipin Random Seas," David Taylor Model Basin (DTMB) Report 2081, November 1965.
M. St. Denis, "On the Structural Design of the Midship Section," DTMB ReportC-555, October 1954.
J . N. Andrews and A .L. Dinsenbacher, "Structural Response of a Carrier Model ¡nRegularand Random Waves," NSRDC Report 2177, April 1966.
G.O. Thomas, "An Extended Static Balance Approach to Longitudinal Strength,"Trans. SNAME, vol. 76, 1968.
J .N. Andrews and A.L. Dinsenbacher, "Agreement of Model and PrototypeResponse Amplitude Operators and Whipping Response," NSRDC Report 2351,April 1967.
N.H. Jasper, et al. "Statistical Presentation of Motions and Hull BendingMoments of Essex-Class Aircraft Carriers," DTMB Report 1251, June 1960.
B.W. Lankford, "The Structural Design of the ASR Catamaran Cross-Structure,"Naval Engineers Journal, August 1967.

UNCLASSIFIED
D D FORM 1473 (PAGE 1)NOV 65 I
UNCLASSIFIED
DOCUMENT CONTROL DATA - R & DSecurity cias sification of nUe, body of abstract nod indoxi:ti,' ,snnolatir,n nIust be entered when the overall report Is class,f,ed)
ORIGINATING ACTIVITY (Corporate author)
M. Rosenblatt & Son, Inc.
¿o. REPORT SECURITY CLASSIFICATION
Unclassified2h. CROUP
3. REPORT TITLE
Catamarans - Technological Limits to Size and Appraisalof Structural Design Information and Procedures
4. DESC RIP TI V E NO TES (Type of report and inclusive dales)Final Report
5. AU THORISI (FIr,st name, middle initial, last name)
Naresh M. Maniar, Wei P. Chiang
. REPORT DATE
Sept. 1971
la. TOTAL NO. OF PAGES
69
7h. NO OF REFS
24Ba. CONTRACT OR ORANT NO
N00024-70-C-5145b. PROJECT NO.
F35422306, Task 2022, SR-192
NAVSHIPS No. 0911-001-1010d.
On. ORIGINATOR'S REPORT 1UMREP(SI
MR&S 2000-1
Sb. OTHER REPORT NOISI (Any other numbers that may be assignedthis report)
SSC-222tO. DISTRIBUTION STATEMENT
Distribution of this document is unlimited.
II. SUPVLEIiENTADV NOTES 12. SPONSORING MILITARY ACTIVITY
Naval Ship Systems Command
3 ABSTRACT
Existing United States shipbuilding facilities can handle 1000-foot catamarans withup to 140-foot individual hull beams on the premise that the hulls would be joined a-float. Major harbors and channels of the world suggest an overall beam limit of 400-feet and 35-foot draft. Drydocking for catamarans over 140-foot in breadth will re-quire new facilities or extensive modification to existing facilities. Scantlings ofa 1000-foot catamaran cargo liner can be expected to be within current shipbuildingcapabilities. The uniqueness of the catamaran design lies in the cross-structure andthe important facets of the cross-structure design are the prediction of the wave-in-duced loads and the method of structural analysis. The primary loads are the trans-verse vertical bending moments, axial force, shear, and torsion moments. Designershave relied heavily on model tests to obtain design loads and have used general struc-tures principles and individual ingenuity to perform the structural analysis in theabsence of established guidelines. Simple semi-empirical equations are proposed forpredicting maximum primary loads. A structural analysis method such as the one pro-posed by Lankford may be employed for conceptual design purposes. The Lankford methodassumes the hulls to be rigid and the cross-structure loads to be absorbed by a groupof transverse bulkheads and associated effective deck plating. This procedure in gen-eral should provide an overall conservative design and not necessarily an economic oroptimized design. Additional research and development work including systematic modeltest programs are necessary for accumulating additional knowledge in areas of uncer-tainty and for the establishment of reliable design methods for catamaran structure.
S/N 0101-807-6801 Security Classification

UNCLASSIFIEDSecurity Classification
D D FORM 1473 (BACK)I NOV 65 I
(PAGE- 2) GPO 919.492UNCLASSIFIED
Security Classification
4KEY WORDS
LINK A LINK B LINK CROLE WT ROLE WT ROLE WT
ç
Ca tama ran
Size Limits
Design Procedures