gastric acidity before and after operative procedure ... - NCBI
FUEL PROCESSING TECHNOLOGY
Fuel Processing Technology 5 I ( 1997) IO I- I25
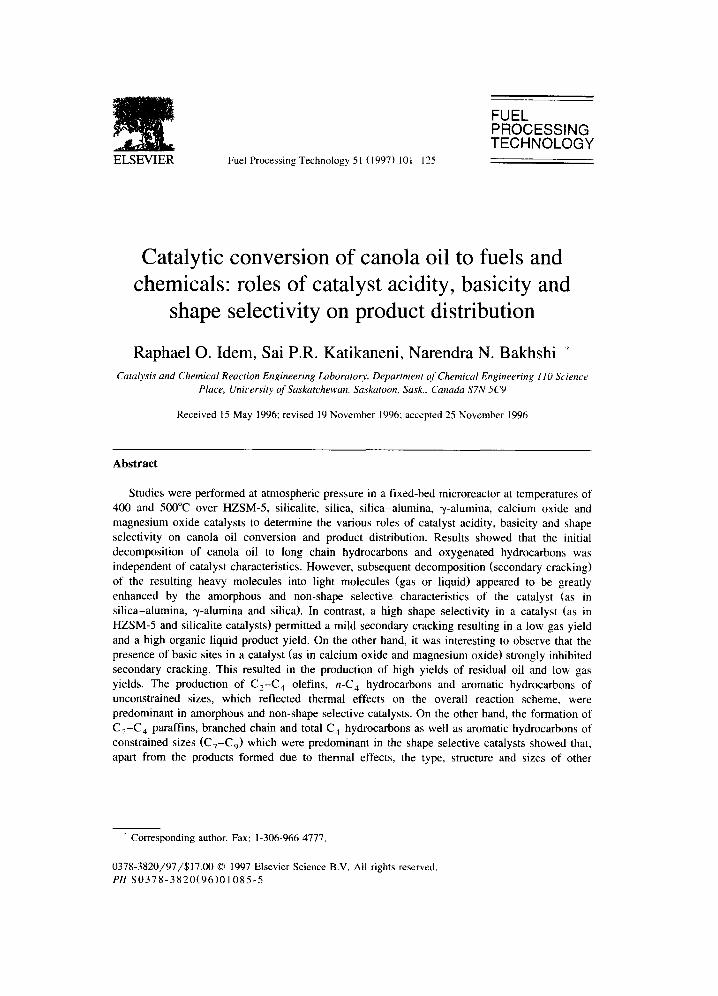
Catalytic conversion of canola oil to fuels and chemicals: roles of catalyst acidity, basicity and
shape selectivity on product distribution
Raphael 0. Idem, Sai P.R. Katikaneni, Narendra N. Bakhshi *
Catalysis and Chemical Reaction Engineering Laboratory, Department of Chemical Engineering 1 IO Science Place, Universiv of Saskatchewcm. Saskatoon, Sask., Canada S7N 5C9
Received 15 May 1996; revised 19 November 1996; accepted 25 November 1996
Abstract
Studies were performed at atmospheric pressure in a fixed-bed microreactor at temperatures of 400 and 500°C over HZSM-5, silicalite, silica, silica-alumina, y-alumina, calcium oxide and magnesium oxide catalysts to determine the various roles of catalyst acidity, basicity and shape selectivity on canola oil conversion and product distribution. Results showed that the initial decomposition of canola oil to long chain hydrocarbons and oxygenated hydrocarbons was independent of catalyst characteristics. However, subsequent decomposition (secondary cracking) of the resulting heavy molecules into light molecules (gas or liquid) appeared to be greatly enhanced by the amorphous and non-shape selective characteristics of the catalyst (as in silica-alumina, y-alumina and silica). In contrast, a high shape selectivity in a catalyst (as in
HZSM-5 and silicalite catalysts) permitted a mild secondary cracking resulting in a low gas yield and a high organic liquid product yield. On the other hand, it was interesting to observe that the presence of basic sites in a catalyst (as in calcium oxide and magnesium oxide) strongly inhibited secondary cracking. This resulted in the production of high yields of residual oil and low gas yields. The production of C,-C, olefins, n-C, hydrocarbons and aromatic hydrocarbons of unconstrained sizes, which reflected thermal effects on the overall reaction scheme, were predominant in amorphous and non-shape selective catalysts. On the other hand, the formation of C,-C, paraffins, branched chain and total C, hydrocarbons as well as aromatic hydrocarbons of constrained sizes (C,-C,) which were predominant in the shape selective catalysts showed that,
apart from the products formed due to thermal effects, the type, structure and sizes of other
* Corresponding author. Fax: 1-306-966-4777.
037%3820/97/$17.00 0 1997 Elsevier Science B.V. All rights reserved. PIf SO378-3820(96)01085-5
102 R.O. Idem et al/Fuel Processing Technology 51 (1997) 101-125
products are determined principally by the shape selective characteristic of the catalyst. 0 1997 Elsevier Science B.V.
Keywords: Canola oil; Conversion; Products; Catalyst; Acid and basic sites; Shape selectivity; Surface area
1. Introduction
Hydrocarbons are used in large quantities in a wide range of industrial applications in the production of fuels and chemicals. Traditionally, hydrocarbons are produced from petroleum sources [l]. However, there is a growing interest in studies involving their production from other sources such as from plant oils and animal fats [2-261. A number of these studies [3,18,21,26] are aimed at augmenting the anticipated future shortfall in hydrocarbons obtained from petroleum sources while others [4,5,7] are aimed at minimizing environmental pollution which arises from the release of large amounts of SO,, NO, and CO, from petroleum processes. Also, some of these studies involve the use of plant-derived oils or animal fats as model compounds to evaluate the product distribution that would be obtained from the catalytic conversion of sewage sludge [7] or waste oils from fast food restaurants and rendering plants [12,13].
In the recent literature [2-151, studies on the production of hydrocarbons from plant oils and animal fats have been conducted using cracking catalysts such as HZSM-5, Pt/HZSM-5, silica-alumina, H-Y, H-modernite, aluminum pillared clays, alumina, silicalite and physical mixtures of these catalysts. In most of these studies, hydrocarbons in the gasoline boiling range were predominant in the desired organic liquid product (OLP) fraction whereas the gaseous fraction contained both paraffinic and olefinic hydrocarbons. Also, it was observed that feed conversion and the type of products obtained depended strongly not only on operating conditions such as reaction tempera- ture, space velocity, type of feed material and whether this feed was co-fed with steam but also on catalyst characteristics such as type of acid centers, acid site distribution, crystallinity and shape selectivity [2,8,9,12,13].
It is known in the literature that for any chemical process, changes in the product distribution resulting from changes in operating variables and catalyst characteristics are due to the effects of these variables and characteristics on the reaction mechanism. A number of workers [ 17,18,22] have postulated reaction schemes showing various reaction pathways for the thermal conversion of plant oils to different hydrocarbon and oxygenated hydrocarbon products. Some of these schemes apply to saturated triglyceride molecules [ 17,18,2 1,231 while others apply to unsaturated triglyceride molecules [21-231. Recently [24], a scheme has been postulated that can adequately describe the thermal conversion of canola oil (a natural oil which contains a mixture of both saturated and unsaturated fatty acid moieties in the triglyceride molecule) to various hydrocarbons and oxygenated hydrocarbons. Attempts have been made [2,7-9,12,13] to determine the roles of both the operating conditions and catalyst characteristics on the reaction scheme and hence on product distribution. In the case of operating variables for example, these studies show that an increase in temperature and a decrease in space velocity result in an increase in total gas, methane, aromatic and C,-C, olefin hydrocarbon production as
R.O. Idem et al./ Fuel Processing Technology 51 (19971 101-125 103
well as in a decrease in the yields of aliphatic hydrocarbons and coke. Also, it has been shown [8,9,12,13,26,27] that the effect of co-feeding a plant oil with steam is to increase the C,-C, olefin hydrocarbon yield. Thus, literature indicates that information from different sources concerning the effects of various operating conditions on the product distribution is consistent. As such, the role of operating conditions on the reaction scheme appears to be fairly understood.
On the other hand, although a number of workers have conducted studies using catalysts possessing widely different characteristics (i.e., Lewis or Bronsted acidity [3,8,9,12,13], weak or strong acid sites, high or low acid site density [27], large or small Brunauer, Emmett, Teller (BET) surface area as well as highly crystalline and shape selective or amorphous and non-shape selective catalysts [ 12,13]), the specific role of each characteristic on both plant oil and animal fat conversion as well as the product distribution still remains a subject of controversy. For example, it has been observed by some workers [8,9,12,13] that the higher the acidity (especially the Bronsted acidity) of the catalyst, the greater the feed conversion. Also, the formation of aromatic hydrocar- bons has been ascribed specifically to the presence of high strength Bronsted acid sites on the catalysts [3,8,9,12,13]. However, these results are in contrast to those of Chang and Wan [18], Egloff and Morrell [ 191, Egloff and Nelson [20], Lipinsky et al. [21], Schwab et al. [22], Crossley et al. [23] as well as studies using silicalite catalyst by Katikaneni et al. [12] which showed that the formation of aromatic hydrocarbons or any other type of hydrocarbons did not necessarily require the presence of any acid centers on the catalyst.
Although there is information in the literature concerning the reaction scheme for the catalytic conversion of plant oils to various products over cracking catalysts [2,7- 9,12,13], there are conflicting views concerning the actual reaction intermediates as well as the correct sequence of intermediate reaction steps. Furthermore, almost all the catalytic conversion work has been performed using acid catalysts. Even though the use of calcium oxide in the destructive distillation of a plant oil has been reported [28], the effect of the presence of basic sites in the catalyst on catalyst performance has not been discussed before in the literature to our knowledge. It is highly desirable to know how each catalyst characteristic affects both the conversion and the overall product slate since such information is essential for the proper design of a catalyst capable of selectively catalyzing the production of only the products of interest.
In this study, an attempt has been made to elucidate the specific roles played by the acidity, basicity, shape selectivity and surface area of the catalyst in the product distribution obtained from the conversion of canola oil.
2. Experimental
2. I. Catalysts and characteristics
The catalyst characteristics under investigation were (i) acidity (including, type of acid centers (Bronsted or Lewis) and strength of the acid sites), (ii) basicity (including the strength of basic sites), (iii) shape selectivity and (iv) surface area. Different
104 R.O. Idem et al./Fuel Processing Technology 51 (1997) 101-125
catalysts exhibit different sets of characteristics. For example, a catalyst can be shape selective and acidic, shape selective and non-acidic, acidic and amorphous, etc. Thus, in the present work, studies were performed using catalysts which possess a widely contrasting set of characteristics from which the effect of acidity, shape selectivity, basicity and surface area on the response variable(s) were elucidated. The response variables were: product distribution (in terms of yield and/or selectivity of products) and canola oil conversion. The catalysts selected were: HZSM-5, silicalite, silica- alumina, silica, y-alumina, magnesium oxide and calcium oxide. Studies were also performed in an empty reactor to determine the effect on these response variables of the complete absence of a catalyst.
HZSM-5 catalyst was prepared following the procedure described by Chen et al. [29]. Details are given elsewhere [14]. On the other hand both silicalite and silica-alumina were obtained from Union Carbide (Danbury, CT, USA) while y-alumina was obtained from LaRoche (LA, USA). The silica catalyst used was fused amorphous silica and was obtained from Cab-0-Sil (Cabot Corporation, Boston, MS, USA) whereas calcium oxide and magnesium oxide were of American Chemical Society (ACS) grade and were obtained from Fisher Scientific (NJ, USA).
The micropore surface areas, pore volumes and median pore sizes of HZSM-5 and silicalite as well as the BET surface areas, pore volumes and average pore sizes of other catalysts were determined using a Micromeritics adsorption equipment (Model ASAP 2000) with nitrogen (99.995% purity; obtained from Linde, Calgary, Canada) as the analysis gas. Prior to analysis, each catalyst was evacuated at 250°C at a vacuum of 0.54 kPa for 10 h. On the other hand, information regarding the acidity, basicity and shape selectivity of the catalysts were obtained from the literature as well as from our earlier work [4,12,13,24,25,30-321. The characteristics of these catalysts are summarized in Table 1.
2.2. Canola oil
Canola oil was obtained from CSP Foods (Saskatoon, Canada) and was of the degummed and refined variety. It consisted mainly of unsaturated triglycerides having an average molecular formula of CsgH,,O,. The fatty acid moieties present in canola oil and their distributions are as follows: 60 wt% oleic acid (18:l); 20 wt% linoleic acid (18:2); 10 wt% linolenic acid (18:3); 2 wt% stearic acid (18:O); 4 wt% palmitic acid (16:O); and small quantities of eicosenic acid (2O:O) and erucic acid (22:l) totaling close to 4 wt%. The first and second numbers in parenthesis refer respectively to the numbers of carbon atoms and C=C bonds per molecule of the acid. Also, the canola oil had a density of 928.8 kg rnm3, a flash point of 63°C a surface tension of 29.2 dynes cm-’ and a pH of 7.0.
2.3. Per$ormance evaluation of catalysts
2.3.1. Equipment The performance evaluation of each catalyst (with respect to canola oil conversion
and product distribution) was carried out in a continuous down-flow fixed-bed stainless
R.O. Idem et al./ Fuel Processing Technology 51 (19971 101-125 105
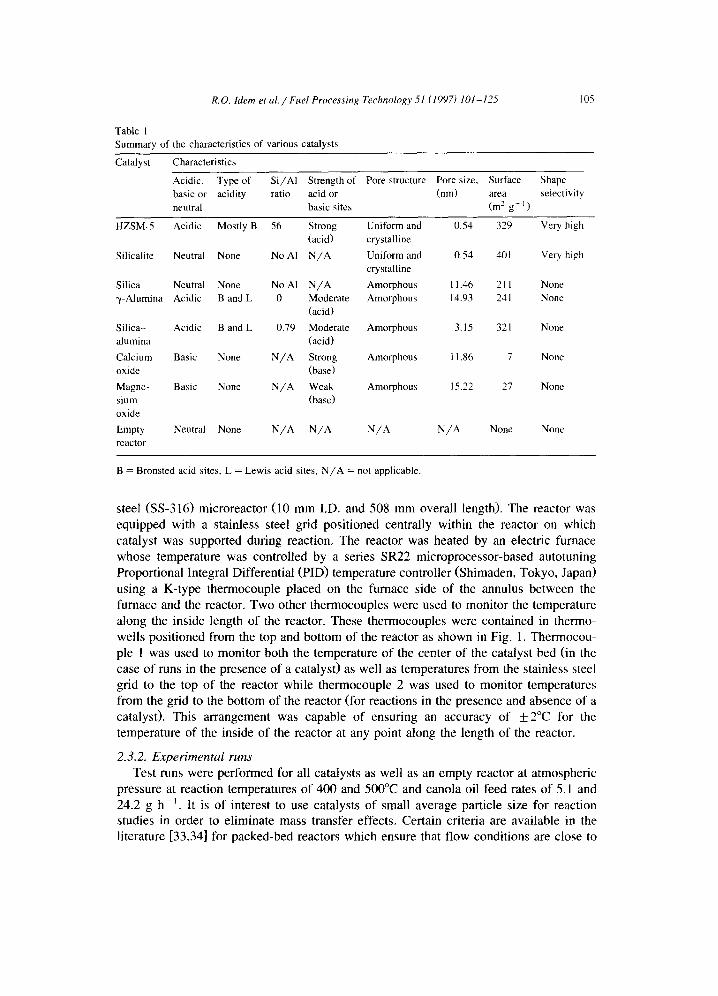
Table 1 Summary of the characteristics of various catalysts
Catalyst Characteristics
Acidic. Type of Si/Al Strength of Pore structure Pore size. Surface Shape basic or acidity ratio acid or (nm) area selectivity neutral basic sites (m’ gg’)
HZSM-5 Acidic Mostly B 56 Strong Uniform and 0.54 329 Very high (acid) crystalline
Silicalite Neutral None No Al N/A Uniform and 0.54 401 Very high crystalline
Silica Neutral None No Al N/A Amorphous 11.46 211 None y-Alumina Acidic B and L 0 Moderate Amorphous 14.93 241 None
(acid)
Silica- Acidic B and L 0.79 Moderate Amorphous 3.15 321 None alumina (acid)
Calcium Basic None N/A Strong Amorphous 1 1.86 I None oxide (base)
Magne- Basic None N/A Weak Amorphous 15.22 27 None aium (base) oxide
Empty Neutral None N/A N/A N/A N/A None None reactor
B = Bronsted acid sites. L = Lewis acid sites, N/A = not applicable.
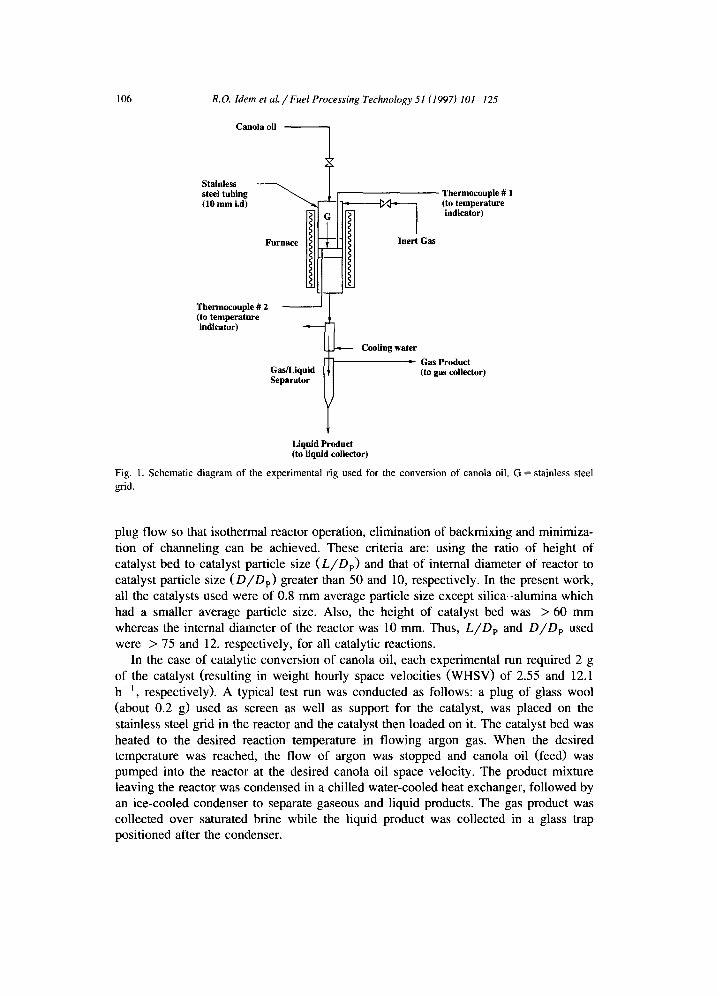
steel (SS-3 16) microreactor (10 mm I.D. and 508 mm overall length). The reactor was equipped with a stainless steel grid positioned centrally within the reactor on which catalyst was supported during reaction. The reactor was heated by an electric furnace whose temperature was controlled by a series SR22 microprocessor-based autotuning Proportional Integral Differential (PID) temperature controller (Shimaden, Tokyo, Japan) using a K-type thermocouple placed on the furnace side of the annulus between the furnace and the reactor. Two other thermocouples were used to monitor the temperature along the inside length of the reactor. These thermocouples were contained in thermo- wells positioned from the top and bottom of the reactor as shown in Fig. 1. Thermocou- ple 1 was used to monitor both the temperature of the center of the catalyst bed (in the case of runs in the presence of a catalyst) as well as temperatures from the stainless steel grid to the top of the reactor while thermocouple 2 was used to monitor temperatures from the grid to the bottom of the reactor (for reactions in the presence and absence of a catalyst). This arrangement was capable of ensuring an accuracy of +2”C for the temperature of the inside of the reactor at any point along the length of the reactor.
2.3.2. Experimental runs Test runs were performed for all catalysts as well as an empty reactor at atmospheric
pressure at reaction temperatures of 400 and 500°C and canola oil feed rates of 5.1 and 24.2 g h- ’ . It is of interest to use catalysts of small average particle size for reaction studies in order to eliminate mass transfer effects. Certain criteria are available in the literature [33,34] for packed-bed reactors which ensure that flow conditions are close to
106 R.O. Idem et al./ Fuel Processing Technology 51 (1997) 101-125
Canola oil
1 Stainless steel tubing (10 mm i.d)
Thermocouple # 1 (to temperature indicator)
Thermocouple # 2 (to temperature indicator)
Cooling water
Gas Product Gas/Liquid Separator ” (to gas collector)
Liquid Product (to liquid collector)
Fig. 1. Schematic diagram of the experimental rig used for the conversion of canola oil. G = stainless steel grid.
plug flow so that isothermal reactor operation, elimination of backmixing and minimiza- tion of channeling can be achieved. These criteria are: using the ratio of height of catalyst bed to catalyst particle size (L/D,) and that of internal diameter of reactor to catalyst particle size (D/D,) greater than 50 and 10, respectively. In the present work, all the catalysts used were of 0.8 mm average particle size except silica-alumina which had a smaller average particle size. Also, the height of catalyst bed was > 60 mm whereas the internal diameter of the reactor was 10 mm. Thus, L/D, and D/D, used were > 75 and 12, respectively, for all catalytic reactions.
In the case of catalytic conversion of canola oil, each experimental run required 2 g of the catalyst (resulting in weight hourly space velocities (WHSV) of 2.55 and 12.1 h-l, respectively). A typical test run was conducted as follows: a plug of glass wool (about 0.2 g) used as screen as well as support for the catalyst, was placed on the stainless steel grid in the reactor and the catalyst then loaded on it. The catalyst bed was heated to the desired reaction temperature in flowing argon gas. When the desired temperature was reached, the flow of argon was stopped and canola oil (feed) was pumped into the reactor at the desired canola oil space velocity. The product mixture leaving the reactor was condensed in a chilled water-cooled heat exchanger, followed by an ice-cooled condenser to separate gaseous and liquid products. The gas product was collected over saturated brine while the liquid product was collected in a glass trap positioned after the condenser.

R.O. Idem et al./ Fuel Processing Technology 51 (1997) 101-125 107
Similarly, the empty reactor runs were carried out at temperatures of 400 and 500°C and canola oil feed rates of 5.11 and 24.2 g h- ’ . Based on the total volume of the reactor, these feed rates corresponded to canola oil gas hourly space velocities (GHSV) of 3.2 and 15.4 hh’, respectively, at normal temperature and pressure (i.e., 25°C and 101.3 kPa)). These GHSV values for the empty reactor runs were equivalent to the WHSV values of 2.55 and 12.1 hh’, respectively for the catalytic runs. The experimen- tal procedure for a test run was the same as in the case of catalytic conversion studies.
The scheme for the estimation of the amounts of coke, residual oil, OLP, gas and water formed for each canola oil conversion run is given in Fig. 2. A detailed description of the procedure is given elsewhere [ 12,14,24].
2.3.3. Analysis of products
2.3.3.1. Gaseous products. The gaseous product was analyzed with a Carle 500 gas chromatograph (GC) using a combination of packed and capillary columns and both flame ionization and thermal conductivity detectors. The sample was injected into a 2 m long pre-column, packed with OV- 101 silicone oil. All components lighter than ethane C,H, passed rapidly through this column and were separated at 70°C in Porapak Q and molecular sieve 13X columns, each 2.7 m in length into CO, CO,, Cl and C, hydrocarbons which were measured by the thermal conductivity detector. The compo- nents having a carbon number of three and above (i.e., CT) were back-flushed onto the fused-silica capillary for which the oven temperature was programmed from 40-200°C.
Canola oil
Liquid product
Organic Liquid
Product (OLP)
Oxygenated Compounds
Unidentified components
\- Vacuum Distillation _) Residual oil
Fig. 2. Scheme for the collection and analyses of various products from the conversion of canola oil
108 R.O. Idem et al./ Fuel Processing Technology 51 (1997) 101-125
The Ci components were measured by flame ionization detector (FID). Analysis took approximately 30 min. The identities of the individual GC peaks had earlier been established using GC-mass spectrometer (GC-MS) technique. After normalization of the components, an average molecular weight for the gas product was calculated. The overall weight of the gas product was then determined from the average molecular weight and the total volume of gas evolved during the run. All the columns were purchased from Supelco (Mississauga, Ontario, Canada).
2.3.3.2. OLP. The OLP was also analyzed with a Carle 500 GC which was equipped with a bonded non-polar (methyl silicone) 50 m X 0.2 mm I.D. capillary column and FID. Temperature in the GC oven was programmed from 40-200°C. Usually, the OLP contains a wide variety of components (hydrocarbons with isomers and various func- tional groups). Therefore, a GC-MS analysis in conjunction with the use of known pure compounds and calibration mixtures (obtained from PolyScience, IL, USA) was neces- sary to establish the identity of the components in the OLP. GC-MS analysis was performed using VG Analytical 70VS extended magnet MS. The attached GC was GC 800 series which was equipped with the same set of columns and operated under the same oven temperature programs as in the Carle GC.
The residue obtained from vacuum distillation of the liquid product at 200°C and 172 Pa (residual oil) was also analyzed using both GC and GC-MS techniques in order to determine the composition of residual oil. The residual oil for each test run was diluted in acetone prior to GC-MS analyses.
For each complete set of analyses (i.e., for gas, OLP and residual oil fractions), the individual compounds identified were placed under similar chemical groups. These included light paraffin gases (i.e., methane, ethane and propane), C, and C, hydrocar- bon gases, C,-C, olefins and paraffins, alcohols, ketones, aldehydes, Ci aliphatic hydrocarbons, benzene, toluene, xylenes, ethyl benzene, Cl aromatic hydrocarbons, total aromatic hydrocarbons and residual oil. Those peaks which could not be identified using the available data base were termed “the unidentified fraction”. Details concem- ing the analysis of both gas and liquid products are given elsewhere [12,13,24].
3. Results and discussion
3.1. Catalyst characteristics
Table 1 gives a summary of the characteristics of the catalysts used in this work. The table shows that HZSM-5 catalyst has a Si/Al ratio of 56, a surface area of 329 m2 g-’ and a pore size of 0.54 nm. According to the literature [ 12,13,24,25], HZSM-5 contains mostly high strength Bronsted acid sites and some Lewis sites, and is both crystalline and highly shape selective. Also, the acid sites in HZSM-5 lie on the intercrystalline surface of the zeolite and are all accessible to the reactants. In addition, molecules such as cyclohexane, 1,3,5 trimethylbenzene have been found [30] to diffuse readily through the pores of HZSM-5. On the other hand, silicalite (which is composed entirely of silica) exhibits the same level of crystallinity and shape selectivity as HZSM-5, but does not
R.O. Idem et al./Fuel Processing Technology 51 (1997) 101-125 109
possess any ion-exchange capability and essentially contains no acid sites. Silicalite has a higher surface area (401 m2 g- ‘1 than HZSM-5 (329 m’ g- ‘1. However, like HZSM-5, it has a uniform pore size of 0.54 nm.
As in the case of HZSM-5, silica-alumina catalyst contains both Al and Si and both Bronsted and Lewis acid sites [4]. It has a BET surface area of 321 m2 g-’ which is essentially the same as the micropore surface area of HZSM-5. However, unlike HZSM-5, silica-alumina has an average pore size of 3.15 nm and a Si/Al ratio of 0.79. Also, most of the acid sites are buried in inaccessible locations, thus leading to a low acidity. In addition, silica-alumina has a non-uniform/amorphous pore structure and is thus completely non-shape selective. In the case of y-alumina, the literature [31,32] indicates that the non-shape selectivity and type of acidity are similar to those exhibited by silica-alumina. The major differences lie in the presence of silica in silica-alumina and not in y-alumina and in the lower BET surface area of y-alumina (241 m2 g- ‘) compared with that of silica-alumina (321 m’ g- ‘).
The test runs conducted with silica were used as a basis for comparison with those using silicalite. The literature indicates that the methods of preparation of the two catalysts are such that silicalite is both highly crystalline and shape selective whereas silica is amorphous and completely non-shape selective. However, they both contain silicon oxide and are essentially non-acidic (neutral). The silica catalyst used in this work has a BET surface area of 211 m’ g-‘. In contrast to acidic or neutral catalysts, two other catalysts. which were basic in nature, were used in the present work to study the role of the catalyst basic sites on product distribution. These were: magnesium oxide and calcium oxide. Both catalysts are amorphous and completely non-shape selective. Their BET surface areas were low (27 and 7 rn’ g- ‘, respectively). The major difference between these two materials is that calcium oxide is a stronger base than magnesium oxide.
Table 2 Overall mass balances for the conversion of canola oil as a function of catalyst type and reaction temperature
Overall mass balance (wt% of canola oil)
Gas fraction Organic liquid Residual oil Coke Canola oil product fraction conversion
Temp. PC) 500 400 500 400 500 400 500 400 500 400
Catalyst HZSM-5 56.5 23.2 36.5 49.6 1 .o 16.4 6.0 10.7 99.0 83.6 Silicalite 61.7 25.5 31.3 52.0 I .o 12.4 6.3 10.1 99. I 87.6 Silica 75.4 38.8 22.3 55.6 0 1.0 2.3 4.6 100 99.0 y-Alumina 76.9 49.9 15.4 40.9 0 0.6 9.7 7.6 100 99.4 Silica-alumina 74.8 33.6 20.4 49.4 0.2 6.5 6.6 8.4 99.8 93.5 Calcium oxide 56.2 14.9 37.2 20.4 4.3 55.8 2.2 9.0 95.7 44.2 Magnesium oxide 66. I 19.8 29.1 36.8 1.6 33.7 3.2 8.0 98.4 56.3 Empty reactor a 70.0 20.1 19.3 47.9 6.7 30.0 1.0 2.0 93.3 70.0 Empty reactor h 75 55.8 14.8 34.4 0 1.6 3.9 3.9 loo 98.4
All runs conducted at WHSV = 12.1 hh’, except a at GHSV= 15.4 h-’ and b at GHSV= 3.2 hh’.
110
Table 3
R.O. Idem et&/Fuel Processing Technology51 11997) 101-125
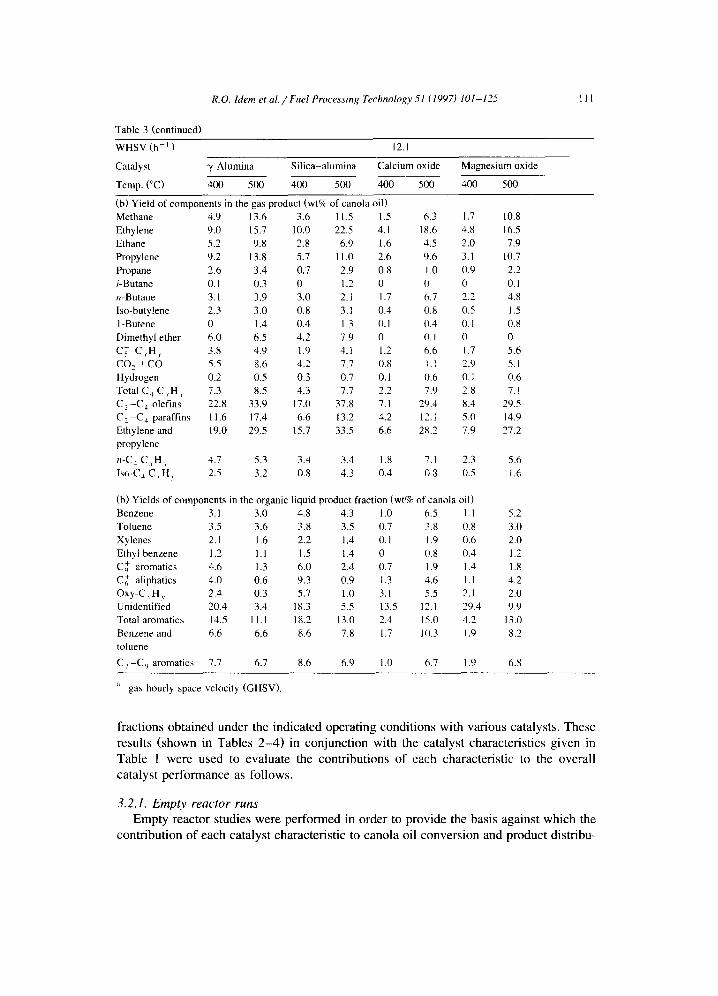
Yields of various products for the conversion of canola oil over various catalysts as a function of reaction temperature: (a) empty reactor, HZSM-5, silicalite and silica: (b) silica-alumina, y-alumina, calcium oxide and magnesium oxide
WHSV (h-’ 1 3.2 a 15.4 a 12.1
Catalyst Empty reactor HZSM-5 Silicalite Silica
Temp. CC) 400 500 400 500 400 500 400 500 400 500
(a) Yields of gas phase product components (wt% of canola oil) Methane 7.1 Ethylene 17.0 Ethane 5.4 Propylene 10.3 Propane 0.9 i-Butane 0 n-Butane 5.5 Iso-butylene 0.8 1-Butene 0.4 Dimethyl ether 0.1 C; C,H, 4.5 co, + co 2.9 Hydrogen 0.9 Total C, C,H, 6.7 C, -C, olefins 28.5 C,-C, paraffins 11.8 Ethylene and 27.3 propylene
n-C4 CxH, 5.9 Iso-C, C,H, 0.8
10.6 2.1 7.9 1.2 5.3 1.9 12.7 2.6 9.75 23.6 16.3 23.3 2.0 9.8 2.3 6.2 10.4 22.7
7.0 1.8 5.3 1.6 4.3 2.3 6.3 4.3 6.5 13.5 3.5 11.7 3.7 12.8 3.6 9.3 7.2 13.1
1.1 0.3 1.0 4.4 5.3 3.6 6.7 2.0 1.4 0 0 0 1.9 1.5 1.7 2.2 0 0 6.5 2.1 7.8 2.1 5.3 2.4 4.4 4.6 7.7 1.0 0.3 0.9 2.1 3.4 2.4 3.4 1.1 1.2 0.5 0.1 0.4 0.4 1.3 0.5 1.0 0 0.6 0.1 0 0.1 0 0 0 0 0 0.1 4.0 2.5 7.6 2.6 5.4 3.4 5.9 4.7 8.8 3.8 0.9 3.4 1.0 2.1 1.5 3.6 2.3 2.5 1.6 0.2 0.8 0 0 0 0.1 0.4 0.9 8.0 2.4 9.1 6.5 11.5 7.0 11.0 5.7 9.5
38.6 10.2 36.3 8.3 27.4 8.8 19.9 17.5 37.6 14.6 4.1 14.1 10.0 16.4 9.9 19.7 10.6 15.6 37.1 9.8 35.0 9.3 22.7 5.8 15.5 16.3 35.7
7.1 2.2 8.1 2.5 6.6 2.8 5.4 4.6 8.3 1.0 0.3 0.9 4.0 4.9 4.2 5.6 1.1 1.3
(a) Yields of components in organic liquid product (wt% of canola oil) Benzene 5.0 4.0 2.5 2.6 4.0 4.9 Toluene 3.9 2.8 1.6 1.4 9.3 10.1 Xylenes 1.1 0.6 0.5 0.6 7.4 7.2 Ethyl benzene 0.8 0.4 0.2 0.3 2.2 2.0 C,+ aromatics 2.7 1.2 2.0 1.5 4.4 3.4 Cl aliphatics 1.5 0.6 1.1 0.2 3.5 1.0 Oxy-C,H, 18.1 1.0 4.1 0.3 4.6 2.1 Unidentified 13.5 4.3 41.9 12.0 14.2 4.8 Total aromatics 12.6 9.0 6.8 6.4 27.3 27.6 Benzene and 8.9 6.8 4.1 4.0 13.3 15.3 toluene
C,-C, aromatics 5.2 4.4 3.2 2.9 22.3 21.6
3.1 4.9 4.6 3.1 7.5 8.9 3.7 2.7 7.2 6.0 2.0 1.3 2.8 2.9 1.0 0.5 5.6 3.2 2.7 1.4 2.7 0.4 13.3 4.4 5.6 0.8 11.4 2.1 17.6 4.1 16.8 6.2 26.1 25.9 14.0 9.6 10.6 13.8 8.3 6.4
21.3 18.6 7.5 4.7
3.2. Performance evaluation of catalysts
Table 2 shows the overall material balances obtained at 400 and 500°C and at the indicated space velocities for canola oil conversions obtained over the various catalysts as well as in the empty reactor. On the other hand, Table 3(a and b) shows the yields of each product or group of products obtained under the indicated operating conditions with various catalysts. Also, Table 4(a and b) shows the compositions of gas and OLP
R.O. Idem et al./ Fuel Processing Technology 51 (19971 101-125 III
Table 3 (continued)
WHSV (h-l)
Catalyst
Temp. CC)
y-Alumina
400 500
12.1
Silica-alumina Calcium oxide Magnesium oxide
400 500 400 500 400 500
(b) Yield of components in the gas product (wt% of canola oil) Methane 4.9 Ethylene 9.0 Ethane 5.2 Propylene 9.2 Propane 2.6 i-Butane 0. I n-Butane 3.1 Iso-butylene 2.3 I -Butene 0 Dimethyl ether 6.0
C: C,H, 3.8 CO? + co 5.5 Hydrogen 0.2 Total C, C rH) 7.3 C? -C, olefins 22.8 C2 -C, paraffins I I.6 Ethylene and 19.0 propylene
n-C, C,H, 4.7
Iao-C, C I H , 2.5
13.6 3.6 11.5 I .5 6.3 1.7 10.8 15.7 10.0 22.5 4. I 18.6 4.8 16.5 9.8 2.8 6.9 1.6 4.5 2.0 7.9
13.8 5.1 11.0 2.6 9.6 3.1 10.7 3.4 0.7 2.9 0.8 I .o 0.9 2.2 0.3 0 1.2 0 0 0 0.1 3.9 3.0 2.1 I .7 6.7 2.2 4.8 3.0 0.8 3.1 0.4 0.8 0.5 1.5 1.4 0.4 1.3 0.1 0.4 0.1 0.8 6.5 4.2 7.9 0 0. I 0 0 4.9 1.9 4.1 1.2 6.6 I.7 5.6 8.6 4.2 7.7 0.8 I.1 2.9 5.1 0.5 0.3 0.7 0. I 0.6 0.1 0.6 8.5 4.3 7.7 2.3 7.9 2.8 7.!
33.9 17.0 37.8 I. I 29.4 8.4 29.5 17.4 6.6 13.2 4.2 12.1 5.0 14.9 29.5 15.7 33.5 6.6 2x.2 7.9 27.2
5.3 3.4 3.4 1.8 7.1 2.3 5.6 3.2 0.8 4.3 0.4 0.3 0.5 I .6
(b) Yields of components in the organic liquid product fraction (wt% of canola oil) Benzene 3.1 3.0 4.8 4.3 1 .o 6.5 I.1 Toluene 3.5 3.6 3.8 3.5 0.7 3.8 0.8 Xylenes 2.1 I .6 2.2 I .4 0. I 1.9 0.6 Ethyl benzene 1.2 I.1 I .5 1.4 0 0.8 0.4 C,+ aromatics 4.6 1.3 6.0 2.4 0.7 1.9 I .4 Cl aliphatics 4.0 0.6 9.3 0.9 1.3 4.6 1.1 Oxy-C , H , 2.4 0.3 5.7 1.0 3.1 5.5 2.1 Unidentified 20.4 3.4 18.3 5.5 13.5 12.1 29.4 Total aromatics 14.5 II.1 18.2 13.0 2.4 IS.0 4.2 Benzene and 6.6 6.6 8.6 7.8 1.7 10.3 I.9 toluene
C, -C, aromatics 7.7 6.7 8.6 6.9 1.0 6.7 1.9
5.2 3.0 2.0 1.2 1 .e 4.2 2.0 9.9
13.0 8.2
6.8
’ gas hourly space velocity (GHSV).
fractions obtained under the indicated operating conditions with various catalysts. These results (shown in Tables 2-4) in conjunction with the catalyst characteristics given in Table 1 were used to evaluate the contributions of each characteristic to the overall catalyst performance as follows.
3.2.1. Empty reactor runs Empty reactor studies were performed in order to provide the basis against which the
contribution of each catalyst characteristic to canola oil conversion and product distribu-
112 R.O. Idem et al./Fuel Processing Technology 51 (1997) 101-125
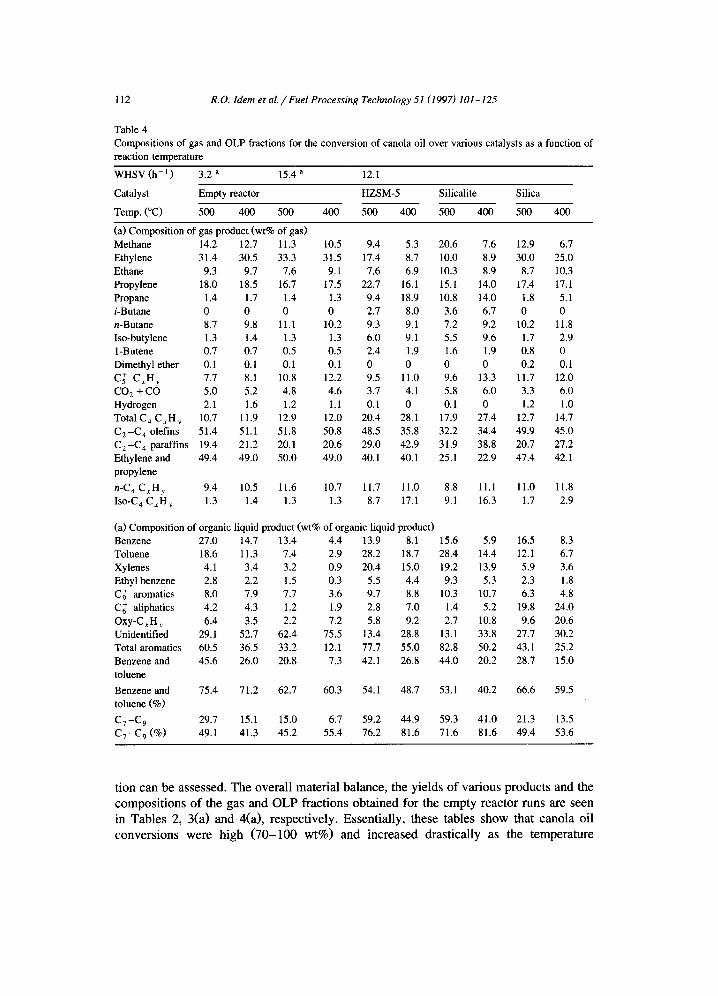
Table 4 Compositions of gas and OLP fractions for the conversion of canola oil over various catalysts as a function of reaction temperature
WHSV (h-l) 3.2 a 15.4 a 12.1
Catalyst Empty reactor HZSM-5 Silicalite Silica
Temp. (“C) 500 400 500 400 500 400 500 400 500 400
(a) Composition of gas product (wt% of gas) Methane 14.2 Ethylene 31.4 Ethane 9.3 Propylene 18.0 Propane 1.4 i-Butane 0 n-Butane 8.7 Iso-butylene 1.3 I-Butene 0.7 Dimethyl ether 0.1
C: CxH, 7.7 co, + co 5.0 Hydrogen 2.1 Total C, C,H, 10.7 C, -C, olefins 51.4 C,-C, paraffins 19.4 Ethylene and 49.4 propylene
n-C, C,H, 9.4 Iso-C, C,H, 1.3
12.7 11.3 10.5 9.4 5.3 20.6 7.6 12.9 6.7 30.5 33.3 31.5 17.4 8.7 10.0 8.9 30.0 25.0
9.1 7.6 9.1 7.6 6.9 10.3 8.9 8.7 10.3 18.5 16.7 17.5 22.7 16.1 15.1 14.0 17.4 17.1
1.7 1.4 1.3 9.4 18.9 10.8 14.0 1.8 5.1 0 0 0 2.7 8.0 3.6 6.7 0 0 9.8 11.1 10.2 9.3 9.1 7.2 9.2 10.2 11.8 1.4 1.3 1.3 6.0 9.1 5.5 9.6 1.7 2.9 0.7 0.5 0.5 2.4 1.9 1.6 1.9 0.8 0 0.1 0.1 0.1 0 0 0 0 0.2 0.1 8.1 10.8 12.2 9.5 11.0 9.6 13.3 11.7 12.0 5.2 4.8 4.6 3.7 4.1 5.8 6.0 3.3 6.0 1.6 1.2 1.1 0.1 0 0.1 0 1.2 1.0
11.9 12.9 12.0 20.4 28.1 17.9 27.4 12.7 14.7 51.1 51.8 50.8 48.5 35.8 32.2 34.4 49.9 45.0 21.2 20.1 20.6 29.0 42.9 31.9 38.8 20.7 27.2 49.0 50.0 49.0 40.1 40.1 25.1 22.9 47.4 42.1
10.5 11.6 10.7 11.7 11.0 8.8 11.1 11.0 11.8 1.4 1.3 1.3 8.7 17.1 9.1 16.3 1.7 2.9
(a) Composition of organic liquid product (wt% of organic liquid product) Benzene 27.0 14.7 13.4 4.4 13.9 8.1 15.6 5.9 16.5 8.3 Toluene 18.6 11.3 7.4 2.9 28.2 18.7 28.4 14.4 12.1 6.7 Xylenes 4.1 3.4 3.2 0.9 20.4 15.0 19.2 13.9 5.9 3.6 Ethyl benzene 2.8 2.2 1.5 0.3 5.5 4.4 9.3 5.3 2.3 1.8 Ci aromatics 8.0 7.9 7.7 3.6 9.7 8.8 10.3 10.7 6.3 4.8 Cl aliphatics 4.2 4.3 1.2 1.9 2.8 7.0 1.4 5.2 19.8 24.0 OXY-CxH, 6.4 3.5 2.2 7.2 5.8 9.2 2.7 10.8 9.6 20.6 Unidentified 29.1 52.7 62.4 75.5 13.4 28.8 13.1 33.8 27.7 30.2 Total aromatics 60.5 36.5 33.2 12.1 77.7 55.0 82.8 50.2 43.1 25.2 Benzene and 45.6 26.0 20.8 7.3 42.1 26.8 44.0 20.2 28.7 15.0 toluene
Benzene and 75.4 71.2 62.7 60.3 54.1 48.7 53.1 40.2 66.6 59.5 toluene (%I
c7-c9 29.7 15.1 15.0 6.7 59.2 44.9 59.3 41.0 21.3 13.5 c,-c, (%I 49.1 41.3 45.2 55.4 76.2 81.6 71.6 81.6 49.4 53.6
tion can be assessed. The overall material balance, the yields of various products and the compositions of the gas and OLP fractions obtained for the empty reactor runs are seen in Tables 2, 3(a) and 4(a), respectively. Essentially, these tables show that canola oil conversions were high (70-100 wt%) and increased drastically as the temperature
R.O. Idem et al./Fuel Processing Technology 51 (1997) 101-125 II3
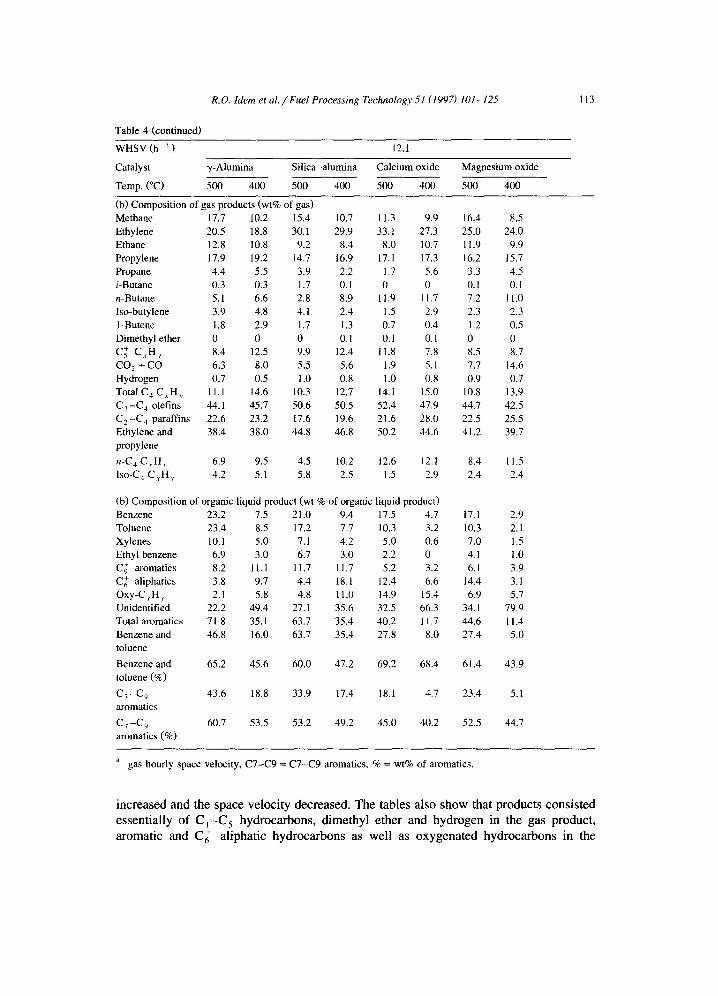
Table 4 (continued)
WHSV (h- ’ )
Catalyst
Temp. CC)
y-Alumina
500 400
12.1
Silica-alumina Calcium oxide Magnesium oxide
500 400 500 400 500 400
(b) Composition of gas products (wt% of gas) Methane- 17.7 Ethylene 20.5 Ethane 12.8 Propylene 17.9 Propane 4.4 i-Butane 0.3 n-Butane 5.1 Iso-butylene 3.9 I -Butene 1.8 Dimethyl ether 0
C; C,H, 8.4 co, + co 6.3 Hydrogen 0.7 Total C, C,H, 11.1 C,-C, olefins 44.1 C, -C, paraffins 22.6 Ethylene and 38.4 propylene
n-C, C,H, 6.9 Iso-C, C , H , 4.2
10.2 15.4 10.7 Il.3 9.9 16.4 8.5 18.8 30.1 29.9 33.1 27.3 25.0 24.0 10.8 9.2 8.4 8.0 10.7 11.9 9.9 19.2 14.7 16.9 17.1 17.3 16.2 15.7 5.5 3.9 2.2 1.7 5.6 3.3 4.5 0.3 1.7 0.1 0 0 0.1 0.1 6.6 2.8 8.9 11.9 11.7 1.2 11.0 4.8 4.1 2.4 1.5 2.9 2.3 2.3 2.9 1.7 1.3 0.7 0.4 1.2 0.5 0 0 0.1 0.1 0.1 0 0
12.5 9.9 12.4 11.8 7.8 8.5 8.7 8.0 5.5 5.6 1.9 5.1 1.7 14.6 0.5 1 .o 0.8 1.0 0.8 0.9 0.7
14.6 10.3 12.7 14.1 15.0 10.8 13.9 45.7 50.6 50.5 52.4 47.9 44.1 42.5 23.2 17.6 19.6 21.6 28.0 22.5 25.5 38.0 44.8 46.8 50.2 44.6 41.2 39.7
9.5 4.5 10.2 12.6 12.1 8.4 11.5 5.1 5.8 2.5 1.5 2.9 2.4 2.4
(b) Composition of organic liquid product (wt % of organic liquid product) Benzene Toluene Xylenes Ethyl benzene C,+ aromatics Ci aliphatics Oxy-C rH ) Unidentified Total aromatics Benzene and toluene
Benzene and toluene (%c)
G-C, aromatics
C,-C, aromatics (%)
23.2 7.5 21.0 9.4 17.5 4.7 17.1 2.9 23.4 8.5 17.2 7.7 10.3 3.2 10.3 2.1 10.1 5.0 7.1 4.2 5.0 0.6 7.0 1.5 6.9 3.0 6.7 3.0 2.2 0 4.1 1.0 8.2 11.1 11.7 11.7 5.2 3.2 6.1 3.9 3.8 9.7 4.4 18.1 12.4 6.6 14.4 3.1 2.1 5.8 4.8 11.0 14.9 15.4 6.9 5.7
22.2 49.4 27.1 35.6 32.5 66.3 34.1 79.9 71.8 35.1 63.7 35.4 40.2 11.7 44.6 11.4 46.8 16.0 63.7 35.4 27.8 8.0 27.4 5.0
65.2 45.6 60.0 47.2 69.2 68.4 61.4
43.6
60.7
18.8
53.5
33.9
53.2
17.4
49.2
18.1 4.1 23.4
45.0 40.2 52.5
43.9
5.1
44.7
a gas hourly space velocity, C7-C9 = C7-C9 aromatics, % = wt% of aromatics.
increased and the space velocity decreased. The tables also show that products consisted essentially of C I-C, hydrocarbons, dimethyl ether and hydrogen in the gas product, aromatic and Ct aliphatic hydrocarbons as well as oxygenated hydrocarbons in the
114 R.O. Idem et al/Fuel Processing Technology 51 (1997) 101-125
OLP, and residual oil (a mixture consisting mainly of long chain hydrocarbons and oxygenated hydrocarbons).
Table 4(a) shows that there was a preponderance of benzene and toluene in the OLP. Also, the yield of benzene, toluene and the total aromatic hydrocarbons increased with both an increase in temperature and a decrease in space velocity. Also, GC-MS analyses showed that the lengths of the carbon chain of hydrocarbons and oxygenated hydrocar- bons decreased with an increase in the cracking temperature and a decrease in space velocity. Table 2 shows that the gas yield was large for the thermal conversion of canola oil. In the gas product itself, Tables 3(a) and 4(a) show respectively that the yields and concentrations of C,-C, olefins were high.
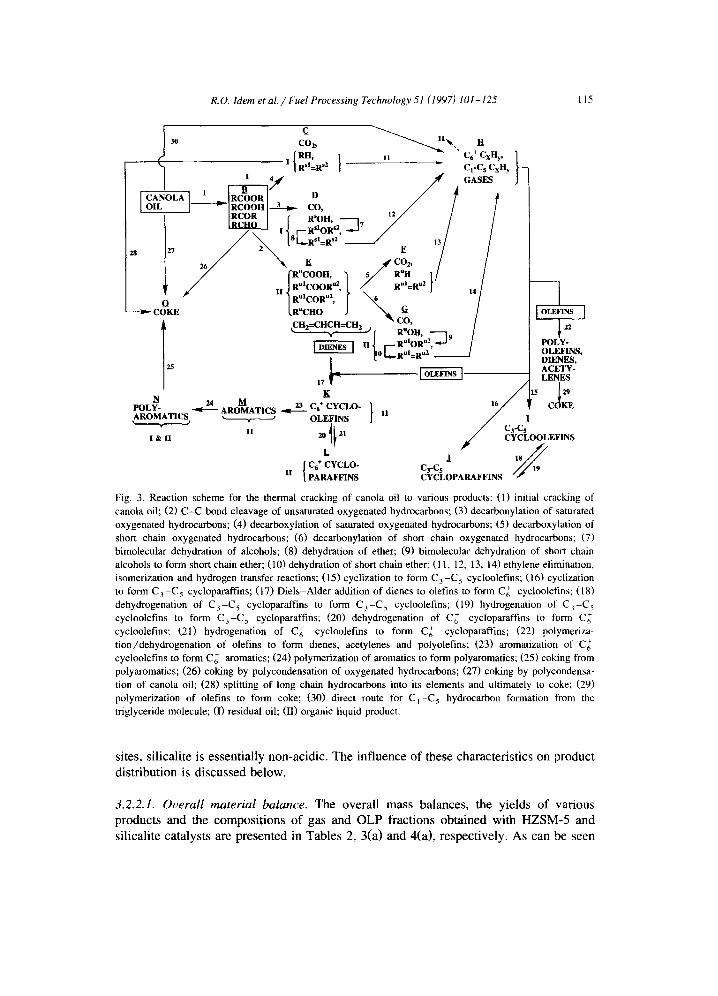
This observed product distribution for the thermal conversion of canola oil is consistent with the sequence of reaction steps developed in our earlier studies [24]. This scheme is given in Fig. 3. According to this scheme, the presence of large amounts of ethylene in the gas product results from its extensive elimination from hydrocarbon molecules during secondary cracking (steps 11-14 in Fig. 3). On the other hand, the production of hydrogen results from dehydrogenation reactions such as in the formation of cycloolefins (step 17) and aromatic hydrocarbons (step 23). The presence of hydrogen in the gas product suggests the net occurrence of dehydrogenation reactions (such as in steps 17, 22-24 and 26) instead of hydrogenation reactions. A net occurrence of dehydrogenation reactions is also responsible for the presence of large amounts of C,-C, olefins observed in the gas product.
This scheme indicates that the gas product is a combination of gaseous products obtained from decarboxylation and decarbonylation reactions (steps 3-6) as well as secondary cracking reactions (step 1 l- 14) involving the elimination of ethylene from hydrocarbon molecules. It also indicates that the OLP is obtained from reaction steps such as those labeled (II) in Fig. 3. This group includes oxygenated hydrocarbons and aliphatic hydrocarbons, cyclic aliphatic hydrocarbons and aromatic hydrocarbons. Fur- thermore, it indicates that residual oil is obtained from reaction steps 1, 3 and 5 (for oxygenated hydrocarbons and aliphatic hydrocarbons) and step 24 (for polyaromatic hydrocarbons) in addition to the unconverted canola oil.
When catalysts are used under conditions similar to those in empty reactor studies, any changes in the product distribution are the consequences of the presence of these catalysts and the modifications introduced by their characteristics in the above reaction scheme. As was stated earlier, the catalyst characteristics investigated are: (i) acidity, (ii) basicity, (iii> shape selectivity and (iv) surface area. The response of canola oil conversion and product distribution (i.e., response variables) to changes in these characteristics is discussed below.
3.2.2. Role of catalyst shape selectivity In the literature [2], the molecular sieving or shape selective characteristics of a
catalyst have been exploited to reform or restructure molecules to the sizes and shapes permitted by the pores of the catalyst. In most plant oil catalytic conversion studies [2,8,9,12,13], the catalysts used to typify these characteristics include HZSMJ and silicalite. As mentioned earlier, these two catalysts are both crystalline and are highly shape selective. However, while HZSM-5 contains strong Bronsted and some Lewis acid
R.O. Idem et al. / Fuel Processing Technology 51 (19971 101-125 I15
u co, R’OH.
GASES
1’ 1
‘(R”COOH, 1 5/ RUIi 11
-) c&E ~RUCHO 1 IG CH,=CHCH=CH,
POLE I(
AROMATICS 2 ARO%ATICS _u cg+ CYCLO-
II \ , * ’ OLEFINS I
II I & II CYCLOOLEFINS
L
II I
c,+ CYCLO- 1
cscs PARAFFINS CYCLOPARAFFINS
Fig. 3. Reaction scheme for the thermal cracking of canola oil to various products: (1) initial cracking of canola oil: (2) C-C bond cleavage of unsaturated oxygenated hydrocarbons; (3) decarbonylation of saturated oxygenated hydrocarbons; (4) decarboxylation of saturated oxygenated hydrocarbons; (5) decarboxylation of short chain oxygenated hydrocarbons; (6) decarbonylation of short chain oxygenated hydrocarbons; (7) bimolecular dehydration of alcohols; (8) dehydration of ether; (9) bimolecular dehydration of short chain alcohols to form short chain ether; (10) dehydration of short chain ether; (11, 12, 13, 14) ethylene elimination, isomerization and hydrogen transfer reactions; (15) cyclization to form C, -C, cycloolefins; (16) cyclization to form C, -C, cycloparaffins; (17) Diels-Alder addition of dienes to oletins to form Cl cycloolefins; (18) dehydrogenation of C, -C, cycloparaffins to form C, -C, cycloolefins; (19) hydrogenation of C,-Cs cycloolefins to form C,-C, cycloparaffins; (20) dehydrogenation of Cl cycloparaffins to form Cz cycloolefins; (21) hydrogenation of Cl cycloolefins to form Cl cycloparaffins; (22) polymeriza- tion/dehydrogenation of olefins to form dienes, acetylenes and polyolefins; (23) aromatization of Cl cycloolefins to form C,+ aromatics; (24) polymerization of aromatics to form polyaromatics; (25) coking from polyaromatics; (26) coking by polycondensation of oxygenated hydrocarbons; (27) coking by polycondensa- tion of canola oil; (28) splitting of long chain hydrocarbons into its elements and ultimately to coke; (29) polymerization of oletins to form coke; (30) direct route for C, -C, hydrocarbon formation from the triglyceride molecule; (I) residual oil; (II) organic liquid product.
sites, silicalite is essentially non-acidic. The influence of these characteristics on product distribution is discussed below.
3.2.2.1. Overall material balance. The overall mass balances, the yields of various products and the compositions of gas and OLP fractions obtained with HZSM-5 and silicalite catalysts are presented in Tables 2, 3(a) and 4(a), respectively. As can be seen
116 R.O. Idem et al. / Fuel Processing Technology 51 (1997) 101-125
from these tables, the type of products obtained with these catalysts (i.e., C,-C, hydrocarbon gases, aromatic and aliphatic hydrocarbons in the OLP fraction as well as coke and residual oil) were similar to those obtained for runs in the empty reactor (i.e., thermal cracking). However, in the case of catalytic runs, canola oil conversion and yields of coke, gas, OLP and residual oil obtained for runs with HZSM-5 were almost identical to those obtained with silicalite under corresponding temperatures and WHSV (Table 2). Also, it can be seen from Tables 3(a) and 4(a) that yields and compositions were similar for these two catalysts (i.e., HZSM-5 and silicalite).
On the other hand, a comparison of the material balances (Table 2), yields of products (Table 3(a)) and compositions of gas and OLP fractions (Table 4(a)) obtained for conversions over HZSM-5 and silicalite with those for the empty reactor shows a number of striking differences. For example, Table 2 shows that gas yields were higher for the empty reactor runs than for those over HZSM-5 and silicalite catalysts, especially at the higher reaction temperature of 500°C where the influence of thermal cracking on gas yield is large. On the contrary, the table shows that the yields of OLP obtained for runs with the two catalysts were higher than those for the empty reactor. A low gas yield together with a high OLP yield for the shape selective catalysts imply that there was only limited secondary cracking. In this case, secondary cracking was sufficient to produce hydrocarbon and oxygenated hydrocarbon molecules that fall within the liquid fraction but barely sufficient to produce gas molecules. Limited or mild secondary cracking of each long molecule may be attributed to the ability of long molecules to diffuse through the interconnecting pores of shape selective catalysts with only mini- mum C-C bond scission [2,30].
3.2.2.2. Gas composition and yields of aromatic hydrocarbons. A comparison of the compositions of the gas fractions obtained over HZSMJ or silicalite catalysts with those obtained for the empty reactor (Table 4(a)) at corresponding temperatures and equivalent space velocities (i.e., either WHSV or GHSV) shows that the fractions of ethylene and propylene as well as that of the total C,-C, oletins were larger for the empty reactor runs than those obtained for the two catalytic runs. In contrast, the fraction of C,-C, paraffins as well as the branched chain and total C, hydrocarbons were larger for runs over HZSM-5 and silicalite than for those obtained in the empty reactor under corresponding operating conditions. The formation of large amounts of C,-C, paraffins for the runs with HZSM-5 and silicalite catalysts can be explained on the basis of the preponderance of hydrogenation reactions during catalytic runs as compared to results obtained in an empty reactor [24,33,38,39].
Both Tables 3(a) and 4(a) show that the fraction of total aromatics obtained for runs over HZSM-5 and silicalite were larger than those in the empty reactor, especially at the lower reaction temperature of 400°C where thermal effects were small. Also, it is seen from these tables that there was a preponderance of benzene and toluene (C, and C, aromatics) in the OLP fraction obtained for the empty reactor runs. The fraction of aromatic hydrocarbons containing more than seven carbon atoms per molecule was small. In contrast, there was a selective production of C,-C, aromatic hydrocarbons in the OLP fraction obtained for runs with HZSM-5 and silicalite catalysts. The literature [17,22,36,37] shows that aromatic hydrocarbons are formed by the Diels-Alder addition
R.O. Idem et al./ Fuel Processing Technology 51 (1997) 101-125 I17
of a conjugated diene to an olefin (mostly C,--C, olefins) to form cycloolefins in the first instance (step 17 in Fig. 3). The subsequent dehydrogenation of the resulting cycloolefins (step 23) yields aromatic hydrocarbons. Thus, as compared to empty reactor products, the formation of larger yields of OLP and total aromatics for conversions over HZSM-5 and silicalite catalysts can be attributed to the larger extent of cyclization and aromatization reactions that occur within their pores.
The consequence of a large extent of aromatization is the reaction of large amounts of C,-C, olefinic gases and the resultant decrease in the concentration of these C2-C, olefins in the gas product as well as a decrease in the total gas yield itself (see Tables 3(a) and 4(a)). In addition, the hydrogen produced during these aromatization reactions is consumed almost completely in hydrogenation reactions (such as occur in steps 1 l- 14). These hydrogenation reactions are responsible for the production of the large amounts of C,-C, paraffins observed in the gas products for HZSM-5 and silicalite catalysts.
3.2.2.3. Mechanism of aromatic hydrocarbon formation from canola oil comersion. It was interesting to observe that thermal cracking alone (i.e., no catalyst) produced higher amounts of gaseous products as compared to those from catalytic runs with the two catalysts. Thermal cracking alone also produced fair amounts of aromatic hydrocarbons in the OLP.
The presence of aromatic hydrocarbons in the products obtained from thermal or catalytic cracking of canola oil implies that cyclization and aromatization reactions can take place both in the presence and absence of a catalyst. In the absence of a catalyst, aromatization is mainly due to thermal effects. The literature [22,24,36,37] shows that low molecular weight olefins (ethylene and propylene) and dienes (butadiene) react together in the absence of a catalyst to form aromatic hydrocarbons (mainly benzene and toluene) so long as the temperature is reasonably high (> 300°C).
On the other hand, it has been shown in the literature [38,39] that the presence of strong Bronsted acid sites in a catalyst (such as HZSM-5) enables the oligomerization of ethylene and propylene to form C,-C,, olefins which then undergo dehydrogenation to form diolefins (or dienes). The addition of olefins to dienes, followed by cyclization and further dehydrogenation results in the formation of aromatic hydrocarbons. In the case of formation of aromatic hydrocarbons from conversion of canola oil, both the olefins and dienes are present in the reaction system from the initial thermal decomposition (see for example steps 1 1 - 14 and 2 for the formation of ethylene and butadiene as well as longer chain olefins and dienes, respectively).
3.2.2.4. Molecular sieving effect of HZSM-5 and silicalite. It appears that the aromatic hydrocarbons obtained from canola oil over HZSM-5 and silicalite catalysts can be much larger than C, aromatic hydrocarbons as a result of the limited secondary cracking and the resulting long chain olefins and dienes obtained with these catalysts. However, the aromatic hydrocarbons observed in the OLP fraction for HZSM-5 and silicalite catalysts were essentially in the C,-C, range. This selective production of C,-C, aromatic hydrocarbons is due principally to the influence exerted on the reaction scheme by the molecular sieving characteristic of these catalysts [2,12,13]. This characteristic
118 R.O. Idem et al. / Fuel Processing Technology 51 (1997) 101-125
ensures that molecules that are structurally larger than the pore size of the catalyst will undergo dealkylation in order to be accommodated within the pores. The literature [30] indicates that, in general, the size of aromatic hydrocarbon molecules that can diffuse through the pores of HZSM-5 and silicalite is < C ,a.
Dealkylation results in the formation of hydrocarbon molecules in the gas product (typically C, hydrocarbons such as propane and propylene and C, hydrocarbons such as isobutane and normal butane). However, the formation of a larger fraction of branched chain C, hydrocarbons in the gas fraction obtained with HZSM-5 and silicalite catalysts (as compared with that produced from the empty reactor) can be attributed principally to the larger extent of hydrogen transfer and isomerization reactions that take place in the pores of these catalysts.
3.2.2.5. Modifications in the thermal reaction scheme due to the presence of HZSM-5 or silicalite. As was discussed previously, there is a large similarity in the conversions and product distributions obtained with HZSM-5 and silicalite catalysts. However, there are a number of significant differences between the performance of these catalysts when compared with that of the empty reactor. This shows that major modifications have been introduced in the reaction scheme given earlier in Fig. 3 as a result of the presence of these catalysts. These are: (i) the possibility of only limited or mild secondary cracking resulting in low gas yield and (ii) the increase in the extents of (a) cyclization and aromatization reactions (steps 17 and 23), (b) isomerization reactions (steps 1 l- 14), (c) hydrogenation reactions (steps 1 l- 14) and (d) dealkylation reactions. However, when the acid and shape selective characteristics of the catalysts are considered along with these results, it appears that the shape selective or molecular sieving characteristic is the dominant factor in these modifications.
3.2.3. Role of catalyst shape selectivity in the absence of acid sites Test runs were conducted using silica and silicalite in order to evaluate the role of
shape selectivity of the catalyst on product distribution devoid of the effect of catalyst acidity. Silica was selected to represent a non-acidic, amorphous and non-shape selective catalyst whereas silicalite was selected to represent a non-acidic but crystalline and shape selective catalyst.
3.2.3.1. Overall material balance and gas composition for silica and silicalite. The overall mass balances, the yields of various products and the compositions of gas and OLP fractions obtained over silica and silicalite catalysts are presented in Tables 2, 3(a) and 4(a), respectively. Table 2 shows that canola oil conversion and the yield of gas were larger with silica than silicalite. On the contrary, the yield of the OLP fraction was larger with silicalite than with silica for corresponding temperatures and space velocities. A comparison of the compositions of the gas fractions (Table 4(a)) shows that the fractions of ethylene and propylene as well as those for the total C,-C, olefins and straight chain C, hydrocarbons were larger for runs with silica than for silicalite. Conversely, both the C,-C, paraffins and the branched chain C, hydrocarbon fractions were larger for runs over silicalite than for those with silica. As was shown earlier, these
R.O. Idem et al./Fuel Processing Technology 51 (1997) 101-125 I19
results for test runs with silicalite catalyst are indications of the large extents of hydrogenation and isomerization reactions that occur within its pores.
3.2.3.2. OLP and aromatic hydrocarbons for silica and silicalite. Both Tables 3(a) and 4(a) show that the total aromatic hydrocarbon fractions obtained for runs over silicalite were larger than those for silica, especially at the lower reaction temperature of 400°C where thermal effects are small. Also, as in the case for thermal cracking runs, there was a preponderance of benzene and toluene (C, and C, aromatics) in the OLP fraction obtained for silica (Table 4(a)). In contrast, there was a selective production of C,-C, aromatic hydrocarbons in the OLP fraction obtained for runs with silicalite catalyst. The formation of larger yields of OLP and total aromatic hydrocarbons for conversions over silicalite catalysts can be attributed respectively to mild secondary cracking and the large extent of cyclization and aromatization reactions that take place within the pores of silicalite. On the other hand, the selective production of C,-C, aromatic hydrocarbons for silicalite is due to the high shape selectivity exhibited by silicalite.
3.2.3.3. Residual oil. Table 2 shows that canola oil conversions and the yields of gas and OLP fractions obtained for thermal runs were less than those obtained with silica. In this work, residual oil is regarded as “unconverted canola oil” for the purpose of estimating the conversion of canola oil. Thus, a low canola oil conversion implies a large yield of residual oil. However, earlier studies [24] as well as the present work have shown that the residual oil is actually a mixture composed of long chain hydrocarbon and oxygenated hydrocarbon molecules and contains only a small amount of unconverted canola oil. These long chain hydrocarbon and oxygenated hydrocarbon molecules are the products obtained from the initial decomposition of canola oil (as shown in steps 1, 3 and 4) which have not yet undergone subsequent secondary cracking (steps 1 l- 14) to produce materials whose boiling points would place them either in the gas or OLP fraction. Thus, the large yields of gas and OLP show that secondary cracking is facilitated by the amorphous pore structure of silica or silica itself. It shows that even though silica is not a typical acid catalyst, it has a pore structure that will not permit a long molecule (such as long chain fatty acids and hydrocarbons obtained from primary cracking) to diffuse through without undergoing C-C bond scission.
3.2.4. Role of catalyst acidity Three acidic catalysts: namely. HZSM-5, silica-alumina and y-alumina were used to
evaluate the actual role of acidity on the product distribution obtained from the conversion of canola oil. The results were also compared with those obtained with the empty reactor.
3.2.4.1. Perjkwmance evaluation studies. The overall mass balances, the yields of various products and the compositions of gas and OLP fractions obtained with these catalysts are given in Tables 2, 3(a) and 4(a), respectively. Tables 2, 3(b) and 4(b) show that canola oil conversion, yields of various products and compositions of both the gas and OLP fractions obtained for runs with silica-alumina catalyst were almost identical to those obtained for y-alumina catalyst. On the other hand, canola oil conversion,
120 R.O. Idem et al/Fuel Processing Technology 51 (1997) 101-125
yields of various products and compositions of both the gas and OLP fractions obtained for runs with HZSM-5 (an acidic and shape selective catalyst) were completely different from those for silica-alumina and y-alumina (both acidic but not shape selective catalysts). This is discussed below.
3.2.4.2. Gas composition. A comparison of the compositions of the gas fractions obtained for various catalysts (Table 4(b)) shows that ethylene, total C,-C, olefins and the straight chain C, hydrocarbon fractions in the gas product were larger for silica- alumina and y-alumina catalysts than those obtained for HZSM-5 catalyst. In contrast, the fractions of both the C,-C, paraffins and the branched chain C, hydrocarbons were larger for runs with HZSM-5 than those for silica-alumina or y-alumina. These results show that there was a larger involvement of hydrogenation and isomerization reactions with HZSM-5 than with silica-alumina or y-alumina. This is consistent with reports in the literature [24,35] which suggest that, apart from acidity, shape selectivity is the major factor responsible for the large hydrogenation and isomerization activities of HZSM-5 catalyst.
Also, Table 2 shows that the gas yields for HZSM-5 catalyst were lower than those obtained for silica-alumina, y-alumina or empty reactor. The low gas yield for HZSM-5 can be attributed to both limited secondary cracking and a high degree of aromatization reactions that occur within its pores. A higher degree of aromatization reactions results in the consumption of large amounts of C,-C, olefinic gases to produce more OLP and the consequent decrease in the concentrations of these C,-C, olefin gases in the gas product as well as a decrease in the total gas yield itself. This implies that conversions over HZSM-5 catalyst will result in the production of high OLP yields, as can be seen in Table 2. Furthermore, the hydrogen produced during these aromatization reactions is consumed almost completely in hydrogenation reactions (such as occur in steps 1 l- 14). This is responsible for the production of large amounts of C,-C, paraffins in the gas product for runs with HZSM-5 catalyst (see Table 4(b)) [38,39] as compared to those for silica-alumina and y-alumina.
3.2.4.3. Aromatic hydrocarbon content of the OLP. Tables 2 and 3(a and b) show that HZSM-5 catalyst gave high yields of OLP and aromatic hydrocarbons as compared to those obtained for silica-alumina, y-alumina or empty reactor. The aromatic hydrocar- bons included those in the range C,-C,,. However, Table 4(a) shows that for HZSM-5 catalyst, C,-C, aromatic hydrocarbons formed a major proportion of the aromatic hydrocarbons. In contrast, benzene and toluene (i.e., C, and C, aromatic hydrocarbons) formed the major proportion of aromatic hydrocarbons obtained for silica-alumina, -y-alumina or empty reactor (Table 4(a and b)). Thus, as was discussed earlier, the formation of large yields of OLP and total aromatic hydrocarbons over HZSMJ is due to limited secondary cracking as well as a large degree of cyclization and aromatization reactions that occur within its pores. On the other hand, the selective production of mainly the C,-Cg aromatic hydrocarbons for HZSM-5 and not for silica-alumina or y-alumina catalysts is due to a combination of two effects. These are: the mild secondary cracking (to produce long chain olefins and dienes) and the molecular sieving characteristics of HZSM-5 catalyst. Since the catalysts under consideration (namely;
R.O. Idem et al./ Fuel Processing Technology 51 (19971 101-125 121
HZSM-5, silica-alumina and y-alumina) contained both Bronsted and Lewis acid sites [2,12,13,30-321) the results imply that the acidity of the catalyst does not determine product selectivity.
3.2.4.4. Comparison of performance of silica-alumina and y-alumina with that in the empty reactor. As was discussed earlier, the presence of aromatics in the products obtained from both thermal or catalytic cracking of canola oil implies that cyclization and aromatization reactions can take place both in the presence or absence (empty reactor) of a catalyst. These catalysts could be acidic or non-acidic and shape selective or non-shape selective. Also, as was shown earlier, the presence of aromatic hydrocar- bons in the product is due to thermal effects. Thus, the similarity in product distribution between silica-alumina and y-alumina catalysts and the empty reactor shows clearly that acidity is not a major factor in cyclization and aromatization reactions involving canola oil as feed.
However. the higher yields of aromatic hydrocarbons for runs with silica-alumina and y-alumina (acid catalysts) as compared to silica (a non-acid catalyst) and the empty reactor show that the only significant contribution of catalyst acidity to the modification of the thermal cracking scheme (Fig. 3) is that of increasing the extent of aromatization process.
3.2.5. Role of catalyst basic@ Test runs over calcium oxide and magnesium oxide catalysts as well as those for the
empty reactor were used to evaluate the role of basic sites on the product distribution. The overall mass balances, the yields of various products and the compositions of gas
and OLP fractions obtained over calcium oxide and magnesium oxide are shown in Tables 2, 3(b) and 4(b), respectively and those for thermal runs in Tables 2, 3(a) and 4(a), respectively. These results also show that similar products were obtained for runs with basic catalysts as in the empty reactor. However, the canola oil conversions and yields of coke, gas, OLP and residual oil obtained with calcium oxide and magnesium oxide were quite different than those obtained for empty reactor.
It was interesting to observe that the yields of residual oil were larger for runs with calcium oxide and magnesium oxide than those for the empty reactor. It is seen from the results that the yields of gas and OLP were low for calcium oxide and magnesium oxide as a result of the large yields of residual oil. Also, from our definition, canola oil conversions are low for runs with calcium oxide and magnesium oxide because the yields of residual oil are high. The large yields of residual oil obtained in the case of the basic catalysts can be explained as follows.
GC-MS analyses showed that the residual oil obtained for runs with calcium oxide and magnesium oxide was composed essentially of long chain hydrocarbons and oxygenated hydrocarbons. These heavy molecules were obtained from the initial decom- position of canola oil (see steps 1, 3 and 4 in Fig. 3). Thus, although canola oil could undergo this initial thermal decomposition to produce long chain hydrocarbons and oxygenated hydrocarbons, subsequent decomposition or secondary cracking of these heavy molecules (steps 2, 11-14) appeared to be inhibited by the presence of basic sites in the catalyst. Thus, the inhibition of secondary cracking is responsible for the
122 R.O. Idem et al/Fuel Processing Technology 51 (1997) 101-125
formation of large amounts of residual oil and only small amounts of gas and OLP. The literature [28] has also shown that 82.7-94.6% of the total product obtained in the case of destructive distillation of palm oil using calcium oxide were long chain saturated and unsaturated hydrocarbons and ketones.
It was also interesting to observe that there was a difference between canola oil conversions and yields of residual oil for calcium oxide and those for magnesium oxide. Table 2 shows that canola oil conversions were higher for runs with magnesium oxide than for calcium oxide. Conversely, residual oil yields were lower for runs with magnesium oxide than for calcium oxide. These results show that the degree of secondary cracking inhibition was higher for runs with calcium oxide than for magne- sium oxide. A higher degree of secondary cracking inhibition (resulting in lower conversions) for calcium oxide can be attributed to the presence of stronger basic sites in calcium oxide than in magnesium oxide.
3.2.6. Role of catalyst sur$ace area It is desirable to evaluate the role of catalyst surface area in the product distribution
obtained from the catalytic conversion of canola oil in the absence of the influence of both catalyst acidity and shape selectivity. This was achieved by using catalysts with a contrasting set of surface area, acidity and shape selectivity characteristics for the test runs to determine the role of catalyst surface area. The catalysts used for this evaluation were: silica (non-shape selective, non-acidic, surface area of 211 m* g-l), silicalite (shape selective, non-acidic, BET surface area of 401 m* g-l), y-alumina (non-shape selective, acidic, BET surface area of 241 m* g- ‘), silica-alumina (non-shape selective, acidic, BET surface area of 321 m* g-l), magnesium oxide and calcium oxide (basic, non-shape selective and BET surface areas of 27 and 7 m* g- ‘, respectively).
Canola oil conversions and yields of various products for these catalysts are presented in Fig. 4(a and b) for test runs carried out at 500 and 400°C respectively. These figures show that for silica-alumina and y-alumina catalysts (amorphous and with acid sites), the canola oil conversions are about the same even though silica-alumina has a much higher BET surface area (327 m* g- ‘) than y-alumina (241 m* g-l). On the other hand, in the case of silica and silicalite catalysts (silica being non-acidic and non-shape selective and silicalite being shape selective and also non-acidic), silica has canola oil conversions greater than silicalite even though it has a lower BET surface area. These observations strongly suggest that the surface area of the catalysts does not determine the level of conversion of canola oil. As was shown earlier, the difference in canola oil conversions and product yields for different catalysts are mainly due to the difference in their pore structures and shape selectivities and not on account of their surface areas [12,13].
On the other hand, Fig. 4(a and b) show that the canola oil conversions for runs with magnesium oxide were higher than those with calcium oxide. This appears to indicate that it is the lower surface area of calcium oxide that contributed to its greater degree of secondary cracking inhibition when compared with magnesium oxide. On the other hand, Fig. 4b shows that at 400°C (where thermal effects are small), canola oil conversion was higher for the empty reactor run than for runs with either calcium oxide or magnesium oxide. Thus, when these results for both magnesium oxide and calcium

R.O. Idem et al./ Fuel Processing Technology 51 (19971 101-125
v - Si-1 Si-2 Al-l G-AI cao MgO ER
Catalyst
k
=3 20 8 ‘I 8 g 0 6 Si-1 G-2 Al-l Si-AI CaO MgO ER
Catalyst
Fig. 4. Canola oil conversions and yields of various products for silicalite, silica, silica-alumina, y-alumina, calcium oxide and magnesium oxide and the empty reactor: (a) reaction at 500°C; (b) reaction at 400°C: WHSV = 12.1 h-’ for all catalysts, GHSV = 15.4 hh’ for empty reactor, Si-1 = silicalite, Si-2 = silica, Al- I = y-alumina, Si-AI = silica-alumina. CaO = calcium oxide, MgO = magnesium oxide, ER = empty reactor.
oxide are compared with that in the empty reactor (with essentially no surface area), it becomes apparent that secondary cracking is independent of the surface area of the catalyst. This confirms that it is the presence of strong basic sites in calcium oxide that is responsible for its low canola oil conversions.
124 R.O. Idem et al. / Fuel Processing Technology 51 (1997) 101-125
4. Conclusions
1. The results show that aromatic hydrocarbons are produced from canola oil even in the absence of a catalyst (i.e., in an empty reactor).
2. The structure and size of any product obtained from the catalytic conversion of canola oil is determined principally by the shape selective characteristic of the catalyst.
3. The uniform pore structure and shape selective characteristics of a catalyst permit mild cracking which results in the production of a large amount of OLP and a small amount of gas. On the other hand, the amorphous pore structure and non-shape selective characteristic of a catalyst facilitates secondary cracking. This results in large canola oil conversions and large gas yields.
4. The presence of basic centers in a catalyst inhibits the decomposition of long chain hydrocarbons and oxygenated hydrocarbons resulting in the formation of a small amount of gas and a large amount of residual oil.
Acknowledgements
The financial support provided by the Saskatchewan Canola Development Commis- sion (SCDC) and the Agricultural Development Fund (ADF) both of Saskatchewan, Canada is gratefully acknowledged.
References
[l] Waddams, A.L. Chemicals from Petroleum, Gulf Publishing Co, Houston, 1980. [2] Weisz, P.B., W.O. Haag and PG. Rodewald, Science, 206 (1979) 57-58. [3] Milne, T.A., R.J. Evans and J. Filly, in A.V. Bridgewater and J.L. Kuester (Ed%), Research in
Thermochemical Biomass Conversions, Elsevier Applied Science, London, 1988, pp 910-926. [4] Campbell, I., Biomass, Catalysis and Liquid Fuels, Holt, Rienhart and Winston, London, 1983. [5] Baker, E.G. and D.C. Elliott, in A.V. Bridgewater (Ed.), Research in Thermochemical Biomass
conversion, Elsevier Applied Science, London, 1987, pp 883-895. [6] Craig, W., E. Coxworth and J. Saddler, in S. Hagnain (Ed.), Proceedings of the Fifth Canadian Biomass
R and D Seminar, Elsevier Applied Science, London, 1984, pp 143-146. [7] Boocock, D.G.B., S.K. Konar, A. Mackay, P.T.C. Chang and J. Lin, Fuel, 71 (1992) 1291-1297. [8] Prasad, Y.S., N.N. Bakhshi, J.F. Mathews and R.L. Eager, Can. J. Chem. Eng., 64 (1986) 278-284. [9] Prasad, Y.S., N.N. Bakhshi, J.F. Mathews and R.L. Eager, Can. J. Chem. Eng., 64 (19861 285-292.
[lo] Craig, W. and E. Coxworth, in C. Ganger (Ed.), Proceedings of the Sixth Canadian Bioenergy R and D Seminar, Elsevier Applied Science, London, 1987, pp 407-411.
[ll] Chantal, P.S., S. Kaliaguine, J.L. Grandmaison and A. Mahay, Appl. Catal., 10 (1984) 317-332. [12] Katikaneni, S.P.K., J.D. Adjaye and N.N. Bakhshi, Can. J. Chem. Eng., 73 (1995) 484-497. [13] Katikaneni, S.P.K., J.D. Adjaye and N.N. Bakhshi, Energy Fuels, 9 (1995) 599-609. [14] Adjaye, J.D. and N.N. Bakhshi, Biomass Bioenergy, 8 (1995) 131-149. [15] Sharma, R.K. and N.N. Bakhshi, Fuel Proc. Technol., 27 (1991) 113-130. [16] Nawar, W.W., J. Agric. Food Chem., 17 (1969) 18-21. [17] Alencar, J.W., P.B. Alves and A.A. Craveiro, J. Agric. Food Chem., 31 (1983) 1268-1270. [18] Chang, C.C. and S.W. Wan, Ind. Eng. Chem., 39 (1947) 1543-1548.
R.O. Idem er al./ Fuel Processing Technology 51 (1997) 101-125 125
[19] Egloff, G. and J.C. Morrell, Ind. Eng. Chem., 24 (1932) 1426-1427. [20] Egloff, G. and E.F. Nelson, Ind. Eng. Chem., 25 (1933) 386-387. [21] Lipinsky, E.S., D. Anson, J.R. Longanbach and M. Murphy, J. Amer. Oil Chem. Sot., 62 (1985)
940-942. [22] Schwab, A.W., G.J. Dykstra, E. Selke, S.C. Sorenson and E.H. Pryde, J. Amer. Oil Chem. Sot., 65
(1988) 1781-1786. [23] Crossley, A., T.D. Heyes and B.J.F. Hudson, J. Amer. Oil Chem. Sot., 3 (1962) 9-14. [24] Idem, R.O., S.P.R. Katikaneni and N.N. Bakhshi, Energy Fuels., 1996 (in press). [25] Katikaneni, S.P.R.. J.D. Adjaye, R.O. Idem and N.N. Bakhshi, Ind. Eng. Chem. Res., 35 (1996)
3332-3346. [26] Billaud, F., V. Dominguez, P. Broutin and C. Busson, J. Amer. Oil Chem. Sot., 72 (1995) I 149-1154. 1271 Gillet-Dominguez, V., Ph.D. Thesis, INPL-ENSIC, University of Nancy, 1994. [28] Craveiro, A.A., F.J.A. Mathos, J.W. Alencar and E.R. Silveira, Energy Fontes Altemativas, 3 (1981)
44-49. [29] Chen, N.Y., J.N. Miale and W.J. Reagan, US Patent No. 4 112056, 1973. [301 Bhatia, S., Zeolite catalysis: Principles and applications, CRC Press, Boca Raton, FL, 1990. 1311 Shen, Y., S.L. Suib, M. Deeba and G.S. Koermer, J. Catal.. 146 (1994) 483-490. [321 Kania, W. and K. Jurczyk, Appl. Catal., 61 (1990) 27. [331 Rase, H.W., Chemical reactor design for process plants, Vol I: Principles and techniques, Wiley, New
York, 1977. [341 Froment, G.F. and K.B. Bischoff, Chemical reactor analysis and design, Wiley, New York. 1979. 1351 Pine, L.A., P.J. Maher and W.A. Wachter, J. Catal., 85 (1983) 446-476. [36] Michael, W.R., J.C. Alexander and N.R. Artman, Lipids, 5 (1966) 353-357. [371 Sarkai, T., D. Nehara and T. Kunugi. in L.F. Albright and B.L. Ceryness (Eds.), Industrial and
Laboratov Pyrolysis, American Chemical Society Symp. Ser., 1976, pp 32. [381 Lukyanov, D.B., N.S. Gnep and M.R. Guisnet, Ind. Eng. Chem. Res., 34 (1995) 516-523. 1391 Lukyanov, D.B., N.S. Gnep and M.R. Guisnet, Ind. Eng. Chem. Res., 33 (1994) 223-234.
Copyright © 2022 FDOKUMEN


![Polyoxometalates with Internal Cavities: Redox Activity, Basicity, and Cation Encapsulation in [X n + P 5 W 30 O 110 ] (15 - n ) - Preyssler Complexes, with X = Na + , Ca 2+ , Y](https://static.fdokumen.com/doc/165x107/633563c6cd4bf2402c0b0fc5/polyoxometalates-with-internal-cavities-redox-activity-basicity-and-cation.jpg)