EFFECT OF CHEMICAL INTERESTERIFICATION ON PHYSICOCHEMICAL PROPERTIES AND INDUSTRIAL APPLICATIONS OF...
20
EFFECT OF CHEMICAL INTERESTERIFICATION ON PHYSICOCHEMICAL PROPERTIES AND INDUSTRIAL APPLICATIONS OF CANOLA OILAND FULLY HYDROGENATED COTTONSEED OIL BLENDS ANA PAULA BADAN RIBEIRO 1,3 , RODRIGO CORRÊA BASSO 1 , RENATO GRIMALDI 1 , LUIZ ANTONIO GIOIELLI 2 and LIRENY APARECIDA GUARALDO GONÇALVES 1 1 Food Technology Department Faculty of Food Engineering State University of Campinas – UNICAMP C.P. 6041, 13083-970 Campinas, SP, Brazil 2 Department of Biochemical and Pharmaceutical Technology Faculty of Pharmaceutical Sciences University of São Paulo – USP São Paulo, SP, Brazil Submitted for Publication March 1, 2009 Revised Received and Accepted May 20, 2009 ABSTRACT Blends of canola oil (CO) and fully hydrogenated cottonseed oil (FHCSO), with 20, 25, 30, 35 and 40% FHCSO (w/w) were interesterified under the following conditions: 0.4% sodium methoxide, 500 rpm stirring, 100C, 20 min. The original and interesterified blends were examined for triacylglycerol composition, melting point, solid fat content (SFC) and con- sistency. Interesterification caused considerable rearrangement of triacylglyc- erol species, reduction of trisaturated triacylglycerol content and increase in disaturated-monounsaturated and monosaturated-diunsaturated triacylglyc- erols in all blends, resulting in lowering of respective melting points. The interesterified blends showed reduced SFC at all temperatures and more linear melting profiles if compared with the original blends. Consistency, expressed as yield value, significantly decreased after the reaction. Iso-solid curves indicated eutectic interactions for the original blends, which were eliminated after randomization. The 80:20, 75:25, 70:30 and 65:35 (w/w) CO: FHCSO interesterified blends showed characteristics which are appropriate for their 3 Corresponding author. TEL: +55-19-32891186; FAX: +55-19-32891186; EMAIL: badanribeiro@ yahoo.com.br Journal of Food Lipids 16 (2009) 362–381. All Rights Reserved. © 2009, Wiley Periodicals, Inc. 362
Transcript of EFFECT OF CHEMICAL INTERESTERIFICATION ON PHYSICOCHEMICAL PROPERTIES AND INDUSTRIAL APPLICATIONS OF...

jfl_1152 362..381
EFFECT OF CHEMICAL INTERESTERIFICATION ONPHYSICOCHEMICAL PROPERTIES AND INDUSTRIAL
APPLICATIONS OF CANOLA OIL AND FULLY HYDROGENATEDCOTTONSEED OIL BLENDS
ANA PAULA BADAN RIBEIRO1,3, RODRIGO CORRÊA BASSO1,RENATO GRIMALDI1, LUIZ ANTONIO GIOIELLI2 and
LIRENY APARECIDA GUARALDO GONÇALVES1
1Food Technology DepartmentFaculty of Food Engineering
State University of Campinas – UNICAMPC.P. 6041, 13083-970Campinas, SP, Brazil
2Department of Biochemical and Pharmaceutical TechnologyFaculty of Pharmaceutical Sciences
University of São Paulo – USPSão Paulo, SP, Brazil
Submitted for Publication March 1, 2009Revised Received and Accepted May 20, 2009
ABSTRACT
Blends of canola oil (CO) and fully hydrogenated cottonseed oil(FHCSO), with 20, 25, 30, 35 and 40% FHCSO (w/w) were interesterifiedunder the following conditions: 0.4% sodium methoxide, 500 rpm stirring,100C, 20 min. The original and interesterified blends were examined fortriacylglycerol composition, melting point, solid fat content (SFC) and con-sistency. Interesterification caused considerable rearrangement of triacylglyc-erol species, reduction of trisaturated triacylglycerol content and increase indisaturated-monounsaturated and monosaturated-diunsaturated triacylglyc-erols in all blends, resulting in lowering of respective melting points. Theinteresterified blends showed reduced SFC at all temperatures and more linearmelting profiles if compared with the original blends. Consistency, expressedas yield value, significantly decreased after the reaction. Iso-solid curvesindicated eutectic interactions for the original blends, which were eliminatedafter randomization. The 80:20, 75:25, 70:30 and 65:35 (w/w) CO: FHCSOinteresterified blends showed characteristics which are appropriate for their
3 Corresponding author. TEL: +55-19-32891186; FAX: +55-19-32891186; EMAIL: [email protected]
Journal of Food Lipids 16 (2009) 362–381. All Rights Reserved.© 2009, Wiley Periodicals, Inc.362

application as soft margarines, spreads, fat for bakery/all-purpose shorten-ings, and icing shortenings, respectively.
PRACTICAL APPLICATIONS
Recently, a number of studies have suggested a direct relationshipbetween trans isomers and increased risk of vascular disease. In response,many health organizations have recommended reducing consumption of foodscontaining trans fatty acids. In this connection, chemical interesterificationhas proven the main alternative for obtaining plastic fats that have low transisomer content or are even trans isomer free. This work proposes to evaluatethe chemical interesterification of binary blends of canola oil and fully hydro-genated cottonseed oil and the specific potential application of these interes-terified blends in food products.
INTRODUCTION
Most natural oil and fat present limited application in their unalteredforms, which is imposed by their particular composition in fatty acids andtriacylglycerols. Because of the increasing concern about the nutritionalimpact of trans fatty acids on health, interesterification has become the mainmethod for the preparation of plastic fat with low trans isomer contents or evenwith the absence of these compounds. In the interesterification reaction, fattyacids remain unaltered, although they are redistributed in the triacylglycerolmolecules. Therefore, the process consists of simultaneous breakage of exist-ing ester bonds and formation of new bonds in glycerol molecules. In contrastwith partial hydrogenation, interesterification does not cause double-bondisomerization of fatty acids and does not affect their degree of saturation(Rousseau and Marangoni 2002). Thus, chemical interesterification alters thetriacylglycerol composition of any given oil or fat and, consequently, changestheir physical properties, crystallization and fusion behaviors, solid fat content(SFC), and polymorphic texture and behavior, hence contributing to a betteravailability of oil fractions to be used in food products (Dian et al. 2007).
Several studies have investigated the influence of chemical interesterifi-cation on physico-chemical properties of oils and fats or their blends (Ghotraet al. 2002). In particular, interesterification of blends of fully hydrogenatedvegetable oils (hardfats) with liquid oils currently represents the most versatileoption for the production of zero trans fats for many industrial purposes(Karabulut et al. 2004; Khatoon and Reddy 2005). Systems that are composedof raw materials of widely varied compositions provide good heterogeneity
363IDENTIFICATION OF CANOLA OIL AND HYDROGENATED COTTONSEED OIL

with regard to triacylclycerol species and, consequently, can produce interes-terified fats with substantially modified physico-chemical properties. In thisregard, canola oil (CO) stands out among vegetable oils mainly because of itsnutritional qualities, given that it is characterized by low saturated fatty acidcontent and a high oleic acid content of over 60%, which has a neutral effecton the plasma levels of total cholesterol, hence being of particular interest forproduction of special fats. Fully hydrogenated cottonseed oil (FHCSO) pos-sesses desirable properties for production of interesterified fat bases, for beingnonatherogenic with stearic acid as its predominant fatty acid and, therefore,for having no adverse effect on the risk for cardiovascular diseases (Hunter2005). Moreover, FHCSO is characterized by its considerable palmitic acidcontent (20–25%), known as the promoter of polymorphic form b′, whichcontributes to the attainment of better consistency, plasticity and aerationcharacteristics (Ghotra et al. 2002).
A comprehensive understanding of the functions and properties of fatsproduced by interesterification is pre-eminent for outlining their applicationsand attaining food products with specific attributes, particularly when thereplacement of partially hydrogenated fats is considered. The satisfactoryperformance of a given fat depends on important factors that determine itsapplication. These include, first, stability during and after processing and totaloil base compatibility with the product to which it is destined. Besides, func-tional characteristics such as plasticity and spreadability must be taken intoaccount in the development of a new formulation. Therefore, the study of theapplication of interesterified fats in margarines, shortenings and other high fatproducts must be based mainly on the understanding of the relations amongparameters such as triacylglycerol composition, melting point, solid profileand consistency (O’Brien 2004).
The objective of this work was to evaluate the chemical interesterificationof binary CO:FHCSO blends, with FHCSO contents of 20, 25, 30, 35 and40%, aiming at the study of fat bases to be used in food products. Triacylg-lycerol composition results, melting point, SFC, iso-solid diagram, and con-sistency were analyzed before and after randomization.
MATERIALS AND METHODS
Raw Materials
Refined CO, acquired at the local market (Campinas, São Paulo, Brazil),and FHCSO, kindly provided by a regional industry (Mairinque, São Paulo,Brazil), were used. The catalyst consisted of 99% sodium methoxide powder(Sigma-Aldrich, São Paulo, Brazil).
364 A.P.B. RIBEIRO ET AL.

Blends
Blends were prepared in the proportions of 80:20, 75:25, 70:30, 65:35,and 60:40 of CO:FHCSO (w/w), melted at 100C and homogenized over10 min at this temperature for full melting of the crystals, prior to eachinteresterification reaction.
Chemical Interesterification
For reactions, a borosilicate-glass jacketed reactor (500 mL) was used,with bottom outlet and emery-polished conical joints, coupled to: recirculatingthermostatized bath (Lauda RE 212, -30 to +200C, �0.02C), agitation system(universal motor with electronic speed variator up to 4,000 rpm – Marconi,BR) with axial-flow agitation shaft, vacuum pump (vacuubrand model 30,diaphragm pump), and digital skewer type thermometer (-50 to +300C, �1C– Incoterm). Samples (200 g) were dried in the reactor, under vacuum andagitation of 500 rpm, at 100C, for 20 min. The catalyst content used was equalto 0.4% and reaction was conducted under vacuum, at 100C, with agitationof 500 rpm over a 20-min period, according to optimization performed byGrimaldi et al. (2005). Reaction was finalized through the addition of distilledwater and 5% citric acid solution, and interesterified samples were carefullywashed with distilled water (80C), for the removal of soaps, and subsequentlydried under vacuum, at 110C, for 30 min.
Fatty Acid Composition
Analyses of fatty acid composition were performed in a capillary gaschromatograph (CGC Agilent 6850 Series GC System – Santa Clara, CA) afteresterification using the method of Hartman and Lago (1973). The fatty acidmethyl esters were separated according to AOCS (2004) procedure 2–66 in aDB – 23 Agilent capillary column (50% cyanopropyl-methylpolysiloxane),dimensions 60 m, f int: 0.25 mm, 0.25 mm film. Oven temperature was 110C-5 min, 110–215C (5C/min), 215C-24 min; detector temperature: 280C; injec-tor temperature 250C; carrier gas: helium; split ratio 1:50; injection volume:1.0 mL. Qualitative composition was determined by comparing peak retentiontimes with the respective standards for fatty acids.
Triacylglycerol Composition
The triacylglycerol composition analysis was performed using a capillarygas chromatograph (CGC) Agilent 6,850 Series GC System. A capillarycolumn (50% phenyl-methylpolysiloxane, 15 m in length ¥ 0.25 mm in inter-nal diameter, and 0.15 mm film) DB-17HT from Agilent (Santa Clara, CA,U.S.A.) was used. Conditions were as follows: split injection, ratio of 1:100;
365IDENTIFICATION OF CANOLA OIL AND HYDROGENATED COTTONSEED OIL

column temperature: 250C, programmed up to 350C at 5C/min; carrier gas:helium, flow rate of 1.0 mL/min; injector temperature: 360C; detector tem-perature: 375C; volume injected: 1.0 mL; sample concentration: 100 mg/5 mLof tetrahydrofuran. Identification of triacylglycerol groups was performed bycomparison of retention times, according to Antoniosi Filho et al. (1995).
SFC
SFC was determined using a nuclear magnetic resonance (NMR) Spec-trometer Bruker pc120 Minispec (Bruker BioSpin, Karlsruhe, Germany) andthe high-precision dry baths (0–70C) Tcon 2000 (Duratech, La Crosse, WI),based on the method of AOCS (2004) Cd 16b- 93: direct method, samplereading in series at 10; 20; 25; 30; 35; 40, 45, 50, 55 and 60C, with temperingfor unstabilized fats.
Construction of Iso-Solid Curves Diagrams
The diagrams of iso-solid lines, that is, the compositions in which theSFC values of a blend are equivalent, were constructed on the basis of the dataexperimentally provided by NMR (Braipson-Danthine and Deroanne 2006).
Melting Point
Melting point was calculated for the temperature corresponding to theSFC equal to 4%, which was attained from the NMR solid curve throughadjusted polynomial equations and the aid of the Statistica 6.0 Software(Statistica 2002; Karabulut et al. 2004).
Consistency
Consistency was determined by the use of a texture analyzer equipmentTA-XT2i (Stable Micro Systems, Godalming, Surrey, UK), controlled by amicrocomputer. Samples were heated in a microwave oven at approximately80C for complete crystal melting, and kept in 50-mL beakers. Conditioningwas performed in an incubator for 24 h at 5C, for fat crystallization, andsubsequently for 24 h at the reading temperatures: 5, 10, 15, 20, 25, 30, 35, 40,45, 50C or higher, according to analyzed samples. An acrylic cone with anon-truncated tip and an angle of 60° was used. Tests were carried out underthe following conditions: distance = 10 mm; speed = 2 mm/s; time = 5 s(Rodrigues et al. 2003). Based on these conditions, compressive strength in(gf) was obtained. Penetration data was converted in yield value, accordingto Haighton (1959):
366 A.P.B. RIBEIRO ET AL.

CK W
p= ×
1 6,
where C = yield value, in gf/cm2; K = factor dependent on the cone angle(equal to 2,815, for a 60° cone); W = compressive strength (gf); andp = penetration depth (mm/10).
Samples were analyzed in triplicate and results correspond to calculatedmean values.
RESULTS AND DISCUSSION
Fatty Acid Composition in Raw Materials and Blends
Table 1 summarizes the composition in fatty acids of raw materials andblends used in the chemical interesterification. The predominant fatty acids in
TABLE 1.FATTY ACID COMPOSITION* (%) OF THE RAW MATERIALS (CO AND FHCSO) AND
BLENDS
Fatty acid (%) CO CO: FHCSO (% w/w) FHCSO
80:20 75:25 70:30 65:35 60:40
C14:0 0.07 0.22 0.39 0.30 0.33 0.38 0.86C16:0 5.22 8.39 9.46 10.41 11.48 12.42 23.39C16:1 0.25 0.21 0.24 0.18 0.17 0.15 –C18:0 2.49 16.61 19.89 23.85 27.77 30.99 74.25C18:1t 0.09 0.08 0.07 0.06 0.06 0.05 0.04C18:1 61.97 51.32 47.90 44.34 40.46 37.73 0.33C18:2t 0.07 0.05 0.06 0.05 0.06 0.05 0.03C18:2 20.72 15.45 14.88 14.24 13.59 12.64 0.51C18:3t 0.21 0.16 0.14 0.14 0.14 0.13 –C18:3 6.54 5.44 5.00 4.57 4.19 3.79 –C20:0 0.67 0.61 0.59 0.57 0.56 0.54 0.37C20:1 0.98 0.82 0.75 0.70 0.63 0.59 –C22:0 0.31 0.28 0.28 0.26 0.25 0.24 0.14C22:1 0.08 0.06 0.06 0.05 0.05 0.05 –C24:0 0.21 0.19 0.20 0.17 0.17 0.16 0.09C24:1 0.11 0.09 0.08 0.08 0.07 0.07 –Saturated (%) 8.98 26.31 30.81 35.57 40.57 44.74 99.09Monounsaturated (%) 63.49 52.59 49.10 45.42 41.45 38.65 0.37Polyunsaturated (%) 27.54 21.10 20.08 19.01 17.98 16.61 0.54
* Means between duplicate samples injection.–, not detected.
367IDENTIFICATION OF CANOLA OIL AND HYDROGENATED COTTONSEED OIL

CO were oleic acid (61.97%), linoleic acid (20.72%) and linolenic acid(6.54%). CO was characterized by a low saturated fatty acid content, amongwhich palmitic acid (5.22%) and stearic acid (2.49%) stand out. These resultsare in accordance with those in the literature, in which oleic acid and linoleicacid percentages are found at 54.60–62.41 and 19.10–26.00%, respectively(List et al. 1995; Tan and Che Man 2000). From a nutritional point of view, thelow saturated fatty acid content (7–8%) and the high content of monounsat-urated fatty acids of CO make it appropriate for different industrial purposes,including the interesterification process (O’Brien 2004).
FHCSO contained a high stearic acid (74.25%), followed by palmitic acid(2.39%), totaling 99.09% of saturated fatty acids. These values agree withthose of DeMan et al. (1989) and List et al. (1995) for FHCSO, where thestearic acid and palmitic acid contents were 70.5–76.2 and 18.8–23.3%,respectively.
The percentages of unsaturated fatty acids of CO and FHCSO were91.03 and 0.91%, respectively. The addition of FHCSO to CO producedblends in which the sum of stearic acid and palmitic acid varied from 25.00to 43.41%. Plasticity of fat is mainly determined by the presence of palmiticacid, which is also responsible for the crystallization of form b′, essential inmost products. In raw materials and, therefore, in blends as well, the pres-ence of a minimum content of trans fatty acids which is associated with therefining and total hydrogenation processes, has been reported (O’Brien2004).
Triacylglycerol Composition
From a technological point of view, the molecular triacylglycerol speciesprofile is the key for the understanding of several physical properties of a givenoil or fat. In a processed food that contains significant fat content, the product’sbehavior may depend on the triacylglycerol composition of that fat. Theinteresterification reaction results in complete fatty acid randomization amongall triacylglycerols present, according to the laws of probability (Rousseau andMarangoni 2002). Table 2 shows the major individual triacylglycerols whichcompose the raw materials CO and FHCSO, as well as their blends, before andafter chemical interesterification.
Fifteen different triacylglycerol species were present in CO, with thepredominance of OOO, OLO, and OLnO, which total 73.16% of the wholetriacylglycerol composition. This significant predominance of triacylglycer-ols with 54 carbons is directly related to the fatty acid composition of CO,in which oleic acid, linoleic acid, and linolenic acid account for 89.51% oftotal fatty acids, as shown in Table 1. Concerning triacylglycerols with 52carbons, the POO and PLO species showed a higher percentage. These
368 A.P.B. RIBEIRO ET AL.

TAB
LE
2.T
RIA
CY
LG
LYC
ER
OL
CO
MPO
SIT
ION
*(%
)O
FT
HE
CO
,FH
CSO
AN
DB
LE
ND
S,B
EFO
RE
AN
DA
FTE
RIN
TE
RE
STE
RIF
ICA
TIO
N
TAG
(%)
CO
CO
:FH
CSO
(%w
/w)
FHC
SO
80:2
080
:20-
I**
75:2
575
:25-
I70
:30
70:3
0-I
65:3
565
:35-
I60
:40
60:4
0-I
PPP
––
––
–0.
33–
0.48
0.76
0.84
1.25
1.33
PStP
–2.
900.
333.
270.
973.
611.
235.
522.
326.
643.
7815
.07
POP
0.51
0.31
1.42
0.26
1.82
–1.
29–
1.77
–1.
03–
PLP
0.30
0.09
0.28
–0.
37–
0.31
–0.
38–
0.19
–PS
tSt
–9.
460.
6011
.51
1.96
12.8
03.
6215
.67
5.96
18.9
09.
9544
.51
POSt
0.62
–4.
79–
4.93
–5.
72–
6.91
–7.
04–
POO
6.56
5.52
9.02
5.24
7.73
5.21
7.49
5.02
6.21
4.71
5.36
–PL
St–
––
––
––
––
––
0.26
PLO
5.16
4.08
1.73
3.73
3.68
3.69
2.70
3.48
3.21
3.19
2.42
–PL
nO2.
371.
375.
141.
364.
441.
264.
561.
164.
551.
143.
26–
PLnL
0.31
0.14
1.08
–1.
00–
0.73
–2.
88–
1.20
–St
StSt
–7.
03–
8.96
1.06
10.4
92.
2813
.74
4.43
16.7
17.
9738
.07
StO
St–
–2.
62–
4.72
–5.
32–
8.22
–10
.48
0.42
StO
O1.
891.
8213
.42
1.80
13.7
81.
7613
.98
1.60
9.67
1.03
9.81
–St
LSt
––
––
––
––
––
–0.
33St
LO
––
18.5
1–
17.8
7–
15.0
1–
10.6
8–
7.19
–O
OO
32.9
627
.86
11.3
026
.76
11.6
725
.62
9.69
22.8
89.
5519
.67
8.03
–O
LO
23.6
519
.65
20.2
019
.01
14.0
017
.93
15.6
015
.29
10.9
713
.80
11.1
4–
OL
L–
–5.
25–
6.47
–7.
68–
5.11
–6.
12–
OL
nO16
.55
13.3
52.
5712
.49
2.01
11.9
81.
8011
.37
2.93
9.86
1.80
–O
LnL
6.62
4.69
0.21
4.26
0.51
4.00
0.40
3.07
2.84
2.93
1.18
–A
OO
0.99
0.90
0.81
0.77
0.15
0.66
0.44
0.48
0.17
0.39
0.80
–O
OG
a0.
720.
470.
530.
420.
860.
390.
150.
240.
480.
19–
–O
LG
a0.
800.
370.
190.
16–
0.27
––
––
––
S 3–
19.3
90.
9323
.74
3.99
27.2
37.
1335
.41
13.4
743
.09
22.9
598
.99
S 2U
1.42
0.40
9.11
0.26
11.8
4–
12.6
4–
17.2
8–
18.7
41.
01U
2S17
.28
13.8
349
.71
12.9
048
.65
12.5
844
.91
11.7
537
.37
10.4
630
.04
–U
381
.30
66.3
940
.25
63.1
035
.52
60.1
935
.32
52.8
531
.88
46.4
528
.27
–
*A
vera
geva
lue
betw
een
dupl
icat
esa
mpl
esin
ject
ion.
P,pa
lmiti
cac
id;
St,s
tear
icac
id;
O,o
leic
acid
;L
,lin
olei
cac
id;
Ln,
linol
enic
acid
;A,a
rach
idic
acid
;G
a,ga
dole
icac
id;
I**,
inte
rest
erifi
edbl
end;
–,no
tde
tect
ed.
369IDENTIFICATION OF CANOLA OIL AND HYDROGENATED COTTONSEED OIL

results are in agreement with those presented by Andrikopoulos (2002) andTan and Che Man (2000), for CO triacylglycerols. FHCSO had 98.98% oftrisaturated triacylglycerols, in which PStSt (44.51%) predominated, fol-lowed by StStSt (38.07%). Triacylglycerol species with 50, 52 and 54carbons were 15.07, 44.77 and 38.82%, respectively. In a study by DeManet al. (1989), these percentages corresponded to 13.60, 43.50 and 40.50%,which are very close to those found in this study. OOO and OLO were thepredominant triacylglycerols in the 80:20, 75:25 and 70:30 blends, whereasOOO and PStSt were the triacylglycerol species with higher percentages forthe 65:35 and 60:40 blends.
Randomization promoted significant alteration in the triacylglycerolcomposition of samples evaluated. Interesterification reaction caused the for-mation of new triacylglycerols, such as POSt, StOSt and OLL, and especiallyof considerable StLO contents, as a result of high proportions of stearic, oleic,and linoleic acids which were present in the initial blends. Additionally, anappreciable increase of the triacylglycerol species StLO was observed, as wellas of the POP, POO, PLnO and PLnL percentages, with a concomitantdecrease in the contents of triacylglycerols PPSt, PStSt, PLO, StStSt, OOO,OLO, OLnO and OLnL.
Differences in the triacylglycerol composition of blends, resulting fromrandom rearrangement, can promote important alterations in the physicalproperties of fats. The presence of high amounts of StLO and StOO, withmelting points equal to 6.1 and 22.8C, respectively, is associated with goodlubricity and gloss characteristics; whereas the formation of the triacylglycerolspecies POSt and StOSt (respective melting points corresponding to 37.8 and41.7C) contributes to a better crystal lattice organization, helping to maintainfat plasticity until higher processing temperatures are reached. Yet, the StStStcontent decrease after randomization and can be regarded as an advantage, ashigh percentages of this triacylglycerol are associated with an unpleasant waxysensation in the mouth (Ghotra et al. 2002).
The addition of FHCSO to CO promoted the increase of the triacyl-glycerol S3 (trisaturated) percentages and the concomitant decrease of othertriacylglycerol classes. Original blends with 20 and 25% of hardfat presentedlow contents of triacylglycerols S2U (disaturated-monounsaturated), whichwere not detected in other blends. For the blends as a whole, randomizationcaused a decrease in the contents of triacylglycerols of types S3 and U3
(triunsaturated), with an increase in the percentages of the triacylglycerolclasses S2U and U2S (monosaturated-diunsaturated), whose sum accountedfor 58.82, 60.49, 57.55, 54.65 and 46.78% of all triacylglycerols. For allblends, a significant predominance of triacylglycerols U3 was verified, beforereaction, which is associated with high contents of species OOO/OLO/OLnO, according to Table 2. After random rearrangement, triacylglycerols
370 A.P.B. RIBEIRO ET AL.
U2S presented the highest concentration among the triacylglycerol classesmainly as a result of excessive formation of StLO and increased concentra-tion of StOO. Triacylglycerols U2S with melting points from 1 to 23C areimportant for sensory properties and related to fat functionality at ambienttemperature (Rodrigues et al. 2003).
Melting Point
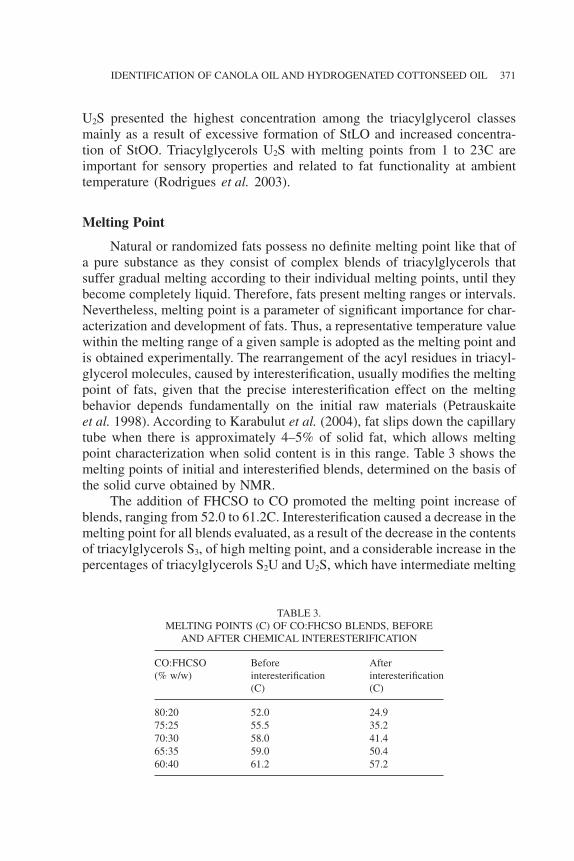
Natural or randomized fats possess no definite melting point like that ofa pure substance as they consist of complex blends of triacylglycerols thatsuffer gradual melting according to their individual melting points, until theybecome completely liquid. Therefore, fats present melting ranges or intervals.Nevertheless, melting point is a parameter of significant importance for char-acterization and development of fats. Thus, a representative temperature valuewithin the melting range of a given sample is adopted as the melting point andis obtained experimentally. The rearrangement of the acyl residues in triacyl-glycerol molecules, caused by interesterification, usually modifies the meltingpoint of fats, given that the precise interesterification effect on the meltingbehavior depends fundamentally on the initial raw materials (Petrauskaiteet al. 1998). According to Karabulut et al. (2004), fat slips down the capillarytube when there is approximately 4–5% of solid fat, which allows meltingpoint characterization when solid content is in this range. Table 3 shows themelting points of initial and interesterified blends, determined on the basis ofthe solid curve obtained by NMR.
The addition of FHCSO to CO promoted the melting point increase ofblends, ranging from 52.0 to 61.2C. Interesterification caused a decrease in themelting point for all blends evaluated, as a result of the decrease in the contentsof triacylglycerols S3, of high melting point, and a considerable increase in thepercentages of triacylglycerols S2U and U2S, which have intermediate melting
TABLE 3.MELTING POINTS (C) OF CO:FHCSO BLENDS, BEFORE
AND AFTER CHEMICAL INTERESTERIFICATION
CO:FHCSO(% w/w)
Beforeinteresterification(C)
Afterinteresterification(C)
80:20 52.0 24.975:25 55.5 35.270:30 58.0 41.465:35 59.0 50.460:40 61.2 57.2
371IDENTIFICATION OF CANOLA OIL AND HYDROGENATED COTTONSEED OIL

points (Ghotra et al. 2002). After random rearrangement, the melting point ofblends varied from 24.9 to 57.2C. The blend with 20% of FHCSO presentedthe biggest relative decrease (27.1C) in its melting point after reaction. Listet al. (1995) attained, for this same interesterified fraction, a melting point of28.4C.
Absolute variation of melting points of interesterified blends in relation tooriginal blends decreased in keeping with the initial FHCSO concentration,which produced randomized blends with increasing and decreasing percent-ages of triacylglycerols of type S2U and U2S, respectively (Table 2). Accordingto Dian et al. (2007), fully hydrogenated fats, interesterified with liquid oil,present a melting point decline with regard to the original blend due to thedecrease in the proportion of triacylglycerols S3. When interesterification isassociated with the reduction of the percentages of triacylglycerol species suchas StStSt and PStSt (in the case of this study), with melting points of 65and 61C, respectively, melting point decline is significant (Rousseau andMarangoni 2002).
Fats with melting points below that of body temperature (37C) can bedirectly used as shortenings, given that they completely melt in the mouthand produce no waxy sensation during consumption (Ghotra et al. 2002).Hence, 80:20 and 75:25 interesterified blends fit in this group. The 70:30interesterified blend, with melting point equal to 41.4C, is situated in therange of most fat bases for the production of solid and semi-solid shorten-ings, whose representative melting point is 42C. Grimaldi et al. (2000)evaluated Brazilian commercial fats used for different industrial purposes.The authors reported melting points between 21.9 and 49.2C; with a greatmajority in the range between 30 and 40C. Karabulut and Turan (2006)reported that the melting points of 25 direct-use margarine and shorteningsamples were between 31.2 and 43.0C. The 65:35 interesterified blend, withmelting point of 50.4C, fits into that category of stabilizing-function fatsused in toppings and icings, which are characterized by melting pointsranging from 45 to 52C (O’Brien 2004). However, for the 60:40 interesteri-fied blend, a considerably high melting point (57.2C) was observed, as far asdirect applicability to food is concerned. Its use would be in basestock forthe formulation of shortenings and margarines based on the addition ofliquid oils. Conversely, this becomes particularly interesting, because, from anutritional point of view, we now have a zero trans basestock source incontrast with commercial basestocks that are normally produced by hydro-genation, which typically contain between 32 and 40% of trans fatty acids intheir composition (List et al. 2007). Nonetheless, melting point is not a realfat consistency indicator and can only to be used as a complementary para-meter for determining the specific use of fats in general (Jeyarani and Reddy2005).
372 A.P.B. RIBEIRO ET AL.

SFC
SFC is a parameter that expresses the solid/liquid ratio of a given fat atvarious temperatures (Rousseau and Marangoni 2002). SFC affects physicalproperties such as spreadability, consistency and stability, besides influencingimportant sensorial properties. Hence, solid profile is essential for plastic fatcharacterization (Lee et al. 2008). Figure 1 shows the solid curves of originaland interesterified blends. The SFC of blends was directly proportional to theaddition of FHCSO to CO at all temperatures evaluated. At 10C, samplespresented SFC values between 21.17 and 41.95%, which decreased in a non-linear fashion until complete fusion between 60 and 65C.
0
5
10
15
20
25
30
35
40
45
10 15 20 25 30 35 40 45 50 55 60 65
Temperature (C)
SF
C (
%)
0
5
10
15
20
25
30
35
40
45
10 15 20 25 30 35 40 45 50 55 60 65
Temperature (C)
SF
C (
%)
80:20
75:25
70:30
75:35
60:40
80:20-I
75:25-I
70:30-I
75:35-I
60:40-I
(a)
(b)
FIG. 1. SFC CURVES OF CO:FHCSO BLENDS, BEFORE (a) AND AFTER (b)INTERESTERIFICATION. I: INTERESTERIFIED BLEND
373IDENTIFICATION OF CANOLA OIL AND HYDROGENATED COTTONSEED OIL

The shape of curves was significantly modified by interesterification,which generated melting profiles that were more linear and with a morepronounced inclination, as a consequence of a greater variability of triacyl-glycerol species resulting from the reaction (Rousseau and Marangoni 2002).Interesterification resulted in a decreased SFC of blends at all temperatures. At25C, SFC of blends was between 18.50 and 39.18%; after randomization,these values were 3.06 and 27.61%, respectively. According to Rousseau andMarangoni (2002), alterations in triacylglycerols of types S3, S2U and U2S,caused by interesterification, directly reflect the solid curves. In this regard, thedecrease in percentage of species S3 and, especially, the simultaneous increasein percentage of triacylglycerols U2S, which presented the highest concentra-tion among the triacylglycerol classes of randomized blends (Table 2), areassociated with a decrease of SFC in the interesterified fats.
The application of new fats is initially based on the correlation of theirphysical properties with those commercial fats for specific use. Solid profile,in particular, has important implications for margarine and shortening charac-teristics, at different temperatures, since it is the major fat specification andselection tool for food applications (Wassell and Young 2007). At low tem-peratures (4 to 10C), SFC gives an indication of the fat’s spreadability atrefrigeration temperatures, which should not exceed 32% at 10C (Lida and Ali1998). The 80:20, 75:25, and 70:30 interesterified blends meet this prerequi-site, which indicates that they possess compatible characteristics for use inrefrigerated products. The SFC ranging between 20 and 22C is related toproduct stability and its resistance to oil exudation and must be over 10%. Thisis particularly important for the interesterified blend 80:20, whose SFC at 20Cis equal to 5.52%, thus limiting its use in solid and semi-solid products. Thesolid fat percentage above 25C represents the hardness of a specific fat. Thus,the interesterified blends 70:30, 65:35 and 60:40, with SFC over 10% at 25C,would be appropriate to provide food products with structure (Lida and Ali1998).
Solid curves concerning several fats and shortenings for different indus-trial purposes have been reported by Lida and Ali (1998), Petrauskaite et al.(1998), Karabulut et al. (2004), Karabulut and Turan (2006), Ghotra et al.(2002), Khatoon and Reddy (2005), Wassell and Young (2007), Grimaldiet al. (2000), Timms (2003), Dijkstra et al. (2007), Lee et al. (2008). Theinteresterified blend 80:20 showed a solid profile similar to that of soft mar-garines, or margarines for culinary use. The interesterified blend 75:25 had asolid profile close to that of fat bases used for the production of spreads, alsomeeting SFC prerequisites in order to ensure spreadability under refrigeration.Fats reach the melting point when SFC is reduced to 4–5% (Karabulut et al.2004). At 35C, this blend’s SFC is equal to 4.23%, which ensures completemelting in the mouth.
374 A.P.B. RIBEIRO ET AL.

The interesterified blend 70:30 showed a solid profile appropriate forgeneral use in bakery and as all-purpose shortening. Shortenings for bakeriesrequire sufficient SFC at ambient temperature, and higher, for dough structur-ing and gas retention during the initial baking stages, aiming at productsbearing appropriate volume. In general, this type of fat base also serves for adifferent number of applications, based on the addition of specific emulsifiers(Ghotra et al. 2002; Karabulut and Turan 2006). According to Wassell andYoung (2007), the SFC at 20C, for all-purpose shortenings, must be between15 and 20% in order to create stable emulsions that have good cream-formation properties; this blend’s specific case, in which SFC at this tempera-ture corresponds to 17.40%.
The interesterified blend 65:35 presented a solid profile that is verysimilar to that of icing shortenings. The aim of such fats is to prevent moistureloss and create a rigid matrix that can resist a wide melting temperature rangeand packaging (Timms 2003; O’Brien 2004). The interesterified blend 60:40,in turn, presented a significantly high SFC between 35 and 40C (19.20–15.48%) and at 50C (8.37%), which makes its direct application in foodproducts unattractive (Dijkstra et al. 2007). This blend has a solid profilecompatible with those of soybean-oil-based basestocks, produced by hydro-genation, with iodine values between 66 and 60. However, such hydrogenatedbases are regarded as nutritionally inappropriate as they contain approximately45% trans isomers in their composition (O’Brien 2004).
Iso-Solid Curves Diagrams
When oils and fats with distinct compositions are blended, severalbehaviors can be verified: solid solutions (compatibility among fats) andmonotectic or eutectic behaviors. Iso-solid diagrams are useful in the com-patibility study among different fats. The iso-solid curves represent the tem-perature in which the SFC of a given fat, or blend of fats, is constant.Figure 2 presents the iso-solid curves for the original and interesterifiedblends.
The blend of two different lipid matrices can present an SFC lower thanthe SFC predicted from those of the individual components, characterizingincompatibility between fats (Braipson-Danthine and Deroanne 2006). Theiso-solid lines show a noticeable decrease in temperature for a FHCSO con-centration equal to 30%. Such declines are typical of eutectic system for-mation, which results in the liquefaction of blends at specific compositions,which represents a problem for the application of fats in which consistencyand SFC are important. This kind of interaction tends to occur when blendcomponents differ in molecular volume, shape or polymorph (Lida et al.2002).
375IDENTIFICATION OF CANOLA OIL AND HYDROGENATED COTTONSEED OIL
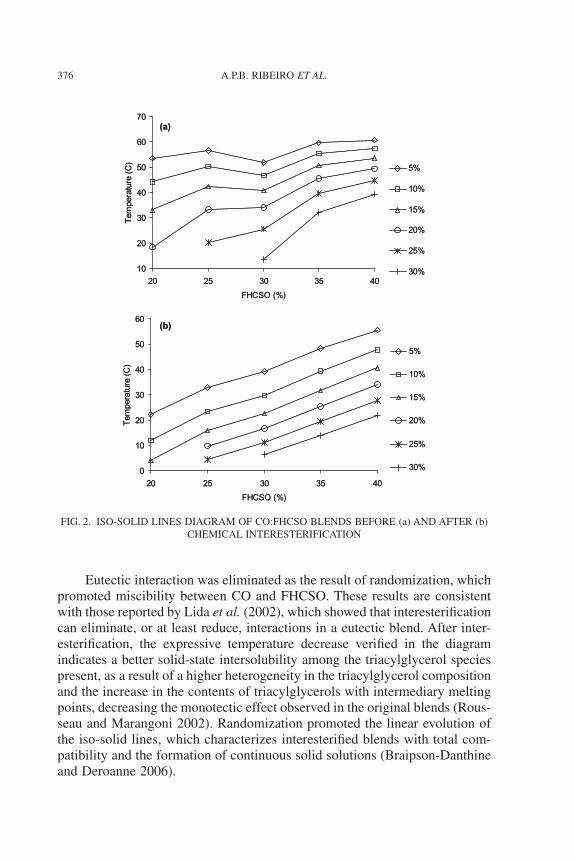
Eutectic interaction was eliminated as the result of randomization, whichpromoted miscibility between CO and FHCSO. These results are consistentwith those reported by Lida et al. (2002), which showed that interesterificationcan eliminate, or at least reduce, interactions in a eutectic blend. After inter-esterification, the expressive temperature decrease verified in the diagramindicates a better solid-state intersolubility among the triacylglycerol speciespresent, as a result of a higher heterogeneity in the triacylglycerol compositionand the increase in the contents of triacylglycerols with intermediary meltingpoints, decreasing the monotectic effect observed in the original blends (Rous-seau and Marangoni 2002). Randomization promoted the linear evolution ofthe iso-solid lines, which characterizes interesterified blends with total com-patibility and the formation of continuous solid solutions (Braipson-Danthineand Deroanne 2006).
0
10
20
30
40
50
60
20 25 30 35 40
FHCSO (%)
Tem
pera
ture
(C
)
5%
10%
15%
20%
25%
30%
10
20
30
40
50
60
70
20 25 30 35 40
FHCSO (%)
Tem
pera
ture
(C
)
5%
10%
15%
20%
25%
30%
(a)
(b)
0
10
20
30
40
50
60
20 25 30 35 40
FHCSO (%)
Tem
pera
ture
(C
)
5%
10%
15%
20%
25%
30%
10
20
30
40
50
60
70
20 25 30 35 40
FHCSO (%)
Tem
pera
ture
(C
)
5%
10%
15%
20%
25%
30%
(a)
(b)
FIG. 2. ISO-SOLID LINES DIAGRAM OF CO:FHCSO BLENDS BEFORE (a) AND AFTER (b)CHEMICAL INTERESTERIFICATION
376 A.P.B. RIBEIRO ET AL.

Consistency
Consistency is an important functional aspect of plastic fats, which areblends of fat crystals and liquid oil. The relation between the two phases andthe crystalline character of the solid phase determines the consistency andfirmness of samples. The rearrangement of triacylglycerols caused by random-ization promotes changes in the physical characteristics of fat bases, especiallythose related to crystal lattice formation, altering the mechanical properties ofinitial raw materials (Lee et al. 2008).
The parameter yield value is the most used tool to interpret the consis-tency of fats. The yield value was described by Haighton (1959) and can beanalyzed independent of the equipment used. It corresponds to the tensionabsorbed before permanent deformation, and can be expressed in gf/cm2. Fatsbehave as rigid solids until the deformation tension exceeds the yield value,when they start flowing as viscous liquids. According to Haighton (1959), onecan classify fats at a determined application temperature as a function ofthe subjective property of spreadability. Figure 3 shows blend consistency inkeeping with temperature, represented as yield value (gf/cm2), before and afterinteresterification.
Blend consistency decreases in keeping with temperature, as a result ofgradual crystal fusion, which produces structurally weaker crystal lattices.Interesterification promoted yield value decrease for all blends, at all tempera-tures evaluated, as shown by Silva and Gioielli (2006), which verified that theconsistency of lard, as well as its binary blends with soybean oil, was signifi-cantly altered by random rearrangement. Consistency was proportionallydependent on the FHCSO concentration of blends, before and after random-ization. Such proportionality shows conformity with the results verified bymelting point and SFC. The major alterations in the yield values of interest-erified blends, in relation to original blends, were ascertained for blends 80:20,75:25 and 70:30. At 25C, original blends presented yield values between569.46 and 5,137.33 gf/cm2; after interesterification, original blends rangedbetween 0 and 1,590.98 gf/cm2.
Consistency analysis has proven to be an extremely useful tool foroutlining specific applications of fat bases produced by interesterification.According to Haighton (1959), yield values between 100 and 200 gf/cm2
characterize soft fats. The interesterified blend 80:20, with yield value at10–15C, between 182.52 and 122.33 gf/cm2, fit the classification of semi-fluidfat bases group, which corroborates its potential to be used in soft margarines(O’Brien 2004). Plastic and spreadable fats present yield values between 200and 800 gf/cm2 (Haighton 1959). In this way, the interesterified blend 75:25,with yield values equal to 208.06 and 561.83 gf/cm2, at temperatures of 10 and20C, respectively, has satisfactory plasticity and spreadability conditions to be
377IDENTIFICATION OF CANOLA OIL AND HYDROGENATED COTTONSEED OIL

used at refrigeration temperatures, besides having the appropriate SFC andmelting point requisites for the application in spreads, as previously men-tioned. Between 25 and 30C, the interesterified blend 70:30 is satisfactorilyspreadable (yield value between 315.25 and 239.06 gf/cm2), but is soft at 35C(yield value equal to 174.66 gf/cm2), which is important for sensorial attributes
0
200
400
600
800
1000
5 10 15 20 25 30 35 40 45 50 55 60
Yie
ld v
alue
(gf
/cm
2)
0
250
500
750
1000
1250
1500
1750
2000
5 10 15 20 25 30 35 40 45 50 55 60
Yie
ld v
alue
(gf
/cm
2)
0
1000
2000
3000
4000
5000
6000
7000
5 10 15 20 25 30 35 40 45 50 55 60
Yie
ld v
alue
(gf
/cm
2)
0
2000
4000
6000
8000
10000
5 10 15 20 25 30 35 40 45 50 55 60
Yie
ld v
alue
(gf
/cm
2)
0
500
1000
1500
2000
2500
3000
3500
4000
5 10 15 20 25 30 35 40 45 50 55 60
Yie
ld v
alue
(gf
/cm
2)
0
200
400
600
800
1000
5 10 15 20 25 30 35 40 45 50 55 60
Yie
ld v
alue
(gf
/cm
2)
80:20 CaO:FHCSO 80:20 CaO:FHCSO-I
0
250
500
750
1000
1250
1500
1750
2000
5 10 15 20 25 30 35 40 45 50 55 60
Yie
ld v
alue
(gf
/cm
2)
85:25 CaO:FHCSO 85:25 CaO:FHCSO-I
0
1000
2000
3000
4000
5000
6000
7000
5 10 15 20 25 30 35 40 45 50 55 60
Yie
ld v
alue
(gf
/cm
2)
65:35 CaO:FHCSO 65:35 CaO:FHCSO-I
0
2000
4000
6000
8000
10000
5 10 15 20 25 30 35 40 45 50 55 60
Yie
ld v
alue
(gf
/cm
2)
60:40 CaO:FHCSO 60:40 CaO:FHCSO-I
0
500
1000
1500
2000
2500
3000
3500
4000
5 10 15 20 25 30 35 40 45 50 55 60
Yie
ld v
alue
(gf
/cm
2)
70:30 CaO:FHCSO 70:30 CaO:FHCSO-I
Temperature (C) Temperature (C)
Temperature (C) Temperature (C)
Temperature (C)
FIG. 3. YIELD VALUE (gf/cm2) OF CO:FHCSO BLENDS, BEFORE AND AFTERINTERESTERIFICATION. I: INTERESTERIFIED BLEND
378 A.P.B. RIBEIRO ET AL.

such as melting sensation in the mouth and absence of adhesiveness. Thus, itsconsistency profile is also suitable to use in bakery or all-purpose shortenings.
Yield values between 1,000 and 1,500 gf/cm2 are linked to hard fats withlimited spreadability, whereas values higher than 1,500 gf/cm2 represent muchharder fats of little direct applicability in food (Haighton 1959). Based on thisclassification, the interesterified blend 65:35 can be regarded as hard between35 to 40C, with yield values between 1,472.28 and 1,103.90 gf/cm2 in thistemperature interval. According to Jeyarani and Reddy (2005), fats regarded ashard are destined to firmer food products, in which there can be no deforma-tions during handling or storage. Hence, this blend presents compatible con-sistency for its use in icing shortenings, as previously noted. The interesterifiedblend 60:40, on its turn, would be classified as hard fat up to 30C, becausefrom there up its yield values are less than 1,000 gf/cm2. However, keepinghigh contents of solid fat at 37C, or higher, renders its direct use in foodproducts inappropriate, because of the undesirable waxy sensation in themouth (Jeyarani and Reddy 2005).
CONCLUSIONS
This study demonstrated that chemical interesterification significantlymodifies the triacylglycerol composition, and consequently the melting point,SFC and consistency properties of the CO:FHCSO blends. The interesterifiedblends displayed characteristics suited for a variety of industrial applications,offering alternatives to partly hydrogenated fats. All the analyses showed thatthe interesterified 80:20, 75:25, 70:30 and 65:35 CO:FHCSO blends displayedcharacteristics suitable for use in soft margarine, spread, bakery/all-purposeshortening and icing shortening, respectively.
ACKNOWLEDGMENTS
The authors would like to thank the financial support from the BrazilianAgencies Fapesp and CNPq.
REFERENCES
ANDRIKOPOULOS, N.K. 2002. Triglyceride species compositions ofcommon edible vegetable oils and methods used for their identificationand quantification. Food Rev. Int. 18, 71–102.
ANTONIOSI FILHO, N., MENDES, O.L. and LANÇAS, F.M. 1995. Com-puter predition of triacylglycerol composition of vegetable oils byHRGC. Chromatographia 40, 557–562.
379IDENTIFICATION OF CANOLA OIL AND HYDROGENATED COTTONSEED OIL

AOCS. 2004. Official Methods and Recommended Practices of the AmericanOil Chemists’ Society, 5th Ed., American Oil Chemists’ Society, Cham-paign, IL.
BRAIPSON-DANTHINE, S. and DEROANNE, C. 2006. Determination ofsolid fat content (SFC) of binary fat blends and use of these data to predictSFC of selected ternary fat blends containing low-erucic rapessed oil. J.Am. Oil Chem. Soc. 83, 571–581.
DEMAN, L., DEMAN, J.M. and BLACKMAN, B. 1989. Polymorphic behav-ior of some fully hydrogenated oils and their mixtures with liquid oil. J.Am. Oil Chem. Soc. 66, 1777–1780.
DIAN, N.L.H.M., SUNDRAM, K. and IDRIS, N.A. 2007. Effect of chemicalinteresterification on triacylglicerol and solid fat contents of palm stearin,sunflower oil and palm kernel olein blends. Eur. J. Lipid Sci. Technol.109, 147–156.
DIJKSTRA, A.J., CHRISTIE, W.W. and KNOTHE, G. 2007. Analysis. In TheLipid Handbook (F.D. Gunstone, J.L. Harwood and A.J. Dijkstra, eds.)pp. 415–455, CRC Press, Boca Raton, FL.
GHOTRA, B.S., DYAL, S.D. and NARINE, S.S. 2002. Lipids shortenings: Areview. Food Res. Int. 35, 1015–1048.
GRIMALDI, R., GONÇALVES, L.A.G. and ESTEVES, W. 2000. Caracterís-ticas de gorduras comerciais brasileiras. Braz. J. Food Technol. 3, 159–164.
GRIMALDI, R., GONÇALVES, L.A.G. and ANDO, M.Y. 2005. Otimizaçãoda reação de interesterificação química de óleo de palma. Quím. Nova 28,633–636.
HAIGHTON, A.J. 1959. The measurement of the hardness of margarine andfats with cone penetrometers. J. Am. Oil Chem. Soc. 36, 345–348.
HARTMAN, L. and LAGO, R. 1973. Rapid preparation of fatty acid methylesters from lipids. Lab. Pract. 22, 475–476.
HUNTER, J.E. 2005. Dietary levels of trans-fatty acids: Basis forhealth concerns and industry efforts to limit use. Nutr. Res. 25, 499–513.
JEYARANI, T. and REDDY, Y. 2005. Physicochemical evaluation of van-aspati marketed in India. J. Food Lipids 12, 232–242.
KARABULUT, I. and TURAN, S. 2006. Some properties of margarines andshortenings marketed in Turkey. J. Food Compost. Anal. 19, 55–58.
KARABULUT, I., TURAN, S. and ERGIN, G. 2004. Effects of chemicalinteresterification on solid fat content and slip melting point of fat/oilblends. Eur. J. Lipid Sci. Technol. 218, 224–229.
KHATOON, S. and REDDY, S.R.Y. 2005. Plastic fats with zero trans fattyacids by interesterification of mango, mahua and palm oils. Eur. J. LipidSci. Technol. 107, 786–791.
380 A.P.B. RIBEIRO ET AL.

LEE, J.H., AKOH, C.C. and LEE, T. 2008. Physical properties of trans-freebakery shortening produced by lipase-catalyzed interesterification. J. Am.Oil Chem. Soc. 85, 1–11.
LIDA, A.M.D.N. and ALI, A.R. 1998. Physical-chemical characteristics ofpalm-based oil blends for the production of reduced fat spreads. J. Am.Oil Chem. Soc. 75, 1625–1631.
LIDA, H.M.D.N., SIEW, W.L., AMINA, A. and MAMOT, S. 2002. TAGcomposition and solid fat content of palm oil, sunflower oil and palmkernel olein blends before and after chemical interesterification. J. Am.Oil Chem. Soc. 79, 1138–1143.
LIST, G.R., MOUNTS, T.L., ORTHOEFER, F. and NEFF, W.E. 1995. Mar-garine and shortening oils by interesterification of liquid and trisaturatedtriglycerides. J. Am. Oil Chem. Soc. 72, 379–382.
LIST, G.R., JACKSON, M., ELLER, F. and ADLOF, R. 2007. Low transspread and shortening oils via hydrogenation of soybean oils. J. Am. OilChem. Soc. 84, 609–612.
O’BRIEN, R.D. 2004. Fats and Oils – Formulating and Processing for Appli-cations, CRC Press, New York, NY.
PETRAUSKAITE, V., DE GREYT, W., KELLENS, M. and HUYGHE-BAERT, A. 1998. Physical and chemical properties of trans-free fatsproduced by chemical interesterification of vegetable oil blends. J. Am.Oil Chem. Soc. 75, 489–493.
RODRIGUES, J.N., GIOIELLI, L.A. and ANTON, C. 2003. Propriedadesfísicas de lipídios estruturados obtidos de misturas de gordura do leite eóleo de milho. Ciênc. Tecnol. Aliment. 23, 226–233.
ROUSSEAU, D. and MARANGONI, A.G. 2002. The effects of interesterifi-cation on the physical properties of fats. In Physical Properties of Lipids(A.G. Marangoni and S.S. Narine, eds.) pp. 479–565, CRC Press, BocaRaton, FL.
SILVA, R.C. and GIOIELLI, L.A. 2006. Propriedades físicas de lipídios estru-turados obtidos a partir de banha e óleo de soja. Rev. Bras. Ciênc. Farm.42, 223–235.
STATISTICA. 2002. Statistica, v.6.0. for Windows, Vol. IV, Statsoft Inc.,Tulsa, OK.
TAN, C.P. and CHE MAN, Y.B. 2000. Differential scanning calorimetricanalysis of edible oils: Comparison of thermal properties and chemicalcomposition. J. Am. Oil Chem. Soc. 77, 143–155.
TIMMS, R.E. 2003. Confectionery Fats Handbook, The Oily Press, Bridg-water, England.
WASSELL, P. and YOUNG, N.W.G. 2007. Food applications of trans fattyacids substitutes. Int. J. Food Sci. Technol. 42, 503–517.
381IDENTIFICATION OF CANOLA OIL AND HYDROGENATED COTTONSEED OIL