case western reserve university - OhioLINK ETD
106
MODELING AND MAPPING OF THE STRUCTURAL DEFORMATION OF LARGE IMPACT CRATERS ON THE MOON AND MERCURY by JEFFREY A. BALCERSKI Submitted in partial fulfillment of the requirements for the degree of Doctor of Philosophy Department of Earth, Environmental, and Planetary Sciences CASE WESTERN RESERVE UNIVERSITY August, 2015
-
Upload
khangminh22 -
Category
Documents
-
view
0 -
download
0
Transcript of case western reserve university - OhioLINK ETD
MODELING AND MAPPING OF THE STRUCTURAL DEFORMATION OF LARGE
IMPACT CRATERS ON THE MOON AND MERCURY
by
JEFFREY A. BALCERSKI
Submitted in partial fulfillment of the requirements for the degree of
Doctor of Philosophy
Department of Earth, Environmental, and Planetary Sciences
CASE WESTERN RESERVE UNIVERSITY
August, 2015

~i~
CASE WESTERN RESERVE UNIVERSITY
SCHOOL OF GRADUATE STUDIES
We hereby approve the thesis/dissertation of
Jeffrey A. Balcerski
candidate for the degree of Doctor of Philosophy
Committee Chair
Steven A. Hauck, II
James A. Van Orman
Ralph P. Harvey
Xiong Yu
June 1, 2015
*we also certify that written approval has been obtained for any proprietary material contained therein

~ii~
Dedicated to Marie,
for her love, strength, and faith
~iii~
Table of Contents
1. Introduction ............................................................................................................1
2. Tilted Crater Floors as Records of Mercury’s Surface Deformation .....................4
2.1 Introduction ..............................................................................................5
2.2 Craters and Global Tilt Meters ................................................................8
2.3 Measurement Process...............................................................................12
2.3.1 Visual Pre-selection of Candidate Craters ................................13
2.3.2 Inspection and Inclusion/Exclusion of Altimetric Profiles .......14
2.3.3 Trend Fitting of Crater Floor Topography ................................16
2.4 Northern Hemisphere Crater Tilts ...........................................................20
2.5 Comparison of Crater Floor Tilts with Long-Wavelength Topography ..26
2.6 Regional Analysis ....................................................................................31
2.6.1 Caloris Basin .............................................................................31
2.6.2 Northern Rise ............................................................................35
2.7 Discussion ................................................................................................37
2.8 Summary and Conclusion ........................................................................40
2.9 Appendix ..................................................................................................44
2.10 References ..............................................................................................62
3. Evolution of Lunar Basin Subsurface Topography ...............................................67
3.1 Impact Basins as Windows to Lunar Thermal History ............................67
3.2 Measurement Process...............................................................................72
3.3 Measurement Results ...............................................................................74
3.4 Discussion of Central Uplift Measurements ............................................76
3.5 Modeling of Basin Structural Evolution ..................................................79
3.6 Model Results ..........................................................................................85

~iv~
3.7 Discussion of Model Results ...................................................................89
3.8 Summary and Conclusions ......................................................................90
3.9 Appendix ..................................................................................................93
3.10 References ..............................................................................................94
List of Tables
2.A.1 Plane-fit Crater Floors Slopes In and Near Caloris Basin ...............................45
2.A.2 Plane-fit Crater Floor Slopes of the Northern Rise ..........................................45
2.A.3 Along-track Unique Crater Slope Measurements ............................................46
3.1 Model Material Parameters ..................................................................................84
3.2 Model Topographic Parameters ...........................................................................85
3.A.1 Morphology of Measureable Lunar Basins ......................................................92
~v~
List of Figures
2.1 Topography of Mercury’s Northern Hemisphere ................................................8
2.2 Crater Floor Tilting Process .................................................................................12
2.3 Measurement Criteria of Example Crater ............................................................16
2.4 Crater Morphological Types ................................................................................20
2.5 Distribution of Morphologic Types of Cataloged Craters ...................................21
2.6 Location Map of All Measured MLA Profiles ....................................................22
2.7 Histogram of Track Lengths of Crater Floor Profiles ..........................................23
2.8 Histogram of the Direction and Magnitude of Crater Floor Profiles ...................24
2.9 Histogram of Randomly Sampled Surface Tilts ..................................................26
2.10 Measured Floor Tilts versus Spherical Harmonic Model ..................................27
2.11 Misfit Analysis ...................................................................................................29
2.12 Co-directional versus Anti-directional Tilts ......................................................31
2.13 Plane-fit Tilt Measurements in Caloris Basin ....................................................34
2.14 Plane-track Tilt Measurements of the Northern Rise ........................................36
2.15 Crater Rim Tilt Influenced by Pre-existing Topography ...................................42
2.A.1 Tilt Selection Flowchart ...................................................................................44
3.1 Lunar Gravity Anomalies ....................................................................................71
3.2 Comparative Topography of Humboldtianum and Nubium ................................72
3.3 Topographic Measurement Criteria .....................................................................73
3.4.A Uplift Magnitude versus Basin Diameter .........................................................75
3.4.B Uplift Width versus Basin Diameter ................................................................75
3.4.C Uplift Width Fraction versus Basin Diameter ..................................................76
3.4.D Uplift Width Fraction versus Crustal Thickness ..............................................76
3.5 Comparative Topography of Basins in Similar Thermal Environments .............78
~vi~
3.6 Model Schematic and Boundary Conditions .......................................................81
3.7.A Initial Thermal State for Model Cases .............................................................83
3.7.B Initial Viscosity Structure for Model Cases .....................................................83
3.8 Maximum Lateral Displacement of Model Cases ...............................................86
3.9 Topographic Evolution of Model Case 3 .............................................................87
3.10 Initial and Evolved Stresses Due to Topographic Deformation ........................88

~vii~
Acknowledgements
First and foremost, this work is dedicated to my wife and family. This has been a collaborative journey in every sense, and there is no doubt that none of would be possible with their support. They have provided the encouragement and motivation to take on each day, and to go beyond my own limitations and ego.
I also owe an incredible debt to my parents, who have been present through all of my success and failures and have continued to provide their unwavering support. Thank you both for your seemingly limitless love and faith.
My gratitude also to my faculty advisors, who saw potential in me, had the confidence that I could succeed, and gave me the opportunity and means to do so. Much credit is due to my advisor, Steven Hauck, for challenging me, encouraging me, and providing access to the planetary science community that I could not have imagined.

~viii~
Modeling and Mapping of the Structural Deformation of Large Impact Craters on the Moon
and Mercury
Abstract
by
JEFFREY A. BALCERSKI
The large craters and impact basins that are present on nearly every solid body in the solar system are remnants of a cataclysmic process that excavated, melted, vaporized, and ejected tremendous amounts of material from the surface of the planets. The results of this process of energy release and topographic disruption can be used to derive information about the deep geologic past of the planets. On Mercury, the topography of the melted sheet which forms interior floors of craters > 12 km in diameter, is well preserved and can be measured using the altimetric data from the MESSENGER orbital mission. I use these measurements to place chronologic constraints on the onset and duration of some of Mercury’s large-scale topographic features. On the Moon, the events that formed impact craters measuring over 120 km in diameter were capable of disrupting the crust-mantle boundary. Many of those perturbations have persisted through the billions of years since their formation. The processes that preserve this remarkable topography and the way in which it deforms over time, are poorly constrained due to the lack of observation of geologically recent basin formation events. However, constraints on these processes can be determined using models governed by high resolution gravity and topography data gathered from recent orbital missions to the Moon, as well as data produced by laboratory rheology experiments. I measure and catalog the morphologic characteristics of the lunar basins and develop numerical finite element structural models in order to evaluate hypotheses about the formation of these features and provide new insight into the structural evolution of the Moon’s shallow interior.
~1~
1. Introduction
The surfaces of all solid bodies in the solar system have experienced some degree of
cataclysmic disruption of their surfaces due to high-energy collisions with solar debris, such as
comets, asteroids, meteoroids, or even other planets. On the Earth, these impacts have been
linked to dramatic and fundamental shifts in the planet’s ecosphere, with the most well-known
example being the Chicxulub impact and the associated Cretaceous-Tertiary mass extinction
event, and may even have been the mechanism by which the materials necessary for life were
deposited upon the planet. However, the surface of the Earth is dynamic, and landforms such as
the crustal basins that result from ancient impact events are erased by tectonics, volcanism, and
weathering. Thus, the Earth is actually a poor record of the impact processes occurring during
the ~4.6 billion year history of the solar system. In the inner solar system, the Earth's Moon and
Mercury stand out as having excellent retention of impact features, due mainly to having large
areas of the surface where resurfacing processes, including volcanism, have been largely absent,
allowing for the retention of features formed only shortly after the solidification of the solid
surface. Since the process of impact cratering is ubiquitous across the surface of a terrestrial
body, the structure of a crater is subject to subsequent modification due to the physical properties
of its host environment. These changes can be used to develop insight into the geologic history
of the planet and to provide information about both surface and subsurface processes that may
not be able to be obtained by other methods.
Complex craters, those that are large enough to have a flat interior floor, were created by
an impact event that produced enough energy to excavate the crater cavity as well as melt a
significant amount of material within it. This molten pool of rock settled into the excavated
~2~
cavity and as it cooled, formed a flat, level surface. Thus, given the age of the crater, the
existence of contemporary non-level crater floors provides a chronologic constraint on the
deformation of the host surface. The laser altimeter aboard the MESSENGER spacecraft is able
to provide topographic profiles of these surfaces, allowing for the measurement of the angle of
the crater floor, and in concert with high resolution orbital imagery, the relative age and geologic
context of the crater can be established. The comprehensive altimetric coverage of Mercury's
northern hemisphere by the MESSENGER spacecraft allows for a statistical analysis that can be
used to demonstrate at least some correlation with large-scale, regional topographic features.
The Moon also possesses these flat-floored complex craters, though they tend to be less
well-defined, with smaller interior melt sheet areas. This makes the Moon a tantalizing
application for the techniques developed to measure these features on Mercury. The Moon
differs somewhat from Mercury, in that it has a notably heterogeneous gravity field. Early
unmanned lunar orbital missions of the 1960's discovered that some of the largest gravity
anomalies corresponded with massive impact features. Many of these lunar impact basins were
found to be geographically located at the sites of significantly elevated gravity potentials, which
indicated the presence of excess mass buried beneath the topographic cavity, due in large part to
mantle material that is uplifted in response to the impact event. In the last five decades, the Moon
has been observed in extraordinary detail by orbital instrumentation capable of resolving
topographic, spectroscopic, and gravimetric features to a level of precision that exceeds even that
which has been obtained for the Earth. These data have shown that impact basins possess not
only surface topography that degrades with time, but also a topographic profile along the crust-
mantle interface that has an age-dependent character. Additionally, basins hosted in the thinner
and warmer lunar nearside have a subsurface character that differs from those of equivalent size
~3~
in the thick cold crust of the lunar farside, which implies a morphologic dependence upon the
thermal environment of the host region. An enduring challenge since the discovery of these
features has been to understand the mechanics by which some of these basins are able to
maintain a significant amount of this topography through geologic time, even as the stresses due
to the density contrasts work to remove the topography and restore equilibrium. Forward
modeling of the rock dynamics under lunar conditions, informed by laboratory-derived rheology
data, provides insight into the lunar thermal history of different regions of the Moon and offers
some explanation for the characteristic differences of basins of similar size and age.
The Earth's Moon, in particular, can be considered to be a planetary experiment in impact
dynamics, offering clues to a distant geologic past which the Earth has long since erased. Of all
the terrestrial bodies of the inner solar system, it is the most accessible, the most studied, the
most visited, and as yet, the only one from which there have been in-situ geologic samples
obtained. The formation of the Earth and Moon are intimately linked, and by studying the deep
geologic history implied by the evolution of craters and basins, a greater understanding of the
Earth's history can be developed.
~4~
2. Tilted Crater Floors as Records of Mercury’s Surface Deformation
Abstract
Topographic profiles of the interior floors of Mercury’s large impact craters indicate that
there is a substantial number with slopes deviating from horizontal. In the absence of evidence of
localized deformation, these re-oriented craters record deflection of the regional surface
subsequent to their emplacement. Although superpositional relationships of tectonic fabric, such
as faults and wrinkle ridges, allow for an estimation of magnitude of regional deformation, and
to a lesser degree, the relative timing and duration, these insights are limited to specific
geographic locales. Impact cratering is a globally ubiquitous process and in the case of large
impacts, leaves nearly permanent scars on the surface of the planet. On Mercury, these impacts
tend to be highly energetic with resulting increased production of impact melt in comparison to
those on other terrestrial bodies. The relatively low viscosity of these melts allows them to pool
in the excavated crater interior, and since the rate of solidification of the pool surface is much
greater than the rate of regional tectonism, it can be used as an indicator of subsequent
deformation. We have used the altimetric data from the Mercury Laser Altimeter aboard the
MESSENGER spacecraft to measure the slopes of the interior floors of 700 large impact craters
in the northern hemisphere. We present statistical evidence that fresh interior crater floors do
indeed originate as level surfaces, largely independent of any underlying regional slope, and
therefore have utility as indicators of regional surface deformation. In combination with a
morphologic analysis of the degradation state of the same craters, we investigated the
relationship between the orientation of these craters and the topography of the region onto which
~5~
they are emplaced. The resulting chronologic relationship indicates that the broad topographic
rises located in both the northern volcanic plains and the Caloris basin were actively deforming
as recently as the Mansurian. Moreover, the mechanisms producing both features must be
restricted to those that progressively and non-destructively reorient the surface while
accumulating impact craters of Calorian, Mansurian, and Kuiperian in age.
1. Introduction
Globally distributed tectonic features are indicators of one of the major evolutionary
processes affecting the surfaces and interiors of terrestrial bodies. Mercury, lacking the erosive
fluvial and atmospheric processes present on the Earth and Mars, retains a surficial record of
much of its history. Observations from Mariner 10 flybys of Mercury showed that the planet has
a global system of long, high-relief, lobate scarps interpreted to be thrust faults [Strom et al.,
1975; Watters et al., 1998]. This network of features, and the lack of a complementary set of
extensional features, led to the conclusion that Mercury’s surface tectonics result from a state of
global compression due to a cooling and contracting interior [Thomas et al., 1988; Watters et al.,
2009]. However, a global analysis of tectonic landforms on Mercury was initially precluded due
to less than half of the surface of the planet being imaged during the Mariner 10 mission and that
the illumination geometry necessary to highlight tectonic features was limited and not uniform
across the visible hemisphere. Recent analyses of data returned by the orbiting MESSENGER
(MErcury Surface, Space ENvironment, GEochemistry, and Ranging) [Solomon et al., 2001]
spacecraft revealed that the wrinkle ridges and lobate scarps are present in much higher numbers
and are more widely distributed than previously observed [Byrne et al., 2014].
~6~
During the flyby phase of the MESSENGER mission, the majority of the Caloris Basin,
an impact feature approximately 1550 kilometers in diameter, was imaged in full for the first
time. Digital elevation models derived from stereographic imagery revealed a broad topographic
rise within the northern interior portion of the basin, with elevations in some areas that exceed
even the height of the basin-defining rim [Oberst et al., 2010]. This broad undulation also
appeared to continue across the basin rim and into the exterior ejecta-sculpted terrain to the
northeast. During the orbital phase of the MESSENGER mission that began in March 2011,
ranging data from the Mercury Laser Altimeter (MLA) [Cavanaugh et al., 2007] have provided
accurate topographic measurements of the planet’s northern hemisphere. These data, which have
the benefit of 1 m vertical precision and better sensitivity to long-wavelength trends than
stereographically generated terrain models are able to further resolve the magnitude and extent of
the interior Caloris rise [Zuber et al., 2012]. Additionally, the expanded topographic coverage of
the northern hemisphere suggests that this feature is only a portion of extensive undulatory
topography covering much of the northern hemisphere and present within the northern volcanic
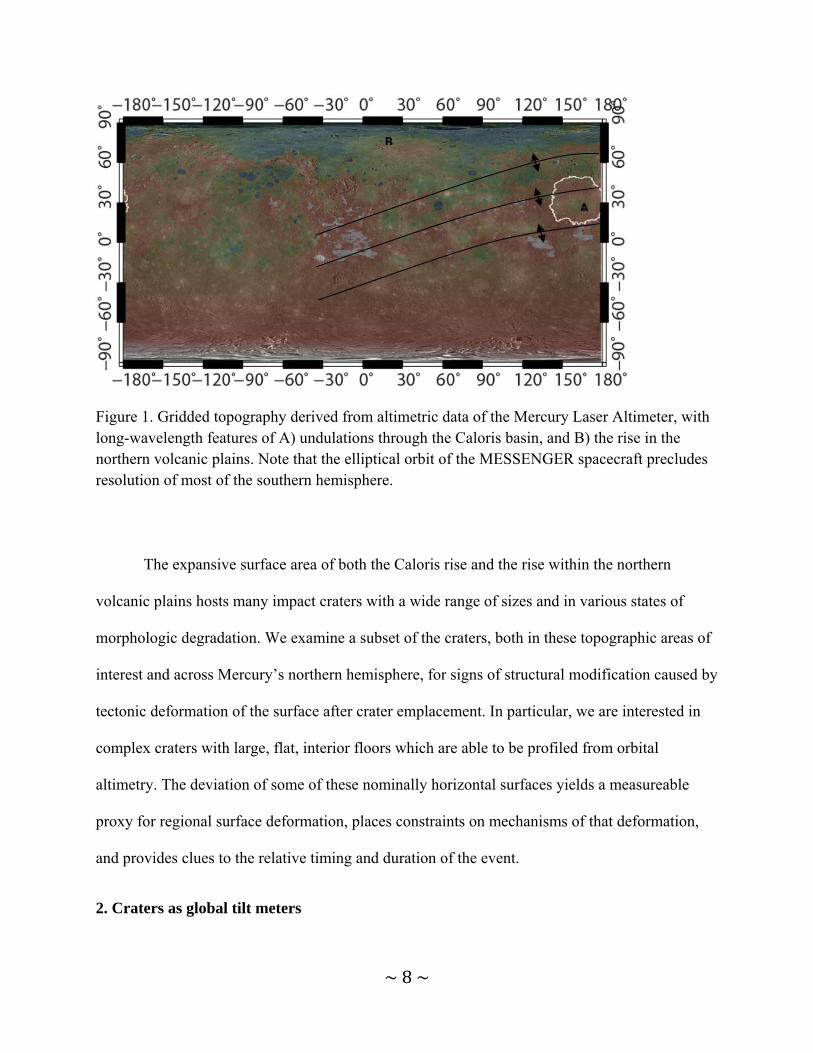
plains, intercrater plains, and heavily cratered terrain [Figure 1]. These topographic features are
characterized by low-amplitude undulations with peak-to-peak wavelengths of 800-1400 km,
long axes up to several thousand km in length, and trough-to-peak amplitudes of up to 3 km
[Klimczak et al., 2013].
MLA data also indicate the presence of an isolated, radially-symmetric domical feature
approximately 1000 km in diameter [Figure 1] that is positioned within the confines of the
smooth volcanic northern plains [Dickson et al., 2012; Zuber et al., 2012]. This rise appears to be
nearly indistinguishable from the surrounding plains in optical characteristics, though
preliminary analyses indicate that it may have a slightly different orientation of wrinkle ridges as
~7~
well as a marginally elevated crater density. Further, these characteristics are not suggestive of a
volcanic provenance for the surrounding plains [Dickson et al., 2012]. These observations yield
some limited constraint on possible mechanisms of formation, but very little in the way of
timing.
The determination of whether these features formed in isolation or whether they are
genetically linked has important implications for Mercury’s tectonic evolution. In order to
inform such an interpretation, a chronologic context for each locale must be established and
interrogated for possible temporal correlation. Establishing the chronology of the development of
the long-wavelength topographic features is assisted by their position within the smooth plains
comprising the surfaces of the Caloris interior and that of the northern volcanic plains. In concert
with ages of the plains material derived from crater size-density distributions, this geologic
relationship places the initial development of both topographic rises to be younger than the onset
of the Calorian [Mccauley et al., 1981; Spudis and Guest, 1988] and any additional time required
for the filling of the basin interior. Constraining the duration of deformation activity associated
with these structures is more challenging however, since tectonic fabric resulting from relatively
small strain of the surface may not be present in sufficient abundance to date relative to
recognized stratigraphic units.
~8~
Figure 1. Gridded topography derived from altimetric data of the Mercury Laser Altimeter, with long-wavelength features of A) undulations through the Caloris basin, and B) the rise in the northern volcanic plains. Note that the elliptical orbit of the MESSENGER spacecraft precludes resolution of most of the southern hemisphere.
The expansive surface area of both the Caloris rise and the rise within the northern
volcanic plains hosts many impact craters with a wide range of sizes and in various states of
morphologic degradation. We examine a subset of the craters, both in these topographic areas of
interest and across Mercury’s northern hemisphere, for signs of structural modification caused by
tectonic deformation of the surface after crater emplacement. In particular, we are interested in
complex craters with large, flat, interior floors which are able to be profiled from orbital
altimetry. The deviation of some of these nominally horizontal surfaces yields a measureable
proxy for regional surface deformation, places constraints on mechanisms of that deformation,
and provides clues to the relative timing and duration of the event.
2. Craters as global tilt meters
A
B
~9~
Impact cratering is perhaps the most ubiquitous process that operates on the surfaces of
terrestrial bodies, and it provides a body of evidence that can be interrogated for information on
the history of surface processes [Wood et al., 1977]. On Mercury, as on the Moon, impact
structures are generally well-preserved as erosion is less effective than on Earth or Mars. In
comparison to lunar impact craters, those on Mercury have a smaller depth-to-diameter ratio and
larger, more distinct, interior impact melt sheets [Pike, 1988; Barnouin et al., 2012]. It is the
latter characteristic that makes Mercury’s craters particularly useful as indicators of topographic
change, as these expansive flat floors should have formed as horizontal surface and therefore
deviations from horizontal are a consequence of surface changes.
As a preliminary step to the investigation, we estimated a lower bound on the diameter of
craters that could be sampled by the MLA instrument with enough resolution to obtain a least-
squares fit. Using the common rule of thumb for linear regression [Harrell, 2001], we set the
minimum threshold for number of points in any measured profile at 10. At the nominal MLA
shot spacing of 400 m, this means that we require a minimum floor profile of 4 km, well below
the simple-to-complex transition size of 12 km [Pike, 1988; Barnouin et al., 2012].
In order to determine whether 12 km represents a reasonable lowest threshold for crater
diameter, we use impact melt scaling relationships to find the expected area of a pristine melt
pool [Pierazzo et al., 1997]. These relationships are normalized to the radius of the projectile,
which is related to the diameter of the transient cavity. Equation 9 of [Croft, 1985] gives the
transient cavity diameter for a complex crater as:
. . . . [ 1 ]
~10~
where DQ is the simple-complex transition diameter of 12 km for Mercury [Pike, 1988; Barnouin
et al., 2012] and Dr is the rim-to-rim diameter of the final crater. Since our test case is for exactly
the size of the transition diameter, the transient cavity is identically 12 km. The projectile
diameter is computed from [Schmidt and Housen, 1987] as:
1.16 . . . [ 2 ]
where Dtc is the transient crater diameter as above, Dpr is the projectile diameter, U is the average
impact velocity of ~56 km/s for asteroids and parabolic comets on Mercury [Schultz, 1988] and g
is the gravitational acceleration of the planet [Pierazzo et al., 1997].
We then use the derived relationships for radius of complete melt and depth to center of
complete melt from a dunite projectile from [Pierazzo et al., 1997]:
0.823 0.793 [ 3 ]
and
1.04 0.87 [ 4 ]
Where rcm is the radius of the buried impact melt body and dcm is the depth to the center of the
melted body. We obtain a spherical approximation of total melt volume of diameter 5.40 km at a
depth of 2.26 km below the surface. Using the depth-diameter relationship of [Pike, 1985]:
0.410 . [ 5 ]
as representative of the post-collapse excavation cavity, we find that in this scenario, the
geometry of the spherical melt body intersects the surface with a circular cross-section of
approximately 5 km in diameter, lying on the 1.4 km-deep interior floor of the crater. However,
flat interiors of this size are rarely observed in craters that are near the simple-complex transition

~11~
size, likely due to obscuration by slumping or mass wasting of the crater wall. We therefore
consider a diameter of 15 km to be the lowest limit for inclusion in this study.
We use the present day slope of this interior impact melt sheet as an indicator of regional
topographic change, similar to the application of tilt meters in terrestrial settings [Dzurisin et al.,
1983]. Moreover, in the absence of significant localized deformation, erosion or deposition,
departure of this surface, en masse, from its originally horizontal configuration is driven
primarily by the development of regional topographic changes subsequent to crater formation.
While populations of impact craters are useful for establishing the chronology of
planetary surface processes at regional scales [Spudis and Guest, 1988; Strom and Neukum,
1988; Neukum et al., 2001; Strom et al., 2008; Marchi et al., 2013] determination of the ages of
individual craters using similar statistical methods is more challenging due to the small surface
area collecting subsequent impacts. Regional volcanism, space weathering, ballistic
sedimentation of ejecta from distant impacts, and subsequent impacts all act to steadily degrade
crater morphology over time, resulting in a distinctive difference in appearance between old and
young craters [Mccauley et al., 1981; Spudis and Guest, 1988; Craddock and Howard, 2000].
Using these characteristics, [Malin and Dzurisin, 1977] identified two distinct classes of craters:
fresh and degraded, which represent a rough context for age. Because the degraded craters may
have the original crater floor configuration obscured or destroyed by infilling and disruption, we
are concerned mainly with fresh-appearing craters. These well-preserved craters are identified by
rims and floors that are clearly distinguishable from each other as well as the surrounding plains
in slope, roughness, and often display albedo and spectral contrasts. Since erosive processes act
continuously to degrade surface features, the state of degradation of the crater morphology can
be used as a proxy for the relative age of the crater [Pohn and Offield, 1970] with finer resolution
~12~
than the binary system of [Malin and Dzurisin, 1977]. Trask (1971) describes the use of multiple
morphologic features, inclusive of both fresh and degraded craters, to discretize the continuum of
morphologic ages [Trask, 1971]. This classification scheme was further refined for Mercurian
craters over 30 km in diameter [Mccauley et al., 1981] where each crater was assigned a class of
C1 (the oldest, most degraded) through C5 (the most pristine). These relative ages can be useful
for estimating the time of formation of a regional structure. For example, if multiple craters of
different ages are emplaced on the flank of a rise during its formation, they will sense different
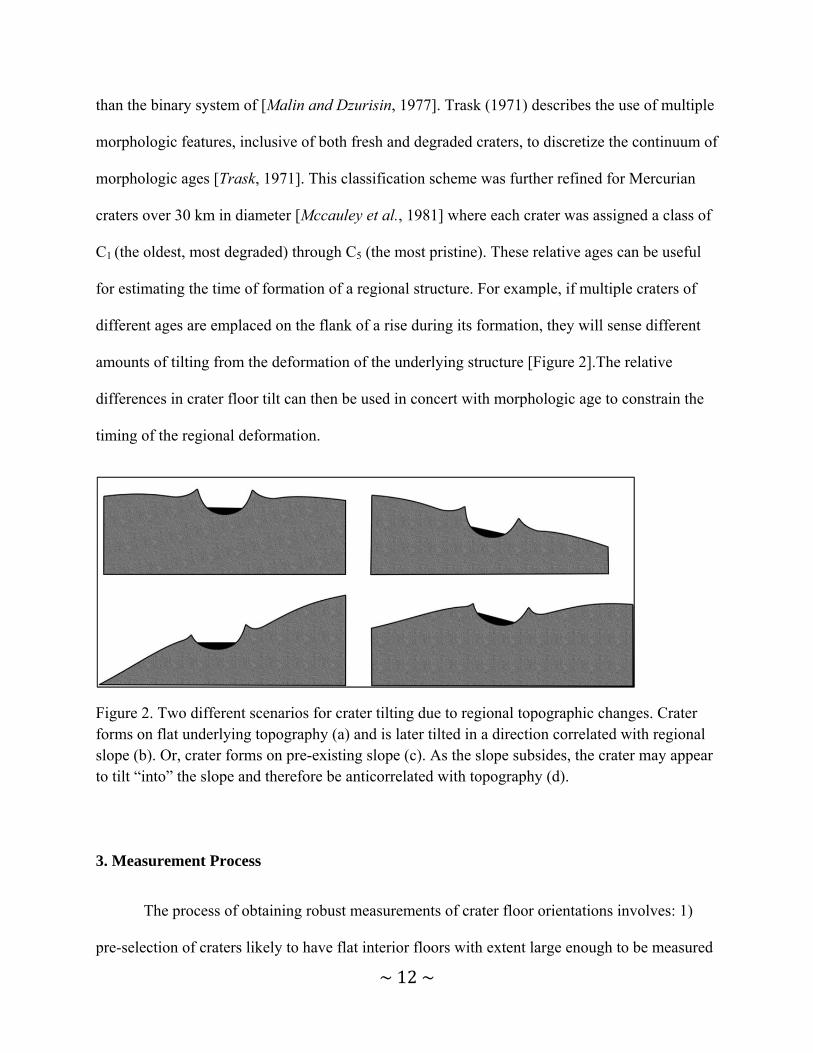
amounts of tilting from the deformation of the underlying structure [Figure 2].The relative
differences in crater floor tilt can then be used in concert with morphologic age to constrain the
timing of the regional deformation.
Figure 2. Two different scenarios for crater tilting due to regional topographic changes. Crater forms on flat underlying topography (a) and is later tilted in a direction correlated with regional slope (b). Or, crater forms on pre-existing slope (c). As the slope subsides, the crater may appear to tilt “into” the slope and therefore be anticorrelated with topography (d).
3. Measurement Process
The process of obtaining robust measurements of crater floor orientations involves: 1)
pre-selection of craters likely to have flat interior floors with extent large enough to be measured
~13~
by the MLA instrument, 2) inspection of altimetric profiles in concert with imagery to determine
suitability and the boundaries of the segment to be measured, and 3) trend fitting of MLA data
points to either a line or plane depending on whether a single or multiple altimetric profiles are
available. This process is illustrated by the flowchart of Figure 1 in the Appendix.
3.1 Visual Pre-selection of Candidate Craters
We used global image mosaics with resolutions of 250 meters per pixel, created from the
Mercury Dual Imaging System (MDIS) [Gold et al., 2001] Near Angle Camera (NAC) and Wide
Angle Camera (WAC) imaging campaigns, to identify flat-floored candidate impact craters. In
practice, the criteria for “flat” floors include characteristics in both imagery and topography. In
orbital images, inclusion is determined by surfaces that appear to form planar and contiguous
surfaces with clear margins that delineate the interior wall from floor. The included geographic
range of 0° to 80° north latitude brackets those craters that are likely to be profiled by MLA in
the low latitudes, and those in the high latitudes where the profiled floors are sun-illuminated. On
Mercury, impact crater shapes transition from simple bowl-shaped depressions to complex peak,
peak-ring, or multi-ring structures at rim-to-rim diameters ranging from 8 to 14 kilometers [Pike,
1988; Barnouin et al., 2012]. The 400 m along-track shot spacing of MLA restricts the lower
bound of useable profile lengths. In our analysis, profiles with total surface distance of less than
10 km have a mean statistical line fit p-value of > 0.20, indicating that the linear regression
predictors are poor models of the topography and therefore significantly reducing their
usefulness as slope measurements. Given that the area of the crater floor is some fraction of the
rim-to-rim diameter, and that the MLA profiles generally transect only a portion of the floor, we
find that in practice, craters with diameters of < 20 km do not result in robust slope fits. Thus, for
the following analyses we consider only craters of 20 km in diameter or greater. In order to
~14~
isolate impact craters that represent a paleo-horizontal surface from those that may have been
resurfaced (and therefore do not record regional tectonic information), we identify fresh-
appearing craters in high resolution MDIS imagery. These typically have flat interior floors
composed of largely intact impact melt sheets, but may also include craters with floors that
appear to have been only lightly and uniformly veneered by secondary processes while still
retaining a distinctly planar and continuous surface. These types of craters comprise types C3-C5
in the McCauley (1981) morphological classification scheme [Mccauley et al., 1981]. Of
particular interest are those craters that are the most pristine, containing observable interior melt
sheets. Though these craters are sparse, they are more readily identified than degraded ones, and
there are several characteristics that can be used to assist in this assessment [Ostrach et al.,
2012]. First, the contact between the interior crater wall and floor forms a sharp, rather than
diffuse boundary, except where wall collapse or subsequent impact degradation is observed.
Next, there is an absence of superposed craters which have been embayed by lava flows. A third
feature, the absence of through-cutting tectonic deformation such as wrinkle ridges, graben, and
lobate scarps is suggestive of a young interior. Observations of tectonic fabric, however, are a
limited by both the lighting incidence angle and resolution of orbital imagery, making it
challenging as a universal indicator. Continuity and smoothness of the crater floor, wall, and rim
also provide preliminary age context that is valuable in determining whether the floor material is
likely to be impact melt [Ostrach et al., 2012]. Post-emplacement tilting of these young craters
would therefore indicate that tectonic processes were recently active in the host region.
3.2 Inspection and Inclusion/Exclusion of Altimetric Profiles
Using only the high-threshold, short-integration trigger channel of the MLA instrument
data [Cavanaugh et al., 2007b], we do a track-by-track search for well-resolved elevation

~15~
profiles through the candidate craters. These MLA segments are then further verified using both
high- and low illumination angle MDIS imagery in order to exclude shot returns from interior
wall slumps, terraces, heavily faulted floors, peaks and rings, distal ejecta, and other features that
are inconsistent with a contiguous impact melt sheet. We note that this process of visual
confirmation and inclusion/exclusion of data based on morphology is used only to define the two
endpoints of an included segment, or to exclude the profile altogether. We do not identify or
remove isolated shot returns as “outliers” within a given segment but consider them rather to be
representative of the crater floor geology. These can be due large boulders, small superposed
craters, hollows, or hummocks, or other small features on the scale of a single shot interval.
When larger features clearly dominate the segment, like a profile though a central peak, the
profile is either excluded completely or if sufficient data points are present, one side of the
bisecting segment may be included. When multiple rings are present, we choose to include a
single track segment that lies inside the central ring. If the track does not pass through the
innermost ring of the crater in these cases, the floor of the secondary ring is included as an
acceptable substitute. The inspection of the topographic profile provides the second criterion for
inclusion: The altimetric data points must reasonably fit a trend is linear about the crater center.
This specifically excludes inward or outward dipping surface (bowl or dome-shaped) as well as
those with major through-going faults. In general, this results in the profiles with the longest
cross-floor track and the highest number of shot returns. This process is illustrated with an
example from our data set in Figure 3.
~16~
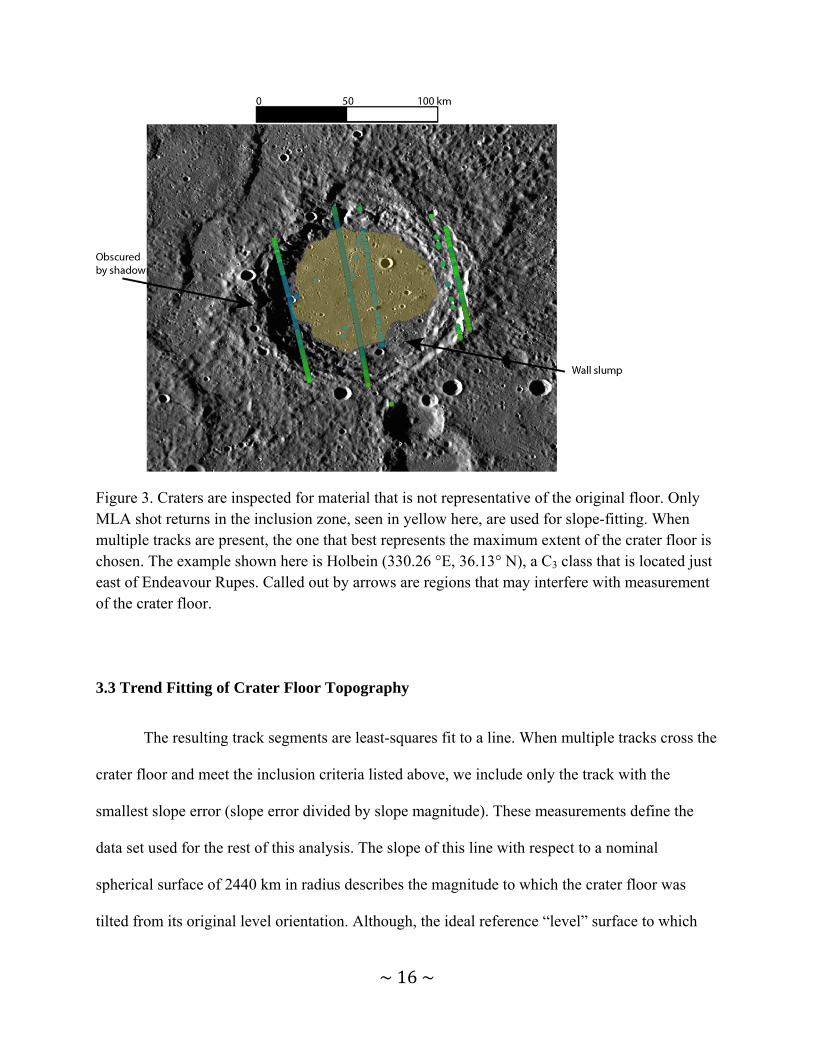
Figure 3. Craters are inspected for material that is not representative of the original floor. Only MLA shot returns in the inclusion zone, seen in yellow here, are used for slope-fitting. When multiple tracks are present, the one that best represents the maximum extent of the crater floor is chosen. The example shown here is Holbein (330.26 °E, 36.13° N), a C3 class that is located just east of Endeavour Rupes. Called out by arrows are regions that may interfere with measurement of the crater floor.
3.3 Trend Fitting of Crater Floor Topography
The resulting track segments are least-squares fit to a line. When multiple tracks cross the
crater floor and meet the inclusion criteria listed above, we include only the track with the
smallest slope error (slope error divided by slope magnitude). These measurements define the
data set used for the rest of this analysis. The slope of this line with respect to a nominal
spherical surface of 2440 km in radius describes the magnitude to which the crater floor was
tilted from its original level orientation. Although, the ideal reference “level” surface to which

~17~
the crater floors are compared is defined by the Mercury’s aspherical global equipotential [Smith
et al., 2010], the profile lengths are small compared to variations in the equipotential. On
Mercury, this means that the maximum change in profile slopes due to the difference between
the equipotential surface and the spherical reference is < 0.02°, which is well below the error in
line fits.
Because each segment is a subset of an individual MLA track, the resulting
measurements are necessarily in the same direction as MESSENGER’s orbit. This yields a tilt
measurement that is a projection of the actual magnitude and direction (traditionally, “apparent
dip” versus “true dip”), and hence equal to or smaller than the true tilt. Since MESSENGER’s
ground track is roughly north-south, this means that craters with tilts dominantly in the east or
west direction, such as those that might be expected to be observed on the flanks of north-south
trending features, will have apparently smaller tilt magnitudes. However, many of the long-
wavelength features have roughly east-west trends [Figure 1] and are well-represented in our
data set.
To further constrain the absolute magnitude and direction of tilt, we assembled a second
database of measurements derived from two-dimensional, least-squares, plane fits to craters with
multiple high-fidelity MLA profiles. The points to which the planes were fit were individually
selected from each track passing through the crater floor using the same inclusion criteria as the
single-track selections. A significant advantage of this approach is that in situations where a
single crater profile contains too few shot returns to reliably fit a line and thusly excludes a
potentially useful crater, the collection of shots from multiple tracks can result in a high-
confidence tilt measurement. In cases where the crater floor was well-sampled by multiple along-
track profiles, these plane fits were then used to supplement the along-track measurements,
~18~
especially where the general orientation of regional topography did not trend perpendicular to the
MLA ground track. This is especially valuable when profiles exist for portions of the floor that
are opposite each other and separated by a central peak or peak-ring. While northern latitudes
have sufficiently dense altimetric data for both types of measurements, increased cross-track
spacing of the MLA profiles at the lower latitudes often lack multiple tracks within crater floors
for the use of plane-fitting.
In order to establish the chronology of tectonic deformation, we first determine the
morphologic degradation classification of profiled craters. Following previous workers[Pohn and
Offield, 1970; Arthur, 1974; Arvidson, 1974; Malin and Dzurisin, 1977; Wood et al., 1977;
Mccauley et al., 1981; Spudis and Guest, 1988; Barnouin et al., 2012], we assigned morphologic
class based on several crater characteristics, including ejecta rays and halos, rim sharpness and
continuity, proximal secondary craters and crater chains, smoothness of exterior rim deposits,
and scalloped interior walls. We also include the visual smoothness (that is, the appearance of an
intact, planar surface at 250 mpp resolution) of an identifiable interior floor as a particularly
useful indicator for fresh craters. The most pristine craters (C5) are identified often, but not
exclusively, by the presence of high-albedo ejecta rays. This class also has a nearly undisturbed
interior floor and proximal ejecta apron completely lacking embayed craters with few superposed
craters [Figure 4a]. The interior walls of these craters often support distinct terraces with visible
melt pools and extensive segments of continuous, sharply scalloped rims. The C4 class craters
[Figure 4b] have no ejecta rays, may have superposed craters on both the interior floor and
exterior proximal ejecta apron, and possess rims that are slightly discontinuous and less sharp
than those of C5. C3 craters [Figure 4c] have significantly degraded and discontinuous rims,
subdued scalloped walls, and an interior floor that has a distinct change in slope from that of the

~19~
interior wall but does not display a clear line of intersection between the two. Some C2 and C1
craters are included in our survey for comparison, though their utility is diminished by volcanic
resurfacing and heavy modification. Class C2 [Figure 4d] craters generally retain a visibly
depressed interior floor, though it is no longer distinctly identified from the interior walls, which
themselves are subdued with no evidence of scallops. C1 craters [Figure 4e] are often identified
only by a faint raised rim, but generally have very shallow interiors and no discernable difference
between interior wall and crater floor. Both C2 and C1 types are heavily modified by the
destructive effects of direct and distal impacts.
~20~
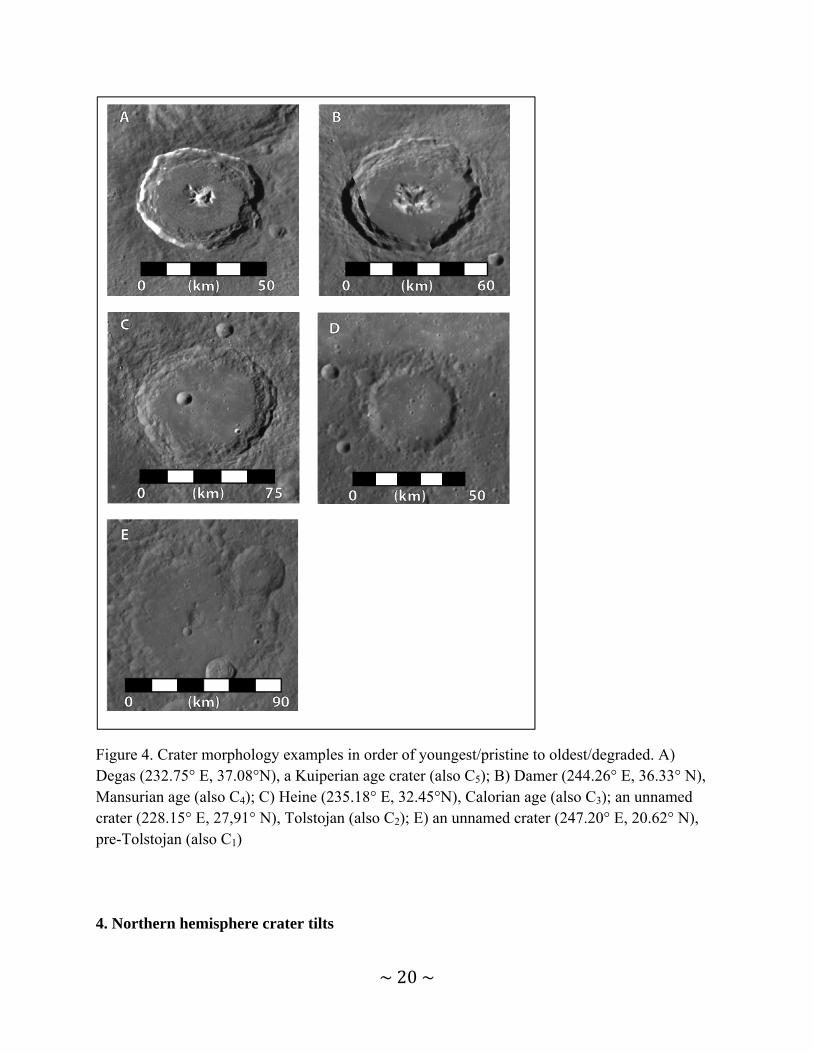
Figure 4. Crater morphology examples in order of youngest/pristine to oldest/degraded. A) Degas (232.75° E, 37.08°N), a Kuiperian age crater (also C5); B) Damer (244.26° E, 36.33° N), Mansurian age (also C4); C) Heine (235.18° E, 32.45°N), Calorian age (also C3); an unnamed crater (228.15° E, 27,91° N), Tolstojan (also C2); E) an unnamed crater (247.20° E, 20.62° N), pre-Tolstojan (also C1)
4. Northern hemisphere crater tilts
~21~
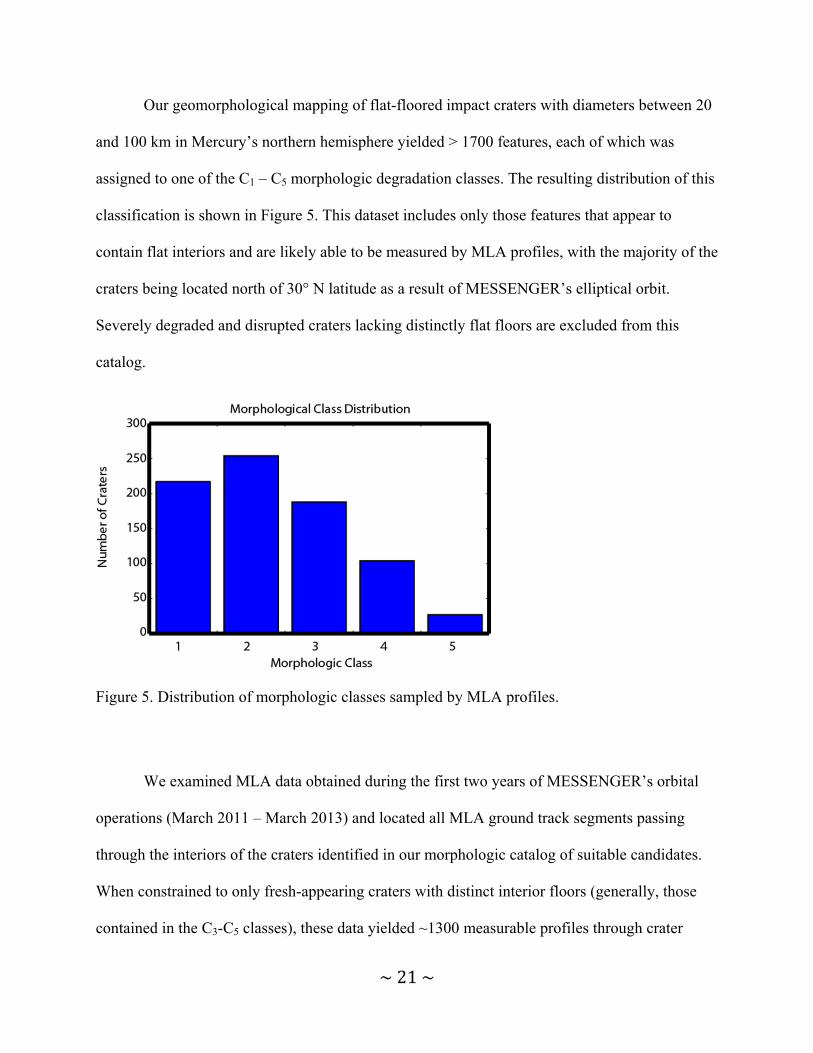
Our geomorphological mapping of flat-floored impact craters with diameters between 20
and 100 km in Mercury’s northern hemisphere yielded > 1700 features, each of which was
assigned to one of the C1 – C5 morphologic degradation classes. The resulting distribution of this
classification is shown in Figure 5. This dataset includes only those features that appear to
contain flat interiors and are likely able to be measured by MLA profiles, with the majority of the
craters being located north of 30° N latitude as a result of MESSENGER’s elliptical orbit.
Severely degraded and disrupted craters lacking distinctly flat floors are excluded from this
catalog.
Figure 5. Distribution of morphologic classes sampled by MLA profiles.
We examined MLA data obtained during the first two years of MESSENGER’s orbital
operations (March 2011 – March 2013) and located all MLA ground track segments passing
through the interiors of the craters identified in our morphologic catalog of suitable candidates.
When constrained to only fresh-appearing craters with distinct interior floors (generally, those
contained in the C3-C5 classes), these data yielded ~1300 measurable profiles through crater
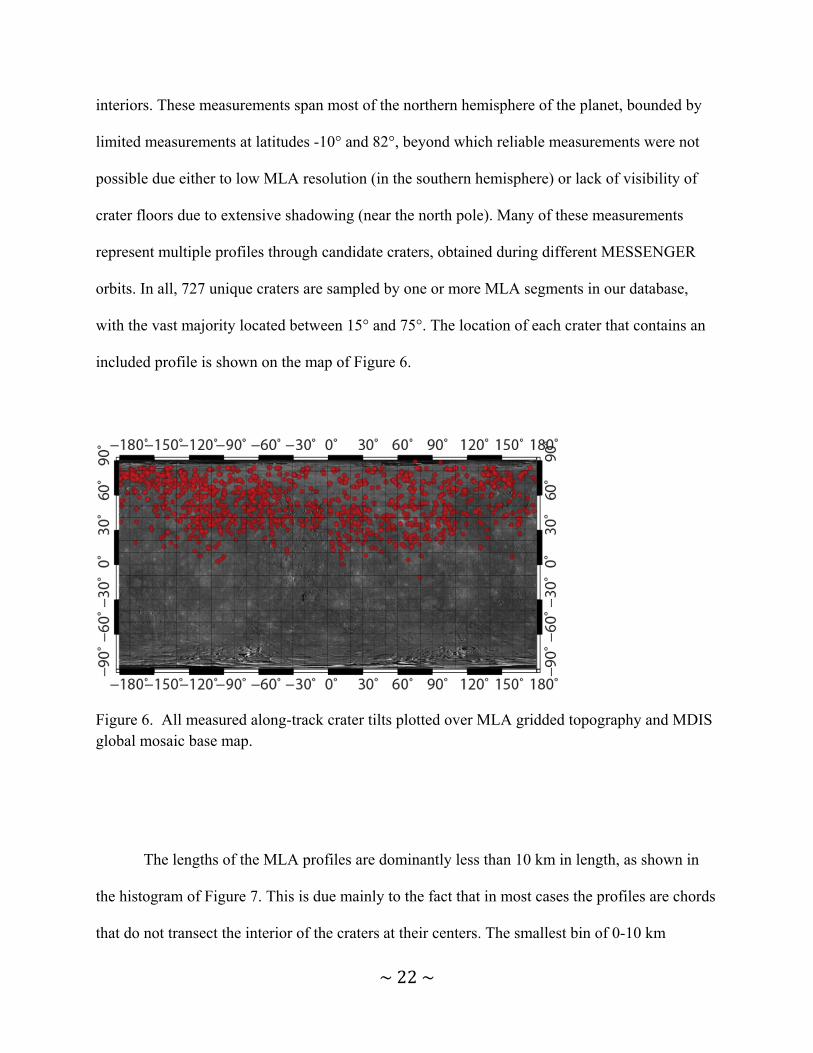
~22~
interiors. These measurements span most of the northern hemisphere of the planet, bounded by
limited measurements at latitudes -10° and 82°, beyond which reliable measurements were not
possible due either to low MLA resolution (in the southern hemisphere) or lack of visibility of
crater floors due to extensive shadowing (near the north pole). Many of these measurements
represent multiple profiles through candidate craters, obtained during different MESSENGER
orbits. In all, 727 unique craters are sampled by one or more MLA segments in our database,
with the vast majority located between 15° and 75°. The location of each crater that contains an
included profile is shown on the map of Figure 6.
Figure 6. All measured along-track crater tilts plotted over MLA gridded topography and MDIS global mosaic base map.
The lengths of the MLA profiles are dominantly less than 10 km in length, as shown in
the histogram of Figure 7. This is due mainly to the fact that in most cases the profiles are chords
that do not transect the interior of the craters at their centers. The smallest bin of 0-10 km
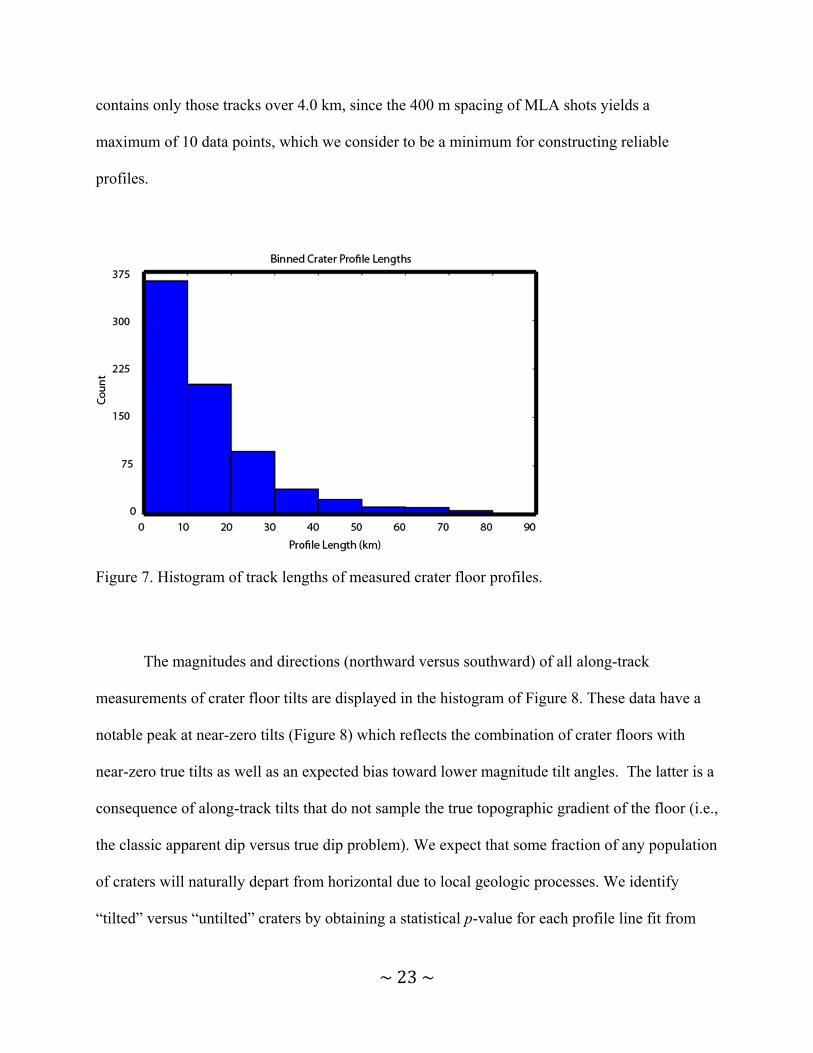
~23~
contains only those tracks over 4.0 km, since the 400 m spacing of MLA shots yields a
maximum of 10 data points, which we consider to be a minimum for constructing reliable
profiles.
Figure 7. Histogram of track lengths of measured crater floor profiles.
The magnitudes and directions (northward versus southward) of all along-track
measurements of crater floor tilts are displayed in the histogram of Figure 8. These data have a
notable peak at near-zero tilts (Figure 8) which reflects the combination of crater floors with
near-zero true tilts as well as an expected bias toward lower magnitude tilt angles. The latter is a
consequence of along-track tilts that do not sample the true topographic gradient of the floor (i.e.,
the classic apparent dip versus true dip problem). We expect that some fraction of any population
of craters will naturally depart from horizontal due to local geologic processes. We identify
“tilted” versus “untilted” craters by obtaining a statistical p-value for each profile line fit from
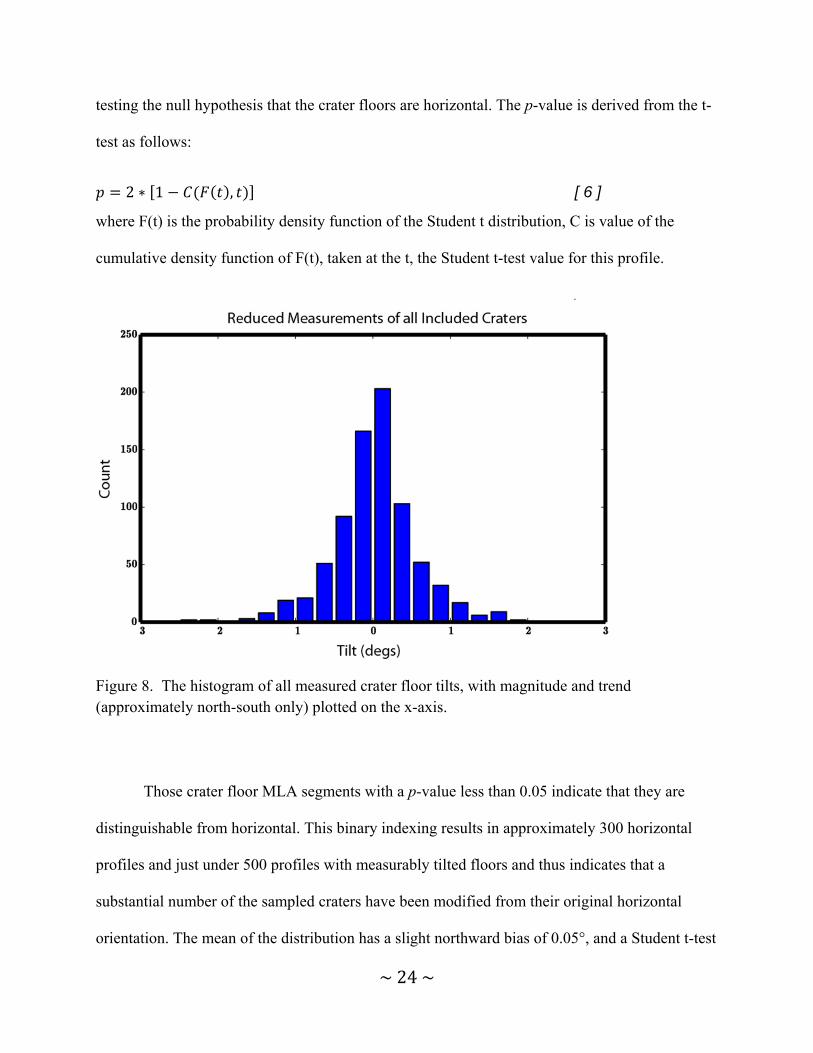
~24~
testing the null hypothesis that the crater floors are horizontal. The p-value is derived from the t-
test as follows:
2 ∗ 1 , [ 6 ]
where F(t) is the probability density function of the Student t distribution, C is value of the
cumulative density function of F(t), taken at the t, the Student t-test value for this profile.
Figure 8. The histogram of all measured crater floor tilts, with magnitude and trend (approximately north-south only) plotted on the x-axis.
Those crater floor MLA segments with a p-value less than 0.05 indicate that they are
distinguishable from horizontal. This binary indexing results in approximately 300 horizontal
profiles and just under 500 profiles with measurably tilted floors and thus indicates that a
substantial number of the sampled craters have been modified from their original horizontal
orientation. The mean of the distribution has a slight northward bias of 0.05°, and a Student t-test
~25~
indicates that this is robust, though such a small bias is difficult to ascribe to a particular
geological mechanism. In order to investigate the relationship of the magnitudes of measured
crater tilt to the slope of the regional topography, following Neumann (2012), we convert the
MLA gridded data into a spherical harmonic model complete through degree and order 36
[Neumann et al., 2012]. With a minimum wavelength of ~400 km, this acts as a low-pass
spectral filter and retains sufficient resolution of the shortest-wavelength topographic undulations
of wavelength ~800 km [Klimczak et al., 2013]. Practically, this means that basin-sized features,
which may significantly affect regional topography, are resolved but smaller craters are
effectively filtered out. In this way, we are able to compare profile-by-profile measurements of
crater floors to their corresponding underlying trends.
In order to compare character of the naturally-occuring slopes on the planet to those
profiled craters and thereby constrain the background slope variability, we sampled all MLA
profiles at spatially random locations and compared the resulting distribution of tilt angle to
those of our crater database. By using a distribution of track lengths consistent with that of the
crater floor segments, we include the effects of along-track shallowing of observed slopes. As
with the crater floor profiles, we obtained the slope of the surface by fitting a linear function via
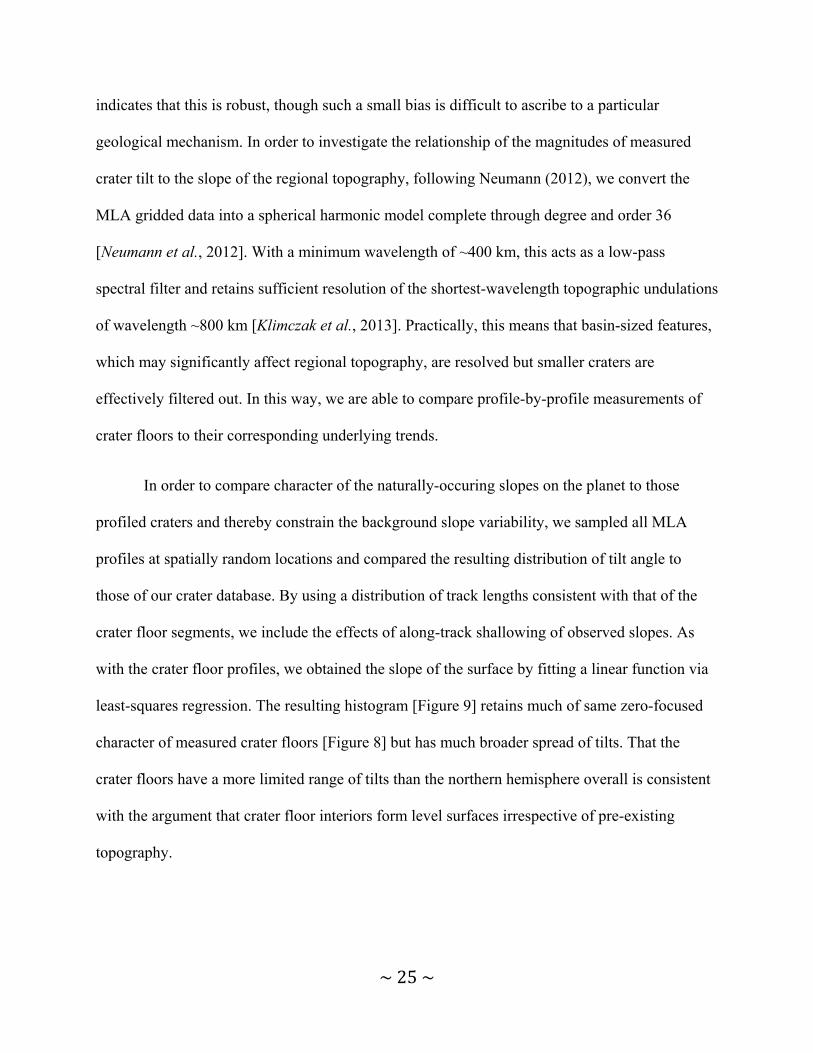
least-squares regression. The resulting histogram [Figure 9] retains much of same zero-focused
character of measured crater floors [Figure 8] but has much broader spread of tilts. That the
crater floors have a more limited range of tilts than the northern hemisphere overall is consistent
with the argument that crater floor interiors form level surfaces irrespective of pre-existing
topography.
~26~
Figure 9. Histogram of along-track tilts, selected from a uniform random distribution of all points in all MLA profiles included in this study. Tilt is computed using the same linear least-squares fit from as Figure 8 above, and the path length of the selected random samples has been normalized to the distribution of track lengths in Figure 8.
5. Comparison of crater floor tilts with long-wavelength topography
Mechanisms responsible for the reorientation of the crater floors are likely to have
operated over a variety of spatial and temporal scales. The operation of these multiple processes
during the life of any single crater likely combine to create a convolved signal in the floor
orientation. For instance, craters located on the highest gradients of regional topographic features
are most likely to “sense” the deformation of the underlying surface. Those located on regional
maxima or minima, as well as those that post-date this topographic development, are more likely
to either retain their initial orientation or, if a measureable floor slope is present, by local rather
than regional processes. If the development of Mercury’s regional long-wavelength topography
beyond the spherical harmonic degree and order 2 shape (such as the trans-Calorian undulations
~27~
or the rise within the northern plains), developed during the time of the geologically “recent”
formation of the flat-floored impact craters, we expect there to be some observable correlation
between the deformation of some number of craters and that of the underlying surface. We
therefore use our analysis of a large number of craters to find trends that should be attributable to
the dominant deformation process. In order to isolate those craters that may have been modified
by regional deformation of the host surface, we examine floor topographic profiles that are
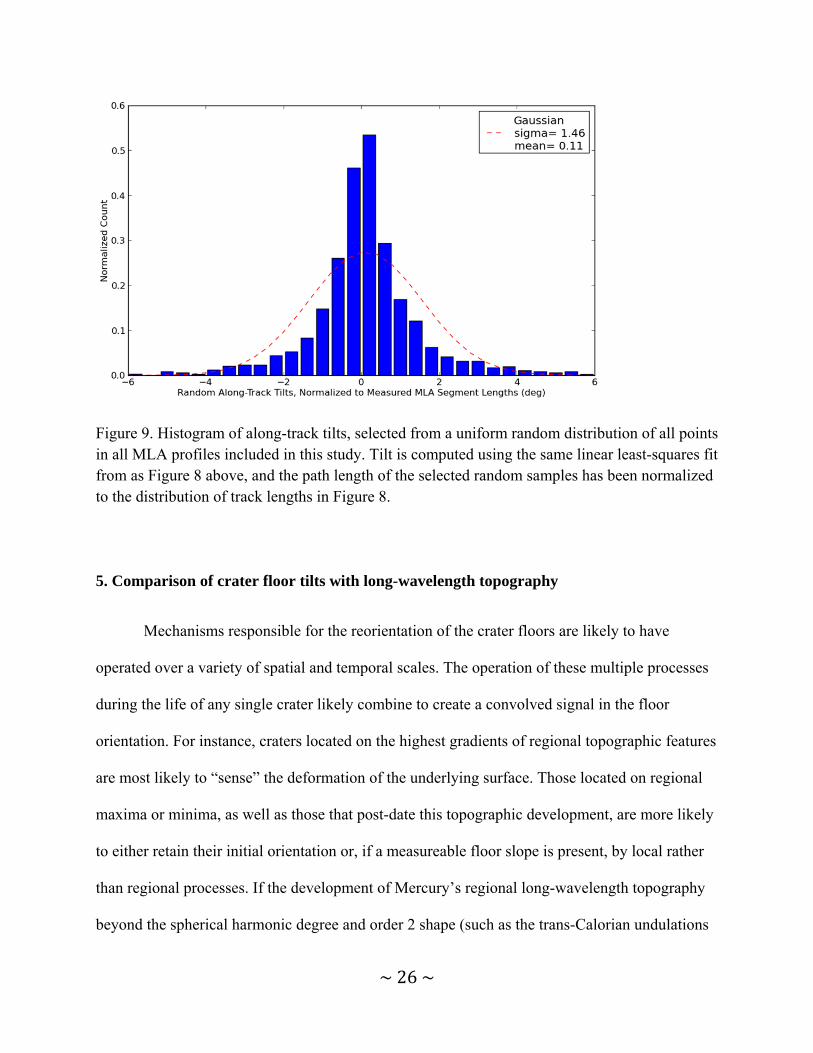
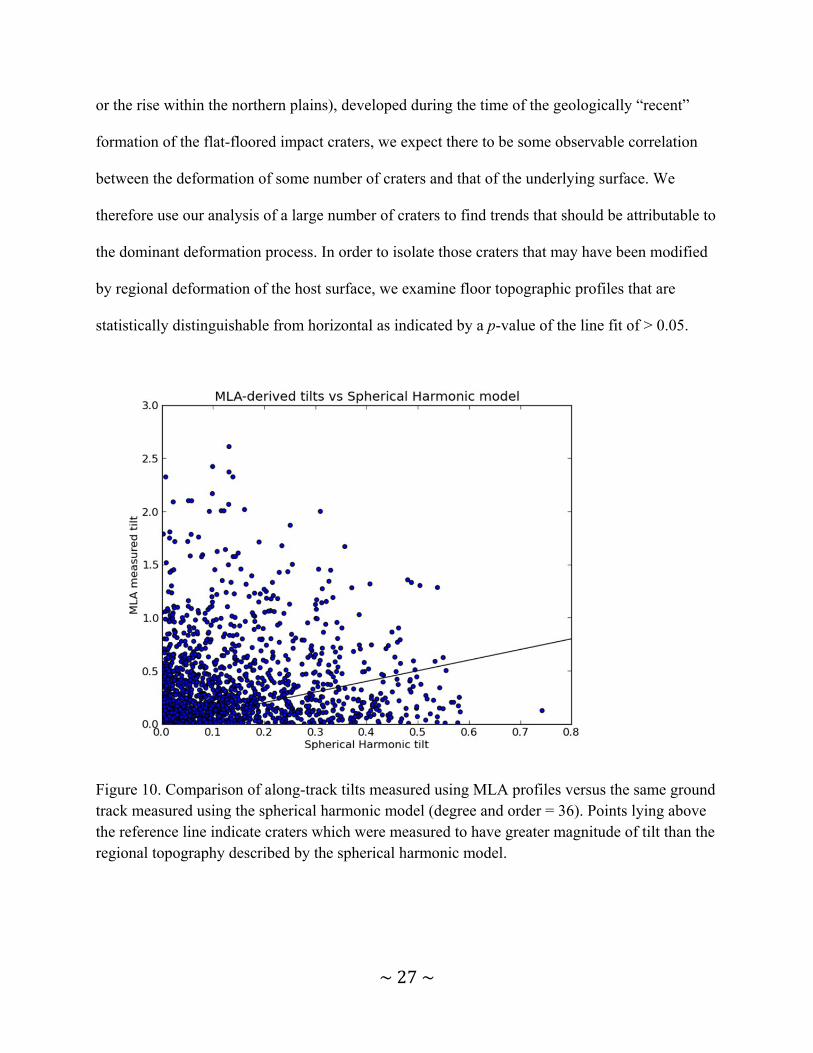
statistically distinguishable from horizontal as indicated by a p-value of the line fit of > 0.05.
Figure 10. Comparison of along-track tilts measured using MLA profiles versus the same ground track measured using the spherical harmonic model (degree and order = 36). Points lying above the reference line indicate craters which were measured to have greater magnitude of tilt than the regional topography described by the spherical harmonic model.
~28~
If the tilts of the crater floors were controlled by either a purely stochastic process, or at
least not influenced in large part by the long-wavelength topography, we would expect roughly
half of the craters to be anti-correlated in dip direction. That is, half of the non-horizontal craters
would be dipping along the regional slope and the other half would dip into the regional slope.
We find that of the 495 non-horizontal crater floor profiles, 68% have a dip direction that
correlates with the regional slope. A plot of measured tilts versus along-track slopes in the
relatively long-wavelength topography of the degree and order 36 spherical harmonic model of
topography [Figure 10] has a notable amount of scatter. This is not entirely unexpected, as the
craters in this data set were formed over a wide range of Mercury’s history, and therefore likely
capture the full range of stages of development of the planet’s regional scale topography. A
histogram [Figure 11] of the difference between the crater floor slopes and regional slopes at
measured locations shows that most of the misfit is concentrated at very small slopes. This is
reasonable and expected since the smaller craters are generally younger, due to decreasing
impactor flux over time [Strom and Neukum, 1988] and they are therefore less likely to predate
global or regional topographic changes. This same effect results in fewer sampled craters at these
large diameters than smaller ones. In addition, the sampled MLA track lengths on the floors of
small craters contain fewer individual shot returns, making the measurement more sensitive to
isolated fluctuations on the floor surface.
~29~
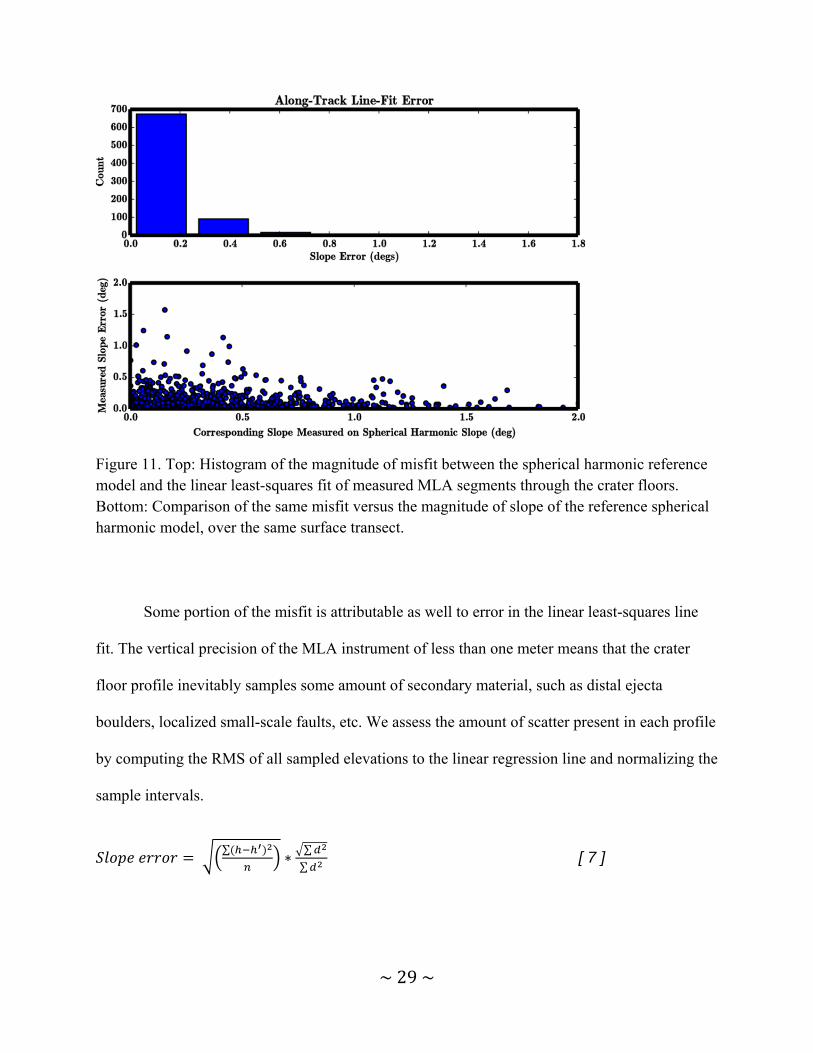
Figure 11. Top: Histogram of the magnitude of misfit between the spherical harmonic reference model and the linear least-squares fit of measured MLA segments through the crater floors. Bottom: Comparison of the same misfit versus the magnitude of slope of the reference spherical harmonic model, over the same surface transect.
Some portion of the misfit is attributable as well to error in the linear least-squares line
fit. The vertical precision of the MLA instrument of less than one meter means that the crater
floor profile inevitably samples some amount of secondary material, such as distal ejecta
boulders, localized small-scale faults, etc. We assess the amount of scatter present in each profile
by computing the RMS of all sampled elevations to the linear regression line and normalizing the
sample intervals.
∑
∗∑
∑ [ 7 ]
~30~
where h is the measured elevation, h’ is the elevation predicted by the line fit, d is the distance
between two consecutive points and n is the number of segments in the profile. As previously,
the largest line-fit error generally occurs at lower regional slope.
We can compensate somewhat for this error in the line fit by removing measurements
with a high magnitude of error. Specifically, we are interested in the portion of measured tilts
that are either correlated or anti-correlated with the regional slope. We first remove those
measurements that are indistinguishable from horizontal, as determined by a p-value > 0.05
(rejecting the null hypothesis that the data are not represented by the linear model). This results
in almost the complete elimination of all C5 craters and thus lends further support for the
assertion that young craters form level interior surfaces. We follow by removing profiles with
error high enough to make the azimuthal dip direction undetermined. The remaining
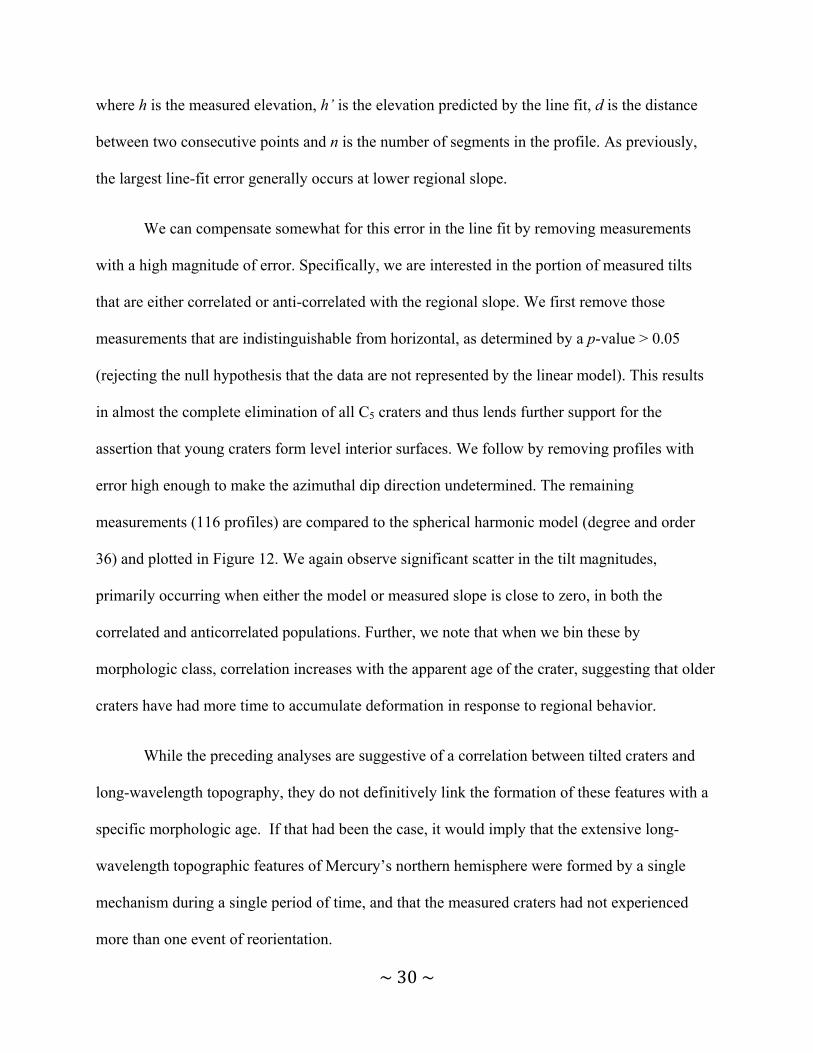
measurements (116 profiles) are compared to the spherical harmonic model (degree and order
36) and plotted in Figure 12. We again observe significant scatter in the tilt magnitudes,
primarily occurring when either the model or measured slope is close to zero, in both the
correlated and anticorrelated populations. Further, we note that when we bin these by
morphologic class, correlation increases with the apparent age of the crater, suggesting that older
craters have had more time to accumulate deformation in response to regional behavior.
While the preceding analyses are suggestive of a correlation between tilted craters and
long-wavelength topography, they do not definitively link the formation of these features with a
specific morphologic age. If that had been the case, it would imply that the extensive long-
wavelength topographic features of Mercury’s northern hemisphere were formed by a single
mechanism during a single period of time, and that the measured craters had not experienced
more than one event of reorientation.
~31~
Figure 12. Comparison of MLA-derived slope to spherical harmonic model slope. Craters with high line-fit error and those that are indistinguishable from zero are removed from the plot.
6. Regional Analysis
Analysis of crater floor tilts over large regions, or even globally, is useful for
understanding trends in topographic modification at the largest spatial and temporal timescales.
However, much of the planet’s tectonic activity is likely to be more regional in extent than
global, and thus is better studied by examining the orientations of crater floors within specific
geological contexts. Here we focus on two large topographic features that are well-resolved in
both orbital imagery and altimetry. The first is associated with the Caloris basin and the other is
the symmetrical rise within the northern volcanic plains [Zuber et al., 2012]. Both features are
orientated, at least in part, at right angles relative to MESSENGER’s ground tracks, making the
along track crater floor tilts a potentially valuable indicator of their development.
6.1 Caloris Basin
~32~
A depression 1550 kilometers in diameter, the Caloris Basin is one of the most dominant
features of Mercury’s surface [Murchie et al., 2008]. The morphology of the area enclosed by
the rim of the basin has been effectively reset twice: once by the impact, and again the volcanic
flooding events that produced the interior smooth plains [Murchie et al., 2008]. What makes this
region uniquely interesting and well-suited for investigation with crater floor tilts is the presence
of broad, undulatory topographic rises present in both the northern and southern portions of the
basin that trend approximately perpendicular to MESSENGER’s ground tracks. These features
were first observed in stereographic analysis of images from the spacecraft’s first fly-by [Oberst
et al., 2010] and confirmed in subsequent orbital laser altimetry [Zuber et al., 2012]. The
superposition of this massive feature on the interior, rim, and exterior plains of the Caloris basin
suggests that there was significant deformation of Mercury's surface subsequent to both the
impact event and volcanic flooding of the basin interior. Unraveling the formative processes for
these features is challenging, due to their relatively low amplitudes and long wavelengths that
render them rather subtle with respect to other features. Indeed, observations of graben and fault
systems in the basin do not suggest a relationship between faulting and the presence of the
undulations [Byrne et al., 2012]. This is perhaps surprising, given that such a large feature might
be expected to be the result of significant deformation and hence produce faulting at the surface
due to zones of compression and tension. However, the strain accommodated perpendicular to
the strike of the undulation can be estimated by comparing the path length of a best fit sine
function of amplitude 1.5 km and wavelength of 1400 km through a MLA profile transecting the
basin to the path length without topography. The difference between the surface track length (at
zero elevation) and the sinusoid fit is approximately 20 meters, indicating a linear surface strain
on the order of only 1E-5. Such a small strain is too small to lead to the finite strains found in
~33~
faulted terranes. This result illustrates the value of directly measuring topographic change over
these long-wavelength features rather than the faults.
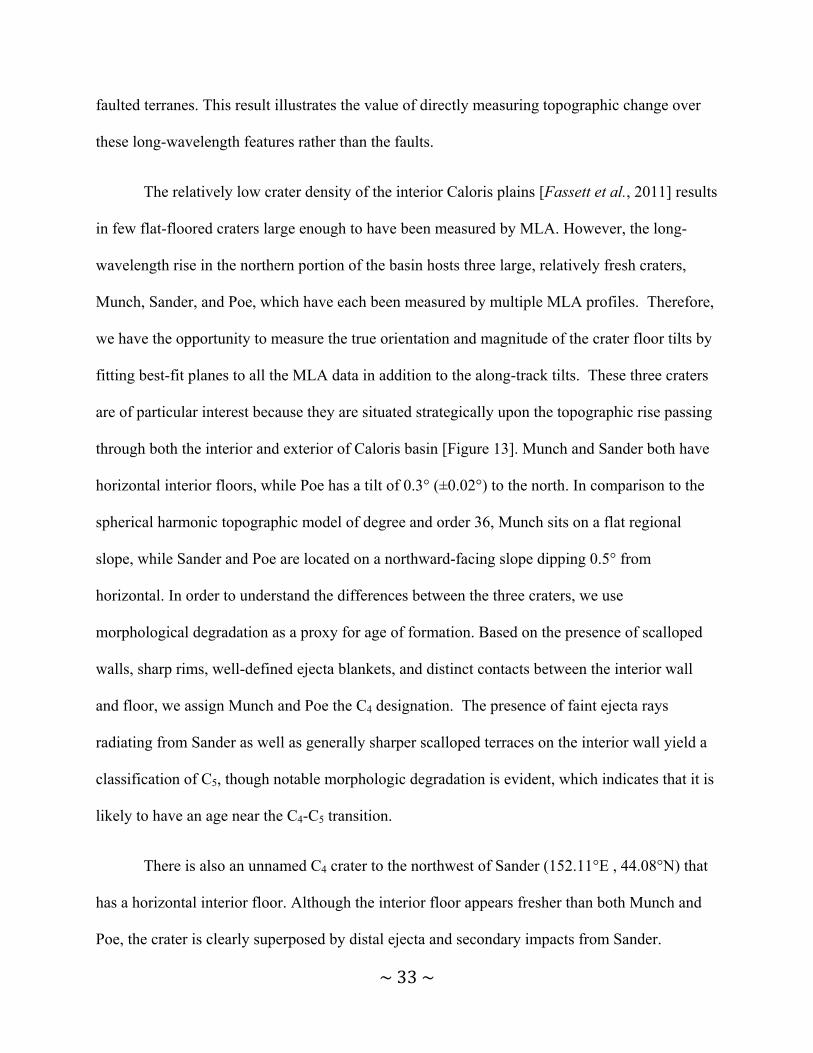
The relatively low crater density of the interior Caloris plains [Fassett et al., 2011] results
in few flat-floored craters large enough to have been measured by MLA. However, the long-
wavelength rise in the northern portion of the basin hosts three large, relatively fresh craters,
Munch, Sander, and Poe, which have each been measured by multiple MLA profiles. Therefore,
we have the opportunity to measure the true orientation and magnitude of the crater floor tilts by
fitting best-fit planes to all the MLA data in addition to the along-track tilts. These three craters
are of particular interest because they are situated strategically upon the topographic rise passing
through both the interior and exterior of Caloris basin [Figure 13]. Munch and Sander both have
horizontal interior floors, while Poe has a tilt of 0.3° (±0.02°) to the north. In comparison to the
spherical harmonic topographic model of degree and order 36, Munch sits on a flat regional
slope, while Sander and Poe are located on a northward-facing slope dipping 0.5° from
horizontal. In order to understand the differences between the three craters, we use
morphological degradation as a proxy for age of formation. Based on the presence of scalloped
walls, sharp rims, well-defined ejecta blankets, and distinct contacts between the interior wall
and floor, we assign Munch and Poe the C4 designation. The presence of faint ejecta rays
radiating from Sander as well as generally sharper scalloped terraces on the interior wall yield a
classification of C5, though notable morphologic degradation is evident, which indicates that it is
likely to have an age near the C4-C5 transition.
There is also an unnamed C4 crater to the northwest of Sander (152.11°E , 44.08°N) that
has a horizontal interior floor. Although the interior floor appears fresher than both Munch and
Poe, the crater is clearly superposed by distal ejecta and secondary impacts from Sander.
~34~
Figure 13. Along-track crater tilt measurements in and near the Caloris basin.
On Mercury, the stratigraphic sequence is identified by ejecta and deposits from basin
and crater-forming impact events [Spudis and Guest, 1988]. The type-locations and referenced
examples of Pre-Tolstojan, Tolstojan, Calorian, Mansurian, and Kuiperian craters are nearly
direct analogues for the C1-C5 morphological classes [Barnouin et al., 2012], which provides a
useful indicator of the potential age for the individual craters in our database and hence, the
deformation ages of their host regions.
Since Sander and the C4 crater to its northwest lie on the north-facing slope of the broad
rise, yet have no measureable tilt, we infer that the formation of the northern Caloris rise was
predominantly completed before the emplacement of either of these two craters, that is, prior to
the end of the Mansurian. Munch also has no tilt, but lies on the topographic apex of the rise, so
it would not have been re-oriented during the creation of the rise and therefore offers no
additional chronologic constraints. However, Poe sits on the north-facing slope and has a floor
~35~
tilt that is correlated with the direction of regional slope. Since the magnitude of slope of the
floor of Poe is smaller than that of the underlying rise, we interpret this measurement to indicate
that the Caloris rise began to form prior to the emplacement of Poe but that the deformation
event did not complete until after Poe was emplaced. That is, that the crater records only a
portion of the total deformation. We therefore conclude that the onset of the topographic
deformation likely initiated after the Calorian-age fill but before the close of the Mansurian.
6.2 Northern Rise
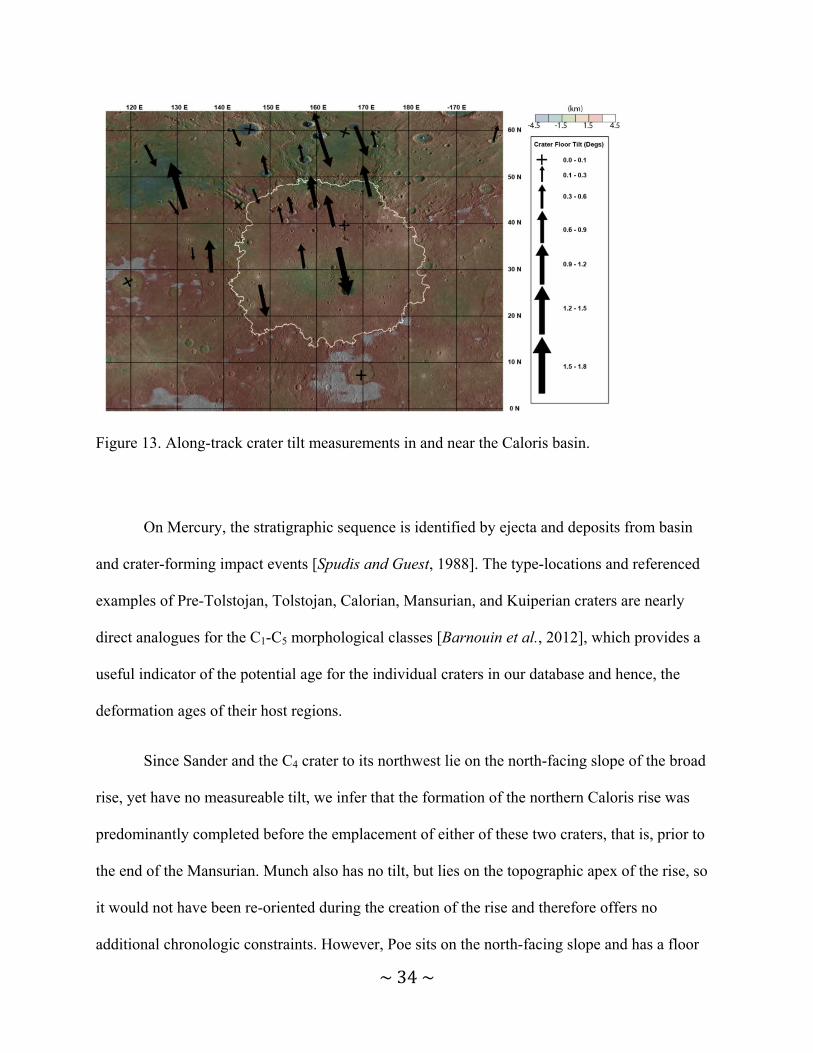
The flooded volcanic plains of the northern hemisphere host an isolated, 950 km
diameter, symmetric topographic rise [Figure 14] that is nearly indistinct from the surrounding
volcanic plains in both geologic features and crater density [Dickson et al., 2012; Zuber et al.,
2012]. The topographic difference between this rise and the surrounding region is less than the
Caloris undulations (2 km for the former and 3 km for the latter), as is the gradient of topography
(0.4° versus 0.6°). Understanding the history and development of this feature has also been
challenged by a relative lack of features diagnostic of its origin. The measurement of flat-floored
craters should provide guidance in evaluating hypotheses for the formation of the rise, and
because the terrain is older than that of Caloris, the cratering record extends deeper into
Mercury’s history.
~36~
Figure 14. Plane-fit crater tilts near the topographic rise in the northern volcanic plains.
We consider two classes of craters present on the topographic rise and in the surrounding
plains. First, we consider completely buried, or ghost, craters (e.g. Head et al., 2008). When
profiled across their flattest interior portion, these craters appear to closely match the regional
topographic gradient in both magnitude and direction. The second class contains the fresher, flat-
floored craters that appear to superpose, and therefore post-date the volcanic northern plains.
These also generally trend away from the center of the rise, but with magnitudes that reflect less
of the regional topography. Table 2 summarizes these measurements along with our morphologic
classification of each crater. As with Caloris, the freshest craters are tilted less than the regional
gradient. That is, the C5 and C4 classes (Kuiperian and Mansurian, respectively) are either level
or very nearly level even along the slopes of the northern rise with the highest regional gradient
of 0.4°. The C3 craters span a range of tilts from under-representing to closely matching regional
gradient. And any C2 and C1 craters are essentially indistinguishable from the completely buried
~37~
ghost craters. Thus we conclude that the deformation associated with the formation of the
northern rise began during the mid to late Calorian, continued through the mid-Mansurian, and
appears to have been complete by the Kuiperian.
These tilt measurements can also assist in the evaluation of hypotheses that have been
suggested to explain the formation of the northern rise [Dickson et al., 2012]. In general, these
mechanisms may include effusive volcanism, faulting, elastic buckling, or buoyant support. The
presence of C4 and C3 craters with floors tilted away from the center of the rise cannot be
explained by the volcanic mantling of a pre-existing rise or the construction of volcanic vent,
since cratering subsequent to volcanism would result in untilted floors. The tectonic normal
faulting hypothesis, where the rise is a remnant plateau created by down-dropped peripheral
blocks, similarly fails to explain the tilts of these young craters. Hypothesized mechanisms of
lithospheric folding or flexure postdating the emplacement of the volcanic plains are permitted
by our data. We also consider it to be possible, given the range of observed tilts within
morphological ages, that the rise formed concurrently with the volcanic flooding of the northern
plains. Our data are also compatible with formation due to buoyant forces arising from localized
variations in the density of the deep mantle [James et al., 2015] and offers timing constraints on
this geodynamical process.
7. Discussion
At a maximum resolution of 250 mpp, the global MDIS mosaics are able to provide
context for candidate crater selection and classification. Since NAC images of higher resolution
are currently only available for specific targets, these global mosaics form the most complete
basis for a global-scale analysis. We note, however, that NAC images on the scale of 25 mpp do
~38~
indeed reveal terrain details of crater interiors that may affect morphologic classification or MLA
profile inclusion/exclusion criteria. For instance, at 250 mpp, the interior floor of Degas appears
quite smooth in contrast to the surrounding walls and exterior of the crater. Higher resolution
NAC images reveal this floor to be crossed with faults and replete with hummocky and blocky
topography that interrupts the melt pool surface. While these features do not, in this case, change
our morphologic class assignment, they do provide additional context to the measured MLA
profile, and provide an illustration of why careful selection of altimeter shot points is critical to
the interpretation of crater tilt.
Like the stratigraphic markers with which the crater morphologic ages are compared, the
timing constraints of the tilted craters are currently limited in resolution to epochs of at best ~1
Gyr. Advances in modeling and quantification of the absolute timescales of crater morphologic
degradation, such as those for simple lunar craters [Craddock and Howard, 2000; Fassett and
Thomson, 2014] may yield much more precise ages of individual craters. In concert with
measured floor tilts, this could dramatically increase the utility of even a sparsely sampled crater
population. Indeed, the careful study even of individual craters that are located proximal to a
localized topographic feature of interest, such a major fault or volcanic provenance, can provide
a valuable insight into surface deformation if the morphologic age is well known.
In this analysis, one third of the measured crater profiles have a dip direction opposite
that of the regional trend. When we examine the distribution of morphologic ages of these
anticorrelated craters, we note that older craters have a higher incidence of anticorrelation than
those that are younger. We consider two explanations for this relationship. First, that older
craters have undergone a higher magnitude of localized deformation and resurfacing, which may
not be apparent from orbital imagery. Second, that the planet experienced regional deformation
~39~
that predates any of the currently-observed long wavelength topography. It is likely that these
older craters originally formed on the flanks of ancient rises. As these rises subsided or were
replaced by contemporary topography, the interiors of the old craters would reflect the
subsidence activity and therefore may be anticorrelated with the topography of the planet today.
Misfit where the crater tilt has a higher magnitude than that of the regional topography is heavily
represented by craters less than 40 km in diameter as well as MLA tracks (over crater floors) less
than 20 km in length. In the former case, it is likely that the crater floors are influenced by local,
small-scale topography that is unrelated to regional trends (i.e. faulting and slumping). In the
latter, it is likely that the chord through the crater floor simply does not sample enough of the
floor near the center of the crater to accurately reflect the trend of the crater as a whole. In these
cases, if there exist multiple MLA profiles across the floor, fitted planes can often provide a
more robust measurement of the orientation of the crater.
Prior studies of tilted crater floors have inferred a causal relationship between the
modified crater and regional tectonic activity [Roth et al., 1981; Stoddard and Jurdy, 2003;
Matias and Jurdy, 2005]. However, all of these investigations were limited by narrow regional
coverage and/or low spatial resolution. In addition, the tilts were obtained by fitting planes to the
entire crater, rather than limiting the sampling area to the crater interior floor [Matias and Jurdy,
2005]. We find that the elevation profile of crater rims can be azimuthally-variable and often
depend on pre-existing topography, in contrast to the fresh crater floor [Figure 15]. Therefore, it
is likely that the measurements of Venusian crater tilts were influenced by the inclusion of crater
features that are not representative of either original horizontality or subsequent tectonic
reorientation. This serves as further caution for the application of these types of measurements
using resampled or smoothed data, such as gridded altimeter topography or stereotopographic
~40~
maps. The resolution of such references should be carefully considered as to whether they can
reliably exclude features not representative of the crater floor.
8. Summary and Conclusion
These data represent the first large-scale use of tilted craters to develop unique insight
into the history of surface deformation over broad regions of a planet. We have confirmed the
expectation that fresh impact craters tend to form an initially-level interior melt sheet that can
serve as paleo-horizontal reference. The combination of crater floor tilt measurements with
estimates of age based upon morphologic degradation yields constraints on the relative timing of
formation of prominent regional topography while the superposition of tilted craters restrict the
plausible hypotheses for formation of these features of interest. On Mercury, regional long-
wavelength features are present on a substantial portion of the planet’s northern hemisphere. The
age-dependent correlation of crater floor tilt with regional topographic slope indicates that some
of Mercury’s broad undulating features are a contemporary development, with respect to even
the relatively young smooth plains units. Also, the anti-correlation between floor slopes of some
older craters and regional topography could be caused either by crater-scale deformative events
unrecognized in orbital images, or it suggests that the planet once had broad-scale features that
were substantially different than those that are observed today. We note that simple volcanic or
ballistic resurfacing of these floors would be likely to produce new crater interiors that conform
to the regional slope, and is an unsatisfactory explanation of anti-correlated slopes.
~41~
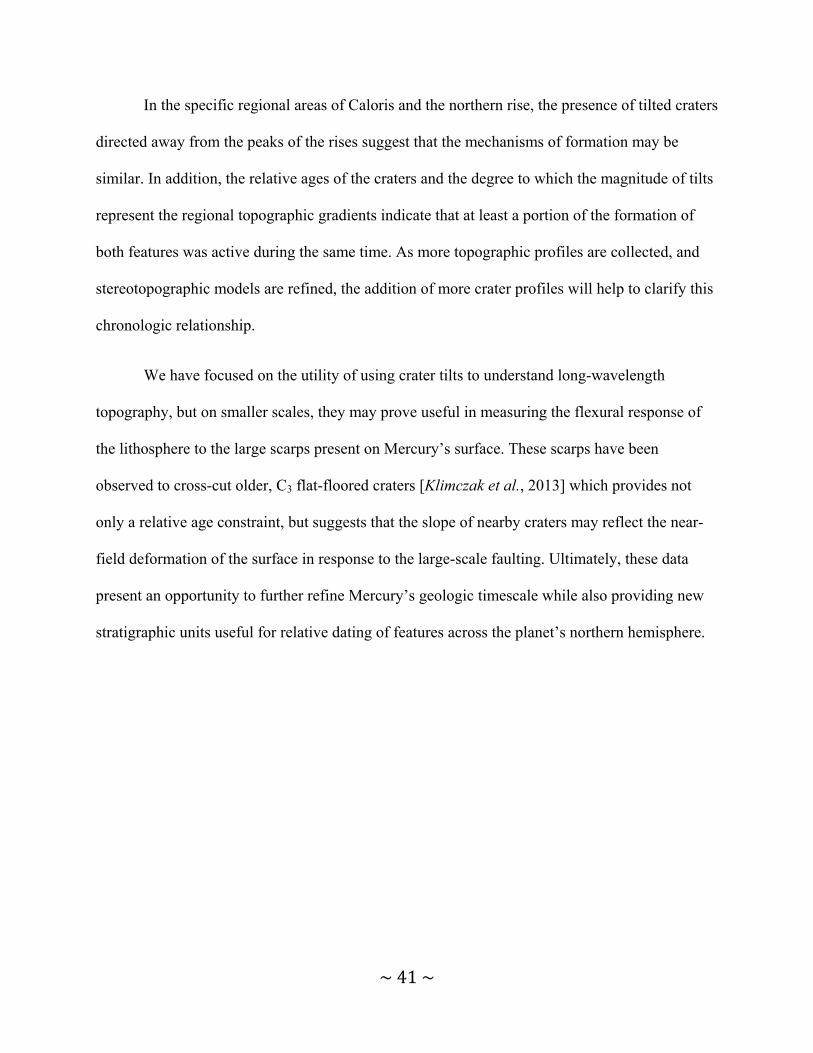
In the specific regional areas of Caloris and the northern rise, the presence of tilted craters
directed away from the peaks of the rises suggest that the mechanisms of formation may be
similar. In addition, the relative ages of the craters and the degree to which the magnitude of tilts
represent the regional topographic gradients indicate that at least a portion of the formation of
both features was active during the same time. As more topographic profiles are collected, and
stereotopographic models are refined, the addition of more crater profiles will help to clarify this
chronologic relationship.
We have focused on the utility of using crater tilts to understand long-wavelength
topography, but on smaller scales, they may prove useful in measuring the flexural response of
the lithosphere to the large scarps present on Mercury’s surface. These scarps have been
observed to cross-cut older, C3 flat-floored craters [Klimczak et al., 2013] which provides not
only a relative age constraint, but suggests that the slope of nearby craters may reflect the near-
field deformation of the surface in response to the large-scale faulting. Ultimately, these data
present an opportunity to further refine Mercury’s geologic timescale while also providing new
stratigraphic units useful for relative dating of features across the planet’s northern hemisphere.
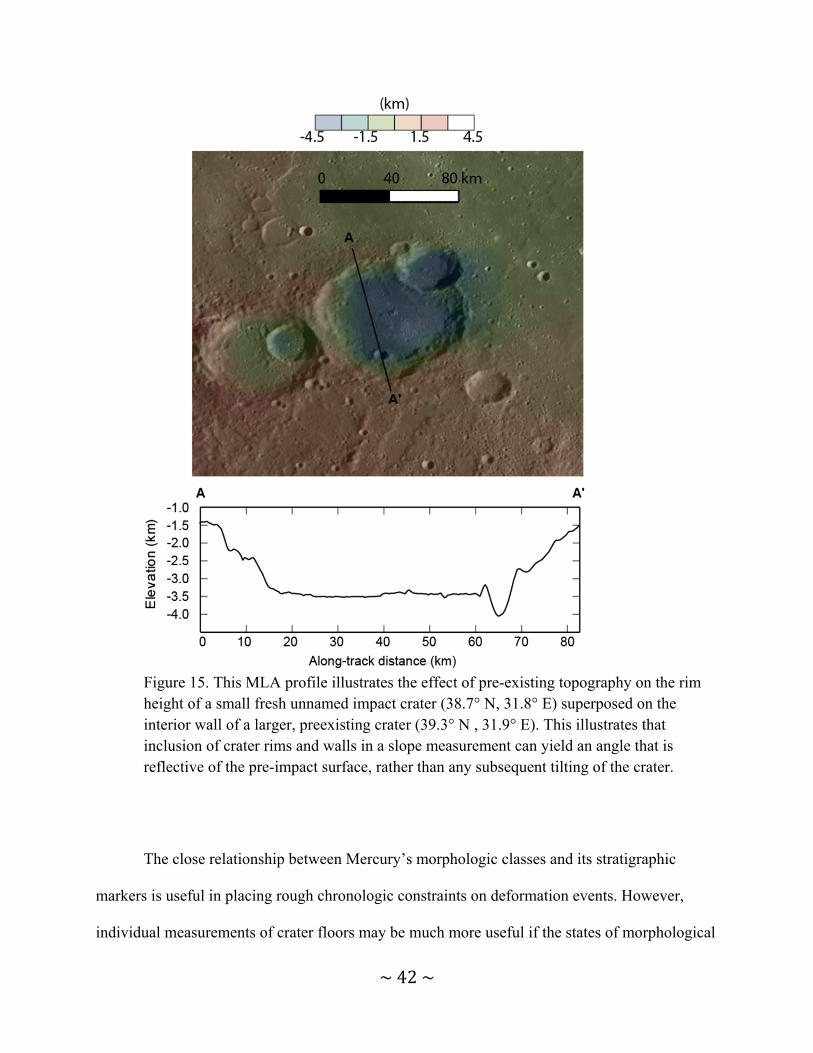
~42~
Figure 15. This MLA profile illustrates the effect of pre-existing topography on the rim height of a small fresh unnamed impact crater (38.7° N, 31.8° E) superposed on the interior wall of a larger, preexisting crater (39.3° N , 31.9° E). This illustrates that inclusion of crater rims and walls in a slope measurement can yield an angle that is reflective of the pre-impact surface, rather than any subsequent tilting of the crater.
The close relationship between Mercury’s morphologic classes and its stratigraphic
markers is useful in placing rough chronologic constraints on deformation events. However,
individual measurements of crater floors may be much more useful if the states of morphological

~43~
degradation can be further refined. Higher resolution orbital imagery provides critical
information needed to differentiate between multiple craters that would otherwise be grouped
into the same class and age.
Beyond Mercury, tilted craters have the potential to provide additional insight into the
surface evolution of other crater-retaining terrestrial bodies. The existence of high-resolution
altimetric data sets for the Moon and Mars (i.e. Lunar Orbiter Laser Altimeter, Mars Orbiting
Laser Altimeter) or stereotopography models offer opportunities to investigate deformation
related to volcanic inflation/deflation, sediment loading, lithospheric buckling, or changes in the
global gravity equipotential.
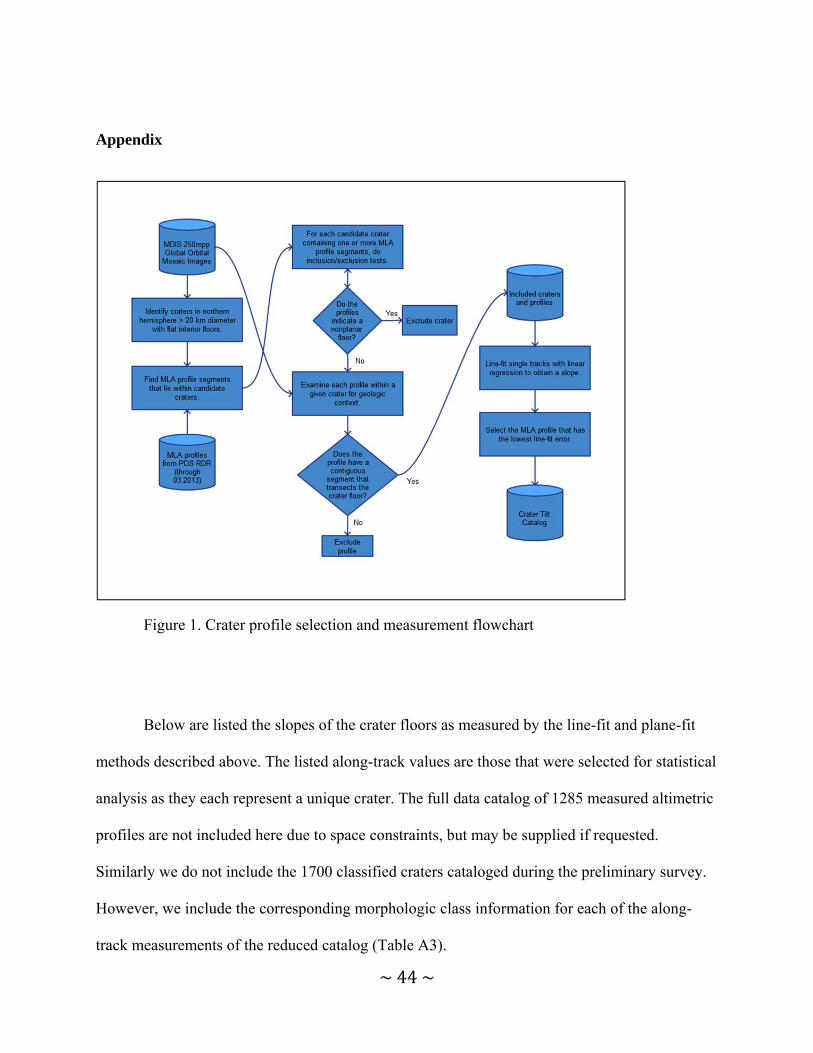
~44~
Appendix
Figure 1. Crater profile selection and measurement flowchart
Below are listed the slopes of the crater floors as measured by the line-fit and plane-fit
methods described above. The listed along-track values are those that were selected for statistical
analysis as they each represent a unique crater. The full data catalog of 1285 measured altimetric
profiles are not included here due to space constraints, but may be supplied if requested.
Similarly we do not include the 1700 classified craters cataloged during the preliminary survey.
However, we include the corresponding morphologic class information for each of the along-
track measurements of the reduced catalog (Table A3).
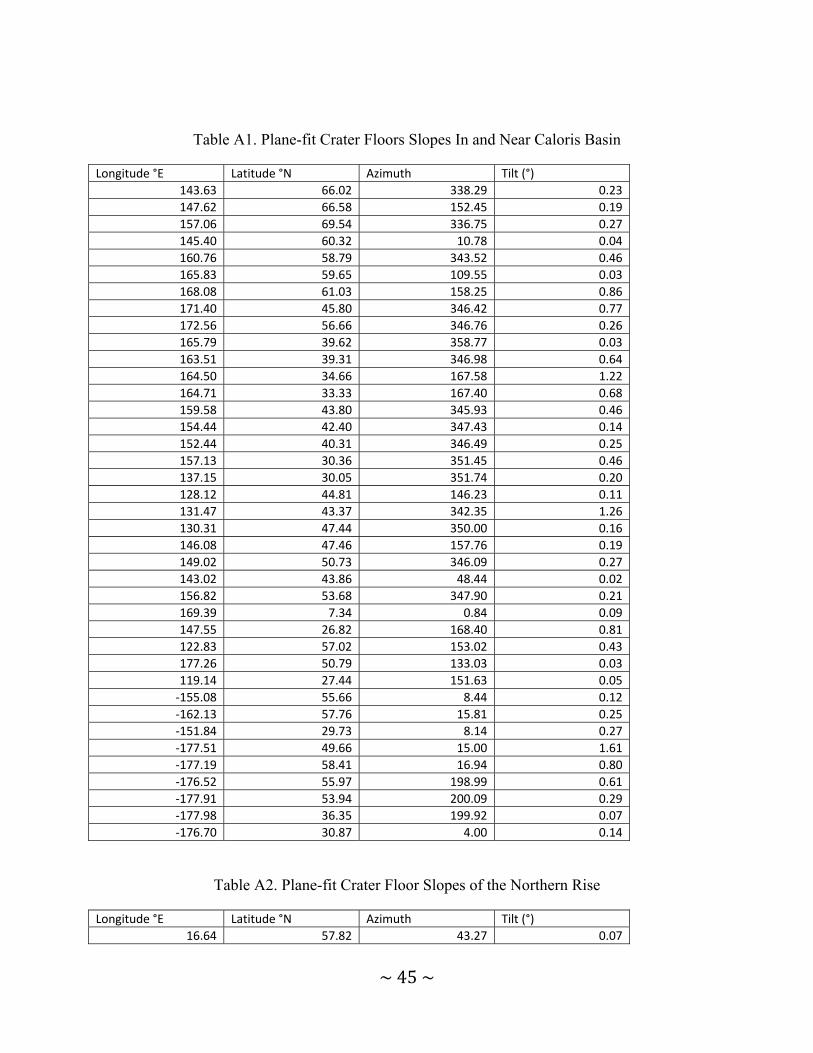
~45~
Table A1. Plane-fit Crater Floors Slopes In and Near Caloris Basin
Longitude °E Latitude °N Azimuth Tilt (°)
143.63 66.02 338.29 0.23
147.62 66.58 152.45 0.19
157.06 69.54 336.75 0.27
145.40 60.32 10.78 0.04
160.76 58.79 343.52 0.46
165.83 59.65 109.55 0.03
168.08 61.03 158.25 0.86
171.40 45.80 346.42 0.77
172.56 56.66 346.76 0.26
165.79 39.62 358.77 0.03
163.51 39.31 346.98 0.64
164.50 34.66 167.58 1.22
164.71 33.33 167.40 0.68
159.58 43.80 345.93 0.46
154.44 42.40 347.43 0.14
152.44 40.31 346.49 0.25
157.13 30.36 351.45 0.46
137.15 30.05 351.74 0.20
128.12 44.81 146.23 0.11
131.47 43.37 342.35 1.26
130.31 47.44 350.00 0.16
146.08 47.46 157.76 0.19
149.02 50.73 346.09 0.27
143.02 43.86 48.44 0.02
156.82 53.68 347.90 0.21
169.39 7.34 0.84 0.09
147.55 26.82 168.40 0.81
122.83 57.02 153.02 0.43
177.26 50.79 133.03 0.03
119.14 27.44 151.63 0.05
‐155.08 55.66 8.44 0.12
‐162.13 57.76 15.81 0.25
‐151.84 29.73 8.14 0.27
‐177.51 49.66 15.00 1.61
‐177.19 58.41 16.94 0.80
‐176.52 55.97 198.99 0.61
‐177.91 53.94 200.09 0.29
‐177.98 36.35 199.92 0.07
‐176.70 30.87 4.00 0.14
Table A2. Plane-fit Crater Floor Slopes of the Northern Rise
Longitude °E Latitude °N Azimuth Tilt (°)
16.64 57.82 43.27 0.07
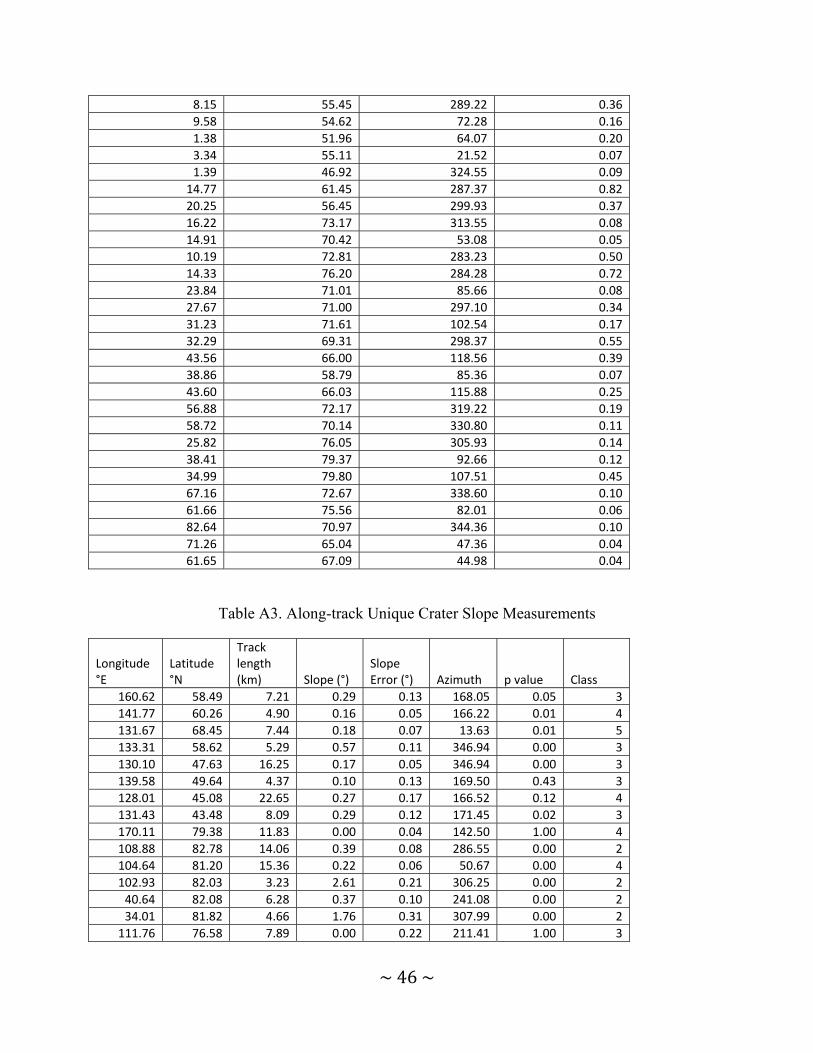
~46~
8.15 55.45 289.22 0.36
9.58 54.62 72.28 0.16
1.38 51.96 64.07 0.20
3.34 55.11 21.52 0.07
1.39 46.92 324.55 0.09
14.77 61.45 287.37 0.82
20.25 56.45 299.93 0.37
16.22 73.17 313.55 0.08
14.91 70.42 53.08 0.05
10.19 72.81 283.23 0.50
14.33 76.20 284.28 0.72
23.84 71.01 85.66 0.08
27.67 71.00 297.10 0.34
31.23 71.61 102.54 0.17
32.29 69.31 298.37 0.55
43.56 66.00 118.56 0.39
38.86 58.79 85.36 0.07
43.60 66.03 115.88 0.25
56.88 72.17 319.22 0.19
58.72 70.14 330.80 0.11
25.82 76.05 305.93 0.14
38.41 79.37 92.66 0.12
34.99 79.80 107.51 0.45
67.16 72.67 338.60 0.10
61.66 75.56 82.01 0.06
82.64 70.97 344.36 0.10
71.26 65.04 47.36 0.04
61.65 67.09 44.98 0.04
Table A3. Along-track Unique Crater Slope Measurements
Longitude °E
Latitude °N
Track length (km) Slope (°)
Slope Error (°) Azimuth p value Class
160.62 58.49 7.21 0.29 0.13 168.05 0.05 3
141.77 60.26 4.90 0.16 0.05 166.22 0.01 4
131.67 68.45 7.44 0.18 0.07 13.63 0.01 5
133.31 58.62 5.29 0.57 0.11 346.94 0.00 3
130.10 47.63 16.25 0.17 0.05 346.94 0.00 3
139.58 49.64 4.37 0.10 0.13 169.50 0.43 3
128.01 45.08 22.65 0.27 0.17 166.52 0.12 4
131.43 43.48 8.09 0.29 0.12 171.45 0.02 3
170.11 79.38 11.83 0.00 0.04 142.50 1.00 4
108.88 82.78 14.06 0.39 0.08 286.55 0.00 2
104.64 81.20 15.36 0.22 0.06 50.67 0.00 4
102.93 82.03 3.23 2.61 0.21 306.25 0.00 2
40.64 82.08 6.28 0.37 0.10 241.08 0.00 2
34.01 81.82 4.66 1.76 0.31 307.99 0.00 2
111.76 76.58 7.89 0.00 0.22 211.41 1.00 3
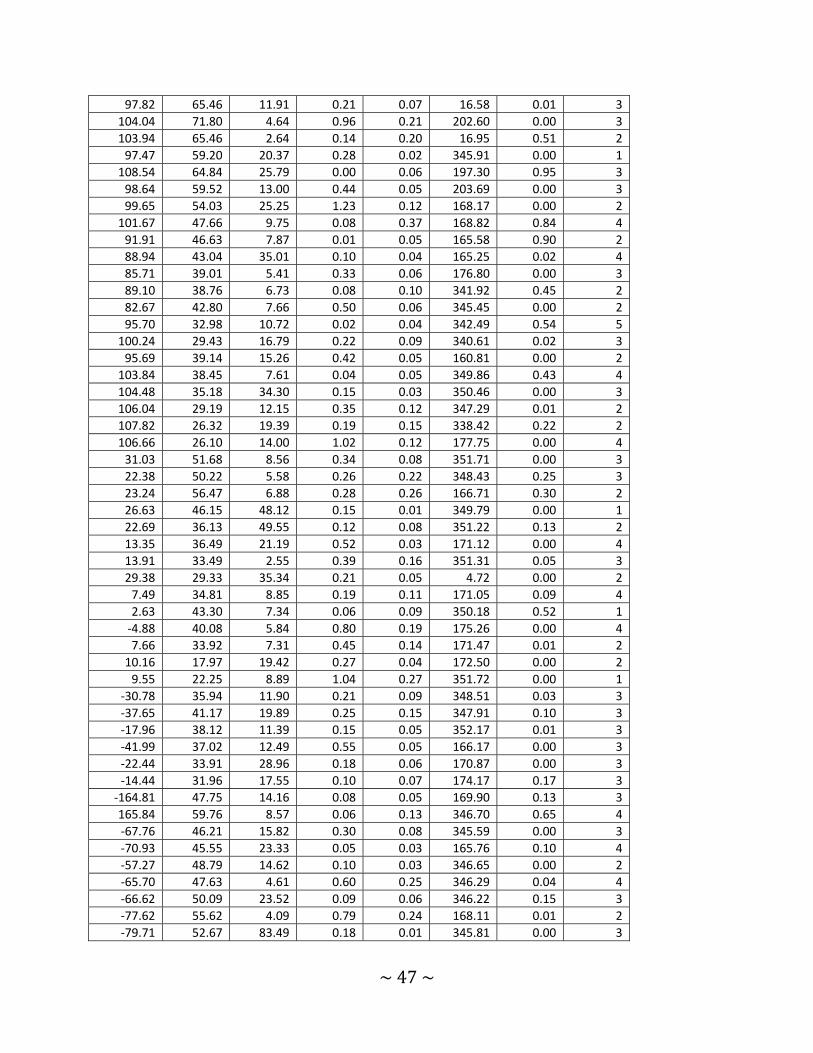
~47~
97.82 65.46 11.91 0.21 0.07 16.58 0.01 3
104.04 71.80 4.64 0.96 0.21 202.60 0.00 3
103.94 65.46 2.64 0.14 0.20 16.95 0.51 2
97.47 59.20 20.37 0.28 0.02 345.91 0.00 1
108.54 64.84 25.79 0.00 0.06 197.30 0.95 3
98.64 59.52 13.00 0.44 0.05 203.69 0.00 3
99.65 54.03 25.25 1.23 0.12 168.17 0.00 2
101.67 47.66 9.75 0.08 0.37 168.82 0.84 4
91.91 46.63 7.87 0.01 0.05 165.58 0.90 2
88.94 43.04 35.01 0.10 0.04 165.25 0.02 4
85.71 39.01 5.41 0.33 0.06 176.80 0.00 3
89.10 38.76 6.73 0.08 0.10 341.92 0.45 2
82.67 42.80 7.66 0.50 0.06 345.45 0.00 2
95.70 32.98 10.72 0.02 0.04 342.49 0.54 5
100.24 29.43 16.79 0.22 0.09 340.61 0.02 3
95.69 39.14 15.26 0.42 0.05 160.81 0.00 2
103.84 38.45 7.61 0.04 0.05 349.86 0.43 4
104.48 35.18 34.30 0.15 0.03 350.46 0.00 3
106.04 29.19 12.15 0.35 0.12 347.29 0.01 2
107.82 26.32 19.39 0.19 0.15 338.42 0.22 2
106.66 26.10 14.00 1.02 0.12 177.75 0.00 4
31.03 51.68 8.56 0.34 0.08 351.71 0.00 3
22.38 50.22 5.58 0.26 0.22 348.43 0.25 3
23.24 56.47 6.88 0.28 0.26 166.71 0.30 2
26.63 46.15 48.12 0.15 0.01 349.79 0.00 1
22.69 36.13 49.55 0.12 0.08 351.22 0.13 2
13.35 36.49 21.19 0.52 0.03 171.12 0.00 4
13.91 33.49 2.55 0.39 0.16 351.31 0.05 3
29.38 29.33 35.34 0.21 0.05 4.72 0.00 2
7.49 34.81 8.85 0.19 0.11 171.05 0.09 4
2.63 43.30 7.34 0.06 0.09 350.18 0.52 1
‐4.88 40.08 5.84 0.80 0.19 175.26 0.00 4
7.66 33.92 7.31 0.45 0.14 171.47 0.01 2
10.16 17.97 19.42 0.27 0.04 172.50 0.00 2
9.55 22.25 8.89 1.04 0.27 351.72 0.00 1
‐30.78 35.94 11.90 0.21 0.09 348.51 0.03 3
‐37.65 41.17 19.89 0.25 0.15 347.91 0.10 3
‐17.96 38.12 11.39 0.15 0.05 352.17 0.01 3
‐41.99 37.02 12.49 0.55 0.05 166.17 0.00 3
‐22.44 33.91 28.96 0.18 0.06 170.87 0.00 3
‐14.44 31.96 17.55 0.10 0.07 174.17 0.17 3
‐164.81 47.75 14.16 0.08 0.05 169.90 0.13 3
165.84 59.76 8.57 0.06 0.13 346.70 0.65 4
‐67.76 46.21 15.82 0.30 0.08 345.59 0.00 3
‐70.93 45.55 23.33 0.05 0.03 165.76 0.10 4
‐57.27 48.79 14.62 0.10 0.03 346.65 0.00 2
‐65.70 47.63 4.61 0.60 0.25 346.29 0.04 4
‐66.62 50.09 23.52 0.09 0.06 346.22 0.15 3
‐77.62 55.62 4.09 0.79 0.24 168.11 0.01 2
‐79.71 52.67 83.49 0.18 0.01 345.81 0.00 3
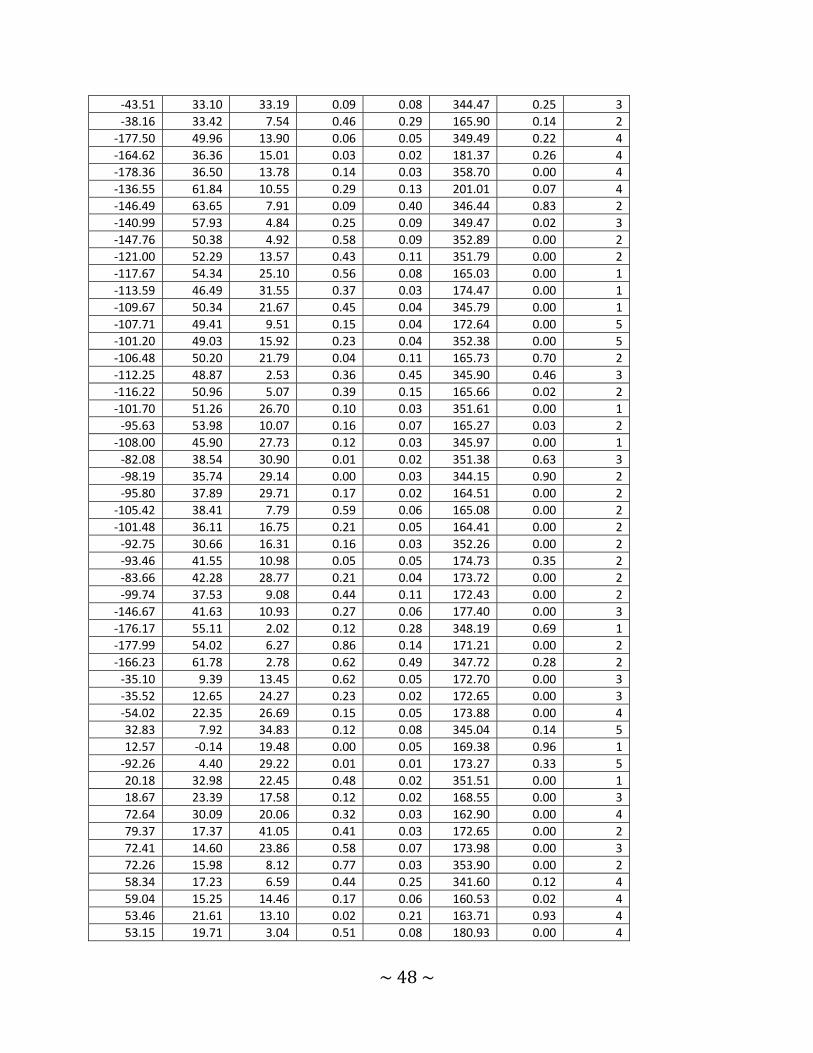
~48~
‐43.51 33.10 33.19 0.09 0.08 344.47 0.25 3
‐38.16 33.42 7.54 0.46 0.29 165.90 0.14 2
‐177.50 49.96 13.90 0.06 0.05 349.49 0.22 4
‐164.62 36.36 15.01 0.03 0.02 181.37 0.26 4
‐178.36 36.50 13.78 0.14 0.03 358.70 0.00 4
‐136.55 61.84 10.55 0.29 0.13 201.01 0.07 4
‐146.49 63.65 7.91 0.09 0.40 346.44 0.83 2
‐140.99 57.93 4.84 0.25 0.09 349.47 0.02 3
‐147.76 50.38 4.92 0.58 0.09 352.89 0.00 2
‐121.00 52.29 13.57 0.43 0.11 351.79 0.00 2
‐117.67 54.34 25.10 0.56 0.08 165.03 0.00 1
‐113.59 46.49 31.55 0.37 0.03 174.47 0.00 1
‐109.67 50.34 21.67 0.45 0.04 345.79 0.00 1
‐107.71 49.41 9.51 0.15 0.04 172.64 0.00 5
‐101.20 49.03 15.92 0.23 0.04 352.38 0.00 5
‐106.48 50.20 21.79 0.04 0.11 165.73 0.70 2
‐112.25 48.87 2.53 0.36 0.45 345.90 0.46 3
‐116.22 50.96 5.07 0.39 0.15 165.66 0.02 2
‐101.70 51.26 26.70 0.10 0.03 351.61 0.00 1
‐95.63 53.98 10.07 0.16 0.07 165.27 0.03 2
‐108.00 45.90 27.73 0.12 0.03 345.97 0.00 1
‐82.08 38.54 30.90 0.01 0.02 351.38 0.63 3
‐98.19 35.74 29.14 0.00 0.03 344.15 0.90 2
‐95.80 37.89 29.71 0.17 0.02 164.51 0.00 2
‐105.42 38.41 7.79 0.59 0.06 165.08 0.00 2
‐101.48 36.11 16.75 0.21 0.05 164.41 0.00 2
‐92.75 30.66 16.31 0.16 0.03 352.26 0.00 2
‐93.46 41.55 10.98 0.05 0.05 174.73 0.35 2
‐83.66 42.28 28.77 0.21 0.04 173.72 0.00 2
‐99.74 37.53 9.08 0.44 0.11 172.43 0.00 2
‐146.67 41.63 10.93 0.27 0.06 177.40 0.00 3
‐176.17 55.11 2.02 0.12 0.28 348.19 0.69 1
‐177.99 54.02 6.27 0.86 0.14 171.21 0.00 2
‐166.23 61.78 2.78 0.62 0.49 347.72 0.28 2
‐35.10 9.39 13.45 0.62 0.05 172.70 0.00 3
‐35.52 12.65 24.27 0.23 0.02 172.65 0.00 3
‐54.02 22.35 26.69 0.15 0.05 173.88 0.00 4
32.83 7.92 34.83 0.12 0.08 345.04 0.14 5
12.57 ‐0.14 19.48 0.00 0.05 169.38 0.96 1
‐92.26 4.40 29.22 0.01 0.01 173.27 0.33 5
20.18 32.98 22.45 0.48 0.02 351.51 0.00 1
18.67 23.39 17.58 0.12 0.02 168.55 0.00 3
72.64 30.09 20.06 0.32 0.03 162.90 0.00 4
79.37 17.37 41.05 0.41 0.03 172.65 0.00 2
72.41 14.60 23.86 0.58 0.07 173.98 0.00 3
72.26 15.98 8.12 0.77 0.03 353.90 0.00 2
58.34 17.23 6.59 0.44 0.25 341.60 0.12 4
59.04 15.25 14.46 0.17 0.06 160.53 0.02 4
53.46 21.61 13.10 0.02 0.21 163.71 0.93 4
53.15 19.71 3.04 0.51 0.08 180.93 0.00 4
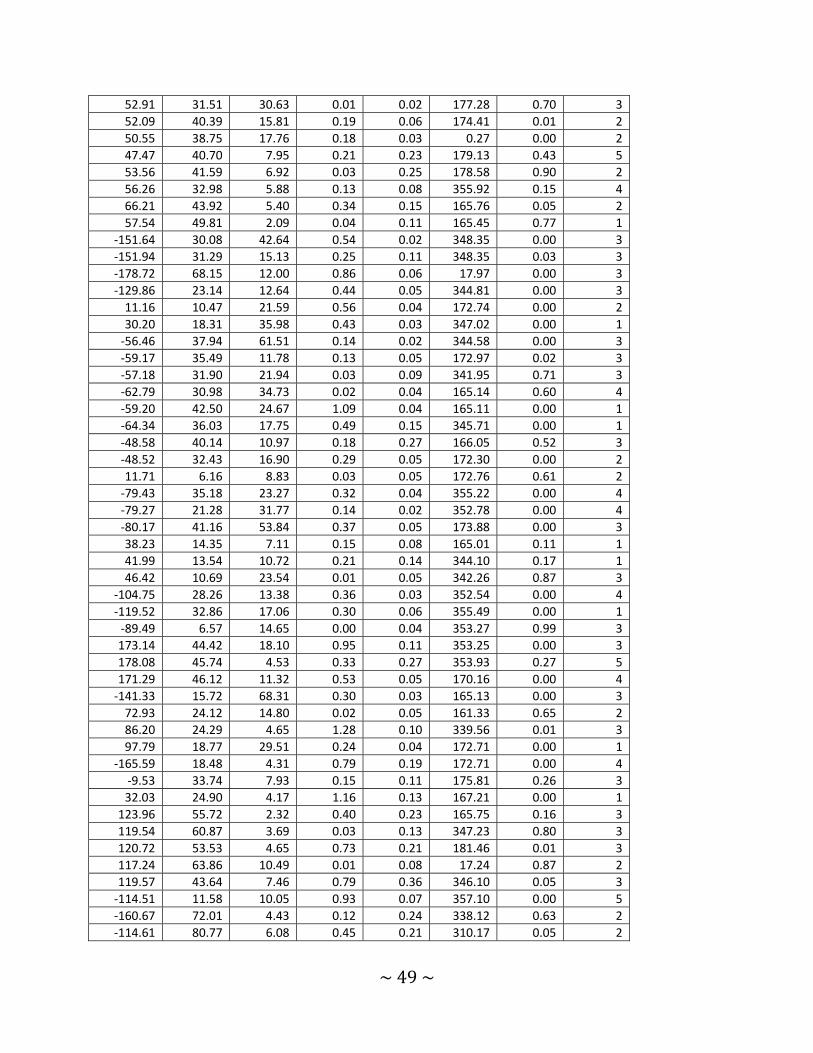
~49~
52.91 31.51 30.63 0.01 0.02 177.28 0.70 3
52.09 40.39 15.81 0.19 0.06 174.41 0.01 2
50.55 38.75 17.76 0.18 0.03 0.27 0.00 2
47.47 40.70 7.95 0.21 0.23 179.13 0.43 5
53.56 41.59 6.92 0.03 0.25 178.58 0.90 2
56.26 32.98 5.88 0.13 0.08 355.92 0.15 4
66.21 43.92 5.40 0.34 0.15 165.76 0.05 2
57.54 49.81 2.09 0.04 0.11 165.45 0.77 1
‐151.64 30.08 42.64 0.54 0.02 348.35 0.00 3
‐151.94 31.29 15.13 0.25 0.11 348.35 0.03 3
‐178.72 68.15 12.00 0.86 0.06 17.97 0.00 3
‐129.86 23.14 12.64 0.44 0.05 344.81 0.00 3
11.16 10.47 21.59 0.56 0.04 172.74 0.00 2
30.20 18.31 35.98 0.43 0.03 347.02 0.00 1
‐56.46 37.94 61.51 0.14 0.02 344.58 0.00 3
‐59.17 35.49 11.78 0.13 0.05 172.97 0.02 3
‐57.18 31.90 21.94 0.03 0.09 341.95 0.71 3
‐62.79 30.98 34.73 0.02 0.04 165.14 0.60 4
‐59.20 42.50 24.67 1.09 0.04 165.11 0.00 1
‐64.34 36.03 17.75 0.49 0.15 345.71 0.00 1
‐48.58 40.14 10.97 0.18 0.27 166.05 0.52 3
‐48.52 32.43 16.90 0.29 0.05 172.30 0.00 2
11.71 6.16 8.83 0.03 0.05 172.76 0.61 2
‐79.43 35.18 23.27 0.32 0.04 355.22 0.00 4
‐79.27 21.28 31.77 0.14 0.02 352.78 0.00 4
‐80.17 41.16 53.84 0.37 0.05 173.88 0.00 3
38.23 14.35 7.11 0.15 0.08 165.01 0.11 1
41.99 13.54 10.72 0.21 0.14 344.10 0.17 1
46.42 10.69 23.54 0.01 0.05 342.26 0.87 3
‐104.75 28.26 13.38 0.36 0.03 352.54 0.00 4
‐119.52 32.86 17.06 0.30 0.06 355.49 0.00 1
‐89.49 6.57 14.65 0.00 0.04 353.27 0.99 3
173.14 44.42 18.10 0.95 0.11 353.25 0.00 3
178.08 45.74 4.53 0.33 0.27 353.93 0.27 5
171.29 46.12 11.32 0.53 0.05 170.16 0.00 4
‐141.33 15.72 68.31 0.30 0.03 165.13 0.00 3
72.93 24.12 14.80 0.02 0.05 161.33 0.65 2
86.20 24.29 4.65 1.28 0.10 339.56 0.01 3
97.79 18.77 29.51 0.24 0.04 172.71 0.00 1
‐165.59 18.48 4.31 0.79 0.19 172.71 0.00 4
‐9.53 33.74 7.93 0.15 0.11 175.81 0.26 3
32.03 24.90 4.17 1.16 0.13 167.21 0.00 1
123.96 55.72 2.32 0.40 0.23 165.75 0.16 3
119.54 60.87 3.69 0.03 0.13 347.23 0.80 3
120.72 53.53 4.65 0.73 0.21 181.46 0.01 3
117.24 63.86 10.49 0.01 0.08 17.24 0.87 2
119.57 43.64 7.46 0.79 0.36 346.10 0.05 3
‐114.51 11.58 10.05 0.93 0.07 357.10 0.00 5
‐160.67 72.01 4.43 0.12 0.24 338.12 0.63 2
‐114.61 80.77 6.08 0.45 0.21 310.17 0.05 2
~50~
‐59.55 71.45 7.80 0.57 0.14 337.47 0.00 1
112.81 70.74 12.24 0.04 0.24 336.83 0.86 3
114.62 70.48 9.51 0.11 0.06 346.52 0.11 3
132.46 69.79 5.52 1.18 0.17 159.04 0.00 2
126.59 70.83 8.70 1.18 0.21 202.87 0.00 3
138.52 71.04 6.10 0.21 0.07 16.88 0.01 1
‐130.89 15.38 6.48 0.28 0.14 343.17 0.10 4
‐135.31 18.68 26.25 0.45 0.06 344.79 0.00 3
‐102.89 14.97 24.27 0.63 0.03 352.36 0.00 2
‐111.10 19.31 13.27 0.34 0.10 355.31 0.00 1
‐125.49 41.31 15.19 0.53 0.06 346.65 0.00 1
85.93 35.04 28.08 0.02 0.03 171.37 0.52 1
76.80 34.15 9.31 0.57 0.17 171.52 0.00 2
99.60 27.48 70.39 0.35 0.02 352.02 0.00 3
156.96 69.31 22.77 0.13 0.03 196.53 0.00 1
‐110.10 33.28 43.81 0.02 0.03 344.41 0.49 2
‐112.76 35.56 18.43 0.01 0.10 359.96 0.96 3
‐113.34 23.61 17.80 0.12 0.03 161.99 0.00 3
‐107.16 24.79 17.25 0.19 0.11 161.41 0.10 2
‐112.60 31.08 11.14 1.04 0.13 164.02 0.00 3
‐92.04 26.07 14.14 0.77 0.06 172.74 0.00 4
‐93.89 17.68 16.00 0.45 0.02 172.87 0.00 2
‐83.02 26.38 31.16 0.51 0.02 172.54 0.00 3
83.65 22.39 36.02 0.99 0.08 158.10 0.00 2
93.95 21.65 4.41 2.37 0.63 155.62 0.02 2
46.11 29.28 5.80 0.22 0.34 179.96 0.54 5
34.18 29.81 13.09 0.80 0.08 347.46 0.00 1
8.88 26.68 7.22 0.71 0.06 352.22 0.00 2
116.58 60.23 16.81 0.36 0.01 167.56 0.00 1
111.35 64.38 27.86 0.42 0.05 16.66 0.00 1
105.62 48.48 26.81 0.85 0.08 165.58 0.00 2
109.47 31.15 27.92 0.23 0.05 346.60 0.00 1
96.78 25.76 20.40 0.08 0.06 172.20 0.17 1
‐7.35 38.17 13.97 0.05 0.04 175.19 0.27 4
‐7.90 42.44 9.77 0.46 0.08 353.65 0.00 3
‐16.66 45.44 7.18 0.68 0.18 171.41 0.00 1
69.43 3.71 16.59 0.02 0.06 355.08 0.76 4
14.20 44.77 34.29 0.18 0.01 355.58 0.00 2
26.58 35.41 17.89 0.27 0.05 181.03 0.00 1
‐62.78 47.72 17.77 0.13 0.07 166.21 0.06 2
‐58.60 50.06 8.72 0.46 0.28 164.68 0.12 2
‐34.80 40.91 9.45 0.94 0.21 168.18 0.00 1
164.66 33.42 3.22 0.20 0.31 351.30 0.53 4
60.94 56.50 3.83 0.72 0.13 163.77 0.00 3
63.63 58.58 2.64 0.41 0.51 167.07 0.47 2
135.68 82.50 6.48 0.83 0.30 68.49 0.02 1
42.18 41.04 1.71 0.78 0.26 175.87 0.06 3
67.37 27.08 23.55 0.86 0.08 354.29 0.00 1
76.93 22.43 18.81 0.15 0.14 159.74 0.27 1
4.69 12.68 62.82 0.37 0.02 172.61 0.00 3
~51~
80.69 7.06 20.11 0.17 0.07 353.08 0.02 1
16.19 58.46 65.78 0.05 0.01 166.56 0.00 5
‐10.09 62.20 20.30 0.14 0.02 194.76 0.00 5
8.02 55.91 35.02 0.02 0.03 167.32 0.59 4
9.33 54.83 20.70 0.14 0.05 350.65 0.00 4
3.43 55.21 9.96 0.14 0.13 350.23 0.30 4
14.52 61.69 16.96 0.24 0.05 345.14 0.00 3
43.51 65.98 5.33 0.56 0.13 163.80 0.00 4
15.08 70.67 19.44 0.01 0.03 340.81 0.84 5
12.26 70.54 2.26 0.54 0.08 340.75 0.01 4
16.17 73.45 18.72 0.13 0.08 338.84 0.09 3
9.98 73.02 19.09 0.21 0.07 334.87 0.00 4
31.83 71.81 7.98 0.50 0.18 338.89 0.01 2
1.65 69.58 7.33 0.07 0.13 19.82 0.61 3
27.75 71.24 14.15 0.13 0.07 341.42 0.06 3
14.21 76.37 4.95 0.18 0.20 154.41 0.39 3
31.80 69.06 23.80 0.53 0.05 199.20 0.00 3
28.39 68.66 4.09 0.32 0.08 19.08 0.00 4
38.36 79.51 16.27 0.31 0.07 137.89 0.00 4
34.74 79.83 7.96 2.00 0.28 316.13 0.00 4
21.62 66.61 4.52 0.06 0.07 343.97 0.41 2
32.02 57.59 7.68 0.02 0.10 346.56 0.86 4
25.77 65.80 4.22 0.04 0.13 19.28 0.78 3
32.86 57.73 4.51 0.18 0.07 350.17 0.02 4
65.35 72.00 64.28 0.02 0.01 23.00 0.12 4
58.78 69.87 16.75 0.07 0.07 25.44 0.37 3
56.47 72.04 13.52 0.08 0.06 18.15 0.18 4
61.68 66.97 9.52 0.57 0.09 203.67 0.00 5
67.60 76.64 42.63 0.16 0.02 32.00 0.00 3
60.66 75.69 20.88 0.02 0.05 150.65 0.68 2
67.52 75.78 13.70 0.47 0.11 150.14 0.00 4
82.58 70.73 17.30 0.20 0.06 200.77 0.00 3
81.08 66.34 7.13 0.31 0.09 344.86 0.00 3
70.69 64.96 9.55 0.23 0.06 343.54 0.00 4
73.14 62.73 6.95 0.41 0.09 341.20 0.00 4
72.94 61.71 17.68 0.06 0.04 22.75 0.13 5
73.27 57.98 72.33 0.06 0.02 346.80 0.00 1
83.92 60.98 43.93 0.36 0.03 342.70 0.00 1
81.92 51.01 141.22 0.00 0.01 11.20 0.62 4
93.77 50.67 4.87 0.43 0.12 351.63 0.01 5
64.63 48.22 22.66 0.41 0.13 165.61 0.00 5
62.81 49.42 3.34 0.29 0.37 165.95 0.47 2
55.51 54.45 8.77 1.72 0.25 169.27 0.00 4
70.55 52.00 8.08 1.01 0.06 165.67 0.00 3
67.09 50.13 13.95 0.21 0.08 345.45 0.02 2
53.17 51.51 3.92 0.22 0.15 350.30 0.19 4
69.21 42.79 6.57 0.42 0.10 176.85 0.00 2
58.21 48.09 10.38 0.90 0.13 345.88 0.00 2
35.76 46.99 15.38 0.16 0.08 166.15 0.04 4
32.29 48.05 50.39 0.07 0.02 349.50 0.00 4
~52~
35.19 46.11 5.75 0.31 0.05 354.04 0.00 4
25.69 47.86 9.56 0.58 0.08 353.68 0.00 3
23.06 45.16 16.60 0.02 0.02 175.37 0.24 4
18.39 41.96 6.53 0.46 0.06 350.39 0.00 4
13.44 49.15 16.65 0.32 0.04 348.95 0.00 4
17.10 45.29 8.90 0.97 0.08 355.04 0.00 3
26.05 45.25 20.96 0.10 0.05 355.24 0.06 3
31.47 39.82 40.79 0.06 0.02 347.37 0.00 2
32.67 40.23 15.76 0.43 0.06 357.11 0.00 3
29.63 39.08 34.75 1.04 0.03 357.94 0.00 2
18.80 40.11 40.90 0.15 0.02 170.98 0.00 2
18.64 40.78 9.58 0.64 0.07 350.11 0.00 3
17.59 37.84 38.97 0.09 0.03 179.77 0.00 2
1.50 51.73 10.59 0.35 0.04 351.54 0.00 4
‐2.13 54.65 7.21 0.13 0.28 170.26 0.66 3
1.82 46.50 28.98 0.30 0.02 349.73 0.00 4
8.72 43.68 24.00 0.10 0.03 170.16 0.00 3
‐10.54 41.95 38.31 0.29 0.03 173.43 0.00 4
‐26.41 50.80 40.32 0.38 0.02 349.28 0.00 3
‐26.47 52.67 10.51 0.29 0.11 11.35 0.02 4
‐30.96 47.18 18.75 1.15 0.08 349.17 0.00 2
‐15.06 50.39 9.44 0.49 0.10 170.55 0.00 2
‐9.15 49.11 6.96 0.04 0.20 351.55 0.83 2
‐15.63 52.45 9.28 0.18 0.07 349.91 0.02 2
‐10.54 54.28 50.37 0.17 0.02 349.94 0.00 2
‐22.20 62.57 6.42 0.00 0.04 195.37 1.00 4
‐19.25 75.08 2.89 0.34 0.18 24.65 0.11 3
‐64.30 74.87 32.46 0.33 0.02 29.03 0.00 3
‐66.86 72.31 8.26 0.62 0.12 155.81 0.00 4
‐51.03 76.98 7.32 0.87 0.09 211.97 0.00 4
‐102.98 81.33 26.25 0.08 0.06 310.26 0.18 4
‐93.43 77.44 11.52 0.66 0.10 214.22 0.00 4
‐75.79 72.15 9.92 0.18 0.15 23.26 0.24 4
‐77.91 65.61 14.01 0.11 0.07 161.49 0.11 2
‐90.86 69.76 7.70 0.06 0.03 200.67 0.09 4
‐78.38 66.17 1.81 0.31 0.34 161.01 0.46 3
‐96.43 71.52 9.78 0.32 0.06 158.54 0.00 4
‐84.66 71.07 9.94 0.61 0.12 196.61 0.00 3
‐62.78 72.13 9.37 1.10 0.13 204.09 0.00 3
‐29.33 76.93 19.12 0.01 0.11 327.38 0.94 4
‐32.44 71.27 23.68 0.34 0.04 159.49 0.00 3
‐50.68 68.35 55.29 0.02 0.01 194.91 0.04 3
‐18.58 82.29 11.59 0.11 0.15 66.32 0.49 3
‐22.94 79.94 6.50 1.11 0.14 315.24 0.00 2
‐19.04 80.23 10.25 0.11 0.10 137.05 0.28 3
‐18.95 78.44 10.44 0.64 0.21 142.17 0.01 2
‐35.42 77.31 6.00 0.03 0.08 28.59 0.74 2
‐4.29 79.89 3.20 1.44 0.16 223.39 0.00 2
4.99 81.83 6.77 0.26 0.35 300.15 0.46 2
‐43.85 82.53 14.98 0.03 0.14 70.88 0.84 4
~53~
‐50.80 83.19 10.72 0.08 0.21 280.05 0.70 3
‐67.13 80.36 3.46 0.46 0.13 227.40 0.01 2
‐86.57 82.74 12.88 0.11 0.07 295.94 0.11 2
‐114.33 76.52 9.67 0.58 0.12 30.33 0.00 2
‐152.73 82.88 14.02 0.10 0.05 99.63 0.05 2
‐126.96 79.85 10.72 0.03 0.04 316.75 0.53 3
‐94.00 83.20 3.51 0.39 0.12 104.81 0.01 2
‐153.66 81.83 15.99 0.21 0.06 61.31 0.00 4
‐126.22 75.43 19.43 0.26 0.04 208.07 0.00 3
‐123.79 78.11 13.75 0.01 0.09 324.60 0.91 2
‐104.91 72.83 2.87 0.25 0.15 338.15 0.16 2
‐114.50 74.93 22.64 0.47 0.06 155.71 0.00 1
‐113.16 73.74 34.89 0.02 0.02 335.08 0.36 2
‐111.15 71.15 8.50 0.08 0.26 201.69 0.76 3
‐109.56 71.47 8.28 0.08 0.09 339.93 0.36 1
‐123.26 71.13 21.51 0.20 0.03 159.01 0.00 3
‐116.71 72.18 41.60 0.06 0.02 339.58 0.00 1
‐136.29 75.06 12.16 0.02 0.05 26.70 0.74 2
‐146.95 77.11 15.37 0.63 0.17 331.84 0.00 1
‐141.44 76.41 27.65 0.12 0.04 330.46 0.00 1
‐143.76 76.12 11.15 0.63 0.14 331.15 0.00 1
‐160.37 75.30 15.30 0.36 0.08 208.19 0.00 3
‐124.45 68.61 24.03 0.11 0.03 202.84 0.00 1
‐121.51 69.56 11.82 0.24 0.23 160.54 0.30 2
‐125.77 72.46 50.73 0.27 0.03 24.89 0.00 1
‐158.52 79.14 28.39 0.35 0.02 38.57 0.00 2
‐155.51 78.75 8.14 0.20 0.10 323.31 0.05 2
‐135.06 71.92 4.34 0.79 0.26 201.55 0.01 3
‐132.24 66.49 23.71 0.01 0.03 203.23 0.60 4
‐138.67 63.19 14.99 0.23 0.05 21.11 0.00 4
‐157.96 72.23 10.96 0.18 0.11 337.08 0.12 2
‐154.55 69.13 2.08 0.18 0.17 201.76 0.34 4
‐138.87 72.54 65.75 0.10 0.02 159.71 0.00 2
‐163.55 73.92 24.63 0.11 0.03 335.14 0.00 1
‐130.97 69.93 32.57 0.15 0.02 160.26 0.00 1
‐136.30 68.51 9.83 0.39 0.06 15.57 0.00 1
‐168.34 77.34 12.23 0.14 0.07 331.61 0.04 2
‐147.41 65.66 5.84 0.01 0.26 164.94 0.96 2
‐141.01 68.83 11.65 0.20 0.09 162.79 0.03 1
‐145.43 69.06 5.29 1.06 0.30 203.01 0.01 2
‐146.62 72.77 27.09 0.67 0.03 156.89 0.00 1
‐173.59 78.11 7.53 0.42 0.18 325.24 0.03 2
‐151.17 71.68 12.57 0.73 0.09 158.06 0.00 1
169.95 78.49 9.12 0.21 0.13 143.75 0.10 2
139.74 76.63 18.43 0.10 0.05 31.64 0.08 3
144.41 78.24 15.40 0.32 0.08 216.31 0.00 3
141.51 80.63 14.99 0.70 0.06 49.22 0.00 3
155.30 73.22 11.71 0.22 0.12 20.62 0.09 2
151.81 72.73 25.39 0.08 0.03 19.97 0.00 3
‐101.00 65.80 49.96 0.52 0.05 11.84 0.00 2
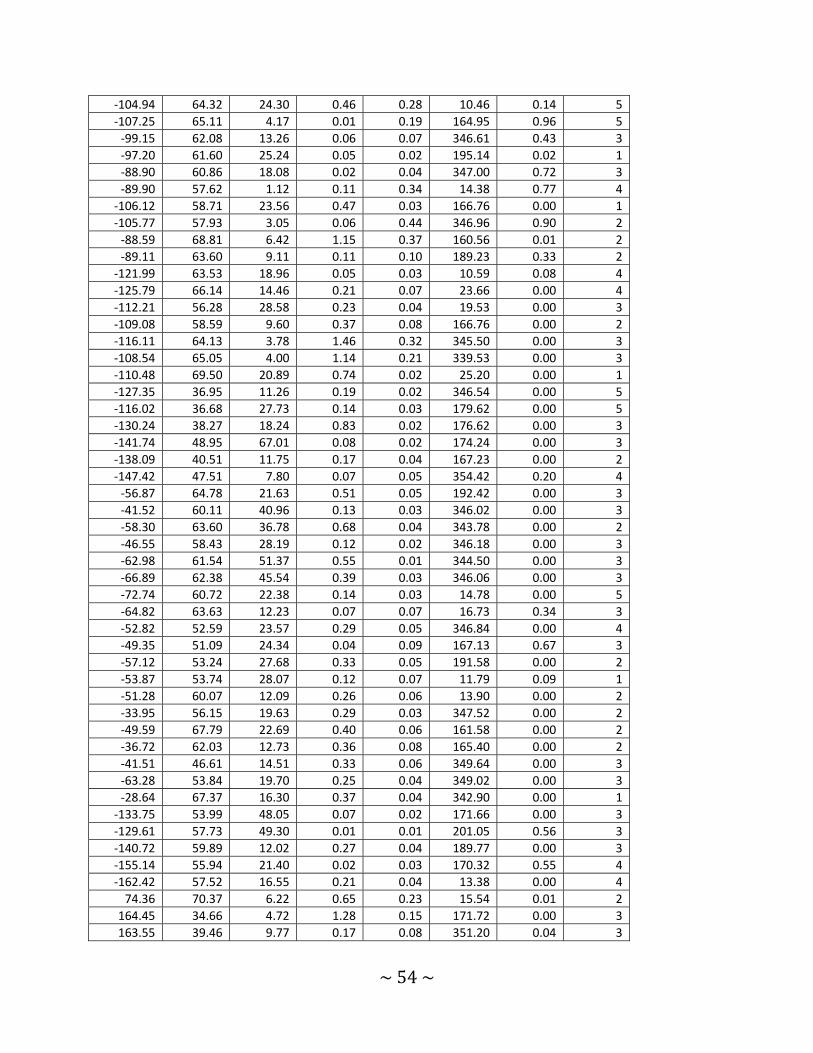
~54~
‐104.94 64.32 24.30 0.46 0.28 10.46 0.14 5
‐107.25 65.11 4.17 0.01 0.19 164.95 0.96 5
‐99.15 62.08 13.26 0.06 0.07 346.61 0.43 3
‐97.20 61.60 25.24 0.05 0.02 195.14 0.02 1
‐88.90 60.86 18.08 0.02 0.04 347.00 0.72 3
‐89.90 57.62 1.12 0.11 0.34 14.38 0.77 4
‐106.12 58.71 23.56 0.47 0.03 166.76 0.00 1
‐105.77 57.93 3.05 0.06 0.44 346.96 0.90 2
‐88.59 68.81 6.42 1.15 0.37 160.56 0.01 2
‐89.11 63.60 9.11 0.11 0.10 189.23 0.33 2
‐121.99 63.53 18.96 0.05 0.03 10.59 0.08 4
‐125.79 66.14 14.46 0.21 0.07 23.66 0.00 4
‐112.21 56.28 28.58 0.23 0.04 19.53 0.00 3
‐109.08 58.59 9.60 0.37 0.08 166.76 0.00 2
‐116.11 64.13 3.78 1.46 0.32 345.50 0.00 3
‐108.54 65.05 4.00 1.14 0.21 339.53 0.00 3
‐110.48 69.50 20.89 0.74 0.02 25.20 0.00 1
‐127.35 36.95 11.26 0.19 0.02 346.54 0.00 5
‐116.02 36.68 27.73 0.14 0.03 179.62 0.00 5
‐130.24 38.27 18.24 0.83 0.02 176.62 0.00 3
‐141.74 48.95 67.01 0.08 0.02 174.24 0.00 3
‐138.09 40.51 11.75 0.17 0.04 167.23 0.00 2
‐147.42 47.51 7.80 0.07 0.05 354.42 0.20 4
‐56.87 64.78 21.63 0.51 0.05 192.42 0.00 3
‐41.52 60.11 40.96 0.13 0.03 346.02 0.00 3
‐58.30 63.60 36.78 0.68 0.04 343.78 0.00 2
‐46.55 58.43 28.19 0.12 0.02 346.18 0.00 3
‐62.98 61.54 51.37 0.55 0.01 344.50 0.00 3
‐66.89 62.38 45.54 0.39 0.03 346.06 0.00 3
‐72.74 60.72 22.38 0.14 0.03 14.78 0.00 5
‐64.82 63.63 12.23 0.07 0.07 16.73 0.34 3
‐52.82 52.59 23.57 0.29 0.05 346.84 0.00 4
‐49.35 51.09 24.34 0.04 0.09 167.13 0.67 3
‐57.12 53.24 27.68 0.33 0.05 191.58 0.00 2
‐53.87 53.74 28.07 0.12 0.07 11.79 0.09 1
‐51.28 60.07 12.09 0.26 0.06 13.90 0.00 2
‐33.95 56.15 19.63 0.29 0.03 347.52 0.00 2
‐49.59 67.79 22.69 0.40 0.06 161.58 0.00 2
‐36.72 62.03 12.73 0.36 0.08 165.40 0.00 2
‐41.51 46.61 14.51 0.33 0.06 349.64 0.00 3
‐63.28 53.84 19.70 0.25 0.04 349.02 0.00 3
‐28.64 67.37 16.30 0.37 0.04 342.90 0.00 1
‐133.75 53.99 48.05 0.07 0.02 171.66 0.00 3
‐129.61 57.73 49.30 0.01 0.01 201.05 0.56 3
‐140.72 59.89 12.02 0.27 0.04 189.77 0.00 3
‐155.14 55.94 21.40 0.02 0.03 170.32 0.55 4
‐162.42 57.52 16.55 0.21 0.04 13.38 0.00 4
74.36 70.37 6.22 0.65 0.23 15.54 0.01 2
164.45 34.66 4.72 1.28 0.15 171.72 0.00 3
163.55 39.46 9.77 0.17 0.08 351.20 0.04 3
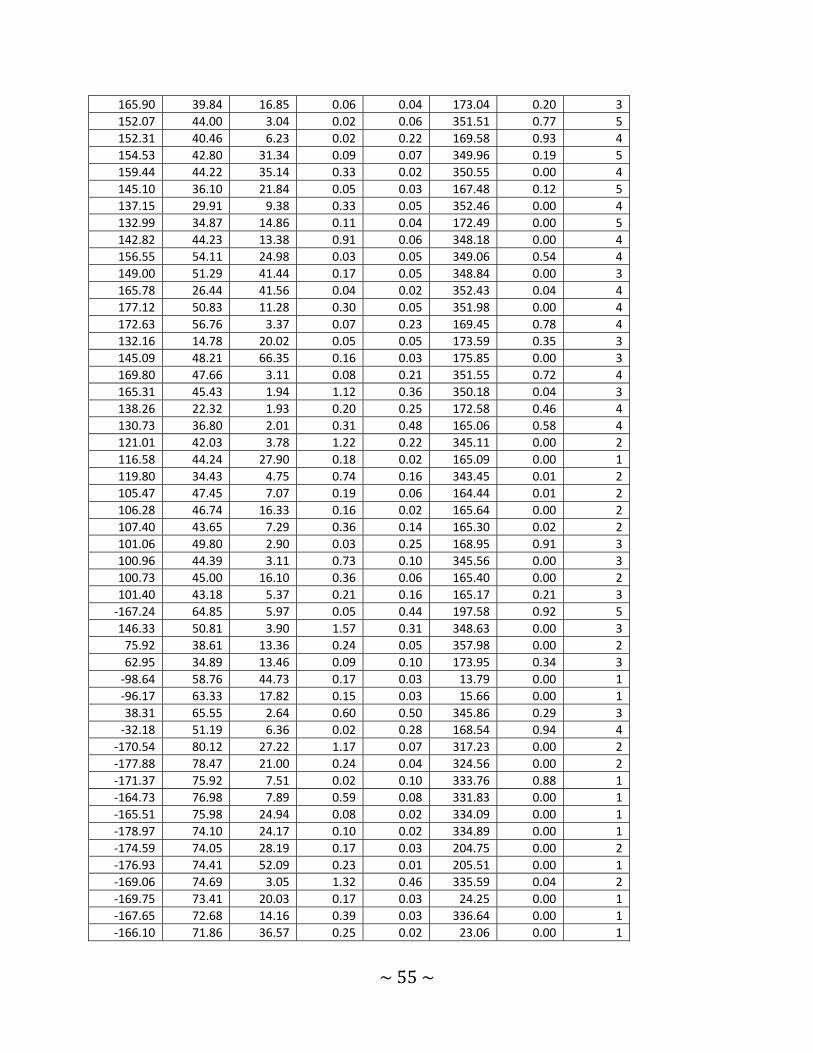
~55~
165.90 39.84 16.85 0.06 0.04 173.04 0.20 3
152.07 44.00 3.04 0.02 0.06 351.51 0.77 5
152.31 40.46 6.23 0.02 0.22 169.58 0.93 4
154.53 42.80 31.34 0.09 0.07 349.96 0.19 5
159.44 44.22 35.14 0.33 0.02 350.55 0.00 4
145.10 36.10 21.84 0.05 0.03 167.48 0.12 5
137.15 29.91 9.38 0.33 0.05 352.46 0.00 4
132.99 34.87 14.86 0.11 0.04 172.49 0.00 5
142.82 44.23 13.38 0.91 0.06 348.18 0.00 4
156.55 54.11 24.98 0.03 0.05 349.06 0.54 4
149.00 51.29 41.44 0.17 0.05 348.84 0.00 3
165.78 26.44 41.56 0.04 0.02 352.43 0.04 4
177.12 50.83 11.28 0.30 0.05 351.98 0.00 4
172.63 56.76 3.37 0.07 0.23 169.45 0.78 4
132.16 14.78 20.02 0.05 0.05 173.59 0.35 3
145.09 48.21 66.35 0.16 0.03 175.85 0.00 3
169.80 47.66 3.11 0.08 0.21 351.55 0.72 4
165.31 45.43 1.94 1.12 0.36 350.18 0.04 3
138.26 22.32 1.93 0.20 0.25 172.58 0.46 4
130.73 36.80 2.01 0.31 0.48 165.06 0.58 4
121.01 42.03 3.78 1.22 0.22 345.11 0.00 2
116.58 44.24 27.90 0.18 0.02 165.09 0.00 1
119.80 34.43 4.75 0.74 0.16 343.45 0.01 2
105.47 47.45 7.07 0.19 0.06 164.44 0.01 2
106.28 46.74 16.33 0.16 0.02 165.64 0.00 2
107.40 43.65 7.29 0.36 0.14 165.30 0.02 2
101.06 49.80 2.90 0.03 0.25 168.95 0.91 3
100.96 44.39 3.11 0.73 0.10 345.56 0.00 3
100.73 45.00 16.10 0.36 0.06 165.40 0.00 2
101.40 43.18 5.37 0.21 0.16 165.17 0.21 3
‐167.24 64.85 5.97 0.05 0.44 197.58 0.92 5
146.33 50.81 3.90 1.57 0.31 348.63 0.00 3
75.92 38.61 13.36 0.24 0.05 357.98 0.00 2
62.95 34.89 13.46 0.09 0.10 173.95 0.34 3
‐98.64 58.76 44.73 0.17 0.03 13.79 0.00 1
‐96.17 63.33 17.82 0.15 0.03 15.66 0.00 1
38.31 65.55 2.64 0.60 0.50 345.86 0.29 3
‐32.18 51.19 6.36 0.02 0.28 168.54 0.94 4
‐170.54 80.12 27.22 1.17 0.07 317.23 0.00 2
‐177.88 78.47 21.00 0.24 0.04 324.56 0.00 2
‐171.37 75.92 7.51 0.02 0.10 333.76 0.88 1
‐164.73 76.98 7.89 0.59 0.08 331.83 0.00 1
‐165.51 75.98 24.94 0.08 0.02 334.09 0.00 1
‐178.97 74.10 24.17 0.10 0.02 334.89 0.00 1
‐174.59 74.05 28.19 0.17 0.03 204.75 0.00 2
‐176.93 74.41 52.09 0.23 0.01 205.51 0.00 1
‐169.06 74.69 3.05 1.32 0.46 335.59 0.04 2
‐169.75 73.41 20.03 0.17 0.03 24.25 0.00 1
‐167.65 72.68 14.16 0.39 0.03 336.64 0.00 1
‐166.10 71.86 36.57 0.25 0.02 23.06 0.00 1
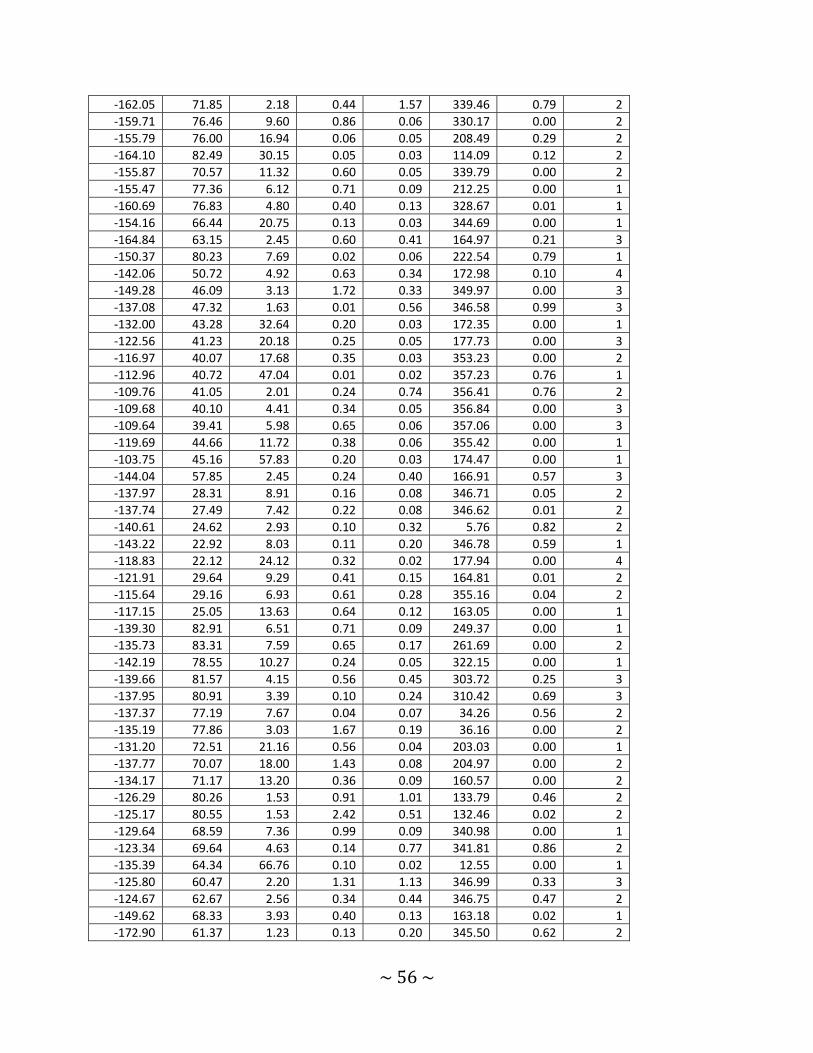
~56~
‐162.05 71.85 2.18 0.44 1.57 339.46 0.79 2
‐159.71 76.46 9.60 0.86 0.06 330.17 0.00 2
‐155.79 76.00 16.94 0.06 0.05 208.49 0.29 2
‐164.10 82.49 30.15 0.05 0.03 114.09 0.12 2
‐155.87 70.57 11.32 0.60 0.05 339.79 0.00 2
‐155.47 77.36 6.12 0.71 0.09 212.25 0.00 1
‐160.69 76.83 4.80 0.40 0.13 328.67 0.01 1
‐154.16 66.44 20.75 0.13 0.03 344.69 0.00 1
‐164.84 63.15 2.45 0.60 0.41 164.97 0.21 3
‐150.37 80.23 7.69 0.02 0.06 222.54 0.79 1
‐142.06 50.72 4.92 0.63 0.34 172.98 0.10 4
‐149.28 46.09 3.13 1.72 0.33 349.97 0.00 3
‐137.08 47.32 1.63 0.01 0.56 346.58 0.99 3
‐132.00 43.28 32.64 0.20 0.03 172.35 0.00 1
‐122.56 41.23 20.18 0.25 0.05 177.73 0.00 3
‐116.97 40.07 17.68 0.35 0.03 353.23 0.00 2
‐112.96 40.72 47.04 0.01 0.02 357.23 0.76 1
‐109.76 41.05 2.01 0.24 0.74 356.41 0.76 2
‐109.68 40.10 4.41 0.34 0.05 356.84 0.00 3
‐109.64 39.41 5.98 0.65 0.06 357.06 0.00 3
‐119.69 44.66 11.72 0.38 0.06 355.42 0.00 1
‐103.75 45.16 57.83 0.20 0.03 174.47 0.00 1
‐144.04 57.85 2.45 0.24 0.40 166.91 0.57 3
‐137.97 28.31 8.91 0.16 0.08 346.71 0.05 2
‐137.74 27.49 7.42 0.22 0.08 346.62 0.01 2
‐140.61 24.62 2.93 0.10 0.32 5.76 0.82 2
‐143.22 22.92 8.03 0.11 0.20 346.78 0.59 1
‐118.83 22.12 24.12 0.32 0.02 177.94 0.00 4
‐121.91 29.64 9.29 0.41 0.15 164.81 0.01 2
‐115.64 29.16 6.93 0.61 0.28 355.16 0.04 2
‐117.15 25.05 13.63 0.64 0.12 163.05 0.00 1
‐139.30 82.91 6.51 0.71 0.09 249.37 0.00 1
‐135.73 83.31 7.59 0.65 0.17 261.69 0.00 2
‐142.19 78.55 10.27 0.24 0.05 322.15 0.00 1
‐139.66 81.57 4.15 0.56 0.45 303.72 0.25 3
‐137.95 80.91 3.39 0.10 0.24 310.42 0.69 3
‐137.37 77.19 7.67 0.04 0.07 34.26 0.56 2
‐135.19 77.86 3.03 1.67 0.19 36.16 0.00 2
‐131.20 72.51 21.16 0.56 0.04 203.03 0.00 1
‐137.77 70.07 18.00 1.43 0.08 204.97 0.00 2
‐134.17 71.17 13.20 0.36 0.09 160.57 0.00 2
‐126.29 80.26 1.53 0.91 1.01 133.79 0.46 2
‐125.17 80.55 1.53 2.42 0.51 132.46 0.02 2
‐129.64 68.59 7.36 0.99 0.09 340.98 0.00 1
‐123.34 69.64 4.63 0.14 0.77 341.81 0.86 2
‐135.39 64.34 66.76 0.10 0.02 12.55 0.00 1
‐125.80 60.47 2.20 1.31 1.13 346.99 0.33 3
‐124.67 62.67 2.56 0.34 0.44 346.75 0.47 2
‐149.62 68.33 3.93 0.40 0.13 163.18 0.02 1
‐172.90 61.37 1.23 0.13 0.20 345.50 0.62 2
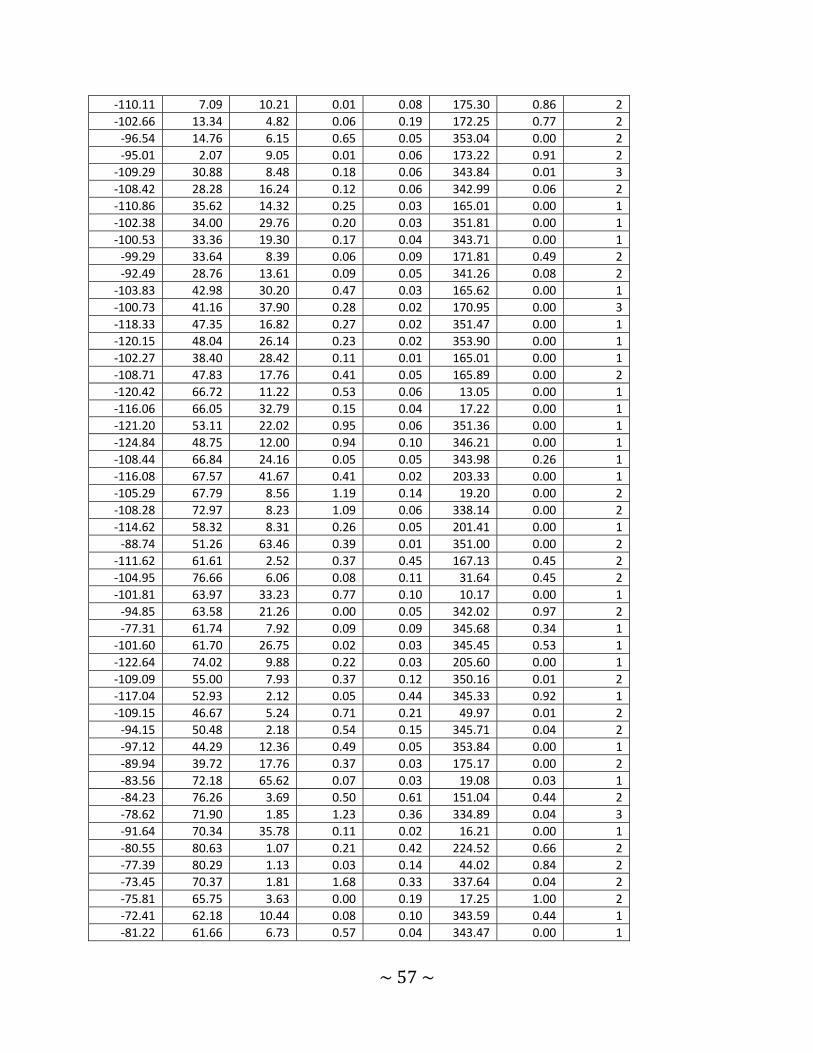
~57~
‐110.11 7.09 10.21 0.01 0.08 175.30 0.86 2
‐102.66 13.34 4.82 0.06 0.19 172.25 0.77 2
‐96.54 14.76 6.15 0.65 0.05 353.04 0.00 2
‐95.01 2.07 9.05 0.01 0.06 173.22 0.91 2
‐109.29 30.88 8.48 0.18 0.06 343.84 0.01 3
‐108.42 28.28 16.24 0.12 0.06 342.99 0.06 2
‐110.86 35.62 14.32 0.25 0.03 165.01 0.00 1
‐102.38 34.00 29.76 0.20 0.03 351.81 0.00 1
‐100.53 33.36 19.30 0.17 0.04 343.71 0.00 1
‐99.29 33.64 8.39 0.06 0.09 171.81 0.49 2
‐92.49 28.76 13.61 0.09 0.05 341.26 0.08 2
‐103.83 42.98 30.20 0.47 0.03 165.62 0.00 1
‐100.73 41.16 37.90 0.28 0.02 170.95 0.00 3
‐118.33 47.35 16.82 0.27 0.02 351.47 0.00 1
‐120.15 48.04 26.14 0.23 0.02 353.90 0.00 1
‐102.27 38.40 28.42 0.11 0.01 165.01 0.00 1
‐108.71 47.83 17.76 0.41 0.05 165.89 0.00 2
‐120.42 66.72 11.22 0.53 0.06 13.05 0.00 1
‐116.06 66.05 32.79 0.15 0.04 17.22 0.00 1
‐121.20 53.11 22.02 0.95 0.06 351.36 0.00 1
‐124.84 48.75 12.00 0.94 0.10 346.21 0.00 1
‐108.44 66.84 24.16 0.05 0.05 343.98 0.26 1
‐116.08 67.57 41.67 0.41 0.02 203.33 0.00 1
‐105.29 67.79 8.56 1.19 0.14 19.20 0.00 2
‐108.28 72.97 8.23 1.09 0.06 338.14 0.00 2
‐114.62 58.32 8.31 0.26 0.05 201.41 0.00 1
‐88.74 51.26 63.46 0.39 0.01 351.00 0.00 2
‐111.62 61.61 2.52 0.37 0.45 167.13 0.45 2
‐104.95 76.66 6.06 0.08 0.11 31.64 0.45 2
‐101.81 63.97 33.23 0.77 0.10 10.17 0.00 1
‐94.85 63.58 21.26 0.00 0.05 342.02 0.97 2
‐77.31 61.74 7.92 0.09 0.09 345.68 0.34 1
‐101.60 61.70 26.75 0.02 0.03 345.45 0.53 1
‐122.64 74.02 9.88 0.22 0.03 205.60 0.00 1
‐109.09 55.00 7.93 0.37 0.12 350.16 0.01 2
‐117.04 52.93 2.12 0.05 0.44 345.33 0.92 1
‐109.15 46.67 5.24 0.71 0.21 49.97 0.01 2
‐94.15 50.48 2.18 0.54 0.15 345.71 0.04 2
‐97.12 44.29 12.36 0.49 0.05 353.84 0.00 1
‐89.94 39.72 17.76 0.37 0.03 175.17 0.00 2
‐83.56 72.18 65.62 0.07 0.03 19.08 0.03 1
‐84.23 76.26 3.69 0.50 0.61 151.04 0.44 2
‐78.62 71.90 1.85 1.23 0.36 334.89 0.04 3
‐91.64 70.34 35.78 0.11 0.02 16.21 0.00 1
‐80.55 80.63 1.07 0.21 0.42 224.52 0.66 2
‐77.39 80.29 1.13 0.03 0.14 44.02 0.84 2
‐73.45 70.37 1.81 1.68 0.33 337.64 0.04 2
‐75.81 65.75 3.63 0.00 0.19 17.25 1.00 2
‐72.41 62.18 10.44 0.08 0.10 343.59 0.44 1
‐81.22 61.66 6.73 0.57 0.04 343.47 0.00 1
~58~
‐99.06 63.67 4.03 0.37 0.20 16.85 0.09 1
‐74.31 57.51 13.63 1.27 0.07 193.41 0.00 1
‐90.70 56.61 1.76 1.33 0.16 344.98 0.00 1
‐86.29 46.01 10.11 0.46 0.07 345.67 0.00 4
‐89.87 47.38 4.37 0.37 0.19 345.76 0.09 2
‐65.33 54.27 13.44 1.13 0.05 165.84 0.00 1
‐90.59 44.48 4.37 0.63 0.14 173.58 0.00 1
‐67.71 57.95 6.68 0.44 0.17 190.13 0.02 3
‐72.41 49.02 5.81 0.31 0.11 349.82 0.01 1
‐88.49 43.60 3.90 0.39 0.35 345.59 0.30 2
‐64.46 47.07 19.49 0.07 0.04 165.29 0.10 1
‐65.44 57.02 2.39 0.34 0.26 163.07 0.25 1
‐64.22 58.88 21.06 0.01 0.04 13.70 0.90 1
‐73.20 59.74 2.24 1.59 0.48 346.28 0.03 1
‐64.74 57.66 4.61 0.25 0.11 191.98 0.05 1
‐69.95 51.60 8.05 0.71 0.10 164.76 0.00 1
‐59.69 61.00 6.02 0.92 0.47 164.48 0.08 3
‐56.11 56.05 6.33 0.17 0.08 192.09 0.10 2
‐85.88 31.37 10.81 0.17 0.10 357.34 0.11 1
‐85.19 34.41 4.69 0.28 0.09 343.09 0.01 3
‐82.84 36.42 4.77 0.40 0.27 163.69 0.17 2
‐94.00 32.81 3.25 1.58 0.33 343.49 0.01 1
‐86.38 28.59 4.01 0.41 0.09 351.78 0.00 1
‐76.45 27.86 6.91 0.03 0.10 159.26 0.83 1
‐73.00 37.93 15.41 0.13 0.07 173.83 0.08 1
‐72.41 33.10 15.57 0.16 0.05 354.88 0.00 1
‐67.39 35.61 10.17 0.02 0.09 163.23 0.78 1
‐72.21 31.09 11.03 0.91 0.06 355.08 0.00 1
‐66.23 32.50 25.87 0.23 0.07 341.82 0.00 1
‐70.73 36.57 10.90 0.74 0.09 343.66 0.00 1
‐66.40 42.36 5.17 0.43 0.23 345.88 0.09 2
‐62.35 38.11 7.60 0.54 0.22 164.21 0.03 1
‐71.99 28.73 14.26 0.18 0.05 355.79 0.00 2
‐46.79 20.53 71.33 0.02 0.02 172.76 0.33 1
‐46.22 16.26 11.91 0.43 0.06 352.61 0.00 1
‐47.86 28.18 57.65 0.11 0.01 172.62 0.00 1
‐47.54 25.94 36.92 0.11 0.05 172.70 0.04 1
‐49.11 35.94 3.33 1.06 0.10 172.02 0.00 2
‐56.42 39.24 2.65 0.69 0.16 352.02 0.00 3
‐44.66 36.66 7.70 0.47 0.11 165.64 0.00 2
‐45.33 38.78 7.13 0.75 0.23 166.10 0.01 2
‐42.27 37.96 14.48 0.71 0.05 166.36 0.00 2
‐63.41 82.79 1.59 0.41 0.56 293.85 0.51 2
‐59.18 67.21 9.85 0.90 0.09 17.39 0.00 1
‐61.05 64.62 4.50 0.22 0.09 197.06 0.06 1
‐54.12 66.07 6.47 0.07 0.27 342.36 0.80 3
‐45.98 64.06 8.65 0.20 0.09 15.87 0.03 2
‐55.77 63.24 8.26 0.02 0.14 195.18 0.90 3
‐56.84 61.23 4.15 0.39 0.21 344.68 0.11 2
‐54.14 61.69 6.03 0.49 0.26 164.59 0.08 2
~59~
‐54.97 58.81 3.03 0.23 0.10 13.05 0.06 3
‐52.56 58.74 3.74 0.72 0.20 165.63 0.01 4
‐45.07 61.29 4.19 0.93 0.26 345.29 0.01 3
‐42.75 56.46 8.07 0.14 0.10 166.80 0.18 2
‐56.67 45.21 9.71 0.60 0.12 345.19 0.00 2
‐51.03 45.44 23.79 0.32 0.04 350.62 0.00 1
‐50.76 46.80 10.05 0.49 0.05 347.09 0.00 1
‐47.34 45.15 16.07 0.36 0.05 347.18 0.00 1
‐44.18 52.75 19.15 0.16 0.05 167.36 0.01 2
‐36.51 46.92 35.28 0.06 0.02 168.41 0.00 2
‐49.12 41.77 5.87 0.75 0.17 346.56 0.00 1
‐39.26 37.16 8.29 0.47 0.08 346.90 0.00 1
‐55.11 50.90 3.28 1.06 0.31 346.91 0.02 3
‐59.04 50.79 4.39 0.10 0.19 349.70 0.62 2
‐32.75 71.81 1.97 0.88 0.19 202.42 0.01 3
‐34.40 29.76 10.88 2.17 0.03 165.46 0.01 3
‐31.82 40.03 1.58 0.13 0.05 168.77 0.23 2
‐18.05 51.07 8.80 0.70 0.20 350.01 0.00 1
‐23.17 37.57 12.92 0.70 0.09 350.77 0.00 1
‐11.84 48.66 6.43 0.71 0.17 351.29 0.00 2
‐12.34 50.69 18.11 0.70 0.09 350.71 0.00 2
‐5.81 46.39 11.56 0.23 0.11 172.85 0.04 3
‐11.08 45.05 2.57 0.96 0.42 172.45 0.11 3
‐19.85 33.96 12.24 0.83 0.08 351.82 0.00 2
‐11.86 31.38 18.63 0.09 0.10 355.43 0.43 3
‐5.06 41.59 8.82 0.43 0.09 174.57 0.00 3
‐14.48 65.04 1.81 0.95 0.18 16.37 0.00 2
‐24.53 75.00 6.09 0.98 0.36 205.34 0.01 2
‐21.07 81.74 1.84 0.08 0.21 235.88 0.72 3
‐3.35 77.88 2.10 1.27 0.28 146.30 0.01 2
8.60 81.17 3.72 1.57 0.39 127.34 0.00 2
5.46 79.24 1.92 0.28 0.15 318.48 0.13 2
25.58 76.07 2.75 0.07 0.43 149.33 0.87 2
23.38 66.77 4.82 0.61 0.25 161.95 0.03 2
20.44 41.04 13.54 0.11 0.10 177.66 0.28 1
2.60 27.30 10.36 0.63 0.17 352.02 0.00 3
23.37 46.80 13.36 0.26 0.05 169.62 0.00 1
11.74 39.29 2.44 0.14 0.06 358.15 0.14 2
20.11 29.40 7.37 0.01 0.21 5.79 0.96 2
27.36 43.21 20.88 0.26 0.04 350.21 0.00 1
29.38 42.90 7.66 0.65 0.08 176.46 0.00 1
15.30 25.11 4.40 1.25 0.17 172.17 0.00 2
3.72 19.84 74.32 0.24 0.02 172.42 0.00 1
4.20 16.40 2.46 0.96 0.18 352.64 0.00 2
13.72 14.47 11.71 0.75 0.08 172.54 0.00 1
19.29 20.48 32.65 0.15 0.11 168.83 0.17 3
17.20 13.57 13.83 0.60 0.07 348.98 0.00 2
13.44 16.58 4.63 0.76 0.11 352.57 0.00 2
32.83 21.66 30.50 0.17 0.05 346.88 0.00 1
26.19 20.59 2.64 0.36 0.09 347.84 0.01 3
~60~
24.69 27.12 12.67 0.57 0.09 348.31 0.00 2
35.67 25.96 4.31 0.47 0.06 185.29 0.08 1
42.52 25.17 5.97 0.02 0.11 3.01 0.88 1
38.30 26.94 3.21 1.01 0.20 166.60 0.00 1
45.86 21.44 2.11 0.04 0.08 3.42 0.63 1
46.11 29.82 4.69 0.56 0.26 179.97 0.06 3
36.01 37.41 6.02 0.53 0.07 178.60 0.00 2
46.26 34.54 2.30 0.01 0.06 166.59 0.89 3
46.12 30.14 1.56 0.14 0.53 179.50 0.81 4
40.25 52.10 1.80 0.06 0.16 353.01 0.71 2
45.39 80.22 2.41 1.20 0.31 317.62 0.01 2
46.77 82.95 2.62 0.44 0.23 280.28 0.11 2
63.90 79.75 2.49 0.27 0.27 221.68 0.37 2
76.57 83.04 3.76 0.18 0.21 99.61 0.43 3
50.14 70.87 12.40 0.43 1.24 157.92 0.73 2
73.00 68.53 2.38 0.51 0.20 193.58 0.05 2
60.57 50.30 39.85 0.24 0.03 165.39 0.00 1
71.98 53.52 2.93 1.64 0.12 167.74 0.00 2
70.03 49.73 9.46 0.09 0.07 349.55 0.23 1
73.30 50.65 31.65 0.22 0.07 165.27 0.00 1
74.33 48.08 47.23 0.23 0.05 165.52 0.00 1
76.59 48.77 14.08 0.49 0.06 169.22 0.00 1
67.65 39.70 2.05 1.39 0.49 165.35 0.05 2
57.33 41.37 2.03 0.30 0.30 346.11 0.39 3
50.54 42.12 1.61 0.99 0.87 346.50 0.34 3
52.50 35.82 3.51 0.81 0.29 166.03 0.02 2
69.35 34.53 17.08 1.08 0.03 344.97 0.00 1
56.46 30.30 19.47 0.01 0.02 176.67 0.82 4
64.52 17.29 12.78 0.74 0.04 176.92 0.00 3
66.78 22.46 10.71 0.32 0.05 341.90 0.00 2
71.24 19.64 22.68 0.64 0.04 339.86 0.00 1
74.78 25.42 13.09 0.23 0.09 352.59 0.02 1
50.96 29.89 30.87 0.74 0.07 165.50 0.00 1
71.34 23.98 4.65 0.20 0.11 173.71 0.09 2
70.43 21.77 5.03 0.30 0.20 160.71 0.18 2
71.77 20.30 4.80 1.21 0.27 353.73 0.00 1
75.56 19.84 4.45 0.26 0.29 352.68 0.38 1
65.85 15.75 72.92 0.55 0.06 158.62 0.00 1
88.16 21.20 30.91 0.39 0.03 352.50 0.00 3
100.27 23.10 53.65 0.17 0.00 172.29 0.00 3
80.70 30.06 48.73 0.63 0.03 162.16 0.00 1
79.94 33.90 8.97 0.39 0.12 171.50 0.00 3
83.73 29.92 11.26 0.40 0.02 171.92 0.00 3
86.69 31.44 37.71 0.15 0.01 342.43 0.00 2
85.72 34.10 4.97 0.12 0.17 343.61 0.48 3
95.11 35.64 8.75 0.36 0.10 351.35 0.00 2
94.83 35.30 12.93 0.15 0.06 163.38 0.03 1
101.28 35.75 7.05 0.80 0.10 351.41 0.00 2
91.63 44.21 15.30 0.39 0.07 165.28 0.00 1
92.33 47.85 1.44 1.20 0.74 349.56 0.25 1

~61~
99.46 39.89 18.21 0.54 0.05 164.44 0.00 2
100.44 39.98 11.09 0.70 0.07 350.85 0.00 2
79.56 49.18 21.33 0.18 0.06 169.11 0.00 1
100.17 60.72 2.89 0.30 0.22 347.56 0.22 1
93.10 53.35 1.23 0.79 0.16 350.63 0.04 1
81.06 64.82 5.25 1.75 0.22 340.19 0.00 2
91.63 70.40 2.74 0.42 0.46 20.87 0.39 1
91.05 72.41 1.92 0.96 0.44 23.98 0.08 1
100.37 70.15 1.65 0.33 0.41 161.77 0.48 1
92.55 76.83 5.60 0.88 0.17 329.16 0.00 2
79.66 81.37 1.93 0.74 0.71 126.77 0.36 2
78.53 82.31 2.94 1.62 1.14 62.40 0.23 2
84.98 82.29 1.15 2.09 0.25 116.80 0.01 1
116.64 82.79 5.24 0.32 0.16 248.62 0.08 2
119.96 76.12 2.74 0.28 0.10 213.81 0.04 3
108.81 73.66 3.04 0.98 0.37 19.52 0.04 1
125.19 72.30 5.13 0.22 0.12 17.90 0.09 3
105.19 70.23 3.86 0.17 0.28 200.91 0.56 2
119.46 63.78 53.44 0.28 0.02 343.02 0.00 1
128.03 64.55 46.90 0.28 0.02 343.02 0.00 1
104.76 62.92 2.23 0.67 0.53 343.99 0.28 2
106.31 60.30 75.82 0.11 0.01 343.99 0.00 1
104.44 51.45 29.35 0.32 0.03 165.59 0.00 1
109.61 46.03 118.37 0.21 0.01 345.65 0.00 1
109.96 36.51 56.56 0.49 0.06 343.59 0.00 1
105.37 31.74 9.06 0.08 0.04 347.29 0.05 1
116.60 27.32 119.75 0.02 0.01 157.99 0.06 3
140.80 58.02 2.32 1.78 0.99 346.28 0.15 2
143.54 65.80 19.18 0.21 0.01 17.94 0.00 1
147.59 66.56 4.13 0.48 0.29 342.53 0.14 1
133.94 64.74 24.50 0.19 0.02 163.07 0.00 1
134.62 66.77 7.36 0.15 0.04 162.65 0.00 1
131.69 66.56 8.51 0.49 0.08 197.97 0.00 1
143.89 66.75 4.13 1.11 0.37 13.20 0.02 2
153.29 66.50 2.86 0.20 0.23 162.79 0.43 3
155.80 69.89 4.55 0.37 0.16 339.58 0.04 1
132.15 70.25 4.59 0.12 0.11 200.38 0.32 1
140.86 70.00 4.48 0.54 0.34 159.85 0.14 2
145.52 72.35 2.37 0.18 0.08 196.79 0.06 2
134.01 77.71 2.35 0.33 0.33 215.14 0.35 2
135.08 76.26 2.51 1.26 0.52 331.96 0.07 2
147.89 73.90 8.08 0.18 0.06 154.93 0.00 1
154.54 70.99 7.72 0.18 0.06 338.42 0.01 1
154.08 71.36 3.63 0.01 0.21 337.93 0.98 1
146.36 76.95 1.80 1.22 0.17 147.76 0.01 1
143.58 70.72 28.63 0.68 0.05 339.10 0.00 1
157.89 74.99 3.35 1.30 0.69 203.34 0.13 1
154.31 78.92 5.04 0.90 0.31 324.57 0.02 2
157.38 78.02 1.27 0.01 0.45 147.65 0.98 1
143.74 79.97 2.76 0.66 0.50 44.76 0.23 2
~62~
139.46 79.88 1.79 0.54 0.92 221.57 0.60 2
140.49 82.58 7.81 1.45 0.13 249.24 0.00 1
142.08 83.15 11.69 0.85 0.12 270.77 0.00 1
174.30 82.87 6.77 0.83 0.11 70.59 0.00 1
177.01 74.27 12.79 0.12 0.08 203.94 0.14 1
167.23 73.75 12.04 0.03 0.03 333.95 0.32 1
159.93 71.17 5.42 0.41 0.11 338.04 0.00 1
179.65 72.53 6.88 1.71 0.09 339.23 0.00 1
167.89 77.45 3.73 0.56 0.17 151.20 0.02 2
168.20 77.16 2.79 0.25 0.16 147.89 0.17 2
165.95 75.63 3.61 0.05 0.18 331.62 0.80 2
158.58 67.76 2.97 0.37 0.07 195.13 0.02 2
160.25 63.06 3.33 1.02 0.14 195.99 0.00 2
159.18 6.51 3.11 0.28 0.12 173.37 0.05 3
‐104.95 68.65 6.06 0.49 0.07 24.96 0.00 1
‐66.61 79.60 3.60 0.82 0.29 140.51 0.02 2
‐170.14 82.15 5.99 1.02 0.14 118.60 0.00 1
‐173.17 74.87 8.54 0.19 0.09 205.80 0.05 1
‐82.68 81.82 1.42 0.09 0.35 239.75 0.82 2
‐12.58 37.66 14.90 1.05 0.11 173.89 0.00 1
23.20 43.90 6.90 0.09 0.16 355.90 0.56 1
48.57 76.77 2.69 0.41 0.52 148.99 0.47 2
74.85 64.62 0.87 0.47 0.45 339.84 0.48 1
142.70 69.20 5.35 0.50 0.07 195.16 0.00 1
‐157.34 61.51 19.00 0.05 0.09 15.12 0.56 2

~63~
References
Arthur, D. (1974), Lunar crater depths from Orbiter IV long-focus photographs, Icarus, 133, 116–133.
Arvidson, R. (1974), Morphologic classification of Martian craters and some implications, Icarus, 271, 264–271.
Barnouin, O. S., M. T. Zuber, D. E. Smith, G. a. Neumann, R. R. Herrick, J. E. Chappelow, S. L. Murchie, and L. M. Prockter (2012), The morphology of craters on Mercury: Results from MESSENGER flybys, Icarus, 219(1), 414–427, doi:10.1016/j.icarus.2012.02.029.
Byrne, P. K., T. R. Watters, S. L. Murchie, C. Klimczak, S. C. Solomon, L. M. Prockter, and A. M. Freed (2012), A tectonic survey of the Caloris basin, Mercury, in Lunar and Planetary Institute Science Conference Abstracts, vol. 43, p. 1722.
Byrne, P. K., C. Klimczak, A. C. Şengör, S. C. Solomon, T. R. Watters, S. A. Hauck, and others (2014), Mercury’s global contraction much greater than earlier estimates, Nat. Geosci., 7(4), 301–307.
Cavanaugh, J., J. Smith, and X. Sun (2007a), The Mercury Laser Altimeter instrument for the MESSENGER mission, in The Messenger Mission …, pp. 451–479, Springer, New York, NY.
Cavanaugh, J. F. et al. (2007b), The Mercury Laser Altimeter instrument for the MESSENGER mission, in The Messenger Mission to Mercury, pp. 451–479, Springer.
Craddock, R. A., and A. D. Howard (2000), Simulated degradation of lunar impact craters and a new method for age dating farside mare deposits, J. Geophys. Res. Planets 1991–2012, 105(E8), 20387–20401.
Croft, S. K. (1985), The scaling of complex craters, J. Geophys. Res. Solid Earth 1978–2012, 90(S02), C828–C842.
Dickson, L., J. W. Head, J. L. Whitten, C. I. Fassett, G. A. Neumann, D. E. Smith, M. T. Zuber, and R. J. Phillips (2012), Topographic rise in the northern smooth plains of Mercury: characteristics from MESSENGER image and altimetry data and candidate modes of origin, in 43rd Lunar and planetary science conference, Abstract, vol. 2249.
Dzurisin, D., J. A. Westphal, and D. J. Johnson (1983), Eruption prediction aided by electronic tiltmeter data at Mount St. Helens, Science, 221(4618), 1381–1383.
Fassett, C. I., and B. J. Thomson (2014), Crater degradation on the lunar maria: Topographic diffusion and the rate of erosion on the Moon, J. Geophys. Res. Planets, 119(10), 2255–2271.
~64~
Fassett, C. I., S. J. Kadish, J. W. Head, S. C. Solomon, and R. G. Strom (2011), The global population of large craters on Mercury and comparison with the Moon, Geophys. Res. Lett., 38(10).
Gold, R. E. et al. (2001), The MESSENGER mission to Mercury: scientific payload, Planet. Space Sci., 49(14), 1467–1479.
Harrell, F. E. (2001), Regression modeling strategies, Springer Science & Business Media.
James, P. B., M. T. Zuber, R. J. Phillips, and S. C. Solomon (2015), Support of long-wavelength topography on Mercury inferred from MESSENGER measurements of gravity and topography, J. Geophys. Res. Planets, 120(2), 287–310.
Klimczak, C., C. M. Ernst, P. K. Byrne, S. C. Solomon, T. R. Watters, S. L. Murchie, F. Preusker, and J. A. Balcerski (2013), Insights into the subsurface structure of the Caloris basin, Mercury, from assessments of mechanical layering and changes in long-wavelength topography, J. Geophys. Res. Planets, 118(10), 2030–2044.
Malin, M. C., and D. Dzurisin (1977), Landform degradation on Mercury, the Moon, and Mars: Evidence from crater depth/diameter relationships, J. Geophys. Res., 82(2), 376–388, doi:10.1029/JB082i002p00376.
Marchi, S., C. R. Chapman, C. I. Fassett, J. W. Head, W. F. Bottke, and R. G. Strom (2013), Global resurfacing of Mercury 4.0-4.1 billion years ago by heavy bombardment and volcanism, Nature, 499(7456), 59–61.
Matias, A., and D. M. Jurdy (2005), Impact craters as indicators of tectonic and volcanic activity in the Beta-Atla-Themis region, Venus, Geol. Soc. Am. Spec. Pap., 388, 825–839.
Mccauley, J. F., J. E. Guest, G. G. Schaber, N. J. Trask, and R. Greeley (1981), Stratigraphy of the Caloris basin, Mercury, Icarus, 47(2), 184–202, doi:10.1016/0019-1035(81)90166-4.
Murchie, S. L. et al. (2008), Geology of the Caloris Basin, Mercury: A View from MESSENGER, Science, 321(5885), 73–76, doi:10.1126/science.1159261.
Neukum, G., J. Oberst, H. Hoffmann, R. Wagner, and B. A. Ivanov (2001), Geologic evolution and cratering history of Mercury, Planet. Space Sci., 49(14), 1507–1521.
Neumann, G., S. C. Solomon, M. T. Zuber, R. J. Phillips, O. S. Barnouin, C. M. Ernst, S. J. Goossens, S. A. Hauck, J. W. Head, and C. L. Johnson (2012), Gravity, topography, and magnetic field of Mercury from MESSENGER, in 39th COSPAR Scientific Assembly, vol. 39, p. 1359.
Oberst, J., F. Preusker, R. J. Phillips, T. R. Watters, J. W. Head, M. T. Zuber, and S. C. Solomon (2010), The morphology of Mercury’s Caloris basin as seen in MESSENGER stereo topographic models, Icarus, 209(1), 230–238.
~65~
Ostrach, L. R., M. S. Robinson, and B. W. Denevi (2012), Distribution of impact melt on Mercury and the Moon, in Lunar and Planetary Institute Science Conference Abstracts, vol. 43, p. 1113.
Pierazzo, E., A. M. Vickery, and H. J. Melosh (1997), A reevaluation of impact melt production, Icarus, 127(2), 408–423.
Pike, R. J. (1985), Some morphologic systematics of complex impact structures, Meteoritics, 20(1), 49–68.
Pike, R. J. (1988), Geomorphology of impact craters on Mercury, Mercury Univ. Ariz. Press, 1, 165–273.
Pohn, H. A., and T. W. Offield (1970), Lunar crater morphology and relative-age determination of lunar geologic units—Part 1. Classification, US Geol Surv. Prof Pap. 700-C, C153–C162.
Roth, L. E., G. S. Downs, R. S. Saunders, and G. Schubert (1981), Radar Altimetry of the Large Martian Craters, in Lunar and Planetary Science Conference, vol. 12, pp. 906–907.
Schmidt, R. M., and K. R. Housen (1987), Some recent advances in the scaling of impact and explosion cratering, Int. J. Impact Eng., 5(1), 543–560.
Schultz, P. H. (1988), Cratering on Mercury-A relook, in Mercury, vol. 1, pp. 274–335, University of Arizona Press.
Smith, D. E. et al. (2010), The equatorial shape and gravity field of Mercury from MESSENGER flybys 1 and 2, Icarus, 209(1), 88–100.
Solomon, S. C. et al. (2001), The MESSENGER mission to Mercury: Scientific objectives and implementation, Planet. Space Sci., 49(14), 1445–1465.
Spudis, P. D., and J. E. Guest (1988), Stratigraphy and geologic history of Mercury, in Mercury, pp. 118–164, University of Arizona Press.
Stoddard, P. R., and D. M. Jurdy (2003), Uplift of Venus geoid highs: timing from coronae and craters, in Lunar and Planetary Science Conference, vol. 34, p. 2129.
Strom, R. G., and G. Neukum (1988), The cratering record on Mercury and the origin of impacting objects, in Mercury, vol. 1, pp. 336–373, University of Arizona Press.
Strom, R. G., N. J. Trask, and J. E. Guest (1975), Tectonism and volcanism on Mercury, J. Geophys. Res., 80(17), 2478–2507.
Strom, R. G., C. R. Chapman, W. J. Merline, S. C. Solomon, and J. W. Head (2008), Mercury cratering record viewed from MESSENGER’s first flyby, Science, 321(5885), 79–81.
Thomas, P. G., P. Masson, and L. Fleitout (1988), in Tectonic history of Mercury, vol. 1.
~66~
Trask, N. J. (1971), Geologic comparison of mare materials in the lunar equatorial belt, including Apollo 11 and Apollo 12 landing sites, US Geol Surv. Prof Pap.
Watters, T. R., M. S. Robinson, and A. C. Cook (1998), Topography of lobate scarps on Mercury: New constraints on the planet’s contraction, Geology, 26(11), 991–994.
Watters, T. R., S. C. Solomon, M. S. Robinson, J. W. Head, S. L. André, H. Ii, S.a, and S. M. Murchie (2009), a. The tectonics of Mercury: The view after MESSENGER’s first flyby, Earth Planet Sci Lett, 285, 283–296.
Wood, C. A., J. W. Head, and M. J. Cintala (1977), Crater degradation on Mercury and the moon-Clues to surface evolution, in Lunar and Planetary Science Conference Proceedings, vol. 8, pp. 3503–3520.
Zuber, M. T. et al. (2012), Topography of the northern hemisphere of Mercury from MESSENGER laser altimetry., Science, 336(6078), 217–20, doi:10.1126/science.1218805.
~67~
3. Evolution of Lunar Basin Subsurface Topography
Abstract
The time-dependent ductile deformation of rock under relatively high temperature and
under high stress, such as that generated by the disruption of the crust-mantle interface due to a
basin forming impact, can be used to probe the thermal history of a hosting body. Many lunar
impact basins correspond to a significant gravity anomaly that can be attributed primarily to an
uplifted mantle beneath the basin. The magnitude of this uplift relative to basin depth, and the
width of the uplift relative to basin diameter, has been interpreted as an indicator of maturity, or
the degree to which a basin has relaxed in response to its thermal environment. Using crustal
thickness models derived from high-resolution orbital gravity and topography we created a
catalog of the characteristics of the central Moho uplift for all known and measurable lunar
basins. Comparing basins of similar sizes and ages we found that there is no substantial
correlation between uplift width and thermal environment. We also developed finite element
viscoelastic models to investigate the temperatures needed to facilitate the flattening of this uplift
and thickening of the crust via viscous flow from the periphery to the center of the basin. The
results of this modeling suggest that significant horizontal deformation can only be initiated and
sustained by a significantly elevated and regional-scale background thermal gradient.
1. Impact Basins as Windows to Lunar Thermal History
Lunar impact basins (complex peak-ring craters with diameters of greater than ~ 120 km
and depths of up to several kilometers) are the result of the displacement of tremendous amounts
of material from the Moon’s surface as a result of high energy collisions. Studies of terrestrial
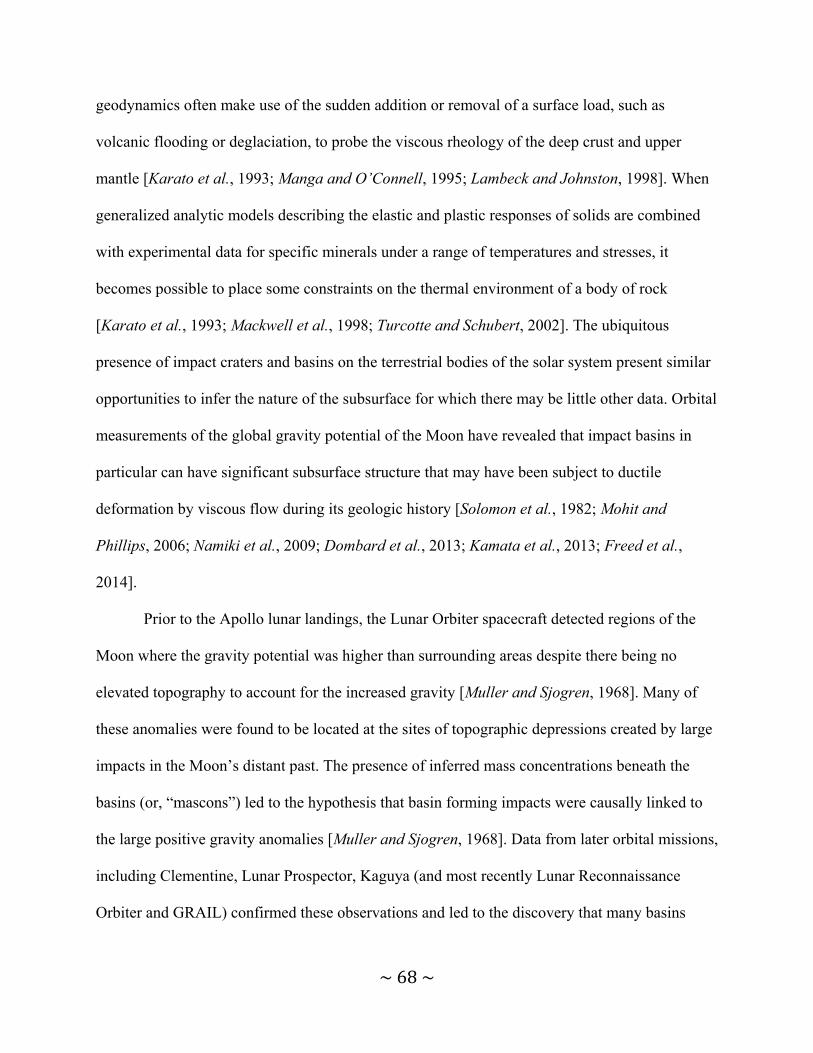
~68~
geodynamics often make use of the sudden addition or removal of a surface load, such as
volcanic flooding or deglaciation, to probe the viscous rheology of the deep crust and upper
mantle [Karato et al., 1993; Manga and O’Connell, 1995; Lambeck and Johnston, 1998]. When
generalized analytic models describing the elastic and plastic responses of solids are combined
with experimental data for specific minerals under a range of temperatures and stresses, it
becomes possible to place some constraints on the thermal environment of a body of rock
[Karato et al., 1993; Mackwell et al., 1998; Turcotte and Schubert, 2002]. The ubiquitous
presence of impact craters and basins on the terrestrial bodies of the solar system present similar
opportunities to infer the nature of the subsurface for which there may be little other data. Orbital
measurements of the global gravity potential of the Moon have revealed that impact basins in
particular can have significant subsurface structure that may have been subject to ductile
deformation by viscous flow during its geologic history [Solomon et al., 1982; Mohit and
Phillips, 2006; Namiki et al., 2009; Dombard et al., 2013; Kamata et al., 2013; Freed et al.,
2014].
Prior to the Apollo lunar landings, the Lunar Orbiter spacecraft detected regions of the
Moon where the gravity potential was higher than surrounding areas despite there being no
elevated topography to account for the increased gravity [Muller and Sjogren, 1968]. Many of
these anomalies were found to be located at the sites of topographic depressions created by large
impacts in the Moon’s distant past. The presence of inferred mass concentrations beneath the
basins (or, “mascons”) led to the hypothesis that basin forming impacts were causally linked to
the large positive gravity anomalies [Muller and Sjogren, 1968]. Data from later orbital missions,
including Clementine, Lunar Prospector, Kaguya (and most recently Lunar Reconnaissance
Orbiter and GRAIL) confirmed these observations and led to the discovery that many basins
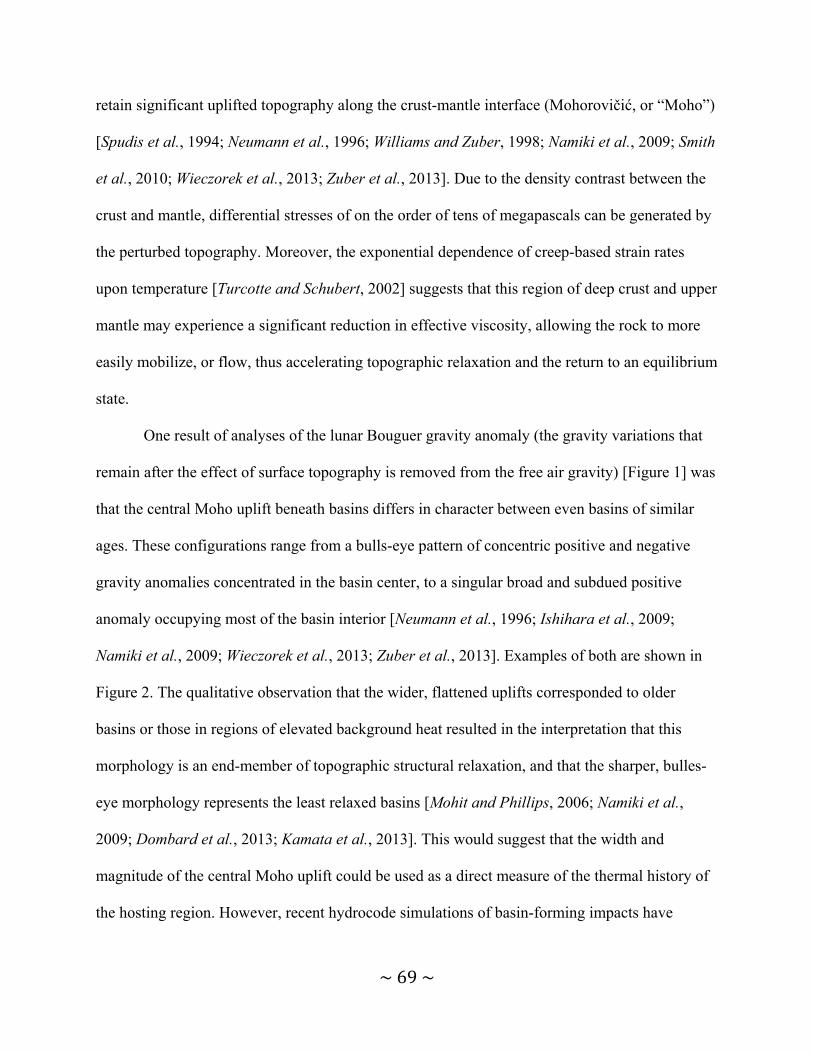
~69~
retain significant uplifted topography along the crust-mantle interface (Mohorovičić, or “Moho”)
[Spudis et al., 1994; Neumann et al., 1996; Williams and Zuber, 1998; Namiki et al., 2009; Smith
et al., 2010; Wieczorek et al., 2013; Zuber et al., 2013]. Due to the density contrast between the
crust and mantle, differential stresses of on the order of tens of megapascals can be generated by
the perturbed topography. Moreover, the exponential dependence of creep-based strain rates
upon temperature [Turcotte and Schubert, 2002] suggests that this region of deep crust and upper
mantle may experience a significant reduction in effective viscosity, allowing the rock to more
easily mobilize, or flow, thus accelerating topographic relaxation and the return to an equilibrium
state.
One result of analyses of the lunar Bouguer gravity anomaly (the gravity variations that
remain after the effect of surface topography is removed from the free air gravity) [Figure 1] was
that the central Moho uplift beneath basins differs in character between even basins of similar
ages. These configurations range from a bulls-eye pattern of concentric positive and negative
gravity anomalies concentrated in the basin center, to a singular broad and subdued positive
anomaly occupying most of the basin interior [Neumann et al., 1996; Ishihara et al., 2009;
Namiki et al., 2009; Wieczorek et al., 2013; Zuber et al., 2013]. Examples of both are shown in
Figure 2. The qualitative observation that the wider, flattened uplifts corresponded to older
basins or those in regions of elevated background heat resulted in the interpretation that this
morphology is an end-member of topographic structural relaxation, and that the sharper, bulles-
eye morphology represents the least relaxed basins [Mohit and Phillips, 2006; Namiki et al.,
2009; Dombard et al., 2013; Kamata et al., 2013]. This would suggest that the width and
magnitude of the central Moho uplift could be used as a direct measure of the thermal history of
the hosting region. However, recent hydrocode simulations of basin-forming impacts have
~70~
revealed significant dependence of basin structure on initial target conditions, including
background temperature and crustal thickness [Miljković et al., 2013]. This leads to the question
of whether lunar basin Moho topography might be at least in part due to effects of the impact
event itself rather than to subsequent long-term deformation. We address this question by first
characterizing the vertical and horizontal magnitudes of central uplifts of all known lunar basins.
We then construct numerical mechanical models of basin relaxation in order to investigate the
conditions that are required to promote broadening of this topography. Since we are interested in
the slow process of lateral displacement of sub-basin material, rather than the relatively fast
isostatic adjustment to residual buoyancy forces [Balcerski et al., 2011; Andrews-Hanna, 2012;
Melosh et al., 2013; Freed et al., 2014], this suite of models assumes an initial isostatic balance
and is applicable to basin evolution occurring ~1E5 years post-impact.
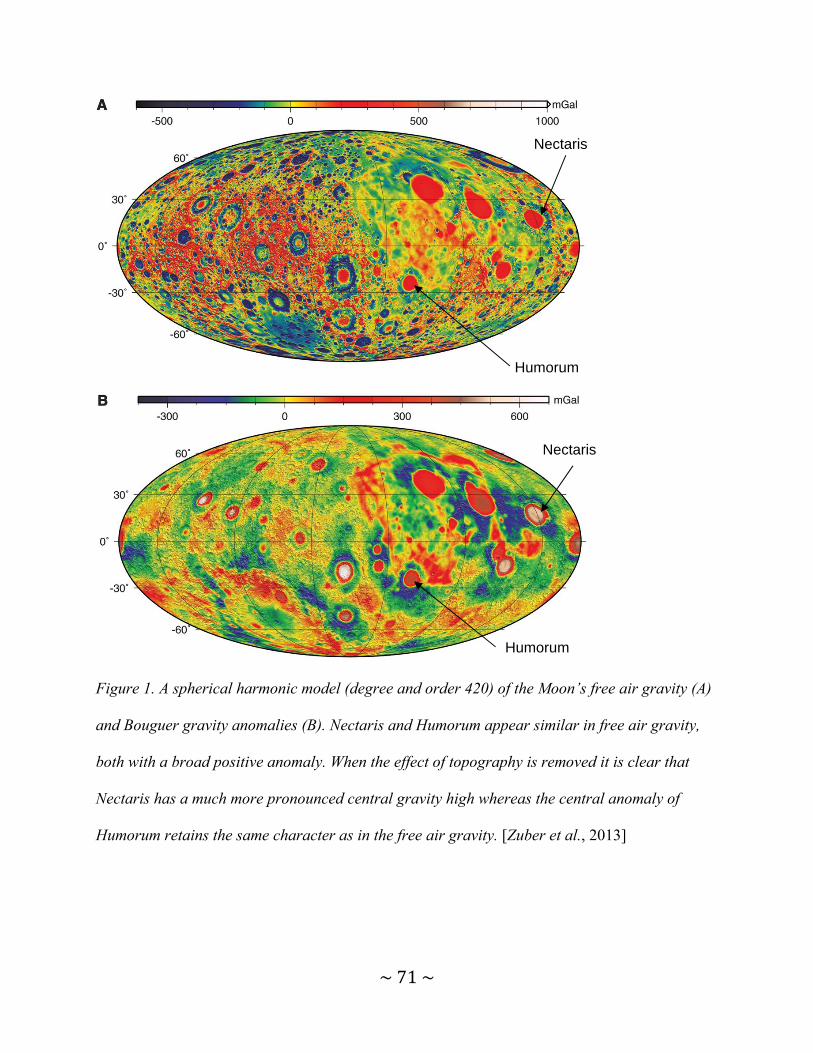
~71~
Figure 1. A spherical harmonic model (degree and order 420) of the Moon’s free air gravity (A)
and Bouguer gravity anomalies (B). Nectaris and Humorum appear similar in free air gravity,
both with a broad positive anomaly. When the effect of topography is removed it is clear that
Nectaris has a much more pronounced central gravity high whereas the central anomaly of
Humorum retains the same character as in the free air gravity. [Zuber et al., 2013]
Nectaris
Humorum
Nectaris
Humorum

~72~
Figure 2. Comparison between the surface and Moho topography of the fresher appearing
Nectarian Humboldtianum basin (81.5° E, 56.8° N) and the degraded pre-Nectarian Nubium
basin (243.4° E, 21.3° S).
2. Measurement Process
We first generated a catalog of profiles of lunar impact basin Moho topographic
configurations, including vertical magnitude and total width of the central uplift. The total width
was determined by the distance from the basin center to the first major positive inflection in the
topography. The vertical magnitude is the elevation difference between this inflection and the
height of the Moho at the basin center [Figure 3]. To obtain these measurements, we used a
single-layer, spherical harmonic crustal thickness model complete through degree and order 310,
which was produced from GRAIL and LOLA mission data [Wieczorek et al., 2013; model
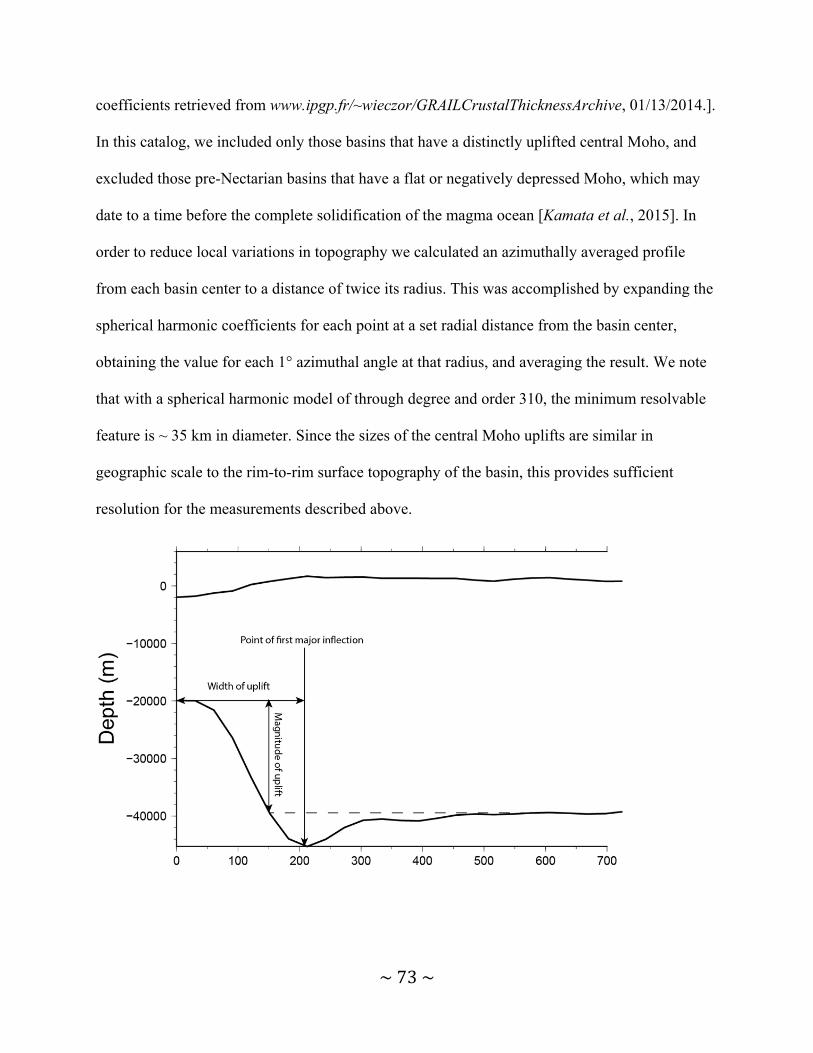
~73~
coefficients retrieved from www.ipgp.fr/~wieczor/GRAILCrustalThicknessArchive, 01/13/2014.].
In this catalog, we included only those basins that have a distinctly uplifted central Moho, and
excluded those pre-Nectarian basins that have a flat or negatively depressed Moho, which may
date to a time before the complete solidification of the magma ocean [Kamata et al., 2015]. In
order to reduce local variations in topography we calculated an azimuthally averaged profile
from each basin center to a distance of twice its radius. This was accomplished by expanding the
spherical harmonic coefficients for each point at a set radial distance from the basin center,
obtaining the value for each 1° azimuthal angle at that radius, and averaging the result. We note
that with a spherical harmonic model of through degree and order 310, the minimum resolvable
feature is ~ 35 km in diameter. Since the sizes of the central Moho uplifts are similar in
geographic scale to the rim-to-rim surface topography of the basin, this provides sufficient
resolution for the measurements described above.
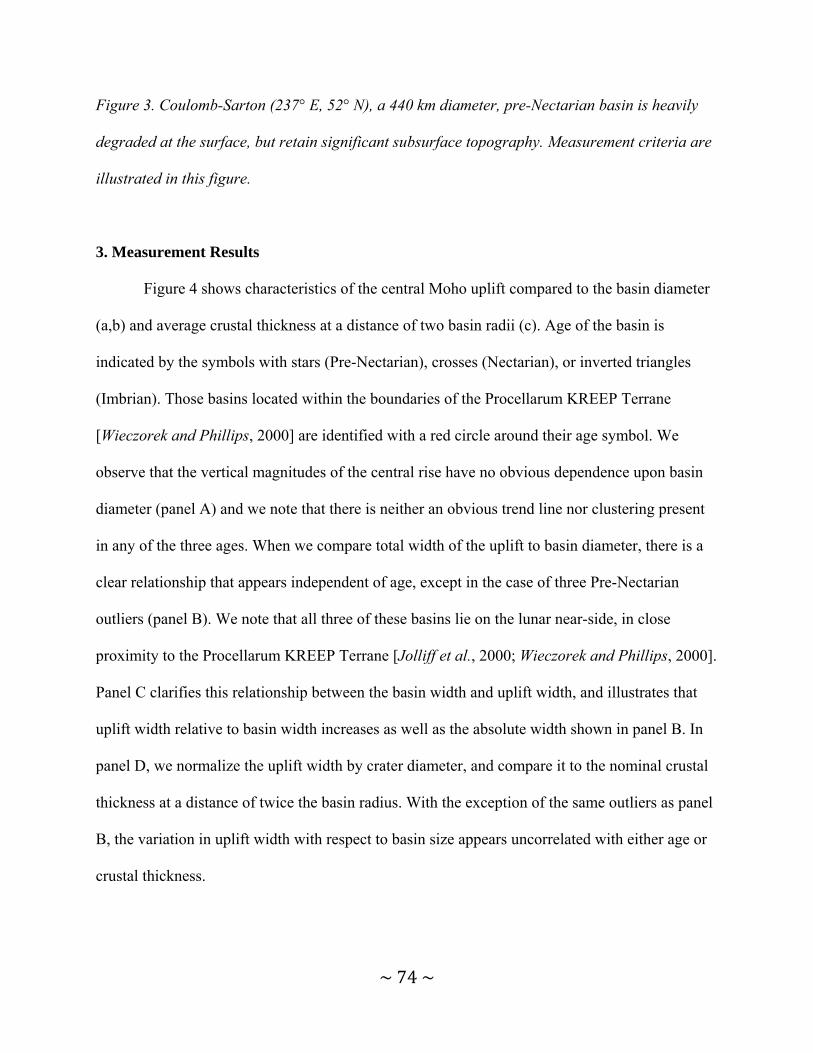
~74~
Figure 3. Coulomb-Sarton (237° E, 52° N), a 440 km diameter, pre-Nectarian basin is heavily
degraded at the surface, but retain significant subsurface topography. Measurement criteria are
illustrated in this figure.
3. Measurement Results
Figure 4 shows characteristics of the central Moho uplift compared to the basin diameter
(a,b) and average crustal thickness at a distance of two basin radii (c). Age of the basin is
indicated by the symbols with stars (Pre-Nectarian), crosses (Nectarian), or inverted triangles
(Imbrian). Those basins located within the boundaries of the Procellarum KREEP Terrane
[Wieczorek and Phillips, 2000] are identified with a red circle around their age symbol. We
observe that the vertical magnitudes of the central rise have no obvious dependence upon basin
diameter (panel A) and we note that there is neither an obvious trend line nor clustering present
in any of the three ages. When we compare total width of the uplift to basin diameter, there is a
clear relationship that appears independent of age, except in the case of three Pre-Nectarian
outliers (panel B). We note that all three of these basins lie on the lunar near-side, in close
proximity to the Procellarum KREEP Terrane [Jolliff et al., 2000; Wieczorek and Phillips, 2000].
Panel C clarifies this relationship between the basin width and uplift width, and illustrates that
uplift width relative to basin width increases as well as the absolute width shown in panel B. In
panel D, we normalize the uplift width by crater diameter, and compare it to the nominal crustal
thickness at a distance of twice the basin radius. With the exception of the same outliers as panel
B, the variation in uplift width with respect to basin size appears uncorrelated with either age or
crustal thickness.
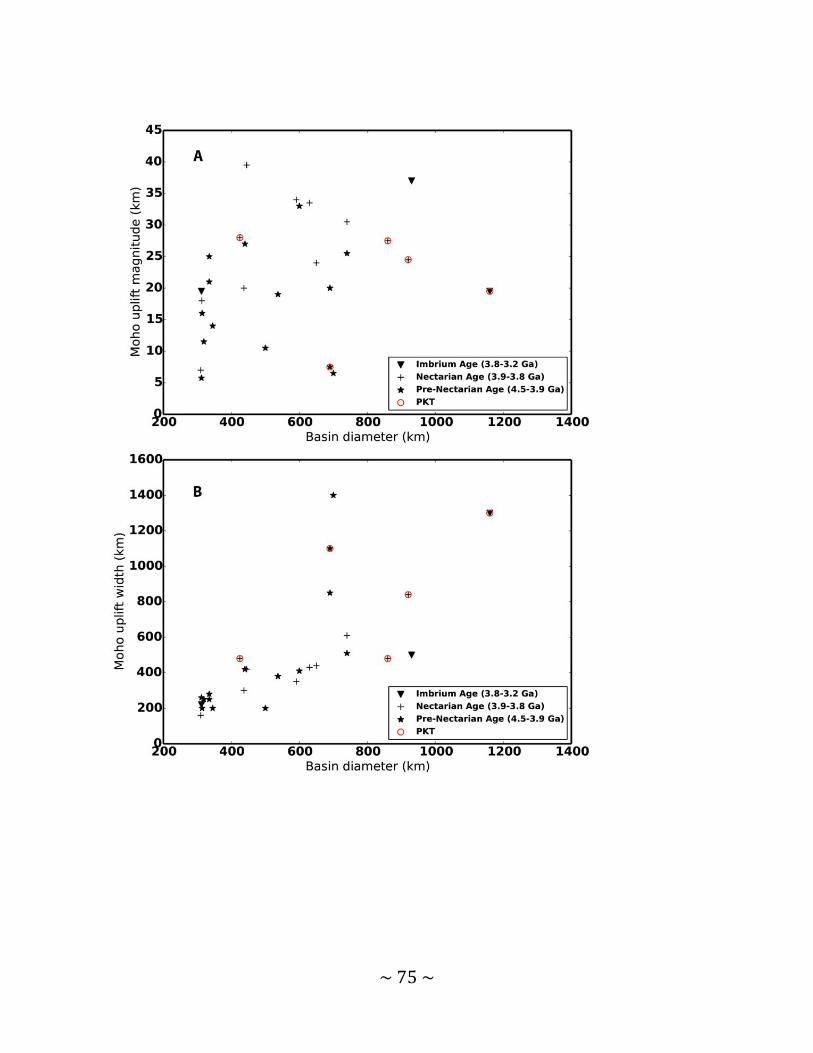
~75~
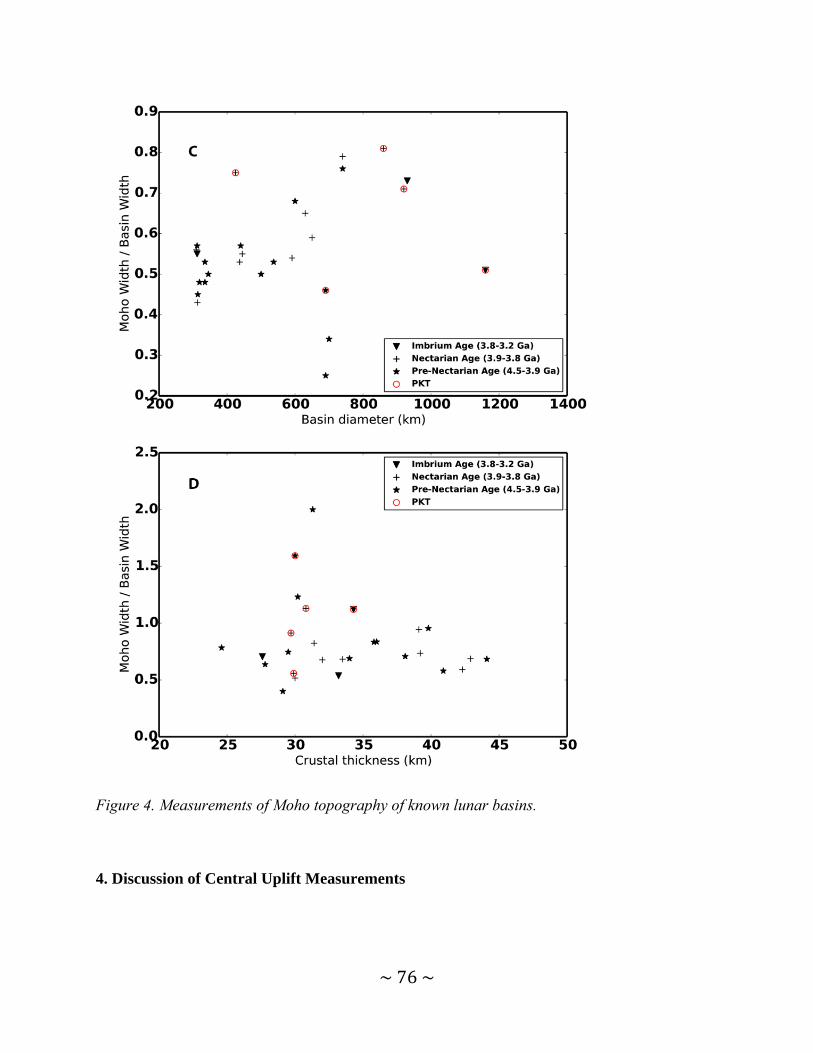
~76~
Figure 4. Measurements of Moho topography of known lunar basins.
4. Discussion of Central Uplift Measurements
~77~
The scatter that is present in Figure 4a suggests that basins of similar ages do not
converge toward the same structural configuration. Since the strain rate of a material deforming
via viscous creep is exponentially dependent upon temperature, the effect of geologic age may be
masked by the more pronounced influence of different regional thermal environments. However,
given the lunar dichotomy of crustal thickness and radiogenic heat production, we might expect
that basin relaxation should generally evolve toward two major end-state modes, rather than a
continuous spectrum of states. That is, regions of elevated heat production on the Moon (due to
the surface expression of KREEP-like material and their inferred shallow interior sources) have
well defined margins, so basins should either be located in a “cool” or “hot” environment,
resulting in either very limited or very advanced topographic relaxation. This separation of states
is not observed in the measurements of either the vertical magnitude or width of the central
Moho uplift.
Conversely, if progressive topographic relaxation is the dominant cause of the different
classes of basin morphology, we would expect basins of similar age, size, and thermal
environment to have the same overall character. Figure 5 illustrates such a comparison, between
Korolev and Hertzsprung. Both basins are approximately 500 km in diameter, Nectarian to Pre-
Nectarian in age [Fassett et al., 2012], and located in the Feldspathic Highland Terrane, a region
of relatively thick crust and cool thermal environment [Jolliff et al., 2000]. While the width of
uplift is approximately the same for each, the magnitude of the uplift (and thus the thickness of
crust beneath the basin center) is substantially different. If this is the result of topographic
evolution, it would require significant volumes of crustal material to be transported toward the
center of the basin, thickening the crust above the central uplift by nearly two kilometers. Prior
numerical modeling of the viscoelastic relaxation of basin-like structures suggests that this
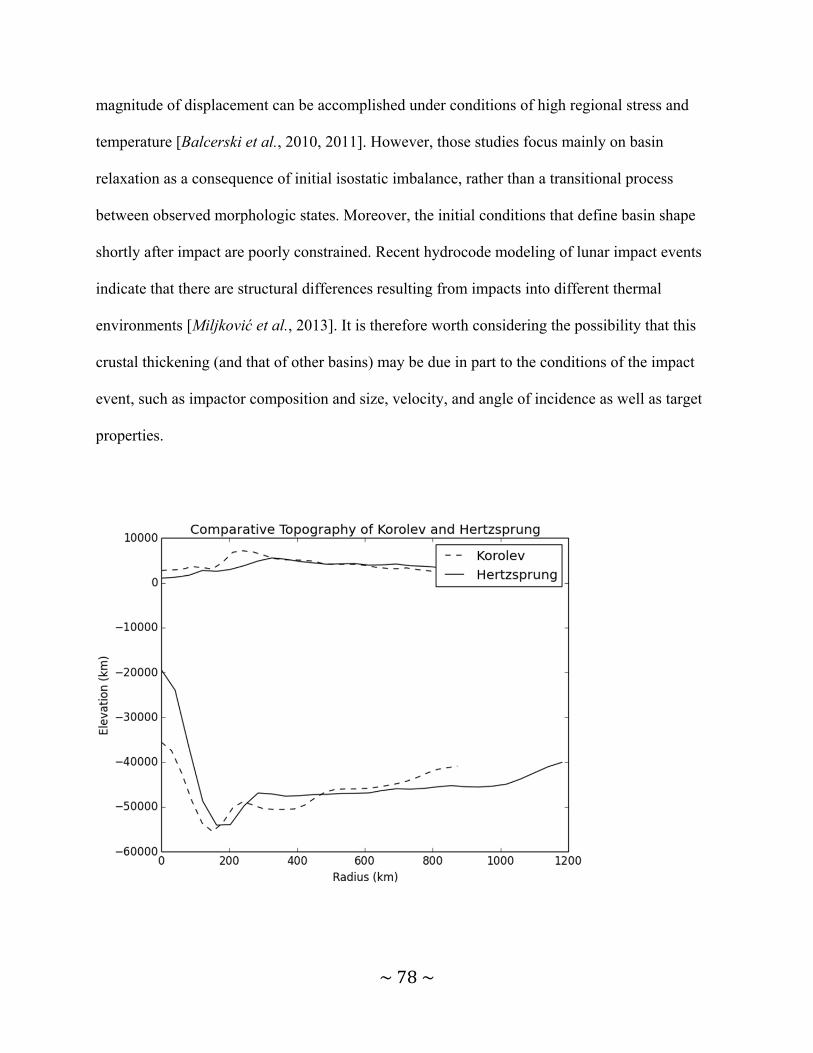
~78~
magnitude of displacement can be accomplished under conditions of high regional stress and
temperature [Balcerski et al., 2010, 2011]. However, those studies focus mainly on basin
relaxation as a consequence of initial isostatic imbalance, rather than a transitional process
between observed morphologic states. Moreover, the initial conditions that define basin shape
shortly after impact are poorly constrained. Recent hydrocode modeling of lunar impact events
indicate that there are structural differences resulting from impacts into different thermal
environments [Miljković et al., 2013]. It is therefore worth considering the possibility that this
crustal thickening (and that of other basins) may be due in part to the conditions of the impact
event, such as impactor composition and size, velocity, and angle of incidence as well as target
properties.
~79~
Figure 5. GRAIL/LOLA derived basin topography for Korolev (157.4° W, 4.0° S) and
Hertzsprung (128.7° W, 1.4° N). From crustal thickness model 1 of [Wieczorek et al., 2013].
If the mascon Moho uplift is indeed the result of both varying impact and relaxation
processes, it becomes necessary to deconvolve the effects of each in order to recover information
on initial thermal and mechanical conditions. Experience with numerical modeling of relaxation
processes suggests that models can provide bounds on the conditions required to relax and/or
remove the basin subsurface topography. Thus, a combination of evolutionary and genetic
modeling approaches may result in a more accurate description of the lunar environment at the
time of basin emplacement. We focus here on developing basin relaxation models to investigate
the limits of long-term topographic evolution.
5. Modeling of Basin Structural Evolution
The goal of developing basin relaxation models is to determine the conditions under
which a morphologic transition can occur between the more pristine “bullseye” configuration,
and the broad, shallow shape that has been interpreted as characteristic of more thermally-
degraded basins. Specifically, crustal material must be transported inward toward the basin
center, resulting in depression and widening of the central Moho rise. The result is that the uplift
occupies a larger fraction of the diameter of the surface cavity. For basins larger than ~800 km in
diameter, this means that the lateral displacement must be on the order of > 10 km. In addition,
the downwarped Moho that corresponds with the annulus of thickened crust near the basin
periphery must be at least partially eliminated by the same process of topographic relaxation.
~80~
This feature is of considerably shorter wavelength than the central uplift and would thus require
a relatively lower viscosity in order to be removed.
We make use of the commercial finite element code, MSC Marc, to develop a
viscoelastic model with creep flow laws appropriate for common crust and mantle materials
[Karato et al., 1993; Mackwell et al., 1998; Rybacki and Dresen, 2000]. Since we are concerned
mainly with the bulk deformation of material surrounding the Moho, we opt to use the stress-
dependent, non-linear rheologies for dislocation creep, which is appropriate for high temperature,
high pressure environments [Karato et al., 1993; Mackwell et al., 1998; Turcotte and Schubert,
2002]. The flow law for dislocation-dominated creep, takes the form:
where is strain rate, A and n are experimentally determined, σ is the von Mises stress, Ea is
activation energy, R is the ideal gas constant, and T is temperature [Turcotte and Schubert,
2002]. Thus, the stress field, strain rate, and resulting viscosity structure of the models are
explicitly determined by the solver for each simulated time step, and evolve naturally as the
solution progresses. This allows for investigation of the relaxation process simply as a
consequence of thermal structure and initial topographic configuration, rather than being driven
by a priori selection of stresses and strain rates. Although there is evidence of hydrated minerals
in the lunar interior [Saal et al., 2008], the volatile content of the crust and mantle is not yet well
constrained, so we choose to implement dry rheologies for both.
Following previous work using this finite element package for modeling of large-scale
structural deformation on the Moon, Venus, and icy satellites [Dombard and Gillis, 2001; Nunes,
2004; Dombard and McKinnon, 2006], we construct a 2-D, axisymmetric structured mesh
composed of quadrilateral elements with bilinear interpolation. A singular basin is centered on
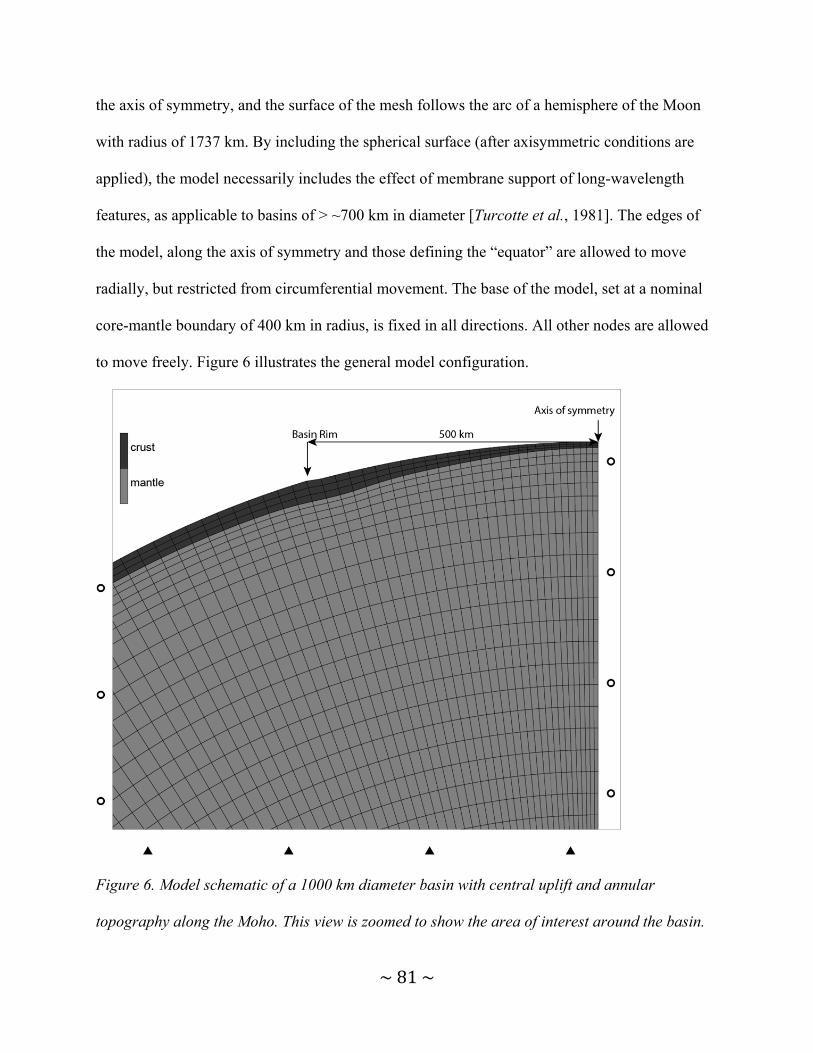
~81~
the axis of symmetry, and the surface of the mesh follows the arc of a hemisphere of the Moon
with radius of 1737 km. By including the spherical surface (after axisymmetric conditions are
applied), the model necessarily includes the effect of membrane support of long-wavelength
features, as applicable to basins of > ~700 km in diameter [Turcotte et al., 1981]. The edges of
the model, along the axis of symmetry and those defining the “equator” are allowed to move
radially, but restricted from circumferential movement. The base of the model, set at a nominal
core-mantle boundary of 400 km in radius, is fixed in all directions. All other nodes are allowed
to move freely. Figure 6 illustrates the general model configuration.
Figure 6. Model schematic of a 1000 km diameter basin with central uplift and annular
topography along the Moho. This view is zoomed to show the area of interest around the basin.
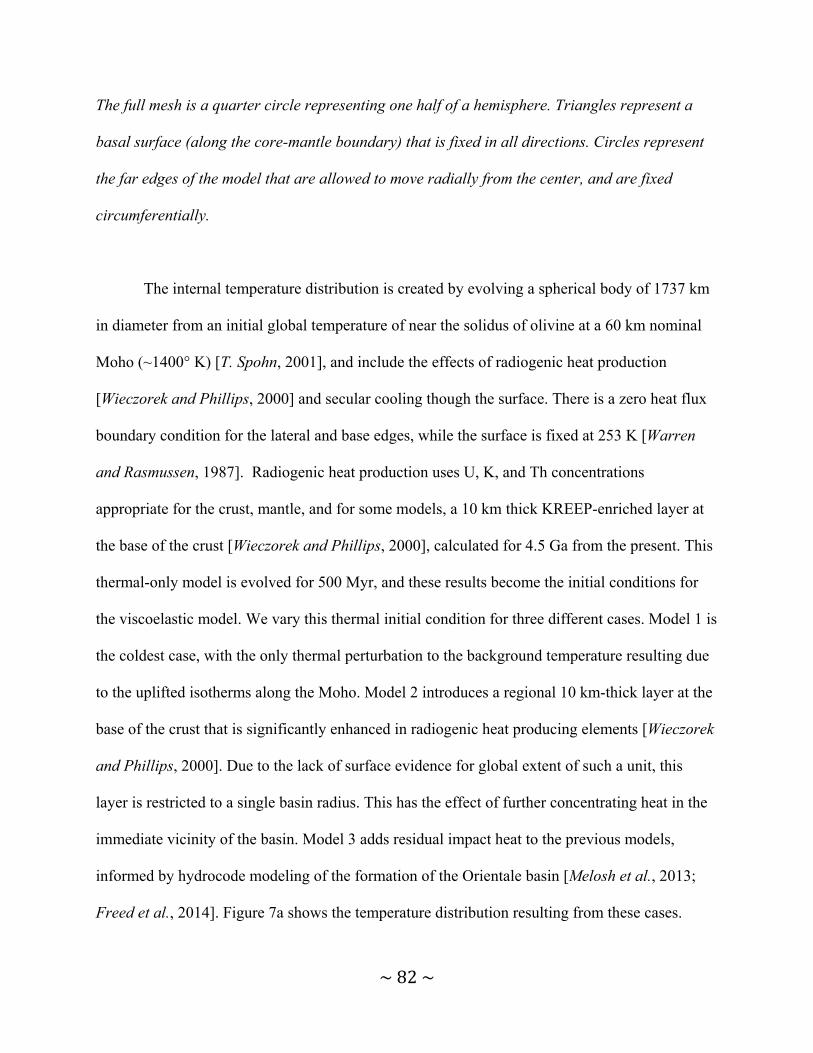
~82~
The full mesh is a quarter circle representing one half of a hemisphere. Triangles represent a
basal surface (along the core-mantle boundary) that is fixed in all directions. Circles represent
the far edges of the model that are allowed to move radially from the center, and are fixed
circumferentially.
The internal temperature distribution is created by evolving a spherical body of 1737 km
in diameter from an initial global temperature of near the solidus of olivine at a 60 km nominal
Moho (~1400° K) [T. Spohn, 2001], and include the effects of radiogenic heat production
[Wieczorek and Phillips, 2000] and secular cooling though the surface. There is a zero heat flux
boundary condition for the lateral and base edges, while the surface is fixed at 253 K [Warren
and Rasmussen, 1987]. Radiogenic heat production uses U, K, and Th concentrations
appropriate for the crust, mantle, and for some models, a 10 km thick KREEP-enriched layer at
the base of the crust [Wieczorek and Phillips, 2000], calculated for 4.5 Ga from the present. This
thermal-only model is evolved for 500 Myr, and these results become the initial conditions for
the viscoelastic model. We vary this thermal initial condition for three different cases. Model 1 is
the coldest case, with the only thermal perturbation to the background temperature resulting due
to the uplifted isotherms along the Moho. Model 2 introduces a regional 10 km-thick layer at the
base of the crust that is significantly enhanced in radiogenic heat producing elements [Wieczorek
and Phillips, 2000]. Due to the lack of surface evidence for global extent of such a unit, this
layer is restricted to a single basin radius. This has the effect of further concentrating heat in the
immediate vicinity of the basin. Model 3 adds residual impact heat to the previous models,
informed by hydrocode modeling of the formation of the Orientale basin [Melosh et al., 2013;
Freed et al., 2014]. Figure 7a shows the temperature distribution resulting from these cases.
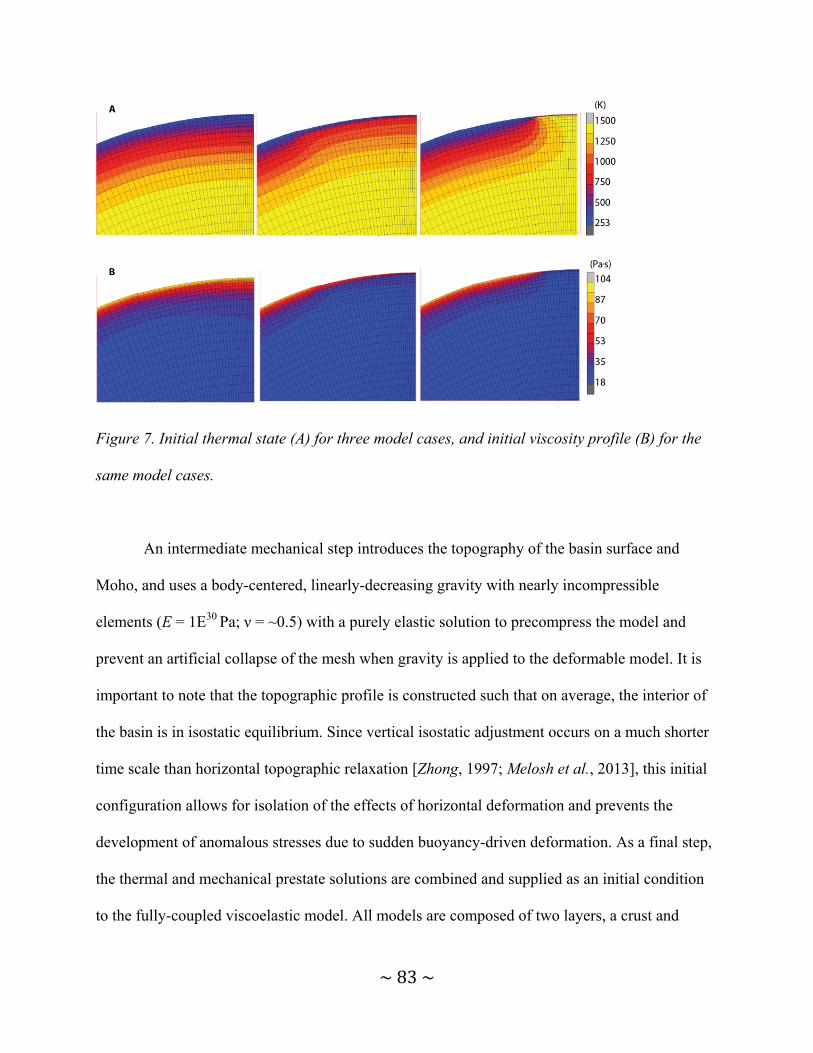
~83~
Figure 7. Initial thermal state (A) for three model cases, and initial viscosity profile (B) for the
same model cases.
An intermediate mechanical step introduces the topography of the basin surface and
Moho, and uses a body-centered, linearly-decreasing gravity with nearly incompressible
elements (E = 1E30 Pa; ν = ~0.5) with a purely elastic solution to precompress the model and
prevent an artificial collapse of the mesh when gravity is applied to the deformable model. It is
important to note that the topographic profile is constructed such that on average, the interior of
the basin is in isostatic equilibrium. Since vertical isostatic adjustment occurs on a much shorter
time scale than horizontal topographic relaxation [Zhong, 1997; Melosh et al., 2013], this initial
configuration allows for isolation of the effects of horizontal deformation and prevents the
development of anomalous stresses due to sudden buoyancy-driven deformation. As a final step,
the thermal and mechanical prestate solutions are combined and supplied as an initial condition
to the fully-coupled viscoelastic model. All models are composed of two layers, a crust and

~84~
mantle, where olivine is used as the mantle material [Karato et al., 1993] and for the crust, dry
Columbia diabase [Mackwell et al., 1998] or dry anorthosite [Rybacki and Dresen, 2000]
representative of the basaltic near side or the Feldspathic Highland Terrane of the lunar far side,
respectively. Table 1 summarizes the relevant material parameters.
Table 1. Model material parameters
Parameter Crust Mantle
Density1,2 2560 kg/m3 3220 kg/m3
Thermal conductivity3 2 W m-1 K-1 3 W m-1 K-1
Specific heat3 1200 J kg-1 K-1 1200 J kg-1 K-1
[1Wieczorek and Phillips, 2000; 3Wieczorek et al., 2013; 2Zuber et al., 2013]
Model topography of the surface and Moho are configured to be appropriate for an
Imbrium-size basin, in order to maximize stresses due to density contrasts while minimizing
lithospheric elastic support. The interior shape of the basin uses a 4th order polynomial to
emulate a steep interior wall and broad flat floor. The exterior rim and ejecta apron are defined
by a more gradual 3rd order polynomial, from the rim crest to a distance of 50% basin radius
where it meets the nominal outer spherical surface. Since the focus is on deformation process and
resulting topographic character, we generalize the Moho topography into a curve described by
two super-imposed Gaussians: one for the central uplift and another smaller curve, inverted and
offset from the basin center to create an annulus of thickened crust. The relevant topographic
parameters are listed in Table 2. Due to the curvature of the body and the use of a structured
mesh, elements aspect ratios are biased laterally towards the axis of symmetry and radially
towards the Moho, in order to provide more resolution and minimize distortion. In the nominal
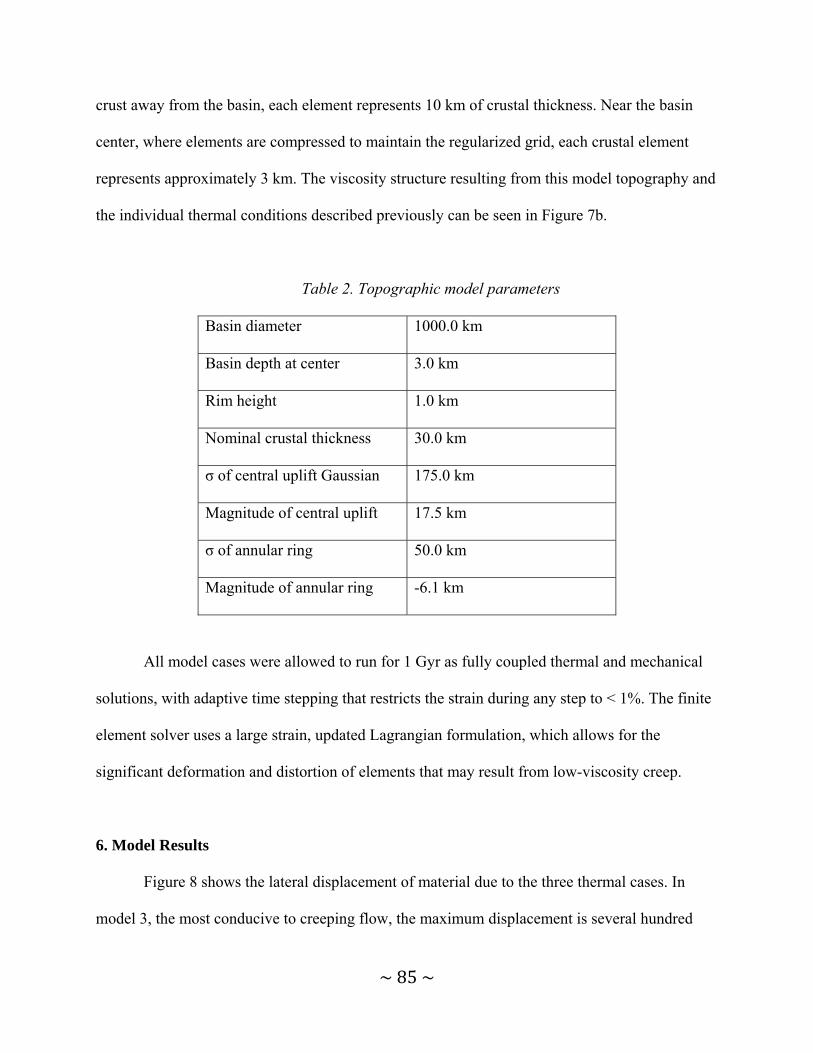
~85~
crust away from the basin, each element represents 10 km of crustal thickness. Near the basin
center, where elements are compressed to maintain the regularized grid, each crustal element
represents approximately 3 km. The viscosity structure resulting from this model topography and
the individual thermal conditions described previously can be seen in Figure 7b.
Table 2. Topographic model parameters
Basin diameter 1000.0 km
Basin depth at center 3.0 km
Rim height 1.0 km
Nominal crustal thickness 30.0 km
σ of central uplift Gaussian 175.0 km
Magnitude of central uplift 17.5 km
σ of annular ring 50.0 km
Magnitude of annular ring -6.1 km
All model cases were allowed to run for 1 Gyr as fully coupled thermal and mechanical
solutions, with adaptive time stepping that restricts the strain during any step to < 1%. The finite
element solver uses a large strain, updated Lagrangian formulation, which allows for the
significant deformation and distortion of elements that may result from low-viscosity creep.
6. Model Results
Figure 8 shows the lateral displacement of material due to the three thermal cases. In
model 3, the most conducive to creeping flow, the maximum displacement is several hundred
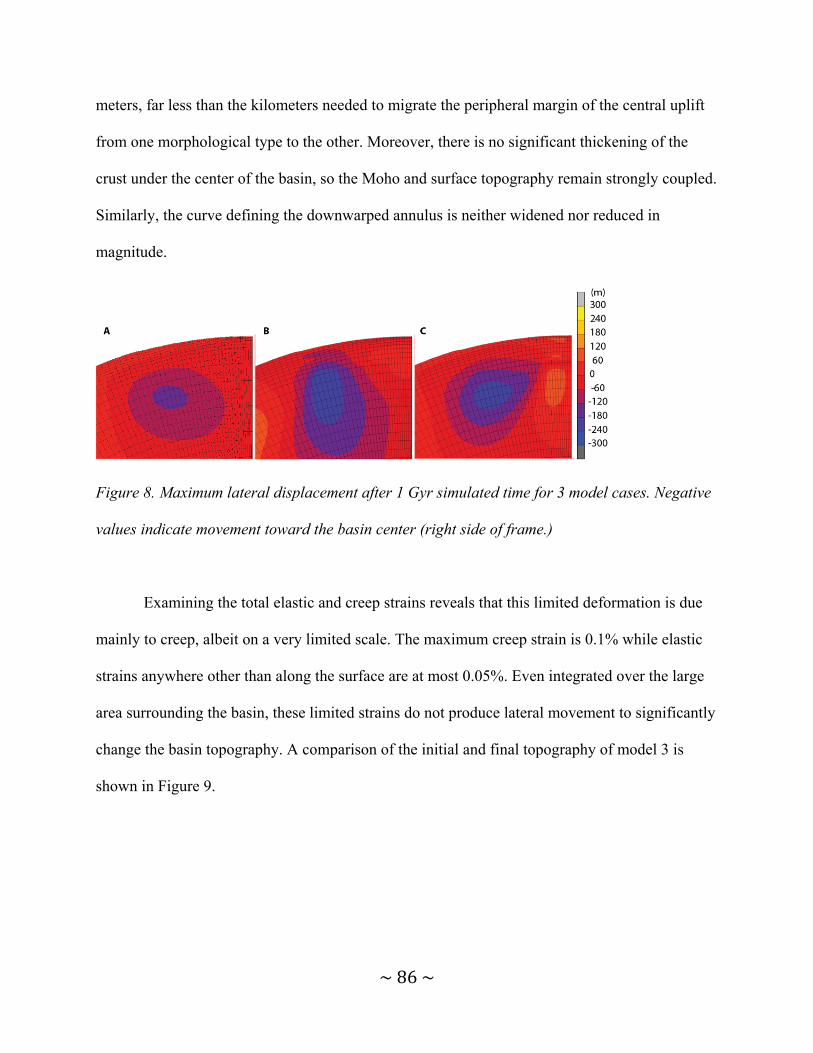
~86~
meters, far less than the kilometers needed to migrate the peripheral margin of the central uplift
from one morphological type to the other. Moreover, there is no significant thickening of the
crust under the center of the basin, so the Moho and surface topography remain strongly coupled.
Similarly, the curve defining the downwarped annulus is neither widened nor reduced in
magnitude.
Figure 8. Maximum lateral displacement after 1 Gyr simulated time for 3 model cases. Negative
values indicate movement toward the basin center (right side of frame.)
Examining the total elastic and creep strains reveals that this limited deformation is due
mainly to creep, albeit on a very limited scale. The maximum creep strain is 0.1% while elastic
strains anywhere other than along the surface are at most 0.05%. Even integrated over the large
area surrounding the basin, these limited strains do not produce lateral movement to significantly
change the basin topography. A comparison of the initial and final topography of model 3 is
shown in Figure 9.
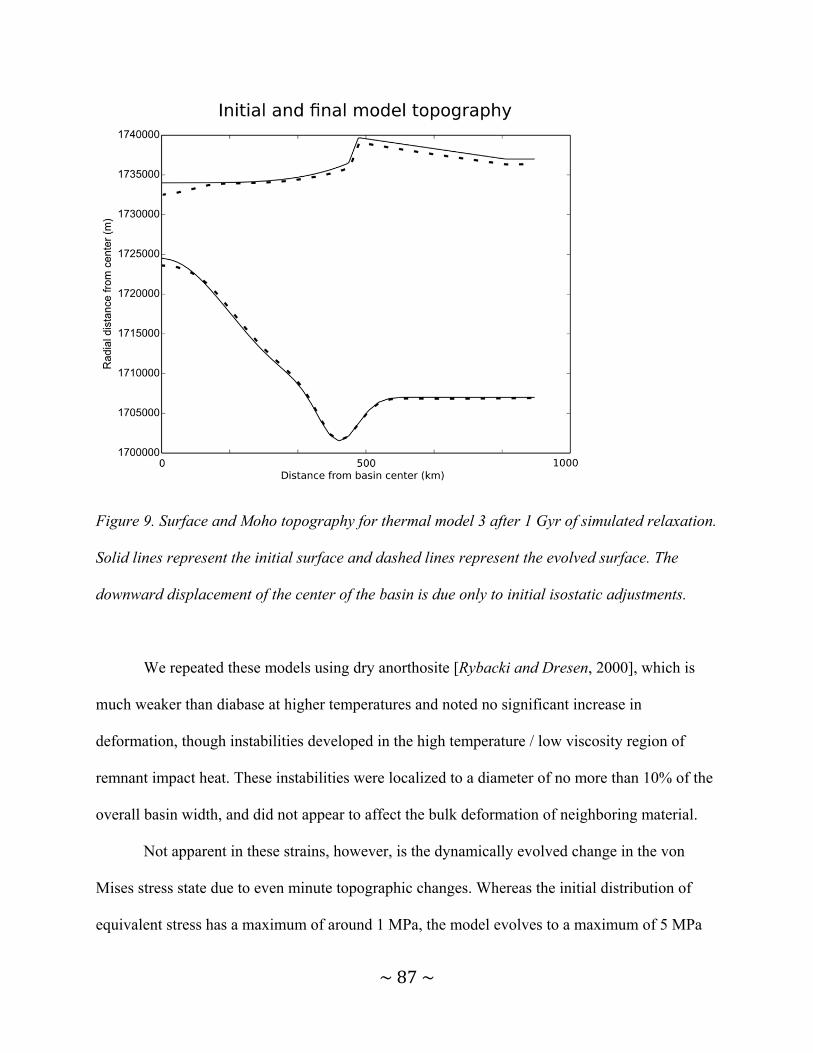
~87~
Figure 9. Surface and Moho topography for thermal model 3 after 1 Gyr of simulated relaxation.
Solid lines represent the initial surface and dashed lines represent the evolved surface. The
downward displacement of the center of the basin is due only to initial isostatic adjustments.
We repeated these models using dry anorthosite [Rybacki and Dresen, 2000], which is
much weaker than diabase at higher temperatures and noted no significant increase in
deformation, though instabilities developed in the high temperature / low viscosity region of
remnant impact heat. These instabilities were localized to a diameter of no more than 10% of the
overall basin width, and did not appear to affect the bulk deformation of neighboring material.
Not apparent in these strains, however, is the dynamically evolved change in the von
Mises stress state due to even minute topographic changes. Whereas the initial distribution of
equivalent stress has a maximum of around 1 MPa, the model evolves to a maximum of 5 MPa
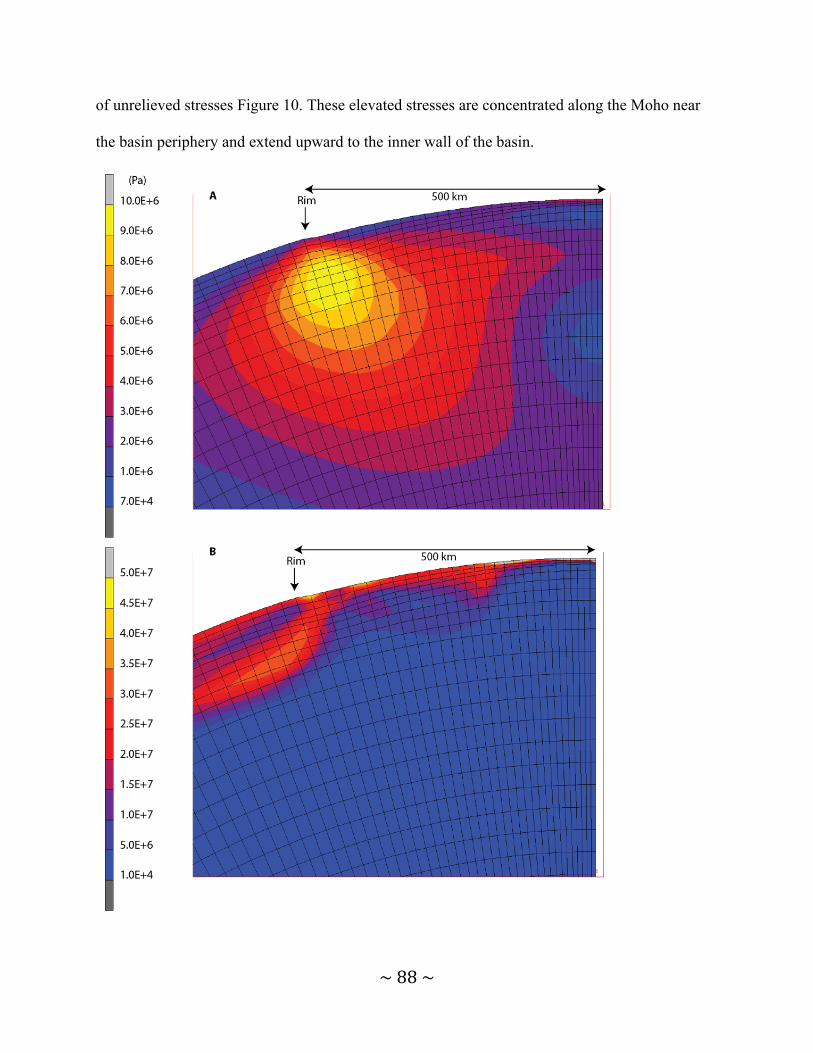
~88~
of unrelieved stresses Figure 10. These elevated stresses are concentrated along the Moho near
the basin periphery and extend upward to the inner wall of the basin.
~89~
Figure 10. Equivalent of stress at beginning of model (top), and after 1 Gyr of simulated
deformation (bottom). Model 3 thermal conditions applied.
7. Discussion of Model Results
The profiles of Figure 7b indicate that the lowest viscosity intersects the minimum cutoff
(1E18 Pa·s) well below the 30 km depth of the nominal crust. This suggests that the limited creep
displacement of the models is restricted due to the choice of thermal conditions rather than the
imposed strain rate limit. That the enhanced heat flux of the basal KREEP layer and remnant
impact heat are not sufficient to promote viscous flow is noteworthy in that they have been
suggested as mechanisms by which the nearside mascons of the Procellarum KREEP Terrane
may have experienced substantially more relaxation than their non-PKT counterparts [Wieczorek
and Phillips, 2000]. This is most certainly due to the geographic limit of the added heat, which is
less than the diameter of the basin, and the thermal diffusion of the impact heat, which is
indistinguishable from the background gradient in less than 100 Ma post-impact. Thus, while
these two factors temporarily and substantially lower the viscosity locally, it is not enough to
overcome the resistance of the strength of surrounding material. There are several factors that
may additionally raise the thermal gradient and thus lower the viscosity. Although we chose a 30
km nominal thickness for the crust, emulating the thin crust that hosts the degraded nearside
basins, implementing a thicker crust more appropriate for the lunar farside would allow for the
background thermal gradient to more significantly heat the lower crust. Moreover, the elevated
radiogenic heat production of crustal versus mantle material increases this gradient,
compounding the effect. The background gradient could also be increased with the presence of a
KREEP enriched layer at the base of the crust that is thicker than the 10 km suggested by
~90~
Wieczorek and Phillips (2000). Last, if the heat released by a crystallizing magma ocean is
preserved well into the Nectarian, it could contribute significantly to topographic relaxation of
these early basins [Kamata et al., 2015].
If lateral spreading of the central uplift requires exceptional thermal conditions, the
process of thickening the crust below the basin center demands even more heat. Since the crust
near the basin center is thinner than that of the thickened periphery, the viscous flow channel is
substantially narrowed. The compounding effect of less radiogenic heat production (due to less
crustal material) means that inward flow that may be permitted near the exterior of the basin,
effectively runs into a stiff barrier as it approaches the center. It is therefore unlikely that
significant thickening occurred in all but exceptional circumstances. We note however, that the
presence of volatiles in the lunar interior is still not yet well constrained [Saal et al., 2008] and
the presence of hydrated minerals can significantly lower viscosities without requiring higher
temperatures [Karato et al., 1993].
8. Summary and Conclusions
Measurements of the topography of the crust-mantle interface underlying lunar impact
basins suggests that differences between proposed morphologic classes do not represent an
evolutionary continuum of topographic relaxation as proposed by previous workers. Width and
height of the uplifts correlates only with basin size and to a lesser extent, age. Moreover, there is
no substantial correlation between these features and crustal thickness of the hosting region, a
proxy for the thermal dichotomy of the lunar hemispheres.
Our numerical viscoelastic models indicate that the process of creep-driven lateral
spreading of the central Moho uplift beneath the large lunar basins is insufficient to explain the
~91~
observed differences in topography between basins of different ages and/or thermal
environments. This provides further evidence that the observed Moho topography of the basins
does not, except perhaps for a few exceptional circumstances, evolve from one style or class to
the other. The short wavelength thickened crustal annulus, and the thickness of the crust below
the basin center, are features that are especially resistant to topography relaxation and they are
unlikely to have changed substantively from their initial configuration.
The differences in uplift width and magnitude observed in almost all basins younger than
pre-Nectarian, are therefore likely to be due almost exclusively to specific impact-related
circumstances. Recent hydrocode models indicate that conditions such as crustal thickness and
porosity, and background thermal gradient, of the target body significantly influence the
morphology of the resulting crater [Melosh et al., 2013; Miljković et al., 2013; Potter et al.,
2013]. Although the effect of target body environment remains poorly constrained, it is evident
that it results in a much higher degree of variability between basins than structural evolution. Our
observations provide some constraints to these models, since they indicate that in general, the
currently-observed morphology is very similar to that shortly after the basin was emplaced.
Finally, we observe significant changes in the stress state throughout the basin that occur
with even small topographic changes, resulting in an increase in von Mises stresses of a factor of
5 or more. The understanding of dynamic stresses of large basins is limited at best, and has been
historically hampered by the simplifying assumptions of models implementing fixed stresses,
strains, and Newtonian rheologies. Since the strain rate of a non-Newtonian dislocation creep
flow is dependent upon stress as well as temperature, increased stresses can promote viscous
flow at somewhat lower temperatures than otherwise expected. In cooler environments, these
stresses may lead not to ductile failure, but rather to brittle fracture, promoting the development
~92~
of deep faults, especially near the basin periphery. While our models were initialized with
topography very near to isostatically balanced, many lunar basins exist in both super and
subisostatic states. Analytic and numerical models show that these states can be evolved over
time [Zhong, 1997; Balcerski et al., 2010, 2011; Andrews-Hanna, 2012; Melosh et al., 2013;
Freed et al., 2014] and thus result in dynamic stress states that should exceed those in our
models. Further development of our models and process can resolve these stresses, and use of an
elastoviscoplastic solver can provide a testable prediction regarding the development and general
location of faulting behavior.
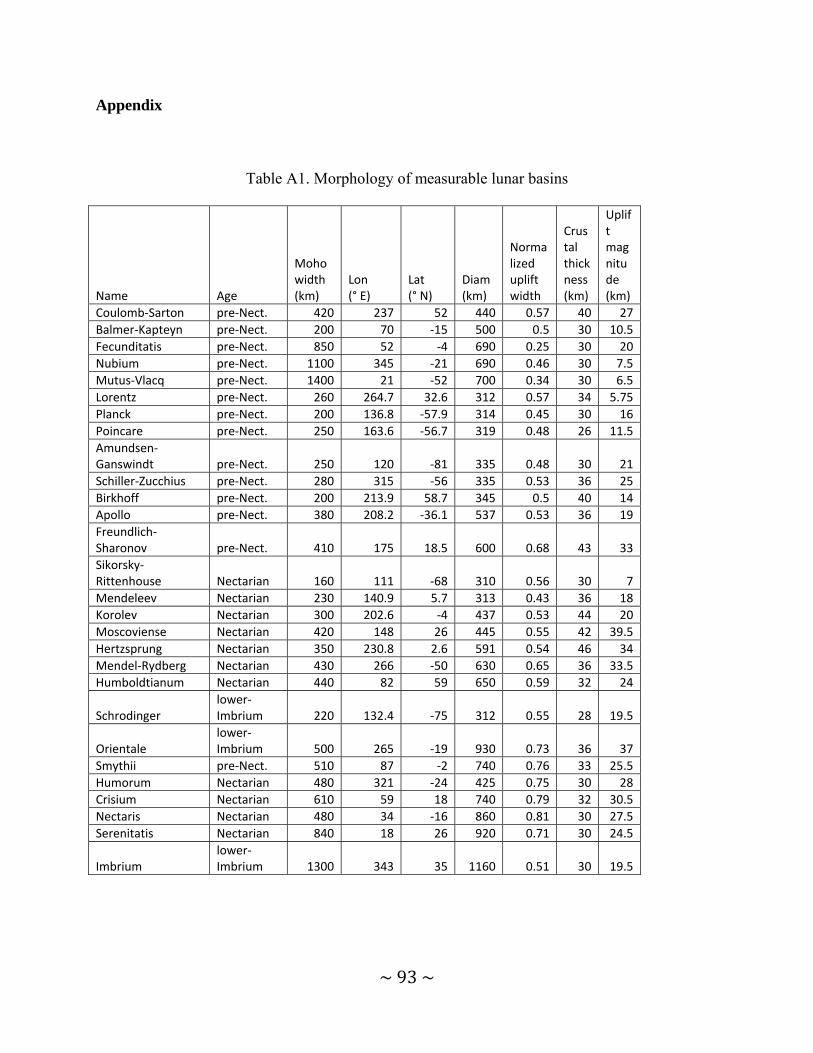
~93~
Appendix
Table A1. Morphology of measurable lunar basins
Name Age
Moho width (km)
Lon (° E)
Lat (° N)
Diam (km)
Normalized uplift width
Crustal thickness (km)
Uplift magnitude (km)
Coulomb‐Sarton pre‐Nect. 420 237 52 440 0.57 40 27
Balmer‐Kapteyn pre‐Nect. 200 70 ‐15 500 0.5 30 10.5
Fecunditatis pre‐Nect. 850 52 ‐4 690 0.25 30 20
Nubium pre‐Nect. 1100 345 ‐21 690 0.46 30 7.5
Mutus‐Vlacq pre‐Nect. 1400 21 ‐52 700 0.34 30 6.5
Lorentz pre‐Nect. 260 264.7 32.6 312 0.57 34 5.75
Planck pre‐Nect. 200 136.8 ‐57.9 314 0.45 30 16
Poincare pre‐Nect. 250 163.6 ‐56.7 319 0.48 26 11.5
Amundsen‐Ganswindt pre‐Nect. 250 120 ‐81 335 0.48 30 21
Schiller‐Zucchius pre‐Nect. 280 315 ‐56 335 0.53 36 25
Birkhoff pre‐Nect. 200 213.9 58.7 345 0.5 40 14
Apollo pre‐Nect. 380 208.2 ‐36.1 537 0.53 36 19
Freundlich‐Sharonov pre‐Nect. 410 175 18.5 600 0.68 43 33
Sikorsky‐Rittenhouse Nectarian 160 111 ‐68 310 0.56 30 7
Mendeleev Nectarian 230 140.9 5.7 313 0.43 36 18
Korolev Nectarian 300 202.6 ‐4 437 0.53 44 20
Moscoviense Nectarian 420 148 26 445 0.55 42 39.5
Hertzsprung Nectarian 350 230.8 2.6 591 0.54 46 34
Mendel‐Rydberg Nectarian 430 266 ‐50 630 0.65 36 33.5
Humboldtianum Nectarian 440 82 59 650 0.59 32 24
Schrodinger lower‐Imbrium 220 132.4 ‐75 312 0.55 28 19.5
Orientale lower‐Imbrium 500 265 ‐19 930 0.73 36 37
Smythii pre‐Nect. 510 87 ‐2 740 0.76 33 25.5
Humorum Nectarian 480 321 ‐24 425 0.75 30 28
Crisium Nectarian 610 59 18 740 0.79 32 30.5
Nectaris Nectarian 480 34 ‐16 860 0.81 30 27.5
Serenitatis Nectarian 840 18 26 920 0.71 30 24.5
Imbrium lower‐Imbrium 1300 343 35 1160 0.51 30 19.5
~94~
References
Andrews-Hanna, J. C. (2012), The origin of non-mare mascon gravity anomalies on the Moon, in Lunar and Planetary Institute Science Conference Abstracts, vol. 43, p. 2804.
Balcerski, J. A., S. A. Hauck, A. J. Dombard, and E. P. Turtle (2010), The influence of local thermal anomalies on large impact basin relaxation, in Lunar and Planetary Science Conference, vol. 41, p. 2535.
Balcerski, J. A., S. A. Hauck, and A. J. Dombard (2011), Preservation of Superisostasy in Large Lunar Basins, in Lunar and Planetary Science Conference, vol. 42, p. 2432.
Dombard, A. J., and J. J. Gillis (2001), Testing the viability of topographic relaxation as a mechanism for the formation of lunar floor-fractured craters, J. Geophys. Res. Planets, 106(E11), 27901–27909, doi:10.1029/2000JE001388.
Dombard, A. J., and W. B. McKinnon (2006), Elastoviscoplastic relaxation of impact crater topography with application to Ganymede and Callisto, J. Geophys. Res., 111(E1), doi:10.1029/2005JE002445.
Dombard, A. J., S. A. Hauck, and J. A. Balcerski (2013), On the origin of mascon basins on the Moon (and beyond): ON THE ORIGIN OF MASCON BASINS, Geophys. Res. Lett., 40(1), 28–32, doi:10.1029/2012GL054310.
Fassett, C. I., J. W. Head, S. J. Kadish, E. Mazarico, G. A. Neumann, D. E. Smith, and M. T. Zuber (2012), Lunar impact basins: Stratigraphy, sequence and ages from superposed impact crater populations measured from Lunar Orbiter Laser Altimeter (LOLA) data, J Geophys Res, 117, E00H06.
Freed, A. M., B. C. Johnson, D. M. Blair, H. J. Melosh, G. A. Neumann, R. J. Phillips, S. C. Solomon, M. A. Wieczorek, and M. T. Zuber (2014), The formation of lunar mascon basins from impact to contemporary form: Formation of Lunar Mascon Basins, J. Geophys. Res. Planets, 119(11), 2378–2397, doi:10.1002/2014JE004657.
Ishihara, Y., S. Goossens, K. Matsumoto, H. Noda, H. Araki, N. Namiki, H. Hanada, T. Iwata, S. Tazawa, and S. Sasaki (2009), Crustal thickness of the Moon: Implications for farside basin structures, Geophys. Res. Lett., 36(19), doi:10.1029/2009GL039708.
Jolliff, B. L., J. J. Gillis, L. A. Haskin, R. L. Korotev, and M. A. Wieczorek (2000), Major lunar crustal terranes: Surface expressions and crust-mantle origins, J. Geophys. Res. Planets, 105(E2), 4197–4216, doi:10.1029/1999JE001103.
Kamata, S. et al. (2013), Viscoelastic deformation of lunar impact basins: Implications for heterogeneity in the deep crustal paleo-thermal state and radioactive element concentration: DEFORMATION OF LUNAR IMPACT BASINS, J. Geophys. Res. Planets, 118(3), 398–415, doi:10.1002/jgre.20056.

~95~
Kamata, S. et al. (2015), The relative timing of Lunar Magma Ocean solidification and the Late Heavy Bombardment inferred from highly degraded impact basin structures, Icarus, 250, 492–503, doi:10.1016/j.icarus.2014.12.025.
Karato, S.-I., P. Wu, and others (1993), Rheology of the upper mantle- A synthesis, Science, 260(5109), 771–778.
Lambeck, K., and P. Johnston (1998), The viscosity of the mantle: evidence from analyses of glacial-rebound phenomena, Earths Mantle Compos. Struct. Evol., 461–502.
Mackwell, S. J., M. E. Zimmerman, and D. L. Kohlstedt (1998), High-temperature deformation of dry diabase with application to tectonics on Venus, J. Geophys. Res. Solid Earth 1978–2012, 103(B1), 975–984.
Manga, M., and R. J. O’Connell (1995), The tectosphere and postglacial rebound, Geophys. Res. Lett., 22(15), 1949–1952.
Melosh, H. J. et al. (2013), The Origin of Lunar Mascon Basins, Science, 340(6140), 1552–1555, doi:10.1126/science.1235768.
Miljković, K., M. A. Wieczorek, G. S. Collins, M. Laneuville, G. A. Neumann, H. J. Melosh, S. C. Solomon, R. J. Phillips, D. E. Smith, and M. T. Zuber (2013), Asymmetric Distribution of Lunar Impact Basins Caused by Variations in Target Properties, Science, 342(6159), 724–726, doi:10.1126/science.1243224.
Mohit, P. S., and R. J. Phillips (2006), Viscoelastic evolution of lunar multiring basins, J. Geophys. Res., 111(E12), doi:10.1029/2005JE002654.
Muller, P. M., and W. L. Sjogren (1968), Mascons: Lunar mass concentrations, Science, 161(3842), 680–684.
Namiki, N. et al. (2009), Farside Gravity Field of the Moon from Four-Way Doppler Measurements of SELENE (Kaguya), Science, 323(5916), 900–905, doi:10.1126/science.1168029.
Neumann, G. A., M. T. Zuber, D. E. Smith, and F. G. Lemoine (1996), The lunar crust: Global structure and signature of major basins, J. Geophys. Res. Planets 1991–2012, 101(E7), 16841–16863.
Nunes, D. C. (2004), Relaxation of compensated topography and the evolution of crustal plateaus on Venus, J. Geophys. Res., 109(E1), doi:10.1029/2003JE002119.
Potter, R. W. K., D. A. Kring, and G. S. Collins (2013), Quantifying the attenuation of structural uplift beneath large lunar craters: ATTENUATION OF STRUCTURAL UPLIFT, Geophys. Res. Lett., 40(21), 5615–5620, doi:10.1002/2013GL057829.
Rybacki, E., and G. Dresen (2000), Dislocation and diffusion creep of synthetic anorthite aggregates, J. Geophys. Res. Solid Earth 1978–2012, 105(B11), 26017–26036.
~96~
Saal, A. E., E. H. Hauri, M. L. Cascio, J. A. Van Orman, M. C. Rutherford, and R. F. Cooper (2008), Volatile content of lunar volcanic glasses and the presence of water in the Moon’s interior, Nature, 454(7201), 192–195, doi:10.1038/nature07047.
Smith, D. E. et al. (2010), Initial observations from the Lunar Orbiter Laser Altimeter (LOLA), Geophys. Res. Lett., 37(18), L18204, doi:10.1029/2010GL043751.
Solomon, S. C., R. P. Comer, and J. W. Head (1982), The evolution of impact basins: Viscous relaxation of topographic relief, J Geophys Res, 87, 3975–3992.
Spudis, P. D., J. J. Gillis, and R. A. Reisse (1994), Ancient multiring basins on the moon revealed by clementine laser altimetry, Science, 266(5192), 1848–1851, doi:10.1126/science.266.5192.1848.
T. Spohn, W. K. (2001), The Longevity of Lunar Volcanism: Implications of Thermal Evolution Calculations with 2D and 3D Mantle Convection Models, Icarus, 149(1), 54–65, doi:10.1006/icar.2000.6514.
Turcotte, D. L., and G. Schubert (2002), Geodynamics, 472 pp, Camb. Univ Press Camb. UK Doi, 10, 0521666244.
Turcotte, D. L., R. J. Willemann, W. F. Haxby, and J. Norberry (1981), Role of membrane stresses in the support of planetary topography, J. Geophys. Res. Solid Earth 1978–2012, 86(B5), 3951–3959.
Warren, P. H., and K. L. Rasmussen (1987), Megaregolith insulation, internal temperatures, and bulk uranium content of the moon, J. Geophys. Res., 92(B5), 3453, doi:10.1029/JB092iB05p03453.
Wieczorek, M. A., and R. J. Phillips (2000), The “Procellarum KREEP Terrane”: Implications for mare volcanism and lunar evolution, J. Geophys. Res. Planets 1991–2012, 105(E8), 20417–20430.
Wieczorek, M. A. et al. (2013), The Crust of the Moon as Seen by GRAIL, Science, 339(6120), 671–675, doi:10.1126/science.1231530.
Williams, K. K., and M. T. Zuber (1998), Measurement and analysis of lunar basin depths from Clementine altimetry, Icarus, 131(1), 107–122.
Zhong, S. (1997), Dynamics of crustal compensation and its influences on crustal isostasy, J. Geophys. Res. Solid Earth 1978–2012, 102(B7), 15287–15299.
Zuber, M. T. et al. (2013), Gravity Field of the Moon from the Gravity Recovery and Interior Laboratory (GRAIL) Mission, Science, 339(6120), 668–671, doi:10.1126/science.1231507.

~97~