Cascade Impactor (CI) Mensuration—An Assessment of the Accuracy and Precision of Commercially...
13
Research Article Cascade Impactor (CI) Mensuration—An Assessment of the Accuracy and Precision of Commercially Available Optical Measurement Systems Frank Chambers, 1 Aziz Ali, 1 Jolyon Mitchell, 2 Christopher Shelton, 3,5 and Steve Nichols 4 Received 21 October 2009; accepted 19 February 2010; published online 23 March 2010 Abstract. Multi-stage cascade impactors (CIs) are the preferred measurement technique for characterizing the aerodynamic particle size distribution of an inhalable aerosol. Stage mensuration is the recommended pharmacopeial method for monitoring CI “fitness for purpose” within a GxP environment. The Impactor Sub-Team of the European Pharmaceutical Aerosol Group has undertaken an inter-laboratory study to assess both the precision and accuracy of a range of makes and models of instruments currently used for optical inspection of impactor stages. Measurement of two Andersen 8-stage ‘non-viable’ cascade impactor “reference” stages that were representative of jet sizes for this instrument type (stages 2 and 7) confirmed that all instruments evaluated were capable of reproducible jet measurement, with the overall capability being within the current pharmacopeial stage specifications for both stages. In the assessment of absolute accuracy, small, but consistent differences (ca. 0.6% of the certified value) observed between ‘dots’ and ‘spots’ of a calibrated chromium-plated reticule were observed, most likely the result of treatment of partially lit pixels along the circumference of this calibration standard. Measurements of three certified ring gauges, the smallest having a nominal diameter of 1.0 mm, were consistent with the observation where treatment of partially illuminated pixels at the periphery of the projected image can result in undersizing. However, the bias was less than 1% of the certified diameter. The optical inspection instruments evaluated are fully capable of confirming cascade impactor suitability in accordance with pharmacopeial practice. KEY WORDS: cascade impactor; inhaler testing; optical inspection; performance verification; stage mensuration. INTRODUCTION The measured aerodynamic particle size distribution (APSD) of emitted aerosol from an oral-inhaled product (OIP) is a key performance parameter for assessing the ability to deliver a therapeutic dose of the medication to the lungs (1,2). Current pharmacopeial methods offer the option of several multi-stage cascade impactors (CIs) or the multi-stage liquid impinger (MSLI) that can measure the APSD of these aerosols with direct traceability to mass of active drug substance (3). Their principle of operation is the size fractionation of the incoming aerosol from the OIP based on differing particle inertia, a process that is described elsewhere and is well understood (3–5). In the context of understanding sources of measurement variability associated with APSD testing, Nichols observed that, in the case of the Next Generation Pharmaceutical Impactor (NGI), the contribution to overall error in the inhaler aerosol APSD measurement process associated with assuring aerody- namic performance by calibration or stage mensuration was only ±1%, as compared with ±3% for internal losses, ±5% for environmental factors, ±5% for the setting of flow rate, and as much as ±20% for the intrinsic variability associated with drug product dose uniformity (6). The NGI is likely to be representa- tive of other multi-stage CIs in these respects, given their common origins. Nevertheless, ways to determine aerodynamic performance that are fully traceable ultimately to the SI length standard are required in order to operate such equipment in a GxP environment (7). CI/MSLI (referred to as CI from now onwards) perform- ance was traditionally assessed by the laborious process of individual stage calibration using many sizes of spherical, monodisperse particles (8,9). More recently, the measurement of critical stage dimensions (stage mensuration) has been adopt- ed as a more efficient and practical procedure (10). Primarily, it is individual jet (nozzle) diameters that determine the aerodynamic size-selectivity of a particular stage. Diameters may be measured directly or calculated from the cross-sectional area of the jet. Once stage mensuration has taken place, measured jet diameters are compared to the design specifications for the CI under evaluation. This procedure is now the norm as the means of assuring CI aerodynamic performance routinely (11). Mensura- tion is also cited in the current European and US Pharmacopeias as the primary method for monitoring the “fitness for purpose” of CIs used within a GxP environment (12,13). Roberts and Romay (14) recently showed that the aerody- namic performance of a multi-nozzle stage is described by a 1 AstraZeneca Charnwood, Loughborough, UK. 2 Trudell Medical International, London, Canada. 3 PPD Inc., 8551 Research Way, Suite 90, Middleton, Wisconsin 53562-4664, USA. 4 OINDP Consultant, Cheshire, UK. 5 To whom correspondence should be addressed. (e-mail: christopher. [email protected]) AAPS PharmSciTech, Vol. 11, No. 1, March 2010 ( # 2010) DOI: 10.1208/s12249-010-9405-0 1530-9932/10/0100-0472/0 # 2010 American Association of Pharmaceutical Scientists 472
Transcript of Cascade Impactor (CI) Mensuration—An Assessment of the Accuracy and Precision of Commercially...
Research Article
Cascade Impactor (CI) Mensuration—An Assessment of the Accuracyand Precision of Commercially Available Optical Measurement Systems
Frank Chambers,1 Aziz Ali,1 Jolyon Mitchell,2 Christopher Shelton,3,5 and Steve Nichols4
Received 21 October 2009; accepted 19 February 2010; published online 23 March 2010
Abstract. Multi-stage cascade impactors (CIs) are the preferred measurement technique for characterizingthe aerodynamic particle size distribution of an inhalable aerosol. Stage mensuration is the recommendedpharmacopeial method for monitoring CI “fitness for purpose” within a GxP environment. The ImpactorSub-Teamof theEuropeanPharmaceuticalAerosolGrouphas undertaken an inter-laboratory study to assessboth the precision and accuracy of a range of makes and models of instruments currently used for opticalinspection of impactor stages. Measurement of two Andersen 8-stage ‘non-viable’ cascade impactor“reference” stages that were representative of jet sizes for this instrument type (stages 2 and 7) confirmedthat all instruments evaluatedwere capable of reproducible jet measurement, with the overall capability beingwithin the current pharmacopeial stage specifications for both stages. In the assessment of absolute accuracy,small, but consistent differences (ca. 0.6% of the certified value) observed between ‘dots’ and ‘spots’ of acalibrated chromium-plated reticule were observed, most likely the result of treatment of partially lit pixelsalong the circumference of this calibration standard.Measurements of three certified ring gauges, the smallesthaving a nominal diameter of 1.0 mm, were consistent with the observation where treatment of partiallyilluminated pixels at the periphery of the projected image can result in undersizing. However, the bias was lessthan 1%of the certified diameter. The optical inspection instruments evaluated are fully capable of confirmingcascade impactor suitability in accordance with pharmacopeial practice.
KEY WORDS: cascade impactor; inhaler testing; optical inspection; performance verification; stagemensuration.
INTRODUCTION
The measured aerodynamic particle size distribution(APSD) of emitted aerosol from an oral-inhaled product (OIP)is a key performance parameter for assessing the ability todeliver a therapeutic dose of the medication to the lungs (1,2).Current pharmacopeial methods offer the option of severalmulti-stage cascade impactors (CIs) or the multi-stage liquidimpinger (MSLI) that can measure the APSD of these aerosolswith direct traceability tomass of active drug substance (3). Theirprinciple of operation is the size fractionation of the incomingaerosol from the OIP based on differing particle inertia, aprocess that is described elsewhere and is well understood (3–5).
In the context of understanding sources of measurementvariability associated with APSD testing, Nichols observed that,in the case of the Next Generation Pharmaceutical Impactor(NGI), the contribution to overall error in the inhaler aerosolAPSD measurement process associated with assuring aerody-namic performance by calibration or stage mensuration was
only ±1%, as compared with ±3% for internal losses, ±5% forenvironmental factors, ±5% for the setting of flow rate, and asmuch as ±20% for the intrinsic variability associated with drugproduct dose uniformity (6). The NGI is likely to be representa-tive of other multi-stage CIs in these respects, given theircommon origins. Nevertheless, ways to determine aerodynamicperformance that are fully traceable ultimately to the SI lengthstandard are required in order to operate such equipment in aGxP environment (7).
CI/MSLI (referred to as CI from now onwards) perform-ance was traditionally assessed by the laborious process ofindividual stage calibration using many sizes of spherical,monodisperse particles (8,9). More recently, the measurementof critical stage dimensions (stage mensuration) has been adopt-ed as a more efficient and practical procedure (10). Primarily, it isindividual jet (nozzle) diameters that determine the aerodynamicsize-selectivity of a particular stage. Diameters may be measureddirectly or calculated from the cross-sectional area of the jet.Once stage mensuration has taken place, measured jet diametersare compared to the design specifications for the CI underevaluation. This procedure is now the norm as the means ofassuring CI aerodynamic performance routinely (11). Mensura-tion is also cited in the current European and US Pharmacopeiasas the primary method for monitoring the “fitness for purpose”of CIs used within a GxP environment (12,13).
Roberts and Romay (14) recently showed that the aerody-namic performance of a multi-nozzle stage is described by a
1AstraZeneca Charnwood, Loughborough, UK.2 Trudell Medical International, London, Canada.3 PPD Inc., 8551 Research Way, Suite 90, Middleton, Wisconsin53562-4664, USA.
4OINDP Consultant, Cheshire, UK.5 To whom correspondence should be addressed. (e-mail: [email protected])
AAPS PharmSciTech, Vol. 11, No. 1, March 2010 (# 2010)DOI: 10.1208/s12249-010-9405-0
1530-9932/10/0100-0472/0 # 2010 American Association of Pharmaceutical Scientists 472

single size-related metric termed ‘effective diameter’, a param-eter calculated directly from stage mensuration data. Providedthat the other more secondary aspects of impactor geometry aremaintained (15), it is now possible to demonstrate traceabilitylinking CI aerodynamic performance to the stage mensurationprocess through the use of certified reference standards that arecommonly used to calibrate the optical image analyzers(inspection systems) used for mensuration. These standardsare themselves ultimately traceable to the international lengthstandard. Current compendial acceptance criteria for CI stageshas thus far focused on the achievable tolerances in impactormanufacture, while conceding that alternative limits can bejustified on a case-by-case basis (12,13).
Stage mensuration can also be performed using calibratedpin gauges for the largest jets, and historically such gauges wereused as the primary means to measure jet diameter. Althoughpin gauges are easy to use and, as primary standards, arecalibrated to a high degree of accuracy, there are limitations:
1. They are invasive2. Accuracy of gauge-determined jet diameter is affected
by the circularity of the jet3. Manual use of gauges is tedious for stages containing
hundreds of jets
More recently, optical systems, having software-drivenimage analysis capability, have become the preferred measure-ment instrument, since this equipment addresses most of thelimitations of pin gauges, providing fast and accurate resultsfrom the many hundreds of repetitive measurements that areneeded to complete the process for a typical CI (10), and insome cases offering the capability of quantifying jet circularity.However, the algorithms associated with the analysis softwareare proprietary, and therefore not well understood by the user
community. This lack of transparency in a critical component ofthe measurement process may account for the fact that Sheltonfound observable differences in reported jet diameters forrecently manufactured non-viable Andersen 8-stage CIs (ACIs)between three different measurement systems to assess thesame stages (16). In the worst case associated with the assess-ments of the smallest nozzles (0.254 mm nominal diameter),extreme values of these differences approached 5% of nominaldiameter. A more recent survey of members of the ImpactorSub-Team within the European Pharmaceutical Aerosol Grouprevealed that at least four different optical inspection systemsare currently in use (17). It is, therefore, postulated that part ofthe reported variability in stage mensuration data may arisemostly from differences between optical inspection systems. Tosupport this hypothesis, the Impactor Sub-Team undertook around-robin study aimed at quantifying separately the measure-ment precision and accuracy of a variety of inspection instru-ments in use, with the objective of confirming the fitness ofpurpose of these systems for stage mensuration. This reportdescribes the outcome of this investigation.
MATERIALS AND METHODS
Assessment of Measurement Precision
Stages 2 (400 jets, nominal diameter=0.914 mm) and 7 (201jets, nominal diameter=0.254 mm) of a stainless steel ACI(Westech Instrument Services Ltd., Upper Stondon, Bedford-shire, UK) were chosen as reference articles, having represen-tative large and small jet sizes, respectively (5). Each stage wasexamined independently in a round-robin exercise at ninedifferent locations, some of which made their measurements
Table I. Overview of Optical Inspection System Characteristics
System Name Parameter Measured Reported Diameter
Reproducibility
Calibration Standard
Automation Site Number
Study
Andersen Visual Inspection System (AVIS)(Specac, Ltd., Orpington, Kent, UK)
Area 0.005 mm
Gauge
Image FocusEdge DetectionImage Analysis
1
2
3
4
PrecisionAccuracy
GaugePrecisionAccuracy
GaugePrecisionAccuracy
GaugePrecisionAccuracy
MondoMondo Metrology Ltd.(no longer available)
Site 5 = Model Optima 725Site 6 = Model Optima 3
Diameter NAGauge Image Focus
Edge DetectionImage Analysis
5
6
PrecisionAccuracy
GaugePrecisionAccuracy
Mitutoyo QV404 (Mitutoyo UK Ltd., Andover, Hampshire,
UK)
Circumference and Area
0.001 mm
Glass reticuleImage Focus
Edge DetectionImage Analysis
6
7
PrecisionAccuracy
Glass reticulePrecisionAccuracy
Glass reticulePrecisionAccuracy
RAM Optical Datastar 100(RAM Optical Instrumentation Inc.,
Rochester, NY, USA)Circumference
0.001-0.008 mm, depending on stage
Glass reticuleImage Focus
Edge DetectionImage Analysis
8
8
PrecisionAccuracy
RAM Omis II non-contact vision system(RAM Optical Instrumentation Inc.,
Rochester, NY, USA)Circumference 0.001 mm
Glass reticuleand gauge
Image FocusEdge DetectionImage Analysis
9PrecisionAccuracy
OGP Smartscope Flash 500(Optical Gaging Products, Inc., Rochester,
NY, USA)Circumference 0.001 mm
Glass reticuleand gauge
Image FocusEdge DetectionImage Analysis
9PrecisionAccuracy
fully manual measurement
a
a
473Cascade Impactor Stage Mensuration

with a different make or model of an inspection system asdepicted in Table I. On receipt, each participant initially cleanedeach stage using the procedure recommended by the supplier(Westech Instrument Services Ltd). The inspection system wasinitially calibrated using the procedure in use at that location,before triplicate measurements of the stages were made in theorder: stage 2, stage 7, stage 2, stage 7, stage 2, stage 7. Thefollowing parameters were reported:
& Number of jets measured per stage& Jet diameter& Calculated jet area from diameter& Measured jet area& Calculated jet diameter from area
The measures of jet diameter and/or area, depending onequipment type, together with a brief description of their site-specific system calibration procedure, were forwarded byeach participant to the study co-ordinator. This informationincluded verification that length-traceable standards had beenused to calibrate the equipment. The mean, median, range, %RSD, and effective diameter for each stage were calculated asdescriptive statistics and the data sets containing the individ-ual measures were also assessed for components of variability
(Appendix) by two-way ANOVA using SAS v. 9.1 (SASInstitute Inc, Cary, North Carolina, USA).
Assessment of Measurement Accuracy
The accuracy of each inspection system was separatelyevaluated to understand sources of possible systematic differ-ences observed by Shelton (16). It was postulated thatdifferences in the treatment of partially lit pixels along thejet circumference may have introduced bias in reporteddiameters. In addition, the physical properties of the nozzlesthemselves, such as jet depth effects and machining imper-fections revealed in the projected images for analysis, mayalso have been interpreted differently by each type of system.
Six individual instruments were evaluated among four ofthe nine participating sites (Table I), with analysis of length-traceable standards conducted by each participant according totheir internal standard operating procedure. A certified glassreticule with traceability to the international standard meter(National Physical Laboratory, Middlesex, UK) was used as onemeasurement reference standard that was circulated to each ofthe four participants. The reticule comprised nine chromium-on-glass ‘dots’ and nine glass-on-chromium circular ‘spots’ arranged
Table II. Descriptive Statistics for Inter-instrument Comparisons from Projected Jet Diameters: AVIS Systems
ACI stage 2 AVIS projected diameter (mm) ACI stage 7 AVIS projected diameter (mm)
Site Replication Number Mean SE mean SD RSD (%) Site Replication Number Mean SE Mean SD RSD (%)
1 1 400 0.9020 0.0002 0.0031 0.34 1 1 201 0.2600 0.0002 0.0033 1.272 400 0.9022 0.0002 0.0030 0.34 2 201 0.2599 0.0002 0.0033 1.273 400 0.9021 0.0002 0.0031 0.34 3 201 0.2601 0.0002 0.0032 1.24
2 1 400 0.9030 0.0001 0.0023 0.26 2 1 201 0.2515 0.0002 0.0028 1.112 400 0.9024 0.0001 0.0023 0.25 2 201 0.2519 0.0002 0.0028 1.113 400 0.9042 0.0001 0.0022 0.24 3 201 0.2516 0.0002 0.0027 1.06
3 1 400 0.9175 0.0001 0.0026 0.29 3 1 201 0.2591 0.0002 0.0035 1.352 400 0.9175 0.0001 0.0026 0.28 2 201 0.2591 0.0002 0.0035 1.343 400 0.9175 0.0001 0.0026 0.28 3 201 0.2591 0.0002 0.0035 1.36
4 1 400 0.9200 0.0002 0.0033 0.35 4 1 201 0.2573 0.0002 0.0027 1.052 400 0.9160 0.0002 0.0030 0.33 2 201 0.2574 0.0002 0.0028 1.093 400 0.9171 0.0002 0.0031 0.34 3 201 0.2565 0.0002 0.0028 1.10
Fig. 1. Photo showing glass reticule slide (left) and calibrated ring gauges (right) in the speciallydesigned holders for analysis. Dark regions in the glass slide are the transparent portions where nochromium deposits exist. Used with permission from (7)
474 Chambers et al.

in a parallel pattern, ranging in diameter from 0.254 to 5.5 mm(Fig. 1). This configuration allowed absolute assessment ofinstrument measurement accuracy based on a two-dimensionalimage profile. A specially designed holder, with exteriordimensions similar to the 8-stage ACI, was used to present thereticule consistently to each system.
Certified ring gauges having nominal diameters of 1.0,2.5, and 4.5 mm (Alpha Gauging Ltd, UK) were alsocirculated as a second reference standard to evaluate theeffect of three-dimensional profiles on accuracy of measuredimage (Fig. 1). The three ring gauges were placed in aseparate designed ACI stage holder for consistent presentationto each system.
Ten replicate measurements of each dot/spot/aperturewere obtained on three different days, resulting in 30 datapoints for each element. The accuracy associated with meanreported diameter was calculated for each calibrated dot/spotand ring gauge as a percent of the reported value from theassociated certificate of analysis.
RESULTS
Measurement Precision
Descriptive statistics for measured jet diameter arereported in Table II (AVIS systems) and Table III (other
Table IV. Descriptive Statistics for Inter-instrument Comparisons from Jet Area Measurements
Site Replicate Number Mean SE mean SD RSD (%) Site Replicate Number Mean SE mean SD RSD (%)
Stage 2 AVIS area (mm2) Stage 7 AVIS area (mm2)1 1 400 0.6390 0.0002 0.0044 0.68 1 1 201 0.0531 0.0001 0.0013 2.53
2 400 0.6392 0.0002 0.0043 0.68 2 201 0.0531 0.0001 0.0013 2.543 400 0.6392 0.0002 0.0044 0.68 3 201 0.0531 0.0001 0.0013 2.47
2 1 400 0.6404 0.0002 0.0033 0.52 2 1 201 0.0497 0.0001 0.0011 2.212 400 0.6396 0.0002 0.0032 0.50 2 201 0.0498 0.0001 0.0011 2.193 400 0.6421 0.0002 0.0031 0.48 3 201 0.0497 0.0001 0.0011 2.13
3 1 400 0.6611 0.0002 0.0038 0.57 3 1 201 0.0527 0.0001 0.0014 2.702 400 0.6611 0.0002 0.0038 0.57 2 201 0.0527 0.0001 0.0014 2.673 400 0.6611 0.0002 0.0038 0.57 3 201 0.0527 0.0001 0.0014 2.71
4 1 400 0.6648 0.0002 0.0047 0.71 4 1 201 0.0520 0.0001 0.0011 2.112 400 0.6590 0.0002 0.0044 0.66 2 201 0.0521 0.0001 0.0011 2.183 400 0.6606 0.0002 0.0045 0.67 3 201 0.0517 0.0001 0.0011 2.20
Stage 2 Mitutoyo area (mm2) Stage 7 Mitutoyo area (mm2)6 1 400 0.6461 0.0002 0.0043 0.67 6 1 201 0.0497 0.0001 0.0010 1.98
2 400 0.6462 0.0002 0.0044 0.69 2 201 0.0497 0.0001 0.0010 2.003 400 0.6465 0.0002 0.0043 0.67 3 201 0.0497 0.0001 0.0010 2.03
7 1 400 0.6442 0.0002 0.0040 0.62 7 1 201 0.0490 0.0001 0.0011 2.282 400 0.6442 0.0002 0.0040 0.62 2 201 0.0490 0.0001 0.0011 2.283 400 0.6442 0.0002 0.0040 0.62 3 201 0.0490 0.0001 0.0011 2.30
Table III. Descriptive Statistics for Inter-instrument Comparisons from Measured Jet Diameters: Non-AVIS Systems
Site Replication Number Mean SE mean SD RSD (%) Site Replication Number Mean SE mean SD RSD (%)
ACI stage 2 Mitutoyo diameter (mm) ACI stage 7 Mitutoyo diameter (mm)6 1 400 0.9101 0.0002 0.0032 0.36 6 1 201 0.2555 0.0002 0.0030 1.18
2 400 0.9101 0.0002 0.0032 0.35 2 201 0.2556 0.0002 0.0030 1.163 400 0.9103 0.0002 0.0032 0.35 3 201 0.2555 0.0002 0.0030 1.17
7 1 400 0.9092 0.0001 0.0030 0.33 7 1 201 0.2549 0.0002 0.0032 1.242 400 0.9091 0.0001 0.0030 0.33 2 201 0.2548 0.0002 0.0032 1.263 400 0.9091 0.0001 0.0030 0.33 3 201 0.2549 0.0002 0.0032 1.26
ACI stage 2 Mondo systems diameter (mm) ACI stage 7 Mondo systems diameter (mm)5 (Optima 725) 1 13 0.9078 0.0007 0.0026 0.29 5 1 8 0.2569 0.0015 0.0042 1.64
2 13 0.9118 0.0009 0.0032 0.35 2 8 0.2543 0.0010 0.0029 1.133 13 0.9141 0.0017 0.0060 0.66 3 8 0.2551 0.0011 0.0032 1.26
6 (Optima 3) 1 13 0.9210 0.0003 0.0067 0.73 6 1 8 0.2591 0.0012 0.0034 1.302 13 0.9219 0.0003 0.0063 0.69 2 8 0.2601 0.0016 0.0045 1.743 13 0.9213 0.0002 0.0049 0.53 3 8 0.2621 0.0017 0.0048 1.82
ACI stage 2 RAM systems diameter (mm) ACI stage 7 RAM systems diameter (mm)8 (Datastar 100) 1 400 0.9177 0.0002 0.0032 0.35 8 (Datastar 100) 1 201 0.2595 0.0002 0.0031 1.20
2 400 0.9171 0.0002 0.0030 0.33 2 201 0.2597 0.0002 0.0032 1.233 400 0.9170 0.0001 0.0030 0.33 3 201 0.2592 0.0002 0.0031 1.19
9 (Omis II) 1 400 0.9226 0.0002 0.0033 0.36 9 (Omis II) 1 201 0.2580 0.0002 0.0026 1.022 400 0.9229 0.0002 0.0032 0.35 2 201 0.2581 0.0002 0.0026 1.033 400 0.9228 0.0002 0.0033 0.36 3 201 0.2580 0.0002 0.0027 1.04
475Cascade Impactor Stage Mensuration
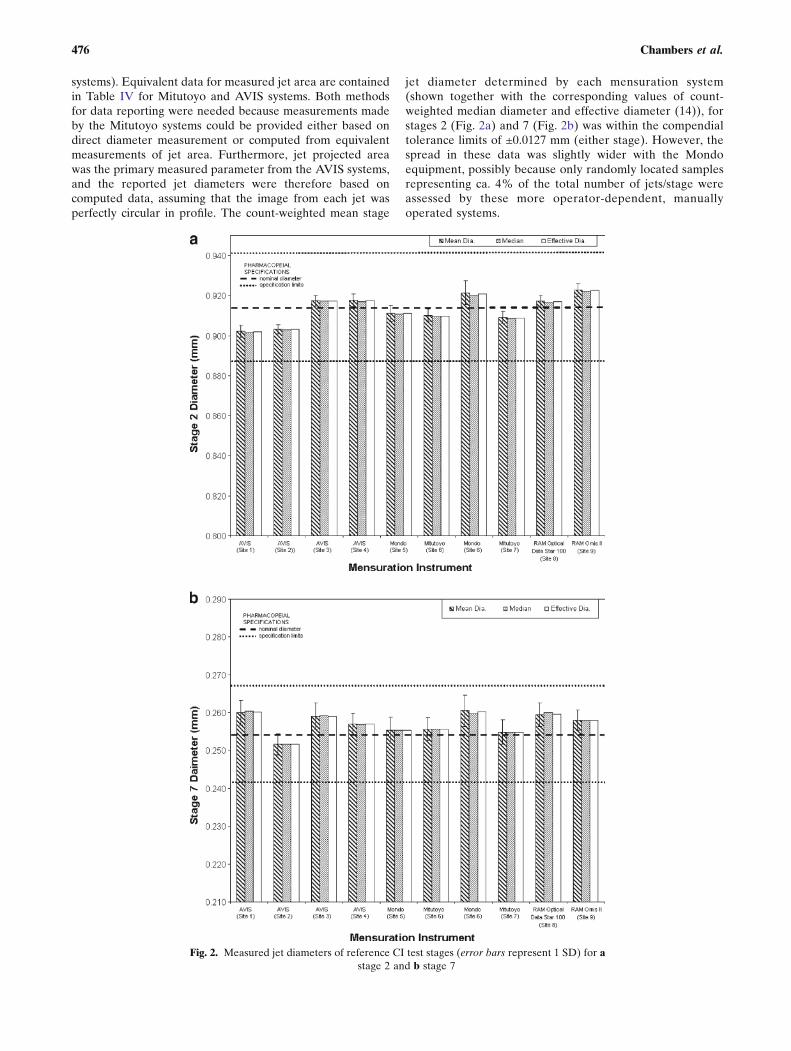
systems). Equivalent data for measured jet area are containedin Table IV for Mitutoyo and AVIS systems. Both methodsfor data reporting were needed because measurements madeby the Mitutoyo systems could be provided either based ondirect diameter measurement or computed from equivalentmeasurements of jet area. Furthermore, jet projected areawas the primary measured parameter from the AVIS systems,and the reported jet diameters were therefore based oncomputed data, assuming that the image from each jet wasperfectly circular in profile. The count-weighted mean stage
jet diameter determined by each mensuration system(shown together with the corresponding values of count-weighted median diameter and effective diameter (14)), forstages 2 (Fig. 2a) and 7 (Fig. 2b) was within the compendialtolerance limits of ±0.0127 mm (either stage). However, thespread in these data was slightly wider with the Mondoequipment, possibly because only randomly located samplesrepresenting ca. 4% of the total number of jets/stage wereassessed by these more operator-dependent, manuallyoperated systems.
Fig. 2. Measured jet diameters of reference CI test stages (error bars represent 1 SD) for astage 2 and b stage 7
476 Chambers et al.

There was no evidence of a consistent pattern of differ-ences that could be linked to measurement system type(Tables II, III, and IV). The largest range in reported meandiameter for stage 2, representing 2.26% of nominal for thisstage (0.914 mm), was obtained between participants 1 and 9(Table V) using an AVIS and the RAM Omis systems,respectively. Similarly, the largest range in mean jet diametervalues for stage 7, obtained between participants 2 and 6using an AVIS and Mondo system, respectively, was 3.47% ofnominal (0.254 mm). The magnitude of the 95% confidenceinterval associated with each mean jet diameter, taken as ameasure of extreme variability in these measurements,represented <0.05% and <1.4% of the mean diameter forstages 2 and 7, respectively. Taking the smallest interval thatenclosed both 95% confidence intervals from the individualsite measurements to represent the overall divergence inmeasured jet diameter for each stage, the maximum differ-ence occurred with stage 7, being equivalent to 3.92% ofnominal.
Direct Jet Diameter Measurements
Further data analysis was possible for both AVIS,Mitutoyo, and Mondo systems, where an instrument of thesame type was used at more than one laboratory (Appendix).Intra-instrument precision associated with the stage 2 AVISmeasurements was estimated comparing RSD values for thereplicates associated with a given instrument. This measure ofprecision was similar for each instrument, being clusteredwithin narrow ranges typically within 0.02% of values in theoverall range 0.24% to 0.35% (Table II). However, theabsolute magnitude of the groups of mean jet diametersmeasured by the same instrument varied between partici-pants. These differences (Fig. 3a) are indicative of significantinter-instrument variability, and further analysis (Table VI)confirmed that 89.1% of this variability originated from inter-site causes. While it is noted that the mean of the distributionof jet diameters in Fig. 3a is not centered within the range,this asymmetry is an artifact of the machining process for thisstage, not the measurement process, as evidenced by theapparent symmetry in the jet distribution for the stage 7 andsimilarity of distributions between instruments.
The stage 7 AVIS-measured data also indicated that theprecision associated with each inspection system was com-parable for the three replicates (Table II), with the RSD forthe measurements in the narrow range from 1.05% to 1.36%,approximately four times larger than equivalent RSD valuesfor the larger stage 2 nozzles. This observation shows that thestandard deviation of measurements is independent of jetdiameter. There were, again, small differences detectableboth in the absolute magnitude and spread of the diametermeasurements between participating test sites (Fig. 3b), with
Table V. Extreme Inter-site Values for Measured Jet Diameters
Stage 2: mean diameter (mm)Site number Mean Lower bound of 95% confidence interval Upper bound of 95% confidence interval9 0.9228 0.9226 0.92301 0.9021 0.9019 0.9023
Stage 2: extreme difference (mm)Difference Difference Lower bound of 95% confidence interval Upper bound of 95% confidence intervalSite 9–Site 1 0.0207 0.0204 0.0209Difference (% of nominal jet diameter) 2.26 2.24 2.29
Stage 7: mean diameter (mm)Site number Mean Lower bound of 95% confidence interval Upper bound of 95% confidence interval6 (Mondo) 0.2605 0.2587 0.26232 0.2517 0.2514 0.2519
Stage 7: extreme difference (mm)Difference Difference Lower bound of 95% confidence interval Upper bound of 95% confidence intervalSite 6–Site 2 0.0088 0.0077 0.0100Difference (% of nominal jet diameter) 3.47 3.01 3.92
Used with permission from (7)
Fig. 3. Comparison of AVIS-projected jet diameters for a stage 2 andb stage 7
477Cascade Impactor Stage Mensuration

58.4% of this variability originating from site-to-site causes(Table VI). It should be noted that the residual componentcomprising 41.4% of total variability, was higher than thatassociated for stage 2 (9.3%), and within expectation for astage with smaller jets.
Similar analysis was undertaken for the data from thetwo participants using the Mitutoyo QV404 optical inspection
equipment (Fig. 4a and b). While the overall variability ofmeasurements from both locations was similar to thatobserved with the AVIS group, with the total RSD varyingfrom 0.33% to 0.36%, the means and spreads of measure-ments between the two sites were comparable. Furtheranalysis showed that only 5.0% of the total variabilityoriginated from inter-site differences (Table VI). A similar
Table VI. Variability Components from Jet Diameter Data
Stage 2 Stage 7
Variability source Variability component % of total Variability source Variability component % of total
AVISInter-site 7.4×10⁻⁵ 89.1 Inter-site 1.3×10⁻⁵ 58.4Replication 1.3×10⁻⁶ 1.5 Replication 2.7×10⁻⁸ 0.1Residual component 7.8×10⁻⁶ 9.3 Residual component 9.6×10⁻⁶ 41.4Total 8.33×10⁻⁵ 99.9 Total 2.3×10⁻⁵ 99.9
MitutoyoInter-site 5.0×10⁻⁷ 5.0 Inter-site 2.3×10⁻⁷ 2.4Replication UN 0.0 Replication UN 0.0Residual component 9.6×10⁻⁶ 95.0 Residual component 9.6×10⁻⁶ 97.6Total 1.00×10⁻⁵ 100.0 Total 9.79×10⁻⁶ 100.0
MondoInter-site 5.0×10⁻⁵ 62.4 Inter-site 1.2×10⁻⁵ 44.0Replication 3.0×10⁻⁶ 3.8 Replication 1.7×10⁻⁷ 0.6Residual component 2.7×10⁻⁵ 33.8 Residual component 1.5×10⁻⁵ 55.4Total 7.99×10⁻⁵ 100.0 Total 2.73×10⁻⁵ 100.0
UN = undetectable
Fig. 4. Comparison of Mitutoyo QV404-measured jet diameters for astage 2 and b stage 7
Fig. 5. Comparison of MONDO-measured jet diameters for a stage 2and b stage 7
478 Chambers et al.
pattern in the variability components occurred with themeasurements of stage 7 by the Mitutoyo equipment, withtotal RSD values varying from 1.16% to 1.26% (Table III).Remarkably, the contribution to variability from replicationwith these instruments was too small to be detected in theanalysis of data from either reference stage.
The total RSD from the Mondo-based measurementswas 0.81% for stage 2, again indicating low overall variability(Table III). However, the intra-instrument precision for stage2 was slightly more variable (Fig. 5a). ANOVA revealed that62.4% of the overall variability originated inter-site with mostof the remainder (33.8%) associated with the residual
component (Table VI). Again, jet-to-jet differences (3.8%)were by far the smallest contributor to overall variability. Itshould be noted, however, that the measures for stage 7 withthis manually operated equipment (Fig. 5b) were based ononly eight determinations. Given the comparatively smallsample size, estimates of the overall measurement variabilityhad greater uncertainty associated with them, most likelyaccounting for the larger overall RSD value that ranged from1.13% to 1.82% (Table III). Further analysis (Table VI)revealed that 44.0% of the total variability originated fromsite-to-site causes, with only 0.61% arising from replication.
Although inter-site analysis was not possible for the jetdiameter measurements made by the two RAM inspectionsystems (Datastar 100 and Omis II operated at differentlocations), the overall variability associated with each ana-lyzer for stage 2 (0.33% to 0.35% RSD for the Datastar 100;0.35% to 0.36% RSD for the Omis) was comparable with theoverall variability for the other three systems alreadyconsidered (Table III). Similarly, overall variability rangesfor stage 7 (1.20% to 1.23% for the Datastar; 1.02% to 1.04%for the Omis II) were at least as precise as equivalent dataobtained from the other equipment.
Jet Diameters Computed from Image Area Measurements
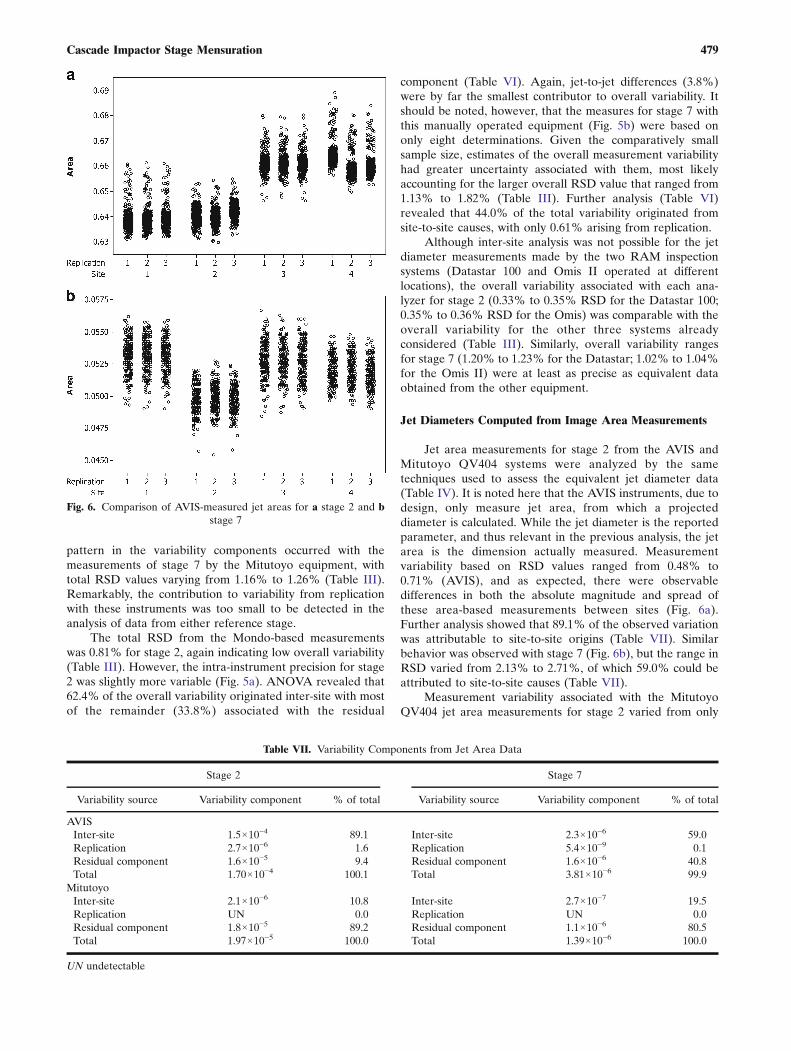
Jet area measurements for stage 2 from the AVIS andMitutoyo QV404 systems were analyzed by the sametechniques used to assess the equivalent jet diameter data(Table IV). It is noted here that the AVIS instruments, due todesign, only measure jet area, from which a projecteddiameter is calculated. While the jet diameter is the reportedparameter, and thus relevant in the previous analysis, the jetarea is the dimension actually measured. Measurementvariability based on RSD values ranged from 0.48% to0.71% (AVIS), and as expected, there were observabledifferences in both the absolute magnitude and spread ofthese area-based measurements between sites (Fig. 6a).Further analysis showed that 89.1% of the observed variationwas attributable to site-to-site origins (Table VII). Similarbehavior was observed with stage 7 (Fig. 6b), but the range inRSD varied from 2.13% to 2.71%, of which 59.0% could beattributed to site-to-site causes (Table VII).
Measurement variability associated with the MitutoyoQV404 jet area measurements for stage 2 varied from only
Fig. 6. Comparison of AVIS-measured jet areas for a stage 2 and bstage 7
Table VII. Variability Components from Jet Area Data
Stage 2 Stage 7
Variability source Variability component % of total Variability source Variability component % of total
AVISInter-site 1.5×10⁻⁴ 89.1 Inter-site 2.3×10⁻⁶ 59.0Replication 2.7×10⁻⁶ 1.6 Replication 5.4×10⁻⁹ 0.1Residual component 1.6×10⁻⁵ 9.4 Residual component 1.6×10⁻⁶ 40.8Total 1.70×10⁻⁴ 100.1 Total 3.81×10⁻⁶ 99.9
MitutoyoInter-site 2.1×10⁻⁶ 10.8 Inter-site 2.7×10⁻⁷ 19.5Replication UN 0.0 Replication UN 0.0Residual component 1.8×10⁻⁵ 89.2 Residual component 1.1×10⁻⁶ 80.5Total 1.97×10⁻⁵ 100.0 Total 1.39×10⁻⁶ 100.0
UN undetectable
479Cascade Impactor Stage Mensuration

0.62% to 0.69% RSD (Table IV), with barely observabledifferences in absolute magnitude of the area measurements(Fig. 7a). Of the observed variation, 10.8% was associatedwith site-to-site causes (Table VII). As expected, the totalvariability was larger for stage 7 measurements, ranging from1.98% to 2.30% RSD (Table IV), with a similar pattern invariability to that seen with stage 2 data (Fig. 7b). In thisinstance, 19.5% of the observed variation originated fromsite-to-site differences (Table VII).
Part 2. Measurement Accuracy
Individual observations from each participating labora-tory for each element of the glass reticule and each of the ringgauges are presented as averages (n=30) in Table VIIItogether with the corresponding certified diameters (mm).By normalizing individual measurements against their nom-inal diameters collectively for each inspection system, anassessment of the overall accuracy and system bias could bemade. Figure 8a shows that the 95% confidence intervals forall the systems are within 1% of their nominal values. Thisresult indicates that the visual inspection systems evaluatedare sufficiently accurate and precise for measuring diametersof impactor jets. A similar approach was used to assessmeasurement bias relative to the type of object calibrationstandard. While all instruments reported a marginally largerdiameter for glass spots (bright aperture against a darkbackground) compared with an identically sized optically
opaque chrome spot against a bright background (Fig. 8b),overall, the bias due to calibration artifact was <1%.
Evaluation of the individual reticule elements obtainedat participating sites and expressed as percent certifieddiameter demonstrated that the measurements from theMitutoyo, AVIS (‘spots’ only) and OGP instruments werewithin ±0.2% of the certified value for both ‘spots’ and ‘dots’,irrespective of size (Figs. 9a and 10a). In the case of the RAMDatastar and Omis II instruments, the magnitude of thereported diameter tended to increase with decreasing size forglass spots on a chrome background (‘spots’; Fig. 9b), aneffect that was repeatable in the case of the Omis II system inwhich a second series of measurements was attempted, in theworst case approaching +2.8% nominal diameter at the smallestsize (0.254 mm diameter), comparable with the nominal jet sizeof stage 7 of the ACI. This trend was reversed when measuringchrome dots on a glass background, with theworst case (Omis II)approaching −1.5% of the certified value (Fig. 10b).
The measurement systems in general underestimated thediameter of the smallest ring gauge (no. 1, having a certifieddiameter of 1.00097 mm) as compared to the glass spot onchrome background of similar size (Fig. 11). In mostinstances, this bias was small, although in the worst case(Omis II), it amounted to −0.8% of the certified value.
DISCUSSION
Equipment Configuration
The optical inspection equipment (Table I) had manyfeatures in common. Each system comprised a CCD cameraand lens that allowed focusing on an individual stage jet andimage projection at the exit plane for analysis. The camerawas mounted above a platform upon which an inverted stagewas placed for inspection. The light source, which served tocreate an image on the CCD lens by transmitted light throughthe impactor stage jet undergoing mensuration, was locatedbeneath the platform. Software controlled movement of theplatform or camera to sequentially maneuver each jetbeneath the camera for inspection and to process theacquired data. Closer inspection revealed important differ-ences with regards to image focusing, image edge detection,and image analysis. Various degrees of technician interactionwere required from preparation of the instrument for stagejet measurements through analysis of the collected image.
In the case of the AVIS, RAM Datastar, and Omis IIinstruments, focus and light levels were manually adjusted forone jet of the stage to obtain an optimal image in the CCDcamera and these settings were maintained during subsequentmeasurements. However, for the AVIS equipment, theoperator was required to identify the optimal lens positionwhere the measured light intensity across the jet was uniform.Once these initial parameters were set, image collection andanalysis of each jet on the stage were fully automated. Imageanalysis was accomplished for both RAM instruments byedge detection algorithms to measure image circumference ina fully automated manner, from which diameter was calcu-lated. This algorithm calculated jet diameter based on amaximum of 500 points around the image circumference. Theuser had a choice of three algorithms (least squares fit,maximum inscribed fit, and minimum circumscribed circle fit)
Fig. 7. Comparison of Mitutoyo QV404-measured jet areas for astage 2 and b stage 7
480 Chambers et al.

to best suit the application. The AVIS systems determined jetdimensions based only on image area, corresponding to thenumber of pixels illuminated in the camera, so that imagediameter was calculated based on the diameter of a circlehaving the same area as the image. The Mitutoyo QV404systems were fully automated, offering the capability for lightadjustment and focus for each jet presented to the lens formeasurement (a technician would only enter system settingsprior to analysis, which were applied to all jet imagescollected for the stage) and were capable of completingmeasurements for an entire stage in about 15 min. Theseinstruments also employed an edge detection algorithm tocalculate jet diameter based on approximately 200 pointsaround the circumference of the image, and in addition theymeasured image area based on the number of pixelsilluminated in the camera. The OGP Smartscope was asautomated as the QV404 system, but image analysis waslimited to edge detection measurements with similar algo-rithms to those for the RAM systems. By contrast, the Mondosystems were fully manual in operation, which severelyincreases the time for stage analysis. Even with measurementof a restricted number of jets per stage, the process requiredabout 45 min of analyst time to analyze one stage.
Calibration procedures used for the various opticalinspection systems did vary in detail from site to site, butnot sufficiently to warrant description here. Importantly, all
participants made use of fully length-traceable test artifactssuch as gauges (including ring gauges, gauge blocks, or in oneinstance, an independently calibrated (reference) ACI stage)or reticules as summarized in Table I.
Finally, it should be noted that magnification of the imagethrough the lens with any of these systems was not a fixedparameter, but was dependent on the instrument configuration/design. For example, the Mitutoyo QV404 utilized two differentlenses for magnification, depending on dimensions of image foranalysis, to maintain an image that was greater than theminimum setting for the field of view. Image magnification forall instruments varied as part of the focusing process across therange of object sizes evaluated in this study.
Measurement Precision
The information gathered in this part of the studyprovided insight as to whether the different systems in usefor CI stage mensuration are suitable, as well as indicatingtheir relative precision with operators skilled in this practice.The data indicate that the reproducibility of site-to-site jetmeasurements is acceptable in relation to the established CIstage specification limits (13,14), based on both individualparticipant data (Fig. 2a and b and Tables II, III, and IV), andextreme overall values (Table V). This is an encouraging
Table VIII. Size Measurements Reported from Certified Standards
Reticule: chromium dots on glassDot no. Certified value
(mm)Mean measured diameter (mm; n=30)QV404 (Site 7) QV404 (Site 8) Omis (Site 9) Datastar (Site 8) OGP Smart
Scope (Site 9)Omis Repeat
(Site 9)1 0.2540 0.2534 0.2536 0.2515 0.2535 0.2536 0.25052 0.3429 0.3424 0.3427 0.3404 0.3429 0.3426 0.33923 0.5330 0.5322 0.5326 0.5301 0.5331 0.5328 0.52904 0.7110 0.7102 0.7101 0.7078 0.7120 0.7098 0.70655 0.9140 0.9126 0.9132 0.9105 0.9152 0.9128 0.90916 1.8900 1.8883 1.8887 1.8807 1.8851 1.8887 1.88997 2.5500 2.5478 2.5486 2.5396 2.5464 2.5484 2.55488 4.5000 4.4981 NM 4.4824 NM 4.4936 4.51109 5.5000 5.4995 NM 5.4972 NM 5.4981 5.5010
Reticule: glass spot on chromiumSpot no. Certified value
(mm)Mean measured diameter (mm; n=30)QV404 (Site 7) QV404 (Site 8) Omis (Site 9) Datastar
(Site 8)AVIS (Site 1) OGP Smart
Scope (Site 9)Omis Repeat
(Site 9)1 0.2539 0.2544 0.2535 0.2610 0.2555 0.2540 0.2542 0.25932 0.3429 0.3427 0.3426 0.3499 0.3452 0.3431 0.3433 0.34813 0.5331 0.5327 0.5325 0.5395 0.5367 0.5330 0.5333 0.53774 0.7111 0.7106 0.7100 0.7162 0.7161 0.7110 0.7113 0.71355 0.9140 0.9133 0.9131 0.9158 0.9204 0.9140 0.9145 0.91546 1.8901 1.8896 1.8895 1.8881 1.9003 1.8900 1.8920 1.89647 2.5500 2.5495 2.5494 2.5461 2.5617 2.5500 2.5536 2.56138 4.5000 4.5001 NM 4.4919 NM 4.5000 4.5036 4.53059 5.5000 5.5002 NM 5.5153 NM 5.5000 5.5029 5.5228
Ring gaugesGauge no. Certified value
(mm)Mean measured diameter (mm; n=30)QV404 (Site 7) QV404 (Site 8) Omis (Site 9) Datastar
(Site 8)AVIS (Site 1) OGP Smart
Scope (Site 9)Omis Repeat
(Site 9)1 1.0010 0.9993 0.9988 0.9934 1.0033 1.0000 0.9977 1.00172 2.4995 2.5006 2.5023 2.5023 2.5100 2.5000 2.4989 2.51023 4.5001 4.5000 NM 4.5074 NM 4.5000 4.5077 4.5175
NM not measuredUsed with permission from (7)
481Cascade Impactor Stage Mensuration

outcome, given the differences in instrument design anddegree of automation for these inspection systems (Table I).
Sources of data variability for a given optical inspectionsystem were attributed as arising from both site-to-site andfrom replicate measurements of the same object, withremaining undefined causes of variability assigned to theresidual component (Appendix). Of necessity the design ofthis investigation focused more on site-to-site variability thanother aspects related to instrument design over which there islittle external control. Interestingly, where comparisonsbetween systems of the same type were possible at differentlocations, both inter-site variability and the residual compo-nent separately contributed more to the overall variabilitythan the replication error (Tables VI and VII). Except forparticipant 6, who supplied data generated by both Mondoand Mitutoyo systems, the design of the precision study didnot make it possible to compare the precision of differentoptical inspection systems at a particular site. However, giventhe small sample size, such observations are believed to be oflimited value and are, therefore, not discussed further.
Inter-site variability is of particular interest, because thesame make of optical measurement system could be usedeither by different organizations undertaking mensuration orby the same organization at different locations. In thiscontext, comparative measurements made with the AVISsystems with both reference stages (Fig. 3a and b) demon-strated that replication and residual components were smallin relation to the inter-site variability. This finding indicatedgood reproducibility existed at each of the organizations using
this equipment, even if the absolute values from one participantdid not match perfectly with those from the others. The totalvariability in jet diameter for stage 7, whether determineddirectly (Tables II and III) or computed from area measure-ments (Table IV), was larger than equivalent measures for stage2. However, this variability is likely still acceptable given thesmaller absolute size of the jets of stage 7.
It is an acknowledged limitation that an unknownportion of the overall imprecision observed for these instru-ments may have originated from the subjective judgment ofthe operator associated with manual focusing of the CCDcamera, introducing small changes to the resulting image ateach intervention. In this context, the absence of a detectablereplication component to overall variability with the Mitutoyosystems is remarkable. In addition, measurements made withthese more fully automated systems had less overall varia-bility than the equivalent AVIS-derived results (compareFig. 3a with Fig. 4a and Fig. 3b with Fig. 4b) As might beexpected from manually operated systems, a larger spread inthe individual measurements was evident with the Mondoinspection equipment (Fig. 5a and b). However, because ofthe small data set obtained from the Mondo system (com-pared to the automated measurement systems), the samplestandard deviation may not accurately reflect the spread ofthe measurements (i.e., measurement uncertainty is higher inthis case). It is important to note that this study was notintended nor powered to determine whether or not such
Fig. 8. Overall accuracy for the optical inspection systems by aoptical inspection system and b nature of calibration artifact
Fig. 9. Comparison of instrument accuracy for glass-on-chromium spotsfor certified reticule for a Mitutoyo site 7 (open diamond), site 8 (opensquare), OGP Smartscope (open circle), and AVIS site 1 (multiplicationsymbol) systems and b RAM Datastar (close triangle) and Omis II(initial (close square) and repeat (close circle)) systems (discontinuouslines represent ±1% of certified value). Used with permission from (7)
482 Chambers et al.

differences were caused by controllable factors such asoperator skill or originating from the instrumentation itself.
Finally, in the case of the AVIS instruments which onlydirectly measure jet area, the higher magnitude of overallvariability (RSD value) associated with jet diameter valuescomputed from area measurements (Table II) compared withtheir equivalent values measured directly (Table IV) isreadily explicable in terms of the relationship between thesquare of jet diameter and area.
Measurement Accuracy
The three different sizes of fully size-traceable ring gaugewere intentionally selected as reference comparators since itis believed that the two-dimensional image projected fromlight striking each three-dimensional gauge aperture wouldinclude peripheral shadows making it more representative ofthe exit plane of a CI jet orifice than either the flat opaque orfully transparent circles of the reticule. Furthermore, it islikely that the jet depth profile, where microscopic but visiblemachining imperfections exist, could affect measurementprocess, thereby enhancing bias.
Each measurement system consistently reported a largerdiameter for a spot (clear hole) of a given size compared withthe equivalent opaque dot (Fig. 8a), and the magnitude of thisbias increased as the size of the calibration spot was reduced.Nevertheless, under worst-case circumstances, the overalleffect was small (<0.6% of the certified value) and is almostcertainly attributable to the systematic allocation of partially
lit pixels located along the image circumference either to thetransparent aperture with the glass spots or to the transparentborder adjacent to the chrome dots during analysis by thesoftware of the different systems. The source of the largerbias observed with the RAM Omis II compared with theother systems when examining the smallest objects on thecertified reticule is therefore almost certainly incorrectassignment of partially lit pixels by the Omis II image analysissoftware. It appears that pixels located at the periphery of theimage of the opaque (dark) spot were incorrectly assigned tothe illuminated region of the image. If true, this behaviorwould indicate that the image resolving power of thesesystems was close to the limit of capability.
The slight but observable underestimation of the size of thesmallest ring gauge by most of the systems (Fig. 11) most likelyoriginated from internal reflection of light in the ring gauge’sthree-dimensional profile that affects the lighted pixel intensityat the two-dimensional projected image. Any change in the pixelintensity at the plane for object analysis would have affected themeasured diameter reported by the optical system. Never-theless, it is likely that this form of bias is sufficiently small to beunimportant even for mensuration of stage 7 of the ACI wherethe smallest nominal jet diameter is 0.254 mm; however, it maybecome a concern for other CI designs if smaller jets are present.
CONCLUSIONS
The assessment of measurement precision using ACIreference stages 2 and 7 confirmed that all optical inspectionsystems evaluated provided measures of jet diameter thatwere within the specification limits defined in the Europeanand US Pharmacopeias. Further analysis revealed that theprecision of the automated systems was generally better thanfor the manually operated equipment (Mondo). Wherebetween-site comparisons were possible, inter-site differencesdominated the variability associated with the AVIS-basedmeasurements but not for equivalent measurements made bythe Mitutoyo automated systems. A repeatable size-relatedbias was evident with one of the diameter-based mensurationsystems (RAM Omis II) in the accuracy assessment, whichwas attributed to its boundary recognition algorithm. In allcases, the overall measurement error for the evaluated stagemensuration systems appears to be better than 1% of nominal
Fig. 10. Comparison of instrument accuracy for chromium-on-glass dotsfor certified reticule a Mitutoyo site 7 (open diamond), site 8 (opensquare), OGP Smartscope (open circle) systems and b RAM Datastar(close triangle) and Omis II (initial (close square) and repeat (closecircle)) systems (discontinuous lines represent ±1% of certified value).Used with permission from (7)
Fig. 11. Comparison of instrument accuracy of ring gauges forAVIS site1 (close triangle), RAM Datastar (close circle) RAM Omis II (initial(close square) and repeat (open diamond)), MitutoyoQV404 site 7 (closediamond) and site 8 (open triangle), and OGP Smart Scope (open circle)systems. Discontinuous lines represent ±1% of certified value
483Cascade Impactor Stage Mensuration

jet diameter, making all the techniques assessed suitable forconfirming CI system suitability.
ACKNOWLEDGMENTS
The authors wish to acknowledge the contributions of teammembers at each participating location: Ian Carter (Astra-Zeneca, Charnwood, UK), Mårten Svensson (AstraZeneca,Lund, Sweden), Mark Copley and William Dove (CopleyScientific Ltd., Nottingham, UK, Hlack Mohammed andHeather Robinson (GSK plc, Ware UK)), Matthew Curtis(Sanofi-Aventis, Holmes Chapel, Cheshire, UK), Mark Nageland Darryl Fischer (Trudell Medical International, London,Ontario, Canada), and Mike Smurthwaite and Gordon Dawson(Westech Instrument Services Ltd,Upper Stondon,Bedfordshire,UK). In addition, they also wish to acknowledge the significanttechnical advice received from Daryl Roberts and ChristianLavarreda (MSP Corp. St. Paul, Minnesota, USA).
APPENDIX: RATIONALE FOR FURTHERSTATISTICAL ANALYSIS OF PRECISION DATA
The purpose of the precision study was to gain anunderstanding of likely variability associated with CI stagemensuration when a variety of optical inspection systems incurrent use measured the same stages 2 and 7 of the ACI thatwere circulated between sites in the round-robin exercise.Such information is helpful in understanding whether thesesystems are suitable for purpose such that the degree ofprecision available is adequate to enable compliance withspecifications for CI stages that are published in the US andEuropean Pharmacopeias (A1, A2).
The total measurement variability (error) reported inTables VII (directly measured jet diameter) and VIII (jetdiameter computed from measured jet area) can be brokendown into the following origins by two-way ANOVA:
1. Site-to-site deviations in procedure (defined as the‘inter test site component)
2. Variability associated with repeated measurements ofthe same standard stage (defined as the ‘replication’component)
3. The residual component of the analysis that includesfactors such as operator and time (day) of measure-ment that were not analyzed for separately
In some instances, the same type of optical inspectionsystem was used at different participant locations, making itpossible to compare site-to-site variability. Except for site 6,which included data generated by both theMondo andMitutoyosystems, the design of the precision study did notmake it possibleto compare within-site precision of different optical systems.
REFERENCES
A1 European Directorate for the Quality of MedicinesandHealthcare (EDQM). Section 2.9.18—Preparationsfor inhalation: aerodynamic assessment of fine par-ticles. European Pharmacopeia 6th Edn., Strasbourg,France: Council of Europe; 2009. p. 287–300.
A2 United States Pharmacopeial Convention. (USP)Chapter 601—Physical tests and determinations:Aerosols. Rockville, MD: USP30-NF25; 2007. p.220–240.
REFERENCES
1. United States Federal Drug Administration (FDA). DraftGuidance: Metered dose inhaler (MDI) and dry powder inhaler(DPI) drug products chemistry, manufacturing and controlsdocumentation. Rockville MD, United States: Federal DrugAdministration; 1998. Docket 98D-0997.
2. European Medicines Agency (EMEA). Guideline on thepharmaceutical quality of inhalation and nasal products. London,UK: European Medicines Agency; 2006. EMEA/CHMP/QWP/49313/2005 Final.
3. Marple VA, Liu BYH. Characteristics of laminar jet impactors.Environ Sci Technol. 1974;8:648–54.
4. Marple VA, Willeke K. Inertial impactors: theory, design anduse. In: Liu BYH, editor. Fine particles. NY: Academic Press; 1976.p. 411–66.
5. Mitchell JP, Nagel MW. Cascade impactors for the size character-ization of aerosols from medical inhalers; their uses andlimitation. J Aerosol Med. 2003;16:341–76.
6. Nichols SC. Particle size distribution parameters using thenext generation pharmaceutical impactor. In: Dalby RN,Byron PR, Peart J, Suman JD, Farr SJ, editors. Respiratorydrug delivery-IX. River Grove: Davis Healthcare Int. Publ; 2004.p. 485–7.
7. Mitchell JP, RobertsDL,Chambers F, AzizA, SheltonC, Nichols S.Cascade impactor calibration, mensuration and in-use qualificationmethods: a practical guide. In: Dalby RN, Byron PR, Peart J,Suman JD, Farr SJ, Young P. Respiratory Drug Delivery 2010,Davis Healthcare Int. Publ., River Grove, IL, (in press)
8. Berglund RN, Liu BYH. Generation of monodisperse aerosolstandards. Environ Sci Technol. 1973;7:147–53.
9. Liu BYH, Pui DYH. A sub-micron aerosol standard and theprimary calibration of the condensation nucleus counter. JColloid Interface Sci. 1974;47:155–71.
10. Copley M. The importance of stage mensuration in cascadeimpaction. Pharm. Technol. Europe. Sept. 2008. Available at:http://www.ptemag.com/pharmtecheurope/analytical+equipment/The-importance-of-stage-mensuration-for-cascade-im/ArticleStandard/Article/detail/547892 (accessed 10 Jun 2009).
11. Christopher D, Curry P, Doub W et al. Considerations for thedevelopment and practice of cascade impaction testing includinga mass balance failure investigation tree. J Aerosol Med. 2003;16:235–47.
12. European Directorate for the Quality of Medicines and Health-care (EDQM). Section 2.9.18—Preparations for inhalation:aerodynamic assessment of fine particles. European Pharmaco-peia 6th Edn., Strasbourg, France: Council of Europe; 2009,pp. 287–300.
13. United States Pharmacopeial Convention (USP) Chapter 601—physical tests and determinations: aerosols. Rockville, MD:USP30-NF25; 2007. pp. 220–40.
14. Roberts DL, Romay FJ. Relationship of stage mensuration datato the performance of new and used cascade impactors. JAerosol Med. 2005;18:396–413.
15. Roberts DL. Theory of multi-nozzle impactor stages and theinterpretation of stage mensuration data. Aerosol Sci Technol.2009;43(11):1119–29.
16. Shelton CM. Comparison of optical systems for mensuration of8-stage cascade impactor. In: Drug Delivery to the Lungs-15,London, UK: The Aerosol Society; 2004. pp. 133–6.
17. Mitchell JP. Good Practices of Qualifying Cascade Impactors(CIs): A Survey of Members of the European PharmaceuticalAerosol Group (EPAG). Drug Delivery to the Lungs-16,London, UK: The Aerosol Society; 2005. p. 189–92.
484 Chambers et al.