Contents 1193..1194 - CI
192
Management Decision Alleviating poverty through trade Guest Editors: Dr David Lamond and Dr Rocky Dwyer Volume 45 Number 8 2007 ISSN 0025-1747 www.emeraldinsight.com
-
Upload
khangminh22 -
Category
Documents
-
view
3 -
download
0
Transcript of Contents 1193..1194 - CI

Management DecisionAlleviating poverty through tradeGuest Editors: Dr David Lamond and Dr Rocky Dwyer
Volume 45 Number 8 2007
ISSN 0025-1747
www.emeraldinsight.com
md cover (i) special issue.qxd 13/07/2007 09:12 Page 1

Guest EditorsDr David LamondDavid Lamond & Associates, Carlingford, AustraliaDr Rocky DwyerFaculty of Philosophy, Saint Paul University, Ottawa, Canada
Editor John PetersEmerald, 60/62 Toller Lane, Bradford, West Yorkshire, UK BD8 9BY. E-mail: [email protected]
Regional EditorsAsia PacificUsha C.V. HaleyDepartment of Management, University of New Haven, 300 Orange Avenue, West Haven, CT 06516, USA. E-mail: [email protected]
Low Sui PhengProfessor, National University of Singapore, School of Design & Environment, 4 Architecture Drive, Singapore 117566. E-mail: [email protected]
EuropeGöran SvenssonOslo School of Management, NorwayE-mail: [email protected]
Patricia Ordóñez de PablosThe University of Oviedo, Faculty of Economics, Avd del Cristo s/n, 33 071 Oviedo Asturias, SpainE-mail: [email protected]
North AmericaRichard L. OsborneExecutive Dean, Center for Management Development, Case Western Reserve University, Weatherhead School of Management, Cleveland, Ohio 44106, USAE-mail: [email protected]
Middle EastZeinab Karake-ShalhoubAssociate Dean of Business and Management, American University of Sharjah,PO Box 26666, Sharjah, United Arab EmiratesE-mail: [email protected]
AustraliaPeter MurrayCourse Director for Bach of HRM, Senior Lecturer in Business, School of Business, Division of Economics and Finance, Macquarie University, NSW, AustraliaE-mail: [email protected]
Book Review EditorKazem ChaharbaghiHead of Research and Professor of Management, East London Business School, University of East London, Longbridge Road, Dagenham, Essex RM8 2AS, UKTel: 020 8223 3000
Executive EditorKate SnowdenE-mail: [email protected]
PublisherKim Foster
ISBN 978-1-84663-608-0ISSN 0025-1747© 2007 Emerald Group Publishing Limited
Management DecisionIndexed and abstracted inABI InformBusiness International and Company Profile ASAPBusiness Periodicals IndexBusiness Source EliteBusiness Source PremierCabell’s Directory of Publishing Opportunities in Management and MarketingCorporate ResourceNetCurrent AbstractsElectronic Collections Online (OCLC)Emerald Management ReviewsEuropean Business ASAPExpanded Academic ASAPINSPECInternational Academic Research LibraryPsycINFOTOC Premier
After reports about all the facts have reached their desks, after all the advicehas been offered, all the opinions listened to, after everything has beenlisted for the final plan, the most talkative of all the experts is on the way backto the airport deciding what to tell the next client ... specialists have utteredtheir warnings, researchers have thrown doubt on the accuracy of the data,and the economic advisor, while voicing no views about the cash flow, knitshis brow and purses his lips about the cash flow situation ... the manageralone has to do something about it all. He or she is the person who has to getsomething done.
Reg Revans, The ABC of Action Learning (New Edition), Lemos and Crane, 1998.
Management Decision aims to publish research and reflection on the theory,practice, and techniques and context of decisions taken in and aboutbusiness and business research.
This journal is also available online at: Journal informationwww.emeraldinsight.com/md.htmTable of contentswww.emeraldinsight.com/0025-1747.htm
Online journal content available worldwideat www.emeraldinsight.comEmerald Group Publishing Limited60/62 Toller Lane, BradfordBD8 9BY, United KingdomTel +44 (0) 1274 777700Fax +44 (0) 1274 785200E-mail [email protected]
Regional offices:For North AmericaEmerald, 875 Massachusetts Avenue, 7th Floor,Cambridge, MA 02139, USATel Toll free +1 888 622 0075; Fax +1 617 354 6875E-mail [email protected] JapanEmerald, 3-22-7 Oowada, Ichikawa-shi, Chiba, 272-0025, JapanTel +81 47 393 7322; Fax +81 47 393 7323E-mail [email protected] IndiaEmerald, 135, 1st Vardhman Diamond Plaza, DeshBandhu Gupta Road, New Delhi – 110055, IndiaTel +91 11-42838038; Fax +91 11-42838038E-mail [email protected] Asia PacificEmerald, 7-2, 7th Floor, Menara KLH, Bandar Puchong Jaya, 47100 Puchong, Selangor, MalaysiaTel +60 3 8076 6009; Fax +60 3 8076 6007E-mail [email protected] ChinaEmerald, 7th Xueyuan Road, Haidian District, Room 508, Hongyu Building 100083, Beijing, ChinaTel +86 10 8230 6438E-mail [email protected]
Customer helpdesk:Tel +44 (0) 1274 785278; Fax +44 (0) 1274 785201; E-mail [email protected] www.emeraldinsight.com/customercharter
Orders, subscription and missing claims enquiries:E-mail [email protected] +44 (0) 1274 777700; Fax +44 (0) 1274 785201
Missing issue claims will be fulfilled if claimed within six months ofdate of despatch. Maximum of one claim per issue.
Reprints service:Tel +44 (0) 1274 785135E-mail [email protected] www.emeraldinsight.com/reprints
Permissions service:Tel +44 (0) 1274 785300E-mail [email protected] www.emeraldinsight.com/permissionsNo part of this journal may be reproduced, stored in a retrieval system, transmittedin any form or by any means electronic, mechanical, photocopying, recording orotherwise without either the prior written permission of the publisher or a licencepermitting restricted copying issued in the UK by The Copyright Licensing Agencyand in the USA by The Copyright Clearance Center. No responsibility is accepted forthe accuracy of information contained in the text, illustrations or advertisements.The opinions expressed in the articles are not necessarily those of the Editor or thepublisher.
Emerald is a trading name of Emerald Group PublishingLimited
Printed by Printhaus Group Ltd, Scirocco Close, Moulton Park, Northampton NN3 6HE
Awarded in recognition ofEmerald’s productiondepartment’s adherence toquality systems andprocesses when preparingscholarly journals for print
MD ii (Quarto).qxd 13/07/2007 09:14 Page 1

������ ���� ��� � ����� ������������������������������ ����
������ � ������ � �� �������������������������������� ����
�������������� � ������ ������������� ����� ������ ���������������������� ����
���������� ������� �������� ��������� ��� ���������� ����������� ������ ����
������ � �������������������������������������������������� ����
� � ���� ��� ���� �� ������� � !�� �����!"��� �� !����� �������# � �$$������ $� "������������ � �� !��� ��� "���� "�����#���������������������������� ���%
&�� '�� � ' "� ������ $� (���� � ��� ��!!�������� �����$�%� &��� ���������������������������������������������������� ���)
*� +��,+�� �� �� ��� ����� � ����� ����!�����-������� � '�������� �������������������������������������������� ����
� � ��"��� .������
������ ���� !����� ����� �� ��'��� �������� ����� ���� �� �� �� � �����
���� ���������
����� �������� �����
(/0&�0&+
!� �����" �� #�$" �����$ % "!�$ &���� ��� ��������� �"'
���1�"�� ���������1�"2����,��)�1��"
(� �� ��$ $����! ��� "!� ��� ����"��� )������ &����$ �)������ *��+���" ,"�� -���1�"�� ���������1�".
��� #�+� %����+ �"�"$ %� %��� ��"���$ % �!�" ��� ����$$ ������$/
������ ���� ��� � ��������� ���

&�� +�� �$��� � !� 3���� !����" �� ��� � ������������ ������# ������ $� !����� �� �$�%�� ����� �������������������������������������������������� ����
("! �� �� ������# ��� 44( � � � 5� ���66 7� ���$ 5� 8��9 !��� " � ����� �� $� ��� �� ��������!"���(������ "���� ���) ������� '���� �����)� ��������� "����� ���"�����) *�����) ������������������������������������������������ ����
&� �� $�" ��� ���� !# � �� ���� $ �� ����� 0'/ ���� ������� � !��� "� � ����� �����"�� �� ����� �� �����!��� �������'������ ���� ��� �%���� (��������������������������������������� �:��
&� �� ���� ���� �� ��! "��������� �� *��� !����� !%����� ������������������������������������������������ �::�
������ ���� !�����# �� � �� ��� ��� ��!� $��� !����" �� ���� �� � �� ����� ��-����# $ � #�� ������������������������������������������������ �:):
&�� ���!� �� �� ��� �"# ������ �� � !��,���!����� �������'����� ���) �%����# �������������������������������������������� �:��
(/0&�0&+���������

�� � ��������� � ��� ������� ��� ��� ���� ���� ������������� ����� � ��� �� ��� ������ ������� ���� ��������� ������� � ����� �� ����� �� ������ � ���� ������ ������ ������������
��� �� ������ �� ��� ��� ����� ��������� ���� ���� ������� ����� � ��� ������� ���� ���������� ����� ����������� � � �� ����� ����� ���� �� �������� � ���� ������ ��� ���� � ����� ��� !� ���������� �� ����� �� ���� "����� #�� ��������� ��������� ���� �������� ���� ��� ����� ����� � ��� ������������ � ������$� ���� �� %���� ��� �������� ������������������������ ��� �������������� � ������ �� ���� �������� � ������� �����������������
#�� ������ ��������"��� ����� ������ ����� ����� ������������ � ����� ���� ������ ������������ ��&��� ��������������� ��� ���"������ #�� �� �� ��� �������� � ������ ��� ��� � ����������� ����� ������ ��� ���� ������� ������������� ����� �� �������� ��� ! ���������� �� ������ ��� ���������
��� ��� ����� � ���� �� ���'��� ������� ������������� ���� ��� �& �� ����������� ��� � ��� ��� � � ��� ���� ���� ������������
!�� "���� �� �" ��� ��� ����� ��� ��� ����
#������� �� ����� �� ��$� �� �� �� ����� �" �� ����� ��������� ������� ��� � ��� ��� ������� �������� ����� ����������� �� ���� ���� ������ � ������ �� ����� ������ ������������� (�� ����� ����� ���� ������� ���������������� ��
%���� ��&���� ��� � � ���� ��� �� ����� ������ �� � ������� ��� ��� ���� ��������� � ��� ������ �� � ���� ��� ������ ����������� ��� ��� ����� �� ����� �� ������� ��� ������������
!�� ���������� ���� ������� ������� �� ���� ������ ����� �� � ������ ����� ���� � ������ ����� ��� ����� ��������� ������� ������ ���� ��� ����������� �� � �����
'�"� ���� ��$��)��� ���&� ���� � ������ ����� ������ � ������� �� ���� ��������� ������ ���� *�� �������� ��� ���& �� � ����� + �� � ������
����� �� � ���������� ���� � "���� ���&� � ����� ��� ������� ������ ������ ������ ��� ��� ��� ����� �� ������� ��������
(� ���� �� �&�� ���������� ������� ������� ������ �������� ���� ������������ �������� �� � ���� �� � ������� ������������ �������� �� ������
#������� ���������� � �� ��� � ���&������ ����� ������� � ����� �� ����� �� ��� � ������������ ��� ���� �� ���� ������ �����������,
)� � ���� ��� ��� ����������*�� ��� ����� ���� ������ ����������� ������ ��� ���� ��������� � )� � ������� ��� -���������� (������ �������.�������� )��� ��� �������� � ������� ��� ��� ����������� %��������� ����� ������ ��� ������ ���& ���������� ������� ��� ������ ������
����� ��� � �� ������ ������ ����� ��� � � &� �� � �� ��� � ����������� � � ������ ��� "����� �� ���� �� �� ��������� � ������� (���� ���������� ���� � �������������� ��� � ����� � ������� ��������������� ��
��� ��� '���� � *����������� ����� ���� ���� ��� � ������ �������� ����������� ���� ��� ��� ���& ��� ����� ��� �& ����������� ��� ���� ��� ��� .���� ������� �� ����� ��������� �� �������� � ������� ����������������������
*��� �" �������������� ����� � ��� ������ �� �������� ��� � ����� ���������� #�� �� �� ������� ����������� �� ��������� ���� �� ������� ������ �� � ������� ������������� ��� ���� ���� ����� � � ����� ���� ��� ������� /����� ��� ��� ���� ����� ��� ����� � ��������� �� ��� ������ ������ � ��������� ������ ������������,
�0�%#/�� �������� 1������� ��������� ������&�������
��������� 1"2�������������"� ���������
������������������
������ �������� #���� ������������� ����
#%-% (������������������ ��" ����� �
�����-��&������ �����
���*������������������
��� ��� *������ (���� �(�� ������ ������ ��� ������� ��� �����,�"���� ����� ����� �����������*� ������� ������������������� �� �� �� 344 567 89:4 :;<9:;(�+ 344 567 89:4 :;<968
�������������������=�����

������
����
������� � ��������� �� ��� �� ������ ����� ������ ��� � ! "���#�� $���������%����
��&'()&*$ *��&+(), -(*)�
��� �� ��� *��� ��� !��.���� �. + �� / ' #����0 +� ��� ���' #����0 �������� + #��� �. - �����*�������������� �"1 &���� � �. ' #����0� ' �20
��������� ������ �� ������ �. 3� ��0� !��.���� �. (����1������� -#�4�� � ���&5( !�0 #���0� '� �� � - ����� + #���� 3���
����� ����� �� �*��� ��� !��.���� �. ���2���� 6��4����0 �. (�����7 8�����
�� ��� �������!��.���� �. 9��2 (����1������ ��� ��� * ���� ����� �� + #��� �. - ������ )�&' 6��4����0� ��"� ���* �������
����� �� ���� ����������� �. �������� �7 �:� � +��� 6��4����0�6+*
��� ���� �;���.��� + #��� �. �������� ;��� .�� - �����!�.����� � ;���.���� 6<
������� � �������!��.���� �. ( �������� !�0 #���0� ��� #��� - �����+ #���� 6<
��������� ��� ��!� ��� " ���!��.����� ���� �� + #��� �. - ������ ���1�� 6��4����0�6+*
����� #��$ �����% &�' (�) ��� " ��� * ���������������� ��- ����� �*3' ;��� ���� 0 =*��� !� �.� >� *��� ����6��4����0 �. +� �# * �������
��� ����� ��� ���� ' #����0 ��� &���4����� ������� ;����6��4����0 �. ? ������� -���"��� * �������
����� �)���� �!��.���� �. �������� )������ �� @���.��� $���0+ #��� �. ������� ��� ' #����0� 6+*
�� ���% +�% ,��!��.���� / @������0 ;#��� �. ;�������4 +����0� + #����. �������� 6��4����0 �. +� *���7�� 6<
-�� ������3�� ���0 &����� �� ��"� ��� * �������
�������� ���� ����!��.����� +7���# + #��� �. � ����� �� @����2�� 3������
�� �� �����!��.���� �. 3���� � ':�� */� 6��4����0� 6+*
��������� -�)� � ����%� ��������� �. - ����� + �� �� 6��4����0 �. 3���� �&���0
��������� � �..� �� ������ �������� �. �������� ;#������ ;��� �. - ������6��4����0 �. ����� # ����� ����# ������ �#� 6+*
(����� � &� ��� ���" ��!*��� ��� !��.����� ! "�� *�������������5*���� @���#*�������������� 6��4����0 �. @�7���%9�� (A�# � !��� ;��0�@&� 6+*
/�����) �� ����@����� !�� !��.���� �. ������� ��#�� ��� +����� �������� �7 ,��2 6��4����0� 6+*
���% !� �� !��.����� 3���� !��� �� ���2���� �������� �. 9���+ �� ��� �������� (��� +��� 6��4����0� 6+*
������ �� !� ���� ���" ����� ��� +�� ;��� ����7� ���A� ;#���� ;��� + #��� �.- ������ 6+*
-�) !����� @�� +� + #��� �. ;���� � @�� <��
�� (� ��).����(#�� +��� 6��4����0� ;�� �" �� 6+*
���� ������� (� ���+���� � �������� &����������� ������0 3 ���9��#����� �;� 6+*
+�� � 0� (����6��4����0 �. ������ 3������
1����� (� ��!��.���� ����� �� <0��� 6��4����0� B����
�� ����� &�)� �(������������ ;��� ����� ��� *�4����� ��4�� $����� /*��� ����� * �������
/�����) -� &�������" ���!��.���� �. �������� *��� ��� ���� &�����������6��4����0 �. ���� �
!�� �� ���!��.���� �. ������� / ��-* ��� ���� !2��6��4����0� !���A� )� "�� �. ;#���
�� 2�3��� (� ����� �+#�� &����������� �:��������� / !��� ����� 6+*
4��� ,� ����%�!��.���� �. ���2��� / +����� �������� 9��7� 2- ����� + #���� 6��4����0 �. 9��7� 2� 6<
��'� 2���%�!������� ���� �� +0����� &� �� ��� *�C � � !��.�����<�� 6��4����0� 6+*
��%���� �� 2�3����*�������� !��.����� @��4��� - ����� + #���� -�������*� 6+*
� ���� 2�'���+ #��� .�� - ����� / )����� �4������� 6��4����0 �.9���� -����� 6<
���.� -����;���2 6��4����0� 9�� ���� �*� 6+*
/�����) -%�����" ���*��� ��� !��.����� +�� 9����� 3� �������� 3���7�@���0 3� -0�� B� + #��� �. - ������ +#������# 6��4����0�6+*
/� -���5� �� �0 @��� �������� �. ;����� ���� ��������+ #��� �. ;�4�� �������� '���# � 6��4����0� -�C���;#���
�)�� -� -������������ �. �������� �����# 6��4����0� ��"� ���* �������
����6���� -�� ������ ������� 6+*
7� +�.�� �������� �. +� ����0 ��� &����������� +� ���� 9�23���� 6��4����0� 9������ +���� 6+* ��� -���� :- ����� + #���� 3���
����� +�� �����!��.���� �. �������� ��� ��� �. )��� # ��� 3� ��0�4������� ;���.��� + #��� �. �������� ;���.���� 6<
��� 8����� �� �� ��3� ���� � � ������� 6��4������ ��4� � $��"���!��� ��
����� �� ��).� ����� * �� �� � D� #�� �����0
7 � /�����;#���� +���� !��.���� �. *����� 3���� ��� � ����� ���7 ,��2 6��4����0� 6+*
������� /���*"��� - ����� + #���� )�"�� ������ 6��4����0�*"���� 6<
2�� /���!��� ����� @��0 ������� ;����@��0%��%'#���� 6<� ����%����
2�%���� /���� ;���.��� + #��� �. �������� ;���.���� 6<

Foreword
Making trade work for the poorThe International Trade Centre (ITC) welcomes this new initiative with EmeraldPublishing that showcases new trends and cases where trade is working for the poor.
The springboard for this publication was the Executive Forum on National ExportStrategies, an event organised by ITC in September 2006, in cooperation with theGerman Ministry of Economic Cooperation. The event brought together business,government and NGO leaders to discuss the challenge of making trade work for thepoor. Many of the views reflected in this publication spring from the research, debatesand discussions at that event.
ITC enables small business export success in developing countries by providing –with partners – trade development solutions to the private sector, trade supportinstitutions and policymakers. As the agency of the United Nations and the WorldTrade Organization for business aspects of trade development, ITC puts povertyreduction through trade at the top of its agenda.
It could be argued that the moral challenge of the nineteenth century was endingslavery. In the twentieth century it was to establish democracy. Today in thetwenty-first century, our moral challenge is dealing with the disparity of wealth on thisabundant planet.
Although trade between countries is skyrocketing as globalisation makes its markon economies, the world’s 50 poorest countries have not shared in this growth. Evenwithin countries – developing as well as advanced – the gap between rich and poor isgrowing.
The gap between the haves and have-nots has been with us since ancient times, butup till now poverty reduction has been seen as a social issue and not part of the tradepolicy agenda. This needs to change. The opportunity to address this problem and thechallenge to close that gap have never been greater than today.
Tackling poverty will need to involve multiple players, including local governmentauthorities, non-governmental organisations (NGOs), communities, financialinstitutions, international organisations and the corporate world. Interventionsshould address the shaping and managing of community aspirations, improvingaccess, and tailoring local solutions. A one-size-fits-all approach will not work.
Working together to reduce poverty through trade is ITC’s central challenge. ITC’scomparative advantage is based on “making trade happen” with a focus on privatesector development and export competitiveness. Competitiveness and exportdevelopment are not ends in themselves. They are means of reducing poverty.
ITC is striving for a demonstrated effect on poverty alleviation. This means takinginto account the issues of youth empowerment, gender equality and environmentalconcerns. It means tapping into ethical trade markets and working more with corporatesocial responsibility programmes. It means encouraging regional integration. Ourpoverty reduction programme gives poor people the skills, information and access toprofitable global markets.
Foreword
1197
Management DecisionVol. 45 No. 8, 2007
pp. 1197-1198q Emerald Group Publishing Limited
0025-1747

The innovation, creativity, talent and resources to overcome poverty and meet themillennium development goals exist in developing countries. Building capacities totranslate their assets into products and services that can take advantage of global tradeopportunities will help developing countries to create more jobs and raise incomes. ITCworking with local and international partners helps the businesses in developingcountries to understand what is needed to compete and unlock their potential.
We will continue to champion innovative thinking on export strategies and bestpractices in export development during ITC’s flagship event, now called World ExportDevelopment Forum to be held in Montreux, Switzerland in October 2007.
Patricia R. FrancisExecutive Director, International Trade Centre
MD45,8
1198

Foreword
As the Director General of an international network of over 450 business schools and100 large companies across 75 countries, I see first-hand the issues facing managementand management education. It gives me great pleasure to add some words ofintroduction to this special issue of Management Decision – Alleviating PovertyThrough Trade.
At EFMD we are working with the UN Global Compact to address “how do we bestdevelop a new generation of business leaders who can successfully deal with globalchallenges” – the Global Responsibility Initiative. The interdependence betweencultures, continents, regions, nations, governments, businesses and other organisationsis becoming ever more apparent. The world is globalising. But many of us – bothindividually and organisationally – are ill equipped to deal with a truly globalbusiness environment. We believe that business leaders should embed globalresponsibility into their vision, goals and practice. “Global” because that is what ourworld, and the world in which business operates, increasingly is. “Responsible”because building a better world requires business leaders to commit to realengagement and take ownership of the consequence of their behaviour, not onlyeconomically, but socially and environmentally as well. It also requires a deep ethicalcommitment and a set of principles to guide leadership behaviour and actions.
The emerging generation needs guidance to maximise their potential as globallyresponsible leaders. This demands individual change and change within organisationsacross the globe to nurture and reward globally responsible leadership moreeffectively. It will necessitate a radical rethink within business schools and othercentres for leadership learning to develop the research agendas, curricula andpedagogy required to create globally responsible leadership.
EFMD and Emerald have worked closely together for the last five years and haveformed a strong and lasting bond that will continue long into the future, and I highlycommend the work of Emerald with this journal and with the many others theyproduce, that raise these critical issues and provide valuable frameworks for reflectingon how to translate the vision of globally responsible leadership into reality. Onlythrough dialogue, openness and long-term commitment with multiple stakeholders canwe hope to help, address and influence future generations. The academic communityhas an important role to play and we will continue to support the work of Emerald andput the development of globally responsible leadership at the forefront of our actions.
Eric CornuelDirector General, European Foundation for Management Development
Foreword
1199
Management DecisionVol. 45 No. 8, 2007
p. 1199q Emerald Group Publishing Limited
0025-1747

Editorial
Corporate social responsibility: making trade work for the poorBackgroundWhether the discussions are rooted in philosophical, legal, political or geopoliticalorigins (Capaldi, 2005), companies and communities alike are paying increasingattention to the idea of corporate social responsibility (CSR) (see, for example, Joneset al., 2007; McWilliams et al., 2006; Spar and La Mure, 2003). On both sides of theAtlantic, companies are seeking to integrate social and environmental concerns in theirbusiness operations investing more in their people, the environment and their relationswith stakeholders (for example, European Agency for Safety and Health at Work, 2004;European Commission, 2004; Kakabadse et al., 2005). This has led even to a re-thinkingof companies as relationship builders rather than just relationship managers (Losano,2005) and the redefinition of the corporation as “an organization engaged in mobilizingresources for productive uses in order to create wealth and other benefits (and notintentionally destroy wealth, increase risk, or cause harm) for its multiple constituents,or stakeholders” (Post et al., 2002, p. 17). Accordingly, organizational wealth isunderstood as “the summary measure of the capacity of an organization to createbenefits for any and all of its stakeholders over the long term” (Post et al., 2002, p. 45).
At the World Economic Forum in January 1999, Kofi Annan (2006), formerSecretary-General of the United Nations, challenged business leaders to join the GlobalCompact – an international initiative to promote responsible corporate citizenship sothat business can be part of the solution to the challenges of globalisation in the areasof human rights, labour, the environment and anti-corruption and create a moresustainable and inclusive global economy (United Nations, 2007). One of the more wellknown examples on the company side is Nike. Infamous through the 1990s for theThird World sweatshops of its overseas suppliers (see, for example, Locke, 2002; Sparand La Mure, 2003; Zadek, 2004), Nike is now acting on, and reporting on how it hasexercised, its corporate social responsibilities. In doing so, it has developed a globalcorporate responsibility strategy that includes improving working conditions in itscontract factories through “a holistic, integrated business approach to our supplychain” (Nike, 2007, p. 10). Now, Nike has been named No. 69 on the Fortune “100 BestCompanies to Work For” list (Fortune, 2007), moving up 31 places from 2006. Yet,despite the efforts of companies such as Nike and others, along with the work of the UNand EC, the plight of the world’s poor is no less stark.
In his Preface to the 2006 United Nations World Economic and Social Survey,Kofi Annan, observed:
Our world is richer than ever before, but it is also marked by enormous inequalities, bothwithin and between countries. The average annual income of someone living in the world’srichest country, Luxembourg, is more than one hundred times larger than that of the averagecitizen of Sierra Leone, one of the world’s poorest. Such big differences in living standardsshould be a matter of great concern, because they reflect serious inequalities in lifeopportunities. This calls for a robust policy response at both the national and internationallevels, so that all countries can achieve the Millennium Development Goals and other agreeddevelopment objectives.
MD45,8
1200
Management DecisionVol. 45 No. 8, 2007pp. 1200-1207q Emerald Group Publishing Limited0025-1747

As part of its response to this challenge, the International Trade Centre (ITC) (theInternational Trade Centre is the joint agency of the United Nations and the WorldTrade Organization for business aspects of trade development), held an ExecutiveForum on “Making Trade Work for the Poor”, in Berlin during September 2006.Emerald Group Publishing, in conjunction with ITC, decided to publish a special issueof Management Decision using selected papers from the 2006 Executive Forum,together with a limited number of papers submitted independently for consideration.The papers we have selected cover a quite proper discursive consideration ofalleviating poverty that is the purpose of this special edition. Taken together, they offersome frameworks for analysis, some lessons from history, a collection of case studiesand some thoughts about how to measure progress.
In the initial set of articles, we consider some of the big geo-political issues associatedwith socioeconomic development – the “great game” of Central Asia (Kidd, 2007) andSouth-South trade (Agatiello, 2007). We then look to Fourie (2007) for some lessons fromthe past to inform our current and future efforts. With this appreciation, of the contextswithin which we seek to alleviate poverty, Skae and Barclay (2007) provide a way offraming process. We move on to a series of case studies, as examples of what ishappening on the ground in terms of poverty alleviation – Caras Do Brasil (Faces ofBrazil) (Barin Cruz et al., 2007); a “grass roots” NGO using agricultural programs togenerate economic viability in developing countries (Duke and Long, 2007); and ananalysis of transaction costs in group microcredit in India (Shankar, 2007). Dwyer (2007)asks “how do we know if it’s working” and then proceeds to consider how we mightdetermine this. We conclude with Thierry’s (2007) identification of the “elephant in theroom” – the existing gender gap in trade strategy formulation that hinders tradeperformance – and a proposal for more coherent and effective programs that capitalizeon existing market structures and women’s entrepreneurial drive, with their moreeffective integration into the export value chain.
Geo-politics, socioeconomic developments and lessons from the pastIn coming to grips with the ways that we can indeed “make trade work for the poor”, itseems reasonable to start with the development of better understanding of how wearrived at this point in the first place and a better understanding of the dynamics thatappear to sustain the inequality. The first two articles in this collection consider thegeopolitics of Central Asia on the one hand (Kidd, 2007), and the place of South-Southtrade as an alternative to North-South trade (Agatiello, 2007) on the other.
Ross’ (2007) bibliography of “Central Asia”, prepared for the Muir S. FairchildResearch Information Center, appears to define Central Asia as constituted by five ofthe “stans” – Kazakhstan, Tajikistan, Turkmenistan, Kyrgyzstan, Uzbekistan.Diamond (1997) presented a sweeping 13-millennia historical argument as to whywestern European culture came to dominate, centred on “guns, germs and steel”.Central Asia was a regular subject of discussion regarding, for example, plant(Diamond, 1997, pp. 159, 167) and animal (Diamond, 1997, pp. 57, 142, 149)domestication, and the barbarian invasions of its pastoral roaming nomads.
“Central Asia” though, is a relatively young artefact, according to Kidd (2007). Heincludes Afghanistan in his definition and notes that Afghanistan especially of the“stans” has been the subject of “The Great Game” over the last several centuries, itsownership regularly passing from Tsarist Russia to the British Empire and back again,
Editorial
1201

until the arrival of more recent occupiers. While recognising the work of the variousagencies contributing to Central Asian redevelopment, such as EU-TRACEA, UNDP,CAREC, and the World Bank, Kidd (2007) argues that much could be achieved if therewas an effort to develop the regional transport infrastructure by implementing ultrahigh-speed Maglev rail systems across Central Asia.
At a recent workshop in Washington on how to achieve an orderly reduction in thelarge and unsustainable global imbalances in current account positions, 30 of the world’sleading experts presented analyses and evaluations of the requirements for such anadjustment (Ahearne et al., 2007). A series of individual country papers explored theunderlying factors behind surpluses and deficits and the scope for adjustment in thecurrent account, while a collection of multi-country simulation papers producedestimates of policy variable changes and corresponding exchange rate adjustments thatwould be consistent with scenarios for a reduction in current account imbalances. Theworkshop did not include a discussion of the North-South/South-South trade issues.
The significance of South-South trade is given by the fact that, from a time only twodecades ago, when developing country trade was viewed as the weakest of the worldtrade segments, trade flows between developing economies reached more than $1 trillionin 2003 (Agatiello, 2007). Much of this increase has been the result of regional preferentialtrade agreements (Commonwealth of Australia, 2004), arrangements which Agatiello(2007) notes, are inconsistent with the rules-based multilateralism, that is the first-bestchoice of mainstream economic theory. Agatiello (2007) goes on to argue thatSouth-South trade can indeed be an alternative to North-South trade, continuing to playan important role in developing country trade, especially in the Asian Pacific region. Atthe same time, he points out that, with the change of status of China and India away fromthat of “developing country”, a more multilateral approach may be necessary.
Some 2,500 years after Heraclitus observed that change is the only constant, we arecontinually bombarded by the view that all is change in the lot of humans and that weneed new solutions to new problems and new dynamics. Presumably, this would applytoo to making trade work for the poor. But are there any lessons we can learn fromprevious efforts to alleviate poverty? Fourie (2007) suggests that there are. In hisexamination of Black poverty in twenty-first century South Africa, Fourie (2007)maintains that, while the magnitude and severity is much greater than that of the whitepoverty at the start of the twentieth century (and has grown from somewhat differentroots), efforts to alleviate black poverty in South Africa can benefit from the insightsgained by an exploration of the responses to the earlier white poverty.
The keys to white poverty in the early 1900s were, according to Fourie (2007), a pooreducation system and conservative culture of the isolated farmer, fast urbanisation, theAnglo-Boer war and many severe droughts. While government labour and welfarepolicies contributed little to the long-term alleviation of white poverty, economicgrowth was the most important factor in eradicating white poverty (Fourie, 2007).Fourie (2007) argues that economic growth is still the key to combating poverty, alongwith improvements in education and property rights, creating numerous positiveexternalities. In his view, then, a government focus on policies that promote highereconomic growth and job creation is, as was the case for white poverty in thepost-1930s, the only solution to black poverty in South Africa today.
MD45,8
1202

Implementation: a framework for action and examplesDiscussions on the eradication of poverty often sound like discussions on leadership –everyone agrees we should have it, but no-one necessarily agrees on what it is or howwe should go about it. In their paper on managing the linkage between exportdevelopment and poverty reduction, Skae and Barclay (2007) seek to remedy thatsituation, by proffering a management framework through which the linkage betweenexports and poverty reduction can be better understood and strengthened. We thenmove to several specific examples, in the form of case studies from Brazil (Barin-Cruzet al., 2007), Malawi and Ethiopa (Duke and Long, 2007), and India (Shankar, 2007).
Having found that many strategies stop short of providing the sort of detailedaction steps that would result in a project’s objectives being effectively implementedand its impact being measured, Skae and Barclay (2007) use the International TradeCentre’s Priority Assessment Framework for Export Development to prepare ahypothetical strategy for the Rwandan coffee sector, as an exemplar of how theframework, which primarily addresses competitiveness issues, can be applied to thedesign and implementation of poverty reduction initiatives in the context of exportdevelopment. This framework, they maintain, can be used to guide nationalstrategy-makers, trade support organizations, sector associations, NGOs and the donorcommunity in formulating, implementing and evaluating trade-related povertyreduction strategies.
Inspired by the framework that incorporates the notion of sustainable developmentin business strategy, as proposed by Steurer et al. (2005), Barin Cruz et al. (2007)present the first of our three case studies, in their examination of the Caras do Brasil(Faces of Brazil) commercialisation programme run by the Pao de Acucar Group (thesecond largest supermarket chain in Brazil). Pao de Acucar brings to its shelvesproducts from various parts of Brazil that have been produced by groups andorganizations which promote social inclusion, preserve the environment, and findcreative alternative ways of generating income using sustainable methods ofproduction. These products include such items as banana flour, sweet preserves, jamsand honeys, candles, pots, baskets and boxes, and coffee, honey and sugar.
The paper proffers an example of programs that seek to develop commercialactivities in partnership with producers from poorer regions by way of seeking anequilibrium between the economic, social and environmental dimensions of societalactivity. Beyond demonstrating the straightforward success of the program though,Barin-Cruz et al. (2007) also show that, in this case at least, the pressure of stake holdersis predominantly related to social concerns rather than the environmental concernsthat drive the model presented by Steurer et al. (2005) and highlight the importance ofseparating transactional and interactional stakeholder views as a way of infusing theframework with a higher level of detail.
Duke and Long (2007) present Healing Hands International (HHI) as their exampleof a grass roots non-government organization (NGO) which has implemented aprogram to help impoverished communities in developing countries move out offamine and poverty and into self-sustenance and economic viability, using agriculturalprograms to generate economic viability. The HHI program starts with agriculturaltraining in “survival gardening”, leading on to small farm production, and then tolarger cooperatives. This type of program appears to be successful in Ethiopia andMalawi. In Malawi, for example, the program produces crops that are transformed into
Editorial
1203

meal supplements, which are traded internationally. Although in the early stages,where structured methods of evaluation are yet to be developed, Duke and Long (2007)suggest that programs like HHI appear to provide evidence of success that will aid inthe effort to solicit more financial support, and other organizations can use theirprogram as a benchmark for developing similar programs in other countries aroundthe world.
When the topic of using microcredit (the provision of very small loans toentrepreneurs who would not otherwise qualify for bank loans) is raised, mostattention tends to be focussed on Dr Muhammad Yunus, winner of the 2006 NobelPeace Prize, and his bank, Grameen (Wikipedia, 2007). Both have been criticised as wellas praised, by both ends of the political spectrum (Neff, 1996; Tucker, 2006). One areaof criticism, high interest rates on microcredit loans and the transaction costs thatcontribute to them, has been examined by Shankar (2007), with a view to being able todraw implications on how lending rates in micro-credit could be reduced in asustainable manner.
Shankar (2007) studied three established microfinance institutions in India todetermine the composition of transaction costs, and found that the key drivers of directtransaction costs are field worker compensation and the number of groups handled perfield worker, with collection activity as the single largest contributor. On the basis ofthe study findings, Shankar (2007) proposes that microfinance institutions can reducedirect transaction costs by increasing the number of groups per square kilometre, whileindirect costs can be reduced by minimising the number of layers of fixed costs andimplementing alternative revenue generating activities that can be undertaken withminimal incremental costs.
Evaluating successPublic trust of, and investment in, poverty reduction programs is a function, at least inpart, of the credible demonstration of the impacts of those programs, by way ofauthoritative performance reporting (Dwyer, 2007). As Skae and Barclay (2007) note intheir paper, however, many strategies stop short of providing the detailed action stepsthat would result in a project’s objectives being effectively implemented and its impactbeing measured. Dwyer (2007) seeks to identify some current best practices in this areaand suggest a model with potential indicators, which could be utilized to measureincremental results and impacts in relation to human development issues. He alsodiscusses ways of incorporating the stakeholder perspective into the performancemeasurement framework. He maintains that an understanding of performancemeasurement theory and stakeholder engagement process can enable business leadersto create practical performance measurement frameworks, which in turn will lead toenhanced reporting and accountability for poverty reduction impacts and results.
Futures of poverty reduction programs?The collection of papers to this point provides some particularly useful insights intothe nature of the poverty reduction problem and the context within which attempts todeal with it must operate, suggests some frameworks for action, together with somelessons from history, presents a series of case studies that can be taken as leads forsimilar initiatives, and promotes the importance of stakeholder driven evaluationprocesses as a basis for demonstrating the effectiveness of the programs so
MD45,8
1204

implemented. At the same time, concern has been expressed about the extent to whichpoverty reduction in particular and corporate social responsibility in general appear tohave developed according to a “white man’s agenda” (Marshall, 2007; Thierry, 2007).
Marshall (2007) argues that CSR is already gender patterned, with the leadership oforganization-based discourses and practices dominated by men, while women are seento be operating at the margins. She argues that these fundamental gender inequalitiesneed to be identified if ecological sustainability and global social justice are to beaddressed effectively. In the same way, Thierry (2007) identifies gender as the“elephant in the room” as far as trade strategies aimed at export-led poverty reductionare concerned. She concludes that the existing gender gap in trade strategy formulationwill hinder trade performance until pro-poor trade strategies engage more inclusivedecision making processes and the use of gender impact assessments. Thierry (2007)says that programs will be more coherent and effective if they capitalise on women’sentrepreneurial drive by integrating them into the export value chain.
Together, the papers in this special issue constitute a useful beginning point for theexploration of the role that corporations can play in sustainable futures for all of us. Inclosing, I pay a special word of tribute to my co-editor, Rocky Dwyer, who really is theinspiration behind this issue ofManagement Decision. Together, we hope that we havemade some small contribution towards making trade work for the poor.
David LamondDavid Lamond & Associates, Carlingford, Australia
References
Agatiello, O. (2007), “Is South-South trade the answer to alleviating poverty?”, ManagementDecision, Vol. 45 No. 8, pp. 1252-69.
Ahearne, A., Cline, W.R., Lee, K.T., Park, Y.C., Pisani-Ferry, J. and Williamson, J. (2007), GlobalImbalances: Time for Action,Policy, Washington, DC, Policy Brief Number PB07-4, availableat: www.petersoninstitute.org/publications/pb/pb07-4.pdf (accessed 30 May 2007).
Annan, K.A. (2006), “Preface”, United Nations, World Economic and Social Survey 2006:Diverging Growth and Development, United Nations, New York, NY, p. iii, available at:www.un.org/esa/policy/wess/wess2006files/preface.pdf (accessed on 10 December 2006).
Barin Cruz, L., Pedrozo, E.A., Quilici, R.B., Bacima, R. and Queiroz, B. (2007), “Company andsociety: the case of the ‘Caras Do Brasil’ (Faces of Brazil) program as leverage forsustainable development”, Management Decision, Vol. 45 No. 8, pp. 1297-1319.
Capaldi, N. (2005), “Corporate social responsibility and the bottom line”, International Journal ofSocial Economics, Vol. 32 No. 5, pp. 408-23.
Commonwealth of Australia (Department of Foreign Affairs and Trade) (2004), South-SouthTrade: Winning From Liberalization, Australian Government, Barton ACT, available at:www.dfat.gov.au/publications/south_south/south_south_trade.pdf
Diamond, J. (1997), Guns, Germs, and Steel: The Fates of Human Societies, WW Norton &Company, New York, NY.
Duke, A. and Long, C. (2007), “Trade from the ground up: a case study of a grass roots NGOusing agricultural programs to generate economic viability in developing countries”,Management Decision, Vol. 45 No. 8, pp. 1320-31.
Dwyer, R. (2007), “Alleviating poverty: how do we know the scope of the problem and when wehave solved it?”, Management Decision, Vol. 45 No. 8, pp. 1343-58.
Editorial
1205

European Agency for Safety and Health at Work (2004), Corporate Social Responsibility andSafety and Health at Work, Office for Official Publications of the European Communities,Luxembourg.
European Commission (Directorate-General for Employment and Social Affairs) (2004),Corporate Social Responsibility: National Public Policies in the European Union, Officefor Official Publications of the European Communities, Luxembourg.
Fortune Magazine (2007), “100 Best companies to work for”, Fortune Magazine, available at:http://money.cnn.com/magazines/fortune/bestcompanies/2007/index.html (accessed 1 June2007).
Fourie, J. (2007), “The South African poor White problem in the early twentieth century: lessonsfor poverty today”, Management Decision, Vol. 45 No. 8, pp. 1270-96.
Jones, P., Comfort, D. and Hillier, D. (2007), “Corporate social responsibility: a case study of thetop ten global retailers”, EuroMed Journal of Business, Vol. 2 No. 1, pp. 23-35.
Kakabadse, N.K., Rozuel, C. and Lee-Davies, L. (2005), “Corporate social responsibility andstakeholder approach: a conceptual review”, International Journal of Business Governanceand Ethics, Vol. 1 No. 4, pp. 277-302.
Kidd, J.B. (2007), “The Great Game evolves for Central Asia and opportunities beckon”,Management Decision, Vol. 45 No. 8, pp. 1224-51.
Locke, R.M. (2002), “The promise and perils of globalization: the case of Nike”, working paperMIT IPC-02-007, July, available at: http://web.mit.edu/ipc/publications/pdf/02-007.pdf(accessed 1 June 2007).
Losano, J.M. (2005), “Towards the relational corporation: from managing stakeholderrelationships to building stakeholder relationships (waiting for Copernicus)”, CorporateGovernance, Vol. 5 No. 2, pp. 60-77.
McWilliams, A., Siegel, D. and Wright, P.M. (2006), “Corporate social responsibility: strategicimplications”, Journal of Management Studies, Vol. 43 No. 1, pp. 1-18.
Marshall, J. (2007), “The gendering of leadership in corporate social responsibility”, Journal ofOrganizational Change Management, Vol. 20 No. 2, pp. 165-81.
Neff, G. (1996), “Microcredit, microresults”, Left Business Observer, Vol. 74, October, available at:www.leftbusinessobserver.com/Micro.html (accessed 3 June 2007).
Nike (2007), Innovate for a Better World: Nike FY05-06 Corporate Responsibility Report,available at: www.nike.com/nikebiz/nikeresponsibility/pdfs/color/Nike_FY05_06_CR_Report_C.pdf (accessed 1 June 2007).
Post, J.E., Preston, L.E. and Sachs, S. (2002), Redefining the Corporation – StakeholderManagement and Organizational Wealth, Stanford University Press, Stanford, CA.
Ross, J.P. (2007), Bibliography of “Central Asia”, prepared for the Muir S. Fairchild ResearchInformation Center, Cleveland, OH.
Shankar, S. (2007), “Transaction costs in group microcredit in India”, Management Decision,Vol. 45 No. 8, pp. 1331-42.
Skae, O. and Barclay, B. (2007), “Managing the linkage between export development and povertyreduction: an effective framework”, Management Decision, Vol. 45 No. 8, pp. 1208-23.
Spar, D.L. and La Mure, L.T. (2003), “The power of activism: assessing the impact of NGOs onglobal business”, California Management Review, Vol. 45 No. 3, pp. 78-101.
Steurer, R., Langer, M.E., Konrad, A. and Martinuzzi, A. (2005), “Corporations, stakeholders andsustainable development: a theoretical exploration of business-society relations”, Journalof Business Ethics, Vol. 61, pp. 263-81.
MD45,8
1206

Thierry, A.R. (2007), “The elephant in the room: gender and export-led poverty reduction”,Management Decision, Vol. 45 No. 8, pp. 1359-78.
Tucker, J. (2006), “Microcredit or macrowelfare: the myth of Grameen”, available at: www.mises.org/story/2375 (accessed 3 June 2007).
United Nations Global Compact Office (2007), What is the Global Compact?, UN Global Compact,New York, NY, available at: www.unglobalcompact.org/AboutTheGC/index.html(accessed 3 June 2007).
Wikipedia (2007), “Muhammad Yunus”, available at: http://en.wikipedia.org/wiki/Muhammad_Yunus (accessed 3 June 2007).
Zadek, S. (2004), “The path to corporate responsibility”, Harvard Business Review, Vol. 82 No. 12,pp. 125-32.
Further reading
Simpson, D. (2007), “Central Asia” (a bibliography with hyperlinks by the Air UniversityLibrary), April 2007, available at: www.au.af.mil/au/aul/bibs/casia.htm#geninfo (accessed30 May 2007).
About the authorProfessor David Lamond is Principal of David Lamond & Associates, Academic Advisor toEmerald Group Publishing, and Visiting Professor at Wuhan University. He earned his PhD inmanagerial psychology at Macquarie University. His research addresses topics including thehistory of management thought, personality and managerial style, organizational culture and jobsatisfaction. He is Editor of the Journal of Management History. David Lamond can be contactedat: [email protected]
Disclaimer
The opinions expressed in these articles are those of the author(s) and do notnecessarily represent those of the Editor, Publisher or those of the InternationalTrade Centre.
Editorial
1207

Managing the linkage betweenexport development and poverty
reductionAn effective framework
Frederick Owen Skaemodicum Competitiveness Services Ltd, Durban, South Africa, and
Brian Barclaymodicum Competitiveness Services Ltd, Vancouver, Canada
Abstract
Purpose – In the world’s quest to eradicate poverty, the means to get there are not fully understood,nor are they universally agreed upon. However, most would accept that the link between trade anddevelopment in general and exports and poverty reduction in particular needs to be strengthened andeffects better understood. The purpose of this paper is to suggest that a management framework existsby which the linkage between exports and poverty reduction can be better understood and as aconsequence strengthened.
Design/methodology/approach – Drawing on the International Trade Centre’s Priority SettingFramework to Export Development, a hypothetical strategy has been prepared for the Rwandan coffeesector, which reinforces the export development and poverty reduction linkage.
Findings – Many strategies stop short at providing detailed action steps that result in the project’sobjectives being effectively implemented and its impact being measured.
Practical implications – The framework can be used to guide national strategy-makers, tradesupport organizations, sector associations, NGOs and the donor community in formulating, and moreimportantly, implementing poverty reduction initiatives in the context of export development.
Originality/value – The paper draws upon a methodology applied in trade related technical assistanceand attempts to demonstrate this framework, which primarily addresses competitiveness issues can berigorously applied to the design and implementation of an export-led poverty reduction strategy.
Keywords Exports, Poverty, Competitive strategy
Paper type Conceptual paper
IntroductionDeveloping countries increasingly have to cope with a plethora of initiatives designedto increase their competitiveness, whilst concurrently responding to the nationaldevelopment agenda. Some of these strategies are concerned with private sectordevelopment, export development, investment promotion and poverty reduction toname but a few (refer to Figure 1). However, generally speaking, the track record ofimplementation of such strategies has so far been poor, despite donor support andassistance from institutions such as the World Bank and the International MonetaryFund (see Sachs, 2005, pp. 269-272).
Why isn’t it working?Let’s put the problem into context by taking just two of the above strategies, exportdevelopment and poverty reduction, and considering some of the key issues that needto be understood and addressed by national policy makers.
The current issue and full text archive of this journal is available at
www.emeraldinsight.com/0025-1747.htm
MD45,8
1208
Management DecisionVol. 45 No. 8, 2007pp. 1208-1223q Emerald Group Publishing Limited0025-1747DOI 10.1108/00251740710819005
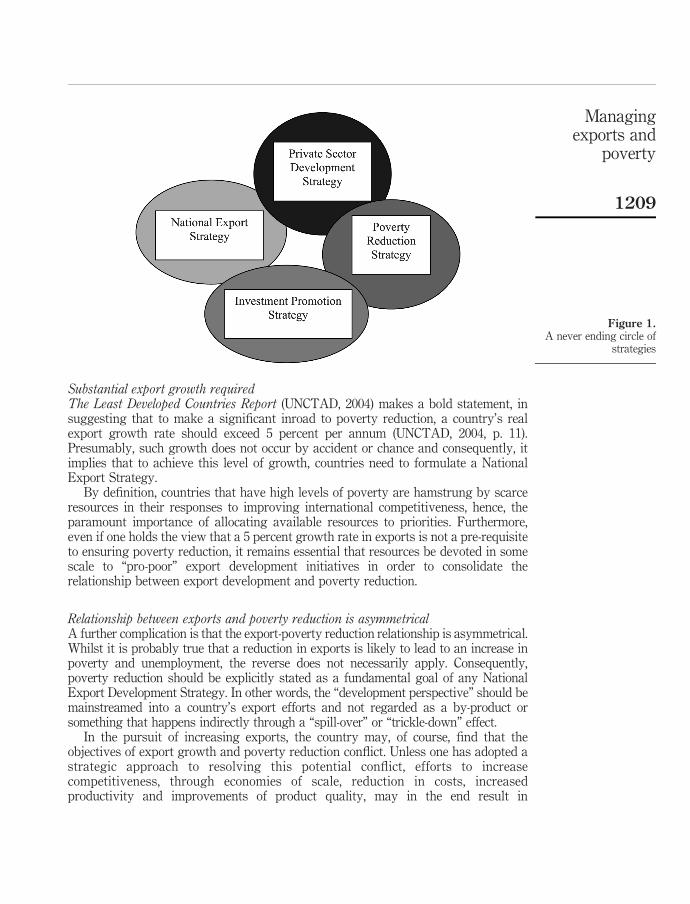
Substantial export growth requiredThe Least Developed Countries Report (UNCTAD, 2004) makes a bold statement, insuggesting that to make a significant inroad to poverty reduction, a country’s realexport growth rate should exceed 5 percent per annum (UNCTAD, 2004, p. 11).Presumably, such growth does not occur by accident or chance and consequently, itimplies that to achieve this level of growth, countries need to formulate a NationalExport Strategy.
By definition, countries that have high levels of poverty are hamstrung by scarceresources in their responses to improving international competitiveness, hence, theparamount importance of allocating available resources to priorities. Furthermore,even if one holds the view that a 5 percent growth rate in exports is not a pre-requisiteto ensuring poverty reduction, it remains essential that resources be devoted in somescale to “pro-poor” export development initiatives in order to consolidate therelationship between export development and poverty reduction.
Relationship between exports and poverty reduction is asymmetricalA further complication is that the export-poverty reduction relationship is asymmetrical.Whilst it is probably true that a reduction in exports is likely to lead to an increase inpoverty and unemployment, the reverse does not necessarily apply. Consequently,poverty reduction should be explicitly stated as a fundamental goal of any NationalExport Development Strategy. In other words, the “development perspective” should bemainstreamed into a country’s export efforts and not regarded as a by-product orsomething that happens indirectly through a “spill-over” or “trickle-down” effect.
In the pursuit of increasing exports, the country may, of course, find that theobjectives of export growth and poverty reduction conflict. Unless one has adopted astrategic approach to resolving this potential conflict, efforts to increasecompetitiveness, through economies of scale, reduction in costs, increasedproductivity and improvements of product quality, may in the end result in
Figure 1.A never ending circle of
strategies
Managingexports and
poverty
1209

unintended, negative consequences for poverty reduction. Certainly, in the absence of astrategic approach, the scope for pro-poor impact cannot be maximized.
Inadequate measurementThe key lies in maintaining an effective impact measurement system that incorporatesa range of measures to assess the reciprocal impact of export and poverty reductioninitiatives (see Nadvi and Barrientos, 2004, p. 29).
Top-down measures of impact are primarily quantitative, for example, GDP growthrate, employment level, balance of payments and annual export growth. Bottom-upmeasures of impact are, on the other hand, qualitative, pertaining to “well-being” or“empowerment” (see Barrientos, 2003, pp. 5-6). What is essential is that any impactmeasurement system, should include a combination of both top-down and bottom-upmeasures. This is obviously easier said than done.
In formulating the objectives around the Development Perspective of NationalExport Strategy, the national strategy-maker runs the risk of confronting the samecriticisms that have been levelled at the Millennium Development Goals, namely thatthe objectives and their macro-impact measures are too “top-down”. The weaknesswith a top-down orientation to impact measurement is that of attribution. For instance,how do quantitative measures reflecting national performance, confirm impact on thelivelihood of subsistence farmers? The challenge is translating these macro-measuresinto relevant indicators with which those stakeholders concerned first and foremostwith poverty reduction can identify.
A different problem confronts an impact assessment system that highlights“bottom-up” measures, namely aggregation. For instance, how can an NGO concernedwith “empowering” rural women to be involved in the export process confirm asubstantive, cost-effective and sustainable contribution to national export performance?
As Figure 2 shows, ultimately, the main problem encountered is one ofmisalignment between the top-down and bottom-up measures. “There are twopossible responses to this problem of misalignment. The first is to say that it isinevitable” (White, 2002, p. 13). As a consequence, institutions do not concernthemselves with linking bottom-up performance to impact on national objectives. The“second response is to resort to logic models. The bridge must be made betweenobserving satisfactory activities and presumed impact on development outcomes”(White, 2002, p. 13). Clearly, if one follows the first response, the misalignment willsimply be perpetuated. It stands to reason therefore, that the second response should bethe preferred option of the export strategy-maker concerned with poverty reduction.
Figure 2.Measuring the reciprocalimpact of exportdevelopment and povertyreduction
MD45,8
1210

Consequently, in measuring the linkage between exports and poverty reduction, thestrategy-maker must give recognition to both proving the impact (quantitativemeasures) and improving the relationship between initiatives and outcomes(qualitative measures). Further, one should avoid being too mechanistic and strict inmeasuring outcomes, but follow a logical methodology that incorporateslearning-by-doing practices (Nexus Associates, 2003, p. 6).
A practical approach to managing the linkageIn its approach to suggesting how a National Export Strategy be managed, theInternational Trade Centre has developed a priority setting framework shown inFigure 3 (Barclay and Skae, 2005).
This framework adopts a Balanced Scorecard Approach to export development andidentifies four perspectives, namely development, competitiveness, client andinstitutional, and a number of strategic considerations relevant to each perspective.For instance, the development perspective has one strategic consideration, the overalleconomic and social development of the nation. The competitiveness perspective hasthree, the client perspective has six and the institutional perspective has two.
In order to begin the process of setting priorities that the strategy will address, thestrategy-maker must ensure that the various stakeholders within each perspective willendorse and fully support, the strategy. The central question to be addressed from thestandpoint of the development perspective is, accordingly: To achieve the vision, howmust all key stakeholders (including civil society and the business community at large,taxpayers, politicians, government ministries, labour unions, NGOs and the donorcommunity) perceive its relevance to their specific concerns and priorities?
Once these questions have been answered, the strategy-maker can proceed toformulate the management framework, which will drive the implementation of theStrategy.
The starting point for this management exercise is the formulation of objectives foreach strategic consideration that has been accorded a high priority. For example, thefirst strategic consideration, namely the “Development Gear of Strategy” has fourpotential objectives, namely employment generation, poverty reduction, regional/ruraldevelopment and environmental sustainability. Measures, targets and initiatives arethen formulated to ensure achievement of the stated objectives, which are in line withthe country’s National Export Strategy priorities. The outline of the managementframework, is illustrated in Figure 4.
The underlying premise behind these “OMTIs” (Objectives, Measures, Targets andInitiatives) is that you can’t manage what you can’t measure and you can’t measurewhat you can’t describe (Kaplan and Norton, 2004, p. xiii). In short, the priorities to beaddressed must be described in the form of objectives, which are in turn measurableand target driven, thereby enabling the initiatives to be properly managed.
Make it a priority of the sectorsAs a National Export Strategy is ultimately the aggregate of the country’s product andservice sector-level strategies, it follows that the sectors themselves should formulatestrategies to directly link poverty reduction to their export efforts. This will go a long wayto addressing the problems of asymmetry, misalignment and inadequate measurement.
Managingexports and
poverty
1211

Figure 3.The International TradeCentre’s priority settingframework
MD45,8
1212

It also recognizes that circumstances may differ among sectors. To apply the sameapproach to the agricultural sector may not be workable in the mining sector.Conceptually, this is presented in Figure 5.
A national supervisory or monitoring agency, such as a National Export Council, isthen responsible for assessing, reporting and aggregating the efforts of the individualsectors. At the same time, the Council may wish to advise national, regional and localgovernment as to where priorities in terms of infrastructure spending, human capitaldevelopment and so on are required so as to maximise impact across the sectors.
Inherent in this approach is the recognition that the institutional frameworks forsetting priorities and managing strategy should be established in the context of afunctioning, and ongoing public private partnership (PPP).
The Rwandan coffee exampleBy way of illustration, a partially completed strategy management framework has beendeveloped to show how a sector can formulate an export strategy with the explicit goal ofpoverty reduction. It shows how the authors of this paper would facilitate acomprehensive strategy, using the International Trade Centre’s recommended approach.
Some of the underlying information around the Rwandan coffee example has beenobtained from a World Bank Policy Research Paper (Diop et al., 2005) and a progressreport to the International Coffee Council (CFC/ICO/22, 2005) and should be read inconjunction with this paper for completeness of understanding.
The poverty determinantsThe World Bank paper indicated the variables in Figure 6 as being key to escapingpoverty.
The Coffee Council’s progress report identified government bureaucracy, specificallyslow Government procurement procedures as one of the key impediments toimplementation of the project.
To initiate the process of strategy formulation, a session would be facilitatedincorporating representatives of relevant stakeholder groupings, such as Ministry ofAgriculture, sector association/s, farmer groupings and so on. A SWOT analysis oftenfulfils the need and allows preliminary responses to be articulated, which will thenform the basis of the priority setting framework. Once again, the key issue here is that
Figure 5.The aggregate of the
sectors
Figure 4.The management
framework
Managingexports and
poverty
1213

the public-private partnership approach should prevail. Some suggestions are shownin Figure 7. It must be noted that the list is not exhaustive.
Following on from the above analysis, the strategic response will then be “mapped”using the framework’s strategic considerations as shown in Figure 8. The figureoutlines the analytical structure and thought process to be followed in formulating acomprehensive strategy from which will flow the relevant objectives, measures, targetsand initiatives.
A suggested management frameworkUsing the International Trade Centre’s Priority setting framework[1], the vision,weighting of the perspectives and the supporting objectives, measures, targets andinitiatives (OMTIs) for each strategic consideration, are identified in Tables I-IV.
Vision: To create an internationally competitive coffee sector, that maximizes wealth creationopportunities for small-scale coffee producers and ensures maximum spread along keypoverty dimensions of income, capability and participation.
ConclusionThe above framework has attempted to identify that a comprehensive response isrequired to managing the linkage. By doing so, the strategy-maker can ensure that: thepoverty reduction efforts are properly addressed in the context of the national exportstrategy; the problems of attribution and aggregation are mitigated to maximizealignment with the objectives of poverty reduction; specific organizationalresponsibility can be assigned, milestones to completion confirmed and resources(money, people or programmes) allocated; and finally, that the impact of the initiativesare properly proved and evaluated, thereby leading to improvement.
Implications for practiceNevertheless, the challenges in adopting a comprehensive approach should not beunderestimated. Some of the more likely challenges to be encountered are:
. Composition and management of the formulating team: This is likely to be thebiggest obstacle to an effective outcome. It is essential that it comprise a requisitemix of stakeholders, but the reality is that one often encounters mistrust anddiffering motives for being involved in the process. For example, the privatesector is likely to have a significantly shorter, profit motive time frame, thepublic sector a development focus, long-term time frame. If the team is too small,it runs the risk of overload and if too large it is cumbersome.
. Time frame of formulation: In the authors’ experience, this process takes at leastsix months. Given the complexity of the challenge, it often requires senior public
Figure 6.How to escape poverty
MD45,8
1214

Figure 7.The key issues andpossible initiatives
Managingexports and
poverty
1215

Figure 8.The broad steps to settingpriorities and developing astrategic response
MD45,8
1216

Ob
ject
ive
Mea
sure
Tar
get
Init
iati
ve
Wei
gh
tin
g:
20p
erce
nt
Max
imiz
eth
eco
ffee
sect
or’s
Pro
pen
sity
scor
em
atch
ing
met
hod
Red
uce
Nat
ion
alP
over
tyH
ead
cou
nt
Iden
tify
geo
gra
ph
ical
area
sw
ith
con
trib
uti
onto
pov
erty
red
uct
ion
Inco
me
(e.g
.U
S$
per
day
)In
dex
by
aq
uar
ter
by
yea
r5
mos
tp
oten
tial
insh
ort-
term
(“lo
wb
yin
crea
sin
gp
rop
ensi
tyto
swit
chfr
omsu
bsi
sten
ceto
coff
eeP
arti
cip
atio
n(e
.g.
voi
cean
dre
pre
sen
tati
onb
yg
end
er,
age,
etc.
)R
edu
cep
over
tyg
apb
y15
per
cen
tb
yy
ear
5h
ang
ing
”co
ffee
cher
rysc
enar
io),
med
ium
-ter
mp
rosp
ects
(str
eng
then
pro
du
ctio
nC
apab
ilit
y(e
.g.
vol
um
eof
bu
sin
ess
tran
sact
ion
s)In
crea
seof
emp
loy
men
tb
y15
per
cen
tb
yen
dy
ear
2th
eb
ush
scen
ario
)an
dlo
ng
-ter
m(g
row
the
bu
shsc
enar
io)
Mid
dle
ran
ge
app
roac
hto
imp
act
asse
ssm
ent
des
ign
edan
dim
ple
men
ted
Table I.Development perspective
Managingexports and
poverty
1217

Ob
ject
ive
Mea
sure
Tar
get
Init
iati
ve
Wei
gh
tin
g:
35p
erce
nt
Bor
der
-in
gea
r:Capacity
development:
To
incr
ease
pro
du
ctiv
ity
and
pro
fita
bil
ity
ofex
isti
ng
crop
s
Inco
me
from
pro
du
ctio
nof
coff
eeIn
crea
seb
y25
per
cen
t,in
des
ign
ated
area
sb
yy
ear
2R
equ
isit
eh
igh
-qu
alit
yex
ten
sion
serv
ices
Hor
izon
tal
lin
kag
esan
dco
-op
erat
ives
tob
ees
tab
lish
edto
add
ress
econ
omie
sof
scal
eV
erti
cal
lin
kag
esp
rog
ram
me
tola
rge
ente
rpri
ses
tob
ees
tab
lish
edR
evis
ion
ofla
nd
law
toin
crea
sefe
asib
ilit
yof
larg
erla
nd
plo
ts
Capacity
diversification
:T
oin
crea
sep
rod
uct
ivit
yan
dp
rofi
tab
ilit
yth
rou
gh
the
pro
mot
ion
ofor
gan
icco
ffee
pro
du
ctio
nan
dot
her
pro
du
cts
To
max
imiz
esp
ill-
over
effe
ctb
yd
evel
opin
gin
ter-
sect
oral
lin
kag
eses
pec
iall
yec
o-to
uri
sm
Inco
me
from
pro
du
ctio
nof
org
anic
coff
eean
dre
late
dp
rod
uct
sN
um
ber
ofto
uri
sts
vis
itin
gsm
all-
scal
eco
ffee
farm
ers
Art
san
dcr
afts
pu
rch
ased
inco
ffee
gro
win
gar
eas
Incr
ease
by
25p
erce
nt,
ind
esig
nat
edar
eas
by
yea
r4
Incr
ease
by
50p
erce
nt
ind
esig
nat
edar
eas
by
yea
r2
Req
uis
ite
exte
nsi
onse
rvic
esL
ink
age
pro
gra
mm
eto
dev
elop
org
anic
pes
tici
des
(min
tan
dle
mon
bal
m),
and
fert
iliz
er(c
hic
ken
man
ure
,le
ftov
erco
ffee
cher
rysk
ins
and
ban
ana
leav
es)
Rw
and
anco
ffee
eco-
tou
rism
exp
erie
nce
inco
nju
nct
ion
wit
hm
inof
tou
rism
,hos
pit
alit
yan
dar
tsan
dcr
afts
sect
orHumancapitaldevelopment:
To
max
imiz
ete
chn
olog
yad
opti
onal
ong
the
req
uis
ite
mix
ofed
uca
tion
,g
end
eran
dag
ew
hil
stad
her
ing
tofa
irem
plo
ym
ent
and
hea
lth
and
safe
tyst
and
ard
s
Req
uis
ite
hea
lth
and
safe
tyst
and
ard
sF
air
emp
loy
men
tst
and
ard
sN
um
ber
ofw
oman
and
you
thon
dev
elop
men
tp
rog
ram
mes
for
coff
eese
ctor
Hea
lth
and
safe
tyst
and
ard
sag
reed
wit
hin
yea
r1
1,50
0p
erso
ns
by
end
yea
r2
Dev
elop
ale
arn
ing
by
doi
ng
pro
gra
mm
eto
opti
mis
ete
chn
olog
yad
opti
onM
axim
ize
lear
nin
gex
tern
alit
ies
thro
ug
hIn
tern
atio
nal
Cof
fee
Org
aniz
atio
n,N
GO
set
cH
ealt
han
dsa
fety
stan
dar
ds
char
ter
form
ula
ted
and
imp
lem
ente
dF
arm
erse
nsi
tisa
tion
pro
gra
mm
eon
fair
emp
loy
men
tp
ract
ices
(continued
)
Table II.Competitivenessperspective
MD45,8
1218

Ob
ject
ive
Mea
sure
Tar
get
Init
iati
ve
Bor
der
gea
r:Infrastructure
:T
op
rov
ide
nec
essa
ryru
ral
tran
spor
tin
fras
tru
ctu
re,
elec
tric
ity
,te
leco
mm
and
log
isti
cssu
pp
ort
ind
esig
nat
edar
eas
Tra
nsp
orta
tion
cost
sR
edu
ceb
y50
per
cen
tw
ith
in2
yea
rsP
aved
road
sto
suit
able
agro
-eco
log
ical
area
s
Proceduresanddocumentation
:T
ost
ream
lin
eg
over
nm
ent
pro
cure
men
tp
roce
du
res
tore
du
ceb
ure
aucr
acy
and
spee
du
pte
nd
erin
gp
roce
ssin
sup
por
tof
pro
ject
tech
nol
ogy
acq
uis
itio
n
Tim
eta
ken
Imp
rov
emen
tof
50p
erce
nt
wit
hin
six
mon
ths
Sec
tor
asso
ciat
ion
toen
gag
ek
eyg
over
nm
ent
dep
artm
ents
Transactionsupport:
To
dev
elop
smal
lsca
lefa
rmer
s’u
nd
erst
and
ing
ofse
ctor
mar
ket
ing
tran
sact
ion
fun
dam
enta
ls
Nu
mb
erof
farm
ers
trai
ned
/cou
nse
lled
/men
tore
d30
trai
ner
str
ain
edw
ith
six
mon
ths
1,50
0fa
rmer
sb
yen
dY
ear
2
Sec
tor
asso
ciat
ion
tod
evel
opa
“how
to”
man
ual
wit
hsu
pp
orti
ng
trai
nin
gan
dad
vis
ory
pro
gra
mm
esT
rain
the
trai
ner
sp
rog
ram
me
esta
bli
shed
Bor
der
-ou
tg
ear:
Marketaccess:
To
imp
rov
eac
cess
top
rior
ity
mar
ket
sfo
rw
ash
edco
ffee
Nu
mb
erof
bu
yer
sw
ho
pre
scri
be
tofa
irtr
ade
bu
yin
gp
ract
ices
wh
oh
ave
vis
ited
Rw
and
a
100
com
pan
ies
by
end
Yea
r1
Est
abli
shex
tern
alli
nk
ages
wit
hg
lob
alb
uy
ers
ind
esig
nat
edm
ark
ets
Iden
tify
fair
trad
eb
uy
ers
Min
istr
yof
Tra
de
ton
egot
iate
bes
tp
ossi
ble
acce
ssin
reg
ion
In-m
arket
businesssupport:
To
pro
vid
eco
ffee
sect
orw
ith
afu
ll-s
erv
ice
adv
isor
yan
dsu
pp
ort
pro
gra
mm
ein
pri
nci
pal
reg
ion
alan
din
tern
atio
nal
mar
ket
s
Nu
mb
erof
faci
lita
ted
trad
em
issi
ons
and
fore
ign
fair
sat
ten
ded
Nu
mb
erof
ord
eren
qu
irie
sd
irec
ted
from
trad
ere
pre
sen
tati
ves
abro
ad
Fiv
em
issi
ons
and
fiv
etr
ade
fair
sin
yea
r1
Incr
ease
inor
der
enq
uir
ies
of30
per
cen
t
Tra
inco
mm
erci
alat
tach
es
Image
andbranding:
To
crea
tea
fav
oura
ble
imag
ean
dre
cog
niz
edb
ran
dfo
rR
wan
dan
coff
ee
Bra
nd
reco
gn
itio
nin
dex
Imp
rov
emen
tof
25p
erce
nt
by
end
Yea
r2
Rw
and
anco
ffee
pro
mot
ion
stra
teg
yd
evel
oped
Table II.
Managingexports and
poverty
1219

Ob
ject
ive
Mea
sure
Tar
get
Init
iati
ve
Wei
gh
tin
g25
per
cen
tCom
petency
:T
oen
sure
max
imu
mb
usi
nes
sco
mp
eten
cyam
ong
stsm
all-
scal
ese
ctor
Nu
mb
erof
bu
sin
ess
pro
gra
mm
eses
tab
lish
edN
um
ber
offa
rmer
sb
ein
gtr
ain
ed
On
ep
rog
ram
me
for
each
SM
Eca
teg
ory
(bas
ic,
inte
rmed
iate
,ad
van
ced
)b
yen
dof
yea
r1
500
by
end
ofy
ear
1.5
and
1,20
0b
yen
dY
3
Un
der
tak
ea
nee
ds
asse
ssm
ent
ofM
icro
and
Sm
all
En
terp
rise
san
dta
ilor
pro
gra
mm
esap
pro
pri
atel
y,
e.g
.(S
tart
ing
you
rb
usi
nes
s,H
owto
cost
and
pri
cean
dy
our
pro
du
cts,
pre
par
ea
bu
dg
et,H
owto
exp
ort
etc)
Tra
inth
eb
usi
nes
str
ain
ers
inp
over
tyal
lev
iati
ond
yn
amic
sT
rain
dev
elop
men
tag
enci
esin
exp
ort
fun
dam
enta
ls
Inform
ation
:T
op
rov
ide
smal
lsc
ale
farm
ers
wit
hre
lev
ant
trad
ein
form
atio
naf
fect
ing
the
coff
eese
ctor
Nu
mb
erof
smal
lsc
ale
farm
ers
onth
e“f
orm
al”
and
“in
form
al”
com
mu
nic
atio
ns
net
wor
k
All
farm
ers
ind
esig
nat
edar
eam
ade
awar
eof
foru
mw
ith
insi
xm
onth
sA
ver
age
60p
erce
nt
atte
nd
ance
atq
uar
terl
ym
eeti
ng
s
Info
rmat
ion
shar
ing
and
exch
ang
efo
rum
esta
bli
shed
ind
esig
nat
edar
eas
for
farm
ers,
e.g
.pri
ces,
succ
ess
stor
ies
and
fail
ure
s
Financial:
To
ensu
reef
fect
ive
pro
vis
ion
ofcr
edit
tosm
all
scal
efa
rmer
sat
affo
rdab
leco
st
Nu
mb
erof
bu
sin
ess
pla
ns
pre
sen
ted
Nu
mb
erof
smal
lsc
ale
farm
ers
wh
oh
ave
neg
otia
ted
fin
ance
faci
liti
esE
xte
nt
ofd
efau
lt
30p
erce
nt
ofsm
all-
scal
efa
rmer
sin
des
ign
ated
area
sto
hav
eco
mp
lete
db
usi
nes
sp
lan
sb
yen
dof
yea
r1
Fin
ance
pro
vis
ion
scal
eat
70p
erce
nt
ofsu
bm
issi
ons
Def
ault
tob
em
anag
edd
own
tole
ssth
an5
per
cen
t
Mat
chin
gg
ran
tsc
hem
esL
arg
e-sc
ale
ente
rpri
ses
tofa
cili
tate
qu
ick
pay
men
tsan
das
sist
wit
hp
rov
isio
nof
wor
kin
gca
pit
al(e
.g.
pro
vid
ein
pu
ts)
Ban
kin
gse
ctor
sen
siti
sati
onp
rog
ram
me
Wom
enon
lyfi
nan
cin
gsc
hem
es
Quality:
To
ensu
ren
eces
sary
qu
alit
yco
nfo
rman
ceto
ach
iev
ing
was
hed
stra
teg
y
Was
hed
cher
ries
reje
ctra
teet
cT
om
eet
bu
yer
con
form
ance
stan
dar
ds
Com
pre
hen
siv
ev
alu
ech
ain
asse
ssm
ent
Table III.Client perspective
MD45,8
1220

Ob
ject
ive
Mea
sure
Tar
get
Init
iati
ve
Wei
gh
tin
g20
per
cen
tStrategy
supportnetwork(SSN):
To
ensu
reth
atth
eco
un
try
’sS
SN
giv
esre
qu
isit
ep
rior
ity
top
over
tyal
lev
iati
onin
its
exp
ort
dev
elop
men
tef
fort
s
Nu
mb
erof
pov
erty
rela
ted
issu
eson
the
agen
da
ofea
chN
atio
nal
Ex
por
tC
oun
cil
mee
tin
gN
um
ber
ofw
ork
ing
pap
ers
and
rese
arch
stu
die
su
nd
erta
ken
toan
aly
seef
fect
and
rep
orte
dto
Nat
ion
alE
xp
ort
Cou
nci
l(N
EC
)an
dse
ctor
asso
ciat
ion
Sec
tor
stra
teg
yto
inco
rpor
ate
pov
erty
alle
via
tion
stra
teg
yan
dre
por
tto
NE
Con
reso
urc
ere
qu
irem
ents
wit
hin
six
mon
ths
Key
min
istr
ies
toh
ave
fin
alis
edb
ud
get
sin
six
mon
ths
Nat
ion
alE
xp
ort
Cou
nci
l“P
over
tyR
edu
ctio
nan
dE
xp
ort
Dev
elop
men
t”ta
skte
ames
tab
lish
edan
dch
ann
els
ofco
mm
un
icat
ion
tose
ctor
ses
tab
lish
edP
over
tyre
du
ctio
nfo
cus
tob
em
ain
stre
amed
into
Nat
ion
alE
xp
ort
Str
ateg
yC
offe
eIn
du
stry
Sta
keh
old
erfo
rum
esta
bli
shed
wit
hV
oice
from
Sm
all-
Sca
leS
ecto
r,m
arg
inal
ized
area
san
dg
end
erb
ased
org
aniz
atio
ns
and
rep
rese
nte
don
Ind
ust
ryS
ecto
rA
ssoc
iati
on
Servicesdeliverynetwork(SDN):
To
ensu
reth
atth
eS
DN
has
req
uis
ite
skil
lsto
assi
stin
stre
ng
then
ing
cap
acit
yin
smal
lsc
ale
and
mar
gin
aliz
edar
eas
Nu
mb
erof
NG
Os
wh
oh
ave
anin
tere
stin
faci
lita
tin
gtr
ade
for
pov
erty
red
uct
ion
reg
iste
red
wit
hN
EC
Nu
mb
erof
com
mer
cial
ven
ture
sw
illi
ng
top
arti
cip
ate
inp
over
tyal
lev
iati
onan
dtr
ade
assi
stan
cep
rog
ram
mes
All
iden
tifi
edw
ith
insi
xm
onth
sT
wo
from
each
ofth
eex
por
tcy
cle
chai
n,
e.g
.cl
eari
ng
and
forw
ard
ing
Col
lab
orat
ion
onb
est
pra
ctic
e
Table IV.Institutional perspective
Managingexports and
poverty
1221

and private sector individuals to give of their time, which many of them canill-afford. This confirms the importance of obtaining “buy-in”, commitment andadhering to the pre-agreed timeframe so they are there for the duration of theexercise. If participants “come and go”, then continuity is lost.
. Access to quality information: Often decisions have to be made on the basis ofpoor quality of information (up to date standards), misinformation (extent ofgovernment initiatives) and even no information (market data). It confirms theneed to have a core team of both public and private sector participants. Thepublic sector cannot make decisions on behalf of the private sector andvice-versa. Having a comprehensive team, enhances the likelihood thatinformation will be made available and shared in the domestic context. Wherethere are gaps, all the participants can agree the method to resolve these.
. Managing the expectations of the disadvantaged communities: Once they are underthe spotlight, the request for assistance, resources and a timeframe may beunrealistic. It is essential therefore, that the strategy formulation andimplementation process build in a proper communication and feedback mechanism.
. Putting together an action plan: To ensure that the strategy has maximumchance of being implemented, milestones, accountable organizations andnecessary resources will still need to be identified. The latter is often the singlelargest challenge. Many strategies founder simply due to a lack of resources. It isimportant to note that resources do not always have to be stated in monetaryterms. Some creative thinking around piggybacking other programmes,re-allocating people and assets may be required. However, a good plan thatdemonstrates clear prioritisation, a measurable time frame and requisiteresources will always succeed in obtaining resources ahead of an ill-conceivedplan. This, ultimately, is the challenge facing the strategy-maker.
It may sound like a contradiction, but the short message is to keep the managementframework simple in terms of the objectives, measures, targets and initiatives beingstated. This is particularly important in ensuring “buy-in” by a diverse group ofstakeholders, none of whom will be able to achieve the ultimate objective of exportdevelopment leading to poverty reduction by themselves.
Implications for researchThe world is yet to derive the answers for eradicating poverty. Certainly, empiricalresearch, which answers some of the practice implications highlighted above, areessential and long overdue. Other implications for research include:
. Better understanding of the broadened definition of poverty to include bothquantitative as well as qualitative measures and effective ways to measure theiroutcomes.
. Can a sector level strategy, which focuses on export led poverty reduction as itsmain objective, be sustainable over the long term?
. Can sector level strategies be pursued independently of national competitivedynamics (i.e. competitive issues which affect all sectors)? This aspect essentiallyattempts to address the age- old debate as to whether strategy is in fact atop-down or bottom-up approach?
MD45,8
1222

Note
1. Whilst the authors have based some of the framework on desk research relevant to Rwanda,it must be noted that some of OMTI’s are hypothetical and have been formulated asillustrative points only. No discussion with or verification has been sought from the WorldBank or Rwandan coffee sector.
References
Barclay, B. and Skae, F.O. (2005), Managing Strategy, Innovations in Export Strategy, InternationalTrade Centre, Executive Forum Discussion Paper, Geneva.
Barrientos, S. (2003), “Labour impact assessment: challenges and opportunities of a learningapproach”, paper presented at the EDIAIS Conference, University of Manchester, Manchester.
CFC/ICO/22 (2005), “Improving coffee quality in East and Central Africa through enhancedprocessing practices (Rwanda and Ethiopia)”, Project Progress Report January to June2005, Submitted by CAB International – Africa Regional Centre Nairobi, InternationalCoffee Council, 94th Session, 27-29 September, London.
Diop, N., Brenton, P. and Asarkaya, Y. (2005), Trade Costs, Export Development and Poverty inRwanda, World Bank Policy Research Working Paper 3784.
Kaplan, R.S. and Norton, D.P. (2004), Strategy Maps, Harvard Business School Press, Boston, MA.
Nadvi, K. and Barrientos, S. (2004), Industrial Clusters and Poverty Reduction Towards aMethodology for Poverty and Social Impact Assessment of Cluster Development Initiatives,United Nations Industrial Development Organization, Vienna.
Nexus Associates, Inc. (2003), Assessing the Poverty Impact of Small Enterprise Initiatives,Working Group for Impact Measurement and Performance Committee of Donor Agenciesfor Small Enterprise Development, Washington, DC.
Sachs, J.D. (2005), The End of Poverty. How We Can Make It Happen In Our Lifetime, PenguinBooks, London.
UNCTAD (2004), The Least Developed Countries Report 2004, overview by the Secretary-Generalof UNCTAD, United Nations, New York, NY and Geneva, pg 11.
White, H. (2002), Using the Millennium Development Goals as a basis for Agency-Level PerformanceMeasurement, Institute of Development Studies, University of Sussex, Brighton.
About the authorsFrederick Owen Skae, MCom, MBA is the Managing Member of modicum consultants cc inDurban, South Africa. He is a strategy specialist focusing on national and sectoralcompetitiveness and has extensive experience in helping countries formulate National ExportStrategies, using the International Trade Centre’s methodology. He has worked in a number ofcountries in Africa and South Asia. He was formerly an Associate Professor in ManagementAccounting and Finance at the University of Kwazulu-Natal, South Africa. Frederick Owen Skaeis the corresponding author and can be contacted at: [email protected]
Brian Barclay, BA, MBA is a Director of modicum Strategy Consulting Inc, in VancouverCanada. He specializes in assisting public and private sector organizations in developing andtransition economies, design and manage strategies in competitiveness and exportdiversification. He was formerly the Co-ordinator of the International Trade Centre’sExecutive Forum on National Export Strategy. modicum Competitiveness Services Ltd. ispioneering the concept of poverty-sensitive value chains.
The International Trade Centre is the joint agency of the United Nations and the World TradeOrganization for business aspects of trade development.
Managingexports and
poverty
1223
To purchase reprints of this article please e-mail: [email protected] visit our web site for further details: www.emeraldinsight.com/reprints

The Great Game evolves forCentral Asia and opportunities
beckonJohn Kidd
Aston Business School, Birmingham, UK
Abstract
Purpose – The purpose of this paper is to look to new opportunities that may be available to thenations comprising Central Asia. The region has recovered only slowly since the fall of the SovietUnion in 1991.
Design/methodology/approach – Based on secondary data from reports by the UN, ADB andother NGOs, academic papers and the press, a quasi-mathematical equation is used to illustrate howinfrastructure development is dependant on many factors. From this analysis the importance of thetransportation sector for future growth is discerned. Historical detractors are noted and drivers for thefuture are discussed.
Findings – The paper finds that Central Asia’s future growth and prosperity would be based on arobust redevelopment of all its infrastructures but primarily on the implementation of Maglev highspeed rail systems to move freight quickly internally and for Eurasian transit.
Practical implications – Well-integrated transport infrastructures enhance local wellbeing. Theinterconnectedness and interdependence of globalised economies depend on transport, but otheraspects of the total infrastructure local and regional must be integrated to achieve growth. In the caseof Central Asia it is seen that an accord between the Presidents is needed to ensure regionalcooperation, which will lead to Eurasian cooperation.
Originality/value – The region has been forgotten, to some extent, by the global community, yet ithas great potential to become again an important transportation hub between Europe and Asia. Thevalue of the paper is in noting the push of many NGOs towards regional integration, which may bebest approached, we suggest, from an initial investment in its transportation infrastructure.
Keywords Central Asia, Transportation, Economic development, Developing countries
Paper type Research paper
IntroductionThis paper will, as an introduction, review some of the history of Central Asia, itscentrality as a transport hub or meeting place between East and West; the politicalpressures brought to bear on the nations over the previous two centuries; and recenteconomic developments. We will note also the continuance of the overbearing politicsin the region, and the suppression of its people, which leads onto a view of the“wellbeing” of a country. For this, we will consider the interactions of seven indicatorsand how, through the guidance of different NGOs, the region may begin to prosper.Finally, we will suggest that the region might aim to become, once more, a transporthub between the East and West, even North and South, which will benefit its ownresources exploitation and wealth generation and place it as an important cog in theEuropean – Asian trade processes.
We will focus on a “Central Asia” that is extensive, see Figure 1. Originally, thisname was associated only with the countries that were former Soviet SocialistRepublics (SSRs) namely Kazakhstan, Kyrgyzstan, Tajikistan, Uzbekistan,
The current issue and full text archive of this journal is available at
www.emeraldinsight.com/0025-1747.htm
MD45,8
1224
Management DecisionVol. 45 No. 8, 2007pp. 1224-1251q Emerald Group Publishing Limited0025-1747DOI 10.1108/00251740710819014

Turkmenistan (to the east of the Caspian Sea) together perhaps with Azerbaijan,Armenia and Georgia (to the west of the Caspian Sea). However, since 1997, the CentralAsian Regional Economic Community (CAREC) programme redefined “Central Asia”for their purposes as the former SSRs east of the Caspian Sea (but only the Southernregion of Kazakhstan) but they do not include the Caucasian states. In addition, theyincorporate the Western Chinese province of Xinjiang, part of Mongolia, and parts alsoof Iran and Afghanistan. Essentially, these represent the historic Turkic speakingregions. This paper will consider Central Asia broadly to be the large swath of landrunning from the Black Sea to the eastern edge of Mongolia – truly a Central Asia –but most often we will discuss the CAREC region.
Ancient geo-morphologyCentral Asia is hard to define as geo-physics, human migration, geo-politics and thedecision making of the last 200 years have defined and re-defined borders. We willassume a land mass for the purposes of this paper that reaches from the eastern edgesof Mongolia, including the western Chinese province of Xinjiang, to the Black Sea andmodern Turkey; and south to include a little of Northern Iran and NorthernAfghanistan. To the North we simply note the presence of the Russian Federation withits vast reach from Europe to the Pacific Coast of Siberia. This definition is far broaderthan “the Caucuses” and it encompasses more than the states within the CARECprogramme (Central Asia Regional Economic Co-operation) set up in 1997.
The distinct structures of these lands were formed about 600,000 years ago whenthe last of the major global tectonic activities created the Himalayas and the othermountainous regions of the area. Much earlier, mankind had developed in Africa andhad diffused into Europe and Indo-China only to be almost wiped out by a massivevolcanic eruption in Sumatra, though others may point to a possible meteorite strike in
Figure 1.A “greater” Central Asia
The Great Gameevolves for
Central Asia
1225

the Bay of Mexico. Whatever the cause, global temperatures fell rapidly wiping outmany species. After the world recovered from this disaster humans once again fannedout from Africa and many colonized the “Fertile Crescent” stretching from Egypt, northto the mountains of the Caucuses thence east along the Tigris and Euphrates rivers to thePersian Gulf. These settlers dominated the earlier nomadic peoples, and once they hadmigrated again into Europe and Indo-China overcame the earlier surviving Neanderthalpopulations, gradually developing into the modern peoples, as we now know them.However, the Central Asia region was, and still is, a difficult land in which to survive,mainly because it is a land of extremes – it is far from moderating influences of a sea soit suffers large temperature variations from summer to winter, it is arid, and in manyplaces has deserts. The tectonic plate crash of India as it floated into the Eurasian massensured that central Asia has high mountain ranges and high plateau, which even todayare a little unstable, with their stress being relieved by many earthquakes.
Nevertheless, the valleys of central Asia were farmed, and became the outpost regionsof the dominate powers of Europe and the Middle East, and its regional cities becamefrontier posts in the trade with China and India. Silk and jade flowed to the West, whilegold, amber and horses flowed to the east. In fact Eurasian trade had became wellestablished along the “flat” routes of the steppes of Russia between the Mongols of theFar East and the Celts of the west from 5000 BC onwards. It is also well accepted that thedevelopment of ancient China was accelerated by the inward diffusion of “European”technologies of horses, wagons and archers from about 800 BC even though horses hadbeen domesticated much earlier by the Mongols (Renfrew, 1973).
Originally, the region supported various ethic groups who lived and traded withinand between its nations. To do this they climbed high passes and crossed cold elevatedplateau and inhospitable desserts. As well as exchanging artefacts many great ideasmay have diffused between Eastern and Western civilizations by way of the Silk Road.These are actually a network of roads, rather than a single byway, and the severe terrainof Central Asia articulates routes that are physically daunting, even today. From East toWest, the region stretches 6,000 kilometres (from Eastern Mongolia to Armenia), andoccupies a land area greater than Europe. The salient geographic characteristic of theregion is its remoteness – the countries in the region are all landlocked, and some statesare doubly landlocked. The capital city of the Western Chinese province of Xinjiang(Urumqi) is further from a seaport than any other large city in the World.
The Great Game(s)Russia, once a vast land, saw its lands scattered through poor management and strife.But from the early 1800s it reacquired the states bordering the Baltic Sea, theCaucasian states, and the “Central European” states east of the Caspian Sea, togetherwith Mongolia and part of Xingjian. Many of these States were liberated after the lastWorld War, annexed again, and finally liberated after the fall of the Soviet Union in1991. However, for a period of 200 years or so the population of Central Asia has livedin terror and in fear of the rulers in Moscow.
The region we have defined as Central Asia was the subject of “The Great Game”.The states therein, especially Afghanistan, were like ping-pong balls passing fromownership by the Tsarist Russia Empire to the British Empire and back again. Thediscussions and frequent local invasions during the nineteenth century continued into
MD45,8
1226

the twentieth century, and indeed even today the games apparently continue, withoutmuch concern for the indigenous peoples.
Alfred Mahan (1905), the father of US geostrategy, outlined the geostrategicdivisions of Eurasia in his 1905 publication The Problem of Asia and its Effect UponInternational Policies. He divided Asia into three parts:
(1) Russian dominated land to the north of the 40th parallel;
(2) British dominated lands to the south of the 30th parallel; and
(3) the Debated and Debatable zone located between the 30th and 40th parallels ofthe Asian continent.
Within this vast third zone lie significant parts of Central Asia, including sections ofwhat are now Tibet, Xinjiang, Kashmir, Pakistan, Afghanistan, Uzbekistan,Turkmenistan, Tajikistan, Iran, and the Caucasus.
Mahan believed that the clash between the Russian land power from the North, pushing downtowards warm water ports, and the opposing coalition of sea powers pushing upward fromthe South (including Britain, the US, Japan, and Germany), would play out their conflict in theDebated and Debatable zone. This zone had areas of political vacuum, underdevelopment,and internecine conflicts which made it both unstable and ripe for conquest (Source availableat: http://en.wikipedia.org/wiki/Geostrategy_in_Central_Asia (accessed Nov 2006)).
After the break-up of the USSR in 1991 the former Soviet Socialist Republics (SSRs)became independent but they are not yet successful nations: indeed they havestruggled to find an acceptable mode of governance. They had no social memory of“governing” given that from the earliest of times they were populated mainly bycity-states which were taken over by Tsarist Russia in the 1850s, and thenincorporated into the Soviet Union until its dissolution. Even now, allegiance isunstable – South Ossetia voted (in mid-November 2006) to split from within Georgia infavour of joining North Ossetia (which lies just outside Georgia but inside Russia); andclose by, Chechnya, another province in southern Russia just north of Georgia is in along-running dispute with Russia as they look for independence. Other small Stateswish for independence or realignment – Nakhichevan (from Armenia to Azerbaijan)and Nagorno-Karabakh (wishes perhaps to become truly independent of Azerbaijan).Mongolia declared itself independent of Russia in 1992, while China’s Westernprovince, Xinjiang, looks for independence though it is still controlled by ministries inBeijing many thousands of kilometres distant.
To the West, the European Union has extended its own scope to 25 nations (by May2004), increasing to 27 when Bulgaria and Romania joined in January 2007. Further, theEU is considering the entry of Turkey, which has a mainly Muslim population, thoughit has a secular constitution and government. The European Union, with other groupslike the UN, UNDP, UNESCO, CAREC and so on, has held a strong interest in aidprovision to Central Asia. This has been partly humanitarian and partly with a view tolocal democratization hoping for a broad increase in commerce notably for access toregional oil and gas supplies. For now, let us simply note that the Central Asian regionwas a hodgepodge, it suffered from the Great Game, and even now may be sufferingfrom its continuation unless (collectively) it can grasp new opportunities with acoordinated political will.
The Great Gameevolves for
Central Asia
1227

Recent regional developmentWe see in all the states of Central Asia positive but uneven development through thelast ten to 15 years. In many cases there have been contested elections, obviousmal-practice and heavy corruption. All these undemocratic activities detract from thedevelopment of the States, which, over the recent past, have sustained variable rates ofgrowth. Some Republics saw greater mining activity, even housing booms, whileothers reacted to a falling oil price (which was still 20 per cent higher than in 2005).Overall, Central Asia grew at 12.4 per cent (ADB, 2007).
As may be seen in Table I the regional Foreign Direct (inwards) Investment reflectsperhaps the longer history of the region wherein Azerbaijan was once one of the worldslarger suppliers of fuel oil, and this single nation still has considerable economicimportance. But developing fastest is Kazakhstan which managed to rise quickly fromits former Soviet shackles calling for outside investment to aid its internal developmentto exploit its gas and oil reserves. We can view estimates of regional oil and gasreserves in Table II.
During the Soviet era there was pressure to educate all the population and this isperhaps illustrated best by noting that it is the Southern nations of Afghanistan, Iran
Inflows Outflows2003 2004 2005 2003 2004 2005
FDI inflows and FDI outflows (millions US$):Afghanistan 2a 1a 1a – – –Iran 482a 100a 30a 365a 19a 6a
Mongolia 132 93 182 – – –Pakistan 534 1,118 2,183 19 56 44Armenia 157 217 220 – 2 7a
Azerbaijan 3,285 3,556 1,680 933 1,205 1,221Georgia 340 499 450 4 10 289Kazakhstan 2,092 4,113 1,738 2121 21,279 17Kyrgyzstan 46 175 47 – 44 –Tajikistan 14 272 54Turkmenistan 100a 215a 62a
Uzbekistan 70a 1a 45a
FDI stock flows (millions US$):Afghanistan 12a 17a 22a – – –Iran 2,039a 2,074a 3,695a – 411a 163a
Mongolia – 182a 709a – – 472a
Pakistan 1,892 6,919 10,401 245 489 775Armenia 9a 632 1,225a 3a 32a
Azerbaijan 3,735 13,876 474a 3,686Georgia 730 2,320Kazakhstan 10,078 25,152 16Kyrgyzstan 447 522 33 60Tajikistan 136a 522a
Turkmenistan 944a 1,360Uzbekistan 699a 964a
Note: a = EstimatesSource: UNCTAD (2006)
Table I.Regional economicindicators
MD45,8
1228

and Pakistan that have low literacy rates, with the former SSR nations’ rates beingexemplary once for both males and females. It is difficult to interpret the meaning of“literacy rate” but we will accept the data gathered by the CIA World Fact Book shownhere in Table III (i.e. the per cet of those over 15 years old who can read and write). Wehave included data for the USA and Russia for comparison.
Notwithstanding the high literacy rate that we see throughout Central Asia,unemployment is very high, and in most states there is a large mass of the populationliving below the poverty line. This is in contradistinction to a sometimes higher figurefor GDP/capita (note Turkmenistan has a GDP/capita of $8,000 with 60 per centunemployment and 58 per cent living below the poverty line). The figures seem not tobe reconcilable in general, but accepting that oil and gas income is high, andemployment in these sectors is quite low, then we may find the ratio understandable.
A political-economic viewIan Bremmer (2006) has written upon the nature of the “J” Curve. His argument notesthat some nations are to the left of the curve (being closed, authoritarian and run by aunique leader) while others lie to the right of the curve (are open, democratic, and havetransparent public institutions). Both groups of nations may seem equally stable, butinevitably if the leader in a left-hand nation was to die or be deposed his country wouldrapidly sink down its “J Curve” into crisis, and maybe into instability. Figure 2illustrates his thesis.
Bremmer considers all the nations of Central Asia lie to the left side of his curve, astoo are India, China, most Middle East States, and Egypt. Uniquely, among Islamicstates is Turkey, which when established in its modern form in the 1920s decided to bea secular democracy, and to not allow the clerics to govern or to exert heavy-handedinfluence. The nations on the right-hand of the curve are generally well-developedstates such as the US, UK, or France. They are typified by having democraticallyelected governments subject to the will of the people.
Bremmer notes that a nation’s individual curve rises and falls with respect to itsstability, which in turn is very strongly governed by its wealth and how that is
Oil (billions barrels) Gas (trillion cu feet)
Iran 136,270 974,000Pakistan 289 27,500Afghanistan 0 3,530Armenia 0 6,215Azerbaijan 7,000 48,000Georgia 35 300Kazakhstan 30,000 100,000Kyrgyzstan 40 200Tajikistan 12 200Turkmenistan 600 100,000Uzbekistan 594 65,000
Source: Energy Information Administration – US.gov (available at: www.eia.doe.gov/emeu/international/contents.html)
Table II.Oil and gas reserves
The Great Gameevolves for
Central Asia
1229

GD
P(p
pp
US
$b
illi
on)
GD
P(p
erca
pit
aU
S$)
Pop
ula
tion
(m)
Un
emp
loy
men
t(%
)
Pop
ula
tion
bel
owp
over
tyli
ne
(%)
Gin
iin
dex
Lit
erac
y%
(mal
e–
fem
ale)
Afg
han
ista
n21
.580
031
.056
4053
–51
-21
Iran
569.
98,
400
68.6
8611
.240
4385
-73
Mon
gol
ia5.
272
1,90
02.
832
6.7
36.1
4498
-97
Pak
ista
n39
5.2
2,40
016
5.80
36.
632
3362
-35
Arm
enia
13.4
64,
500
2.97
631
.643
37.9
99-9
8A
zerb
aija
n37
.92
4,80
07.
961
1.1
4936
.599
-98
Geo
rgia
15.5
63,
300
4.66
112
.654
36.9
100-
100
Kaz
akh
stan
124.
338,
200
15.2
338.
119
31.3
99-9
7K
yrg
yzs
tan
10.6
52,
100
5.21
318
4034
.899
-98
Taj
ikis
tan
8.73
1,20
07.
320
1264
32.6
99-9
9T
urk
men
ista
n39
.54
8,00
05.
042
6058
40.8
99-9
8U
zbek
ista
n48
.24
1,80
027
.307
0.7a
2826
.899
-99
US
A12
.31
tril
lion
41,6
0029
8.44
45.
112
40.8
99-9
9R
uss
ia1.
58tr
illi
on11
,000
142.
893
7.6
17.8
3199
-99
Note:
aU
nof
fici
ales
tim
ates
ofu
nem
plo
ym
ent
are
mu
chh
igh
erSource:
CIA
(200
6)
Table III.Wealth distribution andliteracy data
MD45,8
1230

managed. In closed states oil revenue (typically) is often used to shore up the policeand/or military strength and to dole out jobs to close cronies who may help to governthe state, but who ultimately do not defy the “President”. On the other hand, the openright-hand States, if they achieve greater capital will put that revenue to benefit thepeople by giving them better schools, hospitals and other supportive infrastructure. Inboth open and closed cases, if national revenues fall the stability also falls. In right-sidenations the people and institutions, especially the media, will rally to aid the State. Inleft-side States it is not inconceivable that the “Presidents” will simply flee taking withthem all their nation’s cash (which may have been banked off-shore throughout bettertimes).
Often, despotic leaders, while wishing to avail themselves of their oil revenues willattempt to separate the needed outsider specialists from the local community byforcing the experts to live in compounds and to observe restrictive travel regimes.Ultimately, such restrictive practices are untenable, as local managers have to betrained to operate new equipment which might entail overseas trips that allows them tounderstand how open it may be “out there”. But if leaders do not invite outsiders to runtheir extractive industries, as in Iran after their Islamic Revolution in 1979, industrybegins to fail and output drop. Read and Pirouz (2006) note that the oil production inIran is now 5 per cent below the production level in 1974, five years before their IslamicRevolution, and currently they are investing little in maintenance or exploration. Theygo on to say that the lack of a healthy oil sector in Iran could reignite inflation andcause much social unrest: Bremmer might say this is inevitable unless different policiesare enacted. He notes in Islamic states the teachers often limit learning, knowledge, anddiscussion, to the precepts of early Islam rooted in the fourteenth century. This doesnot fit the population for work in the modern world.
It is inevitable that the extraction of oil and gas resources with the concomitant needfor better transport infrastructures will subtly increase the education of local people.Once road and railways become even slightly better tourism will commence in earnest– to wit, as soon as the much disputed rail link to Lhasa in Tibet was opened in
Figure 2.An illustration of
Bremmer’s “J” Curve
The Great Gameevolves for
Central Asia
1231

July 2006 from Golmud in Xinjiang Province in China overseas passengers quicklyreserved places on rail trips originating in Moscow or Beijing riding private trains suchas the China Orient Express specifically to access the new line (see the web site of GWTravel, for instance). These international passengers will enhance local knowledgethrough knowledge diffusion.
The need for a coordinated approachThere are many varied decisions that the Central Asian states may take in moving totheir futures, most involve modifying current infrastructures such as enhancingcommunications and media availability that includes greater freedom for the press aswell as enhancing the telephone, radio and television networks. It also meansdeveloping and integrating the transport infrastructures, having better watermanagement and having reliable power supplies (gas and fuel oils pipelines, andelectricity supply). Local education and health support also need development. Many ofthese decisions involve neighbour countries, if not the whole region.
As mentioned briefly above, the land mass of Central Asia is composed of terrainthat is difficult to traverse having high mountains and high plateau as well as vast ariddeserts. Even so, the earliest peoples of the region developed local expertise andpromoted trade of their own produce or supported transient trade using pack horsesand camels to increase trade volumes. Recent discoveries of oil, gas and other mineralreserves have stimulated trade, increasing the reach of transportation systems,including pipelines. But due to political forces, generally by the former Soviet Union,the nations have not developed in an open manner.
From 1991 the States have been attempting to create their own political andcommercial models – but cooperation at the regional level has been insufficient tomaintain the functioning of the regional infrastructure networks which were establishedin Soviet times. As a consequence, trade disruption and low rates of investment haveimpaired the economic growth of these landlocked countries (EU, 2002: Central AsiaStrategy Paper). Although nearly one billion Euros have been granted to these Statessince 1991, they have achieved unequal development, with some seeming to regressbelow the achievements made during the Soviet regime. The EU authors say:
[. . .] the countries of Central Asia face common development problems. Slow democratictransition, poor records of implementing human rights obligations, concern over Islamicradicalisation, and the proliferation of weapons of mass destruction, demographic pressuresstraining the capacity of social services, lagging implementation of market-oriented economicreforms, poor business and investment climates, widening income disparities and poverty areproblems experienced throughout Central Asia. They also have shared challenges –including combating transnational crime, improving border management, achievingeconomic diversification, increasing intra-regional trade, accessing world markets, andmaking more sustainable use of natural resources which present opportunities for developingmutually beneficial relations. . .
[. . .] the EU will continue to promote the stability and security of the countries of Central Asiaand to assist in their pursuit of sustainable economic development and poverty reduction(Abstracted from EU Central Asian Strategy Paper (2002)).
The EU is not the only presence in this region. Others like the UNESCAP, UNDP,UNESCO, CAREC, as well as individual nations, have a strong interest in aid provisionto Central Asia.
MD45,8
1232

A nation’s wellbeingThe health of a nation depends on many factors all of which influence the developmentand maintainability of its infrastructures. Sometimes externalities inflict theirpressures, as in wartime, or in times of financial turmoil. In this paper we will suggest"wellbeing" may be viewed as a pseudo-mathematical function, which links severalfactors to the overall infrastructure development:
ID ¼ fn T;C;E;HM ;Ed OG & Trj� �
We propose that infrastructure development (ID) is linked to a number of factors:
T ¼ Transport development;
C ¼ Communications;
E ¼ Energy management;
HM ¼ Health management;
Ed ¼ Education provision;
Given: OG ¼ Open governance and Tr ¼ Transparency.
This “equation” and its constituent factors will be used to shape the ensuingdiscussions of the history, the present and the future of Central Asia. It will be used todraw together actions by supra-national agents such as the UNDP, ADB, CAREC andso on that seem individually to concentrate only on one aspect of (re-)development, butwhich really contribute to the overall “wellbeing”.
Transportation reformThis is a complex subject being concerned with the linking of legacy facilities to theneeds and technology of the modern World. The government, military and commercialoperators have to consider the most appropriate linkages for rail, road, pipeline andwater (sea, river and canal) transport systems that will meet present needs and supportdevelopment locally as well as regionally, if not internationally. Better transportinfrastructures facilitate the movement of raw materials, goods, and the people neededto produce the goods.
Considerable investment has been made by the EU in an attempt to align newCentral Asian railway routings to link with the development of the pan-Europeannetwork as well as provide “bridges” into Asia. As might be expected, the terrain ofCentral Asia hinders straightforward development as does the nature ofcountry-by-country politics and their fears of insurrections that might utilisewell-constructed modern railways to move troops. A further issue is the track gauge.While both Europe and China use standard gauge (1,435 mm), the Soviet legacy in theformer SSRs is broad gauge track (1,520 mm) which provides greater load bearing andstability than “standard” gauge but it requires more land use for curves, bridges,cuttings or elevations. Much of the Indian rail system is an even wider gauge(1,676 mm). About 60 per cent of the world’s railways use “standard” gauge. Thechange of gauge at border crossings delays transit as (usually) the axles along thelength of the train are swapped (but not for the engine, which returns to itshome-country base). For a goods and passenger trains this task takes about six or eight
The Great Gameevolves for
Central Asia
1233

hours – somewhat longer, even than the convoluted customs formalities. The EU hassuggested to the Central Asian states that all new track they install ought to be to the“standard” gauge thereby permitting easy transhipment from the Pacific coast to theAtlantic coast without need to swap axles.
Of the various multilateral initiatives, the EU/TRACECA program beginning in 1993is the best financed. It maintains a secretariat in Baku and a network of representativesfrom every country. There are quite frequent discussions on projects, and for decisionson programming and management of the transport system. The TRACECA programhas had a very positive effect in technical know-how transfer, and in extendingfamiliarization with existing and proposed international norms and practices. But thereremains an understandable local suspicion about regional initiatives.
The Asian Development Bank (ADB) has been promoting regional cooperationspecifically through the Central Asia Regional Economic Cooperation (CAREC)program since 1997. The main participants are the PRC, Azerbaijan, and the fourCentral Asian countries of Kazakhstan, Kyrgyzstan, Tajikistan, Uzbekistan. TheCAREC program’s objectives are to increase trade and integration with the largerexternal markets, reduce costs of transport and facilitate transit, improve supplies ofenergy, and to tackle negative externalities.
Sims, focusing on road transport, states that the region’s countries:
[. . .] should adopt a single scale of weight bands (or lengths) and rates for road use charges, asmaximum allowable charges. Discounts could be allowed, but no supplements over themaxima should be allowed. A fully equitable basis for regional transport would benon-discriminatory. This means that road use charges would be the same for all users,national and international, applied by tolls or vignette or other system. This requires a radicalchange of policy by CAREC countries, both in respect to internal and to external traffic.Drivers frequently complain that whatever the official charges, they are required to makemultiple illicit payments to authorities once they are outside of their home country. These candouble the official tariffs (Sims, 2005).
An earlier survey found:
[. . .] a survey of approximate costs in time and money payments incurred by producers ofKazakhstan and Kyrgyzstan while transporting their goods in Kazakhstan shows thatdrivers from Kyrgyzstan are experiencing remarkable differences in comparison to Kazakhdrivers, in required time and money payments at the various checkpoints, especially at thecustoms checkpoints. The reported times spent at customs were typically two to four hours atthe low end, and 36 to 72 hours at the high end at every checkpoint – one person reportedspending five days, another eight days.
However, the total time spent by Kyrgyz drivers at customs checkpoints varies from 46.5to 139.5 hours, while Kazakh drivers spent only from one to three and a half hours. Takinginto account the total time spent at the checkpoints for different inspections, Kazakh driversare required to add from two to 13 hours to the duration of their trips, while Kyrgyz driversmust add an alarming two to seven days (ESCAP, 2003).
Clearly, the CAREC programme has a long way to go. Like the EU/TRACEAprogramme it is mindful of the need to develop both North/South as well as East/Westroutes. It is clear that a coordinated road/rail development programme will materiallyaid the wellbeing of all the countries of the region as well as vastly reducing end-to-endtrip times of the Eurasian trade.
MD45,8
1234

The driver for rail development and harmonisation across Europe and Asia iscommerce. There is a perceived need to reduce end-to-end journey times. Presently, theoverland link (by rail) from the Pacific to the Atlantic (i.e. from the Chinesemanufacturers/assemblers to the markets of Europe) via the so-called EurasianLandbridge would take about 15 days, by sea (through the Suez canal) about 35 days,and if the ships had to take the Cape route round South Africa the journey would beabout 45 days (though the fastest modern boats cut these times by a few days not allshippers run such vessels). A distinct commercial advantage lies with the land route bethis uniquely rail (Eurasian Landbridge), or a mix of sea routes to Iran at BandarAbbas (their main Gulf port), by rail to the Caspian Sea, then by ship to the Russianports in the North and onward by rail into Europe. CAREC worry somewhat that theinternational container trade may be charged at too high a rate in order to subsidizelocal freight or passenger journeys, but this will be determined finally by global marketforces rather than individual national Presidents.
Communications reformWe might suggest, for instance, that farmers ought to be able to discuss more widelytheir problems of crop yields, and even what crops might work best for them in thefuture given a regional lack of water. Of course, to allow discourse like this requires theleaders to ease their restrictions on the media. As Bremmer has suggested, if a countrycan be helped towards this democratic process the leaders will be moving themselvesand their nations towards the “right-side” of the “J” Curve. Farmers will be able to seethat it was not just themselves who might be having difficulties but their neighbourstoo, and sometimes their compatriots in nearby countries since winds, erosion orchemical drain-off do not adhere to national boundary policies. By supporting thefreedom of expression the leaders will enhance their position.
Communications reform is however much broader than allowing public meetings ofthree of more people, or allowing the local and national press to report and argue freely. Itmeans investing in a physical infrastructure that supports and enables others to utilisethe Worldwide web, the internet, and a range of telecommunications media The websupports freedom of speech, and while as much as 20 per cent of its activity may berelated to personal communications, some 80 per cent of the activity on the web is relatedto commerce, or e-business. The simple placing of a personal order for goods found in anon-line catalogue to be delivered to one’s house spawns a myriad of other commandslinking warehouses, logistics firms, banks, and even the State (for dangerous or bannedgoods control, and for VAT control). Individual demands for goods, once aggregated,leads to the electronic stimulation of manufacturing processes and even to thestimulation of raw material producers – farmers or miners. There is no barrier to theseweb processes. While the final link of the logistics process is delivery to the individual ina small utility vehicle (the brown UPS van is a common sight across the US) all otherprocesses might have been enacted at any part of the globe. Given the current globalisedclimate, much assembly is in eastern Asia (mainly China) and the finished goods need tobe sent to either Europe or North America, and of course some go to the large Chineseinternal market. The goods can be shipped in containers, and as noted above freight sentoverland through Central Asia takes far less time to reach the European market than if ittravels by sea. In all transport modes there is the need to automatically trace and to trackthe goods – which is another use to which the internet is put.
The Great Gameevolves for
Central Asia
1235

Central Asia has not been left out of the global wired-system since it hosts nodesalong the Trans-Asia-Europe (TAE) cable. This cable route, agreed in 1993, it is theworld’s longest overland fibre-optic system, with a total length of 27,000 kilometres. Itprovides digital circuits for transmitting voice, data, fax and or video information fromShanghai to Frankfurt, and hundreds of other cities on the way. Most of the routefollows the ancient Silk Road linking China to Europe (Figure 3), which is an inevitableconsequence of the ancients inventing track ways. They were not idiots. They createdroutes along valleys and chose the lower cols by which to cross high passes: modernroutes follow these ancient pathways, and even airlines tend to follow beam patternstransmitted from modern towns which have become established along the old routes.Participants in the TAE project include China, Kazakhstan, Kyrgyzstan, Uzbekistan,Tajikistan, Turkmenistan, Iran, Turkey, Ukraine, Belarus, Poland, Romania, Hungary,Austria, Germany, Georgia, Azerbaijan, Armenia, Pakistan and Afghanistan. Ofcourse, the telecoms companies in each of the countries involved in the project canextend their local networks, thereby linking their citizens to the rest of the globe.
Energy reforms (focused on energy creation for local use)This section will rely on a substantial quote from a World Bank report:
The Central Asian Republics (to the east of the Caspian Sea) are endowed with significantenergy related natural resources. However, the distribution of these resources is highlyskewed. The Kyrgyz Republic and Tajikistan have abundant hydropower potential butnegligible amounts of commercially exploitable fossil fuels. In contrast, Kazakhstan hassignificant reserves of oil, gas and coal; Uzbekistan has substantial gas reserves as well assome oil and coal and Turkmenistan also has substantial gas reserves together with some oil.
During the Soviet Union era these resources were managed on a regional basis. Thehydropower resources in the Kyrgyz Republic and Tajikistan were operated primarily as anirrigation system with power generation being secondary. Energy systems were thendesigned to take account of the location of various energy sources. The result was a system inwhich energy was exchanged regionally among the various republics. Following thebreak-up of the Soviet Union, however, the scope of regional exchanges, which were turnedinto trade in energy, has declined as the individual republics have focused on achieving agreater level of energy self sufficiency.
Figure 3.The route of the TEAcable
MD45,8
1236

The fossil fuel rich countries, especially Kazakhstan, have been able to leverage their energyresources into a significant volume of energy exports, accessing markets outside CentralAsia. In contrast, the Kyrgyz Republic and Tajikistan face energy shortages in the winter andattempts to secure major export markets for their summer hydropower surpluses have notsucceeded. The political changes in Afghanistan and sustained economic growth in otherneighbouring countries such as China, Iran, Pakistan and Russia, however, have raisedexpectations in the region that opportunities may materialize to export significant amounts ofhydropower outside the region. Such an expectation has further raised hopes that support canbe obtained for investment in major new generation facilities. The most attractive newgeneration options to meet the winter demand requirements are the Talimardjan ThermalPower I Project in Uzbekistan that is largely complete, and the Bishkek II Thermal PowerProject in the Kyrgyz Republic, which is partially constructed. The Bishkek II Thermal Powerproject represents a more cost effective and quicker option to meet the Kyrgyz Republic’sfuture requirements than the Kambarata hydropower projects in the Kyrgyz Republic. Thesetwo thermal power plant projects, however, are both dependent upon the availability of gas inUzbekistan.
It is clear that regional cooperation needs to be reinstituted so that appropriate trade inboth energy and water can be carried out in the Republics and soon more broadly withneighbouring countries. However, considering the complexity of the tasks (with political,economic and commercial dimensions) to be handled by WEC a more nuanced and aspecialized set of institutional arrangements would appear to be called for. While corporateentities would be appropriate for the commercial tasks of raising financial resources,rehabilitating the existing assets, constructing, owning and operating new assets, anddomestic and export sales, other forms of organization have to be considered. The politicaleconomy dimension needs to be addressed by concluding Water Sharing Agreements andReservoir Operation and Water Release Agreements among the riparian member states, andeffective multilateral monitoring and enforcement of these agreements needs to be arranged.Institutions with equal voting rights and consensus based decisions would be appropriate forthe latter set of tasks, while they would be impractical and ineffective for commercial tasks.Further, the envisaged arrangements should look at the possibility of avoiding the creation of“yet another new” institution and make the best use of existing institutions by absorbingthem where possible, or reshaping them to serve the desire objectives (World Bank, 2004).
Clearly, there is a need to strengthen the regional political will as a precursor toaffirmative action. It is not enough to consider a Republic as a net energy exporter (orimporter). We have to consider its own seasonal use of energy at the micro andmeso-level not just at the macro-level of global oil and gas sales. As ever, these issueslink to other vital areas, such as health management. Therefore, overall, local electricitysupply is a regional issue.
Health management (linked to land use reform)This is a very important aspect, for without a healthy population no development cantake place. A nation needs to provide hospitals and other health provisioning. At abasic level it is very important to provide clean fresh water for everyone, and toprovide secure effluent and sewage treatment. Even today, water management studiesrefer to the Victorian London exemplar in which incessant outbreaks of cholera weretraced to wells of drinking water polluted by untreated effluent left to drain on thesurface. The separation of clean water from soiled water reduced the incidence ofwater-borne disease, greatly reducing infant mortality and prolonging adult lives. Thisis still the lesson for today. Other health care provision is needed to control disease,
The Great Gameevolves for
Central Asia
1237

some of which may be cheap to administer, but it requires an administrative structure,personnel, and a political will to do it at national level:
[. . .] It has been estimated that dirty water and poor sanitation account for the vast majorityof the 1.8 million child deaths occurring from diarrhoea globally each year – almost 5,000every day which makes it the second largest cause of child mortality. Access to clean waterand sanitation can reduce the risk of a child dying by as much as 50 per cent. It ought to beincumbent on all governments to provide clean water delivery systems and not force peopleto rely on potentially polluted wells or unclean surface run-off water, and to provide aneffective means of sewage removal and treatment. But alas the capital for these systems arediverted to other purposes, often to the military or police forces used to maintain a suppressedstate. Many countries with high child death rates caused by diarrhoea are spending less than0.5 per cetn of GDP on water and sanitation, a fraction of what they are allocating to militarybudgets (UNDP, 2006, p. 22).
Further, they highlight the difficulties facing the whole region:
[. . .] part of Central Asia is blessed with abundant freshwater flowing down from glaciers inthe Hindu Kush mountains. The region also has one of the world’s most expansive irrigationsystems – a legacy of a Soviet modernization model that often pushed irrigation developmentto generate short-term agricultural revenues at the cost of the environment. The system’scollapse is now holding back human development and reinforcing poverty.
[. . .] Solutions are not easy. Irrigation management in the Soviet era was highly centralizedin Moscow. In the post-Soviet era some governments went to the other extreme, transferringauthority to private water user associations. The lack of financing for the maintenance of thewider infrastructure, and the inability to afford rising electricity charges for pumping or otherconstraints on the mobilization of local financing led to the collapse of many of theseassociations.
Weak regional cooperation has been another problem. Rural livelihoods across the regionare linked through shared river systems. The giant Karhsi pumping cascade lifts water fromthe Amu Darya to irrigate 400,000 hectares of agricultural land on the steppes of southernUzbekistan. Six of the seven pumping stations are in Turkmenistan. Differences between theTurkmen and Uzbek authorities have resulted in under investment in the pumping systemand shelving international aid plans to support its modernization.
Enhanced cooperation in the region and beyond is vital to recovery. Downstream userssuch as Kazakhstan and Uzbekistan depend critically on the volume and timing of releasesfrom upstream Kyrgyzstan, but the Kyrgyz authorities are exploring options for expandinghydropower generation, which would further reduce downstream flows. The costs ofnon-cooperation will be very high: financing water self-reliance through new dams inKazakhstan and Uzbekistan is a high-cost option. The economic benefits of cooperation aresubstantial, but cooperation is underdeveloped.
Central Asia’s water interdependence extends to other neighbours in China, India andMongolia. Failure to manage this interdependence will exacerbate water shortages inagriculture. Countries in the region depend on rivers that rise in Afghanistan, China andRussia which then flow through shared river systems. For example, the Irtysh and Ili Riversoriginate in China and flow into Kazakhstan. As water scarcity mounts in China, authoritieshave announced plans to divert water from these rivers into Xinjiang Province. IfAfghanistan expands irrigation in its part of the Amu Darya Basin, it will influence flows intoTajikistan, Turkmenistan and Uzbekistan. These cases demonstrate the very realimplications of water interdependence and the equally real dangers of failing to developcooperative governance systems (UNDP, 2006, p. 190).
MD45,8
1238

A major legacy in the region stems from the over-development by Soviet planners. InKazakhstan radioactive or toxic chemical sites associated with former defence industriesand atomic test ranges scattered throughout the country pose severe health risks forhumans and animals. Industrial pollution is severe in some cities because the two mainrivers, which flowed into the Aral Sea have been diverted for irrigation. These rivers andthe Aral Sea are drying up, leaving behind a harmful layer of chemical pesticides andsalts, which are picked up by the wind and blown as noxious dust storms. There is alsoheavy pollution in the Caspian Sea caused by an overuse of agricultural chemicals, andincreased salination from poor infrastructure controls and previous wasteful irrigationpractices – this does not bode well for either the sturgeon (caviar) farming, nor for thedevelopment of tourism based on a seaside beach life. Further, many farmers or theiroverseers opted for crops, like cotton, that demand a great deal of water – so they are notreally suitable for the region. It may be more beneficial for some communities tosubstitute crops that minimize water use while still maintaining market value, whichperhaps could enhance or develop new products and markets.
The Central Asian Countries Initiative for Land Management (CACILM) agreed inJune 2006 a ten-year programme of co-ordinated development. It aims to implement amore comprehensive and integrated approach to sustainable land management thatwould produce benefits at the local, national, and global levels. In addition, the AsianDevelopment Bank (ADB) notes that efforts to address land degradation in the regionhave had limited success due to:
. a focus only on technical solutions;
. the lack of coordination among agencies;
. an inadequate policy and legislation for sustainable development; and
. inadequate attention to economic and social implications and the incidence ofpoverty.
The ten-year programme (of CACILM) will establish a multi-country and multi-donorpartnership to support the development and implementation of national levelprogramme frameworks (NPFs) to create a comprehensive and integrated approach tosustainable land management in Central Asia. It aims to combat land degradation andimprove rural livelihoods in Kazakhstan, Kyrgyzstan, Tajikistan, Turkmenistan, andUzbekistan. Their design phase has four key targets:
(1) to develop national programs for each country including a prioritized programof projects and technical assistance and related concept papers;
(2) a CACILM Multi-Country Partnership Framework;
(3) to establish mechanisms for consultation and coordination within and betweencountries that enhance the participation of all stakeholders having effectivemechanisms for the implementation, monitoring, and evaluation of CACILMwith enhanced harmonization of all funding agencies, which should
(4) increase awareness and commitments by national and funding agencystakeholders.
These programmes and target points are grand in aim, but may be underachieved inpractice due to inter-regional and cross border distrust. And further, as we noted
The Great Gameevolves for
Central Asia
1239

above, the social memory of the Great Game lives on and individuals distrust accordsagreed with outsiders since, in the past, such accords simply led to the locals beingduped.
Education reformsHuman beings have innate intelligence, but without being educated and provided with(even) basic reading and writing skills that innate intelligence is squandered. Once apopulation can read and communicate the problems it faces may be discussed morewidely and solutions understood. An educated population has more ability to managethe factors mentioned above – to create a better infrastructure. However, the educationsector across all Republics suffered deeply after they left the protection of the SovietUnion.
In the former time it was Moscow that determined what the schools taught withscant regard for ethnic differences. Moscow produced text books in a timely way and insufficient quantity to provide a free and reasonably good education for all. Once thelocal economies fell, especially after the Asian and Russian financial crises in 1999,there was a great difficulty in meeting education targets. Budgets fell and locallanguage texts were hard to develop and deliver. In many cases the books had to bebought by the parents, at a high cost, in times of general economic hardship. A privateeducation system also developed in most countries as they passed new reforms.
Significant aid was given by the Asian Development Bank through their advice anddiscussions in curricular and general education reforms generally by the mid-1990s.Once agreed, the Education Sector Development Programme (ESDP) offered localtargets, attainment measures and frameworks to make progress (ADB, 2004:Education Reforms. . .). However, real achievement has been patchy. Local conditionsand a simple inertia to leave in place that which was familiar (i.e. the Soviet systemsthat had been seen to work) together with widespread corruption ensured that peoplein general became sceptical about education and the qualifications gained. Forinstance:
[. . .] A student in Tajikistan is forced to pay three times the average monthly salary for a highgrade . . . A Kazakh teacher gets her students to pay for her trip to Moscow – and they allpass their exam . . . In Turkmenistan, the obligation to pay bribes gives students yet anotherreason to seek education abroad. All over Central Asia corruption in education is a seriousproblem.
Ahead of the annual admissions season, RFE/RL (Radio Free Europe/Radio Liberty)correspondents have been talking to students, parents, teachers, and officials about the issue.In the first of a four-part series, they report that corruption in education is widespread andtaking a heavy toll on society. Correspondents and interviewees point to one main reason –the rising poverty in all five republics following independence. Teachers and administratorsare forced to live on tiny salaries and find alternative ways to make ends meet. Thecorruption can start as early as elementary school, but it appears to be worst at universitylevel (abstracted from Moore (2004).
There is hope since most of the regions’ education reformers and providers recognisethat they “need to do better” as a school report might note. As their economies growand diversify, and as they take note of the benefits of the openness in Kyrgyzstan,which uniquely in the region joined the WTO in 1998, they consider how they may also
MD45,8
1240

develop. One route is provided by the University of Central Asia. This institutionbegan course provision in 2003, and in 2006 decided to expand:
UCA is constructing three campuses in Tekeli, Kazakhstan; Naryn, the Kyrgyz Republic; andKhorog, Tajikistan. These will create one of Central Asia’s largest and most ambitiousconstruction projects with the expertise of internationally-renowned architects and designers.World-class academic provision, administration areas, residential blocks, operationalfacilities, libraries, social, cultural and athletic facilities will occupy between 280,000 –300,000 square meters divided equally across the three campuses, and will accommodate aresidential population of almost 4,000 students, faculty and staff.
Begun in 2006, SPCE is the University of Central Asia’s (UCA) first operational academicprogramme, and has the mission of fostering economic development. SPCE is the firstprovider of formal, university-based, non-degree educational programmes in Central Asia,offering vocational, professional development and personal improvement opportunities toyouth and adults.
SPCE emphasizes tertiary short-cycle education (TSCE), which is well developed inadvanced economies but still new to Central Asia. Instead of a university degree, TSCE givesstudents intense training, usually in one year or less, that results in a widely acceptedqualification to perform industry-specific tasks. SPCE intends to contribute to educationalreform in Central Asia by demonstrating the value of its programs in helping its studentsbecome internationally competitive for careers and business opportunities (Abstracted from:www.ucentralasia.org/campus.htm (accessed December 2006)).
It is hoped that this form of concentrated and applied education will help develop theregion. It will aid the integration of its many sectors that require reformation, andabove all, integration across the region will enable deeper linkages with the processesof globalisation. Such changes are needed to nurture new interdependent relationshipsthroughout Central Asia and its co-development with Europe, Russia, China and India.
Manufacturing redevelopmentThe Soviet Union invested heavily in the region to exploit local oil, gas and coalfields,and other minerals. Immediately following its collapse in 1991 few entrepreneursventured into the former Republics – yet there are notable exceptions, especially in theoil and gas sector. Baku, the capital of Azerbaijan, was once a world leader in oilextraction and even now is the starting point for several pipelines to export oil and gasto Russia, Georgia and importantly to Turkey (and beyond). It has potential to takemore pipelined fuels from Kazakhstan to inject into its pipelines, which would havesome advantage to Europe which wishes to reduce its dependence on direct suppliesfrom Russia. The region’s rich mineral resources were only crudely exploited duringSoviet times. Because of this, it has been possible for the Newmont Mining Company ofColorado to make a profit by re-processing the tailings from the early mining inUzbekistan.
Cotton also has potential – Uzbekistan is the world’s fourth largest cotton producerand second largest exporter after the USA. However, Soviet colonial practice left thewhole textile industry woefully undeveloped, which recent Turkish investments inTurkmenistan and a large Korean project in Uzbekistan have only just begun tochange. In this sector a few US agricultural plant manufactures like John Deere, Caseand Caterpillar have found niche markets selling their well-built machines againstweaker local manufacturers.
The Great Gameevolves for
Central Asia
1241

If, however, we note the current upsurge in global foreign direct investment and theactual returns being made on former investments in the former Soviet satellitecountries of Europe we might imagine that soon investors will look to the literate butmore remote peoples of Central Asia. In many Eastern European firms inwardinvestors have cleaned up the Soviet plants installed new motors and electronic controlgear (as well as pollution controls where appropriate) and attempted to reduce thelabour force originally involved in the old enterprises (Ewing, 2006). Importantly, theseEastern European redevelopments are supported by a working infrastructure, whereasin Central Asia the Soviet regime built roads and railways directly from A to B withscant regard to national boundaries, and since 1991 the local regimes have notmaintained the transportation and other infrastructures having lost the centraldirectives once imposed by bureau in Moscow. This change has resulted in anunderstandable malaise in network maintenance and a general fall in it reliability.
As in other sectors, outsiders are willing to grant help, in particular a jump-startthrough better financial instruments and frameworks. We note the work of theInternational Finance Corporation (IFC), the private sector arm of the World Bank. Itsmission is about promoting sustainable private sector investing in developingcountries, helping to reduce poverty and improving people’s lives. In particular, notetheir report on Central Asia (IFC, 2003). However, as ever, policy issues are dependanton the agreement of the Presidents and in many cases they often say “no”.
IFC’s Strategy for Europe and Central Asia is to:. promote transparency and good corporate governance in environmentally and
socially sustainable projects, with a focus on frontier markets;. support investments to diversify economies and modernize industrial structures
and infrastructure, accelerating the transition to market economies;. develop financial markets, with a focus on access to finance for small and
medium enterprises, institution building, and innovative financial products; and. catalyze intraregional investments and public-private partnerships in
infrastructure and social sectors.
These actions have released entrepreneurs into Central Asia through micro-bank loans,and also given confidence to outsider investors. As a result, inward investment hasgrown across the region as noted in Table I, and the ADB suggests growth in theregion will continue at 10 per cent or more through 2008 (ADB, 2007). Other factorsalso aid the process of manufacturing regeneration – namely an increasing opennessof the media, and a better redefinition of the various instruments of government andgovernance – though once again the country-by-country development is patchy: weneed a regional viewpoint and Presidential accord.
Given: the development of open governanceThe equation linking factors supporting the Infrastructure Development has a “given”– that which the earlier part of the equation is dependant upon.
Here, we argue the nations’ governance ought to be open and democratic. As wehave noted, in a brief review of Bremmer’s ideas relating to his “J” curve, a despoticleader can divert incomes away from health support, close down communications,restrict population migration and boost his army and police force to remain in power.
MD45,8
1242

But the nation suffers. In contrast, a democratic nation allows the population to vote forits leaders, to vote them out of power if need be, and to question all aspects of change.An open democracy is vibrant and ought to progress as has Kyrgyzstan having joinedthe WTO in 1998. One of the entry requirements for the WTO is that the accessioncountry must become more democratic, and thus supportive of many freedoms – evenof the press and other media, with better government and governance creating anindependent legislature. Although President Akayev, the leader of Kyrgyzstan since1991, was initially seen as a liberal he became increasingly despotic which led to callsfor his resignation. He fled to Russia via Kazakhstan in March 2005, being succeededby Kurmanbek Bakiyev who was the leader of the People’s Movement of Kyrgyzstan –he thus has popular support, and we hope the country will continue to prosper in aopen way.
. . . and given: increasing transparency of institutionsThis factor is closely linked to governance. The people of a nation ought to be able toquestion decision making, and to understand how and why decisions were made andcarried out. It needs an independent judiciary with its own powers of enforcement. Civilobedience comes from knowledge and openness not from oppression – therefore, inright-side nations (of Bremmer) the people’s energy can be spent on development andnot on strife. In the case of Central Asia, Bremmer would suggest that while advanceshave taken place there are sufficient factors that still restrain individual countries tothe left side of the “J” Curve so nations aligned to the right-hand side have to lookcautiously at their reforms.
If we can be sure that the region’s Presidents are willing to move towards more opengovernance and real transparency we might be better assured that the other factorswill be supported. Already, there is a reasonable background to build upon – literacy isbecoming better again for both men and women, inward investment is higher, and soon. But still several aspects are in disarray after years of neglect. For instance on aregional scale, the maintenance of transport infrastructure, water management andthus both health management and energy supply are at risk. This is where thepan-regional task forces, like CAREC, can be active. And if they nurture change, theremight be a stronger move towards regionalism in the near future. Naturally, followingthe second invasion of Iraq and the toppling of Saddam Hussein there is a greatertension promoted by radical Islam. They suggest that “the west sells democracy foroil” which shifts again the balance of power into the hands of despots as they pocketthe oil revenues or spend frivolously on vanity projects such as the Italian marblepalaces in Turkmenistan (The Economist, 2007, p. 39). And yet, the people ofTurkmenistan are, on the whole, a happy bunch. Due to the relative abundance of oilrevenues they have enough food in their markets and enough cheap fuel for their shortjourneys and for cooking: their President (recently dying of natural causes) describedthem as “wonderful”.
The problem with equationsAs economists know, though national leaders seem to forget, econometric models maybe good at describing historical data, but they do not, of themselves, manage futures.Strategists may be informed by running perturbations and sensitivity analyses onthese models, but it is the will of the leaders that “gets things done”. The equationabove was simply a device to provide a talking point or a focus – to be able to grasp
The Great Gameevolves for
Central Asia
1243

how many facets and actions may be brought together in one storyline. Here we havechosen to review “Wellbeing” as a function of several aspects of infrastructureredevelopment and to illustrate, over the reach of Central Asia, how supra-nationalbodies are attempting to aid local Republics.
There is, however, a “chicken and egg” situation, for without one aspect being inplace another may not prosper. Or money spent on one aspect may be squandered assufficient of another aspect may not be present. We also have to look to the lead timesof decisions and realise that these, while not independent, interact in different timeframes. For instance, pouring cash into the whole of the education sector equally wouldbe wasteful as the older children, not having received a through grounding in thebasics would not be able to absorb fully the higher education offered. And perhapsother parts of the interdependent infrastructure have not come together quickly enoughto create job opportunities for these better-educated children. So, spend heavily onyoungsters first, and do not deprive older children. Perhaps make grants available forthem to attend courses abroad hoping they will return in due course: a policy thatChina seems to have adopted in the past. And, having thus reduced spending on thetotality of education, cash can be freed to spend on other aspects of the infrastructure.
Inevitably, hard choices will have to be made. But regionally there is considerableliquidity, and if the goodwill of Presidents is available then robust interdependentregional strategies can be devised and agreed upon. Macroeconomics and a study ofhistory can inform decision makers, but it is they who will have to persuade theirpeople about a brighter future. And we have to acknowledge that there will be aconsiderable time gap between making these decisions and seeing them blossom: theywill be planting for their children.
Grasping an opportunityFigure 1 shows that the greater Central Asia to which we refer covers a vast area.Approximately 6,000 kilometres East to West and 3,000 kilometres North to Aouth (ifwe measure to the Gulf Coast of Iran). We suggest that one radical decision would be toredevelop the whole of the regional transport infrastructure, modernising it for thefuture.
We have constantly referred to the difficult terrain of Central Asia when consideringthe development of the transport infrastructure – be this road, rail, water-borne orpipelines so it is time to consider a new approach. Especially for the rail transportsystem for goods and people. These East/West and North/South rail routes are vitalarteries for trade. Historically, the Silk Road was once the main trade route betweenAsia and Europe, but this fell into disrepair once ocean shipping became established.Even now, with shippers like Maersk offering daily sailings in their line ofMalaccamax ships (e.g. the Emma Maersk) holding up to 12,500 containers (even largerare planned), there would be little impetus to redevelop the Eurasia landbridge, exceptfor the commercial interest in greatly reducing the freight transit time to about 2-3 dayscompared with 35-45 days depending on the sea route. It is time to be bold – todemonstrate the viability of high-speed Maglev transport systems.
Maglev rail systemsMaglev systems have been demonstrated in the UK, Germany, Florida (USA) andJapan, and they are in regular use in China, but as yet only over the Shanghai to
MD45,8
1244

Pudong International airport link. In the latter case one factor leading to its adoptionwas its undoubted speed, and it became a national prestige project. It has achieved aspeed in excess of 500 km/hr, but normally averages 430 km/hr over its seven minutesand 20 second journey of 30 kms. The Chinese authorities have plans to extend theroute to Hangzhou (, 170 kms) incorporating the Expo 2010 site. That journey wouldtake about 27 minutes:
High-speed Maglevs can be expensive to build, but are comparable to the capital costs ofbuilding a traditional high-speed rail system, a road highway system or a system of airports.More importantly, Maglevs are significantly less expensive to operate and maintain thanhigh-speed trains, planes or intercity buses and they are very eco-friendly. The data comingout of the Shanghai Maglev project indicates that operation and maintenance costs are quitelow, and are covered by the current relatively low volume of 7,000 passengers per day.Passenger volumes on this Pudong International Airport line are expected to risedramatically once the line is extended from Longyang Road metro station all the way intoShanghai’s downtown (Source: http://en.wikipedia.org/wiki/Maglev_train#Propulsion(accessed November 2006)).
We suggest that the states comprising Central Asia have exactly the right conditions toadopt Maglev. They need new rail systems and these systems could be of thehigh-speed variety with the ability to incorporate local lower speed links. This is theconfiguration proposed by the UK Ultraspeed Group who are lobbying for theimplementation of a high-speed backbone system north-south in the UK. They notethat “. . .international evidence demonstrates that regions prosper when they are wellconnected internationally and internally, and that world-class transport links areessential elements of competitive advantage” (Kruse and James, 2006).
Central Asia has four support roles in the transport sector. First, it has to develop itsown coordinated systems to better utilise its own resources be they oil, gas, coal,minerals or water. They need also to stimulate local manufacturing through bettertransport of goods and people and third, they need to support transit traffic betweenEurope and Asia from which they would derive carriage fees. Finally, they couldstimulate tourism if they had a fast/slow and highly integrated transport system.
Maglev can incorporate RoRo container lorries, or have units designed to transportcontainers directly allowing easy transhipment at the boundary of its domain to steelwheels-on-rail traditional systems. Or, in other cars, business and tourist passengerswould be able to quickly explore the region thereby raising income from tourism whilenot increasing pollution costs at all. All would be able to travel at the same ultra-highspeeds on the trunk routes of the Maglev systems, and these routes, we suggest couldbe extended to Europe and to China. One major benefit of Maglev is its low impact onthe environment – it has a low footprint (being elevated), and it is almost frictionless(resulting in very low operating costs), quiet (with no wheel contact noise, but there isthe air displacement noise to consider), and the systems overall have minimalmaintenance costs (as there are few moving parts).
All new transport systems, built from a green field, are costly. Studies constantlyindicate that Maglev is no more costly than the French TGV (or Japanese Shinkansen)high-speed wheels-on-track systems and they deliver a better passenger flow than amulti-lane highway (see Table IV). Maglev do not get implemented however as they areonly marginally more beneficial than the TGV in the proposals studied and becausethey are totally incompatible with “standard” railway tracks. Over the average 127
The Great Gameevolves for
Central Asia
1245

kms of track of the nine proposals above the trains move passengers at an average of400 þ km/hr, but that factor alone is not sufficient to tip the balance againstimplementing TGV. As a CIT study indicated, passengers will prefer TGV against aflight only if the journey is not more than about 800 kms, after which a flight ispreferred, notwithstanding the usual hassle of getting to/from an out of town airport(CIT – Commission for Integrated Transport, 2005). With Maglev perhaps the cut-offmight be 1,000 kms.
The commercial calculation for Maglev becomes different if we consider freightmovements. Maglev can deliver a container at the same speed as a passenger – at anaverage of 400 þ km/hr. Only air-freight approaches this velocity. Large air freighterscan carry about 50,000 kilograms load (Airbus A300-600F freighter) whilst a standardcontainer could carry up to 25,000 kilograms, but Maglev will deliver at a much greaterintensity than air freight. The web site “www.maglev2000.com” hosts technical detailsfor the Maglev-2000 system. It illustrates the safety and the ultimate technicalsuperiority of the Maglev levitating system over conventional systems, be these steelwheels-on-rails, road haulage or even air transport. Essentially, the new systems couldbe quite cheap to build, yielding a fast, flexible, very eco-friendly service since it ispollution free and it generates less noise than traditional high-speed rail systems.
The M-2000 passenger vehicle cabin dimensions are similar to a mid-size jet airliner like theMD-80. Unlike airliners, however, all passengers on M-2000 vehicles enjoy first class seatingwith ample leg-room and wide, comfortable seats. The M-2000 guide-way can also transportfreight vehicles. Their trailers would roll onto and off the Maglev vehicle in two minutes,similar to trailers carried by the Chunnel Trains. M-2000 freight vehicles can also transportcontainerized freight. Depending on traffic density, M-2000 vehicles would operateindividually or as multi-car “train sets.” Headways of one minute are practical (five milesseparation between vehicles). An M-2000 two-way guide-way with single vehicles can carry12,000 passengers or 120 trailer trucks per hour. With three-vehicle “train sets,” the capacitywould increase by a factor of three. Multi-vehicle sets would operate at peak traffic periods,and single vehicles at off-peak. A 2-way M-2000 guide-way could carry 100,000 passengersand several thousand trailer trucks daily.
At 10 cents per passenger-mile and 20 cents per ton-mile, revenues would be six milliondollars per mile of guide-way per year. This would payback the ten million dollar per milecapital cost of a two-way M-2000 guide-way in a couple of years.
System Cost estimate (million e/km)
Shanghai (track, plus units and outbuildings) 42.0Estimated average Maglev track costsa 42.0Maglev-2000 (track only) 12.0Magtube (buried track: cheapest aspect) 2.5High speed TGV (average, track only) 30.0“Ordinary” rail track (costs vary widely) 10.0
Note: aAverage costs of nine global proposals noted in the KCI Technologies Inc./ParsonsBrinckerhoff Joint Venture (2005) study of the Washington – Baltimore link (excluding the longextreme speed Maglev proposal from Osaka to Tokyo which also has many tunnels)Sources: Web sites of Maglev, Transrapid, Magtube & Railway-Technical.com/Finance
Table IV.Comparative rail systembuilding costs
MD45,8
1246

Most (over 90 percent) of the M-2000 guide-way is a sequence of narrow beams that areelevated above the ground. The narrow beams rest on a line of piers and all aspects can beprefabricated to keep production costs down and construction simplified. The M-2000vehicles straddle the narrow beam. Superconducting magnets, cooled by cheap liquidnitrogen, on each side of the vehicle magnetically interact with the aluminium guide-waypanels on each side of the beam, levitating and stabilizing the vehicle as it moves along theguide-way (Source: www.maglev2000.com (accessed November 2006)).
The major attraction of Maglev for the purposes of this paper is its speed of delivery offreight. Table V indicates several freight delivery modes and their journey times fromChina’s Pacific coast to Europe.
The main shippers will quote times a little shorter than in Table V being based ontheir latest faster ships, but the average freight forwarder or manufacturing firm is atthe whim of schedules. These conservative figures illustrate that Maglev operating inCentral Asia for local transhipment and also for Eurasian traffic should be a viableproposition. As such, it would exert a major regenerative effect – not just through thetransport sector alone, but from spin-off services.
Spin-off servicesWe have already hinted that Central Asian tourism has potential. Given the region is solarge with many historical artefacts it is reasonable to expect that travellers would liketo cross the region easily and speedily as they move from site to site. Flight scheduleswould not allow casual movement for the mass of tourists who might explore theregion. Maglev would allow fast transit across the region, and with integration with alow-speed maglev system tourists could with ease pass to their individual destinations.It may be envisaged that “tourist pods” might be built for medium-term rental – like amobile home – which could utilise Maglev as well as the existing road system therebyextending the tourist reach while minimising the ecological costs: Maglev is better thanplanes, better than TGV, and the “pod” could use hybrid fuel technology when in roadmode.
More importantly, however, are the spin-off industries that will arrive to support thenew high-tech Maglev systems. These will include precision engineering, informationand communications technology, and also frontier science as better super conductingmagnetic materials would be sought for the levitating units of Maglev. It is importantto note that Central Asia has a core of high tech industries associated with their fuelsand minerals extraction, the space station and its services in Kazakhstan, as well as theatomic energy facilities in Kazakhstan and Xingjian. Some of the engineers andscientists will be willing to move entrepreneurially to new firms that will supportMaglev developments. New town-ships will also develop as transport communicationbegins to be easier, fast and cheap.
Air freight 2Maglev 2Block trains 15Ship – Suez canal 35Ship – around Africa 45
Table V.Comparative Eurasian
route times (days)
The Great Gameevolves for
Central Asia
1247
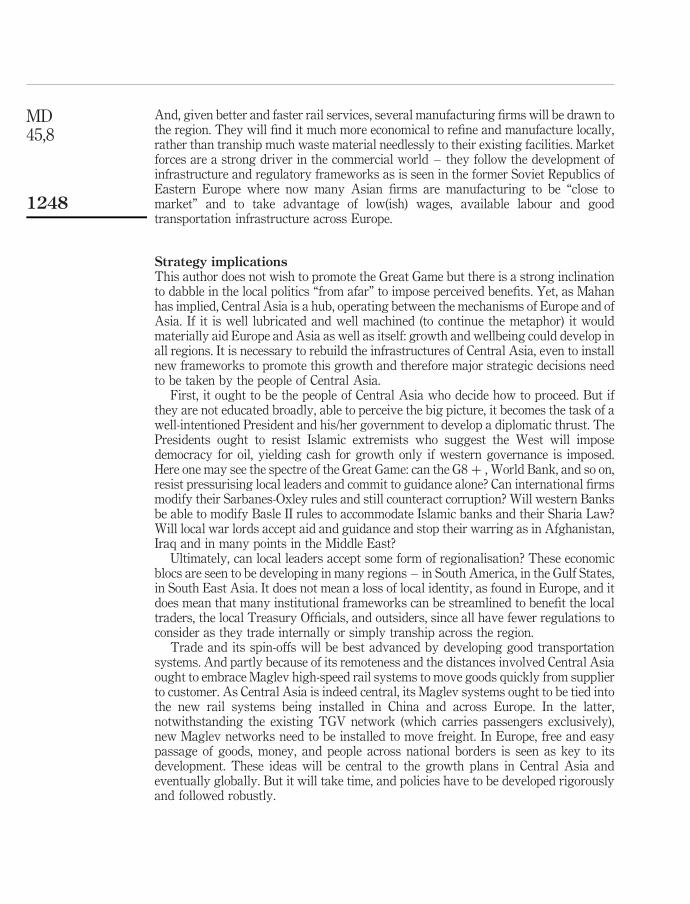
And, given better and faster rail services, several manufacturing firms will be drawn tothe region. They will find it much more economical to refine and manufacture locally,rather than tranship much waste material needlessly to their existing facilities. Marketforces are a strong driver in the commercial world – they follow the development ofinfrastructure and regulatory frameworks as is seen in the former Soviet Republics ofEastern Europe where now many Asian firms are manufacturing to be “close tomarket” and to take advantage of low(ish) wages, available labour and goodtransportation infrastructure across Europe.
Strategy implicationsThis author does not wish to promote the Great Game but there is a strong inclinationto dabble in the local politics “from afar” to impose perceived benefits. Yet, as Mahanhas implied, Central Asia is a hub, operating between the mechanisms of Europe and ofAsia. If it is well lubricated and well machined (to continue the metaphor) it wouldmaterially aid Europe and Asia as well as itself: growth and wellbeing could develop inall regions. It is necessary to rebuild the infrastructures of Central Asia, even to installnew frameworks to promote this growth and therefore major strategic decisions needto be taken by the people of Central Asia.
First, it ought to be the people of Central Asia who decide how to proceed. But ifthey are not educated broadly, able to perceive the big picture, it becomes the task of awell-intentioned President and his/her government to develop a diplomatic thrust. ThePresidents ought to resist Islamic extremists who suggest the West will imposedemocracy for oil, yielding cash for growth only if western governance is imposed.Here one may see the spectre of the Great Game: can the G8 þ , World Bank, and so on,resist pressurising local leaders and commit to guidance alone? Can international firmsmodify their Sarbanes-Oxley rules and still counteract corruption? Will western Banksbe able to modify Basle II rules to accommodate Islamic banks and their Sharia Law?Will local war lords accept aid and guidance and stop their warring as in Afghanistan,Iraq and in many points in the Middle East?
Ultimately, can local leaders accept some form of regionalisation? These economicblocs are seen to be developing in many regions – in South America, in the Gulf States,in South East Asia. It does not mean a loss of local identity, as found in Europe, and itdoes mean that many institutional frameworks can be streamlined to benefit the localtraders, the local Treasury Officials, and outsiders, since all have fewer regulations toconsider as they trade internally or simply tranship across the region.
Trade and its spin-offs will be best advanced by developing good transportationsystems. And partly because of its remoteness and the distances involved Central Asiaought to embrace Maglev high-speed rail systems to move goods quickly from supplierto customer. As Central Asia is indeed central, its Maglev systems ought to be tied intothe new rail systems being installed in China and across Europe. In the latter,notwithstanding the existing TGV network (which carries passengers exclusively),new Maglev networks need to be installed to move freight. In Europe, free and easypassage of goods, money, and people across national borders is seen as key to itsdevelopment. These ideas will be central to the growth plans in Central Asia andeventually globally. But it will take time, and policies have to be developed rigorouslyand followed robustly.
MD45,8
1248

One might ask “where will the money come from for such extensive transportationdevelopment?” It is an important question since the full gamut of the local economy hasto be developed in parallel – education, power systems, water supplies and treatmentsystems, agricultural reform, telecommunications, banking and governance, and so on.
The earliest of railways (tramways) were developed by mine owners to move theircoal to rivers or ports to fuel the Industrial Revolution. Following the success ofindustrialisation in the UK and the USA with its accumulation of immense personalcapital it was natural that their national railways were privately built. This was not thecase in continental Europe where often the State built the rail infrastructure of thenetwork and the operation was granted to private companies who had to buy rollingstock, signalling, stations and so on in exchange for the revenues they collected. Russiatoo was different. Tsar Nicholas I was so concerned that the huge undertaking (toinstall a Russian rail network) may not prove profitable for the entrepreneur he forbadeprivate investment, and had the State manage railway development: a policy thatprevails today (Haywood, 1969). By now, in the early twenty-first century, manyindividuals have amassed vast wealth and could afford to build private railways, thenotion of public/private is widespread, and States too have put aside considerable cashfor infrastructure development. One might note China stated in its 11th Five-Year plan(of the Spring 2007) that . . .ending in 2010 it would spend about US$ 190 billion (140Be) on rail infrastructure alone (Bremner, 2007). There is other money earmarked bythe World Bank, ADB, TRACEA/EU and so on for transportation redevelopmentacross Central Asia.
For this big project considerable engineering appraisal has to be undertaken, andthat will take up time. Time that is vital in the regeneration process of Central Asia. Itis imperative that their Presidents take the big step forward soon and approve Maglevin principle and thus move forward as quickly as possible without capital beingdispersed on old technology.
Ultimately, the major driver for change may be the leaders’ universal agreement toprotect the planet. The report Climate Solutions: WWF’s Vision for 2050 suggests wehave only a few years, up to 2012, to implement changes – otherwise we are doomed(WWF, 2007). Their report goes beyond the Intergovernmental Panel on ClimateChange’s conclusions (IPCC, 2007) that the world could successfully use newtechnologies to limit carbon emissions enough to avoid the worst impacts of climatechange. The WWF shows how this can be done using only sustainable,environmentally friendly energy sources. Their aim, we suggest, will be aided bysubstituting Maglev for other high-speed rail system implementations (as Maglev ismore environmentally friendly), and to move freight to Maglev that is inappropriatelysent long-haul by road haulage.
ConclusionsThere can be no (final) conclusion to this paper except to say that the Great Game isover. It is time to consider the needs of the people – individually in their countries, andwithin their ethnic groups, and regionally too with respect to harmonious overalldevelopment.
There are many pan-regional globalised teams such as the EU/TRACEA, UNDP,CAREC, and various guises of the World Bank which are contributing to Central Asianredevelopment. It is easy to imagine that the region might soon develop a self-image
The Great Gameevolves for
Central Asia
1249

and become an entity like the European Union. This would give it power to combat thedisruption predicted by Mahan – that they are the lands of the Debated and Debatable.
The region has many opportunities which they may grasp – some are simpledevelopments from the past, some are linked obviously to the Human DevelopmentProgramme (like having better sanitation and education), and there are novel projectslinked to a new world order. We suggest one novel project above all others – to developthe regional transport infrastructure by implementing ultra high-speed Maglev railsystems across Central Asia. This project should be integrated in parallel into similardevelopments that are possible in China and in Europe.
PostscriptAfter the main text of this paper was written, Viktor Razbegin, deputy head ofindustrial research at the Russian Economy Ministry, announced on 18 April 2007 thata partnership of State organizations and private companies would inaugurate theTKM-World Link. This consortium is to construct a 6,000 kilometre (3,700 mile)transport corridor from Siberia into the US, which will use a tunnel under the BeringStrait. The tunnel alone will cost $10 billion to $12 billion, and the whole project isexpected to cost $65 billion over a ten to 15-year construction period. Cluster projectsand rail links in Russia and the USA (where a 2,000 kilometre stretch from Angora(Colorado, USA) to Fort Nelson in Canada) would cost up to $15 billion. TKM-WorldLink predicts transhipping 100 million tons annually of cargo so the investment in therail section could be repaid in 20 years. The tunnel would contain a high-speed railway,a highway, and pipelines, as well as power and fibre-optic cables all modes would beinvolved in East/West economic exchanges within their own technologies. YevgenyNadorshin, chief economist with the Trust Investment Bank in Moscow, said in aninterview, “. . . the Chinese are crying out for our commodities and are willing tofinance the transport links” (Humber and Cook, 2007).
This Russian proposal makes it clear that China’s Pacific coast, if connected byMaglev to Europe (10,000 kms) and to the US mid-West (12,000 kms) would become aglobally-central economic power-house based upon assembly and manufacturing forthe foreseeable future. To achieve this prominence it needs ultra-high speed freighttransport links. As mentioned above in the main text, a mix of public-private financingdeals will ensure these links are soon installed. Prophetically, Razbegin also said on18 April, “. . . the transit link is the string on which all our industrial cluster projectscould hang”. We suggest this would benefit all people along the routes, including thosein Central Asia.
References
ADB (2004), Reforms in Countries In Transition: Policies And Processes, Asian DevelopmentBank, Manila.
ADB (2007), Development Outlook: Growth Amid Change, Asian Development Bank, Manila.
Bremmer, J. (2006), New Way to Understand Why Nations Rise and Fall, Simon & Schuster,New York, NY.
Bremner, B. (2007), “China’s great rail spree continues”, BusinessWeek, 20 March.
CIA (2006), CIA World Fact Book, Central Intelligence Agency, Washington, DC.
MD45,8
1250

CIT – Commission for Integrated Transport (2005), High-Speed Rail: International Comparisons:Final Report: February 2004, CIT London.
(The) Economist (2007), “The Caucuses: hanging together”, The Economist, 10 February, p. 39.
ESCAP (2003), “Foreign direct investment in Central Asian and caucasian economies: policiesand issues”, papers and proceedings presented at the Regional Round Table on ForeignDirect Investment for Central Asia, Dushanbe, 3-4 April.
EU Central Asia Strategy Paper (2002), available at: http://ec.europa.eu/comm/external_relations/ceeca/rsp2/02_06_en.pdf (accessed November 2006).
Ewing, J. (2006), “Making good money out of old plants”, BusinessWeek, 20 November, p. 50.
Haywood, R.M. (1969), The Beginnings of Railway Development in Russia in the Reign ofNicholas I, 1835-1842, Duke University Press, Durham, NC.
Humber, Y. and Cook, B. (2007), Russia Plans World’s Longest Tunnel, a Link to AlaskaBloomberg.com, April 18, available at: www.bloomberg.com/apps/news?pid ¼20601087&sid ¼ a0bsMii8oKXw&refer ¼ home (accessed 15 May).
IFC (2003), Europe and Central Asia: Growth in the Private Sector, IFC Regional Reports, IFC,Washington, DC.
IPCC (2007), Climate Change 2007: 4th Assessment Report, available at: www.ipcc.ch
Kruse, A.J. and James, B.A. (2006), Transrapid in Great Britain – Project UK Ultraspeed,available at: www.maglev2006.de/108_Kruse/108_Kruse_ok.pdf (accessed November 2006).
Mahan, A.T. (1905), The Problem of Asia and Its Effect Upon International Policies, Little Brown,Boston, MA.
Moore, K. (2004), “Buying ignorance – corruption in education widespread, corrosive”, RadioFree Europe/Radio Liberty, July 7, available at: www.rferl.org/featuresarticle/2004/07/7a4c4452-4ce5-44ee-a0e8-cbc94cb81d8a.html (accessed December 2006).
Read, S. and Pirouz, B. (2006), “Surprise: oil woes in Iran”, BusinessWeek Online, 11 December.
Renfrew, C. (1973), Before Civilization: The Radiocarbon Revolution and Prehistoric Europe,Alfred A. Knopf, New York, NY.
Sims, M. (2005), Central Asia Regional Economic Cooperation: Harmonization and Simplificationof Transport Agreements, Cross Border Documents and Transport Regulations, AsianDevelopment Bank, Manila.
UNCTAD (2006), World Investment Report, UNCTAD, Geneva.
UNDP (2006), Human Development Report. Beyond scarcity: Power, Poverty and the Global WaterCrisis, United Nations & Palgrave Macmillan, New York, NY.
World Bank (2004), World Bank Central Asia: Regional Electricity Export Potential, World Bank,Washington, DC.
WWF (2007), Climate Solutions: WWF’s Vision for 2050, WWF, Gland, available at: http://assets.panda.org/downloads/climatesolutionweb.pdf (accessed 15 May 2007).
Corresponding authorJohn Kidd can be contacted at: [email protected]
The Great Gameevolves for
Central Asia
1251
To purchase reprints of this article please e-mail: [email protected] visit our web site for further details: www.emeraldinsight.com/reprints

Is South-South trade the answerto alleviating poverty?
Osvaldo R. AgatielloGeneva School of Diplomacy and International Relations, Geneva, Switzerland
Abstract
Purpose – South-South trade is the fastest growing segment of world trade in the last two decades.This paper aims at demonstrating that it is a unique opportunity and a sound development tool fordeveloping countries.
Design/methodology/approach – The paper describes the statistical and empirical evidence froma macroeconomic and microeconomic viewpoint, and discusses the policy options developing countrygovernments face to promote South-South trade and investment.
Findings – Not all regions, countries, products and services fare equally in the current state of play.That South-South trade expands at a much faster pace than other trade, although it is subject to higherbarriers and higher distance-related costs, suggests that addressing trade facilitation issues is of theessence for future progress, including major investments in trade-related infrastructure, like themodernization of air and water ports, roads, transport and customs services.
Practical implications – South-South trade expansion is a market-driven development – mostlyresulting from the widespread operation of international supply chains of the South – that may beenhanced by government intervention but seldom spearheaded by it in the long run.
Originality/value – The “natural” next questions are whether South-South trade can be analternative to North-South trade, whether the learning process for international trading is enhanced orretarded by it, and whether the proliferation of PTAs is strangulating progress in rules-basedmultilateralism, the first-best choice according to mainstream economic theory. Even more importantin development terms is whether South-South trade can help bring developing countries, small- andmedium-sized enterprises (SMEs) and the poor into the export process or, rather, it is a distraction fromthe real targets. This paper suggests there are robust answers to these queries already.
Keywords International trade, Developing counties, Poverty
Paper type Research paper
A new geography of trade and investmentTrade flows between developing economies have continued to increase steadily sincethe early 1990s. At more than one trillion US dollars in 2003, they already representclose to half of all developing country trade. This is a far cry from only two decadesago, when developing country trade represented less than one quarter of globalmerchandise trade and South-South trade was viewed as the “weakest segment ofworld trade” (Ventura-Dias, 1989). Nowadays, it is tempting to see it as the silver bulletto spearhead socioeconomic development.
South-South trade, defined as trade between developing economies, including theEast European and Asian economies in transition from centrally planned Communistsystems to market economies, is a vibrant marketplace reality. This is the result of aseries of converging factors. High rates of economic growth in some developingcountries, particularly in East Asia, are a part of the explanation, as they haveincreased demand for goods and services from all countries, including other developingcountries. Also, average tariff reductions, resulting from Uruguay Roundcommitments and trade integration agreements, have trimmed down developing
The current issue and full text archive of this journal is available at
www.emeraldinsight.com/0025-1747.htm
MD45,8
1252
Management DecisionVol. 45 No. 8, 2007pp. 1252-1269q Emerald Group Publishing Limited0025-1747DOI 10.1108/00251740710819023

country tariffs to about one third of their level two decades ago, while quantitativerestrictions, such as quotas and import licenses, have been radically reduced (seeTable I; United Nations Conference on Trade and Development, 2004a).
During the same period, developing countries have experienced a shift tovalue-added exports as hundreds of their companies have joined international valuechains for the production of components and the assembly of completed products. Notonly do manufactures now represent around two-thirds of developing countrymerchandise exports, but also exports of manufactures to other developing countriesrepresent nearly as much of their total exports (65 percent and 64 percent, respectively,in 2001; Word Bank, 2004). As a consequence, low tariffs on, and just-in-time deliveryof, imported components have become a competitive sine qua non for a large number ofdeveloping country exporters and their governments, even in the case of the 50 leastdeveloped countries (LDCs), where vigorous private exporters excel (Department ofForeign Affairs and Trade, 2004; see Figure 1).
This phenomenon is not restricted to merchandise trade but also services accountfor a larger share of developing country output, reaching 60 percent of GDP or more forupper middle-income countries (World Trade Organization, 2004). Lower tariffs bringabout lower input costs and extra consumer spending power that may raise demandfor other goods and services as well. For instance, an estimate purports that China’sservice sector alone could grow by $US100 billion if trade barriers in services wereeliminated across all countries (Dee and Hanslow, 2000). As the output of a number ofdeveloping countries continues to grow at a much faster pace than that of developedones, their services sector in general, and South-South trade in services in particular, isalso expanding, especially tourism, transportation, information, education, medical,telecommunications and financial services.
Nevertheless, barriers to trade in services are abundant and hard to quantify, indeveloped and developing countries alike, taking the form of qualificationrequirements, technical standards and licensing for the provision of business andprofessional services as well as restrictions to the admission of newcomers, foreignownership and the movement of people, no matter how qualified. This changed inmany developing countries with the first wave of privatization of the 1980s and 1990sbut only partially and certainly not irreversibly. In fact, average applied ad valoremtariffs in developing countries remain more than three times as high as those in
Origin $US billion Share by origin Share by destination
World 2,082 100.0 28.2Developing economies 1,008 48.4 42.5Developing economies: America 94 4.6 25.5Developing Africa 44 2.2 27.7West Asia 87 4.2 31.4Other Asia 780 37.5 50.1China 181 8.7 41.5Developing economies: Oceania 1 0.1 27.7LDCs 15 0.7 40.9Landlocked countries 14 0.7 36.2
Source: United Nations Conference on Trade and Development (2004a)
Table I.Network of exports to
developing economies in2003 (by groups of
countries)
South-Southtrade
1253

industrial countries and nearly three-quarters of all tariffs faced by developing countryexporters are imposed by other countries in the South (12.6 percent and 3.4 percent,respectively, in 2000). For instance, while average applied tariffs in Hong Kong amountto zero, tariff peaks – those that are three or more times the size of the average appliedtariff in a given country – are very common in two-thirds of developing countries,predictably in raw materials and basic manufactures, like textiles, apparel andfootwear (World Trade Organization, 2004; see Table II).
Moreover, while developed countries bind the vast majority of their tariff schedulesat low levels and the gap between binding and applied tariffs – their binding overhangor water – is usually small, developing countries keep numerous tariff lines unboundas well as large overhangs for bound tariffs. This makes the calculation of economicbenefits from bound tariff reductions rather unpredictable, as overhangs allow forsignificant discretionary adjustment. According to World Bank estimates, ifdeveloping countries eliminated their mutual manufacturing and agricultural tradebarriers altogether they could obtain welfare gains for $US62 billion per annum
Figure 1.Average annualizedgrowth rates of trasde byincome groups
MD45,8
1254

(World Bank, 2004). But this calculation can be misleading as it can be used both ways,to advocate in favour of trade liberalization across the board as much as to promote theGlobal System of Trade Preferences among Developing Countries (GSTP), asdiscussed in the next section. In any case, the argument is not going to convincedeveloping country exporters, especially those from middle-income, highly competitivedeveloping economies, that their paramount target should not be better access tomarkets in the North, the locomotives of world trade.
Although the trend is clear and likely to remain so, referring to South-South trade asa global reality may be quite a misnomer at this point in time. While in Asia it reachedaround 40 percent of merchandise exports in 2001, it barely represented one quarter ofthe total exports of the developing countries in the Western Hemisphere and Africa(World Trade Organization, 2004; Kuwayama, 2005). In fact, Asia accounts for morethan two-thirds of all South-South merchandise trade, largely due to intra-industry,intra-regional flows in a region of high economic growth rates. And even there, thethree most-highly protected areas in intra-east Asian trade – agriculture, lightindustry and food and beverages – face ad valorem tariff equivalents of 41, 27 and 22percent respectively (Freudenberg and Paulmier, 2005).
Having said that, evidence mounts in some extra-Asian developing countriesexperiencing spectacular trade booms that South-South exchanges represent agrowing share of their trade. Outside East Asia the trend is characterized byinter-regional trade and may be explained as a discrete trade and investment offensivefrom developing giants like China, India and Brazil. For instance, between 2002 and2005 Brazilian worldwide exports almost doubled to $US 18.3 billion, with developingcountries absorbing 53 percent of the total by the end of 2005. During this period,Brazilian trade with Africa rose by 153 percent (exports) and 149 percent (imports),while trade with Asia grew by 111 percent (exports and imports almost equally; seeMinisterio do Desenvolvimento, Industria e Comercio Exterior, 2006).
Mounting evidence suggests that trade liberalization and the ability of much of Asiato respond flexibly to world demand – the establishment of intra-regional supplychains since the 1980s and of inter-regional ones since the late 1990s – is the bestexplanation for the spectacular growth of South-South trade of recent (World TradeOrganization, 2004; Cernat and Laird, 2003). The development of regional andsubregional trade agreements (RTAs) in Latin America, the Caribbean, the Baltic
World 68OECD developed 73Upper middle income 62Least developed 47Argentina 54Brazil 50China 41Egypt 48India 52Indonesia 41Mexico 69South Africa 65
Source: World Bank (2006)
Table II.Value added in services
as percentage of GDP
South-Southtrade
1255

states, the Balkan countries, the Middle East, North Africa, the Pacific islands, SouthAsia and Southeast Asia may have an impact on South-South trade expansion butperformance comparisons between RTAs, bilateral trade agreements (BTAs), freetrade agreements (FTAs) or other developed-developing country trade and investmentintegration arrangements are very difficult, given their singular scope, content, history,and extra-economic objectives. For instance, trade within and between the foursubregional blocs in Latin America and the Caribbean (the Andean Community,Mercosur, the Central American Common Market and the Caribbean Community andCommon Market) continues to be marred by non-tariff barriers, perforations ofcommon external tariffs (CETs), an underdeveloped infrastructure badly in need ofinvestment and design shortcomings of the very integration institutions that shouldlead the way for macroeconomic convergence and business facilitation (Devlin andFfrench-Davis, 1998; Kuwayama, 2005).
Implications of South-South trade for development strategiesWhile no country has ever consolidated its socioeconomic development by rejectinginternational trade and long-term capital inflows, no country has achieved it byopening up to foreign trade and investment alone either. The questions of why to do it,for what, how and through which instruments continue to be of the essence in thisdiscussion on development fundamentals, a process usually dominated by prejudiceand vested interests. Like in all things doctrinal, South-South trade can be viewed in avery different light, according to the social, political and economic persuasion of thebeholder.
The macro discussionAt one end of the spectrum are those who see it as a substitute to North-South tradeand a tool for nurturing regionalism as the favourite national option for internationaltrade relations (South Centre, 2005; Khor, 2000). Although outside the consensus ofmainstream economic policymaking, these ideas still hold their grasp in parts of Africaand Latin America and are experiencing a rebound in some countries as the export-ledgrowth benefits actually reaching the poor prove disappointing.
At the opposite end gather those who deem South-South trade a distraction toprogress towards multilateralism, traditionally considered the first-best policy option(Greenaway and Milner, 1990; Havrylyshyn, 1985). Advocates of this approach viewtrade liberalization not only as beneficial in its own right but also yielding spill-overeffects on other reforms that contribute to sustainable socioeconomic growth (Berg andKrueger, 2003; Hausmann and Rodrik, 2002; Santos-Paulino, 2005; Wang and Schiff,2004). The hypothetical removal of all trade barriers by all countries is calculated tohave the potential to render global welfare gains of over $US260 billion, 20 percentfrom agricultural liberalization, 30 percent from manufacture liberalization and a full50 percent from services liberalization. The World Bank calculates gains to developingcountries in excess of $US108 billion, or 40 percent of all potential gains (Dee andHanslow, 2000; World Bank, 2002). The preferred path for this school of thought wouldbe unilateral trade liberalization, considered to be a much more potent driver of exportperformance than negotiated liberalization (World Bank, 2004).
At various points in between stand those who recognize South-South trade as anintermediate step on the road to convergence with the world economy. For its
MD45,8
1256

supporters, South-South trade can be a harbinger of progress in the reduction of tariffand non-tariff barriers, focusing on tackling impediments to the movement of goods,services, capital, technology and people as well as on promoting public-privatecooperation at a national, (sub)regional and international level (Department of ForeignAffairs and Trade, 2004; World Trade Organization, 2004; Earthscan Publications,2003; Crawford and Fiorentino, 2005). This eclectic approach is the conventionalwisdom of the moment.
The micro discussionA microeconomic approach – the trading community’s needs and aspirations as thefocus of attention – turns upside down the universe of queries that need a response inthe design of a country’s trade policy:
. Is it comparative advantage that determines trade still today?
. Or is it enabling credit instruments and institutions that supersede it?
. Or is it the political commitment and unwavering attention of governmentauthorities?
. Or is it rather the existence of an adequate physical infrastructure?
. Or a sound foreign exchange policy?
. Or is it subsidies, speedy drawback processing, tax rebates, exemptions andother fiscal incentives?
Surely, some of these conditions, benefits and decisions, and similar ones as well, mayhelp private efforts but what determines trade is traders themselves – that is, thepresence and positioning of buyers, sellers and investors at the right time and the rightplace, identifying business opportunities and effectively acting upon them. In otherwords, the macroeconomics of trade cannot substitute for business acumen and shrewdrisk-taking in the long run.
Having said that, governments, country groupings and international organizationscan go a long way in helping international traders and investors spot opportunities andtrends, and match their bottom-up, demand-driven approach with macro, top-downnational and cross-border initiatives. Public-private partnerships (PPPs) – especiallyin what concerns fluent dialogue and collaboration – are not an option but a necessityin times of globalization. This means mutual access (to make interaction possible),autonomy (meaning impartial government authorities that can say no for a validreason) and cross control (to impede some politically connected operators to undulyend up with the lion’s share and discriminate against the rest).
The whole spectrum of trade promotion services can be encompassed in awell-organized export-oriented strategy, including:
. market research, through trade flow analyses by lines of products, sectors,countries and regions, surveys that identify supply and demand capacities, thedevelopment of regional information platforms, business networks and sectoralclusters, and screening the realities and potential of identified companies,trade-related investors and services providers;
South-Southtrade
1257

. trade support services, through awareness creation and targeted technicalassistance, like how to select sectors with growth capacity and prioritize effortsto capture promising business opportunities;
. sector and market development, through networking events with a regional andsectoral scope simultaneously, if possible; and
. institutional capacity building, through the involvement of trade supportinstitutions (TSIs), government-sponsored as well as private, like chambers ofcommerce, professional associations and trade-related services providers, inresearch, organization and follow-up activities that make good use ofinformation and communication technologies (ICT).
The need to identify and fill gaps in the trade promotion infrastructure of countries,regions and subregions in the South, including trade information and trade promotionfacilities, infrastructure, trade-related services and the like, when what exists is noteffective enough and those gaps remain unheeded, is a major part of the task.Additionally, the regional marketplace frequently provides an opportunity to triggerthe learning process for export and international procurement, a sort of trainingground for trading and investing across borders on a manageable scale. Arguably, therelevance of this notion may be diminishing as international production chains providethe necessary incentives, disincentives, facilities, technologies, skills and know-how(Kulkarni, 2004).
Whatever the policy framework, South-South trade can help create a catalyticenvironment for companies, small, medium and large, especially those targetingbottom-of-the-pyramid approaches, that is, those focused on serving the world’sdeveloping country majority, starting with the poorest. It can engage them in alearning-by-doing process of exploring real-world business opportunities, evaluatinghow to tackle them, dropping the long shots (especially when depending ongovernment subsidies), and capturing the most promising ones (Devlin andFfrench-Davis, 1998; Kahnert et al., 1969; Robson, 1987; Møen, 1998).
RTAs, GSTP, BFHowever important making the right international trade decisions might be, mostdeveloping country governments find it extremely difficult to keep informed on thearray of options they face – an avalanche of highly legalistic agreements andinitiatives that require dedicated specialists, resources that are both scarce and costly(Crawford and Fiorentino, 2005). It is even more difficult for them to assess the relativeimportance and chances of success of each path. Of the roughly 300 PTAs that havebeen notified to the General Agreement on Tariffs and Trade (GATT) and the WorldTrade Organization (WTO) over the years, 150 are still in force. An additional 70 havenever been notified to WTO and it is estimated that the number of operationalagreements of this sort will reach another 300 by the end of this decade. Very few ofthem comply with Article XXIV, GATT 1994, which requires that “substantially all”barriers between PTA members are dismantled (Sutherland et al., 2004; Crawford andFiorentino, 2005). Not only do the various trade arrangements a country is a party tofrequently contradict each other, but also they block the automatic processing ofcomputerised trade operations, requiring discrete customs authority rulings, with theconsequent loss of time and money. Preventing particularism is the very raison d’etre
MD45,8
1258

of rules-based multilateralism. However, the fact is that without a successfulcompletion of the Doha Round negotiations in sight PTAs offer the only way forward(Baldwin, 2006). Besides, since July 2006 the WTO has put in place a new transparencymechanism for all RTAs, which may help to put order in the system.
Every developed country has a bilateral trade and investment promotionprogramme, at times disguised under a technical cooperation facade, to advance theinterests of its exporters, investors and business intermediaries, carve a niche in thepublic sector procurement of developing countries, and obtain key information for itsown business community. It is important for trade officials and the trade community ofdeveloping countries to single out the concealed geographic, thematic or sectoralagendas pursued by national, bilateral and regional institutions and special interests,and weed out the promotional components that are not in their long-term self-interest.Sellers abound in the trade promotion business but very few programmes assure theparticipation of focused buyers and investors, in spite of the proliferation of trade fairsand business jamborees in all continents.
The Global System of Trade Preferences Among Developing Countries (GSTP) is aformal negotiating mechanism for the mutual granting of preferential tariff treatmentfor eligible products between selected developing countries. The secretariat of theUnited Nations Conference on Trade and Development (UNCTAD) provides technicalsupport and administrative assistance to GSTP, which is reserved to the “exclusiveparticipation” of developing countries and country groupings that are members of theGroup of 77 (G-77) and parties to the GSTP agreement of 1988 (see Table III). Theeconomic and legal rationale behind GSTP is that of most RTAs – a partial, temporaryderogation of the most-favoured nation clause (MFN). The progressive liberalization oftrade between developing countries through reciprocal negotiations, GSTP’s declaredobjective, is its main difference with the Generalised System of Preferences (GSP), amechanism for the granting of one-way preferences by developed countries in favour ofdeveloping ones introduced at UNCTAD II in New Delhi in 1968. Another difference isthat GSTP preferential rules of origin are designed to be more transparent andgenerous than those of GSP, especially because they rely on rules rather than thebenevolence and conditionality of the grantor. The first round of GSTP negotiationstook place between 1986 and 1988, at the conclusion of which the GSTP agreement wasadopted. The second round was launched in 1990 and ended in 1998, when 24 countriesindividually and the Mercosur countries as a bloc (at the time Argentina, Brazil,Paraguay and Uruguay) exchanged preferential tariff concessions for about 900products. However, they never entered into force because fewer than the required 15members ratified the protocol.
A third round, making tabula rasa of the second round concessions as if they hadnot existed, was launched in June 2004 at UNCTAD XI in Sao Paulo, but no new tariffconcessions have been exchanged as of yet. The success of the third round depends ona significant linear tariff cut among a bigger basket of participants, particularly Chinaand other G-77 members, like Saudi Arabia, the Gulf states and much of Sub-SaharanAfrica, as well as substantial tariff reductions with wide product coverage. UNCTADestimates that if developing countries reduced mutual average tariffs by 50 percentduring the third GSTP round, an additional $US 15.5 billion in trade would begenerated (Puri, 2005).
South-Southtrade
1259

Parties to the GSTPAgreement
Parties that exchanged tariffconcessions during the
second GSTP round
Algeria U
Argentina U U
Bangladesh (LDC) U U
Benin (LDC) U
Bolivia U U
Brazil U
Cameroon U
Chile U
Colombia U U
Cuba U U
Ecuador U U
Egypt U U
Ghana U U
Guinea (LDC) U
Guyana U
India U U
Indonesia U U
Iran U U
Iraq U U
Libya U U
Malaysia U U
Mexico U
Morocco U U
Mozambique (LDC) U
Myanmar (LDC) U
Nicaragua U
Nigeria U U
North Korea U U
Pakistan U U
Paraguay U
Peru U U
Philippines U U
Romania U U
Singapore U
South Korea U U
Sri Lanka U U
Sudan (LDC) U U
Thailand U U
Trinidad and Tobago U
Tunisia U
Tanzania (LDC) U
Uruguay U
Venezuela U
Viet Nam U
Yugoslavia U
Zimbabwe U
Source: GSTP web page (see www.g77.org/gstp/#members) and UNCTAD’s GSTP coordinationoffice
Table III.GSTP members
MD45,8
1260

In other words, the effectiveness and credibility of GSTP as a real option rests on thepolitical will of member countries and their capacity and determination to recruit more,and more committed, participants. Unfortunately, although a ready framework fornegotiations among developing countries, GSTP is still a project that does not evenmobilize its natural constituency. According to Article 17 of the GSTP agreement, itsmanifest beneficiaries should be the LDCs, “that shall not be required to make concessionson a reciprocal basis” but only seven of the world’s 50 LDCs are GSTP members to date[1].
In spite of the formidable presences of India (a major GSTP promoter, together withBrazil) and China (not a party but participating in the third round), the latter seems tobe much more attentive to consolidating its insertion in the WTO system, which it onlyjoined in 2001. However, given the suspension sine die of the Doha Round negotiationson 27-28 July 2006, the more advanced GSTP participants, such as China, India, Braziland some ASEAN countries, with the support of donors and regional and internationalorganizations, could convene a GSTP negotiating conference and pledge concretemarket access offers, with extra concessions for LDCs.
Business facilitation (BF)By concentrating in the elimination of tariff and non-tariff barriers, regional integrationprocesses should deepen trade-related commitments, fostering productive andfinancial integration via forward and backward linkages along regional value chainsand across sectors and markets. Strengthening the provision of regional public goods(RPGs), macroeconomic coordination and convergence become a requisite, competitionis regulated, compensatory funds are established to reduce social adjustment frictions,and internal and cross-border migration is carefully managed (Devlin andEstevadeordal, 2002; Kuwayama, 2005).
Currently, the political and economic environment in most of the developing worldis one in which most countries face a number of competitive scenarios for bilateral,subregional, intra-regional, inter-regional and multilateral trade and investmentintegration, very few of these scenarios actually address their development needs, andan even smaller number is making any progress at all. In this context, tackling tradeand business facilitation (TF/BF), technical barriers to trade (TBTs), and practicalquestions of physical infrastructure (PI), all urgent matters for private sector operators,becomes a welcomed respite. Few cast doubts about the need to do it; the question iswhere to get the resources to finance mounting capacity building requirements.
BF aims at opening markets by reducing the cost of cross-border trade, simplifyingregulatory and administrative processes, improving access to trade information, andaligning policy and business strategies to liberalise trade and assist growth acrosssectors. It has captured the imagination of governments and companies alike, with tensof public-private initiatives being pursued in all developing regions, especially in thecontext of trade negotiations, from the automation of trade procedures to themodernization of customs services to the joint border inspection by customs,agriculture, veterinary, health, phytosanitary and security controllers of neighbouringcountries. Focus on BF, with special emphasis on customs rules and procedures andtechnical standards and related testing and certification as well as SME-targetedimprovement measures, like human resource development, information access,technology and technology sharing, financing and joint ventures, can provide anon-contentious path for effective progress that may pave the way for more ambitiouscooperation plans.
South-Southtrade
1261

The way forwardIt is now time to respond in detail to the questions of the introduction.
Are South-South value chains more “poverty sensitive” than those of South-North tradeand do they have greater impact on poverty reduction through greater job creation,through generating wider opportunities for the poor to become directly involved in theexport process, or both?In principle, “yes” and “both”. Developing country policymakers naturally aim fortrade and investment initiatives that:
. foster poverty reduction (like microfinancing);
. assure the provision of goods and services (especially affordable public goods,like potable water and public health);
. create and deepen linkages between the international and the local economy(such as developing local supplier networks, providing training and creatingemployment); and
. facilitate the transfer of appropriate technology.
Governments can introduce incentives to reach these goals and South-South regionaland subregional trade and investment agreements invariably provide for such acomposite (Commission on the Private Sector and Development, 2004).
Multinational corporations (MNCs), on the contrary, are dominated by the profitmotive and their concerns for total factor productivity, global market share and overallprofitability so that national or regional development targets can only occupy afraction of their attention. Having said that, some innovative, regional public-privateinitiatives that encourage and enable private engagement in trade and investmentpromotion for poverty reduction show promise. For example, the Emerging AfricaInfrastructure Fund was designed to meet the demand for upgrading and privatizingexisting infrastructure in Africa. And the Financial Deepening Challenge Fund aims atcontributing to the achievement of the Millennium Development Goals (MDGs) byharnessing private sector resources in ways that generate high levels of pro-pooreconomic growth.
However, by definition, these are temporary measures, until the marketplace takesover. In the long run, it is unlikely that the business plans of, say, Korean or Malaycompanies will differ very much from those of MNCs from developed countries in termsof profitability margins, security interest and productivity targets. It is in the fine print ofbusiness-to-business (B2B), business-to-government (B2G) and government-to-government (G2G) stipulations that differences and benefits will truly show.
Should strategy-makers be placing greater attention on South-South trade developmentand, if so, what are the most effective means of promoting the further acceleration ofSouth-South trade: regional economic integration, bilateral or regional tradeagreements, South-South investment promotion, trade facilitation, or supportingnetworking and contact among business practitioners in the South?All of the above, with careful, case-by-case sequencing and mixing. Growing tradewithin a region may be a consequence of the globalization process, led by MNCs andother international investors; or it may be a conscious political decision aimed at
MD45,8
1262

promoting regional economic development and socio-political identity, like theEuropean Union model, or it may manifest the herd instinct of governments that wantto postpone fundamental decisions and just follow the trend of the moment (Hveem,2000). Whatever the case, there are a number of economic arguments in favour ofpromoting regional trade.
On the supply side, there is the potential of standardization and economies of scale,that is, the disseverance of quality production processes that are very sensitive toproximity, particularly as a consequence of reduced logistics costs. On the demandside, in theory proximate countries should have similar spending habits, at least moresimilar than those in countries that are far apart. Gravitational models can explain thepower of proximity in general, and test whether dividing a region into subregions ismore relevant than using the “common border” variable. Policymakers need to decidewhether organizing a regional trading bloc, which aligns the economies within a regionmore closely with one another, provides greater benefits than trade liberalization on amost-favoured-nation (MFN) basis, which aligns their economies more closely with theworld economy at large, giving them a competitive edge while increasing the exposureto external shocks. For the trading community, these government decisions, especiallyany brusque rudder shifts, can make or break their business plans.
In the case of East and Southeast Asia, regional trade has resulted from thegeographical dispersion of production processes, with lower-wage countries absorbingthe labour-intensive segments and intermediate products dominating the intra-regionalexchange, that is, bringing the poorer ones into the export process. In the cases ofAfrica, Latin America and the Caribbean, regional trade seems to be the result of thepolitical will that inspired the subregional integration trends of the last three decades.
What represents an effective pro-poor, South-South trade development strategy? Howwould its emphasis substantively differ from that of a strategy focusing on theSouth-North axis? What are the implications for those institutions, public and private,concerned with delivering support services to the business community and “the poor”?An effective, pro-poor South-South trade development strategy will not differ muchfrom a North-South one in its tools and objectives. That said, South-South tradepromotion activities based on bilateral, subregional and regional approaches mayprofit from economies of scale and the comparative advantages resulting fromcross-border linkages and low factor costs. As pointed out above, it is in the mutualknowledge of neighbours that the training ground for exporting at a manageable scalecan be nurtured rather than aiming for North markets that require large volumes andexacting quality control, packaging and corporate social responsibility (CSR)standards. For instance, the 179 European Union GSP-plus beneficiary countriesneed to demonstrate that their economies are “dependent and vulnerable” and that theyhave ratified and are effectively implementing 27 international conventions related tolabour rights, the environment and governance, including the International Covenanton Civil and Political Rights, the International Covenant on Economic, Social andCultural Rights, the International Convention on the Elimination of all Forms of RacialDiscrimination, the Convention on the Elimination of all Forms of DiscriminationAgainst Women, the Convention on the Prevention and Punishment of the Crime ofGenocide, the Convention Against Torture and Other Cruel, Inhumane or DegradingTreatment or Punishment, the Conventions on the Rights of the Child, the Minimum
South-Southtrade
1263

Age for Admission to Employment (ILO 138), the Prohibition and Immediate Actionfor the Elimination of the Worst Forms of Child Labour (ILO 182), the Abolition ofForced Labour Convention (ILO 105), the Forced Compulsory Labour Convention (ILO29), the Discrimination with Respect to Employment and Occupation Convention (ILO111), the Freedom of Association and Protection of the Right to Organize Convention(ILO 87), the Application of the Principles of the Right to Organize and BargainCollectively Convention (ILO 98), the International Convention on the Suppression andPunishment of the Crime of Apartheid, the Montreal Protocol on Substances thatDeplete the Ozone Layer, the Basel Convention on the Control of Trans-BoundaryMovements of Hazardous Waste and their Disposal, the Stockholm Convention onPersistent Organic Pollutants, the Convention on International Trade in EndangeredSpecies, the Convention on Biological Diversity, the Cartagena Protocol on Bio-Safety,the Kyoto Protocol to the UN Framework Convention on Climate Change, the UNSingle Convention on Narcotic Drugs (1961), the UN Convention on PsychotropicSubstances (1971), the UN Convention against Illicit Traffic in Narcotic Drugs andPsychotropic Substances (1988) and the UN Convention Against Corruption (2003):
EuropeAid external assistance programmes. The European Commission has implemented asound tool for developing country traders and investors through its EuropeAid externalassistance programmes since 1993. Aimed at the promotion of international long-termcooperation between SMEs from the European Union and Latin America (AL-INVEST), Asia(Asia-INVEST), Africa, the Caribbean and the Pacific (EU-ACP); Southeast Europe (CARDS);Eastern Europe and Central Asia (TACIS); the southern Mediterranean, Near and MiddleEast (MEDA), it promotes the organization of small-scale, sector-oriented business meetings.They run parallel to ProeInvest, a EU-ACP partnership programme that is financed by theEuropean Development Fund. Nothing impairs the triangulation of initiatives and thedevelopment of South-South networks as a consequence, with trade facilitation as the mostproximate target.
What pro-poor, South-South trade development programmes work and what is thesecret behind their success?There is no simple answer to this query. Each case will depend on the direction of thetrade flows (inter-regional, regional, subregional, bilateral), the sectors targeted, thesophistication of the national private sectors, the reach and aptitude of the governmentagencies involved, the value added in the process and the distribution of benefits alongthe value chains, the available incentives and deterrents, the specific pro-poor policiestargeted (growth, education, health, human rights, personal security), etc. Noone-size-fits-all nostrums here. It also raises a philosophical question – whether thebusiness community is willing and able to apply its market clout to build up localspending power, a skilled workforce and other elements necessary for sustainablebusiness growth. Businesses can improve their financial performance by re-investingin the communities where they thrive. A North-South, public-private cooperationinitiative in Ethiopia with South-South spill-over effects for the rest of the continent canserve as an example:
Multi-stakeholder cooperation to combat poverty. Dometic AB of Sweden is the world’s leadingalcohol appliance manufacturer. In 1995 it joined the Project Gaia Ethiopia, which aims atrevolutionizing the household energy economy of Ethiopia. Currently, Ethiopia imports all ofits petroleum fuels, with sizeable impact on its balance of trade. At the same time, Ethiopia
MD45,8
1264

has a sugar industry that can produce 8,000,000 litres of ethanol per year from sugar canewaste. Dometic redesigned its renowned non-pressure alcohol stove for production at anaffordable price in Ethiopia without sacrificing quality or performance. This project hasprofound economic and environmental significance for Africa as a whole, where about 60percent of the continent depends on traditional biomass fuels. Besides, as most Africancountries are dependent on petroleum imports, domestically produced alcohol fuels can savevaluable foreign exchange. The success of the project is not an isolated effort by onecorporation that owns advanced stove production technology but rather a multi-stakeholder,long-run initiative that involves governments, foreign investors and African businesses.
Given that a South-South focus may not address fundamental competitiveness issues,could a preoccupation with South-South trade represent, in the longer term, a“development trap”, which will have serious implications for the poor, as well as for thenational export development effort?This is a question that reflects a prejudice of the past – that know-how andtechnological advancement are in the exclusive domain of a handful of developedcountries. Although this is true of many knowledge-intensive industries, theexpanding global presence of trade behemoths like China, India, Korea or Brazilwinning, for example, international tenders to modernize nuclear facilities in Australiaor operate the Panama Canal ports and free trade zone, the second largest in the world,show that the goods and services offered by the value chains of the South are not onlyabundant but increasingly sophisticated. Likewise, the convenience of a South-Southcollaboration over a North-South one needs to be analyzed on its merits and in light ofthe national interests involved so that the “baubles-for-commodities” schemes thatcharacterized colonial rule in the nineteenth century are not replicated under the guiseof South-South cooperation.
In sum, it is safe to predict that South-South trade, investment and technologysharing will continue to play an important role in developing country trade, especiallyin the Asian Pacific region. However, discipline within its ranks will be hard tomaintain as major developing countries undergo mounting pressures to assume fullersystemic commitments, not only in the case of middle-income countries but alsoincluding the graduation of borderline LDCs. Moreover, the most importantdevelopment would ultimately be the change of status of China and India, awayfrom the developing country lot and assuming the benefits and leadershipresponsibilities of the core, like joining the Group of Eight (G8), the Organisation forEconomic Co-operation and Development (OECD) and having a bigger role in theBretton Woods institutions. This would entail that any long-term strategy counting onconcessions from China and India, especially in the case of middle-income countries,may not reach very far.
Only a multi-stakeholder composite, aiming for overall efficiency, will allow for thepublic sector-private sector interaction needed at this juncture for the development ofthe South, when international wars and terrorism are a condition of the world economy,the system of production continues to undergo fundamental transformations, and newactors ascertain their spheres of influence. All developing countries and their SMEsface options they cannot postpone and that require the interaction of an aggressiveprivate sector, willing to take chances; the intervention of governments providing notonly the right macroeconomic environment but also effective, proactive assistance tointernational private efforts; the deepening of cross-border regional integration with
South-Southtrade
1265

the aim of creating economies of scale for a more efficient allocation of resources andconvergence with the world economy (which may mean joining one internationalsupply chain over another); and the enlightened support of those regional andinternational organizations that can help level the playing field of international trade,investment, technology transfer and the free movement of workers.
Note
1. Obtaining LDC status is not automatic. Based on a report by the Committee for DevelopmentPolicy (Department of Economic and Social Affairs, United Nations Secretariat), theEconomic and Social Council (ECOSOC) makes a recommendation to the United NationsGeneral Assembly (UNGA), which is responsible for the final decision on the list of LDCs,that is, including new ones, and maintaining and “graduating” others. The WTO Secretariatadopts the UNGA decision and applies its special and differential treatment (SDT)provisions for LDCs.
References
Baldwin, R. (2006), “Multilateralising regionalism: spaghetti bowls as building blocs on the pathto global free trade”, Discussion Paper No. 5775, Centre for Economic Policy Research,London, available at: www.cepr.org/pubs/dps/DP5775.asp
Berg, A. and Krueger, A. (2003), “Trade, growth and poverty: a selected survey”, IMF WorkingPaper WP/02/20, International Monetary Fund, Washington, DC, available at: www.imf.org/external/pubs/ft/wp/2003/wp0330.pdf
Cernat, L. and Laird, S. (2003), “North, south, east, west: what’s best? Modern RTAs and theirimplications for the stability of trade policy”, Paper No. 03/11, Centre for Research inEconomic Development and International Trade (CREDIT), University of Nottingham,Nottingham, available at: http://papers.ssrn.com/sol3/papers.cfm?abstract_id ¼ 456941
Commission on the Private Sector and Development (2004), “Unleashing Entrepreneurship:Making Business Work for the Poor”, Report to the Secretary General of the UnitedNations by the Commission on the Private Sector and Development, United NationsDevelopment Programme, New York, NY, available at: www.undp.org/cpsd/documents/report/english/fullreport.pdf
Crawford, J.-A. and Fiorentino, R.V. (2005), “The changing landscape of regional tradeagreements”, Discussion Paper No. 8, World Trade Organization, Geneva, available at:www.wto.org/english/res_e/booksp_e/discussion_papers8_e.pdf
Dee, P. and Hanslow, K. (2000), “Multilateral liberalisation of services trade”, ProductivityCommission Staff Research Paper, Ausinfo, Canberra, available at: www.pc.gov.au/research/staffres/multilatlib/index.html
Department of Foreign Affairs and Trade (2004), South-South Trade: Winning fromLiberalization, Department of Foreign Affairs and Trade, Commonwealth of Australia,Barton, available at: www.dfat.gov.au/publications/south_south/south_south_trade.pdf
Devlin, R. and Estevadeordal, A. (2002), “Trade and cooperation: a regional public goodsapproach”, PECC Trade Forum CD: Key Issues on RTAs: Analyses and Conclusions 2001through 2003, Pacific Economic and Cooperation Council, Singapore, available at: www.pecc.org/publications/papers/trade-papers/1_SII/8-devlin.pdf
Devlin, R. and French-Davis, R. (1998), “Towards an evaluation of regional integration in LatinAmerica in the 1990s”, Working Paper No. 2, INTAL-ITD, available at: www.iadb.org/intal/aplicaciones/uploads/publicaciones/i_INTALITD_WP_02_1998_Devlin.pdf
MD45,8
1266

Earthscan Publications (2003), Making Global Trade Work for People, coordinated by K. Malhotra,Earthscan Publications for the United Nations Development Programme, London,available at: www.undp.org/mdg/globaltrade.pdf
Freudenberg, M. and Paulmier, T. (2005), A Comparison of Tariff and Non-Tariff Barriers inEast Asia, EU and NAFTA, International Trade Centre UNCTAD/WTO, Geneva.
Greenaway, D. and Milner, C.R. (1990), “South-South trade: theory, evidence and policy”,The World Bank Research Observer, Vol. 6 No. 1, pp. 47-68, available at: http://ideas.repec.org/s/oup/wbrobs.html
Hausmann, R. and Rodrik, D. (2002), “Economic development as self-discovery”, NBER WorkingPaper No. 8952, May, available at: www.nber.org/papers/w8952
Havrylyshyn, O. (1985), “The direction of developing country trade: empirical evidence ofdifferences between South-South and South-North trade”, Journal of DevelopmentEconomics, Vol. 19 No. 3, pp. 284-314.
Hveem, H. (2000), “Regionalism, trade blocs and globalization: contradictions andcomplementarities”, paper presented at The Comparative Politics Conference 2000, Chr.Michelsens Institute, Bergen, 21 September, available at: http://home.no.net/, enok/tekst/hveem.htm
Kahnert, P., Richards, P., Stoutjesdijk, E. and Thomopoulos, P. (1969), Economic IntegrationAmong Developing Countries, OECD Development Centre, Paris.
Khor, M. (2000), Globalisation and the South: Some Critical Issues, Third World Network, Penang.
Kulkarni, P. (2004), “South-South cooperation: trade as a means!”, Viewpoint Paper No. 1, Centrefor International Trade, Economics and Environment, Consumer Unity and Trust Society(CUTS-CITEE), Jaipur, available at: www.cuts-international.org/view-1.doc
Kuwayama, M. (2005), “Latin American South-South integration and cooperation: from aregional public goods perspective”, Comercio internacional, No. 50, February,LC/L.2245-P/I, United Nations Economic Commission for Latin America and theCaribbean, Santiago, available at: www.eclac.cl/publicaciones/Comercio/5/LCG2245PI/lcl2245i.pdf
Ministerio do Desenvolvimento, Industria e Comercio Exterior (2006), Indicadores e Estatısticasde Comercio Exterior, Ministerio do Desenvolvimento, Industria e Comercio Exterior,Brasilia, available at: www.desenvolvimento.gov.br/sitio/secex/depPlaDesComExterior/indEstatisticas/balComercial.php and http://trade.ec.europa.eu/doclib/docs/2006/may/tradoc_113359.pdf
Møen, J. (1998), “Trade and development: is South-South co-operation a feasible strategy?”,Forum for Development Studies, No. 2, Norwegian Association for Development Research(NFU) and Norwegian Institute of International Affairs (NUPI), Tromsø, available at:www.nupi.no/IPS/filestore/FDS-2-98-Moeen.pdf
Puri, L. (2005), “Towards a new trade ‘Marshall Plan’ for Least Developed Countries: how todeliver on the Doha Development promise and help realize the UN MillenniumDevelopment Goals?”, Trade, Poverty and Cross-cutting Development Issues Study SeriesNo. 1, United Nations, New York, NY/Geneva, available at: www.unctad.org/en/docs/ditctabpov20051_en.pdf
Robson, P. (1987), The Economics of International Integration, Unwin Hyman, London.
Santos-Paulino, A.U. (2005), “Trade liberalisation and economic performance: theory andevidence for developing countries”, The World Economy, Vol. 28 No. 6, available at: www.blackwell-synergy.com/doi/abs/10.1111/j.1467-9701.2005.00707.x
South-Southtrade
1267

Soubbotina, T.P. (2004), Beyond Economic Growth: An Introduction to Sustainable Development,World Bank, Washington, DC.
South Centre (2005), Strengthening the South in International Trade-Related Negotiations: WorkProgramme on Trade Development: Annual Report 2004, South Centre, Geneva, availableat: www.southcentre.org/tadp_webpage/annual_reports/annualreport_2004.pdf
Sutherland, P., Bhagwati, J., Botchwey, K., FitzGerald, N., Hamada, K., Jackson, J.H., Lafer, C. andde Montbrial, T. (2004), The Future of the WTO: Addressing Institutional Challenges in theNew Millennium, Report by the Consultative Board to the Director-General SupachaiPanitchpakdi, World Trade Organization, Geneva, available at: www.wto.org/english/thewto_e/10anniv_e/future_wto_e.pdf
United Nations Conference on Trade and Development (2004a), “UNCTAD Handbook ofstatistics on-line”, available at: www.unctad.org/Templates/Page.asp?intItemID ¼1890&lang ¼ 1
Ventura Dias, V. (1989), South-South Trade: Trends, Issues, and Obstacles to its Growth, Praeger,New York, NY.
Wang, Y. and Schiff, M. (2004), “On the quantity and quality of knowledge: the impact ofopenness and foreign research and development on North-North and North-Southtechnology spillovers”, Policy Research Working Paper No. 3190. World Bank,Washington, DC, available at: http://wdsbeta.worldbank.org/external/default/WDSContentServer/IW3P/IB/2004/03/09/000012009_20040309144210/Rendered/PDF/WPS3190.pdf
World Bank (2002), Globalization, Growth and Poverty: Building an Inclusive World Economy,World Bank, Washington, DC, available at: http://econ.worldbank.org/external/default/main?entityID ¼ 00094946-0202020411335&menuPK ¼ 64168101&piPK ¼ 64168089&theSitePK ¼ 477826
World Bank (2004), Global Economic Prospects 2004: Realizing the Development promise of theDoha Agenda, World Bank, Washington, DC, available at: www.worldbank.org/prospects/gep2004/full.pdf
World Bank (2006), “World Development Indicators on-line, key development data & statistics”,World Bank, Washington, DC, available at: http://web.worldbank.org/WBSITE/EXTERNAL/DATASTATISTICS/0,contentMDK:20535285 , menuPK:1192694 ,pagePK:64133150 , piPK:64133175 , theSitePK: 239419,00.html
World Trade Organization (2004), World Trade Report 2003, I.B.1, “Selected features ofSouth-South trade developments in the 1990-2001 period”, World Trade Organization,Geneva, available at: www.wto.org/english/res_e/booksp_e/anrep_e/world_trade_report_2003_e.pdf
Further reading
Cernat, L. (2003), “Assessing South-South regional integration: same issues, many metrics”,Policy Issues in International Trade and Commodities Study Series, No. 21, United NationsConference on Trade and Development, New York, NY/Geneva, available at: www.unctad.org/en/docs//itcdtab22_en.pdf
Charlton, A.H. and Stiglitz, J.E. (2005), “A development-friendly prioritisation of Doha Roundproposals”, The World Economy, Vol. 28 No. 3, available at: http://users.ox.ac.uk/, sjoh1420/twe.pdf
Cutler, J., Chow, K., Chan, C. and Li, U. (2004), “Intra-regional trade and the role of MainlandChina”, Hong Kong Monetary Authority Quarterly Bulletin, 41, December.
MD45,8
1268

Hertel, T.W. and Keeney, R. (2005), “What’s at stake: the relative importance of import barriers,export subsidies and domestic support”, in Martin, W. and Anderson, K. (Eds),Agricultural Trade Reform and the Doha Development Agenda, PalgraveMacmillan/World Bank, Washington, DC, chapter 2, available at: http://wdsbeta.worldbank.org/external/default/WDSContentServer/IW3P/IB/2005/11/09/000012009_20051109134944/Rendered/PDF/34206.pdf
Isogai, T., Morishita, H. and Ruffer, R. (2002), “Analysis of intra- and inter-regional trade in eastAsia: comparative advantage structures and dynamic interdependency in trade flows”,International Department Working Paper Series 02-E-1, Bank of Japan, Tokyo, availableat: www.boj.or.jp/en/ronbun/02/data/iwp02e01.pdf
United Nations Conference on Trade and Development (2004b), “Some key issues in South-Southtrade and economic cooperation: outcome and papers presented to the Workshop on Trade,Doha High-level Forum on Trade and Investment, Doha, 5-6 December”,UNCTAD/DITC/TNCD/2005/6, available at: www.unctad.org/en/docs/ditctncd20056_en.pdf
United Nations Conference on Trade and Development (2005), Expert Meeting on PositiveCorporate Contributions to the Economic and Social Development of Host DevelopingCountries, United Nations Conference on Trade and Development, Geneva, available at:www.unctad.org/en/docs/c2em17d2_en.pdf
Zebregs, H. (2004), “Intraregional trade in emerging Asia”, IMF Policy Discussion PaperNo. 04/01, International Monetary Fund, Washington, DC, available at: www.imf.org/external/pubs/ft/pdp/2004/pdp01.pdf
About the authorOsvaldo R. Agatiello is Professor of International Economics at the Geneva School of Diplomacyand International Relations. As a consultant to international organizations and advisor tonational governments, Dr Agatiello specializes in international finance and trade, governanceand corporate responsibility, issues on which he has published extensively. Dr Agatiello studiedinternational economics and law at the Fletcher School of Law and Diplomacy of Massachusetts(MALD, PhD) and the universities of Cordoba (SJD) and Buenos Aires (JD) in Argentina. OsvaldoR. Agatiello can be contacted at: [email protected]
South-Southtrade
1269
To purchase reprints of this article please e-mail: [email protected] visit our web site for further details: www.emeraldinsight.com/reprints

The South African poor Whiteproblem in the earlytwentieth centuryLessons for poverty today
Johan FourieDepartment of Economics, University of Stellenbosch,
Stellenbosch, South Africa
Abstract
Purpose – The purpose of this paper is to assess whether any meaningful lessons can be learnedfrom South Africa’s early twentieth century experience of White poverty and to what extent suchlessons can be applied in order to combat Black poverty today.
Design/methodology/approach – This paper uses quantitative measures to assert the scale ofpoverty for both White and Black poverty in the two periods. An extensive discussion of the causes ofpoverty in both periods concludes with specific policy implications for today. Because of the uniquecharacteristics and history of South Africa, this paper provides a unique dimension to povertyanalysis.
Findings – The paper suggests that three key policy lessons can be learned from thetwentieth-century effort to combat White poverty and applied to Black poverty as it exists in SouthAfrica today: an improvement in the quality of education, an improvement in the property rightownership of the poor, and policies to eliminate the constraints on economic growth, by investment, forexample, in infrastructure and new technological industries.
Research limitations/implications – Caution is advised when comparing past eras with thepresent; in comparing two periods that differ widely, only tentative recommendations is possible.
Originality/value – Since many areas of the world are faced with the difficult task of eradicatingpoverty, attempts that, to any extent, are successful are of interest and contribute positively to thedevelopment of the available knowledge base. The time-span and design of this paper offers a uniqueperspective on poverty eradication efforts.
Keywords Apartheid, Empowerment, Poverty, Racial discrimination, South Africa
Paper type Research paper
IntroductionAlthough White poverty was not unheard of during the first two centuries of Whitecolonialisation in South Africa (Coetzee, 1942, p. 23), the extreme poverty of the Whitepoor had become much more evident by the early 1880s (Terreblanche, 2002, p. 266).Half a century later, by the early 1930s, eradicating White poverty became a social,economic and political objective of the government in power at the time. In an attemptto address the problem, the Carnegie Commission of 1932 investigated the causes andconsequences of the poor White phenomenon, as well as the corrective measures thatcould be adopted to overcome it[1]. As a result, at least in part, of these and earlier
The current issue and full text archive of this journal is available at
www.emeraldinsight.com/0025-1747.htm
The author gratefully acknowledges the helpful comments made by Servaas van der Berg,Sampie Terreblanche, Megan Louw, Derek Yu and two anonymous referees.
MD45,8
1270
Management DecisionVol. 45 No. 8, 2007pp. 1270-1296q Emerald Group Publishing Limited0025-1747DOI 10.1108/00251740710819032

policies, as well as other factors and events discussed in the current paper, the problemof White poverty was solved four decades later.
However, more than seven decades later, South Africa is still struggling to overcomethe poverty of its poorest population sectors. By 2000, almost half the Black populationcould have been considered to be poor. Black poverty has regained prominence ingovernment circles as a key policy concern since the democratic elections of 1994. Inshort, the task of alleviating Black poverty seems to be insurmountable.
The rationale for comparing White poverty in the 1930s with Black poverty today isbased on the knowledge that White poverty of the 1930s had mostly been alleviated bythe 1970s, or even earlier[2]. The current South African government aims to eradicateBlack poverty. Caution is, however, advised when comparing past eras with the present;making strong judgments about, and claiming hard evidence for, such comparisons oftenresult in subjective and incomplete assessments. In comparing two periods that differwidely, only the making of “soft” judgments and tentative recommendations is possible.
A comparison between White poverty, as it existed in the 1930s, and Black poverty,as it exists today, reveals a number of similarities in the policies adopted in an effort tocounter it. The causes of poverty in the two eras also overlap in many ways. Drawingfrom historical experience, this study hopes to add to the existing debate on possiblepolicy recommendations for alleviating Black poverty today.
Comparison of the scale of povertyWhite povertyAttempting to compare the extent of White poverty of the 1930s with that of Blackpoverty of today is an ambitious undertaking. Not only does the economic, social andpolitical landscape differ, but the tools and techniques used for poverty analysis havechanged considerably since the 1930s. The inadequacy of statistical record keepingduring the 1930s renders the possibility of making a comparative analysis difficult.Still, in an attempt to draw conclusions about the policies implemented at the time thatwill have relevance for today, to compare the nature and scale of the two experiences ofpoverty is of critical importance.
Although the magnitude of the poor White problem is a much debated issue, mostearly estimates suggest a rapid increase in the numbers of poor Whites over the firstthree decades of the twentieth century. According to Lewis (1973, p. 7), the TransvaalIndigency Commission (1906-1908) maintained less than comprehensive dataregarding the poor White situation and “found it difficult to form any accurateestimate even of the number of urban poor Whites” that existed at the time. The firstofficial statistics to be announced were those cited by H.C. van Heerden, Minister ofAgriculture, at a conference convened by the Dutch Reformed Church (DRC) inCradock in 1916 (see Table I).
Numbers Per cent of population
Ultra-poor 39,021 3.06Poor 67,497 5.29Total 106,518 8.35
Source: Botha (1956, p. 159)
Table I.Estimate of poor Whites,
1916
South Africanpoor Whites
1271

Although such data remained on the official records[3], Grosskopf and Deel (Book I,1932, p. 20) argues that the estimates made were unreliable, as each interviewee useddifferent standards for identifying who were to be categorised as “poor” and“ultra-poor”. According to Lewis (1973, p. 8), the general difficulty experienced withestimates of poor White statistics is that they tend inevitably to suffer fromsubjectivity.
Probably the most reliable estimate of the magnitude of the poor White problemwas expressed by the Carnegie Commission of 1932. Questionnaires sent out to almosthalf the schools in the country asked principals to indicate how many children camefrom “very poor” families. The returned questionnaires indicated that about 17.5 percent of the 49 434 families were regarded as “very poor”. According to Grosskopf andDeel (Book I, 1932, p. vii), if the 17.5 per cent is extrapolated to the total Whitepopulation of 1 800 000 at the time, then a “conservative estimate” of the extent ofsevere poverty would be around 300,000 individuals. The questionnaires werecompleted during 1929-1930, before the effects of the depression became evident. Tocheck the accuracy of such data, the Commission took into consideration the number ofWhite males over 15 working as shepherds, foresters and woodmen, bywoners,labourers on the railways, labourers in general, unskilled industrial workers, transportriders and diggers, as reported in the 1926 census. Assuming that the job situation hadremained the same for the five years preceding their study, they concluded that suchnumbers represented a population group of more than 220,000 in existence at the time.Although not all of the individuals working in such jobs could necessarily beconsidered poor, the Commission argued that the number of individuals living inpoverty was, in fact, likely to have been even more extensive if farmers (totalling morethan 100,000) were considered as poor, as, indeed, many farmers were considered to beat the time (Grosskopf and Deel, Book I, 1932, p. vii). According to Lewis (1973, p. 9), itwas not possible for the Commission to cement their poor White farmer claim until1941, when the cash incomes of farmers were first enumerated for census purposes.
However, some commentators have since argued that the poor White problem wasnever as severe as once was thought. According to Le Roux (1984, p. 3), the estimatesmade in terms of the many investigations undertaken were “totally off the mark”. Heargues that the poor White problem was much more a case of rural poverty, which hadexisted since the beginnings of the first White settlements at the Cape, being openlydeclared (Le Roux, 1984, p. 3). Grosskopf and Deel (Book I, 1932, p. 8) agrees to someextent: “There are many indications that the rural poor did not actually grow poorer,but rather by comparison with other groups, and that on this account many of them leftthe farms of their own choice to look for better chances.”
Such arguments question the established reasoning that the poor White problemmanifested as a sudden increase in the number of poor Whites living in South Africa.Although the size of the White population did increase, overall the apparent rise inWhite poverty tended more to be due to an increase in relative poverty; as the wealth ofother Whites grew, the lower class of Whites, left behind by the rapid increases inwealth experienced by the middle and upper classes, came to join the ranks of the poor.
Black povertySince the arrival of Whites in the interior of the country, an unequal society developed,in which the majority of the poor were Black, rural and unemployed[4]. Although the
MD45,8
1272

wages of Blacks began to increase in the 1970s, by the beginning of the 1990s close tohalf of the Black population still subsisted below the poverty line. With the advent ofthe new democratic government in 1994, the eradication of Black poverty emerged asthe primary objective of the ANC-led government. The new government becameresponsible for alleviating poverty within the context of an economy that had beenstagnating, mostly as a result of the economic sanctions imposed against ApartheidSouth Africa. The Reconstruction and Development Programme (RDP) and theGrowth, Employment and Redistribution (GEAR) Programme were two earlygovernment programmes designed to promote economic growth and to target keyareas in order to alleviate Black poverty. Various other policy documents, reports andconferences have since addressed the problem of Black poverty on a more micro level.The Accelerated and Shared Growth Initiative of South Africa (ASGI-SA) is currentlyattempting to reach a 6 per cent growth target by targeting the country’s constraints –in terms of both infrastructure and human capital – in an attempt to reduce theexisting levels of poverty.
However, Black poverty remains a serious problem. By 2000, according to Van derBerg and Louw (2004, p. 567), 44 per cent of the Black population could still beconsidered poor.
The evidence provided in Tables II and III suggests that, although the number ofBlack poor, as a percentage of the total Black population, declined between 1995 and2000, the levels of absolute poverty increased, while the levels of inequality betweenthe more affluent Black population and the Black poor also widened. Van der Berg andLouw (2004, p. 568) estimate what the path of poverty might have been had the Ginicoefficient remained the same for the Black population between 1970 and 2000[5]. Theyfind that aggregate poverty would have declined from 49.8 per cent in 1970 to 26.5 percent in 2000, rather than to the actual 38.6 per cent actually observed in 2000. Althoughthe percentage of poor Blacks did decrease in the three decades prior to 2000, it seemedto have come at the high cost of greater inequality within the Black community as awhole.
1970 1975 1980 1985 1990 1995 2000
Number of Blacksliving in poverty 10,397,430 9,761,669 10,427,844 12,003,438 13,026,970 15,311,490 16,400,691Percentage ofBlacks living inpoverty 64.60 52.90 49.30 49.10 45.90 48.40 47.40
Source: Van der Berg and Louw (2004)
Table II.Estimates of poverty
headcount and povertyheadcount ratio for
Blacks 1970-2000
1975 1993 1995 1996 2000
Gini coefficient for Blacks 0.49 0.56 0.57 0.68 0.59
Source: Van der Berg and Louw (2004)
Table III.Gini coefficients
estimated from varioussurveys of Black
intra-group distribution
South Africanpoor Whites
1273

Comparative evidenceUsing data found in the Wilcocks (1932) report to the Carnegie Commission anddrawing on the AMPS (All Media and Products Survey) South African AdvertisingResearch Foundation (2004) dataset, Table IV provides a comparison of the extent ofWhite poverty in 1930 with that of Black poverty in 2000[6]. The Wilcocks report in theCarnegie Commission (Wilcocks, Book II, 1932, p. 66) lists the annual income of poorWhite families living in the former Natal. The original estimates were provided by theDepartment of Public Education in Natal, which conducted a thorough investigation ofeach applicant to an educational aid programme[7]. The applicant families wereseparated into four classes: those earning less than £25 per year (Class 1); thoseearning between £26 and £50 per year (Class 2); those earning between £51 and £75per year (Class 3); and those earning between £76 and £100 per year (Class 4)[8]. Thesepoverty lines are inflated to 2000 levels, with a poverty line of R3 571 per year for Class 1;R7 143 per year for Class 2; R10 714 per year for Class 3; and R14 286 per year for Class4 is estimated. Class 1 in the AMPS data set, therefore, represents the proportion ofBlacks earning less than R3 571 per year in the population of Blacks earning less thanR14 286. The figures for the other classes are estimated in a similar way. This providescomparable percentages for the estimates of White and Black poverty, of which theresults are shown in Table IV.
The evidence suggests that the extent of Black poverty in existence in 2000 wasmuch more severe than the extent of White poverty experienced in the 1930s, evengiven the limitations of the data assembling and recording methods. Whileapproximately 20 per cent of the poor White families interviewed in the 1930s(therefore, those earning less than R14 286 in terms of 2000 prices) fell below the Class1 poverty line, nearly 60 per cent of Blacks who were recorded as earning less than R14286 in 2000 could be considered to belong to Class 1. Although the gap is smaller at theClass 2 and Class 3 poverty lines, the number of the ultra-poor Black subpopulation isstill much larger than the number of White poor falling into the same categories in the1930s. It is not possible to make inferences about the White income distribution aboveR14 286 in terms of 2000 prices, because the interviews conducted with White familieswere only recorded if these families earned less than that amount annually. However, itis possible to conclude that the distribution of income for poor Blacks in 2000 lies wellto the left of the distribution of income for poor Whites at the start of the 1930s.
The evidence presented here suggests that both absolute and relative Black povertytoday is far more severe than the absolute and relative poverty endured by someWhites during the 1930s. Solutions aimed at alleviating the current problem may,therefore, be far more difficult to find.
Carnegie Class 1 Carnegie Class 2 Carnegie Class 3(R3 571) (R7 143) (R10 714)
(%) (%) (%)
Poor Whites (Carnegie, 1932) 19.35 60.22 83.33Blacks (AMPS, 2000) 59.32 84.41 94.74
Source: Wilcocks (1932); SAARF (2004)
Table IV.Comparison of thenumber of White poor in1930 with the number ofBlack poor in 2000
MD45,8
1274

Causes of povertyA number of causes have been suggested for the observed increase in White poverty atthe start of the previous century. Poor Whites tended to find scapegoats for theirsituation and thereby implicated the “capitalists, the Jews, the locusts and thedroughts” (Lewis, 1973, p. 10). Later explanations for the poor White problem,including those contained in Afrikaner nationalist propaganda, tended to blameexogenous factors, such as the colonial exploitation of the British, the Anglo-Boer War,the rinderpest outbreak of 1896-1897 or cheap imports of maize from the AmericanSouth. Although these factors indeed did contribute to White poverty, the poor Whiteproblem – as is the case with Black poverty today – developed due to a multitude ofdifferent factors, both exogenous and endogenous. Rising poverty levels take placeover time; Pelzer (1937, p. 4), for example, already noted in 1937 the importance ofadopting a long-term perspective towards investigating the determinants of the poorWhite problem. Historical factors, educational attainment, labour policies,environmental and demographic changes, language, culture and politicaldevelopment all served as factors that shaped a society that, though experiencing anincrease in absolute poverty, experienced an even sharper increase in inequality levels.
Similar to the poor White problem experienced during the 1930s, Black povertytoday has been explained as resulting from various factors. The segregationist policiesleading up to the implementation of apartheid policies, as well as those practicesimplemented in terms of the latter are often seen collectively as being the main cause ofBlack poverty. Yet, without suggesting that such policies did not contribute to Blackpoverty, this paper argues that there are also other underlying reasons for the extent ofBlack poverty suffered today. Similar to the poor White problem, Black poverty iscaused by a mix of exogenous and endogenous factors, including historical factors,inadequate and irrelevant educational policies, discriminatory labour policies, shiftingdemographic trends, linguistic and cultural barriers, and political short-sightedness.This section investigates the causes of both the poor White problem of the past and theBlack poverty of today, and identifies the links between the two periods under review.
EducationAn important cause of poverty in both periods can be found in the poor educationalattainment (or insufficient accumulation of human capital) of the poor. Lewis (1973,p. 13), for example, notes that a lack of proper education is the key factor that wasemphasised by all the commissions investigating the poor White problem.
The education policy of the first White settlers in South Africa was founded in thedoctrine of Protestantism, which emphasised the salvation of individuals by faiththrough personal knowledge of the Bible (Malherbe and Deel, 1932, p. 14). Therefore, inorder to study the Bible, both the Cape settlers and the trekboere strove for high rates ofliteracy. The basic education provided by parents had only one goal: to allow childrento become members of the church and therefore eligible for marriage. Such educationwas, therefore, primarily religious and conservative in nature, which was exacerbatedby the inherent conservatism of the settlers themselves (Lewis, 1973, p. 14)[9]. Yet,these educational practices did not keep abreast of the evolving economic and politicaltrends of the time. Such conservatism assumed that what had worked best in the past,must also, essentially, be best for the future. The opening of the interior, accompaniedby a sharp increase in the levels of urbanisation in the areas surrounding the diamond
South Africanpoor Whites
1275

and gold mines, caught many of the Whites of the time unawares and made pasteducational practices irrelevant.
The missionary schools that were established by the state after 1841 (Malherbe andDeel, 1932, p. 38) were attended by Black, coloured and White students, although someschools catered exclusively for White students. Many teachers were imported fromEngland, bringing with them new teaching methods and content. However, therequirement that all education be in High Dutch until 1910 did not help to furthereducation at a primary or secondary level; High Dutch was almost as foreign alanguage to Afrikaner children as it was to English children (Lewis, 1973, p. 15). In anattempt to address the resulting skills deficiency, the Cape Government establishedindustrial schools, initially for Blacks and coloureds, and much later for Whites, inorder to equip students with skills; however, the common perception was that suchschools tended to attract pupils with criminal tendencies and mental deficiencies(Lewis, 1973, p. 15). Furthermore, many programmes aimed at improving the skills ofthe youth did not reach the rural areas. Education was seen as an irrelevant luxury tothe rural population, as they saw it as irrelevant to their everyday struggles. Accordingto Malherbe and Deel (1932), p. 38), in a survey conducted by Inspector-General DonaldRoss in 1883, 55.4 per cent of the total White student population in school were inStandard I (Grade 3) or lower standards, while more than 80 per cent of the students inrural areas were in Standard I or lower. Only 1 per cent of students were in standardsabove Standard IV, which was equivalent to today’s Grade 6 (the first year of highschool) (Malherbe and Deel, 1932, p. 38).
The conservative lifestyles and views of education limited the development of skillsin industry, especially for the rural, White, Afrikaans-speaking population group – thegroup which would later also form the largest contingent of poor Whites (Malherbe andDeel, 1932, p. ix). According to Lewis (1973, p. 17), in addition to the low developmentlevels present in industry, the poor standard of education existing at the time alsoresulted in inadequate farming methods. Such techniques, in part, failed to lessen theseverity of the droughts experienced during the late nineteenth century, as the farmerslacked sufficient knowledge to be able to cultivate the farms in a more sustainable way.Furthermore, the low levels of education also led to widespread ignorance regardinghealth issues; when a certain Mr du Preez proposed a solution of tobacco, paraffin oil,resin and podaphyllin (wild mandrake root) as a cure for the 1896 rinderpest, whichremedy President Kruger endorsed, chemists sold out of podaphyllin in weeks, in spiteof the affected cattle still dying from the disease (Lewis, 1973, p. 17).
Black poverty today is partly a consequence of the deliberately discriminatoryeducational practices followed during the preceding five decades. According to Fiskeand Ladd (2004, p. 52), four aspects of apartheid were particularly pertinent for Blackeducation: the residential segregation measures adopted to induce poverty amongBlacks; the inadequate resources and low-quality instruction allotted to Black children;the low levels of educational attainment among Black adults, who had been deprived ofa sound primary and secondary education; and the absence of a “culture of learning”resulting from the deliberate under-resourcing of Black residential areas.
The Black Education Act of 1953 formalised the segregation of Black education,which had a severely negative impact on Black schooling (De Villiers, 1996, p. 194).State spending on missionary schools, once the backbone of Black education, ceased in1957, as the government of the day attempted to gain ideological control over the Black
MD45,8
1276

intelligentsia who were the product of a mission-based educational system (Marks andTrapido, 1987, p. 21). The rapid increase in the number of Black scholars exacerbatedthe shortage of funding; in 1953 the student/teacher ratio was 40:1 in Black schools,which had worsened to a ratio of 60:1 by 1974. Furthermore, by 1974, only slightlymore than 1 per cent of teachers in Black schools had a relevant degree andprofessional qualification (De Villiers, 1996, p. 194).
Despite the prevailing inadequacies in the educational system, the lack of funds wasnot the primary reason for the poor education of Blacks. The government’s policy ofseparate development, a discriminatory initiative that began much earlier than theelection of 1948 and which was promulgated by Dr Verwoerd, during his period of timein office as the Minister of Native Affairs, in 1954 subordinated the education of Blacksto that of Whites. Dr Verwoerd, the founding father of the “Grand Apartheid” policy,emphasised that Blacks should not have access to the same quality of education asWhites, as such access would only inculcate aspirations that they could not possiblymeet.
From 1954 to 1968 Black education was the responsibility of the Department ofNative Affairs. After 1968, Black education was split between the educationdepartments of the various artificially created “homelands” and the Department ofBantu Affairs. However, dissatisfaction with the poor quality of education and theinadequate supply of resources available to students erupted in the Soweto uprising of1976. The 1976 Soweto uprising, which Terreblanche (2002, p. 308) calls one of themost decisive events in South Africa’s political and economic history of the twentiethcentury, was the result of a government stipulation imposed earlier in the same yearthat certain subjects in Black schools had to be taught in Afrikaans, despite the factthat an insufficient number of teachers practising in such schools could, in fact, speakAfrikaans (Terreblanche, 2002, p. 350). Promulgation of the law resulted in an illegalmarch by thousands of school children in Soweto that ended violently in confrontationswith the police. The marchers demanded that the Black Education Act be abolishedand insisted on equal per capita education expenditure by the government, regardlessof race or gender; equal access to educational facilities; free and compulsory educationfor Blacks; equal pay for all teachers; and access for Black students to all universities(Davies, 1984). De Villiers (1996, p. 195) notes that, after the Soweto uprisings, Blackeducation was never again the same, as nearly all Black students openly opposed theapartheid regime. Ultimately, the government replaced the Black Education Act withthe Education and Training Act in 1979, suspended the compulsory teaching ofAfrikaans as a third language in all schools and considerably increased its expenditureon Black schools (De Villiers, 1996, p. 195).
Though expenditure on Black education continued to grow after 1994, theeducational outcomes remain unequal (Van der Berg, 2006), because, in practice, littlehas changed for Black students. Fiske and Ladd’s (2004) enumeration of theshortcomings of the earlier educational system is still relevant today: racial segregationremains evident while poverty persists among Blacks; many former Black schoolshave fewer resources than do the former White schools; and the quality of teachingdiffers quite significantly between former Black and White schools. Twopost-Apartheid surveys found that South African children performed amongst theworst in the world in an international comparative study of mathematics and sciencescores (Fiske and Ladd, 2004, p. 57). The poor performance of formerly Black schools
South Africanpoor Whites
1277

with respect to the delivery of adequately educated workers to the job marketcontinues to be one of the main causes of poverty and unemployment.
Demography and the environmentAlthough claimed to be the cause of the poor White problem by many intelligentsia ofthe time, the rinderpest of 1896-1897 and the Anglo-Boer War should rather be thoughtof as events that increased the pace at which White poverty became evident. Therinderpest was devastating to cattle farmers, killing close to a third of all cattle in theCape (Lewis, 1973, p. 22) and half of the cattle herds in the Transvaal (Giliomee, 2004,p. 270). Only two years later, and the British scorched-earth tactics adopted during theAnglo-Boer War severely affected agricultural production in the two Republics.According to Giliomee (2004, p. 270), almost 90 per cent of homesteads in the Free Statewere burned down during the conflict, while many crops and much equipment weredestroyed. In the Transvaal, 80 per cent of the cattle, 75 per cent of the horses and 73per cent of the sheep were killed (Giliomee, 2004, p. 270)[10]. More than 15,000 farmersdid not return to their farms after the war.
Although accelerating the process of rapid urbanisation, the events before the end ofthe nineteenth century played an even more central role in the urbanisation of a largepart of the White population. According to Terreblanche (2002, p. 264), mercantileintermediaries during the 1880s limited the ability of White farmers to developmodernised farming techniques. The chronic poverty of the farmers ensured theirdependence on credit facilities and a lack of both working and investment capital; thefarmers’ “mercantile ‘enslavement’ not only hampered the transition to commercialagriculture, but also helped to bankrupt smaller farmers on uneconomical units”(Terreblanche, 2002, p. 265). Furthermore, during the 1870s, the role of the state inagriculture increased, to the detriment of the small farmer. Consequently, many smallfarmers were reduced to the position of bywoners on the farms of wealthy landowners(Terreblanche, 2002, p. 265). Yet, the wealthy landowners, many of whom wereAfrikaners, assisted in causing the decline of the small farmers by buying the land ofthe latter when bankruptcy threatened or by providing loans that ultimately reducedthe small farmer to life as a bywoner.
These factors, coupled with the poor agricultural practices, poor agricultural land,severe droughts (exacerbated by the unsustainable agricultural practices) andinappropriate cultural tradition (discussed later) were thought to cause what manycalled the second Great Trek – from the farms to the cities. The exodus of the ruralpoor was neatly summarised by Dr Malan (1917, p. 21) in 1917: “Alas, this trek does notlead from the narrows to the open spaces. This is a trek from a condition of freedomand abundance to one of poverty and want. This is the journey from Canaan to Egypt.”
Yet, Table V suggests that the exodus was not as large as was once claimed. Moreaccurately, the growth of the urban population was largely driven by immigrantsentering the country, especially in the period following the discovery of gold in theWitwatersrand, and the high rural fertility rates. According to Giliomee (2004, p. 272),between 1875 and 1904 more than 400,000 immigrants entered South Africa – agreater number of people than that which comprised the total White population in1875. In fact, the growth in the rural population between the censuses, although smallerthan the growth in the cities, suggests that the rural population never actuallydecreased in absolute numbers. High fertility rates and immigration, more than the
MD45,8
1278

other environmental factors, thus contributed significantly to the rapid growth of theurban areas, which created the illusion that the rural areas were depopulating.
Although it would seem that the dramatic increase in the size of the urbanpopulation, rather than urbanisation, was the real problem of the times, urbanisationdid increase the number of White poor, as many Whites arrived in the cities from therural areas with few skills. The effects of urbanisation were much more severe forAfrikaners – while only 2 per cent of Afrikaners (close to 10,000) lived in the cities in1890, nearly half of all Afrikaners (approximately 535,000) were city dwellers by 1936(Giliomee, 2004, p. 274). Giliomee (2004, p. 274) calls the early urbanisation wave “fast,chaotic and a traumatic process”. Wages were low, jobs scarce and labourdisorganised. The poor education of the urbanised Afrikaner contributed to theirinability to find well-paying employment and to form labour unions. Many newarrivals from the farms had no contacts in the city and were reduced to living in smallrooms in one of the many shanty towns that sprang up, some of them considered toprovide the worst living conditions in the world (Giliomee, 2004, p. 274). According toGiliomee (2004, p. 274), crime was rampant in such areas; for many years, youngAfrikaners found crime or prostitution to be their only means of survival.
The second period of urbanisation occurred during the early 1930s, as the GreatDepression of 1929 plunged the world into recession and widespread droughtsdestroyed large parts of the crops and herds. The government attempted to block therush to the cities by offering large loans to farmers. Although many politicians of thetimes had previously argued for a return of the Afrikaner to the farms (see Malan,1917), practical considerations soon won over, with the government greatly expandingits support to the unemployed and finding itself having to provide employment in theform of public works programmes (Giliomee, 2004, p. 295).
Two demographic factors thus played a key role in the formation of a Whiteunderclass: the rapid increase in the urban population and the fact that many of theseimmigrants came from the rural areas, where they were inadequately educated to copewith city life. Although such factors helped to cause White urban poverty, theyprobably contributed more to an increased awareness of the problem than to anincrease in the number of those living in conditions of absolute poverty. Poor Whiteshuddled together in shanty towns on the edges of cities presented a face to a problemthat had previously been hidden by the relative geographical isolation in which manypoor farmers had lived in the past.
CensusUrban
population
Growth inurban
population(%)
Ruralpopulation
Growth inrural
population(%) Total
Urban(%)
Rural(%)
1891 217,322 – 403,297 – 620,619 35.02 64.981904 590,926 171.91 525,880 30.40 1,116,806 52.91 47.091911 695,796 17.75 616,446 17.22 1,276,242 54.52 48.301918 766,894 10.22 654,932 6.24 1,421,781 53.94 46.061921 847,508 10.51 671,980 2.60 1,519,488 55.78 44.221926 975,235 15.07 701,425 4.38 1,676,660 58.17 41.83
Source: Lewis (1973, p. 27)
Table V.Extent of White
urbanisation between1891 and 1926
South Africanpoor Whites
1279

Black urbanisation took a very different route. The influx control measures adoptedfirst by the national government before 1948, most clearly in the form of the Stallardlegislation of 1923 (Simkins, 1983, p. 118), and then by the different municipalities,ensured that Blacks could not take up residence in the metropolitan areas. According toGelderblom and Kok (1994, p. 84), there were primarily two reasons for influx control.The first was that most employers (especially those in mining and agriculture) fearedthat urbanisation would lead to competition in Black labour and thus an increase inwages for Black workers. Second, there was a perceived link between a permanentpresence of Blacks in the cities and the granting of political rights to these individuals.
Before 1948, the enforcement of influx control varied between municipal districts,being effectively administered in Bloemfontein, less effectively in Cape Town and notat all in Johannesburg (Simkins, 1983, p. 119). The Urban Areas Act of 1945 andVerwoerd’s 1952 Act on Influx Control changed the levels of enforcement that wereimposed by prescribing set residential areas for Blacks and limiting the numbers ofBlacks who could move to the cities. According to Simkins (1983, p. 119), the Whitefarmers experienced an acute shortage of labourers in the post-Second World Warperiod, and were pivotal in the design of influx control legislation. Although a surplusof farm labour was evident after the 1960s, the policy of influx control could not then beabandoned, as the government feared that a rush to the cities would result in rapidurbanisation. Consequently, the Riekert Commission proposed a process of “orderlyurbanisation”. However, by the 1970s the situation was already turning into a viciouscycle. The gap between urban and rural lifestyles was widening, which increased thedesire of rural Blacks to move to the cities (Simkins, 1983, p. 119). To suppress thismovement, the government had to enforce stricter influx control measures,accompanied by heavier penalties, which, in turn, widened the gap between rich andpoor still further.
Because Blacks were not allowed to purchase residential land in the urban areas,large settlements developed on the outskirts of metropolitan areas. By the 1940s,squatter camps, inhabited by approximately 63,000 to 92,500 Blacks, had risen up inthe vicinity of Johannesburg (Gelderblom and Kok, 1994, p. 89). Although suchinformal settlements were dispersed during the 1950s, the government offered little inthe way of alternative land suitable for development. Although the government didundertake certain large urban developments, including the opening up of the dormitorysuburbs of Soweto and Alexandria, houses in such townships were only for rent, in linewith the policy of temporariness (Gelderblom and Kok, 1994, p. 90). Accordingly, theresults of the 1980 population census revealed the relatively low level of urbanisationof the Black population at the time. The census found that 88 per cent of Whites, 91 percent of coloureds, 77 per cent of Indians and only 32.6 per cent of Blacks had taken upresidence in the urban and metropolitan areas (Simkins, 1983, p. 119).
By the 1980s, it became clear that the government policy of temporary residencewould not withstand the growing social pressures of a rapidly expanding urbanpopulation resulting from high fertility rates and illegal immigration to the cities.Dissatisfaction with apartheid policies was thus brought to a head. At the time, it wasestimated that every four-roomed house in Soweto provided housing for more than 14people (Gelderblom and Kok, 1994, p. 90). Poverty in the townships was severe. A waveof protests during the 1970s and 1980s finally culminated in the decision to scrap influxcontrol in 1986, after which time, according to Gelderblom and Kok (1994, p. 91), a less
MD45,8
1280

stringent policy was applied to Black urbanisation. While more land was madeavailable to Blacks, informal settlements were also allowed, with attempts being madeto upgrade the latter.
Language and cultureBy the end of the nineteenth century, the majority of poor Whites were Afrikanerfarmers. According to Wilcocks (Book II, 1932, p. viii), the poor White problemoriginated in the long-existing, well-established part of the White population, largelyconsisting of farmers of Dutch-French-German origin. Wilcocks (Book II, 1932, p. viii)argues that the economic deterioration of these farmers was mostly due to theirinability to adapt to the new economic order brought about by the discovery ofdiamonds and gold, the influx of European immigrants, and the speedy construction ofthe railroads to the interior. For many generations these farmers, living in relativeisolation from interaction with evolving technologies, influences and ideas, hadstagnated into a pioneer life of subsistence and simplicity. The older White population,therefore, came eventually to be confronted with a set of challenges of which they hadlittle experience in a society dominated by English leadership.
Unsurprisingly, the inability of White Afrikaners to speak, read or write Englishreduced their chances of finding employment in the largely English-dominated urbanenvironment. Their linguistic incompetence was probably due both to their pooreducation and their reluctance to learn the language of those whom they considered tobe interlopers. Malherbe (1925, p. 13) noted: “[E]ducation proved insufficient as aprophylaxis against economic deterioration during a period of difficult adaptation”.However, English was, unavoidably, the language of trade and commerce, with manybusiness owners and artisans having come to South Africa during the gold rush at theend of the nineteenth century. A large part of the urbanising White Afrikanerpopulation was, therefore, unable to find work in the formal sector of the economy, andhad to choose between a life of poorly paid manual labour or unemployment.
Apart from the language barrier, the cultural tradition of the farmers was notconducive to successful commercial farming. The Roman-Dutch law of inheritanceentitled every child to a portion of his father’s estate, even when the resulting portionswere too small to support a growing family. Consequently, many once successful largefarms, after such subdivision, ended up overused and unsustainable as a viable sourceof livelihood. The impact of drought was all the more severe due to the unsustainabilityof the farming methods employed on many of these subdivided farms.
Just as the relative isolation of the White farmers made rapid transition to themodern economy difficult, so too did the rural Black population in South Africa sufferfrom their ignorance of new technologies and lifestyles. Early explorers andmissionaries in the country noted the apparent rejection of new tools, products andskills by the indigenous population, who only appeared readily to accept the benefits oftobacco and alcohol. Diamond (2005) suggests that this rejection of all things modern isthe fate of most societies developing in isolation, as a conservative outlook on life,entailing the rejection of new – and possibly disastrous – technologies or tools, haseffectively ensured their survival for thousands of years.
In spite of such reluctance to accept a new way of life, by the end of the nineteenthcentury many Blacks had acquired skills that equipped them for participation in theindustrial sector, where, before the institution of the “colour bar”, some performed
South Africanpoor Whites
1281

semi-skilled and skilled work. However, the segregationist and discriminatory policiesof the early 20th century soon restricted the residence of Black workers in the urbanareas, forcing them to return to life as subsistence farmers in the Black reserves.Although urbanisation might have occurred much earlier had it not been for theimposition of apartheid policies, Gelderblom and Kok (1994, p. 27) argue that themigrant labour system was not only the result of external compulsion, but was alsosupported by the cultural tradition of the rural-based Black population. Rather thanpromoting the extension of property rights, Sotho males were primarily farmers,seasonal migrants to their fields, which tended to be widely scattered due to theinconsistent rainfall to which the interior of the land was subject (Feinstein, 2005,p. 17).
Furthermore, the poor education that Blacks received under the apartheidgovernment ill-equipped them for a move to the cities after the abolishment of influxcontrol. Language formed an obstacle, as most of the formal sector was either English-or Afrikaans-speaking. The rural Black traditional culture and lifestyle differed inmany respects from the culture of the White population; for example, in the rural areasBlack farmers tended to use communally-held land for grazing and herding, whileproperty rights ensured individual ownership in terms of the White economy.Furthermore, many rural Blacks settled in sprawling townships on the outskirts oflarge cities, where intolerable living conditions have persisted to this day. Their poorliving conditions and inadequate educational background did little to assist them infinding employment in the formal sector, so many were forced into a life ofunderemployment or unemployment.
Labour and government policiesThe first government of the Union in 1910, first under General Louis Botha, and laterunder General J.C. Smuts, followed a market-oriented approach (Smuts, 1956).According to Giliomee (2004, pp. 276-7), during his years of studying at Cambridge,Smuts was influenced by Alfred Marshall’s Principles of Economics (1890), whichargued for minimal government intervention in the economy[11]. According toclassical economic theory government is unable to alleviate poverty, and only the freemarket mechanism (due to its low import tariffs and balanced budgets) can rectify thesituation; the best government can do is to educate the next generation. Therefore,Smuts aimed at high economic growth rates as the only viable means of improvingsocietal wellbeing. However, his approach was succeeded by that of Hertzog, whichemphasised government intervention as an important tool for alleviating poverty.According to C.M. van den Heever, Hertzog’s biographer, the eminent statesman wasmore continental in his approach, rejecting a purely laissez faire outlook (Giliomee,2004, p. 277). The contrasting political ideologies had profound implications for thetypes of policies enforced by the two governments.
A distinction needs to be made between government policies that contributed topoverty and those that attempted to alleviate it. Government policies at the start of the20th century were primarily concerned with labour issues[12]: providing cheap labourto the mining industries and gaining the political support of the growing White, urbanworking class. These two aims were clearly mutually exclusive: cheap labour could beprovided by Blacks rather than Whites, but reducing White jobs (particularly skilledpositions) was politically unfeasible.
MD45,8
1282

In order to secure a safe middle-ground, the government invented the policy ofsegregation. According to Terreblanche (2002, p. 254), a segregationist policy wasalready proposed by Milner and his Kindergarten (a group of Oxford graduates) in areport that they published in 1905[13]. By adopting such a policy, they hoped to solvethe labour problems of the mines – while accommodating White racism – by creating“native reserves” that were too small to sustain the Black population, thus creating a“reservoir” of migrant labour (Terreblanche, 2002, p. 255). The report furthermoreproposed the segregation of Whites and Blacks in the cities, as well as in politics, inwhich field Whites were supposed to represent Blacks. The adoption of suchsegregationist policy was followed by the promulgation of the Land Act of 1913, whichsucceeded in creating a large reservoir of cheap and docile Black labour, and in 1923 bythe Native (Urban Areas) Act, aimed at controlling the influx of Black workers to thecities, as well as their urbanisation.
According to Beinhart and Dubow (1995, pp. 7-8), the racist segregation policiesof the early twentieth century should be understood as rationalising economic andcapitalistic imperatives. While the repressive labour laws referred to above wereinstitutionalised on behalf of the mainly English-speaking White capitalist classand aimed at lowering their costs, the discriminatory measures wereinstitutionalised mainly on behalf of the Afrikaner proletariat or working class,increasing the costs for capital (Terreblanche, 2002, p. 270). According toTerreblanche (2002, p. 270), it is not surprising to note that most of the repressivelabour laws were institutionalised during the period of the South African Partygovernment from 1910 to 1924 (during which period Botha and Smuts weresupported by the English capitalist class), while most of the discriminatory laws –introduced, at least in part, to alleviate White poverty – were institutionalisedduring the Pact government of Hertzog after 1924.
The steady decline in the amount of profits gained from the gold mines between1910 and 1920 and the increase in the wage differential between White and Blackworkers from 11.7:1 in 1911 to 15:1 in 1920 caused the mine houses to announce plansto employ fewer White workers and to lower the colour bar to allow Black workers toperform semi-skilled work (Terreblanche, 2002, p. 270). These changes triggeredprotests by White mineworkers, who were mainly poor White Afrikaners, under thebanner of a Red Flag blazoned with the slogan: “Workers of the world unite and fightfor a White South Africa”. Smuts reacted by ordering the South African air force tosuppress the strike, resulting in more than 200 casualties. Four leaders of the rebellionwere sentenced to death and walked to the gallows singing the anthem of the Red Flag(Feinstein, 2005, p. 81). According to Terreblanche (2002, p. 270), the harsh suppressionof the strike “featured prominently in the consciousness of the Afrikaner workingclass” and played an important role in the electoral triumph of the Pact government in1924.
The victory of Hertzog’s Pact government (based on an agreement between theNational and Labour parties) in 1924 brought about a change in the emphasis ofgovernment policies, from focusing on the needs of the capitalist class to the needs ofthe working class – specifically in terms of the issue of White poverty alleviation.According to Feinstein (2005, p. 86), the Pact government again interfered with thenormal operation of market forces: whereas the previous government had focused ondeliberately keeping the wages of Black workers low, the Pact government attempted
South Africanpoor Whites
1283

to raise White wages while preventing an increase in Black wages. The newgovernment immediately sprang into action, introducing a discriminatory policyofficially dubbed “civilized labour”, in terms of which it promulgated the Wage Act of1925, the Mines and Works Amendment Act of 1926 and the Native AdministrativeAct of 1927. While the Wage Act authorised the Minister of Labour to appoint a wageboard and to prescribe the same minimum wages for Blacks and Whites, the Mines andWorks Amendment Act reintroduced the “colour bar” in favour of Whites and colouredworkers. Whereas the Supreme Court ruled in 1923 that the previous “colour bar” wasultra vires, the new Act simply reserved the awarding of certificates of competency inskilled trades for Whites and coloureds (Terreblanche, 2002, p. 273). Such legislationinstitutionalised a type of affirmative action; with Blacks being restricted to theperformance of unskilled labour, mines had no option but to employ White labour, eventhough Blacks might have been more productive. According to Terreblanche (2002,p. 273), between 1924 and 1933 more than 8 000 jobs were transferred from Black toWhite workers.
Apart from the labour laws, the new Pact government also saw fit to implement anew industrial policy, which regarded the availability of cheap electricity and steel asnecessary preconditions for the development of a manufacturing industry (Giliomee,2004, p. 290). Accordingly, the Electricity Supply Commission (ESCOM) wasestablished in 1922 and the Iron and Steel Corporation (ISCOR) in 1928, withproduction beginning in 1933. Furthermore, the rapid expansion of the country’sinfrastructure, especially the railways, required builders and operators. Table VI[14]shows the rapid increase in the number of White workers on the railways immediatelyfollowing the 1924 election.
Part of the industrialisation process involved the high tariff structure that wasimposed to protect the local industries. According to Terreblanche (2002, p. 274), ratherthan stimulating new industrialisation, the high tariffs succeeded only in protectingthose industries that used mainly White labour. Government contracts also favouredthose industries that employed predominantly White labour.
While many Whites argued that the Pact government policies succeeded inalleviating White poverty, this was not the case in reality. Terreblanche (2002, p. 274)
Year
Numberemployed on
completed lines
Growth in numberemployed on
completed lines(%)
Numberemployed inconstruction
Growth in numbers ofthose employed in
construction(%) Total
1924 3,083 1,667 4,7501925 7,557 145.12 3,193 91.54 10,7501926 10,161 34.46 3,126 22.10 13,2871927 11,228 10.50 3,624 15.93 14,8521928 11,997 6.85 3,901 7.64 15,8981929 12,906 7.58 2,912 225.35 15,8181930 12,501 23.14 1,862 236.06 14,3631931 12,247 22.03 2,304 23.74 14,551
Source: Wilcocks (Book II, 1932, p. 79)
Table VI.Number of Whitelabourers on the railways
MD45,8
1284

argues that “although many poor Whites were employed ‘artificially’ at the cost ofBlacks, the Pact strategy did not succeed in solving the poor White unemploymentproblem. This only happened after the sharp increase in the price of gold in 1932, theenlistment of Afrikaners in the South African forces that participated in World War 2,and the creation of many additional jobs in the industrial sector during the War”. TheCarnegie investigation undertaken in 1929 and the 1934 National Conference on thepoor White problem both suggest that poverty levels declined only fractionally afterthe first decade of Pact government.
By 1934 the poor White problem had become very sensitive politically[15]. Aconference to discuss possible solutions was called for and held in Kimberley inOctober of that year. A wide variety of speakers, both English and Afrikaans, proposedsolutions to alleviating the problem of White poverty, none more important than thoseproposed by a young Prof. H.F. Verwoerd, then professor in sociology at StellenboschUniversity. Although he acknowledged that White poverty could not be addressedwithout recognising the impact of various policies and interventions on the other racegroups, he argued that “when there is certain discrimination in the interest of the Whiteworker, it should be remembered that such discrimination is not only in the interest ofthe poor White, but in the interest of the country!” (Joubert, 1972, p. 55). To which headded: “There is valid reason for such temporary discrimination in somecircumstances, as it will be in the interest of the country. However, this is the onlyway to sympathetically account for the welfare of both the Whites and non-Whites,even if it does carry with it the resemblance of prejudice” (Joubert, 1972, p. 56, author’semphasis). Verwoerd’s main proposal at the conference was the establishment of aDepartment of Social Welfare to coordinate and micro-manage the poverty alleviationstrategies of all branches of society. After the conference, acting in his role of being incharge of implementing the conference proposals, Verwoerd criticised the slow pace ofgovernment action (Giliomee, 2004, p. 302). He and others, especially D.F. Malan, usedthis inaction by government and the commemoration of the Great Trek in 1938 as thespringboards for a successful campaign to heighten nationalist feeling amongAfrikaners, which contributed to the National Party (NP) winning the 1948 nationalelections.
Although the “colour bar”, which reserved certain occupation for Whites, wasalready introduced early in the twentieth century, discrimination was greatly extendedafter the NP came to power in 1948. In terms of the Native Labour (Settlement ofDisputes) Act of 1953, Blacks could no longer be regarded as “employees”. The Actfurther restricted Blacks from organising strikes and, although not prohibiting Blacktrade unions as such, it denied them official recognition (Feinstein, 2005, p. 157). The1951 Native Building Workers Act prohibited Blacks from undertaking skilledbuilding work outside the demarcated Black residential areas, while the 1956 IndustrialConciliation Act, together with later amendments to the act, reserved almost all skilled,and, increasingly, semi-skilled, jobs for Whites. The promulgation of such labour lawsled to the shortage of skilled workers that had already emerged by the 1960s. However,official policy remained committed to sustaining the policies of job segmentation untilthe Wiehahn Commission recommended, in 1977, that Blacks be included under thedefinition of “employee” contained in the Industrial Conciliation Act (Feinstein, 2005,p. 241). By 1984, and with the rise of Black trade unions, all job reservations had beenabolished, with the exception of the mining industry, where they remained in place
South Africanpoor Whites
1285

until 1988. Although White wages had been significantly higher than Black wages fordecades, the gap started to close in the 1970s, due to the shortage of labour. However,Feinstein (2005, p. 230) notes that Black wages began to rise at the same time as laboursupply began to outstrip labour demand[16]. Real Black wages rose by more than 40per cent between 1970 and 1976, with the wage gap steadily narrowing after that(Feinstein, 2005, p. 231).
The ANC-led government elected to victory in the first democratic elections of 1994chose to follow what is sometimes referred to as a neo-liberal democratic capitalismapproach. In essence, the ANC shifted gear from proclaiming socialist and communistpolicies before the election to opening up the economy and promoting free enterpriseand economic growth as the main vehicles of poverty alleviation. The GEARProgramme, initiated in 1996, embodied the government’s commitment to economicgrowth by means of trade liberalisation, privatisation and macroeconomic stability.Although it did not achieve the high growth rates at which it aimed, it did succeed instabilising the government debt, reducing the budget deficit and opening up theeconomy to all sectors of the population. Despite its primary emphasis on correctingmacroeconomic imbalances, the government also shifted spending to a number of keysocial areas, including education, social welfare, housing and basic infrastructureservices. A new initiative, ASGI-SA, which was launched in 2005 with the help of agroup of international specialists, again highlighted the need for increased economicgrowth in the context of efforts to achieve the Millennium Development Goal of halvingpoverty by 2015.
The Constitution promulgated in 1996 also provided for the introduction oflegislation aimed at addressing the racial imbalances of the past, culminating in theimplementation of a strategy of broad-based Black economic empowerment (BBBEE)by the Department of Trade and Industry (DTI), which later formed the basis for theBroad-based Black Economic Empowerment Act (2003). The BBBEE Act combines theexisting Employment Equity, Skills Development and Preferential Procurementlegislation into a comprehensive strategy to empower “all Black people, includingwomen, workers, youth, people with disabilities and people living in rural areas” (DTI,2004). The policy, akin to Verwoerd’s policy of temporary discrimination, hopes to fasttrack Black economic revival. Although the reasons for introducing the BBBEE charterare evidently more nuanced, one should be sceptical regarding the ability of labourpolicies operating against the prevailing market forces in order to benefit the majorityof the poor and traditionally disadvantaged in the country.
Possible solutions to povertyEconomic growthBefore considering possible governmental poverty alleviation strategies in the twoperiods under review, an historical overview of economic growth that preceded andfollowed the development of the poor White problem and Black poverty today isnecessary. However, assessing South Africa’s economic growth performance in theperiod before 1930 is difficult due to the scant statistical information available.Schumann (1934) states that economic growth in the period 1910 to 1913 was relativelyhigh, but was followed by a slow-down and recession by the end of 1915 (Fedderke andSimkins, 2006). From 1916 to the mid-1920s, economic growth was moderate, with anincrease towards the end of the 1920s.
MD45,8
1286

Figure 1 shows the economic growth rates for South Africa since 1926. Real grossdomestic product using factor incomes (Central Statistical Services, 1982) were used forthe period 1926 to 1946. From 1947 to 2005 the real gross domestic product figures atmarket prices were used, as published online by the South African Reserve Bank (2006).
The Great Depression and South Africa’s persistence in maintaining the goldstandard caused the rapid decline in economic growth rates in the early 1930s.However, as soon as South Africa left the gold standard at the end of 1932, the effect onthe economy was immediate – the gold price increased from £4.31 in 1932 to £7.10 in1937, which contributed to the massive economic growth rates occurring during thisperiod (Fedderke and Simkins, 2006). Figure 1 shows the high economic growth ratessince 1933; the average growth rate for the four decades between 1933 and 1973 was5.51 per cent per annum.
Growth slowed down during the 1970s and stagnated during the 1980s and early1990s, fluctuating rapidly between boom periods and times of negative growth. Theaverage annual growth rate for 1974 to 1994 was a mere 1.91 per cent. Since 1994,growth has picked up, although relatively slowly. Growth between 1995 and 2005 hasaveraged 3.26 per cent per annum.
EducationAn important contributor to the alleviation of White poverty was the improvement ineducation. According to Malherbe (1925, pp. 401-11), between 1909 and 1920 schoolattendance for the total population increased by 92 per cent. However, Malherbe (1925)notes that this increase was mainly due to compulsory school attendance for Whites.De Villiers (1996, p. 191) notes that, in the first decade after unionisation in 1910, thenumber of teachers in the Union more than doubled. Even more important, argues DeVilliers (1996, p. 191), is the increase in the number of teachers in possession of tertiary
Figure 1.Economic growth rates forSouth Africa between 1926
and 2005
South Africanpoor Whites
1287

qualifications over the same period, from 59 per cent at the start to between 73 and 80per cent at its close. These changes in education were primarily brought about bygovernment’s shifting stance on education. According to Malherbe (1925), 26,4 per centof government expenditure was dedicated to education in 1921-1922, an exceptionallyhigh percentage in those years.
Any long-term strategy to improve the welfare of Black households in South Africawill need to include a strategy for improving the quality of Black education (Fiske andLadd, 2004, p. 12). However, as argued before, although government has attempted toimprove educational outcomes by increasing government expenditure on formerlyBlack schools, the results have, so far, been unsatisfactory. Various authors haveproposed a multitude of solutions to the problem, including smaller pupil/teacher ratios(Case and Deaton, 1999), better qualified teachers, more resources and more efficientschool management. Unfortunately, there is presently little indication that theseproposed solutions can be implemented.
However, important practical lessons are to be learned from the success achieved inaddressing the poor White problem in the 1930s. The first of the interventions toaddress the poor standard of education of Whites at the start of the century was tomake education compulsory up to the current Grade 6 for Whites in 1905 (Giliomee,2004, p. 274). Second, increased government spending on teacher salaries helped toensure that higher qualified teachers entered the school system. Third, non-profitorganisations and churches, in many cases funded by the state, played an importantpart in building institutional and infrastructural capacity in schools. The DRC, by wayof its many subsidiary bodies, such as the Afrikaanse Christelike Vrouevereniging(ACVV), built and managed the many industrial and agricultural schools between 1894and 1922 that provided education to more than 1,500 students, as well as 160 boardinghomes that served more than 7,000 rural children between 1917 and 1932 (Giliomee,2004, p. 274).
Education is now compulsory for all South Africans up to Grade 9. More recently,Government has showed its commitment to improving teacher quality by signing theImproved Career Pathing and Accelerated Salary Progression agreement, wherebyteacher salaries are to be substantially raised. There is, however, still a wide gapbetween the quality of education received by Blacks today and that of Whites a centuryago. Furthermore, little is being done to address the shortage of institutional capacityat the micro-level. This is possibly an area where non-profit organisations can play animportant role by addressing such issues as school security, training for science andmathematics teachers, management and consulting services, interschool exchange ofteachers, and the provision of boarding facilities and financial assistance to studentsfrom impoverished backgrounds.
UrbanisationThe urbanisation of the poor Whites and the poor Blacks in the respective periods tookdivergent paths. Migrant labour played no role in the case of the poor Whites – thepoor farmers sold or abandoned their holdings (mostly to wealthier farmers), moved tothe cities with their families and started a new life. By contrast, rural Black families,headed by women in the absence of their husbands, usually remained on subsistencefarms in the Black reserves, with the men migrating to the city to find employment.Government and civil society projects, such as housing schemes providing permanent
MD45,8
1288

residence to the poor aimed at alleviating the poverty in the townships of the 1930sproved successful, whereas attempts to address the urbanisation of Black workers –by building townships where houses could be rented from the government – did littleto alleviate the plight of the poor Black.
The major difference is that the urbanised White could purchase and own the landin the city, whereas the migrant Black worker could not, as his residence in the urbanhubs was seen as temporary. Ownership brings many benefits, including access tocredit facilities, better living conditions and incentives for further improvement andmaintenance of the residence. According to Gelderblom and Kok (1994, p. 92), theavailability and security of land ownership accessible to the urbanising poor is themain difference between the increase in income made possible for the poor White andthe persistence of Black poverty today. In order to address the latter problem, rapidprocessing of property rights allocation should be undertaken in urban areas,especially in settlements where the land is owned by the Government[17].
Government policiesThe labour laws of the Hertzog government did little in the long term to alleviate Whitepoverty. Although the affirmative action policies adopted by that government did forceindustries to hire more White workers, and public works programmes increasedemployment for Whites, the adoption of such strategies did not succeed in reducing theextent of White poverty to a substantial degree. However, together with state welfareprogrammes, these policies did alleviate poverty somewhat for the poorest of the poorin the cities, by offering them at least the chance to earn a minimum income. Accordingto Feinstein (2005, p. 89), the economic interests of the White workers who could votehad triumphed over the economic interests of the country as a whole (which includedmany other South Africans who were deprived of the right to vote). The majorcontributor to lower poverty levels was the high economic growth rate in South Africaover the period spanning 1932 to the end of the 1960s, which was driven predominantlyby the rise in the gold price and greater protectionism as a result of the Second WorldWar[18]. However, economic growth was constrained by the need to accommodate theinterests of the politically active White working class. Some government policiesduring the early twentieth century did contribute to building capacity that could takeadvantage of the rapid economic growth taking place in the decades after 1930. Theimprovement in education and health for the poorest of the poor increased the numberof benefits to be gained from the trickle-down effect of economic growth to thesegroups: an important lesson for policy makers in contemporary South Africa.
More than a decade after the first democratic election, analysts have begun to assessthe success or failure of the post-apartheid approach. According to Van der Berg et al.(2005, p. 22), although the trend in poverty immediately following the transition is notyet that clear, recent evidence suggests that poverty has started to decline.
Whereas poverty headcount numbers at first increased after the 1994 elections, thetrend reversed after the turn of the century, as the impact of poverty reductionstrategies exceeded the natural tendency of an increase in the population to exacerbatepoverty (Van der Berg et al., 2005, p. 22). In particular, the rapid expansion of the socialgrant system since 2002 has been a very effective weapon in the fight against poverty.Further, Van der Berg et al. (2005, p. 22) argue that the income of those Blacks livingabove the poverty line is rising considerably, with Blacks now accounting for half of
South Africanpoor Whites
1289

the growth in the upper end of the consumer market. Although – as in the case ofaffirmative action for Whites – BBBEE has contributed to the increasing income levelsof Blacks in South Africa, BBBEE alone is unlikely to succeed in eradicating Blackpoverty. The need to create jobs rapidly is the next hurdle to cross, according to Vander Berg et al. (2005, p. 23), as the social grant system is currently nearing the limits ofits poverty alleviation capacity. In order to secure rapid job creation, a robustlygrowing economy is a necessity. The official target set for economic development interms of ASGI-SA suggests that the government is on the right track regarding itsmacroeconomic policy framework.
The process of industrialisation during the 1930s was largely driven by thegovernment, as evidenced by the establishment of ESCOM and ISCOR during thatdecade, and then by the founding of the Industrial Development Corporation (IDC) in1940. These institutions, other than succeeding in merely creating additional jobs,contributed to technological development and investment in human capital.Furthermore, the expansion of the infrastructure network (in terms of both powerand rail) was crucial in reducing the transaction costs of economic activity, so enablingeconomic growth. Today, the government, which aims to privatise most state-ownedenterprises, should heed the experiences of the 1930s. Investment in new areas oftechnology, rather than simply investing in job-creating industries, may create positivespill over into other sectors of production, thereby increasing economic growth. Thecurrent government is in the process of implementing an infrastructure developmentstrategy (as in terms of ASGI-SA), as well as fine-tuning an industrial policy strategyfor South Africa.
Final remarksThere is little question that the Black poverty of today is of a much greater magnitudeand severity than was the White poverty at the start of the previous century. Althoughboth periods of poverty received widespread political, social and economic attention,the poor White problem seems to have been mostly a case of an increase in relativepoverty. Whereas society was previously more equal and farmers’ isolation madepoverty less visible, the immigration of thousands of Whites to the cities and theincrease in the relative wealth of mining capital created, for the first time, theawareness of a White impoverished underclass. The awareness of Black poverty alsocan be seen in relation to the relative wealth experienced elsewhere; since the arrival ofthe Whites, the levels of Black wealth have constantly been compared to the levels ofWhite wealth. However, the increase in White income levels, experienced especiallyafter 1930, caused the average White income to remain at a far higher level than that ofthe average Black. Such inequality brought Black poverty into the open, a position thatwas exacerbated by various discriminatory and repressive government policies aimedat depriving members of the Black community from participating fully in the growingeconomy of the country. Although the extent of Black poverty has started to declinesince the transition to a democratic form of government, with many Blacks improvingtheir financial status so that they have, with relative ease, been able to enter the middleincome groups, absolute Black poverty is still much more severe than was Whitepoverty at the start of the previous century.
White poverty mainly resulted from an inadequate educational system, theconservative culture of the isolated farmer, rapid urbanisation and population
MD45,8
1290

expansion after the discovery of mineral deposits in the interior, as well as from anumber of exogenous factors, such as the rinderpest, the Anglo-Boer War and manysevere droughts. Such poverty was alleviated in less than five decades, despitegovernment labour and welfare policies contributing very little to its long-termalleviation. Economic growth, allowing, as it did, for a rapid increase in the number ofjob opportunities available, was the most important factor in eradicating Whitepoverty, as is evident from the high economic growth rates experienced during the fourdecades after 1933. Today, economic growth is still the key to combating poverty. Theextent of Black poverty, although the focus of much political debate over the lastseveral years, is still severe. While it cannot be denied that certain fortuitous events –such as the high gold price and the outbreak of the Second World War – increased therate of economic growth during the earlier period, the government can assist in thealleviation of poverty by way of the adoption of specific policy-oriented strategies.Therefore, an understanding of the policies that contributed to the alleviation of Whitepoverty is of critical relevance to the successful implementation of modern povertystrategies.
This analysis has highlighted a number of factors that should be considered in anyfurther attempts to eradicate the poverty that still plagues certain sectors of the SouthAfrican population. First, is the realisation that improvements in education – in theform of higher government spending, as well as improvement in the quality ofteaching – can dramatically improve the possibility of socioeconomic upliftment.Whereas the current ANC-led government has increased expenditure on educationconsiderably since 1994, the quality of education – and especially the quality ofoutcomes, given the outcomes-based nature of the present educational system – is stillnot adequate. Private, non-profit organisations with a supportive role in theeducational field could play an even more significant role than they have up till now inimproving institutional and managerial capacity at a micro-level. The granting ofextended government aid to such organisations could help to foster a spirit of learningand community involvement in the groups most positively affected by such efforts.
Second, this analysis emphasised the differences between the property rights ofpoor Whites seeking accommodation within the urban environment and those of ruralBlacks subjected to the “orderly urbanisation” process. The strategic importance of therecognition of such rights has been seen in their creating numerous positiveexternalities, primarily through granting owners the opportunity to acquire capital.Therefore, the assurance and ongoing enforcement of such rights should form a criticalpart of the policy agenda of the current government.
Third, the employment of policies such as Black Economic Empowerment and thesocial welfare system will do little in the long term to alleviate Black poverty. Althoughmany Afrikaner nationalists during the apartheid years claimed that Afrikaners had“saved themselves” from impoverishment, such an assertion is only partly true. As thispaper has already shown, the Afrikaner-led government policies, which were aimedprimarily at promoting the socioeconomic interests of the Afrikaner community, didnot, in fact, improve the welfare of poor Whites to any great extent. However, such afinding does not mean that the government should not actively intervene, but ratherthat it should implement policies that promote economic growth or, rather, thateliminate the constraints to which economic growth is subject. Investment ininfrastructure aimed at combating market failures and reducing transaction costs
South Africanpoor Whites
1291

should be a priority in the formulation of policy. Furthermore, the South Africangovernment can, by means of investing in evolving technology-intense industries,encourage private investment to exploit the externalities created by these industries,similarly to how the government invested in the state-subsidised enterprises ofESCOM, ISCOR and the IDC in the 1930s. Yet, the social welfare system has reachedclose to maximum capacity and, although it has evidently contributed to reducing themost severe cases of poverty, it should, in no way, be considered the primary means ofsolving the problem of Black poverty. Rather, the Government’s promotion of policiesthat promote higher economic growth and job creation should be, as was the case withgovernment intervention in regards to the problem of White poverty in the post-1930s,the main focus of any effort aimed at overcoming the problem of Black poverty inSouth Africa today.
Notes
1. In 1927 the president and secretary of the Carnegie Corporation in New York visited SouthAfrica, identifying the need to investigate the plight of the poor White (Grosskopf, Book I,1932, p. i). The Report containing the findings of the Carnegie Commission was published in1932.
2. Black poverty in the 1930s was much more severe than White poverty. Terreblanche (2002,p. 393) estimates that the per capita income of Whites was approximately 11 times largerthan that of Blacks in 1917 and about 13 times larger in 1936. However, for the purposes ofthis paper, only poverty in the White population group is considered during the earlierperiod. For various reasons, Black poverty was historically judged to be unimportant orreceived less economic, social and political attention. (See Le Roux (1984) for a thoroughanalysis of the topic.)
3. H.C. van Heerden, in the Union Year Book of 1933/1934, was recorded as stating: “For allpractical purposes this (the numbers of 1916) still remains the basis of current estimates”.
4. Blacks here exclude coloureds and Indians.
5. The Gini coefficient is a measure of inequality in a country. The Gini coefficient ranges from0 to 1, with a rating of 0 equating to perfect equality (meaning that everyone earns the sameincome) and 1 perfect inequality (one person earns all the income).
6. AMPS data has been gleaned from the South African Advertising Foundation’s All Mediaand Products Survey.
7. This study therefore assumes that White poverty, as experienced in Natal at the time,effectively reflected White poverty as experienced in all four former provinces. Althoughsuch an assumption is not completely valid, as the diamond and gold mines located in theinterior attracted large numbers of immigrants and settlers, many of whom ended upimpoverished, the levels of poverty experienced in the interior could not have significantlydiffered from those endured in the coastal provinces. According to Grosskopf (Book I, 1932,p. 58), the ratio of rural to total Whites in Natal closely equated that in the Transvaal in 1911and 1921, but decreased sharply between 1921 and 1931, as poor White farmers migrated tothe cities in the latter province. Although the absolute numbers of Whites in the twoprovinces differed considerably, their relative numbers would have had little impact on thepercentage of the poor used in this analysis. Therefore, although White poverty levels interms of the Natal estimates could be expected to have a slightly downward bias, this biasshould not change the general findings of the current study.
8. Although the income is only reported per family, a constant family size is assumed over eachof the four classes given.
MD45,8
1292

9. Lubbe (1942, p. 69) notes that the educational system imported with the English teachers (seelater in text) was considered by the settlers to be aimed at undermining their culturalidentity, and so denationalising them.
10. According to Terreblanche (2002, p. 245), 60 per cent of Afrikaner assets in the Transvaaland Free State were destroyed.
11. There is little evidence to show that Marshall did, in fact, influence Smuts. In later years, forexample, through their joint Cambridge connections, Smuts became close friends with JohnMaynard Keynes, a major proponent of state intervention to stabilise the economy. Theirepistolary exchange was later published as part of the Smuts papers (1966-1973).
12. Not all government policies concerned labour. The opening up of the interior and thediscovery of diamonds and gold created a large market for locally produced crops. Yet, dueto the openness of free trade and the poor infrastructure in the interior (which made itdifficult for farmers to transport their goods to market), cheap maize imports from the USAproved a serious problem for local farmers, who vociferously sought the institution of importrestrictions to protect local production. The agricultural sector of the time argued that cheapimports caused them to lose out on market share, lowered their profits and increased levels ofpoverty. Therefore, insufficient policy-making by government could also be considered toresult in poverty. (A general equilibrium analysis might, however, suggest that the benefitsof the cheap maize to city-dwellers outweighed the losses that farmers experienced at thetime.)
13. In fact, the Glen Grey Act of 1894, as promulgated by the government of Cecil John Rhodes,was a prelude to this and later acts that discriminated against Blacks.
14. The details contained in a speech delivered by the Commissioner of the Railway Council in1934 mirror the same trend (Kuit, in Du Toit, 1934, p. 51).
15. Primarily, two reasons can account for such sensitivity. First, the Carnegie Report released in1932 emphasised the severity of the poor White problem. Second, D.F. Malan split from theSmuts–Hertzog coalition to form the Purified National Party. The Party’s nationalisticpropaganda emphasised the injustices perpetrated against the Afrikaners and the need tosolve the poor White (Afrikaner) problem.
16. Had a competitive labour market operated, an increase in the labour supply might have ledto a lowering of prices. However, various other factors induced, most notably, the miningsector to increase prices. Such factors included the increase in the gold price, exchange ratefluctuations, labour strikes and the exclusion of foreign mineworkers (especially thosepreviously sourced from Malawi).
17. The allocation of such property rights differs from land redistribution to Blacks. While theformer refers to the obtaining of property rights to land in cases where the holder alreadylives on the property, land redistribution refers to obtaining property rights to land wherethe holder does not already live on the property.
18. For an extensive discussion of the growth undergone during these early years, see Fedderkeand Simkins (2006).
References
Beinhart, W. and Dubow, S. (Eds.) (1995), Segregation and Apartheid in Twentieth-Century SouthAfrica, Routledge, London.
Botha, L.L.N. (1956), Die Maatskaplike Sorg van die N.G. Kerk in Suid-Afrika, 1928-53, Doctorate,University of Pretoria, Pretoria.
Case, A. and Deaton, A. (1999), “School inputs and educational outcomes in South Africa”,Quarterly Journal of Economics, Vol. 114 No. 3, pp. 1047-84.
South Africanpoor Whites
1293

Central Statistical Services (CSS) (1982), South African Statistics, Central Statistical Services,Pretoria.
Coetzee, J.H. (1942), Verarming en Oorheersing, Nasionale Pers, Cape Town.
Davies, J. (1984), “Capital, state and education reform in South Africa”, in Kallaway, P. (Ed.),Apartheid and Education: The Education of Black South Africans, Ravan, Johannesburg,pp. 341-70.
Department of Trade and Industry, South Africa (2004), Principles and Definition of Broad-basedBlack Economic Empowerment: Codes of Good Practice, available at: www.dti.gov.za/bee/codes/3_20code000.pdf
De Villiers, A.P. (1996), Effektiwiteit van Suid-Afrika se Onderwysstelsel – ’n EkonomieseAnalise, doctorate, Stellenbosch University, Stellenbosch.
Diamond, J. (2005), Collapse, Penguin, London.
Du Toit, P. (Ed.) (1934), Report of the National Conference on the Poor White Problem, 2-5 October,Kimberley.
Fedderke, J. and Simkins, C. (2006), Economic Growth in South Africa Since the Late NineteenthCentury, mimeo, available at: www.commerce.uct.ac.za/Economics/staff/jfedderke/research.asp
Feinstein, C.H. (2005),AnEconomic History of South Africa, Cambridge University Press, Cambridge.
Fiske, E. and Ladd, F. (2004), Elusive Equity, Brookings Institution Press, Washington, DC.
Gelderblom, D. and Kok, P. (1994), Urbanisation: South Africa’s Challenge, Vol. 1, DynamicsHSRC, Pretoria.
Giliomee, H. (2004), Die Afrikaners: ’n Biografie, Tafelberg, Cape Town.
Grosskopf, J.F.W. (1932), Deel I: Ekonomiese Verslag. Die Armblanke-vraagstuk in Suid-Afrika.Verslag van die Carnegie-kommissie, Pro Ecclesia, Stellenbosch.
Joubert, D. (1972), ToeWitmense ArmWas: Uit die Carnegie-verslag, 1932, Tafelberg, Cape Town.
Le Roux, P. (1984), Poor Whites. Second Carnegie Inquiry into Poverty and Development inSouthern Africa, Conference Paper, 248, Cape Town.
Lewis, R.A. (1973), “A study of some aspects of the poor White problem in South Africa“,MA thesis, Rhodes University, Grahamstown.
Lubbe, J.J. (1942), Lewensomstandighede en Opvoeding van die Voortrekkerkind, Nasionale Pers,Cape Town.
Malan, D.F. (1917), De Achteruitgang van ons volk, Collection Nr 1, 1/41/12(1), DocumentationCentre, J.S. Gericke Library, Stellenbosch University, Stellenbosch.
Malherbe, E.G. (1925), Education in South Africa (1652-1922), Juta, Cape Town.
Malherbe, E.G. (1932), Deel I: Ekonomiese Verslag. Die Armblanke-vraagstuk in Suid-Afrika.Verslag van die Carnegie-kommissie, Pro Ecclesia, Stellenbosch.
Marks, S. and Trapido, S. (Eds.) (1987), The Politics of Race, Class and Nationalism in TwentiethCentury South Africa, Longman, London.
Pelzer, A. (1937), “Die Arm-blanke Verskynsel in die Suid-Afrikaanse Republiek Tussen die Jare1882 en 1899”, University of Pretoria, Pretoria, MA thesis.
Schumann, C.G.W. (1934), “Business cycles in South Africa: 1910-1933”, South African Journal ofEconomics, Vol. 2, pp. 130-59.
Simkins, C. (1983), Four Essays on the Past, Present and Possible Future of the Distribution of theBlack Population of South Africa, South Africa Labour and Development Research Unit,Cape Town.
MD45,8
1294

Smuts, J.C. (1956) in Hancock, W.K. (Ed.), Selections from the Smuts Papers, CambridgeUniversity Press, Cambridge.
South African Advertising Research Foundation (2004), All Media and Products Survey (AMPS),dataset, Johannesburg.
South African Reserve Bank (SARB) (2006), Electronic database, available at: www.reservebank.co.za
Terreblanche, S. (2002), A History of Inequality in South Africa, 1652-2002, University of NatalPress, Pietermaritzburg.
Van der Berg, S. (2006), “How effective are poor schools? Poverty and educational outcomes inSouth Africa”, Stellenbosch Economic Working Paper, available at: http://stbweb02.stb.sun.ac.za/economics/3.Research/WP-06-2006.pdf
Van der Berg, S. and Louw, M. (2004), “Changing patterns of South African income distribution:towards time series estimates of distribution and poverty”, South African Journal ofEconomics, Vol. 72 No. 3, pp. 546-72.
Van der Berg, S., Burger, R., Burger, R., Louw, M. and Yu, D. (2005), “Trends in povertyinequality since the political transition”, Stellenbosch Economic Working Paper, availableat: www.ber.sun.ac.za/downloads/2005/working_papers/WP-01-2005.pdf
Wilcocks, R.W. (1932), Deel II: Psigologiese Verslag. Die Armblanke-vraagstuk in Suid-Afrika.Verslag van die Carnegie-kommissie, Pro Ecclesia, Stellenbosch.
Further reading
McGrath, M.D. (1983), The Distribution of Personal Income in South Africa in Selected Years Overthe Period from 1945 to 1980, doctorate, University of Natal, Durban.
Timeline of events and legislation
1894: Glen Grey Act promulgated
1896: Rinderpest outbreak
1899: Anglo-Boer War (also known as the Second Boer War or South African War) starts
1902: Treaty of Vereeniging signed, concluding the Anglo-Boer War
1910: Union of South Africa founded, with Louis Botha as its first prime minister,followed by Jan Smuts in 1919
1913: Land Act promulgated
1924: Hertzog’s Pact government (National Party and Labour Party) accedes to power
1925: Wage Act promulgated
1926: Mines and Works Amendment Act promulgated
1927: Native Administrative Act promulgated
1929: Great Depression starts
1932: Five-volume Carnegie report published Gold standard abolished in South Africa
1939: Second World War starts
1945: Second World War ends
1948: National Party comes to power, adopting apartheid policy
1951: Native Building Workers Act promulgated
1952: Act of Influx Control promulgated
South Africanpoor Whites
1295

1953: Native Labour Act and Black Education Act promulgated, formally segregatingBlack education
1961: South Africa becomes Republic
1976: Soweto uprisings take place
1990: ANC unbanned, with its leader, Nelson Mandela, being released from prison
1993: Reconstruction and Development Programme first announced
1994: First democratic elections take place
1996: Growth, Employment and Redistribution Programme first announced
2003: Broad-based Black Economic Empowerment Act promulgated
2005: Accelerated and Shared Growth Initiative of South Africa first announced
List of abbreviations and terms
ACVV: Afrikaanse Christelike Vrouevereniging
AMPS: All Media and Products Survey
ANC: African National Congress
ASGI-SA: Accelerated and Shared Growth Initiative of South Africa
BBBEE: Broad-based Black economic empowerment
Bywoners: White farmhands who provided company for farmers, helped protect the farmand who often went out on commando with them. The most enterprising oftenraised enough capital, mostly through hunting, to enable them to becomeindependent farmers.
DRC: Dutch Reformed Church
DTI: Department of Trade and Industry
ESCOM: Electricity Supply Commission – the South African electricity public utilitycompany founded in 1922
GEAR: Growth, Employment and Redistribution (Programme)
IDC: Industrial Development Corporation
ISCOR: Iron and Steel Corporation – a parastatal founded in 1928
NP: National Party
RDP: Reconstruction and Development Programme
Rinderpest: An infectious viral disease of cattle, usually fatal
Trekboere: Rhe nomadic, pastoral farmers of the South African interior
About the authorJohan Fourie is a Lecturer in the Department of Economics at the University of Stellenbosch. Hisresearch interest is in the field of quantitative South African and Afrikaner economic history.Johan Fourie can be contacted at: [email protected]
MD45,8
1296
To purchase reprints of this article please e-mail: [email protected] visit our web site for further details: www.emeraldinsight.com/reprints

Company and societyThe “Caras do Brasil” (Faces of Brazil)program as leverage for sustainable
development
Luciano Barin CruzGESTOR/PPGA/Federal University of Rio Grande do Sul (UFRGS) and
EURISTIK/Centre de Recherche Magellan de l’IAE/Jean Moulin Lyon III University, Brazil
Eugenio Avila PedrozoGESTOR/PPGA/Federal University of Rio Grande do Sul (UFRGS) and
Center for Research and Development in Agribusiness (CEPAN)/Federal University of Rio Grande do Sul (UFRGS), Brazil, and
Rosangela Bacima and Beatriz QueirozPao de Acucar Group, Brazil
Abstract
Purpose – Inspired by a framework about the insertion of sustainable development in businessstrategy proposed by Steurer et al., the purpose of this article is to describe the Caras do Brasil (Facesof Brazil) program, highlighting its characteristics and how these can contribute to a newinterpretation of the framework initially proposed.
Design/methodology/approach – A posteriori longitudinal research was undertaken with the firstphase containing the theoretical research and the second phase containing the study of the Caras doBrasil (Faces of Brazil) program, which was designed as an incentive for the commercial developmentof small producers.
Findings – The present case demonstrates two characteristics that give reason to refine theframework proposed by Steurer et al. stakeholder pressures (either transactional or interactional)present differently; and the pressure of stakeholders is predominantly related to social concerns, ratherthan the predominance of environmental concerns stated by Steurer et al.
Research limitations/implications – The study limited itself to a posteriori data collection of thepresented case, given that it was impossible to follow the program regularly from its implementation.The results were generated through the perspectives of employees in the sustainable developmentdepartment of the Pao de Acucar Group, in view of the fact that it was not possible to interview each ofthe stakeholders involved.
Practical implications – For managers of many companies, the case can be considered an exampleof programs that seek to develop commercial activities with producers of poorer regions through theequilibrium of the economic, social and environmental dimensions.
Originality/value – The article demonstrates the differences of interpretation of the frameworkproposed by Steurer et al. when it is used to analyze a business program in a southern country such asBrazil. Separating transactional and interactional stakeholders grants the framework a higher level ofdetail.
Keywords Sustainable development, Fair trade, Stakeholder analysis, Brazil, Retailers
Paper type Case study
The current issue and full text archive of this journal is available at
www.emeraldinsight.com/0025-1747.htm
The “Caras doBrasil” (Faces ofBrazil) program
1297
Management DecisionVol. 45 No. 8, 2007
pp. 1297-1319q Emerald Group Publishing Limited
0025-1747DOI 10.1108/00251740710819041

IntroductionThe need to innovate and develop competitive advantage for companies has alwaysbeen and still is the main orientation of managers (Porter, 1980, 1985; Prahalad andHamel, 1990; Barney, 1991). Taking into consideration the creation of value and theconsequent maximization of the shareholder’s profits, the business strategies havebeen concentrated in competition (Penrose, 1958; Wernerfelt, 1984; Dierickx and Cool,1989; Prahalad and Hamel, 1990; Barney, 1991; Peteraf, 1993; Porter, 1980, 1985) andcooperation (Ring and Van de Ven, 1994; Mohr and Spekman, 1994; Child andFaulkner, 1998; Ireland et al., 2002; Doz, 1996; Barney and Hansen, 1994) as drivers ofthese innovations and competitive advantages.
However, in the last few years, the maximization of the shareholder’s profit beganbeing questioned. The obvious environmental and social problems that devastate theplanet (Martinet and Reynaud, 2004) also give pause for companies to be questionedabout their role in society. Should the companies also be responsible for thecommunities in which they are inserted, by adding value to their natural and socialresources? If the answer is yes, could it be possible to continue thinking aboutmaximization of the shareholder’s profit, considering the social and environmentalinvestments that would need to be done? Or would it be necessary to generate profit forthe shareholders in a way that allows the companies to be socially and environmentallyresponsible?
These questions have troubled many managers and academics in the last years.They relate to the heart of the discussions involving sustainable development: thesearch for the equilibrium of the economic, social and environmental tripod, alwayskeeping an eye on good life conditions for future generations, as was preached in theacclaimed Brundtland Report (1987). However, more than a discussion at the level ofthe nations, environmental development has become something more and morestrategic for companies. In this sense, some differences can be observed among someenterprises of different sectors of the economy, which makes some companies focus onphilanthropic activities while others seek to incorporate social and environmentalactions into their core businesses (as some enterprises that start to consider sustainabledevelopment as a key factor in the product and process innovation development).
In Southern countries such as Brazil, independent of the company’s sector, the socialdemand is visible and compels the companies to think about the responsibility ofquestioning themselves about their role in society (as indicates the work of animportant Institute in Brazil named Ethos Institut – www.ethos.org.br). In a countrywhere social inequity is very large and basic issues need to be confronted, companies ofdifferent sectors and sizes begin to see themselves in the middle of this problem,directly participating in the routine of many communities. This is the case of the Pao deAcucar Group, a retail company that performs in many regions of Brazil (among thempoorer ones) and has sought to develop programs and actions in partnership with othersectors of society that participate in the confrontation of social and environmentalproblems of these regions. This action has resulted in the international recognition byinstitutions such as the Inter-American Development Bank (IDB) and the UnitedNations Development Program (UNDP) through the Growing Sustainable BusinessInitiative. These institutions all demonstrate interest in studying the program. Otherprizes have also been awarded to the program, demonstrating the importantrecognition the program has received. Among these are the Guia Exame de Boa
MD45,8
1298

Cidadania Corporativa (Brazilian Review), the Valor Social Prize, 4th most respectedcompany in the country – Financial Times/Pricewaterhouse Coopers and the RetailCommunity Service (NY) of the American Review Executive Technology.
Among the programs developed by the Pao de Acucar Group, the Caras do Brasil(Faces of Brazil) program can be emphasized. It is designed to build a commercialrelationship that generates more opportunities for small producers of poorcommunities, seeking to professionalize them and offer their products on the shelvesof stores located in large urban centers. The presentation of this program is thepurpose of this article. Using a framework about the incorporation of sustainabledevelopment in business strategy (proposed by Steurer et al. (2005)), the goal here is todescribe the Caras do Brasil (Faces of Brazil) program by highlighting itscharacteristics and how these can contribute to a new interpretation of theframework initially proposed.
The article begins with a theoretical discussion about sustainable development(presentation of the theoretical propositions which give the analysis foundations),followed by a presentation of the methodological procedures used and the details of thecase itself. An explanation of the empirical and theoretical contributions – advances inthe framework proposed by Steurer et al. (2005) – complete the article.
Sustainable developmentAs pointed out by Kanbur (2002), an examination of the core principles of themainstream concept of development (based on the economic perspective) revealstremendous strengths, but also tremendous weaknesses. For him, other disciplinessuch as sociology, anthropology and political science have complementary strengthsthat suggest a role for them as equal partners in development studies and policy. Inthis sense, the debate on sustainable development is currently of major significance.
The traditional concept of sustainable development comes from the BrundtlandReport (World Commission on Environment and Development, 1987, p. 43): “is thedevelopment that meets the needs of the present without compromising the ability offuture generations to meet their own needs.” Having this concept as a starting point,many authors have explored the implications to consider the social, environmental andeconomic responsibility in diverse domains (Anand and Sen, 2000; Torras, 2003;Banerjee, 2003 in the international debate and policies; Asheim et al., 2001; Pretty andWard, 2001; Bansal, 2003; Greaker, 2003; Spangenberg, 2004; Boron and Murray, 2004,Aerni and Bernauer, 2006; Jagger et al., 2005 in the country policies; Hall and Martin,2005, Paramanathan et al., 2004, Dewick and Miozzo, 2004; Tien et al., 2005; Pujari,2006 in technological innovations; Buysse and Verbeke, 2003; Starkey and Crane, 2003;Russo, 2003; Zutshi and Sohal, 2004; Bansal, 2005; Sharma and Henriques, 2005;Barin-Cruz et al., 2006 in management).
Gladwin et al. (1995) present a typology with three different views of sustainabledevelopment: the conventional technocentrism; the antithetical ecocentrism; thesustaincentrism. The authors recognize the legitimacy of the first two views, butassume the third view as a more adequate view to a multidimensional approach.
In the “sustaincentric” view, the earth is humanity’s home, to be kept clean, healthy,and properly managed for the sake of human survival and welfare. The economicsystem that provides humanity with its material goods is underpinned by ecologicalsystems: changes in one affect the other. A prosperous economy depends on a healthy
The “Caras doBrasil” (Faces ofBrazil) program
1299

ecology, and vice versa. A green and equitable economy is possible, in which ecologicaland social externalities are internalized. In such a case, the authors remark thatmarkets are required to efficiently allocate resources, but other policy instruments andeconomic incentives are required to place pre-emptive constraints on the pursuit ofpurely market criteria bearing on natural resource use and satisfaction of basic humanneeds.
Starik and Rands (1995) incorporate this argument in their consideration of theissue, reinforcing the incorporation of sustainable development in business strategy.They consider that sustainability must take into account the relationship betweenorganizations and entities at the individual, organizational, political-economic,social-cultural and ecological levels. According to these authors, two radicalpositions, the choice between an economic technological perspective and a socialenvironmental perspective must be surpassed, opening space for a sustainableperspective, in which it is not enough to be cognizant only of the economic side, butrequiring the inclusion of the other dimensions. Steurer et al. (2005) draw on theseinsights in their own contribution, as will be demonstrated next.
Integrating sustainable development in business strategyAlthough many authors (Payne and Raiborn, 2001; Bansal, 2003, 2005; Greaker, 2003;Spangenberg, 2004; Boron and Murray, 2004; Martinet and Reynaud, 2004; Aggeri et al.,2005; Barin-Cruz et al., 2006; among several others) have explored the integration ofsustainable development into company management, what we will see here is theframework proposed by Steurer et al. (2005), in which the authors seek to representsustainable development through several levels in business management.
Steurer et al. (2005) propose a framework with four levels:
(1) management system;
(2) corporate social responsibility (CSR);
(3) corporate sustainability (CS); and
(4) sustainable development (SD).
The management system level is considered by the authors as the level of definitionand application of some technical norms for programs of social responsibility. Theypoint out norms such as ISO to exemplify what is accomplished by the companies inthis level. All norms and regulations established in the programs developed by thecorporate social responsibility are considered in this level.
The corporate social responsibility level refers to the management of socialresponsibility inside the company, or how the departments responsible for it developprograms and actions. Here, all the stakeholders pointed out above continue to have animportant role, but the employees, clients and community tend to be more directlyinfluenced.
The corporate sustainability level refers to the general policy of the company, ofhow the company structures sustainable development as one of its strategic policies. Inthis level, the role of stakeholders such as Governments, NGOs and local communitiesis also strong, although the shareholders tend to perform an important role.
The sustainable development level is the macro level, related to economic,environmental and social interests in the sphere of society. Here, we can emphasize the
MD45,8
1300

role of stakeholders such as the Governments, non-governmental organizations (NGOs)and local communities.
Taking these four levels under consideration, the authors consider that they surpassthe three classic dimensions of sustainable development (economic, environmental andsocial) through the influence of different stakeholders that relate to the company. Figure 1serves exactly to demonstrate this framework proposed by Steurer et al. (2005).
As can be seen from Figure 1, Steurer et al. (2005) determine entry points for therelationship between the company and stakeholders. These points are related to eachdimension and symbolized by black points. Therefore, in the management systemlevel, the entrance would happen in the economic dimension and would advancetoward the environmental dimension. In the corporate social responsibility level, theentrance would happen in the social dimension and would advance toward theeconomic dimension. In the corporate sustainability and sustainable developmentlevels, though, the entrance would occur in the environmental dimension and advancetoward the economic dimension.
Exploring the role of the stakeholdersLately, there has been a tendency not only to maximize value for the shareholders of anorganization, but to incorporate a concern with everyone that somehow influence or isinfluenced by the organization – the stakeholders. In 1984, Freeman (1984) proposed adefinition of stakeholder as an individual or group that can affect or be affected by theaccomplishment of the firm’s goals.
Having this definition as the starting point, some authors have contributed indefining the relationship between organization and stakeholders (Mitchell et al., 1997;Frooman, 1999; Jones and Wicks, 1999; Jawahar and Mclaughlin, 2001), emphasizingthe relations of power that are established and the form the company chooses toconsider the stakeholder, depending on the legitimacy or urgency of its demands.
Figure 1.Framework proposed by
Steurer et al. (2005)
The “Caras doBrasil” (Faces ofBrazil) program
1301

The growing preoccupation of companies with the insertion of sustainabledevelopment in its strategies has forced them to search for ways to incorporate thestakeholder’s interests in its concerns. Thus, Martinet and Reynaud (2004) suggest thattwo types of stakeholders must be considered: the transactional and interactional.
The stakeholders of the transactional sphere are those who are directly involved inthe commercial or financial transactions of the company. This is the case ofshareholders, the common financial market, employees, suppliers and distributors,clients, investors, etc. As pointed out by the authors, the main pressures made by thistype of stakeholder are: no introduction of the enterprise in ethical funds and somedifficulty to get capital for investments (shareholders); boycotts (clients); difficulty tofind qualified employees, when the employees are in a market that they have somechoice (employees); difficulty to get credit and bad options of assurance contracts(banks and insuring). In the interactional sphere, the stakeholders are not directlyinvolved in the commercial or financial transactions of the company, but are indirectlyrelated to the company. It is the case of governments, scientific institutions, the media,public opinion and civil associations. As also pointed out by the authors, the mainpressures made by this type of stakeholder are: juridical measures (government) andpublic demonstrations and occupations (protection associations).
MethodologyThe present research can be characterized as an a posteriori longitudinal study(Forgues and Vandangeon-Derumez, 2003), as it deals with the case of the Caras doBrasil (Faces of Brazil) Program of the Pao de Acucar Group since its creation untilnow, starting from the current moment and recovering past information (the programwas not followed regularly during its evolution through time). The research wasundertaken in two main phases.
The first phase began with the theoretical referential about sustainabledevelopment with great emphasis on the framework proposed by Steurer et al.(2005), in which the author integrates company (beginning from more technical andoperational levels) and society (integrating this level to the consideration of businessstrategy). Using the framework as its foundation, the second phase was carried on, inwhich we preceded with the study of the Caras do Brasil (Faces of Brazil) Program,developed by the Brazilian retail Pao de Acucar Group.
In the second phase the case study was carried on (as suggested by Yin (2002) andStake (2000)) in the Pao de Acucar Group, with focus in one of its main programs ofcorporate social responsibility, the Caras do Brasil (Faces of Brazil) Program. Thetriangulation technique for data collection and analysis was used, as suggested by Yin(2002) and Stake (2000). This means that interviews of managers involved were takenin Sao Paulo (made by the researchers in the Portuguese language and conducted witha semi-structured questionnaire); internal and external documentation was analyzed(more than 30 documents analyzed); in loco observations were made in the installationsof the program in the group’s headquarters; some visits to suppliers engaged in theprogram were also made. The profile of the interviewees is:
. Institutional relations advisor – Caras do Brasil (Faces of Brazil) program;
. Coordinator of social projects;
. Caras do Brasil (Faces of Brazil) manager; and
. Institute Pao de Acucar Exceutive Director.
MD45,8
1302

The interviews were taken according to the demand made to each interviewee, in orderto indicate which were the greatest impacts resulting of the Caras do Brasil (Faces ofBrazil) program and generated to each stakeholder of the group. It can be pointed outthat in the Pao de Acucar Institute (the part of the group responsible for sustainabledevelopment) all those who act on strategic levels were interviewed; in this case, a totalof four people. These were defined and indicated by the executive manager.
Taking these three sources of information under consideration, it was possible toanalyze the Caras do Brasil (Faces of Brazil) program, in search of an understanding ofthe program through the framework proposed by Steurer et al. (2005). The idea was todetermine the salient characteristics of the program and to draw attention to theBrazilian case that can contribute for a new interpretation of this framework.
Describing the Caras do Brasil (Faces of Brazil) program using theframework proposedThe Pao de Acucar Group was founded in 1948 and since then has performed in thefood retail sector in Brazil. Today, it is the largest retail company in the country andacts in three forms:
(1) supermarkets (Pao de Acucar, CompreBem and Sendas divisions);
(2) hypermarkets (Extra); and
(3) consumer electronics (Extra-Eletro).
Its stocks have been listed in Bovespa (Brazilian Stock Market) since 1995 and in theNew York Stock Exchange since 1997.
Profit leader in the retail sector since 2002 with a gross profit of R$16.5 billion(approximately U$7.67 billion) in 2006; the group has 534 stores distributed in 14Brazilian states and the Federal District, totaling an area of more than 1 million squaremeters, which demands a workforce of 70,000 employees.
The strategic orientation of the company is based on the search for differentials thatcan guarantee the market leadership. The mission “guarantee the best shoppingexperience for all of our clients in each of our stores” is sustained by three pillars,which are the starting point for its concretization: people, technological developmentand solid capital structure. The view proposed in its strategic plan for 2006-2010, “to bethe best Brazilian retail company, admired by its rentability, innovation, efficiency,social responsibility and contribution to the development of Brazil” demonstrates theposition the company seeks to occupy in its segment.
Having corporate social responsibility as one of its criteria for evaluating thesuccess of the corporative view, the company begins to develop several programs inthis area. Among these, the Caras do Brasil (Faces of Brazil) program is prominent.Having the framework proposed by Steurer et al. (2005) as the starting point, some ofthe program’s main characteristics are noted, beginning from the level of society(fourth level, as proposed by the authors), passing through the company managementlevel (CS – third level proposed by the authors) and the program’s management level(CSR – second level proposed by the authors) and finally finishing with the mosttechnical level (first level proposed by the authors). It is important to mention that thelevels are considered according to Table I and that they are presented according to thecharacteristics and influence of the Caras do Brasil (Faces of Brazil) program.
The “Caras doBrasil” (Faces ofBrazil) program
1303

At the end of the presentation of each level, the main impacts generated fortransactional and interactional stakeholders connected to each level were sought. It isimportant to salient that the impacts are a result of the perception of managersinvolved in the Caras do Brasil (Faces of Brazil) program and of managers involvedwith the sector responsible for sustainable development at the Pao de Acucar Group,the Pao de Acucar Institute.
“Management system” level – technical characteristics of the programThe characteristics and/or technical rules of the Caras do Brasil (Faces of Brazil)program is considered in this level. Included among these is the eligibility of suppliers,types of products accepted, supplier accreditation and cadastre, as well as theestablishment of contracts, requests, delivery location, sale price and forms of control.
Supplier elegibility. In order to certify the eligibility of suppliers, an analysis ofcertain elements that inevitably need to be a constitutive part or be present in theprojects is undertaken. Prerequisites for the acceptance of suppliers are:
. to be a legally constituted company, able to emit sale invoices and that also paytheir taxes;
. to obey all national, state and municipal laws, all administrative demands and allinternational treaties and deals of which Brazil is signatory;
. to demonstrate and practice the repudiation of child labor;
. to respect the rights of the indigenous peoples;
. to respect the long-term land use rights, being that the local communities withlegal or traditional land use rights must control forest operations unless theyconsciously and freely delegate this control to other people or entities;
. to act according to environmental responsibility as a whole, taking underconsideration the use of insecticides and other chemical agents, as well as agentsof biological control;
. to be cautious with erosion and preservation of hydric resources;
. to respect the harvest taxes which guarantee sustainability;
. to respect the areas of high conservation value and other elements related to theenvironmental issue; and
. to obey the laws concerning sanitary issues (when applicable).
The projects considered eligible inside the prerequisites above are later analyzedaccording to four other topics (listed below), allowing the construction of a complete
Level proposed by Steurer et al. (2005) Management level
Management system (MS) Technique rules of the Caras do Brasil (Faces ofBrazil) program
Corporate social responsability (CSR) Caras do Brasil (Faces of Brazil) programCorporate sustainability (CS) Pao de Acucar GroupSustainable development (SD) Brazilian society
Table I.Connection between thelevels proposed bySteurer et al. (2005) andthe management levels ofthe Pao de Acucar Group
MD45,8
1304
picture of their true possibilities of participating of the program. It is important tosalient that these criteria are not excluding but they provide the Pao de Acucar Groupimportant information about the coherence of the suppliers with the Caras do Brasil(Faces of Brazil) program. The other items evaluated are:
. capacity to maintain the supply consistently and constantly, guaranteeing thequality of the product offered;
. confidence on the producer regarding the fulfillment of the deals;
. possibility to increment the productive capacity without detriment of the otheraspects of sustainability;
. improvement of the social and economic well-being of employees, according tothe purpose of the project;
. vulnerability of the production due to natural factors;
. true representation in the community;
. fragility of the products, potential difficulties of transportation and possiblesolutions;
. the potential support of non-governmental organizations, government ormultilateral organizations;
. resources that support/sustain the project;
. respect to the norms regarding health and safety of employees; and
. agility and creativity of the producer in dealing with problems and challenges.
Products of the program. Aside from the supplier eligibility criteria, the programdetermines which type of products can be commercialized. These products can besituated in the following categories:
. grocery;
. perishables (as long as they have expiration date superior to five days and can bedelivered directly to the stores);
. personal hygiene;
. decoration objects;
. gastronomy;
. domestic items; and
. textile (bed, table, bath, clothing and accessories).
Supplier accreditation and cadastre. The supplier cadastre is made through theProgram’s web site, where the supplier can fill a specific form. If a supplier does notfulfill the program’s accreditation criteria (presented earlier), he is communicated aboutthe fact by letter or e-mail, being elucidated about the reason it was not accredited and,depending on the case, being given orientations on how to fit the minimum requisites.
The cadastre is only made after the confirmation that the supplier fulfills thesustainability precepts mentioned earlier. After all conditions are fulfilled, thesupplier’s cadastre is made in 7 to 20 days depending on the region of the countrywhere it is situated.
The “Caras doBrasil” (Faces ofBrazil) program
1305

It is important to salient that there are no restrictions regarding the productivecapacity of the suppliers. The Caras do Brasil (Faces of Brazil) program respects thiscapacity.
Product cadastre. Having fulfilled the supplier accreditation stage, the products arechosen according to the exclusive decision of the Pao de Acucar Group. All informationregarding products not accepted is provided to the supplier with the intention oforientating him in the improvement and/or adjustment of his products.
Contract. Having made a cadastre of the supplier and the products, the supplycontract implemented is the same used with all other suppliers, being interesting topoint out some special characteristics such as:
. payment deadline: ten days from the date;
. discounts: no other discount will be applied in the supply contract of the partnersof the Caras do Brasil (Faces of Brazil) program;
. payment forms: the suppliers will be paid via bank account deposit in anybank/agency of the national territory.
Requests, devolutions and delivery location. Each of the requests made to suppliersalways respects its productive capacity and delivery deadline. Therefore, the requestsare made by telephone and later electronically confirmed.
The delivery location of the products is the distribution center of the group in itscity headquarters. The center then takes care of the distribution of the products to thestores that take part in the program.
Sale price. After fulfilling all the previous requisites, the products are sold in storesof specific locations for this finality. The calculated profit of the program is zero. Taxesand part of the operational cost (the other part is paid by the company) are added to theproduct’s original price. These are the factors that shape the sale price of each product.
Visits to suppliers. As a control measure, a representative of the group might visitthe supplier at any time with the objective of checking the maintenance of the datacollected in the cadastre, as well as to verify improvements implemented. Thenon-accomplishment of the rules of eligibility results in the immediate removal fromthe Caras do Brasil (Faces of Brazil) program.
Table II demonstrates the main transactional and interactional stakeholdersconnected to this level, as well as the impacts generated by these stakeholders due to
Stakeholders Impacts
Transactional:Cooperatives, associations and producers Opportunity to generate income continuously and
to structure themselves professionally(interviewees 1, 3 and 4)
Interactional:Certificates and Organisms definers of indicatorssuch as: ABNT Technical Norm – NBR 16001.GRI, Ethos Indicators, ISE/Bovespa Indicators,ISO 26000
The Caras do Brasil (Faces of Brazil) program isan example of the application of some of theorientations defended by these entities, especiallyin what regards respect to the environment, workand income, generating new opportunities forpoor communities (interviewees 1, 3 and 4)
Table II.Benefits for stakeholdersin the managementsystem level
MD45,8
1306

their relationship with the Pao de Acucar Group and/or the Caras do Brasil (Faces ofBrazil) program. It can be noticed that for the transactional stakeholders the impactssuggest a kind of pressure most related, initially, to the economic dimension. On theother hand, for the interactional stakeholders the impacts suggest a kind of pressuremost related, initially, to the social dimension.
“Corporate social responsibility” levelThe management of the Caras do Brasil (Faces of Brazil) program is considered in thislevel, comprehending the position of the program and the goals that conduct it.
Launched in December 2002, with investments of R$500,000,00 (aboutUS$220,000,00), the project is concerned with one of the main problems of civilorganizations which possess a productive activity: commercialization.
Active with the Caras do Brasil (Faces of Brazil) program in 37 stores in cities such asSao Paulo, Rio de Janeiro and other in the State of Sao Paulo, the Pao de Acucar Groupopened room in one of its shelves for the commercialization of sustainable productselaborated by companies that were mostly formed of micro organizations, NGOs andartisans, thus allowing them to expose their goods in one of the country’s largest retailnetwork, reaching a consumer market present in at least 15 federation units.
The program has three main concepts:
(1) to sell products elaborated by organizations that demonstrate social andenvironmental responsibility and cultural valorization;
(2) to accept products which respect the principles of sustainable development,which generate income for those involved and promote the permanence of thesepeople in their communities; and
(3) to follow the principles and policies of the Pao de Acucar Group during thecommercialization of these products in what regards purchase, exposal and sale.
This general view of the program is managed according to goals such as:. to provide a sales channel for products considered sustainable in the Pao de
Acucar Group’s principles of commercialization;. to stimulate conscious consumption;. to contribute to the generation of wealth for the communities;. to encourage the establishment of people in their places of origin;. to stimulate conscious commerce;. to promote social inclusion;. to sell products with social-environmental value attached;. to eliminate intermediates;. to reject slave or child labor; and. to eliminate racial or gender discrimination.
To conduct the program in order to achieve these goals, the management of Caras doBrasil (Faces of Brazil) inside the company counts with the supervision of the executivedirection and the operations take place in the institutional relations sector, composedby one manager and one analyst. There is also an important participation of several
The “Caras doBrasil” (Faces ofBrazil) program
1307

sectors of the company that are highly involved with the program – groups of theDistribution Centers (Sao Paulo and Rio de Janeiro), managers of categories, marketingand of the stores that commercialize products of the program.
In order to monitor and follow the Caras do Brasil (Faces of Brazil) program, theGroup has its own structure and relies on the work of specialized advisors (sustainableview) and with the establishment of partners in several levels (Government,multilateral organizations, NGOs, etc.)
Partnerships and development of the program. To guarantee the adhesion of newsuppliers, the program relies on the collaboration of some partners, of which we canemphasize:
. Brazilian Environmental Ministry: a technical cooperation deal which consists ofthe indication of partner and affiliated projects; publicizing and recommendationof supported projects; articulation of groups or organizations of producers inorder to register opportunities for sustainable products.
. Brazilian Ministry of Culture: development of joint actions which contribute tothe stimulation of economic activities of the Cultural Points of the Live CultureProgram.
. United Nations Development Program: Preparatory Assistance.
These partnerships have contributed for the development of the program. Havingbegun in 2003 with four stores and 27 suppliers from ten Brazilian States, in the firstfive months of operation the program commercialized R$168,000,00 (approximatelyUS$73,000,00) in merchandise. From then on, the number of suppliers practicallytripled and the producers that participate of the initiative saw their production growvertiginously, as demonstrated in Table III.
Today, there are more than 230 items in 37 stores of the Group, coming from 71suppliers of 19 Brazilian States. Table IV demonstrates how the suppliers aredistributed.
Stores Suppliers States
December/2003 4 25 10December/2004 12 44 16December/2005 36 71 19December/2006 33 71 19
Table III.Evolution of the programfrom December 2003 toDecember 2006
By type % part
Autarchy 0.0Artisans 15.0Association 23.3Cooperative 18.3Company 0.0Institutes 1.7Micro company 28.3NGO 13.3
Table IV.Types of suppliers
MD45,8
1308

The main products supplied are: dish towels, honey, table towels, sweets and jam,decorations items, textiles, home equipment, aromatic candles and hygiene and beautyproducts that use typically Brazilian raw material such as andiroba, sisal, orangeflower, honey and propolis.
Table V demonstrates the main transactional and interaction stakeholdersconnected to this level, as well as the impacts generated by these stakeholders due totheir relationship with the Pao de Acucar Group and/or the Caras do Brasil (Faces ofBrazil) program. As can be seen in this table and as it happens on the other level,impacts suggest a kind of pressure for the transactional stakeholders most related,initially, to the economic dimension. On the other hand, for the interactionalstakeholders the impacts suggest a kind of pressure most related, initially, to the socialdimension.
“Corporate sustainability” levelThis level considers the sustainable management developed by the Pao de AcucarGroup, bearing in mind its business posture and the goals that guide this posture.
The Pao de Acucar Group understands its role as a project of common improvementof the company, shareholders, suppliers, clients and most of all, the society. Thecompany encourages its collaborators, suppliers and clients to embrace sociallyresponsible causes and also leave their actives available so that these actions can occur.
Stakeholder Impacts
Transactional:Clients of the stores involved in the program Awareness and valorization of products with attached
social-environmental value with a good price(interviewees 1, 3 and 4)
Clients in general that acknowledge thecompany’s initiative
Awareness of the importance and the possibility ofoffering products with attached social-environmentalvalue with a good price (interviewees 1, 3 and 4)
Executives and managers of the businesssectors. Specially those involved with theCaras do Brasil (Faces of Brazil) program
Need to develop management tools that are appropriatefor a company that has this type of program andposture (interviewees 1, 3 and 4)
Employees of the stores involved with theprogram
Social-environmental awareness, once they starthaving access to products that are fruit of programslike Caras do Brasil (Faces of Brazil). They also start torelate with clients and to valorize this activity explicitly(interviewee 2)
Employees in general Social-environmental awareness, once they beginhaving access to the products that are fruit of the Carasdo Brasil (Faces of Brazil) program (interviewee 2)
Cooperatives, associations and producersthat are part of the program
Opportunity to generate income continuously and tostructure themselves professionally (interviewees 1, 3and 4)
Interactional:Communities (people in general and familiesof the producers)
Possibility of local development of these communities(interviewees 1, 3 and 4)
NGOs Permits the publicizing of its ideas, as well as thedrainage of products elaborated by the projects theysupport (interviewees 1, 3 and 4)
Table V.Benefits for stakeholders
of the corporate socialresponsibility level
The “Caras doBrasil” (Faces ofBrazil) program
1309

Corporate sustainability is present in all sectors of the company and extends itself to allstakeholders. However, for the sake of clarity and transparency, the Pao de AcucarGroup distributes its actions of sustainable management in five scopes, with programsoffered for each public:
(1) Our people: collaborators and family members.
(2) Environment: society/environment.
(3) Responsible retail: clients, consumers, suppliers and partners.
(4) Social development of Brazil: communities, government and society.
(5) Sports and culture: community and society.
Considering the sustainable management scopes that inspire the actions of thecompany, the Caras do Brasil (Faces of Brazil) program can be inserted in practicallyall of them. Among the several actions undertaken by the Pao de Acucar Group, theprogram is a demonstration of how companies can use its actives to serve and build anew society at the same time it creates a differential, levers sails and attends to thespecific demands of consumers, all without having to escape from its core-business (inthe case of Pao de Acucar, its stores).
Caras do Brasil “Faces of Brazil” is intrinsically connected to the businesses of thePao de Acucar Group because it is based on the main activity of the company: buyingand selling merchandise. In this context, however, specific criteria of negotiation andcommercialization were developed so that at the same time it serves the final activity ofthe group, it can transcend these boundaries and have positive reflexes in all thepublics involved.
Aside from that, the program is also inserted in the great themes of social-economicdevelopment articulated by the United Nations, which is the case of the Global Pactand the Millennium Development Goals. Of all the principles of the Global Pact, theCaras do Brasil (Faces of Brazil) program can be inserted in at least five out of ten.They are:
(1) Human rights principles:. Principle 1: businesses should support and respect the protection of
internationally acclaimed human rights.. Principle 2: make sure they are not complicit in human rights abuses.
(2) Environment principles:. Principle 7: businesses should support a precautionary approach to
environmental challenges.. Principle 8: undertake initiatives to promote greater environmental
responsibility.. Principle 9: encourage the development and diffusion of environmentally
friendly technologies.
Regarding the Millennium Goals, the program accomplishes four of the eight pointsapproached in this forum. Among them:
. Goal 1 – eradicate extreme poverty and hunger.
. Goal 3 – promote gender equality and empower women.
MD45,8
1310

. Goal 7 – ensure environmental sustainability.
. Goal 8 – develop a global partnership for development.
Exactly because of its posture of corporate sustainability, levered by programs such asCaras do Brasil (Faces of Brazil), the Group has received national and internationalrecognition. It was considered by the Global Pact as a “Notable practice” in theoccasion of the first publication of the Progress Report since the implementation of theGlobal Pact principles. It has been target of interest of institutions such as theInter-American Development Bank (IDB), the United Nations Development Program(UNDP) and the Growing Sustainable Business (GSB).
The company has already received some awards for its responsible role, amongthem the Guia Exame of Good Cooperative Citizenship award and the Social ValueAward. It was also chosen as the country’s fourth most respected company by theFinancial Times/Pricewaterhouse Coopers and was given the Retail CommunityService (NY) award offered by American Magazine Executive Technology to the bestprojects of communitarian relations and social responsibility undertaken by retailcompanies. The Caras do Brasil (Faces of Brazil) program specifically has granted thecompany the following awards:
. 2006 – Guia Brasil 2006 – Revista Guia Quatro Rodas – Contribution toCraftsmanship/Caras do Brasil (Faces of Brazil) program.
. 2006 – Von Martius Environmental Award – Third Place – Category:Humanity – Caras do Brasil (Faces of Brazil) program.
. 2005 – Social Value – Relations with Community Category – Caras do Brasil(Faces of Brazil) program.
Table VI demonstrates the main transactional and interactional stakeholders connectedto this level, as well as the impacts generated by these due to their relations with the Pao
Stakeholders Impacts
Transactional:Administration Council, representedparticularly in the Development andInnovation Committee, which discusses theissues of social and environmentalresponsibility
Being inserted in the core business of the company, theCaras do Brasil (Faces of Brazil) program strengthensthe perception of the group as a socially responsiblecompany through local development and consciousconsumption, thus stimulating the maintenance of thistype of general policy in the company (interviewees 1, 3and 4)
Executive direction of the group Needs to develop appropriate management tools for acompany with this type of program and this particularposture (interviewees 1, 3 and 4)
Interactional:Governments: Federal, State and Municipal By stimulating income, social inclusion, the program
“helps” the government promote social and economicdevelopment for the people (interviewees 1, 3 and 4)
Partner NGOs Permits the publicizing of its ideas, as well as thedrainage of products elaborated by the projectssupported by the program (interviewees 1, 3 and 4)
Table VI.Benefits for stakeholders
in the corporatesustainability level
The “Caras doBrasil” (Faces ofBrazil) program
1311

de Acucar Group and/or the Caras do Brasil (Faces of Brazil) program. It can be noticedthat these impacts suggest a kind of pressure more related, initially, to the socialdimension for both the transactional and interactional stakeholders.
“Sustainable development” levelThis level is connected to the relationship between the Pao de Acucar Group and thesociety in which it is inserted, the Brazilian society. Considering the serious socialproblems that Brazil faces and the direct impact of these problems in the communitieswhere the Pao de Acucar Group acts, the group has begun to organize itself in order todevelop strategies of participation in the issues of public interest and partnerships thatcontribute with confronting such reality.
The Caras do Brasil (Faces of Brazil) program, object of this article, relates to all thepeople in the company that approve and stimulate the development of this practice.Believing that a socially responsible company is one who possesses the capacity tolisten to the interests of different publics – shareholders, employees, suppliers,consumers, community, government and environment – the Pao de Acucar Groupmanages to incorporate the concepts of social responsibility in the planning andpractice of its activities and therefore seeks to take care of the several demands of itsstakeholders.
In a macro form, the governments in different levels (Federal, State and Municipal),organizations of the supermarket sector, international organizations (such as theUnited Nations – UN, United Nations Developement Programme – UNDP, UnitedNations Educational, Scientific and Cultural Organization – UNESCO, United NationsChildren’s Fund – UNICEF, Inter-American Development Bank – IDB, United NationsConference on Trade and Development – UNCTAD, etc.) as well as AcademicInstitutions and partner NGOs are the main stakeholders of the Pao de Acucar Group.
By developing the Caras do Brasil (Faces of Brazil) program, the Group begunencouraging and advising the communities, in which it is inserted to improve themanagement and administration of their projects, conducting them to results in thecommercial dimension as well in other components of sustainability, including socialand environmental ones.
Table VII therefore demonstrates the main interactional stakeholders connected tothis level, as well as the impact generated by them due to their relationship with thePao de Acucar Group and/or with the Caras do Brasil (Faces of Brazil) program. In thislevel, only interactional stakeholders were considered and one can see that theseimpacts suggest a kind of pressure more related, initially, to the social dimension.
Advancing the framework proposed by Steurer et al. (2005)Taking under consideration the framework proposed by Steurer et al. (2005), one canobserve that the case presented allows a different interpretation than that suggested bythe authors. Maintaining the same working logic of the framework proposed, it can beobserved in the following case that a separation of transactional and interactionalstakeholders can be made. The case demonstrates that the entry point of each level canalso vary according to the stakeholder considered. While the entry point can be in onedimension for the transactional stakeholders, it can be in another for the interactional.By having different goals, the different types of stakeholders pressure the company indifferent ways.
MD45,8
1312

It can be observed in the case of the Pao de Acucar Group that there are,fundamentally, interactional stakeholders in the sustainable development level. In thislevel lies the relation of the company with the society in which it is inserted. As can beseen on the description of the program, the social problems present in the Braziliansociety are such that the pressures of this level’s stakeholders are concentrated on thesocial dimension. There is a need for projects and business actions that help theconfrontation of problems regarding social exclusion. Beginning from the socialdimension, the direction of this pressure heads toward the environmental dimensionand then toward the economic dimension.
In the corporate sustainability level one can observe the existence of interactionaland transactional stakeholders. Here, also due to the strong demands of the Braziliansociety, the interactional and transactional stakeholders exercise pressure on a socialpoint of view. The stakeholders exercise a strong demand so that the sustainabilityposture of the group can continue strongly oriented by the social dimension. However,in this level, while the direction of the pressure of interactional stakeholders headstoward the environmental dimension and then to the economic dimension (pressuremade so that more and more projects connected to the environmental dimension canalso be developed), for transactional stakeholders the direction of the pressure goestoward the economic dimension and then to the environmental dimension (a concernwith the economic viability of several social projects to be developed).
In the corporate social responsibility (CSR) level, the interactional stakeholderscontinue exercising pressure with priority on the social point-of-view (also due to thecharacteristics of Brazilian society) while the transactional stakeholders are moredirectly interested with the economic possibilities of the Caras do Brasil (Faces ofBrazil) program (possibility of profit generation for groups of producers of less
Stakeholders Impacts
Interactional:Governments: Federal, State and Municipal Promoting the generation of income and social
inclusion. It helps the government to promote theeconomic and social development of these regions(interviewees 1, 3 and 4)
Representative organizations of the sector:ABRAS (Brazilian Supermarket Association)and APAS (Sao Paulo SupermarketAssociation)
“Caras do Brasil” (Faces of Brazil) is a benchmark forthese organizations, with the possibility of beingsuggested to companies of other sectors (interviewees1, 3 and 4)
Organizations: UN/UNDP, UNESCO,UNICEF, IDB, GIFE, UNCTAD, EthosInstitute
“Caras do Brasil” (Faces of Brazil) is an example of theapplication of the policies defended by these entities,especially in what regards work, income and theenvironment. It is already a target of case studies withthe objective of publicizing this innovative andwell-succeeded practice (interviewees 1, 3 and 4)
Academic institutions The program is the target of many case studies, whichstimulates research that suggests the replication of thiskind of program (interviewees 1, 3 and 4)
Partner NGOs Permits the publicizing of its ideas, as well as thedrainage of products elaborated by the projectssupported by the program (interviewees 1, 3 and 4)
Table VII.Benefits for stakeholders
in the sustainabledevelopment level
The “Caras doBrasil” (Faces ofBrazil) program
1313

developed regions, through the sale of their products in the shelves of the Pao deAcucar Group). In this level, the direction of pressure of interactional stakeholderscontinues towards the environmental dimension and later towards the economicdimension (with the insertion of requisites for greater environmental protection in theproject) while for transactional stakeholders the direction of pressure goes towards thesocial dimension and afterwards towards the environmental dimension (the producersalso seek to guarantee development conditions for their communities).
In the management system level, the pressure of interactional stakeholderscontinues being mainly connected to social issues (requests for the definition of normsof social inclusion and respect) while for transactional stakeholders the maindimension is still the economic dimension (interested in the criteria that guaranteeseconomic possibility and viability of its production). In this level, the direction ofpressure of interactional stakeholders goes toward the economic dimension and latertowards the environmental dimension (economic viability for producers derived fromdefined social requisites) and for transactional stakeholders the direction of pressuregoes towards the social dimension and later towards the environmental dimension (toserve the interests of the communities in which they are inserted).
Figure 2 demonstrates the interpretation given to the framework proposed bySteurer et al. (2005), according to the observation of the case presented.
As was presented, the social dimension seems to be the most evident dimension inthe case of the Caras do Brasil (Faces of Brazil) program. Although the environmentaland economic dimensions are always observed in the strategic direction of theprogram, the social demands of the Brazilian society urge the program to provide
Figure 2.Framework according tothe case presented
MD45,8
1314

greater assistance to these needs. This demonstrates the contextual character thatmust be given to the framework proposed by Steurer et al. (2005) in face of theparticular characteristics of each country and company. It is speculated that theauthors proposed in the original framework a predominance of the environmentaldimension (as entry point of the stakeholders’ pressure) in the sustainable developmentand corporate sustainability levels, mainly based on the reality of northern countries,where the social issues are better resolved and the environmental issue is made moreand more perceptible.
Final considerationsThe article has presented the Caras do Brasil (Faces of Brazil) program developed bythe Pao de Acucar Group, Brazil’s biggest retail company. The program is one of theinitiatives developed by the group that seek to manage its political strategy of socialresponsibility.
To present this case, two phases were followed in the research. A theoreticalresearch was carried on in the first phase with the purpose of reflecting about some ofthe current theoretical propositions in the field of sustainable development. Theframework proposed by Steurer et al. (2005) can be considered the main contribution ofthis phase. The second phase was characterized by the case study itself, in whichinterviews were made with those involved in the Caras do Brasil (Faces of Brazil)program, in loco observations were carried out and internal documents analyzed.
From a managerial point of view, this article contributes with the presentation of asuccessful case of a program directed toward enacting corporate social responsibility,in which the conducting line is the search for alternatives for the development of fairercommerce between large companies and poor communities. The case gains even morevalue due to the fact that it is being developed in a country such as Brazil, where theexistence of important social disadvantages to be overcome is notorious. The casepresented could be used as a reflection starting point for managers all around the worldwho wish to develop programs to stimulate the development of poor communitiesthrough commercial exchange. As was shown, the Caras do Brasil (Faces of Brasil)program is not an assistentialist program. In fact, the Caras do Brasil (Faces of Brazil)program tries to organize and professionalize producers of some communities. Thistype of program continues to generate good financial return for the company (due tothe sale of products to a special market segment) and at the same time, generatepractical benefits in terms of the community’s development (including theenvironmental preservation of the region) and in terms of the company’s image. It isa good example of how the managers could develop projects that balance betweeneconomical, social and environmental concerns.
From a theoretical perspective, the article contributes in proposing alternatives forthe interpretation of the framework proposed by Steurer et al. (2005), taking intoconsideration the reality of a country with an extremely deficient social context.Otherwise, the research can serve as a starting point for similar studies in othercountries; be they developed countries or countries in development.
However, among the most important limitations of this research, one can point outthe impossibility of interviewing the different stakeholders involved with the Pao deAcucar Group, which would allow a more detailed investigation of the benefits(economic, social and environmental) of the program for each one of them. Another
The “Caras doBrasil” (Faces ofBrazil) program
1315

limitation of this study was the impossibility of undertaking a longitudinal study fromthe creation of the Caras do Brasil (Faces of Brazil) program (to follow the projectregularly since its creation, and not only a posteriori). Future research, designed toexplore similar programs longitudinally, is suggested. Such research may allow anevolutionary accompaniment of the program and may bring new light andcontributions to frameworks such as that of Steurer et al. (2005). We also suggestthat future empirical researches be made to explore the differences between theinteractional and transactional stakeholders’ pressures, as was started to be made inour research.
Considering the current situation of the planet, companies need to consider theirroles in assuming a pro-active posture regarding sustainable development.Contributions related to corporate social responsibility should be encouraged. Wehope this paper and its findings can further stimulate these contributions.
References
Aerni, P. and Bernauer, T. (2006), “Stakeholder attitudes toward GMOs in the Philippines,Mexico, and South Africa: the issue of public trust”, World Development, Vol. 34 No. 3,pp. 557-75.
Aggeri, F., Pezet, E., Abrassart, C. and Acquier, A. (2005), Organiser le Developpement Durable:Experiences des entreprises pionnieres et formation de regles d’action collective, Vuibert,Paris.
Anand, S. and Sen, A. (2000), “Human development and economic sustainability”, WorldDevelopment, Vol. 28 No. 12, pp. 2029-49.
Asheim, G.B., Buchholz, W. and Tungodden, B. (2001), “Justifying sustainability”, Journal ofEnvironmental Economics and Management, Vol. 41 No. 3, pp. 252-68.
Banerjee, S.B. (2003), “Who sustains whose development? Sustainable development and thereinvention of nature”, Organization Studies, Vol. 24, pp. 143-80.
Bansal, P. (2003), “From issues to actions: the importance of individual concerns andorganizational values in responding to natural environmental issues”, OrganizationScience, Vol. 14 No. 5, pp. 510-27.
Bansal, P. (2005), “Evolving sustainably: a longitudinal study of corporate sustainabledevelopment”, Strategic Management Journal, Vol. 26 No. 3, pp. 197-218.
Barin-Cruz, L., Pedrozo, E.A. and Estivalete, V.F.B. (2006), “Towards sustainable developmentstrategies: a complex view following the contribution of Edgar Morin”, ManagementDecision, Vol. 44 No. 7, pp. 871-91.
Barney, J. (1991), “Firm resources and sustained competitive advantage”, Journal ofManagement, Vol. 17 No. 1, pp. 99-120.
Barney, J.B. and Hansen, M.H. (1994), “Trustworthiness as a source of competitive advantage”,Strategic Management Journal, Vol. 15, special issue, pp. 175-90.
Boron, S. and Murray, K. (2004), “Bridging unsustainability gap: a framework for sustainabledevelopment”, Sustainable Development, Vol. 12, pp. 65-73.
Buysse, K. and Verbeke, A. (2003), “Proactive environmental strategies: a stakeholdermanagement perspective”, Strategic Management Journal, Vol. 24 No. 5, pp. 453-70.
Child, J. and Faulkner, D. (1998), Strategies of Co-operation: Managing Alliances, Networks, andJoint Ventures, Oxford University Press, Oxford.
MD45,8
1316

Dewick, P. and Miozzo, M. (2004), “Networks and innovation: sustainable technologies in Scottishsocial housing”, R&D Management, Vol. 34 No. 3, pp. 323-33.
Dierickx, I. and Cool, K. (1989), “Asset stock accumulation and sustainability of competitiveadvantage”, Management Science, Vol. 35 No. 12, pp. 1504-11.
Doz, Y.L. (1996), “The evolution of cooperation in strategic alliances: initial conditions or learningprocesses?”, Strategic Management Journal, Vol. 17, special issue, pp. 55-83.
Forgues, B. and Vandangeon-Derumez, I. (2003), “Analyses longitudinales”, in Thietart, R.A. (Ed.),Methodes de Recherche en Management, Dunod, Paris, pp. 422-48.
Freeman, R.E. (1984), Strategic Management: A Stakeholder Approach, Pitman, Boston, MA.
Frooman, J. (1999), “Stakeholder influence strategies”, Academy of Management Review, Vol. 24No. 2, pp. 206-21.
Gladwin, T.N., Kennelly, J.J. and Krause, T.-S. (1995), “Shifting Paradigms for sustainabledevelopment: implications for management theory and research”, Academy ofManagement Review, Vol. 20 No. 4, pp. 874-907.
Greaker, M. (2003), “Strategic environmental policy; eco-dumping or a green strategy?”, Journalof Environmental Economics and Management, Vol. 45, pp. 692-707.
Hall, J.K. and Martin, M.J.C. (2005), “Disruptive technologies, stakeholders and the innovationvalue-added chain: a framework for evaluating radical technology development”, R&DManagement, Vol. 35 No. 3, pp. 273-84.
Ireland, R.D., Hitt, M.A. and Vaidyanath, D. (2002), “Alliance management as a source ofcompetitive advantage”, Journal of Management, Vol. 28 No. 3, pp. 413-46.
Jagger, P., Pender, J. and Gebremedhin, B. (2005), “Trading off environmental sustainability forempowerment and income: Woodlot devolution in Northern Ethiopia”, WorldDevelopment, Vol. 33 No. 9, pp. 1491-510.
Jawahar, I.M. and Mclaughlin, G.L. (2001), “Toward a descriptive stakeholder theory: anorganizational life cycle approach”, Academy of Management Review, Vol. 26 No. 3,pp. 397-414.
Jones, T.M. and Wicks, A.C. (1999), “Convergent stakeholder theory”, Academy of ManagementReview, Vol. 24 No. 2, pp. 206-21.
Kanbur, R. (2002), “Economics, social science and development”, World Development, Vol. 30No. 3, pp. 477-86.
Martinet, A.-C. and Reynaud, E. (2004), Strategies d’Entreprise et Ecologie, Economica, Paris.
Mitchell, R.K., Agle, B.R. and Wood, D.J. (1997), “Towards a theory of stakeholder identificationand salience: defining the principle of who and what really counts”, Academy ofManagement Review, Vol. 22 No. 4, pp. 853-86.
Mohr, J. and Spekman, R. (1994), “Characteristics of partnership success: partnership attributes,communication behavior, and conflict resolution techniques”, Strategic ManagementJournal, Vol. 15, pp. 135-52.
Paramanathan, S., Farrukh, C., Phaal, R. and Probert, D. (2004), “Implementing industrialsustainability: the research issues in technology management”, R&DManagement, Vol. 34No. 5, pp. 527-37.
Payne, D.M. and Raiborn, C.A. (2001), “Sustainable development: the ethics support theeconomics”, Journal of Business Ethics, Vol. 32, pp. 157-68.
Penrose, E.T. (1958), The Theory of the Growth of the Firm, Wiley, New York, NY.
Peteraf, M.A. (1993), “The cornerstones of competitive advantage: a resourced-based view”,Strategic Management Journal, Vol. 14 No. 3, pp. 179-91.
The “Caras doBrasil” (Faces ofBrazil) program
1317

Porter, M.E. (1980), Competitive Strategy: Techniques for Analyzing Industries and Competitors,Free Press, New York, NY.
Porter, M.E. (1985), Competitive Advantage: Creating and Sustaining Superior Performance,Free Press, New York, NY.
Prahalad, C.K. and Hamel, G. (1990), “The core competence of the corporation”, Harvard BusinessReview, Vol. 68 No. 3, pp. 79-91.
Pretty, J. and Ward, H. (2001), “Social capital and the environment”, World Development, Vol. 29No. 2, pp. 209-27.
Pujari, D. (2006), “Eco-innovation and new product development: understanding the influenceson market performance”, Technovation, Vol. 26 No. 1, pp. 76-85.
Ring, P.S. and Van de Ven, A.H. (1994), “Developmental process of cooperativeinterorganizational relationships”, Academy of Management Review, Vol. 19 No. 1,pp. 90-118.
Russo, M.V. (2003), “The emergence of sustainable industries: building on natural capital”,Strategic Management Journal, Vol. 24 No. 4, pp. 317-31.
Sharma, S. and Henriques, I. (2005), “Stakeholder influences on sustainability practices in theCanadian forest products industry”, Strategic Management Journal, Vol. 26 No. 2,pp. 159-80.
Spangenberg, J.H. (2004), “Reconciling sustainability and growth: criteria, indicators, policies”,Sustainable Development, Vol. 12, pp. 74-86.
Stake, R. (2000), “Case studies”, in Denzin, N.K. and Lincoln, Y.S. (Eds), Handbook of QualitativeResearch, Sage, Newbury Park, CA, pp. 435-55.
Starik, M. and Rands, G.P. (1995), “Weaving an integrated web: multilevel and multisystemperspectives of ecologically sustainable organizations”, Academy of Management Review,Vol. 20 No. 4, pp. 908-35.
Starkey, K. and Crane, A. (2003), “Toward green narrative: management and the evolutionaryepic”, Academy of Management Review, Vol. 28 No. 2, pp. 220-37.
Steurer, R., Langer, M.E., Konrad, A. and Martinuzzi, A. (2005), “Corporations, stakeholders andsustainable development I: a theoretical exploration of business-society relations”, Journalof Business Ethics, Vol. 61, pp. 263-81.
Tien, S., Chung, Y. and Tsai, C. (2005), “An empirical study on the correlation betweenenvironmental design implementation and business competitive advantages in Taiwan’sindustries”, Technovation, Vol. 25 No. 7, pp. 783-94.
Torras, M. (2003), “An ecological footprint approach to external debt relief”, World Development,Vol. 31 No. 12, pp. 2161-71.
Wernerfelt, B. (1984), “A resource based view of the firm”, Strategic Management Journal, Vol. 5No. 2, pp. 171-80.
World Commission on Environment and Development (1987), Our Common Future, OxfordUniversity Press, New York, NY.
Yin, R.K. (2002), Case Study Research: Desing and Methods, Sage Publications, Newbury Park,CA.
Zutshi, A. and Sohal, A. (2004), “Environmental management system adoption by Australasianorganisations: part 1: reasons, benefits and impediments”, Technovation, Vol. 24 No. 4,pp. 335-57.
MD45,8
1318

Further reading
Rowley, T.J. (1997), “Moving beyond dyadic ties: a network theory of stakeholder influences”,Academy of Management Review, Vol. 22 No. 4, pp. 887-910.
Thietart, R.-A. (2001), “Management et Complexite: concepts e theorie”, in Martinet, A.-C. andThietart, R.-A. (Org.) (Eds), Strategies: Actualite et futurs de la recherche, Vuibert, Paris,pp. 361-75.
Corresponding authorLuciano Barin Cruz can be contacted at: [email protected]
The “Caras doBrasil” (Faces ofBrazil) program
1319
To purchase reprints of this article please e-mail: [email protected] visit our web site for further details: www.emeraldinsight.com/reprints

Trade from the ground upA case study of a grass roots NGO using
agricultural programs to generate economicviability in developing countries
Allison Duke and Charla LongLipscomb University, Nashville, Tennessee, USA
Abstract
Purpose – The purpose of this paper is two-fold. First, a case study is presented that examines amodel of agricultural development created by Healing Hands International (HHI) as one answer to theUnited Nations’ Food and Agriculture Organization call to reduce world hunger in half by 2015.Second, the study of HHI’s agricultural model is used to identify some of the variables that mightpredict success in achieving sustainable agricultural systems in developing communities around theworld. Specifically, training and establishing trust through social networks are explored as potentialindicators in which HHI and other non-governmental organizations (NGOs) can better determinewhether they are meeting the goal of making trade work for the poor.
Design/methodology/approach – A case study of HHI’s agricultural program is conducted as ameans to identify success criteria for similar programs designed to establish economic viability indeveloping countries.
Findings – HHI has received global attention for its success in establishing long-term economicviability in impoverished communities. Through the examination of their four-step approach toagricultural development, two variables were identified as potential indicators of success that maygeneralize to similar programs: training and establishing trust through social networks.
Originality/value – There are currently over 40,000 NGOs operating to develop sustained economicviability for developing countries; however, a state of crisis continues to exist. As such, identifyingpredictors of success is essential for ensuring the successful implementation of similar programs andproviding evidence that can result in greater financial support.
Keywords Non-governmental organizations, Trade, Training, Trust, Social networks,Developing countries
Paper type Case study
During the World Food Summit in 1996 and the Millennium Summit in 2000, goalswere set for reducing world hunger by half by the year 2015 (United Nations Food andAgriculture Organization, 2005). The desire to dramatically reduce hunger has fueledmany humanitarian assistance programs over the last decade. According to the UnitedNations Food and Agriculture Organization (FAO) in its 2004 report The State of FoodInsecurity in the World, there are still 852 million undernourished people in the world,with 815 million residing in developing countries. Although progress is being madetoward achieving this goal, significant work still needs to be done.
With some 40,000 non-governmental organizations (NGOs) operating to providerelief and generate economic viability (Anheier et al., 2001), a state of crisis continues.As such, it is necessary to gain a better understanding of what factors predict successin establishing long-term, self-sustaining programs that foster economic growth indeveloping countries. The current study examines an agricultural program developedby Healing Hands International that has received global attention for its achievements
The current issue and full text archive of this journal is available at
www.emeraldinsight.com/0025-1747.htm
MD45,8
1320
Management DecisionVol. 45 No. 8, 2007pp. 1320-1330q Emerald Group Publishing Limited0025-1747DOI 10.1108/00251740710819050

as a means for identifying specific criteria for success that can be used as a benchmarkfor similar programs and solid evidence of achievement when soliciting financialsupport for such projects.
Case study of Healing Hands InternationalLong before the FAO released its recent statistics for the undernourished, HealingHands International (HHI) was working to save lives and relieve suffering for people allover the world. This non-profit, faith-based organization began operations in 1991,responding to the need for medical aid (see www.hhi.org). Although a small operationin comparison to organizations such as World Vision, Mercy Corps, Catholic ReliefServices and Feed the Children, HHI has shipped medical supplies to 66 countries inneed (see www.hhi.org). The need for medications, medical supplies, and equipment isindisputable in developing countries. However, Dr Randy Steger, Chairman andPresident of HHI, believes the medical needs are the by-products of deeperhumanitarian concerns.
“For the first seven years of HHI’s history we focused solely on supplying thirdworld hospitals and clinics with medical supplies and medicine”, said Steger. “Peoplewere sick and dying overseas, while in America we were throwing away life-savingsupplies. As HHI grew in its ability to help, we started looking at the true causes ofillness in the world. We were surprised that it was not a lack of medicine so much as alack of clean water and healthy food. We were only helping to heal the sick in theshort-term instead of dealing with the real problem of poor health. We were using aband-aid approach. For a person with a business background that was unacceptable.We researched the problem and were surprised to discover that many countries in theworld who have trouble feeding their poor actually have the ability to not only feedthemselves, but most of the world. They just lack the knowledge and tools to supplynutritional food”. So Steger decided to add an agriculturally focused component at HHI.
When looking for the person to lead this agriculture initiative, cultural awarenessplayed an important role. Steger said “From our experience with over 60 countries, weknow that one success factor in helping people is understanding cultural differences. Inother words, trying to teach new methods for improving a person’s life is cultural. Weneeded to find someone with agricultural training who also had the experience ofworking with different cultures”.
Dr Steger’s search for Director of International Development and Agricultural Reliefled him to David Goolsby, a servant-leader who had spent his life farming and sharinghis skills with others. Upon college graduation, Goolsby moved to South Korea to workwith the Korea Christian College and Holt Orphanage. Under the guidance of aveterinarian from California, they introduced agricultural development to the SouthKoreans and built a milk pasteurizing facility that exceeded $60 million in sales in2005. Mr Goolsby’s passion for working with the poor and undernourished has led himto a 40-year career as a social entrepreneur. He has worked with agricultural reliefprojects in 22 countries, and traveled to over 40 others, fundraising and surveyingprojects.
With David Goolsby as Director of International Development and AgriculturalRelief, HHI began to look for an area where they could be most beneficial. BelievingAfrica’s poverty and hunger was the worst in the world, and comparable to what heexperienced in South Korea 40 years earlier, Mr Goolsby focused on this area. After
Trade from theground up
1321

examining HHI’s social networks, Ethiopia was chosen as the geographic launchingpoint for Africa.
The agricultural development modelThe initial agricultural development model used by HHI was a four-step approach.
Step 1: Develop trust and social networks through the distribution of medical aid,relief food and educational resources. When working in famine stricken areas, HHIlearned that trust and social networks must be established with those they sought toserve. HHI achieved both of these goals in a number of ways. First, HHI helped toestablish and maintain hospitals, schools, and orphanages with needed supplies andequipment. Second, the organization developed relationships with key local contacts asidentified by faith-based missionaries in the area. Third, HHI gained the respect of thelocal people by working with USAID and other humanitarian organizations providingrelief food and sustaining the lives of many Ethiopians. Through these aid-basedinitiatives, HHI was able to develop relationships with residents of the community.This helped build the trust of social networks required to gain access to the resourcesrequired for the next step in the agricultural model.
Step 2: Survival gardening for food security. When an Ethiopian faith leader wrote toHHI stating “Brethren from my congregation are dying so fast that I cannot get to allthe funerals” (see www.hhi.org), HHI was determined to do something more permanentthan emergency shipments of food in order to stop the recurring death cycle associatedwith these famines. HHI wanted to create food security for Ethiopian citizens. “Foodsecurity exists when all people at all times have both physical and economic access tosufficient food to meet their dietary needs for a productive and healthy life” (USAID,1992). With this as the goal, HHI began its food security program in Ethiopia byintroducing drip irrigation and survival gardening in 1999.
Using the social networks established during the initial provision of food aid, HHIpersonnel from the USA began working with the Ethiopian farmers. HHI spent severalweeks surveying the land and identifying the natural resources available for their use.After this process, HHI created and held its first Level One Food Security Workshopwith only ten farmers. The training sessions taught survival gardening techniqueswhich were practical, sustainable, and affordable. Survival gardens must use theneglected and overlooked resources already available in the area. The first step inbuilding survival gardens is to identify the richest soil. When the Ethiopians wereasked to identify the most fertile ground around their village, many believed it wasvarious plots of land previously used for farming. Mr Goolsby helped the farmersunderstand that the most fertile ground would be within a ten-meter circle around theirhut. With years of refuse built up, the organic matter in the soil would yield the bestcrops. Next, the Ethiopians were asked to find green growth for compost. With anyrainy season comes new growth. By gathering this green growth, compost piles couldbe made for natural fertilizers.
Part of the workshop included instruction on building raised beds and using dripirrigation systems. A simple white five-gallon bucket hangs on a post placed in thegarden and plastic tubing provides water to the root of the plant. With the use of a dripkit, sent by HHI at a cost of $US15 each, a farmer can water a raised bed even during aperiod of drought.
MD45,8
1322

In order to receive their drip kits and seeds and thus complete their training, the firstten farmers were required to go back to their villages and complete their homework:
. create a raised bed; and
. start a compost heap.
Once this was completed, the farmers were given seeds to plant and their dripirrigation kit by HHI. When these farmers returned to their villages and began theirsurvival gardens, interest grew among others in the village. Within a matter of threemonths, the original ten trainees had become trainers themselves and were teachingothers in the village about drip irrigation and survival gardening.
When the first fruits of this method became evident by early 2000, a nationwideinterest in drip irrigation grew across all Ethiopia (see www.hhi.org). By 2006, 60,000Ethiopians had been trained using the HHI Food Security Workshop training program.As a result of drip irrigation and survival garden training, families are now able toprovide more than enough food to sustain themselves and share among theircommunities. Thousands of people have started to use this method of gardening inEthiopia and in several other neighboring and regional African countries (see www.hhi.org).
As a testament to the program, one Ethiopian church leader stated, “We will neverhave to ask the American churches for food again due to Healing Hands Internationalintroducing drip irrigation to the people of Ethiopia” (see www.hhi.org). As a result ofselling surpluses from survival gardens, faith leaders report that church giving hasincreased 6.5 percent every year since the program began in 1999. Additionally, it isreported that within one year, the majority of all survival garden farmers havestabilized their food supply and have an adequate amount to support their families(Goolsby, 2006).
Step 3: Small farm training and production. Believing that the “powers of WallStreet are built upon the silos of the Midwest”, Mr Goolsby wanted the Ethiopians toexpand their survival gardens and push toward economic freedom. In step 3, farmersare trained to increase their small farm production in a number of ways. First, dripirrigation is expanded to a larger plot of land, usually five to ten acres. When farmingthis amount of land, there is surplus to sell in the local community. By introducingadditional types of seeds, new crops can be raised to allow for additional nutrients inthe diet.
Second, numerous types of both small and large varieties of livestock may be addedto this on-the-farm economic development plan (see www.hhi.org). Such livestockenterprises are designed to work hand-in-hand with the raising of crops. Excess cropscan be used to feed the livestock, and animal manure can be used to help fertilize thecrops. This eliminates the need for costly pesticides and fertilizers.
Third, individuals must be able to store their excess crops. The goal of survivalgardening and small farm operations is to have surplus crops that can be sold tointerested buyers. Those new to larger scale farming need assistance in obtainingstorage bins and silos, and HHI has provided such assistance. HHI has found that whenthe farmers find a market for their surplus, they earn real income and become lessdependent on humanitarian assistance.
By increasing the amount of food farmers are able to produce and simultaneouslydeveloping the means by which they can maintain this surplus, step 3 training from
Trade from theground up
1323

Healing Hands International better equips these farmers to provide for their familiesand raise themselves to a higher standard of living. Such improvements, onefarm-family at a time, boost the economic development of the entire rural communityand eventually the nation as a whole (see www.hhi.org).
Step 4: Co-operative organization and support. Grouping small farmers together in aco-operative effort is the purpose of step 4. Once village farmers have proven theirability to grow and store crops, HHI encourages farmers to organize themselves intovillage production clubs, informal predecessors to legally chartered local co-operatives.These village clubs can be further organized with other village clubs and co-ops intoregional or national federated co-operatives. Many village clubs have realized thebenefits of working together in larger numbers to volume purchase their seed and pestcontrol. They have pooled resources and shared the costs for bringing agriculturalspecialists to their region. Many of the co-operative organizations share a common goalof securing contracts with a food plant to keep it supplied with raw materialsoriginating back on the village farms. The success of both farmers and theircooperatives are mutually dependent on the success of the food plant’s output andfurther marketing (see www.hhi.org)
The HHI model beyond EthiopiaUsing the four-phase plan implemented in Ethiopia as an example, HHI began work inMalawi in 2002. HHI trained the first group of 15 farmers and then allowed them tocreate a training network within their own country. HHI continued to supply the dripkits and seeds to get the basic survival gardens started. Survival gardens transitionedinto small farm operations. Over the next two years, hundreds of farmers were trained.As the Malawian farmers entered the co-op stage of development, approximately 800farm families were producing significant surplus for resale.
Meanwhile, humanitarian aid from other organizations continued to flow into theregion, including Pharmanex’s VitaMeale product. The VitaMeale product, packagedin five-pound increments, contains a balance of carbohydrates, protein, fat, and fiberand includes 25 essential vitamins and minerals. Relief agencies were paying to shipthe product from the USA to Africa to offer temporary food aid to families. Then, asuccessful businessman from the region asked Pharmanex if Malawian-grownsoybean and white maize crops could be used as the basis for their product. Afterconducting research, Pharmanex determined that it could ship just the vitamincombination to Malawi, and it could be blended with Malawian-grown crops topackage for distribution.
To launch the VitaMeal production enterprise in Malawi, HHI advised in the designand construction of a food processing plant in Malawi, which was built in 2004. Theplant, which opened November 3, 2004, now produces enough food to nourish 24,000children a day and employs 400 Malawians (see www.malawiproject.org). The finalproduct is sold in several African cities as well as purchased by international aid andrelief agencies. The farmers receive payment for their goods – proceeds from thesesales fund the continuation of the project, and excess food is used to feed orphans whocannot provide for themselves.
The ultimate goal for the Malawian food plant is to produce other products such asroasted soybeans and snack foods that can be sold to ordinary Malawians and citizens
MD45,8
1324

of neighboring countries. This is a clear example of how agricultural programs cancreate economic viability in just a few years.
What’s next for HHI?Although HHI does not currently have a micro-business development area, theagricultural-based initiatives have created cottage industries related to farming. Forexample, villages now have blacksmith, welding, and other repair shops for farmimplements. HHI is examining ways to become more involved with these businessesthrough managerial and entrepreneurial training.
As part of a long-term effort to move African communities to self-sustenance, MrGoolsby has created the CISCADq (Comprehensive Integrated Single Community Aid& Development) training plan. The goal of the CISCADq plan is to transform 150villages in three to five nations in the drought-famine-AIDS zone of Africa by 2014.This ten-year plan focuses on four key areas:
(1) sustainable agricultural production, food security and key related cottageindustries (based upon the four step process described above);
(2) healthcare, including basic nutrition, pre-natal and infant care;
(3) AIDS prevention and treatment; and
(4) education for grades K-8 plus a vocational training program.
The CISCADq training plan was developed only after there was clear evidence that thepreviously implemented programs were successful. Indeed, HHI received internationalpublicity highlighting their success in Africa. As a result, other countries from aroundthe globe have requested the organization’s assistance. However, several questionsarise as other organizations attempt to implement similar programs. Specifically, whataspects of HHI’s program led to their long-term success, and how can these bemeasured in a way that can help make informed decisions about a program’s viability?
Identifying predictors of successWith over 40,000 NGOs operating internationally, one might wonder why a state ofcrisis continues to exist in many countries. What factors make some programssuccessful and others not? From the case study on HHI, two specific criteria emerged aspotential indicators of success in establishing long-term economic viability indeveloping countries:
(1) training; and
(2) developing trust through social networks.
Because HHI has not developed a formal system of evaluating these criteria,recommendations for future research on measuring these variables are discussed.
TrainingThe training process can be defined as “the systematic acquisition of attitudes,concepts, knowledge, rules, or skills that result in improved performance at work”(Goldstein, 1991, p. 508). Within the HHI framework, agricultural training is designedto transfer the basic knowledge and skills necessary to achieve sustainable agriculturalproduction and food security. To meet these training goals, the HHI team has
Trade from theground up
1325

established a system that follows the traditional models of organizational training,which emphasize the importance of completing three distinct phases:
(1) needs assessment;
(2) training and development; and
(3) evaluation (Goldstein, 1991).
Although HHI training is not constrained to the boundaries of an organization, theelements of organizational training can be applied.
Needs assessment. McGehee and Thayer (1961) identified three elements of needsassessment:
(1) organization;
(2) task; and
(3) personal analysis.
Organizational analysis is concerned with whether a training program can createbehavior that can be transferred into new environments. Studies show that thelikelihood of training being transferred to a new environment can be increased whentrainees are encouraged to apply their learning and are rewarded it (Goldstein, 1991). Indesigning the HHI training program, great care was taken to establish a climate fortransfer of training. For example, before training was administered, the team at HHIexamined satellite images of the environment and soil samples to obtain informationabout the environment in which the training would take place. This better prepared thetrainers so that the individual needs of each community could be met. Once initialneeds were met, the food supplied became the reward, which also served asencouragement for continued use of the skills that had been taught.
A second element of needs assessment is task analysis, which identifies specific jobactivities as well as the relevant knowledge, skills, and abilities to perform theseactivities. From this information flows the design of instructional objectives for thetraining program. When developing the training program for survival gardening, theteam at HHI identified the activities involved in drip irrigation. These activities weredescribed in detail and documented in a manual for instructors and trainees. Thisdocumentation provided the relevant objectives for the initial training program.
Finally, needs assessment requires analysis of the person. Two questions ariseduring this analysis:
(1) Who needs training?
(2) What kind of instruction do they need (Goldstein, 1991)?
This type of analysis was the driving force behind the HHI agricultural project. First, apoverty-stricken community in Africa was identified. Next, HHI developed socialnetworks with church leaders in that area. These church leaders, in turn, helpedidentify those families with the greatest level of need and ability to be trained. HHIrecognized that all the families identified had a need for survival gardening instruction,so that training program was administered universally.
Training and development. Once training needs were assessed, the HHI trainersneeded to ensure that the subsequent skills training would be effective so that higher
MD45,8
1326

levels of the plan could be accomplished. According to Cascio (2003), effective skilllearning includes four critical components:
(1) goal setting;
(2) behavioral modeling;
(3) practice; and
(4) feedback.
Goal-setting theory is a motivational technique that suggests that the conscious goalsof an individual will regulate his/her behavior (Locke, 1968). Research demonstratesthat when a task is of low complexity, productivity can be improved by as much as 10percent when difficult but not impossible goals are set and accepted by an individual(Wood et al., 1987). At HHI, the goals of the training program consisted of fairly lowcomplexity. However, they did have some degree of difficulty. Not only did the localfarmers have to create a raised bed and start a compost heap to attain seeds and a dripkit, they had to work the garden on a consistent basis in order to reap the rewards oftheir efforts. However, setting these goals kept the farmers focused on their mission,and as their crops began to meet the needs of their families, their confidence grew sothat higher-level goals could be established.
Behavior modeling is learning through observing others (Bandura, 1986). Studiesindicate that behavior modeling is most effective when a model’s behavior is rewarded,and that reward is something the imitator aspires to have (Goldstein and Sorcher,1974). In the case of HHI, the models are actually the farmers who have completedtraining and successfully grown a survival garden. When this occurs, other residentsof the community begin to model the behavior because they see that other farmers arebeing rewarded with food, which is not only what they desire, but what they need.
Being able to practice a new skill is also critical during the learning process(Ehrenstein et al., 1997). At HHI, the training program itself offers opportunities forpractice through hands-on training. Finally, feedback is important to ensure thetraining is being transferred properly. By having trained trainers who reside in thecommunities HHI serves, feedback can be provided to the farmers throughout theprocess of starting a survival garden.
In addition to establishing a climate for effective skills learning, HHI also had toconsider what method of training should be used. Because HHI wanted to maximizetransfer of learning to a new environment, they selected near-the-job training. Thistype of training provided the local farmers the opportunity to practice their skills withequipment that was identical to what they would be provided with so they could takethose newly acquired skills back to their land and apply them to a nearly identicalsituation.
Evaluation. The training literature provides significant evidence of the importanceof evaluating a training program. In designing an evaluation tool, an organization canassess the participants’ reaction to the training, how much participants learned, whatbehaviors have changed as a result of the training, and what financial outcomes havebeen impacted by the training. With each level of evaluation comes more difficulty inmeasurement, but also more value (Tyler, 2002). At HHI, the evaluation of the traininghas typically focused on the behavior and results levels; however, the collection of datahas been conducted in an informal manner. For example, leaders within the community
Trade from theground up
1327

have conducted informal interviews within the community to determine whetherfamilies are able to stabilize their food supply and provide adequate food resources forthemselves. Additionally, informal interviews reveal how many local farmers havemoved from survival gardening to small farm production and trade.
Although these informal measures of results provide some insight into theeffectiveness of the HHI agricultural training program, it would be advantageous toimplement more formalized evaluation metrics. Not only will the results of thesemetrics provide information for HHI on the effectiveness of their training, but it mayhelp attract donors and establish reciprocal relationships with other organizations thatcan help provide assistance. Some suggestions for future research include theexamination of culture as it pertains to developing training programs. For example,Hofstede’s study (see www.geert-hofstede.com) showed that East Africa scoredrelatively low on individualism. The USA, which in many cases leads the developmentof the training programs, scores relatively high on individualism. How might thesecultural differences affect the development and delivery of training in Africancountries or other countries in need?
Future research should also establish more formalized measures of trainingevaluation. Specifically, it is recommended that studies be conducted to assess thebehavioral and results levels of training evaluation through measures such as percapita income at various time intervals after training has occurred. Additionally,measures evaluating food security (when all people have physical and economic accessto food to meet their needs for productive and healthy lifestyles) should be establishedto properly account for the transition from poverty to self-sustenance to economicviability.
Establishing trust through social networksWhen NGOs come into a community, one of the first challenges is establishing trustwith the people for whom they are offering assistance. According to David Goolsby,residents in Africa are often skeptical of organizations coming into their communitiesto provide assistance (Goolsby, 2006). Because of this skepticism, it is vital that therepresentatives of HHI establish trust in order to gain acceptance for their trainingprograms. Previous research indicates that trust is superior to monitoring andincentives in decreasing coordination costs and increasing individual efforts (Ring andVan de Ven, 1992; McAllister, 1995; Chiles and McMackin, 1996). But how is that trustestablished?
According to Wright (1995), some social biologists believe that humans areprogrammed genetically to distrust others and to be trustworthy except in regards tofamily. This notion makes the idea of establishing trust seem daunting. However, otherresearch points out that developing personal relations can foster trust (Granovetter,1985). The representatives of HHI have done just that – they relied on their socialnetworks to establish trust with the residents of Africa. For example, HHI makessignificant efforts to develop personal relations with church leaders in the community.This is often possible because of the fact that HHI is a faith-based organization, makingthe church leaders feel less vulnerable because they share a common belief system.
Because the church leaders have established relationships with the residents of thecommunity, once they have developed a trusting relationship with HHI, they are able tointroduce the HHI team as a trustworthy source to their community. Essentially, these
MD45,8
1328

church leaders serve as the “structural holes” that connect HHI with the local farmers.A structural hole is an opportunity for someone “to broker the flow of informationbetween people and control the form of projects that bring together people fromopposite sides of the hole” (Burt, 1997, p. 340). For HHI, the church leaders controlaccess to their community until they verify that the intentions of HHI are sincere andthat their programs have merit. Therefore, it is necessary for HHI to foster personalrelationships with the church leaders so that their programs can be introducedeffectively.
Future research for HHI as well as other NGOs who are seeking to promoteself-sustenance and economic viability in developing countries should include studiesthat focus on establishing trust and how social networks assist in that process.Specifically, future research might consider what NGO characteristics might facilitatethe development of trust and how social networks influence that process. Finally,studies are needed to determine how NGOs might best develop social networks.Whereas religious affiliation aided HHI in developing social networks, what othervariables exist and how do these variables help organizations gain access to theresources they need to get established in developing countries?
Practical implicationsThe current study used Healing Hands International as an example of an NGO that hasimplemented a program to help impoverished communities move out of famine andpoverty and into self-sustenance and economic viability. The HHI program starts fromthe ground up: agricultural training in survival gardening, which leads to small farmproduction, then to larger cooperatives. In Malawi, this program has progressed into aproduction facility that uses Malawi-grown crops to produce meal supplements thatare traded internationally. This type of program appears to be successful in Ethiopiaand Malawi. Indeed, developing structured training programs and establishing trustthrough social networks were identified as indicators of success for the HHI program.However, formal methods of evaluation are yet to be developed. Therefore, a futureresearch agenda has focused on developing these types of evaluation procedures. Withthis information, programs like HHI can provide stronger evidence of success in aneffort to solicit more financial support, and other organizations can use their programas a benchmark for developing similar programs in other countries around the world.
References
Anheier, H., Glasius, M. and Kaldor, M. (2001), Global Civil Society 2001, Oxford UniversityPress, Oxford.
Bandura, A. (1986), Social Foundations of Thought and Action: A Social Cognitive Theory,Prentice-Hall, Englewood Cliffs, NJ.
Burt, R.S. (1997), “The contingent value of social capital”, Administrative Science Quarterly,Vol. 42, pp. 339-65.
Cascio, W.F. (2003), Managing Human Resources: Productivity, Quality of Work Life, Profits(6th ed.), McGraw-Hill, New York, NY, p. 300.
Chiles, T.H. and McMackin, J.F. (1996), “Integrating variable risk preferences, trust, andtransaction cost economics”, Academy of Management Review, Vol. 21, pp. 73-99.
Ehrenstein, A., Walker, B.N., Czerwinski, M. and Feldman, E.M. (1997), “Some fundamentals oftraining and transfer: practice benefits are not automatic”, in Quinones, M.A. and
Trade from theground up
1329

Ebrenstein, A. (Eds), Training for a Rapidly Changing Workplace, American PsychologicalAssociation, Washington, DC, pp. 119-47.
Goldstein, I.L. (1991), “Training in work organizations”, in Dunnette, M.D. and Hough, L.M. (Eds),Handbook of Industrial and Organizational Psychology, 2nd ed., Consulting PsychologistsPress, Palo Alto, CA, pp. 507-620.
Goldstein, A.P. and Sorcher, M. (1974), Changing Supervisor Behavior, Pergamon Press, New York,NY.
Goolsby, D. (2006), personal communication, December 1.
Granovetter, M. (1985), “Economic action and social structure: the problem of embeddedness”,American Journal of Sociology, Vol. 91, pp. 481-510.
Locke, E.A. (1968), “Toward a theory of task motivation and incentives”, OrganizationalBehavior and Human Performance, Vol. 3, pp. 157-89.
McAllister, D.J. (1995), “Affect- and cognition-based trust as foundations for interpersonalcooperation in organizations”, Academy of Management Journal, Vol. 38, pp. 24-59.
McGehee, W. and Thayer, P.W. (1961), Training in Business and Industry, Wiley, New York, NY.
Ring, P.S. and Van de Ven, A.H. (1992), “Structuring cooperative relationships betweenorganizations”, Strategic Management Journal, Vol. 13, pp. 483-98.
Tyler, K. (2002), “Evaluating evaluations”, HR Magazine, June, pp. 1-4.
United Nations Food and Agriculture Organization (2005), The State of Food Insecurity in theWorld, United Nations Food and Agriculture Organization, Rome.
USAID (1992), “Policy Determination Number 19”, April 13, available at: www.usaid.gov
Wood, R.E., Mento, A.J. and Locke, E.A. (1987), “Task complexity as a moderator of goal effects:a meta-analysis”, Journal of Applied Psychology, Vol. 72, pp. 416-25.
Wright, R. (1995), The Moral Animal, Vintage Books, New York, NY.
Further reading
Korten, D.C. (1990), Getting to the 21st Century: Voluntary Action and the Global Agenda,Kumarian Press, Bloomfield, CT.
United Nations Food and Agriculture Organization (2004), The State of Food Insecurity in theWorld, United Nations Food and Agriculture Organization, Rome.
Wexley, K.N. and Latham, G.P. (1991), Developing and Training Human Resources inOrganizations, Harper Collins, New York, NY.
Corresponding authorAllison Duke can be contacted at: [email protected]
MD45,8
1330
To purchase reprints of this article please e-mail: [email protected] visit our web site for further details: www.emeraldinsight.com/reprints

Transaction costs in groupmicrocredit in India
Savita ShankarInstitute for Financial Management and Research, Chennai, India
Abstract
Purpose – Existing literature indicates that transaction costs are a major contributor to high interestrates on microcredit loans. The purpose of the study was to examine the composition of transactioncosts to be able to draw implications on how lending rates in microcredit could be reduced in asustainable manner.
Design/methodology/approach – As the study required in-depth insights on the processes beingfollowed within a micro finance institution (MFI), the case study method was used. Three establishedMFIs mainly engaged in microcredit – using group-lending model – were studied.
Findings – The results of the study indicate that the key drivers of direct transaction costs are fieldworker compensation and number of groups handled per field worker. Collection activity is the singlelargest contributor.
Research limitations/implications – Generalisations based on the case studies should be donewith caution.
Practical implications – It is suggested that MFIs, in order to reduce direct transaction costs,increase the number of groups per square kilometer. In order to reduce indirect costs, MFIs shouldminimize the number of layers of fixed costs in their system and examine alternativerevenue-generating activities that can be undertaken with minimal incremental costs. Policymakersneed to take into account transaction costs when examining the interest rates charged by MFIs. Theregional variation in transaction costs that the study has found is an important factor that suggeststhat no uniform view can be taken on the rates charged by MFIs in different regions.
Originality/value – No other studies have focused on transaction costs of a microfinance institutionin India.
Keywords Credit, Personal finance, Loans, Transaction costs, India
Paper type Case study
IntroductionThere are three kinds of costs that a lending institution incurs when it provides a loan:the cost of the money that it lends; the cost of prudent financial practices such asprovisioning for loan defaults; and the cost of transaction, which includes the costs ofidentifying and screening the client, processing the loan application, completing thedocumentation, disbursing the loan, collecting repayments and following up on nonpayment. Unlike the cost of funds and the cost of defaults, transaction cost is notproportional to the amount lent. The average microfinance loan size is smaller thanmost other loans – corporate and personal. Accordingly, the transaction cost on apercentage basis for a microfinance loan tends to be higher.
The current issue and full text archive of this journal is available at
www.emeraldinsight.com/0025-1747.htm
This paper is based on a study supported by the Centre for Micro Finance, Institute for FinancialManagement and Research, Chennai, India. A paper based on the study was published as part ofthe proceedings of the Australia and New Zealand Academy of Management Conference 2006.
Groupmicrocredit in
India
1331
Management DecisionVol. 45 No. 8, 2007
pp. 1331-1342q Emerald Group Publishing Limited
0025-1747DOI 10.1108/00251740710819069

Microcredit in IndiaThe most popular model for dispensation of microcredit in India is the group-lendingmodel. As per the web site of Sa-dhan (Industry Association of CommunityDevelopment Finance Institutions in India), group loans account for 93 percent of themicrofinance in India (Sa-dhan, n.d.). The group lending model entails certain peculiarcosts such as group formation costs and costs on training the borrowers prior to loandisbursement. The high degree of supervision and high frequency of installmentpayments (usually weekly or bi-monthly) that are important features of groupmicrocredit also contribute to costs.
Interest rates in microcreditThough the microcredit sector, by definition, caters to the economically disadvantaged,there is a degree of support for the view that microcredit providers should chargeinterest rates so that the lending programs become “sustainable” (Adams and VonPischke, 1992, pp. 1463-70; Yaron, 1992). Sustainability enables operations on a largerscale and coverage of a larger segment of the population. With demand for microcreditfar exceeding supply, sustainability and subsequent increase in scale are importantobjectives. As per the Microbanking Bulletin (2004) data (published by theMicrofinance Information eXchange), the average operational self-sufficiency[1] ofthe 302 microfinance institutions (MFIs) on which data was presented was 123 percent,and the financial self sufficiency was 110 percent.
Setting sustainable interest rates has resulted in higher interest rates in microcredit.Chavan and Ramakumar (2004) observe that after the introduction of microcredit, anupward shift in the interest rates charged by formal institutions to rural borrowers inIndia has been noticed. Policymakers are concerned about the high interest rates sincemicrocredit is meant for the economically weak. Helms and Reille (2004) and Fernando(2006) argue that, interest rate ceilings are not likely to be a solution to these concernsof the policy makers. This is because they will retard the long term growth ofavailability of credit for the target set of borrowers as if formal financial institutionsare not able to cover their costs, they would tend to exit the market. This in turn wouldresult in increase in dependence of the poor on informal sources of finance. It thereforefollows that microcredit providers need to look at innovative ways to reduce costs,which would result in interest rates coming down in a sustainable manner.
Hence, MFIs face the challenge of finding ways to reduce lending costs. While thecost of funds, default costs and transaction costs contribute to the total cost of lendingin any sector, in the microcredit sector transaction costs have been identified as beingan important contributor to lending costs (Goodwin-Groen, 2003). Rosenberg (2002) hasoutlined a method for estimating the interest rate that an MFI will need to realize on itsloans if it wants to fund its growth primarily with commercial funds. In his model, hehas stated that the administrative expenses of efficient, mature institutions tend torange between 10-25 percent of the average loan portfolio. Administrative expensecovers all the annual recurrent costs – salaries, benefits, rents, utilities anddepreciation – except the cost of funds and loan losses.
The reasons for high transaction costs in microcredit are numerous – the mostimportant being that the average microfinance loan size is small and hence thetransaction cost on a percentage basis for a microfinance loan tends to be higher.Further, the group lending model adopted entails peculiar costs such as groupformation costs, costs on training the borrowers on the procedures to be followed, a
MD45,8
1332

higher degree of supervision and a higher frequency of installment payments (usuallyweekly or bi-monthly). Though the cost structure of such a model is higher, it ensuresthe high repayment rates that microfinance loans are reputed for (Besley and Coate,1995, pp. 1-18; Armendariz, 1999, pp. 79-104).
A better understanding of transaction costs – an important determinant of costs ofan MFI – would be useful in evolving strategies to reduce lending costs in asustainable manner.
This article in section 1 reviews other studies on transaction costs in micro-credit,section 2 gives the construct definitions, section 3 details the research method, in section4 the typical processes in an MFI are described and section 5 presents the study results.
Studies on transaction costs in microcreditStudies in the Indian contextPuhazhendi (1995) and Srinivasan and Satish (2000) studied the microcreditprogramme of the nationalized commercial banks in India and concluded that theintermediation of non-governmental organizations (NGOs) and self-help groups (SHGs)in the credit delivery system reduced the transaction costs of both banks andborrowers. Tankha (2002) concluded that group formation costs are impacted by thenumber of groups handled by one field worker, transport costs, training costs andregional differences in average staff salaries due to differentials in local wage structure.Karduck and Siebel (2004) studied transaction costs of borrowers and concluded thatweekly as against monthly meeting schedules increases transaction costs by 34percent. The Microcredit Ratings International Ltd (M-Cril) Microfinance Review 2003(revised February 2004) mentions that the cost per borrower for the Indian MFIs is onan average US$12.2 (M-Cril, 2003). All the group lending models incur more than halfof total operating expenses on salaries.
Other studiesLlanto and Chua (1996) studied the transaction costs of two Philippines-based NGOs.They concluded that there is an inverse relationship between an organisation’stransaction costs and its number of years in existence. Motivation and retention ofNGO staff were critical for transaction costs. Gonzalez-Vega et al. (1997) studied thetransformation of BancoSol from an NGO MFI to a licensed commercial bank. Theratio of total costs to average number of loans outstanding increased from US$ 149(1992) to US$242 (1994). Most of this increase came from higher cost of funds, but theratio of operational costs to the average number of loans also increased from US$103 toUS$135. One reason was that the transformation was accompanied by an increase inthe number of branches from 4 to 32. The increased investment in infrastructure,monitoring and communication systems, and additional staff did not immediatelygenerate sufficient number of loans. BancoSol compensated by increasing the revenuegenerating capacity of each loan by increasing loan sizes and increasing maturities.
Construct definitionsTransaction cost is defined in economic terms as comprising costs of search,information, bargaining, decision making, policy and enforcement. Applying thisdefinition to the group micro credit transaction framework, transaction cost comprisescosts of group formation, training, loan administration and monitoring. This cost is
Groupmicrocredit in
India
1333

directly attributed to the particular transaction and hence is defined as “directtransaction cost”.
In addition, there are set-up costs of the branches and allocated costs of regional andhead offices that need to be taken into account as they indirectly contribute to theadministration of the loan. These costs are clubbed together under the head “indirecttransaction cost”.
Direct transaction costThis is defined as the cost of the transactor (usually the field worker) doing the grouploan transaction. Its three main components are group formation and training costs,cost of direct administrative activities and cost of monitoring.
Cost of group formation and training is defined here as the cost of formation andtraining of the group with the objective of using it to deliver credit.
Cost of direct administrative activities comprises cost of appraisal, documentation,disbursement, other direct admin activities and the cost of branch manager supervision.Cost of appraisal is the cost of processes for appraising/ grading the group before sanctionof loan. Cost of documentation is the cost of documents and completion of documentationformalities relating to the loan. Cost of disbursement is the cost of completing formalitiesrelating to disbursement of funds. Cost of other direct administrative activities is the cost oftime spent by the field personnel in completing administrative formalities such as reportand format completion, reporting to immediate supervisor (usually the branch manager),filling up movement registers and filling up expense claims for travel and bank relatedduties. Since the branch manager closely supervises the entire loan process and in manycases helps in appraisal/documentation/disbursement, the allocated (per loan) supervisioncost of the branch manager is also included.
Monitoring cost is the cost of loan utilization checks and collection of installments. Itwas inferred from the field staff that additional time is spent with a group only if therewas a problem/potential problem in the group – this varied from case to case. The costof “avoiding default” is not taken into account in the study.
Indirect transaction costIndirect transaction cost includes allocated fixed costs of the branch office, regionaloffice and head office. However, depreciation and taxation costs have not been includedsince these would make the results between MFIs less comparable.
Method of expression of costsFirst year loan costs and repeat loan costsWhile the tenure of the loan is around one year, most groups, once formed, don’tbreak-up after the first loan is repaid, taking on additional loans in subsequent years.The cost of the loan given in the first year of formation of a group is higher than thecosts in subsequent years as the first year cost includes cost of group formation andtraining that are not present in subsequent years. The cost of a repeat loan is assumedto be similar to the cost of a first cycle loan except that the costs of group formation andtraining are absent. The difference in other costs such as collection and administrativecosts was not observed. Interviews with field personnel also confirmed that thedifference might be minor or absent.
The first-year costs are expressed as a percentage of the typical first loan given.
MD45,8
1334

Lifecycle costsThe typical time for which a group is in existence is termed “lifecycle” of the loan. Costsover a group’s life cycle are expressed as a percentage of the typical loan amountsgiven over the life cycle. The lifecycle has been arrived at based on discussions withMFI personnel at different levels. Similarly, typical loan amounts given by each MFI ineach loan cycle were arrived at based on discussions with MFI.
In order to calculate the life cycle cost of a loan, the following method was adopted:The present value (PV) of the costs and that of the loan amounts were calculated. ThePV of costs was expressed as a percentage of the PV of the loan amount. For purposesof calculation of PV, a discount rate of 8 percent p.a. was applied, as that wasapproximately the prevailing cost of funds of the MFIs studied.
Research methodThe case study method was used. A questionnaire-based survey may have covered alarger number of organizations but the quality of data may have been dubious sincethe details about time being spent on each activity would have been entirelyself-reported. The advantage of case research is that it can delve more deeply intomotivations and actions than structured surveys (Yin, 1994).
Sample characteristicsThree established MFIs mainly engaged in microcredit – using group lending model –were studied. Rosenberg (2002) mentions that most MFIs tend to capture most of theireconomies of scale by the time they reach about 5,000 to 10,000 clients. All the MFIsstudied had more than 10,000 clients each.
Selection of MFIsOne MFI in North India and two MFIs in South India were selected. As per data fromSa-dhan (Industry Association of Community Development Finance Institutions inIndia), South India is where 70 percent of Indian microcredit takes place.
The MFI chosen in North India is one, which works in a state, which ranks low onhuman development indicators while the MFIs in South India are in a state with highhuman development indicators. The two MFIs are located in the same state but havereported different costs per borrower. Hence, the two MFIs when studied togethercould give us insights into possible reasons why there is variation in cost structureamong MFIs.
Selection of branches within MFIsIn each MFI at least two branches were studied to ensure width of coverage. They,according to the senior officials of the MFI were “typical branches” whose coststructure could be taken as being representative of the category they were in.
In MFI 1, which functioned mainly in rural areas, there were two models: one withfive member groups and another with 14-20 member groups; hence one of each kindwas studied. Since MFI 2, functioned in semi-urban and rural areas, one semi-urbanbranch and one rural branch were studied. In MFI 3, which functioned mainly insemi-urban areas, a typical mature branch (more than three years old) was studied. Inaddition, two branches started less than a year ago were studied. While both branches
Groupmicrocredit in
India
1335

were started at around the same time, one was in an area with no competition and theother in an area where there was intense competition.
Method for estimation of costsDirect transaction costIn MFI 1 and MFI 2, a field worker was paid a fixed salary on a monthly basis; hence,the cost of that salary was allocated to different activities, depending on the time he/shespent on them. In addition to the fixed salary, an incentive for particular activities suchas group formation and monitoring was also paid, and it was added to the salarycomponent in calculating the cost of that activity. In MFI 3, a field worker did not earna fixed salary but was paid a fixed component for each activity that he/she does. In thiscase, the fixed payment for the activity is the cost of that activity.
The details regarding compensation levels were obtained from senior officials in theMFI. The time spent on each activity was based on observations by tracking fieldworkers, interviews with field personnel and employee logs.
Indirect transaction costFixed costs were allocated on a per loan basis over the tenure. The fixed cost allocationwas done at all levels, branch, regional office and head office, since these offices havebeen primarily set up to oversee microcredit.
Data on the profiles of the MFIs and their branches have been obtained from seniorMFI officials.
Typical processes in an MFIVillage selectionThe branch manager does a village survey and thereafter selects certain villages wherethere is scope for promotion of groups. A number of village meetings are conducted inthe selected villages.
Group formation and trainingAfter a number of meetings, one or more groups are formed. Each MFI has its ownnorm for the number of members in a group, 5 being the most common. Each groupusually has two leaders. On forming a group, the field worker commences training ofthe group members and the group leaders. On completion of the training, a grouprecognition test (GRT) is held. As part of the GRT there are visits to the residences ofthe members. The field worker’s supervisor may also be involved in the GRT. Themembers are tested on MFI principles taught during the training.
Monitoring and collectionThe field worker after disbursement makes loan utilization checks (usually one or moredepending on the MFI norms). The loans are usually for a period of 50 to 55 weeks withweekly collections at group meetings.
Schedule of field workersMost group meetings are held early in the morning. Each field worker has a schedule ofgroup meetings to attend. Thereafter he/she goes to the office to complete the
MD45,8
1336

administrative tasks. In the evenings, they go to the field to form new groups andprovide training to newly-formed groups.
Study resultsThe study results are shown in Table I.
Direct transaction costThe major contributor to direct transaction cost is field worker compensation. It isfound that MFI 1, which works in a difficult location, has to pay more than the others.
In compensation structures without a fixed component such as MFI 3, the MFIincurs the same cost for a particular activity irrespective of the time taken by the fieldworker. This may result in field workers being more productive as it is in their interestto reduce the time spent on the various activities. This could be one reason for MFI 3having lowest first-year direct transaction costs. However, in difficult locations, it maybe difficult to attract employees in case there is no fixed component due to theuncertainty involved in forming groups.
In compensation structures with a fixed component, the more the number of membersthe field worker handles, the lower the cost for the MFI. In the case of MFI 2, a fieldworker handles around 500 members as against MFI 1, where a field worker handlesaround 220 members. However, the population density of the region dictates the numberof members that a field worker can handle. When groups are spread out over widerareas, the field worker can handle fewer groups than when they are clustered together.
Group formation time is lesser in areas where there is greater awareness aboutmicro credit. This can be observed from the time taken for group formation insemi-urban areas vis a vis rural areas in the case of MF1 2, and from the comparison ofthe two new branches in MFI 3.
It is found in all the MFIs that the single activity that contributes the maximum todirect transaction cost is collection.
Further, in all MFIs, the field worker effectively has only a couple of hours in themorning and couple of hours in the evening for field work – these are the times whenthe borrowers/potential borrowers can be reached. During the day the field worker issupposedly engaged in administrative activities in the office, but it is not clear if thetime is effectively utilised.
Indirect transaction costIndirect transaction costs are linked to the number of layers of fixed costs in thesystem. The benefit of fewer numbers of layers is obvious from the study of MFI 1,where the model having less number of layers had lower indirect transaction costs.Indirect transaction costs may be marginally lower in rural areas, as is clear from MFI2. The study of MFI 3 clearly illustrates the benefits of mature branches since the fixedcost is allocated over more number of loans.
Life cycle transaction costAs may be expected, for all the three MFIs the transaction costs are lower when viewedon a life cycle basis as compared to the costs in the first year of giving the loan. This isbecause the first year costs include group formation and training costs, which are notincurred in the subsequent years.
Groupmicrocredit in
India
1337

MF
I1(N
orth
Ind
iab
ased
)M
FI2
(Sou
thIn
dia
bas
ed)
MF
I3(S
outh
Ind
iab
ased
)
Dif
fere
nti
atin
gfa
ctor
amon
gb
ran
ches
stu
die
dA
:5
mem
ber
gro
up
B:
14m
emb
erg
rou
pA
:S
emi-
urb
anB
:R
ura
lA
:M
atu
reb
ran
chB
:N
ewb
ran
chin
com
pet
itiv
een
vir
onm
ent
C:
new
bra
nch
inn
on-c
omp
etit
ive
env
iron
men
tA
:F
irst
yea
rg
rou
pfo
rmat
ion
cost
(%)
Bra
nch
A:
2.0
Bra
nch
B:
1.3
Bra
nch
A:
0.6
Bra
nch
B:
0.7
Bra
nch
A:
0.2
Bra
nch
B:
0.4
Bra
nch
C:
0.8
B:
Fir
sty
ear
adm
inis
trat
ive
cost
(%)
Bra
nch
A:
1.8
Bra
nch
B:
1.3
Bra
nch
A:
0.8
Bra
nch
B:
0.9
Bra
nch
A:
0.5
Bra
nch
B:
0.5
Bra
nch
C:
0.5
C:
Fir
sty
ear
mon
itor
ing
cost
(%)
Bra
nch
A:
2.3
Bra
nch
B:
1.1
Bra
nch
A:
1.0
Bra
nch
B:
1.0
Bra
nch
A:
1.2
Bra
nch
B:
1.3
Bra
nch
C:
1.7
D:
Fir
sty
ear
tota
ld
irec
ttr
ansa
ctio
nco
st(A
þBþ
C)
(%)
Bra
nch
A:
6.2
Bra
nch
B:
3.7
Bra
nch
A:
2.4
Bra
nch
B:
2.6
Bra
nch
A:
1.9
Bra
nch
B:
2.1
Bra
nch
C:
2.9
E:
Fir
sty
ear
tota
lin
dir
ect
tran
sact
ion
cost
(%)
Bra
nch
A:
5.1
Bra
nch
B:
4.4
Bra
nch
A:
1.8
Bra
nch
B:
1.6
Bra
nch
A:
1.3
Bra
nch
B:
4.2
Bra
nch
C:
5.7
F:
Fir
sty
ear
tota
ltr
ansa
ctio
nco
st(a
s%
offi
rst
loan
)(D
þE
)B
ran
chA
:11
.3B
ran
chB
:8.
1B
ran
chA
:4.
2B
ran
chB
:4.
2B
ran
chA
:3.
2B
ran
chB
:6.
3B
ran
chC
:8.
6G
:L
ife
cycl
etr
ansa
ctio
nco
sts
(as
a%
oflo
ans
giv
enov
erli
fecy
cle)
Bra
nch
A:
7.0
Bra
nch
B:
5.0
Bra
nch
A:
1.6
Bra
nch
B:
1.6
Bra
nch
A:
1.8
Bra
nch
B:
3.6
Bra
nch
C:
4.7
Table I.Study results
MD45,8
1338

The benefit of having a longer life cycle for the group from the cost perspective isevident from the comparison of MFI 2 and MFI 3. MFI 2 has a higher first yeartransaction cost than MFI 3; however, the situation reverses on a life cycle basis sincethe expected life of a group for MFI 2 is eight years as compared to four years in thecase of MFI 3.
Implications for MFIsResults from study of direct transaction costField worker productivity. MFIs may not have much leeway on compensation levelssince they are dictated by the market to a large extent. One important way to increasenumber of groups per field worker and reduce conveyance costs is to have highernumber of groups per square kilometer. This means that MFIs must aggressively lookat increasing the intensity of coverage of a particular village before spreading toneighboring villages. Increasing the number of groups may require some flexibility inthe working hours of the employees. For example, in case there are some potentialborrowers who work in distant places and are free only on Sundays, group meetingsshould be held on Sundays for groups of such borrowers.
Since most of the fieldwork is done in the early hours of the morning or in theevening, the field workers should be trained to do other tasks such as accounting, dataentry and audit of other branches during the day. They should also be encouraged tosystematically collate daily the data gathered during the field visits, which should bebuilt up as a database within the MFI. The data would be available even in case ofemployee turnover. MFIs could also look at sharing such data for a fee with companiesinterested in rural markets.
Employee incentives based on profit. Most employee incentives are linked to thenumber of new groups formed or number of groups monitored. Instead, linking incentivesto profit from portfolio of clients would make the employees more cost conscious.
Collection costs. Collection costs being the largest contributor to costs, MFIs need toexamine if the same repayment rates can be achieved by switching over to fortnightlyrepayment schedules, thereby halving the collection costs.
Results from study of indirect transaction costMinimal layers of fixed costs. MFIs need to ensure that there are minimal layers of fixedcosts in their system.
Branch viability. In order to be more viable, branches need to engage in otheractivities such as individual collateral based loans, insurance products and otherproducts. While there may be initial costs involved in training the personnel to handlethe new products, branch viability can be increased in the long run. Since MFIs alreadyhave a good presence in the villages, they could also look at becoming agents of generaland life insurance companies, credit card companies and mutual funds, which could beoffered to even those who are not customers. Insurance companies in particular wouldbe interested in using their services since they also have to meet statutory rural targets.
Alternatives to the branch model. MFIs could have mobile branches that function ata particular location on a particular day of the week so that field workers working inthe area can report to the office on that very day and complete their administrativetasks. Fully equipped vans can make excellent mobile branches; MFIs are thus savedthe cost of setting up branches in each location.
Groupmicrocredit in
India
1339

Results from study of life cycle transaction costWhile it is clear that the longer the time period for which a group lasts, the lower thetransaction costs on a life cycle basis, MFIs needs to examine if there is variation inasset quality with age of the group. This could enable them to arrive at estimations oflife cycle cost including the default cost.
MFI should also take into account the life cycle cost when pricing the loans. Merelylooking at first year costs may result in overpricing of loans, which may have the effectof driving away some good borrowers (Armendariz and Morduch, 2005).
Implications for policy makersThe Government needs to take into account transaction costs when examining theinterest rates charged by microfinance institutions. Regional variations in transactioncosts – higher in less developed areas – indicate that a uniform cap on interest ratesmay in fact drive away MFIs from difficult locations.
Since group formation time and consequently group formation cost is lower in areaswhere awareness about microcredit is high, the MFI industry would benefit if there is acampaign spreading basic awareness about the concepts of group microcredit inremote areas through local print/radio media. The costs of this campaign couldperhaps be borne or shared by the Government.
Limitations and scope for further studyGeneralisations based on the case studies should be done with caution. The study iscross sectional and hence reflects the costs that during the period March-December2005. The effects of inflation have not been considered in projecting costs.
Since increase in number of members reduces transaction costs significantly,experimental research on optimal group size – which minimizes transaction costwithout sacrificing asset quality – would be useful.
Collection contributes to the highest cost; therefore studies on the efficacy offortnightly repayment schedules would be useful.
While it is clear that the longer the time period for which a group lasts, the lower thetransaction costs on a life cycle basis, further research needs to be done on variation ofasset quality with age of the group. This would enable conclusions to be drawn onwhether extending the life of the group, is useful when default costs are also includedin the analysis.
ConclusionExisting literature indicates that transaction costs are a major contributor to highinterest rates on microcredit loans. Hence a study using the case study method wasdone to examine the transaction costs of three established microfinance institutions.
Direct, indirect and life cycle transaction costs were examined. Direct transactioncost comprises group formation, administration and monitoring costs. Indirecttransaction cost comprises allocated costs of the branch, regional office and head office.Lifecycle costs are costs over the time period for which the groups are in existence.
The results of the study indicate that the key drivers of direct transaction costs arefield worker compensation and number of groups handled per field worker. While themarket dictates the compensation level, geography and density of population dictatethe number of groups handled per field worker. Group formation time is found to be
MD45,8
1340

less in areas having greater awareness about microcredit. Collection activity is thesingle largest contributor to direct transaction cost. Indirect transaction costs increasewith the number of layers of fixed costs within the MFI. Rural branches had lowerindirect costs. Maturity of the branch is found to have a direct bearing on indirecttransaction costs since the fixed costs are allocated over more number of group loans.First-year transaction costs are lower than subsequent year costs as group formationand training costs don’t recur after the first year. Lifecycle costs are lower in caseswhere the groups last longer.
Based on the above findings, implications are drawn for MFIs. It is suggested thatMFIs, in order to reduce direct transaction costs, should increase the number of groupsper square kilometer, as this will save both field worker time and conveyance cost.MFIs should examine the possibility of reducing the collection frequency and theimpact it could have on repayment. The ways in which field worker productivity couldbe improved are by utilizing them better during the day hours when they are not in thefield and linking their incentives to profit from their portfolio rather than merely tonumber of groups formed and repayment levels.
The key drivers of indirect transaction cost for an MFI are number of layers of fixedcost in the MFI system, geographical location of the MFI and proportion of maturebranches. In order to reduce indirect costs, MFIs should minimize the number of layersof fixed costs in their system. It is also suggested that MFI branches examinealternative revenue generating activities that can be undertaken with minimalincremental costs. MFIs should also look at alternatives to the branch model such asfully equipped vans that can function as mobile branches.
Lifecycle transaction costs are found to be lower than first year transaction costs.MFIs need to examine life cycle costs including default costs over the group life cycleand take these into account when pricing loans.
The study also has implications for policymakers. Policymakers need to take intoaccount transaction costs when examining the interest rates charged by microfinanceinstitutions. The regional variation in transaction costs that the study has found is animportant factor that suggests that no uniform view can be taken on the rates chargedby MFIs in different regions. In order to spread microcredit to newer areas,Government funded information campaigns could help in bringing down groupformation costs thereby attracting MFIs to these areas.
Note
1. Computed as Operating revenue/(Financial expense þ loan loss provision expense þoperating expense).
References
Adams, D. and Von Pischke, J.D. (1992), “Micro enterprise credit programs: deja vu”,World Development, Vol. 20 No. 10, pp. 1463-70.
Armendariz, B. (1999), “On the design of a credit agreement with peer monitoring”, Journal ofDevelopment Economics, Vol. 60, pp. 79-104.
Armendariz, B. and Morduch, J. (2005), The Economics of Microfinance, MIT Press, Cambridge,MA.
Besley, T. and Coate, S. (1995), “Group lending, repayment incentives and social collateral”,Journal of Development Economics, Vol. 46 No. 1, pp. 1-18.
Groupmicrocredit in
India
1341

Chavan, P. and Ramakumar, R. (2004), “Interest rates on microcredit”, web site of the EconomicResearch Foundation, New Delhi, available at: www.macroscan.com (accessed 28 October2006).
Fernando, N. (2006), Understanding and Dealing with High Interest Rates on Microcredit: A Note toPolicy Makers in the Asia and Pacific Region, Asian Development Bank, Mandaluyong City.
Gonzalez-Vega, C., Schreiner, M., Meyer, R.L., Rodriguez, J. and Navajas, S. (1997), BancoSol:The Challenge of Growth for Microfinance Organisations, OECD Publication, OECD, Paris.
Goodwin-Groen, R. (2003), Making sense of microcredit interest rates”, web site of theConsultative Group to Assist the Poor, available at: www.cgap.org (accessed 28 October2006).
Helms, B. and Reille, X. (2004), “Interest rate ceilings and microfinance the story so far”,Consultative Group to Assist the Poor, available at: www.cgap.org (accessed 28 October2006).
Karduck, S. and Siebel, H.D. (2004), “Transaction costs of self help groups in NABARD’s SHGbanking programme: a study in Karnataka state”, National Bank for Agriculture andRural Development (NABARD), available at: www.nabard.org
Llanto, G.M. and Chua, R.T. (1996), “Transaction costs of lending to the poor: a case study of twoPhilippine non-governmental organizations”, Banking with the Poor, available at: www.bwtp.com (accessed 28 October 2006).
M-Cril (2003), Microfinance Review 2003 (revised 2004), Micro-Credit Ratings International,Gurgaon, available at: www.m-cril.com
Microbanking Bulletin (2004), Issue No. 11, Microfinance Information Exchange, Washington,DC, available at: www.mixmbb.org
Puhazhendi, V. (1995), “Transaction costs of lending to the rural poor: non governmentalorganizations and self help groups of the poor as intermediaries for banks in India”,Banking with the Poor, Brisbane, available at: www.bwtp.org/ (accessed 28 October 2006).
Rosenberg, R. (2002), Microcredit Interest Rates, Consultative Group to Assist the Poor,Washington, DC, available at: www.cgap.org (accessed 28 October 2006).
Sa-dhan (n.d.), “Note on microfinance in India”, The Association of Community DevelopmentFinance Institutions, New Delhi, available at: www.sa-dhan.org (accessed 28 October 2006).
Srinivasan, G. and Satish, P. (2000), Transaction Costs of SHG Lending – Impact on BranchViability, Banker’s Institute of Rural Development, Lucknow.
Tankha, A. (2002), “Self-help groups as financial intermediaries in India: cost of promotion,sustainability and impact, Sa-dhan study“, available at: www.microfinancegateway.org(accessed 28 October 2006).
Yaron, J. (1992), “Successful rural finance institutions”, Discussion Paper No. 150, World Bank,Washington DC.
Yin, R.L. (1994), Case Study Research: Design andMethods, (revised 1993, 1994), Sage Publishing,Beverly Hills, CA.
Corresponding authorSavita Shankar can be contacted at: [email protected]
MD45,8
1342
To purchase reprints of this article please e-mail: [email protected] visit our web site for further details: www.emeraldinsight.com/reprints

Alleviating poverty: how do weknow the scope of the problemand when we have solved it?
Rocky J. DwyerFaculty of Philosophy, Saint Paul University, Ottawa, Canada
Abstract
Purpose – This paper aims to outline and discuss how to incorporate the stakeholder perspectiveinto performance measurement framework to enhance program effectiveness, accountability andunderstanding in relation to human development issues.
Design/methodology/approach – An examination of the literature and a review of best practiceswas undertaken to identify relevant performance measurements and indicators that could be utilizedto measure incremental results and impacts related to poverty reduction strategies.
Findings – Credible demonstration of policy or program impacts for poverty reduction are dependenton understanding the distinction between inputs, outputs, outcomes and indicators. Moreover, to betrusted by the public, performance reporting on poverty reduction needs to focus more selectively onidentifying the key measures of performance and the engagement of key constituents. The intention ofthis paper is to identify some current best practices and suggest a model with potential indicators,which could be utilized to measure incremental results and impacts in relation to human developmentissues that we contend is the essential next step if the power and resources of stakeholders are to beharnessed in the fight against poverty while enabling organizations to implement new ways ofapproaching measurement effectiveness and accountability in a strategic and comprehensive manner.
Practical implications – The paper advocates that an understanding of performance measurementtheory and stakeholder engagement process can enable business leaders to create practicalperformance measurement frameworks, which in turn will lead to enhanced reporting andaccountability for poverty reduction impacts and results.
Originality/value – This paper presents an overview of the literature which both enhances personalknowledge and understanding at the theoretical and practical levels enabling business leaders to gaininsight on the inherent stakeholder factors that need to be considered when designing performancemeasurement strategies and reporting frameworks.
Keywords Poverty, Performance measurement (quality), Stakeholder analysis
Paper type Research paper
IntroductionPerformance measurement and reporting is now considered to be a critical componentin private, not-for-profit and public sector accountability both in Canada and abroad(Office of the Auditor General of Canada, 2003; International Institute for SustainableDevelopment, 2005; Overseas Development Institute, 2006; Treasury Board of Canada,1998, 2000, 2001, 2002). Indeed, private, not-for-profit and public sector organizationsremain under increasing pressure to measure progress toward results, have flexibilityto adjust operations to meet expectations, and report on outcomes accomplished.
The intention of this article is to identify salient best practices and suggest someindicators involved in measuring incremental results and impacts that could be utilizedto enhance measurement, accountability and understanding in relation to humandevelopment issues. This is the essential next step if the power and resources of
The current issue and full text archive of this journal is available at
www.emeraldinsight.com/0025-1747.htm
Alleviatingpoverty
1343
Management DecisionVol. 45 No. 8, 2007
pp. 1343-1358q Emerald Group Publishing Limited
0025-1747DOI 10.1108/00251740710819078

stakeholders are to be harnessed in the fight against poverty, and a model withindicators is proposed to assist in this process.
Manage for resultsIn comparison to private and not-for profit organizations, public sector organizationsneither seek to enhance competitiveness or promote growth – these public institutionsaim to provide the highest quality of service to the public and to manage for and reporton results and performance achieved. A significant element of public sector reform isthe move toward an approach that pays greater attention to the results attained withtaxpayers’ dollars; both the private and not-for-profit sectors have also faced increasedpressure from stakeholders (business, civil society, government, and labor) todemonstrate results, particularly in the area of their contributions to humandevelopment and poverty reduction.
Credible demonstration of policy or program impacts for poverty reduction andother social issues are dependent on understanding the distinction between inputs,outputs, outcomes and indicators. To be trusted by the public, performance reportingon such issues need to focus more selectively on identifying the key measures ofperformance and the engagement of key constituents.
While the literature is replete with numerous models for assessing the impact andresults of programs and policies (see for example: Behn, 2003; Edwards et al., 2006;Malina and Selto, 2004; Martinez, 2005; Moullin, 2005; Neely, 2005; Royal StatisticalSociety, 2003); the number of policy makers, program evaluators, and stakeholdersfamiliar with the literature, and who understand the appropriate methods that can beutilized to estimate and assess these impacts and results, is not optimal (Marshall et al.,2004; Neely, 2005; Thomas, 2004). There are many advantages to having programevaluators understand results and impact assessment literature. For example, ifstakeholders consistently incorporated more stringent performance measures tosupport accountability and performance reporting, and program evaluatorsincorporated the principles of impact and results assessment in both formative andsummative evaluations, it would afford organizations a stronger way of approachingperformance accountability and measurement at the strategic level. Additionally, thesechanges would respond to the changing mind-set of the public regarding performanceaccountability, while providing enhanced information and opportunity fororganizational management to make more effective choices in programminginvestments.
Results-oriented measurementWhile The Millennium Development Goals (formulated in 2000), and The WorldSummit on Sustainable Development in 2002 have put the spotlight on povertyreduction as the most pressing challenge of our time, both recognized that business,civil society, government, and labor have important roles to play according to Edwardset al. (2006), Marshall et al. (2004), and Thomas (2004). Over the last several years, theOverseas Development Institute (2006), the Japan International Cooperation Agency(2004), the World Bank (1999), Radelet (2003), USAID (2004), and the World Bank(1999) have repeatedly reflected a growing concern over the relevance and reliability ofmeasuring poverty related outcomes and reporting success.
MD45,8
1344

The literature (Edwards et al., 2006; Eccles and Pyburn, 1992; Ittner and Larcker,1998; Johnston and Fitzgerald, 2001; Kaplan and Norton, 1992; Manzoni, 2002)distinguishes two uses for performance measurement information. Firstly, from amanagement perspective, performance information can be used to better understandthe contributions and differences a program or policy is making. Furthermore, itenables program management staff to determine if a program or policy is theappropriate tool to achieve the desired result. In this regard, performance measurementis both a search for knowledge and an investigative tool.
Second, performance measurement is utilized to explain or demonstrate the resultsachieved by a policy or program initiative. In many jurisdictions, there is an increasedfocus on reporting to elected officials and other stakeholders exactly what has beenachieved with the dollars spent and resources used. While performance measuresfrequently form the basis of such reporting, according to the Overseas DevelopmentInstitute (2006) and Japan International Cooperation Agency (2004), the question is howcan performance measurement information be used to report credibly on what has beenaccomplished and perhaps to confirm: the right metrics were identified, the approachfor direct impacts was appropriate and useful; and if better indirect measures or eveninduced impacts and report of these impacts in a comparable way would have been abetter alternative.
The literature (Edwards et al., 2006; Eccles and Pyburn, 1992; Ittner and Larcker,1998; Johnston and Fitzgerald, 2001; Kaplan and Norton, 1992; Manzoni, 2002) clearlyarticulates the distinction between inputs, outputs, outcomes and indicators as thebasis of performance measurement. Inputs are the resources allocated to programs andorganizations. Outputs are the activities government agencies undertake, such as theprovision of services. Outcomes are the eventual results of those activities in terms ofthe public good. Schacter (2002) notes:
[. . .] indicators are the empirical measures of inputs, outputs and outcomes.
Hence, the thrust of performance measurement is to train attention on “outcomes” –what ultimately matters the most – and link them to a logical model that connectsinputs (resources) with activities, outputs and outcomes.
From measurement to managementHowever, when examined more closely, performance measurement is more thansimply “measuring impacts” – it entails a management regime that requires anorganization to have a clear idea of its objectives, and a regular means of reporting itssuccess achieving them. Performance reporting is different from program or policyevaluation, which typically takes place at specific points in time in a program’s life andis a more comprehensive analysis of program impacts. It is imperative thatperformance measurement be viewed as part of a larger management regime, whichattempts to link ongoing results with strategic planning, budgeting and resourceallocation. In other words, a framework based on managing for results.
The heart of any performance reporting process is a “logic model” (Figure 1) thatties inputs to activities as well as to short-term, intermediate and ultimate outcomes.According to Wholey (1983), the logic model becomes a conceptual illustration of the“results chain” or how the activities of a policy, program or initiative are expected tolead to the achievement of the final outcomes – in this case poverty reduction. So then,
Alleviatingpoverty
1345

a well-structured logic model is the beginning foundation to both understanding andsubsequently measuring the success of any poverty reduction program. Thus,performance can only be measured if there are both outputs and outcomes.
Even for a program explicit as poverty reduction, selecting indicators is notautomatic. Successful performance measurement depends, in part, on finding credibleindicators, which can be successfully measured. For example – if the objective is tostimulate entrepreneurship within regions of high poverty incidence, with particularemphasis on international markets, a potential initiative may be the establishment offacilitation and brokering platforms to support exporter program initiatives. Theoutput may be a percentage increase in the number of joint initiatives between fundingorganizations and local/regional government, and a potential measure may be thenumber of new opportunities by sector, and region; or the number of new opportunitiesby sector, and region.
Thus, results can be measured in many ways by using many different kinds ofinformation when stakeholders agree upon appropriate performance indicators. Forexample, indicators could be a simple as the extent to which poverty reduction strategy(PRS) initiatives contributed to increased employment among participants, or theincrease rate of participation in PRS employment initiatives, the rate of incomedistribution over quintiles (including inequality gap between percent income groupand others, or the increase in the average yearly employment level by family andregion. However, without stakeholder agreement there is a risk that inappropriateperformance will be encouraged; and in fact become the norm for reporting results.Thus, it is critical to link resources to measurable results.
Linking resources to results – a process requirementSince, performance measurement is not an end in itself – it is essential thatmeasurement be tied to and contribute to the wider process of resource allocation(Behn, 2000; Edwards et al., 2006; Eccles and Pyburn, 1992; Ittner and Larcker, 1998;Johnston and Fitzgerald, 2001; Kaplan and Norton, 1992; Manzoni, 2002, Mercer, 2003;Radelet, 2003; USAID, 2004; World Bank, 1999). Thus, linking resources to resultsbecomes a mechanism for supporting transparency in the decision-making process. Aswell, such steps enrich accountability in a citizens’ centered approach.
Figure 1.Results-based logic model
MD45,8
1346

Theoretically, if programs are found to be under-performing, resources can bereallocated to other programs that have demonstrated public benefits. In addition,there is evidence from several jurisdictions to suggest the alignment of resources toresults. Many organizations report actual performance against targeted performance.Alignment is most common between budgeted resources and expected results.According to Grenier (1996) the conceptual and technical problems involved with validand reliable performance measurement are numerous. He sums up the problem asfollows:
[. . .] public sector performance measurement is, in effect, like putting a meter on a black box:we have little knowledge of the mechanism inside and no theory linking inputs, processes,outputs and outcomes to explain why a particular result occurred or to prescribe whatmanagement or organizational adjustments are needed to improve performance.
Tell a convincing storyThere is a paradox of performance measurement acknowledged in the literature (seeBehn, 2000; Edwards et al., 2006; Eccles and Pyburn, 1992; Ittner and Larcker, 1998;Johnston and Fitzgerald, 2001; Kaplan and Norton, 1992; Manzoni, 2002; Mercer, 2003;Radelet, 2003; Thomas, 2004; USAID, 2004; World Bank, 1999). As noted previously,performance measurement is driven by both precision and a clear assessment of thecontribution of government programs to specific outcomes. The literatureacknowledges that there are significant technical problems associated withdisentangling the specific effect of those programs from other factors that mightcontribute to those outcomes. For example, Behn (2003), Paton (2003), Schacter (2002),and Thomas (2004) argue good performance measurement is an exercise instorytelling. These researchers maintain successful performance measurement mustacknowledge there is an element of judgment. Furthermore, they note the importanceto acknowledge the limits of both the chosen indicators and the evidence for thoseindicators. According to various researchers (Behn, 2000; Edwards et al., 2006; Ecclesand Pyburn, 1992; Ittner and Larcker, 1998; Johnston and Fitzgerald, 2001; Kaplan andNorton, 1992; Manzoni, 2002, Mercer, 2003; Radelet, 2003; Schacter, 2002; Thomas,2004) a well-developed performance framework allows you to tell a convincing story,backed by credible evidence, about the value added by the program to some particularsegment of society.
The literature (Behn, 2000; Edwards et al., 2006; Eccles and Pyburn, 1992; Ittner andLarcker, 1998; Johnston and Fitzgerald, 2001; Kaplan and Norton, 1992; Manzoni, 2002;Mercer, 2003; Radelet, 2003; Thomas, 2004; USAID, 2004; World Bank, 1999) highlightsfour organizational implications of performance measurement. First, if a trueperformance measurement regime is established, it implies the organization has a focuson performance and outcomes rather than on process or outputs. Second, there is awillingness to be evaluated at both an organizational and a personal level. Third, thereis a focus on continuous improvement so that performance measurement is linked tothe development and adjustment of new programs and resource allocation. Fourth,there is greater transparency, and accountability to both internal and externalstakeholders. For instance: in 24 out of the 30 OECD countries, performanceinformation is available to the public and widely published (OECD, 2005). Furthermore,according to the OECD (2005), “ministers or heads of department are formally
Alleviatingpoverty
1347

responsible for setting targets for internal organizations, as well as reporting anddelivery of services, and performance against them is systematically reported inaround two thirds of OECD countries.” Continuous performance monitoring withinministries is also now conducted in well over half of the countries concerned.
Stakeholder engagement – a processMore than a century ago, Sir Josiah Stamp noted:
Q . . . the government is extremely fond of amassing great quantities of statistics. These areraised to the nth degree, the cube roots are extracted and the results are arranged intoelaborate and impressive displays. What must be kept in mind however, is that in every case,the figures are first put down by a village watchman and he puts down anything he damnwell pleases.
Stamp’s comments clearly indicate public institutions have long collected data andother information regarding existing programs and their performance. However, asThomas (2004) and others (see Edwards et al., 2006; Eccles and Pyburn, 1992; Ittnerand Larcker, 1998; Johnston and Fitzgerald, 2001; Kaplan and Norton, 1992; Manzoni,2002; Mercer, 2003; Radelet, 2003) denote, the nature and content of such performanceassessments have evolved from focusing mainly on the quantity of resources used byprograms (the dollars spent and the number of people employed) to examining how theresources are used, the purposes of programs and their impacts and effects on society.This change of emphasis has been necessary, as decision-makers have increasinglydemanded better information on the actual as opposed to the expected achievements ofpublic sector policies and programs.
Within public institutions, program evaluation has been an essential organizationalpractice. Engaging key constituents, however, is not practiced consistently across allprogram areas, nor is it sufficiently well integrated into the day-to-day evaluationprocess of most programs. Thomas (2004, p. 1) notes that it is easier to find examples ofwhere performance measurement systems have been abandoned or drastically scaledback than it is to find examples where such systems . . . contribute to improvedperformance by public organizations. Typically, there are three phases to public sectorevaluations.
(1) Evaluation assessment or framework (the planning phase).
(2) Evaluation study.
(3) Decision-making based on findings and recommendations.
The evaluation assessment phase identifies the main issues and questions to beaddressed in the study and develops appropriate methods for gathering evidence onthem. The evaluation staff then develops specific terms of reference for approval by thesenior management cadre, following which the evaluation study begins, and data iscollected and analyzed to produce findings about the evaluation issues. These findingsand subsequent recommendations form the basis for making decisions about the futureof the program(s). The reporting of these findings to senior management cadre helpsmaintain accountability for the results. So then, the real question is is reporting takingplace?
Serving the broader interest means ensuring that the interest of stakeholders andtaxpayers, are protected. Traditionally, however, public sector organizations have
MD45,8
1348

considered accountability to be of greater importance – inputs (what it spends),activities (what it did) and outputs (what it produced). This mentality may haveensured that the ledger books were in order but it provides little information aboutwhether the interests of stakeholders have been considered. To differentiate itself fromthe current evaluation process, evaluation units need to re-focus how they wouldreposition themselves to engage key stakeholders at all levels in the evaluation process.
Measurement and its limitations!Less about precisionAs pointed out by Canada’s Auditor General (2003), the Overseas DevelopmentInstitute (2006) and the Japan International Cooperation Agency (2004) there remains aconstant need to rethink what measurement can usefully mean. This is especially truefor initiatives such as poverty reduction. Even with a carefully designed evaluationstudy, definitively determining the extent to which a program contributes to aparticular reduction outcome is usually very difficult, and perhaps not possible. In fact,measurement is becoming less about precision and more about increasing ourunderstanding and knowledge about what works, thereby reducing the uncertaintyabout program impacts. This view of measurement implies a requirement to gatheradditional data and information that will increase our understanding about a programand its impacts, even if we cannot “prove” things in an absolute sense. However, itmight allow us to provide a reasonable estimate of the magnitude of the impact.
Qualitative toolsPerhaps more importantly, this view recognizes a need to include softer, qualitativemeasurement tools within the concept of measurement. Since there is a need to berealistic about program outcomes, there is a need to acknowledge other factors at playthat may influence these outcomes. Furthermore, Edwards et al. (2006), Malina and Selto(2004), Martinez (2005), Moullin (2005), Neely (2005), Royal Statistical Society (2003), andMayne (2001) all contend there is a need for a more honest and credible approach byacknowledging that these influences exist, rather than pretending otherwise.
Increasingly, there is recognition that such measurement has its limitations,perhaps implying that a need exists to accept some uncertainty about theunavailability of performance measures in some cases. When it is absolutelynecessary to have a high degree of certainty regarding a program’s contribution, itbecomes even more crucial to ensure rigor within the evaluation measurement process.
Intended outcomesWhile the literature is clear on the concept of program “effectiveness”, organizationalprograms designed to produce certain “intended outcomes” such as: poverty reduction,a healthier public, better living conditions, healthier communities, more jobs, and so onhave proven difficult to measure. We all know that effective programs are those thatcan demonstrate these results. In other words, they contribute to the public view ofvalue for money expended. However, in the quest to measure program performance, weface two challenges: first, measuring whether or not these outcomes are actuallyoccurring, and second, determining what contribution the specific program has madeto the outcome. The second is perhaps the more difficult question in that it attempts todetermine how much of the success (or failure) can be attributed to the program.
Alleviatingpoverty
1349

The broad picture that emerges from the review and analysis of the literature is thatany poverty reduction strategy (PRS) has the potential to encourage the developmentof a country-owned and credible long-term strategy for growth and poverty reduction,which could provide an effective framework for coordinating the efforts of donors andinternational financial institutions. However, actual achievements thus far fallconsiderably short of potential. This is partly because it is unrealistic to expect quickgains given the initial conditions from which the process started in most low-incomecountries. But there were also shortcomings in the design of the initiative that havereduced its effectiveness, including a lack of clarity about the role, which fundingorganizations and stakeholders should play.
Stakeholder participationStakeholder participation in the formulation of poverty reduction strategies isincreasingly seeing practice; and although there was generally more broadly basedengagement than in previous approaches, and most stakeholders involved in theprocess viewed this as a significant improvement. However, the participatoryprocesses are typically not designed to strengthen existing domestic institutionalprocesses for policy formulation and accountability (e.g. through local authority). In afew cases, institutional arrangements to sustain the process are beginning to developaround the budgetary cycle; and in fact few if any measures exist to gauge the impactof domestic stakeholders in outcomes (see for example: Edwards et al., 2006; Malinaand Selto, 2004; Martinez, 2005; Moullin, 2005; Neely, 2005; Royal Statistical Society,2003; Thomas, 2004; USAID, 2004).
The PRS process has had limited impact in generating meaningful discussions,outside the narrow official circle, of alternative policy options with respect to themacroeconomic framework and macro-relevant structural reforms (Edwards et al.,2006; Japan International Cooperation Agency, 2004; Malina and Selto, 2004; Martinez,2005; Moullin, 2005; Neely, 2005; Overseas Development Institute, 2006; RoyalStatistical Society, 2003; Thomas, 2004; USAID, 2004). This reflects in part the absenceof any mechanism to ensure that key issues were aired and the broader debate wellinformed. Lack of clarity about the role of funding organizations in this areacontributed to this outcome. In the relatively few cases where a broader stakeholderengagement and debate did occur, there was a positive impact on policy outcomes.
Results in terms of ownership are mixed according to many leading researchers(Edwards et al., 2006; Japan International Cooperation Agency, 2004; Malina and Selto,2004; Martinez, 2005; Moullin, 2005; Neely, 2005; Thomas, 2004). The approach hasoften generated relatively strong ownership in a narrow circle of official stakeholdersresponsible for driving the process, but much less among other domestic stakeholders.The perception that the approach is overly influenced by procedural requirements offunding organizations is potentially widespread in PRS initiatives.
Stakeholder engagement measurement – suggestions for considerationStakeholder engagement has been a key element in progressive planning andmanagement processes for many years. “Consultation” has, however, taken manyforms and actual practices have often been criticized as tokenistic and cynical. In somecases, Rightmer and Jeney (2002) suggests the approach taken has been referred to asthe “decide, educate, announce, defend” (DEAD) process of engagement.
MD45,8
1350

However, relationships with stakeholders are a strength that can be developed toimprove government policymaking, legislative and accountability frameworksparticularly as roles and the environment evolve (Mitchell et al., 1997; O’Dwyer,2004; Sexty, 2002). Arguably, stakeholder relations are a critical part of any foundationthat will support the evolution of accountability and performance measurementprocesses.
In fact, stakeholder participation should be an interactive two way process. Assuggested by Dwyer (2004) for example, consultation should involve consensusbuilding, be objective, open and fair, be explicit – where, when and how, legitimate soresults can be used in the decision making process and traceable so participants cansee how their efforts have influenced the decision making process – a point alsosupported by Hardy (1985).
According to a recent OECD report economic growth is clearly linked to povertyreduction and is not linked to increasing inequality (2006). For pro-poor growth thepoor must be able to participate in the growth process. The poor often avoid high riskswith high opportunities thus policies must be in place to decrease risk andvulnerability. Pro-poor growth must involve women and policies must be in place thatdeals with social, environmental and political issues as well as economic issues.Poverty reduction strategies must be nationally owned for stronger stakeholderinvolvement. Donors should support in-country processes, be flexible and responsiveto country situations, and remain engaged in the face of weak or bad governments.
Dwyer (2004) indicates that any stakeholder consultation process should have thefollowing principles: a first thought, not an afterthought, mutual respect and theinvolvement of stakeholders. In the context of a pro-poor growth initiative,stakeholders are those who affect, are affected by or have a legitimate interest in theinitiative, activity or the outcome. For example, for the purposes of pro-poor growthinitiatives, stakeholders might include: governments, civil-society organizations, localcommunities, customers, business partners, employees and stockholders Thus,involving stakeholders on such issues as participant funding; outcome identification inan open, honest, and transparent manner where all stakeholders have equal influenceon outcome of the process; with access to information; and shared ownership of theprocess; will ensure solid feedback and continuing communication between the variousstakeholders.
In terms of stakeholder engagement, according to the International Institute forSustainable Development (2005) indicators may be described as “bits of informationthat summarize the characteristics of systems or highlight what is happening in asystem”. Others, such as the World Resource Institute (2005) denote indicators can beused to gain information about progress or decline in particular areas and can help touncover clues to matters of larger significance or identify trends. Often, informationfrom monitoring of indicators is expected to “provide important policy guidance todecision makers and provide a means for tracking sustainable development” related toPRS in the context of stakeholder engagement.
Identification of appropriate and measurable indicatorsWe know that effective indicator use for sustainability purposes requires attention to arange of social, economic and perhaps other considerations, hopefully with some effort
Alleviatingpoverty
1351

to recognize and track interconnections. However, it is quite clear that the majority ofindicators that have been developed are utilized to report on sustainable development.
Thus, the next logical consideration would be to develop a set of indicators thatmeasure the contribution and impact of stakeholder engagement in relation to the PRSinitiative outcomes. For example, a set of indicators could be developed around:
. Procedural quality. Measured by evidence/indicators of how the stakeholderengagement was undertaken, and whether it was consistent with its declaredprocess.
. Responsiveness. Measured by evidence/indicators which demonstrates theorganization has leant from the process of engagement and, crucially, that thelearning is put into practice, e.g. through policies and decisions.
. Quality of outcomes. Measuring indicators/evidence of resulting costs andbenefits to the organization and its stakeholders.
Both the Office of the Auditor General of Canada (1997, 2000, 2003) and the TreasuryBoard of Canada’s (1998, 2000, 2001, 2002) literature underscore that what is needed forunderstanding and reporting is a specific analysis to provide information on thecontribution of a program toward the outcomes the program is trying to influence. Theaforementioned literature is unmistakably clear on the subject of simply measuringand reporting performance based on performance measurement systems, without anydiscussion or analysis of other factors at play. This kind of performance measurementinformation is thought to have little credibility. Moreover, the literature urgesmanagers to be realistic about outcomes, especially if they are trying to either influenceor want to gain insight and understanding as to if and how the program activities aremaking a difference. Recognizing the other factors at play while still believing theprogram is making a contribution is a critical first step.
At the end of the day, it can be stated that contribution analysis attempts to exploreand perhaps demonstrate, “plausible association.” A thought echoed by Hendricks(1996), who noted:
[. . .] plausible association is whether a reasonable person, knowing what has occurred in theprogram and knowing the intended outcomes actually occurred, agrees that the programcontributed to those outcomes.
The management matrixIncorporating evidence of practice based on the above considerations, it is thereforepossible to develop a management matrix that incorporates the stakeholderperspective (see Table I), which presents the linking of strategic objectives for a setof development perspective measures, targets and initiatives for pro-poor growthinitiatives.
ConclusionGaining an understanding of the literature related to best practices in impactmeasurement this has not been achieved – the literature review is scant andidiosyncratic is the first step in building a credible methodology to measure povertyreduction program impacts. In addition, utilizing both contribution analysis and otherappropriate techniques and approaches to add rigor increases evidence validity. As
MD45,8
1352

Str
ateg
icco
nsi
der
atio
n:
the
dev
elop
men
t“g
ear”
ofst
rate
gy
Mea
sure
sT
arg
ets
Init
iati
ves
Objective
1:
tora
ise
emp
loy
men
tam
ong
urb
anp
oor,
wit
hp
arti
cula
rem
ph
asis
onth
ose
exp
ort
sect
ors
char
acte
rize
db
yh
igh
lab
or,m
ediu
msk
ill
req
uir
emen
ts
Ex
ten
tto
wh
ich
PR
Sin
itia
tiv
esco
ntr
ibu
ted
toin
crea
sed
emp
loy
men
tam
ong
par
tici
pan
ts
Per
cen
tag
ein
crea
seof
emp
loy
men
tcr
eate
dam
ong
par
tici
pan
ts.
Ato
tal
of30
per
cen
tov
eral
lre
du
ctio
nin
un
emp
loy
men
tw
ith
inth
ree
yea
rs
Sta
keh
old
eren
gag
emen
tin
itia
tiv
esat
the
loca
lan
dre
gio
nal
lev
els
toid
enti
fyd
efin
itio
nof
emp
loy
men
tsu
cces
san
dy
earl
yta
rget
s
Per
cen
tag
ein
crea
seof
the
aver
age
inco
me
ofth
eb
otto
man
dto
p20
per
cen
t
Intr
odu
ctio
nof
the
coop
erat
ive
cen
ter
mod
elat
loca
lan
dre
gio
nal
lev
els
Incr
ease
inth
eav
erag
ey
earl
yem
plo
ym
ent
lev
elb
yfa
mil
yan
dre
gio
n
Per
cen
tag
eof
pop
ula
tion
liv
ing
atp
over
tyle
vel
asco
mp
ared
top
erce
nta
ge
incr
ease
En
cou
rag
ep
rog
ram
s,w
hic
hsu
pp
ort
ente
rpri
ses,
wh
ich
crea
tes
abu
nd
ance
oflo
w/s
emi-
skil
led
job
opp
ortu
nit
ies
Incr
ease
rate
ofp
arti
cip
atio
nin
PR
Sem
plo
ym
ent
init
iati
ves
5p
erce
nt
yea
rly
incr
ease
inP
RS
emp
loy
men
tin
itia
tiv
esp
arti
cip
atio
nra
te(p
erce
nta
ge
ofel
igib
lep
arti
cip
ants
wh
oar
eac
tiv
ep
arti
cip
ants
)
Cre
atio
nof
ince
nti
ves
for
ente
rpri
ses
tolo
cate
inla
gg
ing
reg
ion
s.P
rior
ity
inv
estm
ent
stra
teg
y,
wh
ich
pla
ces
and
emp
has
ize
onex
por
tse
ctor
Objective
2:
tog
ener
ate
exp
ort-
rela
ted
inco
me
opp
ortu
nit
ies
for
rura
lfa
mil
ies
wor
kin
gin
the
info
rmal
sect
or
Nu
mb
erof
new
opp
ortu
nit
ies
by
sect
or,
and
reg
ion
Per
cen
tag
ein
crea
sein
nu
mb
erof
opp
ortu
nit
ies
by
sect
oran
dre
gio
nan
nu
ally
PR
Ssp
onso
rsh
ipof
com
mu
nit
y-b
ased
and
self
-led
acti
vit
ies
and
init
iati
ves
Nu
mb
erof
mic
ro-c
red
itlo
ans
by
sect
oran
dre
gio
nP
erce
nta
ge
incr
ease
inu
pta
ke
ofm
icro
-cre
dit
Res
earc
hg
ran
tsto
loca
lan
dre
gio
nal
ind
ivid
ual
san
dg
rou
ps
tou
nd
erta
ke
and
sup
por
tre
sear
chre
late
dto
econ
omic
via
bil
ity
and
com
pet
itiv
enes
s
(continued
)
Table I.The management matrix
from a stakeholderperspective
Alleviatingpoverty
1353

Str
ateg
icco
nsi
der
atio
n:
the
dev
elop
men
t“g
ear”
ofst
rate
gy
Mea
sure
sT
arg
ets
Init
iati
ves
Nu
mb
erof
mic
ro-o
wn
ente
rpri
ses
by
sect
oran
dre
gio
nP
erce
nta
ge
incr
ease
inth
en
um
ber
ofjo
int
init
iati
ves
bet
wee
nfu
nd
ing
org
aniz
atio
ns
and
loca
l/re
gio
nal
gov
ern
men
t
Coo
per
ativ
em
ark
etin
gp
rog
ram
sat
the
loca
l,re
gio
nal
and
inte
rnat
ion
alle
vel
.E
stab
lish
men
tof
faci
lita
tion
and
bro
ker
ing
pla
tfor
ms
tosu
pp
ort
exp
orte
rp
rog
ram
init
iati
ves
.D
evel
opm
ent
ofp
ilot
test
ing
/mon
itor
ing
new
app
roac
hes
fram
ewor
k–
wh
atw
ork
s/w
hat
do
not
wor
kN
um
ber
ofag
reem
ents
wit
hex
por
ters
Per
cen
tag
ein
crea
sein
nu
mb
erof
agre
emen
tssi
gn
edP
artn
ersh
ipin
itia
tiv
esw
ith
inte
rnat
ion
aln
ot-f
or-p
rofi
tor
gan
izat
ion
s(i
.e.
Wor
ldV
isio
n,
UN
ICE
F,
Ox
fam
)
Ob
ject
ive
3:to
stim
ula
teen
trep
ren
eurs
hip
wit
hin
reg
ion
sof
hig
hp
over
tyin
cid
ence
,w
ith
par
ticu
lar
emp
has
ison
inte
rnat
ion
alm
ark
ets
Sta
keh
old
ers
hav
ea
“goo
d”
(i.e
.b
ette
rth
an“f
air”
bu
tn
ot“e
xce
llen
t”u
nd
erst
and
ing
and
app
reci
atio
nof
the
ben
efits
ofth
ep
rog
ram
25p
erce
nt
incr
ease
insh
are
ofp
aid
emp
loy
men
tw
ith
inth
ree
yea
rsS
tak
ehol
der
wor
ksh
ops.
Est
abli
shm
ent
ofB
usi
nes
sIm
pro
vem
ent
Ass
ocia
tion
sat
loca
lan
dre
gio
nal
lev
els
Incr
ease
du
pta
ke
ofp
arti
cip
atio
nb
yst
akeh
old
ers
infu
nd
edtr
ain
ing
and
pro
gra
ms
100
per
cen
tof
inte
rest
edin
div
idu
als
rece
ive
trai
nin
gw
ith
two
yea
rsA
cces
sto
chil
d-c
are
pro
gra
ms.
Pro
mot
ion
ofcr
oss-
lear
nin
gw
ith
and
bey
ond
loca
lan
dre
gio
nal
cen
ters
Ex
ten
tto
wh
ich
the
Inte
rnat
ion
alT
rad
eC
entr
efu
nd
edin
itia
tiv
esco
ntr
ibu
ted
tolo
ng
-ter
mb
enefi
tsan
din
ten
ded
outc
omes
ofth
ep
rog
ram
Dem
onst
rate
din
crea
seat
the
loca
lan
dre
gio
nal
lev
els
ofb
est
pra
ctic
ein
itia
tiv
es.
Per
cen
tag
ed
emon
stra
ted
qu
alit
ativ
efe
edb
ack
sup
por
tin
gin
ten
ded
outc
omes
Pro
mot
ing
and
shar
ing
goo
dp
ract
ice.
Init
iati
ves
tosu
pp
ort
man
agin
gri
sk.
Dev
elop
men
tof
entr
epre
neu
rsh
ipm
ento
rin
gp
rog
ram
Sta
keh
old
ers
are
the
dri
vin
gfo
rce
wit
hre
spec
tto
pro
vid
ing
bu
sin
ess
inte
llig
ence
reg
ard
ing
loca
lm
ark
ets
Qu
alit
yan
dq
uan
tity
ofb
usi
nes
sin
tell
igen
cein
corp
orat
edin
tob
usi
nes
sp
lan
nin
gan
dri
skm
itig
atio
nst
rate
gie
s
PR
Ssp
onso
rsh
ipof
loca
lan
dre
gio
nal
coop
erat
ive
led
init
iati
ves
PR
Sfu
nd
ing
tosu
pp
ort
loca
lan
dre
gio
nal
bu
sin
ess
asso
ciat
ion
s
Table I.
MD45,8
1354

well, institutions need to build a culture of partnership and constituent engagement.Such an approach would require organizations to achieve a balance betweenconstituents’ expectations and evaluation requirements. What works best in anorganization will depend on a range of factors, including its size, the nature of itsbusiness and its culture. Engaging constituents in an evaluation should be the productof deliberate and strategic-decision making, based on an understanding of theorganization, its objectives, operating environment and culture. According to studiesconducted by the Commonwealth of Australia (2001) and The World Bank (1999)incorporating a process to engage key constituents’ active participation in theevaluation process builds quality and credibility into the process and subsequentlyleads to acceptance of results at the grass roots level. The model and concepts proposedin this paper if incorporated into current and future poverty reduction initiatives wouldnot only increase the level of transparency with stakeholders – it would enablecountries to create a highly credible accountability and reporting regime; and supportdecision making at a more strategic level, ultimately building a stronger socialfoundation and more competitive, robust economy.
Finally, the literature highlights the recognition that measurement is becoming lessabout precision and more about increasing the overall understanding of programcontribution in comparison to intended outcomes. Also as highlighted throughout thispaper, is the need to consider the broader array of factors at play that could contributeadditional data and information with respect to poverty reduction initiatives. Lastly,the literature bespeaks of the need to keep an open mind when developing alternativemethodologies – such an approach will provide a more credible demonstration ofprogram impacts.
References
Behn, R.D. (2000), “Different purposes require different measures”, paper presented to theAssociation for Public Policy Analysis and Management, Seattle, OR, November 2-4.
Behn, R.D. (2003), “Why measure performance? Different purposes require different measures”,Public Administration Review, Vol. 63, pp. 586-606.
Commonwealth of Australia (2001), Performance Management in the Australian Public Service:A Strategic Framework, Commonwealth of Australia, Canberra.
Dwyer, R.J. (2004), “Utilizing points of differentiation to enhance competitiveness and growth –some thoughts for consideration”, Performance Measurement and Metrics, Vol. 5 No. 2,pp. 66-71.
Eccles, R.G. and Pyburn, P.J. (1992), “Creating a comprehensive system to measure performance”,Management Accounting, Vol. 74 No. 4, pp. 41-4.
Edwards, P.E., Neely, A., Martinez, V. and Pidd, M. (2006), “Multiple perspectives of performancemeasurement and management systems”, Symposium organized at The Academy ofManagement Annual Meeting, Atlanta, GA.
Grenier, J.M. (1996), “Positioning performance measurement for the twenty-first century”, inHalachmi, A. and Bouckaert, G. (Eds), Organizational Performance and Measurement inPublic Sector, Quorum Books, Westport, CT, pp. 11-50.
Hardy, C. (1985), The Management of Organizational Closure, Gower Publishing, Aldershot.
Hendricks, M. (1996), “Performance monitoring: how to measure effectively the results of ourefforts” paper presented at the American Evaluation Association Annual Conference,Atlanta, GA.
Alleviatingpoverty
1355

International Institute for Sustainable Development (2005), “Sustainable development indicators:proposals for the way forward”, available at: www.iisd.org/pdf/2005/measure_indicators_sd_way_forward.pdf
Ittner, C.D. and Larcker, D.F. (1998), “Innovations in performance measurement: trends andresearch implications”, Journal of Management Accounting Research, Vol. 10, pp. 205-38.
Japan International Cooperation Agency (2004), “JICA guideline for project evaluation: practicalmethods for project evaluation”, available at: www.jica.go.jp/english/evaluation/guides/pdf/guideline01-01.pdf
Johnston, R. and Fitzgerald, L. (2001), “Performance measurement: flying in the face of fashion”,International Journal of Business Performance Management, Vol. 3 Nos 2/4, pp. 181-90.
Kaplan, R.S. and Norton, D.P. (1992), “The balanced scorecard: measures that driveperformance”, Harvard Business Review, Vol. 83, pp. 71-9.
Malina, M.A. and Selto, F.M. (2004), “Choice and change of measures in performancemeasurement models”, working paper, June, Naval Postgraduate School, Monterey, CAand University of Colorado, Boulder, CO.
Manzoni, J.F. (2002), “The need for a new high performance management control paradigm”, inEpstein, M.J. and Manzoni, J.F. (Eds), Performance Measurement and ManagementControl: A Compendium of Research, Elsevier Science, Barking.
Marshall, M., Wray, L., Epstein, P. and Grifel, S. (2004), “21st century community focus: betterresults by linking citizens, government, and performance measurement”, available at:www.iog.ca/policity/CP/Public%20Library/library_reference_21st.html (accessed October2004).
Martinez, V. (2005), “What is the value of using performance management systems?”,Perspectives on Performance, Vol. 4 No. 2, pp. 16-18.
Mayne, J. (2001), “Addressing attribution through contribution analysis: using performancemeasures sensibly”, The Canadian Journal of Program Evaluation, Vol. 16 No. 1, pp. 1-24.
Mercer, J. (2003), “Cascade performance budgeting: a guide to an effective system for integratingbudget and performance information and for linking long-term goals to day-to-dayactivities”, available at: www.John-Mercer.com/library/cascade_pb.pdf
Mitchell, R.K., Bradley, R.A. and Wood, D.J. (1997), “Toward a theory of stakeholderidentification and salience: defining the principle of who and what really counts”, Academyof Management Review, Vol. 22 No. 4, pp. 853-86.
Moullin, M. (2005), “Defining PM – the debate continues”, Perspectives on Performance, Vol. 4No. 1, p. 13.
Neely, A. (2005), “Defining performance measurement: adding to the debate”, Perspectives onPerformance, Vol. 4 No. 2, pp. 14-15.
O’Dwyer, B. (2004), “Stakeholder democracy: challenges and contributions from accountancy”,No. 18-2004 ICCSR Research Paper Series, International Centre for Corporate SocialResponsibility, University of Nottingham, Nottingham.
OECD (2005), “Modernising government: the way forward”, OECD, Paris, Chapters 2-3, availableat: www.oecdbookshop.org
Office of the Auditor General of Canada (1997), “Moving toward managing for results”, Chapter11 in Annual Report of the Auditor General of Canada to the House of Commons, availableat: www.oagbvg.gc.ca
Office of the Auditor General of Canada (2000), “Implementing results-based management:lessons from the literature”, available at: www.oag-bvg.gc.ca
MD45,8
1356

Office of the Auditor General of Canada (2003), “Reporting on outcomes: setting performanceexpectations and telling performance stories”, OAG Discussion Paper, available at: www.oag-bvg.gc.ca/domino/other.nsf’html/200305dpl_e.html/$file/200305dpl_e.pdf
Overseas Development Institute (2006), “A corporate social responsibility (CSR) diagnosismodule for application in value chain analysis (VCA)”, available at: www.odi.org.uk/PPPG/activities/country_level/odpci/csr/ODI-FIAS_CSRDiagnosisModuleforValueChainAnalysis_web.pdf
Radelet, S. (2001), “Regional integration and cooperation in Sub-Saharan Africa: are formal tradeagreements the right strategy?”, Journal of African Finance and Economic Development,Vol. 4 No. 1.
Rightmer, J. and Jeney, L.A. (2002), Four Building Blocks for Success in the Customer Economy,Avaya Communications, New York, NY.
Royal Statistical Society (2003), “Performance indicators: good, bad and ugly”, available at:www.rss.org.uk
Schacter, M. (2002), What Will Be: The Challenge of Applying Results-based Thinking to Policy,Institute on Governance, Ottawa.
Sexty, R. (2002), “Approaches to understanding stakeholder relations” (accessed throughAthabasca University BSES 604 Digital Reading Room, August 22, 2006).
Thomas, P. (2004), Performance Measurement, Reporting and Accountability: Recent Trends andFuture Directions, The Saskatchewan Institute of Public Policy, Public Policy Paper 23,Saskatchewan.
Treasury Board of Canada (1998), “Alternative service delivery, citizen- centred service and thepartnership option”, Ottawa, available at: www.tbs-sct.gc.ca
Treasury Board of Canada (2000), “A comparative analysis of governments’ performancemeasurement strategies”, Ottawa, available at: www.tbssct.gc.ca/rma/communic/prr2000/coman_e.asp
Treasury Board of Canada (2001), “Guidelines for preparing departmental performance reports2001-2002”, Ottawa, available at: www.tbs-sct.gc.ca/rma/dpr/01-02/Guidance/glld_e.asp
Treasury Board of Canada (2002), “Linking resources to results: inter-jurisdictional researchstudy findings”, Ottawa, available at: www.tbs-sct.gc.ca/rma/account/r2r/r2r-01_e.asp
USAID (2004), Measuring the Performance of Wquity-Share Schemes in South Africa: A Focus onFinancial Criteria, available at http://pdf.usaid.gov/pdf_docs/PNADE747.pdf
Wholey, J.S. (1983), Evaluation and Effective Public Management, Little, Brown, Boston, MA.
World Bank (1999), The World Development Report 1998/99: Knowledge for Development,Oxford University Press for the World Bank, New York, NY.
World Resource Institute (2005), “Diverging paths: what future for export credit agencies indeveloping finance”, available at: http://pdf.wri.org/iffe_eca.pdf
Further reading
Carpenter, V. and Feroz, E. (1992), “GAAP as a symbol of legitimacy: New York State’s decisionto adopt generally accepted accounting principles”, Accounting, Organizations and Society,Vol. 17, pp. 613-43.
Carter, N., Klein, R. and Day, P. (1992), How Organisations Measure Success: The Use OfPerformance Indicators in Government, Routledge, London.
Alleviatingpoverty
1357

de Waal, A.A. and Counet, H. (2006), “Lessons learned from the balanced scorecard”, in Neely, A.,Kennerley, M. and Walters, A. (Eds), Performance Measurement and Management: Publicand Private, Cranfield School of Management, Cranfield, pp. 211-8.
Hatry, H. (1997), “We need a new concept of accountability”, The Public Manager, Vol. 26 No. 3,pp. 37-8.
Hood, C., James, O., Jones, G., Scott, C. and Travers, T. (1998), “Regulation inside government:where new public management meets the audit explosion”, Public Money andManagement, Vol. 18 No. 2, pp. 61-8.
Kaplan, R.S. (1983), “Measuring manufacturing performance: a new challenge for managerialaccounting research”, The Accounting Review, Vol. 58, pp. 686-705.
Kaplan, R.S. and Norton, D.P. (2004), Strategy Maps: Converting Intangible Assets into TangibleOutcomes, Harvard Business School Press, Boston, MA.
Marr, B. (2006), Strategic Performance Management: Leveraging and Measuring Your IntangibleValue Drivers, Elsevier, Oxford.
Martinez, V. and Kennerley, M. (2005), “Performance measurement systems: mix effects”,in EURAM 2005, Responsible Management in an Uncertain World, 5th AnnualInternational Conference Proceedings, TUM Business School, Munich.
Moullin, M. (2003), “Defining performance measurement”, Perspectives on Performance, Vol. 2No. 12, p. 3.
Pollitt, C. and Bouckaert, G. (2004), Public Management Reform: A Comparative Analysis,2nd ed., Oxford University Press, Oxford.
Power, M. (1997), The Audit Society: Rituals of Verification, Oxford University Press, Oxford.
Pratt, D. (2005), “A comment on the debate between Max Moullin and Fabrizio Bocci”,Perspectives on Performance, Vol. 4 No. 2.
Smith, P. (1995), “On the unintended consequences of publishing performance data in the publicsector”, International Journal of Public Administration, Vol. 18, pp. 277-310.
Yin, R.K. (1994), Case Study Research, Sage Publications, Beverly Hills, CA.
Zeppou, M. and Sotirakou, T. (2002), “The stair model: a comprehensive approach for managingand measuring government performance in the post-modern era”, in Neely, A., Walters, A.and Austin, R. (Eds), Performance Measurement and Management: Research and Action,Cranfield School of Management, Cranfield.
Corresponding authorRocky J. Dwyer can be contacted at: [email protected]
MD45,8
1358
To purchase reprints of this article please e-mail: [email protected] visit our web site for further details: www.emeraldinsight.com/reprints

The elephant in the room: genderand export-led poverty reduction
Astrid Ruiz ThierryWomen in World Markets Ltd, Madrid, Spain
Abstract
Purpose – The purpose of this paper is to explore the theoretical underpinnings and practicalimplications of gender-sensitizing trade strategies aimed at export-led poverty reduction, wherecapitalizing on market-oriented structures and optimizing existing resources become the drivers formaking trade work efficiently and equitably.
Design/methodology/approach – The paper is based on an in-depth literature review and theauthor’s own practical experience as an international business consultant specialized in helping publicinstitutions, corporations and non-profit organizations to integrate a gender perspective into theirplanning and decision making processes, strategies, programs, and projects.
Findings – The paper concludes that the existing gender gap in trade strategy formulation indirectlyhinders trade performance and that pro-poor trade strategies require more inclusive decision makingprocesses and the use of gender impact assessments.
Research limitations/implications – Further research into the links between CSR, gendersensitivity and value chain analysis is needed to explore the potential of specific engagement betweencorporations and women-led MSEs.
Practical implications – The paper proposes that policy and strategy makers can produce morecoherent and effective programs by capitalizing on existing market structures and women’sentrepreneurial drive, incipient integration into the export value chain, and MSE networks andclusters.
Originality/value – The paper provides a response to how export-led poverty reduction strategiescan systematically maximize market opportunities and, at the same time minimize the risks inherent toimplementing counter-mainstream actions and decisions aimed at creating gendered value-enhancedmarket opportunities.
Keywords Gender, Trade, Exports, Poverty, Value chain, Entrepreneurialism
Paper type General review
IntroductionThe ultimate purpose of trade is to increase the general well-being of nations and theircitizens through a more efficient employment of the world’s productive forces, so as topromote healthy and equitable growth. Yet, approximately 50 per cent of the world’spopulation lives below the poverty threshold, of whom 70 per cent are women. Thissituation belies the aims of our international trade system.
Nevertheless, there seems to be a generalized belief among today’s policy makersthat because trade issues form part of the economic realm, they are subject toirrefutable natural laws comparable to physical laws (Soros, 1999). This belief isobviously false, and decisions and structures based on it further and dangerouslywiden the gap between the expectations and the results of any poverty reductionstrategy based on trade. But regardless of whether policymakers are truly interested ornot in reducing the poverty of others and promoting their economic development, thebottom line is that if policy makers don’t start looking at things from an inclusiveparadigm, the wealthy will begin losing their wealth and possibly even their
The current issue and full text archive of this journal is available at
www.emeraldinsight.com/0025-1747.htm
The elephant inthe room
1359
Management DecisionVol. 45 No. 8, 2007
pp. 1359-1378q Emerald Group Publishing Limited
0025-1747DOI 10.1108/00251740710819087

livelihoods. So the key question is not what should we trade, but rather how should wetrade.
The main challenge facing trade policy makers is how to promote gender-sensitiveexport-led strategies to reduce poverty in a way that is viable economically andpolitically and at the same time inclusive and fair. Until now, export-led growth hasbeen based on the comparative advantage of women as available, cheap, flexiblelabour. The result has been an explosive cocktail of inequality that has convertedgender-insensitivity into an artificial barrier that produces infra-trade and impedespoverty reduction. Not disarming it can have serious political and economicconsequences.
If trade is to constructively contribute to poverty reduction, policy makers cannotcontinue ignoring that women are the world’s most over-utilized resource andunder-valued asset. We must find ways to use exports as a tool for growing healthybi-lateral and multilateral win-win advantages through strategies that deliver growthnot just to the economic system at large, but also to its citizens and especially women.They are today’s principal agents for growth and development. This suggests the needto acknowledge gendered resource constraints and dedicate urgent attention tostrengthening women’s capacity to participate fully in the global economy.
The question is: how can export-led poverty reduction strategies systematicallymaximize market opportunities and at the same time minimize the risks inherent toimplementing counter-mainstream actions and decisions aimed at creating genderedvalue-enhanced market opportunities? Although no magical solution, we proposestrategists and decision makers realistically begin to reverse the downward slide intopoverty by capitalizing on market-oriented structures that are already in place andoptimising already available resources.
In the deep endIf trade exists to promote development, as mainstream policy economics argues, then“given the massive increase in global trade over the last 25 years, the global economyought to have experienced accelerated growth. Instead, global economic growth hasactually slowed relative to the prior quarter-century” (Palley, 2006a). Indeed, as thesystem of rules and agreements that currently governs the international trade map isstill largely guided by measures of development based purely on market criteria, itcontinues to ignore human well-being and the excluded majority – poor women. Thecommon buzzwords – power, empowerment, and equality – have been ignored for solong by mainstream economists and trade policy makers that today they have becomecentral slogans and warrant careful attention when assessing trade policies andperformance.
If trade is to be used as a tool, rather than a cause, for growing healthy sustainable,reciprocal commercial flows that build bi-lateral and multilateral advantages, ratherthan just one-sided advantages, policy makers need to recognize that whilegrowth-through trade is important for poverty reduction, trade alone is not enough.For trade to work in favour of poverty reduction, it is necessary to promote women’smarket participation in trade flows from a win-win perspective, to empower them aslegitimate economic actors and to strengthen their entrepreneurial role in domesticmarkets as a building block for promoting national development (Bessis, 2005).
MD45,8
1360

This requires economists and politicians to think beyond the safe mathematicalapproaches they are accustomed to and complicate their existing cost-benefit paradigmby taking into account other economic parameters into account[1]. But, above all, itmeans: STOP ignoring the “elephant in the room” (Palley, 2006b). Psychologists referto this phenomenon as a condition where people talk about everything except the mostimportant issue. In trade discussions, the elephant is still sitting quietly in the roomsipping tea because policy makers have not yet paid sufficient attention to it as thecommon denominator in all economic and non-economic parameters used to designexport-led poverty reduction strategies: women.
This suggests there is a need to attend to the character of trade to ensure that it isinclusive and fair. Poverty is gendered, and any trade strategy aimed at povertyreduction needs to be sensitive to this. Urgent priority must, therefore, be given tostrengthening the capacity of developing countries to participate in the globaleconomy, while at the same time building women’s capacities worldwide to participatein local, regional, and global markets and have a voice in macroeconomic policymaking processes.
No one can ignore the fact that women’s work is today is central to world economicproduction and reproduction spheres nor that their labour has become the basis for thetype of market-based and private-sector driven growth that multilateral tradeagreements seek to promote:
. women produce more than 50 per cent of the food grown worldwide (FAO)[2];
. women’s labour is the main, if not only source, of income for more than 30 percent of households in the world (ILO)[3];
. women account for over 80 per cent of family and community care givingservices or what is referred to as unpaid labour; if the value of this unpaid workcounted, global output would be almost 50 per cent greater (ILO); and
. as an economic actor, women are significant producers, consumers and investorswhose decisions have a compound economic impact.
These brief statistics underline one key missing dimension in today’s trade map:gender[4]. It is an essential factor for devising any and all types of trade strategiesaiming at poverty reduction. The stakes of having a clear strategic internationalgender-sensitive trade map are higher than ever, for instead of improving theconditions of life and work for all, trade, today, is simply eliminating the leastcompetitive players: poor women. Their continued exclusion can generate a very graveand unsustainable situation of global poverty. Governments and institutions must findways of growing and building advantages for women in international trade from awin-win perspective, rather than just eliminating disadvantages and talking aboutwomen as a special “focus group”. This is not only a strategic imperative, it is commonsense.
Looking over the edgePro-poor trade development strategies require more inclusive decision makingprocesses, as well as carrying out continuing gender impact assessments whendesigning, implementing and monitoring policies. It is especially important to diagnosethe gender intensity of production through the differences in the potential impact that
The elephant inthe room
1361

trade expansion has on men and women, and specifically with regards to employment,wages, job security, mobility, and entrepreneurship.
This suggests the need to design operational strategies that necessarilyacknowledge gendered resource constraints and address the issue of empowering[5]women as fully recognized and legitimate actors. Although the trade liberalizationprocess has indisputably generated more employment[6], empirical evidence showsthat the productive feminine advantage has, to a great extent, been built on genderinequalities to boost the competitiveness of total exports. The structure of labourmarkets and global production chains are so highly gendered and based on persistenthorizontal and vertical occupational segregation by sex, as well as low salaries, thatwomen are pushed into the less paid and unskilled jobs in labour intensive sectors andleft out of the decision-making processes that affect their and their family’s livelihood.
If we take into account that an increasing number of families depend on women’sincome, it becomes evident that export-led growth may have been good for the tradesystem, but women have been its main victims: in order to protect themselves and theirfamilies from the negative impacts of our current predator style of trade liberalization,many have taken advantage of jobs in intensive exporting sectors in order to eke out aliving, . . .only to discover the vicious Catch-22 situation that our present model ofexport-led growth has in store for them down the road: poor if you don’t, poor if youdo[7].
What we discover is that more and more women are ending up in a dead end,looking over the deep end: feminization of poverty as a direct consequence of theirunequal access to economic opportunities and consequent emigration in order to earn asalary with which they can maintain the family. The underlying reality is that theentire economy of many developing countries is faced with the same dead end cliffhanger: productivity and growth rates affect trade performance, which weakenswomen’s position as economic actors, which in turn constrains their economy’s outputresponse and thus its export capacity (Catagay, 2000).
The key question is: how can export strategies contribute to reducing poverty bycreating a lasting balance between trade liberalization on one hand, and the need forinclusive development on the other hand? Through gender-sensitive strategy-makingthat emphasizes the need to strengthen domestic markets through local development,promote women’s entrepreneurship capacity, integrate women-led MSEs into theexport value chain, and foster the creation of women-led MSE clusters and networks.The underlying premise to our proposal is that international trade structures are not agiven, but rather a result of specific choices, and that the actors involved in trade canreconstruct them through their voluntarily coordinated actions. Obviously, allstrategies have risks. But can we afford not to take them? After all, equal trade beginswith equal and fair treatment of men and women.
Common sense export-led poverty reduction designStrategy makers today still largely consider the linkages between gender equality andcommerce neither direct nor strong enough to justify a gender-sensitive approach tostrategy design. The result is that export strategies neglect gender issues. This is aserious oversight. It leads to the exclusion of strategic options for designing actionsthat can effectively improve national competitiveness and export performance. The
MD45,8
1362

final result of ignoring the gender gap is that it indirectly hinders trade performance(see Figure 1).
The framework: designing gender-sensitive trade strategiesIf strategy and policy makers want to contribute to breaking the poverty cycle, theyneed to develop their gender sensitivity, a term used here to define the situation of anorganization whose right hand coordinates thinking and its left hand, action. Thestrategic imperative here is to develop and apply the gender analysis approach[8] toaddress the causes of poverty and use a holistic, multiple-level economic perspectivefocused on bottom-up capacity-building. The question is not “Should the genderdimension be considered in trade policy making?” but “How can trade policies andstrategies be gendered?”.
Developing gender sensitivity requires two capabilities: awareness of the need forchange and ability to change successfully (Langdon and Andrew, 1997). Today’s“compassionate” trade agenda continues focusing exclusively on external competitive
Figure 1.Common sense export-ledpoverty reduction design
The elephant inthe room
1363

factors, while ignoring the relevance gender issues have for export development andcompetitiveness. International trade organizations must begin gender mainstreaming(GM)[9]: taking into accounting the differences in the conditions, situations and needsof men and women during the planning stage and systematically assessing thepossible effects that policies can have on gender differences. This means that, beyondpaying lip service to the generally recognized barriers that impede women’s successfulintegration into global trade dynamics, they need to acknowledge the invisible andsilenced barriers that are unique to women and seriously limit the full realization oftheir abilities as producers and potential trade partners (see Table I).
Unless both types of barriers are reduced, there is simply no way women anywhere,but especially so in the more disadvantaged countries, can increase their capacity toexport traditional or non-traditional products and generate enough wealth to reinvestpart of it in order to grow their business activity beyond subsistence.
However, acknowledging gender does not imply developing an approachexclusively focused on women. The main problem with many gendermainstreaming efforts is that they focus on women as a subject of change in anattempt to adjust women to the status quo, instead of transforming the status quo tomake it more gender equal. Engendering trade strategies means much more than theuntil now “add gender and stir” formula. It means weaving a gender perspective intothe trade fabric made of policy-making feasibility, accountability and triple bottom-linecost accounting (finance, environment, people), such that gender considerationsbecome a natural aspect of decision-making processes from beginning to end. The goalis to empower women by practicing bottom-up capacity-building to help womenovercome their invisibility and put them on the path to self-sufficiency.
The building blocks: optimising existing resourcesAwareness and successful change are, thus, the key ingredients for producingcoherently designed programs that specifically recognize and address genderdifferences in market conditions. As a whole, they should be aimed at capitalizing onfour factors:
1. Existing market structures. An economy is not an abstraction. Any intention tosuccessfully promote development and growth must be based on the real economy ofeach nation and region, in order to successfully combine the opportunities offered byglobal and regional[10] markets with strategies for gender-sensitive domesticinvestment, institution building, and domestic entrepreneurship. The ultimate goal isto strengthen domestic markets by creating local development synergies.
This means recognizing the “popular” or “informal” economy[11] as a dynamicdevelopment hub. Between 50 per cent and 70 per cent of the active population in LDCseke out their survival in the informal economy, which represents over 60 per cent offeminine employment outside of agriculture – far more if agriculture is included(UNIFEM, 2005). Despite its “invisibility”, which impedes the “legal” inclusion of thepoor in the fabric of the world economy, it is the main building block for strengtheningdomestic markets and constitutes a window of opportunity for export-led trade tomake a constructive contribution to poverty reduction, so that given the rightconditions to be accepted as a valid market space, it can become a springboard forintegrating women into the global economy.
MD45,8
1364

Economists and politicians can object that supporting the “informal” economy meansreproducing underdevelopment and poverty. But it’s time to start thinking outside thebox so that this forceful and yet invisible local energy can be integrated into the formalmarket system. The poor need real opportunities.
This is not primarily a question of legal and regulatory frameworks. It’s, above all, aquestion of empowering women as autonomous economic agents, so they can build
Generally recognized barriers (typicalconstraints: financial, social, andinformational) Invisible and silenced barriers (unique to women)
Non-tariff barriers: human resourcecapacity, access to finance, access toknowledgeAccess to information (markets,legislation, and standards to berespected in order to gain access tospecific export markets)Compliance with certification standardsAccess to business support services andnetworksCultural and social discrimination.Throughout the world, women are stillconsidered second-class citizensPoor and inefficient storage, transport,and marketing mechanisms in ruralareas reduces profit margins. (75 percent of the world’s poor live and womenaccount for 60 per cent-80 per cent of theagricultural workforce)Lack of access to decision-makingprocesses and exclusion fromnegotiating processes with respect touse and exchange of resources
Lack of time and excessive workloadIn general women’s burden averages 20 per cent more thanthat of men and more so in rural areas. This constitutes aconsiderable constraint, in terms of time, mobility andenergyLack of securityIt is not uncommon for women to suffer sexual harassmentor violence on the isolated roads and paths they have to taketo go from one village to the next, or at border trade pointsInvisibility of women’s workIn both rich and poor countries, it is largely unaccounted,unrecognised, and undervalued, and yet over-utilized as aneconomic resource. As micro-entrepreneurs, they are largelyignored in policy discussion, because their activity pertainsmainly to the informal economyInternational trade organizations’ strategic driftThis is a phrase that describes the slow but sure movementof the world away from the position for which today’sinternational policy making organizations were prepared.The biggest change for which international tradeorganizations were not prepared for is gendermainstreaming (GM), which in practical terms means takinginto accounting the differences in the conditions, situationsand needs of men and women during the planning stage andsystematically examining measures and policies to assessthe possible effects that policies can have on genderdifferencesEntrenched beliefs and policy-making habitsThe international trade map needs to take into account notonly market criteria, but also human well-being and othernon-monetary values inherent to economic development,such as power, empowerment, and equalityStrategy makers’ lack of imaginationStrategy makers today still largely consider the linkagesbetween gender equality and commerce neither direct norstrong enough to justify a gender-sensitive approach tostrategy design. As a result, export strategies neglect genderissues. This is a serious oversight, because it leads to theexclusion of options that strategy makers need to identify ifthey want to design actions for improving nationalcompetitiveness and export performance Table I.
The elephant inthe room
1365

their comparative advantage by maneuvering a market space borne out of thesynergies obtained from the interaction between the formal and informal economiesand, as a result, effectively engage in trade through export opportunities.
The tragedy of poor women is that they want to participate in the world economywithout getting lost in a world that essentially ignores them[12]. One of the goals ofgendering export-led poverty reduction should, therefore, be to support efforts tostrengthen domestic markets as an entry point for women’s participation in globaltrade dynamics. It is what UNIDO calls a “bottom-up growth strategy”: transformingand diversifying micro and small-scale enterprises into growth-oriented activities andincreasing women’s participation in the mainstream economy, by creating businessopportunities that arise from local market and entrepreneurial capabilities, not externalintervention. The goal is not to base the economy’s success on exports, but to ensurethat exports adequately complement the development and growth of the domesticmarket.
The conclusion to be drawn here is that if trade policy is to be friendly to povertyreduction and human development, it must embrace and encourage diversity indevelopment-through-trade strategies by providing gender-sensitive tradedevelopment programs; their resulting multiplier effects will help prepare thedomestic economy for equality-based engagement with the international economy.
2. Women’s entrepreneurship. “Women participate in international trade not only asworkers, but also as entrepreneurs who make a valuable contribution to increasingexport capacity of their countries” (Tran-Nguyen, 2004a). In the MSE sector worldwide,women make up between one-quarter to one-third of the total business population(UNIDO, 2003). Women’s entrepreneurship is, in fact, a principal push factor behindlocal, informal trade and one of the principal motors for innovation, competitiveness,and growth[13]. It is, therefore, one of the most important tools for increasing theiraccess to and control over income and working conditions and strengthening theirnegotiating power as economic agents. In other words, not only is small beautiful, butput trade and women’s entrepreneurship together, and you have a powerful force thatcontributes to world economic growth, development, and prosperity.
Prahalad (2005) has forcefully argued that the “bottom of the pyramid”, the world’spoorest, is one of the fastest growing new markets, with immense entrepreneurialcapabilities and buying power. We contend that not only do the poor represent a viableconsumer market; they also represent a significant export power that must be unlockedby tapping into the greatest trapped resource: women. They are the driver behind abottom-push trickle-up development. However, very few women-led businesses havethe capacities to respond to the emerging opportunities from the export sector becausethey don’t “formally” exist. It is, therefore, critically important to recognize women’slargely invisible self-employment capacity.
Micro-entrepreneurial activities are a natural result of the endogenous solidarityand social mechanisms that underlie the informal production system and serve as astructuring mechanism for the local market by joining economic activity to localsociety, something that the formal economy is unable to achieve. Women entrepreneursplay a key role in this synergetic relationship, for they are not “economicentrepreneurs” in the classical sense of the term nor is the aim of their activityexclusively profit. They deploy economic mechanisms in pursuit of communityreproduction and development through a wide array of non-market mechanisms:
MD45,8
1366

citizenship, ethics, culture, identity, membership, resources, cooperation, partnerships,etc. This constitutes what we could call a social-relational type of economic activitythat is characteristic of women’s growing contribution to their national economies andto poverty alleviation.
The potential behind this latent impetus is immense; but, it cannot mature if womenare not granted a legitimately recognized and “authorized” position on the worldeconomic stage. The role of international trade organizations and partners is to helpunstructure women’s biggest barrier: strategy makers’ lack of imagination fortranslating global thinking into effective gender-sensitive local action. They must stopviewing women as a means to other ends or women’s MSE development as a convenientlow-cost, self-help strategy that can be used to side-step policy making for redistributingwealth between and within countries. Gender is not an add-on; it is a basic factor forsuccess, and successful approaches can only be built on a “clear understanding of therole of local women producers and workers in trade, and more specifically, of theirexisting and potential contributions to export earnings” (Randriamaro, 2006).
Constructive integration of women entrepreneurs into the export value chain. Theimportance of value chain analysis for MSE development cannot be overemphasized asan approach for export-led poverty reduction strategy making and application. Thevalue delivery system is a framework that can serve to define and manage theexchange relationship between an entrepreneur or a business and the market.However, there is little research on how opportunities in the value chain can becaptured for strengthening the participation of women-led MSEs[14].
The way forward is to apply gender mainstreaming tools in the sectors in whichlocal women-led MSEs specialize and then ask how the global market for productsfrom these sectors is organized. These markets are not free-for-all open spaces. Theyare coordinated by global buyers who source different parts and services from aroundthe world and involve increasing functional integration between internationallydispersed activities that require corporations to create partnerships with local supplies.The value chain, after all, is a two-way street.
Public and institutional private sector partnerships are central to identifyingleverage points and ways to intervene, in order to strengthen women’s position inthem. But there is potential for much greater, specific engagement betweencorporations[15] and small women-led companies, as a result of the changing natureof the value chain and the growing importance of CSR as a factor in that value chain.The increasing globalization of commerce is leading many corporations to produce,source or distribute from developing nations, which more often than not involvesworking with local partners and MSEs as part of their value chain.
However, the latter’s capability gap to fully meet the requirements of large firmslimits the ability of local MSEs to effectively engage with corporations. This is perhapsthe greatest challenge that women-led MSEs face in order to integrate their activity in thesupply chain with a clear added value and, thus, link more effectively with opportunitiesin the global economy. This is where partnerships with small enterprises becomevaluable as a strategic entry point for converting informal women-led MSE activity intoa formally recognized one, with clear commercial and CSR benefits for the corporation.
It would, therefore, seem that the convergence of a corporation’s CSR andcommercial supply chain/distribution agendas provides a clear building block forsupporting women-led MSE development as a formally recognized local and global
The elephant inthe room
1367

economic actor. The main challenge that strategic planners face here is how to developa gender-sensitive value chain approach, in order to help local enterprises find a nichein global value chains coordinated by foreign enterprises and provide support for localenterprises, so they can produce and market their own product overseas. This requiresbridging the gap for women between the so-called more modern economy and theinformal sector.
4. Build women’s MSE networks and clusters. Networking is a major ingredient inthe recipe for successful gendered, export-led, poverty reduction strategies, because itis one of the key mechanisms for providing access to information, new customers, andsuppliers. In fact, developing networks and systems of information exchange may bemore important than skills training, because they will result in more mobilizationpotential (Kantor, 2001), provide an advocacy channel for women workers and womenin business, and create and promote women entrepreneurial role models. They are alsoa key resource for reducing women’s marginalization and exclusion from formaleconomic structures: they bring women entrepreneurs out of their isolation and intolarger networks and groups of MSE owners or suppliers of goods and services,strengthening their participation and integration in export trade flows and promotingtheir autonomy.
The specific goal of supporting women exporter networks is to optimize the smallcomparative advantages that a group of exporters can obtain through networking andhelp women entrepreneurs create export clusters with enough critical mass to provideaccess to the same opportunities that big exporters have in terms of obtaining capital,resources, information, and technology. This is essential if women are to build acompetitive advantage based on the product or service being offered, and not onlocation and low costs.
Clusters represent a new form of intermediate spatial organization to link marketsand actors at all levels and are an alternative way to integrate the informal sector intothe value chain. In the context of poverty alleviation and as a support to networking,the cluster approach for exporting women entrepreneurs can help increase theirbargaining and market power and foster healthy competition, as well as cooperation.
Clustering and networking matter, especially in developing countries, because theyhelp small businesses raise their competitiveness. By helping them attain a competitiveadvantage and overcome obstacles in accessing inputs and product markets, they candevelop collective efficiency[16] through economies of scale and scope. The centralargument behind networks and clusters is that participating enterprises “can overcomeobstacles and conquer markets beyond their individual reach and that externalassistance plays an important role in facilitating cooperation” (Deloitte Report, 2004).But, if clustering and networking are to be a viable tool for strengthening women-ledMSEs and integrating them into the global value chain, it is absolutely necessary tofirst apply a gender analysis to existing cases and draw on the insights gained in orderto define a gender-sensitive approach to promoting networks and clusters for tradepurposes, especially export-led trade.
How do we define success?Talking about trade success is talking about economic success, which covers a wholerange of macroeconomic and social indicators analysed in terms of competitiveness. Inthe context of a global economy, this can only be achieved by taking into account the
MD45,8
1368

interdependence among economic players. That is, success is nothing if it is notsuccess for all.
Even if we agree that trade is a genuine locomotive for growth and development andthat exporting is a way to capture the gains it generates, we must recognize that ifthese gains are to be captured equitably by rich and poor, men and women, it isnecessary to break the existing discriminating dichotomy between dynamic and newtrade sectors and “power” trade dynamics; the trade map is highly gendered andhighly unequal.
UNCTAD defines dynamic and new sectors and products as those offering thegreatest opportunities for LDCs and other commodity-dependent economies forbreaking out of the poverty trap (Tran-Nguyen, 2004b). The top 40 include thefollowing areas in each sector:
. Manufacturing sector. Electronic and electrical goods, steel and relatedspecialties (such as automobiles, engines and parts), apparel, and chemicals.
. Commodities sector. Silk, cereal preparations and non-alcoholic beverages, fishand fisheries, and certain fruit and fruit preparations.
. Merchandise sector. Perfumery and cosmetics.
. Non-traditional sectors. Organic, non-wood forest, traditional-knowledge basedproducts, and renewable energy products and non-timber, non-agricultural andnatural products.
. Services sector. Outsourcing for data processing and call centers and tourism.
The problem is:. The labour force for most of the above is feminine, but ownership and
decision-making is male dominated.. LDCs are characterized by a polarized industrial system of a handful of large
enterprises -owned either by the state, foreign investors or a few rich local menentrepreneurs – and a large number of micro enterprises, mostly in the informalsector, of which an increasing number are women. Only a few have the capacityto capture the gains generated.
. Women are not involved in the policy and decision-making processes regardingthe design of specific actions aimed at ensuring development gains from tradenegotiations.
On the other hand, the “power-based” trade sectors – information technology,infrastructures (construction), traditional energy sources – either almost or totallyexclude women, or exploit them as cheap labourers.
This is, obviously, an oversimplification of the trade map, but it serves to show thatthe trade map which guides export trade potential is totally skewed in detriment ofwomen. It is necessary to develop an alternative map that can balance out women’sgreat and growing contribution to export trade and the limited benefits it providesthem with.
So, what are the key ingredients in a recipe for success?
(1) Treating gender as a cross-sectoral trade issue. Accounting for genderdimensions of international trade, development, and finance involves more than
The elephant inthe room
1369

simply looking at the impact of economic policies on women and formulatingappropriate safety nets. It requires understanding the conceptual tools behindgender analysis and how they can be used to derive a more gender-sensitiveapproach to trade policy operations and analysis (Evers, 2002).
(2) Integrating women’s non-paid work as a necessary factor in programformulation. Women’s overwork, lack of control over the fruits of their labourand lack of access to productive inputs can greatly inhibit their supply responsein the cash crop and other sectors.
(3) Including men in export-trade formula design. To improve women’s access tomarkets. Gender sensitivity does not mean targeting women only; it meansturning talk into action.
(4) Promoting equal opportunities for women’s entrepreneurship development. It isthe motor for sustainable economic growth and development.
(5) Last, a recipe for success requires that export programs promote equalopportunities in accessing market sectors.
Institutional implicationsAny attempt to reconfigure trade map dynamics from a gender equality perspective willcertainly not be successful unless it challenges sub-national, national, regional, andmultilateral formulation and decision-making. This has several institutional implications.
First and foremost, the multilateral trading system[17] may have adapted to thespecific needs and requirements of the global integration process and the specific valueshifts that have accompanied the process (Williams, 2002), but it has done so based ona deeply embedded assumption of gender neutrality and undifferentiated impact.Sensitizing export-led poverty reduction efforts, therefore, requires first developingand applying the gender analysis approach to strategy and policy design. Thisinvolves not only raising awareness of the need to change within the strategy-makingbodies about the relevance of the gender issue to export development andcompetitiveness and developing the ability to change successfully to convertknowledge gained into pre-emptive action. It also means:
. Applying diversity management techniques. To export strategy implementation.The organization must build its capacity to identify and value the differencesthat define its own human capital, as well as those that define the humanpotential in the countries where the strategy or policy will be implemented. Thisinvolves taking people into account on equal terms during the planning processand focusing not only on market access, but also paying attention to the socialand infrastructural needs of different stakeholders in the economy.
. Using systems thinking. To establish more cross-sectoral linkages of issues andadvocacy for women as economic agents. There is a real need for creativethinking so that strategy makers can put values and strategy ingredientstogether to design new ways forward. Systems thinking is one of the key toolsfor doing that, because it considers a problem from a multi-faceted perspective –structure, processes, culture, people – in order to identify real, instead ofassumed, causes[18].
MD45,8
1370
The second implication is that institutional decision-making processes need tospecifically focus on systemic and governance issues at the national and sub-nationallevels, with specific attention to negotiating teams, regional organization compositionand gender policy, and participation of women at the international/multilateral tradepolicy level and in areas of sectoral concern.
The main goal is to develop responsive national trade policies. This requirespromoting:
. Networking and advocacy with a broad cross-section range of civil societyinstitutions. Strategy makers must consult with women’s groups andcommunity-based organizations when designing programs and recommendingactions.
. Focusing on the particular dynamics of individual groups and sub-groups.Advocacy occurs at all levels (professional organizations, business groups andservice organizations, etc.). It is critically necessary to promote collectiveself-help efforts of small-scale women entrepreneurs[19].
. Greater inter-sectoral collaboration at the macro-level (groups of policy makers),but keeping in mind that working together means trying to ground efforts in thesub-national and micro-level realities and requires focusing on the particulardynamics of individual groups and sub-units (such as women and villages) andarticulating inter-sectoral collaboration at all levels, including the informalsector.
. Creating an enabling business regulatory environment, in which womenentrepreneurs can fulfil their initiatives for advancement[20].
Strategy-making groups, therefore, need to involve cross-institutional and multi-levelparticipation through partnership building[21] that includes a gender perspective fromthe beginning (i.e. choosing partners) and include women as equal members of thestrategy group’s negotiating teams, regional and plurilateral trade delegations, andresearch groups.
Conclusion: gender as a strategic imperative“Until very recently, when confronted with the grim reality of scarcity and disorder,western man tended to place his hopes in technological progress as a sure path toaffluence and stability. However, the increasing strains and stresses which now affectthe human condition have gradually compelled a drastic reassessment of man’s genderblind[22] faith in liberal trade as the means for economic growth and development”(Camilleri, 1976). Indeed, one of the most striking deficiencies of the variousdevelopment-through-trade models has been the tendency to overlook or dismiss thesignificance of gender. Yet it is the gender inequalities inherent to internationalproduction and trade structures and processes that are largely responsible for theperpetuation of poverty in the developing world and the increasing pockets of povertyin the developed world[23].
It is emblematic that the richest 20 per cent of the world consumes 86 per cent of theplanet’s natural resources, while 50 per cent of the world’s population lives in poverty.But what should be underlined is that this reality has a woman’s face; women representone half of the planet’s population, but account for 70 per cent of the 1.5 billion people
The elephant inthe room
1371

who live below the poverty threshold[24]. Facts like these lead to an inevitableconclusion: economy and trade policy and decision makers must either dedicatethemselves to transforming commerce to a restorative undertaking or march society tothe undertaker[25].
Commerce is, of course, an insufficient mechanism to significantly reduce therich-poor gap, but it certainly is an essential building block for contributing to povertyreduction. One of the greatest resources that trade must stop ignoring and strengthenis women: they are not only the primary cell for social transmission of values and halfthe world’s population, but also the motor behind change and development. As TheEconomist points out in its article: “A quick guide to women economic”: “Carve up theworld’s economic growth a different way and another surprising conclusion emerges:over the past decade or so, the increased employment of women in developedeconomies has contributed much more to global growth than China has” (TheEconomist, 2005). If trade is to contribute positively to poverty reduction, policymakers cannot continue ignoring the gender aspects involved in export-leddevelopment. Making better use of their skills and entrepreneurial drive is not just amatter of fairness; it simply makes good trade sense.
It’s time to recognize that women are an essential part of the economy, to embracethe potential they have to offer. Strategy makers need to put gender analysis at thecenter of strategy making processes and women’s empowerment at the heart ofpoverty reduction strategies. But if world markets are to work efficiently and fairly, itis necessary to remember that equality is more than an economic or even politicalphenomenon. It represents a state of mind and, as such, constitutes the power tool thatcan shape a better future for all. Equal trade begins with reconciling equal individualopportunity with global human opportunity, and this requires changing the verynature of comparative advantage: it is “now less a matter of the price of physicalresources and the cost of labour and more a function of unpriceable imagination,innovation, and time” (Harlan Cleveland, 1993) and gender equality.
The ultimate purpose of trade is not, or should not be, simply to strengthen anation’s economic position. Nor is it merely a system for exporting and importingcommodities and labour. The promise of international trade is to increase the generalwell-being of nations and their citizens through a more efficient employment of theworld’s productive forces so as to promote healthy and equitable growth.
It is not a question, as many would have it, of culture or values. It is not a question offinancial realism. It is a call for inclusive economics, socially conscious trade and futurefocused governance. Parapharasing Ricardo Lagos, ex-president of Chile and thePresident of the Club of Madrid: We cannot accept that inequalities, neither internal norexternal, be the basis of the future we are now building. Our responsibility is to listento what women and men throughout the world dream today, so that the pieces can allfall into place in a new coherent definition of development.
Notes
1. Such as: adequate supply of inputs to production at cost and productivity levels sufficient toincrease not only the product’s competitiveness in the international market but also sustainthe worker’s family beyond survival level; enabling institutional and domestic marketinfrastructures; and adequate social safety nets to safeguard the labour force against marketand price fluctuations.
MD45,8
1372

2. Because of the extent and nature of their roles in agriculture and food security, theircontribution to farming, forestry, and fishing is most likely underestimated, as manysurveys and censures account for only paid labour.
3. Women are, in fact, becoming the basis not only for their families’ survival, but also for theircountry’s economic survival. In El Salvador and Nicaragua, women account for 80 per centof economic activity. In India, more than 60 million households depend solely on women.Globally the proportion of households headed by women is 20-24 per cent. . .and growing.
4. Gender refers to socially constructed roles and behaviours of men and women. Genderrelations are characterized in all countries throughout the world by unequal power andnorms that determine an unequal distribution, in favour of men, of resources, work, decisionmaking, political power, and the entitlement of rights and obligations in both the private andpublic spheres.
5. The World Bank’s Empowerment Team defines empowerment “as increasing the capacity ofindividuals and groups to make choices and to transform these choices into desired actionsand outcomes”. It involves the interplay of two interrelated factors: agency and opportunitystructure. The former refers to an actor’s ability to make meaningful choices and the latter tothe aspects of the content within which actors operate. This goes hand-in-hand withensuring that the strategies designed also provide opportunities for poor people to contesttheir rights through normative changes that confer legitimacy to their claims.
6. Despite the massive integration of women into the world labour force since the mid 20thcentury, the presence of women in economic production is still largely invisible in themajority of the world’s countries. It is estimated that about two-thirds of women’s activitiesin developing countries are not even captured by the System of National Accounts (SNA),while in developed countries poverty is on the rise and has a feminine face. It is also wellknown that the export enclaves which depend mainly on women’s labour base theircompetitive advantage on the inherent wage gap behind the gender inequalities. First, thegrowing dependence in the developing world on capital-intensive production has, ratherthan increased employment opportunities, pushed more and more women working in theproduction lines into the informal economy. But, in addition, as export production structuresbecome more technologically advanced, they become higher-skilled, at which point womenare laid off and more men are employed at higher wages. To make matters worse, becausetrade openness leads to intensified competition and has budgetary repercussions fromcompliance to trade agreements, there is a growing tendency to limit public servicesavailable for health and education for the poor. Second, as traditional and semi-industrialrelations of production and exchange are inserted into or displaced by the global system ofproduction, many micro-entrepreneurs, the majority women, find it more and more difficultto gain access to capital and compete and bargain for wage workers and favourable terms oftrade in the sectors in which they work.
7. First, the growing dependence in the developing world on capital-intensive production has,rather than increased employment opportunities, pushed more and more women working inthe production lines into the informal economy. But, in addition, as export productionstructures become more technologically advanced, they become higher-skilled, at whichpoint women are laid off and more men are employed at higher wages. To make mattersworse, because trade openness leads to intensified competition and has budgetaryrepercussions from compliance to trade agreements, there is a growing tendency to limitpublic services available for health and education for the poor. Second, as traditional andsemi-industrial relations of production and exchange are inserted into or displaced by theglobal system of production, many micro-entrepreneurs, the majority women, find it moreand more difficult to gain access to capital and compete and bargain for wage workers andfavourable terms of trade in the sectors in which they work.
The elephant inthe room
1373

8. Gender-based analysis is a tool for explicitly taking into account gender in policy design andanalysis and assessing the generally masked or obscured differential impact that proposedor existing trade policies or programs have on women and men. As a process, genderanalysis is based on the fact that men and women participate in different ways in theeconomy and society and aims to identify the structures and processes that contribute toperpetuating the gender gap. It helps organize information such that strategy and policymakers can make informed recommendations based on real facts and not suppositions orpresumed ideas on the lives of men and women. The ultimate purpose of gender analysis isto assess whether the needs and priorities of women and men are included in the policy orprogram under consideration, if additional changes are required so that women canparticipate fully and benefit from it, and if it provides opportunities for reducing or avoidinggender inequalities.
9. As a concept, GM is a “new strategy for action designed to change structures of genderdiscrimination” that was popularized at the 4th World Conference of Women in Beijing in1995. It refers to “the reorganization, improvement, development and evaluation of alldecision-making processes, in the sense that all actors participating in this process follow theidea of equality in all general policies and at all levels” (Thege, 2002).
10. The multiplication in the number of regional trade blocks is one of the main factorscharacterizing international relations during the last decades. According to Maurice Schiffand Alan Winters, in their study entitled Integration Regionale et Developpement,commissioned by the World Bank, over one-third of total international trade is carried outwithin them. In principle, their objective is to reduce trade barriers among member countries,which implies discriminating against those who are not members, form an economic unionwith common executive, judiciary and legislative institutions, and stimulate investment.
11. According to the ILO definition this includes all forms of informal wage employment andinformal self-employment through the selling of one’s labour or of small quantities of goods.It has been commonly assumed that in developing countries, workers in the informaleconomy would be absorbed into the modern industrial economy as the benefits of economicgrowth trickled down. Instead, over the past two decades, the informal economy haspersisted and grown, in both developing and developed countries. But estimates show thatthe informal sector in developing countries employs between 30 per cent-70 per cent of thelabour force, a majority of whom are women. Poor people have been excluded from themainstream modern economy and in their attempts to work their way out of poverty theyhave been forced to invent an alternative one based on the logic of exchange andredistribution, rather than accumulation. Nevertheless, despite the fact that of the 1 billionpeople who live on less than $1 a day, roughly half – 550 million – are working, they simplydon’t earn enough to feed themselves and their families (Chen et al., 2005; UNIFEM, 2005).
12. Idea is adapted from Cohen (1997), Grasset (2004) (cited in Christian (2005)).
13. One of the most dynamic world economic changes in the last two decades is the explosion ofwomen-owned and operated business as employment generators: between one-quarter andone-third of the world’s businesses are owned by women. Throughout the developing world,approximately 100 million women are employed in labour-intensive industries, such asclothing manufacturing and food processing; the UN has estimated that women run 70 percent-80 per cent of small businesses.
14. Linda Mayoux is a consultant for WISE Development and outlines basic issues involved andsome key questions for gender analysis of value chains. Web site source: IDS Research:Globalization Value Chain Studies, available at: www.ids.ac.uk
15. A corporation refers to companies of a large-scale with a well-established internationalpresence.
MD45,8
1374

16. Collective efficiency is defined in the UNIDO programme as competitive advantage derivedfrom local external economies and joint action.
17. Here we refer not only the WTO, but also regional and plurilateral trade agreements, such asCotonou: trade and technical assistance agreement signed in 2000 between the EU, Africanstates, and Caribbean and Pacific States. It replaces the Lome Convention.
18. In this sense, please refer to The World Center for New Thinking, located in Malta andcreated by Dr Edward de Bono, an internationally renown specialist in creative thinkingapplied to organizational capacity building.
19. One interesting tool in this regard is the United Nations Industrial DevelopmentOrganization’s (UNIDO) Multipurpose Village Workshops (MVW) and their CommunityProduction Centers (CPCs).
20. UNIDO has many relevant recommendations in this respect.
21. Partnerships have become more important than ever in order to achieve equality in trade. Weunderstand a partnership to mean: “an interdependent relationship between people and/ororganizations in which they work together to achieve some mutual goals, and in which eachinvests resources and takes risks”. See Mariotti (2001).
22. Added by the author.
23. In the USA, for example, 13 per cent of the population lives in poverty; 57,2 per cent arewomen (Ohio University Extension Fact Sheet, Family and Consumer Sciences, available at:www.ohioonline.osu.edu). In Europe, poverty today affects 72 million citizens or 16 per centor the total European population (Bouquerel and de Malleray, 2006).
24. For example, according to a recent article in the Spanish newspaper El Paıs, in Latin America67.8 per cent of rural families headed by women live in extreme poverty, in comparison to 26per cent headed by men. In urban centers, the percentage is 43 per cent in comparison to 10per cent (El Pais, 22 May, 2006).
25. Phrase coined from Hawken(1993).
References
Bessis, S. (2005), Las emergencias del mundo: economıa, poder, alteridad, Ediciones Nobel, SA,Oviedo.
Bourquerel, S. and de Malleray, P.-A. (2006), Robert Schuman Foundation, cited inEuroActivi.com, “Analysis: Europe and poverty. What reality?”, available at: www.euractiv.com
Camilleri, J. (1976), Civilization in Crisis: Human Prospects in a Changing World, CambridgeUniversity Press, New York, NY.
Catagay, N. (2000), “Gender, poverty and trade”, background paper for the UNDP Report onTrade and Sustainable Human Development.
Chen, M., Venk, J., Lund, F., Heinz, J., Jhabvala, R. and Bonner, C. (2005), Progress of the World’sWomen 2005, UNIFEM, New York, NY.
Christian, S. (2005), Faire face a la pauvrete et a l’uniformisation mondialiste, L’Harmattan, Paris.
Cohen, D. (1997), Richesse du monde. Pauvretes des nations, Flammarion, Paris.
Deloitte Report (2004), “Partnerships for small enterprise development”, Deloitte Report,commissioned by UNIDO, p. 9.
(The) Economist (2005), “A quick guide to women economic“, The Economist, 15 April, .
The elephant inthe room
1375

Evers, B. (2002), “Gender, international trade and the trade policy review mechanism: conceptualreference points for UNCTAD”, Women Working Worldwide (WWWW).
Harlan Cleveland, R.S. (1993), Birth of a New World, Jossey-Bass, San Francisco, CA.
Hawken, P. (1993), The Ecology of Commerce. A Declaration of Sustainability, Harper Business,New York, NY.
Kantor, P. (2001), “Promoting women’s entrepreneurship development base done good practiceprogrammes: some experiences from the North to the South”, Seed paper No. 9, Series onWomen’s Entrepreneurship Development and Gender in Enterprises, ILO, Wedge.
Langdon, K. and Andrew, B. (1997), Creating a Market Sensitive Culture, Pitman Publishing,London.
Mariotti, J. (2001), Smart Things to Know about Partnerships, Capstone, Mankato, MN.
Palley, T.I. (2006a), “Thinking outside the box about trade, development, and poverty reduction”,a FPIF discussion paper, 18 January.
Palley, T.I. (2006b), “Export-led growth: the elephant in the room”, available at: www.thomaspalley.com
Prahalad, C.K. (2005), The Fortune at the Bottom of the Pyramid. Eradicating Poverty throughProfits, Wharton School Publishing, West Orange, NJ.
Randriamaro, Z. (2006), “Gender, trade liberalization and the multilateral trading system:towards and African perspective”, available at: www.gwafrica.org
Soros, G. (1999), La crisis del capitalismo global, Editorial Debate, Madrid.
Thege, B. (2002), “Gender mainstreaming in the EU”, Institute of Women Research and GenderStudies, University of Applied Sciences, Kiel.
Tran-Nguyen, A.-N. (2004a), “Trade and gender: opportunities and challenges”, WTO PublicSymposium, CBC and GWIT, 27 May.
Tran-Nguyen, A.-N. (2004b), Strengthening Participation of Developed Countries in Dynamic andNew Sectors of World Trade. Trends, Issues and Policies, TD/396, 17 May.
UNIDO (2003), A Path out of Poverty. Developing Rural and Women Entrepreneurship, UNIDO,Vienna.
UNIFEM (2005), Report Progress of the World’s Women 2005. Women, Work, and Poverty,UNIFEM, London.
Williams, M. (2002), “Gender and governance in the multilateral trading system: critical areas ofdecision-making and global responses”, paper presented at the GERA Mid-Term ReviewWorkshop, 25-29 November, Accra.
Further reading
Alsop, R. (Ed.) (2004), “Power, rights, and poverty: concepts and connections”, a working meetingsponsored by DFID and the World Bank, The International Bank for Reconstruction andDevelopment/The World Bank and the Department for International Development,23-24 March.
Campbell, B. (2004), Qu’allons-nous faire des pauvres?, L’Harmattan, Paris.
Centre Louis-Joseph Lebret (2003), Mondialisation et initiatives locales, Editions Karthala, Paris.
Chan Kim, W. and Manborgue, R. (2005), Blue Ocean Strategy. How to Create UncontestedMarket Space, Harvard Business School Press, Boston, MA.
Chua, A. (2003), A World on Fire. How Exporting Free Trade Democracy Breeds Ethnic Hatredand Global Instability, Anchor Books, New York, NY.
MD45,8
1376

Clones, J. (2003), “Gender and international trade in the context of pro-poor growth: a conceptpaper”, June.
Cordonnier, R. (1987), Femmes africaines et commerce. Les revendeuses de tissu de la ville de Lome(Togo), L’Harmattan, Paris.
Cordonnier, R. (2006), Croissance et developpement. Reperes internationaux, Cahiers d’economiede l’innovation No. 24, L’Harmattan, Paris.
DeVillota, P. (1999), Globalizacion y genero, Editorial Sıntesis, Madrid.
Delaney, L. (2002), “Women entrepreneurs take on the world”, Enterprising Women, available at:www.enterprisingwomen.com
Engehard, P. (1998), L’Afrique miroir du monde. Plaidoyer pour une nouvelle economie, Arlea,Paris.
European Commission (2006), A Roadmap for Equality Between Men and Women 2006-2010,European Commission, Brussels, April.
Garten, J.E. (1999), World View: Global Strategies for the New Economy, Harvard Business SchoolPress, Boston, MA.
Henry, G.M. (2001), A quoi sert l’organisation mondiale du commerce?, Jeunes Editions,Le vallois-Peret.
Houee, P. (2003), Le developpement local au defi de la mondialisation, L’Harmattan, Paris.
Irwin, D.A. (2001), “A brief history of international trade policy”, Contributor’s Forum,November 26, available at: www.econlib.org
Korovkin, T. (2005), “Exportaciones agrıcolas no-tradicionales y la pobreza rural en Ecuador”,paper presented at the First Ecuatorian Meeting on Rural Society Research, Quito, 26-27October.
Lanning, M.J. (1998), Delivering Profitable Vale. A Revolutionary Framework to AccelerateWealth, and Rediscover the Heart of Business, Perseus Books, Reading, MA.
Lamy, P. (2006), “Humanising globalization”, WTO News, 30 January, available at: www.wto.org
Mayoux, L. (2001), Jobs, Gender, and Small Enterprises: Getting the Policy Environment Right,ILO, Geneva.
Meier, G.M. (1988), Theoretical Issues Concerning the History of International Trade andEconomic Development, Research Paper No. 992, Free University, Berlin, 6 May.
Millet, M. (2001), La regulacion del comercio internacional: del GATT a la OMC, La Caixa,Madrid.
Mountjoy, A.B. (1963), Industrialization and Underdeveloped Countries, Aldine PublishingCompany, Chicago, IL.
Nyambal, E. (2006), Creer la prosperite en Afrique. Dix cles pour sortir de la pauvrete,L’Harmattan, Paris.
Randriamaro, Z. (2006), Gender and Trade. Overview Report, available at: www.bridge.ids.ac.uk
Reich, R.B. (n.d.), The Wealth of Nations, Vintage Books, New York, NY.
Sachs, J. (2005), The End of Poverty, Penguin Press, New York, NY.
Schiff, M. and Winters, A. (2003), Integration regionales et developpement, The World Bank,Washington, DC.
Schneider, B. (1995), El escandalo y la verguenza de la pobreza y el subdesarrollo, Informe al Clubde Roma, Galaxia Gutenberg, Barcelona.
Simeon, C. (2005), Faire face a la pauvrete et a l’uniformisation mondialiste, L’Harmattan, Paris.
The elephant inthe room
1377

Thurow, L. (1999), Building Wealth, Harper Collins, New York, NY.
Tran-Nguyen, A.-N. (2004), Least Developed Countries Report 2004, UNCTAD, Geneva.
UNIDO (1995), Women, Industry, and Technology, Women in Industry Series, UNIDO, Vienna.
Vara, M.J. (2006), Estudios sobre genero y economıa, Ediciones Akal, Madrid.
Corresponding authorAstrid Ruiz Thierry can be contacted at: [email protected]
MD45,8
1378
To purchase reprints of this article please e-mail: [email protected] visit our web site for further details: www.emeraldinsight.com/reprints

The world’s leading publisher of management journals and databases
Emerald Management Xtra, the essential online management database, was createdafter gaining a deep understanding of the real needs and pressures faced by businessschools, universities and information professionals world-wide.
Emerald Management Xtra in 2007 comprises:
• Over 160 journals containing 65,000 full text articles – from a wide variety ofsubject areas including International Business, Innovation and Enterprise,Marketing and Organizational Development
• 190,000 reviews taken from 300 top management journals such as HarvardBusiness Review, MIT Sloan Management Review, Journal of Marketing andAccounting Horizons
• The Emerald Collections – includes over 1,000 case studies and book reviews,literature reviews, key management readings and over 300 interviews withleading figures within the industry
• Extra support and guidance for all your users, including tailored resources for:librarians, students, faculties, authors, researchers, deans and managers
• An institution-wide licence allowing all your users unrestricted access to EmeraldManagement Xtra, both on and off site.
If you would like further information or to take a free evaluation of this product, pleasee-mail [email protected]
Established in 1967, Emerald Group Publishing Limited has
supported the needs of librarians and information professionals
world-wide for over 40 years...
www.emeraldinsight.com
Emerald –celebrating 40
years in publishing!
EMX ad 2007 quarto bw.qxd 21/02/2007 14:51 Page 1

Do you want to get to know researchers in your field from all over the world? Would you like toshow-case your work and have like-minded professionals contact you? Do you need to find
collaborative research partners?
Emerald Research Connections is a free-to-all and easy-to-use online meeting place for theacademic and corporate research communities, allowing researchers to present their own work
and interests, and find others to participate in future projects or simply share ideas
Let us know about research undertaken via Emerald Research Connections and we will publishthe details on our website. Your research will also be highlighted to the Editors of over 160
Emerald journals
Through our website we also offer a range of support and services to researchers world-wide
For further information please contact us [email protected]
Join a world-wide research community
www.emeraldinsight.com/connections
emerald connections ad quarto_40.qxd 1/30/2007 3:00 PM Page 1

Authorguidelines
Submitting an article on JADEPlease log on to JADE with your username and password. This will take you through to yourown Author Homepage:∑ Select the journal to which you wish to submit by clicking on the journal title.
∑ To consult the Author Guidelines for this journal, click on the author guidelines button.
∑ Click on the submit article button, which will take you through to the article submissionpage.
∑ Complete all fields and browse to upload your article.
∑ For help, click on the blue question marks or consult the “How to submit using JADE”guide. You can save at any time.
∑ When all required sections are completed, click submit.
Manuscript requirementsThe manuscript should be in MS WORD format, in 1.5 line spacing and 12 point font size.Good electronic copies of all figures and tables should also be provided. All manuscriptsshould be run through a UK English spell check prior to submission.
As a guide, articles should be between 3,000 and 6,000 words in length. A title of notmore than 12 words should be provided. A brief autobiographical note should be suppliedincluding full name, affiliation, e-mail address and full international contact details.Authors must supply a structured abstract set out under 4-6 sub-headings: Purpose;Design/methodology/approach; Findings; Research limitations/implications (ifapplicable); Practical implications (if applicable); and Originality/value of the paper.Maximum is 250 words in total. In addition provide up to six keywords which encapsulatethe principal topics of the paper and categorize your paper under one of theseclassifications: Research paper, Viewpoint, Technical paper, Conceptual paper, Casestudy, Literature review or General review. For more information and guidance on structuredabstracts visit: www.emeraldinsight.com/structuredabstracts
Notes or Endnotes should be used only if absolutely necessary and must be identifiedin the text by consecutive numbers, enclosed in square brackets and listed at the end of thearticle.
Figures should be supplied within the article itself.All Figures (charts, diagrams and line drawings) and Plates (photographic images)
should be submitted in both electronic form and hard copy originals. Figures should be ofclear quality, in black and white and numbered consecutively with arabic numerals.
Figures created in MS Word, MS PowerPoint, MS Excel, Illustrator and Freehand shouldbe saved in their native formats.
Electronic figures created in other applications should be copied from the originationsoftware and pasted into a blank MS Word document or saved and imported into a MSWord document by choosing “Insert” from the menu bar, “Picture” from the drop-downmenu and selecting “From File . . .” to select the graphic to be imported.
For figures which cannot be supplied in MS Word, acceptable standard image formatsare: .pdf, .ai, .wmf and .eps. If you are unable to supply graphics in these formats thenplease ensure they are .tif, .jpeg, or .bmp at a resolution of at least 300dpi and at least10cm wide.
To prepare screenshots, simultaneously press the “Alt” and “Print screen” keys on thekeyboard, open a blank Microsoft Word document and simultaneously press “Ctrl” and “V”to paste the image. (Capture all the contents/windows on the computer screen to pasteinto MS Word, by simultaneously pressing “Ctrl” and “Print screen”.)
For photographic images (plates) good quality original photographs should besubmitted. If supplied electronically they should be saved as .tif or .jpeg files at aresolution of at least 300dpi and at least 10cm wide. Digital camera settings should be setat the highest resolution/quality as possible.
In the text of the paper the preferred position of all tables, figures and plates should beindicated by typing on a separate line the words “Take in Figure (No.)” or “Take in Plate(No.)”. Tables should be typed and included as part of the manuscript. They should not besubmitted as graphic elements. Supply succinct and clear captions for all tables, figuresand plates. Ensure that tables and figures are complete with necessary superscriptsshown, both next to the relevant items and with the corresponding explanations or levels ofsignificance shown as footnotes in the tables and figures.
References to other publications must be in Harvard style and carefully checked forcompleteness, accuracy and consistency. This is very important in an electronicenvironment because it enables your readers to exploit the Reference Linking facility on thedatabase and link back to the works you have cited through CrossRef. You should includeall author names and initials and give any journal title in full.
You should cite publications in the text: (Adams, 2006) using the first named author’sname or (Adams and Brown, 2006) citing both names of two, or (Adams et al., 2006), whenthere are three or more authors. At the end of the paper a reference list in alphabetical ordershould be supplied:
For books: surname, initials, (year), title of book, publisher, place of publication, e.g. Harrow, R. (2005), No Place to Hide, Simon & Schuster, New York, NY.
For book chapters: surname, initials, (year), “chapter title”, editor’s surname, initials,title of book, publisher, place of publication, pages, e.g. Calabrese, F.A. (2005), “The earlypathways: theory to practice – a continuum”, in Stankosky, M. (Ed.), Creating the Disciplineof Knowledge Management, Elsevier, New York, NY, pp. 15-20.
For journals: surname, initials, (year), “title of article”, journal name, volume, number,pages, e.g. Capizzi, M.T. and Ferguson, R. (2005), “Loyalty trends for the twenty-firstcentury”, Journal of Consumer Marketing, Vol. 22 No. 2, pp. 72-80.
For electronic sources: if available online the full URL should be supplied at the end ofthe reference.
Final submission of the articleOnce accepted for publication, the final version of your paper should be submitted usingJADE. Please ensure that the abstract, article category, keywords and a briefautobiographical note for each author (full name, affiliation, e-mail address and fullinternational address) are supplied in the article document.
Management Decision
CopyrightArticles submitted to the journal should be original contributions (see www.emeraldinsight.com/info/copyright/plagiarism_full.jsp for the journal plagiarism policy)and should not be under consideration for any other publication at the same time. Authorssubmitting articles for publication warrant that the work is not an infringement of anyexisting copyright and will indemnify the publisher against any breach of such warranty. Forease of dissemination and to ensure proper policing of use, papers and contributionsbecome the legal copyright of the publisher unless otherwise agreed. Copyright is assignedthrough the use of a digital signature as part of the submission process in JADE.
The EditorJohn PetersEmerald Group Publishing Limited, 60-62 Toller Lane, Bradford, West Yorkshire, England BD8 9BYE-mail: [email protected]
Editorial objectivesTo publish research and reflection on the theory, practice, techniques and context ofdecisions taken in and about business and business research.
Management Decision was founded in 1963 at the time of the first wave of growth anddevelopment of business schools in the Western world, and has tracked thought onstrategy, policy and decision-making through that time. Management Decision publishespapers relating directly and indirectly to the theory and practice of decision-making.
In 2001, Management Decision extended its scope to formally encompass decision-making on research and research methodologies, with the publication of a themed issueon insights in business research.
Principles• We aim to publish well-written readable articles with broad appeal and a truly
international relevance. We encourage authors from all parts of the world.• Contributors are encouraged to focus on ethnographic, conceptual or empirical work
to outline practical implications for strategy, policy and decision-making. Topicsshould relate directly or indirectly to some aspect of decision-making.
• New and first-time authors are particularly encouraged.
Guidelines for authorsPapers should:Have a clear statement of purpose• Have a clear statement of importance; why the paper was written and what it
contributes to the body of knowledge• Have clearly stated implications for further research• Have clearly stated implications for practice• Be well-written and readable• Present reliable and valid conclusions appropriate to the methodology employed• Be completely free of spelling and grammatical errors
Application Questions Papers normally carry “Application Questions” which prompt areader to consider how concepts presented in a paper should be applied. Authors areencouraged to create these themselves; see a recent issue for examples.
The reviewing processEach paper is reviewed by the editor and, if it is judged suitable for this publication, it isthen sent to two referees for double blind peer review. Based on their recommendations,the editor then decides whether the paper should be accepted as is, revised or rejected.The process described above is a general one. The editor, however, may, in somecircumstances, vary this process.
Emerald Literati Editing ServiceThe Literati Club can recommend the services of a number of freelance copy editors, allthemselves experienced authors, to contributors who wish to improve the standard ofEnglish in their paper before submission. This is particularly useful for those whose firstlanguage is not English. Please see www.emeraldinsight.com/editingservice for furtherdetails.
Submission processSubmissions to Management Decision are made using Emerald’s online submission andpeer review system, the Journal Article Delivery Engine (JADE). Registration and access areavailable at http://jade.emeraldinsight.com Full information for authors and guidance onusing JADE are available at www.emeraldinsight.com/literaticlub/authors/usingjade.htm
Registering on JADEIf you have not yet registered with JADE, please follow the instructions below:∑ log on to http://jade.emeraldinsight.com
∑ click on the register now button
∑ choose a username and password using the convention SurnameFirstname
∑ complete all fields and then click submit.
You are now a registered JADE author and will be taken to your own Author Homepage.
MD_JADE 2007_author guidelines.qxd 13/07/2007 09:15 Page 1

Number 8Alleviating poverty through tradeGuest Editors: Dr David Lamond and Dr Rocky Dwyer
1195 Access this journal online
1196 Editorial advisory board
1197 ForewordPatricia R. Francis
1199 ForewordEric Cornuel
1200 Editorial
1208 Managing the linkage between export development and poverty reduction: an effectiveframeworkFrederick Owen Skae and Brian Barclay
1224 The Great Game evolves for Central Asia and opportunities beckonJohn Kidd
1252 Is South-South trade the answer to alleviating poverty?Osvaldo R. Agatiello
1270 The South African poor White problem in the early twentieth century: lessons for poverty todayJohan Fourie
1297 Company and society: the “Caras do Brasil” (Faces of Brazil) program as leverage forsustainable developmentLuciano Barin Cruz, Eugenio Avila Pedrozo, Rosangela Bacima and Beatriz Queiroz
1320 Trade from the ground up: a case study of a grass roots NGO using agricultural programs togenerate economic viabilty in developing countriesAllison Duke and Charla Long
1331 Transaction costs in group microcredit in IndiaSavita Shankar
1343 Alleviating poverty: how do we know the scope of the problem and when we have solved it?Rocky J. Dwyer
1359 The elephant in the room: gender and export-led poverty reductionAstrid Ruiz Thierry
www.emeraldinsight.com
Management Decision
Volume 45 Number 8 2007
ISBN 978-1-84663-608-0
MD (iv).qxd 13/07/2007 09:13 Page 1