Carbon fluxes through major phytoplankton groups during the spring bloom and post-bloom in the...
15
Carbon fluxes through major phytoplankton groups during the spring bloom and post-bloom in the Northwestern Mediterranean Sea Andre ´ s Gutie ´ rrez-Rodrı ´guez a, , Mikel Latasa a,1 , Marta Estrada a , Montserrat Vidal b , Celia Marrase ´ a a Institut de Ci encies del Mar (CSIC), Passeig Marı ´tim de la Barceloneta 37-49, E-08003 Barcelona, Spain b Departament d’Ecologia, University of Barcelona (UB), Diagonal 645, E-08028 Barcelona, Spain article info Article history: Received 3 December 2008 Received in revised form 13 July 2009 Accepted 27 December 2009 Available online 11 January 2010 Keywords: Community structure Phytoplankton growth Microzooplankton grazing Carbon flux NW Mediterranean abstract The carbon flux through major phytoplankton groups, defined by their pigment markers, was estimated in two contrasting conditions of the Northwestern Mediterranean open ocean ecosystem: the spring bloom and post-bloom situations (hereafter Bloom and Post-bloom, respectively). During Bloom, surface chlorophyll a (Chl a) concentration was higher and dominated by diatoms (53% of Chl a), while during Post-bloom Synechococcus (42%) and Prymnesiophyceae (29%) became dominant. The seawater dilution technique, coupled to high pressure liquid chromatography (HPLC) analysis of pigments and flow cytometry (FCM), was used to estimate growth and grazing rates of major phytoplankton groups in surface waters. Estimated growth rates were corrected for photoacclimation based on FCM-detected changes in red fluorescence per cell. Given the 30% average decrease in the pigment content per cell between the beginning and the end of the incubations, overlooking photoacclimation would have resulted in a 0.40 d 1 underestimation of phytoplankton growth rates. Corrected average growth rates (m o ) were 0.90 70.20 (SD) and 0.40 70.14 d 1 for Bloom and Post-bloom phytoplankton, respectively. Diatoms, Cryptophyceae and Synechococcus were identified as fast-growing groups and Prymnesiophy- ceae and Prasinophyceae as slow-growing groups across Bloom and Post-bloom conditions. The higher growth rate during Bloom was due to dominance of phytoplankton groups with higher growth rates than those dominating in Post-bloom. Average grazing rates (m) were 0.58 70.20 d 1 (SD) and 0.31 70.07 d 1 . The proportion of phytoplankton growth consumed by microzooplankton grazing (m/m o ) tended to be lower in Bloom (0.69 70.34) than in Post-bloom (0.80 70.08). The intensity of nutrient limitation experienced by phytoplankton indicated by m o /m n (where m n is the nutrient- amended growth rate), was similar during Bloom (0.78) and Post-bloom (0.73). Primary production from surface water (PP) was estimated with 14 C incubations. A combination of PP and Chl a synthesis rate yielded C/Chl a ratios of 34 721 and 168 775 (g:g) for Bloom and Post-bloom, respectively. Transformation of group-specific Chl a fluxes into carbon equivalents confirmed the dominant role of diatoms during Bloom and Synechococcus and Prymnesiophyceae during Post-bloom. & 2010 Elsevier Ltd. All rights reserved. 1. Introduction Biogeochemical cycles in the ocean are strongly dependent on phytoplankton community composition (Falkowski et al., 2003; Hood et al., 2006). In the open sea, the phytoplankton community usually encompasses a diverse assemblage of species that, although coexisting in the same environment, present different growth rates and physiological characteristics (Furnas, 1990; Goericke, 2002; Margalef, 1978). Thus, the study of phytoplankton dynamics from bulk properties such as chlorophyll a (Chl a) can mask important differences affecting ecosystem structure and function (Li et al., 1993). The role of ecologically meaningful members of the community needs to be characterized in order to improve our mechanistic understanding of the ocean carbon cycle. However, studies are scarce and have been a limiting factor for accurate parameterization of key processes included in biogeochemical models (Hood et al., 2006; Le Qu er e et al., 2005). In order to fill the gap, previous investigations have taken advantage of the specificity of flow cytometry (FCM) combined with 14 C-uptake rates or dilution-experiment derived rate measurements to quantify contribution of major phytoplankton groups to carbon production (Brown et al., 1999, 2002; Li, 1994; ARTICLE IN PRESS Contents lists available at ScienceDirect journal homepage: www.elsevier.com/locate/dsri Deep-Sea Research I 0967-0637/$ - see front matter & 2010 Elsevier Ltd. All rights reserved. doi:10.1016/j.dsr.2009.12.013 Corresponding author. Present address: Integrative Oceanography Division, Scripps Institution of Oceanography, University of California at San Diego, La Jolla, CA 92093, USA. Tel.: + 1 858 534 2148. E-mail addresses: [email protected], [email protected] (A. Gutie ´ rrez-Rodrı ´guez), [email protected] (M. Latasa), [email protected] (M. Estrada), [email protected] (M. Vidal), [email protected] (C. Marrase ´). 1 Present address: Centro Oceanogra ´ fico de Gijo ´ n (IEO), Avda. Prı ´ncipe de Asturias 70 bis, E-33213 Gijo ´ n, Spain. Deep-Sea Research I 57 (2010) 486–500
-
Upload
independent -
Category
Documents
-
view
0 -
download
0
Transcript of Carbon fluxes through major phytoplankton groups during the spring bloom and post-bloom in the...
Carbon fluxes through major phytoplankton groups during the spring bloomand post-bloom in the Northwestern Mediterranean Sea
Andres Gutierrez-Rodrıguez a,!, Mikel Latasa a,1, Marta Estrada a, Montserrat Vidal b, Celia Marrase a
a Institut de Ci!encies del Mar (CSIC), Passeig Marıtim de la Barceloneta 37-49, E-08003 Barcelona, Spainb Departament d’Ecologia, University of Barcelona (UB), Diagonal 645, E-08028 Barcelona, Spain
a r t i c l e i n f o
Article history:Received 3 December 2008Received in revised form13 July 2009Accepted 27 December 2009Available online 11 January 2010
Keywords:Community structurePhytoplankton growthMicrozooplankton grazingCarbon fluxNW Mediterranean
a b s t r a c t
The carbon flux through major phytoplankton groups, defined by their pigment markers, was estimatedin two contrasting conditions of the Northwestern Mediterranean open ocean ecosystem: the springbloom and post-bloom situations (hereafter Bloom and Post-bloom, respectively). During Bloom,surface chlorophyll a (Chl a) concentration was higher and dominated by diatoms (53% of Chl a), whileduring Post-bloom Synechococcus (42%) and Prymnesiophyceae (29%) became dominant. The seawaterdilution technique, coupled to high pressure liquid chromatography (HPLC) analysis of pigments andflow cytometry (FCM), was used to estimate growth and grazing rates of major phytoplankton groups insurface waters. Estimated growth rates were corrected for photoacclimation based on FCM-detectedchanges in red fluorescence per cell. Given the 30% average decrease in the pigment content per cellbetween the beginning and the end of the incubations, overlooking photoacclimation would haveresulted in a 0.40 d!1 underestimation of phytoplankton growth rates. Corrected average growth rates(mo) were 0.9070.20 (SD) and 0.4070.14 d!1 for Bloom and Post-bloom phytoplankton, respectively.Diatoms, Cryptophyceae and Synechococcus were identified as fast-growing groups and Prymnesiophy-ceae and Prasinophyceae as slow-growing groups across Bloom and Post-bloom conditions. The highergrowth rate during Bloom was due to dominance of phytoplankton groups with higher growth ratesthan those dominating in Post-bloom. Average grazing rates (m) were 0.5870.20 d!1 (SD) and0.3170.07d!1. The proportion of phytoplankton growth consumed by microzooplankton grazing(m/mo) tended to be lower in Bloom (0.6970.34) than in Post-bloom (0.8070.08). The intensity ofnutrient limitation experienced by phytoplankton indicated by mo/mn (where mn is the nutrient-amended growth rate), was similar during Bloom (0.78) and Post-bloom (0.73). Primary productionfrom surface water (PP) was estimated with 14C incubations. A combination of PP and Chl a synthesisrate yielded C/Chl a ratios of 34721 and 168775 (g:g) for Bloom and Post-bloom, respectively.Transformation of group-specific Chl a fluxes into carbon equivalents confirmed the dominant role ofdiatoms during Bloom and Synechococcus and Prymnesiophyceae during Post-bloom.
& 2010 Elsevier Ltd. All rights reserved.
1. Introduction
Biogeochemical cycles in the ocean are strongly dependent onphytoplankton community composition (Falkowski et al., 2003;Hood et al., 2006). In the open sea, the phytoplankton communityusually encompasses a diverse assemblage of species that,
although coexisting in the same environment, present differentgrowth rates and physiological characteristics (Furnas, 1990;Goericke, 2002; Margalef, 1978). Thus, the study of phytoplanktondynamics from bulk properties such as chlorophyll a (Chl a) canmask important differences affecting ecosystem structure andfunction (Li et al., 1993). The role of ecologically meaningfulmembers of the community needs to be characterized in order toimprove our mechanistic understanding of the ocean carboncycle. However, studies are scarce and have been a limiting factorfor accurate parameterization of key processes included inbiogeochemical models (Hood et al., 2006; Le Qu!er!e et al.,2005). In order to fill the gap, previous investigations have takenadvantage of the specificity of flow cytometry (FCM) combinedwith 14C-uptake rates or dilution-experiment derived ratemeasurements to quantify contribution of major phytoplanktongroups to carbon production (Brown et al., 1999, 2002; Li, 1994;
ARTICLE IN PRESS
Contents lists available at ScienceDirect
journal homepage: www.elsevier.com/locate/dsri
Deep-Sea Research I
0967-0637/$ - see front matter & 2010 Elsevier Ltd. All rights reserved.doi:10.1016/j.dsr.2009.12.013
! Corresponding author. Present address: Integrative Oceanography Division,Scripps Institution of Oceanography, University of California at San Diego, La Jolla,CA 92093, USA. Tel.: +18585342148.
E-mail addresses: [email protected], [email protected](A. Gutierrez-Rodrıguez), [email protected] (M. Latasa), [email protected](M. Estrada), [email protected] (M. Vidal),[email protected] (C. Marrase).
1 Present address: Centro Oceanografico de Gijon (IEO), Avda. Prıncipe deAsturias 70 bis, E-33213 Gijon, Spain.
Deep-Sea Research I 57 (2010) 486–500
ARTICLE IN PRESS
Worden et al., 2004). Alternatively, 14C-uptake and dilutionexperiments have been coupled with biomass estimates ofparticular groups to assess the contribution of pigment-definedtaxa to total phytoplankton production (Brown et al., 2002;Goericke, 1998; Goericke and Welschmeyer, 1993; Latasa et al.,2005).
The NW Mediterranean is a region with a relatively highproductivity.It sustains active fisheries and important populationsof cetaceans (Capelli et al., 2008; Notarbartolo et al., 1992),suggesting a highly efficient transfer from primary producers tohigher trophic levels. This region presents marked seasonalphysical, chemical and biological dynamics (Bosc et al., 2004;Morales, 2006; Morel and Andre, 1991). Maximum Chl aconcentration values are observed in early spring triggered bythe onset of thermal stratification after winter mixing, whileminimum values are found at the end of the strongly stratifiedsummer period. Probably the most distinctive feature of this basinis the deep convective mixing event occurring in winter (January–February), which can reach down to 2000m depth. The nutrientsprovided by this mixing sustain a spring bloom that is limited tothe south by the North Balearic Front (NBF), a thermohalinesurface (200m) front that extends from north of the BalearicIslands to Corsica following the parallel 411N (Deschamps et al.,1984; Millot, 1999). The waters south of the NBF also undergowinter mixing and a phytoplankton bloom, although bothphenomena are less intense and persistent and occur earlier thanin waters north of the NBF (Morales, 2006; D’Ortenzio andd’Alcala, 2009). The progressive stratification and nutrient deple-tion after the spring bloom ends in autumn, when the thermoclineis eroded and nutrients reach the euphotic layer again.
A succession of major phytoplankton groups takes place inparallel to this physico-chemical seasonal variability. Largediatoms, which tend to dominate the late-winter–early-springbloom, are substituted by small flagellates (o3mm) and cyano-bacteria during the oligotrophic season. (Estrada, 1991; Estradaet al., 1999; Marty and Chiaverini, 2002; Vidussi et al., 2000).However, a detailed quantitative description of biogeochemicalfluxes associated with the phytoplankton groups and key speciesduring ‘spring’ bloom and subsequent ‘summer’ stratified condi-tions in open sea waters has not been addressed yet, and furtherinvestigations are require.
The two main objectives of the present study were toinvestigate: (1) the growth (mo) and grazing (m) rates of majorphytoplankton groups, as defined by their pigment markers, and(2) the carbon fluxes through these groups. The study wasperformed in two contrasting situations of the NW Mediterraneanopen sea: the characteristic spring bloom north of the NBF and theco-occurring post-bloom conditions south of the NBF (hereafterBloom (B) and Post-bloom (PB), respectively). Growth and grazingrates of pigment-defined major phytoplankton groups (Objective1) were studied to survey differences in the growth and grazingpattern among those groups (inter-group variability) and toevaluate whether the rates of particular groups differed betweenBloom and Post-bloom (intra-group variability). Growth andgrazing rates were estimated by means of dilution experimentscoupled to HPLC analysis. Nutrient limitation was assessed by thenutrient limitation index (NL=mo/mn) defined by Landry et al.,(1995a, 1998). Microzooplankton grazing impact on phytoplank-ton production (m/mo) was quantified, and grazing selectivity atthe level of pigment-defined groups was analyzed following therelative preference index (RPI, Obayashi and Tanoue, 2002).
Carbon fluxes of synthesis and destruction, through majorphytoplankton groups (Objective 2), were assessed following theapproach of Obayashi and Tanoue (2002) modified by Latasa et al.(2005). Group-specific growth and grazing rates and Chemtaxalgorithms were combined to yield the Chl a synthesis and
destruction rates of major phytoplankton groups. Parallelestimates of 14C-uptake were used to calculate community C/Chl a ratios and to transform Chl a fluxes derived from dilutionexperiments into carbon equivalents.
In addition, we tackled two potential problems of dilutionexperiments: non-linearities in the grazing response and photo-acclimation-related artifacts. Gifford (1988) and Gallegos (1989)first considered the effect of non-linearities on the estimation ofgrowth and grazing rate in dilution experiments. Since then,different approaches have been applied to avoid bias due to thiscause (Evans and Paranjape, 1992; Moigis, 2006; Redden et al.,2002; Rivkin et al., 1999; Worden and Binder, 2003; Teixeira andFigueiras, 2009). We have introduced some modifications to boththe experimental design and the parameter estimation procedure,based on the ‘‘three points’’ rationale of Gallegos (1989), aiming atimproving the accuracy of rate estimates.
Photoacclimation processes are inherent to all types ofincubations and related artifacts are a common concern for thederived rates, especially if these estimates are based on pigmentmeasurements (Landry et al., 2000; Latasa et al., 2005; McManus,1995). In this study, we propose a procedure to quantify andcorrect for the photoacclimation response during the incubation.In addition, we discuss the impact of photoacclimation onestimated rates and derived variables (NL, m/mo and C/Chl a).
2. Material and methods
2.1. Area of study
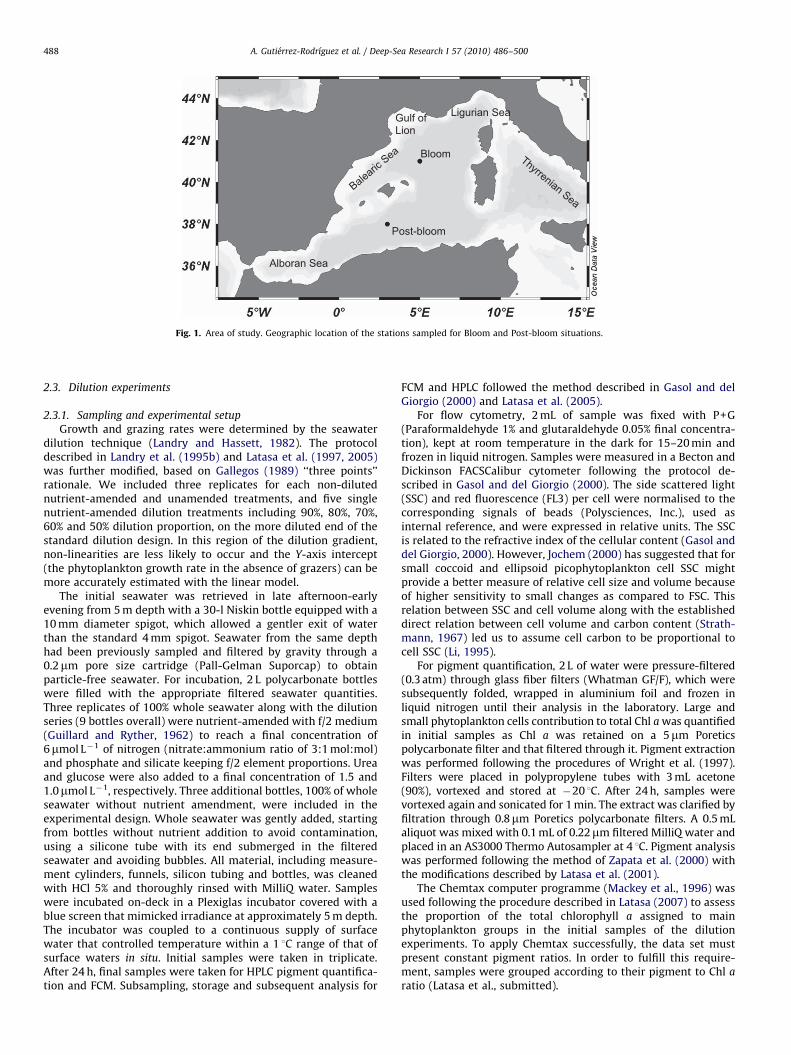
This study was conducted during a 10-day cruise at the end ofMarch and beginning of April 2004 on board the RV Cornide deSaavedra. The Bloom (B) station was located north of the Balearicfront (41.45 N, 05.10 E). The Post-bloom station (PB) was locatedsouth of the front (38.20 N, 03.10 E) (Fig. 1). The experimentsreported here (Table 1) were carried out within the framework ofthe project EFLUBIO, which had as a main objective the study ofthe structure of the planktonic community and associated matterand energy fluxes.
2.2. Sampling of physico-chemical parameters
Irradiance profiles where obtained with a 2p photosyntheti-cally available radiation (PAR, 400–700nm irradiance) sensor,integrated onto the FASTtracka fast repetition rate fluorometer(Chelsea Instruments). The measured irradiance values wereadjusted to the following exponential equation to estimate theattenuation coefficient
E"z# $ E0 % e"!KPAR%Z# "1#
E(z) and Eo are the irradiances at depth z (m) and at the surface(mmolphotonm!2 s!1), and KPAR is the attenuation coefficient(m!1). The intensity of stratification was estimated by means ofthe Brunt–Vaisala frequency (Fofonoff and Millard, 1983) A SBE911plus CTD equipped with a Sea-Tech fluorometer was used toobtain profiles of temperature, salinity and fluorescence. Watersamples were obtained with a rosette system. Water fordetermination of dissolved nutrients was directly filtered fromthe Niskin bottles through 0.2mm polyethersulfone filters (Pall-Gelman Suporcap), previously washed in diluted HCl and rinsedwith distilled water. These samples were obtained within no morethan 2h after the water for dilution experiments was retrieved.Dissolved nitrate, nitrite, ammonium, phosphate and silicateconcentrations were determined using an alliance evolution IIautoanalyser, following the methods of Grasshoff et al. (1999).
A. Gutierrez-Rodrıguez et al. / Deep-Sea Research I 57 (2010) 486–500 487
ARTICLE IN PRESS
2.3. Dilution experiments
2.3.1. Sampling and experimental setupGrowth and grazing rates were determined by the seawater
dilution technique (Landry and Hassett, 1982). The protocoldescribed in Landry et al. (1995b) and Latasa et al. (1997, 2005)was further modified, based on Gallegos (1989) ‘‘three points’’rationale. We included three replicates for each non-dilutednutrient-amended and unamended treatments, and five singlenutrient-amended dilution treatments including 90%, 80%, 70%,60% and 50% dilution proportion, on the more diluted end of thestandard dilution design. In this region of the dilution gradient,non-linearities are less likely to occur and the Y-axis intercept(the phytoplankton growth rate in the absence of grazers) can bemore accurately estimated with the linear model.
The initial seawater was retrieved in late afternoon-earlyevening from 5m depth with a 30-l Niskin bottle equipped with a10mm diameter spigot, which allowed a gentler exit of waterthan the standard 4mm spigot. Seawater from the same depthhad been previously sampled and filtered by gravity through a0.2mm pore size cartridge (Pall-Gelman Suporcap) to obtainparticle-free seawater. For incubation, 2 L polycarbonate bottleswere filled with the appropriate filtered seawater quantities.Three replicates of 100% whole seawater along with the dilutionseries (9 bottles overall) were nutrient-amended with f/2 medium(Guillard and Ryther, 1962) to reach a final concentration of6mmol L!1 of nitrogen (nitrate:ammonium ratio of 3:1mol:mol)and phosphate and silicate keeping f/2 element proportions. Ureaand glucose were also added to a final concentration of 1.5 and1.0mmol L!1, respectively. Three additional bottles, 100% of wholeseawater without nutrient amendment, were included in theexperimental design. Whole seawater was gently added, startingfrom bottles without nutrient addition to avoid contamination,using a silicone tube with its end submerged in the filteredseawater and avoiding bubbles. All material, including measure-ment cylinders, funnels, silicon tubing and bottles, was cleanedwith HCl 5% and thoroughly rinsed with MilliQ water. Sampleswere incubated on-deck in a Plexiglas incubator covered with ablue screen that mimicked irradiance at approximately 5m depth.The incubator was coupled to a continuous supply of surfacewater that controlled temperature within a 1 1C range of that ofsurface waters in situ. Initial samples were taken in triplicate.After 24h, final samples were taken for HPLC pigment quantifica-tion and FCM. Subsampling, storage and subsequent analysis for
FCM and HPLC followed the method described in Gasol and delGiorgio (2000) and Latasa et al. (2005).
For flow cytometry, 2mL of sample was fixed with P+G(Paraformaldehyde 1% and glutaraldehyde 0.05% final concentra-tion), kept at room temperature in the dark for 15–20min andfrozen in liquid nitrogen. Samples were measured in a Becton andDickinson FACSCalibur cytometer following the protocol de-scribed in Gasol and del Giorgio (2000). The side scattered light(SSC) and red fluorescence (FL3) per cell were normalised to thecorresponding signals of beads (Polysciences, Inc.), used asinternal reference, and were expressed in relative units. The SSCis related to the refractive index of the cellular content (Gasol anddel Giorgio, 2000). However, Jochem (2000) has suggested that forsmall coccoid and ellipsoid picophytoplankton cell SSC mightprovide a better measure of relative cell size and volume becauseof higher sensitivity to small changes as compared to FSC. Thisrelation between SSC and cell volume along with the establisheddirect relation between cell volume and carbon content (Strath-mann, 1967) led us to assume cell carbon to be proportional tocell SSC (Li, 1995).
For pigment quantification, 2 L of water were pressure-filtered(0.3atm) through glass fiber filters (Whatman GF/F), which weresubsequently folded, wrapped in aluminium foil and frozen inliquid nitrogen until their analysis in the laboratory. Large andsmall phytoplankton cells contribution to total Chl awas quantifiedin initial samples as Chl a was retained on a 5mm Poreticspolycarbonate filter and that filtered through it. Pigment extractionwas performed following the procedures of Wright et al. (1997).Filters were placed in polypropylene tubes with 3mL acetone(90%), vortexed and stored at !20 1C. After 24h, samples werevortexed again and sonicated for 1min. The extract was clarified byfiltration through 0.8mm Poretics polycarbonate filters. A 0.5mLaliquot was mixed with 0.1mL of 0.22mm filtered MilliQ water andplaced in an AS3000 Thermo Autosampler at 4 1C. Pigment analysiswas performed following the method of Zapata et al. (2000) withthe modifications described by Latasa et al. (2001).
The Chemtax computer programme (Mackey et al., 1996) wasused following the procedure described in Latasa (2007) to assessthe proportion of the total chlorophyll a assigned to mainphytoplankton groups in the initial samples of the dilutionexperiments. To apply Chemtax successfully, the data set mustpresent constant pigment ratios. In order to fulfill this require-ment, samples were grouped according to their pigment to Chl aratio (Latasa et al., submitted).
Bloom
Post-bloom
Gulf of Lion
Balearic Sea
Ligurian Sea
Alboran Sea
Thyrrenian Sea
Fig. 1. Area of study. Geographic location of the stations sampled for Bloom and Post-bloom situations.
A. Gutierrez-Rodrıguez et al. / Deep-Sea Research I 57 (2010) 486–500488
ARTICLE IN PRESS
2.3.2. Data analysisFollowing Landry and Hassett (1982), exponential growth and
loss processes were assumed for the populations studied.Apparent growth rates (k) were calculated as
k$1t
! "ln
Nt
N0 % D
# $"2#
Nt and N0 are final and initial pigment marker concentrations,respectively, D is the proportion of whole seawater and t isthe duration of the incubation. Major phytoplankton groups’apparent growth rates (k) at each dilution were estimated fromchanges in concentration of pigment markers. Chl a fucox-anthin, 190-hexanoyloxyfucoxanthin, zeaxanthin, alloxanthin,chlorophyll b and 190-butanoyloxyfucoxanthin were used totrace total phytoplankton, diatoms, Prymnesiophyceae, Synecho-coccus, Cryptophyceae, Prasinophyceae and Pelagophyceaedynamics, respectively. The undetectability of lutein, character-istic of Chlorophyceae, suggested that chlorophyll b, common toall Chlorophyta, was mainly due to the dominance of Prasinophy-ceae, another class of the Chlorophyta division. We are aware thatzeaxanthin is not only present in Synechococcus but also inPrasinophyceae and Prochlorococcus. The zeaxanthin:Chl a ratio incultured Synechococcus (RCC513) was &50-fold higher comparedto prasinophyte Bathycoccus (RCC113). If we translate this ratio toChl a assigned to Prasinophyceae and Synechococcus in the field, itcan be derived that the contribution of Synechococcus to the bulkzeaxanthin pool largely overrode that of Prasinophyceae duringBloom (12–27-fold higher) and Post-bloom (207–280-fold high-er). This and the absence of Prochlorococcus in the surface layer ledus to assume that zeaxanthin dynamics was governed bySynechococcus.
The intrinsic growth rate for nutrient-amended bottles(mn) was estimated as the Y-axis intercept of the linear regression(model I) between apparent growth rates (Y-axis) and dilutionfactor (D). The number of points included in the linear regressionwas given by a trade-off between the adequacy of using alinear model to fit the data and the robustness of the regression,assumed to be given by the coefficient of determination (r2)and the statistical significance of the regression (p-value),respectively. Following the stepwise regression principles, andstarting from the more diluted towards the less diluted bottles,the regression included the number of points that yielded thehighest r2 while keeping the p-value below 0.10 (Table 1). Grazingrate (m) was calculated as the difference between mn and thenet growth rate (mn, net) in the non-diluted nutrient-amendedbottles (m=mn!mn, net). In situ intrinsic growth rates (m0) wereestimated as the sum of net growth rate in non-diluted non-nutrient-amended bottles (mnet) and estimated grazing(m0=mnet+m).
The nutrient limitation index (NL) was assessed as NL=m0/mn
(Landry et al., 1995a, 1998). The proportion of primary productionconsumed daily by grazing was calculated as the ratio of grazingto growth (m/m0, Landry et al., 1998). In order to reduce theimpact of extreme values on the estimated average, these ratioswere transformed to their arctangent value. The resulting averagearctangent values (a) were transformed back to the averages thatare presented throughout the text, using their inverse function,tangent (a), (Calbet and Landry, 2004).
Chl a synthesis and destruction rates (mgChla L!1 d!1) wereestimated according to Frost (1972)
Chlasynthesis $m0N0"exp"m0!m#t!1#
m0!m"3#
Chladestruction $mN0"exp"m0!m#t!1#
m0!m"4#
Table
1In
situ
water
temperature
(T%a)
andinorgan
icnutrientco
ncentration(N
+N:Nitrate+Nitrite,Si:silicate)in
thefirst5m
dep
th.Mixed
layer
dep
th(M
LD,defi
ned
asthedep
thdownto
whichsigmavariesless
than
0.150),
attenuationco
efficien
t(K
PAR),su
rfaceChla
areal
concentrationintegratedbetwee
n0an
d100m
dep
th([Chla]
0–100).Daily
irradiance
at5m
dep
thex
pressed
inmolp
hotonm
!2d!1.P
hotoacclim
ationindex
(Phi,dim
ensionless),
growth
rate
(mo),grazingrate
(m),growth
rate
innutrient-am
ended
bottles(m
n),theco
efficien
tofdetermination(r
2),thep-valuean
dthenumber
ofpoints
included
inthetypeIlinea
rregressionbetwee
nap
paren
tgrowth
and
dilutionfactor.Theproportionofphytoplanktonproductionco
nsu
med
daily
(m/m
o,d
imen
sionless),nutrientlimitationindex
(mo/m
n,d
imen
sionless)an
dproportionofphytoplanktonstan
dingstock
consu
med
daily
(%Ps).S
Dan
dSE
Mreferto
thestan
darddev
iationan
dthestan
darderrorofthemea
n,resp
ectively.nd:nondetermined
.
Station
Date(1C)
T%a (mM)
[N+N]
( mM)
[NH4+]
(mM)
[DIP]
(mM)
[Si]
(m)
MLD
(m!1)
KPAR
(mgm
!2)
[Chla]
0!100
irradiance
Daily
(d!1)
Phi light
(d!1)
m o7
SEM
(d!1)
m7
SEM
(n)
m n7
SEM
(%d!1)
r2,p-value
m/m
om o
/mn
%Ps
B1
25/03/2005
13.7
0.75
0.36
0.01
0.34
69
0.202
140
4.2
0.66
0.837
0.08
0.597
0.08
1.217
0.07
0.79,0.003(8)
0.71
0.69
67
B2
26/03/2005
13.7
0.75
0.4
0.026
0.26
27
0.174
127
5.9
nd
0.667
0.13
0.837
0.12
0.947
0.10
0.85,0.027(5)
1.25
0.70
76
B3
27/03/2005
13.8
11.04
0.03
1.36
40
0.142
79.5
22.5
0.67
0.777
0.08
0.317
0.08
0.987
0.07
0.69,0.02(7)
0.39
0.78
38
B4
28/03/2005
13.5
2.03
1.02
0.027
1.24
42
0.106
103
21.6
0.74
1.037
0.17
0.717
0.16
1.247
0.14
0.70,0.08(5)
0.69
0.83
83
B5
29/03/2005
14
2.21
0.69
0.037
1.44
49
0.104
92.7
21.8
0.45
1.157
0.11
0.497
0.07
1.287
0.03
0.97,0.016(4)
0.42
0.90
70
Mea
nbloom
13.7
1.35
0.702
0.026
0.93
45.4
0.146
108
15.2
0.63
0.90
0.58
1.13
-0.69
0.78
67
(SD)
(0.18)
(0.71)
(0.33)
(0.01)
(0.58)
(15.4)
(0.042)
(24)
(9.3)
(0.13)
(0.20)
(0.20)
(0.16)
-(0.34)
(0.089)
(17)
PB1
01/04/2005
14.8
0.56
0.82
0.037
0.37
27
0.069
21.0
24.1
0.67
0.55
70.13
0.367
0.09
0.967
0.04
0.93,0.007(5)
0.67
0.57
40
PB2
02/04/2005
14.6
0.25
1.16
0.021
0.63
33
0.055
35.4
18.9
0.94
0.267
0.05
0.227
0.04
0.3507
0.03
0.94,0.006(5)
0.88
0.73
23
PB3
03/04/2005
14.7
nd
0.51
0.024
0.21
27
0.064
28.5
18.1
nd
0.397
0.08
0.347
0.07
0.447
0.07
0.81,0.098(4)
0.88
0.88
35
Mea
npost-b
loom
14.7
0.40
0.83
0.027
0.4
29
0.063
28.3
20.4
0.80
0.40
0.31
0.58
–0.81
0.73
33
(SD)
(0.1)
(0.22)
(0.33)
(0.01)
(0.21)
(3.4)
(0.007)
(7.2)
(3.2)
(0.19)
(0.14)
(0.07)
(0.33)
–(0.12)
(0.16)
(10)
A. Gutierrez-Rodrıguez et al. / Deep-Sea Research I 57 (2010) 486–500 489
ARTICLE IN PRESS
The relative preference index (RPI) was estimated followingObayashi and Tanoue (2002) as
RPI$mChlai=
PmChlai
'Chlai(=P
'Chlai("5#
where m Chl a is the amount of daily grazed Chl a (mgChl a L!1
d!1), subscript i refers to each phytoplankton group analyzed and[Chl a] is the concentration of Chl a (mgChl a L!1). RPI41indicates positive selection and vice versa.
2.3.3. Photoacclimation in dilution experimentsPhotoacclimation refers to phenotypic adjustments of the cells
in response to variation in irradiance (Falkowski and LaRoche,1991). It is typically reflected in a graded reduction/increase inthe photosynthethic pigment content with increasing/decreasingirradiance (MacIntyre et al., 2002). The nutrient status of the cellsmight also affect the photoacclimation response and the pigmentto carbon ratio (e.g. Geider et al., 1997; Laws and Bannister, 1980).A photoacclimation index (Phi) was calculated separately for thepico- and nano-eukaryotes based on FCM measurements of redfluorescence to side scatter per cell ratio (FL3/SSC). A Phi index foronly irradiance effect (Philight) was calculated by dividing the FL3/SSC of the non-diluted bottles at the end of the incubation by theinitial FL3/SSC (averages of triplicate bottles, Eq. (6)). A second Phiindex accounting for irradiance and nutrient effects (Philight+nut)was estimated dividing the FL3/SSC of the amended bottles at theend of the incubation by the initial FL3/SSC (Eq. (7)). The ratio FL3/SSC was used as a proxy for the Chl a/C to reflect the proportion ofchange in pigment concentration that could be ascribed tochanges in pigment content not related to changes in phyto-plankton carbon biomass. We assumed that photoacclimationduring incubation in the eukaryotic phytoplankton communitywould be more closely reflected by the Phi estimated for nano-eukaryotes (Phinano) and/or picoeukaryotes (Phipico), given theirgreater phylogenetic proximity, than from Phi estimated forSynechococcus.
Philight $"FL3=SSC#funamended
"FL3=SSC#0iinitial"6#
Philight)nut $"FL3=SSC#f amended
"FL3=SSC#0iinitial"7#
The corresponding Phi was included in Eq. (2) to correct forphotoacclimation-derived changes in cell pigment content as
k$1tln
Nt
N0 % D% Philight)nut
! "in nutrient-amended incubations
"8#
k$1tln
Nt
N0 % D% Philight
! "in nutrient-unamended "9#
For the Bloom samples, we applied Phipico to account forphotoacclimation in diatoms, Prasinophyceae, Prymnesiophyceae,Cryptophyceae and Pelagophyceae, because the picoeukaryotepopulation, delineated by their FL3 and SSC signature, was betterdefined in the cytogram. For Post-bloom samples, pico- and nano-eukaryote populations were well defined and we used the averageof Phipico and Phinano as the Phi for the phytoplankton community.Synechococcus growth and grazing rate estimates were based onchanges in zeaxanthin without Phi correction. Given the structur-al role of zeaxanthin (Kana et al., 1988) we assumed that changesin this pigment solely reflected changes in carbon biomass,(Moore et al., 1995; Six et al., 2004).
In order to validate this approach, we analyzed the propor-tionality between FL3/SSC and Chl a/SSC in a picoplanktonicspecies of Prasinophyceae (Bathycoccus, RCC113). This species was
batch-cultured in the laboratory with three different media toobtain nutrient-replete cells (f/2 medium), nitrogen-starved cells(f/2 with 1/10 original nitrate) and phosphorus-starved cells(f/2 with 1/10 original phosphorus). Cultures were grown at160mmolphotonm!2 d!1 for one week. The nutrient-repletetreatment was diluted every 2 days with fresh media in order tokeep cells in exponential phase, while the nutrient-limitedtreatments (N- and P-limited) were not. On day 8, triplicateinitial samples for FCM and HPLC pigment analysis were takenbefore splitting the treatments into two sub-cultures that wereshifted to high-irradiance (HL&300mmolphotonm!2 d!1) andlow-irradiance conditions (LL&20–25mmolphotonm!2 d!1).After 24h, final samples for FCM and HPLC were taken andprocessed as described in Section 2.3.1. Chl a/cell was assessedfrom Chl a concentration estimated with HPLC and cell concen-tration measured with the FCM, while FL3/cell was estimatedfrom FCM-detected FL3 and cell concentration. Changes in FL3and Chl a were normalised to SSC per cell, assumed to beproportional to cell carbon, to obtain FL3/SSC and Chl a/SSC.
2.4. Microzooplankton community
Two types of samples were taken for the study of themicrozooplankton community present in Bloom and Post-bloom.Ciliate samples were preserved in 1% final concentration of anacidic lugol solution. One hundred mL of sample were settled inchambers for at least 48h before enumeration in an invertedmicroscope. Cells were measured with an ocular micrometerand the estimated biovolume was transformed to carbonequivalents using experimentally derived factors for lugol-fixedmarine oligotrichs and tintininids: 0.2 pgC per mm!3 (Putt andStoecker, 1989), and 0.053pgCmm!3 (Verity and Langdon, 1984),respectively.
Heterotrophic nanoflagellate (HNF) samples were fixed with10% glutaraldehyde (final concentration 1%). Thirty mL werefiltered through 0.8mm black polycarbonate filters and stainedwith DAPI (5mg L!1 final concentration). Slides for epifluores-cence were mounted on board and kept at !20 1C until arrival onland. HNF were counted on a Nikon Labophot epifluorescencemicroscope at 1250% (Porter and Feig, 1980), and sized, usinga calibrated ocular micrometer, into 3 size classes (4–8mm,8–16mm and 416mm).
Maximum clearance rate (F) for ciliates (Fc: mL filtered ciliate!1
hour!1) or for HNF (Ff: mL filtered HNF!1 hour!1) was estimatedas:
F $grazing rate
grazer concentration"10#
We consider Fc or Ff as potential maxima because the micro-zooplankton grazing rate is completely assigned to either ciliatesor flagellates in each case.
2.5. P–E curves
Water samples for photosynthesis–irradiance (P–E) experi-ments were taken from 5m depth, between 10:00 and 12:00GMT.The water was introduced into 13 clear and one dark (wrapped inaluminium foil) 70mL tissue culture bottles. The bottles wereinoculated with 10mCi 14C-bicarbonate and incubated for 2h in alinear incubator refrigerated with circulating surface water.Irradiance levels in the incubator ranged from &1 to 1000mmolphotonsm!2 s!1. After incubation, samples were filtered ontoWhatman GF/F filters (25mm diameter), which were placed in6mL scintillation vials and fumed overnight with 35% HCl. Finally,ready safe cocktail was added to the vials, and radioactivity was
A. Gutierrez-Rodrıguez et al. / Deep-Sea Research I 57 (2010) 486–500490

ARTICLE IN PRESS
counted by means of a Beckman LS6500 liquid scintillationcounter. For conversion to carbon units, ambient inorganic carbonconcentration was assumed to be 25000mgCm!3 (Moran andEstrada, 2005).
The model of Webb et al. (1974) was fitted to the Chl a-normalized hourly carbon assimilation rates from the experiments, inorder to derive pBm, the light-saturated Chl a-normalized photosyn-thetic rate (mgCmgChla!1h!1) and aB, the initial slope of the P–Erelationship [mgCmgChla!1h!1 (mmolphotonsm!2 s!1)!1]. Nophotoinhibition was detected in the P–E curves of surface samples.The light saturation parameter or saturation irradiance, EK (mmolphotonsm!2 s!1), was calculated as PBm/aB. The P–E parameters,together with Chl a concentration and hourly PAR values were usedto estimate the daily rates of primary production at 5m depth, thedepth sampled for the dilution experiments.
2.6. C/Chl a and carbon flux estimation
The C/Chl a ratio of the newly produced organic matter wascalculated from the combination of the carbon incorporation ratesestimated from P–E experiments and Chl a synthesis ratesassessed from dilution experiments (Latasa et al., 2005; Obayashiand Tanoue, 2002). Instead of using the slope of the relationbetween carbon and Chl a synthesis rates, as described in Latasaet al. (2005), we calculated the C/Chl a for each particularexperiment carried out in Bloom (n=5) and Post-bloom (n=3)(Obayashi and Tanoue, 2002). We used these C/Chl a values toconvert Chl a-based phytoplankton dynamics into carbon equiva-lents. Although photoacclimation kinetics might vary with cellsize and taxonomic affiliation (Cullen and Lewis, 1988; MacIntyreet al., 2002; Finkel et al., 2004), in view of the impossibility ofreliably assessing the relative sensitivity of major phytoplanktontaxonomic or size groups to irradiance, we had to assume thesame response in terms of C/Chl a ratio for the whole community.However, we followed the method described in Latasa et al.(2005) to account for group-specific C/Chl a response to nutrientlimitation. Briefly, based on the work by Laws and Bannister(1980), where the Chl a/C ratio was shown to be proportional tothe degree of nutrient limitation (m/mmax), we used the analogousNL index (mo/mn) to estimate the degree of nutrient limitation ofeach group. We normalised this group-specific NL against the totalphytoplankton NL (NL normalised=NL_group: NL_total phytoplank-ton) and used it to derive the group-specific Chl a/C from thecommunity Chl a/C following this expression
Group-specific Chla=C$ group NL normalised
% community Chl a=C "11#
The group-specific C/Chl a was obtained as the inverse of theirChl a/C ratio and was applied to convert Chl a fluxes (Eqs. (3) and(4)) into carbon equivalents.
3. Results
3.1. Physico-chemical characteristics and phytoplanktoncommunity structure
Physical and chemical characteristics of the water column aswell as phytoplankton community structure corresponding to thisstudy have been described in detail elsewhere (Latasa et al.,submitted). Here, we will briefly describe the prevailing physico-chemical conditions and outline the main features of surfacephytoplankton composition.
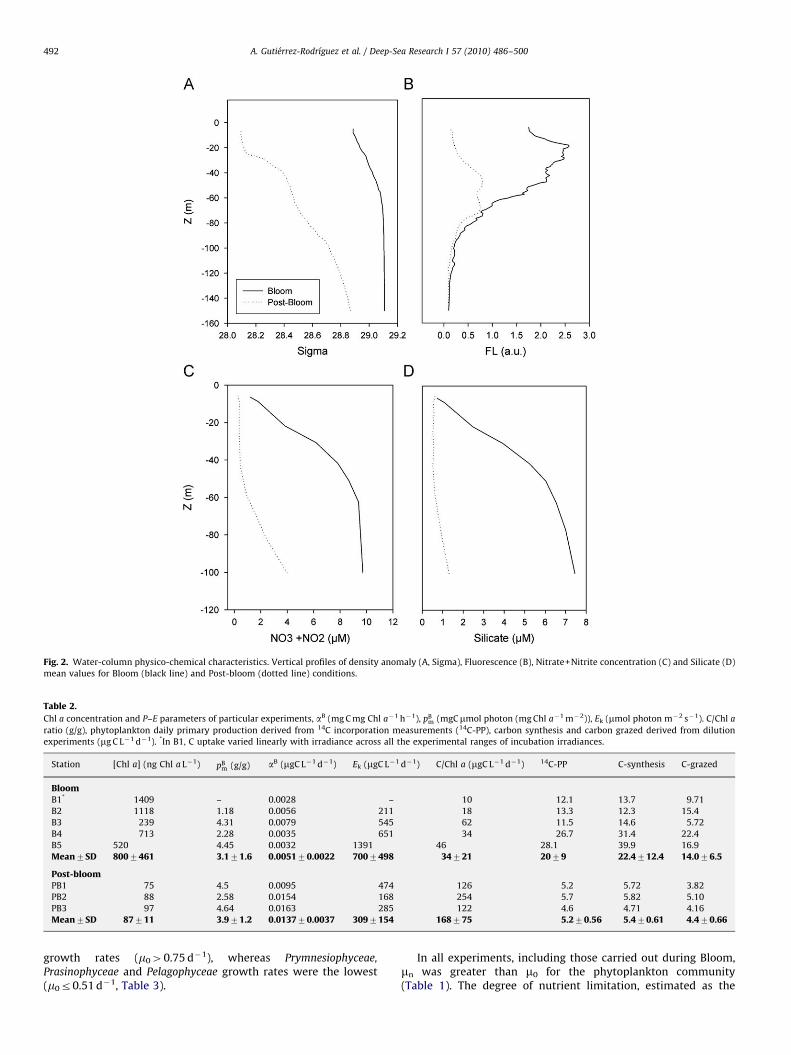
During the Bloom, water column was actively mixed (Fig. 2A).Mixed layer depth (MLD), defined as the depth down to which thedensity anomaly (st) varies less than 0.150 units, ranged between
27 and 69m averaging 45m (Table 1). During Post-bloom, the st
profile was steeper (Fig. 2A), evidencing the increasedstratification, with MLD averaging 29m. Nitrogen (NO3+NO2)and silicate concentrations at the surface (5m) were more thandouble during Bloom compared to Post-bloom, but phosphate andammonium concentrations were similar (Table 1). Nutrientconcentration increased rapidly with depth during Bloom butremained constant or only increased slightly during Post-bloom(Fig. 2C, D) indicating nutrient consumption by phytoplankton,restricted to the upper metres of the water column during Bloom,and extending deeper during Post-bloom. Fluorescence washighest in the first 20m during Bloom and between 40 and60m in Post-bloom (Fig. 2B). The vertical distribution of physical,chemical and biological basic parameters along with seasonaldynamics of surface Chl a, as derived from remote sensingimagery (Morales, 2006; D’Ortenzio and d’Alcala, 2009),supported the interpretation as Bloom and Post-bloom of theconditions, respectively, north and south of the NBF.
Daily integrated surface irradiance was comparable duringBloom and Post-bloom (Table 1), with the exception of the firsttwo days of Bloom (B1 and B2), in which the weather was cloudyand the irradiance measured was much lower (4-fold lower) thanduring the rest of the cruise.
Vertically integrated (between 0 and 100m) Chl a in Bloomwas &3 times higher than in Post-bloom (109 vs 29mgm!2,Latasa et al., submitted). The Chl a concentrations reached duringBloom fell within the upper range reported for the 9-year series ofthe DYFAMED JGOFS station (431250N, 71520E, Marty andChiaverini, 2002) and were comparable to values measuredduring the North Atlantic Bloom Experiment (Joint et al., 1993).Given the different vertical distributions of Chl a, surface Chl aconcentration was on average 10 times higher in Bloom than inPost-bloom (0.8070.46mg L!1 vs 0.0870.01mg L!1, mean7SD,Table 2). However, differences in phytoplankton carbon biomassat the surface between the two conditions were smaller(2075mgC L!1 vs 1477mgC L!1, mean7SD) because of higherC/Chl a values observed during Post-bloom compared to Bloom(see Section 3.5.2). The high heterogeneity during Bloom wasreflected in the higher coefficient of variation of the Chl aconcentration (58% vs 12% during Post-bloom) in agreement withresults from modelling work for the area (Levy et al., 1999, 2000).
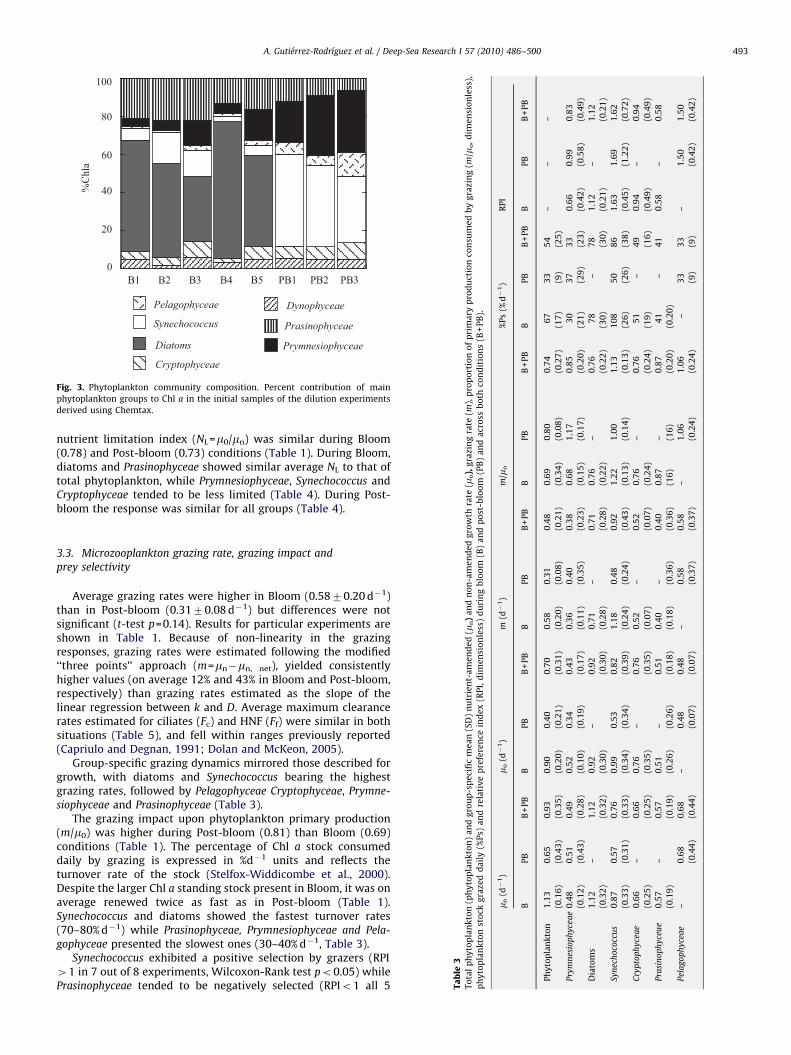
During Bloom, diatoms were the dominant group (53% of Chla), followed by Prasinophyceae (Fig. 3). During Post-bloom, allgroups presented lower biomass than during bloom, but thisdecline was not equal for all phytoplankton groups. Synechococcus(42%) and Prymnesiophyceae (29%) became the dominant taxa anddiatoms virtually disappeared from the surface layer (Fig. 3). Thisshift in the community composition was reflected in thecontribution of eukaryotic phytoplankton to the total Chl a,which decreased from 90% during Bloom to 57% in Post-bloom.The size distribution of the phytoplankton community alsochanged with 70% and 10% of Chl a retained on 5mm filtersduring Bloom and Post-bloom, respectively.
3.2. Phytoplankton growth rate and nutrient limitation
Phytoplankton growth rates are summarized in Table 1. Meangrowth rate for total phytoplankton was higher during Bloom(0.9070.20d!1) than Post-bloom (0.4070.15d!1, t-test,p=0.036). We did not find significant differences (t-test) ingroup-specific growth rates between Bloom and Post-bloom forthe phytoplankton groups analyzed (Table 3). Moreover, specificgrowth-rate values were linked to taxonomic affiliation andrevealed differences among major phytoplankton groups.Diatoms, Synechococcus and Cryptophyceae showed the highest
A. Gutierrez-Rodrıguez et al. / Deep-Sea Research I 57 (2010) 486–500 491
ARTICLE IN PRESS
growth rates (m040.75 d!1), whereas Prymnesiophyceae,Prasinophyceae and Pelagophyceae growth rates were the lowest(m0r0.51d!1, Table 3).
In all experiments, including those carried out during Bloom,mn was greater than m0 for the phytoplankton community(Table 1). The degree of nutrient limitation, estimated as the
Fig. 2. Water-column physico-chemical characteristics. Vertical profiles of density anomaly (A, Sigma), Fluorescence (B), Nitrate+Nitrite concentration (C) and Silicate (D)mean values for Bloom (black line) and Post-bloom (dotted line) conditions.
Table 2.
Chl a concentration and P–E parameters of particular experiments, aB (mgCmg Chl a!1 h!1), pBm (mgCmmol photon (mgChl a!1m!2)), Ek (mmol photon m!2 s!1). C/Chl aratio (g/g), phytoplankton daily primary production derived from 14C incorporation measurements (14C-PP), carbon synthesis and carbon grazed derived from dilutionexperiments (mgC L!1 d!1). *In B1, C uptake varied linearly with irradiance across all the experimental ranges of incubation irradiances.
Station [Chl a] (ng Chl a L!1) pBm (g/g) aB (mgC L!1 d!1) Ek (mgC L!1 d!1) C/Chl a (mgC L!1 d!1) 14C-PP C-synthesis C-grazed
BloomB1* 1409 – 0.0028 – 10 12.1 13.7 9.71B2 1118 1.18 0.0056 211 18 13.3 12.3 15.4B3 239 4.31 0.0079 545 62 11.5 14.6 5.72B4 713 2.28 0.0035 651 34 26.7 31.4 22.4B5 520 4.45 0.0032 1391 46 28.1 39.9 16.9Mean7SD 8007461 3.171.6 0.005170.0022 7007498 34721 2079 22.4712.4 14.076.5
Post-bloomPB1 75 4.5 0.0095 474 126 5.2 5.72 3.82PB2 88 2.58 0.0154 168 254 5.7 5.82 5.10PB3 97 4.64 0.0163 285 122 4.6 4.71 4.16Mean7SD 87711 3.971.2 0.013770.0037 3097154 168775 5.270.56 5.470.61 4.470.66
A. Gutierrez-Rodrıguez et al. / Deep-Sea Research I 57 (2010) 486–500492
ARTICLE IN PRESS
nutrient limitation index (NL=m0/mn) was similar during Bloom(0.78) and Post-bloom (0.73) conditions (Table 1). During Bloom,diatoms and Prasinophyceae showed similar average NL to that oftotal phytoplankton, while Prymnesiophyceae, Synechococcus andCryptophyceae tended to be less limited (Table 4). During Post-bloom the response was similar for all groups (Table 4).
3.3. Microzooplankton grazing rate, grazing impact andprey selectivity
Average grazing rates were higher in Bloom (0.5870.20d!1)than in Post-bloom (0.3170.08d!1) but differences were notsignificant (t-test p=0.14). Results for particular experiments areshown in Table 1. Because of non-linearity in the grazingresponses, grazing rates were estimated following the modified‘‘three points’’ approach (m=mn!mn, net), yielded consistentlyhigher values (on average 12% and 43% in Bloom and Post-bloom,respectively) than grazing rates estimated as the slope of thelinear regression between k and D. Average maximum clearancerates estimated for ciliates (Fc) and HNF (Ff) were similar in bothsituations (Table 5), and fell within ranges previously reported(Capriulo and Degnan, 1991; Dolan and McKeon, 2005).
Group-specific grazing dynamics mirrored those described forgrowth, with diatoms and Synechococcus bearing the highestgrazing rates, followed by Pelagophyceae Cryptophyceae, Prymne-siophyceae and Prasinophyceae (Table 3).
The grazing impact upon phytoplankton primary production(m/m0) was higher during Post-bloom (0.81) than Bloom (0.69)conditions (Table 1). The percentage of Chl a stock consumeddaily by grazing is expressed in %d!1 units and reflects theturnover rate of the stock (Stelfox-Widdicombe et al., 2000).Despite the larger Chl a standing stock present in Bloom, it was onaverage renewed twice as fast as in Post-bloom (Table 1).Synechococcus and diatoms showed the fastest turnover rates(70–80%d!1) while Prasinophyceae, Prymnesiophyceae and Pela-gophyceae presented the slowest ones (30–40%d!1, Table 3).
Synechococcus exhibited a positive selection by grazers (RPI41 in 7 out of 8 experiments, Wilcoxon-Rank test po0.05) whilePrasinophyceae tended to be negatively selected (RPIo1 all 5
0
20
40
60
80
100
Prasinophyceae
Prymnesiophyceae
Pelagophyceae
Synechococcus
Diatoms
Cryptophyceae
Dynophyceae
%Ch
la
B1 B2 B3 B4 B5 PB1 PB2 PB3
Fig. 3. Phytoplankton community composition. Percent contribution of mainphytoplankton groups to Chl a in the initial samples of the dilution experimentsderived using Chemtax.
Table
3Totalphytoplankton(phytoplankton)an
dgroup-specificmea
n(SD)nutrient-am
ended
(mn)an
dnon-amen
ded
growth
rate
(mo),grazingrate
(m),proportionofprimaryproductionco
nsu
med
bygrazing(m
/mo,d
imen
sionless),
phytoplanktonstock
graze
ddaily
(%Ps)
andrelativepreference
index
(RPI,dim
ensionless)duringbloom
(B)an
dpost-bloom
(PB)an
dacross
both
conditions(B
+PB).
m n(d
!1)
m o(d
!1)
m(d
!1)
m/m
o%Ps(%
d!1)
RPI
BPB
B+PB
BPB
B+PB
BPB
B+PB
BPB
B+PB
BPB
B+PB
BPB
B+PB
Phytoplankton
1.13
(0.16)
0.65
(0.43)
0.93
(0.35)
0.90
(0.20)
0.40
(0.21)
0.70
(0.31)
0.58
(0.20)
0.31
(0.08)
0.48
(0.21)
0.69
(0.34)
0.80
(0.08)
0.74
(0.27)
67
(17)
33
(9)
54
(25)
––
–
Prymnesiophycea
e0.48
(0.12)
0.51
(0.43)
0.49
(0.28)
0.52
(0.10)
0.34
(0.19)
0.43
(0.17)
0.36
(0.11)
0.40
(0.35)
0.38
(0.23)
0.68
(0.15)
1.17
(0.17)
0.85
(0.20)
30
(21)
37
(29)
33
(23)
0.66
(0.42)
0.99
(0.58)
0.83
(0.49)
Diatoms
1.12
(0.32)
–1.12
(0.32)
0.92
(0.30)
–0.92
(0.30)
0.71
(0.28)
–0.71
(0.28)
0.76
(0.22)
–0.76
(0.22)
78
(30)
–78
(30)
1.12
(0.21)
–1.12
(0.21)
Synechococcu
s0.87
(0.33)
0.57
(0.31)
0.76
(0.33)
0.99
(0.34)
0.53
(0.34)
0.82
(0.39)
1.18
(0.24)
0.48
(0.24)
0.92
(0.43)
1.22
(0.13)
1.00
(0.14)
1.13
(0.13)
108
(26)
50
(26)
86
(38)
1.63
(0.45)
1.69
(1.22)
1.62
(0.72)
Cryptophycea
e0.66
(0.25)
–0.66
(0.25)
0.76
(0.35)
–0.76
(0.35)
0.52
(0.07)
–0.52
(0.07)
0.76
(0.24)
–0.76
(0.24)
51
(19)
–49
(16)
0.94
(0.49)
–0.94
(0.49)
Prasinop
hycea
e0.57
(0.19)
–0.57
(0.19)
0.51
(0.26)
– (0.26)
0.51
(0.18)
0.40
(0.18)
– (0.36)
0.40
(0.36)
0.87
(16)
– (16)
0.87
(0.20)
41
(0.20)
–41
0.58
–0.58
Pelag
ophycea
e–
0.68
(0.44)
0.68
(0.44)
–0.48
(0.07)
0.48
(0.07)
–0.58
(0.37)
0.58
(0.37)
–1.06
(0.24)
1.06
(0.24)
–33
(9)
33
(9)
–1.50
(0.42)
1.50
(0.42)
A. Gutierrez-Rodrıguez et al. / Deep-Sea Research I 57 (2010) 486–500 493
ARTICLE IN PRESS
experiments, po0.01, Table 3). The rest of the groups did notshow a clear selection trend (p40.15).
3.4. Photoacclimation
Comparison between Chl a/SSC and FL3/SSC in laboratory-cultured picoeukaryotes yielded a significant correlation(r=0.802, p=0.009, model II linear regression), supporting theuse of FL3/SSC as a proxy of Chl a/C. The initial zeaxanthin contentof cultured Synechococcus (RCC513, mean7SD=1.2470.70 fgcell!1) was 3-fold higher than that of prasinophyte Bathycoccus(RCC113, mean7SD=0.4270.20 fg cell!1), while the Chl a con-tent was &10-fold lower in Synechococcus (0.8270.32 fg cell!1)than in Bathycoccus (8.571.8 fg cell!1).
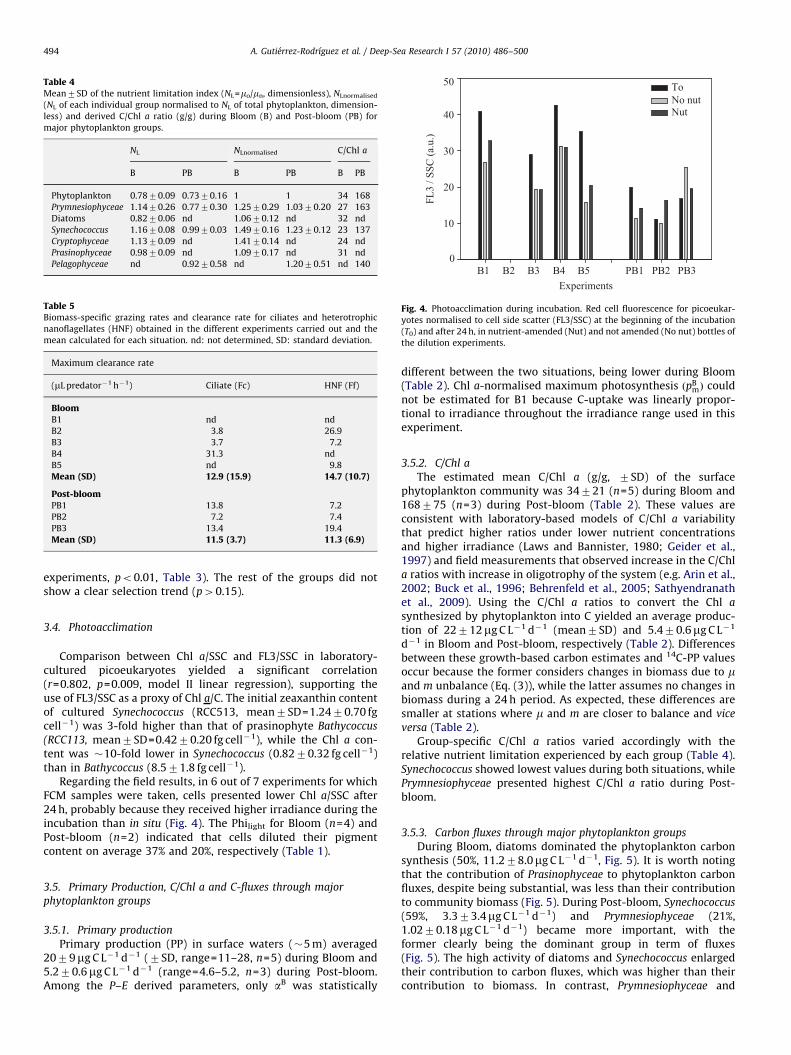
Regarding the field results, in 6 out of 7 experiments for whichFCM samples were taken, cells presented lower Chl a/SSC after24h, probably because they received higher irradiance during theincubation than in situ (Fig. 4). The Philight for Bloom (n=4) andPost-bloom (n=2) indicated that cells diluted their pigmentcontent on average 37% and 20%, respectively (Table 1).
3.5. Primary Production, C/Chl a and C-fluxes through majorphytoplankton groups
3.5.1. Primary productionPrimary production (PP) in surface waters (&5m) averaged
2079mgC L!1 d!1 (7SD, range=11–28, n=5) during Bloom and5.270.6mgC L!1 d!1 (range=4.6–5.2, n=3) during Post-bloom.Among the P–E derived parameters, only aB was statistically
different between the two situations, being lower during Bloom(Table 2). Chl a-normalised maximum photosynthesis "pBm# couldnot be estimated for B1 because C-uptake was linearly propor-tional to irradiance throughout the irradiance range used in thisexperiment.
3.5.2. C/Chl aThe estimated mean C/Chl a (g/g, 7SD) of the surface
phytoplankton community was 34721 (n=5) during Bloom and168775 (n=3) during Post-bloom (Table 2). These values areconsistent with laboratory-based models of C/Chl a variabilitythat predict higher ratios under lower nutrient concentrationsand higher irradiance (Laws and Bannister, 1980; Geider et al.,1997) and field measurements that observed increase in the C/Chla ratios with increase in oligotrophy of the system (e.g. Arin et al.,2002; Buck et al., 1996; Behrenfeld et al., 2005; Sathyendranathet al., 2009). Using the C/Chl a ratios to convert the Chl asynthesized by phytoplankton into C yielded an average produc-tion of 22712mgC L!1 d!1 (mean7SD) and 5.470.6mgC L!1
d!1 in Bloom and Post-bloom, respectively (Table 2). Differencesbetween these growth-based carbon estimates and 14C-PP valuesoccur because the former considers changes in biomass due to mand m unbalance (Eq. (3)), while the latter assumes no changes inbiomass during a 24h period. As expected, these differences aresmaller at stations where m and m are closer to balance and viceversa (Table 2).
Group-specific C/Chl a ratios varied accordingly with therelative nutrient limitation experienced by each group (Table 4).Synechococcus showed lowest values during both situations, whilePrymnesiophyceae presented highest C/Chl a ratio during Post-bloom.
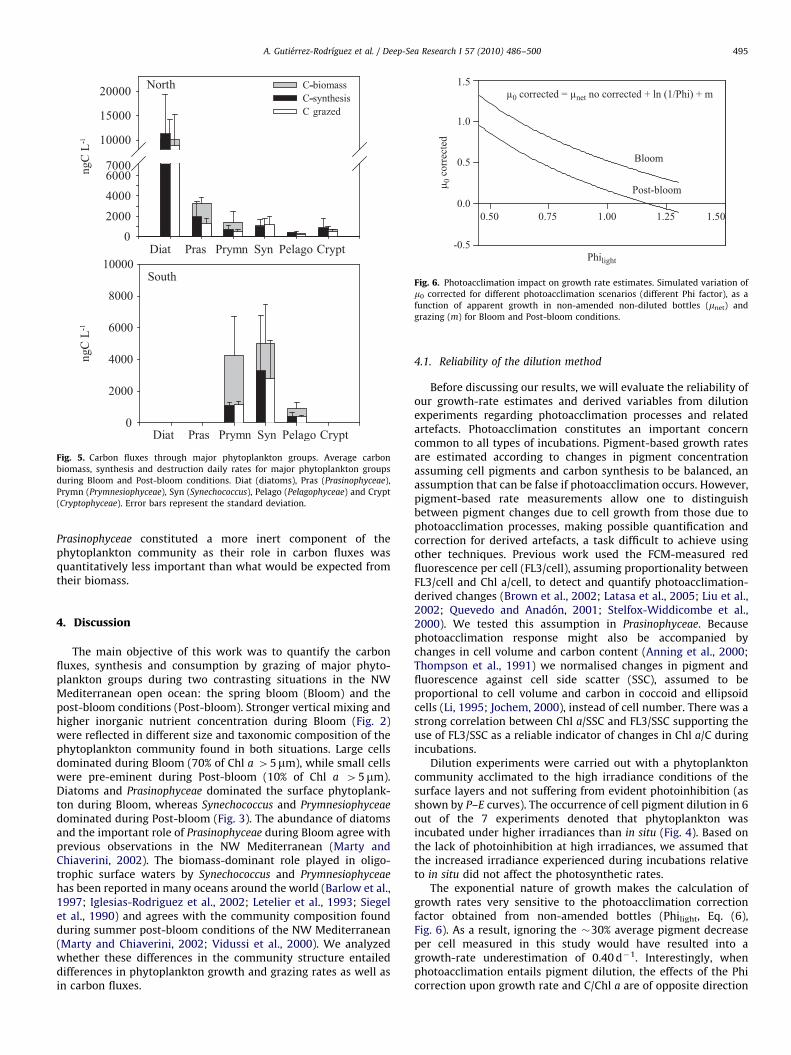
3.5.3. Carbon fluxes through major phytoplankton groupsDuring Bloom, diatoms dominated the phytoplankton carbon
synthesis (50%, 11.278.0mgC L!1 d!1, Fig. 5). It is worth notingthat the contribution of Prasinophyceae to phytoplankton carbonfluxes, despite being substantial, was less than their contributionto community biomass (Fig. 5). During Post-bloom, Synechococcus(59%, 3.373.4mgC L!1 d!1) and Prymnesiophyceae (21%,1.0270.18mgC L!1 d!1) became more important, with theformer clearly being the dominant group in term of fluxes(Fig. 5). The high activity of diatoms and Synechococcus enlargedtheir contribution to carbon fluxes, which was higher than theircontribution to biomass. In contrast, Prymnesiophyceae and
Table 4Mean7SD of the nutrient limitation index (NL=mo/mn, dimensionless), NLnormalised
(NL of each individual group normalised to NL of total phytoplankton, dimension-less) and derived C/Chl a ratio (g/g) during Bloom (B) and Post-bloom (PB) formajor phytoplankton groups.
NL NLnormalised C/Chl a
B PB B PB B PB
Phytoplankton 0.7870.09 0.7370.16 1 1 34 168Prymnesiophyceae 1.1470.26 0.7770.30 1.2570.29 1.0370.20 27 163Diatoms 0.8270.06 nd 1.0670.12 nd 32 ndSynechococcus 1.1670.08 0.9970.03 1.4970.16 1.2370.12 23 137Cryptophyceae 1.1370.09 nd 1.4170.14 nd 24 ndPrasinophyceae 0.9870.09 nd 1.0970.17 nd 31 ndPelagophyceae nd 0.9270.58 nd 1.2070.51 nd 140
Table 5Biomass-specific grazing rates and clearance rate for ciliates and heterotrophicnanoflagellates (HNF) obtained in the different experiments carried out and themean calculated for each situation. nd: not determined, SD: standard deviation.
Maximum clearance rate
(mL predator!1 h!1) Ciliate (Fc) HNF (Ff)
BloomB1 nd ndB2 3.8 26.9B3 3.7 7.2B4 31.3 ndB5 nd 9.8Mean (SD) 12.9 (15.9) 14.7 (10.7)
Post-bloomPB1 13.8 7.2PB2 7.2 7.4PB3 13.4 19.4Mean (SD) 11.5 (3.7) 11.3 (6.9)
Experiments
FL3
/ SSC
(a.u
.)
0
10
20
30
40
50 To No nut Nut
B1 B2 B3 B4 B5 PB1 PB2 PB3
Fig. 4. Photoacclimation during incubation. Red cell fluorescence for picoeukar-yotes normalised to cell side scatter (FL3/SSC) at the beginning of the incubation(T0) and after 24h, in nutrient-amended (Nut) and not amended (No nut) bottles ofthe dilution experiments.
A. Gutierrez-Rodrıguez et al. / Deep-Sea Research I 57 (2010) 486–500494
ARTICLE IN PRESS
Prasinophyceae constituted a more inert component of thephytoplankton community as their role in carbon fluxes wasquantitatively less important than what would be expected fromtheir biomass.
4. Discussion
The main objective of this work was to quantify the carbonfluxes, synthesis and consumption by grazing of major phyto-plankton groups during two contrasting situations in the NWMediterranean open ocean: the spring bloom (Bloom) and thepost-bloom conditions (Post-bloom). Stronger vertical mixing andhigher inorganic nutrient concentration during Bloom (Fig. 2)were reflected in different size and taxonomic composition of thephytoplankton community found in both situations. Large cellsdominated during Bloom (70% of Chl a 45mm), while small cellswere pre-eminent during Post-bloom (10% of Chl a 45mm).Diatoms and Prasinophyceae dominated the surface phytoplank-ton during Bloom, whereas Synechococcus and Prymnesiophyceaedominated during Post-bloom (Fig. 3). The abundance of diatomsand the important role of Prasinophyceae during Bloom agree withprevious observations in the NW Mediterranean (Marty andChiaverini, 2002). The biomass-dominant role played in oligo-trophic surface waters by Synechococcus and Prymnesiophyceaehas been reported in many oceans around the world (Barlow et al.,1997; Iglesias-Rodriguez et al., 2002; Letelier et al., 1993; Siegelet al., 1990) and agrees with the community composition foundduring summer post-bloom conditions of the NW Mediterranean(Marty and Chiaverini, 2002; Vidussi et al., 2000). We analyzedwhether these differences in the community structure entaileddifferences in phytoplankton growth and grazing rates as well asin carbon fluxes.
4.1. Reliability of the dilution method
Before discussing our results, we will evaluate the reliability ofour growth-rate estimates and derived variables from dilutionexperiments regarding photoacclimation processes and relatedartefacts. Photoacclimation constitutes an important concerncommon to all types of incubations. Pigment-based growth ratesare estimated according to changes in pigment concentrationassuming cell pigments and carbon synthesis to be balanced, anassumption that can be false if photoacclimation occurs. However,pigment-based rate measurements allow one to distinguishbetween pigment changes due to cell growth from those due tophotoacclimation processes, making possible quantification andcorrection for derived artefacts, a task difficult to achieve usingother techniques. Previous work used the FCM-measured redfluorescence per cell (FL3/cell), assuming proportionality betweenFL3/cell and Chl a/cell, to detect and quantify photoacclimation-derived changes (Brown et al., 2002; Latasa et al., 2005; Liu et al.,2002; Quevedo and Anadon, 2001; Stelfox-Widdicombe et al.,2000). We tested this assumption in Prasinophyceae. Becausephotoacclimation response might also be accompanied bychanges in cell volume and carbon content (Anning et al., 2000;Thompson et al., 1991) we normalised changes in pigment andfluorescence against cell side scatter (SSC), assumed to beproportional to cell volume and carbon in coccoid and ellipsoidcells (Li, 1995; Jochem, 2000), instead of cell number. There was astrong correlation between Chl a/SSC and FL3/SSC supporting theuse of FL3/SSC as a reliable indicator of changes in Chl a/C duringincubations.
Dilution experiments were carried out with a phytoplanktoncommunity acclimated to the high irradiance conditions of thesurface layers and not suffering from evident photoinhibition (asshown by P–E curves). The occurrence of cell pigment dilution in 6out of the 7 experiments denoted that phytoplankton wasincubated under higher irradiances than in situ (Fig. 4). Based onthe lack of photoinhibition at high irradiances, we assumed thatthe increased irradiance experienced during incubations relativeto in situ did not affect the photosynthetic rates.
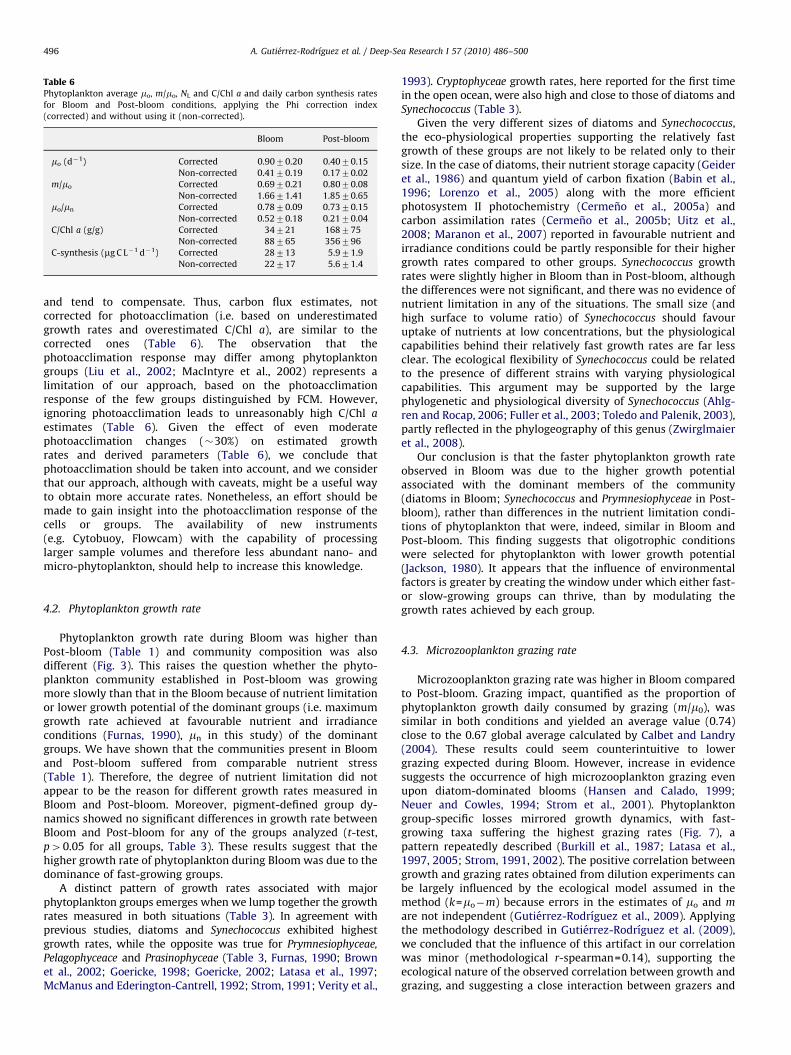
The exponential nature of growth makes the calculation ofgrowth rates very sensitive to the photoacclimation correctionfactor obtained from non-amended bottles (Philight, Eq. (6),Fig. 6). As a result, ignoring the &30% average pigment decreaseper cell measured in this study would have resulted into agrowth-rate underestimation of 0.40 d!1. Interestingly, whenphotoacclimation entails pigment dilution, the effects of the Phicorrection upon growth rate and C/Chl a are of opposite direction
Fig. 5. Carbon fluxes through major phytoplankton groups. Average carbonbiomass, synthesis and destruction daily rates for major phytoplankton groupsduring Bloom and Post-bloom conditions. Diat (diatoms), Pras (Prasinophyceae),Prymn (Prymnesiophyceae), Syn (Synechococcus), Pelago (Pelagophyceae) and Crypt(Cryptophyceae). Error bars represent the standard deviation.
0.50 0.75 1.00 1.25 1.50
-0.5
0.0
0.5
1.0
1.5
Bloom
Post-bloom
µ0 corrected = µnet no corrected + ln (1/Phi) + m
Philight
µ 0 c
orre
cted
Fig. 6. Photoacclimation impact on growth rate estimates. Simulated variation ofm0 corrected for different photoacclimation scenarios (different Phi factor), as afunction of apparent growth in non-amended non-diluted bottles (mnet) andgrazing (m) for Bloom and Post-bloom conditions.
A. Gutierrez-Rodrıguez et al. / Deep-Sea Research I 57 (2010) 486–500 495
ARTICLE IN PRESS
and tend to compensate. Thus, carbon flux estimates, notcorrected for photoacclimation (i.e. based on underestimatedgrowth rates and overestimated C/Chl a), are similar to thecorrected ones (Table 6). The observation that thephotoacclimation response may differ among phytoplanktongroups (Liu et al., 2002; MacIntyre et al., 2002) represents alimitation of our approach, based on the photoacclimationresponse of the few groups distinguished by FCM. However,ignoring photoacclimation leads to unreasonably high C/Chl aestimates (Table 6). Given the effect of even moderatephotoacclimation changes (&30%) on estimated growthrates and derived parameters (Table 6), we conclude thatphotoacclimation should be taken into account, and we considerthat our approach, although with caveats, might be a useful wayto obtain more accurate rates. Nonetheless, an effort should bemade to gain insight into the photoacclimation response of thecells or groups. The availability of new instruments(e.g. Cytobuoy, Flowcam) with the capability of processinglarger sample volumes and therefore less abundant nano- andmicro-phytoplankton, should help to increase this knowledge.
4.2. Phytoplankton growth rate
Phytoplankton growth rate during Bloom was higher thanPost-bloom (Table 1) and community composition was alsodifferent (Fig. 3). This raises the question whether the phyto-plankton community established in Post-bloom was growingmore slowly than that in the Bloom because of nutrient limitationor lower growth potential of the dominant groups (i.e. maximumgrowth rate achieved at favourable nutrient and irradianceconditions (Furnas, 1990), mn in this study) of the dominantgroups. We have shown that the communities present in Bloomand Post-bloom suffered from comparable nutrient stress(Table 1). Therefore, the degree of nutrient limitation did notappear to be the reason for different growth rates measured inBloom and Post-bloom. Moreover, pigment-defined group dy-namics showed no significant differences in growth rate betweenBloom and Post-bloom for any of the groups analyzed (t-test,p40.05 for all groups, Table 3). These results suggest that thehigher growth rate of phytoplankton during Bloom was due to thedominance of fast-growing groups.
A distinct pattern of growth rates associated with majorphytoplankton groups emerges when we lump together the growthrates measured in both situations (Table 3). In agreement withprevious studies, diatoms and Synechococcus exhibited highestgrowth rates, while the opposite was true for Prymnesiophyceae,Pelagophyceace and Prasinophyceae (Table 3, Furnas, 1990; Brownet al., 2002; Goericke, 1998; Goericke, 2002; Latasa et al., 1997;McManus and Ederington-Cantrell, 1992; Strom, 1991; Verity et al.,
1993). Cryptophyceae growth rates, here reported for the first timein the open ocean, were also high and close to those of diatoms andSynechococcus (Table 3).
Given the very different sizes of diatoms and Synechococcus,the eco-physiological properties supporting the relatively fastgrowth of these groups are not likely to be related only to theirsize. In the case of diatoms, their nutrient storage capacity (Geideret al., 1986) and quantum yield of carbon fixation (Babin et al.,1996; Lorenzo et al., 2005) along with the more efficientphotosystem II photochemistry (Cermeno et al., 2005a) andcarbon assimilation rates (Cermeno et al., 2005b; Uitz et al.,2008; Maranon et al., 2007) reported in favourable nutrient andirradiance conditions could be partly responsible for their highergrowth rates compared to other groups. Synechococcus growthrates were slightly higher in Bloom than in Post-bloom, althoughthe differences were not significant, and there was no evidence ofnutrient limitation in any of the situations. The small size (andhigh surface to volume ratio) of Synechococcus should favouruptake of nutrients at low concentrations, but the physiologicalcapabilities behind their relatively fast growth rates are far lessclear. The ecological flexibility of Synechococcus could be relatedto the presence of different strains with varying physiologicalcapabilities. This argument may be supported by the largephylogenetic and physiological diversity of Synechococcus (Ahlg-ren and Rocap, 2006; Fuller et al., 2003; Toledo and Palenik, 2003),partly reflected in the phylogeography of this genus (Zwirglmaieret al., 2008).
Our conclusion is that the faster phytoplankton growth rateobserved in Bloom was due to the higher growth potentialassociated with the dominant members of the community(diatoms in Bloom; Synechococcus and Prymnesiophyceae in Post-bloom), rather than differences in the nutrient limitation condi-tions of phytoplankton that were, indeed, similar in Bloom andPost-bloom. This finding suggests that oligotrophic conditionswere selected for phytoplankton with lower growth potential(Jackson, 1980). It appears that the influence of environmentalfactors is greater by creating the window under which either fast-or slow-growing groups can thrive, than by modulating thegrowth rates achieved by each group.
4.3. Microzooplankton grazing rate
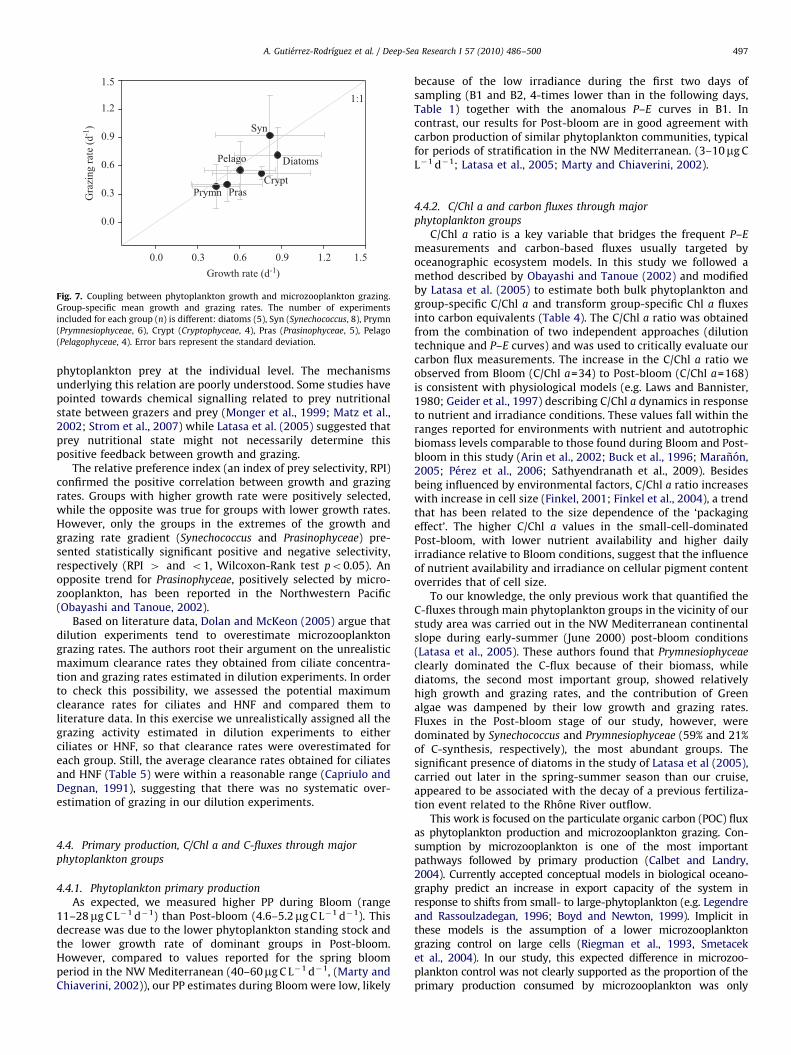
Microzooplankton grazing rate was higher in Bloom comparedto Post-bloom. Grazing impact, quantified as the proportion ofphytoplankton growth daily consumed by grazing (m/m0), wassimilar in both conditions and yielded an average value (0.74)close to the 0.67 global average calculated by Calbet and Landry(2004). These results could seem counterintuitive to lowergrazing expected during Bloom. However, increase in evidencesuggests the occurrence of high microzooplankton grazing evenupon diatom-dominated blooms (Hansen and Calado, 1999;Neuer and Cowles, 1994; Strom et al., 2001). Phytoplanktongroup-specific losses mirrored growth dynamics, with fast-growing taxa suffering the highest grazing rates (Fig. 7), apattern repeatedly described (Burkill et al., 1987; Latasa et al.,1997, 2005; Strom, 1991, 2002). The positive correlation betweengrowth and grazing rates obtained from dilution experiments canbe largely influenced by the ecological model assumed in themethod (k=mo!m) because errors in the estimates of mo and mare not independent (Gutierrez-Rodrıguez et al., 2009). Applyingthe methodology described in Gutierrez-Rodrıguez et al. (2009),we concluded that the influence of this artifact in our correlationwas minor (methodological r-spearman=0.14), supporting theecological nature of the observed correlation between growth andgrazing, and suggesting a close interaction between grazers and
Table 6Phytoplankton average mo, m/mo, NL and C/Chl a and daily carbon synthesis ratesfor Bloom and Post-bloom conditions, applying the Phi correction index(corrected) and without using it (non-corrected).
Bloom Post-bloom
mo (d!1) Corrected 0.9070.20 0.4070.15Non-corrected 0.4170.19 0.1770.02
m/mo Corrected 0.6970.21 0.8070.08Non-corrected 1.6671.41 1.8570.65
mo/mn Corrected 0.7870.09 0.7370.15Non-corrected 0.5270.18 0.2170.04
C/Chl a (g/g) Corrected 34721 168775Non-corrected 88765 356796
C-synthesis (mgC L!1 d!1) Corrected 28713 5.971.9Non-corrected 22717 5.671.4
A. Gutierrez-Rodrıguez et al. / Deep-Sea Research I 57 (2010) 486–500496
ARTICLE IN PRESS
phytoplankton prey at the individual level. The mechanismsunderlying this relation are poorly understood. Some studies havepointed towards chemical signalling related to prey nutritionalstate between grazers and prey (Monger et al., 1999; Matz et al.,2002; Strom et al., 2007) while Latasa et al. (2005) suggested thatprey nutritional state might not necessarily determine thispositive feedback between growth and grazing.
The relative preference index (an index of prey selectivity, RPI)confirmed the positive correlation between growth and grazingrates. Groups with higher growth rate were positively selected,while the opposite was true for groups with lower growth rates.However, only the groups in the extremes of the growth andgrazing rate gradient (Synechococcus and Prasinophyceae) pre-sented statistically significant positive and negative selectivity,respectively (RPI 4 and o1, Wilcoxon-Rank test po0.05). Anopposite trend for Prasinophyceae, positively selected by micro-zooplankton, has been reported in the Northwestern Pacific(Obayashi and Tanoue, 2002).
Based on literature data, Dolan and McKeon (2005) argue thatdilution experiments tend to overestimate microzooplanktongrazing rates. The authors root their argument on the unrealisticmaximum clearance rates they obtained from ciliate concentra-tion and grazing rates estimated in dilution experiments. In orderto check this possibility, we assessed the potential maximumclearance rates for ciliates and HNF and compared them toliterature data. In this exercise we unrealistically assigned all thegrazing activity estimated in dilution experiments to eitherciliates or HNF, so that clearance rates were overestimated foreach group. Still, the average clearance rates obtained for ciliatesand HNF (Table 5) were within a reasonable range (Capriulo andDegnan, 1991), suggesting that there was no systematic over-estimation of grazing in our dilution experiments.
4.4. Primary production, C/Chl a and C-fluxes through majorphytoplankton groups
4.4.1. Phytoplankton primary productionAs expected, we measured higher PP during Bloom (range
11–28mgC L!1 d!1) than Post-bloom (4.6–5.2mgC L!1 d!1). Thisdecrease was due to the lower phytoplankton standing stock andthe lower growth rate of dominant groups in Post-bloom.However, compared to values reported for the spring bloomperiod in the NW Mediterranean (40–60mgC L!1 d!1, (Marty andChiaverini, 2002)), our PP estimates during Bloomwere low, likely
because of the low irradiance during the first two days ofsampling (B1 and B2, 4-times lower than in the following days,Table 1) together with the anomalous P–E curves in B1. Incontrast, our results for Post-bloom are in good agreement withcarbon production of similar phytoplankton communities, typicalfor periods of stratification in the NW Mediterranean. (3–10mgCL!1 d!1; Latasa et al., 2005; Marty and Chiaverini, 2002).
4.4.2. C/Chl a and carbon fluxes through majorphytoplankton groups
C/Chl a ratio is a key variable that bridges the frequent P–Emeasurements and carbon-based fluxes usually targeted byoceanographic ecosystem models. In this study we followed amethod described by Obayashi and Tanoue (2002) and modifiedby Latasa et al. (2005) to estimate both bulk phytoplankton andgroup-specific C/Chl a and transform group-specific Chl a fluxesinto carbon equivalents (Table 4). The C/Chl a ratio was obtainedfrom the combination of two independent approaches (dilutiontechnique and P–E curves) and was used to critically evaluate ourcarbon flux measurements. The increase in the C/Chl a ratio weobserved from Bloom (C/Chl a=34) to Post-bloom (C/Chl a=168)is consistent with physiological models (e.g. Laws and Bannister,1980; Geider et al., 1997) describing C/Chl a dynamics in responseto nutrient and irradiance conditions. These values fall within theranges reported for environments with nutrient and autotrophicbiomass levels comparable to those found during Bloom and Post-bloom in this study (Arin et al., 2002; Buck et al., 1996; Maranon,2005; Perez et al., 2006; Sathyendranath et al., 2009). Besidesbeing influenced by environmental factors, C/Chl a ratio increaseswith increase in cell size (Finkel, 2001; Finkel et al., 2004), a trendthat has been related to the size dependence of the ‘packagingeffect’. The higher C/Chl a values in the small-cell-dominatedPost-bloom, with lower nutrient availability and higher dailyirradiance relative to Bloom conditions, suggest that the influenceof nutrient availability and irradiance on cellular pigment contentoverrides that of cell size.
To our knowledge, the only previous work that quantified theC-fluxes through main phytoplankton groups in the vicinity of ourstudy area was carried out in the NW Mediterranean continentalslope during early-summer (June 2000) post-bloom conditions(Latasa et al., 2005). These authors found that Prymnesiophyceaeclearly dominated the C-flux because of their biomass, whilediatoms, the second most important group, showed relativelyhigh growth and grazing rates, and the contribution of Greenalgae was dampened by their low growth and grazing rates.Fluxes in the Post-bloom stage of our study, however, weredominated by Synechococcus and Prymnesiophyceae (59% and 21%of C-synthesis, respectively), the most abundant groups. Thesignificant presence of diatoms in the study of Latasa et al (2005),carried out later in the spring-summer season than our cruise,appeared to be associated with the decay of a previous fertiliza-tion event related to the Rhone River outflow.
This work is focused on the particulate organic carbon (POC) fluxas phytoplankton production and microzooplankton grazing. Con-sumption by microzooplankton is one of the most importantpathways followed by primary production (Calbet and Landry,2004). Currently accepted conceptual models in biological oceano-graphy predict an increase in export capacity of the system inresponse to shifts from small- to large-phytoplankton (e.g. Legendreand Rassoulzadegan, 1996; Boyd and Newton, 1999). Implicit inthese models is the assumption of a lower microzooplanktongrazing control on large cells (Riegman et al., 1993, Smetaceket al., 2004). In our study, this expected difference in microzoo-plankton control was not clearly supported as the proportion of theprimary production consumed by microzooplankton was only
Growth rate (d-1)
Gra
zing
rate
(d-1
)
0.0
0.3
0.6
0.9
1.2
1.5
Prymn
Diatoms
Syn
CryptPras
Pelago
1:1
0.0 0.3 0.6 0.9 1.2 1.5
Fig. 7. Coupling between phytoplankton growth and microzooplankton grazing.Group-specific mean growth and grazing rates. The number of experimentsincluded for each group (n) is different: diatoms (5), Syn (Synechococcus, 8), Prymn(Prymnesiophyceae, 6), Crypt (Cryptophyceae, 4), Pras (Prasinophyceae, 5), Pelago(Pelagophyceae, 4). Error bars represent the standard deviation.
A. Gutierrez-Rodrıguez et al. / Deep-Sea Research I 57 (2010) 486–500 497
ARTICLE IN PRESS
slightly lower in the diatom-dominated Bloom than in theSynechococcus- and Prymnesiophyceae-dominated Post-bloom (69%vs 81%, respectively). Furthermore, a year-round deployed sedimenttrap located at &2000m did not detect a significant increase incarbon export flux during the Bloom (Scharek, pers. comm.). Thisagrees with studies reporting similar export rates under contrastingphytoplankton composition in both cold (Rivkin, 1996) and warm(Benitez-Nelson et al., 2007) waters. In the latter study, a strongtrophic coupling observed between microzooplankton and phyto-plankton (Landry et al., 2008) was invoked to explain the lack ofexport increase in response to an eddy-driven diatom bloom. Thisexplanation could also apply, in part, in our study area, in whichmicrozooplankton grazing accounted for a similar proportion ofdaily primary production in Bloom and Post-bloom (Table 3).However, the lack of increase in vertical carbon export flux duringthe spring bloom could also be due to factors that we did notaddress in our study, such as advective transport or the effect of themesopelagial biota on controlling downward vertical fluxes.
5. Conclusions
Phytoplankton carbon biomass during Bloom was dominated bylarge diatoms and was higher than the biomass of the Post-bloomcommunity, dominated by Synechococcus and small Prymnesiophy-ceae. Because of the lower C/Chl a measured in Bloom than in Post-bloom, the difference in phytoplankton carbon biomass was muchsmaller than that observed in terms of Chl a, stressing the pivotal roleof the C/Chl a variable for understanding the fluxes of organic matterin the pelagic system (Banse, 2002).
Phytoplankton growth rates were higher during Bloom thanduring Post-bloom. Growth rates exhibited by specific groups ofphytoplankton were similar under both situations (low intra-groupvariability) but were consistently different among groups (highinter-group variability). Distinct growth patterns could be identifiedfor individual groups: diatoms, Synechococcus and Cryptophyceaewere clustered as fast-growing groups, opposite to the slow growthmeasured for Prymnesiophyceae and Prasinophyceae. The degree ofnutrient limitation experienced by phytoplankton was similarduring Bloom and Post-bloom conditions. We conclude that thehigher phytoplankton growth rate observed in Bloom was due tothe higher growth rate of the dominant members of the commu-nity, rather than a better physiological condition of the cells. Thisstudy suggests that the taxonomic composition of the phytoplank-ton thriving in a given ecological situation appears largelydetermined by the prevailing environmental conditions, while bulkphytoplankton growth rate would be largely determined by theparticular physiological characteristics of the dominant groups.
During Bloom, phytoplankton carbon synthesis, sustainedprimarily by diatoms, was higher than during Post-bloom,in which Synechococcus and Prymnesiophyceae dominated carbonproduction. Microzooplankton grazing constituted a major lossprocess of phytoplankton production. For the whole phytoplank-ton, the proportion of primary production consumed by grazingaveraged 0.74 across both situations. Surprisingly, this highrelative impact was comparable in Bloom (0.69) and Post-bloom(0.80). Prasinophyceae and Prymnesiophyceae were identified asthe least reactive groups in terms of energy and material cycling,as their relative contribution to carbon fluxes (production anddestruction) was lower than to biomass. The opposite was true forSynechococcus, the contribution of which to carbon fluxes washigher than what would have been predicted from their biomass.
This study shows that changes in phytoplankton carbonfluxes in the open northwestern Mediterranean Sea could belargely related to variation in community structure. Our findingshighlight the benefits of studying the composition of the
community in order to better understand the factors controllingphytoplankton production, a necessary step to improve ourpredictive capability of the response of the ocean carbon cycleto local and global environmental changes.
Acknowledgements
This study was supported by the project EFLUBIO (REN2002-04151-C02-01, former Ministry of Science and Technology,Spanish Government) and associated pre-doctoral grant (BES-2003 0895) both funded by the Spanish Ministry of Education andScience. We thank the captain and crew of the RV Cornide deSaavedra and all the EFLUBIO shipmates and colleagues for theirexcellence support during the cruise. The comments from threeanonymous reviewers helped greatly to improve the initialversion of this work.
References
Ahlgren, N.A., Rocap, G., 2006. Culture isolation and culture-independent clonelibraries reveal new marine Synechococcus ecotypes with distinctive light andN physiologies. Appl. Environ. Microb. 72, 7193–7204.
Anning, T., MacIntyre, H.L., Pratt, S.M., Sammes, P.J., Gibb, S., Geider, R.J., 2000.Photoacclimation in the marine diatom Skeletonema costatum. Limnol.Oceanogr. 45, 1807–1817.
Arin, L., Moran, X.A.G., Estrada, M., 2002. Phytoplankton size distribution andgrowth rates in the Alboran Sea (SW Mediterranean): short term variabilityrelated to mesoscale hydrodynamics. J. Plankton Res. 24, 1019–1033.
Babin, M., Morel, A., Claustre, H., Bricaud, A., Kolber, Z., Falkowski, P., 1996.Nitrogen- and irradiance-dependent variations of the maximum quantumyield of carbon fixation in eutrophic, mesotrophic and oligotrophic marinesystems. Deep-Sea Res. Pt I 43, 1241–1272.
Banse, K., 2002. Should we continue to measure 14C-uptake by phytoplankton foranother 50 years. Limnol. Oceanogr. Bull. 11, 45–46.
Barlow, R.G., Mantoura, R.F.C., Cummings, D.G., Fileman, T.W., 1997. Pigmentchemotaxonomic distributions of phytoplankton during summer in thewestern Mediterranean. Deep-Sea Res. Pt II 44, 833–850.
Behrenfeld, M.J., Boss, E., Siegel, D.A., Shea, D.M., 2005. Carbon-based oceanproductivity and phytoplankton physiology from space. Global Biogeochem.Cycle 19, GB1006, doi:10.1029/2004GB002299.
Benitez-Nelson, C.R., Bidigare, R.R., Dickey, T.D., Landry, M.R., Leonard, C.L., Brown,S.L., Nencioli, F., Rii, Y.M., Maiti, K., Becker, J.W., Bibby, T.S., Black, W., Cai, W.J.,Carlson, C.A., Chen, F.Z., Kuwahara, V.S., Mahaffey, C., McAndrew, P.M., Quay,P.D., Rappe, M.S., Selph, K.E., Simmons, M.P., Yang, E.J., 2007. Mesoscale eddiesdrive increased silica export in the subtropical Pacific Ocean. Science 316,1017–1021.
Boyd, P.W., Newton, P.P., 1999. Does planktonic community structure determinedownward particulate organic carbon flux in different oceanic provinces?Deep-Sea Res. Pt I 46, 63–91.
Bosc, E., Bricaud, A., Antoine, D., 2004. Seasonal and interannual variability in algalbiomass and primary production in the Mediterranean Sea, as derived from 4years of SeaWiFS observations. Global Biogeochem. Cycle 18, GB1005doi:10.1029/2003GB002034.
Brown, S.L., Landry, M.R., Barber, R.T., Campbell, L., Garrison, D.L., Gowing, M.M.,1999. Picophytoplankton dynamics and production in the Arabian Sea duringthe 1995 Southwest Monsoon. Deep-Sea Res. Pt II 46, 1745–1768.
Brown, S.L., Landry, M.R., Christensen, S., Garrison, D., Gowing, M.M., Bidigare, R.R.,Campbell, L., 2002. Microbial community dynamics and taxon-specificphytoplankton production in the Arabian Sea during the 1995 monsoonseasons. Deep-Sea Res. Pt II 49, 2345–2376.
Buck, K.R., Chavez, F.P., Campbell, L., 1996. Basin-wide distributions of livingcarbon components and the inverted trophic pyramid of the central gyre of theNorth Atlantic Ocean, summer 1993. Aquat. Microb. Ecol. 10, 283–298.
Burkill, P.H., Mantoura, R.F.C., Llewellyn, C.A., Owens, N.J.D., 1987. Microzoo-plankton grazing and selectivity of phytoplankton in coastal waters. Mar. Biol.93, 581–590.
Calbet, A., Landry, M.R., 2004. Phytoplankton growth, microzooplankton grazing,and carbon cycling in marine systems. Limnol. Oceanogr. 49, 51–57.
Capelli, R., Das, K., Pellegrini, R.D., Drava, G., Lepoint, G., Miglio, C., Minganti, V.,Poggi, R., 2008. Distribution of trace elements in organs of six species ofcetaceans from the Ligurian Sea (Mediterranean), and the relationship withstable carbon and nitrogen ratios. Sci. Total Environ. 390, 569–578.
Capriulo, G.M., Degnan, C., 1991. Effect of food concentration on digestion andvacuole passage time in the heterotrichous marine ciliate Fibrea-Salina. Mar.Biol. 110, 199–202.
Cermeno, P., Estevez-Blanco, P., Maranon, E., 2005a. Maximum photosyntheticefficiency of size-fractionated phytoplankton assessed by C-14 uptake and fastrepetition rate fluorometry. Limnol. Oceanogr. 50, 1438–1446.
A. Gutierrez-Rodrıguez et al. / Deep-Sea Research I 57 (2010) 486–500498
ARTICLE IN PRESS
Cermeno, P., Maranon, E., Rodriguez, J., Fernandez, E., 2005b. Large-sizedphytoplankton sustains higher carbon specific photosynthesis than smallercells in a coastal eutrophic ecosystem. Mar. Ecol. Prog. Ser. 297, 51–60.
Cullen, J.J., Lewis, M.R., 1988. The kinetics of algal photoadaptation in the contextof vertical mixing. J. Plankton Res. 10, 1039–1063.
D’Ortenzio, F., d’Alcala, M.R., 2009. On the trophic regimes of the MediterraneanSea: a satellite analysis. Biogeosciences 6, 139–148.
Deschamps, P.Y., Frouin, R., Crepon, M., 1984. Sea surface temperatures of thecoastal zones of France observed by the HCMM satellite. J. Geophys. Res. 89,8123–8149.
Dolan, J.R., McKeon, K., 2005. The reliability of grazing rate estimates from dilutionexperiments: have we over-estimated rates of organic carbon consumption bymicrozooplankton? Ocean Sci. 1, 1–7.
Estrada, M., 1991. Phytoplankton assemblages across a NW Mediterranean front:changes from winter mixing to spring stratification. In: Ros, J.D., Prat, N. (Eds.),Homage to Ramon Margalef or Why there is such pleasure in studying nature.Oecol. Aquat., pp. 157–185.
Estrada, M., Varela, R.A., Salat, J., Cruzado, A., Arias, E., 1999. Spatio-temporalvariability of the winter phytoplankton distribution across the Catalan andnorth Balearic fronts (NW Mediterranean). J. Plankton Res. 21, 1–20.
Evans, G.T., Paranjape, M.A., 1992. Precision of estimates of phytoplankton growthand microzooplankton grazing when the functional response of grazers maybe nonlinear. Mar. Ecol. Prog. Ser. 80, 285–290.
Falkowski, P.G., LaRoche, J., 1991. Acclimation to espectral irradiance in algae. J.Phycol. 27, 8–14.
Falkowski, P.G., Laws, E.A., Barber, R.T., Murray, J.W., 2003. Phytoplankton andtheir role in primary, new and export production. In: Fasham, M.J.R. (Ed.),Ocean Biogeochemistry: The Role of the Ocean Carbon Cycle in Global Change.Global Change—The IGBP Series, pp. 99–119.
Finkel, Z.V., 2001. Light absorption and size scaling of light-limited metabolism inmarine diatoms. Limnol. Oceanogr. 46, 86–94.
Finkel, Z.V., Irwin, A.J., Schofield, O., 2004. Resource limitation alters the 3/4 sizescaling of metabolic rates in phytoplankton. Mar. Ecol. Prog. Ser. 273, 269–279.
Fofonoff, N.P., Millard Jr., R.C., 1983. Algorithms for computation of fundamentalproperties of seawater. UNESCO Tech. Pap. Mar. Sci. 44, 1–53.
Frost, B.W., 1972. Effects of size and concentration of food particles on feedingbehaviour of marine planktonic copepod Calanus pacificus. Limnol. Oceanogr.17, 805–815.
Fuller, N.J., Marie, D., Partensky, F., Vaulot, D., Post, A.F., Scanlan, D.J., 2003. Clade-specific 16S ribosomal DNA oligonucleotides reveal the predominance of asingle marine Synechococcus clade throughout a stratified water column inthe Red Sea. Appl. Environ. Microbiol. 69, 2430–2443.
Furnas, M.J., 1990. In situ growth rates of marine phytoplankton: approaches tomeasurement, community and species growth rates. J. Plankton Res. 12,1117–1151.
Gallegos, C.L., 1989. Microzooplankton grazing on phytoplankton in the RhodeRiver, Maryland: nonlinear feeding kinetics. Mar. Ecol. Prog. Ser. 57, 23–33.
Gasol, J.M., del Giorgio, P.A., 2000. Using flow cytometry for counting naturalplankton bacteria and understanding the structure of planktonic bacterialcommunities. In: Reckermann, M., Colin, F. (Eds.), Aquatic Flow Cytometry:Achievements and Prospects. Barcelona, Spain, pp. 197–224.
Geider, R.J., MacIntyre, H.L., Kana, T.M., 1997. Dynamic model of phytoplanktongrowth and acclimation: responses of the balanced growth rate and thechlorophyll a: carbon ratio to light, nutrient-limitation and temperature. Mar.Ecol. Prog. Ser. 148, 187–200.
Geider, R.J., Platt, T., Raven, J.A., 1986. Size dependence of growth andphotosynthesis in diatoms: a synthesis. Mar. Ecol. Prog. Ser. 30, 93–104.
Gifford, D.J., 1988. Impact of grazing by microzooplankton in the Northwest arm ofHalifax Harbor, Nova-Scotia. Mar. Ecol. Prog. Ser. 47, 249–258.
Goericke, R., 1998. Response of phytoplankton community structure and taxon-specific growth rates to seasonally varying physical forcing in the Sargasso Seaoff Bermuda. Limnol. Oceanogr. 43, 921–935.
Goericke, R., 2002. Top-down control of phytoplankton biomass and communitystructure in the monsoonal Arabian Sea. Limnol. Oceanogr. 47, 1307–1323.
Goericke, R., Welschmeyer, N.A., 1993. The marine Prochlorophyte Prochlorococ-cus contributes significantly to phytoplankton biomass and primary produc-tion in the Sargasso Sea. Deep-Sea Res. Pt I 40, 2283–2294.
Grasshoff, K., Ehrhardt, M., Kremling, K., 1999. Methods of Seawater Analysis, Thirdedition Verlag Chemie, Weinheim.
Guillard, R.R., Ryther, J.H., 1962. Studies of marine planktonic diatoms. 1.Cyclotella nana Hustedt, and Detonula confervacea (Cleve) Gran. Can. J.Microbiol. 8, 229–239.
Gutierrez-Rodrıguez, A., Latasa, M., Mourre, B., Laws, E.A., 2009. Coupling betweenphytoplankton growth and microzooplankton grazing in dilutiton experi-ments: potential artefacts. Mar. Ecol. Prog. Ser. 314, 1–14.
Hansen, P.J., Calado, A.J., 1999. Phagotrophic mechanisms and prey selection infree-living dinoflagellates. J. Eukaryotic Microbiol. 46, 382–389.
Hood, R.R., Laws, E.A., Armstrong, R.A., Bates, N.R., Brown, C.W., Carlson, C.A., Chai,F., Doney, S.C., Falkowski, P.G., Feely, R.A., Friedrichs, M.A.M., Landry, M.R.,Moore, J.K., Nelson, D.M., Richardson, T.L., Salihoglu, B., Schartau, M., Toole,D.A., Wiggert, J.D., 2006. Pelagic functional group modelling: progress,challenges and prospects. Deep-Sea Res. Pt II 53, 459–512.
Iglesias-Rodriguez, M.D., Brown, C.W., Doney, S.C., Kleypas ,J., Kolber, D., Kolber, Z.,Hayes, P.K., Falkowski, P.G., 2002. Representing key phytoplankton functionalgroups in ocean carbon cycle models: Coccolithophorids. Global Biogeochem.Cycle 16 (4), 1100, doi:10.1029/2001GB001454.
Jackson, G.A., 1980. Phytoplankton growth and zooplankton grazing in oligo-trophic oceans. Nature 284, 439–441.
Jochem, F.J., 2000. Probing the physiological state of phytoplankton at the single-cell level. Sci. Mar. 64, 183–195.
Joint, I., Pomroy, A., Savidge, G., Boyd, P., 1993. Size-fractionated primaryproductivity in the Northeast Atlantic in May–July 1989. Deep-Sea Res. Pt I40, 423–440.
Kana, T.M., Glibert, P.M., Goericke, R., Welschmeyer, N.A., 1988. Zeaxanthin and a-carotene in Synechococcus WH7803 respond differently to irradiance. Limnol.Oceanogr. 33, 1623–1627.
Landry, M.R., Hassett, R.P., 1982. Estimating the grazing impact of marinemicrozooplankton. Mar. Biol. 67, 283–288.
Landry, M.R., Constantinou, J., Kirshtein, J., 1995a. Microzooplankton grazing in thecentral equatorial Pacific during February and August, 1992. Deep-Sea Res. Pt II42, 657–671.
Landry, M.R., Kirshtein, J., Constantinou, J., 1995b. A refined dilution technique formeasuring the community grazing impact of microzooplankton, with experi-mental tests in the central equatorial Pacific. Mar. Ecol. Prog. Ser. 120, 53–63.
Landry, M.R., Brown, S.L., Campbell, L., Constantinou, J., Liu, H.B., 1998. Spatialpatterns in phytoplankton growth and microzooplankton grazing in theArabian Sea during monsoon forcing. Deep-Sea Res. Pt II 45, 2353–2368.
Landry, M.R., Constantinou, J., Latasa, M., Brown, S.L., Bidigare, R.R., Ondrusek, M.E.,2000. Biological response to iron fertilization in the eastern equatorial Pacific(IronEx II). III. Dynamics of phytoplankton growth and microzooplanktongrazing. Mar. Ecol. Prog. Ser. 201, 57–72.
Landry, M.R., Brown, S.L., Rii, Y.M., Selph, K.E., Bidigare, R.R., Yang, E.J., Simmons,M.P., 2008. Depth-stratified phytoplankton dynamics in Cyclone Opal, asubtropical mesoscale eddy. Deep-Sea Res. Pt II 55, 1348–1359.
Latasa, M., 2007. Improving estimations of phytoplankton class abundances usingCHEMTAX. Mar. Ecol. Prog. Ser. 329, 13–21.
Latasa, M., Landry, M.R., Schluter, L., Bidigare, R.R., 1997. Pigment-specific growthand grazing rates of phytoplankton in the central equatorial Pacific. Limnol.Oceanogr. 42, 289–298.
Latasa, M., Moran, X., Scharek, R., Estrada, M., 2005. Estimating the carbon fluxthrough main phytoplankton groups in the northwestern Mediterranean.Limnol. Oceanogr. 50, 1447–1458.
Latasa, M., Van Lenning, K., Garrido, J.L., Scharek, R., Estrada, M., Rodriguez, F.,Zapata, M., 2001. Losses of chlorophylls and carotenoids in aqueous acetoneand methanol extracts prepared for RPHPLC analysis of pigments. Chromato-graphia 53, 385–391.
Laws, E.A., Bannister, T.T., 1980. Nutrient- and light-limited growth of Thalassio-sira fluviatilis in continuous culture, with implications for phytoplanktongrowth in the ocean. Limnol. Oceanogr. 25, 457–473.
Legendre, L., Rassoulzadegan, F., 1996. Food-web mediated export ofbiogenic carbon in oceans: hydrodynamic control. Mar. Ecol. Prog. Ser. 145,179–193.
Le Qu!er !e, C., Harrison, S.P., Prentice, I.C., Buitenhuis, E.T., Aumont, O., Bopp, L.,Claustre, H., Da Cunha, L.C., Geider, R., Giraud, X., Klaas, C., Kohfeld, K.E.,Legendre, L., Manizza, M., Platt, T., Rivkin, R.B., Sathyendranath, S., Uitz, J.,Watson, A.J., Wolf-Gladrow, D., 2005. Ecosystem dynamics based on planktonfunctional types for global ocean biogeochemistry models. Global Change Biol.11, 2016–2040.
Letelier, R.M., Bidigare, R.R., Hebel, D.V., Ondrusek, M., Winn, C.D., Karl, D.M., 1993.Temporal variability of phytoplankton community structure based on pigmentanalysis. Limnol. Oceanogr. 38, 1420–1437.
Levy, M., Memery, L., Madec, G., 1999. The onset of the Spring Bloom in the MEDOCarea: mesoscale spatial variability. Deep-Sea Res. Pt I 46, 1137–1160.
Levy, M., Memery, L., Madec, G., 2000. Combined effects of mesoscale processesand atmospheric high-frequency variability on the spring bloom in the MEDOCarea. Deep-Sea Res. Pt I 47, 27–53.
Li, W.K.W., 1994. Primary production of Prochlorophytes, Cyanobacteria andeukaryotic ultraphytoplankton—measurements from flow cytometric sorting.Limnol. Oceanogr. 39, 169–175.
Li, W.K.W., 1995. Composition of Ultraphytoplankton in the Central North-Atlantic. Mar. Ecol. Prog. Ser. 122, 1–8.
Li, W.K.W., Dickie, P.M., Harrison, W.G., Irwin, B.D., 1993. Biomass and productionof bacteria and phytoplankton during the Spring Bloom in the western North-Atlantic Ocean. Deep-Sea Res. Pt II 40, 307–327.
Liu, H., Suzuki, K., Saino, T., 2002. Phytoplankton growth and microzooplanktongrazing in the subarctic Pacific Ocean and the Bering Sea during summer 1999.Deep-Sea Res. Pt I 49, 363–375.
Lorenzo, L.M., Arbones, B., Tilstone, G.H., Figueiras, F.G., 2005. Across-shelfvariability of phytoplankton composition, photosynthetic parameters andprimary production in the NW Iberian upwelling system. J Mar. Syst. 54,157–173.
MacIntyre, H.L., Kana, T.M., Anning, T., Geider, R.J., 2002. Photoacclimation ofphotosynthesis irradiance response curves and photosynthetic pigments inmicroalgae and cyanobacteria. J. Phycol. 38, 17–38.
Mackey, M.D., Mackey, D.J., Higgins, H.W., Wright, S.W., 1996. CHEMTAX—aprogram for estimating class abundances from chemical markers: applicationto HPLC measurements of phytoplankton. Mar. Ecol. Prog. Ser. 144, 265–283.
Maranon, 2005. Phytoplankton growth rates in the Atlantic subtropical gyres.Limnol. Oceanogr. 50, 299–310.
Maranon, E., Cermeno, P., Rodriguez, J., Zubkov, M.V., Harris, R.P., 2007. Scaling ofphytoplankton photosynthesis and cell size in the ocean. Limnol. Oceanogr. 52,2190–2198.
A. Gutierrez-Rodrıguez et al. / Deep-Sea Research I 57 (2010) 486–500 499
ARTICLE IN PRESS
Margalef, R., 1978. Life forms of phytoplankton as survival alternatives in anunstable environment. Oceanol. Acta 1, 493–509.
Marty, J.C., Chiaverini, J., 2002. Seasonal and interannual variations in phyto-plankton production at DYFAMED time-series station, northwestern Mediter-ranean Sea. Deep-Sea Res. Pt II 49, 2017–2030.
McManus, G.B., 1995. Phytoplankton abundance and pigment changes duringsimulated in situ dilution experiments in estuarine waters: possible artefactscaused by algal light adaptation. J. Plankton Res. 17, 1705–1716.
McManus, G.B., Ederington-Cantrell, M.C., 1992. Phytoplankton pigments andgrowth rates, and microzooplankton grazing in a large temperate estuary. Mar.Ecol. Prog. Ser. 87, 77–85.
Millot, C., 1999. Circulation in the western mediterranean sea. J. Mar. Syst. 20,423–442.
Moigis, A.G., 2006. The clearance rate of Microzooplankton as the key element fordescribing estimated non-linear dilution plots demonstrated by a model. Mar.Biol. 149, 743–762.
Matz, C., Boenigk, J., Arndt, H., Jurgens, K., 2002. Role of bacterial phenotypic traitsin selective feeding of the heterotrophic nanoflagellate Spumella sp. Aquat.Microb. Ecol. 27, 137–148.
Monger, B.C., Landry, M.R., Brown, S.L., 1999. Feeding selection of heterotrophicmarine nanoflagellates based on the surface hydrophobicity of their pico-plankton prey. Limnol. Oceanogr. 44, 1917–1927.
Moore, L.R., Goericke, R., Chisholm, S.W., 1995. Comparative physiology ofSynechococcus and Prochlorococcus: influence of light and temperature ongrowth, pigments, fluorescence and absorptive properties. Mar. Ecol. Prog. Ser.116, 259–275.
Morales, A.B., 2006. Ph.D. Dissertation, Universidad Politecnica de Catalunya,Barcelona, Spain.
Moran, X., Estrada, M., 2005. Winter pelagic photosynthesis in the NWMediterranean. Deep-Sea Res. Pt I 52, 1806–1822.
Morel, A., Andre, J.M., 1991. Pigment distribution and primary production in thewestern Mediterranean as derived and modelled from Coastal Zone ColorScanner observations. J Geophys. Res.—Oceans 96, 12685–12698.
Neuer, S., Cowles, T.J., 1994. Protist herbivory in the Oregon upwelling system.Mar. Ecol. Prog. Ser. 113, 147–162.
Notarbartolo, G., Ausenda, F., Orsi Relini, L., Relini, G., 1992. Una proposta digestione dell’ambiente pelagico: la Riserva della Biosfera nel Bacino corso-ligure provenzale. Atti XXII Congreso della Societ!a Italiana di Biologıa Marina,20-24 May, 1991, Santa Margherita di Pulla, Cagliari. Oebalia 17, 517–521.
Obayashi, Y., Tanoue, E., 2002. Growth and mortality rates of phytoplankton in thenorthwestern North Pacific estimated by the dilution method and HPLCpigment analysys. J. Exp. Mar. Biol. Ecol. 280, 33–52.
Perez, V., Fernandez, E., Maranon, E., Moran, X.A.G., Zubkov, M.V., 2006. Verticaldistribution of phytoplankton biomass, production and growth in the Atlanticsubtropical gyres. Deep-Sea Res. Pt I 53, 1616–1634.
Porter, K., Feig, Y.S., 1980. The use of DAPI for identifying and counting aquaticmicroflora. Limnol. Oceanogr. 25, 943–948.
Putt, M., Stoecker, D.K., 1989. An experimentally determined carbon : volume ratiofor marine oligotrichous ciliates from estuarine and coastal waters. Limnol.Oceanogr. 34, 1097–1104.
Quevedo, M., Anadon, R., 2001. Protist control of phytoplankton growth in thesubtropical north-east Atlantic. Mar. Ecol. Prog. Ser. 221, 29–38.
Redden, A.M., Sanderson, B.G., Rissik, D., 2002. Extending the analysis of thedilution method to obtain the phytoplankton concentration at whichmicrozooplankton grazing becomes saturated. Mar. Ecol. Prog. Ser. 226, 27–33.
Riegman, R., Kuipers, B.R., Noordeloos, A.A.M., Witte, H.J., 1993. Size-differentialcontrol of phytoplankton and the structure of plankton communities. Neth. J.Sea Res. 31, 255–265.
Rivkin, R.V., 1996. Vertical flux of biogenic carbon in the oceans: Is there food webcontrol? Science 272, 1163–1166.
Rivkin, R.B., Putland, J.N., Anderson, M.R., Deibel, D., 1999. Microzooplanktonbacterivory and herbivory in the NE subarctic Pacific. Deep-Sea Res. Pt II 46,2579–2618.
Sathyendranath, S., Stuart, V., Nair, A., Oka, K., Nakane, T., Bouman, H., Forget, M.H.,Maass, H., Platt, T., 2009. Carbon-to-chlorophyll ratio and growth rate ofphytoplankton in the sea. Mar. Ecol. Prog. Ser. 383, 73–84.
Siegel, D.A., Iturriaga, R., Bidigare, R.R., Smith, R.C., Pak, H., Dickey, T.D., Marra, J.,Baker, K.S., 1990. Meridional variations of the spring-time phytoplanktoncommunity in the Sargasso Sea. J. Mar. Res. 48, 379–412.
Six, C., Thomas, J.C., Brahamsha, B., Lemoine, Y., Partensky, F., 2004. Photophysiol-ogy of the marine cyanobacterium Synechococcus sp. WH8102, a new modelorganism. Aquat. Microb. Ecol. 35, 17–29.
Smetacek, V., Assmy, P., Henjes, J., 2004. The role of grazing in structuring SouthernOcean pelagic ecosystems and biogeochemical cycles. Antarct. Sci. 16,541–558.
Stelfox-Widdicombe, C.E., Edwards, E.S., Burkill, P.H., Sleigh, M.A., 2000. Micro-zooplankton grazing activity in the temperate and sub-tropical NE Atlantic:summer 1996. Mar. Ecol. Prog. Ser. 208, 1–12.
Strathmann, R.R., 1967. Estimating the organic carbon content of phytoplanktonfrom cell volume or plasma volume. Limnol. Oceanogr. 12, 411–418.
Strom, S.L., 1991. Growth and grazing rates of the herbivorous dinoflagellateGymnodinium sp. from the open subarctic Pacific Ocean. Mar. Ecol. Prog. Ser.78, 103–113.
Strom, S.L., 2002. Novel interactions between phytoplankton and microzooplank-ton: their influence on the coupling between growth and grazing rates in thesea. Hydrobiologia 480, 41–54.
Strom, S.L., Macri, E.L., Olson, B., 2007. Microzooplankton grazing in the coastalGulf of Alaska: Variations in top-down control of phytoplankton. Limnol.Oceanogr. 52, 1480–1494.
Strom, S.L., Brainard, M.A., Holmes, J.L., Olson, M.B., 2001. Phytoplankton bloomsare strongly impacted by microzooplankton grazing in coastal North Pacificwaters. Mar. Biol. 138, 355–368.
Teixeira, I.G., Figueiras, F.G., 2009. Feeding behaviour and non-linear responses indilution experiments in a coastal upwelling system. Aquat. Microb. Ecol. 55,53–63.
Thompson, P.A., Harrison, P.J., Parslow, J.S., 1991. Influence of irradiance on cellvolume and carbon quota for ten species of marine phytoplankton. J. Phycol.27, 351–360.
Toledo, G., Palenik, B., 2003. A Synechococcus serotype is found preferentially insurface marine waters. Limnol. Oceanogr. 48, 1744–1755.
Uitz, J., Huot, Y., Bruyant, F., Babin, M., Claustre, H., 2008. Relating phytoplanktonphotophysiological properties to community structure on large scales. Limnol.Oceanogr. 53, 614–630.
Verity, P., Langdon, C., 1984. Relationships between lorica volume, carbon,nitrogen, and ATP content of tintinnids in Narrangasett Bay. J. Plankton. Res.6, 859–868.
Verity, P.G., Stoecker, D.K., Sieracki, M.E., Nelson, J.R., 1993. Grazing, growth andmortality of microzooplankton during the 1989 North Atlantic spring bloom at47N, 18W. Deep-Sea Res. Pt I 40, 1793–1814.
Vidussi, F., Marty, J.C., Chiaveini, J., 2000. Phytoplankton pigment variations duringthe transition from spring bloom to oligotrophy in the northwesternMediterranean sea. Deep-Sea Res. Pt I 47, 423–445.
Webb, W.L., Newton, M., Starr, D., 1974. Carbon dioxide exchange of Alnus rubra: amathematical model. Oecologia 17, 281–291.
Worden, A.Z., Binder, B.J., 2003. Application of dilution experiments for measuringgrowth and mortality rates among Prochlorococcus and Synechococcus popula-tions in oligotrophic environments. Aquat. Microb. Ecol. 30, 159–174.
Worden, A., Nolan, J., Palenik, B., 2004. Assessing the dynamics and ecology ofmarine picophytoplankton: The importance of the eukaryotic component.Limnol. Oceanogr. 49, 168–179.
Zapata, M., Rodrıguez, F., Garrido, J.L., 2000. Separation of chlorophylls andcarotenoids from marine phytoplankton: a new HPLC method using a reversedphase C-8 column and pyridine-containing mobile phases. Mar. Ecol. Prog. Ser.195, 29–45.
Zwirglmaier, K., Jardillier, L., Ostrowski, M., Mazard, S., Garczarek, L., Vaulot, D.,Not, F., Massana, R., Ulloa, O., Scanlan, D.J., 2008. Global phylogeography ofmarine Synechococcus and Prochlorococcus reveals a distinct partitioning oflineages among oceanic biomes. Environ. Microbiol. 10, 147–161.
A. Gutierrez-Rodrıguez et al. / Deep-Sea Research I 57 (2010) 486–500500