Carbon dynamics of Florida Bay: spatiotemporal patterns and biological control
9
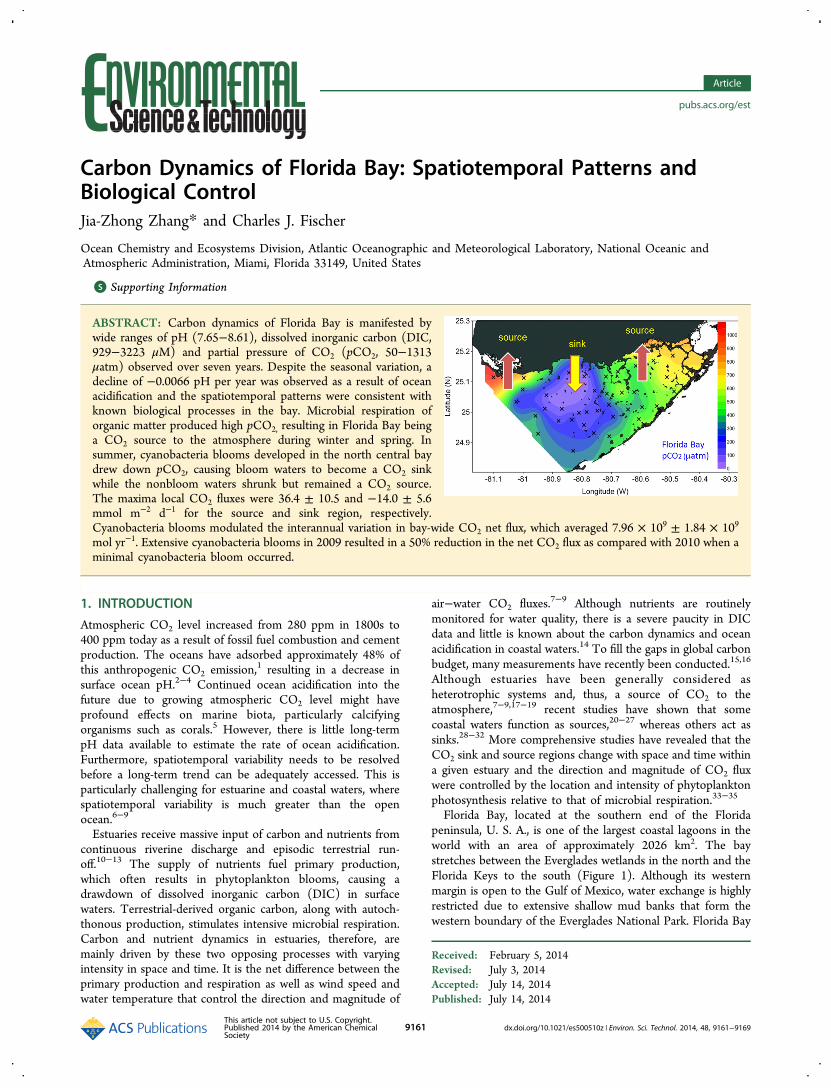
Carbon Dynamics of Florida Bay: Spatiotemporal Patterns and Biological Control Jia-Zhong Zhang* and Charles J. Fischer Ocean Chemistry and Ecosystems Division, Atlantic Oceanographic and Meteorological Laboratory, National Oceanic and Atmospheric Administration, Miami, Florida 33149, United States * S Supporting Information ABSTRACT: Carbon dynamics of Florida Bay is manifested by wide ranges of pH (7.65-8.61), dissolved inorganic carbon (DIC, 929-3223 μM) and partial pressure of CO 2 (pCO 2 , 50-1313 μatm) observed over seven years. Despite the seasonal variation, a decline of -0.0066 pH per year was observed as a result of ocean acidification and the spatiotemporal patterns were consistent with known biological processes in the bay. Microbial respiration of organic matter produced high pCO 2, resulting in Florida Bay being a CO 2 source to the atmosphere during winter and spring. In summer, cyanobacteria blooms developed in the north central bay drew down pCO 2 , causing bloom waters to become a CO 2 sink while the nonbloom waters shrunk but remained a CO 2 source. The maxima local CO 2 fluxes were 36.4 ± 10.5 and -14.0 ± 5.6 mmol m -2 d -1 for the source and sink region, respectively. Cyanobacteria blooms modulated the interannual variation in bay-wide CO 2 net flux, which averaged 7.96 × 10 9 ± 1.84 × 10 9 mol yr -1 . Extensive cyanobacteria blooms in 2009 resulted in a 50% reduction in the net CO 2 flux as compared with 2010 when a minimal cyanobacteria bloom occurred. 1. INTRODUCTION Atmospheric CO 2 level increased from 280 ppm in 1800s to 400 ppm today as a result of fossil fuel combustion and cement production. The oceans have adsorbed approximately 48% of this anthropogenic CO 2 emission, 1 resulting in a decrease in surface ocean pH. 2-4 Continued ocean acidification into the future due to growing atmospheric CO 2 level might have profound effects on marine biota, particularly calcifying organisms such as corals. 5 However, there is little long-term pH data available to estimate the rate of ocean acidification. Furthermore, spatiotemporal variability needs to be resolved before a long-term trend can be adequately accessed. This is particularly challenging for estuarine and coastal waters, where spatiotemporal variability is much greater than the open ocean. 6-9 Estuaries receive massive input of carbon and nutrients from continuous riverine discharge and episodic terrestrial run- off. 10-13 The supply of nutrients fuel primary production, which often results in phytoplankton blooms, causing a drawdown of dissolved inorganic carbon (DIC) in surface waters. Terrestrial-derived organic carbon, along with autoch- thonous production, stimulates intensive microbial respiration. Carbon and nutrient dynamics in estuaries, therefore, are mainly driven by these two opposing processes with varying intensity in space and time. It is the net difference between the primary production and respiration as well as wind speed and water temperature that control the direction and magnitude of air-water CO 2 fluxes. 7-9 Although nutrients are routinely monitored for water quality, there is a severe paucity in DIC data and little is known about the carbon dynamics and ocean acidification in coastal waters. 14 To fill the gaps in global carbon budget, many measurements have recently been conducted. 15,16 Although estuaries have been generally considered as heterotrophic systems and, thus, a source of CO 2 to the atmosphere, 7-9,17-19 recent studies have shown that some coastal waters function as sources, 20-27 whereas others act as sinks. 28-32 More comprehensive studies have revealed that the CO 2 sink and source regions change with space and time within a given estuary and the direction and magnitude of CO 2 flux were controlled by the location and intensity of phytoplankton photosynthesis relative to that of microbial respiration. 33-35 Florida Bay, located at the southern end of the Florida peninsula, U. S. A., is one of the largest coastal lagoons in the world with an area of approximately 2026 km 2 . The bay stretches between the Everglades wetlands in the north and the Florida Keys to the south (Figure 1). Although its western margin is open to the Gulf of Mexico, water exchange is highly restricted due to extensive shallow mud banks that form the western boundary of the Everglades National Park. Florida Bay Received: February 5, 2014 Revised: July 3, 2014 Accepted: July 14, 2014 Published: July 14, 2014 Article pubs.acs.org/est This article not subject to U.S. Copyright. Published 2014 by the American Chemical Society 9161 dx.doi.org/10.1021/es500510z | Environ. Sci. Technol. 2014, 48, 9161-9169
-
Upload
independent -
Category
Documents
-
view
0 -
download
0
Transcript of Carbon dynamics of Florida Bay: spatiotemporal patterns and biological control
Carbon Dynamics of Florida Bay: Spatiotemporal Patterns andBiological ControlJia-Zhong Zhang* and Charles J. Fischer
Ocean Chemistry and Ecosystems Division, Atlantic Oceanographic and Meteorological Laboratory, National Oceanic andAtmospheric Administration, Miami, Florida 33149, United States
*S Supporting Information
ABSTRACT: Carbon dynamics of Florida Bay is manifested bywide ranges of pH (7.65−8.61), dissolved inorganic carbon (DIC,929−3223 μM) and partial pressure of CO2 (pCO2, 50−1313μatm) observed over seven years. Despite the seasonal variation, adecline of −0.0066 pH per year was observed as a result of oceanacidification and the spatiotemporal patterns were consistent withknown biological processes in the bay. Microbial respiration oforganic matter produced high pCO2, resulting in Florida Bay beinga CO2 source to the atmosphere during winter and spring. Insummer, cyanobacteria blooms developed in the north central baydrew down pCO2, causing bloom waters to become a CO2 sinkwhile the nonbloom waters shrunk but remained a CO2 source.The maxima local CO2 fluxes were 36.4 ± 10.5 and −14.0 ± 5.6mmol m−2 d−1 for the source and sink region, respectively.Cyanobacteria blooms modulated the interannual variation in bay-wide CO2 net flux, which averaged 7.96 × 10⁹ ± 1.84 × 10⁹
mol yr−1. Extensive cyanobacteria blooms in 2009 resulted in a 50% reduction in the net CO2 flux as compared with 2010 when aminimal cyanobacteria bloom occurred.
1. INTRODUCTION
Atmospheric CO2 level increased from 280 ppm in 1800s to400 ppm today as a result of fossil fuel combustion and cementproduction. The oceans have adsorbed approximately 48% ofthis anthropogenic CO2 emission,1 resulting in a decrease insurface ocean pH.2−4 Continued ocean acidification into thefuture due to growing atmospheric CO2 level might haveprofound effects on marine biota, particularly calcifyingorganisms such as corals.5 However, there is little long-termpH data available to estimate the rate of ocean acidification.Furthermore, spatiotemporal variability needs to be resolvedbefore a long-term trend can be adequately accessed. This isparticularly challenging for estuarine and coastal waters, wherespatiotemporal variability is much greater than the openocean.6−9
Estuaries receive massive input of carbon and nutrients fromcontinuous riverine discharge and episodic terrestrial run-off.10−13 The supply of nutrients fuel primary production,which often results in phytoplankton blooms, causing adrawdown of dissolved inorganic carbon (DIC) in surfacewaters. Terrestrial-derived organic carbon, along with autoch-thonous production, stimulates intensive microbial respiration.Carbon and nutrient dynamics in estuaries, therefore, aremainly driven by these two opposing processes with varyingintensity in space and time. It is the net difference between theprimary production and respiration as well as wind speed andwater temperature that control the direction and magnitude of
air−water CO2 fluxes.7−9 Although nutrients are routinelymonitored for water quality, there is a severe paucity in DICdata and little is known about the carbon dynamics and oceanacidification in coastal waters.14 To fill the gaps in global carbonbudget, many measurements have recently been conducted.15,16
Although estuaries have been generally considered asheterotrophic systems and, thus, a source of CO2 to theatmosphere,7−9,17−19 recent studies have shown that somecoastal waters function as sources,20−27 whereas others act assinks.28−32 More comprehensive studies have revealed that theCO2 sink and source regions change with space and time withina given estuary and the direction and magnitude of CO2 fluxwere controlled by the location and intensity of phytoplanktonphotosynthesis relative to that of microbial respiration.33−35
Florida Bay, located at the southern end of the Floridapeninsula, U. S. A., is one of the largest coastal lagoons in theworld with an area of approximately 2026 km2. The baystretches between the Everglades wetlands in the north and theFlorida Keys to the south (Figure 1). Although its westernmargin is open to the Gulf of Mexico, water exchange is highlyrestricted due to extensive shallow mud banks that form thewestern boundary of the Everglades National Park. Florida Bay
Received: February 5, 2014Revised: July 3, 2014Accepted: July 14, 2014Published: July 14, 2014
Article
pubs.acs.org/est
This article not subject to U.S. Copyright.Published 2014 by the American ChemicalSociety
9161 dx.doi.org/10.1021/es500510z | Environ. Sci. Technol. 2014, 48, 9161−9169
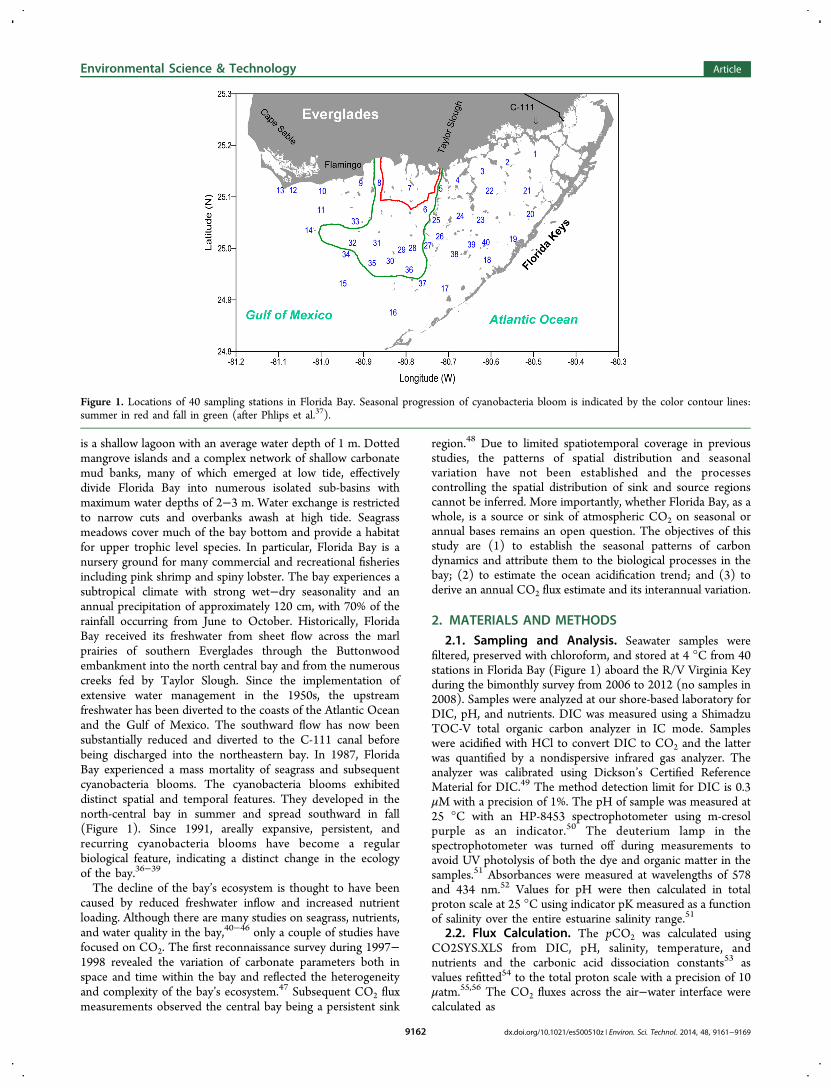
is a shallow lagoon with an average water depth of 1 m. Dottedmangrove islands and a complex network of shallow carbonatemud banks, many of which emerged at low tide, effectivelydivide Florida Bay into numerous isolated sub-basins withmaximum water depths of 2−3 m. Water exchange is restrictedto narrow cuts and overbanks awash at high tide. Seagrassmeadows cover much of the bay bottom and provide a habitatfor upper trophic level species. In particular, Florida Bay is anursery ground for many commercial and recreational fisheriesincluding pink shrimp and spiny lobster. The bay experiences asubtropical climate with strong wet−dry seasonality and anannual precipitation of approximately 120 cm, with 70% of therainfall occurring from June to October. Historically, FloridaBay received its freshwater from sheet flow across the marlprairies of southern Everglades through the Buttonwoodembankment into the north central bay and from the numerouscreeks fed by Taylor Slough. Since the implementation ofextensive water management in the 1950s, the upstreamfreshwater has been diverted to the coasts of the Atlantic Oceanand the Gulf of Mexico. The southward flow has now beensubstantially reduced and diverted to the C-111 canal beforebeing discharged into the northeastern bay. In 1987, FloridaBay experienced a mass mortality of seagrass and subsequentcyanobacteria blooms. The cyanobacteria blooms exhibiteddistinct spatial and temporal features. They developed in thenorth-central bay in summer and spread southward in fall(Figure 1). Since 1991, areally expansive, persistent, andrecurring cyanobacteria blooms have become a regularbiological feature, indicating a distinct change in the ecologyof the bay.36−39
The decline of the bay’s ecosystem is thought to have beencaused by reduced freshwater inflow and increased nutrientloading. Although there are many studies on seagrass, nutrients,and water quality in the bay,40−46 only a couple of studies havefocused on CO2. The first reconnaissance survey during 1997−1998 revealed the variation of carbonate parameters both inspace and time within the bay and reflected the heterogeneityand complexity of the bay’s ecosystem.47 Subsequent CO2 fluxmeasurements observed the central bay being a persistent sink
region.48 Due to limited spatiotemporal coverage in previousstudies, the patterns of spatial distribution and seasonalvariation have not been established and the processescontrolling the spatial distribution of sink and source regionscannot be inferred. More importantly, whether Florida Bay, as awhole, is a source or sink of atmospheric CO2 on seasonal orannual bases remains an open question. The objectives of thisstudy are (1) to establish the seasonal patterns of carbondynamics and attribute them to the biological processes in thebay; (2) to estimate the ocean acidification trend; and (3) toderive an annual CO2 flux estimate and its interannual variation.
2. MATERIALS AND METHODS
2.1. Sampling and Analysis. Seawater samples werefiltered, preserved with chloroform, and stored at 4 °C from 40stations in Florida Bay (Figure 1) aboard the R/V Virginia Keyduring the bimonthly survey from 2006 to 2012 (no samples in2008). Samples were analyzed at our shore-based laboratory forDIC, pH, and nutrients. DIC was measured using a ShimadzuTOC-V total organic carbon analyzer in IC mode. Sampleswere acidified with HCl to convert DIC to CO2 and the latterwas quantified by a nondispersive infrared gas analyzer. Theanalyzer was calibrated using Dickson’s Certified ReferenceMaterial for DIC.49 The method detection limit for DIC is 0.3μM with a precision of 1%. The pH of sample was measured at25 °C with an HP-8453 spectrophotometer using m-cresolpurple as an indicator.50 The deuterium lamp in thespectrophotometer was turned off during measurements toavoid UV photolysis of both the dye and organic matter in thesamples.51 Absorbances were measured at wavelengths of 578and 434 nm.52 Values for pH were then calculated in totalproton scale at 25 °C using indicator pK measured as a functionof salinity over the entire estuarine salinity range.51
2.2. Flux Calculation. The pCO2 was calculated usingCO2SYS.XLS from DIC, pH, salinity, temperature, andnutrients and the carbonic acid dissociation constants53 asvalues refitted54 to the total proton scale with a precision of 10μatm.55,56 The CO2 fluxes across the air−water interface werecalculated as
Figure 1. Locations of 40 sampling stations in Florida Bay. Seasonal progression of cyanobacteria bloom is indicated by the color contour lines:summer in red and fall in green (after Phlips et al.37).
Environmental Science & Technology Article
dx.doi.org/10.1021/es500510z | Environ. Sci. Technol. 2014, 48, 9161−91699162
= − = ΔF kK p p kK p( CO CO ) CO0 2sw 2air 0 2 (1)
where k (cm h−1) is the gas transfer velocity of CO2, and K0(mol m−3 atm−1) is the solubility coefficient of CO2 at in situtemperature and salinity.57 The pCO2sw and pCO2air are thepartial pressure of CO2 (atm) in seawater and air, respectively.A positive value of F indicates a transfer of CO2 from seawaterto the atmosphere. The globally averaged marine surface annualmean pCO2 from NOAA Earth System Research Laboratorywere used for atmospheric values, increasing from 380.93 to392.58 ppm in 2006−2012. The k values were computed as a
function of wind speed using Wanninkhof’s quadraticequation.58 Monthly average wind speed over the past 50years in the study area varied from 4.11 to 5.45 m s−1. Long-term average wind speed for each month from Florida ClimateCenter was used in the flux calculation.Bay-wide daily CO2 flux for each survey was intergraded from
the 40 stations using a pCO2 contour grid file created withSurfer software. The areas of CO2 sink and source regions andtheir fluxes were calculated using the grid volume computationfunction in Surfer. Atmospheric pCO2 values were used todefine the surface boundary layer (Z values) between sink and
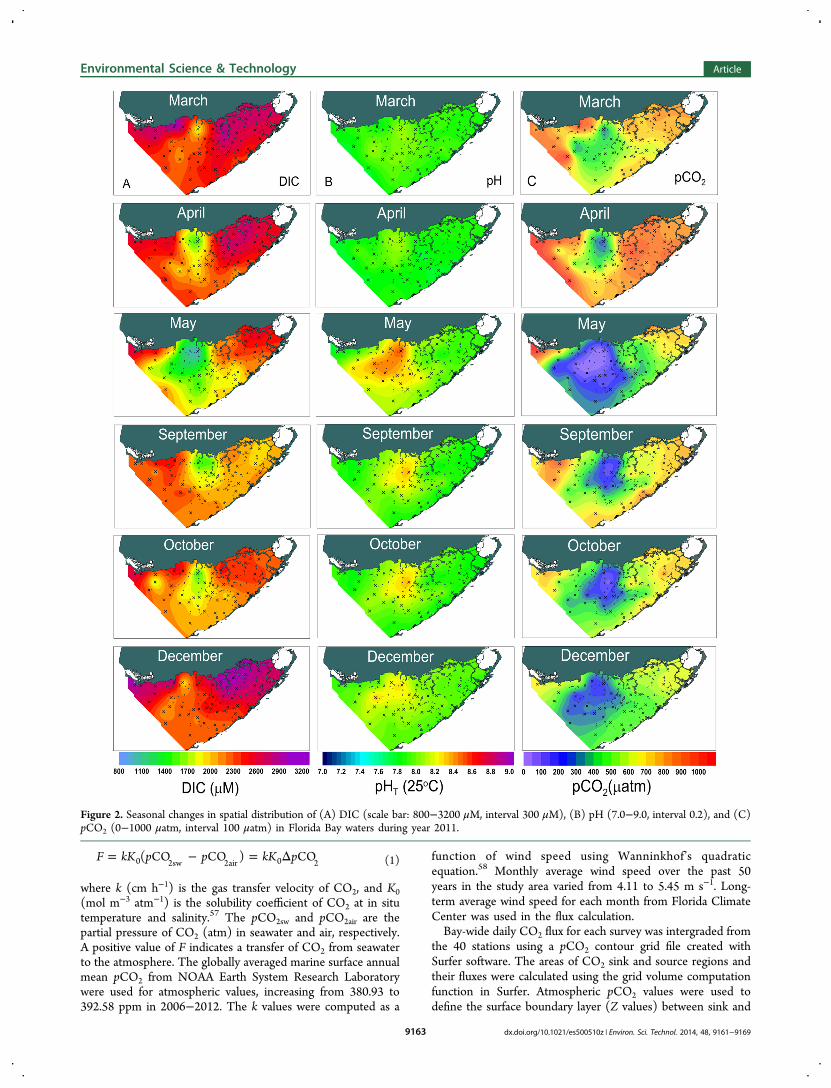
Figure 2. Seasonal changes in spatial distribution of (A) DIC (scale bar: 800−3200 μM, interval 300 μM), (B) pH (7.0−9.0, interval 0.2), and (C)pCO2 (0−1000 μatm, interval 100 μatm) in Florida Bay waters during year 2011.
Environmental Science & Technology Article
dx.doi.org/10.1021/es500510z | Environ. Sci. Technol. 2014, 48, 9161−91699163
source region. Calculations produced both positive (source)and negative (sink) areas. The same contour grid file was usedfor flux calculation in which ΔpCO2 was multiplied by k and K0such that the vertical axes represent flux per unit area (eq 1).The kK0 values for each survey were used as a vertical Z factor.CO2 fluxes in each region was then intergraded over the areaand calculated as “volumes”. A positive volume indicated a CO2flux from seawater to the air. Annual fluxes were estimated by asummation of monthly fluxes with data gaps interpolated withavailable data in the same season.
3. RESULTS AND DISCUSSION3.1. Spatial Distributions of DIC and pH and Their
Seasonal Variation. Spatiotemporal patterns of DIC and pHin Florida Bay were similar each year. As an example, spatialdistributions of DIC and pH and their seasonal variation in2011 are shown in Figure 2. The spatial distribution of pH wasopposite to that of DIC as a result of carbonate bufferingsystem on seawater pH.59,60 In March, DIC concentrationswere high over the entire bay, averaging 2454 ± 243 μM; pHwere at annual minima, ranging from 7.69 to 8.10 with anaverage of 7.93 ± 0.08. The highest DIC and lowest pH werefound in the northern coastal stations adjacent to theEverglades wetlands, ranging from 2591 to 2917 μM with anexception of the lowest DIC (1717 μM) and highest pH (8.10)at north-central station 7. In April, bay-wide DIC decreased to2279 ± 301 μM. This was primarily due to a decrease of DIC atstation 7 (1437 μM) and the spreading of low DIC (<2000μM) waters southward to the central bay. By the end of May,low DIC and high pH waters reached its maximum extent inthe bay, spreading from the coastal waters off the Everglades inthe north to the waters close to the Florida Keys in the south.However, the lowest DIC of 929 μM and the highest pH of8.53 remained at station 7. As the season progressed into fall,the area of low DIC water decreased significantly, but station 7remained the lowest DIC (1425 μM) and the second highestpH (8.22) in the bay. The highest pH of 8.36 was observed atnearby station 6. In October, DIC in the eastern bay increasedto above 2200 μM, but the low DIC waters of the central bayhad continued to spread further south. By December, DICincreased over the entire bay and the low DIC water seenpreviously had completely disappeared. The spatial distributionof DIC was similar to March with a bay-wide average of 2451 ±284 μM, and the highest DIC of 2919 μM was observed at thenortheast station 4.The spatial distribution and seasonal variation of DIC was
opposite to that of salinity in the bay. The highest DICobserved in the northeast corner in winter were associated withthe lowest salinity (18) in the bay.42,61 In early summer, thehighest salinity (>40) developed in the north central baycoexisted with the lowest DIC observed.42,61 Apparently,precipitation and evaporation processes that cause covariationof salinity and DIC, usually observed in oligotrophic openoceans, were not manifested in Florida Bay because thebiological uptake and regeneration of DIC overwhelmed theprecipitation and evaporation induced DIC change. Further-more, these biological processes have no effect on salinity. Infact, the spatiotemporal pattern of carbon parameters resembleknown spatial distribution and seasonal succession ofcyanobacteria blooms in Florida Bay.36−39 A multiyearcomprehensive study conducted by Phlips et al.36,37 docu-mented the development of annual blooms of cyanobacteria inFlorida Bay in late spring or early summer. The greatest
frequency and intensity of the bloom was always restricted tothe north central bay where cellular biovolumes of thecyanobacteria Synechococcus regularly exceeded 107 μm3
ml−1(Figure 1).37 High concentration of cyanobacteria alsoappeared during the fall in the south-central region of the bayand coincided with the onset of seasonal cold fronts, when thewind direction shifts from the more common east orsoutheasterly direction to a north or northwesterly direction.37
A strong northerly or northwesterly wind, brought by a coldfront, can drive the bloom-laden water from the north centralregion to the south central region. This north−south pattern ofwater circulation is supported by similarities in the patterns ofsalinity variation observed in these two regions.61
The bay-wide ranges of DIC and pH measured in eachsurvey changed with the seasons. The monthly maxima andminima of DIC observed from 2006 to 2012 are plotted againstthe month of year in Figure 3A. The top clusters of data aremaxima and the bottom minima. Maxima DIC wereapproximately 3000 μM in spring, decreased to 2500 μM insummer, and then increased to 3000 μM again in December.Monthly minima DIC were approximately 2000 μM in spring,decreased to 1000 μM in May, and then increased to 2000 μMin December. The stations with a monthly maximum DICalways had a minimum pH, ranging from 7.6 to 8.0 (Figure3B). Likewise, the maxima pH were associated with minimaDIC and varied from 8.1 to 8.6. In spring, the maxima pH was8.2 ± 0.1 and rapidly increased to 8.5 ± 0.1 in May. MaximapH decreased gradually in fall and winter to 8.3 ± 0.1. Thelarge area of bay waters with elevated pH induced bycyanobacteria blooms can serve as refugia for corals growingin Florida Bay and off the Florida Keys under continued impactof ocean acidification.62
3.2. Estimate Ocean Acidification Trend in FloridaBay. Assuming surface seawater is in equilibrium withincreasing atmospheric CO2, the calculated rate of oceanacidification is −0.0017 pH per year.2,4 A plot of all pH datacollected in the bay against time showed a statisticallysignificant decreased trend (Supporting Information FigureS1). The estimated rate of −0.0143 pH per year is much higherthan those observed in the open ocean2−4 but is only one-thirdof the rate observed in coastal waters of Tatoosh Island in theeastern Pacific.63 Arguably, the high pHs observed in the sinkregion were caused by cyanobacteria blooms and this mayobscure ocean acidification signals. On the other hand, the CO2source waters were dominated by respiration processes, whichexhibited little seasonal variation. It might be more reliable toestimate the ocean acidification trend in the source waters.Linear least-squares regression analyses of pH in CO2 sourcewaters against time generated a statistically significant (n = 814,p < 0.00005) annual trend of −0.0066 ± 0.0015 pH per yearwith a 95% confidence interval of −0.0096 and −0.0036(Figure 4). This rate is three-time higher than that observed inthe open ocean.2−4 A 25% decrease in buffer intensity,59 whenseawater pH drops from 8.1 to 7.9, contributes in part to thehigher rate of acidification observed in these low pH waters.64
Nonetheless, long-term data in different estuaries are needed toverify the higher rate of ocean acidification and to reveal thefactors governing the ocean acidification processes in coastalwaters.
3.3. Spatial Distribution of pCO2 and Its SeasonalVariation. Spatial distribution of pCO2 and its seasonalvariation in 2011 are shown in Figure 2c. In spring, pCO2values were high for the entire bay, averaging 645 ± 182 μatm.
Environmental Science & Technology Article
dx.doi.org/10.1021/es500510z | Environ. Sci. Technol. 2014, 48, 9161−91699164
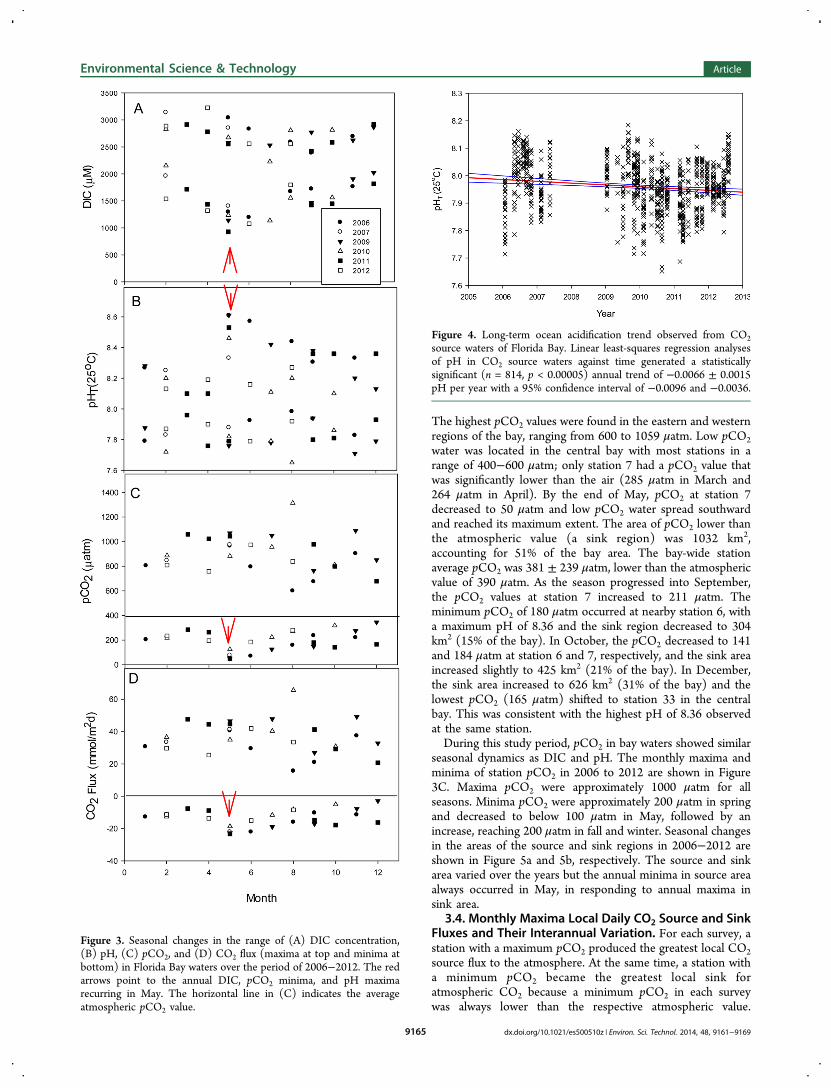
The highest pCO2 values were found in the eastern and westernregions of the bay, ranging from 600 to 1059 μatm. Low pCO2water was located in the central bay with most stations in arange of 400−600 μatm; only station 7 had a pCO2 value thatwas significantly lower than the air (285 μatm in March and264 μatm in April). By the end of May, pCO2 at station 7decreased to 50 μatm and low pCO2 water spread southwardand reached its maximum extent. The area of pCO2 lower thanthe atmospheric value (a sink region) was 1032 km2,accounting for 51% of the bay area. The bay-wide stationaverage pCO2 was 381 ± 239 μatm, lower than the atmosphericvalue of 390 μatm. As the season progressed into September,the pCO2 values at station 7 increased to 211 μatm. Theminimum pCO2 of 180 μatm occurred at nearby station 6, witha maximum pH of 8.36 and the sink region decreased to 304km2 (15% of the bay). In October, the pCO2 decreased to 141and 184 μatm at station 6 and 7, respectively, and the sink areaincreased slightly to 425 km2 (21% of the bay). In December,the sink area increased to 626 km2 (31% of the bay) and thelowest pCO2 (165 μatm) shifted to station 33 in the centralbay. This was consistent with the highest pH of 8.36 observedat the same station.During this study period, pCO2 in bay waters showed similar
seasonal dynamics as DIC and pH. The monthly maxima andminima of station pCO2 in 2006 to 2012 are shown in Figure3C. Maxima pCO2 were approximately 1000 μatm for allseasons. Minima pCO2 were approximately 200 μatm in springand decreased to below 100 μatm in May, followed by anincrease, reaching 200 μatm in fall and winter. Seasonal changesin the areas of the source and sink regions in 2006−2012 areshown in Figure 5a and 5b, respectively. The source and sinkarea varied over the years but the annual minima in source areaalways occurred in May, in responding to annual maxima insink area.
3.4. Monthly Maxima Local Daily CO2 Source and SinkFluxes and Their Interannual Variation. For each survey, astation with a maximum pCO2 produced the greatest local CO2source flux to the atmosphere. At the same time, a station witha minimum pCO2 became the greatest local sink foratmospheric CO2 because a minimum pCO2 in each surveywas always lower than the respective atmospheric value.
Figure 3. Seasonal changes in the range of (A) DIC concentration,(B) pH, (C) pCO2, and (D) CO2 flux (maxima at top and minima atbottom) in Florida Bay waters over the period of 2006−2012. The redarrows point to the annual DIC, pCO2 minima, and pH maximarecurring in May. The horizontal line in (C) indicates the averageatmospheric pCO2 value.
Figure 4. Long-term ocean acidification trend observed from CO2source waters of Florida Bay. Linear least-squares regression analysesof pH in CO2 source waters against time generated a statisticallysignificant (n = 814, p < 0.00005) annual trend of −0.0066 ± 0.0015pH per year with a 95% confidence interval of −0.0096 and −0.0036.
Environmental Science & Technology Article
dx.doi.org/10.1021/es500510z | Environ. Sci. Technol. 2014, 48, 9161−91699165

Therefore, the monthly maxima source and sink fluxes reflectthe range of variability in the strength of CO2 source and sinkwaters as shown in Figure 3D. Maxima local CO2 source fluxvaried from 15.6 to 65.5 mmol m−2 d−1 with an average of 36.4± 10.5 mmol m−2 d−1 over the study period. A minimum localCO2 source flux of 15.6 mmol m−2 d−1 was observed in August2006, reflecting the lowest monthly maximum station pCO2 of599 μatm observed over the study period. A maximum localCO2 source flux of 65.5 mmol m−2 d−1 was observed in August2010, reflecting the highest monthly maximum pCO2 of 1313μatm observed over the study period at station 4.Maxima local CO2 sink flux varied from −2.9 to −23.3 mmol
m−2 d−1 with an average of −14.0 ± 5.6 mmol m−2 d−1 over thestudy period. The minimum local CO2 sink flux of −2.9 mmolm−2 d−1 was observed in December 2009, reflecting the highestminimum pCO2 of 346 μatm observed for the entire studyperiod at station 26. The maximum local CO2 sink flux of−23.3 mmol m−2 d−1 was observed in May 2011, reflecting thelowest monthly minimum pCO2 of 50 μatm observed for theentire study period at station 7. In contrast to the maxima CO2source flux, there is a strong seasonal pattern seen in themaxima CO2 sink flux. The maximum local CO2 sink fluxalways occurred in May every year and decreased gradually infall. There is considerable interannual variation in the maximumCO2 sink flux. The annual average maximum local CO2 sinkflux varied from a low of −11.3 ± 5.1 mmol m−2 d−1 in 2010 toa high of −16.8 ± 7.6 mmol m−2 d−1 in 2007. The ranges offlux variations observed in this study are similar to previousdirect measurements using flux chambers in which local dailyflux varied from 59.9 to −40.3 mmol m−2 d−1.48
3.5. Bay-Wide Integrated Daily CO2 Flux and ItsInterannual Variation. Bay-wide daily CO2 source fluxesduring 2006 to 2012 are plotted against the month of year inFigure 6A. Bay-wide daily CO2 source flux varied from 7.05 ×
106 to 6.01 × 10⁷ mol d−1 with an average of 2.73 × 10⁷ ± 1.25× 10⁷ mol d−1 over the 2006−2012 period. The minimum bay-wide daily CO2 source flux of 7.05 × 10⁶ mol d−1 was observedin May 2009, reflecting the smallest source area (511 km2) andthe largest sink area (1515 km2) observed during the entirestudy period. The maxima bay-wide daily CO2 source fluxes of4.50−6.01 × 10⁷ mol d−1 was observed in March and April2011, reflecting the largest source areas of 1967−2001km2
observed in the entire study period. The annual minima dailyCO2 source fluxes occurred in May due to shrinking of the CO2
source region. A substantial interannual variation was observedon top of the seasonal pattern. The annual average bay-wide
Figure 5. Seasonal changes in the areas of CO2 (A) source region and(B) sink region in Florida Bay over the period of 2006−2012.
Figure 6. Seasonal changes in daily bay-wide CO2 (A) source flux, (B)sink flux and (C) net flux integrated over the source region, sinkregion and whole bay, respectively, over the period of 2006−2012.
Environmental Science & Technology Article
dx.doi.org/10.1021/es500510z | Environ. Sci. Technol. 2014, 48, 9161−91699166
daily CO2 source flux varied from a low of 1.99 × 10⁷ ± 1.03 ×10⁷ mol d−1 in 2009 to a high of 3.44 × 10⁷ ± 1.34 × 10⁷ mold−1 in 2010.Bay-wide daily CO2 sink fluxes in 2006 to 2012 are shown in
Figure 6B. Because of the seasonal occurrence of cyanobacteriabloom and the subsequent die off in the bay, bay-wide dailyCO2 sink flux varied over 3 orders of magnitude, ranging from−2.86 × 10⁴ to −1.83 × 10⁷ mol d−1 with an average of −3.10× 10⁶ ± 4.20 × 10⁶ mol d−1 over the entire study period. Theminimum bay-wide daily CO2 sink flux of −2.86 × 10⁴ mol d−1
was observed in October 2010, reflecting the smallest sink area(56 km2) and the largest source area (1970 km2) observed inthe entire study period. The maximum bay-wide daily CO2 sinkflux of −1.83 × 10⁷ mol d−1 was observed in May 2009,reflecting the largest sink area of 1515 km2 observed during theentire study period. The annual maxima daily CO2 sink fluxesoccurred in May due to the expansion of the CO2 sink regioninduced by the cyanobacteria blooms. In addition to theseasonal pattern, there was also a substantial interannualvariation. The annual average bay-wide daily CO2 sink fluxvaried from a low of −1.29 × 10⁶ ± 1.59 × 10⁶ mol d−1 in 2012to a high of −5.60 × 10⁶ ± 8.59 × 10⁶ mol d−1 in 2009.The bay-wide daily CO2 net fluxes were obtained by adding
the negative regional sink flux to the positive regional sourceflux for each survey. The bay-wide daily CO2 net fluxesobserved during 2006 to 2012 are shown in Figure 6C. Bay-wide daily CO2 net flux varied from −1.12 × 10⁷ mol d−1 to5.99 × 107 mol d−1 with an average of 2.42 x10⁷ ± 1.56 × 10⁷
mol d−1 over the 2006−2012 period. The minimum bay-widedaily CO2 net flux of −1.12 × 10⁷ mol d−1 was observed in May2009, reflecting the largest sink area of 1515 km2 observed inthe entire study period. Only in this survey, Florida Bay, as awhole, behaved as a sink for atmospheric CO2. The maximumbay-wide daily CO2 net flux of 5.99 × 10⁷ mol d−1 was observedin April 2011, reflecting the second smallest sink area (59.6km2) and the second largest source area (1967 km2) observedduring the entire study period. The annual minima daily CO2net fluxes occurred in May due to the cyanobacteria bloom. Inaddition to this seasonal pattern, there was considerableinterannual variation. The annual average bay-wide daily CO2net flux varied from 1.43 × 10⁷ ± 1.85 × 10⁷ mol d−1 in 2009 to3.31 × 107 ± 1.49 × 10⁷ mol d−1 in 2010.3.6. Bay-Wide Integrated Annual CO2 Flux and Its
Interannual Variation. Bay-wide daily CO2 net fluxes weremultiplied by the number of days in a month to obtain bay-wide monthly CO2 fluxes. Because the samples were collectedfrom bimonthly survey cruises, the missing data on monthlysource and sink fluxes were interpolated separately fromavailable source and sink data in the same season. Summationof the 12 monthly data provided a first order estimate of bay-wide annual CO2 fluxes. The bay-wide annual CO2 fluxes to theatmosphere are 7.93, 6.60, 5.32, 10.53, 9.09, and 8.29 × 10⁹ molC yr−1 for 2006, 2007, 2009, 2010, 2011, and 2012, respectively(Supporting Information Figure S2). The average annual fluxwas 7.96 × 10⁹ ± 1.84 × 10⁹ mol C yr−1 (3.93 ± 0.91 mol Cm−2 yr−1) over the 2006−2012 period. The minimum annualflux observed in 2009 corresponds to a year in which awidespread cyanobacteria bloom occurred in the central bay.The maximum extent of the cyanobacteria bloom observed in2009 resulted in a 50% reduction in net CO2 flux to theatmosphere as compared with that of year 2010, in which aminimal cyanobacteria bloom occurred. The annual fluxesobserved in Florida Bay are similar to those observed in Tendo
Lagoon in the Ivory Coast of West Africa34 and estuaries ofCocheco, Bellamy, and Oyster rivers in New England, U. S. A.with limited freshwater flow.65
It is worth noting that these flux estimates are subjected tomany sources of error. The samples were collected during thedaytime, and diurnal variation in pCO2 due to photosynthesis islikely to cause an overestimate of sink flux.66,67 A previousstudy indicated the diurnal variation in Florida Bay was mostlikely influenced by precipitation and dissolution of calciumcarbonate.68 Comprehensive studies are needed to quantify thespatial variation of diurnal signals in the bay, particularlymeasurements in the north central region during peakcyanobacteria blooms.Because of the high variability in biogeochemical processes
observed in the bay, sufficient sampling coverage in both spatialand temporal scales are essential to accurately estimating theannual CO2 flux in Florida Bay. The 40 sampling stations usedin this study seem to adequately cover the spatial variability ofcarbon parameters in Florida Bay. However, deficiency intemporal coverage in this study is likely the greatest error in theannual carbon budget estimates. Fortunately, sampling wasconducted during the peak cyanobacteria bloom each May,except for 2008. In future studies, a monthly sampling programconducted over multiple years, and perhaps biweekly samplingduring the bloom period would improve significantly on theestimates of annual carbon budget for Florida Bay.
■ ASSOCIATED CONTENT*S Supporting InformationA plot of all pH data against time in Florida Bay (Figure S1)and a plot of interannual variation of bay-wide CO2 flux to theatmosphere (Figure S2). This material is available free of chargevia the Internet at http://pubs.acs.org/.
■ AUTHOR INFORMATIONCorresponding Author*E-mail: [email protected]. Phone: (305) 361 4512.Fax: (305) 361 4447.
NotesThe authors declare no competing financial interest.
■ ACKNOWLEDGMENTSThe authors thank Lindsey Visser, Chris Kelble, Grant Rawson,and Jeff Judas for assistance with sample collection during thefield survey in Florida Bay. This study was supported byNOAA/OAR base funds. The scientific results and conclusions,as well as any views or opinions expressed herein, are those ofthe authors and do not necessarily reflect the views of NOAAor the Department of Commerce.
■ REFERENCES(1) Sabine, C. L.; Feely, R. A.; Gruber, N.; Key, R. M.; Lee, K.;Bullister, J. L.; Wanninkhof, R.; Wong, C. S.; Wallace, D. W. R.;Tilbrook, B.; Millero, F. J.; Peng, T. H.; Kozyr, A.; Ono, T.; Rios, A. F.The oceanic sink for anthropogenic CO2. Science 2004, 305, 367−371.(2) Dore, J. E.; Lukas, R.; Sadler, D. W.; Church, M. J.; Karl, D. M.Physical and biogeochemical modulation of ocean acidification in thecentral North Pacific. Proc. Natl. Acad. Sci. U. S. A. 2009, 106, 12235−12240.(3) Gonzalez-Davila, M.; Santana-Casiano, J. M.; Rueda, M. J.; Llinas,O. The water column distribution of carbonate system variables at theESTOC site from 1995 to 2004. Biogeosciences 2010, 7, 3067−3081.
Environmental Science & Technology Article
dx.doi.org/10.1021/es500510z | Environ. Sci. Technol. 2014, 48, 9161−91699167
(4) Byrne, R. H.; Mecking, S.; Feely, R. A.; Liu, X. Directobservations of basin-wide acidification of the North Pacific Ocean.Geophys. Res. Lett. 2010, 37, L02601 DOI: 10.1029/2009GL040999.(5) Doney, S. C.; Fabry, V. J.; Feely, R. A.; Kleypas, J. A. Oceanacidification:the other CO2 problem. Annu. Rev. Mar. Sci. 2009, 1,169−192.(6) Wollast, R. Evaluation and comparison of the global carbon cyclein the coastal zone and in the open ocean. In The Global CoastalOcean; Robinson, A. R., Brink, K. H., Eds.; John Wiley & Sons: 1998;pp 213−252.(7) Chen, C.-T. A.; Huang, T.-H.; Chen, Y.-C.; Bai, Y.; He, X.; Kang,Y. Air−sea exchanges of CO2 in the world’s coastal seas. Biogeoscience2013, 10, 6509−6544.(8) Borges, A. V.; Schiettecatte, L.-S.; Abril, G.; Delille, B.; Gazeau, F.Carbon dioxide in European coastal waters. Estuarine, Coastal Shelf Sci.2006, 70, 375−387.(9) Borges, A. V.; Abril, G. Carbon Dioxide and Methane Dynamicsin Estuaries. In Treatise on Estuarine and Coastal Science, Vol. 5:Biogeochemistry; Wolanski, E., McLusky, D., Eds.; Academic Press:Waltham, 2011; pp 119−161.(10) Meybeck, M. Carbon, nitrogen and phosphorus transport byworld rivers. Am. J. Sci. 1982, 282, 401−450.(11) Guo, L.; Zhang, J.-Z.; Gueguen, C. Speciation and fluxes ofnutrients (N, P, Si) from the upper Yukon River. Global Biogeochem.Cycles 2004, 18, GB1038 DOI: 10.1029/2003GB002152.(12) Zhang, J.-Z.; Kelble, C. R.; Fischer, C. J.; Moore, L. HurricaneKatrina induced nutrient runoff from an agricultural area to coastalwaters in Biscayne Bay, Florida. Estuarine, Coastal Shelf Sci. 2009, 84,209−218, DOI: 10.1016/j.ecss.2009.06.026.(13) Liu, K. K., Atkinson, L.; Quinones, R.; Talaue-McManus, L.,Eds. Carbon and Nutrient Fluxes in Continental Margins: A GlobalSynthesis; Springer-Verlag: Berlin Heidelberg, 2010.(14) Borges, A. V. Do we have enough pieces of the jigsaw tointegrate CO2 fluxes in the coastal ocean? Estuaries 2005, 28 (1), 3−27, DOI: 10.1007/ BF02732750.(15) Laruelle, G. G.; Durr, H. H.; Slomp, C. P.; Borges, A. V.Evaluation of sinks and sources of CO2 in the global coastal oceanusing a spatially-explicit typology of estuaries and continental shelves.Geophys. Res. Lett. 2010, 37, L15607.(16) Laruelle, G. G.; Durr, H. H.; Laurwald, R.; Hartmann, J.; Slomp,C. P.; Goossens, N.; Regnier, P. A. G. Global multi-scale segmentationof continental and coastal waters from the watersheds to thecontinental margins. Hydrol. Earth Syst. Sci. 2013, 17, 2029−2051.(17) Smith, S. V.; Hollibaugh, J. T. Coastal metabolism and theoceanic organic carbon balance. Rev. Geophys. 1993, 31 (1), 75−89,DOI: 10.1029/92RG02584.(18) Gattuso, J. P.; Frankignoulle, M.; Wollast, R. Carbon andcarbonate metabolism in coastal aquatic ecosystems. Annu. Rev. Ecol.Syst. 1998, 29, 405−434.(19) Cai, W.-J. Estuarine and coastal ocean carbon paradox; CO2
sinks or sites of terrestrial carbon incineration? Annu. Rev. Mar. Sci.2011, 3, 123−145.(20) Frankignoulle, M.; Abril, G.; Borges, A.; Bourge, I.; Canon, C.;Delille, B.; Libert, E.; Theate, J.-M. Carbon dioxide emission fromEuropean estuaries. Science 1998, 282, 434−436.(21) Raymond, P. A.; Bauer, J. E.; Cole, J. J. Atmospheric CO2
evasion, dissolved inorganic carbon production, and net heterotrophyin the York River estuary. Limnol. Oceanogr. 2000, 45 (8), 1707−1717,DOI: 10.4319/lo.2000.45.8.1707.(22) Jiang, L.-Q.; Cai, W.-J.; Wang, Y. A comparative study of carbondioxide degassing in river- and marine-dominated estuaries. Limnol.Oceanogr. 2008, 53 (6), 2603−2615, DOI: 10.4319/lo.2008.53.6.2603.(23) Borges, A. V.; Djenidi, S.; Lacroix, G.; Theate, J.; Delille, B.;Frankignoulle, M. Atmospheric CO2 flux from mangrove surroundingwaters. Geophys. Res. Lett. 2003, 30, 1558 DOI: 10.1029/2003GL017143.(24) Cai, W.-J. Riverine inorganic carbon flux and rate of biologicaluptake in the Mississippi River plume. Geophys. Res. Lett. 30(2), 1032;doi:10.1029/2002GL016312.
(25) Ito, R. G.; Schneider, B.; Thomas, H. Distribution of surfacefCO2 and air−sea fluxes in the Southwestern subtropical Atlantic andadjacent continental shelf. J. Marine Systems 2005, 56, 227−242.(26) Zhai, W. D.; Dai, M. H.; Cai, W.-J.; Wang, Y. C.; Wang, Z. H.High partial pressure of CO2 and its maintaining mechanism in asubtropical estuary: the Pearl River estuary, China. Mar. Chem. 2005,93, 21−32.(27) Muduli, P. R.; Kanuri, V. V.; Robin, R. S.; Kumar, B. C.; Patra,S.; Raman, A. V.; Rao, N. G.; Subramanian, B. R. Spatio-temporalvariation of CO2 emission from Chilika Lake, a tropical coastal lagoon,on the east coast of India. Estuarine, Coastal Shelf Sci. 2012, 113, 305−313.(28) Maher, D. T.; Eyre, B. D. Carbon budgets for three autotrophicAustralian estuaries: Implications for global estimates of the coastal air-water CO2 flux. Global Biogeochem. Cycles 2012, 26, GB1032DOI: 10.1029/2011GB004075.(29) Frankignoulle, M.; Borges, A. V. Direct and indirect pCO2
measurements in a wide range of pCO2 and salinity values (TheScheldt estuary). Aquat. Geochem. 2001, 7, 267−273.(30) Chen, C. T. A.; Borges, A. V. Reconciling opposing views oncarbon cycling in the coastal ocean: Continental shelves as sinks andnear-shore ecosystems as sources of atmospheric CO2. Deep Sea Res.,Pt. II 2009, 56, 578−590.(31) Borges, A. V.; Delille, B.; Frankignoulle, M. Budgeting sinks andsources of CO2 in the coastal ocean: Diversity of ecosystems counts.Geophys. Res. Lett. 2005, 32, L14601 DOI: 10.1029/2005GL023053.(32) Wanninkhof, R.; Hitchcock, G.; Wiseman, B.; Vargo, G.; Ortner,P. B.; Asher, W.; Ho, D. T.; Schlosser, P.; Dickson, M.-L.; Masserini,R.; Fanning, K.; Zhang, J.-Z. Gas exchange, dispersion, and biologicalproductivity on the west Florida Shelf: Results from a Lagrangiantracer study. Geophys. Res. Lett. 1997, 24, 1767−1770.(33) Ortega, T.; Ponce, R.; Forja, J.; Gomez-Parra, A. Fluxes ofdissolved inorganic carbon in three estuarine systems of theCantabrian Sea (north of Spain). J. Mar. Systems 2005, 53, 125−142.(34) Kone, Y. J. M.; Abril, G.; Kouadio, K. N.; Delille, B.; Borges, A.V. Seasonal variability of carbon dioxide in the rivers and lagoons ofIvory Coast (West Africa). Estuaries Coasts 2009, 32, 246−260.(35) Chen, C. T. A.; Huang, T. H.; Fu, Y. H.; Bai, Y.; He, X. Strongsources of CO2 in upper estuaries become sinks of CO2 in large riverplumes. Curr. Opin. Environ. Sustain. 2012, 4, 179−185.(36) Phlips, E. J.; Badylak, S. Spatial variability in phytoplanktonstanding crop and composition in a shallow inner-shelf lagoon, FloridaBay, Florida. Bull. Mar. Sci. 1996, 58, 203−216.(37) Phlips, E. J.; Badylak, S.; Lynch, T. C. Blooms of thepicoplanktonic cyanobacterium Synechococcus in Florida Bay, asubtropical inner-shelf lagoon. Limnol. Oceanogr. 1999, 44, 1166−1175.(38) Brand, L. E.; Pablo, J.; Compton, A.; Hammerschlag, N.; Mash,D. C. Cyanobacterial blooms and the occurrence of the neurotoxin,beta-N-methylamino-L-alamine (BMAA), in South Florida aquaticfood webs. Harmful Algae 2010, 9, 620−635.(39) Goleski, J. A.; Koch, F.; Marcoval, M. A.; Wall, C. C.; Jochem, F.J.; Peterson, B. J.; Gobler, C. J. The role of zooplankton grazing andnutrient loading in the occurrence of harmful cyanobacterial blooms inFlorida Bay, USA. Estuaries Coasts 2010, 33 (5), 1202−1215.(40) Boyer, J. N.; Fourqurean, J. W.; Jones, R. D. Seasonal and long-term trends in the water quality of Florida Bay (1989−1997). Estuaries1999, 22, 417−430.(41) Koch, M. S.; Erskine, J. M. Sulfide as a phytotoxin to the tropicalseagrass Thalassia testudinum: interactions with light, salinity andtemperature. J. Exp. Mar. Biol. Ecol. 2001, 266, 81−95.(42) Zhang, J.-Z.; Fischer, C. J.; Ortner, P. B. Potential availability ofsedimentary phosphorus to sediment resuspension in Florida Bay.Global Biogeochem. Cycles 2004, 18, GB4008 DOI: 10.1029/2004GB002255.(43) Zhang, J.-Z.; Huang, X.-L. Relative importance of solid −phasephosphorus and iron in sorption behavior of sediments. Environ. Sci.Technol. 2007, 41 (8), 2789−2795, DOI: 10.1021/es061836q.
Environmental Science & Technology Article
dx.doi.org/10.1021/es500510z | Environ. Sci. Technol. 2014, 48, 9161−91699168
(44) Huang, X.-L.; Zhang, J.-Z. Spatial variation in sediment-waterexchange of phosphorus in Florida Bay: AMP as a model organiccompound. Environ. Sci. Technol. 2010 , 44 , 7790−7795,DOI: 10.1021/es100057r.(45) Zhang, J.-Z.; Huang, X.-L. Effect of temperature and salinity onphosphate sorption on marine sediments. Environ. Sci. Technol. 2011,45, 6831−6837, DOI: 10.1021/es200867p.(46) Huang, X.-L.; Zhang, J.-Z. Phosphorus sorption on marinecarbonate sediment: Phosphonate as model organic compounds.Chemosphere 2011, 85 (8), 1227−1232, DOI: 10.1016/j.chemo-sphere.2011.07.016.(47) Millero, F. J.; Hiscock, W. T.; Huang, F.; Roche, M.; Zhang, J.-Z.Seasonal variation of the carbonate system in Florida Bay. Bull. Mar.Sci. 2001, 68, 101−123.(48) Dufore, C. M. Spatial and temporal variations in the air−seacarbon dioxide fluxes of Florida Bay. M.Sc. Thesis, University of SouthFlorida, Tampa, FL, 2012.(49) Guide to best practices for ocean CO2 measurements, PICES SpecialPublication 3; Dickson, A. G., Sabine, C. L., Christian, J. R., Eds.; OakRidge National Laboratory: Oak Ridge, TN, 2007.(50) Millero, F. J.; Zhang, J.-Z.; Fiol, S.; Sotolongo, S.; Roy, R. N.;Lee, K.; Mane, S. The use of buffers to measure the pH of seawater.Mar. Chem. 1993, 44, 143−152.(51) Mosley, L. M.; Husheer, S. L. G.; Hunter, K. A.Spectrophotometric pH measurement in estuaries using thymol blueand m-cresol purple. Mar. Chem. 2004, 91, 175−186.(52) Clayton, T. D.; Byrne, R. H. Spectrophotometric seawater pHmeasurements: total hydrogen ion concentration scale calibration ofm-cresol purple and at-sea results. Deep-Sea Res. 1993, 40, 2115−2129.(53) Mehrbach, C.; Culberson, C. H.; Hawley, J. E.; Pytkowicz, R. M.Measurement of the apparent dissociation constants of carbonic acidin seawater at atmospheric pressure. Limnol.Oceanogr. 1973, 18, 897−907.(54) Dickson, A. G.; Millero, F. J. A comparison of the equilibriumconstants for the dissociation of carbonic acid in seawater media. Deep-Sea Res. 1987, 34, 1733−1743.(55) Pierrot, D.; Lewis, E.; Wallace, D. W. R. MS Excel ProgramDeveloped for CO2 System Calculations, ORNL/CDIAC-105a; OakRidge National Laboratory, Carbon dioxide Information AnalysisCenter, U.S. Department of Energy: Oak Ridge, TN, 2006.(56) Lewis, E.; Wallace, D. W. R. Program Developed for CO2 SystemCalculations, ORNL/CDIAC-105; Oak Ridge National Laboratory,Carbon Dioxide Information Analysis Center, U.S. Department ofEnergy: Oak Ridge, TN. (21pp), 1998.(57) Weiss, R. F. Carbon dioxide in water and seawater: the solubilityof a non-ideal gas. Mar. Chem. 1974, 2, 203−215.(58) Wanninkhof, R. Relationship between wind speed and gasexchange over the ocean. J. Geophys. Res. 1992, 97 (C5), 7373−7382,DOI: 10.1029/92JC00188.(59) Zhang, J.-Z. The use of pH and buffer intensity to quantify thecarbon cycle in the ocean. Mar. Chem. 2000, 70, 121−131.(60) Soetaert, K.; Hofmann, A. F.; Middelburg, J. J.; Meysman, F. J.R.; Greenwood, J. The effect of biogeochemical processes on pH. Mar.Chem. 2007, 105, 30−51.(61) Kelble, C. R.; Johns, E. M.; Nuttle, W. K.; Lee, T. N.; Smith, R.H.; Ortner, P. B. Salinity patterns of Florida Bay. Estuarine, CoastalShelf Sci. 2007, 71, 318−334.(62) Manzello, D. P.; Enochs, I. C.; Melo, N.; Gledhill, D. K.; Johns,E. M. Ocean acidification refugia of the Florida Reef track. PLoS One2012, 7 (7), e41715,10 DOI: 10.1371/journal.pone.0041715.(63) Wootton, J. T.; Pfister, C. A.; Forester, J. D. Dynamic patternsand ecoclogical impacts of declining ocean pH in a high-resolutionmulti-year dataset. Proc. Natl. Acad. Sci. U. S. A. 2008, 105, 18848−18853.(64) Cai, W.-J.; Hu, X.; Huang, W.-J.; Murrell, M. C.; Lehrter, J. C.;Lohrenz, S. E.; Chou, W.-C.; Zhai, W.; Hollibaugh, J. T.; Wang, Y.;Zhao, P.; Guo, X.; Gundersen, K.; Dai, M.; Gong, G.-C. Acidificationof subsurface coastal waters enhanced by eutrophication. Nat. Geosci.2011, 4, 766−770.
(65) Hunt, C. W.; Salisbury, J. E.; Vandemark, D.; McGillis, W.Contrasting carbon dioxide inputs and exchange in three adjacent NewEngland estuaries. Estuaries Coasts 2011, 34, 68−77.(66) Dai, M.; Lu, Z.; Zhai, W.; Chen, B.; Cao, Z.; Zhou, K.; Cai, W.-J.; Chen, C-T. A. Diurnal variations of surface seawater pCO2 incontrasting coastal environments. Limnol. Oceanogr. 2009, 54 (3),735−745.(67) Zhang, J.-Z.; Wanninkhof, R. H.; Lee, K. Enhanced newproduction observed from the diurnal cycle of nitrate in anoligotrophic anticyclonic eddy. Geophys. Res. Lett. 2001, 28 (8),1579−1582.(68) Yates, K. K.; Dufore, C.; Smiley, N.; Jackson, C.; Halley, R. B.Diurnal variation of oxygen and carbonate system parameters inTampa Bay and Florida Bay. Mar. Chem. 2007, 104, 110−124.
■ NOTE ADDED AFTER ASAP PUBLICATIONThis paper was originally published ASAP on July 29, 2014,with an incorrect version of Figure 2. The correct version wasreposted on July 31, 2014.
Environmental Science & Technology Article
dx.doi.org/10.1021/es500510z | Environ. Sci. Technol. 2014, 48, 9161−91699169