Carbon dioxide emissions from coal based power generation in India
15
Carbon dioxide emissions from coal based power generation in India Shiv Pratap Raghuvanshi * , Avinash Chandra, Ashok Kumar Raghav Indian Institute of Technology Delhi, Hauz Khas, New Delhi 110 016, India Received 24 May 2004; received in revised form 9 November 2004; accepted 18 May 2005 Available online 21 July 2005 Abstract Coal is the major fossil fuel used in industrial units and power plants for power generation in India. The carbon dioxide emitted as a product of combustion of coal (fossil fuels) is currently responsible for over 60% of the enhanced greenhouse effect. The present communication is an attempt to provide a brief inves- tigation of CO 2 emission from coal based power generation in India. Energy indicators, trends in energy consumption and carbon dioxide emissions have been thoroughly investigated. Methodology for analysis of carbon emissions and possible sinks is also provided. Ó 2005 Elsevier Ltd. All rights reserved. Keywords: CO 2 emission; Coal; Combustion; Energy consumption; CO 2 mitigation; Sinks 1. Introduction Energy is the basic component for development of industry, public service and transport. It is the prime mover of economic growth and development. Throughout the history of the human race, major advances in civilization have been accompanied by an increased consumption of en- ergy. Combustion converts coal into useful heat energy, but it is also a part of the process that 0196-8904/$ - see front matter Ó 2005 Elsevier Ltd. All rights reserved. doi:10.1016/j.enconman.2005.05.007 * Corresponding author. Tel.: +91 9818604170; fax: +91 1126581121. E-mail address: [email protected] (S.P. Raghuvanshi). www.elsevier.com/locate/enconman Energy Conversion and Management 47 (2006) 427–441
Transcript of Carbon dioxide emissions from coal based power generation in India
www.elsevier.com/locate/enconman
Energy Conversion and Management 47 (2006) 427–441
Carbon dioxide emissions from coal based power generationin India
Shiv Pratap Raghuvanshi *, Avinash Chandra, Ashok Kumar Raghav
Indian Institute of Technology Delhi, Hauz Khas, New Delhi 110 016, India
Received 24 May 2004; received in revised form 9 November 2004; accepted 18 May 2005Available online 21 July 2005
Abstract
Coal is the major fossil fuel used in industrial units and power plants for power generation in India. Thecarbon dioxide emitted as a product of combustion of coal (fossil fuels) is currently responsible for over60% of the enhanced greenhouse effect. The present communication is an attempt to provide a brief inves-tigation of CO2 emission from coal based power generation in India. Energy indicators, trends in energyconsumption and carbon dioxide emissions have been thoroughly investigated. Methodology for analysisof carbon emissions and possible sinks is also provided.� 2005 Elsevier Ltd. All rights reserved.
Keywords: CO2 emission; Coal; Combustion; Energy consumption; CO2 mitigation; Sinks
1. Introduction
Energy is the basic component for development of industry, public service and transport. It isthe prime mover of economic growth and development. Throughout the history of the humanrace, major advances in civilization have been accompanied by an increased consumption of en-ergy. Combustion converts coal into useful heat energy, but it is also a part of the process that
0196-8904/$ - see front matter � 2005 Elsevier Ltd. All rights reserved.doi:10.1016/j.enconman.2005.05.007
* Corresponding author. Tel.: +91 9818604170; fax: +91 1126581121.E-mail address: [email protected] (S.P. Raghuvanshi).
428 S.P. Raghuvanshi et al. / Energy Conversion and Management 47 (2006) 427–441
engenders the greatest environmental and health concerns. Combustion of coal at thermal powerplants emits mainly carbon dioxide (CO2), sulphur oxides (SOx), nitrogen oxides (NOx), CFCs [1],other trace gases and air borne inorganic particulates, such as fly ash and suspended particulatematter (SPM). CO2, NOx and CFCs are green house gases (GHGs). CO2 produced in combustionis perhaps not strictly a pollutant (being a natural product of all combustion), nonetheless it is ofgreat concern in view of its impact on global warming. Carbon dioxide is a stable molecule withless than 10 years average residence time, i.e. 3 years in the troposphere [2], though its residencetime is over 100 years in the atmosphere, and its present concentration in the atmosphere isincreasing at an astonishing rate of 0.4% per year. The average residence time in the tropospheremeans the number of years a molecule exists before it is reused by another biological process onthe earth�s surface or broken apart in the stratosphere.
Electricity has been a preferred form for energy consumption and has consistently registered ahigher growth rate than other forms of energy. India is a developing country with over a billionpopulation and immense natural resources with total surface area of 3,287,590 sq. km and a hugeland area of 2,973,190 sq. km. Increased consumption of electric power is more intimately boundup with economic development on the one hand and increased emission of pollutants on the otherhand. Establishment of new industries, plants, commercial complexes and expansion of the capac-ity for consumer goods industries to feed its ever increasing population has led to a considerableincrease in the consumption of electricity in India and, consequently, the emission levels of CO2.Besides, with government plans for rural electrification and electricity to all, the demand for elec-tricity is sure to increase at an astonishing rate. Based on their studies in the northern hemisphere,Dunn and Flavin [3] stated that carbon dioxide, which is released into the atmosphere from theburning of fossil fuels, is the single most important greenhouse gas contributing to the ‘‘anthro-pogenic forcing of climate change’’. Thus, they conclude the share of CO2 in warming is expectedto rise from slightly more than half today to around 3/4th by 2100 and further stated that theaverage global surface temperature would be raised more during the 20th century than duringany other century in the last 1000 years.
Carbon dioxide comprises about 0.03% of the earth�s atmospheric volume, but due to the com-bustion of fossil fuels and deforestation, this percentage has increased by about 25% since pre-industrial times. Each year about 5 Gt of carbon is released into the atmosphere due to fossilfuel combustion. The average concentration of CO2 in the atmosphere has already reached358 ppm by volume (ppmv), compared to the pre-industrial level of 280 ppmv. Scientists projectthat excessive CO2 emissions into the atmosphere will increase the earth�s surface temperatureapproximately 1.5–4 �C in the next 30–40 years [4]. In most developing countries, CO2 emissionsare between 0.3 and 0.6 tons of carbon per capita per year. The relative rate of CO2 emission in-crease in developing countries has been much larger during the last few decades (about 5% peryear in developing regions in contrast to 1% per year in industrial regions during the last decades)[5].
Izrael [6] states that organic fuel combustion will evidently increase until the middle of the nextcentury, reaching a value of about 20 billion tons of coal equivalent (tce) per year (i.e. 6 · 1020 J).After that, organic fuels will be replaced with other energy resources, which do not produce thesame scale of pollutants emission into the environment. Even if this energy is produced verycleanly, the pronounced ecological effects would still limit it, evidently associated with the huge

S.P. Raghuvanshi et al. / Energy Conversion and Management 47 (2006) 427–441 429
amount of heat being dispersed into the environment due to the GHGs emitted from stationary ormobile sources in various forms.
1.1. Problems associated with CO2 increase in atmosphere
Projections by the International Energy Agency in World Energy Outlook 2000 have indi-cated that global CO2 emissions would increase to 29,575 and 36,102 million tones in 2010 and2020, respectively [7]. Fast accumulation of carbon dioxide in the atmosphere can evidently affectthe climate of earth rather quickly by warming the earth surface. This effect is associated withthe absorption of long wavelength radiation much more by CO2 than other GHGs. In particu-lar, the atmosphere of the northern hemisphere will be 1 �C warmer because of anthropogeniccarbon dioxide when this contribution will have reached several billion tons, corresponding to a60 ppm increase in concentration from now, such an increase could take place by the year 2010 [8].
The Intergovernmental Panel on Climate Change (IPCC) suggests that the global mean surfacetemperature of the earth has increased by between 0.3� and 0.6 �C since the late 19th century. Gio-rgi and Hewitson [9] concluded that a doubling of CO2 would increase the temperature by 2–4 �Cand decrease rainfall by 10–20% (>1 mm day�1). Carbon dioxide has already risen by 30% sincethe industrial era began [4].
The global atmosphere traps an increasing amount of heat due to the increased concentrationof CO2, and thus, higher temperatures result globally. This change in atmospheric temperature isof concern since even an increase of a few degrees would lead to severe regional effects, such asprolonged droughts, crop failure, change in cropping pattern, vegetative production with in-creased desertification, polar ice might partially melt, resulting in ocean flooding and submer-gence of major portions of low lying islands and coastal areas. Problems like global warming,climate change, emergence of natural hazards like flooding and change in sea levels, are on theirheadway, and for all these, the increasing concentration of carbon dioxide is held responsible. Forall these changes, human activities are held responsible, which mainly includes the emission ofGHGs by fossil fuel combustion [8]. CO2 is a universal production of the cycle of life. It is ab-sorbed by plants and generated and released by oxygen utilizing processes such as animal respi-ration, natural decay processes and anthropogenic combustion of fossil fuels. The level of CO2 inthe world depends on the balance between these processes. CO2 is a product of the combustion ofthe hydrocarbons in coal, oil and gas. It cannot be eliminated from the combustion, but it can besignificantly reduced, only at a great expense.
A US Environmental Protection Agency study of 15 major cities calculated that an estimated9800 additional deaths could occur annually in the United States due to air pollution as a result ofglobal warming [10].
1.2. Objectives of study
The objective of this study is to prepare an inventory of CO2 emissions from the present energygeneration and predict the same for the next two decades. This emission inventory will provideoptions to policy makers for CO2 reduction in the Indian power sector. Mitigation options (sinks)have been suggested and discussed.
430 S.P. Raghuvanshi et al. / Energy Conversion and Management 47 (2006) 427–441
2. National energy profile
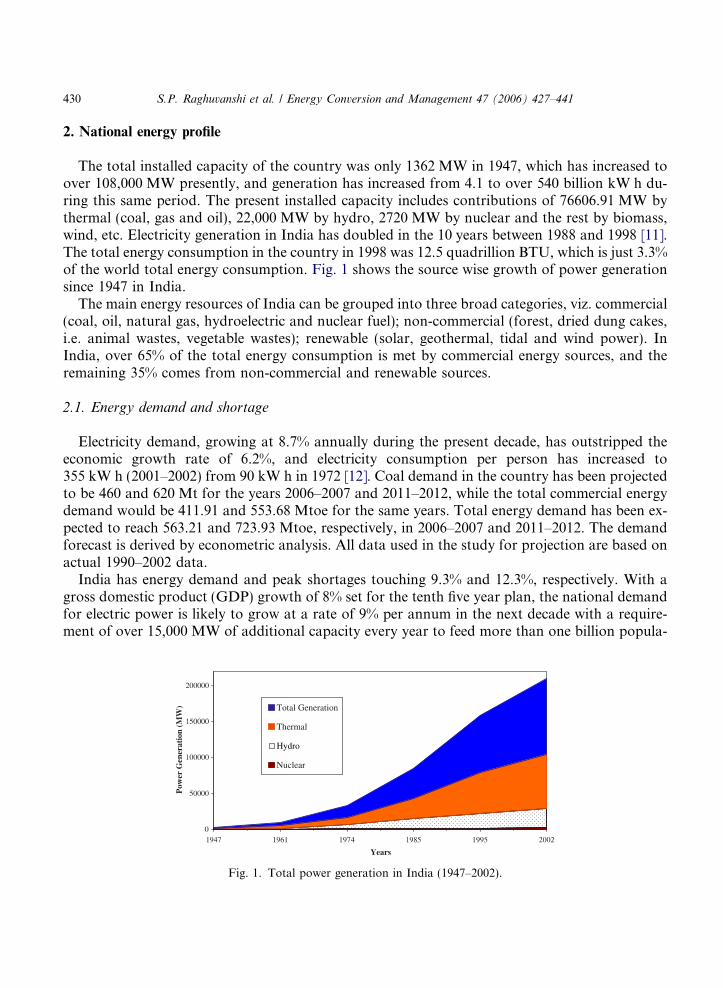
The total installed capacity of the country was only 1362 MW in 1947, which has increased toover 108,000 MW presently, and generation has increased from 4.1 to over 540 billion kW h du-ring this same period. The present installed capacity includes contributions of 76606.91 MW bythermal (coal, gas and oil), 22,000 MW by hydro, 2720 MW by nuclear and the rest by biomass,wind, etc. Electricity generation in India has doubled in the 10 years between 1988 and 1998 [11].The total energy consumption in the country in 1998 was 12.5 quadrillion BTU, which is just 3.3%of the world total energy consumption. Fig. 1 shows the source wise growth of power generationsince 1947 in India.
The main energy resources of India can be grouped into three broad categories, viz. commercial(coal, oil, natural gas, hydroelectric and nuclear fuel); non-commercial (forest, dried dung cakes,i.e. animal wastes, vegetable wastes); renewable (solar, geothermal, tidal and wind power). InIndia, over 65% of the total energy consumption is met by commercial energy sources, and theremaining 35% comes from non-commercial and renewable sources.
2.1. Energy demand and shortage
Electricity demand, growing at 8.7% annually during the present decade, has outstripped theeconomic growth rate of 6.2%, and electricity consumption per person has increased to355 kW h (2001–2002) from 90 kW h in 1972 [12]. Coal demand in the country has been projectedto be 460 and 620 Mt for the years 2006–2007 and 2011–2012, while the total commercial energydemand would be 411.91 and 553.68 Mtoe for the same years. Total energy demand has been ex-pected to reach 563.21 and 723.93 Mtoe, respectively, in 2006–2007 and 2011–2012. The demandforecast is derived by econometric analysis. All data used in the study for projection are based onactual 1990–2002 data.
India has energy demand and peak shortages touching 9.3% and 12.3%, respectively. With agross domestic product (GDP) growth of 8% set for the tenth five year plan, the national demandfor electric power is likely to grow at a rate of 9% per annum in the next decade with a require-ment of over 15,000 MW of additional capacity every year to feed more than one billion popula-
Fig. 1. Total power generation in India (1947–2002).
S.P. Raghuvanshi et al. / Energy Conversion and Management 47 (2006) 427–441 431
tion [13], which will necessitate a tripling of installed generation capacity from 101,000 to292,000 MW by 2020 [14]. During 2000–2001, the total energy shortage was estimated at39,816 million units, and the peak shortage was estimated at 10,157 MW (approximately 13%of the country�s installed capacity). In terms of energy demand, India accounts for 3.5% (313.5million tones of oil equivalent, Mtoe) of the world commercial energy demand (8752.4 Mtoe)in 2001 [15]. The country�s demand is increasing steadily, but an equilibrium position has not beenachieved.
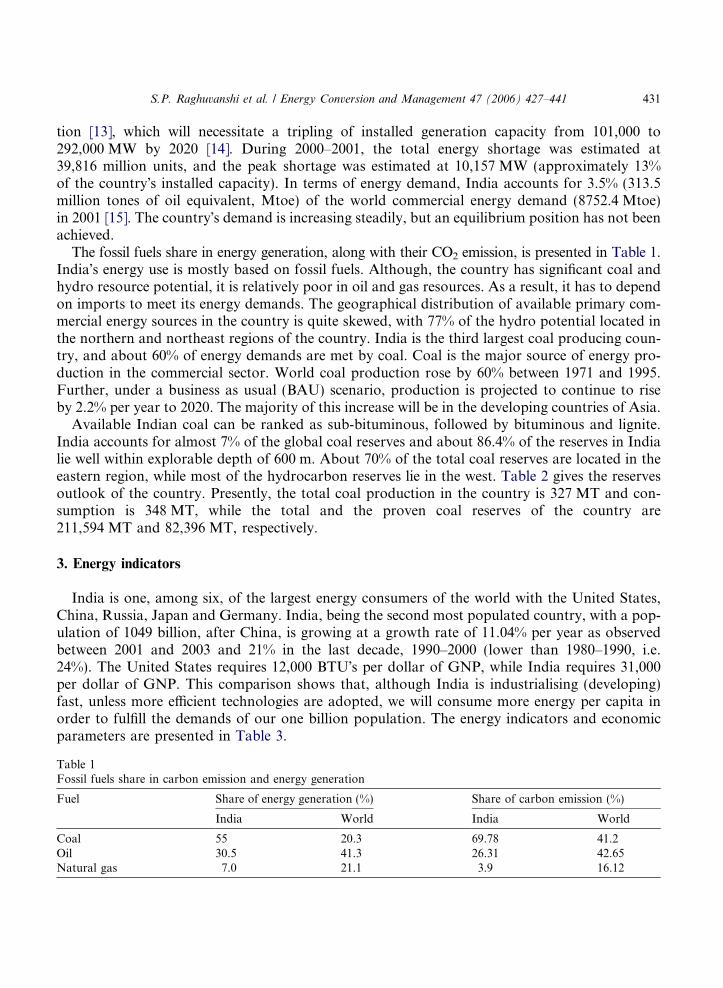
The fossil fuels share in energy generation, along with their CO2 emission, is presented in Table 1.India�s energy use is mostly based on fossil fuels. Although, the country has significant coal andhydro resource potential, it is relatively poor in oil and gas resources. As a result, it has to dependon imports to meet its energy demands. The geographical distribution of available primary com-mercial energy sources in the country is quite skewed, with 77% of the hydro potential located inthe northern and northeast regions of the country. India is the third largest coal producing coun-try, and about 60% of energy demands are met by coal. Coal is the major source of energy pro-duction in the commercial sector. World coal production rose by 60% between 1971 and 1995.Further, under a business as usual (BAU) scenario, production is projected to continue to riseby 2.2% per year to 2020. The majority of this increase will be in the developing countries of Asia.
Available Indian coal can be ranked as sub-bituminous, followed by bituminous and lignite.India accounts for almost 7% of the global coal reserves and about 86.4% of the reserves in Indialie well within explorable depth of 600 m. About 70% of the total coal reserves are located in theeastern region, while most of the hydrocarbon reserves lie in the west. Table 2 gives the reservesoutlook of the country. Presently, the total coal production in the country is 327 MT and con-sumption is 348 MT, while the total and the proven coal reserves of the country are211,594 MT and 82,396 MT, respectively.
3. Energy indicators
India is one, among six, of the largest energy consumers of the world with the United States,China, Russia, Japan and Germany. India, being the second most populated country, with a pop-ulation of 1049 billion, after China, is growing at a growth rate of 11.04% per year as observedbetween 2001 and 2003 and 21% in the last decade, 1990–2000 (lower than 1980–1990, i.e.24%). The United States requires 12,000 BTU�s per dollar of GNP, while India requires 31,000per dollar of GNP. This comparison shows that, although India is industrialising (developing)fast, unless more efficient technologies are adopted, we will consume more energy per capita inorder to fulfill the demands of our one billion population. The energy indicators and economicparameters are presented in Table 3.
Table 1Fossil fuels share in carbon emission and energy generation
Fuel Share of energy generation (%) Share of carbon emission (%)
India World India World
Coal 55 20.3 69.78 41.2Oil 30.5 41.3 26.31 42.65Natural gas 7.0 21.1 3.9 16.12
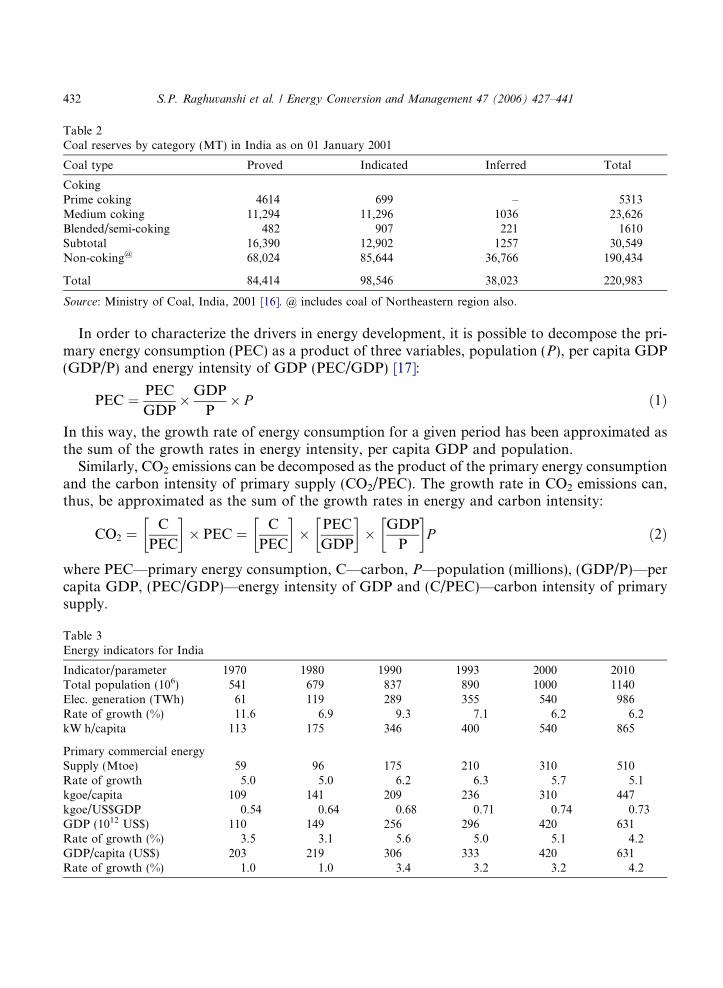
Table 2Coal reserves by category (MT) in India as on 01 January 2001
Coal type Proved Indicated Inferred Total
CokingPrime coking 4614 699 – 5313Medium coking 11,294 11,296 1036 23,626Blended/semi-coking 482 907 221 1610Subtotal 16,390 12,902 1257 30,549Non-coking@ 68,024 85,644 36,766 190,434
Total 84,414 98,546 38,023 220,983
Source: Ministry of Coal, India, 2001 [16]. @ includes coal of Northeastern region also.
432 S.P. Raghuvanshi et al. / Energy Conversion and Management 47 (2006) 427–441
In order to characterize the drivers in energy development, it is possible to decompose the pri-mary energy consumption (PEC) as a product of three variables, population (P), per capita GDP(GDP/P) and energy intensity of GDP (PEC/GDP) [17]:
TableEnerg
IndicaTotalElec.RatekW h
PrimaSupplRatekgoe/kgoe/GDPRateGDP/Rate
PEC ¼ PEC
GDP�GDP
P� P ð1Þ
In this way, the growth rate of energy consumption for a given period has been approximated asthe sum of the growth rates in energy intensity, per capita GDP and population.
Similarly, CO2 emissions can be decomposed as the product of the primary energy consumptionand the carbon intensity of primary supply (CO2/PEC). The growth rate in CO2 emissions can,thus, be approximated as the sum of the growth rates in energy and carbon intensity:
CO2 ¼C
PEC
� �� PEC ¼ C
PEC
� �� PEC
GDP
� �� GDP
P
� �P ð2Þ
where PEC—primary energy consumption, C—carbon, P—population (millions), (GDP/P)—percapita GDP, (PEC/GDP)—energy intensity of GDP and (C/PEC)—carbon intensity of primarysupply.
3y indicators for India
tor/parameter 1970 1980 1990 1993 2000 2010population (106) 541 679 837 890 1000 1140generation (TWh) 61 119 289 355 540 986of growth (%) 11.6 6.9 9.3 7.1 6.2 6.2/capita 113 175 346 400 540 865
ry commercial energyy (Mtoe) 59 96 175 210 310 510of growth 5.0 5.0 6.2 6.3 5.7 5.1capita 109 141 209 236 310 447US$GDP 0.54 0.64 0.68 0.71 0.74 0.73(1012 US$) 110 149 256 296 420 631of growth (%) 3.5 3.1 5.6 5.0 5.1 4.2capita (US$) 203 219 306 333 420 631of growth (%) 1.0 1.0 3.4 3.2 3.2 4.2
y=31.525x + 139.05
R2=0.7359
y= 0.0166x + 0.1762
R2=0.819
0
0.1
0.2
0.3
0.4
0.5
0.6
1990
1991
1992
1993
1994
1995
1996
1997
1998
1999
2000
2002
2005
2010
2020
Years
Per
Cap
ita C
arbo
n E
mis
sion
(M
T)
0
100
200
300
400
500
600
700
800
900
Carbon Emission
E Consumption
Per Capita E
nergy Consum
ption (MT
)
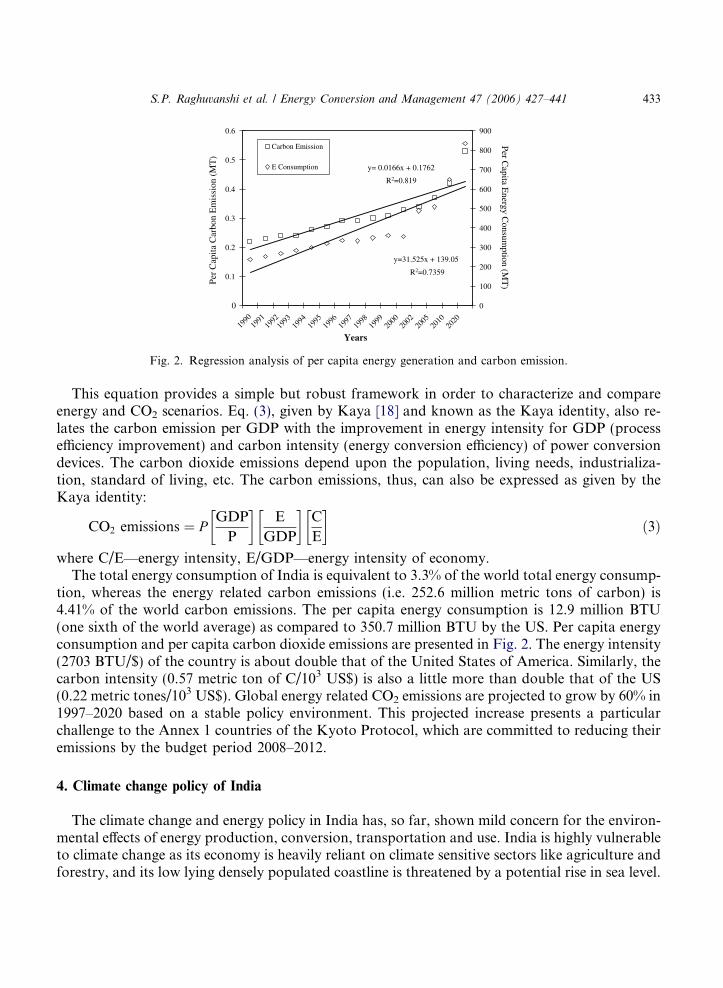
Fig. 2. Regression analysis of per capita energy generation and carbon emission.
S.P. Raghuvanshi et al. / Energy Conversion and Management 47 (2006) 427–441 433
This equation provides a simple but robust framework in order to characterize and compareenergy and CO2 scenarios. Eq. (3), given by Kaya [18] and known as the Kaya identity, also re-lates the carbon emission per GDP with the improvement in energy intensity for GDP (processefficiency improvement) and carbon intensity (energy conversion efficiency) of power conversiondevices. The carbon dioxide emissions depend upon the population, living needs, industrializa-tion, standard of living, etc. The carbon emissions, thus, can also be expressed as given by theKaya identity:
CO2 emissions ¼ PGDP
P
� �E
GDP
� �C
E
� �ð3Þ
where C/E—energy intensity, E/GDP—energy intensity of economy.The total energy consumption of India is equivalent to 3.3% of the world total energy consump-
tion, whereas the energy related carbon emissions (i.e. 252.6 million metric tons of carbon) is4.41% of the world carbon emissions. The per capita energy consumption is 12.9 million BTU(one sixth of the world average) as compared to 350.7 million BTU by the US. Per capita energyconsumption and per capita carbon dioxide emissions are presented in Fig. 2. The energy intensity(2703 BTU/$) of the country is about double that of the United States of America. Similarly, thecarbon intensity (0.57 metric ton of C/103 US$) is also a little more than double that of the US(0.22 metric tones/103 US$). Global energy related CO2 emissions are projected to grow by 60% in1997–2020 based on a stable policy environment. This projected increase presents a particularchallenge to the Annex 1 countries of the Kyoto Protocol, which are committed to reducing theiremissions by the budget period 2008–2012.
4. Climate change policy of India
The climate change and energy policy in India has, so far, shown mild concern for the environ-mental effects of energy production, conversion, transportation and use. India is highly vulnerableto climate change as its economy is heavily reliant on climate sensitive sectors like agriculture andforestry, and its low lying densely populated coastline is threatened by a potential rise in sea level.

434 S.P. Raghuvanshi et al. / Energy Conversion and Management 47 (2006) 427–441
India signed this multi-lateral treaty on 10 June 1992 and was the 38th country to ratify the Con-vention on 1 November 1993. India is a party to the United Nations Framework Convention onClimate Change (UNFCCC) and participates in international efforts to find a coordinated, equi-table and effective set of actions to combat the threat of climate change. Still, the country�s policyinsists more on the use of coal as its major fossil fuel for power generation.
There are various technologies and processes that have substantial potential to reduce GHGemissions, for instance, coal and biomass gasification technology; gas turbine technology; powergeneration with solar thermal and photovoltaic technology, fuel cells, etc. Clean coal technologiesand renewable energy usage have been adopted by India as methods of best approach to discussclimate change. These are broadly classified as:
(a) Energy conservation and improvements in energy efficiency.(b) Use of low carbon fuels like natural gas and hydropower.(c) Promote afforestation.(d) Sequestration.(e) Sinks.
These options have been partially implemented and further implementations are necessary tomove towards a sustainable energy future and reduce its dependency on coal fired electricity gen-eration. Along with all these methods, further steps can be implemented for reduction of CO2
emissions. These are research and development; information and education (for awareness); eco-nomic measures; regulatory measures; and voluntary agreements. Each step offers advantages anddrawbacks and has different effects on CO2 reduction. Measures often interact and function incombination.
Research and development activities include research on the climate system and prevention ofclimate change. These include voluntary and funding support based participation by institutes andindustries on climate change related research.
Information and awareness campaigns are directed to the general public and specific groups inorder to motivate them and to disseminate technical knowledge for energy efficiency andconservation.
India recognizes the importance of reducing these harmful emissions and also places a high pri-ority on economic development. As such, India is not a signatory to the Kyoto Protocol that man-dates specific commitments by countries to reduce their emissions of greenhouse gases to anaverage of 5.2% below 1990 levels by 2008–2012. Nevertheless, India accepted (ratification wasunnecessary) the Kyoto Protocol on August 26, 2002.
5. Method to calculate CO2 emission from coal combustion
5.1. Characteristics of coal used in power sector
The lower grade coking coal used in Indian thermal power stations has low calorific value andhigh ash and moisture content. The ash of Indian coal is refractory in nature, which is also con-
S.P. Raghuvanshi et al. / Energy Conversion and Management 47 (2006) 427–441 435
sidered an advantage for its use in power plants. Indian power plants receive coals of E, F and Ggrades. Indian coal in general, contains low sulphur (<0.6%), and the chlorine content is less than0.1%, making it an ideal fuel for power generation purposes.
The rate of coal consumption in production of electricity, overall, for India is of the order of0.77–0.85 kg/kW h [19]. Coal is extracted from a system of linked collieries in the country and istransported mainly by rail (about 60%) and also by road. Around 449 mines are operational in thecountry, which provide coal for various uses. Washing of coal in the country is difficult because itcontains near gravity impurities and existing coal beneficiation facilities are old and have low unitcapacity.
5.2. Carbon dioxide emission from coal combustion
Carbon dioxide emission from combustion of coal depends on the quantity of coal consumed,the average carbon content of the coal and a small percent of carbon that remains unoxidised,largely as particulate matter. The high heating value (HHV) of coal (or gross calorific value,GCV) is related to its carbon content. The GCV/HHV was calculated to be 14840.09 kJ/kg.The fraction of carbon in coal was estimated by using the general molecular formula of coal,i.e. C135H96O9NS. Of the total carbon burned, Marland and Rotty [20] have estimated that about1% escapes unoxidised. Based on the input parameters and ultimate analysis of the fuel used forpower generation, the emission of carbon dioxide from thermal power plants has been computed.The input parameters are coal consumed per annum, combustion system efficiency and carboncontent of the fuel. The combustion system efficiency has been considered equal to the averagevalue (26%) observed in pulverized systems. The total carbon dioxide emissions from the powersector have been obtained from Eq. (4):
QCO2¼ Cqg ð4Þ
where QCO2—amount of carbon dioxide emitted, Mt; C—carbon fraction of the fuel; q—amount
of fuel consumed in the particular year, MT (per annum); g—combustion efficiency of the fueldevice.
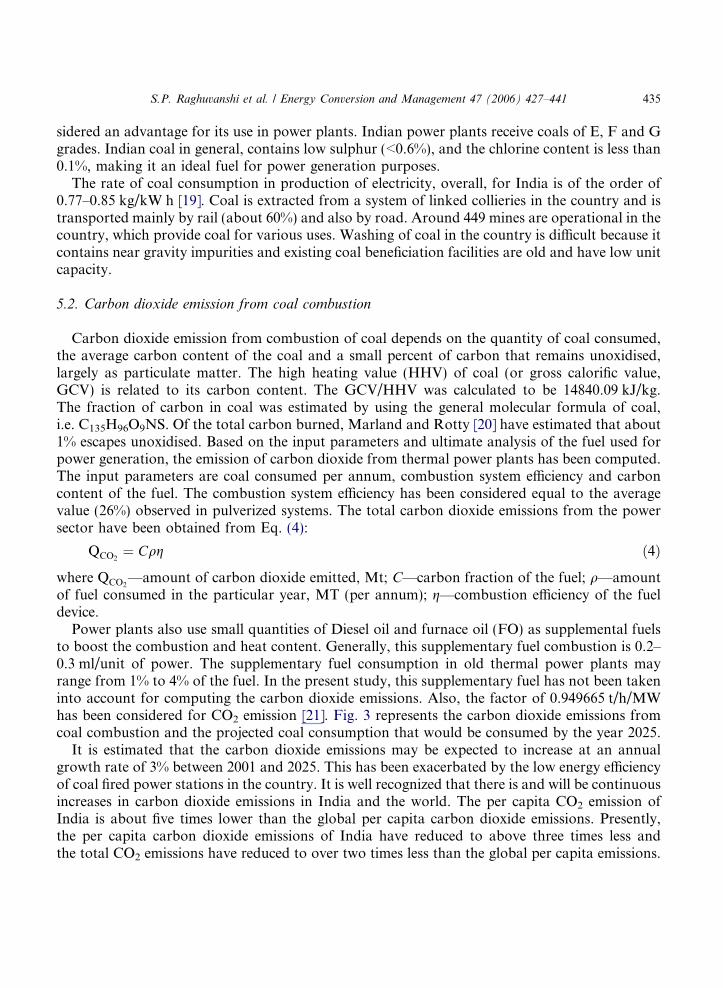
Power plants also use small quantities of Diesel oil and furnace oil (FO) as supplemental fuelsto boost the combustion and heat content. Generally, this supplementary fuel combustion is 0.2–0.3 ml/unit of power. The supplementary fuel consumption in old thermal power plants mayrange from 1% to 4% of the fuel. In the present study, this supplementary fuel has not been takeninto account for computing the carbon dioxide emissions. Also, the factor of 0.949665 t/h/MWhas been considered for CO2 emission [21]. Fig. 3 represents the carbon dioxide emissions fromcoal combustion and the projected coal consumption that would be consumed by the year 2025.
It is estimated that the carbon dioxide emissions may be expected to increase at an annualgrowth rate of 3% between 2001 and 2025. This has been exacerbated by the low energy efficiencyof coal fired power stations in the country. It is well recognized that there is and will be continuousincreases in carbon dioxide emissions in India and the world. The per capita CO2 emission ofIndia is about five times lower than the global per capita carbon dioxide emissions. Presently,the per capita carbon dioxide emissions of India have reduced to above three times less andthe total CO2 emissions have reduced to over two times less than the global per capita emissions.
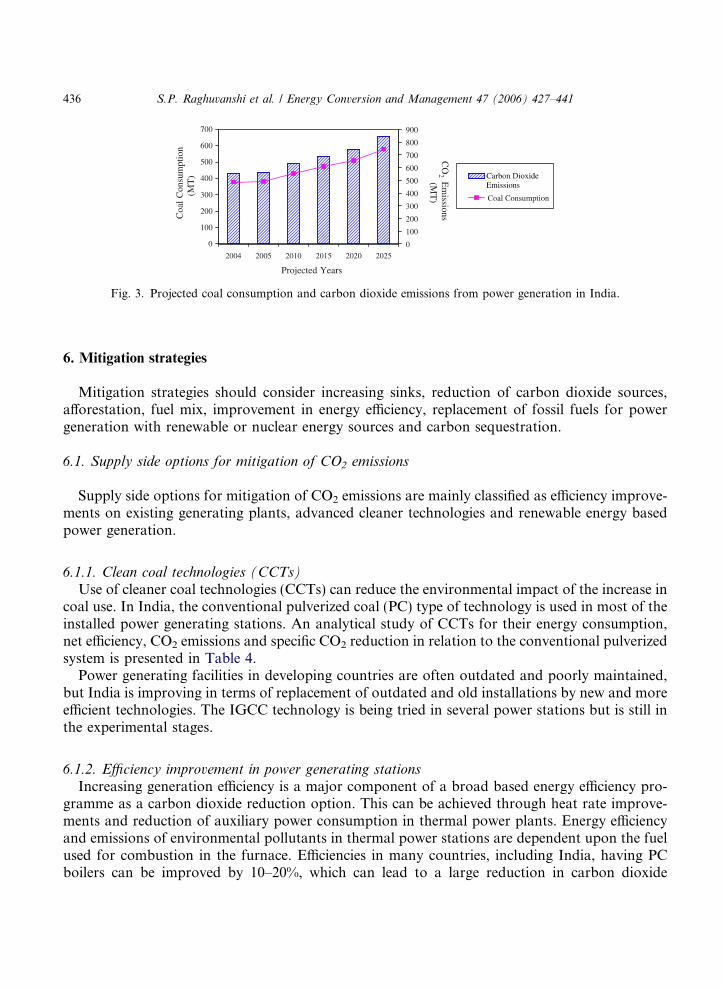
Fig. 3. Projected coal consumption and carbon dioxide emissions from power generation in India.
436 S.P. Raghuvanshi et al. / Energy Conversion and Management 47 (2006) 427–441
6. Mitigation strategies
Mitigation strategies should consider increasing sinks, reduction of carbon dioxide sources,afforestation, fuel mix, improvement in energy efficiency, replacement of fossil fuels for powergeneration with renewable or nuclear energy sources and carbon sequestration.
6.1. Supply side options for mitigation of CO2 emissions
Supply side options for mitigation of CO2 emissions are mainly classified as efficiency improve-ments on existing generating plants, advanced cleaner technologies and renewable energy basedpower generation.
6.1.1. Clean coal technologies (CCTs)Use of cleaner coal technologies (CCTs) can reduce the environmental impact of the increase in
coal use. In India, the conventional pulverized coal (PC) type of technology is used in most of theinstalled power generating stations. An analytical study of CCTs for their energy consumption,net efficiency, CO2 emissions and specific CO2 reduction in relation to the conventional pulverizedsystem is presented in Table 4.
Power generating facilities in developing countries are often outdated and poorly maintained,but India is improving in terms of replacement of outdated and old installations by new and moreefficient technologies. The IGCC technology is being tried in several power stations but is still inthe experimental stages.
6.1.2. Efficiency improvement in power generating stationsIncreasing generation efficiency is a major component of a broad based energy efficiency pro-
gramme as a carbon dioxide reduction option. This can be achieved through heat rate improve-ments and reduction of auxiliary power consumption in thermal power plants. Energy efficiencyand emissions of environmental pollutants in thermal power stations are dependent upon the fuelused for combustion in the furnace. Efficiencies in many countries, including India, having PCboilers can be improved by 10–20%, which can lead to a large reduction in carbon dioxide
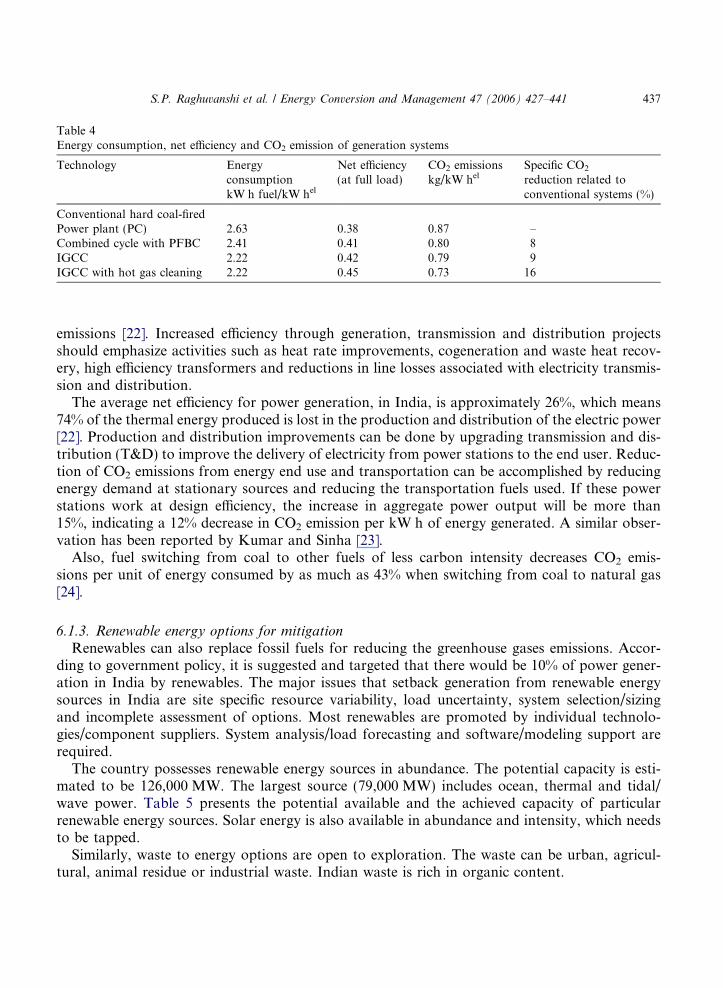
Table 4Energy consumption, net efficiency and CO2 emission of generation systems
Technology EnergyconsumptionkW h fuel/kW hel
Net efficiency(at full load)
CO2 emissionskg/kW hel
Specific CO2
reduction related toconventional systems (%)
Conventional hard coal-firedPower plant (PC) 2.63 0.38 0.87 –Combined cycle with PFBC 2.41 0.41 0.80 8IGCC 2.22 0.42 0.79 9IGCC with hot gas cleaning 2.22 0.45 0.73 16
S.P. Raghuvanshi et al. / Energy Conversion and Management 47 (2006) 427–441 437
emissions [22]. Increased efficiency through generation, transmission and distribution projectsshould emphasize activities such as heat rate improvements, cogeneration and waste heat recov-ery, high efficiency transformers and reductions in line losses associated with electricity transmis-sion and distribution.
The average net efficiency for power generation, in India, is approximately 26%, which means74% of the thermal energy produced is lost in the production and distribution of the electric power[22]. Production and distribution improvements can be done by upgrading transmission and dis-tribution (T&D) to improve the delivery of electricity from power stations to the end user. Reduc-tion of CO2 emissions from energy end use and transportation can be accomplished by reducingenergy demand at stationary sources and reducing the transportation fuels used. If these powerstations work at design efficiency, the increase in aggregate power output will be more than15%, indicating a 12% decrease in CO2 emission per kW h of energy generated. A similar obser-vation has been reported by Kumar and Sinha [23].
Also, fuel switching from coal to other fuels of less carbon intensity decreases CO2 emis-sions per unit of energy consumed by as much as 43% when switching from coal to natural gas[24].
6.1.3. Renewable energy options for mitigationRenewables can also replace fossil fuels for reducing the greenhouse gases emissions. Accor-
ding to government policy, it is suggested and targeted that there would be 10% of power gener-ation in India by renewables. The major issues that setback generation from renewable energysources in India are site specific resource variability, load uncertainty, system selection/sizingand incomplete assessment of options. Most renewables are promoted by individual technolo-gies/component suppliers. System analysis/load forecasting and software/modeling support arerequired.
The country possesses renewable energy sources in abundance. The potential capacity is esti-mated to be 126,000 MW. The largest source (79,000 MW) includes ocean, thermal and tidal/wave power. Table 5 presents the potential available and the achieved capacity of particularrenewable energy sources. Solar energy is also available in abundance and intensity, which needsto be tapped.
Similarly, waste to energy options are open to exploration. The waste can be urban, agricul-tural, animal residue or industrial waste. Indian waste is rich in organic content.
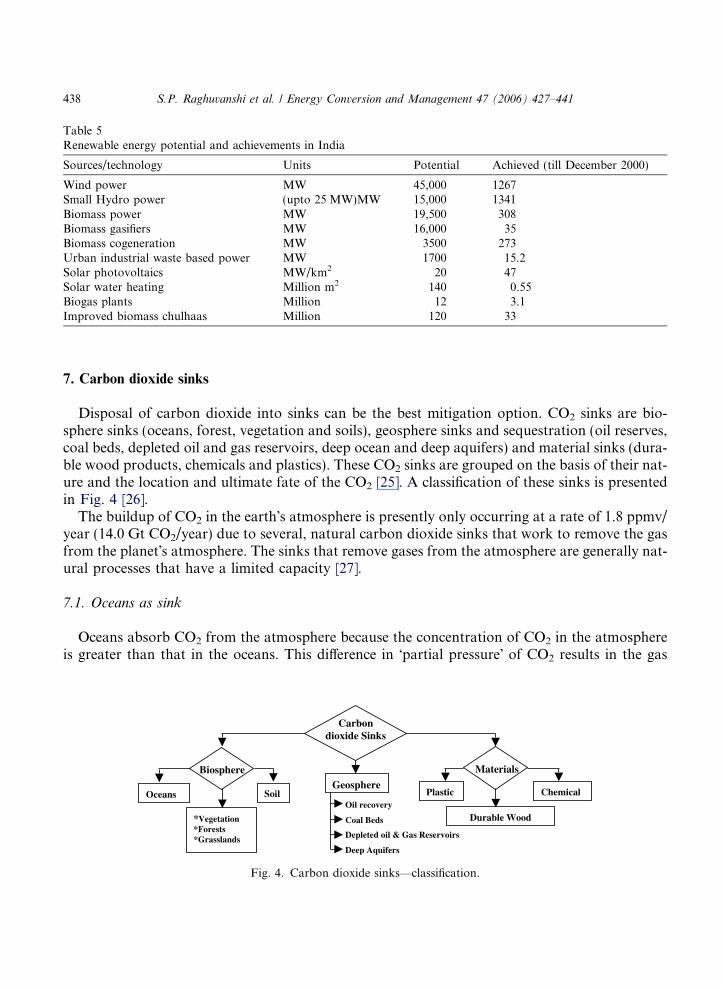
Table 5Renewable energy potential and achievements in India
Sources/technology Units Potential Achieved (till December 2000)
Wind power MW 45,000 1267Small Hydro power (upto 25 MW)MW 15,000 1341Biomass power MW 19,500 308Biomass gasifiers MW 16,000 35Biomass cogeneration MW 3500 273Urban industrial waste based power MW 1700 15.2Solar photovoltaics MW/km2 20 47Solar water heating Million m2 140 0.55Biogas plants Million 12 3.1Improved biomass chulhaas Million 120 33
438 S.P. Raghuvanshi et al. / Energy Conversion and Management 47 (2006) 427–441
7. Carbon dioxide sinks
Disposal of carbon dioxide into sinks can be the best mitigation option. CO2 sinks are bio-sphere sinks (oceans, forest, vegetation and soils), geosphere sinks and sequestration (oil reserves,coal beds, depleted oil and gas reservoirs, deep ocean and deep aquifers) and material sinks (dura-ble wood products, chemicals and plastics). These CO2 sinks are grouped on the basis of their nat-ure and the location and ultimate fate of the CO2 [25]. A classification of these sinks is presentedin Fig. 4 [26].
The buildup of CO2 in the earth�s atmosphere is presently only occurring at a rate of 1.8 ppmv/year (14.0 Gt CO2/year) due to several, natural carbon dioxide sinks that work to remove the gasfrom the planet�s atmosphere. The sinks that remove gases from the atmosphere are generally nat-ural processes that have a limited capacity [27].
7.1. Oceans as sink
Oceans absorb CO2 from the atmosphere because the concentration of CO2 in the atmosphereis greater than that in the oceans. This difference in �partial pressure� of CO2 results in the gas
Carbon dioxide Sinks
Biosphere Geosphere
Materials
Oil recovery
Coal Beds
Depleted oil & Gas Reservoirs
Deep Aquifers
Oceans
*Vegetation *Forests *Grasslands
Soil
Durable Wood
Plastic
Chemical
Fig. 4. Carbon dioxide sinks—classification.

S.P. Raghuvanshi et al. / Energy Conversion and Management 47 (2006) 427–441 439
being absorbed into the world�s oceans. The amount of CO2 that can be taken up by the oceans ina given year is a function of wind speed, air and water temperatures and concentration gradientsand is, therefore, difficult to determine accurately. Similarly, the absolute amount of CO2 that theoceans will be able to absorb is currently a matter of debate. The best estimates of the ocean sinkare that the oceans are absorbing 7.4 Gt CO2/year (0.9 ppmv/year) [27].
7.2. Forests as sinks
Forests sequester carbon for finite time periods, which would allow the implementation of morepermanent options for avoidance of GHGs emissions and stabilization of climate change. Slowingdeforestation and planting trees will increase the planet�s terrestrial biomass sink, also slowingCO2 buildup in the atmosphere. Globally forests, grasslands and other land based plants are cur-rently absorbing an estimated 5.5 Gt CO2/year (0.7 ppmv/year). The total forest area in India is63,300 · 103 ha, having a deforestation rate of 274 · 103 ha yr�1. Out of the total land availablefor forestation (i.e. 53,200 · 103 ha) about 10,640 · 103 ha can be considered for energy planta-tions. Trees growing in the forest serve as an important means to capture and store atmosphericCO2 in vegetation, soil and forest products. Further, in India, the wasteland available for fores-tation is quite large, i.e. 30 · 106 ha. An energy plantation can be used for power generation inthree general applications, for instance:
(i) Co-firing in fossil fuel fired power generation facilities.(ii) Cogeneration in agriculture and forestry processing facilities.(iii) Stand alone grid connected biomass based power stations that consider energy plantation
feed stocks along with other agriculture residues, like baggase, wood waste, rice hull, etc.
Though non-conventional fuels like biomass, hydro, solar, etc. can replace coal based powergenerations to an extent, they are expensive to establish and operate on one hand, while theirnet life cycle CO2 emissions are negligible or zero on the other hand, which provides them a supe-rior position above fossil fuels like coal.
Brown et al. [28] have grouped forest mitigation activities into three categories: the first cate-gory includes activities that avoid the release of emissions from carbon stock (forest conservationand protection); the second includes activities that store carbon (afforestation, reforestation andagro forestry); and the third category involves substituting the use of carbon intensive productsand fuels with sustainable harvested wood products and wood fuel (e.g. substitution of woodfor steel or concrete and bio-electricity for electricity generated from fossil fuel combustion). Sat-haye et al. [29] have suggested afforestation (short and long rotation), regeneration and protectionof forest as a possible and fastest way to reduce C emissions. The potential was estimated to be ofthe order of 1 Pg C yr�1 in 2010, or enough to offset a large portion of the annual GHGs emissionfrom this sector during the 1990s.
The reason for forests as an increased sink is that increased levels of atmospheric CO2 haveacted to �fertilize� plant matter, causing their increased growth. Forests allow bio-chemical conver-sion of carbon dioxide into a useful product for long term storage The regeneration of forests onabandoned farmland in the northern hemisphere may also be contributing to the capacity of thissink.
440 S.P. Raghuvanshi et al. / Energy Conversion and Management 47 (2006) 427–441
Emissions of CO2 from coal combustion can also be reduced by CO2 capture and sequestration.The CO2 may be stored in aquifers, oil and gas fields or on the ocean floor. These technologieshave great potential and have been studied in depth by the IEA Greenhouse Gas R&D Pro-gramme [30].
8. Conclusion
This communication was mainly focused on studying the carbon dioxide emissions from coalbased power generation and the other energy indicators on which GHGs emissions are dependent.Methods and equations to analyse these emissions and their dependence on various factors, likeGDP, population, energy intensity, etc., have been taken into account.
Coal, being the abundant source available in India, will continue to play the major role in fu-ture power generation. As also, the government policy is based on coal based power generation,essentially, carbon dioxide emissions will take place as long as we use these fuels. For every ton offossil fuels burned, at least three quarters of a tone of carbon is released as CO2. It has been foundthat 0.8–0.9 kg/kW h CO2 is emitted in Indian power plants.
It is concluded that there are technically feasible and economically viable options for mitiga-ting the most potent GHG (CO2) emission from the power sector, like shifting to very optimisticand clean renewable based energy sources in place of coal and other high carbon intensive fuels,which need to be studied for their suitability and life long assessment for specific Indian condi-tions. The possibilities to reduce carbon dioxide emissions depend mainly on economic growth,the development of energy efficient systems and fuel switching to less carbon intensive productionsystems.
Reduction measures can be improved many fold with a combination of two options, i.e. usinglow carbon fuels in efficient systems for power generation and enhanced growth of sinks (e.g. for-ests). Also, CO2 emissions reductions cannot be achieved within a short span of time, since cleancoal technologies, renewable energy sources and sinks have their own times to reduce CO2 in theatmosphere.
References
[1] Emissions from thermal power plants using coal as fuel [online]: Available from: http://www.osc.edu/research/pcrm/emissions/summary.shtml.
[2] The carbon and oxygen cycle [online]: Available from: http://www.envf.port.ac.uk/geog/teaching/environ/sect3-7g.htm.
[3] Dunn S, Flavin C. Moving the climate change agenda forward: In State of the World 2002. Special World SummitEdition. NY: WW Norton and Company, 2002; p. 25–50.
[4] IPCC, In: Houghton JT, Meira Filho LG, Callender BA, Harris N, Kattenberg A, Mashell K, editors. ClimateChange 1995: The Science of Climate Change, Intergovernmental Panel on Climate Change. Cambridge, UK:Cambridge University Press; 1996.
[5] International Energy Agency (IEA), Greenhouse Gas R&D Program. Carbon dioxide capture from power plantstation UK, 1995.
[6] Izrael YA. Energy development and its effect on environment. Energy 1987;12(10/11):969–74.[7] International Energy Agency (IEA), World Energy Outlook-2000. 2000: 66.
S.P. Raghuvanshi et al. / Energy Conversion and Management 47 (2006) 427–441 441
[8] IPCC, In: Houghton JT, Ding Y, Griggs DJ, Noguer M, Van der Linden PJ, Dai X, et al., editors. Climate Change2001: A Scientific Basis: Intergovernmental Panel on Climate Change. Cambridge, UK: Cambridge UniversityPress; 2001.
[9] Giorgi F, Hewitson B. Regional climate information—evaluation and projections. In: Houghton JT, Ding Y,Griggs DJ, Noguer M, Van Der Linden PJ, Xioaosu D, editors. Climate Change 2001: The Scientific Basis,Contribution of Working Group I to the Third Assessment Report of the Intergovernmental Panel on ClimateChange. Cambridge: Cambridge University Press; 2001. p. 583 –683.
[10] Health problems [online]: Available from: http://www.iclei.org/SB4.HTM.[11] Available online from: http://unfcc.int/text/resource/iuckit/fact03.html.[12] Misra BC, Verma SK, Chakrabarti RK. Clean Coal Technology-Indian Context. Indo-European Seminar
1997:11.3.1–5.[13] Raghuvanshi SP, Raghav AK, Chandra A, Singh R. Greenhouse gas: carbon dioxide emission inventory from
combustion of fossil fuels in power sector in India. In: Proceedings International Conference World ClimateChange Conference 2003, Moscow, Russia, 2003; p. 557.
[14] Gupta SP. Indian Vision 2020, Planning Commissions Report, Government of India, New Delhi, 2002, p. 10.[15] Powerline, India�s First Power Magazine 2001;5(10):74–5.[16] Ministry of Coal, 2001. New Delhi, India.[17] World Energy Scenarios [online]: Available from: http://www.upmf-grenoble.fr/iepe/textes/ShAVol02.pdf (page 43
as viewed on 20 March 2004).[18] Kaya Y. Impact of Carbon Dioxide Emission on GNP Growth: Interpretation of Proposed Scenarios. Geneva,
Switz: Intergovernmental Panel on Climate Change, Response Strategies Work Group 1989.[19] CBIP. Power Development in India (1995–1996). Government of India, New Delhi, 1995.[20] Marland G, Rotty R. Carbon dioxide emission from fossil fuels: A procedure for estimation and results for 1950–
1982. Tellus 1984;36(b):232–61.[21] Chandra A, Chandra H. Impact of Indian and imported coal on Indian thermal power plants. J Scient Industr Res
2004;23:156–62.[22] Raghuvanshi SP, Chandra A, Raghav AK. Carbon dioxide emission inventory from power sector. In: Proceedings
Energy and Environment—International Conference on Energy and Environment: Strategies for SustainableDevelopment (ICEE-SSD) 2004: 369–78.
[23] Kumar S, Sinha S. Non-CO2 emitting renewable energy source in India: Paths, reliable potential and requirementof industry related forestry pattern. Energy Convers Manage 1995;36(6–9):885–8.
[24] Frederick MD. Voluntary reporting of GHGs emissions reduction achieved in 2000. Air Pollut Constants (AspenPubs Inc.) 2002;12(5):19–113.
[25] Schimel D, Alves D, Enting D, Heimann M, Joos F. Radiative forcing of climate change. In: Houghton JT, MeiraFilho LG, Callander BA, Harris N, Kattenberg A, Maskell K, editors. Climate Change 1995. The Science ofClimate Change. Cambridge: Cambridge University Press; 1996. p. 65–132.
[26] Raghuvanshi SP, Raghav AK, Singh R, Chandra A. Carbon dioxide and methane emission from power generationin India. In: Proceedings, �RIO 3 International Congress�, Rio De Janeiro, Brazil, 1–5 December 2003; p. 243–50.
[27] Energy facts sheet: Greenhouse Gases [online]: Available from: http://www.iclei.org/efacts/greengas.htm.[28] Brown S, Masera O, Sathaye J. Project-based activities. In: Watson R, Noble I, Bolin B, Ravindranath N, Verado
D, Dokken D, editors. Land Use, Land Use Change, and Forestry, A Special Report of the IntergovernmentalPanel on Climate Change. Cambridge University Press; 2000. p. 377.
[29] Sathaye JA, Makundi WR, Andrasko K, Boer R, Ravindranath NH, Sudha P, et al. Carbon mitigation potentialand cost of forestry options in Brazil, China, India, Indonesia, Mexico, The Philippines and Tanzania. MitigatAdapt Strat Global Change 2001;6:185–211.
[30] International Energy Agency. Greenhouse Gas R&D Program. Carbon dioxide capture from power plant station,UK, 1995.