Approaches to the Mechanical Properties of Threaded Studs ...
Upload
khangminh22Category
view
1download
0
U.S. International Trade CommissionPublication 4885 April 2019
Washington, DC 20436
Carbon and Alloy Steel Threaded Rod from China, India, Taiwan, and ThailandInvestigation Nos. 701-TA-618-619 and 731-TA-1441-1444 (Preliminary)

U.S. International Trade Commission
COMMISSIONERS
David S. Johanson, Chairman Irving A. Williamson
Meredith M. Broadbent Rhonda K. Schmidtlein
Jason E. Kearns
Catherine DeFilippo
Staff assigned
Address all communications to Secretary to the Commission
United States International Trade Commission Washington, DC 20436
Director of Operations
Keysha Martinez, Investigator Daniel Matthews, Industry Analyst
James Horne, Economist David Boyland, Accountant
Aaron Woodward, Statistician Patrick Gallagher, Attorney
Douglas Corkran, Supervisory Investigator
Special assistance fromAlison Luckett, Investigations Intern

U.S. International Trade CommissionWashington, DC 20436
www.usitc.gov
Publication 4885 April 2019
Carbon and Alloy Steel Threaded Rod from China, India, Taiwan, and ThailandInvestigation Nos. 701-TA-618-619 and 731-TA-1441-1444 (Preliminary)


CONTENTS Page
i
Determinations ............................................................................................................................... 1 Views of the Commission ............................................................................................................... 3
Part I: Introduction ................................................................................................................ I‐1
Background ................................................................................................................................ I‐1
Statutory criteria and organization of the report ..................................................................... I‐1
Statutory criteria ................................................................................................................... I‐1
Organization of report ........................................................................................................... I‐3
Market summary ....................................................................................................................... I‐3
Summary data and data sources ............................................................................................... I‐3
Previous and related investigations .......................................................................................... I‐4
Nature and extent of alleged subsidies and sales at LTFV ........................................................ I‐6
Alleged subsidies ................................................................................................................... I‐6
Alleged sales at LTFV ............................................................................................................. I‐8
The subject merchandise .......................................................................................................... I‐9
Commerce’s scope ................................................................................................................ I‐9
Tariff treatment ................................................................................................................... I‐10
The product ............................................................................................................................. I‐11
Description and applications ............................................................................................... I‐11
Manufacturing processes .................................................................................................... I‐12
Domestic like product issues ................................................................................................... I‐14
Part II: Supply and demand information .................................................................................. 1
U.S. market characteristics .......................................................................................................... 1
Channels of distribution .............................................................................................................. 1
Geographic distribution .............................................................................................................. 2
Supply and demand considerations ............................................................................................ 3
U.S. supply ............................................................................................................................... 3
U.S. demand ............................................................................................................................ 6
Substitutability issues .................................................................................................................. 9
Lead times ............................................................................................................................. 10
Factors affecting purchasing decisions.................................................................................. 10
Comparison of U.S.‐produced and imported threaded rod .................................................. 10

CONTENTS Page
ii
Part III: U.S. producers’ production, shipments, and employment ....................................... III‐1
U.S. producers ......................................................................................................................... III‐1
U.S. production, capacity, and capacity utilization ................................................................. III‐2
Constraints on capacity ....................................................................................................... III‐4
Alternative products ............................................................................................................ III‐4
U.S. producers’ U.S. shipments and exports ........................................................................... III‐5
U.S. producers’ inventories ..................................................................................................... III‐6
U.S. producers’ imports and purchases .................................................................................. III‐7
U.S. employment, wages, and productivity ............................................................................ III‐7
Part IV: U.S. imports, apparent U.S. consumption, and market shares ................................ IV‐1
U.S. importers.......................................................................................................................... IV‐1
U.S. imports ............................................................................................................................. IV‐3
Negligibility .............................................................................................................................. IV‐6
Cumulation considerations ..................................................................................................... IV‐8
Fungibility ............................................................................................................................ IV‐8
Geographical markets ......................................................................................................... IV‐9
Presence in the market ..................................................................................................... IV‐10
Apparent U.S. consumption .................................................................................................. IV‐13
U.S. market shares ................................................................................................................ IV‐14
Part V: Pricing data ............................................................................................................... V‐1
Factors affecting prices ............................................................................................................ V‐1
Raw material costs ............................................................................................................... V‐1
Pricing practices ....................................................................................................................... V‐2
Pricing methods .................................................................................................................... V‐2
Sales terms and discounts .................................................................................................... V‐3
Price leadership .................................................................................................................... V‐3
Price data .................................................................................................................................. V‐3
Price trends ........................................................................................................................... V‐6
Price comparisons ................................................................................................................ V‐7
Lost sales and lost revenue ...................................................................................................... V‐8

CONTENTS Page
iii
Part VI: Financial experience of U.S. producers .................................................................... VI‐1
Background .............................................................................................................................. VI‐1
Operations on Threaded Steel Rod ......................................................................................... VI‐1
Revenue ............................................................................................................................... VI‐4
Cost of goods sold and gross profit or loss .......................................................................... VI‐5
SG&A expenses and operating income or loss .................................................................... VI‐6
Interest expense, other expenses, and net income or loss ................................................ VI‐7
Capital expenditures and research and development expenses ............................................ VI‐7
Assets and return on assets .................................................................................................... VI‐8
Capital and investment ........................................................................................................... VI‐8
Part VII: Threat considerations and information on nonsubject countries .......................... VII‐1
The industry in China .............................................................................................................. VII‐3
Exports ................................................................................................................................ VII‐4
The industry in India ............................................................................................................... VII‐6
Changes in operations ........................................................................................................ VII‐8
Operations on threaded rod ............................................................................................... VII‐8
Alternative products ........................................................................................................... VII‐8
Exports ................................................................................................................................ VII‐9
The industry in Taiwan ......................................................................................................... VII‐11
Changes in operations ...................................................................................................... VII‐12
Operations on threaded rod ............................................................................................. VII‐13
Alternative products ......................................................................................................... VII‐13
Exports .............................................................................................................................. VII‐13
The industry in Thailand ....................................................................................................... VII‐16
Exports .............................................................................................................................. VII‐16
Subject countries combined ................................................................................................. VII‐18
U.S. inventories of imported merchandise .......................................................................... VII‐18
U.S. importers’ outstanding orders ...................................................................................... VII‐20
Antidumping or countervailing duty orders in third‐country markets ................................ VII‐20
Information on nonsubject countries .................................................................................. VII‐20

CONTENTS Page
iv
Appendixes
A. Federal Register notices .................................................................................................. A‐1
B. List of staff conference witnesses ................................................................................... B‐1
C. Summary data ................................................................................................................. C‐1
Note.—Information that would reveal confidential operations of individual concerns may not be published. Such information is identified (including by brackets or by parallel lines) in confidential reports and is deleted and replaced with asterisks in public reports.

UNITED STATES INTERNATIONAL TRADE COMMISSION
Investigation Nos. 701‐TA‐618‐619 and 731‐TA‐1441‐1444 (Preliminary)
Carbon and Alloy Steel Threaded Rod from China, India, Taiwan, and Thailand
DETERMINATIONS
On the basis of the record1 developed in the subject investigations, the United States International Trade Commission (“Commission”) determines, pursuant to the Tariff Act of 1930 (“the Act”), that there is a reasonable indication that an industry in the United States is materially injured by reason of imports of carbon and alloy steel threaded rod from China, India, Taiwan, and Thailand, provided for in subheading 7318.15.50 of the Harmonized Tariff Schedule of the United States, that are alleged to be sold in the United States at less than fair value (“LTFV”) and to be subsidized by the governments of China and India.2
COMMENCEMENT OF FINAL PHASE INVESTIGATIONS
Pursuant to section 207.18 of the Commission’s rules, the Commission also gives notice of the commencement of the final phase of its investigations. The Commission will issue a final phase notice of scheduling, which will be published in the Federal Register as provided in section 207.21 of the Commission’s rules, upon notice from the U.S. Department of Commerce (“Commerce”) of affirmative preliminary determinations in the investigations under sections 703(b) or 733(b) of the Act, or, if the preliminary determinations are negative, upon notice of affirmative final determinations in those investigations under sections 705(a) or 735(a) of the Act. Parties that filed entries of appearance in the preliminary phase of the investigations need not enter a separate appearance for the final phase of the investigations. Industrial users, and, if the merchandise under investigation is sold at the retail level, representative consumer organizations have the right to appear as parties in Commission antidumping and countervailing duty investigations. The Secretary will prepare a public service list containing the names and addresses of all persons, or their representatives, who are parties to the investigations. BACKGROUND
On February 21, 2019, Vulcan Threaded Products Inc., Pelham, Alabama, filed petitions with the Commission and Commerce, alleging that an industry in the United States is materially injured or threatened with material injury by reason of subsidized imports of carbon and alloy steel threaded rod from China and India and LTFV imports of carbon and alloy steel threaded rod from China, India, Taiwan, and Thailand. Accordingly, effective February 21, 2019, the Commission, pursuant to sections 703(a) and 733(a) of the Act (19 U.S.C. 1671b(a) and
1 The record is defined in sec. 207.2(f) of the Commission’s Rules of Practice and Procedure (19 CFR 207.2(f)).
2 84 FR 10034 and 84 FR 10040 (March 19, 2019).

1673b(a)), instituted countervailing duty investigation Nos. 701‐TA‐618‐619 and antidumping duty investigation Nos. 731‐TA‐1441‐1444 (Preliminary).
Notice of the institution of the Commission’s investigations and of a public conference to be held in connection therewith was given by posting copies of the notice in the Office of the Secretary, U.S. International Trade Commission, Washington, DC, and by publishing the notice in the Federal Register of February 28, 2019 (84 FR 6817). The conference was held in Washington, DC, on March 14, 2019, and all persons who requested the opportunity were permitted to appear in person or by counsel.

3
Views of the Commission
Based on the record in the preliminary phase of these investigations, we determine that there is a reasonable indication that an industry in the United States is materially injured by reason of imports of carbon and alloy steel threaded rod (“threaded rod”) from China, India, Taiwan, and Thailand that are allegedly sold in the United States at less than fair value and are allegedly subsidized by the governments of China and India.
I. The Legal Standard for Preliminary Determinations
The legal standard for preliminary antidumping and countervailing duty determinations requires the Commission to determine, based upon the information available at the time of the preliminary determinations, whether there is a reasonable indication that a domestic industry is materially injured or threatened with material injury, or that the establishment of an industry is materially retarded, by reason of the allegedly unfairly traded imports.1 In applying this standard, the Commission weighs the evidence before it and determines whether “(1) the record as a whole contains clear and convincing evidence that there is no material injury or threat of such injury; and (2) no likelihood exists that contrary evidence will arise in a final investigation.”2
II. Background
Parties to the Investigations. Vulcan Threaded Products, Inc. (“Vulcan” or “Petitioner”), a U.S. producer of threaded rod, is the petitioner in these investigations. Vulcan appeared at the conference accompanied by counsel and submitted a postconference brief. A representative of Bay Standard Manufacturing, Inc. (“Bay Standard”), a domestic producer of threaded rod, appeared at the conference in support of the petition, but did not file a postconference brief. Representatives from the government of Taiwan appeared at the conference and filed a postconference brief. A representative of Ying Ming Industry Co., Ltd. (“Ying Ming”), a producer in Taiwan, appeared at the conference, but did not file a postconference brief. No other parties appeared at the conference or filed briefs.
Data Coverage. U.S. industry data are based on the questionnaire responses of seven producers, believed to account for the vast majority of U.S. production of threaded rod.3 U.S. import data are based on data submitted in response to the Commission’s importer
1 19 U.S.C. §§ 1671b(a), 1673b(a) (2000); see also American Lamb Co. v. United States, 785 F.2d
994, 1001‐04 (Fed. Cir. 1986); Aristech Chem. Corp. v. United States, 20 CIT 353, 354‐55 (1996). No party argues that the establishment of an industry in the United States is materially retarded by the allegedly unfairly traded imports.
2 American Lamb Co., 785 F.2d at 1001; see also Texas Crushed Stone Co. v. United States, 35 F.3d 1535, 1543 (Fed. Cir. 1994).
3 Confidential Report (“CR”) at III‐1 and Public Report (“PR”) at III‐1.

4
questionnaires and official Commerce statistics.4 The Commission received useable responses to its questionnaires from foreign producers of subject merchandise in India and Taiwan: four producers/exporters in India, accounting for approximately *** percent of U.S. imports of subject merchandise from India in 2018;5 and three producers/exporters in Taiwan, accounting for approximately *** percent of U.S. imports of subject merchandise from Taiwan in 2018.6 While the Commission issued foreign producer/exporter questionnaires to 210 firms and five firms believed to have produced or exported threaded rod from China and Thailand, respectively, during the period of investigation (“POI”), the Commission did not receive a response from any producer or exporter in China or Thailand.7
III. Domestic Like Product
A. In General
In determining whether there is a reasonable indication that an industry in the United States is materially injured or threatened with material injury by reason of imports of the subject merchandise, the Commission first defines the “domestic like product” and the “industry.”8 Section 771(4)(A) of the Tariff Act of 1930, as amended (“the Tariff Act”), defines the relevant domestic industry as the “producers as a whole of a domestic like product, or those producers whose collective output of a domestic like product constitutes a major proportion of the total domestic production of the product.”9 In turn, the Tariff Act defines “domestic like product” as “a product which is like, or in the absence of like, most similar in characteristics and uses with, the article subject to an investigation.”10
The decision regarding the appropriate domestic like product(s) in an investigation is a factual determination, and the Commission has applied the statutory standard of “like” or “most similar in characteristics and uses” on a case‐by‐case basis.11 No single factor is
4 CR/PR at IV‐1 and Table IV‐2. The Commission received questionnaire responses from 47
importers, representing *** percent of imports from China, *** percent from India, *** percent from Taiwan, and *** percent from Thailand in 2018. CR/PR at IV‐1.
5 CR at VII‐7, PR at VII‐6. 6 CR at VII‐15, PR at VII‐11. 7 CR at VII‐3 (China) and VII‐23 (Thailand), PR at VII‐3 and VII‐15. 8 19 U.S.C. § 1677(4)(A). 9 19 U.S.C. § 1677(4)(A). 10 19 U.S.C. § 1677(10). 11 See, e.g., Cleo Inc. v. United States, 501 F.3d 1291, 1299 (Fed. Cir. 2007); NEC Corp. v.
Department of Commerce, 36 F. Supp. 2d 380, 383 (Ct. Int’l Trade 1998); Nippon Steel Corp. v. United States, 19 CIT 450, 455 (1995); Torrington Co. v. United States, 747 F. Supp. 744, 749 n.3 (Ct. Int’l Trade 1990), aff’d, 938 F.2d 1278 (Fed. Cir. 1991) (“every like product determination ‘must be made on the particular record at issue’ and the ‘unique facts of each case’”). The Commission generally considers a number of factors including the following: (1) physical characteristics and uses; (2) interchangeability; (3) channels of distribution; (4) customer and producer perceptions of the products; (5) common manufacturing facilities, production processes, and production employees; and, where appropriate, (6) (Continued…)

5
dispositive, and the Commission may consider other factors it deems relevant based on the facts of a particular investigation.12 The Commission looks for clear dividing lines among possible like products and disregards minor variations.13 Although the Commission must accept Commerce’s determination as to the scope of the imported merchandise that is subsidized and/or sold at less than fair value,14 the Commission determines what domestic product is like the imported articles Commerce has identified.15
B. Product Description
In its notices of initiation, Commerce defined the imported merchandise within the scope of these investigations as:
. . . carbon and alloy steel threaded rod. Steel threaded rod is certain threaded rod, bar, or studs, of carbon or alloy steel, having a solid, circular cross section of any diameter, in any straight length. Steel threaded rod is normally drawn, cold‐rolled, threaded, and straightened, or it may be hot‐rolled. In addition, the steel threaded rod, bar, or studs subject to these investigations are non‐headed and threaded along greater than 25 percent of their total actual length. A variety of finishes or coatings, such as plain oil finish as a temporary rust protectant, zinc coating (i.e., galvanized, whether by electroplating or hot‐dipping), paint, and other similar finishes and coatings, may be applied to the merchandise.
Steel threaded rod is normally produced to American Society for Testing and Materials (ASTM) specifications ASTM A36, ASTM A193 B7/B7m, ASTM A193 B16, ASTM A307, ASTM A329 L7/L7M, ASTM A320 L43, ASTM A354 BC
(…Continued) price. See Nippon, 19 CIT at 455 n.4; Timken Co. v. United States, 913 F. Supp. 580, 584 (Ct. Int’l Trade 1996).
12 See, e.g., S. Rep. No. 96‐249 at 90‐91 (1979). 13 See, e.g., Nippon, 19 CIT at 455; Torrington, 747 F. Supp. at 748‐49; see also S. Rep. No. 96‐249
at 90‐91 (Congress has indicated that the like product standard should not be interpreted in “such a narrow fashion as to permit minor differences in physical characteristics or uses to lead to the conclusion that the product and article are not ‘like’ each other, nor should the definition of ‘like product’ be interpreted in such a fashion as to prevent consideration of an industry adversely affected by the imports under consideration.”).
14 See, e.g., USEC, Inc. v. United States, 34 Fed. App’x 725, 730 (Fed. Cir. 2002) (“The ITC may not modify the class or kind of imported merchandise examined by Commerce.”); Algoma Steel Corp. v. United States, 688 F. Supp. 639, 644 (Ct. Int’l Trade 1988), aff’d, 865 F.3d 240 (Fed. Cir.), cert. denied, 492 U.S. 919 (1989).
15 Hosiden Corp. v. Advanced Display Mfrs., 85 F.3d 1561, 1568 (Fed. Cir. 1996) (the Commission may find a single like product corresponding to several different classes or kinds defined by Commerce); Cleo, 501 F.3d at 1298 n.1 (“Commerce’s {scope} finding does not control the Commission’s {like product} determination.”); Torrington, 747 F. Supp. at 748‐52 (affirming the Commission’s determination defining six like products in investigations where Commerce found five classes or kinds).

6
and BD, ASTM A449, ASTM F1554–36, ASTM F1554–55, ASTM F1554 Grade 105, American Society of Mechanical Engineers (ASME) specification ASME B18.31.3, and American Petroleum Institute (API) specification API 20E. All steel threaded rod meeting the physical description set forth above is covered by the scope of these investigations, whether or not produced according to a particular standard.
Subject merchandise includes material matching the above description that has been finished, assembled, or packaged in a third country, including by cutting, chamfering, coating, or painting the threaded rod, by attaching the threaded rod to, or packaging it with, another product, or any other finishing, assembly, or packaging operation that would not otherwise remove the merchandise from the scope of the investigations if performed in the country of manufacture of the threaded rod.
Carbon and alloy steel threaded rod are also included in the scope of these investigations whether or not imported attached to, or in conjunction with, other parts and accessories such as nuts and washers. If carbon and alloy steel threaded rod are imported attached to, or in conjunction with, such non‐subject merchandise, only the threaded rod is included in the scope.
Excluded from the scope of these investigations are: (1) Threaded rod, bar, or studs which are threaded only on one or both ends and the threading covers 25 percent or less of the total actual length; and (2) stainless steel threaded rod, defined as steel threaded rod containing, by weight, 1.2 percent or less of carbon and 10.5 percent or more of chromium, with our without other elements.
Excluded from the scope of the antidumping investigation on steel threaded rod from the People’s Republic of China is any merchandise covered by the existing antidumping order on Certain Steel Threaded Rod from the People’s Republic of China. See Certain Steel Threaded Rod from the People’s Republic of China: Notice of Antidumping Duty Order, 74 FR 17154 (April 14, 2009).
Steel threaded rod is currently classifiable under subheadings 7318.15.5051, 7318.15.5056, and 7318.15.5090 of the Harmonized Tariff Schedule of the United States (HTSUS). Subject merchandise may also enter under subheading 7318.15.2095 and 7318.19.0000 of the HTSUS. The HTSUS subheadings are provided for convenience and U.S. Customs purposes only. The written description of the scope is dispositive.16
16 Carbon and Alloy Steel Threaded Rod From India, Taiwan, Thailand, and the People’s Republic
of China: Initiation of Less‐Than‐Fair‐Value Investigations, 84 Fed. Reg. 10034, 10039‐40 (March 19, 2019) (“Commerce AD Initiation”) and Carbon and Alloy Steel Threaded Rod From India and the People’s Republic of China: Initiation of Countervailing Duty Investigations, 84 Fed. Reg. 10040, 10043‐44 (March 19, 2019) (“Commerce CVD Initiation”).

7
Threaded rod is produced from carbon and alloy steel wire rod (in the form of coils), or from steel bar for applications that require a larger diameter.17 Certain threaded rod can be heat‐treated either before or after it is threaded. Depending on the intended end use of the final product, threaded rod can also be coated with a plain oil finish during the threading process, or it is galvanized using either a zinc plating or a hot‐dip galvanizing process, or it is coated with other finishes such as paint or epoxy coatings, all of which are processes that impart corrosion resistance.18 Threaded rod is normally produced to be compliant with particular specifications published by the American Society for Testing and Materials (“ASTM”), the Society of Mechanical Engineers ("ASME"), and the American Petroleum Institute ("API").19
C. Arguments of the Parties20
Petitioner argues that the Commission should find a single domestic like product, coextensive with the scope of Commerce’s investigations.21 It claims that there are no clear dividing lines between carbon and alloy threaded rod. Petitioner asserts that all threaded rod is made by the same producers using the same processes, is sold through the same channels of distribution to the same end users, and serves the same functions.22
1. Analysis
We address whether, for purposes of these preliminary determinations, all threaded rod within the scope of these investigations should be defined as a single domestic like product.
Physical Characteristics and Uses. Threaded rod is generally threaded along its entire length and is produced from low‐ and medium‐carbon or alloy steel wire rod and bar. Threaded rod is primarily used in commercial (non‐residential) construction to suspend electrical conduits; pipes for plumbing; heating, ventilation, and air‐conditioning (“HVAC”)
17 Domestic producers manufacture threaded rod to a variety of diameters and use both steel
wire rod and bar as major inputs. Conference Transcript at 68 (Logan) and 69 (Gross). 18 CR at I‐15 to I‐16, PR at I‐11 to I‐12. Petitioner indicated that the vast majority of domestically
produced threaded rod is zinc electroplated, while hot‐dipped galvanized accounts for a smaller share of domestic production (approximately seven to ten percent for Vulcan). Conference Transcript at 39 (Jenkins).
19 CR at I‐15 and nn.34‐38, PR at I‐11 and nn.34‐38. 20 The Taiwan government argues that producers in Taiwan should be excluded from the scope
of the order because the products exported to the United States by producers in Taiwan differ from U.S. products in terms of production processes, physical characteristics and uses, and interchangeability. It claims that the producers in Taiwan manufacture threaded rod with the higher elasticity required for products used in special applications, such as in automobile engines, and thus are not interchangeable with the threaded rod covered by the scope of the investigation. See Taiwan Government Postconference Brief at 3‐4. Although fashioned as a like product argument, the Taiwan government appears to be requesting a scope exclusion that is properly addressed to Commerce. See Petitioner Postconference Brief at 23 n.97 and CR at I‐18, PR at I‐14.
21 Petitioner Postconference Brief at 6. 22 Petitioner Postconference Brief at 3‐6.

8
ductwork; and sprinkler systems for fire protection, among other applications. Normally, one end of the threaded rod is fastened to the ceiling and the other end is fastened to a support for suspending the conduits, pipes, ductwork, or sprinkler system. Threaded rod is also used for hanging suspended ceilings and elevated conveyor belts, and for joint restraint systems for underground piping. It is used in structural tie downs in earthquake‐ and hurricane‐restraint systems for roofing. Threaded rod can also be used as a headless screw in general fastener applications or for bolting together pipe joints.23 While alloy steel threaded rod is made from rod or bar that has more alloying elements than carbon steel threaded rod, there are also varying levels of alloying elements contained within certain types of carbon and alloy rod. In addition, while alloy steel threaded rod is generally stronger than carbon steel threaded rod, there also are high strength carbon steel threaded rod products, such as medium carbon steel threaded rod made to ASTM specification A449.24
Common Manufacturing Facilities, Production Processes, and Employees. All threaded rod is produced by drawing wire or rod, straightening it, cutting to length, and threading it;25 it may also be galvanized, painted, or coated. While alloy steel threaded rod is also heat treated, there are types of carbon steel threaded rod that are heat treated. Petitioner Vulcan testified that domestic producers manufacture both carbon and alloy threaded rod in the same facilities, using the same or similar equipment, and the same production process.26
Channels of Distribution. Threaded rod is sold almost exclusively to distributors. A small proportion of threaded rod is sold to end users.27 Interchangeability. Although there are some applications that require alloy threaded rod, alloy threaded rod may be used interchangeably with carbon threaded rod in many other applications.28 The interchangeability between threaded rod and other types of rod is limited due to the standard industry specifications, such as ASTM, ASME, or API specifications, that are required for a particular application.
Producer and Customer Perceptions. The record indicates that domestic producer Vulcan, other producers, and distributors perceive carbon and alloy threaded rod to be part of a single product category comprised of all steel threaded rod.29
Price. Threaded rod is available in a range of prices depending on size and other factors. Although alloy threaded rod is generally higher priced than carbon steel threaded rod, there are a wide array of prices based on length, diameter, thread pitch, coating, and other factors.30
23 CR at I‐13, PR at I‐10. 24 See Petitioner Postconference Brief at 4‐5. 25 Conference Transcript at 16 (Black). 26 Conference Transcript at 18‐19 (Black) and Petition at Exhibit I‐12. Petitioner also noted that,
in the investigation on carbon threaded rod from China, the Commission found that all but one of the responding domestic producers made products other than carbon threaded rod, including alloy threaded rod, on the same equipment and machinery and using the same workers used to produce carbon threaded rod. Petitioner Postconference Brief at 5 citing Certain Steel Threaded Rod from China, Inv. No 731‐TA‐1145 (Final), USITC Pub. 4070 (April 2009), at I‐7.
27 CR/PR at Table II‐1. 28 Conference Transcript at 15 (Black); see also Petitioner Postconference Brief at 4. 29 See Petition at Exhibits I‐9 and I‐11.
9
Conclusion. The available information on the record addressing the six factors supports defining a single domestic like product and no party has argued to the contrary. Based on the record in the preliminary phase of these investigations, we define a single domestic like product consisting of threaded rod coextensive with the scope of the investigations.
IV. Domestic Industry
The domestic industry is defined as the domestic “producers as a whole of a domestic like product, or those producers whose collective output of a domestic like product constitutes a major proportion of the total domestic production of the product.”31 In defining the domestic industry, the Commission’s general practice has been to include in the industry producers of all domestic production of the like product, whether toll‐produced, captively consumed, or sold in the domestic merchant market.
We must determine whether any producer of the domestic like product should be excluded from the domestic industry pursuant to Section 771(4)(B) of the Tariff Act. This provision allows the Commission, if appropriate circumstances exist, to exclude from the domestic industry producers that are related to an exporter or importer of subject merchandise or which are themselves importers.32 Exclusion of such a producer is within the Commission’s discretion based upon the facts presented in each investigation.33
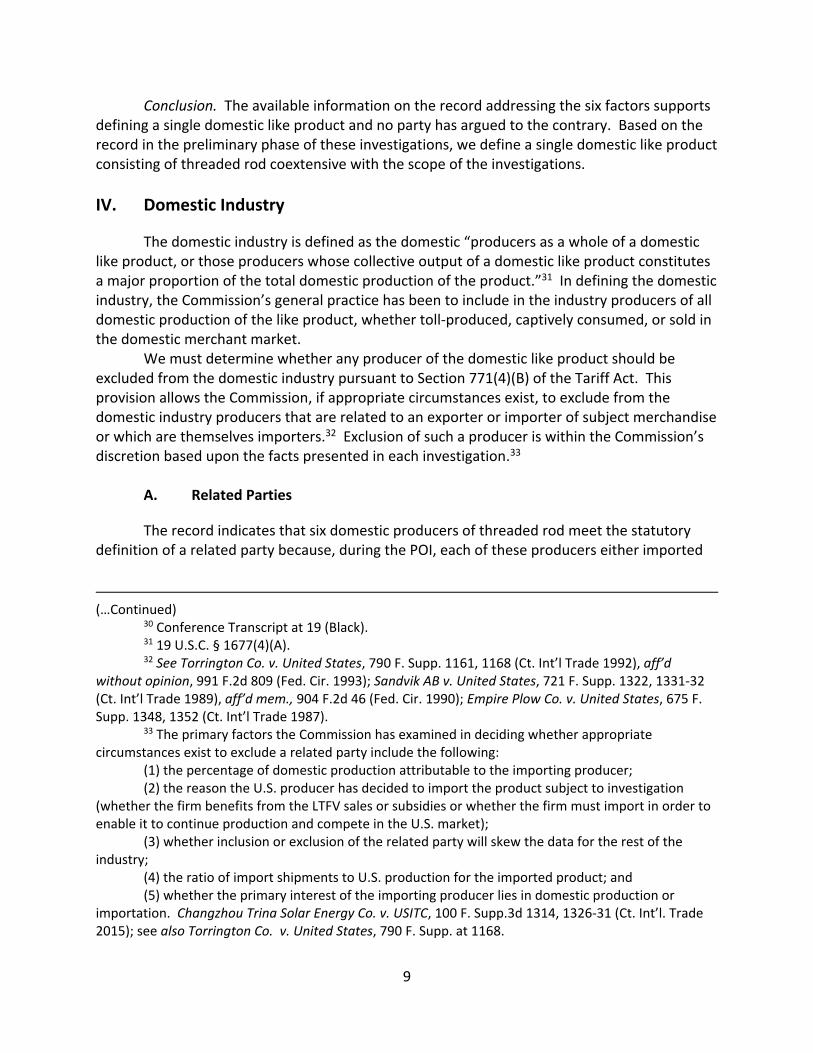
A. Related Parties
The record indicates that six domestic producers of threaded rod meet the statutory definition of a related party because, during the POI, each of these producers either imported
(…Continued)
30 Conference Transcript at 19 (Black). 31 19 U.S.C. § 1677(4)(A). 32 See Torrington Co. v. United States, 790 F. Supp. 1161, 1168 (Ct. Int’l Trade 1992), aff’d
without opinion, 991 F.2d 809 (Fed. Cir. 1993); Sandvik AB v. United States, 721 F. Supp. 1322, 1331‐32 (Ct. Int’l Trade 1989), aff’d mem., 904 F.2d 46 (Fed. Cir. 1990); Empire Plow Co. v. United States, 675 F. Supp. 1348, 1352 (Ct. Int’l Trade 1987).
33 The primary factors the Commission has examined in deciding whether appropriate circumstances exist to exclude a related party include the following:
(1) the percentage of domestic production attributable to the importing producer; (2) the reason the U.S. producer has decided to import the product subject to investigation
(whether the firm benefits from the LTFV sales or subsidies or whether the firm must import in order to enable it to continue production and compete in the U.S. market);
(3) whether inclusion or exclusion of the related party will skew the data for the rest of the industry;
(4) the ratio of import shipments to U.S. production for the imported product; and (5) whether the primary interest of the importing producer lies in domestic production or
importation. Changzhou Trina Solar Energy Co. v. USITC, 100 F. Supp.3d 1314, 1326‐31 (Ct. Int’l. Trade 2015); see also Torrington Co. v. United States, 790 F. Supp. at 1168.

10
subject threaded rod directly or had a subsidiary that imported the subject merchandise.34 Two domestic producers, ***, are affiliated with firms that imported subject merchandise from China during the POI.35 Four producers directly imported subject merchandise from a subject country: ***.36 Petitioner argues that the Commission should exclude domestic producer *** from the definition of the domestic industry for purposes of the preliminary determinations because it alleges that *** principal interest appears to lie in importation rather than domestic production.37
***. *** is a related party because its *** imported subject merchandise from China.38 *** accounted for *** percent of U.S. production in 2018.39 The ratio of its affiliate’s subject imports from *** to *** domestic production was *** percent in 2016, *** percent in 2017, and *** percent in 2018.40 During the POI, *** stated that its affiliate ***.41 *** the petition.42 Its operating income ratio was *** than the average for the rest of the domestic industry throughout the POI.43 On balance, given that the record indicates that the firm’s principal interest appeared to be in domestic production, we find that appropriate circumstances do not exist to exclude *** from the domestic industry as a related party.
***. *** is a small U.S. producer, accounting for only *** percent of U.S. production in 2018.44 *** is a ***.45 *** imports of subject merchandise exceeded *** domestic production during most of the POI. The ratio of the parent company’s subject imports from *** to *** domestic production was *** percent in 2016, *** percent in 2017, and *** percent in 2018.46 *** U.S. production also increased during the POI, from *** pounds in 2016 to *** pounds in 2018.47 During the POI, *** stated that its ***.48 *** the petition.49 Its operating income ratio was *** than the average for the rest of the domestic industry throughout the POI.50 While the record appears to indicate that the *** of the domestic industry, and the fact that ***. Thus, *** from the domestic industry as a related party.
34 CR/PR at Tables III‐2 and IV‐1. 35 CR/PR at Tables III‐2 and IV‐1. 36 CR/PR at Table IV‐1. No domestic producer imported subject merchandise from Taiwan or
Thailand either directly or through an affiliate during the POI. Id. 37 Petitioner Postconference Brief at 7‐8. 38 CR/PR at Table III‐2. 39 CR/PR at Table III‐1. 40 CR/PR at Table III‐8. 41 CR/PR at Table III‐8. 42 CR/PR at Table III‐1. 43 CR/PR at Table VI‐3. 44 CR/PR at Table III‐1. 45 CR/PR at Table III‐2. 46 CR/PR at Table III‐8. 47 CR/PR at Table III‐8. 48 CR/PR at Table III‐8. 49 CR/PR at Table III‐1. 50 CR/PR at Table VI‐3.

11
The four remaining producers (***) are related parties because each firm directly imported threaded rod from a subject country during the POI.51
***. *** accounted for *** percent of U.S. production in 2018.52 *** ratio of its subject imports to domestic production was relative steady at *** percent in 2016, *** percent in 2017, and *** percent in 2018.53 During the POI, *** stated that it ***.54 *** the petition.55 Its operating income ratio was *** than the average for the rest of the domestic industry throughout the POI.56 On balance, given that the record indicates that the firm’s principal interest appears to be in domestic production, we find that appropriate circumstances do not exist to exclude *** from the domestic industry as a related party.
***. *** accounted for *** percent of U.S. production in 2018.57 *** ratio of subject imports to domestic production declined over the POI, initially increasing from *** percent in 2016 to *** percent in 2017, and then declining to *** percent in 2018.58 During the POI, *** stated that it ***.59 *** the petition.60 Its operating income ratio was *** than the average for the rest of the domestic industry throughout the POI.61 On balance, given that the record indicates that the firm’s principal interest appears to be in domestic production, we find that appropriate circumstances do not exist to exclude *** from the domestic industry as a related party.
***. *** accounted for *** percent of U.S. production in 2018.62 *** ratio of subject imports to domestic production was *** percent in 2016, *** percent in 2017, and *** percent in 2018.63 During the POI, *** stated that it imported subject threaded rod because ***.64 *** the petition.65 Its operating income ratio was *** than the average for the rest of the domestic
51 CR/PR at Table III‐2. *** imported subject merchandise from ***. *** also imported subject
merchandise from India. CR/PR at Tables III‐8 and IV‐1. Although *** was provided. See CR/PR III‐1 and VI‐1 n.2. We note that the ratio of *** subject
imports to its domestic production was *** percent in 2016, *** percent in 2017, and *** percent in 2018. CR/PR at Table III‐8. Therefore, its principal interest appears to be in importation rather than in domestic production. Nevertheless, the exclusion of ***, which accounted for only *** percent of U.S. production in 2018, from the domestic industry would have no effect on the Commission’s analysis of material injury or threat of material injury to the domestic industry in these investigations. CR/PR at Table III‐1.
52 CR/PR at Table III‐1. 53 CR/PR at Table III‐8. 54 CR/PR at Table III‐8. 55 CR/PR at Table III‐1. 56 CR/PR at Table VI‐3. 57 CR/PR at Table III‐1. 58 CR/PR at Table III‐8. 59 CR/PR at Table III‐8. 60 CR/PR at Table III‐1. 61 CR/PR at Table VI‐3. 62 CR/PR at Table III‐1. 63 CR/PR at Table III‐8. 64 CR/PR at Table III‐8. 65 CR/PR at Table III‐1.

12
industry throughout the POI.66 On balance, given that the record indicates that the firm’s principal interest appears to be in domestic production, we find that appropriate circumstances do not exist to exclude *** from the domestic industry as a related party.
Accordingly, we define the domestic industry to consist of all U.S. producers of the domestic like product.67
V. Negligible Imports
Pursuant to Section 771(24) of the Tariff Act, imports from a subject country of merchandise corresponding to a domestic like product that account for less than 3 percent of all such merchandise imported into the United States during the most recent 12 months for which data are available preceding the filing of the petition shall be deemed negligible.68
Subject imports from the subject countries are above the statutory negligibility threshold. Specifically, from February 2018 to January 2019, the 12 month period preceding the filing of the petition for which data are available, subject imports from China accounted for 46.4 percent of total imports of threaded rod in the antidumping duty investigations, subject imports from India accounted for 32.4 percent, subject imports from Taiwan accounted for 11.5 percent, and subject imports from Thailand accounted for 5.3 percent.69 With respect to the countervailing duty investigations, subject imports from China accounted for 47.4 percent of total imports and subject imports from India accounted for 31.8 percent of total imports during the negligibility period.70 Thus, subject imports from each subject country exceed the pertinent 3 percent statutory threshold. We consequently find that imports from each subject country are not negligible.
VI. Cumulation
For purposes of evaluating the volume and effects for a determination of reasonable indication of material injury by reason of subject imports, section 771(7)(G)(i) of the Tariff Act requires the Commission to cumulate subject imports from all countries as to which petitions were filed and/or investigations self‐initiated by Commerce on the same day, if such imports compete with each other and with the domestic like product in the U.S. market. In assessing whether subject imports compete with each other and with the domestic like product, the Commission generally has considered four factors:
66 CR/PR at Table VI‐3. 67 We intend to reexamine whether to exclude any domestic producers as related parties in any
final phase of these investigations. 68 19 U.S.C. §§ 1671b(a), 1673b(a), 1677(24)(A)(i), 1677(24)(B). 69 CR/PR at Table IV‐3. These data refer to the subject imports in the antidumping duty
investigations and thus exclude imports from China that are subject to an existing antidumping duty order on carbon threaded rod from China. See Certain Steel Threaded Rod from the People’s Republic of China: Notice of Antidumping Duty Order, 74 Fed. Reg. 17154 (April 14, 2009) and Certain Steel Threaded Rod from China, Inv. No 731‐TA‐1145 (Final), USITC Pub. 4070 (April 2009).
70 CR/PR at Table IV‐4.

13
(1) the degree of fungibility between subject imports from different countries and between subject imports and the domestic like product, including consideration of specific customer requirements and other quality related questions;
(2) the presence of sales or offers to sell in the same geographic markets of subject imports from different countries and the domestic like product;
(3) the existence of common or similar channels of distribution for subject imports from different countries and the domestic like product; and
(4) whether the subject imports are simultaneously present in the market.71
While no single factor is necessarily determinative, and the list of factors is not exclusive, these factors are intended to provide the Commission with a framework for determining whether the subject imports compete with each other and with the domestic like product.72 Only a “reasonable overlap” of competition is required.73
A. Arguments of the Parties
Petitioner’s Argument. Petitioner argues that the Commission should cumulatively assess imports from China, India, Taiwan, and Thailand.74 With respect to fungibility, Petitioner claims that there is a high degree of interchangeability between subject imports from each country and the domestic like product. It observes that the *** of responding domestic producers and importers agree that threaded rod from the United States and the subject countries is *** interchangeable.75 Petitioner claims that threaded rod from all subject countries and the domestic like product are present in the same channels of trade, principally to distributors and, ***.76 It argues that domestically produced threaded rod is present nationwide and that import statistics show threaded rod from each of the subject countries
71 See Certain Cast‐Iron Pipe Fittings from Brazil, the Republic of Korea, and Taiwan, Inv. Nos.
731‐TA‐278‐80 (Final), USITC Pub. 1845 (May 1986), aff’d, Fundicao Tupy, S.A. v. United States, 678 F. Supp. 898 (Ct. Int’l Trade), aff’d, 859 F.2d 915 (Fed. Cir. 1988).
72 See, e.g., Wieland Werke, AG v. United States, 718 F. Supp. 50 (Ct. Int’l Trade 1989). 73 The Statement of Administrative Action (SAA) to the Uruguay Round Agreements Act (URAA),
expressly states that “the new section will not affect current Commission practice under which the statutory requirement is satisfied if there is a reasonable overlap of competition.” H.R. Rep. No. 103‐316, Vol. I at 848 (1994) (citing Fundicao Tupy, 678 F. Supp. at 902); see Goss Graphic Sys., Inc. v. United States, 33 F. Supp. 2d 1082, 1087 (Ct. Int’l Trade 1998) (“cumulation does not require two products to be highly fungible”); Wieland Werke, AG, 718 F. Supp. at 52 (“Completely overlapping markets are not required.”).
74 Petitioner Postconference Brief at 9. 75 Petitioner Postconference Brief at 9‐10. 76 Petitioner Postconference Brief at 10.

14
entered ports in all regions of the country.77 Finally, Petitioner asserts that subject imports from all four subject countries have been present in every month of the POI.78
Taiwan Government’s Arguments. The Taiwan government argues that subject imports from Taiwan should not be cumulated with imports from other subject countries because Taiwanese products differ in terms of production processes, physical characteristics and uses, and interchangeability, and thus do not compete with U.S. products. It asserts that products from Taiwan are generally of a specific quality, and are often customized to meet customer specifications. According to this respondent, import trends from China and the other countries under investigation are very different. Specifically, it claims that the volume of U.S. imports from China increased by nearly 100 percent over the POI, from 64.3 million to 125.4 million pounds, while subject imports from Taiwan remained stable from 2016 to 2018, at approximately 41.5 million pounds per year. In light of these factors, the government of Taiwan urges the Commission to forego cumulation in this case and exclude imports from Taiwan from its cumulated injury analysis.79
B. Analysis
We consider subject imports from China, India, Taiwan, and Thailand on a cumulated basis because the statutory criteria for cumulation are satisfied. As an initial matter, Petitioner Vulcan filed the antidumping duty petitions on imports from China (alloy only), India, Taiwan, and Thailand and countervailing duty petitions with respect to imports from China and India on the same day, February 21, 2019.80
Fungibility. Threaded rod, regardless of source, is generally produced in accordance with industry standards set by the ASTM, ASME, or API.81 All responding domestic producers and the majority of importers reported that imports from the four subject countries are always or frequently interchangeable with each other and the domestic like product.82 Almost all of the remaining importers indicated that subject imports from the subject countries are sometimes used interchangeably with each other and with the domestic like product. 83
Moreover, when asked whether differences other than price are ever significant in choosing between threaded rod from different sources, a majority of domestic producers responded sometimes or never.84 Importers were more divided on this question, but a majority of importers also answered sometimes or never.85 Consequently, the record indicates that the
77 Petitioner Postconference Brief at 10‐11. 78 Petitioner Postconference Brief at 11 and Exhibit 10. 79 Taiwan Government Postconference Brief at 4. 80 None of the statutory exceptions to cumulation applies. 81 CR at I‐15 and nn.34‐38, PR at I‐11 and nn.34‐38 82 CR/PR at Table II‐6. 83 CR/PR at Table II‐6. 84 CR/PR at Table II‐7. One responding domestic producer responded “never” when asked
whether differences other than price are significant in choosing between domestically produced threaded rod and threaded rod from China. Id.
85 CR/PR at Table II‐7.

15
domestic like product and threaded rod from each subject source are fungible. We note, however, that the vast majority of subject imports from China are of alloy steel and are not galvanized, in contrast with threaded rod produced in the United States and subject imports from the remaining three subject countries.86
Channels of Distribution. Domestic producers sold threaded rod almost exclusively to distributors, while importers sold primarily or predominantly to distributors.87 In 2018, almost all of the domestic producers’ U.S. shipments of threaded rod, as well as *** subject imports from Thailand, were sold to distributors. A majority of shipments of imports from China (*** percent), India (*** percent), and Taiwan (*** percent) were also sold to distributors.88
Geographic Overlap. Domestically produced threaded rod and imports from each of the subject countries are sold throughout the contiguous United States.89
Simultaneous Presence in Market. Import data show that the domestic like product and subject imports from all subject countries have been present in each of the 36 months from January 2016 to December 2018.90
Conclusion. The record supports a finding that subject imports from each country are fungible with the domestic like product and each other, that subject imports from each subject country and the domestic like product are sold in the same channels of distribution and in the same geographic markets, and have been simultaneously present in the U.S. market.
Consequently, the record indicates that there is a reasonable overlap of competition between and among subject imports and the domestic like product. We accordingly analyze subject imports from China, India, Taiwan, and Thailand on a cumulated basis for our analysis of whether there is a reasonable indication of material injury by reason of subject imports.
VII. Reasonable Indication of Material Injury by Reason of Subject Imports
A. Legal Standard
In the preliminary phase of antidumping and countervailing duty investigations, the Commission determines whether there is a reasonable indication that an industry in the United States is materially injured or threatened with material injury by reason of the imports under investigation.91 In making this determination, the Commission must consider the volume of subject imports, their effect on prices for the domestic like product, and their impact on domestic producers of the domestic like product, but only in the context of U.S. production
86 CR/PR at Tables IV‐5 and IV‐6. 87 CR/PR at Table II‐1. 88 CR/PR at Table II‐1. In 2018, *** percent of domestic producers’ U.S. shipments were sold to
distributors. Id. 89 CR/PR at Tables II‐2 and IV‐7. Subject imports of threaded rod from China entered the United
States predominantly (81.6 percent) through the Southern border. Subject imports of threaded rod entering the United States from the other subject countries were more evenly distributed. CR/PR at Table IV‐7.
90 CR at IV‐16, PR at IV‐10, and CR/PR at Table IV‐8. 91 19 U.S.C. §§ 1671b(a), 1673b(a).

16
operations.92 The statute defines “material injury” as “harm which is not inconsequential, immaterial, or unimportant.”93 In assessing whether there is a reasonable indication that the domestic industry is materially injured by reason of subject imports, we consider all relevant economic factors that bear on the state of the industry in the United States.94 No single factor is dispositive, and all relevant factors are considered “within the context of the business cycle and conditions of competition that are distinctive to the affected industry.”95
Although the statute requires the Commission to determine whether there is a reasonable indication that the domestic industry is “materially injured by reason of” unfairly traded imports,96 it does not define the phrase “by reason of,” indicating that this aspect of the injury analysis is left to the Commission’s reasonable exercise of its discretion.97 In identifying a causal link, if any, between subject imports and material injury to the domestic industry, the Commission examines the facts of record that relate to the significance of the volume and price effects of the subject imports and any impact of those imports on the condition of the domestic industry. This evaluation under the “by reason of” standard must ensure that subject imports are more than a minimal or tangential cause of injury and that there is a sufficient causal, not merely a temporal, nexus between subject imports and material injury.98
In many investigations, there are other economic factors at work, some or all of which may also be having adverse effects on the domestic industry. Such economic factors might include nonsubject imports; changes in technology, demand, or consumer tastes; competition among domestic producers; or management decisions by domestic producers. The legislative history explains that the Commission must examine factors other than subject imports to ensure that it is not attributing injury from other factors to the subject imports, thereby inflating an otherwise tangential cause of injury into one that satisfies the statutory material
92 19 U.S.C. § 1677(7)(B). The Commission “may consider such other economic factors as are
relevant to the determination” but shall “identify each {such} factor ... {a}nd explain in full its relevance to the determination.” 19 U.S.C. § 1677(7)(B).
93 19 U.S.C. § 1677(7)(A). 94 19 U.S.C. § 1677(7)(C)(iii). 95 19 U.S.C. § 1677(7)(C)(iii). 96 19 U.S.C. §§ 1671b(a), 1673b(a). 97 Angus Chemical Co. v. United States, 140 F.3d 1478, 1484‐85 (Fed. Cir. 1998) (“{T}he statute
does not ‘compel the commissioners’ to employ {a particular methodology}.”), aff’g 944 F. Supp. 943, 951 (Ct. Int’l Trade 1996).
98 The Federal Circuit, in addressing the causation standard of the statute, has observed that “{a}s long as its effects are not merely incidental, tangential, or trivial, the foreign product sold at less than fair value meets the causation requirement.” Nippon Steel Corp. v. USITC, 345 F.3d 1379, 1384 (Fed. Cir. 2003). This was re‐affirmed in Mittal Steel Point Lisas Ltd. v. United States, 542 F.3d 867, 873 (Fed. Cir. 2008), in which the Federal Circuit, quoting Gerald Metals, Inc. v. United States, 132 F.3d 716, 722 (Fed. Cir. 1997), stated that “this court requires evidence in the record ‘to show that the harm occurred “by reason of” the LTFV imports, not by reason of a minimal or tangential contribution to material harm caused by LTFV goods.’” See also Nippon Steel Corp. v. United States, 458 F.3d 1345, 1357 (Fed. Cir. 2006); Taiwan Semiconductor Industry Ass’n v. USITC, 266 F.3d 1339, 1345 (Fed. Cir. 2001).

17
injury threshold.99 In performing its examination, however, the Commission need not isolate the injury caused by other factors from injury caused by unfairly traded imports.100 Nor does the “by reason of” standard require that unfairly traded imports be the “principal” cause of injury or contemplate that injury from unfairly traded imports be weighed against other factors, such as nonsubject imports, which may be contributing to overall injury to an industry.101 It is clear that the existence of injury caused by other factors does not compel a negative determination.102
Assessment of whether material injury to the domestic industry is “by reason of” subject imports “does not require the Commission to address the causation issue in any particular way” as long as “the injury to the domestic industry can reasonably be attributed to the subject imports” and the Commission “ensure{s} that it is not attributing injury from other sources to
99 SAA, H.R. Rep. 103‐316, Vol. I at 851‐52 (1994) (“{T}he Commission must examine other
factors to ensure that it is not attributing injury from other sources to the subject imports.”); S. Rep. 96‐249 at 75 (1979) (the Commission “will consider information which indicates that harm is caused by factors other than less‐than‐fair‐value imports.”); H.R. Rep. 96‐317 at 47 (1979) (“in examining the overall injury being experienced by a domestic industry, the ITC will take into account evidence presented to it which demonstrates that the harm attributed by the petitioner to the subsidized or dumped imports is attributable to such other factors;” those factors include “the volume and prices of nonsubsidized imports or imports sold at fair value, contraction in demand or changes in patterns of consumption, trade restrictive practices of and competition between the foreign and domestic producers, developments in technology and the export performance and productivity of the domestic industry”); accord Mittal Steel, 542 F.3d at 877.
100 SAA at 851‐52 (“{T}he Commission need not isolate the injury caused by other factors from injury caused by unfair imports.”); Taiwan Semiconductor Industry Ass’n , 266 F.3d at 1345. (“{T}he Commission need not isolate the injury caused by other factors from injury caused by unfair imports ... . Rather, the Commission must examine other factors to ensure that it is not attributing injury from other sources to the subject imports.” (emphasis in original)); Asociacion de Productores de Salmon y Trucha de Chile AG v. United States, 180 F. Supp. 2d 1360, 1375 (Ct. Int’l Trade 2002) (“{t}he Commission is not required to isolate the effects of subject imports from other factors contributing to injury” or make “bright‐line distinctions” between the effects of subject imports and other causes.); see also Softwood Lumber from Canada, Inv. Nos. 701‐TA‐414 and 731‐TA‐928 (Remand), USITC Pub. 3658 at 100‐01 (Dec. 2003) (Commission recognized that “{i}f an alleged other factor is found not to have or threaten to have injurious effects to the domestic industry, i.e., it is not an ‘other causal factor,’ then there is nothing to further examine regarding attribution to injury”), citing Gerald Metals, 132 F.3d at 722 (the statute “does not suggest that an importer of LTFV goods can escape countervailing duties by finding some tangential or minor cause unrelated to the LTFV goods that contributed to the harmful effects on domestic market prices.”).
101 S. Rep. 96‐249 at 74‐75; H.R. Rep. 96‐317 at 47. 102 See Nippon, 345 F.3d at 1381 (“an affirmative material‐injury determination under the
statute requires no more than a substantial‐factor showing. That is, the ‘dumping’ need not be the sole or principal cause of injury.”).

18
the subject imports.”103 Indeed, the Federal Circuit has examined and affirmed various Commission methodologies and has disavowed “rigid adherence to a specific formula.”104
The Federal Circuit’s decisions in Gerald Metals, Bratsk, and Mittal Steel all involved cases in which the relevant “other factor” was the presence in the market of significant volumes of price‐competitive nonsubject imports. The Commission interpreted the Federal Circuit’s guidance in Bratsk as requiring it to apply a particular additional methodology following its finding of material injury in cases involving commodity products and a significant market presence of price‐competitive nonsubject imports.105 The additional “replacement/benefit” test looked at whether nonsubject imports might have replaced subject imports without any benefit to the U.S. industry. The Commission applied that specific additional test in subsequent cases, including the Carbon and Certain Alloy Steel Wire Rod from Trinidad and Tobago determination that underlies the Mittal Steel litigation.
Mittal Steel clarifies that the Commission’s interpretation of Bratsk was too rigid and makes clear that the Federal Circuit does not require the Commission to apply an additional test nor any one specific methodology; instead, the court requires the Commission to have “evidence in the record ‘to show that the harm occurred ‘by reason of’ the LTFV imports,’” and requires that the Commission not attribute injury from nonsubject imports or other factors to subject imports.106 Accordingly, we do not consider ourselves required to apply the replacement/benefit test that was included in Commission opinions subsequent to Bratsk.
The progression of Gerald Metals, Bratsk, and Mittal Steel clarifies that, in cases involving commodity products where price‐competitive nonsubject imports are a significant factor in the U.S. market, the Court will require the Commission to give full consideration, with adequate explanation, to non‐attribution issues when it performs its causation analysis.107
103 Mittal Steel, 542 F.3d at 877‐78; see also id. at 873 (“While the Commission may not enter an
affirmative determination unless it finds that a domestic industry is materially injured ‘by reason of’ subject imports, the Commission is not required to follow a single methodology for making that determination ... {and has} broad discretion with respect to its choice of methodology.”) citing United States Steel Group v. United States, 96 F.3d 1352, 1362 (Fed. Cir. 1996) and S. Rep. 96‐249 at 75. In its decision in Swiff‐Train v. United States, 793 F.3d 1355 (Fed. Cir. 2015), the Federal Circuit affirmed the Commission’s causation analysis as comporting with the Court’s guidance in Mittal.
104 Nucor Corp. v. United States, 414 F.3d 1331, 1336, 1341 (Fed. Cir. 2005); see also Mittal Steel, 542 F.3d at 879 (“Bratsk did not read into the antidumping statute a Procrustean formula for determining whether a domestic injury was ‘by reason’ of subject imports.”).
105 Mittal Steel, 542 F.3d at 875‐79. 106 Mittal Steel, 542 F.3d at 873 (quoting from Gerald Metals, 132 F.3d at 722), 875‐79 & n.2
(recognizing the Commission’s alternative interpretation of Bratsk as a reminder to conduct a non‐attribution analysis).
107 To that end, after the Federal Circuit issued its decision in Bratsk, the Commission began to present published information or send out information requests in the final phase of investigations to producers in nonsubject countries that accounted for substantial shares of U.S. imports of subject merchandise (if, in fact, there were large nonsubject import suppliers). In order to provide a more complete record for the Commission’s causation analysis, these requests typically seek information on capacity, production, and shipments of the product under investigation in the major source countries that export to the United States. The Commission plans to continue utilizing published or requested (Continued…)

19
The question of whether the material injury threshold for subject imports is satisfied notwithstanding any injury from other factors is factual, subject to review under the substantial evidence standard.108 Congress has delegated this factual finding to the Commission because of the agency’s institutional expertise in resolving injury issues.109
B. Conditions of Competition and the Business Cycle
The following conditions of competition inform our analysis of whether there is a reasonable indication of material injury by reason of subject imports.
1. Demand Conditions
U.S. demand for threaded rod is driven by demand for end use products in building construction, particularly nonresidential and industrial construction, including for hanging of pipe, sprinkler systems, conduits, electrical wiring, lights, struts, and HVAC units, as well as joint restraint systems for underground piping, concrete anchors, and general framing and anchoring.110 A majority of responding U.S. producers and a plurality of responding U.S. importers reported that U.S. demand for threaded rod has increased since January 2016.111 Reported apparent U.S. consumption increased by 27.3 percent between 2016 and 2018, steadily increasing from 285.8 million pounds in 2016 to 320.9 million pounds in 2017 and 363.8 million pounds in in 2018.112
2. Supply Conditions
Cumulated subject imports served as the largest source of supply for the U.S. market, followed by the domestic producers, with nonsubject imports accounting for the smallest portion of the market.
The domestic industry’s reported capacity decreased by 6.3 percent between 2016 and 2018, from 263.7 million pounds in 2016 to 247.2 million pounds in 2018, while its reported capacity utilization rate increased from 50.1 percent in 2016 to 55.8 percent in 2017 and 58.8 percent in 2018.113
(…Continued) information in the final phase of investigations in which there are substantial levels of nonsubject imports.
108 We provide in our discussion below a full analysis of other factors alleged to have caused any material injury experienced by the domestic industry.
109 Mittal Steel, 542 F.3d at 873; Nippon Steel Corp., 458 F.3d at 1350, citing U.S. Steel Group, 96 F.3d at 1357; S. Rep. 96‐249 at 75 (“The determination of the ITC with respect to causation is ... complex and difficult, and is a matter for the judgment of the ITC.”).
110 CR at II‐8, PR at II‐6. 111 CR/PR at Table II‐4. 112 CR/PR at Tables IV‐10 and C‐1. 113 CR/PR at Tables III‐4 and C‐1. Petitioner Vulcan reported that it purchased all of the major
equipment and assets of Acme’s Indianapolis, Indiana, facility in August 2017. Vulcan reported that it (Continued…)

20
The market share of the domestic industry declined from 46.0 percent of apparent U.S. consumption in 2016 to 43.9 percent in 2017 and 38.8 percent in 2018.114 Conversely, the market share of cumulated subject imports increased from 50.1 percent in 2016 to 53.5 percent in 2017 and 58.6 percent in 2018.115 The market share of nonsubject imports decreased over the POI, from 3.9 percent in 2016 to 2.7 percent in 2017 and 2.5 percent in 2018.116
3. Substitutability and Other Conditions
Based on the record, we find that there is a high degree of substitutability between the domestic like product and subject imports.117 All responding U.S. producers and a majority of U.S. importers reported that the domestic like product and subject imports from all subject countries are always or frequently interchangeable.118 A majority of responding U.S. producers reported that differences other than price between and among subject imports from all sources and the domestic like product are sometimes significant, although a majority of responding U.S. importers reported that differences other than price between and among subject imports from all sources and the domestic like product are sometimes or never significant.119
Purchasers responding to the Commission’s lost sales/lost revenue survey were asked to identify the main factors that their firms considered in making purchasing decisions for threaded rod. All responding purchasers reported that price was a main factor in their purchasing decisions. A majority of responding purchasers also reported that quality and availability were important factors in their purchasing decisions.120 Accordingly, we find that price is an important factor in purchasing decisions for threaded rod.
Raw materials are the largest component of the domestic producers’ total cost of goods sold (“COGS”) for threaded rod. U.S. producers reported that raw material costs increased as a share of total COGS, from 62 percent in 2016 to 71.6 percent in 2018.121 The majority of U.S. producers and importers reported that raw material costs increased over the POI.122
(…Continued) had planned on installing this equipment to increase production, but that this equipment is presently in storage. Conference Transcript at 15 (Black), 22 (Logan), and 34 (Schagrin); CR at III‐3, PR at III‐2. However, Acme continues domestic production at other facilities. See CR/PR at Tables III‐3 and III‐4.
114 CR/PR at Tables IV‐10 and C‐1. 115 CR/PR at Tables IV‐10 and C‐1. 116 CR/PR at Table IV‐10. The largest sources of nonsubject imports in 2018 were Malaysia, the
Philippines, Germany, and Korea. CR at VII‐30, PR at VII‐20, and CR/PR at Table IV‐2. 117 CR at II‐13, PR at II‐8. 118 CR/PR at Table II‐6. 119 CR/PR at Table II‐7. 120 CR at II‐14 to II‐15, PR at II‐10 to II‐11. 121 CR/PR at V‐1. 122 CR at V‐2 to V‐3, PR at V‐1.

21
C. Volume of Subject Imports
Section 771(7)(C)(i) of the Tariff Act provides that the “Commission shall consider whether the volume of imports of the merchandise, or any increase in that volume, either in absolute terms or relative to production or consumption in the United States, is significant.”123
The volume of cumulated subject imports increased by 49.1 percent from 2016 and 2018. Cumulated subject imports increased steadily from 143.1 million pounds in 2016 to 171.5 million pounds in 2017 and 213.4 million pounds in 2018.124 The market share of cumulated subject imports increased from 50.1 percent in 2016 to 53.5 percent in 2017 and 58.6 percent in 2018.125 As noted above, cumulated subject imports gained market share at the expense of the domestic industry, gaining 8.6 percentage points of market share between 2016 and 2018, while the domestic industry lost 7.2 percentage points of market share over the same period.126
We find that the volume and increase in volume of cumulated subject imports are significant both in absolute terms and relative to consumption in the United States.
D. Price Effects of the Subject Imports
Section 771(7)(C)(ii) of the Tariff Act provides that, in evaluating the price effects of subject imports, the Commission shall consider whether –
(I) there has been significant price underselling by the imported merchandise as compared with the price of domestic like products of the United States, and
(II) the effect of imports of such merchandise otherwise depresses prices to a significant degree or prevents price increases, which otherwise would have occurred, to a significant degree.127 As discussed above, we find that cumulated subject imports and the domestic like
product are highly substitutable, and that price is an important factor in purchasing decisions for threaded rod.
The Commission collected quarterly f.o.b. pricing data on sales of six threaded rod products shipped to unrelated U.S. customers during the POI.128 Four U.S. producers and 15
123 19 U.S.C. § 1677(7)(C)(i). 124 CR/PR at Tables IV‐9 and C‐1. 125 CR/PR at Table IV‐9. 126 CR/PR at Tables IV‐9 and C‐1. 127 19 U.S.C. § 1677(7)(C)(ii). 128 CR at V‐6, PR at V‐4. The six pricing products are: Product 1—Low‐carbon steel fully threaded rod, electroplated with zinc, a 3/8 in. diameter, 16
threads pre inch, in 10‐foot lengths, in cardboard tubes. Product 2— Low‐carbon steel fully threaded rod, electroplated with zinc, a 1/2 in. diameter, 13
threads per inch, in 10‐foot lengths, in cardboard tubes. (Continued…)

22
importers provided usable pricing data for sales of the requested products, although not all firms reported pricing data for all products for all quarters.129 The pricing data reported by these firms accounted for approximately 22.3 percent of the domestic industry’s U.S. commercial shipments in 2017, 2.4 percent of U.S. commercial shipments of subject imports from China, 34.7 percent of U.S. commercial shipments of subject imports from India, 25.6 percent of U.S. commercial shipments of subject imports from Taiwan, and 25.4 percent of U.S. shipments of subject imports from Thailand in 2018. Pricing data reported by these firms accounted for 25.4 percent of commercial U.S. shipments from all subject sources in 2018.130
Based on the reported pricing data, cumulated subject imports undersold the domestic like product produced by the domestic industry in 146 out of 225 quarterly comparisons (64.9 percent of comparisons), at margins ranging between 0.3 percent and 50.5 percent, and an average margin of underselling of 9.7 percent.131 The data also reflect predominant underselling by volume, with 61.6 million pounds of subject imports in quarters with instances of underselling compared to 8.1 million pounds of subject imports in quarters with instances of overselling.132 Thus, the record indicates that subject imports were priced lower than domestically produced threaded rod at a time when subject imports were gaining market share at the expense of the domestic industry. Because price is an important factor in purchasing decisions for threaded rod, and subject imports and the domestic like product are highly substitutable, the shifts in market share from the domestic industry to subject imports appear to be a direct result of subject import pricing. Therefore, we find the underselling by the subject imports to be significant.
We have also considered price trends. The data on the record show that prices for threaded rod from all sources generally rose during the POI.133 The reported pricing data show
(…Continued)
Product 3— Low‐carbon steel fully threaded rod, electroplated with zinc, a 3/4 in. diameter, 10 threads per inch, in 12‐foot lengths, in cardboard tubes.
Product 4— Low‐carbon steel fully threaded rod, electroplated with zinc, a 5/8 in. diameter, 11 threads per inch, in 12‐foot lengths, in cardboard tubes.
Product 5— Alloy steel fully threaded rod, produced to ASTM A193 Grade B7, a 3/4 in. diameter, 10 threads per inch, in 12‐foot lengths, in cardboard tubes.
Product 6— Alloy steel fully threaded rod, produced to ASTM A193 Grade B7, a 1‐1/4 in. diameter, 8 threads per inch, in 12‐foot lengths, in cardboard tubes. Id.
129 CR at V‐7, PR at V‐4. 130 CR at V‐7, PR at V‐4. 131 CR/PR at Table V‐10. One purchaser responding to the Commission’s lost sales/lost revenue
survey reported that subject import prices were lower than those for domestically produced threaded rod, that price was the primary reason for its decision to purchase subject imports rather than the domestic like product, and that U.S. producers had reduced their prices or rolled back announced price increases to compete with subject imports. CR at V‐24 to V‐25, PR at V‐9, and CR/PR at Tables V‐12 and V‐13.
132 CR/PR at Table V‐10. 133 CR at V‐20, PR at V‐6, and CR/PR at Table V‐9.

23
that prices for domestically produced threaded rod increased during the POI, ranging from *** to *** percent.134 Accordingly, the current record does not show that cumulated subject imports depressed prices of the domestic like product to a significant degree.
The domestic industry’s ratio of COGS to net sales steadily increased over the POI, from 71.7 percent in 2016 to 78.2 percent in 2017 and then again to 79.1 percent in 2018.135 From 2016 to 2018, the industry's unit COGS rose by $0.15 per pound, while its net sales average unit value (“AUV”) increased by only $0.12 per pound.136 Thus, the record indicates that the industry experienced a cost‐price squeeze over the POI as demand increased. In any final phase of these investigations, we will further examine how prices are determined in this market and whether subject imports prevented price increases by the domestic industry which otherwise would have occurred to a significant degree.
In sum, the record indicates that price is an important factor in purchasing decisions for threaded rod and subject imports and the domestic like product are highly substitutable. Significant underselling by subject imports resulted in a shift in market share from the domestic industry to subject imports. We therefore find that the subject imports had adverse price effects.
E. Impact of the Subject Imports137
Section 771(7)(C)(iii) of the Tariff Act provides that the Commission, in examining the impact of the subject imports on the domestic industry, “shall evaluate all relevant economic factors which have a bearing on the state of the industry.” These factors include output, sales, inventories, capacity utilization, market share, employment, wages, productivity, gross profits, net profits, operating profits, cash flow, return on investment, return on capital, ability to raise capital, ability to service debt, research and development, and factors affecting domestic prices. No single factor is dispositive and all relevant factors are considered “within the context of the business cycle and conditions of competition that are distinctive to the affected industry.”138
While some of the industry’s output indicators improved over the POI, these increases were lower than the substantial increase in apparent U.S. consumption (27.3 percent). As the industry lost market share to subject imports, its profitability declined.139
134 CR at V‐20, PR at V‐6, and CR/PR at Table V‐9. 135 CR/PR at Table C‐1. 136 CR/PR at Table C‐1. 137 In its notice initiating the antidumping duty investigations on threaded rod from China, India,
Taiwan, and Thailand, Commerce initiated investigations based on estimated dumping margins of 57.36 and 59.45 percent for imports from China, 23.43 and 28.34 percent for imports from India, 32.26 percent for imports from Taiwan, and 20.83 percent for imports from Thailand. Commerce AD Initiation, 84 Fed. Reg. at 10037.
138 19 U.S.C. § 1677(7)(C)(iii). 139 Apparent U.S. consumption increased by 27.3 percent between 2016 and 2018, from 285.8
million pounds in 2016 to 320.9 million pounds in 2017 and 363.8 million pounds in 2018. CR/PR at Tables IV‐10 and C‐1.

24
The domestic industry’s capacity decreased by 6.3 percent between 2016 and 2018, decreasing from 263.7 million pounds in 2016 to 246.9 million pounds in 2017, before increasing to 247.2 million pounds in 2018.140 Production increased by 9.9 percent from 2016 to 2018, from 132.1 million pounds in 2016 to 137.7 million pounds in 2017 and 145.2 million pounds in 2018.141 Capacity utilization increased by 8.7 percentage points from 2016 to 2018, from 50.1 percent in 2016 to 55.8 percent in 2017 and 58.8 percent in 2018.142
U.S. shipments rose 7.3 percent from 2016 to 2018, from 131.6 million pounds in 2016 to 140.8 million pounds in 2017 and 141.2 million pounds in 2018.143 The domestic industry’s share of apparent U.S. consumption fell 7.2 percentage points from 2016 to 2018, from 46.0 percent in 2016 to 43.9 percent in 2017 and 38.8 percent in 2018.144
Employment increased by 4.6 percent from 2016 to 2018, increasing from 280 production‐related workers (“PRWs”) in 2016 to 312 PRWs in 2017, before decreasing to 293 PRWs in 2018.145 Hours worked rose 6.0 percent from 2016 to 2018, increasing from 598,000 hours in 2016 to 664,000 hours in 2017, before declining to 634,000 hours in 2018.146 Wages paid increased by 20.2 percent from 2016 to 2018, increasing from $10.9 million in 2016 to $13.3 million in 2017, before declining to $13.1 million in 2018.147 Productivity (in pounds per hour) rose by 3.7 percent from 2016 to 2018, declining from 220.9 in 2016 to 207.3 in 2017, and then increasing to 229.1 in 2018.148
Revenues rose by 24.3 percent from 2016 to 2018, increasing from $96.7 million in 2016 to $105.9 million in 2017 and $120.2 million in 2018.149 Total COGS rose by 37.2 percent from 2016 to 2018, increasing from $69.3 million in 2016 to $82.8 million in 2017 and $95.0 million in 2018.150 The industry’s ratio of COGS to net sales rose 7.4 percentage points from 2016 to 2018, increasing from 71.7 percent in 2016 to 78.2 percent in 2017 and 79.1 percent in 2018.151 Gross profit declined by 8.2 percent from 2016 to 2018, declining from $27.4 million in 2016 to $23.1 million in 2017, and then increasing to $25.2 million in 2018.152
140 CR/PR at Tables III‐4 and C‐1. 141 CR/PR at Tables III‐4 and C‐1. 142 CR/PR at Tables III‐4 and C‐1. 143 CR/PR at Tables IV‐9 and C‐1. Ending inventories of producers in the domestic industry rose
by 2.0 percent from 2016 to 2018, decreasing from 21.7 million pounds in 2016 to 18.5 million pounds in 2017, before increasing to 22.2 million pounds in 2018. CR/PR at Tables III‐7 and C‐1.
144 CR/PR at Tables IV‐9 and C‐1. 145 CR/PR at Tables III‐9 and C‐1. 146 CR/PR at Tables III‐9 and C‐1. 147 CR/PR at Tables III‐9 and C‐1. Hourly wages rose 13.4 percent from 2016 to 2018, from
$18.16 in 2016 to $19.95 in 2017 and $20.59 in 2018. Id. 148 CR/PR at Tables III‐9 and C‐1. 149 CR/PR at Tables VI‐1 and C‐1. 150 CR/PR at Tables VI‐1 and C‐1. 151 CR/PR at Tables VI‐1 and C‐1. 152 CR/PR at Tables VI‐1 and C‐1.

25
Operating income fell by 14.7 percent from 2016 to 2018, decreasing from $13.3 million in 2016 to $9.4 million in 2017, before increasing to $11.4 million in 2018.153 The industry’s operating income margin decreased from 13.8 percent in 2016 to 8.9 percent in 2016, and then increased to 9.5 percent in 2018.154 Net income declined by 12.1 percent from 2016 to 2018, decreasing from $11.5 million in 2016 to $7.7 million in 2017, and then increasing to $10.1 million in 2018.155 Capital expenditures increased by *** percent between 2016 and 2018, increasing from $*** in 2016 to $*** in 2017 and $*** in 2018.156
As discussed above, subject imports undersold the domestic producers’ prices and gained market share at the domestic industry’s expense. Although the domestic industry showed some improvement in output and employment over the POI as apparent U.S. consumption rose substantially, the improvement was far lower than the growth in apparent U.S. consumption. Moreover, its profitability declined over the POI. Given the volume and price effects of subject imports, we find, for purposes of these preliminary investigations, that subject imports had an adverse impact on the domestic industry.157
We have considered whether there are other factors that may have had an impact on the domestic industry during the POI to ensure that we are not attributing injury from such other factors to subject imports. Nonsubject imports had a relatively small and declining presence in the U.S. market during the POI. Nonsubject imports lost 1.4 percentage points of market share between 2016 and 2018, while the domestic industry lost 7.2 percentage points of market share. 158 Thus, based on the available data, nonsubject imports cannot explain the magnitude of the domestic industry’s loss of market share during the POI.
VIII. Conclusion
For the reasons stated above, we determine that there is a reasonable indication that an industry in the United States is materially injured by reason of subject imports of threaded rod from China, India, Taiwan, and Thailand that are allegedly sold in the United States at less than fair value and that allegedly are subsidized by the governments of China and India.
153 CR/PR at Tables VI‐1 and C‐1. 154 CR/PR at Tables VI‐1 and C‐1. 155 CR/PR at Tables VI‐1 and C‐1. 156 CR/PR at Tables VI‐4 and C‐1. The domestic industry incurred research and development
(“R&D”) expenses of $*** in 2016, $*** in 2017, and $*** in 2018. CR/PR at Table VI‐4. 157 We also observe that, despite the improvements in the domestic industry’s output and
employment indicators over the POI, the industry’s capacity utilization remains low and the production assets purchased from Acme by Vulcan are reported to have remained idle. CR/PR at Tables III‐3 and C‐1.
158 CR/PR at Table C‐3. The market share of nonsubject imports decreased from 3.9 percent in 2016 to 2.7 percent in 2017 and 2.5 percent in 2018. CR/PR at Tables IV‐10 and C‐1.


I‐1
PART I: INTRODUCTION
BACKGROUND
These investigations result from petitions filed with the U.S. Department of Commerce (“Commerce”) and the U.S. International Trade Commission (“USITC” or “Commission”) by Vulcan Threaded Products Inc. (“Vulcan”), Pelham, Alabama, on February 21, 2019, alleging that an industry in the United States is materially injured and threatened with material injury by reason of subsidized imports of carbon and alloy steel threaded rod (“threaded rod”)1 from China and India and by less‐than‐fair‐value (“LTFV”) imports of threaded rod from China, India, Taiwan, and Thailand. The following tabulation provides information relating to the background of these investigations.2 3
Effective date Action
February 21, 2019
Petitions filed with Commerce and the Commission; institution of Commission investigations (84 FR 6817, February 28, 2019)
March 13, 2019
Commerce’s notice of initiation of AD and CVD investigations (84 FR 10034 and 84 FR 10040, March 19, 2019)
March 14, 2019 Commission’s conference
April 5, 2019 Commission’s vote
April 8, 2019 Commission’s determinations
April 15, 2019 Commission’s views
STATUTORY CRITERIA AND ORGANIZATION OF THE REPORT
Statutory criteria
Section 771(7)(B) of the Tariff Act of 1930 (the “Act”) (19 U.S.C. § 1677(7)(B)) provides
that in making its determinations of injury to an industry in the United States, the Commission—
shall consider (I) the volume of imports of the subject merchandise, (II) the effect of imports of that merchandise on prices in the United States for domestic like products, and (III) the impact of imports of such merchandise on domestic producers of domestic like products, but only in
1 See the section entitled “The Subject Merchandise” in Part I of this report for a complete description of the merchandise subject in this proceeding.
2 Pertinent Federal Register notices are referenced in appendix A, and may be found at the Commission’s website (www.usitc.gov).
3 A list of witnesses appearing at the conference is presented in appendix B of this report.

I‐2
the context of production operations within the United States; and. . . may consider such other economic factors as are relevant to the determination regarding whether there is material injury by reason of imports.
Section 771(7)(C) of the Act (19 U.S.C. § 1677(7)(C)) further provides that‐‐4 In evaluating the volume of imports of merchandise, the Commission shall consider whether the volume of imports of the merchandise, or any increase in that volume, either in absolute terms or relative to production or consumption in the United States is significant.. . .In evaluating the effect of imports of such merchandise on prices, the Commission shall consider whether. . .(I) there has been significant price underselling by the imported merchandise as compared with the price of domestic like products of the United States, and (II) the effect of imports of such merchandise otherwise depresses prices to a significant degree or prevents price increases, which otherwise would have occurred, to a significant degree.. . . In examining the impact required to be considered under subparagraph (B)(i)(III), the Commission shall evaluate (within the context of the business cycle and conditions of competition that are distinctive to the affected industry) all relevant economic factors which have a bearing on the state of the industry in the United States, including, but not limited to. . . (I) actual and potential decline in output, sales, market share, gross profits, operating profits, net profits, ability to service debt, productivity, return on investments, return on assets, and utilization of capacity, (II) factors affecting domestic prices, (III) actual and potential negative effects on cash flow, inventories, employment, wages, growth, ability to raise capital, and investment, (IV) actual and potential negative effects on the existing development and production efforts of the domestic industry, including efforts to develop a derivative or more advanced version of the domestic like product, and (V) in {an antidumping investigation}, the magnitude of the margin of dumping.
In addition, Section 771(7)(J) of the Act (19 U.S.C. § 1677(7)(J)) provides that—5 (J) EFFECT OF PROFITABILITY.—The Commission may not determine that there is no material injury or threat of material injury to an industry in the United States merely because that industry is profitable or because the performance of that industry has recently improved.
4 Amended by PL 114‐27 (as signed, June 29, 2015), Trade Preferences Extension Act of 2015. 5 Amended by PL 114‐27 (as signed, June 29, 2015), Trade Preferences Extension Act of 2015.

I‐3
Organization of report
Part I of this report presents information on the subject merchandise, alleged subsidy/dumping margins, and domestic like product. Part II of this report presents information on conditions of competition and other relevant economic factors. Part III presents information on the condition of the U.S. industry, including data on capacity, production, shipments, inventories, and employment. Parts IV and V present the volume of subject imports and pricing of domestic and imported products, respectively. Part VI presents information on the financial experience of U.S. producers. Part VII presents the statutory requirements and information obtained for use in the Commission’s consideration of the question of threat of material injury as well as information regarding nonsubject countries.
MARKET SUMMARY
Threaded rod is generally used in commercial construction to suspend electrical conduit,
pipes for plumbing, HVAC ductwork, and sprinkler systems. The leading U.S. producer of threaded rod is Vulcan, while leading producers of threaded rod outside the United States include ***. The leading U.S. importers of threaded rod from subject sources are ***, while the leading importers of threaded rod from nonsubject countries include ***. U.S. purchasers of threaded rod are firms that distribute threaded rod to end users or use threaded rod as an input for a custom made construction product; leading purchasers include ***.
Apparent U.S. consumption of threaded rod totaled approximately 363.8 million pounds ($270.8 million) in 2018. Currently, seven firms are known to produce threaded rod in the United States. U.S. producers’ U.S. shipments of threaded rod totaled 141.2 million pounds ($120.2 million) in 2018, and accounted for 38.8 percent of apparent U.S. consumption by quantity and 44.4 percent by value. U.S. imports from subject sources totaled 213.4 million pounds ($137.9 million) in 2018 and accounted for 58.6 percent of apparent U.S. consumption by quantity and 50.9 percent by value. U.S. imports from nonsubject sources totaled 9.3 million pounds ($12.8 million) in 2018 and accounted for 2.5 percent of apparent U.S. consumption by quantity and 4.7 percent by value.
SUMMARY DATA AND DATA SOURCES
A summary of data collected in these investigations is presented in appendix C, table C‐
1. Except as noted, U.S. industry data are based on questionnaire responses of seven firms that accounted for the vast majority of U.S. production of threaded rod during 2018. U.S. imports are based on official Commerce statistics.

I‐4
PREVIOUS AND RELATED INVESTIGATIONS
Antidumping and countervailing duty investigations
Threaded rod has been the subject of two prior countervailing and antidumping duty investigations in the United States.6
On March 5, 2008, Vulcan filed an antidumping duty petition against imports of certain threaded rod from China. Following an affirmative determination by Commerce, on April 6, 2009, the Commission determined that the U.S. threaded rod industry was materially injured by reason of imports of threaded rod from China.7 Commerce issued an antidumping duty order on Chinese imports of threaded rod in April 2009, with margins ranging from 55.16 percent to 206.00 percent.8 The Commission instituted a five‐year review of the order on March 3, 2014. On June 6, 2014, the Commission determined that it would conduct an expedited review.9 On June 26, 2014, Commerce published its determination that revocation of the antidumping duty
6 The scope of the investigations included steel threaded rod, bar, or studs, in which: (1) iron predominates, by weight, over each of the other contained elements; (2) the carbon content is 2 percent or less, by weight; and (3) none of the elements listed below exceeds the quantity, by weight, respectively indicated:
1.80 percent of manganese, or
1.50 percent of silicon, or
1.00 percent of copper, or
0.50 percent of aluminum, or
1.25 percent of chromium, or
0.30 percent of cobalt, or
0.40 percent of lead, or
1.25 percent of nickel, or
0.30 percent of tungsten, or
0.012 percent of boron, or
0.10 percent of molybdenum, or
0.10 percent of niobium, or
0.41 percent of titanium, or
0.15 percent of vanadium, or
0.15 percent of zirconium. 7 Certain Steel Threaded Rod from the People's Republic of China: Final Determination of Sales at Less
Than Fair Value, 74 FR 8907, February 27, 2009; and Certain Steel Threaded Rod From China Determination, 74 FR 16427, April 10, 2009.
8 Certain Steel Threaded Rod from the People’s Republic of China: Notice of Antidumping Duty Order, 74 FR 17154, April 14, 2009.
9 Certain Steel Threaded Rod From China; Institution of a Five‐Year Review, 79 FR 11827, March 3, 2014; and Steel Threaded Rod From China; Scheduling of an Expedited Five‐Year Review, 79 FR 34783, June 18, 2014.

I‐5
order would be likely to lead to continuation or recurrence of dumping.10 On August 8, 2014, the Commission notified Commerce of its determination that material injury would be likely to continue or recur within a reasonably foreseeable time.11 Following affirmative determinations in the five‐year review by Commerce and the Commission, effective August 19, 2014, Commerce issued a continuation of the antidumping duty order on imports of certain threaded rod from China.12 The Commission is scheduled to institute the second five‐year review of the order on July 1, 2019.
On June 27, 2013, All American Threaded Products, Inc., Bay Standard Manufacturing Inc., and Vulcan filed a countervailing duty petition against imports of certain threaded rod from India and antidumping duty petitions against imports of certain threaded rod from India and Thailand. On August 18, 2014, the Commission determined that the U.S. threaded rod industry was not materially injured or threatened with material injury, and the establishment of an industry in the United States was not materially retarded by reason of imports of certain threaded rod from India and Thailand that had been found by Commerce to be sold in the United States at LTFV and subsidized by the government of India.13
Overview on Section 232 and Section 301 proceedings
On March 8, 2018, the President issued a proclamation adjusting imports of steel mill
products into the United States, under Section 232 of the Trade Expansion Act of 1962, as amended (19 U.S.C. 1862), providing for additional import duties, effective March 23, 2018.14 While imports of subject threaded rod are not subject to the Section 232 investigation, imports of raw materials such as carbon and alloy steel wire rod and carbon and alloy steel bar are among the articles subject to the additional 25‐percent national‐security tariff.15 Subsequent proclamations were issued on March 22, 2018, April 30, 2018, and May 31, 2018 adjusting the scope of these measures.16 As of June 1, 2018, imports of the specified raw materials from all
10 Certain Steel Threaded Rod from the People’s Republic of China: Final Results of Expedited Sunset Review of the Antidumping Duty Order, 79 FR 36288, June 26, 2014.
11 Certain Steel Threaded Rod From China, 79 FR 46450, January 22, 2014. 12 Certain Steel Threaded Rod From the People's Republic of China: Continuation of Antidumping Duty
Order, 79 FR 49050, August 19, 2014. 13 Certain Steel Threaded Rod From Thailand, 79 FR 26267, May 7, 2014; and Certain Steel Threaded
Rod From India, 79 FR 49810, August 22, 2014. 14 Adjusting Imports of Steel into the United States, Presidential Proclamation 9705, March 8, 2018,
83 FR 11625, March 15, 2018. 15 U.S. Customs and Border Protection, “Section 232 Tariffs on Aluminum and Steel,” February 27,
2019, https://www.cbp.gov/trade/programs‐administration/entry‐summary/232‐tariffs‐aluminum‐and‐steel, (accessed March 15, 2018).
16 Adjusting Imports of Steel into the United States, Presidential Proclamation 9711, March 22, 2018, 83 FR 13361, March 28, 2018; Adjusting Imports of Steel into the United States, Presidential Proclamation 9740, April 30, 2018, 83 FR 20683, May 7, 2018; Adjusting Imports of Steel into the United
(continued...)

I‐6
countries of origin except Argentina, Australia, Brazil, and South Korea has been subject to a 25 percent ad valorem duty, while imports of certain steel mill products from Argentina, Brazil, and South Korea are subject to an absolute annual quota.17
On August 18, 2017, the Office of the U.S. Trade Representative (USTR) initiated an investigation pursuant to Section 301 of the Trade Act of 1974, as amended (the Trade Act), to determine whether acts, policies, and practices of the Government of the People’s Republic of China (China) related to technology transfer, intellectual property, and innovation are actionable under the Trade Act.18 Following its investigation and a public comment period, USTR published a notice on September 21, 2018 announcing the imposition of a 10 percent ad valorem duty on products imported from China with an annual trade value of approximately $200 billion, including subject threaded rod. The 10 percent ad valorem duty took effect on September 24, 2018, and continues to remain in place.19 On December 19, 2018, USTR announced that it would postpone the date on which the rate of the additional duties would increase to 25 percent for the products covered by the September 2018 action to March 2, 2019.20 On March 5, 2019, USTR announced that the rate of additional duty will remain at 10 percent and that further increases in this rate will be postponed until further notice.21
NATURE AND EXTENT OF ALLEGED SUBSIDIES AND SALES AT LTFV
Alleged subsidies
On March 19, 2019, Commerce published a notice in the Federal Register of the
initiation of its countervailing duty investigations on threaded rod from China and India.22 Commerce identified the following government programs in China and India.23
(…continued) States, Presidential Proclamation 9740, April 30, 2018, 83 FR 20683, May 7, 2018; Adjusting Imports of Steel into the United States, Presidential Proclamation 9759, May 31, 2018, 83 FR 25857, June 5, 2018.
17 U.S. Customs and Border Protection, “Section 232 Tariffs on Aluminum and Steel,” February 27, 2019, https://www.cbp.gov/trade/programs‐administration/entry‐summary/232‐tariffs‐aluminum‐and‐steel, (accessed March 15, 2018).
18 Initiation of Section 301 Investigation; Hearing; and Request for Public Comments: China's Acts, Policies, and Practices Related to Technology Transfer, Intellectual Property, and Innovation, August 18, 2017, 82 FR 40213, August 24, 2017.
19 Notice of Modification of Section 30 Action: China’s Acts, Policies, and Practices Related to Technology Transfer, Intellectual Property, and Innovation, September 21, 2018, 83 FR 47974.
20 Notice of Modification of Section 301 Action: China's Acts, Policies, and Practices Related to Technology Transfer, Intellectual Property, and Innovation, December 19, 2018, 83 FR 65198.
21 Notice of Modification of Section 301 Action: China's Acts, Policies, and Practices Related to Technology Transfer, Intellectual Property, and Innovation, March 5, 2019, 84 FR 7966.
22 Carbon and Alloy Steel Threaded Rod From India and the People’s Republic of China: Initiation of Countervailing Duty Investigations, 84 FR 10040, March 19, 2019.
23 Commerce Initiation Checklist, C‐570‐105, March 13, 2019, pp. 7‐29; and Commerce Initiation Checklist, C‐533‐888, March 13, 2019, pp. 7‐45.

I‐7
China A. Preferential Lending: 1. Policy Loans to the Steel Threaded Rod Industry 2. Export credits from Export‐Import Bank of China
a. Export seller’s credit b. Export buyer’s credit
3. Loans and Interest Subsidies Provided Pursuant to the Northeast Revitalization Plan.
B. Income Tax and Other Direct Tax Subsidies: 1. Preferential Income Tax Program for High and New Technology Enterprises (HNTEs)
2. Preferential Deduction of Research and Development (R&D) Expenses for HNTEs 3. Preferential Income Tax Policy for Enterprises in the Northeast Region 4. Reduction in or Exemption from Fixed Assets Investment Orientation Regulatory Tax 5. Income Tax Benefits for Domestically Owned Enterprises Engaging in Research and Development
C. Indirect Tax Programs: 1. Value‐Added Tax (VAT) and Tariff Exemptions for Purchases of Fixed Assets
Under the Foreign Trade Development Fund 2. Import Tariff and VAT Exemptions for Foreign‐invested Enterprises (FIEs) and Certain Domestic Enterprises Using Imported equipment in Encouraged Industries
D. Grant Programs: 1. Foreign Trade Development Fund Grants 2. Export Assistance Grants 3. Subsidies for Development of Famous Export Brands and China World Top
Brands 4. Export Interest Subsidies 5. Grants for Energy Conservation and Emission Reduction 6. Grants for Retirement of Capacity
E. Government Provision of Goods and Services for Less than Adequate Remuneration (LTAR): 1. Provision of Electricity for LTAR 2. Provision of Wire Rod and Steel Bar for LTAR
India A. Duty Exemption/Remission Schemes: 1. Advance Authorization Scheme (formerly, Advance License Program) 2. Duty Free Import Authorization Scheme (DFIA Scheme) 3. Duty Drawback Scheme (DDB)

I‐8
B. Subsidies for Export Oriented Units (EOU): 1. Duty‐Free Import of Goods, Including Capital Goods and Raw Materials 2. Reimbursements of Central Sales Tax Paid on Goods Manufactured in India 3. Duty Drawback on Fuel Procured from Domestic Oil Companies 4. Exemption from Payment of Central Excise Duty on Goods Manufactured in India
and Procured from a Domestic Tariff Area (DTA) C. Export Promotion of Capital Goods Scheme (EPCGS) D. Pre‐Shipment and Post‐Shipment Export Financing E. Market Development Assistance Scheme (MDA Scheme) F. Market Access Initiative (MAI) G. Focus Product Scheme H. Government of India Loan Guarantees I. Status Certificate Program J. Steel Development Fund Loans (SDF) K. Provision of Steel Wire Rod and Bar for Less Than Adequate Remuneration (LTAR) L. Incremental Exports Incentivisation Scheme (IEIS) M. State Government of Maharashtra (SGOM) Programs: 1. Infrastructure Assistance for Mega Projects Under the Maharashtra Industrial
Policy of 2013 and Other SGOM Industrial Promotion Policies to Support Mega Projects
2. Subsidies for Mega Projects under the Package Scheme of Incentives
Alleged sales at LTFV
On March 19, 2019, Commerce published a notice in the Federal Register of the initiation of its antidumping duty investigations on threaded rod from China, India, Taiwan, and Thailand.24 Commerce has initiated antidumping duty investigations based on the following estimated dumping margins:
Country Estimated dumping margin
(percent)
China 57.36 to 59.45
India 25.43 to 28.34
Taiwan 32.26
Thailand 20.83
24 Carbon and Alloy Steel Threaded Rod From India, Taiwan, Thailand, and the People's Republic of China: Initiation of Less‐Than‐Fair‐Value Investigations, 84 FR 10034, March 19, 2019.

I‐9
THE SUBJECT MERCHANDISE
Commerce’s scope
In the current proceeding, Commerce has defined the scope as follows:25 The merchandise covered by the scope of these investigations is carbon and alloy steel threaded rod. Steel threaded rod is certain threaded rod, bar, or studs, of carbon or alloy steel, having a solid, circular cross section of any diameter, in any straight length. Steel threaded rod is normally drawn, cold‐rolled, threaded, and straightened, or it may be hot‐rolled. In addition, the steel threaded rod, bar, or studs subject to these investigations are non‐headed and threaded along greater than 25 percent of their total actual length. A variety of finishes or coatings, such as plain oil finish as a temporary rust protectant, zinc coating (i.e., galvanized, whether by electroplating or hot‐dipping), paint, and other similar finishes and coatings, may be applied to the merchandise. Steel threaded rod is normally produced to American Society for Testing and Materials (ASTM) specifications ASTM A36, ASTM A193 B7/B7m, ASTM A193 B16, ASTM A307, ASTM A329 L7/L7M, ASTM A320 L43, ASTM A354 BC and BD, ASTM A449, ASTM F1554‐36, ASTM F1554‐55, ASTM F1554 Grade 105, American Society of Mechanical Engineers (ASME) specification ASME B18.31.3, and American Petroleum Institute (API) specification API 20E. All steel threaded rod meeting the physical description set forth above is covered by the scope of these investigations, whether or not produced according to a particular standard. Subject merchandise includes material matching the above description that has been Start Printed Page 10040finished, assembled, or packaged in a third country, including by cutting, chamfering, coating, or painting the threaded rod, by attaching the threaded rod to, or packaging it with, another product, or any other finishing, assembly, or packaging operation that would not otherwise remove the merchandise from the scope of the investigations if performed in the country of manufacture of the threaded rod.
Carbon and alloy steel threaded rod are also included in the scope of these investigations whether or not imported attached to, or in conjunction with, other parts and accessories such as nuts and washers. If carbon and alloy steel threaded rod are imported attached to, or in conjunction with, such non‐subject merchandise, only the threaded rod is included in the scope.
Excluded from the scope of these investigations are: (1) Threaded rod, bar, or studs which are threaded only on one or both ends and the threading covers 25 percent or
25 Ibid.

I‐10
less of the total actual length; and (2) stainless steel threaded rod, defined as steel threaded rod containing, by weight, 1.2 percent or less of carbon and 10.5 percent or more of chromium, with or without other elements.
Excluded from the scope of the antidumping investigation on steel threaded rod from the People's Republic of China is any merchandise covered by the existing antidumping order on Certain Steel Threaded Rod from the People's Republic of China. See Certain Steel Threaded Rod from the People's Republic of China: Notice of Antidumping Duty Order, 74 FR 17154 (April 14, 2009).
Steel threaded rod is currently classifiable under subheadings 7318.15.5051, 7318.15.5056, and 7318.15.5090 of the Harmonized Tariff Schedule of the United States (HTSUS). Subject merchandise may also enter under subheading 7318.15.2095 and 7318.19.0000 of the HTSUS. The HTSUS subheadings are provided for convenience and U.S. Customs purposes only. The written description of the scope is dispositive.
Tariff treatment
Based upon the scope set forth by the Department of Commerce, information available to the Commission indicates that the merchandise subject to these proceedings may enter under the following statistical reporting numbers of the 2018 Harmonized Tariff Schedule of the United States (“HTS”): 7318.15.5051,26 7318.15.5056,27 7318.15.5090,28 7318.15.2095,29 and 7318.19.0000.30 As discussed in Part IV of this report, more than 95 percent of reported imports of threaded rod are continuously threaded, and thus provided for in HTS statistical reporting numbers 7318.15.5051 and 7318.15.5056.
Threaded rod imported under the applicable subheadings is accorded a column‐1 general duty rate of “free” for all subheadings with the exception of subject threaded rod which is imported under 7318.19.0000, which is accorded a column‐1 general duty rate of 5.7 percent. As previously discussed in this report, threaded rod imported from China is subject to a 10
26 Screws and bolts, whether or not with their nuts or washers; studs; other than stainless steel; continuously threaded rod; of alloy steel.
27 Screws and bolts, whether or not with their nuts or washers; studs; other than stainless steel; continuously threaded rod; other than alloy steel.
28 Screws and bolts, whether or not with their nuts or washers; studs; other than stainless steel; other than continuously threaded rod.
29 Screws and bolts, whether or not with their nuts or washers; bolts and bolts and their nuts or washers entered or exported in the same shipment; having shanks or threads with a diameter of 6 mm or more; other than track bolts, structural bolts, and bent bolts; other than with round heads and hexagonal heads; other than stainless steel.
30 Threaded rod articles other than: coach screws; other wood screws; screw hooks and screw rings; self‐tapping screws; other screws and bolts, whether or note with their nuts or washers; and nuts.

I‐11
percent ad valorem duty under Section 301 of the Trade Act of 1974.31 Decisions on the tariff classification and treatment of imported goods are within the authority of U.S. Customs and Border Protection.
THE PRODUCT32
Description and applications
Threaded rod is generally threaded along its entire length and is produced from low
carbon, medium carbon, or alloy steel wire rod or bar.33 Threaded rod is primarily used in commercial (non‐residential) construction to suspend electrical conduits; pipes for plumbing; heating, ventilation, and air‐conditioning (HVAC) ductwork; and sprinkler systems for fire protection, among other applications. Normally, one end of the threaded rod is fastened to the ceiling and the other end is fastened to the support for suspending the conduits, pipes, ductwork, or sprinkler system. Threaded rod is also used for hanging suspended ceilings and elevated conveyor belts, and for joint restraint systems for underground piping. It is also used in structural tie downs in earthquake‐ and hurricane‐restraint systems for roofing. Threaded rod can also be used as a headless screw in general fastener applications or for bolting together pipe joints.
Threaded rod subject to these investigations is normally produced to American Society for Testing and Materials (“ASTM”) specifications ASTM A36,34 ASTM A193 B7/B7m, ASTM 193 B16,35 ASTM A307,36 ASTM A320 L7/L7M, ASTM A320 L43,37 ASTM A354 BC and BD,38 ASTM
31 Notice of Modification of Section 301 Action: China’s Acts, Policies, and Practices Related to Technology Transfer, Intellectual Property, and Innovation, 83 FR 47974, September 21, 2018.
32 Unless otherwise specified, information on the subject product and its applications is derived from the petition and/or Steel Threaded Rod from China, Inv. No. 731‐TA‐1145 (Review), USITC Publication 4483, August 2014, pp. I‐5‐6.
33 Low carbon steel is generally classified as having as composition of 0.05 percent‐0.25 percent carbon and up to 0.4 percent manganese. This type of steel is softer and easier to form and fabricate, while steels with a higher level of carbon are harder and stronger, but more difficult to machine and weld. Medium carbon steel has a composition of 0.29 percent ‐0.54 percent carbon, with 0.60 percent‐1.65 percent manganese. Medium carbon steel is ductile and strong, with long‐wearing properties. O’Neal Steel, “Carbon and Alloy Steel,” https://www.onealsteel.com/carbon‐and‐alloy‐steel.html, (accessed March 18, 2019).
34 This is the standard specification for carbon structural steel. ASTM International, ASTM A36/A36‐05,” https://www.astm.org/DATABASE.CART/HISTORICAL/A36A36M‐05.htm, (accessed March 22, 2019).
35 ASTM A193 specifications generally cover alloy and stainless steel bolting intended for high‐temperature or high pressure service and other special purpose applications. ASTM International, “ASTM A193 / A193M – 17,” https://www.astm.org/Standards/A193.htm, (accessed March 22, 2019).
36 Standard specification for carbon steel bolts, studs, and threaded rod 60,000 PSI tensile strength. ASTM International, “A307‐14e1,” https://www.astm.org/Standards/A307.htm, (accessed March 22, 2019).

I‐12
A449,39 ASTM F l 554‐36, ASTM F1554‐55, ASTM F1554 Grade 105,40 American Society of Mechanical Engineers ("ASME") specification ASME B18.31.3,41 and American Petroleum Institute ("API") specification API 20E.42
Manufacturing processes43
Threaded rod is produced from carbon and alloy steel wire rod (in the form of coils), or
from steel bar for applications that require a larger diameter.44 Regardless of whether steel wire rod or bar is used, the production process is the same. The manufacturing process begins with the removal of surface scale (descaling) on the wire rod or bar. The descaling process facilitates the manufacturing process by removing unwanted surface deposits on the steel.45 The wire rod or bar is then cold‐drawn through a series of dies, each one smaller than the preceding one, to reduce the rod or bar diameter to the required size. The wire rod or bar is then straightened and cut to length. Together, these processes ensure that the rod is round and has the final diameter desired by the customer. Next, the rod sections are fed through a threading machine, which forms the threaded grooves along the entire length, or only part of the length, by rolling the rod between a pair of grooved dies (i.e. thread rolling).
(…continued)
37 A320 standard specifications generally apply to alloy and stainless steel bolting for low‐temperature services. ASTM International, “ASTM A320 / A320M – 18,” https://www.astm.org/Standards/A320.htm, (accessed March 22, 2019).
38 A354 standard specifications generally apply to quenched and tempered alloy steel bolts, studs, and other externally threaded fasteners. ASTM International, “ASTM A354 ‐ 17e2,” https://www.astm.org/Standards/A354.htm, (accessed March 22, 2019).
39 A449 standard specification applies to hex cap screws, bolts and studs, steel, heat treated, 120/105/90 ksi minimum tensile strength, general use. ASTM International, “ASTM A449 – 14,” https://www.astm.org/Standards/A449.htm, (accessed March 22, 2019).
40 F1554 standard specifications apply to anchor bolts, steel, 36, 55, and 105‐ksi yield strength. 41 ASME standard specification for square, hex, heavy hex, and askew head bolts. Also covers hex,
heavy hex, hex flange, lobed head, and lag screws. ASME, “B18.2.1‐2012,” https://www.asme.org/products/codes‐standards/b1821‐2012‐square‐hex‐heavy‐hex‐askew‐head‐bol‐(1), (accessed March 22, 2019).
42 API SPEC 20E covers alloy and carbon steel bolting used in the petroleum and natural gas industries. Techstreet, “API SPEC 20E,” https://www.techstreet.com/standards/api‐spec‐20e?product_id=1944354, (accessed March 22, 2019).
43 Unless otherwise specified, information on the subject product and its applications is derived from the petition and/or Steel Threaded Rod from China, Inv. No. 731‐TA‐1145 (Review), USITC Publication 4483, August 2014, pp. I‐5‐6.
44 Domestic producers produce threaded rod in a variety of diameters and use both steel wire rod and bar as major inputs. Conference transcript, p. 68 (Logan); p. 69 (Gross).
45 AZO Materials, “Descaling – Metallurgical Processes,” August 23, 2013, https://www.azom.com/article.aspx?ArticleID=9626, (accessed March 14, 2019).

I‐13
Certain threaded rod can be heat‐treated46 either before or after it is threaded. Depending on the intended end use of the final product, threaded rod can also be coated with a plain oil finish during the threading process, or it is galvanized using either a zinc plating47 or a hot‐dip galvanizing48 process, or coated with other finishes such as point or epoxy coatings—all processes which impart corrosion resistance.49 Once the final coating or plating has been applied, the threaded rod is then packaged in cardboard tubes, or in bundles if it is sold in larger quantities.50 One producer noted that threaded rod can also be sold in burlap wrap, which is preferred by certain customers in the western United States because it creates little to no dunnage.51
46 Heat treatment is a process by which metal is heated (or cooled) to change its microstructure, thereby enhancing certain physical and mechanical characteristics. Heat treating is commonly used to improve strength, hardness, and corrosion resistance. Ryan Wojes, “What Happens When Metals Undergo Heat Treatment?” The Balance, February 6, 2019, https://www.thebalance.com/what‐happens‐when‐metals‐undergo‐heat‐treatment‐2340016. The petitioner indicated that alloy steel is more commonly heat‐treated. Conference transcript, p. 38 (Jenkins).
47 Zinc plating is a process used to protect iron and steel product against corrosion. It involves the electrodeposition of a thin coating of zinc metal onto the surface of the product. This coating creates a barrier that prevents rusting on the underlying metal. Sharrett Plating, “The Zinc Plating Process,” https://www.sharrettsplating.com/blog/the‐zinc‐plating‐process/, (accessed March 28, 2019).
48 Hot‐dip galvanizing is a process by which fabricated steel is dipped into a kettle or vat containing molten zinc. During this process, the steel reacts with molten zinc to produce a tightly‐bonded alloy coating that enhances the corrosion resistance abilities of the steel. American Galvanizers Association, “What is Galvanizing,” https://galvanizeit.org/hot‐dip‐galvanizing/what‐is‐galvanizing, (accessed March 14, 2019).
49 Petitioners indicated that the vast majority of domestically‐produced threaded rod is zinc electroplated, while hot‐dipped galvanized accounts for a smaller share of domestic production (approximately seven to ten percent for the petitioner). Conference transcript, p. 39 (Jenkins).
50 Conference transcript, p. 47‐48 (Logan). 51 Dunnage generally refers to packaging components such as boards, blocks, planks, metal, or plastic
bracing used to support and secure products while they are being shipped and handled. Universal Packaging, “What is Dunnage,” September 20, 2017, https://www.universalpackage.com/universal‐package‐blog/what‐is‐dunnage; Conference transcript, p. 49 (Gross).

I‐14
DOMESTIC LIKE PRODUCT ISSUES
No issues with respect to domestic like product have been raised in these investigations. The petitioner proposes a single domestic like product consisting of threaded rod, co‐extensive with the scope in these investigations.52 No other interested party commented on the definition of the domestic like product.53
52 Petitioner’s postconference brief, p. 1. 53 A representative from Ying Ming Industry Co., Ltd., a Taiwan producer/exporter of threaded rod,
testified that the products it manufactures and exports to the United States are specialized double‐ended studs used in the automobile industry, mainly for transmissions and engines, and are not covered by the scope of the investigation. Conference transcript, pp. 90‐91 (Liu). In addition, a representative of the Taipei Economic and Cultural Representative Office testified that products from Taiwan differ from the U.S. product in terms of production processes, physical characteristics, end uses, and interchangeability, and therefore imports from Taiwan should be excluded from the scope of the investigation. Conference transcript, p. 8 (Tsai).

II-1
PART II: SUPPLY AND DEMAND INFORMATION
U.S. MARKET CHARACTERISTICS
Threaded rod has a variety of applications and uses, though its primary uses are in construction to suspend electrical conduit, pipes, HVAC-ductwork, sprinkler systems for fire protection, and other items. In such applications, one end of the threaded rod is normally fastened to the ceiling and the other end is fastened to the support for suspending pipes, ductworks, sprinkler systems, or other items. Threaded rod may also be used for hanging suspended ceilings and elevated conveyor belts, and for joint restraint systems for underground piping. It is also used in structural tie downs in earthquake- and hurricane-restraint systems for roofing. Threaded rod may also be used as headless screws in general fastener applications or for bolting pipe joints together.1
Threaded rod is manufactured in various diameters and lengths, and is produced primarily from carbon or alloy steel wire rod or steel bar (for larger diameters). Threaded rod can be finished with plain oil, galvanized using either zinc plating or a hot-dip galvanized process, or coated with other finishes such as paint or epoxy coatings.2
CHANNELS OF DISTRIBUTION
The large majority of U.S. producers sell threaded rod to distributers. Importers sell the majority of threaded from China, India, Taiwan, and Thailand to distributors (table II-1). Importers report selling the majority of nonsubject threaded rod to end users. As nonsubject threaded rod makes up a small percentage of the U.S. market, however, the majority of threaded rod sold in the U.S. market is sold through distributors.
1 Petition, Volume I, p. 7. 2 Petition, Volume I, p. 7.

II-2
Table II-1 Threaded rod: U.S. producers’ and importers’ U.S. shipments, by sources and channels of distribution, 2016-18
Item Calendar year
2016 2017 2018 Share of U.S. shipments (percent) U.S. producers: to Distributors 97.9 98.2 98.6 to End users 2.1 1.8 1.4 U.S. importers: China to Distributors *** *** ***
to End users *** *** *** U.S. importers: India to Distributors *** *** ***
to End users *** *** *** U.S. importers: Taiwan to Distributors *** *** ***
to End users *** *** *** U.S. importers: Thailand to Distributors *** *** ***
to End users *** *** *** U.S. importers: Subject to Distributors 82.9 84.8 82.9
to End users 17.1 15.2 17.1 U.S. importers: Nonsubject to Distributors *** *** ***
to End users *** *** *** U.S. importers: All sources: to Distributors *** *** ***
to End users *** *** *** Source: Compiled from data submitted in response to Commission questionnaires.
GEOGRAPHIC DISTRIBUTION
A plurality of responding U.S. producers reported selling threaded rod to all regions of the contiguous United States (table II-2). A plurality of the responding importers of threaded rod reported selling their threaded rod to all regions of the United States. Responding U.S. producers reported shipping *** percent of threaded rod within 100 miles of their production facilities, *** percent between 101 and 1000 miles, and *** percent over 1,000 miles. Importers of threaded rod from China, India, Taiwan, and/or Thailand reported shipping *** percent of their product within 100 miles of their points of shipment, *** percent between 101 and 1,000 miles, and *** percent over 1,000 miles.

II-3
Table II-2 Threaded rod: Geographic market areas in the United States served by U.S. producers and importers, by number of responding firms
Region U.S.
producers Subject U.S.
importers Northeast 5 25 Midwest 6 26 Southeast 6 28 Central Southwest 6 23 Mountains 5 19 Pacific Coast 6 25 Other1 4 11 All regions (except Other) 4 16 Reporting firms 7 39
1All other U.S. markets, including AK, HI, PR, and VI. Source: Compiled from data submitted in response to Commission questionnaires.
SUPPLY AND DEMAND CONSIDERATIONS
U.S. supply
Table II-3 provides a summary of the supply factors regarding threaded rod from the United States, India, and Taiwan. Table II-3
Threaded rod: U.S. and foreign industry factors that the affect ability to increase shipments to the United States
Item
2016 2018 2016 2018 2016 2018
Shipments by market in 2018
(percent)
Able to shift to alternate
products
Capacity (1,000 pounds)
Capacity utilization (percent)
Inventories as a ratio to total
shipments (percent)
Home market
shipments
Exports to non-U.S. markets
No. of firms reporting
“yes” United States 263,665 247,163 50.1 58.8 *** *** *** *** 5 of 7 China --- --- --- --- --- --- --- --- 0 of 0 India *** *** *** *** *** *** *** *** 1 of 4 Taiwan *** *** *** *** *** *** *** *** 1 of 4 Thailand --- --- --- --- --- --- --- --- 0 of 0
Note.--The Commission did not receive questionnaire responses from producers of threaded rod in China or Taiwan. For more information on the industry in these countries see Part VII. Source: Compiled from data submitted in response to Commission questionnaires.

II-4
Domestic production
Based on available information, U.S. producers of threaded rod have the ability to respond to changes in demand with moderate-to-large changes in the quantity of shipments of U.S.-produced threaded rod to the U.S. market. The main contributing factors to this level of responsiveness of supply are the availability of unused capacity, some inventories, and the ability to switch production from other products to threaded rod. A limited amount of non-U.S. exports may mitigate U.S. producers’ ability to respond to changes in demand with shipments from these other markets.
Domestic capacity to produce threaded rod decreased by 6.3 percent from 2016 to 2018 (table II-3). Domestic capacity utilization increased by 8.7 percentage points during this time, from 50.1 percent in 2016 to 58.8 percent in 2018. This moderate level of capacity utilization suggests that U.S. producers may have the ability to increase production of threaded rod in response to an increase in prices. U.S. producers' inventories were *** percent of total shipments in 2016 and *** percent of total shipments in 2018. These inventory levels indicate that U.S. producers have the ability to respond to changes in demand with quantity shipped from inventories. U.S. producers exported *** percent of their total shipments of threaded rod in 2018, suggesting that they have *** ability to divert shipments to the U.S. market away from foreign markets in response to price changes. The majority of responding U.S. producers stated that they could switch production from other products to threaded rod. U.S. producers reportedly can produce a variety of products, including but not limited to anchor bolts, u-bolts, and headed bolts. U.S. producers reported that the factors affecting their ability to shift production from alternate products include time and labor costs, and lack of a skilled work force. Subject imports from India
Based on the available information, Indian producers of threaded rod have a moderate ability to respond to changes in demand with changes in the quantity of shipments of threaded rod to the U.S. market. The main contributing factors to this are moderate capacity utilization rates, the availability of some inventories, and the low percentage of exports that Indian producers send to markets other than the United States. One mitigating factor to this level of responsiveness is a limited ability to switch production from other products to threaded rod.
Capacity utilization for responding Indian producers decreased from *** percent in 2016 to *** percent 2018, while their total production capacity increased by *** percent during this time. This moderate level of capacity utilization suggests that Indian producers may have some ability to increase production of threaded rod in response to an increase in prices. Indian producers’ inventories increased from *** percent of total shipments in 2016 to *** percent of total shipments in 2018. These inventories levels suggest that Indian producers have a low ability to respond to changes demand with quantities of threaded rod shipped from inventories. As a share of their total shipments, Indian producers shipped *** percent of their product to export markets other than the United States in 2018. Shipments to their home market accounted for *** percent of Indian producers’ shipments in 2018. This indicates that Indian producers have a low ability to divert shipments to the U.S. market in response to

II-5
increased prices. The majority of responding Indian producers indicated that they did not produce any other products on the same machinery or equipment as threaded wire rod, which would limit Indian producers’ ability to respond to changes in the price of threaded rod by transferring production from alternate products. The Indian producer that did report being able to produce other products on the same machinery as threaded rod reported producing nut bolts and washers, tie rods, anchor bolts, and HDG truss rods. Subject imports from Taiwan
Based on the available information, producers of threaded rod in Taiwan have a moderate ability to respond to changes in demand with changes in the quantity of threaded rod shipped to the U.S. market. The main contributing factors to this are the availability of some unused production capacity, some inventories, and the high percentage of exports that producers in Taiwan send to markets other than the United States. A mitigating factor to this level of responsiveness is a limited ability to shift production from alternate products to threaded rod.
Capacity utilization for responding producers in Taiwan increased from *** percent in 2016 to *** percent 2018. Reporting producers’ total production capacity decrease by *** percent between 2016 and 2018. This level of capacity utilization suggests that producers in Taiwan have a moderate capacity to increase production of threaded rod in response to increase prices. Taiwan producers’ inventories as a ratio of total shipments increased from *** in 2016 to *** percent in 2018, suggesting that they may have some limited ability to respond to changes in demand with increased quantities shipped from inventories. As a share of their total shipments, producers of threaded rod in Taiwan shipped *** percent of their product to export markets other than the United States in 2018, and *** percent to their home market. This indicates that producers in Taiwan have a small ability to divert shipments to the U.S. market in response to increased prices. The majority of responding producers from Taiwan indicated that they did not produce any other products on the same machinery or equipment as threaded rod, which may limit their ability to respond to changes in the price of threaded rod with an increase in the production of alternate products. The producers that did report having the ability to produce other products on the same machinery as threaded rod listed custom auto parts as the product that they are able to produce.
Nonsubject imports
Nonsubject imports decreased from 2016 to 2018 in terms of both value and quantity. In 2016, nonsubject imports as a share of apparent U.S. consumption represented 3.9 of the U.S. market in terms of quantity and 7.6 percent of the U.S. market in terms of value. In 2018, nonsubject imports were 2.5 percent of the U.S. market in terms of quantity and 4.7 percent of the U.S. market in terms of value.

II-6
Supply constraints
The majority of U.S. producers and importers did not report any supply constraints. Those U.S. producers and importers that did report supply constraints indicated that it was caused by raw material price increases or increased lead times in supply lines.
U.S. demand
Based on available information, the overall demand for threaded rod is likely to experience relatively small changes in response to changes in price. Petitioners identified commercial construction as the primary use for threaded rod.3 The main contributing factors are the limited availability substitutes and the relatively small cost share of threaded rod in the most common end-use products, though this varies considerably across end-use and the type of end product (e.g., sprinkler system vs. commercial building).
End uses and cost shares
U.S. demand for threaded rod depends on the demand for U.S.-produced downstream products. Reported end uses include commercial construction; hanging of pipe, sprinkler systems, conduit, electrical, lights, struts, and HVAC units; joint restraint systems for underground piping; tie downs and fastening; concrete anchors; and general framing and anchoring.4
A plurality of firms did not estimate cost shares with associated end uses, with some noting that the information was “unknown” or that they were distributors/wholesalers and so could not estimate accurately. Of the identified end uses, threaded rod accounted for a highly variable share of the cost of the end-use products in which it is used. Some reported end uses and cost shares were as follows: construction and pipe hanging (1 to 14 percent); swimming pools (1 percent); caster wheel assembly (20 percent); marine fender system (2 percent); embedded anchor bolts (75 percent); and anchor studs and bolts for building foundations (1 percent).
Business cycles
Five of seven responding U.S. producers and the majority of responding importers indicated that the market was not subject to business cycles or conditions of competition. U.S. producers and importers that reported that the threaded rod market was subject to business cycles indicated that the market follows the construction market and the oil and gas production market. These U.S. producers and importers reported that demand for threaded rod decreases in the winter months when construction projects slow and increases in summer, spring, and fall when construction projects are underway.
3 Petitioner’s Postconference Brief, p. 4. 4 Petition, Volume I, p. 7.

II-7
Demand trends
Overall demand for threaded rod depends on the demand for its end uses, of which most are connected to nonresidential/commercial construction activity. Private nonresidential construction spending increased by almost 13.8 percent between January 2016 and December 2018 (see figure II-1).
Figure II-1 Construction spending: Private nonresidential construction spending (seasonally adjusted, annual rate), monthly, January 2016-December 2018
Source: U.S. Census Bureau at https://www.census.gov/construction/c30/c30index.html, retrieved March 6, 2019.
Most U.S. producers indicated that demand in the United States for threaded rod has increased since January 2016 (see table II-4). U.S. producers reported that the increase in demand was due to an increase in the number of new construction projects which they associated with the growth of the U.S. economy or increase in the number of oil and gas production projects due to higher crude oil and natural gas prices. An equal number of responding importers indicated that demand in the United States increased and fluctuated since January 2016. Importers reported that the increase in demand was due to increases in the number of construction projects and expanding productions in oil production.
0
50
100
150
200
250
300
350
400
450
500
Billi
ons o
f dol
lars

II-8
Table II-4 Threaded rod: Firms’ perceptions regarding demand in the United States and outside of the United States
Item Number of firms reporting
Increase No change Decrease Fluctuate Demand inside the United States: U.S. producers 5 2 --- ---
Importers 13 10 3 13 Demand outside the United States: U.S. producers 1 1 --- ---
Importers 5 8 1 8 Source: Compiled from data submitted in response to Commission questionnaires.
Substitute products
All responding U.S. producers and almost all U.S. importers (43 of 44) indicated that there were no substitutes for threaded rod. The one importer that indicated that there were substitutes for threaded rod (***) reported that bolts could be substituted for threaded rod in wooden construction.
Section 301 tariffs, section 232 tariffs, and antidumping and countervailing duty orders
U.S. producers and importers were asked to report the impact of 301 tariffs, 232 tariffs, or antidumping and countervailing duty orders on wire rod. Firms were asked if the impact had been in overall demand, supply, price, or raw material cost (table II-5).

II-9
Table II-5 Threaded rod: Number of firms reporting that the section 232, section 301, or wire rod AD/CVD orders had caused changes in the market, by order and type of change
Type of Change
U.S. producers U.S. importers
Increase No
change Decrease Fluctuate Increase No
change Decrease Fluctuate Section 232
Overall demand in U.S. market 3 2 1 1 3 15 2 8 Supply in U.S. market 1 4 1 1 0 18 2 7 Prices in U.S. market 4 1 1 1 10 9 1 6 Raw material costs in U.S. market 5 1 1 0 9 10 1 6
Section 301 Overall demand in U.S. market 1 4 1 1 0 16 2 10 Supply in U.S. market 0 5 1 1 0 17 2 8 Prices in U.S. market 2 4 1 0 10 8 1 7 Raw material costs in U.S. market 2 4 1 0 7 8 1 9
AD/CVD orders on wire rod Overall demand in U.S. market 2 3 0 0 1 9 1 8 Supply in U.S. market 0 3 0 0 0 9 2 7 Prices in U.S. market 1 3 0 0 3 7 1 6 Raw material costs in U.S. market 3 2 0 0 3 6 1 6
Source: Compiled from data submitted in response to Commission questionnaires.
The petitioners reported that while some raw material cost increases could be attributed to normal market factors, the “additional 25 percent tariffs for many imports of steel and steel products including wire rod and steel bar from most countries” has increased raw material costs and “made the domestic industry more vulnerable to injury.”5 Importer (***) reported that the tariffs on European steel had a significant impact on the market, and that it had passed on the increase in price of the tariff on to its customers. However, importers *** and *** report absorbing addition costs as a result of the tariffs.
SUBSTITUTABILITY ISSUES
The degree of substitution between domestic and imported threaded rod depends upon such factors as relative prices, quality (e.g., grade standards, reliability of supply, defect rates, etc.), and conditions of sale (e.g., price discounts/rebates, lead times between order and delivery dates, payment terms, product services, etc.). Based on available data, staff believes
5 Petitioner’s Postconference Brief, p. 6.

II-10
that there is high degree of substitutability between domestically produced threaded rod and threaded rod imported from subject sources.
Lead times
U.S. producers reported that 79.4 percent of their sales were from inventories and 20.6 percent were produced-to-order. When sourced from inventories, most responding U.S. producers reported lead times between a customer’s order and date of delivery ranging from 2 to 4 days, with an average of 3.4 days. For produced-to-order threaded rod, U.S. producers reported lead times ranging from 10 to 21 days, with an average of 17.5 days. The majority of U.S. producers (4 of 7) reported that their customers usually arrange transportation.
Importers reported sourcing 84.7 percent of sales from U.S. inventories, 14.4 percent from foreign inventories, and producing 0.9 percent to order. When threaded rod is sourced from their U.S. inventories, importers reported lead times of between 1 and 180 days, with an average of 27 days. For product sourced from foreign manufacturers’ inventories, importers reported lead times ranging from 70 to 180 days, with an average of 85 days. For produced-to- order product, importers reported lead times ranging from 80 to 250 days, with an average of 104 days. The majority of importers reported arranging for transportation to their customers.
Factors affecting purchasing decisions
Purchasers responding to lost sales lost revenue questionnaires were asked to identify the main purchasing factors their firm considered in their purchasing decisions for threaded rod. All responding purchasers reported that price was a main factor in their purchasing decisions. A majority of responding purchasers also reported that quality and availability were important factors in their purchasing decision. One responding purchaser reported that country origin was not important in their purchasing decision or to their customer base.
Comparison of U.S.-produced and imported threaded rod
When comparing threaded rod from the United States, China, India, Taiwan, Thailand, and nonsubject countries, the majority of U.S. producers and importers reported that they are “always” or “frequently” interchangeable (table II-6). Importers *** reported that government regulations and customer requirements limit the interchangeability of threaded rod.

II-11
Table II-6 Threaded rod: Interchangeability between threaded rod produced in the United States and in other countries, by country pair
Country pair U.S. producers U.S. importers
A F S N A F S N United States vs. China 3 4 --- --- 13 10 6 --- United States vs. India 2 3 --- --- 13 8 6 1 United States vs. Taiwan 2 2 --- --- 6 5 3 1 United States vs. Thailand 2 2 --- --- 3 6 3 1 China vs. India 1 1 --- --- 7 1 5 2 China vs. Taiwan 1 1 --- --- 6 1 2 2 China vs. Thailand 1 1 --- --- 6 1 2 2 India vs. Taiwan 1 1 --- --- 6 1 3 1 India vs. Thailand 1 1 --- --- 6 1 3 1 Taiwan vs. Thailand 1 1 --- --- 7 1 2 1 United States vs. Nonsubject 1 2 --- --- 4 6 4 --- China vs. Nonsubject 1 --- --- --- 8 1 2 --- India vs. Nonsubject 1 --- --- --- 8 --- 2 --- Taiwan vs. Nonsubject 1 --- --- --- 7 --- 1 --- Thailand vs. Nonsubject 1 --- --- --- 7 --- 1 ---
Note.—A=Always, F=Frequently, S=Sometimes, N=Never. Source: Compiled from data submitted in response to Commission questionnaires.
When comparing threaded rod from the United States, China, India, Taiwan, Thailand, and nonsubject countries on factors other than price, the majority of U.S. producers reported that factors other than price are “sometimes” significant. An equal number of U.S. producers reported that factors other than price are “always” and “sometimes” significant when comparing threaded rod from Thailand and the United States. An equal number of U.S. producers reported that factors other than price are “always” and “sometimes” significant when comparing product from China, India, Taiwan, Thailand, and nonsubject countries. Importers reported that factors other than price are “sometimes” significant when comparing threaded rod from the United States and threaded rod from China, India, Taiwan, Thailand, and nonsubject countries. Importers reported factors other than price are “never” significant when comparing threaded rod from nonsubject countries and threaded rod from China, India, Taiwan, and Thailand. Importers reported that factors other than price are “sometimes” significant when comparing threaded rod from India and threaded rod from Taiwan, Thailand, and nonsubject countries. A plurality of importers reported that factors other than price are “never” significant when comparing Thai threaded rod and threaded rod from China and Taiwan. Importer *** reported that quality for producer to producer can vary widely and is therefore a significant factor in their sourcing decisions.

II-12
Table II-7 Threaded rod: Significance of differences other than price between threaded rod produced in the United States and in other countries, by country pair
Country pair U.S. producers U.S. importers
A F S N A F S N United States vs. China 1 --- 5 1 3 6 9 7 United States vs. India 2 --- 3 --- 1 5 13 9 United States vs. Taiwan 2 --- 2 --- --- 4 6 3 United States vs. Thailand 2 --- 2 --- --- 2 5 4 China vs. India 1 --- 1 --- 3 1 7 3 China vs. Taiwan 1 --- 1 --- 3 --- 5 3 China vs. Thailand 1 --- 1 --- 3 --- 3 4 India vs. Taiwan 1 --- 1 --- 3 --- 5 3 India vs. Thailand 1 --- 1 --- 3 --- 4 3 Taiwan vs. Thailand 1 --- 1 --- 3 --- 3 4 United States vs. Nonsubject 1 --- 2 --- --- 3 7 3 China vs. Nonsubject 1 --- --- --- 3 1 3 4 India vs. Nonsubject 1 --- --- --- 3 --- 4 4 Taiwan vs. Nonsubject 1 --- --- --- 3 --- 2 4 Thailand vs. Nonsubject 1 --- --- --- 3 --- 2 4
Note.—A=Always, F=Frequently, S=Sometimes, N=Never.
Source: Compiled from data submitted in response to Commission questionnaires

III‐1
PART III: U.S. PRODUCERS’ PRODUCTION, SHIPMENTS, AND EMPLOYMENT
The Commission analyzes a number of factors in making injury determinations (see 19 U.S.C. §§ 1677(7)(B) and 1677(7)(C)). Information on the alleged subsidies and dumping margins was presented in Part I of this report and information on the volume and pricing of imports of the subject merchandise is presented in Part IV and Part V. Information on the other factors specified is presented in this section and/or Part VI and (except as noted) is based on the questionnaire responses of seven firms that accounted for the vast majority of U.S. production of threaded rod during 2018.
U.S. PRODUCERS
The Commission issued a U.S. producer questionnaire to nine firms based on
information contained in the petition. Seven firms provided usable data on their productive operations. Staff believes that these responses represent the vast majority of U.S. production of threaded rod.1
Table III‐1 lists U.S. producers of threaded rod, their production locations, positions on the petition, and shares of total production. Table III-1 Threaded rod: U.S. producers of threaded rod, their positions on the petition, production locations, and shares of reported production, 2018
Firm Position on petition Production location(s)
Share of production (percent)
Acme Manufacturing *** Denver, CO Lancaster, PA ***
All Ohio *** Cleveland, OH *** Alloy & Stainless *** Houston, TX *** All-Pro *** Arlington, TX *** Bay Standard *** Brentwood, CA *** Highland *** Houston, TX *** Vulcan Petitioner Pelham, AL ***
Total *** Source: Compiled from data submitted in response to Commission questionnaires.
Table III‐2 presents information on U.S. producers’ ownership, related and/or affiliated firms of threaded rod.
1 *** did not respond to the Commission’s questionnaire.

III‐2
Table III-2 Threaded rod: U.S. producers’ ownership, related and/or affiliated firms
As indicated in table III‐2, no U.S. producers are related to foreign producers of the subject merchandise, although *** are related to U.S. importers of the subject merchandise. In addition, as discussed in greater detail below, four U.S. producers directly import the subject merchandise and one purchases the subject merchandise from U.S. importers.
Table III‐3 presents U.S. producers’ reported changes in operations since January 1, 2016. Petitioner Vulcan reported that it purchased all of the major equipment and assets of Acme’s Indianapolis, Indiana facility in August 2017. Vulcan indicated that it had planned to install this equipment to increase its production but could not meet its forecasted production levels due to low‐priced subject imports. This equipment is currently in storage.2
Table III-3 Threaded rod: U.S. producers’ reported changes in operations, since January 1, 2016
* * * * * * *
U.S. PRODUCTION, CAPACITY, AND CAPACITY UTILIZATION
Table III‐4 and figure III‐1 present U.S. producers’ production, capacity, and capacity utilization. Domestic producers’ threaded rod production increased by 9.9 percent during 2016‐18, while capacity decreased by 6.3 percent. The decrease in capacity reflects the *** by ***.
2 Conference transcript, pp. 15, 22, and 34 (Black, Logan, and Schagrin).

III‐3
Table III-4 Threaded rod: U.S. producers’ production, capacity, and capacity utilization, 2016-18
Item Calendar year
2016 2017 2018 Capacity (1,000 pounds) Acme Manufacturing *** *** *** All Ohio *** *** *** Alloy & Stainless *** *** *** All-Pro *** *** *** Bay *** *** *** Highland *** *** *** Vulcan *** *** ***
Total capacity 263,665 246,912 247,163 Production (1,000 pounds) Acme Manufacturing *** *** *** All Ohio *** *** *** Alloy & Stainless *** *** *** All-Pro *** *** *** Bay *** *** *** Highland *** *** *** Vulcan *** *** ***
Total production 132,121 137,671 145,235 Capacity utilization (percent) Acme Manufacturing *** *** *** All Ohio *** *** *** Alloy & Stainless *** *** *** All-Pro *** *** *** Bay *** *** *** Highland *** *** *** Vulcan *** *** ***
Average capacity utilization 50.1 55.8 58.8 Source: Compiled from data submitted in response to Commission questionnaires.

III‐4
Figure III-1 Threaded rod: U.S. producers’ production, capacity, and capacity utilization, 2016-18
Source: Compiled from data submitted in response to Commission questionnaires.
Constraints on capacity
Six of seven responding U.S. producers reported constraints in the manufacturing process. Constraints in the manufacturing process include available machinery, raw material availability, and a skilled workforce. *** reported the production of alternative products as a constraint on its threaded rod capacity. In addition, *** characterized low‐priced imports as a constraint on capacity.
Alternative products
As shown in table III‐5, the vast majority (more than 90 percent) of the product
produced during 2016‐18 by U.S. producers was threaded rod. Six of seven firms reported producing alternative products, including threaded rod of various metals such as aluminum, brass, copper, silicon bronze, and stainless steel, unthreaded rod, anchor bolts, headed bolts, u‐bolts, swag rods, and other specialty items.

III‐5
Table III-5 Threaded rod: U.S. producers’ overall plant capacity and production on the same equipment as subject production, 2016-18
Item Calendar year
2016 2017 2018 Quantity (1,000 pounds) Overall capacity 283,337 266,252 266,737
Production: Threaded rod 132,121 137,671 145,235
Out-of-scope production 13,826 14,127 13,402 Total production on same machinery 145,947 151,798 158,637
Ratios and shares (percent) Overall capacity utilization 51.5 57.0 59.5
Share of production: Threaded rod 90.5 90.7 91.6
Out-of-scope production 9.5 9.3 8.4 Total production on same machinery 100.0 100.0 100.0
Source: Compiled from data submitted in response to Commission questionnaires.
Firms were asked about their ability to switch production from threaded rod to other products. Machinery set‐up time, available tooling, cost, and a skilled workforce all impact producers’ ability to switch production. Petitioner Vulcan reported that it is easy to shift from carbon and alloy to stainless if it is the same diameters. However, Vulcan reported that the U.S. stainless steel threaded rod market is fairly small.3 Similarly, *** reported its ability to switch production is impacted by the significantly lower demand of other products that are supplied almost entirely by imports.
U.S. PRODUCERS’ U.S. SHIPMENTS AND EXPORTS
Table III‐6 presents U.S. producers’ U.S. shipments, export shipments, and total
shipments. U.S. shipments by quantity and value increased overall during 2016‐18, by 7.3 percent and 24.9 percent, respectively. Unit values increased by 16.4 percent during this period, from $0.73 per pound to $0.85 per pound. U.S. producers’ U.S. shipments accounted for the vast majority of total shipments (*** percent in 2018). Two of the seven responding firms, ***, reported export shipments. Exports decreased by *** percent between 2016 and 2018. *** was the only U.S. producer to report *** internal consumption. In addition, *** reported transfers to related firms, with *** accounting for the great majority.
3 Conference transcript, p. 32 (Logan).

III‐6
Table III-6 Threaded rod: U.S. producers’ U.S. shipments, exports shipments, and total shipments, 2016-18
Item Calendar year
2016 2017 2018 Quantity (1,000 pounds) U.S. shipments 131,586 140,794 141,212 Export shipments *** *** ***
Total shipments *** *** *** Value (1,000 dollars) U.S. shipments 96,221 105,808 120,164 Export shipments *** *** ***
Total shipments *** *** *** Unit value (dollars per pound) U.S. shipments 0.73 0.75 0.85 Export shipments *** *** ***
Total shipments *** *** *** Share of quantity (percent) U.S. shipments *** *** *** Export shipments *** *** ***
Total shipments 100.0 100.0 100.0 Share of value (percent) U.S. shipments *** *** *** Export shipments *** *** ***
Total shipments 100.0 100.0 100.0 Source: Compiled from data submitted in response to Commission questionnaires.
U.S. PRODUCERS’ INVENTORIES
Table III‐7 presents U.S. producers’ end‐of‐period inventories and the ratio of these inventories to U.S. producers’ production, U.S. shipments, and total shipments. The U.S. industry’s inventories of threaded rod increased by 2.0 percent during 2016‐18. The ratio of inventories to production ranged between 13.4 and 16.4 percent, while the ratio of inventories to U.S. shipments similarly ranged between 13.1 and 16.5 percent.
Table III-7 Threaded rod: U.S. producers’ inventories, 2016-18
Item Calendar year
2016 2017 2018 Quantity (1,000 pounds) U.S. producers' end-of-period inventories 21,722 18,457 22,158 Ratio (percent)
Ratio of inventories to.-- U.S. production 16.4 13.4 15.3
U.S. shipments 16.5 13.1 15.7 Total shipments *** *** ***
Source: Compiled from data submitted in response to Commission questionnaires.

III‐7
U.S. PRODUCERS’ IMPORTS AND PURCHASES
U.S. producers’ imports of threaded rod are presented in table III‐8. Six of seven U.S. producers either directly imported or are related to firms that directly imported subject merchandise. Vulcan, in contrast, testified that it does not import subject threaded rod.4 In addition, six of seven U.S. producers reported purchasing *** threaded rod from other producers and/or subject and nonsubject sources although *** was the only producer that reported purchases from a subject source (***). *** purchased the following quantities of threaded rod from importer ***: *** in 2017 and *** in 2018.
Table III-8 Threaded rod: U.S. producers’ U.S. production and imports, 2016-18
* * * * * * *
U.S. EMPLOYMENT, WAGES, AND PRODUCTIVITY
Table III‐9 shows U.S. producers’ employment‐related data. All employment‐related indicators were higher in 2018 than in 2016. The number of production and related workers (“PRWs”) fluctuated, increasing by 11.4 percent during 2016‐17 then decreasing by 6.1 percent during 2017‐18, for an overall increase of 4.6 percent. All firms reported an overall increase in PRWs, with the exception of ***. Hours worked and wages paid increased overall between 2016 and 2018, by 6.0 percent and 20.2 percent respectively, but decreased during 2017‐18, by 4.5 percent and 1.5 percent. Productivity also increased overall, but experienced a 6.2 percent decrease during 2016‐17. *** reported that its higher wages in 2017 and 2018 are due to “a very tight labor market.” *** attributed its employment trends to the “busy economy” and supporting help. *** reported that overtime and the hourly rate increased with economic growth. *** added a night shift in 2017 and had significant overtime hours in 2018. *** reported that it has added more workers as business has increased. In addition, a representative for Bay Standard testified that the company has added services along with threaded rod, which is very labor intensive.5
4 Conference transcript, p. 17 (Black). 5 Conference transcript, p. 35 (Gross).
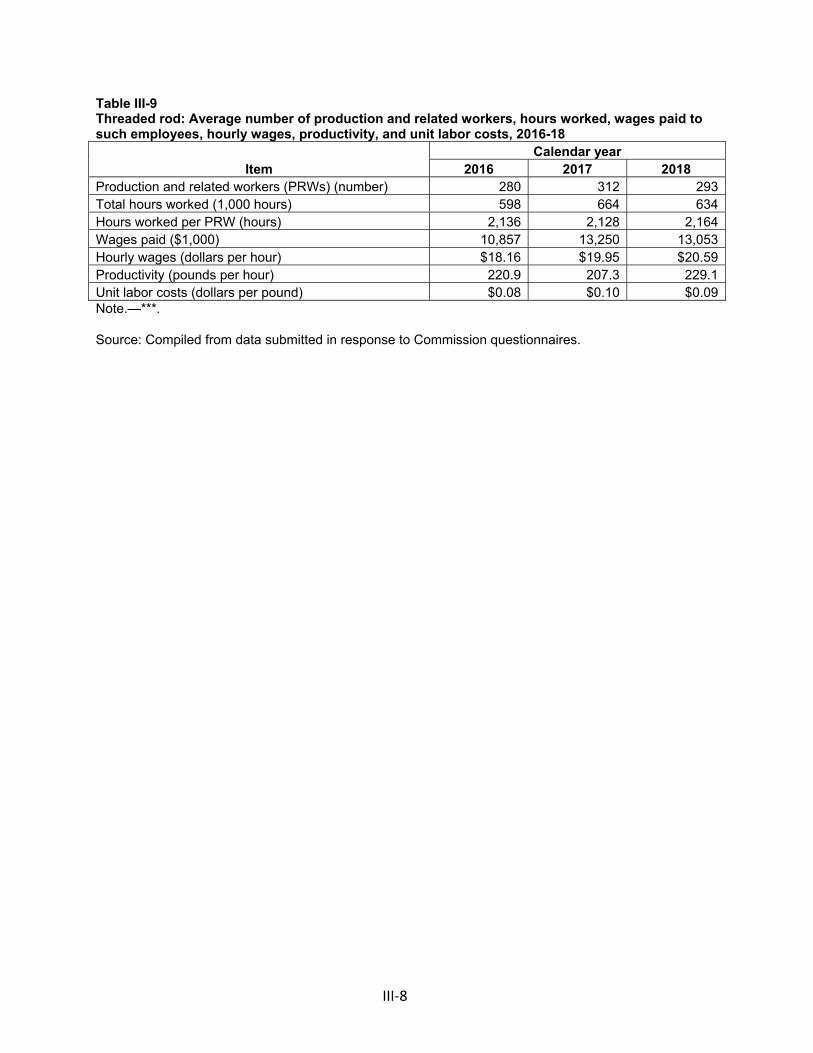
III‐8
Table III-9 Threaded rod: Average number of production and related workers, hours worked, wages paid to such employees, hourly wages, productivity, and unit labor costs, 2016-18
Item Calendar year
2016 2017 2018 Production and related workers (PRWs) (number) 280 312 293 Total hours worked (1,000 hours) 598 664 634 Hours worked per PRW (hours) 2,136 2,128 2,164 Wages paid ($1,000) 10,857 13,250 13,053 Hourly wages (dollars per hour) $18.16 $19.95 $20.59 Productivity (pounds per hour) 220.9 207.3 229.1 Unit labor costs (dollars per pound) $0.08 $0.10 $0.09 Note.—***.
Source: Compiled from data submitted in response to Commission questionnaires.

IV‐1
PART IV: U.S. IMPORTS, APPARENT U.S. CONSUMPTION, AND MARKET SHARES
U.S. IMPORTERS
The Commission issued importer questionnaires to 251 firms identified as potential importers of subject threaded rod, as well as to all U.S. producers of threaded rod.1 Usable questionnaire responses were received from 47 companies, representing 55.9 percent of total U.S. imports during 2018 under HTS statistical reporting numbers 7318.15.5051 and 7318.15.5056, covering continuously threaded rod, that petitioners estimate correspond to the threaded rod covered by the scope of the investigations.2 Firms responding to the Commission’s questionnaire accounted for the following shares of individual subject country’s imports (as a share of official Commerce statistics, by quantity) during 2018.
*** percent of subject imports from China;3
*** percent of subject imports from India;
*** percent of subject imports from Taiwan; and
*** percent of subject imports from Thailand.
In light of the questionnaire coverage, U.S. imports are based on official Commerce statistics.4 Table IV‐1 lists all responding U.S. importers of threaded rod from China, India, Taiwan, Thailand, and other sources, their locations, and their shares of U.S. imports, in 2018.
1 The Commission issued questionnaires to 41 firms that, based on a review of data provided by U.S. Customs and Border Protection (“Customs”), may have accounted for more than one percent of total imports under HTS statistical reporting numbers 7318.15.5051, 7318.15.5056, 7318.15.5090, 7318.15.2095, and 7318.19.0000 in 2018. In addition, the Commission issued questionnaires to 210 firms identified in the petition for which a useable email address was provided.
2 Counsel for petitioner stated that product entering under HTS statistical reporting numbers 7318.15.5051 and 7318.15.5056 is virtually all subject merchandise. Conference transcript, p. 33 (Drake).
3 Petitioner identified Industrial Threaded Products and PrimeSource Materials as two major importers of threaded rod that did not provide a response to the Commission’s questionnaire. Conference transcript, pp. 28‐29 (Drake); and petitioner’s postconference brief, “Answers to Staff Questions,” p. 2.
4 Import data presented in this report may be understated as they do not include non‐continuously threaded rod. Petitioner’s counsel argued for the inclusion of a third HTS statistical reporting number, 7318.15.5090, citing that it contains mostly in‐scope products. However, petitioner also stated that the vast majority of the threaded rod market is continuously threaded product. Conference transcript, pp. 33‐34 (Drake) and 79 (Logan).

IV‐2
Table IV-1 Threaded rod: U.S. importers by source, 2018
Firm Headquarters
Share of imports by source (percent)
China India Taiwan Thailand Subject sources
Non-subject sources
All import
sources 3v Jacksonville, FL *** *** *** *** *** *** *** Acme Jacksonville, FL *** *** *** *** *** *** *** All America Lancaster, PA *** *** *** *** *** *** *** All Ohio Cleveland, OH *** *** *** *** *** *** *** Alloy & Stainless Houston, TX *** *** *** *** *** *** *** All-Pro Arlington, TX *** *** *** *** *** *** *** Bay Brentwood, CA *** *** *** *** *** *** *** BendPak Santa Paula, CA *** *** *** *** *** *** *** Bowie Bridgeville, DE *** *** *** *** *** *** *** Brighton Long Beach, CA *** *** *** *** *** *** *** Capital Closter, NJ *** *** *** *** *** *** *** CT Tech Pomona, CA *** *** *** *** *** *** *** Dayton Miamisburg, OH *** *** *** *** *** *** *** DC Wilsonville, OR *** *** *** *** *** *** *** Elite Sugar Land, TX *** *** *** *** *** *** *** Fairway St. Louis, MO *** *** *** *** *** *** *** Fastenal Winona, MN *** *** *** *** *** *** *** Fluid Houston, TX *** *** *** *** *** *** *** Grainger Lake Forest, IL *** *** *** *** *** *** *** Highland Houston, TX *** *** *** *** *** *** *** Hilti Tulsa, OK *** *** *** *** *** *** *** Home Depot Atlanta, GA *** *** *** *** *** *** *** Icon Chantilly, VA *** *** *** *** *** *** *** KM Fasteners West Valley City, UT *** *** *** *** *** *** *** Kratos Farmers Branch, TX *** *** *** *** *** *** *** Laube Camarillo, CA *** *** *** *** *** *** *** Lawrence Harwood Heights, IL *** *** *** *** *** *** *** Table continued on next page.

IV‐3
Table IV-1--Continued Threaded rod: U.S. importers by source, 2018
Firm Headquarters
Share of imports by source (percent)
China India Taiwan Thailand Subject sources
Non-subject sources
All import
sources Leo Brooklyn, NY *** *** *** *** *** *** *** Lindstrom Blaine, MN *** *** *** *** *** *** *** Linus Houston, TX *** *** *** *** *** *** *** Lippincott Vallejo, CA *** *** *** *** *** *** *** LoneStar Spring, TX *** *** *** *** *** *** *** M.T.A. Caesarea, Israel *** *** *** *** *** *** *** Marine Sanford, FL *** *** *** *** *** *** *** Mighty Sourcing Palatine, IL *** *** *** *** *** *** *** Paradiigm Alexandria, VA *** *** *** *** *** *** *** R.B. Morton Grove, IL *** *** *** *** *** *** *** Shandex Fort Lee, NJ *** *** *** *** *** *** *** Shibata Lansdowne, VA *** *** *** *** *** *** *** Siemens Orlando, FL *** *** *** *** *** *** *** Star Houston, TX *** *** *** *** *** *** *** Steelex White Plains, NY *** *** *** *** *** *** *** Stelfast Strongsville, OH *** *** *** *** *** *** *** Technical Peabody, MA *** *** *** *** *** *** *** Trelleborg Broussard, LA *** *** *** *** *** *** *** Unbrako Downey, CA *** *** *** *** *** *** *** Warwick Warwick, RI *** *** *** *** *** *** ***
Total 100.0 100.0 100.0 100.0 100.0 100.0 100.0 Source: Compiled from data submitted in response to Commission questionnaires.
U.S. IMPORTS
Table IV‐2 and figure IV‐1 present data for U.S. imports of threaded rod from China, India, Taiwan, Thailand, and all other sources. During 2016‐18, total U.S. imports increased overall by 44.3 percent, based on quantity. Similarly, subject U.S. imports increased by 49.1 percent during the same period. Specifically, imports from China and India increased by 127.8 percent and 19.6 percent, respectively, while imports from Taiwan decreased by 2.9 percent. Imports from Thailand were relatively stable, increasing by 0.4 percent between 2016 and 2018. Subject imports accounted for 95.8 percent of total U.S. imports in 2018, with imports from China alone accounting 47.7 percent of U.S. imports of threaded rod. Imports from nonsubject sources decreased by 17.1 percent during 2016‐18 and accounted for 4.2 percent of total U.S. imports in 2018. Leading nonsubject sources of imports include Malaysia and the Philippines, accounting for 1.1 percent and 0.8 percent of total U.S. imports in 2018, respectively. Average unit values from all sources increased during 2016‐18; average unit values from subject sources were consistently lower than average unit values from nonsubject sources. The ratio of subject imports to U.S. production increased by 38.6 percentage points

IV‐4
during 2016‐18, and subject imports were equivalent to 146.9 percent of U.S. production in 2018. Table IV-2 Threaded rod: U.S. imports by source, 2016-18
Item Calendar year
2016 2017 2018 Quantity (1,000 pounds)
U.S. imports from.-- China 46,598 74,442 106,144
India 58,461 67,154 69,912 Taiwan 26,037 19,636 25,275 Thailand 11,976 10,317 12,020
Subject sources 143,073 171,548 213,350 Nonsubject sources 11,190 8,541 9,271
All import sources 154,262 180,089 222,621 Value (1,000 dollars)
U.S. imports from.-- China 30,853 48,940 81,907
India 24,620 29,388 34,741 Taiwan 13,227 11,341 15,013 Thailand 5,133 4,913 6,192
Subject sources 73,833 94,582 137,853 Nonsubject sources 13,947 10,448 12,781
All import sources 87,780 105,030 150,634 Unit value (dollars per pound)
U.S. imports from.-- China 0.66 0.66 0.77
India 0.42 0.44 0.50 Taiwan 0.51 0.58 0.59 Thailand 0.43 0.48 0.52
Subject sources 0.52 0.55 0.65 Nonsubject sources 1.25 1.22 1.38
All import sources 0.57 0.58 0.68 Table continued on next page.

IV‐5
Table IV-2--Continued Threaded rod: U.S. imports by source, 2016-18
Item Calendar year
2016 2017 2018 Share of quantity (percent)
U.S. imports from.-- China 30.2 41.3 47.7
India 37.9 37.3 31.4 Taiwan 16.9 10.9 11.4 Thailand 7.8 5.7 5.4
Subject sources 92.7 95.3 95.8 Nonsubject sources 7.3 4.7 4.2
All import sources 100.0 100.0 100.0 Share of value (percent)
U.S. imports from.-- China 35.1 46.6 54.4
India 28.0 28.0 23.1 Taiwan 15.1 10.8 10.0 Thailand 5.8 4.7 4.1
Subject sources 84.1 90.1 91.5 Nonsubject sources 15.9 9.9 8.5
All import sources 100.0 100.0 100.0 Ratio to U.S. production
U.S. imports from.-- China 35.3 54.1 73.1
India 44.2 48.8 48.1 Taiwan 19.7 14.3 17.4 Thailand 9.1 7.5 8.3
Subject sources 108.3 124.6 146.9 Nonsubject sources 8.5 6.2 6.4
All import sources 116.8 130.8 153.3 Note.—Nonsubject sources, in 2018 descending quantity, include Malaysia, the Philippines, Germany, and Korea. Source: Compiled from official U.S. import statistics using statistical reporting numbers 7318.15.5051 and 7318.15.5056, accessed March 13, 2019.

IV‐6
Figure IV-1
Threaded rod: U.S. import volumes and average unit values, 2016-18
Source: Compiled from official U.S. import statistics using statistical reporting numbers 7318.15.5051 and 7318.15.5056, accessed March 13, 2019.
NEGLIGIBILITY
The statute requires that an investigation be terminated without an injury
determination if imports of the subject merchandise are found to be negligible.5 Negligible imports are generally defined in the Act, as amended, as imports from a country of merchandise corresponding to a domestic like product where such imports account for less than 3 percent of the volume of all such merchandise imported into the United States in the most recent 12‐month period for which data are available that precedes the filing of the petition or the initiation of the investigation. However, if there are imports of such merchandise from a number of countries subject to investigations initiated on the same day that individually account for less than 3 percent of the total volume of the subject merchandise, and if the imports from those countries collectively account for more than 7 percent of the volume of all such merchandise imported into the United States during the applicable 12‐month period, then imports from such countries are deemed not to be negligible.6 Based on official Commerce statistics, tables IV‐3 and IV‐4 present the individual shares of total imports accounted by
5 Sections 703(a)(1), 705(b)(1), 733(a)(1), and 735(b)(1) of the Act (19 U.S.C. §§ 1671b(a)(1), 1671d(b)(1), 1673b(a)(1), and 1673d(b)(1)).
6 Section 771 (24) of the Act (19 U.S.C § 1677(24)).

IV‐7
subject countries, by quantity, during February 2018 through January 2019, the most recent 12‐month period for which data are available. Table IV-3
Threaded rod: U.S. imports subject to antidumping duty investigations, February 2018 through January 2019
Item
February 2018 through January 2019
Antidumping duty investigations
Quantity (1,000 pounds)
Share of quantity (percent)
U.S. imports from.-- China1 105,462 46.4
India 73,668 32.4 Taiwan 26,060 11.5 Thailand 12,003 5.3
Subtotal 217,194 95.6 All other sources 10,037 4.4
All import sources 227,230 100.0 1 Imports of carbon-quality threaded rod from China are subject to an existing antidumping duty order. Thus, imports from China entering under HTS statistical reporting number 7318.15.5056 (non-alloy threaded rod) are not included in this calculation. Source: Compiled from official U.S. import statistics using statistical reporting numbers 7318.15.5051 and 7318.15.5056, accessed March 28, 2019.
Table IV-4
Threaded rod: U.S. imports subject to countervailing duty investigations, February 2018 through January 2019
Item
February 2018 through January 2019
Countervailing duty investigations
Quantity (1,000 pounds)
Share of quantity (percent)
U.S. imports from.-- China 109,598 47.4
India 73,668 31.8 Subtotal 183,266 79.2 All other sources 48,099 20.8
All import sources 231,366 100.0 Source: Compiled from official U.S. import statistics using statistical reporting numbers 7318.15.5051 and 7318.15.5056, accessed March 28, 2019.

IV‐8
CUMULATION CONSIDERATIONS
In assessing whether imports should be cumulated, the Commission determines whether U.S. imports from the subject countries compete with each other and with the domestic like product and has generally considered four factors: (1) fungibility, (2) presence of sales or offers to sell in the same geographical markets, (3) common or similar channels of distribution, and (4) simultaneous presence in the market. Information regarding channels of distribution, market areas, and interchangeability appear in Part II. Additional information concerning fungibility, geographical markets, and simultaneous presence in the market is presented below.
Fungibility
Threaded rod by galvanization
Table IV‐5 and figure IV‐2 presents U.S. producers’ shipments and U.S. importers’ imports by galvanization. Threaded rod, whether or not galvanized, was sold by both producers and importers in the United States. U.S. producers’ U.S. shipments consisted of both galvanized and non‐galvanized threaded rod, *** percent and *** respectively. U.S. importers’ subject imports also consisted of both galvanized and non‐galvanized threaded rod, in different mixes depending on the country of origin. Electroplated galvanized threaded rod is more common in the U.S. market than hot‐dipped galvanized threaded rod.7
7 Petitioner stated that electroplated galvanized threaded rod made up the vast majority of its sales, while hot‐dipped galvanized threaded rod made up between 7 and 10 percent of its sales. Conference transcript, pp. 38‐39 (Jenkins and Drake).

IV‐9
Table IV-5
Threaded rod: U.S. shipments and imports by galvanization, 2018
* * * * * * * Figure IV-2
Threaded rod: U.S. shipments and imports by galvanization, 2018
* * * * * * *
Threaded rod by steel and threading type
Table IV‐6 and figure IV‐3 presents U.S. producers’ shipments and U.S. importers’ imports by steel type and whether or not continuously threaded. Both carbon (non‐alloy) and alloy threaded rod are widely sold in the U.S. market and the great majority is continuously threaded. U.S. producers’ shipments consisted of *** percent continuously threaded carbon (non‐alloy) rod and *** percent continuously threaded alloy rod, while U.S. importers’ imports consisted of *** percent continuously threaded carbon (non‐alloy) rod and *** percent continuously threaded alloy rod. The majority of imports from China in 2018 were alloy products. Petitioner contends that since the imposition of the antidumping duty order on carbon‐quality threaded rod from China in 2009, imports from China have shifted from carbon products to alloy products.8 Producers and importers both reported small quantities of non‐continuously threaded alloy and non‐alloy steel rod.
Table IV-6
Threaded rod: U.S. shipments and imports by steel type and threading, 2018
* * * * * * *
Figure IV-3
Threaded rod: U.S. producers' and U.S. importers' U.S. shipments by steel type and threading, 2018
* * * * * * *
Geographical markets
Threaded rod produced in the United States is shipped nationwide (see Part II for more information on geographic markets). U.S. imports of subject merchandise from China, India, Taiwan, and Thailand entered multiple U.S. ports of entry across the nation. Table IV‐7 presents U.S. imports of threaded rod, by source and border of entry in 2018, based on official import statistics. The majority of subject imports from China entered via the South, while subject imports from India, Taiwan, and Thailand were more widely dispersed.
8 Conference transcript, pp. 12 and 40 (Meisner, Jenkins, and Schagrin).

IV‐10
Table IV-7
Threaded rod: U.S. imports by border of entry, 2018
Item
Border of entry
East North South West All
borders Quantity (1,000 pounds)
U.S. imports from.-- China 7,689 5,168 86,607 6,679 106,144
India 26,196 9,558 16,281 17,877 69,912 Taiwan 7,278 4,015 4,434 9,547 25,275 Thailand 4,277 1,798 2,997 2,947 12,020
Subject sources 45,440 20,540 110,319 37,051 213,350 Nonsubject sources 1,208 3,400 4,010 653 9,271
All import sources 46,648 23,940 114,329 37,704 222,621 Share across (percent)
U.S. imports from.-- China 7.2 4.9 81.6 6.3 100.0
India 37.5 13.7 23.3 25.6 100.0 Taiwan 28.8 15.9 17.5 37.8 100.0 Thailand 35.6 15.0 24.9 24.5 100.0
Subject sources 21.3 9.6 51.7 17.4 100.0 Nonsubject sources 13.0 36.7 43.3 7.0 100.0
All import sources 21.0 10.8 51.4 16.9 100.0 Share down (percent)
U.S. imports from.-- China 16.5 21.6 75.8 17.7 47.7
India 56.2 39.9 14.2 47.4 31.4 Taiwan 15.6 16.8 3.9 25.3 11.4 Thailand 9.2 7.5 2.6 7.8 5.4
Subject sources 97.4 85.8 96.5 98.3 95.8 Nonsubject sources 2.6 14.2 3.5 1.7 4.2
All import sources 100.0 100.0 100.0 100.0 100.0 Source: Compiled from official U.S. import statistics using statistical reporting numbers 7318.15.5051 and 7318.15.5056, accessed March 13, 2019.
Presence in the market
Threaded rod produced in the United States was present in the market throughout the period for which data were collected. Table IV‐8 and figures IV‐4 and IV‐5 present the monthly data for U.S. imports of threaded rod from subject and nonsubject sources between January 2016 and December 2018. Based on official import statistics, subject U.S. imports of threaded rod from China, India, Taiwan, and Thailand were present in each month during 2016‐18.

IV‐11
Table IV-8
Threaded rod: U.S. imports by month, January 2016 through December 2018
Item
U.S. imports
China India Taiwan Thailand Subject sources
Non-subject sources
All import
sources Quantity (1,000 pounds)
2016.-- January 3,953 4,544 1,945 771 11,212 1,162 12,374
February 4,350 3,617 1,590 557 10,114 661 10,775 March 3,129 5,604 1,598 1,241 11,572 925 12,497 April 3,251 4,670 1,843 1,764 11,528 952 12,480 May 3,611 5,111 2,567 335 11,625 728 12,353 June 3,564 3,992 2,017 1,059 10,632 797 11,429 July 3,375 5,508 2,056 1,360 12,299 572 12,871 August 4,347 5,123 2,534 1,066 13,070 1,596 14,666 September 4,269 4,779 3,139 1,095 13,282 723 14,005 October 3,819 5,091 1,600 1,006 11,516 738 12,253 November 3,125 5,693 2,751 851 12,419 1,266 13,685 December 5,805 4,731 2,396 871 13,803 1,071 14,874
2017.-- January 5,782 6,539 1,681 550 14,552 601 15,153
February 4,399 4,880 2,216 743 12,238 884 13,122 March 4,880 5,891 1,802 560 13,133 525 13,658 April 5,293 5,248 1,217 1,009 12,766 477 13,243 May 7,363 6,276 2,230 766 16,635 655 17,290 June 8,915 4,931 1,701 639 16,186 660 16,846 July 6,692 4,960 1,878 941 14,471 604 15,075 August 5,911 4,823 1,128 1,057 12,919 922 13,842 September 8,061 5,602 1,518 1,087 16,268 917 17,184 October 6,861 6,379 1,226 793 15,259 680 15,939 November 5,232 6,093 1,521 1,180 14,026 788 14,814 December 5,052 5,532 1,519 994 13,096 829 13,925
2018.-- January 6,112 5,508 2,330 903 14,854 772 15,626
February 6,857 5,772 1,608 411 14,648 755 15,403 March 5,244 6,071 1,285 1,300 13,900 845 14,745 April 6,779 4,651 1,811 1,347 14,588 439 15,027 May 8,186 5,924 1,506 1,088 16,704 860 17,563 June 8,734 5,243 2,379 568 16,924 562 17,486 July 9,560 5,578 2,199 1,083 18,421 448 18,868 August 9,939 6,685 2,029 805 19,458 851 20,310 September 9,546 5,075 2,209 743 17,573 1,041 18,614 October 10,519 5,827 2,365 1,455 20,165 839 21,004 November 10,360 6,536 2,710 1,072 20,678 1,241 21,920 December 14,308 7,042 2,844 1,244 25,437 618 26,055
Source: Compiled from official U.S. import statistics using statistical reporting numbers 7318.15.5051 and 7318.15.5056, accessed March 13, 2019.

IV‐12
Figure IV-4
Threaded rod: Monthly U.S. imports from individual subject sources, January 2016 through December 2018
Source: Compiled from official U.S. import statistics using statistical reporting numbers 7318.15.5051 and 7318.15.5056, accessed March 13, 2019.
Figure IV-5
Threaded rod: Monthly U.S. imports from subject and nonsubject sources, January 2016 through December 2018
Source: Compiled from official U.S. import statistics using statistical reporting numbers 7318.15.5051 and 7318.15.5056, accessed March 13, 2019.
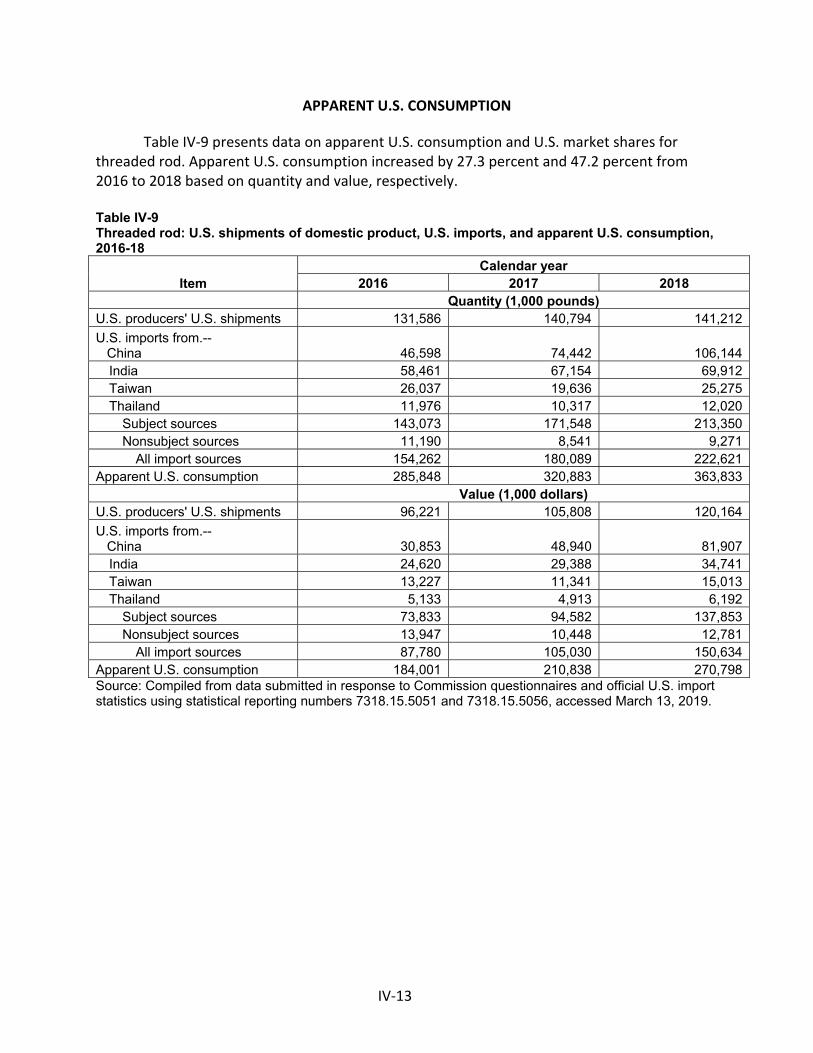
IV‐13
APPARENT U.S. CONSUMPTION
Table IV‐9 presents data on apparent U.S. consumption and U.S. market shares for threaded rod. Apparent U.S. consumption increased by 27.3 percent and 47.2 percent from 2016 to 2018 based on quantity and value, respectively.
Table IV-9 Threaded rod: U.S. shipments of domestic product, U.S. imports, and apparent U.S. consumption, 2016-18
Item Calendar year
2016 2017 2018 Quantity (1,000 pounds) U.S. producers' U.S. shipments 131,586 140,794 141,212
U.S. imports from.-- China 46,598 74,442 106,144
India 58,461 67,154 69,912 Taiwan 26,037 19,636 25,275 Thailand 11,976 10,317 12,020
Subject sources 143,073 171,548 213,350 Nonsubject sources 11,190 8,541 9,271
All import sources 154,262 180,089 222,621 Apparent U.S. consumption 285,848 320,883 363,833 Value (1,000 dollars) U.S. producers' U.S. shipments 96,221 105,808 120,164
U.S. imports from.-- China 30,853 48,940 81,907
India 24,620 29,388 34,741 Taiwan 13,227 11,341 15,013 Thailand 5,133 4,913 6,192
Subject sources 73,833 94,582 137,853 Nonsubject sources 13,947 10,448 12,781
All import sources 87,780 105,030 150,634 Apparent U.S. consumption 184,001 210,838 270,798 Source: Compiled from data submitted in response to Commission questionnaires and official U.S. import statistics using statistical reporting numbers 7318.15.5051 and 7318.15.5056, accessed March 13, 2019.
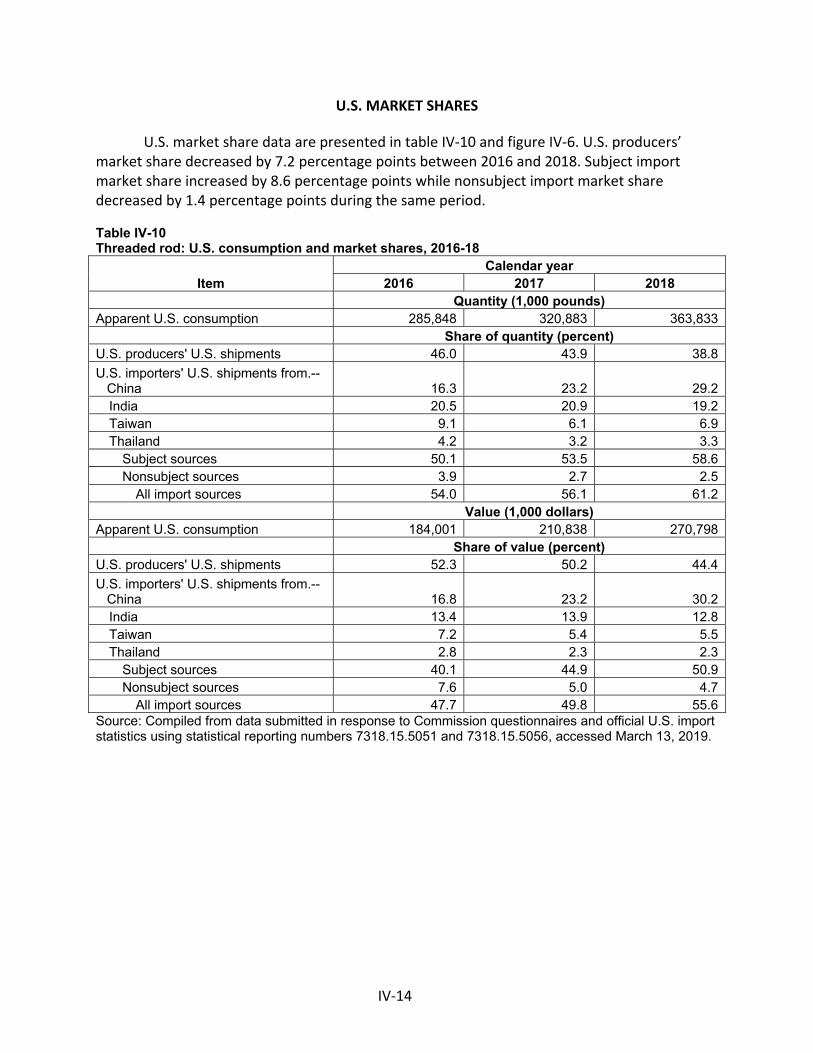
IV‐14
U.S. MARKET SHARES
U.S. market share data are presented in table IV‐10 and figure IV‐6. U.S. producers’ market share decreased by 7.2 percentage points between 2016 and 2018. Subject import market share increased by 8.6 percentage points while nonsubject import market share decreased by 1.4 percentage points during the same period.
Table IV-10 Threaded rod: U.S. consumption and market shares, 2016-18
Item Calendar year
2016 2017 2018 Quantity (1,000 pounds) Apparent U.S. consumption 285,848 320,883 363,833 Share of quantity (percent) U.S. producers' U.S. shipments 46.0 43.9 38.8
U.S. importers' U.S. shipments from.-- China 16.3 23.2 29.2
India 20.5 20.9 19.2 Taiwan 9.1 6.1 6.9 Thailand 4.2 3.2 3.3
Subject sources 50.1 53.5 58.6 Nonsubject sources 3.9 2.7 2.5
All import sources 54.0 56.1 61.2 Value (1,000 dollars) Apparent U.S. consumption 184,001 210,838 270,798 Share of value (percent) U.S. producers' U.S. shipments 52.3 50.2 44.4
U.S. importers' U.S. shipments from.-- China 16.8 23.2 30.2
India 13.4 13.9 12.8 Taiwan 7.2 5.4 5.5 Thailand 2.8 2.3 2.3
Subject sources 40.1 44.9 50.9 Nonsubject sources 7.6 5.0 4.7
All import sources 47.7 49.8 55.6 Source: Compiled from data submitted in response to Commission questionnaires and official U.S. import statistics using statistical reporting numbers 7318.15.5051 and 7318.15.5056, accessed March 13, 2019.

IV‐15
Figure IV-6
Threaded rod: Apparent U.S. consumption, 2016-18
Source: Compiled from data submitted in response to Commission questionnaires and official U.S. import statistics using statistical reporting numbers 7318.15.5051 and 7318.15.5056, accessed March 13, 2019.


V-1
PART V: PRICING DATA
FACTORS AFFECTING PRICES
Raw material costs
Threaded rod is made primarily from low-carbon steel wire rod, which is typically cold-drawn, straightened, cut to length, threaded, and then sometimes plated or galvanized.1 Raw materials are the largest component of the total cost of goods sold (“COGS”) for threaded rod. U.S. producers reported that raw materials increased from a share of 69.2 percent of total COGS in 2016 to 71.6 percent in 2018.
The prices of all types wire rod and steel bar increased between January 2016 and January 2019. Cold heading quality wire rod prices increased by *** percent; high carbon wire rod prices increased by *** percent, industrial quality low carbon wire rod prices increased by *** percent, and steel bar cold-finished 1 inch round prices increased by *** percent during this time (figure V-1).2
Figure V-1 Wire rod and steel bar: Average monthly U.S. prices of different types of wire rod and steel bar, in dollars per hundredweight, January 2016-January 2019
* * * * * * *
The majority of U.S. producers (5 of 7) and importers (26 of 42) indicated that raw material costs have increased since January 1, 2016. Importers reported that raw material costs increased on average ***. Some firms (***) reported passing on these increased prices to customers, while others (***) reported decreased profit margins due to increased raw material costs. Two producers and 13 importers reported fluctuating raw material costs, while four importers reported no change.
U.S. inland transportation costs
The majority of responding U.S. producers (4 of 7) reported that the purchaser typically
arranges transportation, with estimated U.S. inland transportation costs ranging from 3 to 5 percent. The majority of importers (31 of 39) reported that they typically arrange
1 Petition, Volume I, p. 7. 2 A combination of antidumping and countervailing duty orders on carbon and certain alloy steel wire rod from Belarus, Italy, Korea, Russia, South Africa, Spain, Turkey, Ukraine, United Arab Emirates, and the United Kingdom entered into effect in the United States in the first half of 2018.

V-2
transportation to their customers. Most importers reported inland transportation costs ranging from 1 to 10 percent.3
PRICING PRACTICES
Pricing methods
U.S. producers and importers reported using transaction-by-transaction negotiations, contracts, set price lists, and other methods to set prices for threaded rod. As presented in table V-1, most U.S. producers and importers sell primarily using transaction-by-transaction negotiations.
Table V-1 Threaded rod: U.S. producers’ and importers’ reported price setting methods, by number of responding firms
Method U.S. producers U.S. importers Transaction-by-transaction 7 30 Contract 2 11 Set price list 2 6 Other 1 9
1 The sum of responses down will not add up to the total number of responding firms as each firm was instructed to check all applicable price set ting methods employed. Source: Compiled from data submitted in response to Commission questionnaires.
U.S. producers and importers reported selling the majority of their threaded rod on the spot market (for 90.7 percent of U.S. producers’ U.S. commercial shipments and 80.1 percent of importers’ U.S. commercial shipments) (table V-2). Short-term contracts were the second most common type of sales type for both U.S. producers and importers. U.S. producers reported that their short-term contracts ranged from 14 to 176 days, while importers reported short-term contracts ranging from 90 to 150 days.
Table V-2 Threaded rod: U.S. producers’ and importers’ shares of U.S. commercial shipments, by type of sale, 2018
Item U.S. producers U.S. importers
Share (percent) Long-term contracts --- --- Annual contract 0.5 5.3 Short-term contracts 8.8 14.7 Spot sales 90.7 80.1
Note.--Because of rounding, figures may not add to the totals shown. Source: Compiled from data submitted in response to Commission questionnaires.
3 Three importers report higher inland transportation costs: one reported a cost of 15 percent, one reported a cost of 18 percent, and one reported a cost of 25 percent.
V-3
One U.S. producer (***) reported fixing both price and quantity and indexing prices to
raw materials in its short-term contracts. Another U.S. producer (***) reported fixing quantity for its short-term contracts. Three importers reported price renegotiations during the contract period for their short-term contracts, two reported price renegotiations during the contract period for their annual contracts, and one reported price renegotiations during both its short-term and annual contracts. Five importers also reported fixing prices for their short-term contracts, one reported fixing prices for its annual contracts, and one reported fixing prices for its long-term contracts. Six importers reported fixing both price and quantity for their short-term contracts, five reported fixing both prices and quantity for their annual contracts, and one reported fixing both price and quantity for its long-term contacts. Two importers reported indexed raw material cost for their annual contracts.
Sales terms and discounts
Four of 7 responding U.S. producers typically quote prices on an f.o.b. basis, while the other three typically quote prices on a delivered basis. Twenty-three of 40 importers typically quote prices on a delivered basis, while 21 reported quoting prices on an f.o.b. basis.4 Four U.S. producers reported offering quantity discounts, two reported offering discounts based on total volume, two reported having no discount policy, and one reported offering “other” discounts based on “expected volume… subject to market competitive factors such as available imports in the market.” Fourteen importers reported offering quantity discounts, 8 reported offering discounts based on total volume, 18 reported having no discount policy, and 9 reported offering “other” discounts. Three of the importers that reported offing “other” discounts reported basing them on early payment, and two reported offing rebates.
Price leadership
Two purchasers identified Vulcan Steel Products as a price leader, stating that it is the largest domestic manufacturer. One purchaser identified Brighton Best International as a price leader.
PRICE DATA
The Commission requested U.S. producers and importers to provide quarterly data for the total quantity and f.o.b. value of the following threaded rod products shipped to unrelated U.S. customers during January 2016-December 2018.
4 Four firms reported quoting on both an f.o.b. and a delivered basis.

V-4
Product 1.--Low-carbon steel fully threaded rod, electroplated with zinc, a 3/8 in diameter, 16 threads per inch, in 10-foot lengths, in cardboard tubes.
Product 2.--Low-carbon steel fully threaded rod, electroplated with zinc, a 1/2 in diameter, 13 threads per inch, in 10-foot lengths, in cardboard tubes.
Product 3.--Low-carbon steel fully threaded rod, electroplated with zinc, a 3/4 in diameter, 10 threads per inch, in 12-foot lengths, in cardboard tubes.
Product 4.--Low-carbon steel fully threaded rod, hot dipped galvanized, a 5/8 in diameter, 11 threads per inch, in 12-foot lengths, in cardboard tubes.
Product 5.--Alloy steel fully threaded rod, produced to ASTM A193 Grade B7, a 3/4 inch diameter, 10 threads per inch, in 12-foot lengths, in cardboard tubes.
Product 6.--Alloy steel fully threaded rod, produced to ASTM A193 Grade B7, a 1-1/4 inch diameter, 8 threads per inch, in 12-foot lengths, in cardboard tubes.
Four U.S. producers and 15 importers provided usable pricing data for sales of the requested products. Not all responding firms provided pricing data and not all firms that provided pricing data reported pricing for all products for all quarters.5 6 Pricing data reported by these firms accounted for approximately 22.3 percent of U.S. producers’ U.S. commercial shipments of threaded rod, 2.4 percent of U.S. commercial shipments of subject imports from China, 34.7 percent of U.S. commercial shipments of subject imports from India, 25.6 percent of U.S. commercial shipments of subject imports from Taiwan, and 46.4 percent of U.S. commercial shipments of subject imports from Thailand in 2018. Pricing data reported by these firms account for 25.4 percent of commercial U.S. shipments of all subject sources combined in 2018.
Price data for products 1-6 are presented in tables V-3 to V-8 and figures V-2 to V-7.
5 Per-unit pricing data are calculated from total quantity and total value data provided by U.S. producers and importers. The precision and variation of these figures may be affected by rounding, limited quantities, and producer or importer estimates. 6 Some firms reported pricing data that is believed to contain reporting errors either for individual quarters or in their entirety. ***. The Commission was not able to obtain corrections from these firms in time for publication of this report. Accordingly, such data have not been included in this pricing analysis.

V-5
Table V-3 Threaded rod: Weighted-average f.o.b. prices and quantities of domestic and imported product 1, and margins of underselling/(overselling), by quarter, January 2016-December 2018
* * * * * * * Table V-4 Threaded rod: Weighted-average f.o.b. prices and quantities of domestic and imported product 2, and margins of underselling/(overselling), by quarter, January 2016-December 2018
* * * * * * *
Table V-5 Threaded rod: Weighted-average f.o.b. prices and quantities of domestic and imported product 3, and margins of underselling/(overselling), by quarter, January 2016 through December 20181
* * * * * * *
Table V-6 Threaded rod: Weighted-average f.o.b. prices and quantities of domestic and imported product 4, and margins of underselling/(overselling), by quarter, January 2016 through December 2018
* * * * * * * Table V-7 Threaded rod: Weighted-average f.o.b. prices and quantities of domestic and imported product 5, and margins of underselling/(overselling), by quarter, January 2016 through December 2018
* * * * * * * Table V-8 Threaded rod: Weighted-average f.o.b. prices and quantities of domestic and imported product 6, and margins of underselling/(overselling), by quarter, January 2016 through December 2018
* * * * * * *
Figure V-2 Threaded rod: Weighted-average f.o.b. prices and quantities of domestic and imported product 1, by quarter, January 2016-December 2018
* * * * * * * Figure V-3 Threaded rod: Weighted-average f.o.b. prices and quantities of domestic and imported product 2, by quarter, January 2016-December 2018
* * * * * * * Figure V-4 Threaded rod: Weighted-average f.o.b. prices and quantities of domestic and imported product 3, by quarter, January 2016-December 2018
* * * * * * *

V-6
Figure V-5 Threaded rod: Weighted-average f.o.b. prices and quantities of domestic and imported product 4, by quarter, January 2016-December 2018
* * * * * * *
Figure V-6 Threaded rod: Weighted-average f.o.b. prices and quantities of domestic and imported product 5, by quarter, January 2016-December 2018
* * * * * * * Figure V-7 Threaded rod: Weighted-average f.o.b. prices and quantities of domestic and imported product 6, by quarter, January 2016-December 2018
* * * * * * *
Price comparisons
As shown in table V-10, prices for threaded rod imported from China, India, Taiwan, and Thailand were below those for U.S.-produced product in 146 of 225 instances; margins of underselling ranged from less than 1 percent to 50.5 percent. In the remaining 79 instances, prices for threaded rod from China, India, Taiwan and Thailand were between 0.2 percent and 75 percent above prices for the domestic product.

V-7
Table V-10 Threaded rod: Instances of underselling/overselling and the range and average of margins, by product and by country, January 2016-December 2018
Source
Underselling
Number of quarters Quantity (pounds)
Average margin
(percent)
Margin range (percent)
Min Max Product 1 *** *** *** *** *** Product 2 *** *** *** *** *** Product 3 *** *** *** *** *** Product 4 *** *** *** *** *** Product 5 *** *** *** *** *** Product 6 *** *** *** *** ***
Total, underselling 146 61,597,392 9.7 0.0 50.5 China *** *** *** *** *** India *** *** *** *** *** Taiwan *** *** *** *** *** Thailand *** *** *** *** ***
Total, underselling 146 61,597,392 9.7 0.0 50.5
Source
(Overselling)
Number of quarters Quantity (pounds)
Average margin
(percent)
Margin range (percent)
Min Max Product 1 *** *** *** *** *** Product 2 *** *** *** *** *** Product 3 *** *** *** *** *** Product 4 *** *** *** *** *** Product 5 *** *** *** *** *** Product 6 *** *** *** *** ***
Total, overselling 79 8,092,257 (13.7) (0.2) (75.0) China *** *** *** *** *** India *** *** *** *** *** Taiwan *** *** *** *** *** Thailand *** *** *** *** ***
Total, overselling 79 8,092,257 (13.7) (0.2) (75.0) Source: Compiled from data submitted in response to Commission questionnaires.
Price trends
In general, prices for threaded rod from all sources increased during January 2016-December 2018. Table V-9 summarizes the price trends, by country and by product. As shown in table V-9 and figure V-8, domestic price increases ranged from *** percent to *** percent. For products where data are available, Chinese price increase range from *** percent to *** percent. For products where data are available, Indian price changes range from a decrease of *** percent to an increase of *** percent. For products where data are available, price increases for producers in Taiwan range from *** percent to *** percent. For products where data are available, Thai price increases range from *** percent to *** percent.

V-8
Table V-9 Threaded rod: Number of quarters containing observations, low price, high price, and change in price over period, by product and source, January 2016-December 2018
* * * * * * * LOST SALES AND LOST REVENUE
Of the seven responding U.S. producers, two (***) reported that they had to reduce prices and roll back announced price increases. These same two firms indicated that they had lost sales to imports from China, India, Taiwan, and/or Thailand. One U.S. producer (***) submitted lost sales and lost revenue allegations. The responding U.S. producer identified 25 firms with which they lost sales or revenue (18 consisting of lost sales allegations, 4 consisting of lost revenue allegations, and 3 consisting of both types of allegations). One of the allegations involved China, 10 involved India, 18 involved Taiwan, and 3 involved Thailand.
Staff contacted these 25 purchasers and received responses from five purchasers. Responding purchasers reported purchasing 79.9 million pounds of threaded rod between January 2016 and December 2018 (table V-11). During 2018, responding purchasers reported purchasing 17.7 percent of their threaded rod from the United States, 80.5 percent from China, India, and/or Taiwan, and 1.3 percent from all other sources. Purchasers did not report purchasing or importing any threaded rod from Thailand during 2016-18.
Table V-11 Threaded rod: Purchasers' responses to purchasing patterns Table V-11 Threaded rod: Purchasers' responses to purchasing patterns
Purchaser
Purchases and imports in 2016-18 (pounds)
Change in domestic
share2 (pp, 2016-18)
Change in subject
country share2 (pp, 2016-18)
Domestic Subject All other1 *** *** *** *** *** *** *** *** *** *** *** *** *** *** *** *** *** *** *** *** *** *** *** *** *** *** *** *** *** ***
Total 15,953,314 62,659,206 1,321,179 *** *** 1 All other includes unknown sources. 2 Percentage points (pp) change: Change in the share of the firm’s total purchases of domestic and/or subject country imports between first and last years. Source: Compiled from data submitted in response to Commission questionnaires. Responding purchasers reported purchasing increased quantities of threaded rod produced in the United States, China, and India while purchasing decreased quantities from Taiwan from 2016 to 2018. Purchasers reported increasing purchases of threaded rod from U.S. producers by *** percent, from *** pounds in 2016 to *** pounds in 2018. Purchasers

V-9
reported increasing purchases of threaded rod produced in China by *** percent, from *** pounds in 2016 to *** pounds in 2018. Purchasers reported decreasing purchases of threaded rod from Taiwan by *** percent, from *** pounds in 2016 to *** pounds in 2018. Purchasers reported increasing purchases from India by *** percent, from *** pounds in 2016 to *** pounds in 2018. Purchasers reported increasing purchases of threaded rod from nonsubject countries by *** percent, from *** pounds in 2016 to *** pounds in 2018. As shown in Table V-12, one responding purchaser reported purchasing imported threaded rod (from ***) instead of domestic threaded rod. This purchaser also reported that the price of the imported product was below the price of the domestic product, and that price was a primary reason for the decision to purchase imported rather than domestic product. The firm estimated purchasing *** pounds of threaded rod from *** instead of domestic sources. Table V-12 Threaded rod: Purchasers' responses to purchasing subject instead of domestic, by firm
Purchaser
Subject imports
purchased instead of
domestic (Y/N)
Imports priced lower
(Y/N)
If purchased subject imports instead of domestic, was price a primary reason
Y/N
If Yes, quantity (pounds)
If No, non-price reason
*** *** *** *** *** --- *** *** *** *** *** --- *** *** *** *** *** --- *** *** *** *** *** --- *** *** *** *** *** ---
Total Yes--1; No--3 Yes--1; No--1 Yes--1; No--0 *** Source: Compiled from data submitted in response to Commission questionnaires.
Of the five responding purchasers, one reported that U.S. producers had reduced prices in order to compete with lower-priced imports from ***, while one reported that U.S. producers had not lowered prices in order to compete with imports from China, India, and/or Taiwan, and one firm that reported that U.S. producers had not lowered prices in order to compete with imports from unknown source countries; two firms reported that they did not know (table V-13). The reported estimated price reduction ranged was *** percent. In describing the price reductions, the purchaser indicated that Chinese product is typically lower-priced, but that domestic producers are more aggressive with pricing when the overall market is slow, which allows them keep their business bases and machines running.

V-10
Table V-13 Threaded rod: Purchasers’ responses to U.S. producer price reductions
Purchaser
U.S. producers reduced prices
to compete with subject imports (Y/N)
If U.S. producers reduced prices Estimated U.S. price reduction (percent) Additional information, if available
*** *** *** *** *** *** *** *** *** *** *** *** *** *** *** *** *** *** *** ***
Total Yes--0; No--2; Don’t Know--2 *** ---
Source: Compiled from data submitted in response to Commission questionnaires.

VI‐1
PART VI: FINANCIAL EXPERIENCE OF U.S. PRODUCERS
BACKGROUND
Seven U.S. producers provided full or partial data to the Commission. *** reported usable financial results on their operations on threaded rod for 2016 through 2018.1 2 With the exception of Vulcan, which is a division of SDI and part of that company’s Steel Operations segment,3 U.S. producers are privately held companies.
Notable changes in the character of U.S. threaded rod operations include SDI’s acquisition of Vulcan in 2016 and Vulcan’s subsequent acquisition of assets from Acme All America Threaded Products (Acme All America) in 2017.4 Currently, the purchased Acme All America assets remain in storage near Vulcan’s production facility.5
Reflecting consolidation both prior to and during the period examined,6 the U.S. industry’s threaded rod sales are relatively concentrated with Vulcan accounting for *** percent of the period’s total sales quantity. The remaining U.S. producers accounted for *** to *** of total sales quantity.7
OPERATIONS ON THREADED STEEL ROD
Table VI‐1 and table VI‐2 present income‐and‐loss data for U.S. producers’ operations on threaded rod and corresponding changes in average per pound values, respectively. Table VI‐3 presents selected financial information by firm.8
1 *** reported its financial results on a tax basis. The remaining U.S. producers reported their financial results on the basis of generally accepted accounting principles (GAAP). All U.S. producers reported their financial results for calendar‐year periods.
***. 2 ***. USITC auditor preliminary‐phase notes. 3 SDI 2018 10‐K, pp. 6‐7. 4 Conference transcript, p. 15 (Black). As noted in the Cost of goods sold and gross profit or loss
section below, ***. *** U.S. producer questionnaire, response to III‐10. 5 Vulcan’s decision not to deploy these assets reportedly reflects inadequate projected return on
investment (ROI). Conference transcript, p. 22 (Black), pp. 57‐58 (Black). 6 Conference transcript, p. 30 (Black). 7 Company‐specific shares of total sales quantity are as follows: ***. 8 In general, the utility of the Commission’s variance analysis is enhanced when product mix remains
the same throughout the period. While Vulcan indicated that its product mix did not change substantially during 2016‐18, Bay Standard indicated that its product mix did change. Conference transcript, p. 53 (Jenkins, Gross). Additionally, the pattern of the U.S. industry’s average per pound sales values and costs reflects changes in company‐specific market share (see footnote 13). Under these circumstances and since its utility appears to be limited, a variance analysis is not presented.

VI‐2
Table VI-1 Threaded rod: Results of operations of U.S. producers, 2016-18
Item Fiscal year
2016 2017 2018 Quantity (1,000 pounds) Total net sales quantity 132,186 140,970 141,347 Value (1,000 dollars) Total net sales value 96,692 105,864 120,200
Cost of goods sold: Raw materials 47,948 57,576 68,087
Direct labor 7,565 8,836 9,742 Other factory costs 13,784 16,379 17,216
Total cost of goods sold 69,297 82,791 95,045 Gross profit 27,395 23,073 25,155 SG&A expense 14,052 13,702 13,768 Operating income or (loss) 13,343 9,371 11,387 Interest expense *** *** *** Other expenses *** *** *** Other income *** *** *** Net income or (loss) 11,507 7,689 10,119 Depreciation/amortization 1,859 2,080 2,150 Estimated cash flow 13,366 9,769 12,269 Ratio to net sales (percent)
Cost of goods sold: Raw materials 49.6 54.4 56.6
Direct labor 7.8 8.3 8.1 Other factory costs 14.3 15.5 14.3
Cost of goods sold 71.7 78.2 79.1 Gross profit 28.3 21.8 20.9 SG&A expense 14.5 12.9 11.5 Operating income or (loss) 13.8 8.9 9.5 Net income or (loss) 11.9 7.3 8.4
Table continued on next page.

VI‐3
Table VI-1—Continued Threaded rod: Results of operations of U.S. producers, 2016-18
Item Fiscal year
2016 2017 2018 Ratio to total COGS (percent)
Cost of goods sold: Raw materials 69.2 69.5 71.6
Direct labor 10.9 10.7 10.2 Other factory costs 19.9 19.8 18.1
Unit value (dollars per pound) Total net sales 0.73 0.75 0.85
Cost of goods sold: Raw materials 0.36 0.41 0.48
Direct labor 0.06 0.06 0.07 Other factory costs 0.10 0.12 0.12
Total cost of goods sold 0.52 0.59 0.67 Gross profit 0.21 0.16 0.18 SG&A expense 0.11 0.10 0.10 Operating income or (loss) 0.10 0.07 0.08 Net income or (loss) 0.09 0.05 0.07 Number of firms reporting Operating losses *** *** *** Net losses *** *** *** Data *** *** ***
Source: Compiled from data submitted in response to Commission questionnaires.
Table VI-2 Threaded rod: Changes in average per pound values, 2016-18
Item Between fiscal years
2016-18 2016-17 2017-18
Change in average unit values (dollars per pound)
Total net sales 0.12 0.02 0.10
Cost of goods sold: Raw materials 0.12 0.05 0.07
Direct labor 0.01 0.01 0.01 Other factory costs 0.02 0.01 0.01
Total cost of goods sold 0.15 0.06 0.09 Gross profit (0.03) (0.04) 0.01 SG&A expense (0.01) (0.01) 0.00 Operating income or (loss) (0.02) (0.03) 0.01 Net income or (loss) (0.02) (0.03) 0.02
Source: Compiled from data submitted in response to Commission questionnaires.

VI‐4
Table VI-3 Threaded rod: Results of operations of U.S. producers, by firm, 2016-18
* * * * * * *
Revenue
The substantial majority (*** percent) of total revenue represents commercial sales. Relatively small amounts of revenue classified as transfers to related firms (*** percent) and internal consumption (*** percent) were also reported.9 Given the predominance of commercial sales, a single revenue line item is presented in the tables below.
Quantity
While the U.S. industry’s total sales quantity increased throughout 2016‐18, company‐specific directional patterns and magnitudes of change varied (see table VI‐3). In 2017, the overall increase in sales quantity was largely attributable to *** and *** with *** and *** reporting only modest increases in sales quantity.10 In 2018, in contrast, the pattern of higher sales quantity was attributable largely to ***, which partially offset *** large decline in sales quantity subsequent to ***. *** and, to a lesser extent, *** also contributed to the modest net increase sales quantity in 2018.11
Value
In conjunction with increases in both total sales quantity and average per pound sales value, the U.S. industry’s total revenue increased throughout the period (9.5 percent in 2016‐17 and 13.5 percent in 2017‐18).
On a company‐specific basis and with some exceptions, average per pound sales values were in a similar range. As shown in table VI‐3, *** average per pound sales values were the highest throughout the period while the lowest average per pound sales values were reported by *** and ***.12
9 ***. Petitioner’s postconference brief (Attachment 8). 10 ***. March 18, 2019 e‐mail from *** to USITC auditor. 11 ***. Petitioner’s postconference brief (Attachment 8). ***. March 13, 2019 e‐mail with attachment (revised IIII‐9a and III‐13) from *** to USITC auditor. 12 ***. March 18, 2019 e‐mail from *** to USITC auditor. *** consumed almost exclusively steel bar
(see footnote 17), which, in general, suggests a larger diameter and higher value product mix as compared to U.S. producers consuming both steel wire rod and steel bar.

VI‐5
While the U.S. industry’s average per pound sales value increased throughout the period,13 company‐specific average per pound sales values reflect a mix of declines and increases in 2016‐17 followed by a more uniform pattern of increases in 2017‐18.14
Cost of goods sold and gross profit or loss
Raw materials
Total raw material cost, which primarily represents steel wire rod and steel bar, accounts for the largest share of threaded rod total COGS, ranging from 69.2 percent in 2016 to 71.6 percent in 2018.15 The increasing share of raw material cost to total COGS generally reflects period‐to‐period increases in average per pound raw material costs, which exceeded corresponding increases in average per pound direct labor and other factory costs.16
Differences in company‐specific average per pound raw material costs appear to reflect, at least in part, the extent to which steel bar and/or steel wire rod is consumed as a primary input.17 U.S. producers, for the most part, reported the same directional pattern of higher average per pound raw material costs throughout the period.18
Direct labor and other factory costs
Other factory costs represent the second largest component of COGS, ranging from 19.9 percent of total COGS in 2016 to 18.1 percent in 2018. On an overall basis, average per pound other factory costs increased 11.4 percent in 2017 and 4.8 percent in 2018. Table VI‐3 shows that U.S. producers were mixed in terms of the directional pattern of average per pound other factory costs; e.g., while *** reported higher average other factory costs between 2016‐17, *** and *** reported lower other factory costs. As a practical matter, the U.S. industry’s
13 The increase in the U.S. industry’s average per pound sales value in 2017 largely reflects the increased market share of ***, which reported the second highest average per pound sales value throughout the period, and the lower market share of ***, which reported the lowest average per pound sales value in 2016 and 2017. ***. USITC auditor preliminary‐phase notes.
14 ***. Petitioner’s postconference brief (Attachment 8). ***. March 13, 2019 e‐mail with attachment (revised IIII‐9a and III‐13) from *** to USITC auditor. 15 ***. Petitioner’s postconference brief (Answers to Staff Questions, p. 5). 16 ***. *** U.S. producer questionnaire, responses to III‐7 and III‐9b. At the staff conference, a
Vulcan company official stated, “. . . the majority of our steel purchases come from suppliers other than SDI because they have freight advantages.” Conference transcript (Black), p. 18.
17 The extent to which U.S. producers consume steel wire rod and/or steel bar in the production of threaded rod varies. ***. U.S. producer questionnaires, responses to III‐9c.
18 ***. Petitioner’s postconference brief (Attachment 8). ***. March 13, 2019 e‐mail with attachment (revised IIII‐9a and III‐13) from *** to USITC auditor.

VI‐6
pattern of higher average per pound other factory costs in 2017 and 2018 is largely attributable to *** and ***, respectively.19
***.20 Direct labor is the smallest component of COGS, ranging from 10.9 percent of total
COGS in 2016 to 10.2 percent in 2018. On a company‐specific basis and similar to the pattern of other factory costs, U.S. producers reported a mixed directional trend. Also like other factory costs, the overall increase in the U.S. industry’s average per pound direct labor costs *** reflects increases reported by ***.21
Cost of goods sold
Principally due to increases in average per pound raw material cost, the U.S. industry’s average per pound COGS increased throughout the period. Increases in average per pound conversion costs (direct labor and other factory costs) also contributed to the pattern of higher average per pound COGS.22 With some exceptions, *** in 2016‐17 and *** in 2017‐18, U.S. producers reported increasing average per pound COGS of varying magnitudes throughout the period.
Gross profit
On an absolute basis and as a ratio to net sales, the U.S. industry’s gross profit was at its highest level in 2016. In 2017 and 2018, gross profit ratios declined, reflecting higher average per pound COGS, which increased at a faster rated compared to corresponding average per pound sales value. While total revenue increased by 9.5 percent in 2017, the deterioration in gross profit ratio yielded lower total gross profit in that year. In contrast and in conjunction with a 13.5 percent increase in revenue, the U.S. industry’s total gross profit increased in 2018 compared to 2017.
While the amounts of company‐specific total gross profit fluctuated, along with company‐specific gross profit ratios, table VI‐3 shows that *** U.S. producers generated gross profit during 2016‐18. *** financial performance, however, was different inasmuch as it was the only U.S. producer to report consecutive and pronounced declines in its gross profit ratio.
SG&A expenses and operating income or loss
The U.S. industry’s total SG&A expenses declined to its lowest level in 2017 and then, in conjunction with 6.6 percent higher sales quantity, increased somewhat in 2018. Corresponding
19 ***. Petitioner’s postconference brief (Attachment 8). ***. Ibid. ***. *** U.S. producer questionnaire, response to III‐10. Petitioner’s postconference brief (Attachment 8).
20 USITC auditor notes (preliminary phase). 21 ***. Petitioner’s postconference brief (Attachment 8). 22 ***. *** U.S. producer questionnaire, response to III‐10.

VI‐7
SG&A expense ratios (total SG&A expenses divided by total revenue) declined throughout the period, principally reflecting increases in total revenue.23 While not alone on a company‐specific basis in terms of reporting lower SG&A expense ratios, the 2017 *** in *** SG&A expenses and corresponding SG&A expense ratios is notable.24 U.S. producers generally reported SG&A expense ratios that were in a similar range but were mixed in terms of directional patterns and magnitudes of change.25
To the extent that the U.S. industry’s overall SG&A expense ratios declined throughout the period, the impact on operating results was positive inasmuch as it partially offset the impact of lower gross profit ratios. While magnitudes and directional patterns varied, all U.S. producers reported positive operating income during 2016‐18.26
Interest expense, other expenses, and net income or loss
As indicated above, *** included non‐recurring items as components of COGS and SG&A expenses (see footnotes 19, 22, 25). In contrast, *** reported non‐recurring items as part of other expenses below operating results.27 Table VI‐1 shows that, while period‐to‐period differences between the U.S. industry’s operating and net results narrowed in conjunction with changes in total interest expense and net other income and expenses, operating and net results followed the same directional trend throughout the period.
CAPITAL EXPENDITURES AND RESEARCH AND DEVELOPMENT EXPENSES
Table VI‐4 presents U.S. producers’ capital expenditures and research and development (R&D) expenses related to their threaded rod operations.
Table VI-4 Threaded rod: Capital expenditures and research and development (R&D) expenses of U.S. producers, 2016-18
* * * * * * *
23 In 2017, the decline in the U.S. industry’s SG&A expense ratio also reflects a lower level of SG&A expenses. In 2018, SG&A expenses increased at a slower rate compared to corresponding revenue (0.5 percent compared to 13.5 percent).
24 ***. Petitioner’s postconference brief (Attachment 8). 25 ***. *** U.S. producer questionnaire, response to III‐10. ***. *** U.S. producer questionnaire,
response to III‐10. 26 ***. 27 ***. *** U.S. producer questionnaires, responses to III‐10.

VI‐8
*** accounted for the substantial majority of total reported capital expenditures (*** percent),28 followed by *** (*** percent),29 *** (***percent),30 and *** (*** percent).31 *** and *** reported no capital expenditures during the period.
*** was the *** company to report R&D expenses during the period, which were reportedly for automation initiatives related to its continuing operations.32
ASSETS AND RETURN ON ASSETS
Table VI‐5 presents data on the U.S. producers’ total net assets and selected company‐specific operating return on net assets related to operations on threaded rod.33 34
Table VI-5 Threaded rod: U.S. producers’ total net assets and operating return on net assets, 2016-18
* * * * * * *
CAPITAL AND INVESTMENT
The Commission requested the U.S. producers of threaded rod to describe any actual or potential negative effects on their return on investment or its growth, investment, ability to raise capital, existing development and production efforts (including efforts to develop a derivative or more advanced version of the product), or the scale of capital investments as a result of imports of threaded rod from China, India, Taiwan and/or Thailand. Table VI‐6 tabulates the responses on actual negative effects on investment, growth and development, as
28 ***. *** U.S. producer questionnaire, response to III‐13 (note 1). 29 ***. *** U.S. producer questionnaire, response to III‐13 (note 1). 30 ***. *** U.S. producer questionnaire, response to III‐13 (note 1). 31 ***. *** U.S. producer questionnaire, response to III‐13 (note 1). While its overall threaded rod
capacity *** during the period, Bay Standard eliminated a production line dedicated to small diameter threaded rod. Conference transcript, p. 25 (Gross).
32 *** U.S. producer questionnaire, response to III‐13 (note 2). 33 With respect to a company’s overall operations, staff notes that a total asset value (i.e., the bottom
line value on the asset side of a company’s balance sheet) reflects an aggregation of a number of current and non‐current assets, which, in many instances, are not product specific. Allocation factors were presumably necessary to report total asset values specific to U.S. producers’ operations on threaded rod. The ability of U.S. producers to assign total asset values to discrete product lines affects the meaningfulness of operating return on net assets.
34 *** reported total asset information, which appears anomalous given calculated asset turnover ratios (total revenue divided by total assets), calculated operating return on assets, and, in one instance, total asset amounts that are less than corresponding estimated ending inventory. USITC auditor preliminary‐phase notes. Given these issues and while table VI‐5 presents the total assets reported by these companies, table VI‐5 does not present their corresponding operating return on assets.

VI‐9
well as anticipated negative effects.35 Table VI‐7 presents the narrative responses of the U.S. producers regarding actual and anticipated negative effects on investment, growth and development.
Table VI-6 Threaded rod: Negative effects of imports from subject sources on investment, growth, and development since January 1, 2016
Item No Yes Negative effects on investment 5 2
Cancellation, postponement, or rejection of expansion projects
1 Denial or rejection of investment proposal 0 Reduction in the size of capital investments 0 Return on specific investments negatively impacted 2 Other 0
Negative effects on growth and development 5 2 Rejection of bank loans
0 Lowering of credit rating 0 Problem related to the issue of stocks or bonds 0 Ability to service debt 0 Other 2
Anticipated negative effects of imports 4 3 Source: Compiled from data submitted in response to Commission questionnaires. Table VI-7 Threaded rod: Narrative responses of U.S. producers regarding actual and anticipated negative effects of imports from subject sources on investment, growth, and development since January 1, 2016
* * * * * * *
35 As indicated in footnote 2, ***.


VII‐1
PART VII: THREAT CONSIDERATIONS AND INFORMATION ON NONSUBJECT COUNTRIES
Section 771(7)(F)(i) of the Act (19 U.S.C. § 1677(7)(F)(i)) provides that— In determining whether an industry in the United States is threatened with material injury by reason of imports (or sales for importation) of the subject merchandise, the Commission shall consider, among other relevant economic factors1‐‐
(I) if a countervailable subsidy is involved, such information as may be presented to it by the administering authority as to the nature of the subsidy (particularly as to whether the countervailable subsidy is a subsidy described in Article 3 or 6.1 of the Subsidies Agreement), and whether imports of the subject merchandise are likely to increase,
(II) any existing unused production capacity or imminent, substantial increase in production capacity in the exporting country indicating the likelihood of substantially increased imports of the subject merchandise into the United States, taking into account the availability of other export markets to absorb any additional exports,
(III) a significant rate of increase of the volume or market penetration of imports of the subject merchandise indicating the likelihood of substantially increased imports,
(IV) whether imports of the subject merchandise are entering at prices that are likely to have a significant depressing or suppressing effect on domestic prices, and are likely to increase demand for further imports,
(V) inventories of the subject merchandise,
1 Section 771(7)(F)(ii) of the Act (19 U.S.C. § 1677(7)(F)(ii)) provides that “The Commission shall consider {these factors} . . . as a whole in making a determination of whether further dumped or subsidized imports are imminent and whether material injury by reason of imports would occur unless an order is issued or a suspension agreement is accepted under this title. The presence or absence of any factor which the Commission is required to consider . . . shall not necessarily give decisive guidance with respect to the determination. Such a determination may not be made on the basis of mere conjecture or supposition.”

VII‐2
(VI) the potential for product‐shifting if production facilities in the foreign country, which can be used to produce the subject merchandise, are currently being used to produce other products,
(VII) in any investigation under this title which involves imports of both a raw agricultural product (within the meaning of paragraph (4)(E)(iv)) and any product processed from such raw agricultural product, the likelihood that there will be increased imports, by reason of product shifting, if there is an affirmative determination by the Commission under section 705(b)(1) or 735(b)(1) with respect to either the raw agricultural product or the processed agricultural product (but not both),
(VIII) the actual and potential negative effects on the existing development and production efforts of the domestic industry, including efforts to develop a derivative or more advanced version of the domestic like product, and
(IX) any other demonstrable adverse trends that indicate the probability that there is likely to be material injury by reason of imports (or sale for importation) of the subject merchandise (whether or not it is actually being imported at the time).2
Information on the nature of the alleged subsidies was presented earlier in this report; information on the volume and pricing of imports of the subject merchandise is presented in Parts IV and V; and information on the effects of imports of the subject merchandise on U.S. producers’ existing development and production efforts is presented in Part VI. Information on inventories of the subject merchandise; foreign producers’ operations, including the potential for “product‐shifting;” any other threat indicators, if applicable; and any dumping in third‐country markets, follows. Also presented in this section of the report is information obtained for consideration by the Commission on nonsubject countries.
2 Section 771(7)(F)(iii) of the Act (19 U.S.C. § 1677(7)(F)(iii)) further provides that, in antidumping investigations, “. . . the Commission shall consider whether dumping in the markets of foreign countries (as evidenced by dumping findings or antidumping remedies in other WTO member markets against the same class or kind of merchandise manufactured or exported by the same party as under investigation) suggests a threat of material injury to the domestic industry.”

VII‐3
THE INDUSTRY IN CHINA
The Commission issued foreign producers’ or exporters’ questionnaires to 210 firms believed to produce and/or export threaded rod from China.3 The Commission did not receive a foreign producer/exporter questionnaire from any firms in China.
Brothers Holding Group is the self‐identified largest producer of threaded rod, engineering studs, chemical anchor studs, and tie rods in China. The company’s various facilities have a combined annual production capacity of 100,000 metric tons. Brothers Holding Group’s HAMCO facility in Haiyan, Zhejiang Province produces carbon and alloy threaded rod products and has a monthly production capacity of 2,000 metric tons. HAMCO supplies customers in the engineering, petrochemical, wind energy, construction, and other major industries, and a “high proportion” of the firm’s production is exported to customers worldwide.4
Zhejiang Junyue Standard Part Co., Ltd. is another major producer of threaded rods in China. According to the company’s website, it had a monthly threaded rod production rate between 4,000 to 5,000 metric tons, and an annual output that exceeds 60,000 metric tons. The company’s facility in Zhejiang Province, China has 125 sets of thread rollers and 2 galvanizing lines, in addition to 2 heat treating lines with the length of 12 meters. Zhejiang Junyue supplies “high‐end markets” and its products are exported primarily to customers in Europe, the United States, and Japan.5
Another major producer of threaded rod in China—Ningbo Zhongjiang High Strength Bolts Co., Ltd.—has a 30,000 metric ton annual capacity for high strength bolts, nuts, and threaded rods, and it primarily supplies markets in Europe, North America, the Middle East, and Southeast Asia.6 Ningbo’s threaded rod products are produced to ASTM standard specification A193 (in diameters ranging from ½ inch to 4 inches) and A320 (in diameters ranging from ½ inch to 2 and ½ inches) and are available in a variety of finishes.7
3 These firms were identified through a review of information submitted in the petition and contained in *** records.
4 HAMCO, “About HAMCO,” http://www.hamco‐allthread.com/about.asp, (accessed March 19, 2019).
5 Zhejiang Junyue Standard Part Co., Ltd., “Company,” http://www.zj‐junyue.com/about/company‐profile.html, (accessed March 19, 2019).
6 The firm’s share of total production that is devoted to threaded rod is not publically available. Ningo Zhongjiang High Strength Bolts Co., Ltd., “About Zongjiang,” http://www.zhongjiangfstn.com/en/about.html, (accessed March 22, 2019).
7 Ningo Zhongjiang High Strength Bolts Co., Ltd., “Thread Rods,” http://www.zhongjiangfstn.com/en/products/THREAD‐RODS.html, (accessed March 22, 2019).

VII‐4
Exports
According to GTA, the leading export markets for threaded screws and bolts (HS subheading 7318.15),8 a category which contains threaded rod and out‐of‐scope products, from China are the United States, Russia, and Japan (table IV‐1). During 2018, the United States was the top export market for threaded screws and bolts from China, accounting for 22.3 percent, followed by the Russia and Japan, accounting for 6.8 percent and 4.6 percent, respectively. Table VII-1 Threaded screws and bolts: Exports from China, 2016-18
Destination market Calendar year
2016 2017 2018 Quantity (1,000 pounds) Exports from China to the United States 672,406 681,381 798,520
Exports from China to other major destination markets.-- Russia 187,433 209,528 243,282
Japan 166,091 169,044 164,062 Germany 57,211 105,108 115,501 Australia 85,833 99,635 101,674 Mexico 79,747 75,325 88,254 South Korea 89,535 96,493 83,866 Vietnam 65,318 66,247 82,239 India 67,035 59,311 82,138 All other destination markets 1,466,852 1,608,471 1,818,932
Total exports from China 2,937,461 3,170,543 3,578,467 Value (1,000 dollars) Exports from China to the United States 441,721 483,227 646,064
Exports from China to other major destination markets.-- Russia 96,058 113,956 166,145
Japan 126,251 135,557 143,752 Germany 38,237 69,329 96,106 Australia 62,615 85,444 101,674 Mexico 53,786 56,244 72,109 South Korea 61,956 69,557 67,528 Vietnam 73,514 66,872 93,013 India 57,957 61,043 88,914 All other destination markets 1,130,315 1,259,581 1,598,081
Total exports from China 2,142,409 2,400,810 3,073,385 Table continued on next page.
8 The full description for product classified in HS 7318.15 is “threaded screws and bolts nesoi, with or without their nuts or washers, of iron or steel.”

VII‐5
Table VII-1--Continued Threaded screws and bolts: Exports from China, 2016-18
Destination market Calendar year
2016 2017 2018 Unit value (dollars per pound) Exports from China to the United States 0.66 0.71 0.81
Exports from China to other major destination markets.-- Russia 0.51 0.54 0.68
Japan 0.76 0.80 0.88 Germany 0.67 0.66 0.83 Australia 0.73 0.86 1.00 Mexico 0.67 0.75 0.82 South Korea 0.69 0.72 0.81 Vietnam 1.13 1.01 1.13 India 0.86 1.03 1.08 All other destination markets 0.77 0.78 0.88
Total exports from China 0.73 0.76 0.86 Share of quantity (percent) Exports from China to the United States 22.9 21.5 22.3
Exports from China to other major destination markets.-- Russia 6.4 6.6 6.8
Japan 5.7 5.3 4.6 Germany 1.9 3.3 3.2 Australia 2.9 3.1 2.8 Mexico 2.7 2.4 2.5 South Korea 3.0 3.0 2.3 Vietnam 2.2 2.1 2.3 India 2.3 1.9 2.3 All other destination markets 49.9 50.7 50.8
Total exports from China 100.0 100.0 100.0 Source: Official exports statistics under HS subheading 7318.15 as reported by China Customs in the Global Trade Atlas database, accessed March 15, 2019.

VII‐6
THE INDUSTRY IN INDIA
The Commission issued foreign producers’ or exporters’ questionnaires to six firms believed to produce and/or export threaded rod from India.9 Usable responses to the Commission’s questionnaire were received from four firms. These firms’ exports to the United States accounted for approximately *** percent of U.S. imports of threaded rod from India in 2018. Table VII‐2 presents information on the threaded rod operations of the responding producers and exporters in India.
Table VII-2 Threaded rod: Summary data for producers in India, 2018
Firm
Production (1,000
pounds)
Share of reported
production (percent)
Exports to the United States (1,000
pounds)
Share of reported exports to the United States
(percent)
Total shipments
(1,000 pounds)
Share of firm's total shipments exported
to the United States
(percent) Goodgood *** *** *** *** *** *** Kapson *** *** *** *** *** *** Mangal *** *** *** *** *** *** Maharaja *** *** *** *** *** ***
Total *** *** *** *** *** *** Source: Compiled from data submitted in response to Commission questionnaires.
Maharaja International (Maharaja) is a major Indian producer and exporter of fastener products, including threaded rod, nuts, and bolts. The firm’s website indicates that it supplies products to customers in the United States, Europe, and the Middle East. Maharaja has obtained “Export House” status under the Government of India’s Status Holder Scheme, which is reserved for Indian firms that have excelled in international trade and have successfully contributed to the country’s foreign trade.10 According to the Federation of Indian Export Organizations, firms can qualify for various export privileges depending on their rating under the program.11
9 These firms were identified through a review of information submitted in the petition and contained in *** records.
10 Maharaja International, “About Maharaja International,” http://www.maharajaindia.com/about‐threaded_rods‐bolts_nuts‐pipe_supports‐manufacturer‐exporter‐from‐ludhiana‐punjab‐india.html, (accessed March 28, 2019).
11 Mangal Steel, “Performance,” http://www.steelmangal.com/performance.htm, (accessed March 22, 2019); Federation of Indian Export Organizations, “Promotional Schemes,” https://www.fieo.org/view_section.php?lang=0&id=0,30,1700, (accessed March 22, 2019).

VII‐7
Mangal Steel is major producer of threaded rod in India. According to its website, the company imported advanced thread rolling machinery from the United States in order to produce threaded rods and studs up to 2 inches in diameter and 20 feet in length.12 Mangal Steel has also obtained “Export House” status and has received awards for “Highest Exporter with Continuous Excellence” under the Government of India’s Status Holder Scheme, which is reserved for Indian firms that have excelled in international trade and have successfully contributed to the country’s foreign trade.
Kapson India is another Indian producer and exporter of zinc plated, hot‐dip galvanized, BSW,13 and UNC14 threaded rods and offers products with diameters ranging from 5mm to 60mm (3/16 inch to 2.5 inches).15 The company supplies end users in the construction, manufacturing, and automotive industries throughout Europe, the United States, Africa, Asia, and the Middle East.
Concept Fasteners, another Indian producer and exporter of threaded rod, has a 75,000 square foot manufacturing facility in Ludhiana, Punjab, India that is equipped with bolt and nut formers, forging machines, and threaded machines, and zinc plating capabilities. The company’s website notes that the Ludhiana facility has a 12‐container capacity for threaded rod, compared to 3‐4 containers for channel nut, 4‐5 containers for tie rods, and 5‐containers for scaffolding.16
Kanika Exports (subsidiary of Kanika Group of Companies) is another major Indian producer of threaded rods, in addition to coil rods, hex nuts, and other fastener products. This company supplies customers in Europe, the Middle East, and Asia (Kanika Export’s website claims these regions serve as a “special export market base”), as well as firms in the United States and Canada.17 Kanika’s threaded rod products are produced to ASTM A36 and A307 and have a diameter ranging from ¼ inch to 2 inches (produced from low carbon steel). The company’s finishing capabilities include plain, electro‐zinc plated, hot‐dip galvanized, and stainless steel.18
12 Mangal Steel, “About Us,” http://www.steelmangal.com/aboutus.htm, (accessed March 22, 2019). 13 BSW refers to British Standard Whitworth, which is a common imperial‐unit based screw thread
standard. 14 UNC is the most common thread pitch measurement type. 15 Kapson India, “Threaded Rods,” https://kapsonindia.in/threadedrodmanufacturers.php, (accessed
March 22, 2019). 16 Concept Fasteners, “Manufacturer Facility,”
https://www.conceptfastners.com/Infrastructure.html, (accessed March 22, 2019). Container capacity generally indicates a firm’s ability to store and readily transport products by ship.
17 Kanika Exports, “Clients/Exports,” http://www.kanikagroup.in/exports.html, (accessed March 22, 2019).
18 Kanika Exports, “Threaded Rods/Bars,” http://www.kanikagroup.in/threaded‐rods.html, (accessed March 22, 2019).
VII‐8
Changes in operations
As presented in table VII‐3 producers in India reported several operational and organizational changes since January 1, 2016.
Table VII-3 Threaded rod: Indian producers' reported changes in operations, since January 1, 2016
* * * * * * *
Operations on threaded rod
Table VII‐4 presents information on the threaded rod operations of the responding producers and exporters in India. Capacity increased by *** percent from 2016 to 2018, while production decreased by *** percent during the same period. Capacity and production in 2019 and 2020 are projected to increase from 2018 levels. Exports to the United States decreased by *** percent, while exports to other markets increased by *** percent. Indian producers’ total home market shipments as a share of total shipments increased from *** percent to *** percent between 2016 and 2018, and are projected to increase in 2019 and 2020. Indian producers’ total exports as a share of total shipments decreased during 2016‐18 from *** percent to *** percent, and are projected to decrease *** in 2019 and 2020. Table VII-4 Threaded rod: Data for producers in India, 2016-18 and projected 2019 and 2020
* * * * * * *
Alternative products
As shown in table VII‐5, responding Indian firms produced other products on the same equipment and machinery used to produce threaded rod. *** responding firms reported production of alternative products with *** accounting for the majority. Other products include nut bolts and washers, stainless steel threaded rods, HDG truss rods, tie rods, anchor bolts, and pipe supports.
Table VII-5 Threaded rod: India producers' overall capacity and production on the same equipment as subject production, 2016-18
* * * * * * *

VII‐9
Exports
According to GTA, the leading export markets for threaded screws and bolts (HS subheading 7318.15),19 a category which contains threaded rod and out‐of‐scope products, from India are Germany, the United Kingdom, and the Netherlands, each accounting for 15.1 percent, 13.9 percent, and 10.7 percent during 2018, respectively (table IV‐6). During 2018, the United States was the fifth largest export market for threaded screws and bolts from India, accounting for 5.5 percent. Table VII-6 Threaded screws and bolts: Exports from India, 2016-18
Destination market Calendar year
2016 2017 2018 Quantity (1,000 pounds) Exports from India to the United States 15,837 12,550 15,200
Exports from India to other major destination markets.-- Germany 38,353 38,251 41,343
United Kingdom 40,440 36,763 38,163 Netherlands 47,296 37,284 29,346 Saudi Arabia 11,839 14,199 15,989 Italy 21,800 20,670 15,114 United Arab Emirates 11,135 12,761 11,947 Poland 9,599 8,605 9,893 Spain 15,707 8,624 8,211 All other destination markets 78,247 77,054 89,321
Total exports from India 290,251 266,761 274,527 Value (1,000 dollars) Exports from India to the United States 21,489 19,338 24,136
Exports from India to other major destination markets.-- Germany 39,495 44,323 53,030
United Kingdom 29,657 27,510 30,557 Netherlands 44,406 39,895 39,896 Saudi Arabia 7,525 9,314 11,177 Italy 22,744 23,106 20,503 United Arab Emirates 9,709 10,113 11,563 Poland 5,622 5,173 7,610 Spain 10,977 7,942 9,391 All other destination markets 67,108 70,968 85,523
Total exports from India 258,733 257,682 293,384 Table continued on next page.
19 The full description for product classified in HS 7318.15 is “threaded screws and bolts nesoi, with or without their nuts or washers, of iron or steel.”

VII‐10
Table VII-6--Continued Threaded screws and bolts: Exports from India, 2016-18
Destination market Calendar year
2016 2017 2018 Unit value (dollars per pound) Exports from India to the United States 1.36 1.54 1.59
Exports from India to other major destination markets.-- Germany 1.03 1.16 1.28
United Kingdom 0.73 0.75 0.80 Netherlands 0.94 1.07 1.36 Saudi Arabia 0.64 0.66 0.70 Italy 1.04 1.12 1.36 United Arab Emirates 0.87 0.79 0.97 Poland 0.59 0.60 0.77 Spain 0.70 0.92 1.14 All other destination markets 0.86 0.92 0.96
Total exports from India 0.89 0.97 1.07 Share of quantity (percent) Exports from India to the United States 5.5 4.7 5.5
Exports from India to other major destination markets.-- Germany 13.2 14.3 15.1
United Kingdom 13.9 13.8 13.9 Netherlands 16.3 14.0 10.7 Saudi Arabia 4.1 5.3 5.8 Italy 7.5 7.7 5.5 United Arab Emirates 3.8 4.8 4.4 Poland 3.3 3.2 3.6 Spain 5.4 3.2 3.0 All other destination markets 27.0 28.9 32.5
Total exports from India 100.0 100.0 100.0 Source: Official exports statistics under HS subheading 7318.15 as reported by Ministry of Commerce in the Global Trade Atlas database, accessed March 15, 2019.

VII‐11
THE INDUSTRY IN TAIWAN
The Commission issued foreign producers’ or exporters’ questionnaires to nine firms believed to produce and/or export threaded rod from Taiwan.20 Usable responses to the Commission’s questionnaire were received from three firms.21 These firms’ exports to the United States accounted for approximately *** percent of U.S. imports of threaded rod from Taiwan in 2018. According to estimates requested of the responding producers in Taiwan, the production of threaded rod in Taiwan reported in questionnaires accounts for approximately *** percent of overall production of threaded rod in Taiwan. Table VII‐7 presents information on the threaded rod operations of the responding producers and exporters in Taiwan.
Table VII-7 Threaded rod: Summary data for producers in Taiwan, 2018
Firm
Production (1,000
pounds)
Share of reported
production (percent)
Exports to the United States (1,000
pounds)
Share of reported exports to the United States
(percent)
Total shipments
(1,000 pounds)
Share of firm's total shipments exported
to the United States
(percent) Super Cheng *** *** *** *** *** *** Ta Chen *** *** *** *** *** *** Ying Ming *** *** *** *** *** ***
Total *** *** *** *** *** *** Source: Compiled from data submitted in response to Commission questionnaires.
Ta Chen is one of Taiwan’s and the world’s leading producers of steel, aluminum,
duplex, and nickel alloy products. The firm’s Taiwan operations have the following production capabilities: 3,000 metric tons a month for welded pipe; 1,100 tons per month for structural tubing; 650 tons per month for flat bar; 180 tons per month for butt‐weld fittings; and 100 tons per month for valves. Ta Chen also has operations in Canada, China, and the United States, and the company is a major supplier to customers in Europe and the United States.22
Ying Ming Industry Co. Ltd (Ying Ming) is a manufacturer of high‐strength fasteners in Taiwan and China. The company has integrated metal forming, heat‐treatment, and surface treatment operations at its manufacturing facility in Kaohsiung City, Taiwan.23 According to a representative from the firm, subject threaded rod produced by Ying Ming is used primarily in
20 These firms were identified through a review of information submitted in the petition and contained in *** records.
21 An additional firm, Easylink Industrial Co., Ltd., ***. 22 Ta Chen International Inc., “About Us,” https://www.tachen.com/aboutus.asp, (accessed March
28, 2019). 23 Fastener Key, “Ying Ming Industry CO., LTD.,” https://www.fastenerkey.com/directory/listing/ying‐
ming‐industry‐co‐ltd, (accessed April 1, 2019).

VII‐12
automotive‐related applications.24 Ying Ming became a tier‐1 fastener supplier25 to Ford North America in 2005; to AAT (joint venture of Ford and Mazda) in 2010; to Ford Australia, South Africa, and Argentina in 2011; and to Ford Thailand and India in 2013.26
Quintain Steel Co., Ltd. is a producer of carbon and alloy wire products and threaded rod in Taiwan. The company supplies ball thread27 and v‐thread28 threaded rod in Taiwan and to foreign customers and has a total annual capacity of 400,000 metric tons at its manufacturing facility in Tainan City, Taiwan.29
Super Cheng, a producer of alloy steel threaded rod in Taiwan, sells product with a variety of finishes, including plain, zinc plated, and special coating. According to the company’s website, Super Cheng has expanded its business into threaded rods, bolts, and sockets in recent years and exports over 90 percent of its products to customers in the United States, Canada, and Europe. The company has three manufacturing facilities throughout Taiwan, and two of these facilities possess wire‐drawing, material storage, and threaded rod manufacturing capabilities.30
Changes in operations
As presented in table VII‐8 producers in Taiwan reported the following operational and organizational changes since January 1, 2016.
Table VII-8 Threaded rod: Taiwan producers' reported changes in operations, since January 1, 2016
* * * * * * *
24 Conference transcript, p. 89 (Lui). 25 Tier‐1 suppliers are firms that supply parts directly to original equipment manufacturers (OEMs). 26 Ying Ming Industry Co. Ltd., “History,”
http://www.ymfastec.com/index.php?option=module&lang=en&task=pageinfo&id=100&index=2, (accessed April 1, 2019).
27 Ball thread generally refers to ball screws that have a ogival shape (‘gothic’ arch) thread formed from two arcs of the same radius. Nook, “Ball Screw Thread Form Terms,” http://www.nookindustries.com/LinearLibraryItem/Ball_Screw_Thread_Form_Terms, (accessed March 22, 2019).
28 V‐thread refers to screws that have a thread angle of 60 degrees. 29 Public data for threaded rod as a share of total production were not readily available. Quintain
Steel Co., Ltd., “Products,” http://www.quintain.com.tw/products‐3_62113‐english.html, (accessed March 20, 2019).
30 The company’s website does not specify if threaded rod is produced at the third facility. Super Cheng Industrial Co. LTD, “About Super Cheng,” https://www.supercheng.com.tw/en/#about, (accessed March 20, 2019).

VII‐13
Operations on threaded rod
Table VII‐9 presents information on the threaded rod operations of the responding producers and exporters in Taiwan. Capacity decreased by *** percent from 2016 to 2018, while production *** during the same period. Capacity and production in 2019 and 2020 are projected to decrease from 2018 levels. The vast majority of Taiwan producers’ shipments are exported. Exports to the United States *** between 2016 and 2018, while exports to other markets decreased by *** percent. Taiwan producers’ total home market shipments as a share of total shipments decreased from *** percent to *** percent between 2016 and 2018, and are projected to increase in 2020. Taiwan producers’ total exports as a share of total shipments also increased during 2016‐18, and are projected to remain the same in 2019 and 2020.
Table VII-9 Threaded rod: Data for producers in Taiwan, 2016-18 and projected 2019 and 2020
* * * * * * *
Alternative products
As shown in table VII‐10, responding Taiwan firms produced other products on the same equipment and machinery used to produce threaded rod. *** reported production of alternative products. ***.
Table VII-10 Threaded rod: Taiwan producers' overall capacity and production on the same equipment as subject production, 2016-18
* * * * * * *
Exports
According to GTA, the leading export markets for threaded screws and bolts (HS subheading 7318.15),31 a category which contains threaded rod and out‐of‐scope products, from Taiwan are the United States, Germany, and Japan (table VII‐11). During 2018, the United States was the top export market for threaded screws and bolts from Taiwan, accounting for 42.8 percent, followed by Germany and Japan, accounting for 9.8 percent and 5.4 percent, respectively.
31 The full description for product classified in HS 7318.15 is “threaded screws and bolts nesoi, with or without their nuts or washers, of iron or steel.”

VII‐14
Table VII-11 Threaded screws and bolts: Exports from Taiwan, 2016-18
Destination market Calendar year
2016 2017 2018 Quantity (1,000 pounds) Exports from Taiwan to the United States 731,495 777,659 851,547
Exports from Taiwan to other major destination markets.-- Germany 178,498 186,968 195,076
Japan 95,155 103,528 107,437 United Kingdom 87,847 82,014 77,029 Netherlands 67,929 68,319 71,255 Canada 40,657 54,783 61,756 Italy 46,313 46,666 49,762 Poland 44,793 47,309 48,130 Spain 30,634 29,567 35,086 All other destination markets 477,101 483,260 491,319
Total exports from Taiwan 1,800,423 1,880,073 1,988,397 Value (1,000 dollars) Exports from Taiwan to the United States 755,926 869,613 1,005,530
Exports from Taiwan to other major destination markets.-- Germany 179,369 210,622 246,154
Japan 111,871 129,154 144,846 United Kingdom 90,010 98,364 97,403 Netherlands 75,328 86,256 95,789 Canada 44,296 58,093 71,352 Italy 42,639 49,989 55,648 Poland 31,980 35,581 41,065 Spain 27,018 29,597 37,182 All other destination markets 559,643 627,884 683,524
Total exports from Taiwan 1,918,080 2,195,153 2,478,493 Table continued on next page.
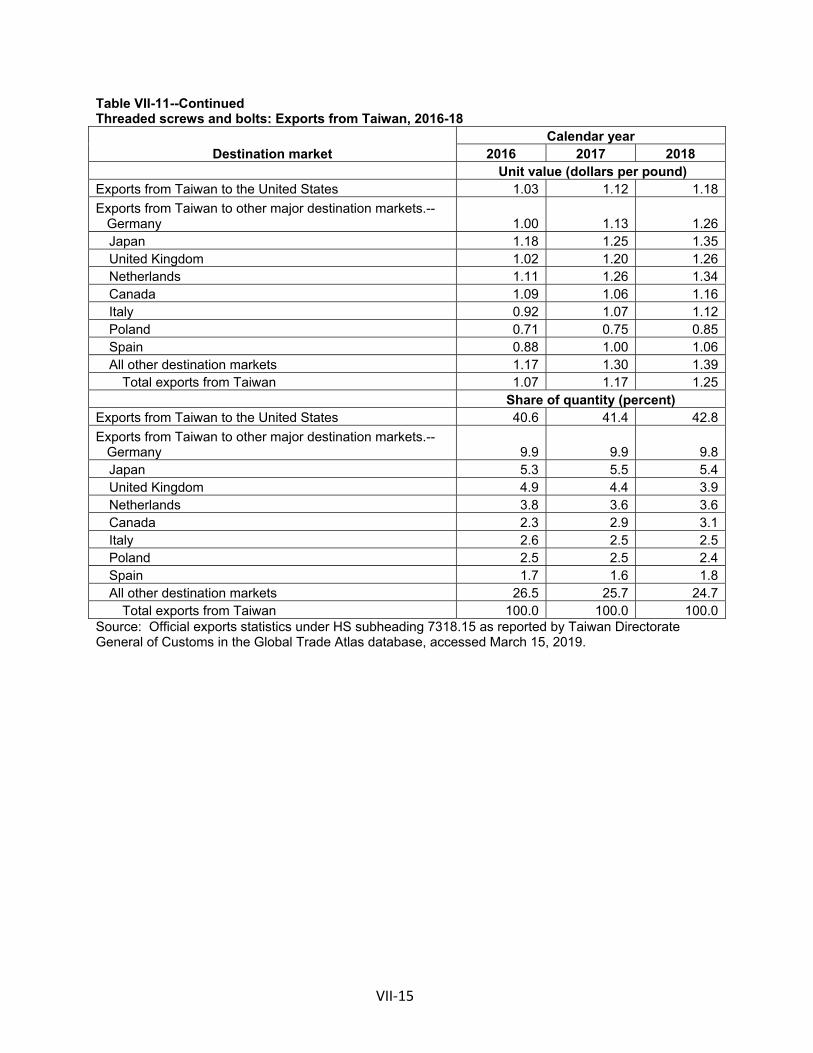
VII‐15
Table VII-11--Continued Threaded screws and bolts: Exports from Taiwan, 2016-18
Destination market Calendar year
2016 2017 2018 Unit value (dollars per pound) Exports from Taiwan to the United States 1.03 1.12 1.18
Exports from Taiwan to other major destination markets.-- Germany 1.00 1.13 1.26
Japan 1.18 1.25 1.35 United Kingdom 1.02 1.20 1.26 Netherlands 1.11 1.26 1.34 Canada 1.09 1.06 1.16 Italy 0.92 1.07 1.12 Poland 0.71 0.75 0.85 Spain 0.88 1.00 1.06 All other destination markets 1.17 1.30 1.39
Total exports from Taiwan 1.07 1.17 1.25 Share of quantity (percent) Exports from Taiwan to the United States 40.6 41.4 42.8
Exports from Taiwan to other major destination markets.-- Germany 9.9 9.9 9.8
Japan 5.3 5.5 5.4 United Kingdom 4.9 4.4 3.9 Netherlands 3.8 3.6 3.6 Canada 2.3 2.9 3.1 Italy 2.6 2.5 2.5 Poland 2.5 2.5 2.4 Spain 1.7 1.6 1.8 All other destination markets 26.5 25.7 24.7
Total exports from Taiwan 100.0 100.0 100.0 Source: Official exports statistics under HS subheading 7318.15 as reported by Taiwan Directorate General of Customs in the Global Trade Atlas database, accessed March 15, 2019.

VII‐16
THE INDUSTRY IN THAILAND
The Commission issued foreign producers’ or exporters’ questionnaires to five firms believed to produce and/or export threaded rod from Thailand.32 The Commission did not receive a foreign producer/exporter questionnaire from any firms in Thailand.
Tycoons Worldwide Group (Thailand) Public Co. Ltd. is a major Thai producer of threaded rod, wire rod, reinforcing bar, annealed wire, and other steel products and is believed to be the sole midstream to downstream vertically integrated producer of these products in Thailand. All of Tycoon’s production takes place at the company’s Rayong, Thailand facility. In 2017, Tycoon estimated its annual production capacity for steel wire rod, annealed wire, screws, and bolts at 360,000 metric tons, 144,000 metric tons, 17,108 metric tons, and 36,000 metric tons, respectively.33
Tong Heer Fasteners, a subsidiary of TONG Group, is another producer of steel bolts, screws, stud bolts, and threaded rods in Thailand. The firm opened its Chon Buri, Thailand operations in 2005, and supplies customers in the solar energy, petrochemical, machine assembling, food machinery, telecommunication, and construction industries.34
Exports
According to GTA, the leading export markets for threaded screws and bolts (HS subheading 7318.15),35 a category which contains threaded rod and out‐of‐scope products, from Thailand are the Germany, the United States, and the United Kingdom (table VII‐12). Germany, the United States, and the United Kingdom accounted for 20.2 percent, 18.5 percent, and 8.4 percent of exports of threaded screws and bolts from Thailand during 2018, respectively.
32 These firms were identified through a review of information submitted in the petition and contained in *** records.
33 No specific breakout was provided for threaded rod. Tycoons Worldwide Group, “Investor Relations: Annual Report 2017,” http://ir.tycons.com/english/meeting/agm2018/5annual_report_3_E.pdf, (accessed March 20, 2019), p. 1.
34 Tong Heer Fasteners Co. Sdn. Bhd., “Products,” http://www.tong.com.my/page/new/thai/product.aspx, (accessed March 20, 2019); Tong Herr Resources Berhad, “History and Businesses,” http://www.tong.com.my/page/new/history_business.aspx, (accessed March 20, 2019).
35 The full description for product classified in HS 7318.15 is “threaded screws and bolts nesoi, with or without their nuts or washers, of iron or steel.”

VII‐17
Table VII-12 Threaded screws and bolts: Exports from Thailand, 2016-18
Destination market Calendar year
2016 2017 2018 Quantity (1,000 pounds) Exports from Thailand to the United States 35,098 38,225 48,730
Exports from Thailand to other major destination markets.-- Germany 49,484 44,350 53,387
United Kingdom 16,960 19,192 22,200 Netherlands 13,260 18,289 18,233 India 11,758 14,588 17,564 Italy 27,885 17,663 17,081 Indonesia 10,039 11,113 10,656 Japan 6,883 6,422 6,998 Argentina 4,200 5,249 6,140 All other destination markets 52,603 60,547 62,820
Total exports from Thailand 228,170 235,639 263,809 Value (1,000 dollars) Exports from Thailand to the United States 32,850 41,809 60,350
Exports from Thailand to other major destination markets.-- Germany 29,400 26,572 38,393
United Kingdom 10,955 12,167 18,387 Netherlands 7,663 13,441 16,609 India 28,143 34,887 41,779 Italy 21,264 15,308 15,889 Indonesia 20,310 23,988 27,164 Japan 12,666 12,414 15,840 Argentina 8,728 12,204 15,049 All other destination markets 91,287 103,392 111,690
Total exports from Thailand 263,266 296,183 361,149 Table continued on next page.

VII‐18
Table VII-12--Continued Threaded screws and bolts: Exports from Thailand, 2016-18
Destination market Calendar year
2016 2017 2018 Unit value (dollars per pound) Exports from Thailand to the United States 0.94 1.09 1.24
Exports from Thailand to other major destination markets.-- Germany 0.59 0.60 0.72
United Kingdom 0.65 0.63 0.83 Netherlands 0.58 0.73 0.91 India 2.39 2.39 2.38 Italy 0.76 0.87 0.93 Indonesia 2.02 2.16 2.55 Japan 1.84 1.93 2.26 Argentina 2.08 2.32 2.45 All other destination markets 1.74 1.71 1.78
Total exports from Thailand 1.15 1.26 1.37 Share of quantity (percent) Exports from Thailand to the United States 15.4 16.2 18.5
Exports from Thailand to other major destination markets.-- Germany 21.7 18.8 20.2
United Kingdom 7.4 8.1 8.4 Netherlands 5.8 7.8 6.9 India 5.2 6.2 6.7 Italy 12.2 7.5 6.5 Indonesia 4.4 4.7 4.0 Japan 3.0 2.7 2.7 Argentina 1.8 2.2 2.3 All other destination markets 23.1 25.7 23.8
Total exports from Thailand 100.0 100.0 100.0 Source: Official exports statistics under HS subheading 7318.15 as reported by Thai Customs Department in the Global Trade Atlas database, accessed March 15, 2019.
SUBJECT COUNTRIES COMBINED
Table VII‐13 presents summary data on threaded rod operations of the reporting subject producers in the subject countries. Table VII-13 Threaded rod: Data on the industry in subject countries, 2016-18 and projected 2019 and 2020
* * * * * * *
U.S. INVENTORIES OF IMPORTED MERCHANDISE
Table VII‐14 presents data on U.S. importers’ reported inventories of threaded rod. Inventories of subject imports increased by 22.4 percent between 2016 and 2018. The ratio of importers’ inventories to subject shipments of imports ranged from 43.1 and 53.2 percent

VII‐19
during 2016‐18, while the ratio of inventories to shipments of imports from nonsubject sources ranged from *** to *** percent during the same period. Table VII-14 Threaded rod: U.S. importers’ inventories, 2016-18
Item Calendar year
2016 2017 2018 Inventories (1,000 pounds); Ratios (percent)
Imports from China Inventories *** *** *** Ratio to U.S. imports *** *** *** Ratio to U.S. shipments of imports *** *** ***
Ratio to total shipments of imports *** *** ***
Imports from India: Inventories *** *** *** Ratio to U.S. imports *** *** *** Ratio to U.S. shipments of imports *** *** ***
Ratio to total shipments of imports *** *** ***
Imports from Taiwan: Inventories *** *** *** Ratio to U.S. imports *** *** *** Ratio to U.S. shipments of imports *** *** ***
Ratio to total shipments of imports *** *** ***
Imports from all Thailand: Inventories *** *** *** Ratio to U.S. imports *** *** *** Ratio to U.S. shipments of imports *** *** ***
Ratio to total shipments of imports *** *** ***
Imports from all subject sources: Inventories 44,757 43,325 54,788 Ratio to U.S. imports 49.8 43.3 46.8 Ratio to U.S. shipments of imports 53.2 43.1 52.4
Ratio to total shipments of imports 52.7 42.7 51.8
Imports from all nonsubject sources: Inventories *** *** *** Ratio to U.S. imports *** *** *** Ratio to U.S. shipments of imports *** *** ***
Ratio to total shipments of imports *** *** ***
Imports from all sources: Inventories *** *** *** Ratio to U.S. imports *** *** *** Ratio to U.S. shipments of imports *** *** ***
Ratio to total shipments of imports *** *** *** Source: Compiled from data submitted in response to Commission questionnaires.

VII‐20
U.S. IMPORTERS’ OUTSTANDING ORDERS
The Commission requested importers to indicate whether they imported or arranged for the importation of threaded rod after December 31, 2018. Thirty‐six of 47 responding firms indicated that they had arranged such imports. These data are presented in table VII‐15.
Table VII-15
Threaded rod: Arranged imports, January 2019 through December 2019
* * * * * * *
ANTIDUMPING OR COUNTERVAILING DUTY ORDERS IN THIRD‐COUNTRY MARKETS
The petitioner reported no countervailing or antidumping duty orders on threaded rod from China, India, Taiwan, and Thailand other than the antidumping order on U.S. imports of carbon threaded rod from China.36 A review of quarterly notifications to the World Trade Organization’s Committee on Anti‐Dumping Practices found no additional orders on the subject product in third‐country markets.37
INFORMATION ON NONSUBJECT COUNTRIES
As previously indicated in table IV‐2, Malaysia, the Philippines, Germany, and Korea were the leading nonsubject sources of U.S. imports of threaded rod in 2018.
Table VII‐16 presents the leading exporters of threaded screws and bolts (HS 7318.15),38 which includes threaded rod and out‐of‐scope products, from 2016 to 2018. Total world exports of threaded screws and bolts increased by 12.8 percent between 2016 and 2017.39 China accounted for the largest share of global exports, by quantity, in 2017 (25.8 percent), followed by Taiwan (15.3 percent) and the United States (9.5 percent).
36 Conference transcript, p. 69‐70 (Drake). 37 World Trade Organization, “Anti‐dumping,”
https://www.wto.org/english/tratop_e/adp_e/adp_e.htm, (accessed March 18, 2019). 38 The full description for product classified in HS 7318.15 is “threaded screws and bolts nesoi, with
or without their nuts or washers, of iron or steel.” 39 Data for 2018 are not yet available for many reporting countries.

VII‐21
Table VII-16 Threaded screws and bolts: Global exports by exporter, 2016-18
Exporter Calendar year
2016 2017 2018 Quantity (1,000 pounds) United States 856,817 1,163,374 1,164,084
Subject sources.-- China 2,937,461 3,170,543 3,578,467
India 290,251 266,761 274,527 Taiwan 1,800,423 1,880,073 1,988,397 Thailand 228,170 235,639 263,809
Subject global exports 5,256,305 5,553,016 6,105,201
All other major reporting exporters.-- Germany 972,037 1,071,487
(1)
Italy 684,961 742,247 Singapore 157,575 564,024 Japan 478,725 499,526 Netherlands 298,399 373,323 South Korea 308,476 299,808 France 176,528 201,798 Poland 150,085 161,903 Spain 151,996 158,218 Turkey 126,285 156,638 All other exporters 2,152,702 2,528,644
Total global exports 10,914,075 12,310,633 Value (1,000 dollars) United States 2,033,430 2,086,509 2,041,317 Subject sources.-- China 2,142,409 2,400,810 3,073,385
India 258,733 257,682 293,384 Taiwan 1,918,080 2,195,153 2,478,493 Thailand 263,266 296,183 361,149
Subject global exports 4,582,488 5,149,828 6,206,411
All other major reporting exporters.-- Germany 2,504,393 2,758,730
(1)
Italy 1,110,235 1,226,090 Singapore 132,840 133,984 Japan 1,491,961 1,572,629 Netherlands 447,176 554,113 South Korea 526,046 506,617 France 532,610 606,229 Poland 213,192 238,507 Spain 278,477 295,862 Turkey 155,850 187,935 All other exporters 4,676,447 4,886,486
Total global exports 16,651,715 18,117,009 Table continued on next page.

VII‐22
Table VII-16--Continued Threaded rod: Global exports by exporter, 2016-18
Exporter Calendar year
2016 2017 2018 Unit value (dollars per pound) United States 2.37 1.79 1.75
Subject sources.-- China 0.73 0.76 0.86
India 0.89 0.97 1.07 Taiwan 1.07 1.17 1.25 Thailand 1.15 1.26 1.37
Subject global exports 0.87 0.93 1.02
All other major reporting exporters.-- Germany 2.58 2.57
(1)
Italy 1.62 1.65 Singapore 0.84 0.24 Japan 3.12 3.15 Netherlands 1.50 1.48 South Korea 1.71 1.69 France 3.02 3.00 Poland 1.42 1.47 Spain 1.83 1.87 Turkey 1.23 1.20 All other exporters 2.17 1.93
Total global exports 1.53 1.47 Share of quantity (percent) United States 7.9 9.5 (1)
Subject sources.-- China 26.9 25.8
India 2.7 2.2 Taiwan 16.5 15.3 Thailand 2.1 1.9
Subject global exports 48.2 45.1
All other major reporting exporters.-- Germany 8.9 8.7
Italy 6.3 6.0 Singapore 1.4 4.6 Japan 4.4 4.1 Netherlands 2.7 3.0 South Korea 2.8 2.4 France 1.6 1.6 Poland 1.4 1.3 Spain 1.4 1.3 Turkey 1.2 1.3 All other exporters 19.7 20.5
Total global exports 100.0 100.0 1 Export statistics for many reporting statistical authorities are not yet available for 2018.
Source: Official exports statistics under HS subheading 7318.15 reported by various national statistical authorities in the Global Trade Atlas database, accessed March 18, 2019.

A‐1
APPENDIX A
FEDERAL REGISTER NOTICES


A‐3
The Commission makes available notices relevant to its investigations and reviews on its website, www.usitc.gov. In addition, the following tabulation presents, in chronological order, Federal Register notices issued by the Commission and Commerce during the current proceeding.
Citation Title Link 84 FR 6817, February 28, 2019
Carbon and Alloy Steel Threaded Rod From China, India, Taiwan, and Thailand; Institution of Antidumping and Countervailing Duty Investigations and Scheduling of Preliminary Phase Investigations
https://www.govinfo.gov/content/pkg/FR-2019-02-28/pdf/2019-03450.pdf
84 FR 10034, March 19, 2019
Carbon and Alloy Steel Threaded Rod From India, Taiwan, Thailand, and the People’s Republic of China: Initiation of Less-Than-Fair-Value Investigations
https://www.govinfo.gov/content/pkg/FR-2019-03-19/pdf/2019-05136.pdf
84 FR 10040, March 19, 2019
Carbon and Alloy Steel Threaded Rod From India and the People’s Republic of China: Initiation of Countervailing Duty Investigations
https://www.govinfo.gov/content/pkg/FR-2019-03-19/pdf/2019-05138.pdf


B‐1
APPENDIX B
LIST OF STAFF CONFERENCE WITNESSES


B‐3
CALENDAR OF PUBLIC PRELIMINARY CONFERENCE
Those listed below appeared as witnesses at the United States International Trade Commission’s preliminary conference:
Subject: Carbon and Alloy Steel Threaded Rod from China, India, Taiwan, and Thailand
Inv. Nos.: 701-TA-618-619 and 731-TA-1441-1444 (Preliminary)
Date and Time: March 14, 2019 - 9:30 a.m.
Sessions were held in connection with these preliminary phase investigations in the Main Hearing Room (Room 101), 500 E Street, SW., Washington, DC. EMBASSY APPEARANCE: Taipei Economic and Cultural Representative Office in the United States Washington, DC
James, Chih-tang Tsai, Economic Division
OPENING REMARKS: In Support of Imposition (Luke A. Meisner, Schagrin Associates) In Support of the Imposition of
Antidumping and Countervailing Duty Orders: Schagrin Associates Washington, DC on behalf of Vulcan Threaded Products, Inc.
Dennis Black, General Manager, Vulcan Threaded Products, Inc.
Alan Logan, Customer Service Manager, Vulcan Threaded Products, Inc.
Brent Jenkins, Bar Mill Product & Marketing Manager,
Vulcan Threaded Products, Inc.

B‐4
In Support of the Imposition of Antidumping and Countervailing Duty Orders (continued):
Walter Gross, President, Bay Standard Manufacturing, Inc.
Roger B. Schagrin ) Elizabeth J. Drake ) – OF COUNSEL Luke A. Meisner ) INTERESTED PARTY IN OPPOSITION: Ying Ming Industry Co., Ltd Kaohsiung City, Taiwan
Carol Liu, Project Manager REBUTTAL/CLOSING REMARKS: In Support of Imposition (Elizabeth J. Drake, Schagrin Associates)
-END-

C‐1
APPENDIX C
SUMMARY DATA


Table C-1Threaded rod: Summary data concerning the U.S. market, 2016-18
2016 2017 2018 2016-18 2016-17 2017-18
U.S. consumption quantity:Amount................................................ 285,848 320,883 363,833 27.3 12.3 13.4Producers' share (fn1).......................... 46.0 43.9 38.8 (7.2) (2.2) (5.1)Importers' share (fn1):
China................................................ 16.3 23.2 29.2 12.9 6.9 6.0India.................................................. 20.5 20.9 19.2 (1.2) 0.5 (1.7)Taiwan.............................................. 9.1 6.1 6.9 (2.2) (3.0) 0.8Thailand............................................ 4.2 3.2 3.3 (0.9) (1.0) 0.1
Subject sources............................. 50.1 53.5 58.6 8.6 3.4 5.2Nonsubject sources........................ 3.9 2.7 2.5 (1.4) (1.3) (0.1)
All import sources....................... 54.0 56.1 61.2 7.2 2.2 5.1
U.S. consumption value:Amount................................................ 184,001 210,838 270,798 47.2 14.6 28.4Producers' share (fn1).......................... 52.3 50.2 44.4 (7.9) (2.1) (5.8)Importers' share (fn1):
China................................................ 16.8 23.2 30.2 13.5 6.4 7.0India.................................................. 13.4 13.9 12.8 (0.6) 0.6 (1.1)Taiwan.............................................. 7.2 5.4 5.5 (1.6) (1.8) 0.2Thailand............................................ 2.8 2.3 2.3 (0.5) (0.5) (0.0)
Subject sources............................. 40.1 44.9 50.9 10.8 4.7 6.0Nonsubject sources........................ 7.6 5.0 4.7 (2.9) (2.6) (0.2)
All import sources....................... 47.7 49.8 55.6 7.9 2.1 5.8
U.S. imports from:China:
Quantity............................................ 46,598 74,442 106,144 127.8 59.8 42.6Value................................................. 30,853 48,940 81,907 165.5 58.6 67.4Unit value.......................................... $0.66 $0.66 $0.77 16.5 (0.7) 17.4Ending inventory quantity.................. *** *** *** *** *** ***
India:Quantity............................................ 58,461 67,154 69,912 19.6 14.9 4.1Value................................................. 24,620 29,388 34,741 41.1 19.4 18.2Unit value.......................................... $0.42 $0.44 $0.50 18.0 3.9 13.6Ending inventory quantity.................. *** *** *** *** *** ***
Taiwan:Quantity............................................ 26,037 19,636 25,275 (2.9) (24.6) 28.7Value................................................. 13,227 11,341 15,013 13.5 (14.3) 32.4Unit value.......................................... $0.51 $0.58 $0.59 16.9 13.7 2.8Ending inventory quantity.................. *** *** *** *** *** ***
Table continued on next page.
C-3
Calendar year Calendar yearReported data Period changes
(Quantity=1,000 pounds; Value=1,000 dollars; Unit values, unit labor costs, and unit expenses=dollars per pound; Period changes=percent--exceptions noted)

Table C-1--ContinuedThreaded rod: Summary data concerning the U.S. market, 2016-18
2016 2017 2018 2016-18 2016-17 2017-18
U.S. imports from:--ContinuedThailand:
Quantity............................................ 11,976 10,317 12,020 0.4 (13.9) 16.5Value................................................. 5,133 4,913 6,192 20.6 (4.3) 26.0Unit value.......................................... $0.43 $0.48 $0.52 20.2 11.1 8.2Ending inventory quantity.................. *** *** *** *** *** ***
Subject sources:Quantity............................................ 143,073 171,548 213,350 49.1 19.9 24.4Value................................................. 73,833 94,582 137,853 86.7 28.1 45.8Unit value.......................................... $0.52 $0.55 $0.65 25.2 6.8 17.2Ending inventory quantity.................. 44,757 43,325 54,788 22.4 (3.2) 26.5
Nonsubject sources:Quantity............................................ 11,190 8,541 9,271 (17.1) (23.7) 8.6Value................................................. 13,947 10,448 12,781 (8.4) (25.1) 22.3Unit value.......................................... $1.25 $1.22 $1.38 10.6 (1.9) 12.7Ending inventory quantity.................. *** *** *** *** *** ***
All import sources:Quantity............................................ 154,262 180,089 222,621 44.3 16.7 23.6Value................................................. 87,780 105,030 150,634 71.6 19.7 43.4Unit value.......................................... $0.57 $0.58 $0.68 18.9 2.5 16.0Ending inventory quantity.................. *** *** *** *** *** ***
U.S. producers':Average capacity quantity.................... 263,665 246,912 247,163 (6.3) (6.4) 0.1Production quantity.............................. 132,121 137,671 145,235 9.9 4.2 5.5Capacity utilization (fn1)....................... 50.1 55.8 58.8 8.7 5.6 3.0U.S. shipments:
Quantity............................................ 131,586 140,794 141,212 7.3 7.0 0.3Value................................................. 96,221 105,808 120,164 24.9 10.0 13.6Unit value.......................................... $0.73 $0.75 $0.85 16.4 2.8 13.2
Export shipments:Quantity............................................ *** *** *** *** *** ***Value................................................. *** *** *** *** *** ***Unit value.......................................... *** *** *** *** *** ***
Ending inventory quantity..................... 21,722 18,457 22,158 2.0 (15.0) 20.1Inventories/total shipments (fn1).......... *** *** *** *** *** ***
Table continued on next page.
C-4
(Quantity=1,000 pounds; Value=1,000 dollars; Unit values, unit labor costs, and unit expenses=dollars per pound; Period changes=percent--exceptions noted)
Reported data Period changesCalendar year Calendar year

Table C-1--ContinuedThreaded rod: Summary data concerning the U.S. market, 2016-18
2016 2017 2018 2016-18 2016-17 2017-18
U.S. producers':--ContinuedProduction workers.............................. 280 312 293 4.6 11.4 (6.1)Hours worked (1,000s)......................... 598 664 634 6.0 11.0 (4.5)Wages paid ($1,000)............................ 10,857 13,250 13,053 20.2 22.0 (1.5)Hourly wages (dollars per hour)........... $18.16 $19.95 $20.59 13.4 9.9 3.2Productivity (pounds per hour)............. 220.9 207.3 229.1 3.7 (6.2) 10.5Unit labor costs.................................... $0.08 $0.10 $0.09 9.4 17.1 (6.6)Net sales:
Quantity............................................ 132,186 140,970 141,347 6.9 6.6 0.3Value................................................. 96,692 105,864 120,200 24.3 9.5 13.5Unit value.......................................... $0.73 $0.75 $0.85 16.3 2.7 13.2
Cost of goods sold (COGS).................. 69,297 82,791 95,045 37.2 19.5 14.8Gross profit or (loss)............................ 27,395 23,073 25,155 (8.2) (15.8) 9.0SG&A expenses................................... 14,052 13,702 13,768 (2.0) (2.5) 0.5Operating income or (loss)................... 13,343 9,371 11,387 (14.7) (29.8) 21.5Net income or (loss)............................. 11,507 7,689 10,119 (12.1) (33.2) 31.6Capital expenditures............................ *** *** *** *** *** ***Unit COGS........................................... $0.52 $0.59 $0.67 28.3 12.0 14.5Unit SG&A expenses........................... $0.11 $0.10 $0.10 (8.4) (8.6) 0.2Unit operating income or (loss)............ $0.10 $0.07 $0.08 (20.2) (34.1) 21.2Unit net income or (loss)...................... $0.09 $0.05 $0.07 (17.8) (37.3) 31.3COGS/sales (fn1)................................. 71.7 78.2 79.1 7.4 6.5 0.9Operating income or (loss)/sales (fn1). 13.8 8.9 9.5 (4.3) (4.9) 0.6Net income or (loss)/sales (fn1)........... 11.9 7.3 8.4 (3.5) (4.6) 1.2
Notes:
fn1.--Reported data are in percent and period changes are in percentage points.fn2.--Undefined.
(Quantity=1,000 pounds; Value=1,000 dollars; Unit values, unit labor costs, and unit expenses=dollars per pound; Period changes=percent--exceptions noted)
C-5
Source: Compiled from data submitted in response to Commission questionnaires and official U.S. import statistics using statistical reporting numbers 7318.15.5051 and 7318.15.5056, accessed March 13, 2019.
Reported data Period changesCalendar year Calendar year

Copyright © 2022 FDOKUMEN