Dynamic cache contention detection in multi-threaded applications
12
Dynamic Cache Contention Detection in Multi-threaded Applications Citation Zhao, Qin et al. “Dynamic Cache Contention Detection in Multi- threaded Applications.” Proceedings of the 7th ACM SIGPLAN/SIGOPS International Conference on Virtual Execution Environments - VEE ’11. Newport Beach, California, USA, 2011. 27. Copyright c2011 ACM As Published http://dx.doi.org/10.1145/1952682.1952688 Publisher Association for Computing Machinery / ACM Special Interest Group on Programming Languages./ ACM Special Interest Group in Operating Systems. Version Author's final manuscript Accessed Sun Apr 15 14:48:47 EDT 2012 Citable Link http://hdl.handle.net/1721.1/62586 Terms of Use Creative Commons Attribution-Noncommercial-Share Alike 3.0 Detailed Terms http://creativecommons.org/licenses/by-nc-sa/3.0/
-
Upload
independent -
Category
Documents
-
view
3 -
download
0
Transcript of Dynamic cache contention detection in multi-threaded applications

Dynamic Cache Contention Detection in Multi-threadedApplications
Citation Zhao, Qin et al. “Dynamic Cache Contention Detection in Multi-threaded Applications.” Proceedings of the 7th ACMSIGPLAN/SIGOPS International Conference on Virtual ExecutionEnvironments - VEE ’11. Newport Beach, California, USA, 2011.27. Copyrightc2011 ACM
As Published http://dx.doi.org/10.1145/1952682.1952688
Publisher Association for Computing Machinery / ACM Special InterestGroup on Programming Languages./ ACM Special InterestGroup in Operating Systems.
Version Author's final manuscript
Accessed Sun Apr 15 14:48:47 EDT 2012
Citable Link http://hdl.handle.net/1721.1/62586
Terms of Use Creative Commons Attribution-Noncommercial-Share Alike 3.0
Detailed Terms http://creativecommons.org/licenses/by-nc-sa/3.0/
Dynamic Cache Contention Detectionin Multi-threaded Applications
Qin Zhao David Koh Syed RazaSaman Amarasinghe
Computer Science and Artificial Intelligence LaboratoryMassachusetts Institute of Technology
Cambridge, MA, USA{qin zhao, dkoh, raza, saman}@csail.mit.edu
Derek Bruening Weng-Fai Wong
Google Inc School of ComputingMountain View National University of Singapore
CA, USA [email protected] [email protected]
AbstractIn today’s multi-core systems, cache contention due to true andfalse sharing can cause unexpected and significant performancedegradation. A detailed understanding of a given multi-threadedapplication’s behavior is required to precisely identify such perfor-mance bottlenecks. Traditionally, however, such diagnostic infor-mation can only be obtained after lengthy simulation of the mem-ory hierarchy.
In this paper, we present a novel approach that efficiently ana-lyzes interactions between threads to determine thread correlationand detect true and false sharing. It is based on the following keyinsight: although the slowdown caused by cache contention de-pends on factors including the thread-to-core binding and param-eters of the memory hierarchy, the amount of data sharing is pri-marily a function of the cache line size and application behavior.Using memory shadowing and dynamic instrumentation, we im-plemented a tool that obtains detailed sharing information betweenthreads without simulating the full complexity of the memory hi-erarchy. The runtime overhead of our approach — a 5× slowdownon average relative to native execution — is significantly less thanthat of detailed cache simulation. The information collected allowsprogrammers to identify the degree of cache contention in an appli-cation, the correlation among its threads, and the sources of signif-icant false sharing. Using our approach, we were able to improvethe performance of some applications by up to a factor of 12×.For other contention-intensive applications, we were able to shedlight on the obstacles that prevent their performance from scalingto many cores.
Categories and Subject Descriptors D.3.4 [Programming Lan-guages]: Processors – Optimization, Run-time environments
General Terms Performance
Keywords False Sharing, Cache Contention, Shadow Memory,Dynamic Instrumentation
Permission to make digital or hard copies of all or part of this work for personal orclassroom use is granted without fee provided that copies are not made or distributedfor profit or commercial advantage and that copies bear this notice and the full citationon the first page. To copy otherwise, to republish, to post on servers or to redistributeto lists, requires prior specific permission and/or a fee.VEE’11, March 9–11, 2011, Newport Beach, California, USA.Copyright c© 2011 ACM 978-1-4503-0501-3/11/03. . . $10.00
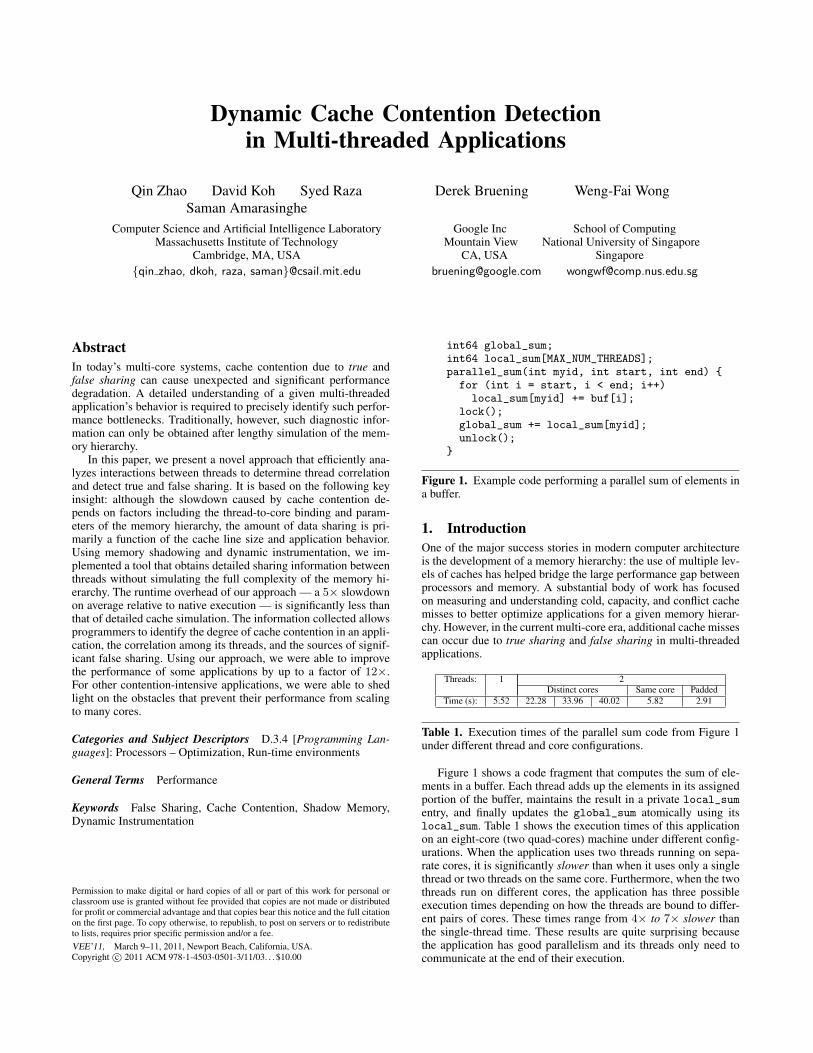
int64 global_sum;int64 local_sum[MAX_NUM_THREADS];parallel_sum(int myid, int start, int end) {for (int i = start, i < end; i++)
local_sum[myid] += buf[i];lock();global_sum += local_sum[myid];unlock();
}
Figure 1. Example code performing a parallel sum of elements ina buffer.
1. IntroductionOne of the major success stories in modern computer architectureis the development of a memory hierarchy: the use of multiple lev-els of caches has helped bridge the large performance gap betweenprocessors and memory. A substantial body of work has focusedon measuring and understanding cold, capacity, and conflict cachemisses to better optimize applications for a given memory hierar-chy. However, in the current multi-core era, additional cache missescan occur due to true sharing and false sharing in multi-threadedapplications.
Threads: 1 2Distinct cores Same core Padded
Time (s): 5.52 22.28 33.96 40.02 5.82 2.91
Table 1. Execution times of the parallel sum code from Figure 1under different thread and core configurations.
Figure 1 shows a code fragment that computes the sum of ele-ments in a buffer. Each thread adds up the elements in its assignedportion of the buffer, maintains the result in a private local_sumentry, and finally updates the global_sum atomically using itslocal_sum. Table 1 shows the execution times of this applicationon an eight-core (two quad-cores) machine under different config-urations. When the application uses two threads running on sepa-rate cores, it is significantly slower than when it uses only a singlethread or two threads on the same core. Furthermore, when the twothreads run on different cores, the application has three possibleexecution times depending on how the threads are bound to differ-ent pairs of cores. These times range from 4× to 7× slower thanthe single-thread time. These results are quite surprising becausethe application has good parallelism and its threads only need tocommunicate at the end of their execution.
In this example, unexpected slowdowns are caused by falsesharing, which occurs because two threads repeatedly update thesame cache line holding their private local_sum entries. If weadd padding between local_sum entries to place them in differentcache lines, the performance of the application with two threadsrunning on different cores is substantially improved, and the ex-pected linear speed-up is achieved (final column in Table 1). Inaddition, the three distinct execution times when the two threadsrun on different cores reflect the varying performance penalty in-curred by false sharing depending on which two cores competefor the same cache line: cache line exchanges cost less on coreswith a shared L2 cache than on cores without one. Thus, if threadcontention was unavoidable for some reason, we could still reduceslowdowns by scheduling threads that frequently access the samedata on cores with lower communication cost.
Even in this contrived example, while the solution is simple,the real challenge lies in precisely identifying performance bottle-necks in the application. Usually, this requires an understandingof a multi-threaded application’s behavior and its interactions withthe underlying hardware. To the best of our knowledge, no existingtool provides accurate and detailed information to help program-mers identify and solve performance problems caused by cachecontention in an efficient manner. Previous work generally relieson full cache simulation with prohibitively high runtime overhead.For example, CMP$im [15] runs at only 4-10MIPS.
The key contribution of this paper is identifying the minimal in-formation required for cache contention detection, cache line own-ership, and realizing that a tool that focuses on that informationcan efficiently solve an important class of performance problemsrelated to cache contention. We propose a novel approach to ob-tain detailed information about cache contention by tracking theownership of each cache line via memory shadowing and dynamicinstrumentation. This basic scheme for efficiently tracking cacheline ownership allows us to bypass the full complexity of the mem-ory hierarchy, do away with expensive cache simulation, and hencedrastically reduce the cost of obtaining sharing information. Con-tention detection, thread correlation, and false sharing detection arethree examples built on top of the basic scheme.
1.1 Memory shadowingMemory shadowing is a powerful technique for tracking proper-ties of an application’s data. It has been successfully used by manydynamic program analysis tools that need to maintain meta-dataabout every byte of the application’s memory, including tools fordetecting race conditions [13, 23, 29, 30], tracking dynamic in-formation flow propagation [8, 22, 25], detecting memory usageerrors [28, 31], and many others [5, 19, 20, 40]. General frame-works like Umbra [38] have been developed to help users build cus-tomized memory shadowing tools. In this paper, we propose a newapplication of memory shadowing. By using shadow memory anddynamic instrumentation to track ownership of application memoryat the granularity of cache lines, we are able to efficiently deter-mine an application’s sharing profile. Using appropriate meta-data,we can collect several types of information about thread interac-tions, and help programmers to identify and solve cache contentionproblems.
1.2 ContributionsThis paper’s contributions include:
• We present a novel scheme that, to the best of our knowledge,is the first scheme that can efficiently account for cache missesand invalidations caused by cache contention without resortingto expensive full cache simulation.
• We propose a novel use of shadow memory to track ownershipof cache lines in application memory for cache contention anal-ysis.
• We introduce a set of analysis tools that can determine thecache contention in applications, discover thread correlation,and detect true and false sharing, with an average overhead of5× slowdown compared to native execution.
• We were able to identify significant false sharing in 4 out of18 real benchmark applications, and were able to improve theperformance of 2 applications by up to a factor of 12×.
• We discovered thread communication patterns and thread cor-relation in real applications via cache contention analysis.
• We showed that two benchmarks benefited from schedulingthreads based on the memory hierarchy and their thread cor-relation, achieving up to a 2.4× performance improvement.
1.3 Paper LayoutThe rest of the paper is organized as follows: Section 2 provides anoverview of inter-thread cache contention and describes our detec-tion scheme. Section 3 discusses the details of our implementation.Section 4 presents experimental results from using our approach,Section 5 discusses related work, and Section 6 concludes the pa-per.
2. OverviewIn multi-core systems, each individual core typically has a privateL1 data cache for its own use. These private caches are the source ofcache contention. When threads running on different cores accessthe same data or data within the same cache line, multiple copiesof the cache line are created in the private caches of those cores.A hardware cache coherency mechanism is required to guaranteeconsistency between these copies. If a thread attempts to updatea cache line that has been replicated in other cores’ private caches,the hardware must invalidate all the other copies before the core canproceed with the write operation. A cache invalidation is an expen-sive operation as it causes memory operations to stall and wastesmemory bandwidth. Moreover, cache invalidations can cause cachemisses later when other cores access the same cache line again.Cache invalidations and misses can occur when cores compete toaccess the same data (true sharing) or different data items that hap-pen to reside in the same cache line (false sharing). If cache inval-idations and cache misses occur frequently, the performance of theapplication can suffer severely. It is therefore important for devel-opers to be aware of sharing-induced slowdowns in order to scaletheir applications.
Traditionally, developers have had to resort to full cache simula-tion to obtain detailed cache behavior when studying capacity andconflict misses. Cache behavior can also vary significantly depend-ing on the configuration of the memory hierarchy. However, we ob-serve that the true/false sharing is only related to the size of a cacheline and the application’s behavior, and is independent of the othermemory hierarchy parameters. This insight allows us to efficientlysimulate cache contention behavior without running detailed cachesimulations. Our approach dynamically tracks changes in owner-ship of application memory at the granularity of individual cachelines. This allows us to identify instructions that are responsible forthe bulk of the cache misses and cache invalidations, threads thatcommunicate frequently with each other, and interleaved accessesbetween different cores that cause cache contention.
2.1 Basic SchemeWe assume that our target application is running on a machinethat has enough computational cores that each thread can run on

Application Memory
Shadow Memory
Cache Lines (16 words each)T1
T32
T2
Ownership Bitmap
(32 bits)
Figure 2. The shadow memory data structure used for our basecontention detection scheme. Application memory is shadowed atcache line granularity with a bitmap indicating which cores containa copy of that data.
its own dedicated core. This way, we can refer to threads andcores interchangeably, and report the worst-case results causedby contention. In this section we describe a design that assumesthere are no more than 32 threads/cores simultaneously active in anapplication; Section 3 explains how our implementation scales tomore threads.
We further assume that each core has a private L1 cache, andthat data is never evicted from this private cache except throughcache invalidations. This assumption allows us to avoid expensivecache simulation, ignore capacity and conflict misses, and isolatethe inter-thread communication patterns that are sufficient for de-tecting cache contention. This assumption may also introduce in-accuracy due to not faithfully simulating the actual cache behavior,which will be discussed later in Section 3.5.
As shown in Figure 2, we use an ownership bitmap in shadowmemory to track the distribution of each application memory cacheline’s copies. Each bit in the bitmap represents one core or thread.If it is set, it means that particular core has a copy of the associatedcache line in its private cache, or that the core owns the cache line.
The bitmaps in the shadow memory are maintained by dynami-cally inserting instrumentation code for every application memoryreference. When a thread reads a data object, it creates a copy of thecache line containing that data object in its own cache. We simulatethis by setting the thread’s bit in the cache line’s ownership bitmap,indicating that the thread owns the cache line. When a thread up-dates an object, it invalidates all copies of the entire cache line inother cores’ private caches, and updates the copy in its own cache.This is simulated by setting the current thread’s bit and simulta-neously clearing all other bits in the cache line’s bitmap, therebyindicating the thread’s exclusive ownership of this cache line.
Using this approach, we can simply examine ownership bitmapsat any time to observe the status of the cache lines. In addition totracking cache line ownership, we often want to collect more in-formation about an application in order to understand thread con-tention. In particular, we may wish to determine the degree of cachecontention in the application, identify delinquent instructions thatcause most of the cache contention events, determine the commu-nication patterns and hence the correlation between threads, andcompute the frequency of true/false sharing. In order to obtain suchinformation, we need to add more instrumentation code and main-tain additional information in shadow memory.
2.2 Contention DetectionThe first step in performance debugging is to check whether anapplication does indeed suffer from cache contention. Therefore,
Application Memory
Shadow Memory
Thread Index
(32 bits)
Ownership Bitmap
(32 bits)
Cache Lines (16 words each)
T1
T32
T2
T1
T32
T2
Figure 3. The shadow memory data structure used for determiningthread correlation. A thread index is used to track which thread lastupdated the cache line.
we may wish to determine the frequency of cache contention events(cache misses or cache invalidations) during program execution.To do so, we need to detect and count the total number of cachecontention events, which can be easily done using the ownershipbitmap of Figure 2.
A cache miss occurs when a core attempts to read a cache linethat it does not own. In our scheme, this can be discovered bychecking whether the current thread’s bit is set in the correspondingownership bitmap in shadow memory on a memory read. A cacheinvalidation happens when a core wants to update a cache line thatit does not exclusively own. We can discover this by checkingwhether any bit other than the current thread’s bit is set in theownership bitmap. By checking the ownership of the target cacheline on every memory reference, we can count the total number ofcache contention events.
In addition, we can also track the behavior of individual memoryaccess instructions. We associate each instruction with two thread-private counters that count the number of cache misses and inval-idations it causes, respectively. By checking these counters afterexecution, we can easily identify the delinquent access instructionsthat are responsible for most of the cache misses and/or invalida-tions. Pinpointing such instructions is an important step in trying toreverse any performance losses due to cache contention.
2.3 Determining Thread CorrelationAn effective optimization strategy is to identify groups of threadsthat communicate frequently with each other, and reduce the per-formance penalties of cache contention by scheduling them oncores with lower communication costs, e.g., cores with shared L2caches.
We can extend our scheme to determine thread correlation. Twothreads are strongly correlated if they communicate frequently witheach other during the course of program execution. For instance,two threads may have a producer/consumer relationship and mayneed to communicate at fine granularity. To obtain thread correla-tion information, we allocate an array of counters for each threadto record its interaction frequency with other threads. We also adda field in the shadow memory unit to record the last thread that up-dated a data item, as shown in Figure 3. When a thread accesses adata item in a cache line, we identify which thread previously up-dated the cache line and increment the corresponding counter. Weonly update a counter when a cache miss or a cache invalidationoccurs, so our correlation statistics only capture thread interactionsthat contribute to performance slowdowns. If there are two accessesto a piece of data and only one of the accesses causes a cache missor invalidation, the counter is incremented only once. At the end of

Word 1 Read Bitmap
(32 bits)
Application Memory
Shadow Memory
Word 1 Write Bitmap
(32 bits)
Word 16 Read Bitmap
(32 bits)
Word 16 Write Bitmap
(32 bits)
…
Cache Lines (16 words each)
Ownership Bitmap
(32 bits)
... T1
T32
T2
T1
T32
T2
T1
T32
T2
T1
T32
T2
T1
T32
T2
Figure 4. The shadow memory data structure used for false sharing detection. We track which threads read and wrote to each word in eachcache line.
execution, using these counters, we can report the degree of corre-lation between threads, enabling the developer to act on the infor-mation and achieve better performance.
2.4 False Sharing DetectionBecause cache lines are often larger than the data objects theycontain, a single cache line often holds multiple data objects. Cachecontention can arise due to true or false sharing of the cache line.
Definitions of false sharing are often imprecise or impracticalfor real-time detection [3, 18]. Here, we identify false sharing basedon the following intuition: if a cache miss or cache invalidationcould have been avoided had the target data been moved to anothercache line, we consider the cache miss or invalidation to be causedby false sharing. More specifically, on a cache miss or invalidation,if the target location is also accessed by other threads, then it is aresult of true sharing, and is unavoidable. Otherwise, it is result offalse sharing.
In order to detect true/false sharing, we must maintain moreinformation in the shadow memory for each cache line. As shownin Figure 4, we record the access history for each word withina cache line in the shadow memory. Specifically, we maintain abitmap for each word within a cache line. Each thread has twobits in this bitmap to indicate whether it read and/or wrote thecorresponding word. For every memory access, code is insertedto set the current thread’s read or write bit in the bitmap for thespecific word that was accessed.
During a delinquent access, we can determine if the cache missor invalidation was caused by true or false sharing by examining theshadow memory of the corresponding cache line. On a cache miss,we can identify which threads updated this word by examining thebitmap associated with the word: the miss is due to false sharing ifno other thread’s write bit is set. Otherwise, it is due to true sharing.On a cache invalidation caused by a write, we check whether thetarget word was read or written by another thread by examining itsbitmap once again. The invalidation is due to true sharing if someother thread’s read or write bit is set. Otherwise, it is caused byfalse sharing. For a store, we clear all the bitmaps for the entirecache line in the shadow memory, and only mark the write bit ofthe current thread in the target word’s bitmap. This is to capture thefact that the thread has exclusive ownership of the cache line, andto detect subsequent false or true sharing.
2.5 Further ExtensionsBeing architecture-independent, our approach can easily be appliedto collect arbitrary information for a wide class of problems. Be-
yond the features described above, there are many other possibleways to extend the instrumentation for different purposes. For in-stance, we could add fields in the shadow memory to record whichcache lines caused most of the cache invalidations, and report theseproblematic data locations to the user. It is also possible to add timestamps in the shadow memory to keep track of access times so thateven more complex temporal relationships can be derived. Addinga field in shadow memory for storing call-stack context informationis another possible extension to help programmers identify delin-quent accesses with more context information.
Using a software-based approach lends our tool flexibility. First,it enables our tool to run on a wide range of commodity hardware.Second, our tool can change its parameters to analyze contentionbehavior over various thread and cache configurations that aredifferent from the actual machine where the application is run.Finally, we can target different levels of the memory hierarchy; e.g.,we can study not only private caches but also caches shared by asubset of cores by simply assigning the same thread bit to multiplethreads.
3. ImplementationWe implemented our detector on top of the shadow memory frame-work Umbra [38], which is an efficient memory shadowing frame-work that uses a novel mapping scheme [37] to translate applicationmemory addresses to shadow memory addresses. Umbra is inte-grated with DynamoRIO [1, 4] and provides a simple API for clientapplications to easily add instrumentation to manipulate shadowmemory without knowing the details of the underlying memorymapping scheme.
3.1 Base FrameworkAs described in Section 2, we associate each cache line (64 bytes)with a shadow memory unit in which a bitmap is used to representwhich cores own the cache line. Using a 32-bit bitmap, we can trackup to 32 threads or cores. We use Umbra’s API to add instrumen-tation to update the shadow memory for every application mem-ory reference. We instrument both reads and writes to keep trackof cache line ownership changes in the bitmap. For each memoryread, we set the bit for the current thread in the shadow memorybitmap corresponding to the cache line using an OR operation. Foreach memory write, we use a MOV instruction to set the bit corre-sponding to the current thread and clear all other bits at the sametime.
Our implementation faced three main challenges. The first chal-lenge is performance. The simple instrumentation described above
could cause high runtime overhead. Because we must update theshadow memory on every memory access, a significant amount ofbandwidth may be used by the shadow memory updates which willcause system bus congestion and stall execution. Moreover, the up-dates to the shadow memory itself will introduce high cache con-tention among threads. To avoid such problems, we optimized ourinstrumentation by adding checks and updating the shadow mem-ory only when necessary (we call this approach racy test and set).In the common case, if multiple threads read but do not write thesame cache line, only each thread’s first read will cause a shadowmemory update. In contrast, blindly writing the shadow memory(we call this approach set) even when no updates are necessarywould cause different cores to compete on the cache line holdingthe shadow memory unit, incurring much higher runtime overhead.In addition, to minimize cache contention caused by accessingshadow memory, we ensure shadow memory units are cacheline-sized (64 bytes) or larger even though the actual meta-data in theshadow memory might be as small as 32 bits.
The second challenge is handling concurrent accesses to thebitmap. When multiple threads access the same cache line simulta-neously, the corresponding instrumented code will simultaneouslyupdate the same bitmap. We could assign a lock to each bitmap andrequire any access to the bitmap to first acquire the lock (we callthis approach atomic test and set). This guarantees that the bitmapcheck and update operations are atomic, but the runtime overheadis high. This is because the lock operation, an XCHG instruction inour implementation, is a very expensive operation that stalls thesystem in order to ensure atomic operation. In contrast, if we allowracy accesses, we may miss a few cache miss or cache invalida-tion events, but we will still catch most of them, which is sufficientfor our analysis purposes. Our implementation uses racy accesseswithout locks (racy test and set).
The third challenge is scalability of design when more threadsare added. Our current design uses one bit per thread in a 32-bitbitmap and is limited to 32 threads. One simple method is to recyclethread bits: e.g., represent thread 0 and thread 32 with the same bit.Bit recycling can lose precision and miscalculate cache misses orinvalidations, because we cannot determine actual behavior whentwo threads represented by the same bit access the same cacheline. Another method is to use a multi-word bitmap to track morethreads. However, this approach incurs higher runtime overheadfor its multi-word checks and updates. More importantly, usingmore words cannot scale up to a high number of threads. In real-world applications, some programs first create a group of threadsto perform one task, destroy them, and then create another groupof threads to perform the next task in sequence. Such programs cancreate hundreds of threads over the application lifetime, althoughonly a few of them are simultaneously active. For such programsbit recycling works better than a multi-word bitmap scheme. Itis possible to combine the two approaches to achieve both betterprecision and better scalability. In the prototype we implemented,we used bit recycling on a 32-bit bitmap.
3.2 Contention DetectionWe extend the basic framework implementation described aboveto discover cache contention in an application. We associate twothread-private counters with each application memory reference in-struction to count the cache misses and cache invalidations it causesin each thread, respectively. By doing so, we not only know the totalnumber of cache misses and invalidations, but can also easily iden-tify delinquent instructions, i.e., memory access instructions thatcause most of the cache contention events.
For a memory read, we use a TEST instruction 1 to checkwhether the current thread has a copy of the referenced cache line(i.e., whether it owns the cache line). If the thread does indeed havea copy, no additional work is necessary. Otherwise, we can inferthat there is a cache miss. Therefore, we update the cache misscounter and set the thread’s bit in the shadow memory bitmap forthat cache line using an OR instruction.
For a memory write, we use a CMP instruction to check ifthe only bit set in the bitmap for the cache line belongs to thecurrent thread, i.e., whether it has exclusive ownership of the cacheline. Again, if this is the case, no additional work is necessary.Otherwise, the inserted code will increment the cache invalidationcounter and update the bitmap to reflect the thread’s exclusiveownership with a MOV instruction.
When a cache invalidation occurs, we could determine whetherthe data has not been accessed by any other thread yet (a cold missindicated by an all-0 bitmap), or whether there is at least one copyof the cache line in some other core (indicating a likely prior cacheinvalidation). However, this would increase the runtime overhead ofour dynamic instrumentation. Because our focus is on inter-threadsharing contention rather than full cache simulation, each cacheline can at most experience one cold miss in our model. Hence,we are trading off some accuracy for better performance. Similarly,for a memory read, the cache miss counter actually includes cachemisses due to both cold misses and cache invalidations. It is pos-sible to tell the difference between these two forms of misses bymaintaining more information in the shadow memory. We makethe same accuracy versus performance trade-off as before.
We also insert code to record the total number of instructionsexecuted for each thread. When a thread terminates, we scan thetwo counters kept for each memory reference instruction to obtainthe total number of cache misses and invalidations, and comparethat against the total number of instructions executed by the threadto understand the extent of its cache contention. In addition, wecan determine the delinquent instructions that contributed most tocache misses and cache invalidations for that thread. Where debuginformation is present, these instructions can be easily mappedback to the application’s source code.
3.3 Determining Thread CorrelationTo compute thread correlation, we allocate an array Ti of countersfor each thread i. Counter Ti[j] of the array corresponds to threadj. The first entry in the array is reserved for counting first-timeaccesses.
We also add a field in our shadow memory for each cache linethat stores the index of Ti corresponding to the thread that per-formed the latest update to that cache line. On a cache miss or cacheinvalidation, we obtain the latest thread index from the shadowmemory, and update the corresponding counter accordingly.
The stored counters can indicate a producer-consumer relation-ship. It is possible to separate cache misses from cache invalida-tions when updating these counters, so that producers can be distin-guished from consumers. However, for our purposes, details aboutthese relationships are not important, so we simply use one counter.
Because the memory is shadowed at the granularity of a cacheline, our thread correlation actually reflects architectural-level cor-relation, which may or may not be equivalent to semantic corre-lation within the application. For example, if one thread updatesone part of a cache line while another thread reads a different partof that cache line, our correlation counter is updated. This correla-tion is caused by false sharing, but it also affects performance, soreporting it is necessary.
1 The TEST instruction performs an AND operation, updates the conditionflags accordingly, and then discards the result.

In essence, our counters hold the frequency of a thread’s in-teraction with every other thread. At the end of the application’sexecution, this correlation information is output to the user whomay then use the information to understand the interaction amongthreads and schedule groups of correlated threads accordingly forbetter performance.
3.4 False Sharing DetectionIn order to detect false sharing, we extend our shadow memory torecord which threads have read and written to each word in a cacheline.
Ideally, we should use 132 bytes of shadow memory for each64-byte cache line to track 32 threads: 4 shadow bytes for recordingcache line ownership, and 16 pairs of 4-byte bitmaps to track whichof the 32 threads has read or written to each word in the cacheline. However, Umbra does not currently support such a mappingscheme. Because we perform our experiments on an 8-core system,our prototype uses a compacted shadow memory data structure totrack 8 threads using the configuration described below.
For each 64-byte cache line of the application, we maintain adata structure of the same size in the shadow memory, which is di-vided into 16 four-byte entries corresponding to the 16 applicationwords in the cache line. The first byte of the first entry is used asthe bitmap for tracking the ownership of the entire cache line as be-fore. The last two bytes of each entry are used as the read and writebitmaps to track access history for 8 threads for the associated wordin the cache line. The second byte of each entry is not used. We usebit recycling to handle applications that need to create more than 8threads.
We check whether there is a cache miss or invalidation using theownership bitmap as described before. In addition, we set the bitcorresponding to the word that was accessed by the current threadusing an OR operation. We again use a test and set scheme to avoidunnecessary memory updates for better performance. On a cachemiss, we check whether the word being accessed has write bits setby other threads. If not, a false sharing instance is reported. On acache invalidation, we check whether any other thread had accessedthe word by checking its bitmap. If there were no previous accesses,false sharing is reported. For a store, we clear the whole shadowmemory unit for the cache line and set the cache line bitmap and theword bitmap with the write bit for the current thread. This approachlimits multi-word updates to only cache invalidation events.
Our use of word granularity in false sharing detection may causeinaccuracy as some applications may have false sharing at the levelof individual bytes. It is possible to implement byte granularity inour scheme, but we chose to use words instead, for two reasons.First, a byte granularity implementation incurs higher overhead.
Second, while the compiler often arranges for two unrelateddata fields to lie in the same cache line unbeknownst to the pro-grammer, and such fields can be difficult for the programmer toidentify, two fields that occupy the same word are rarer and usuallyeasier to locate: e.g., an array of characters or several consecutivesub-word struct fields. The compiler often generates padding to ex-pand unrelated adjacent sub-word fields to have word alignment.Thus, we choose to use word granularity.
3.5 Accuracy DiscussionThere are several potential sources of inaccuracy in our design andimplementations. One source of inaccuracy is our assumption thatdata is only evicted from a core’s private cache through invalida-tions. This may cause our profiling results to differ from the actualbehavior of the application when executing on a particular hard-ware configuration, i.e., a particular private cache size and replace-ment scheme. However, our approach separates application behav-ior from the actual hardware configuration, which provides users
with an insightful view of application behavior independent of anyparticular hardware features or configurations except the cache linesize. We believe that this is more important than accurately report-ing behavior on a particular execution instance, which may changewhen the application runs in a different environment.
In fact, the accuracy of cache contention analysis is difficult toevaluate. It depends on many factors, especially the interleaved or-der of memory accesses by different threads, which may changefrom run to run. Although full cache simulation can simulate de-tailed cache behavior, the input, i.e., the memory access trace, doesnot always reflect actual execution; thus, the simulation results areoften artificial. For example, Cachegrind, a cache simulation toolbuilt on Valgrind [21], serializes multithreaded execution, resultingin a memory reference sequence that would almost never happenin actual execution on a multi-core system. Even full cache sim-ulation can report accurate results for one particular execution in-stance only and may not accurately reflect application behavior inother runs with different interleavings.
Other sources of inaccuracy, including the number of threadsexceeding the number of bits in our bitmap, using word rather thanbyte granularity in false sharing detection, and not being able toseparate cold misses from cache misses due to cache contention,have been discussed above.
4. Experimental ResultsWe conducted a series of experiments to evaluate our approach.
4.1 Experimental SetupOur tool is implemented on top of Umbra for Linux. We used ap-plications from two parallel, shared-memory benchmark suites forour experiments: the SPLASH2 [36] and Phoenix [27] suites. Threebenchmarks from SPLASH2, namely volrend, water-spatial,and cholesky, were not included in our experiments because theycomplete in very short times (< 0.5 seconds). All benchmarks werecompiled as 64-bit executables using gcc 4.3.2 with the -O2 opti-mization flag. The hardware platform we used has two quad-coreIntel Xeon processors with 3.16GHz clock rate and 8GB total RAMrunning 64-bit Debian GNU/Linux 5.0. Each core has its own pri-vate 32KB L1 data cache, whose cache line size is 64 bytes. Thefour cores in each quad-core die are arranged into two groups oftwo cores each that share a 6MB L2 cache. Thus, the fastest a givencore can acquire a copy of a missing cache line is from the othercore that shares its L2 cache, followed by one of the other coreson the same die. Fetching a cache line from the other die is evenslower, followed by the case when a cache line must be loaded frommemory.
4.2 Performance EvaluationWe first evaluate the performance of our base framework that trackscache line ownership implemented using different instrumentationschemes: set only, test and set, and atomic test and set, which wediscussed in Section 3. Table 2 shows the performance of the twobenchmark suites with these different instrumentation schemes. Itis clear that test and set has much lower runtime overhead. Thereasons have been discussed in Section 3.1. The atomic test and setis much slower than the simple set scheme, primarily because ofthe high cost of the XCHG instruction.
We next compare the performance of our three contention detec-tors. Figure 5 presents the results. It shows that contention detectionand thread correlation have similar performance overhead. This iseasily understood: they both check for changes in shadow mem-ory bitmaps, and update any counters accordingly (see Section 3).Thread correlation is slightly slower than contention detection be-cause it also needs to record the thread that last updated the cache

2.9
0
0x
2x
4x
6x
8x
10x
Contention detection
Thread correlation
False sharing detection
3.8
1
3.8
8
5.3
4
Benchmark
Slo
wd
ow
n v
sn
ative
Figure 5. Performance evaluation of contention detection, thread correlation, and false sharing detection. Performance is normalized to8-thread native execution time. Arithmetic average is used.
Benchmarks Set Racy Atomictest & set test & set
SPLASH2 31.83× 2.68× 50.82×Phoenix 50.64× 3.61× 95.88×
Table 2. Performance of our base framework with different instru-mentation schemes for tracking 8 threads, normalized to native exe-cution (i.e., without any instrumentation) and averaged across eachbenchmark suite.
line for each memory access. False sharing detection is the slow-est. This is due mainly to the more complex instrumentation codeneeded to update the access positions within each cache line. Onaverage, our tool causes a 3× to 5× slowdown when compared tonative execution.
Benchmark Misses Invalidationbarnes 0.15% 0.10%fmm 20.52% 1.36%
ocean (c) 0.15% 0.13%ocean (nc) 0.92% 0.55%radiosity 10.94% 16.89%raytrace 16.78% 22.06%water-nsq 1.78% 2.54%
fft 0.00% 0.00%lu (c) 0.23% 0.01%lu (nc) 0.11% 0.02%radix 0.00% 0.00%
histogram 0.00% 3.04%kmeans 0.00% 0.00%
linear_reg 54.65% 69.91%matrix_mul 0.13% 0.04%
pca 0.10% 0.67%string_match 0.00% 2.82%word_count 0.93% 0.17%
Table 3. Relative error between using racy versus atomic opera-tions for counter updates.
4.3 Accuracy of Racy UpdatesRacy shadow memory checks and updates have much better perfor-mance than using atomic test and set in the instrumentation schemeon the shadow memory. However, races could result in loss of ac-curacy. Table 3 shows the relative errors (in percentages) of themiss and invalidation counts obtained using racy test and set versusatomic test and set instrumentation. We found that there are negli-gible differences between the two results for most benchmarks. Forfour of the 18 benchmarks, the error exceeded 10%. In our analy-sis, it is the relative magnitude rather than the absolute counts thatmatters. As such, we regard the trade-off between performance andaccuracy of the final counts a worthwhile one to make.
Apart from the obvious reason that racy updates can causeinaccuracies, there is another possible cause for the differences:the slowdown may change how threads interleave their accesses,usually causing more interleaved accesses due to fewer referencesin each interval. An example is linear reg: the atomic update causeshigher runtime overhead, so more interleaved references happen,and more cache misses and invalidations occur and are detected.We believe this is the cause for the 50% variant of linear reg inTable 3, not errors due to racy updates.
4.4 Benchmark AnalysisIn this section, we describe some interesting benchmark results,and the insights they yielded. The way we analyzed the results alsoreflects how we believe a developer would use our tool to discoverand fix inter-thread sharing contention problems.
4.4.1 Contention DetectionContention detection can help programmers identify whether theirmulti-threaded programs suffer from cache contention due to datasharing, and pinpoint the most problematic instructions if there areany. The contention rate is the total number of cache misses andcache invalidations divided by the total number of instructions ex-ecuted by all threads. Table 4 lists the speedups of our benchmarksdue to parallelization using eight threads as well as their contentionrates. Benchmarks with higher contention rates usually benefit lit-tle from parallelization. In other words, they are not scalable. Theconverse, however, is not true: a benchmark showing little speedup,as the number of threads and cores are scaled, does not necessar-ily have a high contention rate. There are many possible causes

of limited scalability in an application, including an unbalancedworkload, expensive communication, or excessive synchronization.The rest of this paper focuses on those benchmarks that have highcontention rates (i.e., a contention rate of more than 10−3). Theseare the benchmarks ocean (nc), fft, histogram, radix, andlinear_regression.
Benchmark 8-Thread ContentionSpeedup rate
barnes 6.59 1.61× 10⁻⁴
fmm 6.42 8.36× 10⁻⁵
ocean (c) 4.26 6.12× 10⁻⁴
ocean (nc) 2.85 1.82× 10⁻³
radiosity 5.30 2.87× 10⁻⁴
raytrace 7.27 6.72× 10⁻⁵
water-nsq 5.87 2.34× 10⁻⁵
fft 2.07 2.28× 10⁻³
lu (c) 3.00 2.63× 10⁻⁴
lu (nc) 3.39 2.27× 10⁻⁴
radix 5.69 2.18× 10⁻³
histogram 3.18 4.26× 10⁻³
kmeans 3.96 1.09× 10⁻⁵
linear_regression 0.56 3.68× 10⁻²
matrix_multiply 1.02 6.85× 10⁻⁵
string_match 5.01 2.60× 10⁻⁴
word_count 7.24 1.32× 10⁻⁴
Table 4. The correlation between parallelization speedup and con-tention rate. The speedup is the native running time of a singlethread divided by the total number of application instructions ex-ecuted.
For the benchmarks with high contention rates, we examined theinstructions causing the contention. There are four common reasonsfor their behavior:
1. Initialization. Some of the problematic instructions are foundin initialization functions, especially in the first thread ofthe benchmark, which usually reads data from input filesand causes cold misses. Because cold misses are treated ascontention-causing misses for performance reasons in our im-plementation (Section 3.2), such instructions are identified asdelinquent accesses. For example, there are three instructionsin histogram that are responsible for more than 99% of thecache misses, and all of them are from an initialization functionthat reads data.
2. Global data update. In some benchmarks, such as radiosity,threads update global data from time to time, which is often asource of cache contention.
3. False sharing. The linear_regression benchmark containsgood examples of false sharing that resulted in many cacheinvalidations. It has 8 instructions that together are responsiblefor more than 99% of the total cache misses and invalidations.They all access data that resides in the same cache line frommultiple threads. This will be discussed later in detail.
4. Communication. In some benchmarks, threads communicatewith each other after each phase. fft is a typical benchmarkthat performs a lot of communication, thereby causing a highamount of contention.
4.4.2 Determining Thread CorrelationWe next present results for our thread correlation algorithm. Asexpected, different benchmarks showed different communication
Benchmark No Worst Bestbinding case case
ocean (nc) 1.95s 1.99s 0.79slinear_regression 2.31s 3.08s 1.66s
Table 5. Performance impact of scheduling different threads ondifferent cores for two of our benchmarks. All times are in sec-onds. ‘No binding’ lets the operating system decide the scheduling.The other two columns show the extremes of performance whenscheduling on different cores. ocean’s ‘No binding’ time averaged1.95s but varied significantly.
patterns. The most common pattern we see is that all other threadshave strong correlation with thread 0, the master thread. Bench-marks likes barnes, radiosity, lu, and water-nsquared havesuch patterns. In these benchmarks, the master thread will first ini-tialize the data and then each thread works on its own tasks.
Some benchmark threads simply read data in parallel, and havelittle communication with each other. Most of the benchmarks fromPhoenix fit this pattern. This is not surprising, since this set ofbenchmarks was designed to evaluate the performance of map-reduce, and so the benchmarks are mostly embarrassingly parallel.
We also tested the performance impact of scheduling differentthreads on different cores. In our platform, we have two quad coreson two different dies. Communication between two cores from dif-ferent dies is much more expensive than communication betweentwo cores on the same die. Based on the observed correlations, wecluster threads into two groups using two different methods. Onemethod minimizes communication between the two groups whilethe other maximizes the communication. We considered the perfor-mance difference between these two methods on benchmarks withhigh contention rates based on thread correlations. histogram’scorrelation array shows that all threads interact most with the firstentry, which indicates most misses are cold misess for first-time ac-cesses. So it was not very interesting. fft and radix have almostidentical correlation values among threads, revealing no optimiza-tion opportunities. ocean (nc) and linear_regression, on theother hand, showed interesting correlation patterns. ocean (nc)has a paired communication pattern: every two threads commu-nicate significantly with each other but very little with the otherthreads. linear_regression, in contrast, forms a chain of com-munication. Each thread talks very frequently with its neighbors.As shown in Table 5, scheduling threads on different cores has aprofound impact on the execution time for these two benchmarks.For ocean (nc), we observe a significant performance difference.The ‘worst case’, i.e., when threads were clustered to maximizecommunication, runs 2.4× slower than the ‘best case’ where com-munication is minimized. The ‘normal case’, in which we left it tothe operating system to decide the scheduling, is closer to the worstcase. We see a smaller improvement in linear_regression, be-cause it does not have a regular pattern that perfectly matches thecore configuration as was the case in ocean (nc).
4.4.3 False Sharing DetectionBecause software, including our benchmarks, is usually performance-tuned before release, many applications have already insertedpadding on their own to avoid false sharing. It is therefore difficultto find a mature program with significant performance problems.However, we did find several benchmarks with large amounts offalse sharing. Table 6 shows the false sharing rate of the bench-marks that suffer from high contention rates. The false sharing rateis defined as the total number of false sharing misses divided by thetotal number of instructions executed. Our results show that thesebenchmarks also experience high rates of false sharing. The misses

Benchmark Contention False sharingrate rate
ocean (nc) 1.82× 10⁻³ 1.57× 10⁻³
fft 2.28× 10⁻³ 7.50× 10⁻⁴
radix 2.18× 10⁻³ 1.16× 10⁻³
histogram 4.26× 10⁻³ 4.26× 10⁻³
linear_regression 4.33× 10⁻² 4.33× 10⁻²
Table 6. False sharing rates of benchmarks with high contentionrates. The false sharing rate is the number of false sharing instancesdivided by the total number of application instructions executed.
0
1
2
3
4
5
6
7
8
1 2 3 4 5 6 7 8
Number of processors
Pe
rfo
rma
nc
e S
pe
ed
up
Linear speedup
Original (with false sharing)
After padding (false sharing removed)
0
1
2
3
4
5
6
7
8
1 2 3 4 5 6 7 8
Pe
rfo
rma
nc
e S
pe
ed
up
Number of processors
Linear speedup
Original (with false sharing)
After padding (false sharing removed)
Figure 6. Speedup with and without false sharing. To eliminatefalse sharing we added padding to the data structures identified byour tool.
in histogram are mostly cold cache misses, which are identified asfalse sharing in our algorithm. It is possible to differentiate the coldmisses from the real false sharing, but this requires extra instru-mentation and shadow data fields. Note that the contention rate forlinear_regression is different from the value in Table 4. This isbecause false sharing detection causes more runtime overhead thancontention detection, and leads to more interleaved accesses on thesame cache line by different threads, and thus higher contentionrates.
By studying the source code of linear_regression, wefound that it allocates an array, passes one entry to each thread,and each thread then updates the entry simultaneously. This is acommon programming practice that causes false sharing. Becauseseveral entries share a cache line, a large amount of false shar-ing happens when multiple threads update neighboring entries.By adding pads into the data structure, we achieved a significantimprovement (12× for 8 cores) for this benchmark, as shown inFigure 6.
We also find that the benchmark radix from SPLASH2 [36]has a significant amount of false sharing. radix is a benchmarkthat implements a parallel radix sort that sorts an array one digit ata time. In every round, it copies entries from the array into anotherarray of the same size ordered by that round’s digit. Multiplethreads fill in the array, causing false sharing. However, this isbehavior that we cannot change without drastically changing thealgorithm. We tried to add padding between the data but the runtimeactually increased because of lost cache locality. In fact, radix hasa relatively good speed up, as shown in Table 4. This is becauseit sorts over 50 million integers, using two 400MB chunks ofmemory. Its working set is much larger than the available amountof caches in all eight cores. So there is a good chance that the datamay already be evicted before invalidations or misses can happen.
ocean (nc) also exhibited significant false sharing as well andhas algorithmic issues. In ocean (nc), different threads updatedifferent columns of a 2D array. Because the array is stored in
row-major order, a lot of false sharing occurs during this updatingprocess. Our data shows that almost every instruction that accessesthe array experiences false sharing. Due to the large size of thearray, padding does not work well. However, as we showed in theprevious section, we can still improve the overall performance byjudiciously scheduling the threads so as to reduce communicationcost. fft, in contrast, has an all-to-all communication pattern, sothe majority of contention is actually caused by true sharing, and ithas no easy way to optimize it due to its communication pattern.
An artifact of our implementation is that false sharing detectioncan precisely track up to 8 threads, while contention detection cantrack upto 32 threads. There are two benchmarks pca and kmeansthat use more than 8 threads. They create 8 threads in every phasesor iteration. In total, pca and kmeans used 16 and 1,317 threadsrespectively. Table 4.4.3 lists the data obtained from contention de-tection and false sharing detection. False sharing detection reportedless cache misses and invalidations because fewer number of bitswere used in thread tracking. How to precisely and efficiently tracka large number of threads (hundreds or thousands) simultaneouslyis still an unresolved issue.
Benchmarks Contention detection False sharing detection# misses # inv # misses # inv
kmeans 3.23× 10⁶ 1.53× 10⁶ 4.25× 10⁵ 4.25× 10⁵
pca 5.63× 10⁶ 4.37× 10⁶ 1.16× 10⁶ 1.16× 10⁶
Table 7. The number of cache misses and invalidations observedduring contention detection and false sharing detection for bench-marks that created more than 8 threads.
Our experiments showed that the novel analysis made possi-ble by our tool can help programmers discover intense thread con-tention, determine thread correlation, and detect false sharing. Thishelps programmers better understand their applications and makebetter choices, for example, in the implementation of the data struc-tures, or the scheduling decisions, so as to improve performance.
5. Related WorkWe discuss related work in the areas of false sharing detection andthread correlation.
5.1 False SharingFalse sharing can be difficult to define precisely [3, 18, 35]. For in-stance, false sharing can be defined as the additional cache missesincurred by a program running with a given cache line size com-pared to the same program running with one-word cache lines. Thismay seem like a good definition because using one-word cachelines minimizes the amount of data transferred between processors.However, since programs cannot exploit spatial locality with word-sized cache lines, the number of coherence operations needed be-tween processors may still increase. Thus, this definition can resultin a negative amount of false sharing if the loss in spatial localityeclipses any savings due to reduced false sharing. In this paper, wechose an intuitive definition of false sharing that can be practicallyused for dynamic detection.
Before the proliferation of multi-core systems, false sharingemerged as a significant performance problem for distributedshared memory (DSM) systems. However, because cache co-herency protocols in DSM systems operate at the granularity ofindividual memory pages, DSM false sharing is much more likelyto occur than cache line false sharing in multi-core machines. Manyapproaches developed to dynamically control DSM false shar-ing [7, 11] used relaxed memory consistency models and versionvectors with smaller granularity than memory pages.

Intel’s Performance Tuning Utility (PTU) [14] provides hintsthat can be used by developers to identify false sharing: for eachcache line, it collects the thread ID and offset of sampled accesses.Also, the Precise Event Based Sampling (PEBS) support on Intelprocessors can provide reports of coherency events and identify ad-dresses of the corresponding memory accesses. However, becauseboth of these approaches are sampling-based, they only aggregatememory access statistics without recording the order of interleavedmemory accesses. Thus, these approaches cannot distinguish be-tween false and true sharing and can greatly overstate the incidenceof false sharing. Hardware approaches [9] for reducing false shar-ing include protocols that perform invalidations on a word basisor postpone invalidations at the sender/receiver or both. However,such approaches rely on special hardware support.
Compiler optimizations for reducing both DSM and cache linefalse sharing have also been proposed in the past. Static analysiscan be used to approximate program memory-access patterns andapply data layout transformations to improve memory locality [16].Other proposed approaches reorganize control structures (e.g., loopdistribution) along with shared data to reduce false sharing [17, 24].These approaches rely on the regularity of code and data layout toapproximate the memory reference behavior of programs, whichgreatly limits their usage and accuracy.
Memory managers such as Hoard [2] try to prevent false shar-ing caused by concurrent requests by ensuring that data allocatedfor separate threads does not lie on the same cache line. Unfortu-nately, these allocators have no control over inter-thread contentioninadvertently caused by developers in real-world applications be-cause of poor data layout or thread scheduling. Diagnostic toolsare invariably required to help developers reduce false sharing andthread contention.
A full architecture simulation for detecting false sharing is em-ployed by CacheIn [34]. The runtime overhead for the full simu-lation is not mentioned but we can reasonably expect it to be veryhigh. Furthermore, the false sharing detection algorithm works bycreating a serial trace of all memory references and comparing theaddress of shared writes to subsequent shared reads. This approachis not efficient in terms of the sheer amount of data generated duringprogram execution and the likely post-processing overhead. Fur-thermore, the machine model of this simulation only uses the la-tencies of a few instructions. Traditional full simulations [15] canbe used to obtain detailed information about cache behavior, butat the cost of orders of magnitude of slowdown. Our method is anorder of magnitude faster.
Pluto [12] tries to detect cache false sharing via dynamic binaryinstrumentation. However, it simply aggregates information aboutthe number of threads that access a given cache block (and thecorresponding access offsets), without retaining any informationabout the timing of these accesses. While Pluto uses heuristicsabout thread offsets (just like PEBS) to account for true sharing,it cannot accurately differentiate between true or false sharing, andits results can be very inaccurate. It cannot accurately provide thecache invalidation or false sharing statistics for each instruction.Furthermore, Pluto’s reported performance overhead can be as highas two orders of magnitude on target applications.
5.2 Thread CorrelationMost thread libraries allow programmers to specify thread relation-ships, execution priorities, and scheduling policies. For instance,programmers can statically bind threads to specific processors onmost operating systems. Some frameworks allow programmers todeclare groups of related threads (e.g., via RTIDs [26]) so thatthread schedulers can run these related threads accordingly to avoidperformance penalties due to thread communication.
Real-world applications are often developed in different phases,utilize modules from many libraries, and are coded by many pro-grammers. Therefore, it may not be easy for application develop-ers to specify the scheduling of threads or their processor bind-ings. In the absence of programmer directives, many frameworkstrack the cache behavior of threads at runtime to make schedul-ing decisions that improve performance. For instance, cache-awareschedulers can dynamically identify threads that reference shareddata [6, 10, 32, 33] so that they can be scheduled accordinglyor migrated to specific processors. Such optimizations can reduceoverhead due to poor thread scheduling, but they often use hard-ware sampling of cache misses or other hardware facilities, whichmakes their approaches inaccurate and platform specific. As a re-sult, these approaches often cannot help developers identify theexact threads and instructions in an application that communi-cate excessively with each other. With such diagnostic informa-tion, developers would be able to take more aggressive, application-specific steps to overcome thread correlation penalties. To the bestof our knowledge, no existing dynamic instrumentation tool pro-vides thread correlation analysis for diagnosis without incurringprohibitive performance overheads.
6. ConclusionMerely porting an application to use multiple threads is insuffi-cient to guarantee good performance on today’s multi-core systems.In this paper, we focused on reducing unexpected performancedegradation in multi-threaded applications that can arise from inter-thread cache contention and sub-optimal placement of correlatedthreads across multiple cores. In particular, we outlined a novel ap-proach for identifying delinquent accesses, measuring thread cor-relation, and detecting true/false sharing. Our tool is based on theinsight that the rate of true/false sharing in an application primarilydepends on application behavior and cache line size, and can be ac-curately determined without considering the full complexity of theactual memory hierarchy. We outlined a novel use of shadow mem-ory and dynamic instrumentation that tracks ownership of cachelines in application memory to detect true/false sharing. Our ap-proach is more accurate than static analysis or the use of hardwarecounters, because we use the exact sequence of memory referencesin an executing application to detect both true and false sharing,and to differentiate between them. We show that our approach in-curs an average of 3× to 5× slowdown relative to native execution,and thus is much more efficient than cache simulations.
We used our tool to analyze 18 shared memory benchmarks. Weshowed how the information obtained by our tool can be used tosignificantly improve application performance. We first performedcontention detection to identify benchmarks that suffer from con-tention issues. We then examined thread correlation to derive thecommunication patterns of problematic applications. In one in-stance, namely ocean, we attained a 2.4× performance improve-ment by optimally scheduling the threads of the application. Next,we illustrated that applications with high contention rates consis-tently exhibit high degrees of false sharing. For one benchmark,namely linear_regression, we removed false sharing by meansof padding and turned slowdowns originally experienced by the ap-plication into near-linear speedups: we turned a 2× slowdown intoa 6× speedup relative to native execution on 8 cores. For otherapplications, the information that our tool provided was used to ex-plain why no performance improvement was possible without dras-tic restructuring of the underlying algorithms.
In the future, we would like to explore how we can furtherspeed up our approach through the use of sampling. If this turnsout to be feasible, it may be possible to extend our tool into a run-time framework that interacts directly with the thread scheduler,allowing for tuning of multi-threaded applications as they execute

through their various program phases, and dynamic load-balancingof the system. Alternatively, we could integrate our tool with micro-simulations [39] to obtain even greater detail about the applica-tion’s and/or the platform’s behavior.
References[1] DynamoRIO dynamic instrumentation tool platform, Feb. 2009.
http://dynamorio.org/.[2] E. Berger, K. McKinley, R. Blumofe, and P. Wilson. Hoard: A scalable
memory allocator for multithreaded applications. ACM SIGPLANNotices, 35(11):117–128, 2000.
[3] P. W. Bolosky, W. J. Bolosky, and M. L. Scott. False sharing and its ef-fect on shared memory. In In Proceedings of the USENIX Symposiumon Experiences with Distributed and Multiprocessor Systems (SEDMSIV), pages 57–71, 1993.
[4] D. Bruening. Efficient, Transparent, and Comprehensive RuntimeCode Manipulation. PhD thesis, M.I.T., Sept. 2004.
[5] M. Burrows, S. N. Freund, and J. L. Wiener. Run-time type checkingfor binary programs. In Proc. of the 12th International Conference onCompiler Construction (CC ’03), pages 90–105, 2003.
[6] J. M. Calandrino and J. H. Anderson. On the design and implemen-tation of a cache-aware multicore real-time scheduler. Real-Time Sys-tems, Euromicro Conference on, 0:194–204, 2009.
[7] J. Carter, J. Bennett, and W. Zwaenepoel. Implementation and perfor-mance of Munin. In Proceedings of the thirteenth ACM symposium onOperating systems principles, page 164. ACM, 1991.
[8] W. Cheng, Q. Zhao, B. Yu, and S. Hiroshige. Tainttrace: Efficient flowtracing with dynamic binary rewriting. In Proc. of the Proceedings ofthe 11th IEEE Symposium on Computers and Communications (ISCC’06), pages 749–754, 2006.
[9] M. Dubois, J. Skeppstedt, L. Ricciulli, K. Ramamurthy, and P. Sten-strom. The detection and elimination of useless misses in multipro-cessors. ACM SIGARCH Computer Architecture News, 21(2):88–97,1993.
[10] A. Fedorova. Operating system scheduling for chip multithreadedprocessors. PhD thesis, Harvard University, Cambridge, MA, USA,2006.
[11] V. W. Freeh. Dynamically controlling false sharing in distributedshared memory. International Symposium on High-Performance Dis-tributed Computing, 0:403, 1996.
[12] S. Gunther and J. Weidendorfer. Assessing cache false sharing ef-fects by dynamic binary instrumentation. In Proceedings of the Work-shop on Binary Instrumentation and Applications, pages 26–33. ACM,2009.
[13] J. J. Harrow. Runtime checking of multithreaded applications withvisual threads. In Proc. of the 7th International SPIN Workshopon SPIN Model Checking and Software Verification, pages 331–342,2000.
[14] Intel-Corporation. Intel Performance Tuning Utility 3.2. User Guide,Chapter 7.4.6.5, 2008.
[15] A. Jaleel, R. S. Cohn, C.-K. Luk, and B. Jacob. CMP$im: A Pin-based on-the-fly multi-core cache simulator. In Proc. of the TheFourth Annual Workshop on Modeling, Benchmarking and Simulation(MoBS), pages 28–36, Beijing, China, Jun 2008.
[16] T. Jeremiassen and S. Eggers. Reducing false sharing on sharedmemory multiprocessors through compile time data transformations.ACM SIGPLAN Notices, 30(8):179–188, 1995.
[17] Y. Ju and H. Dietz. Reduction of cache coherence overhead by com-piler data layout and loop transformation. Languages and Compilersfor Parallel Computing, pages 344–358, 1992.
[18] V. Khera, P. R. LaRowe, Jr., and S. C. Ellis. An architecture-independent analysis of false sharing. Technical Report DUKE-TR-1993-13, Duke University, Durham, NC, USA, 1993.
[19] S. Narayanasamy, C. Pereira, H. Patil, R. Cohn, and B. Calder. Au-tomatic logging of operating system effects to guide application-levelarchitecture simulation. In Proc. of the Joint International Conferenceon Measurement and Modeling of Computer Systems (SIGMETRICS’06/Performance ’06), pages 216–227, 2006.
[20] N. Nethercote and A. Mycroft. Redux: A dynamic dataflow tracer. InElectronic Notes in Theoretical Computer Science, volume 89, 2003.
[21] N. Nethercote and J. Seward. Valgrind: A framework for heavyweightdynamic binary instrumentation. In Proc. of the ACM SIGPLANConference on Programming Language Design and Implementation(PLDI ’07), pages 89–100, June 2007.
[22] J. Newsome. Dynamic taint analysis for automatic detection, analysis,and signature generation of exploits on commodity software. In Proc.of the Network and Distributed System Security Symposium (NDSS2005), 2005.
[23] OpenWorks LLP. Helgrind: A data race detector, 2007.http://valgrind.org/docs/manual/hg-manual.html/.
[24] J. Peir and R. Cytron. Minimum distance: A method for partitioningrecurrences for multiprocessors. IEEE Transactions on Computers,38(8):1203–1211, 1989.
[25] F. Qin, C. Wang, Z. Li, H.-s. Kim, Y. Zhou, and Y. Wu. Lift: Alow-overhead practical information flow tracking system for detectingsecurity attacks. In Proc. of the 39th International Symposium onMicroarchitecture (MICRO 39), pages 135–148, 2006.
[26] M. Rajagopalan, B. Lewis, and T. Anderson. Thread scheduling formulti-core platforms. In Proceedings of the 11th USENIX workshopon Hot topics in operating systems, pages 1–6. USENIX Association,2007.
[27] C. Ranger, R. Raghuraman, A. Penmetsa, G. Bradski, andC. Kozyrakis. Evaluating mapreduce for multi-core and multiproces-sor systems. In Proceedings of the 2007 IEEE 13th International Sym-posium on High Performance Computer Architecture, pages 13–24,2007.
[28] Rational Software. Purify: Fast detection of memory leaks and accesserrors, 2000. http://www.rationalsoftware.com/products/whitepapers/319.jsp.
[29] M. Ronsse, B. Stougie, J. Maebe, F. Cornelis, and K. D. Bosschere. Anefficient data race detector backend for DIOTA. In Parallel Comput-ing: Software Technology, Algorithms, Architectures & Applications,volume 13, pages 39–46. Elsevier, 2 2004.
[30] S. Savage, M. Burrows, G. Nelson, P. Sobalvarro, and T. Anderson.Eraser: a dynamic data race detector for multithreaded programs. ACMTrans. Comput. Syst., 15(4):391–411, 1997.
[31] J. Seward and N. Nethercote. Using Valgrind to detect undefined valueerrors with bit-precision. In Proc. of the USENIX Annual TechnicalConference, pages 2–2, 2005.
[32] S. Sridharan, B. Keck, R. Murphy, S. Chandra, and P. Kogge. Threadmigration to improve synchronization performance. In Workshopon Operating System Interference in High Performance Applications,2006.
[33] D. Tam, R. Azimi, and M. Stumm. Thread clustering: sharing-awarescheduling on smp-cmp-smt multiprocessors. In EuroSys ’07: Pro-ceedings of the 2nd ACM SIGOPS/EuroSys European Conference onComputer Systems 2007, pages 47–58, New York, NY, USA, 2007.ACM.
[34] J. Tao and W. Karl. CacheIn: A Toolset for Comprehensive CacheInspection. Computational Science–ICCS 2005, pages 174–181, 2005.
[35] J. Weidendorfer, M. Ott, T. Klug, and C. Trinitis. Latencies of conflict-ing writes on contemporary multicore architectures. Parallel Comput-ing Technologies, pages 318–327, 2007.
[36] S. C. Woo, M. Ohara, E. Torrie, J. P. Singh, and A. Gupta. TheSPLASH-2 programs: characterization and methodological consider-ations. In Proc. of the 22nd International Symposium on ComputerArchitecture (ISCA ’95), pages 24–36, 1995.
[37] Q. Zhao, D. Bruening, and S. Amarasinghe. Efficient memory shad-owing for 64-bit architectures. In Proc. of the The International Sym-posium on Memory Management (ISMM ’10), Toronto, Canada, Jun2010.
[38] Q. Zhao, D. Bruening, and S. Amarasinghe. Umbra: Efficient andscalable memory shadowing. In Proc. of the International Symposiumon Code Generation and Optimization (CGO ’10), Apr. 2010.
[39] Q. Zhao, R. Rabbah, S. Amarasinghe, L. Rudolph, and W.-F. Wong.Ubiquitous memory introspection. In International Symposium onCode Generation and Optimization, San Jose, CA, Mar 2007.
[40] Q. Zhao, R. M. Rabbah, S. P. Amarasinghe, L. Rudolph, and W.-F.Wong. How to do a million watchpoints: Efficient debugging usingdynamic instrumentation. In Proc. of the 17th International Confer-ence on Compiler Construction (CC ’08), pages 147–162, 2008.