Carbohydrate Starvation Causes a Metabolically Active but Nonculturable State in Lactococcus lactis
15
APPLIED AND ENVIRONMENTAL MICROBIOLOGY, Apr. 2007, p. 2498–2512 Vol. 73, No. 8 0099-2240/07/$08.000 doi:10.1128/AEM.01832-06 Copyright © 2007, American Society for Microbiology. All Rights Reserved. Carbohydrate Starvation Causes a Metabolically Active but Nonculturable State in Lactococcus lactis †‡ Balasubramanian Ganesan, Mark R. Stuart,§ and Bart C. Weimer* Western Dairy Center, Center for Integrated BioSystems, Center for Microbe Detection and Physiology, Department of Nutrition and Food Sciences, Utah State University, Logan, Utah 84322-4700 Received 2 August 2006/Accepted 5 February 2007 This study characterized the ability of lactococci to become nonculturable under carbohydrate starvation while maintaining metabolic activity. We determined the changes in physiological parameters and extracellular substrate levels of multiple lactococcal strains under a number of environmental conditions along with whole-genome expression profiles. Three distinct phases were observed, logarithmic growth, sugar exhaustion, and nonculturabil- ity. Shortly after carbohydrate starvation, each lactococcal strain lost the ability to form colonies on solid media but maintained an intact cell membrane and metabolic activity for over 3.5 years. ML3, a strain that metabolized lactose rapidly, reached nonculturability within 1 week. Strains that metabolized lactose slowly (SK11) or not at all (IL1403) required 1 to 3 months to become nonculturable. In all cases, the cells contained at least 100 pM of intracellular ATP after 6 months of starvation and remained at that level for the remainder of the study. Amino- peptidase and lipase/esterase activities decreased below detection limits during the nonculturable phase. During sugar exhaustion and entry into nonculturability, serine and methionine were produced, while glutamine and arginine were depleted from the medium. The cells retained the ability to transport amino acids via proton motive force and peptides via ATP-driven translocation. The addition of branched-chain amino acids to the culture medium resulted in increased intracellular ATP levels and new metabolic products, indicating that branched-chain amino acid catabolism resulted in energy and metabolic products to support survival during starvation. Gene expression analysis showed that the genes responsible for sugar metabolism were repressed as the cells entered noncultur- ability. The genes responsible for cell division were repressed, while autolysis and cell wall metabolism genes were induced neither at starvation nor during nonculturability. Taken together, these observations verify that carbohy- drate-starved lactococci attain a nonculturable state wherein sugar metabolism, cell division, and autolysis are repressed, allowing the cells to maintain transcription, metabolic activity, and energy production during a state that produces new metabolites not associated with logarithmic growth. Carbohydrates are the primary energy and carbon sources for lactic acid bacteria (LAB) during growth in laboratory media and fermented products, such as milk. These traits are associated with specific plasmids that have distinct genes for proteolysis and lactose metabolism (35). During the fermenta- tion processes, LAB are subject to the vagaries of stress due to changes in water activity, pH, redox potential, and substrate availability (38). Lactococci respond to stress conditions by regulating many metabolic pathways to maintain metabolism and energy production (61). In response to carbohydrate star- vation, lactococci become nonculturable (NC) and remain metabolically active for at least 2 weeks (48). At the onset of carbohydrate starvation in lactococci, the intracellular levels of the glycolytic intermediates, phos- phoenolpyruvate (PEP), 3-phosphoglycerate, and 2-phospho- glycerate increase, all of which constitute the PEP potential (53, 54). During persistent starvation, PEP is metabolized to pyruvate and ATP (53, 54). Thompson and Thomas (54) sug- gested that lactococci utilize intracellular glycolytic reserves for moderate periods of starvation to compensate for the lack of sugar. The PEP potential allows enzymatic activity and trans- port to remain active for survival during the depletion of car- bohydrates and is used to reactivate sugar metabolism. The ability to form colonies on solid media is lost at the onset of carbohydrate starvation (48). During this NC state, cells are incapable of sustaining cellular division required for growth on rich nonselective media (39) but do remain meta- bolically active for extended times. Many genera exhibit the NC state, including Escherichia coli, Micrococcus luteus, Vibrio vulnificus, Campylobacter jejuni, and Brevibacterium linens (3, 39). However, the duration of survival in the NC state has not been demonstrated past 30 days in lactococci, thereby ques- tioning the role of cells in this cellular state in long-term survival during stress and hence the role of this cellular stage in the flavor development of fermented foods during storage. While the genes involved in abiotic stresses, such as pH and temperature, are well characterized in lactococci (42–44, 61), the molecular events associated with the NC state are not delineated. Macromolecular metabolism decreases in NC bacteria, sim- ilar to the response of marine bacteria to starvation (29). How- ever, starved cultures are not metabolically static cells. Changes during or after transition to the NC state include changes in the size and shape of the bacteria to minimize * Corresponding author. Mailing address: Center for Integrated BioSystems, Utah State University, Logan, UT 84322-4700. Phone: (435) 797-2753. Fax: (435) 797-2766. E-mail: [email protected]. † Contribution number 7671 of the Utah Agricultural Experimental Station (approved by its director). ‡ Supplemental material for this article may be found at http://aem .asm.org/. § Present address: Ralcorp Frozen Bakery Products, 215 N. 700 W., Bldg. 5-D, Ogden, UT 84404. Published ahead of print on 9 February 2007. 2498 on February 21, 2016 by guest http://aem.asm.org/ Downloaded from
-
Upload
independent -
Category
Documents
-
view
1 -
download
0
Transcript of Carbohydrate Starvation Causes a Metabolically Active but Nonculturable State in Lactococcus lactis

APPLIED AND ENVIRONMENTAL MICROBIOLOGY, Apr. 2007, p. 2498–2512 Vol. 73, No. 80099-2240/07/$08.00�0 doi:10.1128/AEM.01832-06Copyright © 2007, American Society for Microbiology. All Rights Reserved.
Carbohydrate Starvation Causes a Metabolically Active butNonculturable State in Lactococcus lactis�†‡
Balasubramanian Ganesan, Mark R. Stuart,§ and Bart C. Weimer*Western Dairy Center, Center for Integrated BioSystems, Center for Microbe Detection and Physiology,
Department of Nutrition and Food Sciences, Utah State University, Logan, Utah 84322-4700
Received 2 August 2006/Accepted 5 February 2007
This study characterized the ability of lactococci to become nonculturable under carbohydrate starvation whilemaintaining metabolic activity. We determined the changes in physiological parameters and extracellular substratelevels of multiple lactococcal strains under a number of environmental conditions along with whole-genomeexpression profiles. Three distinct phases were observed, logarithmic growth, sugar exhaustion, and nonculturabil-ity. Shortly after carbohydrate starvation, each lactococcal strain lost the ability to form colonies on solid media butmaintained an intact cell membrane and metabolic activity for over 3.5 years. ML3, a strain that metabolized lactoserapidly, reached nonculturability within 1 week. Strains that metabolized lactose slowly (SK11) or not at all(IL1403) required 1 to 3 months to become nonculturable. In all cases, the cells contained at least 100 pM ofintracellular ATP after 6 months of starvation and remained at that level for the remainder of the study. Amino-peptidase and lipase/esterase activities decreased below detection limits during the nonculturable phase. Duringsugar exhaustion and entry into nonculturability, serine and methionine were produced, while glutamine andarginine were depleted from the medium. The cells retained the ability to transport amino acids via proton motiveforce and peptides via ATP-driven translocation. The addition of branched-chain amino acids to the culture mediumresulted in increased intracellular ATP levels and new metabolic products, indicating that branched-chain aminoacid catabolism resulted in energy and metabolic products to support survival during starvation. Gene expressionanalysis showed that the genes responsible for sugar metabolism were repressed as the cells entered noncultur-ability. The genes responsible for cell division were repressed, while autolysis and cell wall metabolism genes wereinduced neither at starvation nor during nonculturability. Taken together, these observations verify that carbohy-drate-starved lactococci attain a nonculturable state wherein sugar metabolism, cell division, and autolysis arerepressed, allowing the cells to maintain transcription, metabolic activity, and energy production during a state thatproduces new metabolites not associated with logarithmic growth.
Carbohydrates are the primary energy and carbon sourcesfor lactic acid bacteria (LAB) during growth in laboratorymedia and fermented products, such as milk. These traits areassociated with specific plasmids that have distinct genes forproteolysis and lactose metabolism (35). During the fermenta-tion processes, LAB are subject to the vagaries of stress due tochanges in water activity, pH, redox potential, and substrateavailability (38). Lactococci respond to stress conditions byregulating many metabolic pathways to maintain metabolismand energy production (61). In response to carbohydrate star-vation, lactococci become nonculturable (NC) and remainmetabolically active for at least 2 weeks (48).
At the onset of carbohydrate starvation in lactococci, theintracellular levels of the glycolytic intermediates, phos-phoenolpyruvate (PEP), 3-phosphoglycerate, and 2-phospho-glycerate increase, all of which constitute the PEP potential(53, 54). During persistent starvation, PEP is metabolized to
pyruvate and ATP (53, 54). Thompson and Thomas (54) sug-gested that lactococci utilize intracellular glycolytic reserves formoderate periods of starvation to compensate for the lack ofsugar. The PEP potential allows enzymatic activity and trans-port to remain active for survival during the depletion of car-bohydrates and is used to reactivate sugar metabolism.
The ability to form colonies on solid media is lost at theonset of carbohydrate starvation (48). During this NC state,cells are incapable of sustaining cellular division required forgrowth on rich nonselective media (39) but do remain meta-bolically active for extended times. Many genera exhibit theNC state, including Escherichia coli, Micrococcus luteus, Vibriovulnificus, Campylobacter jejuni, and Brevibacterium linens (3,39). However, the duration of survival in the NC state has notbeen demonstrated past 30 days in lactococci, thereby ques-tioning the role of cells in this cellular state in long-termsurvival during stress and hence the role of this cellular stage inthe flavor development of fermented foods during storage.While the genes involved in abiotic stresses, such as pH andtemperature, are well characterized in lactococci (42–44, 61),the molecular events associated with the NC state are notdelineated.
Macromolecular metabolism decreases in NC bacteria, sim-ilar to the response of marine bacteria to starvation (29). How-ever, starved cultures are not metabolically static cells.Changes during or after transition to the NC state includechanges in the size and shape of the bacteria to minimize
* Corresponding author. Mailing address: Center for IntegratedBioSystems, Utah State University, Logan, UT 84322-4700. Phone:(435) 797-2753. Fax: (435) 797-2766. E-mail: [email protected].
† Contribution number 7671 of the Utah Agricultural ExperimentalStation (approved by its director).
‡ Supplemental material for this article may be found at http://aem.asm.org/.
§ Present address: Ralcorp Frozen Bakery Products, 215 N. 700 W.,Bldg. 5-D, Ogden, UT 84404.
� Published ahead of print on 9 February 2007.
2498
on February 21, 2016 by guest
http://aem.asm
.org/D
ownloaded from

energy requirements, a decrease in the number of ribosomes,and changes in fatty acid content of the cell membrane inresponse to local conditions (39, 58). The NC cells of lactococcican synthesize RNA (51). Thus, the cells appear to decrease innumber, or even die, by classical plating techniques, but theyremain metabolically active (48).
Lactococci are capable of using alternate carbon sources suchas RNA, lipids, proteins, peptides, and amino acids for energyduring carbohydrate starvation (49). Carbohydrate starvation andenergy depletion prompt lactococci to shift their metabolism fromglycolysis to amino acid catabolism (48). The genes forming thearginine deiminase pathway are present on the chromosome inlactococci (8, 9) and serves as either the sole or an additionalsource of energy, carbon, and nitrogen in LAB, Bacillus, Pseudo-monas, Aeromonas, Mycoplasma, clostridia, and halobacteria (13,14). This pathway produces 1 mol of ATP per mol of arginine incarbohydrate-depleted medium (13, 14). This additional source ofATP increases the survival of Lactococcus lactis (48).
During sugar starvation, the available energy within cells isutilized for protein and biomolecule synthesis rather than forthe generation of cell mass. These proteins are then degradedby lactococci over time to generate peptides and amino acidsthat aid survival (50, 51). Aminopeptidases (APs) aid proteinturnover and new protein synthesis at transitional states duringstarvation (26). Hence, protein metabolism and AP activitymay be limiting factors for survival.
The ability of lactococci to survive during carbohydrate star-vation and continue transcriptional and translational turnoveralso indicates their ability to actively metabolize proteins andamino acids (51). They shift away from lactic acid productiontoward nitrogenous metabolism in the NC state, which leads tonew metabolic end products, such as fatty acids (21–23). Thesechanges manifest as a phenotype of persistent nonculturability.
In this study, we hypothesize that carbohydrate starvationrepresses specific genes for replication without induction of thelytic genes in lactococci. To test this hypothesis, this studycompared orthogonal cellular responses in three lactococcalstrains during carbohydrate starvation by using plate counts,intracellular ATP content, a fluorescent probe for membranecompromise, amino acid metabolism, enzyme activity, macro-molecule transport, and gene expression profiles to determinemultiple metabolic responses to starvation. The findings indi-cate that lactococci remained metabolically active by maintain-ing membrane integrity, shifting the metabolism from carbo-hydrates to amino acids, and maintaining ATP levels duringthe NC state. The population remained capable of amino acidcatabolism and yet was NC on solid agar for at least 3 years.Gene expression profiles measured across the cellular phases(logarithmic phase, starvation, and nonculturability) showedthat, among many expression changes, the onset of starvationrepressed genes for sugar catabolism and cell division. Genesassociated with cell lysis (those encoding N-acetyl murami-dases, lysins, and holins) were not expressed at any phase ofcell growth.
MATERIALS AND METHODS
Bacterial strains and media. Lactococcus lactis subsp. lactis ML3 and IL1403and Lactococcus lactis subsp. cremoris SK11 were obtained from the Utah StateUniversity culture collection. The L. lactis subsp. lactis strains were propagatedin Elliker’s and M17G broths, respectively, and L. lactis subsp. cremoris SK11 was
grown in M17L broth (Difco Laboratories, Detroit, MI). Stock cultures wereprepared by growing the organisms twice in 10 ml of the respective broth at 30°Cfor 24 h. Cultures were frozen for storage at �70°C in 10% nonfat dry milkcontaining 30% glycerol. Before each experiment, frozen stock cultures werethawed and subcultured twice at 30°C for 24 h in 10 ml of the respective broth.
The strains were grown overnight at 30°C, harvested by centrifugation(6,000 � g for 15 min at 4°C), washed twice with and resuspended in sterilesaline, and inoculated (1%) into sterile chemically defined basal medium (CDM)(24). For short-term starvation studies, the basal CDM was supplemented with0.1% lactose. For long-term starvation, the basal CDM contained 0.2% lactoseor glucose, and branched-chain amino acids (BCAAs) were added at 10 times theoriginal CDM content of 20 mg/liter. The CDM was adjusted to either pH 7.2buffered with 0.19 M of sterile 3-(N-morpholino)propanesulfonic acid (MOPS)or pH 5.2 buffered with 0.19 M 2-(N-morpholino)ethanesulfonic acid and filtersterilized. Amino acids and buffer salts were purchased from Sigma (Sigma-Aldrich, St. Louis, MO).
Lactose and glucose determination. Lactose or glucose concentration wasdetermined either by the colorimetric method of Dubois et al. (16) or by high-pressure liquid chromatography as described by Stuart et al. (48).
Culturable cell estimation. Samples were taken at determined time pointsfrom the culture suspensions and diluted in sterile saline dilution blanks. Thesedilutions were either spiral plated as described by Stuart et al. (48) or plated onthe respective solid medium by using the spread-plate technique in duplicate.The plates were incubated anaerobically for 48 h at 30°C. Colony counts weredetermined in spiral-plated plates according to the manufacturer’s instructionsby using duplicate plates.
Cell viability estimation by fluorescence. Samples were collected from the cellsuspension, and bacterial viability was estimated as described previously byStuart et al. (48).
ATP determination. Intracellular ATP concentration in cell suspensions wasquantified by measuring bioluminescence with an ATP assay kit as described inthe manufacturer’s instructions (Calbiochem-Novabiochem Corporation, SanDiego, CA) and was described earlier (48). Luminescence was measured on anLS6500 scintillation counter (Beckman Coulter Inc., Fullerton, CA).
AP and lipase/esterase (LE) activities. Cell-free extracts (CFE) from cultureswere prepared as described by Dias and Weimer (15) using sterile 106-�m glassbeads (Sigma Chemical Co., St. Louis, MO) to facilitate cell lysis. The sampleswere vortexed at high speed for 10 min at 1-min intervals, with alternate dippingin an ice bath. The supernatant was collected and used as the CFE for intracel-lular enzyme assays. The protein content of the CFE was determined spectro-photometrically using a bicinchoninic acid assay according to the manufacturer’sinstructions (Pierce Chemical Co., Rockford, IL). Bovine serum albumin wasused to obtain a standard curve.
AP activity was measured by a semiautomated colorimetric method usingreflectance colorimetry as described by Dias and Weimer (15). The assay mix-tures contained 100 �l of 1 mM chromogenic substrate in 0.05 M sodiumphosphate buffer (pH 7.2) and 100 �l of CFE. Hydrolysis of the chromogenicsubstrate was measured as the increase in yellowness (b*) by using a reflectancecolorimeter (Omnispec 4000 bioactivity monitor; Wescor, Inc., Logan, UT) every5 min for 3 h at 30°C in duplicate.
LE activity was determined by a semiautomated reflectance colorimetricmethod using p-nitrophenyl derivatives (Sigma-Aldrich, St. Louis, MO) ofbutyrate and caprylate (1). Each assay mixture contained 20 �l of 1 mM chro-mogenic substrate in 80 �l of 0.05 M sodium phosphate buffer (pH 7.2) with 0.2mM Triton X-100 and 100 �l of CFE. Colorimetric measurements were deter-mined as described for AP activity.
Enzyme activities were determined by plotting the change in yellowness (�b*)over the assay time (15). The linear portion of the curve was used to calculate theslope. The slope was divided by the amount of protein in the added CFE to givethe AP and LE activities (�b*/mg protein/h).
Amino acid determination. CDM samples were prepared and derivatized with3-(4-carboxybenzoyl)quinoline-2-carboxaldehyde as described by Stuart et al.and Ummadi and Weimer (48, 55). Norleucine was added as an internal standardto each reaction mixture before the derivatizing agent was added. Amino acidswere monitored by micellar electrokinetic chromatography and laser-inducedfluorescence (48, 55). The results are presented as amino acid concentrations(mM).
Peptide metabolism. After 8 months of starvation, a peptide uptake andutilization assay was performed using the casein peptide �s1-9. Cells were col-lected from CDM by centrifugation on a bench-top centrifuge at 12,000 � g for2 min and washed once with 190 mM MOPS at pH 7.2. The cells were resus-pended in the same buffer containing the peptide, and the level of peptides in the
VOL. 73, 2007 LACTOCOCCI AND CARBOHYDRATE STARVATION 2499
on February 21, 2016 by guest
http://aem.asm
.org/D
ownloaded from

assay buffer was monitored at 0, 1, 3, and 24 h by high-pressure liquid chroma-tography as described by Broadbent et al. (4).
Amino acid metabolism assay. The cells were collected at one specific timepoint and incubated with [2-13C]leucine as described by Ganesan et al. (22, 23).Postincubation, the supernatant and cell pellet were collected by centrifugation(12,000 � g for 2 min) and the products were assayed in the supernatant and cellextracts by nuclear magnetic resonance spectroscopy as described by Ganesanet al. (23).
Gene expression analysis. A whole-genome array was designed, produced, andvalidated by NimbleGen Systems, Inc. (Madison, WI) using the genome se-quence of IL1403 that is publicly available (2). RNA samples at logarithmicphase, the onset of starvation, and nonculturability were extracted, purified, andreverse transcribed to cDNA as described by Xie et al. (61). The cDNA wassheared enzymatically by the protocol of Nimblegen Systems, Inc. and biotinyl-ated as described by Xie et al. (61) prior to hybridization. The cDNA sampleswere hybridized and detected at NimbleGen using the NimbleScreen oligonu-cleotide microarrays designed and optimized for IL1403.
Statistical analysis and gene expression visualization. All experiments weredone in two biological replicates. Starvation physiological and metabolic datafrom lactococcal strains ML3, SK11, and IL-1403 were analyzed with time as arepeated measure to determine strain-wise treatment effects (equation 1). Thefactors used in statistical analyses were the effect of time, the effect of pH, theircombined effect on strains, and the differences between any two strains at dif-ferent pHs. SAS statistical software, version SAS 9.0 (SAS Statistical Institute,Cary, NC), was used for the analysis. The parameters used in statistical analyseswere plate count estimates, live and dead cell counts, ATP content, and AP/LEactivities. Significant differences were assigned an � value of 0.05. All the Pvalues obtained were multiplied by the total number of time points (30) tocorrect for multiple comparisons.
Yijk � mean � pHi � timej � �pH � time�ij � (error)ijk (1)
where Y is the response variable generalized in the previous sentence and i, j, andk are the parameters in the equation.
For gene expression data, the raw pixel intensities from all arrays were simul-taneously normalized using the Robust Multichip Average package within Rstatistical software, version 2.1.0. The log2 values of Robust Multichip Average-normalized data were averaged across replicates and plotted as expression mapsin Hierarchical Clustering Explorer software, version 3.0 (46), for visualization.Coloring of the expression maps was based on whole-genome expression levelsfor all samples. A baseline was determined at the software-calculated mode thatwas color-coded green. Two levels of expression changes were set 2.5-fold apartfrom each other and were consequently represented by black and red.
The statistical significance of gene expression changes was determined using Rstatistical software suite v2.0, using a repeated-measure, linear mixed-effects modelwith a compound symmetry error structure with the lme package. The false discoveryrate to adjust against multiple comparisons was determined using the qvalue pack-age in R software. The false discovery rate (q value) was set at 30%.
RESULTS
The phenomenon of nonculturability is difficult to verifysince the traditional measure of growth on a solid medium isthe standard assay. However, the use of 16S DNA sequencingand metagenomics indicates that the NC state is common inextreme environments (56). Due to the difficulty of determin-ing this bacterial state, this study used numerous lines of evi-dence relevant to the physiology of lactococci in addition togrowth to estimate the NC state. Each method of analysisprovides a unique perspective of the metabolic state and cel-lular capability during growth and carbohydrate starvation.This approach provides evidence about the general health ofthe cell to prove that the NC state and the cellular capabilitiesfor survival and metabolism exist in lactococci.
Growth and starvation survival. Three lactococcal strainswere tested for survival and growth during short-term starvation(42 days) and long-term starvation (3.5 years). These strains wereselected based on different rates of lactose metabolism (48).Strain variation was tested using a common laboratory strain
(IL1403) that is plasmid free, a commercial strain commonly usedin the laboratory (ML3) that has three plasmids (including lac andprt), and a commercial strain (SK11) that has five plasmids (35).Two pH conditions were tested to simulate laboratory conditions(pH 7.2) and the acidic stress of cheese ripening (pH 5.2), theirindustrial use. The pH stress response leads to cross-protectionfor other stresses in lactococci (61). To control for this confound-ing effect, we incubated the cells under both pH conditions todetermine whether other stresses play a role in nonculturability.
Plate count assays were done to determine the culturabilityof each strain during the study. IL1403 was used as the controlorganism since it is plasmid free and lacks the ability to me-tabolize lactose (2) due to the absence of the lac plasmid. Assuch, the addition of lactose to the growth medium of thisstrain mimics carbohydrate starvation. This was tested by com-paring the addition of lactose to glucose catabolism in IL1403as a control for the role of plasmids. Buffered CDM was usedto avoid confounding the effect of pH stress during the study.
Culturable cell estimation and sugar metabolism. Duringshort-term starvation, the cell density of ML3 increased signif-icantly (P � 0.05) (Fig. 1). L. lactis subsp. lactis ML3 metab-olized the added lactose to below detectable levels within 1 day(Fig. 2A) and did not change the pH of the buffered medium.However, ML3 became NC at 8 days, 7 days after lactosedepletion, suggesting that additional molecular events wereoccurring to allow this strain to survive. Interestingly, the ad-dition of 0.2% lactose to the medium of ML3 again resulted incomplete utilization within 1 week (Fig. 2A). This additionproduced a reduction in pH of 0.5 units under both pHconditions tested, which agrees with the observations of Chou (8).SK11 utilized all the available lactose at pH 7.2 but did not utilizeany lactose at pH 5.2 (Fig. 2), nor did it alter the pH in eithermedium. IL1403, being plasmid free and incapable of metaboliz-ing lactose, did not utilize lactose at either pH (Fig. 2A), asexpected, but IL1403 utilized the glucose within 1 day at pH 7.2.
ML3 metabolized lactose quickly (i.e., within 1 day) andbecame NC within 9 days under both pH conditions. Alterna-tively, SK11 and IL1403 utilized sugar slower than ML3 andwere culturable at pH 7.2 until 30 days and 112 days, respec-tively (Fig. 1B). When grown at pH 5.2, SK11 became NC at 11days, while IL1403 did not become NC until 240 days (Fig. 1C).IL1403 in glucose at pH 7.2 attained nonculturability at 21days, which was similar to what was observed for SK11. Thesedata demonstrate that a relationship exists between the me-tabolism of carbohydrates and the NC state in lactococci,which is strain dependent. These results were expected becausecarbohydrate metabolism generates ATP and influences cellu-lar growth and density (8, 33). This was also observed by Chou(8), who found that the ratio of sugar to arginine influencednonculturability and the final pH of the medium due to the pro-duction of acid from sugar and that of ammonia from arginine,respectively. These observations further suggest that genetic reg-ulation switches between carbohydrate metabolism and othermetabolic modes determine the time at which a cell reaches theNC state. The metabolic switch is likely to be regulated by ccpA,which is known to act as both a repressor and an activator be-tween carbohydrate and amino acid metabolisms (25).
Viability. To verify that the cells were viable without cultur-ing, a cellular membrane probe that produces fluorescenceupon binding with DNA was used to examine membrane in-
2500 GANESAN ET AL. APPL. ENVIRON. MICROBIOL.
on February 21, 2016 by guest
http://aem.asm
.org/D
ownloaded from

tegrity as demonstrated by Stuart et al. (48) for lactococci. Therelative fluorescence of the live populations for all culturesincreased with growth in liquid media. The measure was thesame for logarithmic-phase cells and NC cells (see the supple-mental material) during short- and long-term starvation stud-ies. After the NC state was attained, the viabilities of all strainsremained at similar levels. Further observations for 2 years inCDM showed that the cells remained NC with no change inmembrane integrity (see the supplemental material). Theseobservations are similar to those of Stuart et al. (48), exceptthat this study demonstrated that the cells maintained intactmembranes in the NC state for at least 2 years. This indicates
that lactococci are capable of maintaining the membrane struc-ture for extended periods of starvation and suggests that in-tracellular processes remain active for cellular metabolism,including the preservation of ATP and a proton motive force(PMF) for transport.
Cellular energy. The ATP concentration during growth wasdetermined to estimate the amount of cellular energy availableduring logarithmic growth and nonculturability since the cellsmaintained intact membranes. During short-term starvation,the ATP concentration of ML3 followed a pattern similar tocell count estimations (Fig. 2B) and significantly increased overtime (P � 0.05). The ATP level rose during lactose metabolism
FIG. 1. Cell counts during growth and carbohydrate starvation in buffered CDM. Plate counts of ML3 in buffered CDM containing 0.1% lactoseat pH 7.0 (squares) (A) and plate counts of ML3 (squares), SK11 (diamonds), and IL1403 (circles) in CDM at pH 7.2 (B) and within the first 15days of starvation (B1) are shown. Plate counts of ML3 (squares), SK11 (diamonds), and IL1403 (circles) in CDM at pH 5.2 (C) and within thefirst 15 days of starvation (C1) are also shown. ML3 data are shown for up to 2 years, but ML3 was NC for up to 3.5 years. The coefficient ofvariation ranged between 0.1 and 9% for all strains at each time point and under each pH condition.
VOL. 73, 2007 LACTOCOCCI AND CARBOHYDRATE STARVATION 2501
on February 21, 2016 by guest
http://aem.asm
.org/D
ownloaded from
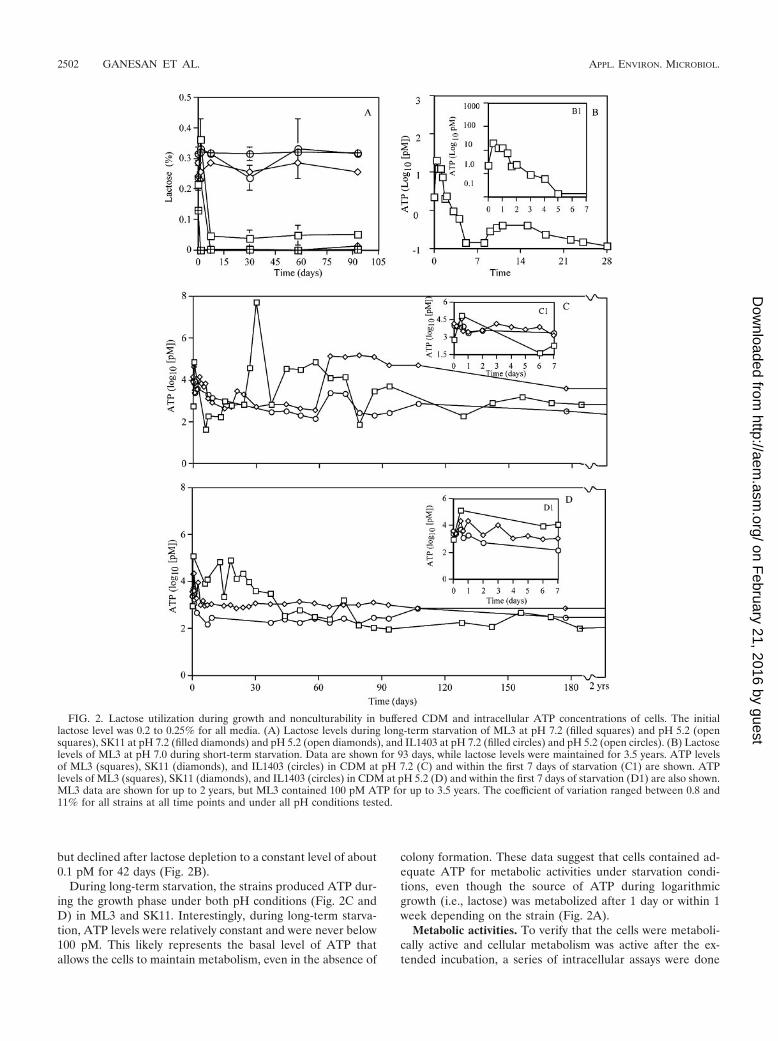
but declined after lactose depletion to a constant level of about0.1 pM for 42 days (Fig. 2B).
During long-term starvation, the strains produced ATP dur-ing the growth phase under both pH conditions (Fig. 2C andD) in ML3 and SK11. Interestingly, during long-term starva-tion, ATP levels were relatively constant and were never below100 pM. This likely represents the basal level of ATP thatallows the cells to maintain metabolism, even in the absence of
colony formation. These data suggest that cells contained ad-equate ATP for metabolic activities under starvation condi-tions, even though the source of ATP during logarithmicgrowth (i.e., lactose) was metabolized after 1 day or within 1week depending on the strain (Fig. 2A).
Metabolic activities. To verify that the cells were metaboli-cally active and cellular metabolism was active after the ex-tended incubation, a series of intracellular assays were done
FIG. 2. Lactose utilization during growth and nonculturability in buffered CDM and intracellular ATP concentrations of cells. The initiallactose level was 0.2 to 0.25% for all media. (A) Lactose levels during long-term starvation of ML3 at pH 7.2 (filled squares) and pH 5.2 (opensquares), SK11 at pH 7.2 (filled diamonds) and pH 5.2 (open diamonds), and IL1403 at pH 7.2 (filled circles) and pH 5.2 (open circles). (B) Lactoselevels of ML3 at pH 7.0 during short-term starvation. Data are shown for 93 days, while lactose levels were maintained for 3.5 years. ATP levelsof ML3 (squares), SK11 (diamonds), and IL1403 (circles) in CDM at pH 7.2 (C) and within the first 7 days of starvation (C1) are shown. ATPlevels of ML3 (squares), SK11 (diamonds), and IL1403 (circles) in CDM at pH 5.2 (D) and within the first 7 days of starvation (D1) are also shown.ML3 data are shown for up to 2 years, but ML3 contained 100 pM ATP for up to 3.5 years. The coefficient of variation ranged between 0.8 and11% for all strains at all time points and under all pH conditions tested.
2502 GANESAN ET AL. APPL. ENVIRON. MICROBIOL.
on February 21, 2016 by guest
http://aem.asm
.org/D
ownloaded from
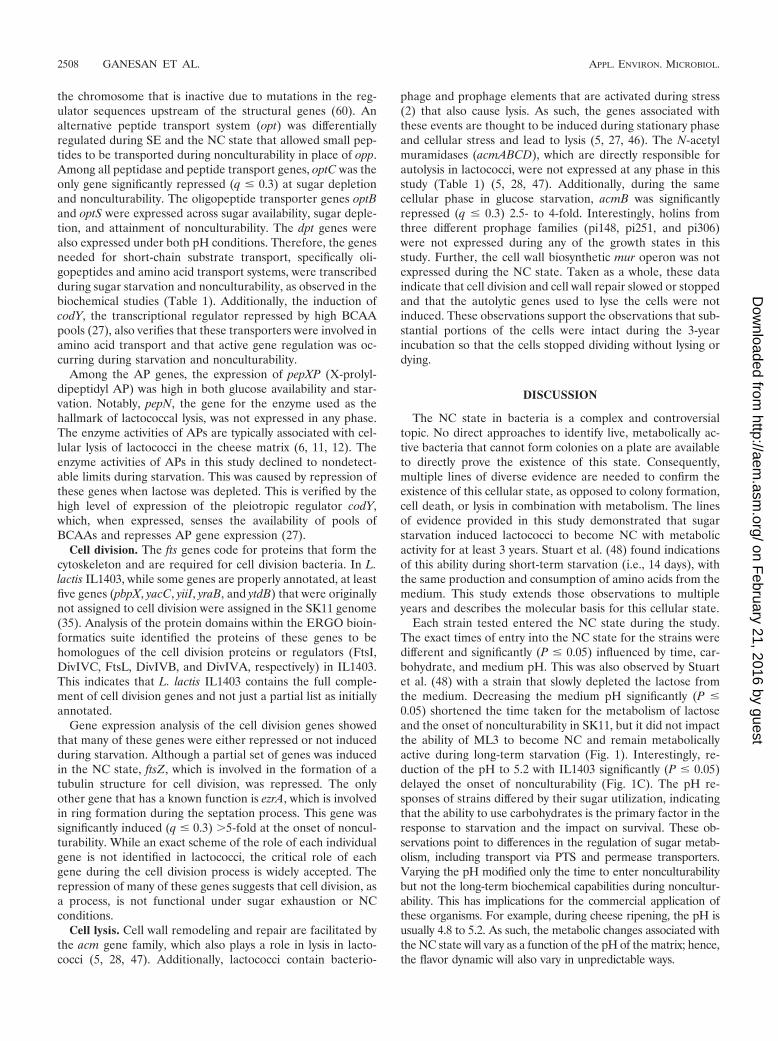
that measured various metabolic activities of the cell that re-quired energy. All assays were used to demonstrate the abilityof NC cells to remain metabolically active, despite their inabil-ity to produce colonies on a solid medium.
Peptide metabolism. The transport mechanism of casein-derived peptides via the Opp system that requires ATP ischromosomal (4, 10). During long-term starvation, peptideuptake with ML3 was determined at 8 months of incubation inan assay system to verify the presence of adequate ATP so asto allow active transport during the NC state. ML3 initiatedtransport of the �s1-9 casein peptide within 3 h of exposure tothe peptide and completely utilized the peptide within 24 h(data not shown). This confirmed that NC cells have mem-brane integrity (see the supplemental material), contain suffi-cient ATP (Fig. 2), and have active peptide transport systems(i.e., the summation of Opt, Opp, and Dpp oligopeptide trans-port systems) that require ATP.
AP and lipase activities. Once the peptide is transportedinto the cell, AP degrades them into the constituent aminoacids. This feature is important to industrial fermentations forgrowth and flavor production during product storage. Duringshort-term starvation, AP and LE activities were present inML3 initially at 80 to 90 units �b*/mg protein/h (data notshown). However, these activities significantly (P � 0.05) de-creased to undetectable levels by 6 days. The decrease in ac-tivity of AP and LE may be due to a decrease in the energyneeded for these enzymes to function or for transcription.Alternatively, the lack of triacylglycerols and peptides or in-creased free amino acids inhibits the activities and expressionlevels of AP and LE (36), which were present in this definedmedium. These enzymes were not measured during long-termstarvation due to their short time of activity after the cellsbecame NC and the ability of the whole-genome arrays tomeasure the expression of the proteins needed for these pro-cesses. Since the AP activity decreased, yet the cells producedend products from amino acid metabolism, we measuredamino acid concentration in the medium.
Amino acid metabolism. Amino acid transport is facilitatedby antiport, PMF, and ATP-driven mechanisms in lactococci(31). Therefore, amino acid metabolism and transport weredetermined as a measure of active metabolism, PMF, and ATPavailability for transport of small molecules. The amino acidsglycine/valine, threonine, tyrosine, alanine, histidine, proline,cysteine, isoleucine, phenylalanine, leucine, aspartate, gluta-mate, and asparagine did not significantly (P 0.05) changeover the incubation time and cellular phase changes.
Arginine decreased significantly (P � 0.05) to nondetectablelevels after 2 days in CDM with ML3 (Fig. 3), as did glutamineover 42 days of incubation (Fig. 3). Conversely, the methionineand serine concentrations significantly (P � 0.05) increasedover time in ML3 (Fig. 3). The reduction of arginine afterlactose depletion is consistent with the results of a previousstudy (8), as is the production of methionine and serine withresults of studies of cheese and defined media (32, 57). Thecells retained the ability to transport amino acids under allconditions that demonstrate that the PMF (glutamine), ATPavailability (serine), and antiporters (arginine) are operableduring all time points of starvation. To complement this ob-servation, we determined the ability of the NC cells to metab-
olize amino acids that will yield end products, energy, redoxcontrol, and a PMF gradient.
Amino acid catabolism in NC cells. Amino acids were trans-ported and are a substantial source of ATP during starvation(20, 21). BCAAs are imported via a PMF-dependent transportsystem, which requires an intact membrane to maintain thepotential (31), resulting in the production of 2 mol of ATP/BCAAs. We observed BCAA transport (PMF dependent) andmetabolism during this study, further supporting previous ob-servations of intact membranes by using fluorescence. There-fore, NC cells were collected from all strains and assayed forfatty acid production using [2-13C]L-leucine nuclear magneticresonance after incubation for 3.5, 2, and 2 years, respectively,for ML3, SK11, and IL1403. All strains catabolized leucine toisobutyric, propionic, and acetic acids. Intracellular leucine wasfound with the concomitant presence of isobutyric acid in thesupernatant, indicating that this amino acid was being con-verted to a new product (i.e., branched-chain fatty acids) thatwas found only during starvation (20), which is consistent withthe observations of Ganesan et al. (21). This confirmed ourhypothesis that amino acids were transported via a PMF-de-pendent mechanism for the generation of ATP during sugarstarvation in short- and long-term starvation studies, suggest-ing that this is an important mechanism for survival withoutsugar. Taken together, these experiments verify that NC cellshave an intact membrane that is capable of supporting sub-strate transport via three different mechanisms and enableamino acid metabolism for new end products that result inATP generation to support survival and cellular metabolism.
Gene expression analysis. The biochemical and physiologi-cal data provided evidence that the cells were capable of sur-vival and metabolism. However, it was unclear whether thiswas from enzymes produced during logarithmic-phase growthor from transcription and subsequent translation during star-vation; as such, we determined the gene expression at keyphenotypic points during the experiment with IL1403 by usinga whole-genome expression chip we designed previously (21).This study investigated the genes annotated for glycolysis,cell division, autolysis, and their known regulators. Using arepeated-measure statistical model, we found that 34 of the300 genes in these categories were significantly (q � 0.3)regulated at sugar exhaustion (SE) and nonculturability (Ta-ble 1). The specific metabolic functions associated withthese two cellular stages are further described with respectto their role in cellular function and metabolic ability.
Glycolysis. The genes associated with sugar transport andcatabolism were regulated differently between SE and attain-ment of nonculturability (Table 1). Many of the glycolyticgenes involved in catabolizing glucose to triose phosphateswere repressed during the incubation time but did not change(i.e., �2-fold change) at SE (Table 1). For example, the ptsgenes associated with the phosphorelay system for phospho-transferase transport system (PTS) sugar transport poise thecell for rapid sugar use and were regulated differently as thecell progressed to the NC state. The kinase (ptsK) and Hprcarrier protein (ptsH) genes were repressed at NC attainment(Fig. 4). This was somewhat expected, as glucose exhaustionrepresses the genes associated with sugar metabolism (17), butthe progression of repression was not expected. Additional
VOL. 73, 2007 LACTOCOCCI AND CARBOHYDRATE STARVATION 2503
on February 21, 2016 by guest
http://aem.asm
.org/D
ownloaded from

uncharacterized genes related to sugar transport (yngE, ypcG,and malFG) reflect the redundancy (Table 1).
The genes for other steps of glycolysis, for example, pgk(phospholycerate kinase) and yjhF (phosphoglyceromutase),were significantly (q � 0.3) induced 2.5- to 4-fold above themedian expression level during starvation. Only six genes re-mained unchanged from logarithmic-phase growth to noncul-turability (ptsI, lacR, galK, pmg, pflA, and pta). Notably, theunregulated genes are all associated with a regulatory protein,sugar phosphorylation, or sugar transport via a permease,while starvation repressed some genes needed to utilize ATPfor sugar phosphorylation. Additionally, some of the down-stream products of glycolysis (3-phosphoglycerate, phospho-enol pyruvate, and pyruvate) are also substrates for intercon-version to amino acid biosynthesis, which is consistent with theobservations of amino acid production and the subsequentmetabolism to branched-chain fatty acids. This suggests thatmetabolic mechanisms in glycolysis that scavenge precursors
for protein synthesis, redox, and ATP generation remain activeduring starvation and nonculturability from new transcriptionand translation events. This also indicates that the cells maypossess intermediates that contribute to depletion of the PEPpotential and, hence, are energetically poised to shuttle glyco-lytic intermediates that metabolize substrates into amino acidsfor subsequent energy. These observations are consistent withthe observation of peptide metabolism after 3.5 years of car-bohydrate starvation and BCAA catabolism for the productionof ATP.
ATP synthase. Since glycolytic genes were repressed, ATPsynthesis must have occurred from alternate sources. One suchsource is the use of ATP synthesis as part of macromoleculetransport that is required for cellular processes important insurvival and metabolism. The F0F1 ATP synthase of lactococciacts as a proton pump that maintains intracellular PMF gra-dient by utilizing energy from ATP hydrolysis to pump protonsout of the cell (30). The F1 unit of ATP synthase (i.e., the ε
FIG. 3. Extracellular amino acid profile for ML3 grown in CDM with 0.1% lactose. Serine concentrations are depicted on the yy axis and allother amino acid concentrations on the y axis. The coefficient of variation ranged between 1 and 8% over all time points.
2504 GANESAN ET AL. APPL. ENVIRON. MICROBIOL.
on February 21, 2016 by guest
http://aem.asm
.org/D
ownloaded from
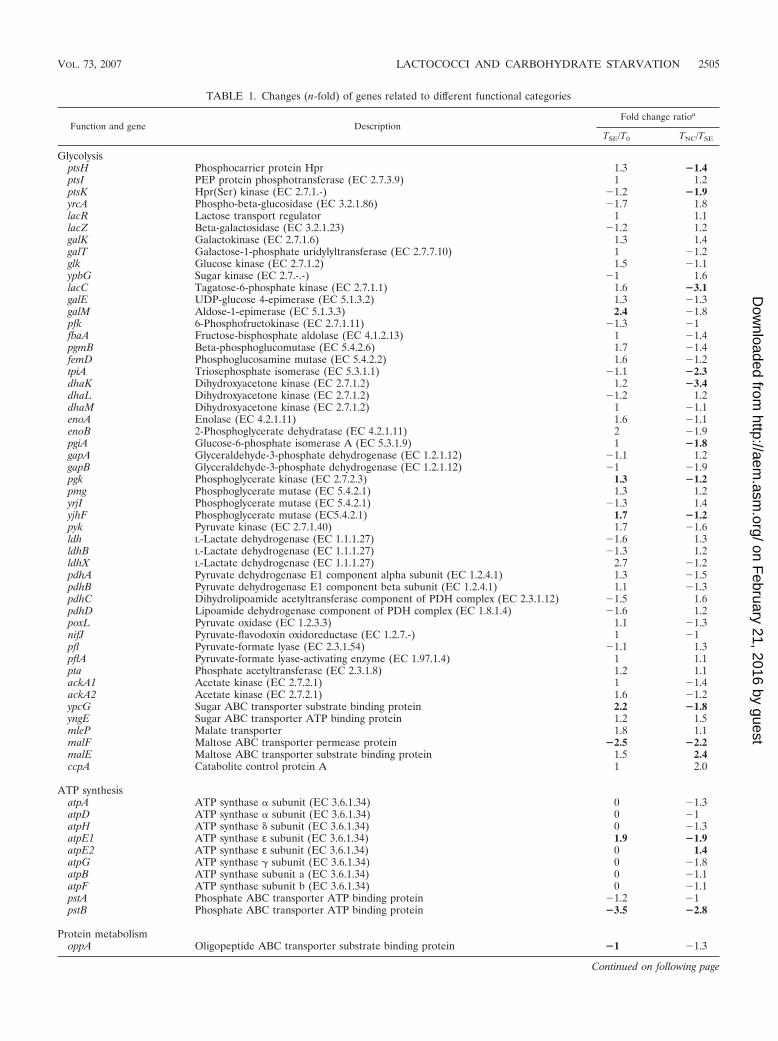
TABLE 1. Changes (n-fold) of genes related to different functional categories
Function and gene DescriptionFold change ratioa
TSE/T0 TNC/TSE
GlycolysisptsH Phosphocarrier protein Hpr 1.3 �1.4ptsI PEP protein phosphotransferase (EC 2.7.3.9) 1 1.2ptsK Hpr(Ser) kinase (EC 2.7.1.-) �1.2 �1.9yrcA Phospho-beta-glucosidase (EC 3.2.1.86) �1.7 1.8lacR Lactose transport regulator 1 1.1lacZ Beta-galactosidase (EC 3.2.1.23) �1.2 1.2galK Galactokinase (EC 2.7.1.6) 1.3 1.4galT Galactose-1-phosphate uridylyltransferase (EC 2.7.7.10) 1 �1.2glk Glucose kinase (EC 2.7.1.2) 1.5 �1.1ypbG Sugar kinase (EC 2.7.-.-) �1 1.6lacC Tagatose-6-phosphate kinase (EC 2.7.1.1) 1.6 �3.1galE UDP-glucose 4-epimerase (EC 5.1.3.2) 1.3 �1.3galM Aldose-1-epimerase (EC 5.1.3.3) 2.4 �1.8pfk 6-Phosphofructokinase (EC 2.7.1.11) �1.3 �1fbaA Fructose-bisphosphate aldolase (EC 4.1.2.13) 1 �1.4pgmB Beta-phosphoglucomutase (EC 5.4.2.6) 1.7 �1.4femD Phosphoglucosamine mutase (EC 5.4.2.2) 1.6 �1.2tpiA Triosephosphate isomerase (EC 5.3.1.1) �1.1 �2.3dhaK Dihydroxyacetone kinase (EC 2.7.1.2) 1.2 �3.4dhaL Dihydroxyacetone kinase (EC 2.7.1.2) �1.2 1.2dhaM Dihydroxyacetone kinase (EC 2.7.1.2) 1 �1.1enoA Enolase (EC 4.2.1.11) 1.6 �1.1enoB 2-Phosphoglycerate dehydratase (EC 4.2.1.11) 2 �1.9pgiA Glucose-6-phosphate isomerase A (EC 5.3.1.9) 1 �1.8gapA Glyceraldehyde-3-phosphate dehydrogenase (EC 1.2.1.12) �1.1 1.2gapB Glyceraldehyde-3-phosphate dehydrogenase (EC 1.2.1.12) �1 �1.9pgk Phosphoglycerate kinase (EC 2.7.2.3) 1.3 �1.2pmg Phosphoglycerate mutase (EC 5.4.2.1) 1.3 1.2yrjI Phosphoglycerate mutase (EC 5.4.2.1) �1.3 1.4yjhF Phosphoglycerate mutase (EC5.4.2.1) 1.7 �1.2pyk Pyruvate kinase (EC 2.7.1.40) 1.7 �1.6ldh L-Lactate dehydrogenase (EC 1.1.1.27) �1.6 1.3ldhB L-Lactate dehydrogenase (EC 1.1.1.27) �1.3 1.2ldhX L-Lactate dehydrogenase (EC 1.1.1.27) 2.7 �1.2pdhA Pyruvate dehydrogenase E1 component alpha subunit (EC 1.2.4.1) 1.3 �1.5pdhB Pyruvate dehydrogenase E1 component beta subunit (EC 1.2.4.1) 1.1 �1.3pdhC Dihydrolipoamide acetyltransferase component of PDH complex (EC 2.3.1.12) �1.5 1.6pdhD Lipoamide dehydrogenase component of PDH complex (EC 1.8.1.4) �1.6 1.2poxL Pyruvate oxidase (EC 1.2.3.3) 1.1 �1.3nifJ Pyruvate-flavodoxin oxidoreductase (EC 1.2.7.-) 1 �1pfl Pyruvate-formate lyase (EC 2.3.1.54) �1.1 1.3pflA Pyruvate-formate lyase-activating enzyme (EC 1.97.1.4) 1 1.1pta Phosphate acetyltransferase (EC 2.3.1.8) 1.2 1.1ackA1 Acetate kinase (EC 2.7.2.1) 1 �1.4ackA2 Acetate kinase (EC 2.7.2.1) 1.6 �1.2ypcG Sugar ABC transporter substrate binding protein 2.2 �1.8yngE Sugar ABC transporter ATP binding protein 1.2 1.5mleP Malate transporter 1.8 1.1malF Maltose ABC transporter permease protein �2.5 �2.2malE Maltose ABC transporter substrate binding protein 1.5 2.4ccpA Catabolite control protein A 1 2.0
ATP synthesisatpA ATP synthase � subunit (EC 3.6.1.34) 0 �1.3atpD ATP synthase � subunit (EC 3.6.1.34) 0 �1atpH ATP synthase � subunit (EC 3.6.1.34) 0 �1.3atpE1 ATP synthase ε subunit (EC 3.6.1.34) 1.9 �1.9atpE2 ATP synthase ε subunit (EC 3.6.1.34) 0 1.4atpG ATP synthase subunit (EC 3.6.1.34) 0 �1.8atpB ATP synthase subunit a (EC 3.6.1.34) 0 �1.1atpF ATP synthase subunit b (EC 3.6.1.34) 0 �1.1pstA Phosphate ABC transporter ATP binding protein �1.2 �1pstB Phosphate ABC transporter ATP binding protein �3.5 �2.8
Protein metabolismoppA Oligopeptide ABC transporter substrate binding protein �1 �1.3
Continued on following page
VOL. 73, 2007 LACTOCOCCI AND CARBOHYDRATE STARVATION 2505
on February 21, 2016 by guest
http://aem.asm
.org/D
ownloaded from
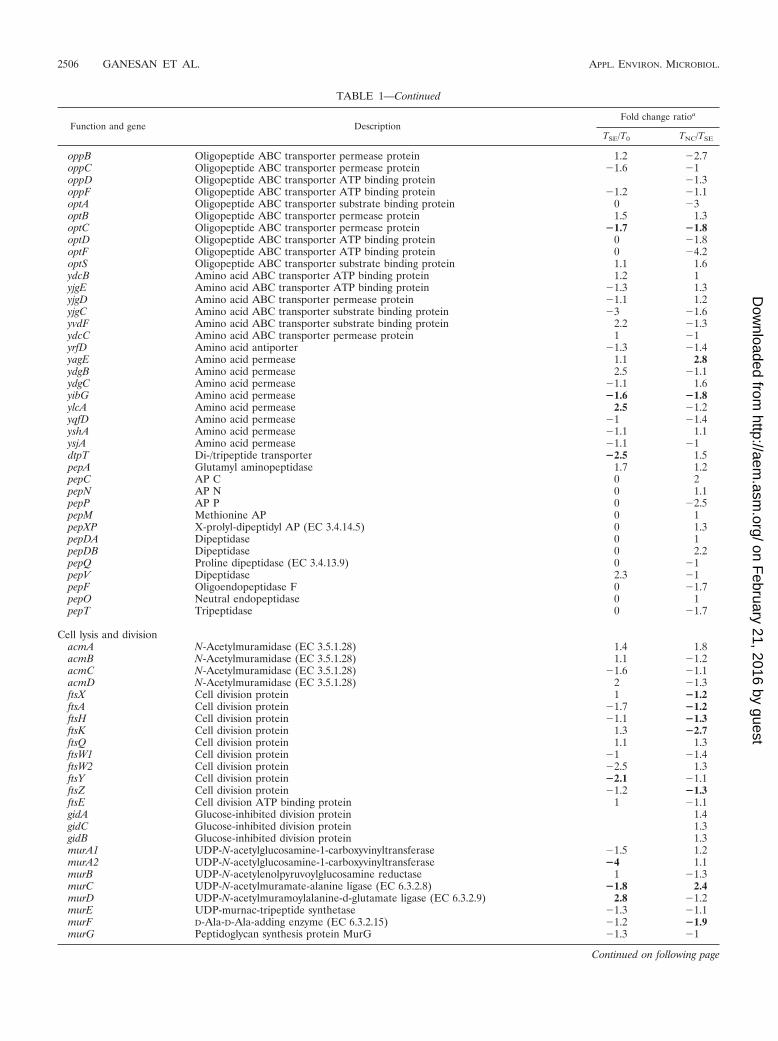
TABLE 1—Continued
Function and gene DescriptionFold change ratioa
TSE/T0 TNC/TSE
oppB Oligopeptide ABC transporter permease protein 1.2 �2.7oppC Oligopeptide ABC transporter permease protein �1.6 �1oppD Oligopeptide ABC transporter ATP binding protein �1.3oppF Oligopeptide ABC transporter ATP binding protein �1.2 �1.1optA Oligopeptide ABC transporter substrate binding protein 0 �3optB Oligopeptide ABC transporter permease protein 1.5 1.3optC Oligopeptide ABC transporter permease protein �1.7 �1.8optD Oligopeptide ABC transporter ATP binding protein 0 �1.8optF Oligopeptide ABC transporter ATP binding protein 0 �4.2optS Oligopeptide ABC transporter substrate binding protein 1.1 1.6ydcB Amino acid ABC transporter ATP binding protein 1.2 1yjgE Amino acid ABC transporter ATP binding protein �1.3 1.3yjgD Amino acid ABC transporter permease protein �1.1 1.2yjgC Amino acid ABC transporter substrate binding protein �3 �1.6yvdF Amino acid ABC transporter substrate binding protein 2.2 �1.3ydcC Amino acid ABC transporter permease protein 1 �1yrfD Amino acid antiporter �1.3 �1.4yagE Amino acid permease 1.1 2.8ydgB Amino acid permease 2.5 �1.1ydgC Amino acid permease �1.1 1.6yibG Amino acid permease �1.6 �1.8ylcA Amino acid permease 2.5 �1.2yqfD Amino acid permease �1 �1.4yshA Amino acid permease �1.1 1.1ysjA Amino acid permease �1.1 �1dtpT Di-/tripeptide transporter �2.5 1.5pepA Glutamyl aminopeptidase 1.7 1.2pepC AP C 0 2pepN AP N 0 1.1pepP AP P 0 �2.5pepM Methionine AP 0 1pepXP X-prolyl-dipeptidyl AP (EC 3.4.14.5) 0 1.3pepDA Dipeptidase 0 1pepDB Dipeptidase 0 2.2pepQ Proline dipeptidase (EC 3.4.13.9) 0 �1pepV Dipeptidase 2.3 �1pepF Oligoendopeptidase F 0 �1.7pepO Neutral endopeptidase 0 1pepT Tripeptidase 0 �1.7
Cell lysis and divisionacmA N-Acetylmuramidase (EC 3.5.1.28) 1.4 1.8acmB N-Acetylmuramidase (EC 3.5.1.28) 1.1 �1.2acmC N-Acetylmuramidase (EC 3.5.1.28) �1.6 �1.1acmD N-Acetylmuramidase (EC 3.5.1.28) 2 �1.3ftsX Cell division protein 1 �1.2ftsA Cell division protein �1.7 �1.2ftsH Cell division protein �1.1 �1.3ftsK Cell division protein 1.3 �2.7ftsQ Cell division protein 1.1 1.3ftsW1 Cell division protein �1 �1.4ftsW2 Cell division protein �2.5 1.3ftsY Cell division protein �2.1 �1.1ftsZ Cell division protein �1.2 �1.3ftsE Cell division ATP binding protein 1 �1.1gidA Glucose-inhibited division protein 1.4gidC Glucose-inhibited division protein 1.3gidB Glucose-inhibited division protein 1.3murA1 UDP-N-acetylglucosamine-1-carboxyvinyltransferase �1.5 1.2murA2 UDP-N-acetylglucosamine-1-carboxyvinyltransferase �4 1.1murB UDP-N-acetylenolpyruvoylglucosamine reductase 1 �1.3murC UDP-N-acetylmuramate-alanine ligase (EC 6.3.2.8) �1.8 2.4murD UDP-N-acetylmuramoylalanine-d-glutamate ligase (EC 6.3.2.9) 2.8 �1.2murE UDP-murnac-tripeptide synthetase �1.3 �1.1murF D-Ala-D-Ala-adding enzyme (EC 6.3.2.15) �1.2 �1.9murG Peptidoglycan synthesis protein MurG �1.3 �1
Continued on following page
2506 GANESAN ET AL. APPL. ENVIRON. MICROBIOL.
on February 21, 2016 by guest
http://aem.asm
.org/D
ownloaded from

subunit atpE1) was significantly induced (q � 0.3) at SE, whilegene expression was low and remained unchanged for the �, �, , and � subunits. The genes for the F0 unit responsible forproton channel activity (atpB and atpF) were expressed duringglucose availability and SE. The �, �, and subunits are re-sponsible for ATP hydrolysis for proton translocation while theε subunit is responsible for connecting channel activity to pro-ton translocation (45). The low expression of the �, �, and subunits suggests that the cells are reducing ATP hydrolysis
during starvation to minimize ATP loss by proton translocationyet expressing these proteins at a sufficient level to maintainthe PMF, as indicated by amino acid transport.
Protein metabolism. Protein metabolism, which includespeptide and amino acid transport, proteases, and APs, pro-vides amino acid substrates for metabolic processes. The mostnotable observation is the compete repression of opp, which isthe primary peptide transport system used during log-phasegrowth (Table 1). This strain has a portion of the opp system on
FIG. 4. Schematic representation of gene expression of the lactococcal PEP-dependent PTS for various PTS sugars with connections toglycolytic intermediates. The symbol indicates gene repression. NAG, N-acetylglucosamine.
TABLE 1—Continued
Function and gene DescriptionFold change ratioa
TSE/T0 TNC/TSE
dnaA Replication initiation protein DnaA �1dnaB Replication protein DnaB 1dnaC Replicative DNA helicase �2.1dnaD DNA replication protein DnaD �1.1dnaE DNA polymerase III, alpha chain 2 (EC 2.7.7.7) �2.3dnaG DNA primase (EC 2.7.7.-) �1.1dnaH DNA polymerase III, subunits beta and tau (EC 2.7.7.7) 1.1dnaI Primosomal protein DnaI 3.7dnaN DNA polymerase III, beta chain (EC 2.7.7.7) �1dnaQ DNA polymerase III, epsilon chain 1.1
a The changes (n-fold) of significantly changing genes are in boldface. All significantly changing genes have a q value of �0.3. Positive values of change indicateinduction of gene expression, while negative values indicate repression. T0, initial time point; TSE, time point of SE; TNC, time point of nonculturability.
VOL. 73, 2007 LACTOCOCCI AND CARBOHYDRATE STARVATION 2507
on February 21, 2016 by guest
http://aem.asm
.org/D
ownloaded from
the chromosome that is inactive due to mutations in the reg-ulator sequences upstream of the structural genes (60). Analternative peptide transport system (opt) was differentiallyregulated during SE and the NC state that allowed small pep-tides to be transported during nonculturability in place of opp.Among all peptidase and peptide transport genes, optC was theonly gene significantly repressed (q � 0.3) at sugar depletionand nonculturability. The oligopeptide transporter genes optBand optS were expressed across sugar availability, sugar deple-tion, and attainment of nonculturability. The dpt genes werealso expressed under both pH conditions. Therefore, the genesneeded for short-chain substrate transport, specifically oli-gopeptides and amino acid transport systems, were transcribedduring sugar starvation and nonculturability, as observed in thebiochemical studies (Table 1). Additionally, the induction ofcodY, the transcriptional regulator repressed by high BCAApools (27), also verifies that these transporters were involved inamino acid transport and that active gene regulation was oc-curring during starvation and nonculturability.
Among the AP genes, the expression of pepXP (X-prolyl-dipeptidyl AP) was high in both glucose availability and star-vation. Notably, pepN, the gene for the enzyme used as thehallmark of lactococcal lysis, was not expressed in any phase.The enzyme activities of APs are typically associated with cel-lular lysis of lactococci in the cheese matrix (6, 11, 12). Theenzyme activities of APs in this study declined to nondetect-able limits during starvation. This was caused by repression ofthese genes when lactose was depleted. This is verified by thehigh level of expression of the pleiotropic regulator codY,which, when expressed, senses the availability of pools ofBCAAs and represses AP gene expression (27).
Cell division. The fts genes code for proteins that form thecytoskeleton and are required for cell division bacteria. In L.lactis IL1403, while some genes are properly annotated, at leastfive genes (pbpX, yacC, yiiI, yraB, and ytdB) that were originallynot assigned to cell division were assigned in the SK11 genome(35). Analysis of the protein domains within the ERGO bioin-formatics suite identified the proteins of these genes to behomologues of the cell division proteins or regulators (FtsI,DivIVC, FtsL, DivIVB, and DivIVA, respectively) in IL1403.This indicates that L. lactis IL1403 contains the full comple-ment of cell division genes and not just a partial list as initiallyannotated.
Gene expression analysis of the cell division genes showedthat many of these genes were either repressed or not inducedduring starvation. Although a partial set of genes was inducedin the NC state, ftsZ, which is involved in the formation of atubulin structure for cell division, was repressed. The onlyother gene that has a known function is ezrA, which is involvedin ring formation during the septation process. This gene wassignificantly induced (q � 0.3) 5-fold at the onset of noncul-turability. While an exact scheme of the role of each individualgene is not identified in lactococci, the critical role of eachgene during the cell division process is widely accepted. Therepression of many of these genes suggests that cell division, asa process, is not functional under sugar exhaustion or NCconditions.
Cell lysis. Cell wall remodeling and repair are facilitated bythe acm gene family, which also plays a role in lysis in lacto-cocci (5, 28, 47). Additionally, lactococci contain bacterio-
phage and prophage elements that are activated during stress(2) that also cause lysis. As such, the genes associated withthese events are thought to be induced during stationary phaseand cellular stress and lead to lysis (5, 27, 46). The N-acetylmuramidases (acmABCD), which are directly responsible forautolysis in lactococci, were not expressed at any phase in thisstudy (Table 1) (5, 28, 47). Additionally, during the samecellular phase in glucose starvation, acmB was significantlyrepressed (q � 0.3) 2.5- to 4-fold. Interestingly, holins fromthree different prophage families (pi148, pi251, and pi306)were not expressed during any of the growth states in thisstudy. Further, the cell wall biosynthetic mur operon was notexpressed during the NC state. Taken as a whole, these dataindicate that cell division and cell wall repair slowed or stoppedand that the autolytic genes used to lyse the cells were notinduced. These observations support the observations that sub-stantial portions of the cells were intact during the 3-yearincubation so that the cells stopped dividing without lysing ordying.
DISCUSSION
The NC state in bacteria is a complex and controversialtopic. No direct approaches to identify live, metabolically ac-tive bacteria that cannot form colonies on a plate are availableto directly prove the existence of this state. Consequently,multiple lines of diverse evidence are needed to confirm theexistence of this cellular state, as opposed to colony formation,cell death, or lysis in combination with metabolism. The linesof evidence provided in this study demonstrated that sugarstarvation induced lactococci to become NC with metabolicactivity for at least 3 years. Stuart et al. (48) found indicationsof this ability during short-term starvation (i.e., 14 days), withthe same production and consumption of amino acids from themedium. This study extends those observations to multipleyears and describes the molecular basis for this cellular state.
Each strain tested entered the NC state during the study.The exact times of entry into the NC state for the strains weredifferent and significantly (P � 0.05) influenced by time, car-bohydrate, and medium pH. This was also observed by Stuartet al. (48) with a strain that slowly depleted the lactose fromthe medium. Decreasing the medium pH significantly (P �0.05) shortened the time taken for the metabolism of lactoseand the onset of nonculturability in SK11, but it did not impactthe ability of ML3 to become NC and remain metabolicallyactive during long-term starvation (Fig. 1). Interestingly, re-duction of the pH to 5.2 with IL1403 significantly (P � 0.05)delayed the onset of nonculturability (Fig. 1C). The pH re-sponses of strains differed by their sugar utilization, indicatingthat the ability to use carbohydrates is the primary factor in theresponse to starvation and the impact on survival. These ob-servations point to differences in the regulation of sugar metab-olism, including transport via PTS and permease transporters.Varying the pH modified only the time to enter nonculturabilitybut not the long-term biochemical capabilities during noncultur-ability. This has implications for the commercial application ofthese organisms. For example, during cheese ripening, the pH isusually 4.8 to 5.2. As such, the metabolic changes associated withthe NC state will vary as a function of the pH of the matrix; hence,the flavor dynamic will also vary in unpredictable ways.
2508 GANESAN ET AL. APPL. ENVIRON. MICROBIOL.
on February 21, 2016 by guest
http://aem.asm
.org/D
ownloaded from

The production of ATP in the cells was observed during allcellular phases in this study. This finding is important sinceATP-dependent transport of nutrients and metabolic pro-cesses allow the cell to produce new compounds or secondarymetabolites. Ganesan et al. (21) noted the parallel betweenglycolysis and BCAA utilization with respect to ATP produc-tion, allowing the pathways to be divided into two halves. Theinitial half (i.e., the preparatory phase) of glycolysis providesintermediates that switch between sugar and amino acid useduring starvation to provide energy (i.e., the payoff phase).Glucose metabolism genes of the preparatory phase were re-pressed during starvation and nonculturability, presumablydue to the exhaustion of glucose (Fig. 4). The genes of the latephase are involved in reactions that produce substrates foramino acid metabolism. These genes were expressed at star-vation and nonculturability. Sugar metabolism is repressed byCcpA, which activates the metabolism of nitrogenous sub-strates in Firmicutes (7). Since lactococci lack functional sigmafactors to regulate metabolism, the exact cadre of regulatoryevents is unclear. However, the involvement of CcpA and itscognate binding site (CRE) in the metabolic shift is clear.Interestingly, all of these strains contain multiple CRE sitesupstream of selected genes of the arginine deiminase pathway,which are likely activated differentially by CcpA. Chou (8)found that the proteins of the arginine deiminase pathwaywere produced differently, but not in an operon, and resultedin the metabolism of Arg in a segmented fashion. CcpA me-diates catabolite control by binding to HPr-SerP (7, 37), whichin turn needs to be phosphorylated by PEP. Consequently,depletion of the HPr-SerP intermediate is likely since thephosphocarrier protein (ptsH) and the Hpr(Ser) kinase (ptsK)were repressed, leaving CcpA available to bind other regula-tory partners that are unrelated to sugar metabolism.
During the transition from growth to the NC state, the cellrepressed division genes, remained intact during environmen-tal stress, and remained metabolically active to produce sec-ondary metabolites. The majority of the fts genes (8 or 10) wererepressed during this transition (Table 1), thereby leaving thecell unable to initiate cell division via ftsZ. Coupled with thatwas the repression of the genes associated with DNA replica-tion (Table 1); consequently, the cells lost the ability to divide.Interestingly, the genes for cell division and DNA replicationalso contained upstream CRE sites, indicating that these geneswere regulated by CcpA. This study found an inverse correla-tion in gene expression between these genes: ccpA was inducedas fts (specifically ftsZ) and dnaN were repressed.
The cellular integrity was maintained via intact membranesand the lack of induction of the lytic system (acm or phageholins) (Table 1). While none of the autolytic genes containupstream CRE sites, many of them were repressed while ccpAwas induced, indicating that additional regulatory systems areinvolved in autolysis. While other putative sugar regulators haddifferent expression patterns, only the role of CcpA in glyco-lytic repression was confirmed. Further studies are needed toverify the exact role of the individual regulators in this multi-gene change.
With the demonstration of NC cells, the repression of PTSsugar transport, and the shift to nitrogen substrates, the extentof metabolic ability remained. The proteolytic system was reg-ulated in mixed directions during the incubation. Oligopeptide
transporter (Table 1) expression was differentially regulated asthe cell entered starvation and nonculturability. Some compo-nents were repressed while others were induced. Three peptidetransport systems exist in lactococci, opp, dpt, and opt (10).Only the regulation and action of opp are well characterized(18). In this study, opp was repressed while dpt and optBCSwere concomitantly induced upon entry into starvation andnonculturability. This study demonstrated that �s1-9 casein wastransported during nonculturability, presumably via opt. Inter-estingly, the induction of dtp was associated with the inductionof three dipeptidases (pepXP, pepDA, and pepDB), while twoother dipeptidases (pepQ and pepV) were repressed. The in-duction of these functionally redundant systems allows the cellto acquire protein-based substrates with the repression of PTSsugar transport to provide energy to the cell, but additionalstudies are needed to functionally characterize their regulationand role in NC physiology.
The transport of amino acids regulates APs and peptidemetabolism via the pleiotropic repressor CodY (40). Duringthis study, only pepCDTO was induced during nonculturability;the remaining APs were repressed. This observation verifiesthe activity of APs increasing during growth but declining overstarvation (Table 1). This was supported by the reduction inenzymatic activity for these proteins. Two uncharacterizedamino acid transporters were induced during nonculturability,while many others were repressed. Additional studies of theseuncharacterized transporters are needed to determine theirrole in amino acid utilization, regulation, and substrate speci-ficity.
However, the linkage between the repression of sugar me-tabolism and the induction of amino acid utilization is dem-onstrated in this study. The data from this study and the resultsof Chou (8), where ML3 metabolized arginine only after thecell depleted lactose, are in agreement. This switch was regu-lated by the repression of sugar utilization via CcpA and wasinduced before lactococci shifted to amino acid metabolismfrom sugar metabolism (33). These similar responses suggestthat there is a minimal set of metabolic abilities that allow thecell to survive long-term carbohydrate starvation that arelinked to the shift of metabolism from sugar to amino acids,which provide energy in the absence of electron transportcapabilities in these organisms. All the strains maintained con-stant levels of ATP for long periods of carbohydrate starvation,even after becoming NC within 7 days of carbohydrate deple-tion. This indicates that the cells have enough energy to con-duct central metabolic reactions that require energy, such asenzyme activity and transport, which was verified by measuringgene expression and by phenotypic determination of aminoacid and peptide metabolisms. The intermediates of these re-actions are renewed by the interconnection between glycolyticintermediates and amino acid metabolism. Interestingly, thecell seems to conserve energy by repressing ATP synthasesubunits responsible for ATP hydrolysis (Table 1) associatedwith proton pumps, which channel ATP into intracellular pro-cesses.
During the 42-day starvation, the cultures became NC onsolid agar after the ATP concentration dropped below 0.5 pM(Fig. 1 and 3). We presumed that this represented the main-tenance energy required for lactococci to remain culturable onsolid agar, as did Stuart et al. (48). However, this supposition
VOL. 73, 2007 LACTOCOCCI AND CARBOHYDRATE STARVATION 2509
on February 21, 2016 by guest
http://aem.asm
.org/D
ownloaded from

was not true during long-term starvation, where ATP consis-tently remained above 100 pM throughout the NC period. Thedifference in the minimal ATP during long-term starvationmay be associated with the presence of BCAAs at 10-times-higher levels than for short-term starvation. The presence ofadditional BCAAs during the long-term starvation resulted in1,000- to 10,000-fold-higher levels of ATP (Fig. 2) than forcells without BCAA, thus confirming the shift from sugar toamino acid metabolism to provide ATP, even though the NCstate was attained within the same time interval (Fig. 1). Thischange was made for long-term starvation experiments to testwhether these amino acids were able to increase ATP levels.The positive result led us to conclude that BCAAs may supportthe carbon and energetic needs of the cells during long-termstarvation at levels that were similar to those during lactoseutilization.
Logarithmic-phase cells of lactococci utilize BCAAs to producestraight and branched-chain fatty acids in the absence of sugar(22). These pathways also allow for the production of ATP bysubstrate-level phosphorylation and generation of NAD that cansubsequently be used in redox-mediated biosynthetic pathwaysfor additional ATP (22, 23). Brevibacterium linens utilizes BCAAsonly after carbohydrate starvation (23). These observations pro-vide evidence that BCAAs extend survival via additional ATP andsupport precursor generation for other pathways to be functionalduring starvation. Arginine was depleted before the onset of theNC state (Fig. 3). Under such energy-depleted conditions,BCAAs may be the substrates that support energy, carbon, andnitrogen requirements in long-term starvation and regulate theexpression of codY (40) to control the peptidase system (27).
The concomitant depletion of arginine and lactose is inagreement with the results of previous studies done both understarvation conditions and with ripening cheese, in which thearginine concentration decreased (41, 49, 57). Arginine is usedfor growth requirements (31), the maintenance of pH ho-meostasis (8), and the maintenance of ATP. The transport ofglutamine is energy driven via phosphate, presumably throughthe use of ATP or other energy-rich phosphate intermediates(31). The consistent decrease of glutamine over time under allconditions (Fig. 3) indicates that alternate energy sources arebeing utilized to generate ATP, which is used in transport.
Methionine is produced during cheese ripening (32, 57) aswell as at the onset of starvation (Fig. 3). This amino acid isassociated with desirable sulfur notes in cheddar cheese and islinked to the production of volatile sulfur compounds (59). Itis not known why methionine increases during carbohydratestarvation, but it may be linked to nucleic acid metabolism viaS-D-ribosyl-L-homocysteine or S-adenosyl-L-methionine pro-duced by lactococci (2). Serine, the precursor to methionine, isalso released during the ripening of cheese (20, 32, 57), star-vation (19), and nonculturability (Fig. 3). These observationssuggest that mechanisms to degrade serine may not be activeduring starvation, as lactococci contain genes for the enzymesof serine catabolism. Hence, methionine and serine productionmay be the biomarker of starvation or nonculturability in lac-tococci.
The presence of viable cells for up to 3 years, as measured byspectrofluorometry, in combination with low expression of lyticand cell wall repair genes, denotes the maintenance of a cel-lular membrane that did not undergo lysis and aided the pres-
ervation of nucleic acids. This is contrary to the current dogmathat states that lactococci die, lyse, and lose viability due toharsh environments (19, 34, 52). The estimation of culturablecells relies on the ability of cells to replicate on solid media.The absence of any culturable counts simply indicates theinability of cells to replicate and not necessarily their death, asdemonstrated in this study in combination with transcriptionand translation events identified with gene expression analysis.
The strong correlations in ccpA induction and repression ofsome glycolytic genes, cell division and autolysis genes, and theinduction of amino acid metabolism, along with attainment ofthe NC state and the maintenance of membrane intactness andATP levels, suggest that the control of sugar metabolism maybe the key to attainment of the NC state in lactococci. Thecontrol may exist via mechanisms analogous to catabolite re-pression/activation mediated by CcpA or other sugar regula-tors or via mechanisms yet to be identified.
The mechanisms involved in recycling the intermediates be-tween sugar and amino acid metabolisms remain elusive.These cycles provide energy and oxidation/reduction potentialfor metabolism, yet it is unclear what advantage exportingamino acids to the medium that may be lost due to diffusionprovides for metabolism by other organisms in mixed cultures.These data provide a solid foundation to prove that noncul-turability exists in lactococci, but the specific details about theregulatory mechanisms between sugar and amino acid metab-olisms require further elucidation. As this occurred in all threestrains with different plasmid populations and, in one case, aplasmid-free strain (IL1403), it seems likely that the regulatoryelements required for nonculturability are encoded on thechromosome.
Conclusions. After carbohydrate depletion, all of the lacto-cocci became NC. Once the cells became NC, they remainedintact and lost the ability to use PTS sugar transport but re-tained the ability to transport protein substrates via ATP- andPMF-dependent mechanisms. This was coupled with a con-comitant repression of the genes associated with cellular cy-toskeleton, autolysis, or phage-induced lysis. The induction ofgenes associated with amino acid metabolism led to the pro-duction of serine and methionine and the depletion of glu-tamine, arginine, and leucine. The addition of BCAAs led tothe production of new metabolites not found during logarith-mic-phase growth. The induction of CcpA correlated with therepression of genes that contained a CRE site upstream ofgenes related to sugar metabolism, cell division, and cell lysis,and the induction of genes related to arginine catabolism.Taken together, these data prove that lactococci become NCby repressing the production of the cytoskeleton, repressingPTS transport systems, and inducing the metabolism of aminoacids that result in ATP and new metabolic products that maybe biomarkers of this cellular state.
ACKNOWLEDGMENT
Mention of companies and products does not constitute endorse-ment by Utah State University or the Utah Agricultural ExperimentalStation over similar products not mentioned.
REFERENCES
1. Blake, M. R., R. Koka, and B. C. Weimer. 1996. A semiautomated reflec-tance colorimetric method for the determination of lipase activity in milk. J.Dairy Sci. 79:1164–1171.
2510 GANESAN ET AL. APPL. ENVIRON. MICROBIOL.
on February 21, 2016 by guest
http://aem.asm
.org/D
ownloaded from

2. Bolotin, A., P. Wincker, S. Mauger, O. Jaillon, K. Malarme, J. Weissenbach,S. D. Ehrlich, and A. Sorokin. 2001. The complete genome sequence of thelactic acid bacterium Lactococcus lactis subsp. lactis IL1403. Genome Res.11:731–753.
3. Boyaval, P., E. Boyaval, and M. J. Desmazeud. 1985. Survival of Brevibacte-rium linens during nutrient starvation and intracellular changes. Arch. Mi-crobiol. 141:128–132.
4. Broadbent, J. R., M. Strickland, B. C. Weimer, M. E. Johnson, and J. L.Steele. 1998. Peptide accumulation and bitterness in cheddar cheese madeusing single-strain Lactococcus lactis starters with distinct proteinase speci-ficities. J. Dairy Sci. 81:327–337.
5. Buist, G., H. Karsens, A. Nauta, D. van Sinderen, G. Venema, and J. Kok.1997. Autolysis of Lactococcus lactis caused by induced overproduction of itsmajor autolysin, AcmA. Appl. Environ. Microbiol. 63:2722–2728.
6. Buist, G., G. Venema, and J. Kok. 1998. Autolysis of Lactococcus lactis isinfluenced by proteolysis. J. Bacteriol. 180:5947–5953.
7. Choi, S.-K., and M. H. Saier, Jr. 2005. Regulation of sigL expression by thecatabolite control protein CcpA involves a roadblock mechanism in Bacillussubtilis: potential connection between carbon and nitrogen metabolism. J.Bacteriol. 187:6856–6861.
8. Chou, L.-S. 2001. The arginine deiminase pathway in lactococci: physiolog-ical role and molecular characterization. Ph.D. dissertation. Utah State Uni-versity, Logan.
9. Chou, L.-S., B. C. Weimer, and R. Cutler. 2001. Relationship of arginine andlactose utilization by Lactococcus lactis ssp. lactis ML3. Int. Dairy J. 11:253–258.
10. Christensen, J. E., E. G. Dudley, J. A. Pederson, and J. L. Steele. 1999.Peptidases and amino acid catabolism in lactic acid bacteria. Antonie Leeu-wenhoek 76:217–246.
11. Christensen, J. E., M. E. Johnson, and J. L. Steele. 1995. Production ofcheddar using a Lactococcus lactis ssp. cremoris SK11 derivative with en-hanced aminopeptidase activity. Int. Dairy J. 5:367.
12. Crow, V. L., T. Coolbear, P. K. Gopal, F. G. Martley, L. L. McKay, and H.Riepe. 1995. The role of autolysis of lactic acid bacteria in the ripening ofcheese. Int. Dairy J. 5:855–875.
13. Crow, V. L., and T. D. Thomas. 1982. Arginine metabolism in lactic strep-tococci. J. Bacteriol. 150:1024–1032.
14. Cunin, R., N. Glansdorff, A. Pierard, and V. Stalon. 1986. Biosynthesis andmetabolism of arginine in bacteria. Microbiol. Rev. 50:314–352.
15. Dias, B., and B. Weimer. 1995. A semi-automated colorimetric method fordetermination of aminopeptidase activity in turbid solutions. J. Rapid Meth-ods Autom. Microb. 3:223–235.
16. Dubois, M., K. A. Gilles, J. K. Hamilton, P. A. Rebers, and F. Smith. 1956.Colorimetric method for determination of sugars and related substances.Anal. Chem. 28:350–356.
17. Even, S., N. D. Lindley, and M. D. Cocaign-Bousquet. 2001. Molecularphysiology of sugar catabolism in Lactococcus lactis IL1403. J. Bacteriol.183:3817–3824.
18. Foucaud, C., E. R. S. Kunji, A. Hagting, J. Richard, W. N. Konings, M.Desmazeaud, and B. Poolman. 1995. Specificity of peptide transport systemsin Lactococcus lactis: evidence for a third system which transports hydro-phobic di- and tripeptides. J. Bacteriol. 177:4652–4657.
19. Fox, P. F., J. Law, P. L. H. McSweeney, and J. Wallace. 1993. Biochemistryof cheese ripening, vol. 1. Chapman and Hall, London, United Kingdom.
20. Frau, M., J. Massanet, C. Rossello, S. Simal, and J. Canellas. 1997. Evolu-tion of free amino acid content during ripening of Mahon cheese. FoodChem. 60:651–657.
21. Ganesan, B., P. Dobrowolski, and B. C. Weimer. 2006. Identification of theleucine-to-2-methylbutyric acid catabolic pathway of Lactococcus lactis.Appl. Environ. Microbiol. 72:4264–4273.
22. Ganesan, B., K. Seefeldt, B. Dias, R. Koka, and B. C. Weimer. 2004. Mono-carboxylic acid production by lactococci and lactobacilli. Int. Dairy J. 14:237–246.
23. Ganesan, B., K. Seefeldt, and B. C. Weimer. 2004. Fatty acid productionfrom amino acids and �-keto acids by Brevibacterium linens BL2. Appl.Environ. Microbiol. 70:6385–6393.
24. Gao, S., D. H. Oh, J. R. Broadbent, M. E. Johnson, B. C. Weimer, and J. L.Steele. 1997. Aromatic amino acid catabolism by lactococci. Lait 77:371–381.
25. Gaudu, P., G. Lamberet, S. Poncet, and A. Gruss. 2003. CcpA regulation ofaerobic and respiration growth in Lactococcus lactis. Mol. Microbiol. 50:183–192.
26. Gottesman, S., and M. R. Maurizi. 1992. Regulation by proteolysis: energy-dependent proteases and their origin. Microbiol. Rev. 56:592–621.
27. Guedon, E., P. Serror, S. D. Ehrlich, P. Renault, and C. Delorme. 2001.Pleiotropic transcriptional repressor CodY senses the intracellular pool ofbranched-chain amino acids in Lactococcus lactis. Mol. Microbiol. 40:1227–1239.
28. Huard, C., G. Miranda, F. Wessner, A. Bolotin, J. Hansen, S. J. Foster, andM. P. Chapot-Chartier. 2003. Characterization of AcmB, an N-acetylglu-cosaminidase autolysin from Lactococcus lactis. Microbiology 149:695–705.
29. Kjelleberg, S., M. Hermansson, P. Marden, and G. W. Jones. 1987. The
transient phase between growth and non-growth of heterotrophic bacteria,with emphasis on the marine environment. Annu. Rev. Microbiol. 41:25–49.
30. Konings, W. N. 2002. The cell membrane and the struggle for life of lacticacid bacteria. Antonie Leeuwenhoek 82:3–27.
31. Konings, W. N., B. Poolman, and A. J. M. Driessen. 1989. Bioenergetics andsolute transport in lactococci. Crit. Rev. Microbiol. 16:419–476.
32. Kunji, E. R. S., G. Fang, C. M. Jeronimus-Stratingh, A. P. Bruins, B.Poolman, and W. N. Konings. 1998. Reconstruction of the proteolytic path-way for use of �-casein by Lactococcus lactis. Mol. Microbiol. 27:1107–1118.
33. Larsen, R., G. Buist, O. P. Kuipers, and J. Kok. 2004. ArgR and AhrC areboth required for regulation of arginine metabolism in Lactococcus lactis. J.Bacteriol. 186:1147–1157.
34. Law, B. A. 1984. Flavour development in cheeses, p. 187–208. In F. L. Daviesand B. A. Law (ed.), Advances in the microbiology and biochemistry ofcheese and fermented milk. Elsevier Applied Science Publishing, London,United Kingdom.
35. Makarova, K., A. Slesarev, Y. Wolf, A. Sorokin, B. Mirkin, E. Koonin, A. Pavlov,N. Pavlova, V. Karamychev, N. Polouchine, V. Shakhova, I. Grigoriev, Y. Lou, D.Rohksar, S. Lucas, K. Huang, D. M. Goodstein, T. Hawkins, V. Plengvidhya, D.Welker, J. Hughes, Y. Goh, A. Benson, K. Baldwin, J. H. Lee, I. Diaz-Muniz,B. Dosti, V. Smeianov, W. Wechter, R. Barabote, G. Lorca, E. Altermann, R.Barrangou, B. Ganesan, Y. Xie, H. Rawsthorne, D. Tamir, C. Parker, F. Breidt,J. Broadbent, R. Hutkins, D. O’Sullivan, J. Steele, G. Unlu, M. Saier, T.Klaenhammer, P. Richardson, S. Kozyavkin, B. C. Weimer, and D. Mills. 2006.Comparative genomics of the lactic acid bacteria. Proc. Natl. Acad. Sci. USA103:15611–15616.
36. Marugg, J. D., W. Meijer, R. van Kranenburg, P. Laverman, P. G.Bruinenberg, and W. M. de Vos. 1995. Medium-dependent regulation ofproteinase gene expression in Lactococcus lactis: control of transcriptioninitiation by specific dipeptides. J. Bacteriol. 177:2982–2989.
37. Monedero, V., S. Poncet, I. Mijakovic, S. Fieulaine, V. Dossonnet, I. Martin-Verstraete, S. Nessler, and J. Deutscher. 2001. Mutations lowering the phos-phatase activity of HPr kinase/phosphatase switch off carbon metabolism.EMBO J. 20:3928–3937.
38. Notredame, C., D. G. Higgins, and J. Heringa. 2000. T-Coffee: a novelmethod for fast and accurate multiple sequence alignment. J. Mol. Biol.302:205–217.
39. Oliver, J. D. 1993. Formation of viable but nonculturable cells. Plenum Press,New York, NY.
40. Petranovic, D., E. Guedon, B. Sperandio, C. Delorme, D. Ehrlich, and P.Renault. 2004. Intracellular effectors regulating the activity of the Lactococ-cus lactis CodY pleiotropic transcription regulator. Mol. Microbiol. 53:613–621.
41. Puchades, R., L. Lemieux, and R. E. Simard. 1989. Evolution of free aminoacids during the ripening of cheddar cheese containing added lactobacillistrains. J. Food Sci. 54:885–888.
42. Rallu, F., A. Gruss, and E. Maguin. 1996. Lactococcus lactis and stress.Antonie Leeuwenhoek 70:243–251.
43. Rezaıki, L., B. Cesselin, Y. Yamamoto, K. Vido, E. van West, P. Gaudu, andA. Gruss. 2004. Respiration metabolism reduces oxidative and acid stress toimprove long-term survival of Lactococcus lactis. Mol. Microbiol. 53:1331–1342.
44. Sanders, W. J., G. Venema, and J. Kok. 1999. Environmental stress re-sponses in Lactococcis lactis. FEMS Microbiol. Rev. 23:483–501.
45. Santana, M., M. S. Ionescu, A. Vertes, R. Longin, F. Kunst, A. Danchin, andP. Glaser. 1994. Bacillus subtilis F0F1 ATPase: DNA sequence of the atpoperon and characterization of atp mutants. J. Bacteriol. 176:6802–6811.
46. Seo, J., and B. Shneiderman. 2002. Interactively exploring hierarchical clus-tering results. IEEE Comput. 35:80–86.
47. Steen, A., E. Palumbo, M. Deghorain, P. S. Cocconcelli, J. Delcour, O. P.Kuipers, J. Kok, G. Buist, and P. Hols. 2005. Autolysis of Lactococcus lactisis increased upon D-alanine depletion of peptidoglycan and lipoteichoicacids. J. Bacteriol. 187:114–124.
48. Stuart, M. R., L. S. Chou, and B. C. Weimer. 1999. Influence of carbohydratestarvation and arginine on culturability and amino acid utilization of Lacto-coccus lactis subsp. lactis. Appl. Environ. Microbiol. 65:665–673.
49. Thomas, T. D., and R. D. Batt. 1969. Degradation of cell constituents bystarved Streptococcus lactis in relation to survival. J. Gen. Microbiol. 58:347–362.
50. Thomas, T. D., and R. D. Batt. 1968. Survival of Streptococcus lactis instarvation conditions. J. Gen. Microbiol. 50:367–382.
51. Thomas, T. D., and R. D. Batt. 1969. Synthesis of protein and ribonucleicacid by starved Streptococcus lactis in relation to survival. J. Gen. Microbiol.58:363–369.
52. Thomas, T. D., P. Lyttleton, K. L. Williamson, and R. D. Batt. 1969. Changesin permeability and ultra-structure of starved Streptococcus lactis in relationto survival. J. Gen. Microbiol. 58:381–390.
53. Thompson, J. 1987. Regulation of sugar transport and metabolism in lacticacid bacteria. FEMS Microbiol. Rev. 46:221–231.
54. Thompson, J., and T. D. Thomas. 1977. Phosphoenolpyruvate and 2-phos-phoglycerate: endogenous energy sources for sugar accumulation by starvedcells of Streptococcus lactis. J. Bacteriol. 130:583–595.
VOL. 73, 2007 LACTOCOCCI AND CARBOHYDRATE STARVATION 2511
on February 21, 2016 by guest
http://aem.asm
.org/D
ownloaded from
55. Ummadi, M., and B. C. Weimer. 2002. Use of capillary electrophoresis andlaser-induced fluorescence for attomole detection of amino acids. J. Chro-matogr. A 964:243–253.
56. Venter, J. C., K. Remington, J. F. Heidelberg, A. L. Halpern, D. Rusch, J. A.Eisen, D. Wu, I. Paulsen, K. E. Nelson, W. Nelson, D. E. Fouts, S. Levy, A. H.Knap, M. W. Lomas, K. Nealson, O. White, J. Peterson, J. Hoffman, R.Parsons, H. Baden-Tillson, C. Pfannkoch, Y. H. Rogers, and H. O. Smith.2004. Environmental genome shotgun sequencing of the Sargasso Sea. Sci-ence 304:66–74.
57. Wallace, J. M., and P. F. Fox. 1997. Effect of adding free amino acids tocheddar cheese curd on proteolysis, flavour and texture development. Int.Dairy J. 7:157–167.
58. Watson, S. P., M. O. Clements, and S. J. Foster. 1998. Characterization ofthe starvation-survival response of Staphylococcus aureus. J. Bacteriol. 180:1750–1758.
59. Weimer, B., K. Seefeldt, and B. Dias. 1999. Sulfur metabolism in bacteriaassociated with cheese. Antonie Leeuwenhoek 76:247–261.
60. Xie, Y. 2003. Determining the influence of extracellular proteinase fromBrevibacterium linens on the metabolism of Lactococcus lactis subsp. lactisusing functional genomics. Ph.D. dissertation. Utah State University,Logan.
61. Xie, Y., L.-S. Chou, A. Cutler, and B. Weimer. 2004. DNA macroarrayprofiling of Lactococcus lactis subsp. lactis IL1403 gene expression duringenvironmental stresses. Appl. Environ. Microbiol. 70:6738–6747.
2512 GANESAN ET AL. APPL. ENVIRON. MICROBIOL.
on February 21, 2016 by guest
http://aem.asm
.org/D
ownloaded from