Caractérisation de la variabilité intra-spécifique et cellulaire ...
183
HAL Id: tel-03485734 https://tel.archives-ouvertes.fr/tel-03485734 Submitted on 17 Dec 2021 HAL is a multi-disciplinary open access archive for the deposit and dissemination of sci- entific research documents, whether they are pub- lished or not. The documents may come from teaching and research institutions in France or abroad, or from public or private research centers. L’archive ouverte pluridisciplinaire HAL, est destinée au dépôt et à la diffusion de documents scientifiques de niveau recherche, publiés ou non, émanant des établissements d’enseignement et de recherche français ou étrangers, des laboratoires publics ou privés. Caractérisation de la variabilité intra-spécifique et cellulaire de Listeria monocytogenes à des températures basses Lena Fritsch To cite this version: Lena Fritsch. Caractérisation de la variabilité intra-spécifique et cellulaire de Listeria monocytogenes à des températures basses. Médecine humaine et pathologie. Université Paris-Est, 2019. Français. NNT : 2019PESC0055. tel-03485734
-
Upload
khangminh22 -
Category
Documents
-
view
4 -
download
0
Transcript of Caractérisation de la variabilité intra-spécifique et cellulaire ...

HAL Id: tel-03485734https://tel.archives-ouvertes.fr/tel-03485734
Submitted on 17 Dec 2021
HAL is a multi-disciplinary open accessarchive for the deposit and dissemination of sci-entific research documents, whether they are pub-lished or not. The documents may come fromteaching and research institutions in France orabroad, or from public or private research centers.
L’archive ouverte pluridisciplinaire HAL, estdestinée au dépôt et à la diffusion de documentsscientifiques de niveau recherche, publiés ou non,émanant des établissements d’enseignement et derecherche français ou étrangers, des laboratoirespublics ou privés.
Caractérisation de la variabilité intra-spécifique etcellulaire de Listeria monocytogenes à des températures
bassesLena Fritsch
To cite this version:Lena Fritsch. Caractérisation de la variabilité intra-spécifique et cellulaire de Listeria monocytogenesà des températures basses. Médecine humaine et pathologie. Université Paris-Est, 2019. Français.�NNT : 2019PESC0055�. �tel-03485734�

THESE DE DOCTORAT
de l’Université Paris-Est
Spécialité : Microbiologie
École doctorale n°581 Agriculture, alimentation, biologie, environnement et santé (ABIES)
par
Lena FRITSCH
Characterization of the intra-specific and cellular variability
of Listeria monocytogenes at low temperatures
Directeur de thèse : Jean-Christophe AUGUSTIN
Co-encadrement de la thèse : Laurent GUILLIER
Thèse présentée et soutenue à Maisons-Alfort, le 18.12.2019:
Composition du jury :
Mme. Annemarie PIELAAT, Responsable de recherche, Unilever, Pays-Bas Rapporteur
M. Louis COROLLER, Professeur, Université de Brest, France Rapporteur
M. Romain BRIANDET, Directeur de recherches, INRA, Jouy-en-Josas, France Examinateur
M. Taurai TASARA, Responsable de recherche, Université Zurich, Suisse Examinateur
M. Jean-Christophe AUGUSTIN, Professeur, Ecole Nationale Vétérinaire d’Alfort, France Directeur de thèse
M. Laurent GUILLIER, Chargé de projets scientifiques, ANSES, Maisons Alfort, France Encadrement de thèse
Unité Salmonella et Listeria, LSAL, Maisons Alfort 14 Rue Pierre et Marie Curie 94701 Maisons Alfort

Summary
During the last years, the cases of the foodborne disease listeriosis are steadily increasing in Europe. Listeriosis is mainly caused by the ingestion of food contaminated with the bacterium Listeria monocytogenes. Especially, ready-to-eat food products represent an increased risk to consumers and have been often causally linked to foodborne outbreaks of listeriosis. Since low temperatures have the potential to inhibit the bacterial pathogens’ growth, the cold chain is of high importance to ensure the safety of the products. Contrary to other pathogens, L. monocytogenes is hard to control by the cold chain because of its ability to grow at low temperatures even around freezing point. Quantitative microbial risk assessment (QMRA) models are used to better understand the risk for human health and therefore helps to find appropriate interventions for public health benefit. Improving risk assessment for L. monocytogenes implies a better understanding of the pathogen behavior near growth limits and description of the effect of the environment on lag time (i.e. delay in growth when bacteria adapt to new environments) and growth probability. Moreover, the characterization of L. monocytogenes subtypes’ phenotypic variability during cold exposure also helps to improve the precision of the predictions. Recent developments in whole genome sequencing (WGS) opened new opportunities for explaining the intraspecific variability of phenotypes. Successful association between WGS-data and specific phenotypes potentially contribute to better predicting microbial behaviors through the discovery of genomic markers. The successful application of combined bioinformatics approaches associating WGS-genotypes and specific phenotypes is a major step in the refinement of QMRA models. In this perspective, the first aim of this thesis was the exploration and application of different tools to conduct Genome Wide Association Studies (GWAS). Three different approaches, covering the pan-genome as also a phylogenomic-based method, were applied to a set of 51 L. monocytogenes strains to gain insights on the genomic features explaining their ability to grow at low temperatures (2 °C). Several genomic features (i.e. genes and SNPs), as well as specific phylogenetic sublineages, were identified as associated with L. monocytogenes' growth at low temperature. These biomarkers can be used in future QMRA studies to perform risk assessments targeted to the L. monocytogenes subpopulations that pose the greatest risk linked to their higher ability to survive and/or grow in the food chain. Therefore, the 2nd study of this thesis focused on the refinements of a QMRA model for listeriosis from the consumption of cold-smoked salmon chain in France considering pheno-genotype associations (e.g. growth ability at low temperature and virulence). Even if QRMA model refinement is still using some strong hypotheses (i.e. Clonal Complex association with virulence), this work highlighted the potential impact of implementing genomic data in QMRA. Large genomic data sets are necessary to obtain robust genetic markers to use in QRMA. Genomic DNA extraction and sequencing are already fully-automated with high throughput. However, when performing pheno-genotype associations studies, experiments for phenotyping are often time-consuming and labor-intensive with a low degree of automation. Therefore, the aim of the third study of this thesis was to develop an automated microscopy method to determine the single-cell growth probability and lag time in cold conditions. Agar-based medium covering slides were inoculated with L. monocytogenes cells and were observed over time by phase-contrast microscopy. Image recordings of the single-cells and micro-colonies were analyzed with an automatic image analysis procedure. This method was successfully used to generate single-cell lag time distributions and to estimate growth probability of the selected L. monocytogenes strains. This method provides a rapid and convenient strategy for the study of single cell behavior determination that would require months with indirect methods. The characterization and the implementation of these variables into predictive models and thus exposure assessments have the potential to increase their certainty.
Résumé
Depuis plusieurs années, les cas de listériose d'origine alimentaire augmentent régulièrement en Europe. Les produits alimentaires prêts-à-consommer sont généralement incriminés car potentiellement contaminés par Listeria monocytogenes (Lm) et consommés sans cuisson préalable, d’où un risque accru pour les consommateurs. Les basses températures permettent de freiner la croissance de la majorité des bactéries pathogènes, et la maitrise de la chaîne du froid est donc très importante. Cependant, Lm est capable de croitre à basse température ce qui rend la maitrise du danger plus difficile. Les modèles d'appréciation quantitative des risques microbiens (AQRM) aident à caractériser le risque et à définir les mesures de lutte pour préserver la santé publique. Avoir une meilleure compréhension du comportement de Lm proche de sa limite de croissance permettrait d’améliorer ces modèles. La validité d'un modèle pour prédire les conditions qui mènent à des niveaux critiques dans les aliments dépend fortement de sa capacité à décrire l'effet de l'environnement sur la latence et la probabilité de croissance. La caractérisation de la variabilité phénotypique lors de l'exposition au froid permet également d'améliorer la précision des résultats prédits. Les développements récents dans le séquençage du génome entier (WGS) ont ouvert de nouvelles opportunités pour expliquer la variabilité intraspécifique des phénotypes. Les données du WGS associées à des phénotypes spécifiques peuvent permettre de mieux prédire les comportements microbiens grâce à la découverte de marqueurs génomiques. L'application d'approches bioinformatiques combinées associant des génotypes WGS et des phénotypes spécifiques est une étape majeure dans le perfectionnement des modèles d'AQRM. Dans cette perspective, le premier objectif de cette thèse était l'exploration et l'application de différents outils pour mener des études d'association à l'échelle du génome (GWAS). Trois approches différentes couvrant le pan-génome ainsi qu'une méthode basée sur la phylogénomique ont été appliquées à un ensemble de 51 souches de Lm pour identifier les caractéristiques génomiques expliquant leur capacité de croissance à basse température (2 °C). Plusieurs caractéristiques génomiques (gènes et SNP), ainsi que des sous-lignées phylogénétiques spécifiques ont été identifiées comme étant associées à la croissance de Lm à basse température. Ces biomarqueurs pourront être utilisés dans des AQRM pour évaluer les risques liés aux sous-populations de Lm qui posent le plus grand risque dû à leur forte capacité à survivre et/ou à croître dans les aliments. Les résultats de la deuxième étude de cette thèse indiquent que la mise en œuvre des données de sous-typage WGS dans un modèle d'AQRM améliore l'estimation de la probabilité de listériose. Même si l'amélioration du modèle d’AQRM repose encore sur des hypothèses fortes (association du complexe clonal avec la virulence), ces travaux ont mis en évidence l'impact potentiel de la mise en œuvre des données génomiques dans l'AQRM. De grandes quantités de données génomiques sont nécessaires pour obtenir des marqueurs génétiques robustes. L'extraction et le séquençage de l'ADN génomique sont déjà entièrement automatisés et à haut débit. Toutefois ces souches doivent être caractérisées phénotypiquement, mais ces expériences sont couteuses en temps car faiblement automatisées. Par conséquent, la troisième étude de ce projet de thèse avait pour but de mettre au point une méthode de microscopie automatisée pour déterminer la probabilité de croissance et le temps de latence cellulaires. Des lames de milieu à base de gélose ont été inoculées avec des cellules de Lm et observées au fil du temps par microscopie à contraste de phase. Les enregistrements d'images de cellules individuelles et de micro-colonies ont été analysés à l'aide d'une procédure automatique d'analyse d'images. Cette méthode a été utilisée avec succès pour générer des distributions de temps de latence et les probabilités de croissance unicellulaires de quatre souches de Lm. Cette méthode permet d’obtenir rapidement et facilement des données de comportement cellulaires dont l’acquisition prendraient des mois avec des méthodes indirectes. La caractérisation de la probabilité de croissance d'une seule cellule et du temps de latence dans les modèles prévisionnels et donc lors d’évaluations de l'exposition augmente leur certitude.

Acknowlegement
First, I want to thank the French National Research Agency for funding the project OptiCold (ANR-15-CE21-0011) and my PhD. Further, I want to thank ANSES for giving me the opportunity to perform my thesis in the food safety laboratory.
A special and huge thank goes to my supervisors Jean-Christophe Augustin and Laurent Guillier. They accompanied me through to the thesis with their patience, continuous support, immense knowledge and passion. I learned incredibly much from them and I feel so thankful for the possibility to work close to such great scientists as they are.
Besides my supervisors, I would like to thank my thesis committee for their insightful comments, fruitful advices, encouragement and the time they took to revise my work: Hélène Bergis, Hélène Bierne, Florence Dubois-Brissonnet, Alexandre Leclercq and Mariem Ellouze.
For sure, a huge thank goes to all my colleagues especially to the members of SeL and GAMeR. I am thankful for all the advices, help and the time we spent together. Especially, I enjoyed the stimulating discussions that opened me to different perspectives and enhanced my knowledge in different areas.
During my PhD, I had the pleasure to supervise Abirami Baleswaran through to her Master internship. She has done a great job and helped me a lot to finish the experiments in the lab. Thank you very much.
I will address also my sincere thanks to Sabine Delannoy for her generous aid in reviewing my draft version.
Besides colleagues of my team, I want to thank SJA and Sabine Herbin. They have always been there for me, pushed me when necessary and lifted my mood with a “carambar joke”. Merci!
Hélène Bergis and Véronique Noel, without them would have been completely lost and I cannot even thank enough for the support, cheering up, advices, open ears, help and and and. I will really miss coming around in their office.
Besides these two young girls, also Federica Palma was such an important person for me, at and besides work. She joined our office last year and it took just a short time to recognize that we were quite similar characters: always a smile on the lips, positive, a little bit freaky, how to say the Mediterranean type ;) Thank you from the bottom of my heart for lightening up every single day by being simply you. And, I cannot thank you enough for the great help at work, especially in the last PhD months. Grazie mille!!! Without my former super supervisors Véronique Zuliani and Mariem Ellouze, that became friends to me, my entire journey would not have been possible. They formed me, opened my horizons, impressed me and made me willing to grow. Thank you for accompanying me during that journey with all your advices and friendship!
Shirin Sygor und Sarah Zitzer gilt auch mein Dank, die mich nun schon einige Jahre begleiten und ohne deren Hilfe ich wohl nicht durchs Studium gekommen wäre ;). Danke, Ihr Master of Disaster
Alina Glitsch, danke für deine Unterstützung, Freundschaft und natürlich für unsere Ausflüge im «Herzen von Europa».
Vielen Dank an meine Sandkastenfreundin Hanna Lüdde, die mich trotz der Entfernung jeden Tag auf meiner Reise begleitet hat, mit mir virtuell den ein oder anderen Abend verbracht hat und auf die ich mich seit 28 Jahren jeden Tag verlassen kann.
Papa, Mama und Julia, vielen Dank für alles. Euch gilt der gröβte Dank! Danke für all die Möglichkeiten, die Unterstützung und all das was Ihr mir mit auf den Weg gegeben habt.
Diese Doktorarbeit möchte ich meiner Oma Elsbeth widmen.
I would like to dedicate this thesis to my grandma Elsbeth.

Table of contents
List of abbreviations ................................................................................................................... I
List of figures ........................................................................................................................... III
List of tables ............................................................................................................................ V
Introduction ............................................................................................................................. VI
Theoretical background ............................................................................................................ 1
1 Listeria monocytogenes .............................................................................................. 1
1.1 Overview.............................................................................................................. 1
1.2 Genomics of Listeria monocytogenes .................................................................. 2
1.3 Monitoring of Listeria monocytogenes in the European Union.............................. 7
1.4 Food sources and outbreaks................................................................................ 8
1.5 Surveillance ......................................................................................................... 9
1.5 Regulations .........................................................................................................11
2 Cold adaptation ..........................................................................................................12
2.1 Importance of cold growth/adaptation .................................................................12
2.2 Mechanisms .......................................................................................................13
2.3 Cold growth and virulence ..................................................................................19
3 Association studies in the genomic era ......................................................................22
3.1 Whole Genome Sequencing ...............................................................................22
3.2 Genomic events driving phenotypic diversity ......................................................24
3.3 Genome Wide Association Studies .....................................................................27
4 Quantitative microbial risk assessment ......................................................................31
4.1 Hazard identification ...............................................................................................32
4.2 Exposure assessment .............................................................................................32
4.3 Hazard characterization ..........................................................................................40
4.4 Risk characterization...............................................................................................41
Objectives ............................................................................................................................... 42
Chapter 1 ................................................................................................................................ 45
Insights from genome-wide approaches to identify variants associated to phenotypes at pan-
genome scale: Application to Listeria monocytogenes’ ability to grow in cold conditions ..45
Résumé ............................................................................................................................46

Abstract ............................................................................................................................48
1 Introduction ................................................................................................................50
1.1 French introduction .............................................................................................50
1.2 English introduction ............................................................................................53
2 Materials and methods ...............................................................................................56
2.1 Strains ................................................................................................................56
2.2 Whole genome sequencing ................................................................................56
2.3 Phenotyping in cold conditions ............................................................................56
2.4 Genomic approaches ..........................................................................................57
3 Results and discussion ..............................................................................................60
3.1 GWAS methods to explore the genetic basis of growth capacity at 2 °C .............60
3.2 Analysis of the growth ability at 2 °C through a Bayesian inference method .......67
4 Conclusion .................................................................................................................70
Acknowledgements ..........................................................................................................70
Chapter 2 ................................................................................................................................ 71
Next generation quantitative microbiological risk assessment: Refinement of the cold
smoked salmon-related listeriosis risk model by integrating genomic data .......................71
Résumé ............................................................................................................................72
Abstract ............................................................................................................................73
1 Introduction ................................................................................................................74
1.1 French introduction .............................................................................................74
1.2 English introduction ............................................................................................77
2 Material and methods ................................................................................................79
2.2 Genomic differentiation of L. monocytogenes for hazard identification ................82
2.3 Virulence properties of L. monocytogenes genotypes subtypes ..........................82
2.4 Phenotypic (growth) characteristics of L. monocytogenes subgroups .................83
2.5 Prevalence of L. monocytogenes genotypes in cold-smoked salmon ..................84
2.6 Model parameters and simulation .......................................................................84
3 Results and discussion ..............................................................................................86
3.1 Distributions of phenotypic and virulence properties among L. monocytogenes
subtypes .......................................................................................................................86

3.2 Exposure and risk estimates according to the L. monocytogenes subtypes ........89
Acknowledgement ............................................................................................................92
Chapter 3 ................................................................................................................................ 93
A novel microscopy method for determining individual lag times and growth probability of
individual bacterial cells ....................................................................................................93
Résumé ............................................................................................................................94
Abstract ............................................................................................................................95
1. Introduction ............................................................................................................96
1.1 French introduction .............................................................................................96
1.2 English introduction ............................................................................................99
2 Material and methods .............................................................................................. 102
2.1 Strains .............................................................................................................. 102
2.2 Preparation of inocula ....................................................................................... 102
2.3 Preparation and storage of the microscope slides ............................................. 102
2.4 Microscopic observation of cells ....................................................................... 103
2.5 Image analysis procedure ................................................................................. 103
2.6 Growth curve at population level ....................................................................... 106
2.7 Determination of growth probability ................................................................... 106
2.8 Individual lag time determination ....................................................................... 106
3 Results .................................................................................................................... 108
3.1 Growth rates ..................................................................................................... 108
3.2 Determination of cell numbers in the captured images ...................................... 108
3.3 Growth probability ............................................................................................. 111
3.4 Individual lag times of single-cells ..................................................................... 113
4 Discussion ............................................................................................................... 115
5 Conclusion ............................................................................................................... 117
Acknowledgement .......................................................................................................... 117
General discussion ............................................................................................................... 118
Conclusion and future perspectives ...................................................................................... 130
1 Conclusion ............................................................................................................... 130
2 Perspectives ............................................................................................................ 131

Valorization ........................................................................................................................... 132
References ........................................................................................................................... 135
Supplementary material ........................................................................................................ 159

List of abbreviations
I
List of abbreviations
ABC ATP-Binding Cassette
aw Water activity
BC Benzalkonium Chloride
BetL Betaine porter I
BHI Brain Heart Infusion Broth
bp base pair
CC Clonal Complex
CDS Coding DNA Sequences
CFU Colony Forming Unit
cgMLST Core Genome Multi Locus Sequence Typing
Csp cold shock protein
CSS Cold-Smoked Salmon
DNA Deoxyribonucleic acid
dsRNA Double Stranded Ribonucleic Acid
ECDC European Centre for Disease Prevention and Control
EFSA European Food Safety Authority
EPIS-FWD
Epidemic Intelligence Information System for Food- and Waterborne diseases
EU European union
EWRS Early Warning and Response System
FAO Food and Agriculture Organization
FBO Food Business Operator
GbuABC Betaine porter II
GTR General Time-Reversible
GWAS Genome Wide Association Studies
ILSI Life Science Institute
InDels Insertions or Deletions
LD Linkage Disequilibrium
LD50 Median Lethal Doses
LLO Cytolysin Listeriolysin
LMM Linear Mixed Model
LOC Lab-On-a-Chip
Mbp Mega base pairs
MGE Mobile Genetic Elements

List of abbreviations
II
ML Maximum Likelihood
MLST Multi Locus Sequence Typing
MPD maximum population density
MPN Most Probable Number
MVLST Multi Virulence Locus Sequence Typing
NCBI National Center for Biotechnology Information
OppA Oligopeptide binding protein
PFGE Pulsed-Field Gel Electrophoresis
PMSC Premature Stop Codon
QAC Quaternary Ammonium Compound
QMRA Quantitative Microbial Risk Assessment
qPCR Quantitative Polymerase Chain Reaction
RASFF Rapid Alert System for Food and Feed
rMLST Ribosomial Multi Locus Sequence Typing
RNA Ribonucleic Acid
RNAP RNA polymerase
RTE Ready-To-Eat
SNP Single Nucleotide Polymorphism
ST Sequence Type
Tmin Minimal Growth Temperature
TSA Tryptone Soya Agar
TSB-YE Tryptone Soya Broth with Yeast Extract
wgMLST Whole Genome Multi Locus Sequence Typing
WGS Whole Genome Sequencing
WHO World Health Organization
µmax Maximal Growth Rate

List of figures
III
List of figures
Figure 1 : Schema of typing methods with different discriminatory power. ............................. 4
Figure 2 : L. monocytogenes lineages and clonal complexes ................................................ 5
Figure 3 : The European Union summary report on trends and sources of zoonoses, zoonotic
agents and food‐borne outbreaks in 2017 ............................................................................. 7
Figure 4 : Trend in reported confirmed human cases of listeriosis in the EU/EEA .................. 8
Figure 5 : Flow diagram for communication following of a cross-border outbreak in EU .......10
Figure 6 : Schematic outline of the cold stress adaptation process in L. monocytogenes .....14
Figure 7 : Role of the Csp proteins in adaptation to low temperature. ...................................15
Figure 8 : The risk analysis process and the positioning of QMRA modelling process ..........31
Figure 9 : Factors and parameters that should be considered in QMRA. ..............................33
Figure 10 : Prediction of Salmonella enterica ser. Typhimurium ...........................................36
Figure 11 : Growth simulation of stressed L. monocytogenes cells in cold-smoked salmon. .37
Figure 12 : The comfort zone. ...............................................................................................37
Figure 13 : Comparison of the stochastic growth of two microbial populations......................39
Figure 14 : Overview of QMRA and the different objectives and chapters of the thesis. .......43
Figure 15 : Phylogenetic tree of 51 L. monocytogenes isolates. ...........................................61
Figure 16 : Manhattan plot of core genome SNPs. ...............................................................62
Figure 17 : Evolution of a discrete phenotype distribution. ....................................................68
Figure 18 : Evolution of a discrete phenotype distribution of inlA gene. ................................69
Figure 19 : Model for assessing exposure of L. monocytogenes by consumption of cold-
smoked salmon ....................................................................................................................81
Figure 20 : Dendrogram based on log10 r-values of 26 different L. monocytogenes strains .86
Figure 21 : Dendrogram created by clinical frequencies. ......................................................87
Figure 22 : Dendrogram based on 166 different strains with corresponding Tmin values .....88
Figure 23 : Schema of a prepared slide with agar layer and coverslip. ............................... 103
Figure 24 : Different process steps of image analysis. ........................................................ 105
Figure 25 : Schema of the principle to determine single-cell lag time. ................................. 107
Figure 26 : Images obtained with phase-contrast microscope. ........................................... 109
Figure 27 : Relationship between the number of cells per colony and the number of pixels for
strain O228.. ....................................................................................................................... 110
Figure 28 : Cell growth probability at 4 °C of the four L. monocytogenes strains tested
according to the different repetitions. .................................................................................. 111
Figure 29 : Uncertainty distribution of individual probability of the four strains of
L. monocytogenes at 4°C. ................................................................................................. 112

List of figures
IV
Figure 30 : Median of the individual cell lag times of the four strains tested according to the
different repetitions of the experiment. ................................................................................ 113
Figure 31 : A) Random individual lag times drawn from fitted lognormal distributions for the
four strains. B) Pairwise comparisons of deciles. ................................................................ 114
Figure 32 : Schema to reduce variants in associations’ studies. ......................................... 123

List of tables
V
List of tables
Table 1 : Species of the Listeria genus. ................................................................................. 1
Table 2 : Summary of L. monocytogenes lineages adapted from (Orsi et al., 2011). ............. 3
Table 3 : MLST schema for L. monocytogenes...................................................................... 6
Table 4 : Summary of the first Genome Wide Association Studies adapted from (Chen and
Shapiro, 2015) ......................................................................................................................28
Table 5 : Bioinformatics tools for GWAS. ..............................................................................30
Table 6 : Methods to monitor the evolution of bacterial density. ............................................35
Table 7 : Extract of SNPs with strong evidences (p-value<0.01) for genome-wide association
to the tested phenotypic trait.................................................................................................63
Table 8 : Distributions of parameters used to simulate the growth of L. monocytogenes in cold-
smoked salmon and to estimate the corresponding listeriosis risk. .......................................85
Table 9 : Relative frequencies of the subgroups of virulence and growth ability at low
temperature observed in L. monocytogenes strains present in cold-smoked salmon. ...........89
Table 10 : Predicted cases of listeriosis of the appropriate virulence and Tmin groups. ..........90
Table 11 : Metadata of L. monocytogenes stains ................................................................ 102
Table 12 : Population growth parameters of the four tested strains with their 95th confidence
interval [0.025 0.0975]. ....................................................................................................... 108

Introduction
VI
Introduction
The role of the cold chain in the food sector is essential for mitigating the risk of
bacterial pathogens’ growth, which can reach such a level in specific food matrices to
cause human illnesses, threatening the public health safety. Among these bacterial
pathogens, those able to grow at cold temperatures are of greater concern due to the
difficulties of hampering their development through the cold chain (Wei et al., 2019).
Especially, Listeria monocytogenes (L. monocytogenes) is a challenging pathogen due
to its low minimal growth temperature allowing its growth at cold temperatures (Coroller
et al., 2012). L. monocytogenes is a ubiquitous foodborne pathogen causative of a
severe human disease called listeriosis. In the last decade, this pathogen has been
used as a model in a large number of studies aiming to address the impact of strain
diversity (Aryani et al., 2015) and the role of L. monocytogenes population
heterogeneity in adaptive stress response and survival capacity (Abee et al., 2016).
Several studies focusing on predictive microbiology have shown that lag time and the
probability of growth of L. monocytogenes are much more uncertain and difficult to
predict compared to the growth rate (Aguirre and Koutsoumanis, 2016; Augustin and
Czarnecka-Kwasiborski, 2012). However, the validity of a mathematical model in
predicting the conditions that lead to critical levels in foods highly depends on its ability
to describe the effect of the environmental conditions on lag time and the growth
probability. This implies that a better understanding of the pathogen’s behavior near
growth limits is of great importance for the effective application of microbial predictive
models in food safety risk assessment.
Distribution of individual cell lag phases and growth probabilities are generally obtained
in laboratory culture media. The classical method for individual cell lag times
acquisition is based on turbidity measurement on microplate wells inoculated with
approximately one bacterial cell per well (Guillier and Augustin, 2006). The growth
probability can be determined either by visually monitoring 96-microwell plates and
deduced from concentrations estimated with the most probable number (MPN)
calculation (Augustin and Czarnecka-Kwasiborski, 2012) or by comparing the ratio of
colony forming units (CFU) formed on agar plates incubated in the studied conditions
to CFU obtained in the optimal conditions (Aguirre and Koutsoumanis, 2016). Yet,
these methods are labor-intensive and would benefit from higher throughput
approaches.

Introduction
VII
Besides the classical molecular methods to obtain microbial data for predictive models,
nowadays the progress in whole genome sequencing (WGS) opens new possibilities
to characterize intra-species variability of L. monocytogenes strains. High-throughput
WGS data allow the applications of advanced statistical approaches through Genome
Wide Association Studies (GWAS) aiming at investigating differences in the genomic
elements linked to a specific phenotype (Chen and Shapiro, 2015). These elements
constitute important biomarkers that could be used to describe the behavior of
L. monocytogenes subpopulations improving the performance of Quantitative
Microbial Risk Assessment (QMRA) (Franz et al., 2016).

Theoretical background
1
Theoretical background
1 Listeria monocytogenes
1.1 Overview
Listeria monocytogenes (Phylum: Firmicutes, Class: Bacilli, Order: Bacilliales, Family:
Listeriaceae) is a Gram-positive, rod-shaped, non-spore forming, facultative anaerobic
bacterium with a size of 2 µm x 0.5 µm (ANSES, 2011; Carpentier and Cerf, 2011). It
is part of the Listeria genus, which is currently subdivided into 18 species (Table 1).
Table 1 : Species of the Listeria genus.
Species Publication
L. monocytogenes (Pirie, 1940)
L. welshimeri (Rocourt and Grimont, 1983)
L. seeligeri
L. ivanovii (Seelinger et al., 1984)
L. innocua (Seelinger et al., 1984)
L. marthii (Graves et al., 2010)
L. grayi (Larsen and Seeliger, 1966)
L. rocourtiae (Leclercq et al., 2010)
L. fleischmannii (Bertsch et al., 2013)
L. weihenstephanensis (Halter et al., 2013)
L. floridensis
(den Bakker et al., 2014)
L. aquatica
L. cornellensis
L. riparia
L. grandensis
L. booriae (Weller et al., 2015)
L. newyorkensis
L. costaricensis (Núñez-Montero et al., 2018)
So far, only two species are considered as foodborne pathogens: L. monocytogenes
and L. ivanovii (Núñez-Montero et al., 2018; Orsi and Wiedmann, 2016). L. ivanovii
mainly affects animals and only a few numbers of cases have been linked to human
diseases (Cummins et al., 1994; Guillet et al., 2010; Snapir et al., 2006). In contrast,
L. monocytogenes largely affects both animals and humans. L. monocytogenes,
formerly called Bacterium monocytogenes, was first isolated in 1924 and described in
1926. It was isolated from the livers of laboratory rabbits with bacterial sepsis in

Theoretical background
2
Cambridge (Murray et al., 1926). The disease caused by L. monocytogenes is called
listeriosis. It is a zoonosis, which can result in bacteremia, meningitis, septicemia,
miscarriage, and stillbirths. It is particularly dangerous for susceptible persons
including pregnant women, foetuses, elderly and immunosuppressed individuals
(Charlier et al., 2017; Donnelly, 2001; Sheehan et al., 1994). Due to its capacity to
survive in various environments and grow under a wide range of temperatures (-2 –
45C), pH (4.0 - 9.6) and aw (0.92- /), L. monocytogenes can be found in several
ecological niches (e.g. soils, water, and food processing plants) (ANSES, 2011). Of
particular concern is the ability of L. monocytogenes to survive in the harsh conditions
encountered in food processing plants since it increases the risk of spreading along
the food chain. The contamination of the natural environment results mainly from the
release of the bacteria via excreta of animals, whether healthy or sick carriers (ANSES,
2011).
1.2 Genomics of Listeria monocytogenes
The complete genome of the L. monocytogenes reference strain EGDe has been firstly
published in 2001 by Glaser et al. (Glaser et al., 2001). The chromosome of
L. monocytogenes is about 2,7-3 Mbp with a low G+C content of 37-38 % (Buchrieser
et al., 2003; Wiedmann and Zhang, 2011). The genome composition can be divided
between the “core” genome and “accessory” genome. The core corresponds to the
genome sequence shared by all of the analyzed strains, while the accessory genome
corresponds to genes present only in some strains of the observed strains. In a
pangenomic study performed on a panel of 207 strains of L. monocytogenes, Henri et
al. observed a core genome consisting of 2017 genes and an accessory genome of
3101 genes (Henri et al., 2017). The accessory genome is often characterized by
different mobile genetic elements (MGE) such as prophages, plasmids, mobile islands
and transposons (Kuenne et al., 2013). The presence of MGEs in L. monocytogenes
strains is highly variable. For instance, the plasmid detection rate can range from
absence (non-detection) up to 79 % based on different studies (Kolstad et al., 1992;
Lebrun et al., 1992; McLauchlin et al., 1997; Perez-Diaz et al., 1982; Peterkin et al.,
1992).
Since the L. monocytogenes EGDe complete genome was published, the databank of
the National Center for Biotechnology Information (NCBI) is counting today (October
2019) 23210 genome assemblies of L. monocytogenes isolates collected worldwide.

Theoretical background
3
1.2.1 Subgrouping of Listeria monocytogenes
L. monocytogenes population has been classified into four different evolutionary
lineages (from I to IV). Lineage I and II have been earlier described in 1989 by Piffaretti
et al. (Piffaretti et al., 1989). Two further lineages were later identified as lineage III,
first published in 1995 (Rasmussen et al., 1995), and lineage IV, first mentioned as IIIB
(Roberts et al., 2006) and then reported as lineage IV two years later (Ward et al.,
2008). The majority of the L. monocytogenes isolates responsible for more than 90 %
of human listeriosis cases belong to lineage I and II (McLauchlin et al., 2004). It is
necessary to discriminate with a high resolution between closely related strains likely
involved in human diseases from those that are unrelated in order to enhance outbreak
investigations, epidemiological surveillance and source attribution studies.
Different techniques have been applied to detect and characterized L. monocytogenes
strains. The first L. monocytogenes subtyping was performed with the serotyping
method, based on the somatic and flagellar antigens (Paterson, 1940; Seeliger and
Höhne, 1979). However, this approach is expensive and time-consuming and only
allows differentiating 13 serotypes (Table 2).
Table 2 : Summary of L. monocytogenes lineages adapted from (Orsi et al., 2011).
Lineage Serotypes Genetic characteristics
Distribution Reference
I 1/2b, 3b, 3c, 4b
Lowest diversity among the lineages; lowest levels of recombination among lineages
Commonly isolated from various sources; overrepresented among human-related isolates
(Piffaretti et al., 1989)
II 1/2a, 1/2c, 3a
Most diverse, highest recombination levels
Commonly isolated from various sources; overrepresented among food and food-related as well as natural environments
(Piffaretti et al., 1989)
III 4a, 4b, 4c Very diverse; recombination levels between those for lineage I and II
Most isolates obtained from ruminants
(Rasmussen et al.,
1995)
IV 4a, 4b, 4c Few isolates analyzed Most isolates obtained from ruminants
(Roberts et al., 2006;
Ward et al., 2008)
It is important to notice, that four serotypes (i.e. 1/2a, 1/2b, 1/2c and 4b) are causing
nearly all reported human listeriosis cases. The phenotypic variability observed within

Theoretical background
4
each serotype required the development of subtyping methods with higher
discriminatory power such as the molecular typing techniques (Figure 1).
Before the explosion of WGS technologies, the pulsed-field gel electrophoresis (PFGE)
has been the gold standard method for microbial subtyping of foodborne pathogens
(especially L. monocytogenes and Salmonella enterica) during epidemiological
studies, surveillance and outbreak control (Brosch et al., 1994; Graves and
Swaminathan, 2001; Kerouanton et al., 1998). This method is based on the random
fragmentation of DNA using two restriction enzymes for L. monocytogenes (i.e.
ApaI/AscII). However, the protocol is laborious and difficult to harmonize between
laboratories limiting the inter-laboratory comparisons of the obtained PFGE-profiles.
An additional disadvantage of PFGE is the limited information on the genetic
relationships provided by the distance-based phylogeny inferred on PFGE band
profiles.
A further developed typing method relying on the allelic profiling of seven house-
keeping loci is the multi-locus sequence typing (MLST). It is based on the sequence
analysis of the housekeeping genes: acbZ (ABC transporter), bglA (beta-glucosidase),
cat (catalase), dapE (Succinyl diaminopimelate desuccinylase), dat (D-amino acid
aminotransferase), ldh (lactate dehydrogenase) and lhkA (histidine kinase). This MLST
scheme was first proposed by Salcedo et al. (2003) and later adapted by Ragon and
colleagues to conduct a large study with 360 L. monocytogenes isolates (Ragon et al.,
2008; Salcedo et al., 2003). Compared to serotypes and PFGE profiles, the (ML) STs
allelic variation allowed grouping of L. monocytogenes isolates into clonal
complexes (CCs). The CCs are defined as groups of STs sharing six out of seven
Figure 1 : Schema of typing methods with different discriminatory power. Adapted from (Rossen et al.,
2018).

Theoretical background
5
alleles with at least one other profile of the group (Feil et al., 2004). Consequently,
singletons were defined as STs having at least two allelic mismatches with all other
STs (Ragon et al., 2008). In this study, 126 different STs were observed and allocated
into 23 CCs, where most of the isolates were associated with a small number of major
clones (Figure 2).
Figure 2 : L. monocytogenes lineages and clonal complexes (a) Core genome SNP maximum-likelihood phylogeny of L. monocytogenes genome sequences with the clades annotated by 7 loci MLST CC. (b) Minimum spanning tree of the isolates included as described by 7 locus MLST. Each circle represents a single ST that is numbered on the tree (Painset et al., 2019).
MLST has been used as the gold standard typing method for long-term epidemiological
surveillance of L. monocytogenes, however, for outbreak investigations, PFGE often
showed a better discriminatory power (Carrico et al., 2013). Nowadays, WGS
technology is rapidly revolutionizing the way the investigation of bacterial pathogens is
performed along the food chain. The sequencing of the complete bacterial genome
allows to identify different types of genomic variants including Single Nucleotide
Polymorphism (SNPs) and differentiate strains based on their genotypes (i.e. SNPs
differences in number and position across the genome dataset). This WGS-based
Theoretical background
6
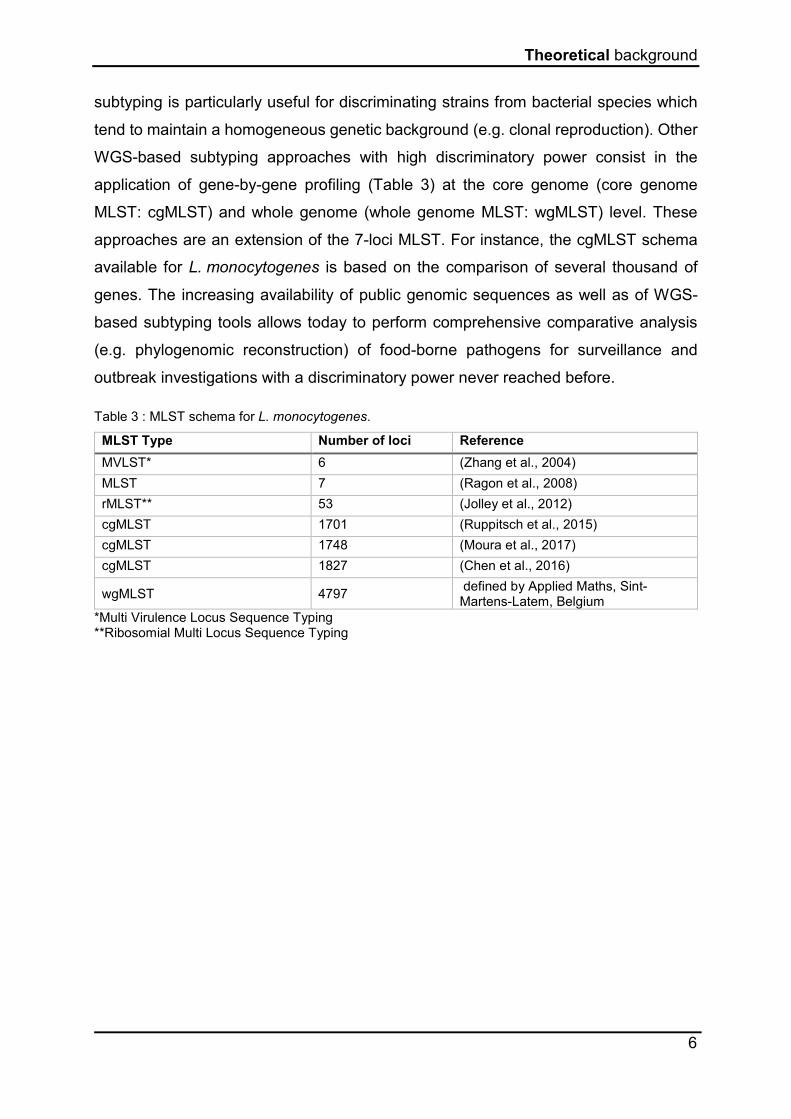
subtyping is particularly useful for discriminating strains from bacterial species which
tend to maintain a homogeneous genetic background (e.g. clonal reproduction). Other
WGS-based subtyping approaches with high discriminatory power consist in the
application of gene-by-gene profiling (Table 3) at the core genome (core genome
MLST: cgMLST) and whole genome (whole genome MLST: wgMLST) level. These
approaches are an extension of the 7-loci MLST. For instance, the cgMLST schema
available for L. monocytogenes is based on the comparison of several thousand of
genes. The increasing availability of public genomic sequences as well as of WGS-
based subtyping tools allows today to perform comprehensive comparative analysis
(e.g. phylogenomic reconstruction) of food-borne pathogens for surveillance and
outbreak investigations with a discriminatory power never reached before.
Table 3 : MLST schema for L. monocytogenes.
MLST Type Number of loci Reference
MVLST* 6 (Zhang et al., 2004)
MLST 7 (Ragon et al., 2008)
rMLST** 53 (Jolley et al., 2012)
cgMLST 1701 (Ruppitsch et al., 2015)
cgMLST 1748 (Moura et al., 2017)
cgMLST 1827 (Chen et al., 2016)
wgMLST 4797 defined by Applied Maths, Sint-Martens-Latem, Belgium
*Multi Virulence Locus Sequence Typing **Ribosomial Multi Locus Sequence Typing
Theoretical background
7
1.3 Monitoring of Listeria monocytogenes in the European Union
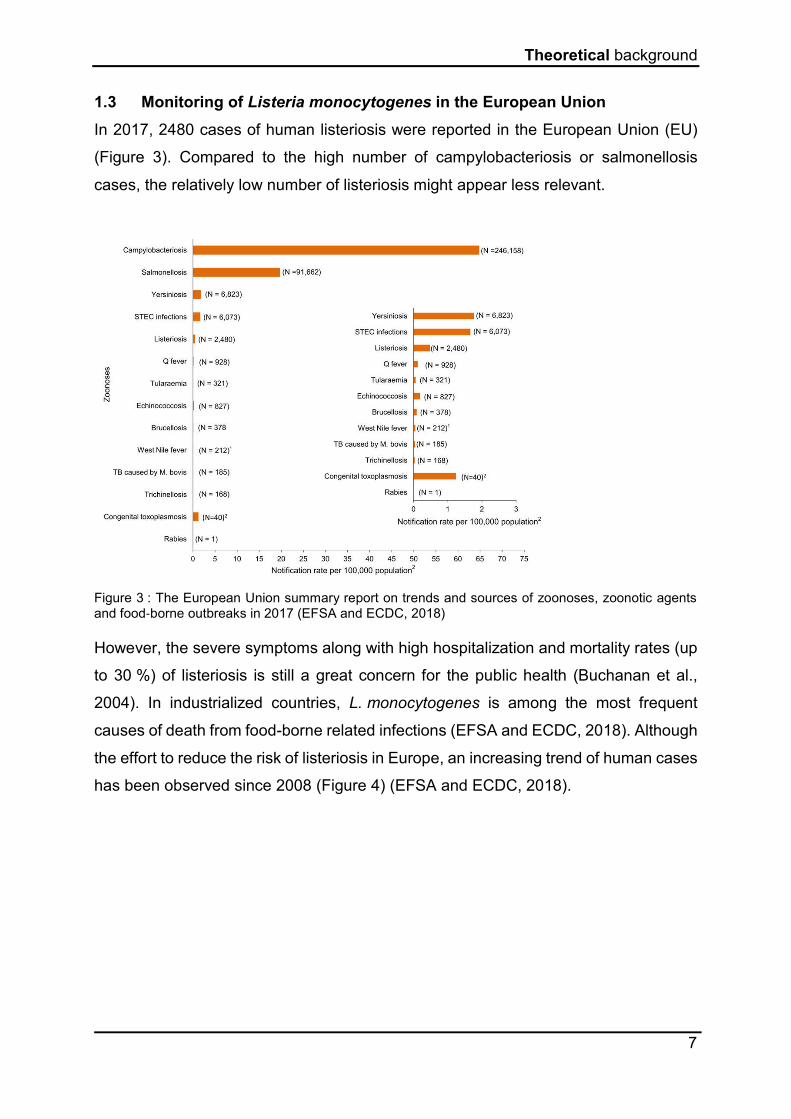
In 2017, 2480 cases of human listeriosis were reported in the European Union (EU)
(Figure 3). Compared to the high number of campylobacteriosis or salmonellosis
cases, the relatively low number of listeriosis might appear less relevant.
However, the severe symptoms along with high hospitalization and mortality rates (up
to 30 %) of listeriosis is still a great concern for the public health (Buchanan et al.,
2004). In industrialized countries, L. monocytogenes is among the most frequent
causes of death from food-borne related infections (EFSA and ECDC, 2018). Although
the effort to reduce the risk of listeriosis in Europe, an increasing trend of human cases
has been observed since 2008 (Figure 4) (EFSA and ECDC, 2018).
Figure 3 : The European Union summary report on trends and sources of zoonoses, zoonotic agents and food‐borne outbreaks in 2017 (EFSA and ECDC, 2018)

Theoretical background
8
Figure 4 : Trend in reported confirmed human cases of listeriosis in the EU/EEA , by month, 2008-2017 (EFSA and ECDC, 2018).
1.4 Food sources and outbreaks
Listeriosis is a foodborne disease associated with a wide range of food (e.g. raw meat,
seafood, and vegetables) and processed (e.g. sausage, dairy, and ready-to-eat food)
products. In particular, ready-to-eat (RTE) products (e.g. meat and fish tartars, smoked
fish, deli meats, composite salads and raw vegetables) present a high microbiological
risk (Okada et al., 2013; Rocourt et al., 2003; Tompkin, 2002) since directly consumed
without any cooking or other processing after a period of refrigeration. Thanks to
improved detection methods along the food chain, more outbreaks with fewer cases
have been linked to foods previously not considered as a potential risk of
L. monocytogenes contamination as caramel apples (Angelo et al., 2017; Buchanan,
Gorris, et al., 2017). Because of the ability of L. monocytogenes to adapt to different
unfavourable conditions (e.g. acid and oxidative stress), to grow at low temperatures
(e.g. 2 ºC) and to form biofilms, cells can persist in food processing plants and retail
markets over time (Overney et al., 2017). Thus, food contamination can occur at any
stage of the food chain (ANSES, 2011; EFSA BIOHAZ Panel, 2018).
Foodborne diseases can be sporadic or epidemic. A sporadic case is an isolated case
with no epidemiological link to other cases of the same disease. An epidemic is an
excess of illnesses cases, compared to what is usually observed, in a delimited area
and time frame. An epidemic of foodborne disease can be expressed in two forms:

Theoretical background
9
- outbreaks linked to a common "circumscribed" source (e.g. among people from
the same family or those sharing the same collective catering);
- diffuse epidemics due to widely distributed and affecting products (e.g. mostly,
people with no apparent connection to each other).
In 2017, ten foodborne outbreaks caused by L. monocytogenes were reported in the
EU. Four of them were classified as strong-evidence outbreaks in Austria (2), Denmark
and Sweden. The food vehicle in these cases were cheese, fish products, meat
products, vegetables and juices and other products thereof (EFSA and ECDC, 2018).
These ten outbreaks were responsible for 39 human cases (illnesses) over 2480
confirmed cases of listeriosis in the EU. These data emphasize that most of the
listeriosis cases reported in the EU are sporadic (EFSA and ECDC, 2018). The largest
worldwide known outbreak of listeriosis was recently reported in South Africa, with a
total of 1060 cases reported in 18 months (from January 2017 to July 2018). Here, the
origin of the outbreak was RTE processed meat products (polony) (Smith et al., 2019).
1.5 Surveillance
For public health safety, the early detection of contamination events in the production
systems is essential to prevent foodborne pathogen outbreaks and to rapidly find the
source of contamination for avoiding the distribution of contaminated food. Multiple
factors like the market globalization, the associated geographical dispersion and the
long period of disease incubation, hinder the control and detection of linked listeriosis
cases as well as their association with the contaminated food products. Thus, the EU
has implemented three different platforms to promptly act and exchange information
between the member states in order to mitigate food-borne diseases (Figure 5).

Theoretical background
10
Figure 5 : Flow diagram for communication following of a cross-border outbreak in EU adapted from (Yeni et al., 2017).
The cross-border communication platforms developed in the EU include:
- The Rapid Alert System for Food and Feed (RASFF), a platform to share
information between the member states related to hazards found in food and
feed. With this system, it has been possible to trace back contaminated batches
(Leuschner et al., 2013).
- The Epidemic Intelligence Information System for Food- and Waterborne
diseases (EPIS-FWD), for fast information exchange on an unusually high
increase of human cases and emerging outbreaks detected on the national level
(Gossner, 2016).
- The Early Warning and Response System (EWRS), aiming to link public health
authorities of EU member states and the European Commission to find a rapid
response in case of human listeriosis (Guglielmetti et al., 2006).
Molecular typing data from clinical strains are uploaded into the European Centre for
Disease Prevention and Control (ECDC) database TESSy by the EU member states
since 2012. Food, feed, animal and environmental isolates of L. monocytogenes are
submitted to the European Food Safety Authority (EFSA). Joint analysis between
ECDC and EFSA are requested by the European Commission. For this purpose, a joint
database hosted by the ECDC has been established. This tool increases the
possibilities of surveillance and monitoring of foodborne pathogens by linking clinical
Theoretical background
11
isolates with non-human isolates, reducing the response time (Rizzi et al., 2017). A
recently solved L. monocytogenes outbreak (March 2018) well shows how important
the networks between EU member states and the functionality of the implemented
systems are. The EU recorded 32 listeriosis cases and six death due to the infection.
Gathering information from the member states through the communication platforms,
this outbreak was confirmed to be multi-country (Austria, Denmark, Finland, Sweden,
and the UK) and already ongoing since 2015. The outbreak was finally associated with
frozen corn (Authority et al., 2018).
1.5 Regulations
The EU has established microbiological food safety criteria for L. monocytogenes in
RTE foods in Regulation (EC) No 2073/20053 (15/11/2005) on microbiological criteria
for foodstuffs. Annex I of the Regulation specifies the food category, sampling plan,
microbiological limits, analytical methods and stage where the criterion applies.
Specific food safety criteria for L. monocytogenes in RTE foods are described below
(category 1.1 to 1.3 of Annex I of this Regulation).
For RTE foods, other than those intended for infants and for medical purposes
(category 1.1), which are able to support the growth of Listeria monocytogenes
(category 1.2), two microbiological criteria are laid down: either a qualitative criterion,
i.e. absence in 25 g before the food has left the immediate control of the food business
operator (FBO) who has produced it, or a quantitative criterion, i.e. 100 CFU/g for
products placed on the market during their shelf-life. This quantitative criterion applies
if the FBO is able to demonstrate, to the satisfaction of the competent authority, that
its product will not exceed the limit of 100 CFU/g throughout the shelf-life. For this
purpose and according to Article 3.2, the FBO shall conduct studies that are mentioned
in Annex II of this Regulation: predictive microbiology, challenge tests or durability
studies. For products that do not support the growth of L. monocytogenes
(Category1.3), only the quantitative criteria are applied.
Good manufacturing practices, appropriate hygiene and control of the storage
temperature of products are necessary to limit the product contamination and/or the
potential growth of L. monocytogenes in food in order to maintain levels below
100 CFU/g product (EFSA, 2013). In this perspective, the temperature control of high-
risk foods is an essential element from farm-to-fork (Duret, Hoang, et al., 2014).

Theoretical background
12
2 Cold adaptation
2.1 Importance of cold growth/adaptation
A specific characteristic of L. monocytogenes is its ability to grow at refrigeration
temperature. Before selective media was used to isolate L. monocytogenes strains, its
capacity to grow at low temperatures gave the advantage of isolating strains by cold
enrichment (Donnelly and Nyachuba, 2007). Gray and colleagues discovered that
L. monocytogenes is able to grow at refrigeration temperature back in 1948. They
observed that strains isolated from bovine brain suspensions had the capacity to grow
at 4 °C after they had been stored for three days up to three months (Gray and
McWade, 1954). Later, it has been also shown that L. monocytogenes is able to grow
at temperatures as low as -2 °C (Bajard et al., 1996; Junttila et al., 1988).
As mentioned before, RTE products are high-risk vehicles of L. monocytogenes
infection (Rodrigues et al., 2017). Even if the initial contamination is low at the end of
the food processing process, there are some critical points along the distribution that
highly increase the risk of L. monocytogenes growing (e.g. non-compliance of the cold
chain). The storage at low temperature is often the only preservation of RTE, due to
an often-limited bacterial inhibition by other environmental factors (i.e. low pH, low aw,
preservatives, etc). The physico-chemical characteristics of many refrigerated RTE
allow L. monocytogenes growth, as also the lack of cold-tolerant competitive microflora
(Cacace et al., 2010; Chan and Wiedmann, 2008). In the case of refrigerated RTE
products, the shelf-life is a critical issue to avoid that L. monocytogenes cells multiply
to a sufficient number for causing listeriosis (Duret, Guillier, et al., 2014). For instance
in France, the shelf-life of rillettes and jellied pork tongue has been reduced from 48 to
28 days after the notification of several outbreaks (De Valk et al., 2001).
An important factor in the assessment of cold adaptation ability of L. monocytogenes
is the lag time. It is inversely proportional to the maximum growth rate. Below four
degrees Celsius, the lag times are highly increased as the growth rate is much slower.
However, slight changes in storage temperature can enhance the growth of
L. monocytogenes in RTE foods and consequently increase the risk of listeriosis (Lu
et al., 2005). In their work, Lu and colleagues (2005) determined the lag time and
growth parameters of L. monocytogenes at 4.4 °C and at 10 °C in frankfurters
products. Increasing the temperature, the lag time was reduced from18 to 6.5 days,

Theoretical background
13
whereby the doubling time was four times lower at 10 °C (Lu et al., 2005). In addition,
Okada et al. (2013) showed that the exposition to L. monocytogenes increased when
the RTE food (i.e. cooked sardines) was stored at the wrong temperature (i.e. 10 °C
rather than 4 °C), with cell concentrations up to 3.5 log10 (CFU/g) higher after 7 days
of storage (Okada et al., 2013).
All these observations emphasize the importance to understand the mechanisms of
cold adaptation and the behavior of L. monocytogenes at refrigeration temperature for
enhancing food safety.
2.2 Mechanisms
To adapt to cold conditions, the bacteria have to overcome different obstacles.
According to scientific literature, different temperatures and mechanisms are
associated with cold adaptation (see below). First, the nutrient uptake is reduced due
to decreased membrane fluidity. Additionally, the superhelical coiling of the DNA is
increased, which represents an issue to replicate or transcribe DNA. The translation
can be also affected due to modifications in the secondary structures of the RNA.
Generally, biochemical mechanisms like protein folding or enzymatic reactions
become slow or inefficient at low temperatures. To permit an efficient functioning of the
bacteria, the ribosomes need to adapt to the cold environment (Graumann and
Marahiel, 1999). L. monocytogenes implemented different response mechanisms to
overcome these problems and thus grow at low temperatures (Figure 6). Some of
these response mechanisms are nowadays well studied, although there are still gaps
in knowledge.

Theoretical background
14
Figure 6 : Schematic outline of the cold stress adaptation process in L. monocytogenes adapted from (Tasara and Stephan, 2006).
In the following part, the known key response strategies of L. monocytogenes,
including maintenance of the cellular membrane fluidity, the stabilization of ribosome
and nucleic acid structures, the uptake/synthesis of cryoprotective osmolytes and
peptids as well as the production of cold shock proteins (Csps), are described.
Cold shock proteins
Cold shock proteins (Csps) are small and highly conserved polymers, which play a
major role in the cold response (Ermolenko and Makhatadze, 2002). Their expression
is enhanced when temperature decreases (Hébraud and Potier, 1999). The genome
of L. monocytogenes harbors three genes coding for cold shock proteins: cspA, cspB,
and cspD (Schmid et al., 2009). Csps have different functions, among which facilitating
the uptake of compatible solutes (see below) and oligopeptide permease (see below)
as well as acting as RNA chaperones (Beumer et al., 1994; Borezee et al., 2000; Chan
and Wiedmann, 2008). At low temperatures, the RNA structures become more stable,
hurdling an efficient transcription and translation. Thus, the Csps destabilize secondary
structures by melting the double stranded-ribonucleic acid (dsRNA) to further stabilize
the single-stranded state of the target RNA (Figure 7a) (Barria et al., 2013; Ermolenko

Theoretical background
15
and Makhatadze, 2002; Schmid et al., 2009). In RNA metabolism, the activity of Csps
can avoid redundant effects such as the affected work of the nucleases, the hindered
formation of the translation initiation complex or the transcription concerned by
premature terminations of RNA polymerase (RNAP) (Figure 7) (Barria et al., 2013).
Figure 7 : Role of the Csp proteins in adaptation to low temperature. (a) Csps (spheres) can melt double-stranded RNA, and stabilize single-stranded RNA conformation. (b) New secondary structures can impair RNA metabolism (Barria et al., 2013).
Schmid and co-workers found out that CspA, CspB, and CspD are not necessary for
the growth of L. monocytogenes at 37 °C. They were able to classify these three
proteins by importance for cold growth (4 °C). The mutant without cspA gene was not
able to grow at 4 °C, the mutant without cspD showed reduced growth while the cspB
mutant showed no significant difference compared to the wildtype (Schmid et al.,
2009). Arguedas-Villa and colleagues also showed the importance of cspA gene for
the growth of L. monocytogenes in cold conditions. They separated 20 strains in two
different groups according to their lag time at 4 °C. The first group with lag times
between 7-30 h showed higher transcriptional activation of cspA than the second group
with lag times of 257-420 h (Arguedas-Villa et al., 2010).
Membrane fluidity
In order to maintain the membrane in the optimal liquid (liquid-crystal) state in cold
conditions, some modifications of the fatty acid composition are necessary for the
transport of nutrients. Three major fatty acids constitute the membrane of
L. monocytogenes: anteiso C15:0, anteiso C17:0 and iso C15:0 (Annous et al., 1997).

Theoretical background
16
These three types represent about 95 % of all membrane fatty acids (Annous et al.,
1997). In response to cold conditions, the ratio of the fatty acids is changing in the
membrane. The content of anteiso C15:0 increases whereas the amount of anteiso
C17:0 and iso C15:0 decreases (Annous et al., 1997; Jones et al., 1997; Juneja et al.,
1998; Püttmann et al., 1993). On one hand, there is a reduction of the fatty acid chain,
and on the other, a change from iso to anteiso C15:0 can be noticed. The shorter length
of the chain leads to a lower melting point, which increases the membrane fluidity. The
transformation from iso to anteiso disrupts the close packing of the chains due to the
changed type of branching at the methyl end and thus enhances the membrane fluidity.
ATP-Binding Cassette (ABC) Transporters and uptake of compounds
Different ABC transporters permit the uptake of specific substrates into
L. monocytogenes cells. These substrates are compatible solutes or osmolytes. They
are soluble, low-molecular-weight organic compounds that have no negative effect on
the normal function of the bacteria. Studies showed that a higher concentration of the
cryoprotective osmolytes, as glycine betaine and carnitine, characterized
L. monocytogenes cells during cold exposure (Angelidis and Smith, 2003;
Wemekamp-Kamphuis et al., 2004). Sleator and colleagues (2003) demonstrated that
L. monocytogenes is not able to synthesize these main cryoprotective osmolytes
(Sleator et al., 2003). Glycine betaine is mainly found in plants, while carnitine is
commonly from meat or dairy origin (Mitchell, 1978; Zeisel et al., 2003). Different
studies showed that glycine betaine and carnitine addition in growth media increases
the growth of L. monocytogenes in cold conditions (Bayles and Wilkinson, 2000;
Beumer et al., 1994; Ko et al., 1994; Smith, 1996). Even though L. monocytogenes
cannot synthesize these solutes, its genome codes for different betaine transporters
and transporters that permit the uptake of carnitine (Angelidis and Smith, 2003;
Gerhardt et al., 1996; Gerhardt et al., 2000). During cold growth, the uptake of
cryoprotective osmolytes from the environment into the cell through the upregulated
ABC transporter systems is increased (Angelidis and Smith, 2003; Beumer et al., 1994;
Gerhardt et al., 2000; Wemekamp-Kamphuis et al., 2004). The main transporters for
glycine betaine uptake are betaine porter I (BetL) and betaine porter II (GbuABC), while
for carnitine the major system is OpuC (Fraser and O'Byrne, 2002; Ko and Smith, 1999;
Sleator et al., 1999; Sleator et al., 2000; Verheul et al., 1995). During cold stress the
transporter system GbuABC plays the main role for glycine betaine uptake.

Theoretical background
17
Wemekamp-Kamphuis and colleagues showed that the key role between the different
transporter systems can change depending on the accessible solutes in the media
(Wemekamp-Kamphuis et al., 2004). Similar results were also presented by Sleator at
al. (2003), who showed that the importance of each transporter was associated with
the environment (Sleator et al., 2003). Miladi et al. (2017) also observed a higher
expression of opuCA and betL (encoding for carnitine and betaine transporters,
respectively) after cold exposure of L. monocytogenes (Miladi et al., 2017). The
accumulated cryoprotective osmolytes have different functions, which have not been
fully discovered, yet. On one hand, they sustain the turgor and prevent the dehydration
of the cells, but one the other, they contribute to increasing growth in cold conditions
probably through the stabilization of folded proteins and hydrogen bonds due to a
higher volume of cytoplasmic water (Arakawa and Timasheff, 1985; Record Jr et al.,
1998).
Besides the uptake of cryoprotective osmolytes, the accumulation of short peptides
from the environment affects L. monocytogenes’ growth under cold stress positively.
Borzee and colleagues (2000) found an oligopermease operon harboring five genes,
including oppA, oppB, oppC, oppD and oppF. By creating an oppA deletion mutant,
they studied the role of this gene, which encodes a 62 kDa oligopeptide binding protein
(OppA). They discovered that OppA mediates the transport of oligopeptides and is
essential for the growth of LO28 in cold conditions (5 °C). The transcription rate was
higher at 5 °C, and curiously, the transcripts at low temperature were 1.2 kb shorter
than those at 37 °C (Borezee et al., 2000). A reason for this observation could be the
activation of a second promoter. Similarly, Durack and co-workers noted a significant
up-regulation of oppA in all strains adapted to cold stress (Durack et al., 2013). The
role of the short peptides in L. monocytogenes’ cold adaption is not completely
explored. One theory is that they are implicated in transduction pathways enhancing
other mechanisms for a better adaptation and growth in cold environments. Another
theory suggests that they were used as substrate donors, like amino acids or peptide
derivate (Maria-Rosario et al., 1995).
DEAD-box RNA helicase
DEAD-box proteins are RNA helicases, whose best-known functions are the
separation of short duplex RNA regions on one side and a chaperone activity on the

Theoretical background
18
other (Jarmoskaite and Russell, 2011). Based on that functionality, these proteins play
an important role in a cold environment. The genome of the reference strain EGD-e
harbors four predicted DEAD-box RNA helicase genes, including lmo0866, lmo1246,
lmo1450 and lmo1722 (Glaser et al., 2001). Chan et al. and Markkula et al. studied the
role of these genes in L. monocytogenes at low temperature (4 °C and 3 °C,
respectively) (Chan et al., 2007; Markkula et al., 2012). Chan and co-workers
demonstrated that the transcript levels of genes encoding three DEAD-box helicases
were enhanced in cold conditions compared to 37 °C. Similar results were published
by Markkula and colleagues that found higher transcript levels of all four DEAD-box
RNA helicase genes grown at cold temperatures than at 37 °C. Furthermore, they
noticed a higher minimum temperature of the gene deletion mutants compared to the
EGD-e wildtype strain. They also reported impaired motility of the mutants. Thus, they
demonstrated that these genes are required for cold tolerance and motility, although
the gene lmo1450 seems to have a universal role not only related to cold (Markkula et
al., 2012).
Transcriptional regulation
Cold response of cells can also occur at the transcription level through molecular
transduction networks. Different studies showed enhanced transcription of particular
genes necessary for cold adaption and growth (Arguedas-Villa et al., 2010; Cacace et
al., 2010; Kaan et al., 2002). The alternative sigma factors, for instance, are key
regulatory mechanisms of prokaryotes for a rapid adaptation to changing
environmental conditions. These bacterial transcription initiators enable specific
binding of RNA polymerase subunits to gene promoters under particular conditions
(Kazmierczak et al., 2003; Kazmierczak et al., 2005; Liu et al., 2017).
L. monocytogenes harbors five different sigma factors including; A, B, C, H, and L.
Whereas B, C, H, and L are alternative factors, A is a housekeeping sigma factor
(Chaturongakul et al., 2011; Liu et al., 2017). These four alternative sigma factors
regulate the transcription of genes that are affecting the virulence and the response to
various stresses of L. monocytogenes (Chaturongakul et al., 2011; Liu et al., 2017).
The largest and the most-studied regulon is the B. A recent study shows that
201 genes are preceded by B -dependent promotors (Liu et al., 2017). However,
several previous studies investigated the role of this sigma factor (Chaturongakul et

Theoretical background
19
al., 2011; Oliver et al., 2010; Ribeiro et al., 2014; Toledo-Arana et al., 2009). These
studies highlight that B plays an important part, especially, in virulence and response
to different types of stress (i.e. acid, osmotic, arsenate, oxidative and cold). Moreover,
a study of Becker and colleagues showed that B is required for the transition to
stationary phase, but does not affect on log-phase cells (Becker et al., 2000; Mujahid
et al., 2013; O’Byrne and Karatzas, 2008). As mentioned before, 201 B -dependent
genes are currently known. Part of these genes code for proteins with putative roles in
cold growth of L. monocytogenes, such as the genes coding for compatible solute
transporters opuCA and gbu (Becker et al., 2000; Cetin et al., 2004; Kazmierczak et
al., 2003). Other genes appear to be involved in transcriptional regulation, metabolism
of energy, carbon, and nucleotides as also for other stresses (Liu et al., 2017).
2.3 Cold growth and virulence
The infection path normally starts with the ingestion of contaminated food. This
requires a rapid adaptation of L. monocytogenes in the new environment in order to
invade the host duodenum and then access the blood system. From here they can
expand and circulate to reach other tissues, e.g., the central nervous system or the
placenta (Allerberger and Wagner, 2010; Guldimann et al., 2017). To resist the
infection-related stresses, the cells need to modify their gene expression in order to
rapidly adapt to the changing environmental conditions (Guldimann et al., 2017). The
B activation of the transcription not only of some virulence genes, but also some genes
known to be implicated in cold adaption (as opuCA and gbu), might be a link between
cold growth and pathogenicity (Cetin et al., 2004; Guldimann et al., 2017; Kazmierczak
et al., 2003). Previous studies (Durst, 1975; Wood and Woodbine, 1979) reported that
L. monocytogenes strains were able to develop an increased virulence when grown at
4 °C and then exposed to mice and chick embryos, respectively. Likewise, more recent
studies showed possible associations regarding virulence and cold adaptation
(Arguedas-Villa et al., 2010; Cordero et al., 2016). For instance, Arguedas-Villa and
co-workers observed that the majority of strains able to grow at 4 °C in defined minimal
media, were also those linked to human listeriosis (Arguedas-Villa et al., 2010).
As mentioned before, B plays a role in both virulence and cold adaptation. Becker and
colleagues demonstrated that the absence of B impaired the adaptation of stationary
phase cells to grow at 8 °C, contrary to log-phase cells. This factor is needed for the
Theoretical background
20
accumulation of betaine and carnitine (see above) (Becker et al., 2000). Regarding
pathogenicity, B is regulating several virulence genes, such as the inlAB operon. The
inlA gene is coding for a surface protein internalin, which is necessary for the invasion
of the epithelial cells (Kim et al., 2004; Kim et al., 2005). In addition, the expression
and activity of PrfA, a protein that plays an important role after the intestinal barrier as
a primary transcriptional regulator of virulence genes, is also supposed to be related
to B (reviewed by (NicAogáin and O’Byrne, 2016).
Other studies focus on the role of Csps in virulence of L. monocytogenes. Findings
from a recent study of Eshwar and co-workers suggest that Csps are involved in the
expression/regulation of genes related to host pathogenicity, cell aggregation and
flagella-based motility (Eshwar et al., 2017). They demonstrated an affected
expression of those genes in Csp deletion mutants. Furthermore, they suggest a Csp-
dependent transcriptional regulation of prfA, hly, mpl and plcA. It was also observed
that Csp deletion mutants showed reduced or absent production of the cell surface
protein ActA and cell surface flagella. However, in this study, the CspB plays a major
role concerning virulence. A similar conclusion was published by Schärer and
colleagues but focusing on cytolysin listeriolysin (LLO) production. LLO is a pore-
forming protein encoded by the previously mentioned gene hly and necessary for
intracellular survival. The CspB deletion mutant showed decreased levels of hly gene
transcripts, while the mutant with CspB presented no difference compared to the
wildtype (Schärer et al., 2013).
In conclusion of these studies, Csps seems to be involved in the modulation of
L. monocytogenes’ virulence. But to date, studies demonstrated only an association
between virulence and CspB. As mentioned before its role regarding cold stress is the
less important among the Csps (Eshwar et al., 2017; Schmid et al., 2009).
The flagellum-mediated motility of L. monocytogenes was reported to be relevant for
the tissue culture invasion and for raising the infectivity after bacterial ingestion in vivo
(O'Neil and Marquis, 2006). Furthermore, it seems to be an important ability for
L. monocytogenes strains to form biofilms that can later contaminate food in the
processing environments and ultimately reach the consumer with harmful
consequences (Lemon et al., 2007). Mattila and colleagues found that the expression
levels of the motility genes flhA and motA are higher at 3 °C than at 37 °C.

Theoretical background
21
Furthermore, they demonstrated that the gene deletion mutants were non-motile at all
tested temperatures. Besides, the mutants showed lower growth rates in cold
compared to the wildtype while no significant differences were observed at 25 and
37 °C (Mattila et al., 2011). This suggests that the motility might be a common point in
virulence and cold growth.

Theoretical background
22
3 Association studies in the genomic era
The field of genomics encompasses the study not only of the whole sequence but also
of the structure and the function of genetic information, offering unparalleled
possibilities to better understand and characterize bacterial pathogens and their
phenotypic behavior (Gill, 2017). Several bacterial mechanisms, which are translated
in specific phenotypic response, are the result of multiple genes and their regulatory
systems. Most of these are far from being fully understood, yet. The example of cold
adaption mechanisms in the previous chapter describes the complexity of the network
of genes and regulators that play a role in L. monocytogenes adaptation.
Many of the mentioned examples used knock-out mutants to understand the role of
genes in cold adaptation, which is a highly labor-intensive work focusing only on a few
genes and combination possibilities. With declining sequencing costs and by
combining multiple analysis in a single pipeline, the recent progress in WGS represents
a promising opportunity to decode phenotypic behaviors from the genomic sequence
of the bacteria of interest. Until now, the use of WGS is mainly focusing on outbreak
investigation, source tracking and source attribution in public health (Franz et al.,
2016). For the implication of WGS data into risk assessment, reliable biomarkers for
the prediction of phenotypes are necessary (Franz et al., 2016; Gill, 2017; Pielaat et
al., 2015)
3.1 Whole Genome Sequencing
In the last decade, WGS sequencing has become a method of choice for bacterial
pathogens typing in the field of food safety due to its improvement in performance,
quality and cost-effectiveness. The further development of this powerful tool is still
ongoing (Jagadeesan et al., 2018). Since the Illumina Genome Analyzer was able to
produce Gigabases of sequence data in 2006, numerous studies were published,
demonstrating the potential of WGS-based tools for characterization, functional
annotation and prediction of phenotypes (Bentley et al., 2008; Brynildsrud et al., 2016;
Kleinheinz et al., 2014; Nadon et al., 2017; Seemann, 2014).
Due to the increased demand for WGS, advanced bioinformatics approaches have
been developed to storage and process the high amount of genomic data. In the
second-generation sequencing era, WGS data are mainly generated using shotgun
(i.e. copies of randomly fragmented DNA segments) Illumina technology. Based on the

Theoretical background
23
adopted library preparation technology (e.g. NexteraXT), DNA fragments are
sequenced with a specifically targeted length (e.g. 150 bp), and called “short-reads”.
Although Illumina short-read technology is dominating the current bacterial sequencing
market, the single-molecule sequencing technology for the generation of the so-called
“long-reads” is taking off as third-generation sequencing due to improved genome
assembly. However, the short-read Illumina technique is still cheaper than those
generating long-reads (e.g. PacBio or MinION). In addition to the lower costs, it also
generates sequences with a lower error rate in comparison to long-read technology
and is thus nowadays competing as the gold standard method for microbial WGS.
Since the technology of short-reads was earlier accessible for the scientific community,
a number of bioinformatics approaches are available today to process short-reads.
Reference mapping and SNP calling
The reads mapping approach is based on the mapping pre-processed reads against
the selected high-quality reference genome by finding the optimal placement for each
read across that reference (Davis et al., 2015). The process behind read-mapping
against a reference genome relies on algorithms that index the reference genome,
align sequence reads to the reference and index the differences between them,
assigning confidence levels to each variant position (Deng et al., 2016; Taboada et al.,
2017). The choice of the reference genome is an essential step to ensure a good read
mapping performance. It is recommended to use a completely sequenced reference
genome that is closely related to the studied strains. Otherwise, the mapping process
can lead to misalignments and/or several regions where the reads cannot be mapped,
producing unreliable results (Carriço et al., 2018; Schürch et al., 2018). Important
quality check parameters for the read mapping process are the breadth coverage (i.e.
the time each nucleotide position in the reference genome is covered by reads) and
the depth coverage (i.e. the number of reads of a given nucleotide in an experiment).
After reference mapping, the variation between the reference genome and the
analyzed strain can be extracted. If a single nucleotide is substituted in the analyzed
genome the variant is an SNP, else the variation is an insertion or deletion of few (i.e.
less than 50 bp) bases called InDel. This whole process is referred to as a variant
calling. Relative to the reference genome, every variant of an isolate is recorded, thus
the genetic relatedness can be quantified between strains by pairwise variant

Theoretical background
24
comparisons (Jagadeesan et al., 2018). The drawback of this approach is that only the
shared regions can be aligned between the reference and the analyzed isolates. Also,
the presence of repetitive regions can lead to an increased pileup. In addition, MGEs
such as plasmids, transposons, and prophages, will not be detected if they are absent
in the chosen reference genome and if they are not shared by all strains in the analysis
(Lynch et al., 2016).
De Novo assembly
The process that assembles short nucleotide sequences into longer ones without the
use of a reference genome is referred to as de novo assembly. Here, contrary to the
read mapping against a reference, the reads are overlapped by algorithms to create
long contiguous consensus sequences called “contigs” (Zerbino and Birney, 2008).
Following, by re-mapping the reads to the contigs even longer sequences are created
and called “scaffolds”. These longer sequences result in high-quality draft genomes.
Different tools have been developed to conduct de novo assembly, as for example
Velvet, Skesa and SPAdes to cite the most commonly used (Bankevich et al., 2012;
Souvorov et al., 2018; Zerbino and Birney, 2008). A major point in the draft genome
generation is the quality check performed at each step of the process. The “Quality
Assessment Tool for Genome Assemblies” QUAST has been proven to be a reliable
tool to assess the quality of the assemblies (Gurevich et al., 2013). This software
evaluates different parameters, as the number of contigs and their lengths as well as
the median contig size (N50) and the size of the assembled genome. The de novo
approach is particularly used for pan genome investigations to allow the extraction of
assembled coding DNA sequences (CDS).
3.2 Genomic events driving phenotypic diversity
Thanks to the possibility to reconstruct complete (or nearly complete) bacterial
genomes through the above described approaches, comparative genomics can be
performed to discover the relations between genetic variants or phylogenomic profiling
and phenotypic traits (Dutilh et al., 2013; Kensche et al., 2007). Genetic variations can
be caused by SNPs, InDels and horizontal gene transfers of longer sequences (i.e.
plasmids, phages, and transposable elements).

Theoretical background
25
Plasmids
Plasmids are generally small, circular, double-stranded DNA molecule distinct from the
chromosomal DNA. Plasmids have been often found in L. monocytogenes at
frequency ranging between 28 and 81 %, with a sequence size varying from 14 to
106 kbp (Fagerlund et al., 2016; Harvey and Gilmour, 2001; Hingston et al., 2017;
Kolstad et al., 1992; Kuenne et al., 2010; Lebrun et al., 1992; McLauchlin et al., 1997;
Rychli et al., 2017; Schmitz-Esser et al., 2015). Furthermore, some plasmids show a
high level of conservation within and between L. monocytogenes CCs and can be
found identical over years and in different countries across the globe (Fox et al., 2016;
Hingston et al., 2019; Muhterem-Uyar et al., 2018; Rychli et al., 2017; Schmitz-Esser
et al., 2015). Plasmids can be lost or acquired by L. monocytogenes to maintain their
fitness or to enhance their survival in harsh conditions (Ferreira et al., 2014; Knudsen
et al., 2017; Kuenne et al., 2010; Martín et al., 2014). The frequency of plasmids is
often higher in strains isolated from food or food processing environments than from
clinical isolates (Lebrun et al., 1992; McLauchlin et al., 1997). This led to the hypothesis
that strains harboring a plasmid have an advantage during the exposure to stresses
related food and food processing (Naditz et al., 2019). More precisely, the presence of
plasmids can have a positive effect for enhancing tolerance to stressful conditions
including heat and acid, heavy metal or the presence of antibiotics and benzalkonium
chloride (Elhanafi et al., 2010; Hingston et al., 2019; Kremer et al., 2017; Lebrun et al.,
1994; Li et al., 2016; Pöntinen et al., 2017).
A recent study of Naditz and colleagues (2019) described that wildtype strains of ST5,
ST8, and ST121 (harboring putative stress response genes in plasmids) had higher
counts of survivors than the plasmid-cured strains after exposure to food environment-
associated stresses (i.e. elevated temperature, salinity, acidic environments, oxidative
stress, and disinfectants) (Naditz et al., 2019).
Prophages
Further mobile elements responsible for the most variable fraction of the microbial
genomes are the phages or prophages (Dutilh et al., 2013). Prophages (i.e. the
bacteriophage genomes that have integrated into the chromosome or plasmid of
bacteria) are often found in L. monocytogenes’ genomes. Schmitz-Lesser and

Theoretical background
26
colleagues as also Hain et al. reported the presence of one to four prophages per
L. monocytogenes strain (Hain et al., 2012; Schmitz-Esser et al., 2015). Prophages
often encode functions associated with the response to changing conditions as well as
genes related to pathogenicity (Brüssow et al., 2004; Nogueira et al., 2009). Some
genes harbored in prophages are reported to have an effect on antibiotic resistance,
stress resistance (osmotic, oxidative and acid), growth and biofilm formation (Fortier
and Sekulovic, 2013; Verghese et al., 2011; Wang et al., 2010). Besides that, genes
encoding for phage cell cycle (entry, DNA integration and replication, packaging, cell
lysis and the related regulation of expression), cell cycle inhibition of other phages and
viral replication, as well as a number of genes with unknown function are contained
into prophages (Dutilh et al., 2013). Due to their ubiquity, the prophages influence the
evolution of most bacterial species and thus they might be a key feature for explaining
phenotypic variations between closely related strains.
Small mutations
Point mutations (i.e. SNPs) or small insertions or deletions (i.e. InDels) can also affect
the phenotypic behavior of bacteria. These spontaneous mutations can appear during
DNA replication or repair by DNA polymerases, recombination, movement of genetic
elements or resulting from selective pressure (Foster, 2006; Martinez and Baquero,
2000). Drake and colleagues reported mutations rates in microbes nearly up to 1/300
per genome per replication (Drake et al., 1998). A single mutation can lead to a change
of the encoded amino acid (non-synonymous mutation) as also to a premature stop
codon (PMSC), affecting the protein conformation. However, in the case of
synonymous mutation, the same amino acid will be encoded (Syvänen, 2001) without
any effect on the protein conformation. Furthermore, the location of the SNP (e.g. in
coding, non-coding or regulatory regions) has to be taken into account for phenotype
variations. For instance, SNPs might affect the operon expression, leading to a
decreased or increased expression, as impacting RNAPs or transcription factors. A
study by Hoffmann and co-workers (2013) shows the possible impact of a single
mutation. They created a single point mutation in the A-like promotor region of the
secondary transporter BetL for carnitine uptake. Increased stress tolerance and a
significant increase in betL transcript levels under osmo- and chill stress have been
reported (Hoffmann et al., 2013). Moreover, the research of Kovacevic et al. (2013)
highlighted the potential effect of PMSC in inlA to the cold adaptation. Strains that

Theoretical background
27
showed quick adaptation to cold were more likely to harbor an inlA gene lacking
PMSCs (i.e. full-length inlA) (Kovacevic et al., 2013).
3.3 Genome Wide Association Studies
In the pre-genomic era, conventional molecular microbiology methods were used to
find genetic events associated with phenotypic traits, often struggling with natural
variations (Falush, 2016). Due to the increasing amount of WGS data, new possibilities
are nowadays accessible to study the association between geno- and phenotypes at
the genomic scale. These possibilities rely upon advanced statistical approaches
called Genome Wide Association Studies (GWAS). This approach is based on a simple
principle: a genome-wide set of genetic variants in different individuals is statistically
observed to see if any variant is associated with a trait. The phenotypic traits and the
genomic sequences of a strain collection are therefore necessary to assess genetic
variant candidates explaining the phenotypic trait of interest. Therefore, it is statistically
tested if some genetic elements are more common in strains presenting the specific
trait than in those that do not (Falush, 2016). GWAS can be made at different genomic
levels. Usually, genomes are broken down into core and accessory genome. Then,
variants such as SNPs, small indels and also k-mers (i.e. a word of DNA that is k long)
are explored in the core genome are (Earle et al., 2016; Jaillard et al., 2018; Sheppard
et al., 2013), whereas, the differences in presence/absence of genes are searched in
the accessory genome (e.g. through the tool Scoary developed by (Brynildsrud et al.,
2016)).
The first successfully application of GWAS on human populations has been published
in 2005. Since then, thousands of human genetic GWAS have been performed, but
only a few studies focused on the bacterial population. Until 2015, only about a dozen
of microbial GWAS have been published, primarily based on clinical linked phenotypes
as antibiotic resistance and virulence (Chen and Shapiro, 2015). Table 4 shows an
overview of the first applied GWAS in microbiology and their strategy.

Theoretical background
28
Table 4 : Summary of the first Genome Wide Association Studies adapted from (Chen and Shapiro, 2015)
Study Taxa
Relative
recombination
rate
# of genomes Phenotype Association
method
Addresses
accessory
genome ?
Unit of genetic
variant # of variants
Correction for
population
stratification
(van Hemert et al.,
2010)
L. plantarum Low 42 Host immune
response
Allele counting yes Gene
presence/absence
? (comparative
genomic
hybridization
none
(Sheppard et al.,
2013)
C .jejuni Moderate 29
(+ validation in
161)
Host
specificity
Allele counting Yes 30-bp DNA
sequences
>10,000 Simulation for
population
stratification
(Farhat et al., 2013) M. tuberculosis Low 123 Antibiotic
resistance
Homoplasy
counting
No SNPs ~25,000 Implicit in
phylogenetic
convergence criterion
(Laabei et al., 2014) S. aureus Low 90 Virulence Allele counting No SNPs and small
indels
~3000 Genomic control
(Salipante et al.,
2015)
E. coli Low-moderate 312 Antibiotic
resistance
Allele counting Yes Gene
presence/absence
~15,000 genes Inferred ancestry
clusters
(Alam et al., 2014) S. aureus Low 75 Antibiotic
resistance
Allele counting
and homoplasy
counting
No SNPs ~55,000 Inferred ancestry
clusters
(Chewapreecha et
al., 2014)
S. pneumoniae High 3085
(+validation in
616)
Antibiotic
resistance
Allele counting No SNPs ~400,000 Inferred ancestry
clusters
(Chaston et al.,
2014)
41 strains N/A 41 Host
development
time and
triglyceride
content
Allele counting Yes Gene
presence/absence
~12,000 genes Consideraration of
genes with unique
phylogenetic
distributions
(Chen and Shapiro,
2015)
M. tuberculosis Low 123 Antibiotic
resistance
Allele counting No SNPs ~3000 Inferred ancestry
clusters

Theoretical background
29
Different factors influence bacterial GWAS in comparison to the human one. The main
issues rely on the differences in bacterial DNA reproduction and recombination. The
bacterial recombination is not linked to their reproduction and can appear several times
during cell life or not at all. Without recombination events, bacteria’s populations are
highly clonal and exhibit a strong linkage disequilibrium (LD). The landscape of LD in
eukaryotic genomes is quite different than those in bacteria. In bacteria, gene
conversions often occur leaving a reshuffle of recombined tracts on top of a genomic
background of linked regions that erode the linkage of clonal frames. This limits the
performance of common mapping methods because it can hide true causal variants
from the rest of the linked sites in the clonal frame (Chen and Shapiro, 2015; Earle et
al., 2016; Milkman and Bridges, 1990). Another factor that can affect GWAS is the
population stratification (Chen and Shapiro, 2015; Earle et al., 2016). Within a bacterial
population, subpopulations can be shaped including individuals that are on average
more closely related to each other than to individuals of the wide population (Balding,
2006). In this case, the association of variants can arise more from the highly related
genetic background rather than the causality of the phenotype of interest (Falush,
2016).
Besides the differences in LD and population stratification, the phenotypes also
present disparity to those of eukaryotes. While human disease traits evolve mainly by
genetic drift (neutral diversification), the bacterial phenotypes of interest are mostly
driven by strong natural selection (e.g. positive selection for antibiotic resistance)
instead of genetic drift (Sheppard et al., 2018). Regarding these issues, association
studies, that do not consider these factors risk to find a high amount of false-positive
associations. Therefore, prior association studies focused mainly on finding clonal
lineages with linked phenotypic traits rather than studying specific genetic elements
(Lees and Bentley, 2016). For example, Maury et al (2016) associated
L. monocytogenes CCs to epidemiological data (food and clinical isolates) and
identified a gene cluster that causes increased virulence (Maury et al., 2016).
Due to recent developments in microbial GWAS, the above-mentioned factors can now
be taken into account. Earle and co-workers proposed in 2016 a new method based
on linear mixed models (LMMs) that has been referred to as an “important milestone”
to realize the potential of bacterial GWAS (Falush, 2016). The approach suggested by
Earle et al. allows controlling the bacterial population structure taking into account the

Theoretical background
30
signal of associations at lineage level in case of strong LD, lack of homoplasy and
strong population structure. This LMM-based approach can manage samples that have
a close relatedness by gathering precisely the fine structure of populations. This work
successfully proved the ability to find causal variants by controlling divergent ancestry
or a close relatedness without losing statistical power (Earle et al., 2016).
Since then, a number of tools have been developed that permit the user to find variants
on different genetic levels associated with either discrete (e.g. resistant/sensitive) or
continuous phenotypes (e.g. maximal growth rate). Table 5 is giving an overview of
bioinformatics tools available to conduct GWAS.
Table 5 : Bioinformatics tools for GWAS.
Names Genome level Location Phenotype Approach Publication
Roary/Scoary Genes Accessory Discrete Accounting for population stratification
(Brynildsrud et al., 2016; Page et al., 2015)
Piggy/Scoary Intergenic regions Pan-genome Discrete (Brynildsrud et al., 2016; Thorpe, Bayliss, Sheppard, et al., 2017)
DBGWAS Unitigs Pan-Genome Discrete LMM (Bugwas from Earle et al., 2016)
(Jaillard et al., 2018)
treeWAS SNPs and Genes Pan-Genome Discrete and continuous
Phylogenomic tree based
(Collins and Didelot, 2018)
Neptune k-mers Pan-Genome Discrete (Marinier et al., 2017)
SEER/pySEER k-mers/unitigs Pan-Genome Discrete Correction for clonal population structure
(Lees et al., 2018)
Kover k-mers Pan-Genome Discrete No correction for population structure
(Drouin et al., 2016)
Earle pipeline SNP, k-mers, Core-Genome Pan-genome
Discrete LMM (Earle et al., 2016)
Bacterial GWAS have the potential to expand our knowledge and help in explaining
complex bacterial responses to environmental factors as well as finding biomarkers to
predict phenotypic behaviors. This opens new doors for applications related to public
health and food safety management. Biomarkers could refine the hazard identification
(virulence or persistence markers), predictive microbiology when thermal processes
are modeled (heat resistance markers), source attribution and quantitative microbial
risk assessment (QMRA) (Franz et al., 2016; Jagadeesan et al., 2018). Franz et
al. (2016) mention that in the next future risk assessment models could be fed with
genomic biomarkers to conduct studies more targeted to high-risk subpopulations
(Franz et al., 2016).

Theoretical background
31
4 Quantitative microbial risk assessment
Quantitative microbial risk assessment (QMRA) is defined as “a systematic process for
identifying adverse consequences and their associated probabilities arising from
consumption of foods that may be contaminated with microbial pathogens and/or
microbial toxin“ (Lammerding and Fazil, 2000). QMRA largely used by public health
authorities to manage food safety risks and for decision-making regarding public
health. Usually, the outcome of the models are the probabilities of illness per serving.
However, it is often of interest to gain information along the different steps in the food
supply chain (from farm to fork) to identify the individual stages where risk might be
increased. At the same time, the model can be used to predict the effects of proposed
intervention scenarios (Nauta, 2002). The process of QMRA modelling is illustrated in
Figure 8.
Figure 8 : The risk analysis process and the positioning of QMRA modelling process (Haberbeck et al., 2018).
Before the setting up of a QMRA, it is necessary to have a well-defined question. The
QMRA process is often quite complex and requires a high amount of knowledge and
data for the mathematical analyses.

Theoretical background
32
QMRA models are based on four cornerstones: Hazard identification, exposure
assessment, hazard characterization and risk characterization (Lammerding and Fazil,
2000).
4.1 Hazard identification
Hazard identification is defined as “the identification of biological, chemical and
physical agents capable of causing adverse health effects and which may be present
in a particular food or group of foods” (FAO/WHO, 2016) It represents the first step in
microbial risk assessment. In the case of microbial risk assessment, the hazard is
usually known i.e. the pathogen or toxin causing human illness (Lammerding and Fazil,
2000; Nauta, 2002).
4.2 Exposure assessment
According to the Food and Agriculture Organization (FAO) and the World Health
Organization (WHO), exposure assessment is “the qualitative and/or quantitative
evaluation of the likely intake of biological, chemical, and physical agents via food as
well as exposures from other sources if relevant” (FAO/WHO, 2016).
In microbial exposure assessment, the aim is to estimate how likely is the exposure to
a microbial hazard and about the number of microorganisms that will likely be ingested
(Lammerding and Fazil, 2000). In this step, all factors and parameters affecting the
number of pathogens during the analyzed food chain should be identified and
considered (Figure 9).

Theoretical background
33
Quantitative data of contamination levels in food at the time of consumption are rarely
available. Models and assumptions based on available data are used to translate
qualitative into quantitative estimates. A particular concern about microbial exposure
assessment is the dynamic character of the hazard due to the ability of microorganisms
to grow or to be inactivated during the food chain (from farm-to-fork). Sources of
information to feed the model can be published articles, expert opinions, survey
outputs for consumers’ behavior and preferences as well as every information on the
processing steps, preparation practices and environmental conditions (e.g.
temperature, time, pH, etc.).
4.2.1 Predictive microbiology
Predictive microbiology is the area of food microbiology aiming to assess the impact of
different environmental conditions (e.g. temperature, pH, substrate concentrations,
inhibitors, etc.) and their possible interactions related to growth, inactivation or survival
of microorganisms (Buchanan, 1993). Providing that the response of the
microorganisms is reproducible in a defined environment, it is possible, after the
characterization of the environment and based on prior observations, to predict the
behavior of these microorganisms. This behavior cannot only be simulated in food, but
also along the food chain from farm to fork.
In predictive microbiology, as in any field related to modelling, the collection of good
quality data is an essential element both for the selection of a model and for the
Figure 9 : Factors and parameters that should be considered in QMRA.

Theoretical background
34
estimation of its parameters. The experimental design of a predictive model will depend
mainly on its final application.
The microbial behavior can be studied directly in food or in media. Traditionally, when
comparing the model's predictions based on culture media data with food data, the
growth observed in culture media is much faster than that observed in food (Pin et al.,
1999). Several factors are attributable: the matrix of the food, the presence of flora
indigenous to the food or additional environmental factors present in the food and not
included in the culture medium. Nutrients such as metabolites can broadly diffuse in
the culture medium, and thus the environment can be considered globally uniform. On
the other hand, food is generally not homogeneous (Wilson et al., 2002). The structure
of food creates local physical or chemical conditions that can affect the growth of
microorganisms. The mobility of bacteria in food is also severely restricted, and growth
is mainly expressed in microcolonies (Skandamis and Jeanson, 2015). Several studies
have shown that bacteria forced to develop as colonies have a slower rate of growth,
different metabolic activity or modified maximum growth levels compared to planktonic
cells (Koutsoumanis et al., 2004; Malakar et al., 2003; Stecchini et al., 1998). However,
experiments based on food matrices are more expensive and more difficult to realize.
This explains why most models are culture media-based. Methods used to monitor the
evolution of microbial density are presented in Table 6.

Theoretical background
35
Table 6 : Methods to monitor the evolution of bacterial density.
Method Principle Pros Cons
CFU Counting cells capable of forming colonies on
agar media
-Liquid and solid media
(agar or food media)
-A cluster of cells deposited on the culture medium will result in
a single colony, preventing the estimation of the actual number
of individual cells actually present in the medium
-Long waiting times to allow bacterial growth in culture media
(24 to 48 hours).
-The uncertainty of bacterial enumerations is about
0.5 log10 CFU
Optical
density
Absorbance measurement
(or turbidity or optical density)
-Automated (Bioscreen)
-Conditions
-The detection limit (greater than or equal to 106 ml – 1 cells)
-Planktonic cells
-Indirect
Microscopy Surface inoculated with the microorganism of
interest deposited on a thin layer of agar or on a
microscope slide placed in a measuring chamber
-Solid media
-Single cell
-Direct
-relatively heavy to implement
-Low throughput
-Agar
Bio-
chemical
Based on the measurement of impedance, or
conductance, CO2, etc.
The time when a significant change in properties
in the growth medium is detected is used.
-Automated
-Conditions
-LOD
-Planktonic cells
-Indirect
Flow
cytometry
Based on the marking of cells in suspension with
fluorochromes and on the passage of these cells
through a microcapillary equipped with an
electronic detection device.
-Speed -Only broth
qPCR* Estimation of absolute initial copy number of the
DNA template
-Speed and sensitivity -LOD
-Difficult in solid
*quantitative polymerase chain reaction

Theoretical background
36
4.2.2 Single cell heterogeneity
Most of the deterministic models rely on describing the behavior of microbial
populations as a whole, without taking account the single-cell heterogeneity. Several
studies have shown that the inoculation size is affecting the variability of growth
(Baranyi, 1998; Métris et al., 2003; Robinson et al., 2001) and inactivation (Aspridou
and Koutsoumanis, 2015). Since most of the initial bacterial contaminations have a low
level in food, taking into account the single-cell behavior is essential for realistic
estimations of food safety risks (Ross and McMeekin, 2003).
The work of Koutsoumanis and Lianou highlights the high variability in division and
growth of single-cells compared to bacterial populations of Salmonella enterica ser.
Typhimurium. Figure 10 shows the Monte Carlo simulation by considering single-cell
behavior (a) or simulating population growth (Koutsoumanis and Lianou, 2013). The
authors pointed out that for bacterial populations with N0 > 100 cells the variability is
almost eliminated and that the variability is increasing with decreasing the initial level
of cells.
Guillier also demonstrated similar results for L. monocytogenes (Guillier, 2005). He
simulated the growth of L. monocytogenes in cold-smoked salmon at 8°C with different
inoculation level. An increased variability of lag time was observed in the case of the
low contaminated cold-smoked salmon packages (Figure 11a) compared to the higher
contaminated ones (Figure 11b).
Figure 10 : Prediction of Salmonella enterica ser. Typhimurium growth based on the stochastic model for (a) initial level of 1 cell, and (b) initial level of 100 cells. Adapted from (Koutsoumanis and Lianou, 2013) (Copyright © American Society for Microbiology).

Theoretical background
37
Figure 11 : Growth simulation of stressed L. monocytogenes cells in cold-smoked salmon at 8 °C with an inoculum size of 3 cells (a) and 90 cells (b) (Guillier, 2005).
4.2.3 Physiological state
Bacterial adaption is the product of the gene expression and/or activation of enzyme
systems as a response to changes in their environment. Therefore, environmental
conditions impact on the microbial physiological state. Figure 12 illustrates the
physiological states of cells during stress impact.
The innermost zone presents the stress range where cells will grow at a finite rate. The
central or “survival” zone indicates no cells’ growth and slow death while the outer zone
is characterized by high cells’ death rates. Noteworthy, all three zones represent
numerous cells’ states and their sizes depend on the success of adaption and the
bacterial intrinsic sensitivity (Booth, 2002).
Figure 12 : The comfort zone. For any stress, the bacterial cell has a defined range within which the rate of increase of CFU is positive (growth), zero (survival) or negative (death) (Booth, 2002).

Theoretical background
38
The validity of a mathematical model in predicting the conditions that lead
L. monocytogenes physiology to critical levels in foods highly depends on its ability to
describe the effect of the environment on lag time and growth probability. These
parameters are depending on stresses the bacteria were exposed to. In the food
industry environment and during food processing (including heating, freezing,
exposure to acids and high osmotic pressures), cells L. monocytogenes are highly
exposed to stresses. Predictive models should thus be revised by considering injuries
encountered by cells before they contaminate food (Guillier and Augustin, 2006). The
physiological state is an important parameter to quantify the impact of stress on the
bacterial cells. Indeed, the physiological state of the cells, induced by their history,
plays a role in the maintenance or survival of the cells in a stressful environment. The
physiological state can be determined using several parameters depending upon the
ability of cells to multiply. Two important parameters for L. monocytogenes physiology
are the distribution of cellular lag times and the probabilities of growth.
When the L. monocytogenes cells are exposed to environmental stress, they can be
directly adapted to the food or need to do important work (e.g. metabolic adaptations,
repair of cellular damage) before they start to divide (lag time) or are no longer able to
divide (growth probability). Different studies focused on the exposure of bacterial
populations including L. monocytogenes to sub-lethal injuries (Elfwing et al., 2004;
Guillier et al., 2005; Kutalik et al., 2005). They demonstrated that the individual cell lag
times were extended with increasing prior stress, and also the variability of individual
lag times increased when cells were damaged. Nevertheless, the injury of cells can
also inhibit the initiation of the growth of some cells within a population (Wu et al.,
2000). This fraction can be characterized by the growth probability, as the probability
for a single cell to initiate growth in given conditions shown by Dupont and Augustin
(Dupont and Augustin, 2009). Other studies also indicated the possibility that the
minimal values of environmental factors to promote multiplication can vary from one
bacterial cell to another. For instance, Pascual et al. (2001) focused on the effect of
NaCl concentration in the growth medium (Pascual et al., 2001). Increasing the NaCl
concentration, an increased inoculum size needed to initiate growth. Similar
observations were also reported by Koutsoumanis and Sofos (2005) in their growth
boundaries experiments testing temperature, pH, and water activity (aw)
(Koutsoumanis et al., 2004). Some years later, Augustin and Czarnecka-Kwasiborski

Theoretical background
39
(2012) characterized the single-cell growth probability of L. monocytogenes regarding
temperature, pH and aw. This work delivers models on the possibility to predict grow
probability in low contaminated chilled food (Augustin and Czarnecka-Kwasiborski,
2012).
Figure 13 clearly shows the impact of the growth probability to the outcome of
predictive models and thus exposure assessment. Koutsoumanis and Lianou included
the growth probability in their stochastic model (Koutsoumanis and Lianou, 2013). The
presence of a non-growing fraction within the bacterial population is therefore taken
into account. When only 10 cells out of 100 (red points) were able to grow, it led to an
apparent longer lag time and an enlarged variability in the population growth.
Figure 13 : Comparison of the stochastic growth of two microbial populations with N0 of 100 cells and probability of growth of the individual cells (Pg) equal to 1.0 (all 100 cells are able to grow) and 0.1 (about 10 of 100 cells are able to grow). Growth is predicted by the stochastic model using Monte Carlo simulation with 10,000 iterations and a uniform distribution for time (Koutsoumanis and Lianou, 2013)

Theoretical background
40
4.3 Hazard characterization
To estimate the adverse health effects of foodborne pathogen infections (e.g.
listeriosis), dose-response models are used in QMRA. These dose-response
relationships are highly important for hazard characterization. Obtaining data to
establish these models is pretty hard, so they are built on several assumptions that
increase the variability (Chen et al., 2003). Due to the long incubation time of listeriosis,
gaining adequate quantitative data associated with outbreaks or sporadic cases to
improve these models is rare (Pouillot et al., 2015). That is why most of these models
are based on animal models (Buchanan et al., 1997; Haas et al., 1999).
The exponential dose‐response model is a “single‐hit” model. Here, the probability of
a given cell causing an adverse effect is an independent parameter, it is thus sufficient
to cause illness with a probability superior zero. The parameter corresponding to the
probability of a single cell causing illness is called r (Pouillot et al., 2015).
Differences in host susceptibility are another issue of dose-response models. This
variable is considered by using subgroups of populations with associated dose-
responses. Especially, elderly persons (> 65 years old), pregnant women and
immunosuppressed individuals are highly susceptible as hosts.
Besides the variability in the population, strain variability regarding virulence is also
affecting the dose-response estimations. For instance, Chen and colleagues explored
the use of dose-response models in relation to L. monocytogenes genetic lineages to
enable optimized risk attribution of specific subtypes (Chen et al., 2006). They
assumed that L. monocytogenes subtypes of lineage I have a higher probability to
cause human illness than those of lineage II, which are more often found in foods
indeed. In addition, Pouillot and colleagues proposed an adjustment of the dose-
response model by taking into account the variability of strains’ virulence and host
susceptibility (Pouillot et al., 2015). For refinement of the prior model, they introduced
eleven population subgroups. The distribution of r value includes in their model the
individual within-group as also the strain variability.
Today, the progress of the WGS is expected to improve hazard characterization.
Pielaat and co-workers published a first and promising approach based on GWAS to
show the utility of genetic data to refine QMRA, especially hazard characterization.
They associated SNPs in the genome of Shiga toxin-producing Escherichia coli

Theoretical background
41
(STEC) O157 strains with the in vitro ability to adhere to epithelial cells as a proxy for
virulence (Pielaat et al., 2015). Similar approaches will help to better describe and
characterize also L. monocytogenes virulence variability. A different approach has
been shown by Maury et al. who used epidemiological data to identify the level of
virulence of L. monocytogenes CCs. Following, they tested several CCs in a
humanized mouse model to investigate further and to confirm the results obtained by
epidemiological data (Maury et al., 2016).
4.4 Risk characterization
The final step of the QMRA is the risk characterization. At this stage, exposure
assessment and hazard characterization are finally combined. More precisely, the
output of the expose model is used as input for the dose-response assessment. In risk
characterization “the likelihood that the population will suffer adverse effects as a result
of the hazard” is calculated (Buchanan et al., 2000). For the interpretation of the results,
the variability and uncertainty of the outcome have to be taken into account as both
are sources of variation. Uncertainty is referred to a lack of knowledge of the used
parameter values and can be reduced by further measurements or by using more
accurate methods (Buchanan et al., 2000; Nauta, 2000). On the other hand, variability
represents a true heterogeneity. Especially, all biological parts of the assessment are
highly variable.
As mentioned before, the development in WGS has the ability to improve QMRA
models and to reduce their variability, not only for hazard characterization. For
instance, the life Science Institute (ILSI) published four articles showing up the future
application possibilities of omics data in risk assessment (Cocolin, Mataragas, et al.,
2018; den Besten et al., 2017; Haddad et al., 2018; Rantsiou et al., 2018).

Objectives
42
Objectives
As described in the scientific literature review, the recent development in WGS opens
new opportunities for QMRA. Nevertheless, classical microbiological methods remain
essential to describe single-cell behavior in exposure assessment.
The global aim of this thesis is therefore to gain further insight on the
L. monocytogenes’ variability associated with cold adaptation using genomic data and
at the single-cell level. As mentioned in paragraph 3.3, bacterial GWAS are mainly
focusing on clinical phenotypes such as virulence or antibiotic resistance. However,
the characterization of the L. monocytogenes strain growth variability in relation to food
environmental stresses such as the low temperatures during the cold chain is also
crucial for the improvement of QMRA models. The discovery of genetic variants
associated with cold adaptation will improve exposure assessment estimates and thus
the risk characterization for L. monocytogenes.
Besides the refinement of QMRA models through genomic data, the description of
single-cell behavior can also be used to improve exposure assessment, as mentioned
in paragraph 4.2. In this perspective, the development of laboratory methods, which
perform even testing bacterial isolates in harsh conditions with high throughput and
short experiment duration, is needed.
Figure 14 shows the classical QMRA approach with its variabilities at different steps.
The lower part of the figure highlights in which parts the objectives achieved in this
thesis work will help to improve QMRA and to overcome different sources of
L. monocytogenes variability.

Objectives
43
Figure 14 : Overview of QMRA and the different objectives and chapters of the thesis.
The thesis is divided into three parts:
i) Evaluation of the GWAS contribution to study the physiology of food
pathogens with particular focus to the cold adaptation of a major pathogen:
L. monocytogenes
A collection of L. monocytogenes strains representing several CCs collected from food
and food processing environments were sequenced for this study. Different
bioinformatics analyses were conducted to assess the association between genetic
variants and L. monocytogenes strains’ ability for cold adaptation. Therefore, the
phenotypic behavior was studied at 2 °C to divide the strains clearly according to their
growth abilities in case and control groups.
ii) Evaluation of the contribution of WGS based characterization of strains in
QMRA models and the impact on their accuracy
In this work, the outcome of association studies is integrated into a QMRA model to
optimize the risk characterization. A specific focus was given on cold growth during the

Objectives
44
food chain and virulence factors. For that purpose, the QMRA model of cold-smoked
salmon and L. monocytogenes published by Pouillot et al. (Pouillot et al., 2009; Pouillot
et al., 2007) was used. This model was chosen because all necessary data (e.g.
representative prevalence data of cold-smoked salmon) are available to conduct that
study with a genomic approach.
iii) Characterization of the variability at intraspecific and cellular level regarding
the growth initiation of L. monocytogenes at low temperature by the
development of a direct microscopy approach
To improve the throughput of data collection at the single-cell level, an innovative
method based on the use of direct cell observation with phase-contrast time-lapse
microscopy (equipped with a 100× objective and a high-resolution device camera) was
developed. This device was herein used to study the growth initiation and the lag phase
of individual L. monocytogenes cells deposited on microscopic slides covered by agar.
Automation of image acquisition on a large surface was used to reach a high-
throughput.
Through the selected method, the single-cell growth probabilities and lag times at low
temperatures (i.e. 4 °C) were characterized.
Chapter 1
45
Chapter 1
Insights from genome-wide approaches to identify variants associated to
phenotypes at pan-genome scale: Application to Listeria monocytogenes’ ability
to grow in cold conditions
Authors:
Lena Fritsch1, Arnaud Felten1, Federica Palma1, Jean-François Mariet1, Nicolas
Radomski1, Michel-Yves Mistou1, Jean-Christophe Augustin1,2, Laurent Guillier1*
Affiliation:
1 French Agency for Food, Environmental and Occupational Health & Safety (Anses), Laboratory for
Food Safety, Université Paris-Est, Maisons-Alfort F-94701, France
2 Ecole Nationale Vétérinaire d'Alfort, Maisons-Alfort F-94704, France.
Keywords: whole genome sequencing, genome wide association study, cold stress
Published in the International Journal of Food Microbiology, Volume 291,
February 2019, Pages 181-188.
Chapter 1
46
Résumé
La variabilité intraspécifique du comportement de la plupart des pathogènes d'origine
alimentaire est bien décrite et prise en compte dans l'appréciation quantitative des
risques microbiens (AQRM), mais la prise en compte des facteurs (origine de la
souche, sérotype, etc.) expliquant ces différences sont rares ou contradictoires entre
les études. De nos jours, le séquençage du génome entier (WGS) offre de nouvelles
possibilités d'expliquer la variabilité intraspécifique des pathogènes alimentaires, à
partir de divers outils bio-informatiques récemment publiés.
L'objectif de cette étude est de décrire les différentes approches bio-informatiques
existantes pour associer phénotype(s) et génotype(s) bactérien(s). Par conséquent,
un ensemble de données de 51 souches de L. monocytogenes, isolées à partir de
sources multiples (de différentes matrices alimentaires et d‘environnements de
production) et appartenant à 17 complexes clonaux (CC), a été sélectionné pour
représenter une grande diversité de population. De plus, la variabilité phénotypique de
la croissance à basse température a été déterminée (phénotype qualitatif : souche
« lente » ou souche « rapide »), et les génomes des souches sélectionnées ont été
séquencés. Le pangenome, ainsi que la reconstruction phylogénétique basée sur les
SNPs du génome de base (ou « core genome »), ont été établis à partir des génomes
séquencés. Une méthode d'inférence bayésienne a d’abord été appliquée pour
identifier les branches sur lesquelles la distribution des phénotypes « lent » et
« rapide » évoluait significativement. Deux études d'association à l'échelle
pangénomique (c.-à-d. GWAS) sur la base de la présence/absence de gènes et sur la
base de SNP) ont été réalisées indépendamment afin de relier les mutations
génétiques au phénotype qui nous intéresse.
Les analyses génomiques présentées dans cette étude ont été appliquées avec
succès à l'ensemble de données sélectionné. L'approche phylogénétique bayésienne
a mis en évidence une association avec une capacité de croissance "lente" à 2 °C de
la lignée I, ainsi qu'avec CC9 de la lignée II. De plus, les deux approches GWAS ont
montré des associations statistiques significatives avec le phénotype testé. Une liste
de 114 gènes du génome accessoire (incluant des gènes déjà connus pour leur
implication dans le mécanisme d'adaptation au froid et des gènes associés à des
éléments génétiques mobiles) ont été identifiés. D'autre part, un groupe de 184 SNP

Chapter 1
47
hautement associés (avec des valeurs de p<0.01) ont été mis en évidence par le SNP-
GWAS (comprenant des SNP dans des gènes qui déjà connus dans l'adaptation au
froid, des protéines hypothétiques et des régions intergéniques où par exemple des
promoteurs et régulateurs peuvent être situés.
L'application réussie d'approches bioinformatiques combinant des génotypes WGS et
des phénotypes spécifiques, pourrait contribuer à améliorer la prédiction des
comportements microbiens dans les aliments. La mise en œuvre de ces informations
dans les processus d'identification des dangers et d'évaluation de l'exposition ouvrira
de nouvelles possibilités pour alimenter les modèles d'AQRM.

Chapter 1
48
Abstract
Intraspecific variability of the behavior of most foodborne pathogens is well described
and taken into account in Quantitative Microbial Risk Assessment (QMRA), but factors
(strain origin, serotype, …) explaining these differences are scarce or contradictory
between studies. Nowadays, Whole Genome Sequencing (WGS) offers new
opportunities to explain intraspecific variability of food pathogens, based on various
recently published bioinformatics tools.
The objective of this study is to get a better insight into different existing bioinformatics
approaches to associate bacterial phenotype(s) and genotype(s). Therefore, a dataset
of 51 L. monocytogenes strains, isolated from multiple sources (i.e. different food
matrices and environments) and belonging to 17 clonal complexes (CC), were selected
to represent large population diversity. Furthermore, the phenotypic variability of
growth at low temperature was determined (i.e. qualitative phenotype), and the whole
genomes of selected strains were sequenced. The almost exhaustive gene content,
as well as the core genome SNPs based phylogenetic reconstruction, were derived
from the whole sequenced genomes. A Bayesian inference method was applied to
identify the branches on which the phenotype distribution evolves within sub-lineages.
Two different Genome Wide Association Studies (i.e. gene- and SNP-based GWAS)
were independently performed in order to link genetic mutations to the phenotype of
interest.
The genomic analyses presented in this study were successfully applied on the
selected dataset. The Bayesian phylogenetic approach emphasized an association
with “slow” growth ability at 2 °C of the lineage I, as well as CC9 of the lineage II.
Moreover, both gene- and SNP-GWAS approaches displayed significant statistical
associations with the tested phenotype. A list of 114 significantly associated genes,
including genes already known to be involved in the cold adaption mechanism of
L. monocytogenes and genes associated to mobile genetic elements (MGE), resulted
from the gene-GWAS. On the other hand, a group of 184 highly associated SNPs were
highlighted by SNP-GWAS, including SNPs detected in genes which were already
likely involved in cold adaption; hypothetical proteins; and intergenic regions where for
example promotors and regulators can be located.

Chapter 1
49
The successful application of combined bioinformatics approaches associating WGS-
genotypes and specific phenotypes, could contribute to improve prediction of microbial
behaviors in food. The implementation of this information in hazard identification and
exposure assessment processes will open new possibilities to feed QMRA-models.

Chapter 1
50
1 Introduction
1.1 French introduction
Dans le domaine de la microbiologie alimentaire, la variabilité des souches
phénotypiques est un phénomène bien connu (Koutsoumanis et Lianou, 2013). Lors
de l'étude du comportement des pathogènes bactériens dans les aliments, il est assez
courant d'inclure de plusieurs à de grandes collections de souches (Haberbeck et al.,
2015 ; Van Der Veen et al., 2008). En ce qui concerne les principaux pathogènes
d'origine alimentaire, certaines divergences significatives ont été mises en évidence
lors de l'observation et de la modélisation du comportement de la souche. Par
exemple, Aryani et ses collaborateurs (2015) ont étudié la variabilité de croissance de
20 souches de Listeria monocytogenes dans différentes conditions de pH, d'activité
dans l'eau (aw), de concentration en NaCl, de concentration en acide lactique non
dissocié et de température (Aryani et al., 2015). La variabilité a été quantifiée à l'aide
des paramètres du modèle comme étant la température de croissance minimale, Tmin
(°C), avec des valeurs allant de -3,3 °C à -1,1 °C. En ce qui concerne Bacillus cereus,
de grandes différences pour les paramètres de croissance cardinaux, y compris les
températures de croissance minimale, optimale et maximale, ont également été
décrites en observant le paramètre Topt (°C) de 31,0 °C à 43,1 °C pour les 12 souches
étudiées (Carlin et al., 2013). Haberbeck et ses collaborateurs (2015) ont étudié la
variation des limites de croissance/absence de croissance de 188 souches
d'Escherichia coli dont le pH minimal de croissance varie entre 3,8 et 4,3 selon les
souches testées (Haberbeck et collaborateurs, 2015). L'inclusion de plusieurs souches
est également fréquente dans l'étude d'autres phénotypes qui ne sont pas liés à la
modélisation prédictive. De nombreux autres exemples concernent l'adhérence
bactérienne ou la formation de biofilms (Lianou et Koutsoumanis, 2012 ; Piercey et al.,
2017), la capacité à survivre à un stress (Zoz et al., 2017) ou un phénotype plus lâche,
comme la capacité à persister en milieu agroalimentaire (Nowak et al., 2017).
La description de la variabilité de la souche peut suffire à elle seule à identifier la
mesure de contrôle appropriée qui devrait être appliquée pour garantir la sécurité
sanitaire des aliments. Dans une telle situation, la souche ayant la plus grande
capacité de survie/croissance est la souche de référence de référence. Cependant, la
caractérisation de la variabilité phénotypique est habituellement suivie d'études
d'associations statistiques sur les données qualitatives caractérisant les souches et

Chapter 1
51
les différences phénotypiques observées. Selon l'agent pathogène, plusieurs facteurs
d'intérêt peuvent expliquer la variabilité observée. Elles reposent généralement sur
l'origine d'isolement de la souche, sur certaines caractéristiques de sous-typage (c'est-
à-dire le sérotype) ou même sur la présence ou l'absence de marqueurs (Carlin et al.,
2013 ; Shabala et al., 2008 ; Van Der Veen et al., 2008). Par exemple, Carlin et ses
collaborateurs (2013) ont démontré une corrélation claire entre les différents groupes
phylogénétiques de B. cereus et l'adaptation à la température, au pH et à aw. Par
contre, d'autres études axées sur la variabilité phénotypique de la souche n'ont pas
réussi à déceler des associations entre des facteurs comme le sérotype ou l'origine de
la souche (Shabala et al., 2008 ; Van Der Veen et al., 2008).
Ces exemples démontrent qu'il existe un besoin de nouvelles approches analytiques
afin d'identifier les marqueurs génétiques prédictifs des comportements bactériens.
Grâce à l'expansion des technologies WGS, ainsi qu'au développement récent d'outils
bioinformatiques open source associant mutations et phénotypes bactériens, il est
désormais possible de détecter des éléments génétiques impliqués dans des
phénotypes binaires ou continus donnés (Lees et Bentley, 2016 ; Power et al., 2017).
Presque toutes les informations sur les comportements phénotypiques sont codées
dans l'ADN microbien (Chen et Shapiro, 2015). Des études d'association entre cette
information génétique et les caractères phénotypiques d'intérêt peuvent être réalisées
à différents niveaux d'éléments génétiques, comme la présence ou l'absence de gènes
spécifiques (Brynildsrud et al., 2016), k-mers (Earle et al., 2016 ; Lees et al., 2016 ;
Marinier et al., 2017) ou polymorphismes nucléotides simples (SNPs) (Collins et
Didelot, 2018 ; Earle et al., 2016).
Des études d'association à l'échelle du génome (GWAS) ont été récemment mises au
point et appliquées sur les génomes bactériens, principalement axées sur des
phénotypes cliniquement pertinents comme la virulence (Buchanan et al., 2017 ;
Laabei et al., 2014 ; Pielaat et al., 2015) et la résistance aux antibiotiques (Earle et al.,
2016 ; Salipante et al., 2015). notre connaissance, un nombre limité de GWAS
(Hingston, Chen, Dhillon et al., 2017 ; Pielaat et al., 2015) ont évalué de nouvelles
associations de phénotypes pertinentes pour l'industrie et/ou utiles pour les études
d'évaluation des risques.

Chapter 1
52
Même si l'association bactérienne GWAS vise à atténuer les effets préjudiciables de
la structure des populations, les méthodes explorant la relation entre génotypes et
phénotypes peuvent reposer sur la reconstruction phylogénétique. La relation entre un
génotype et un phénotype peut en effet être étudiée en observant comment le
phénotype est distribué en fonction des valeurs génotypiques (Ansari et Didelot, 2016).
L'application réussie des méthodes basées sur les GWAS et la phylogénie a été
largement prouvée pour les phénotypes d'importance clinique (c'est-à-dire la
résistance aux antibiotiques ou la virulence). Jusqu'à présent, l'application de ces
méthodes pour étudier les phénotypes présentant un intérêt pour la microbiologie
alimentaire est encore limitée. L'objectif de cet article est donc de présenter et
d'évaluer la capacité des différentes approches à identifier les marqueurs génétiques
associés à un phénotype d'intérêt afin de prédire le comportement bactérien des
aliments. Ces méthodes ont été appliquées à un ensemble de données sélectionnées
de souches de L. monocytogenes nouvellement séquencées avec des phénotypes
bien caractérisés à basse température.

Chapter 1
53
1.2 English introduction
In the field of food microbiology, phenotypic strain variability is a well-known
phenomenon (Koutsoumanis and Lianou, 2013). While studying the behavior of
bacterial pathogens in food, it is quite common to include from several to large
collection of strains (Haberbeck et al., 2015; Van Der Veen et al., 2008). Concerning
the main foodborne pathogens, some significant discrepancies have been enlightened
while observing and modelling the strain behaviour. For instance, Aryani et al. (2015)
studied the growth variability of 20 Listeria monocytogenes strains in different
conditions of pH, water activity (aw), NaCl concentration, undissociated lactic acid
concentration and temperature (Aryani et al., 2015). The variability was quantified
through model parameters as minimal growth temperature, Tmin (°C), with values
ranging from −3.3 °C to −1.1 °C. With regard to Bacillus cereus, large differences for
cardinal growth parameters, including minimal, optimal and maximal growth
temperatures, were also described observing the parameter Topt (°C) from 31.0 °C to
43.1 °C for the 12 studied strains (Carlin et al., 2013). Haberbeck et al. (2015)
investigated the variation in growth/no growth boundaries of 188 Escherichia coli
strains with a range of minimal pH for growth varying between 3.8 and 4.3 according
to the tested strains (Haberbeck et al., 2015). The inclusion of several strains is also
common when studying other phenotypes which are not related to predictive
modelling. Numerous other examples can be found concerning the bacterial adhesion
or biofilm formation (Lianou and Koutsoumanis, 2012; Piercey et al., 2017), ability to
survive to a stress (Zoz et al., 2017) or more loosely defined phenotype, such as the
ability to persist in food processing environment (Nowak et al., 2017).
The description of strain variability can by itself be sufficient to identify the appropriate
control measure that should be applied to guarantee food safety. In such a situation,
the strain with higher ability to survive/grow is the benchmark reference strain.
However, characterization of phenotypic variability is usually followed by statistical
association studies on qualitative data characterizing the strains and the observed
phenotypic differences. According to the pathogen, several factors of interest may
explain the observed variability. They usually rely on the isolation origin of the strain,
on some sub-typing characteristics (i.e. serotype) or even on any relevant
presence/absence of markers (Carlin et al., 2013; Shabala et al., 2008; Van Der Veen
et al., 2008). For example, Carlin et al. (2013) demonstrated a clear correlation

Chapter 1
54
between different phylogenetic groups of B. cereus and the adaptation to temperature,
pH and aw. In contrast, other studies focusing on phenotypic strain variability failed to
detect associations between factors as the strain serotype or origin (Shabala et al.,
2008; Van Der Veen et al., 2008). These examples demonstrate that there is a need
of new analytical approaches in order to identify genetic markers predicting bacterial
behaviors. Based on the expansion of WGS technologies, as well as the recent
development of open source bioinformatics tools associating mutations and bacterial
phenotypes, it is now possible to detect genetic elements involved in given binary or
continuous phenotypes (Lees and Bentley, 2016; Power et al., 2017).
Almost all information about the phenotypic behaviors is encoded in the microbial DNA
(Chen and Shapiro, 2015). Association studies between this genetic information and
phenotypic traits of interest can be performed at different levels of genetic elements,
such as the presence/absence of specific genes (Brynildsrud et al., 2016), k-mers
(Earle et al., 2016; Lees et al., 2016; Marinier et al., 2017) or single nucleotide
polymorphisms (SNPs) (Collins and Didelot, 2018; Earle et al., 2016). Genome Wide
Association Studies (GWAS) have been recently developed and applied on bacterial
genomes, mainly focusing on clinically relevant phenotypes such as virulence
(Buchanan, Webb, et al., 2017; Laabei et al., 2014; Pielaat et al., 2015) and antibiotic
resistance (Earle et al., 2016; Salipante et al., 2015). Up to our knowledge, a limited
number of GWAS (Hingston et al., 2017; Pielaat et al., 2015) assessed de novo
associations of phenotypes relevant to industry and/or useful for risk assessment
studies. Even if bacterial GWAS aims to mitigate the prejudicial effects of population
structure, methods exploring the relationship between genotypes and phenotypes may
rely on phylogenetic reconstruction. The relationship between a genotype and a
phenotype can indeed be investigated by observing how the phenotype is distributed
according to genotypic values (Ansari and Didelot, 2016).
The successful application of GWAS and phylogeny-based methods has been
extensively proven for phenotypes with clinical importance (i.e. antibiotic resistance or
virulence). So far, the application of these methods for investigating phenotypes of
interest for food microbiology is still limited. Therefore, the objective of this article is to
present and to assess the ability of different approaches to identify genetic markers
associated to a phenotype of interest in order to predict the bacterial behavior in foods.

Chapter 1
55
These methods were applied to a selected dataset of newly sequenced
L. monocytogenes strains with well-characterized phenotypes at low temperature.

Chapter 1
56
2 Materials and methods
2.1 Strains
From the Anses collection stored at −80 °C, a set of 51 L. monocytogenes strains was
constituted in order to achieve large population diversity in terms of genotypes (i.e. CC-
types) and food-related origins (i.e. meat products, dairy, seafood and environment).
The lineages, clonal complexes (CC) based on 7 loci MLST (Ragon et al., 2008), as
well as the strain origin are detailed in Supplementary material 1.
2.2 Whole genome sequencing
Firstly, cryo bead-based strains were inoculated onto tryptone soya agar (TSA, AES
Chemunex, Bruz, France) and incubated for 24h at 37 °C to check isolates purity. A
single colony of each strain isolated on TSA was picked to inoculate different brain
heart infusion broth (BHI, Oxoid, Dardilly, France) tubes (10 ml) incubated overnight
(12-18 h) at 37 °C. The Wizard® Genomic DNA Purification Kit (Promega, France) was
used in order to isolate genomic DNA. Nanodrop® Spectrophotometer and Qbit®
fluorimeter were used to assess the quantity of the extracted DNA. Global integrity of
DNA (200 ng) was assessed via horizontal agarose electrophoresis (Seakem GTG
Agarose gel at 0.8 % migration 3 h with an electrical field at 120V/105mA in TBE 1X
gel) as a quality control measure. Paired-end sequencing (i.e. 2 x 150 bp) were
performed by the ‘Institut du Cerveau et de la Moëlle’ (ICM, France) using TruSeq
automated library preparation (Illumina) and Nextseq500 sequencing system
(Illumina). The paired-end reads, isolates information and genome assemblies are
available under the PRJEB24673 (ERP106517) ENA bio-project.
2.3 Phenotyping in cold conditions
Qualitative phenotypes based on the ability to reach turbidity in a given time (i.e. two
months) at 2 °C were established for each strain and a minimum of three replicates
were performed for all experiments.
One cryo bead of each strain was put in 10ml TSB-YE and incubated for 7 h at 37 °C.
Then, a 1/10 dilution was prepared and further incubated at 37 °C for 17 h. In order to
achieve a density of 5 log cfu.ml-1, overnight cultures were diluted in pre-chilled
tryptone salt (TS, Oxoid, Hampshire, UK) and TSB-YE (2 °C), successively.
Enumerations ensuring the concentration of the obtained suspensions were performed
onto TSA. Microtiter plates were inoculated with 200 µl per well (Overney et al., 2016)

Chapter 1
57
of the diluted suspensions and incubated at 2 °C. The microplates were covered with
parafilm in order to avoid dehydration. The turbidity of wells was visually inspected
each day for each strain, so that the strains can then be divided into two groups based
on time to observe turbidity. The two groups include strains that showed visible turbidity
before (hereafter called “fast”) and later (hereafter called “slow”) than 21 days,
respectively.
2.4 Genomic approaches
In order to link mutations to qualitative phenotypes, two different SNP-based
phylogenetic reconstructions (i.e. including and excluding recombination events; §
2.4.1), two different GWAS methods (i.e. gene- and SNP-based GWAS; § 2.4.2), as
well as a Bayesian inference method (§ 2.4.3), were performed.
2.4.1 Phylogenetic reconstructions
SNPs calling
A variant calling analysis was performed using iVARCall2, a recently published
workflow based on the GATK HaplotypeCaller algorithm (Felten, Nova, et al., 2017).
Briefly, this pipeline aims to align paired-end reads against a reference genome to
identify SNPs and InDels by local de novo assembly. The complete sequence of
L. monocytogenes strain EGD-e (accession number: NC_003210) was used as
reference genome. The pipeline produces also a multi-fasta file, called
“pseudogenomes”, including pseudo reference genomes obtained by substituting into
the reference all the genotypes of SNPs for each strain included in the analysis.
SNP-based phylogenetic inference
Phylogenetic reconstruction based on core genome SNPs was carried out with RAxML
(Randomized Axelerated Maximum Likelihood) (Stamatakis, 2014). The
pseudogenome fasta file generated by iVARCall2 was used as input for RAxML to build
a phylogenetic tree in newick format. The phylogenetic inference was performed with
bootstrap analysis and searching for the best-scoring Maximum Likelihood (ML) tree
with General Time-Reversible (GTR) model of substitution and the secondary structure
16-state model. One thousand bootstraps were applied and convergence was
checked. The resulting newick trees were further used in the following analyses.

Chapter 1
58
In order to detect recombination events, ClonalFrameML software package (Didelot
and Wilson, 2015) was applied using as input the phylogenetic tree from RaxML and
the pseudogenome fasta file from iVARCall2. Then, the SNPs corresponding to
recombination events were filtered out from the pseudogenomes using the
Clonal_VCFilter script (Felten, Nova, et al., 2017) in order to obtain a phylogenetic tree
where variants linked to recombination events were excluded.
2.4.2 GWAS methods
Gene-based GWAS
A GWAS based on the accessory gene content of the 51 L. monocytogenes de novo
assemblies was performed. First, draft genomes were obtained based on the SPAdes
algorithm (Bankevich et al., 2012) after quality check of Illumina reads using FASTQC
(Andrews, 2010) and trimming low quality reads with Trimmomatic (Bolger et al., 2014).
Finally, the qualitative evaluation of assemblies was performed by computing various
metrics with QUAST (Gurevich et al., 2013). The whole genome annotation was carried
out using Prokka (Seemann, 2014) with default parameters. Prokka uses the
assemblies as input and produces GFF3-files, including sequences and annotations,
which were used to extract the pan-genome of the 51 L. monocytogenes isolates with
the software Roary (Page et al., 2015). Finally, gene-based GWAS was performed
using Scoary (Brynildsrud et al., 2016). A file including phenotypic traits, the
phylogenetic tree based on SNPs and the gene presence/absence matrix from Roary
were thus used as input-data to Scoary.
SNP-based GWAS
A SNP-based GWAS was performed based on the workflow published by Earle et al.
2016 (Earle et al., 2016). The R scripts developed by Earle et al. and the related
external programs, such as GEMMA (Zhou and Stephens, 2012), were applied to
create SNPs-GWAS outputs. The pseudogenome fasta sequences produced by
iVARCall2 (Felten et al., 2017) and the associated binary phenotypic trait were
supplied as input of the workflow developed by Earle et al. (Earle et al., 2016). In the
SNPs-GWAS, correction for multiple testing was accounted for by applying Bonferroni
adjustments. The consideration of population structure effect provides estimates of the
proportion of variance in phenotypes explained by "SNP heritability". For associated

Chapter 1
59
SNPs, the related information are provided including annotation, associated p-values,
positions, types and bases of SNPs, as well as reference and non-reference codons
with the corresponding amino acid.
2.4.3 Bayesian inference method
With a view to assessing the evolution of qualitative phenotypes distribution along the
branches of the phylogenetic tree, a recently developed Bayesian inference method
(Ansari and Didelot, 2016) was applied. The R package called TreeBreaker was used
in order to infer the evolution of a discrete phenotype distribution across a phylogenetic
tree and divide the tree into segments where their distributions are constant (Ansari
and Didelot, 2016). Therefore, SNP-based newick trees obtained at core genome and
gene (inlA) level excluding recombination events and the discrete phenotypic traits
(“fast”=0, “slow”=1) were supplied as input to this program.
Chapter 1
60
3 Results and discussion
Out of the 51 L. monocytogenes strains included in the study, 43 were classified as
“fast” growing strains and 8 as “slow” growing strains at 2 °C (Supplementary
material 1). All results presented below are supported by high-quality reads-mapping
and draft genomes based on depth (median of 328 X) and breadth (median of 87.39 %)
coverages, as well as total contigs length (i.e. cumulated length of 2 984 694 kb with
N50 of 2 950 739), respectively (Supplementary material 2).
3.1 GWAS methods to explore the genetic basis of growth capacity at 2 °C
3.1.1 GWAS based on presence-absence of genes
A gene-based GWAS was carried out exploring the different analytical steps and
corresponding statistical parameters computed by Roary (Page et al., 2015) and
Scoary (Brynildsrud et al., 2016). The pan-genome of the 51 Listeria monocytogenes
strains (Figure 15) is composed of a total of 6 612 genes, including 2 014 core genes
(present in the 99 % of isolates) and 4 598 accessory genes (Supplementary material
3). A similar number of core genes has been already reported in previous studies on
L. monocytogenes: 2 032 (den Bakker et al., 2010) and 2 354 (Kuenne et al., 2013).
In order to select a curated set of genes associated to the “fast” or “slow” growth
phenotype, the 4 598 accessory genes detected by Roary were therefore considered
for the GWAS analysis performed with Scoary. A detailed description of the different
steps applied in the GWAS analysis is reported in Supplementary material 3. It is worth
mentioning that in the results obtained with this analysis, the population structure
correction is taken into account based on the produced SNP-based ML-tree
(Supplementary material 4).

Chapter 1
61
Figure 15 : Phylogenetic tree of 51 L. monocytogenes isolates compared to a matrix of presence and absence of core and accessory genes in dark blue.
A list of a total of 114 genes with strong statistical associations with the growth ability
at 2 °C (Supplementary material 4) was finally listed. The output table includes a couple
of genes already reported to be involved in the cold adaption mechanism of
L. monocytogenes such as the genes coding for RNA helicase (Markkula et al., 2012)
and for the precursor of internalin A (Kovacevic et al., 2013). Interestingly, 15 out of
114 genes (~13 %) of reported genes, corresponding to MGE (such as phage capsid
family protein or transposase from transposon Tn916), were found to be associated
with the measured phenotype. Despite, 70 out of 114 genes (~61 %) reported in the
output table correspond to hypothetical proteins.
3.1.2 SNP-based GWAS
The objective of the SNP-based GWAS analysis was to detect the phenotype-
associated genetic variants in the core genome. When performing microbial GWAS,
confounding factors (i.e. bacterial population structure and recombination events) may
affect the data analysis and lead to spurious associations. The approach by Earle et
al. (2016) was applied including mixed models which take into account for phylogenetic
relatedness and signals of lineage associations. Therefore, all SNPs located in the
2014 core genome genes and in the intergenic regions which can also be involved in

Chapter 1
62
phenotype associations, especially the 5’-untranscribed regions which may be
regulated by small RNAs (Cerutti et al., 2017), were included in the analysis (i.e.
104 160 core genome SNPs). Figure 16 presents the association for all these SNPs to
the studied phenotype. In this Figure, the positions of the SNPs in the genome are on
the x-axis while the corresponding –log10 (p-values) quantifying the association are
displayed on the y-axis. The majority of the SNPs (n=101 685) shows no significant
association (p-value>0.05), whereas slight (p-value<0.05) and strong significance
associations (p-value<0.01) were observed for 2 291 and 184 SNPs, respectively.
Figure 16 : Manhattan plot of core genome SNPs which show associations to the given phenotypic traits of the 51 L. monocytogenes strains. Each point presents a SNP with its position and corresponding –log10(p-value), which shows the significance of the geno-phenotype association. The color represents the extent of this significance, red (p-value< 0.01), orange (p-value< 0.05) and grey (p-value>0.05).
Table 7 shows the first 40 SNPs with the highest p-values of association and the
complete table of SNPs with p-value<0.01 is reported in Supplementary material 5.

Chapter 1
63
Table 7 : Extract of SNPs with strong evidences (p-value<0.01) for genome-wide association to the tested phenotypic trait of L. monocytogenes at 2°C. All associated SNPs at 0.05 significance p-value levels are listed in Supplementary material 5.
Refposition p-value
Allele0 Allele1 A C G T Type Refcodon Non-refcodon
Refaa Non-refaa
Name Start End Product
2335431 0.0067 A T 42 0 0 9 Synonymous CCA CCT Pro Pro lmo2244 2334586 2335455 ribosomal large subunit pseudouridine synthase
67812 0.0068 G A 9 0 42 0 Synonymous GTG GTA Val Val lmo0061 66160 70656 hypothetical protein
326545 0.0068 A G 42 0 9 0 Synonymous AGT AGC Ser Ser lmo0300 325729 327120 phospho-beta-galactosidase
361961 0.0068 G A 9 0 42 0 Synonymous GGG GGA Gly Gly lmo0333 360936 366272 internalin
361964 0.0068 T A 9 0 0 42 Synonymous CTT CTA Leu Leu lmo0333 360936 366272 internalin
361966 0.0068 C T 0 42 0 9 Non-synonymous
TCG TTG Ser Leu lmo0333 360936 366272 internalin
522745 0.0068 G A 9 0 42 0 Synonymous AAC AAT Asn Asn lmo0488 522628 523521 LysR family transcriptional regulator
632556 0.0068 T C 0 9 0 42 Synonymous GAT GAC Asp Asp lmo0590 631045 632811 hypothetical protein
659121 0.0068 T C 0 9 0 42 Synonymous AGT AGC Ser Ser lmo0620 659083 659475 hypothetical protein
659133 0.0068 C T 0 42 0 9 Synonymous GCC GCT Ala Ala lmo0620 659083 659475 hypothetical protein
659139 0.0068 T C 0 9 0 42 Synonymous GAT GAC Asp Asp lmo0620 659083 659475 hypothetical protein
659158 0.0068 A G 42 0 9 0 Non-synonymous
AGT GGT Ser Gly lmo0620 659083 659475 hypothetical protein
821163 0.0068 T G 0 0 9 42 Synonymous CTA CTC Leu Leu lmo0793 821070 821771 hypothetical protein
924279 0.0068 A T 42 0 0 9 Synonymous TCA TCT Ser Ser lmo0884 923161 924540 protoporphyrinogen oxidase
924290 0.0068 G C 0 9 42 0 Non-synonymous
AGA ACA Arg Thr lmo0884 923161 924540 protoporphyrinogen oxidase
924366 0.0068 T A 9 0 0 42 Synonymous CCT CCA Pro Pro lmo0884 923161 924540 protoporphyrinogen oxidase

Chapter 1
64
Refposition p-value
Allele0 Allele1 A C G T Type Refcodon Non-refcodon
Refaa Non-refaa
Name Start End Product
924378 0.0068 T C 0 9 0 42 Synonymous GTT GTC Val Val lmo0884 923161 924540 protoporphyrinogen oxidase
924387 0.0068 G A 9 0 42 0 Synonymous CAG CAA Gln Gln lmo0884 923161 924540 protoporphyrinogen oxidase
924393 0.0068 A G 42 0 9 0 Synonymous CGA CGG Arg Arg lmo0884 923161 924540 protoporphyrinogen oxidase
924415 0.0068 A G 42 0 9 0 Non-synonymous
ATC GTC Ile Val lmo0884 923161 924540 protoporphyrinogen oxidase
924420 0.0068 A G 42 0 9 0 Synonymous AAA AAG Lys Lys lmo0884 923161 924540 protoporphyrinogen oxidase
924438 0.0068 T C 0 9 0 42 Synonymous GTT GTC Val Val lmo0884 923161 924540 protoporphyrinogen oxidase
924456 0.0068 C T 0 42 0 9 Synonymous AGC AGT Ser Ser lmo0884 923161 924540 protoporphyrinogen oxidase
1400214 0.0068 A T 42 0 0 9 Synonymous GCA GCT Ala Ala lmo1375 1399699 1400796 aminotripeptidase
1448590 0.0068 C T 0 42 0 9 Non-synonymous
GCT ACT Ala Thr lmo1418 1448315 1449583 hypothetical protein
1855515 0.0068 G A 9 0 42 0 Synonymous CCG CCA Pro Pro lmo1778 1854748 1855521 ABC transporter ATP-binding protein
2844257 0.0068 A G 42 0 9 0 Non-synonymous
ATA ATG Ile Met lmo2763 2844249 2845601 PTS cellbiose transporter subunit IIC
1163023 0.0068 T A 9 0 0 42 Synonymous CTA CTT Leu Leu lmo1129 1162666 1163280 hypothetical protein
1163026 0.0068 C T 0 42 0 9 Synonymous AAG AAA Lys Lys lmo1129 1162666 1163280 hypothetical protein
1163043 0.0068 T C 0 9 0 42 Non-synonymous
AGT GGT Ser Gly lmo1129 1162666 1163280 hypothetical protein
1163044 0.0068 C T 0 42 0 9 Synonymous AAG AAA Lys Lys lmo1129 1162666 1163280 hypothetical protein
1163055 0.0068 C A 9 42 0 0 Non-synonymous
GTA TTA Val Leu lmo1129 1162666 1163280 hypothetical protein
1163059 0.0068 C T 0 42 0 9 Synonymous TTG TTA Leu Leu lmo1129 1162666 1163280 hypothetical protein
66276 0.0097 T C 0 3 0 48 Synonymous CCT CCC Pro Pro lmo0061 66160 70656 hypothetical protein

Chapter 1
65
Refposition p-value
Allele0 Allele1 A C G T Type Refcodon Non-refcodon
Refaa Non-refaa
Name Start End Product
137562 0.0097 G T 0 0 48 3 Synonymous GGG GGT Gly Gly lmo0135 137323 138897 peptide ABC transporter substrate-binding protein
139157 0.0097 A G 48 0 3 0 Synonymous CAA CAG Gln Gln lmo0136 138999 139949 peptide ABC transporter permease
139178 0.0097 A G 48 0 3 0 Synonymous CCA CCG Pro Pro lmo0136 138999 139949 peptide ABC transporter permease
139247 0.0097 T C 0 3 0 48 Synonymous AAT AAC Asn Asn lmo0136 138999 139949 peptide ABC transporter permease
150185 0.0097 T C 0 3 0 48 Intergenic - -
lmo0152:lmo0153 148354:150232 150009:151173 peptide ABC transporter substrate-binding protein: zinc ABC transporter substrate-binding protein

Chapter 1
66
This group of highly associated SNPs are harbored by genes which were previously
described as likely involved in cold adaption such as lmo0135 ABC-transporter
(Cabrita et al., 2013), lmo033 internalin (Hingston et al., 2017; Kovacevic et al., 2013)
and lmo0316 hydroxyethylthiazole (Mattila et al., 2012). The other highly associated
SNPs are harbored by hypothetical proteins and in intergenic regions, where for
example promotors and regulators can be located (Thorpe, Bayliss, Hurst, et al., 2017).
Although SNP-based GWAS has been recently applied in bacterial genomics, it is
worth to notice that the SNPs associated to cold growth phenotype were supported by
lower p-values in comparison to those reported by already published GWAS-based
studies investigating antibiotic resistance (Chen and Shapiro, 2015; Earle et al., 2016).
At least two reasons can be advanced to explain this discrepancy. The first is related
to the limited number of genomes related to “slow” growing strains. A more balanced
dataset might provide lower p-values supporting stronger phenotypic association. The
other reason is related to the selected phenotype of interest. Contrary to other studies,
the analyzed phenotype in this study is related to multiple compartments of the
bacterial cell (Chan and Wiedmann, 2008). As previously reported, cold adaptation of
L. monocytogenes may involve a variety of mechanisms, like the uptake of compatible
solutes and oligopeptides (Chan and Wiedmann, 2008), the membrane fluidity
(Saunders et al., 2016) and/or the general stress response factors (Cacace et al., 2010;
Chan et al., 2008).
Other methods to perform bacterial GWAS were published these last years. Some of
them rely on k-mers presence/absence (Earle et al., 2016; Lees et al., 2016; Marinier
et al., 2017), these approaches aim to associate traits with substitutions in the core
genome, and the accessory genome (Earle et al., 2016). Another tool was recently
proposed to specifically analyses presence/absence of intergenic regions (Thorpe,
Bayliss, Sheppard, et al., 2017). Herein, SNPs in genes, intergenic regions, as well as
presence/absence of genes can be explored. A novel SNP-based GWAS method was
also recently proposed for continuous phenotype (Collins and Didelot, 2018). An
additional k-mer-based GWAS approach dealing with phenotype-associated genetic
variants (i.e. SNPs, InDels, intergenic regions and recombination events) without prior
knowledge is still under evaluation (Jaillard et al., 2018).

Chapter 1
67
Notwithstanding, a promising alternative to GWAS which rely on the combination of
high-throughput gene function assays with mechanistic based models prioritizing
genetic variants (i.e. synonymous variants, variants in non-coding regions and
accessory genome) has been recently refined (Galardini et al., 2017). Such method
has been successfully applied on a large collection of E. coli strains with known
genotype and growth phenotype to deliver growth predictions, considering the variant’s
probability of affecting gene functionality, and genetic intervention strategies (Galardini
et al., 2017).
3.2 Analysis of the growth ability at 2 °C through a Bayesian inference method
The distribution of the observed qualitative phenotype was evaluated with phylogenetic
trees based on core genome (Figure 17) and inlA gene (Figure 18). In general, if all
individuals included in a phylogenetic analysis have the same phenotype distribution,
measured phenotypes would be randomly distributed on the tree leaves. Treebreaker
can assess if the phenotype distribution evolves over time. The model is based on
Poisson process of evolving phenotype distribution on the branches of a phylogeny. It
allows checking if that distribution is different from ancestral state reconstruction.
Hence, this Bayesian inference method aims at identifying the steadiness distribution
of phenotype within a tree segment. When a segment has a significant distribution of
a specific phenotype compared to other segments, the corresponding branch is
flagged. The thickness of the branches is proportional to the posterior probability of
phenotype change on the given branch. To perform this analysis a phylogenetic tree
was built based on core genome SNPs detected on the 51 L. monocytogenes strains
excluding recombination events because high rates of recombination events can affect
reconstruction of L. monocytogenes lineages (Moura et al., 2017). Recombination
events are distinct from evolutionary mechanisms related single substitutions and can
consequently bias ancestral sequence reconstruction from where phylogenetic
reconstructions are inferred with regards to evolutionary models of substitutions (Yang
and Rannala, 2012). The variants from recombination events were thus removed in
order to improve the accuracy of phylogeny reconstruction. The two Bayesian
inference branches presenting the highest associations with “slow” growth ability at
2 °C correspond to the lineage I and CC9 of the lineage II (Figure 17).

Chapter 1
68
These findings are in accordance with the study of Hingston et al. (2017), where the
CC1, CC2 and CC6 belonging to lineage I as also CC9 (lineage II) presented the
slowest growth rates at 4 °C in broth (Hingston et al., 2017).
A similar approach to that herein presented, has been already applied to find
association between antimicrobial resistance along branches of a phylogenetic tree
(Suzuki et al., 2016). Nevertheless, in a study on Streptococcus pyogenes, it has been
shown that phylogenetic inferences based on the alignment of specific SNP loci
associated to specific phenotype may exhibit topological deviation compared to core
genome-based phylogeny (Bao et al., 2016). Moreover, the categorical inferences
established at the accessory gene level (i.e. wgMLST) can also exhibit topology
distortion in comparison to core genome phylogenetic inferences based on SNPs
(Henri et al., 2017). Accordingly, focusing the analysis on specific genes could be more
relevant for investigating the evolution of the phenotypic trait of interest. For example,
Møretrø et al. (2017) succeeded in finding relevant association between Benzalkonium
Chloride (BC) susceptibility differences and a specific variant (i.e. cysteine/serine
difference at amino acid 42) detected in qacH gene in L. monocytognes strains carrying
or not the Quaternary Ammonium Compound (QAC) resistance genes (i.e. bcrABC or
qacH) (Møretrø et al., 2017).
Figure 17 : Evolution of a discrete phenotype distribution (red dot=”slow”, orange dot=”fast”) on a phylogenetic tree including 51 analyzed genomes. The thickness of the branches is proportional to the posterior probability of having a change point. The branch “▲” corresponds to lineage I and the branch “∆” to the CC9.

Chapter 1
69
Therefore, a candidate gene approach focusing on a pre-specified gene of interest (i.e.
inlA) already associated to cold adaptation (Hingston et al., 2017; Kovacevic et al.,
2013) was applied. A phylogenetic tree (Figure 18) was thus established based on the
sequences alignment of inlA gene and used as input for Treebreaker analysis.
In Figure 18, a pheno-genotype association (thicker branch) is shown, although the
null-hypothesis model (i.e. no association of binary phenotype with the branch) is not
rejected at 0.05 p-value level. Even though, the thicker branch reported in Figure 18 is
the same than that obtained based on core genome SNPs excluding recombination
events and corresponding to the strains of lineage I.
Figure 18 : Evolution of a discrete phenotype distribution (red dot=”slow”, orange dot=”fast”) on a phylogenetic tree based on DNA sequences of inlA gene.

Chapter 1
70
4 Conclusion
A number of genes and SNPs, as well as specific phylogenetic sub-lineages were
identified as associated to L. monocytogenes’ growth at low temperature (2 °C). The
test data set used to present the different approaches in this study contains 51 strains.
The application on a larger genome data set of accurately selected strains with
contrasting phenotypes would likely increase the power to detect the associations.
The development of various innovative methods, as well as the increasing availability
of bacterial genomes, opens a new area for food microbiology studies. The
identification of genetic markers associated to phenotype of interest along the food
chain should provide sensitive and accurate methods to predict and then control the
behavior of foodborne pathogens (Cocolin, Membré, et al., 2018; den Besten et al.,
2017). The use of GWAS could help to perform risk assessments especially targeting
the subpopulations that pose the greatest risk linked to their higher ability to survive
and/or grow in the food chain (Franz et al., 2016).
A rapid detection of strains harboring genetic markers related to the high ability to
persist in the processing environment or to high virulence potential could guide
reinforced control measures and optimize interventions strategies. The identification of
such biomarkers at the genomic level is only one aspect. The expansion of alternative
omics approaches based on transcriptomic or proteomics is opening new relevant
perspectives for a full understanding of pathogen behavior in foods as well as in the
whole food chain (Cocolin, Mataragas, et al., 2018; Hingston et al., 2017; Renier et al.,
2012).
Acknowledgements
This work received funds from The French National Research Agency under the project
ANR-15-CE21-0011 OPTICOLD.

Chapter 2
71
Chapter 2
Next generation quantitative microbiological risk assessment: Refinement of the
cold smoked salmon-related listeriosis risk model by integrating genomic data
Authors:
Lena Fritsch1, Laurent Guillier1, Jean-Christophe Augustin1,2*
Affiliation:
1 French Agency for Food, Environmental and Occupational Health & Safety (Anses), Laboratory for
Food Safety, Université Paris-Est, Maisons-Alfort F-94701, France
2 Ecole Nationale Vétérinaire d'Alfort, Maisons-Alfort F-94704, France.
Keywords: Listeria monocytogenes, Quantitative Microbial Risk Assessment, genome wide
association study, Clonal Complex
Published in Microbial Risk Analysis, Volume 10, December 2018, Pages 20-27.

Chapter 2
72
Résumé
Les développements récents dans le séquençage du génome ouvrent de nouvelles
opportunités pour expliquer la variabilité intraspécifique des phénotypes (p. ex.
virulence, comportement de croissance). L’association entre les données WGS et des
phénotypes spécifiques ouvre la voie à mieux prédire les comportements microbiens.
L’introduction de ces nouvelles données dans les processus d'identification des
dangers, d'évaluation de l'exposition et de caractérisation des dangers permettra
d'affiner les modèles d’appréciation quantitative des risques microbiens (AQRM). Le
but de cette étude était d'explorer cette voie d’amélioration des études d'AQRM en
considérant les associations phénotype/génomique- en ce qui concerne la capacité de
croissance à basse température (température minimale de croissance, Tmin) et la
virulence. Le modèle d'AQRM utilisé a déjà été développé pour l'évaluation du nombre
de cas de listériose associés au saumon fumé à froid en France. La prévalence globale
dans le modèle existant a été remplacée par la prévalence spécifique pour chaque
sous-groupe génotypique (complexe clonal - CC) en Europe. Afin de décrire plus
précisément la variabilité des caractéristiques de croissance de L. monocytogenes,
deux distributions différentes de Tmin ont été appliquées. Pour la caractérisation des
risques, trois groupes différents de virulence ont été considérés selon les CC. Chaque
groupe a été associé à un modèle dose-réponse spécifique. Le nouveau modèle
d'AQRM a montré que les CC qui contribuent le plus à l'exposition des consommateurs
ne sont pas ceux qui contribuent le plus aux cas de listériose. Les CC les plus répandus
ont entraîné peu de cas de listériose, alors que des souches virulentes bien que
représentant moins de 10 % de l’exposition étaient responsables de la majorité des
cas prévus. De même, le groupe de souches ayant des fortes capacités de croissance
au froid (Tmin faibles) sont deux fois plus impliqués que les souches à faible capacité
de croissance au froid. La prise en compte des données génotypiques dans l'AQRM
ouvre la voie à l'établissement de mesures de maitrise propres à des sous-groupes
distincts de L. monocytogenes.

Chapter 2
73
Abstract
Recent developments in genome sequencing open new opportunities for explaining
the intraspecific variability of phenotypes (e.g. virulence, growth behavior). Successful
association between WGS-data and specific phenotypes is thought to contribute to
better predicting microbial behaviors. Implementing this information in hazard
identification, exposure assessment, and hazard characterization processes will refine
quantitative microbial risk assessments (QMRA) models. The aim of this study was to
explore the refinements in QMRA studies when considering phenogenotype
associations for the hazard properties, particularly related to the growth ability at low
temperature (minimal growth temperature, Tmin) and the virulence. The used QMRA-
model was previously developed for the assessment of the number of listeriosis cases
associated to cold-smoked salmon in France. The global prevalence in the existing
model was replaced by the specific prevalence for each genotypic subgroup (clonal
complex - CC) in Europe. In order to describe the variability of Listeria monocytogenes’
growth characteristics more accurately, two different distributions of Tmin were
implemented. For risk characterization, three different groups of virulence were
considered according to the CCs. Each group was associated with a specific dose-
response model. The new QMRA model showed that CCs contributing the most in
consumer exposure were not those that contributed the most to listeriosis cases. The
most prevailing CCs led to few listeriosis cases, whereas uncommon high virulent
strains were responsible for the majority of predicted cases. Similarly, the less
prevailing group of strains with high Tmin was approximately two times less implicated
when considering human listeriosis in comparison to food contamination. Considering
genotypic data in QMRA opens the way for the establishment of risk based measures
specific to distinct sub-groups of L. monocytogenes.

Chapter 2
74
1 Introduction
1.1 French introduction
Dans la gestion des risques pour la santé publique, l'appréciation quantitative des
risques microbiens (AQRM) joue un rôle crucial dans la justification de la mise en
œuvre de mesures de maitrise (den Besten et al., 2017 ; Membré et Guillou, 2016).
L'estimation des risques auxquels les consommateurs d'aliments sont exposés,
fondée sur un modèle, est appliquée depuis près de deux décennies (Rantsiou et al.,
2018). Bien que ces modèles soient bien établis, ils présentent encore des lacunes qui
pourraient avoir une forte incidence sur l'évaluation de l'exposition, p. ex. entre la
variabilité des caractéristiques de croissance des souches (Delignette-Muller et al.,
2006). De plus, le manque d'information précise sur la variabilité de la relation dose-
réponse pour les pathogènes d'origine alimentaire induit une incertitude importante
dans les estimations des risques (Haddad et al., 2018; McLauchlin et al., 2004).
Les modèles d'AQRM tiennent généralement compte de la variabilité observée de
l'agent pathogène d'origine alimentaire à l'étude en mettant en œuvre des distributions
décrivant la variabilité des paramètres biologiques au niveau des espèces. Toutefois,
la corrélation entre les souches contaminant l'aliment et les propriétés de croissance
ou de virulence associées n'est pas prise en compte. De nouvelles approches dans le
séquençage du génome entier (WGS), et les études d'association à l'échelle du
génome (GWAS) pourraient annoncer une nouvelle ère de l'AQRM (Cocolin et al, 2018
; den Besten et al, 2017 ; Rantsiou et al, 2018). La diminution des coûts du WGS et le
nombre croissant d'outils accessibles pour le traitement des données génomiques
ouvrent la voie à de nouvelles approches pour étudier la variabilité phénotypique entre
souches.
La description précise des phénotypes des pathogènes d'origine alimentaire (p. ex.
virulence, capacité de survivre à un stress et caractéristiques de croissance) est
fondamentale pour l'EQRM. Il sera possible dans un proche avenir, à l'aide de données
génomiques/omiques, de cibler les évaluations des risques sur les sous-populations
bactériennes qui présentent le plus grand risque (Franz et al., 2016 ; Pielaat et al.,
2015). Des articles récemment publiés ont éclairé le lien entre le comportement des
pathogènes d'origine alimentaire et leurs génotypes (den Besten et al., 2010 ; Hingston
et al., 2017 ; Maury et al, 2016 ; Pielaat et al., 2015).

Chapter 2
75
L. monocytogenes est l'une des principales préoccupations des gestionnaires de
risques et l'un des pathogènes les plus considérés dans l'AQRM. Bien que la listériose
ne soit pas la zoonose d'origine alimentaire la plus courante, le taux élevé de létalité
(jusqu'à 30 %) (Ross et al., 2009), combiné à la fréquence relativement élevée de
l'isolement dans les aliments (Buchanan et al., 2017) et sa capacité de croissance
dans des conditions difficiles, ont conduit à l'établissement de nombreux modèles pour
prévoir sa croissance pour évaluer son exposition. Les aliments prêts à consommer
sont la principale source d'exposition (Buchanan et al., 2017 ; EFSA BIOHAZ Panel et
al., 2018), en raison de l'absence de traitement thermique avant consommation
(Lindqvist et Westööö, 2000). Les produits emballés de saumon fumé à froid ont été
décrits comme des sources potentielles de listériose humaine (Ericsson et al., 1997 ;
Loncarevic et al., 1998). Par conséquent, des modèles d'AQRM pour
L. monocytogenes ont été développés pour ce produit (Lindqvist et Westöö, 2000 ;
Pouillot et al., 2007).
Certains travaux récents ont porté sur le lien entre les génotypes et les phénotypes de
L. monocytogenes, ce qui permet une meilleure compréhension du comportement des
différentes souches spécifiques. Maury et ses collaborateurs (2016) se sont
concentrés sur les niveaux de virulence associés aux complexes clonaux (CC). Ils ont
couplé les données génomiques aux données cliniques et épidémiologiques. Bien que
la plupart des études d'association portent sur les phénotypes cliniques, l'étude
d'association à l'échelle du génome portant sur les phénotypes liés aux aliments a
rarement été menée (Hingston et al., 2017). Récemment, Hingston et ses
collaborateurs (2017) ont étudié les génotypes de L. monocytogenes associés au
stress du froid, du sel, de l'acide et de la dessiccation.
Même s'il est maintenant possible de produire les données nécessaires et de réaliser
des études d'association, il reste encore plusieurs défis à relever. Cocolin et ses
collaborateurs (2018) considèrent que le plus grand défi pour les microbiologistes est
maintenant de montrer comment intégrer les données omics dans l'AQRM.
L'objectif de cet article est de présenter comment les données génomiques récemment
publiées peuvent être utilisées pour affiner un modèle évaluant le risque de listériose
lié à la consommation de saumon fumé. Premièrement, l'information sur les
biomarqueurs potentiels peut être utilisée pour décrire la capacité des souches de

Chapter 2
76
L. monocytogenes à se développer dans des conditions froides, ce qui affecte ensuite
l'exposition des consommateurs à l'agent pathogène d'origine alimentaire.
Deuxièmement, un lien hypothétique entre les types génomiques (CC) et les propriétés
de virulence (relation dose-réponse) est proposé pour évaluer le risque d'infection pour
chaque souche contaminante en fonction de sa classe de virulence.

Chapter 2
77
1.2 English introduction
In public health risk management, Quantitative Microbial Risk Assessment (QMRA)
plays a crucial role when assessing the risk associated with the consumption of food
and justifying the implementation of control measures (den Besten et al., 2017;
Membré and Guillou, 2016). The model-based estimation of the risk food consumers
are exposed to has been implemented for almost two decades (Rantsiou et al., 2018).
Although these models are well-established for risk assessment, they still have
deficiencies that could strongly impact exposure assessment, e.g. between strains
variability of the growth characteristics (Delignette-Muller et al., 2006). Moreover, the
lack of accurate information on the variability of the dose-response for foodborne
pathogens induces a significant uncertainty in risk estimates (Haddad et al., 2018;
McLauchlin et al., 2004).
QMRA models generally take into account the observed variability for the foodborne
pathogen under consideration by implementing distributions describing the variability
of biological parameters at species level. However, correlation between the strains
contaminating the food and the related growth or virulence properties are not
considered. New approaches and achievements in whole genome sequencing (WGS),
omics and genome wide association studies (GWAS) might herald a new era of QMRA
(Cocolin, Mataragas, et al., 2018; den Besten et al., 2017; Rantsiou et al., 2018). The
decreasing costs of WGS and the increasing number of accessible tools for genomic
data treatment open the way to new approaches to study phenotypic variability
between strains.
The accurate description of foodborne pathogens’ phenotypes (e.g. virulence, ability
to survive to a stress and growth characteristics) is fundamental for QMRA. It will be
possible in the near future, using genomic/omic data, to target risk assessments on
bacterial subpopulations that pose the greatest risk (Franz et al., 2016; Pielaat et al.,
2015). Recently published papers enlightened the link between foodborne pathogens’
behavior and their genotypes (den Besten et al., 2010; Hingston et al., 2017; Maury et
al., 2016; Pielaat et al., 2015).
Listeria monocytogenes is one of major concern of risk managers and is one of the
most considered pathogens in QMRA. Although listeriosis is not the most common
foodborne zoonosis, the high rate of fatal cases up to 30 % (Ross et al., 2009)

Chapter 2
78
combined with relatively high frequency of isolation in foods (Buchanan, Gorris, et al.,
2017) and its capacity to grow under harsh conditions, lead to the establishment of a
high numbers of models to predict its growth for exposure assessment. Ready-to-eat
(RTE) foods are the major source of exposure (Buchanan, Gorris, et al., 2017; EFSA
BIOHAZ Panel et al., 2018), due to the absence of heat treatment before consumption
(Lindqvist and Westöö, 2000). Packaged products of cold-smoked salmon (CSS) have
been described as potential sources of human listeriosis (Ericsson et al., 1997;
Loncarevic et al., 1998). Hence, CSS QMRA models for L. monocytogenes have been
developed (Lindqvist and Westöö, 2000; Pouillot et al., 2007).
Some of the recent works were focused on the link between genotypes and
phenotypes of L. monocytogenes, which permits a better understanding of the different
specific strains’ behavior. Maury et al. (2016) focused on the virulence levels
associated to Clonal Complexes (CCs). They coupled genomic data to clinical and
epidemiological data. While most association studies are investigating clinical
phenotypes, GWAS dealing with food related phenotypes were rarely conducted
(Hingston et al., 2017). Recently, Hingston et al. (2017) studied the genotypes of
L. monocytogenes associated to cold, salt, acid and desiccation stress.
Even if it is possible now to produce the necessary data and to perform association
studies, there are still several challenges to overcome. Cocolin et al. (2018) considered
that the greatest challenge for microbiologist is now to show how to integrate omics
data in QMRA (Cocolin, Mataragas, et al., 2018).
The objective of this paper is to present how recently published genomic data can be
used to refine a model assessing the listeriosis risk linked to the consumption of CSS.
Firstly, potential biomarker information can be used to describe the ability of
L. monocytogenes strains to grow in cold conditions affecting then the exposure of
consumers to the foodborne pathogen. Secondly, a hypothetical link between the
genomic types (CCs) and the virulence properties (dose-response relationship) is
proposed to assess the risk of infection for each contaminating strain according to its
virulence class.

Chapter 2
79
2 Material and methods
2.1 Overview of the model: Quantitative risk assessment of
L. monocytogenes in cold-smoked salmon
The quantitative risk assessment model was published by Pouillot et al., (2007, 2009).
This model was developed to estimate the probability of invasive listeriosis associated
to the consumption of CSS in France.
The exposure of consumers to L. monocytogenes was assessed by simulating the
behavior of bacteria contaminating CSS packs from the processing plant to the
consumption taking into account the time-temperature profiles encountered during the
distribution chain (Pouillot et al., 2007). The L. monocytogenes density in CSS at
consumption depends on the prevalence and the initial concentration (end of the
production line) of L. monocytogenes, X0, the growth parameters of L. monocytogenes
in CSS (minimal temperature for growth, Tmin, and reference growth rate in CSS, ref,
maximum population density, MPD), and on the characteristics (duration and
temperature) of the different logistic stages (storage at warehouse, platform, retail cold
room, refrigerated transport, retail display cabinet, transport after purchase, household
conservation at ambient temperature and in refrigerator). Since the background
competitive flora of CSS can inhibit L. monocytogenes growth, a predictive model
simulating the “Jameson effect” (growth of L. monocytogenes and food flora
independent until one of them reaches its maximum population density and stops both
growths) was used. This model requires supplementary data related to the background
CSS flora (X0, Tmin, ref, MPD). The final L. monocytogenes density (at consumption)
was combined with consumption data (serving size) to evaluate the exposure of the
population to L. monocytogenes per CSS serving.
The probability of invasive listeriosis was then assessed with a dose-response model
reflecting the pathogenicity of the microorganism and the sensitivity of the consumers.
An exponential dose-response equation with a parameter r (probability of illness for
the ingestion of one bacterial cell) was used for this risk characterization (Pouillot et
al., 2009). The annual number of listeriosis cases could then be predicted by combining
the distribution of individual risks with the total number of servings per year.

Chapter 2
80
Figure 19 illustrates the used model and the factors influencing the amount of
L. monocytogenes the consumers are exposed to. These factors are related to: (i) the
product (prevalence, level of contamination, presence of annex flora), (ii) the cold chain
(time-temperature profiles), (iii) microbiological characteristics (minimum temperature
for growth, growth rate, and maximum population level), (iv) consumption data (portion
size and frequency).

Chapter 2
81
Figure 19 : Model for assessing exposure of L. monocytogenes by consumption of cold-smoked salmon (adapted from Pouillot et al., 2007)

Chapter 2
82
2.2 Genomic differentiation of L. monocytogenes for hazard identification
The clonal framework of Listeria species can accurately be defined by Multilocus
sequence typing (MLST). MLST profiles are based on the sequence-analysis of seven
housekeeping genes including; acbZ (ABC transporter), bglA (beta-glucosidase), cat
(catalase), dapE (Succinyl diaminopimelate desuccinylase), dat (D-amino acid
aminotransferase), ldh (lactate deshydrogenase), and lhkA (histidine kinase). By
means of these profiles, CCs are categorized. A CC is defined by allelic profiles sharing
6 out of 7 genes, whereby at least one gene is shared with only one of another group
(Ragon et al., 2008).
2.3 Virulence properties of L. monocytogenes genotypes subtypes
For risk characterization, virulence levels were identified from virulence studies
performed with different L. monocytogenes strains in mice (Pine et al., 1991; Pine et
al., 1990; Stelma et al., 1987). The median lethal doses (LD50) obtained by
intraperitoneal infection route for 26 strains (FDA/FSIS, 2003) were firstly translated in
r-values, that is in the probability of a given bacterial cell to cause the adverse effect.
The LD50 is inversely proportional to r (Pouillot et al., 2015), then we can transform
log10 LD50 into log10 r with a scaling factor. This scaling factor was estimated by
assuming that the median log10 LD50 of the 26 strains (i.e., 5.02 log10 CFU) corresponds
to the median log10 r for the whole population published by Pouillot et al. (2015) (i.e., -
13.81 that is equal to log10 of 1.5610-14). The scaling factor to translate log10 LD50 into
log10 r is then equal to -8.79 (log10 r = -log10 LD50 -8.79). To determine a number of
groups relating to virulence-level, a dendrogram based on these values was made. R
packages phytools (Revell, 2012b), “ape” (Paradis et al., 2004) and “dendextend”
(Galili, 2015) were used to build the dendrogram using the function “hclust”
(method="complete").
In a second step, the work of Maury et al. (2016) related to the virulence of
L. monocytogenes clones was used to associate r-values to the diverse CCs of the
pathogen. They characterized 6,633 L. monocytogenes strains collected in France
between 2005 and 2013, including 2,584 clinical and 4,049 food isolates (strains from
own samples of food by industries in France and from passive surveillance in RTE
foods). The CC1, CC2, CC4 and CC6 are the most frequent clones found among
clinical isolates; in addition Maury et al. (2016) demonstrated that CC1, CC4 and CC6
are hypervirulent clones in a humanized mouse model of listeriosis. On the contrary,

Chapter 2
83
CC9 and CC121 showed hypovirulence in the mouse model and were strongly
associated with food but not in clinical infection. Thus, in this study, strains
corresponding to CC9 and CC121 were attributed to the group of low virulence while
strains corresponding to CC1, CC2, CC4 and CC6 were attributed to the group of high
virulence. Since the virulence assessment in the mouse model was not performed for
all the CCs studied by Maury et al. (2016) and that it is not possible to identify at this
step all the genomic traits associated with the level of virulence, we used the clinical
frequency of CCs as a parameter to characterize their virulence. The clinical frequency
takes into account the exposure and the virulence. It was calculated by dividing the
number of clinical isolates of a particular CC by the total number of clinical and food
isolates of that CC (Maury et al., 2016).
As the frequency of clinical isolates among the total number of isolates was a good
indicator for the hypervirulent clones CC1, CC2, CC4 and CC6 as well as for the
hypovirulent CC9 and CC121, the same assumption was made for the other clones. A
dendrogram (function “hclust”, method="complete") based on these frequencies was
built to classify clones according to their virulence.
It was finally assumed that the virulence groups could be related to the r-values groups,
and for instance, that the CC1, CC2, CC4 or CC6 belonging to the hypervirulent group
are characterized by r-values belonging to the group of the smallest r-values. The 294
strains of L. monocytogenes prevalent in smoked salmon in Europe (Møller-Nielsen et
al., 2017) were then associated to virulence and r-values groups according to their CC
(Supplementary material 6).
2.4 Phenotypic (growth) characteristics of L. monocytogenes subgroups
In order to describe the variability of L. monocytogenes’ growth characteristics more
accurately, different distributions of Tmin were implemented. Data published by
Hingston et al. (2017) describing the ability of 166 L. monocytogenes to grow in cold
(4 °C) stress conditions were used. The standardized values for growth rate at 4 °C,
std-max, were translated into Tmin values assuming a square root model to describe
the effect of temperature on the growth rate and a Tmin value equal to -2.86 °C for the
median isolate (Pouillot et al., 2007). Tmin values for each isolate were then calculated
as follows:

Chapter 2
84
���� = 4 − (4 + 2.86)����−����
A dendrogram based on the Tmin values was made to classify isolates according to
their growth ability. We then assumed that a potential genomic marker could be
identified to clearly discriminate “low-growing” and “high-growing” strains with high and
low Tmin values, respectively. Then, the respective proportions of these different strains
among the L. monocytogenes isolates contaminating salmon were assumed similar to
those observed by Hingston et al. (2017) in their collection.
2.5 Prevalence of L. monocytogenes genotypes in cold-smoked salmon
A global prevalence for L. monocytogenes of 10.4 % in Europe (EFSA, 2013) was used
to predict listeriosis cases caused by CSS consumption in France. Then, the global
prevalence was split into specific prevalence for each genotypic subgroup. The relative
frequencies for the L. monocytogenes genotypes contaminating CSS were derived
from the recent distribution observed in Europe (Møller-Nielsen et al., 2017).
2.6 Model parameters and simulation
The L. monocytogenes growth in CSS and the individual risk linked to the consumption
of contaminated servings were estimated with Matlab R2017a software (The
Mathworks Inc., Natick, MA, USA). Monte Carlo simulations were performed to take
into account the variability of input parameters (Table 8). Simulation runs of 100,000
iterations were replicated 10 times in order to obtain stable predictions. For each
simulation run, the mean “individual” risk (due to consumption of a serving) was
multiplied by the mean annual number of servings per inhabitant and by the population
size to predict the number of annual cases of listeriosis. The simulations were
performed for each group of L. monocytogenes strains to estimate the expected
number of cases according to the virulence and the growth characteristics (minimal
growth temperature) of the strains. A generic simulation for L. monocytogenes was
also performed by randomly sampling r-values and Tmin value in the entire
distributions (Table 8). This generic simulation corresponds to a non-informative
approach about the virulence and growth genotypes distribution in the population of
the L. monocytogenes strains contaminating CSS in Europe.

Chapter 2
85
Table 8 : Distributions of parameters used to simulate the growth of L. monocytogenes in cold-smoked salmon and to estimate the corresponding listeriosis risk.
Parameter Symbol (unit)
Distribution/valuea Source
L. monocytogenes characteristics
Initial concentration X0Lm (log10 CFU.g-1)
N(-1.05,0.74) (Pouillot et al., 2007)
Minimal temperature for growth for group LG
TminLG (°C) ED({1/5,1/5,1/5,1/5,1/5},{-2.09,-2.02,-1.97,-1.93,-1.84}) (Hingston et al., 2017)
Minimal temperature for growth for group HG
TminHG (°C) ED({1/161, … ,1/161},{-3.28, … ,-2.44}) (Hingston et al., 2017)
Reference growth rate at 25°C µrefLm (day-
1) NT(6.2,0.36,0,) (Pouillot et al., 2007)
Log10 r-values for hypervirulent strains rHV ED({1/5,1/5,1/5,1/5,1/5},{-12.46,-12.41,-11.68,-11.48,-11.36}) (Pouillot et al., 2015) (FDA/FSIS, 2003)
Log10 r-values for medium virulence strains
rMV ED({1/15,...,1/15},{-15.02,-14.83,-14.79,-14.7,-14.54,-14.26,-13.87,-13.75,-13.74,-13.52,-13.45,13.4, -13.36,-13.35,-13.28})
(Pouillot et al., 2015) (FDA/FSIS, 2003)
Log10 r-values for hypovirulent strains rLV ED({1/6,1/6,1/6,1/6,1/6,1/6},{-18.49,-17.67,-16.33,-16.09,-16.07,-15.59}) (Pouillot et al., 2015) (FDA/FSIS, 2003)
Maximum population density MPD (log10 CFU.g-1)
N(7.27,0.84) (Pouillot et al., 2007)
Background food flora characteristics
Initial concentration X0ff (log10 CFU.g-1)
N(2.78,1.12) (Pouillot et al., 2007)
Minimal temperature for growth Tminff (°C) N(-4.52,7.39) (Pouillot et al., 2007) Reference growth rate at 25°C µreff (day-1) NT(4.1,0.52,0,) (Pouillot et al., 2007)
Cold-smoked salmon characteristics
Serving size serv (g) ED({11/111,1/111,1/111,29/111,12/111,1/111,41/111,4/111,4/111,1/111,4/111,1/111,1/111}, {10,12,19,20,30,34,40,50,60,67.5,80,100,250})
(Pouillot et al., 2007)
Shelf-life printed on the packaging SLp (days) ED({0.99,0.01},{28,21}) (Pouillot et al., 2007) Shelf-life applied by the consumer SLa (days) Triang(SLp,SLp,SLp+5) (Pouillot et al., 2007) Logisitc chain (succession of process stages)
_ ED({1/35, … ,1/35},) (Pouillot et al., 2007)
Time-temperature profiles of process stages
_ _ (Pouillot et al., 2007)
Consumers characteristics
Population size Npop 61624000 (Pouillot et al., 2009) Mean annual number of servings per inhabitant
S 6.4 (Pouillot et al., 2009)

Chapter 2
86
3 Results and discussion
3.1 Distributions of phenotypic and virulence properties among
L. monocytogenes subtypes
Figure 20 shows the clustering of r-values of 26 strains of L monocytogenes. This
dendrogram defines the number of virulence groups. Three main groups were
observed; hypovirulence (blue), medium virulence (yellow) and hypervirulence (red).
The average dose response log10 r-values were -11.88 for the hypervirulent group, -
13.99 for medium virulence and -16.71 for the hypovirulent strains.
Figure 21 presents in a dendrogram the CCs of L. monocytogenes according to their
level of virulence (based on clinical frequency). Maury et al. (2016) showed that the
hypervirulent strains in humanized mice-model were also characterized by a high
proportion of clinical isolates in comparison to food isolates. Similarly, the CCs not
tested in mice could also be associated to one of the groups based on their relative
clinical frequency.
Figure 20 : Dendrogram based on log10 r-values of 26 different L. monocytogenes strains (FDA/FSIS, 2003) ranging from −18.49 to −11.36 (Supplementary material 7); blue group=hypovirulence, yellow group=medium virulence and red group=hypervirulence. (For interpretation of the references to color in this figure legend, the reader is referred to the web version of this article.)

Chapter 2
87
Dealing with distance analyzes, it is relevant to cluster as many groups as it is
necessary to obtain real differences (sufficiently large distances) between the groups.
Without that contrast between the categories, the growth ability at low temperature or
the virulence of the strains can be incorrectly assessed and influence the final results.
For example, if a CC is incorrectly attributed to the hypervirulent group and its
prevalence is high in the food product under consideration, the risk will be
overestimated. An error in the attribution of a CC in a virulence group can occur using
the approach based on clinical frequency. Indeed, this approach can lead to a false
interpretation of a CCs’ virulence through to the fact that large outbreaks involving non-
hypervirulent strains could artificially increase their clinical frequency and change the
importance of CCs and their virulence group. To minimize that error source it would be
better to use data only from sporadic cases. In near future the use of virulence
biomarkers (e.g. genes/SNPs) can replace the present grouping (Njage et al., 2017).
Such an approach will be also more precise than the MLST approach as the
determination of CCs depends only on seven housekeeping genes.
Figure 21 : Dendrogram created by clinical frequencies (Maury et al., 2016) of different Clonal-Complexes to associate the level of virulence to CCs; blue group=hypovirulence, yellow group=medium virulence and red group=hypervirulence. (For interpretation of the references to colour in this figure legend, the reader is referred to the web version of this article.)

Chapter 2
88
Figure 22 represents the dendrogram based on Tmin values. A huge group of “high
growth” (97 % of strains) with an associated average Tmin of -2.86 °C and a small group
of “low growth” (3 % of strains) with an assigned average Tmin of -1.97 °C were defined.
It is worth to notice that Fritsch et al. (2018) also observed a similar proportion of “high
growth” compared to “low growth” strains.
No markers of these two phenotype subgroups were explored in CSS strains isolated
in Europe. In their GWAS, Hingston et al. (2017) and Fritsch et al. (2018) identified
some potential markers of the L. monocytogenes cold adaptation. For example,
Hingston et al. (2017) showed that isolates with full length inlA exhibited enhanced cold
tolerance relative to those harboring a premature stop codon in this gene. Fritsch et al.
(2018) found a significant association between the ability to grow at low temperature
(2 °C) and a single nucleotide polymorphism (SNP) in the ribosomal large subunit
pseudouridine synthase (lmo2244). When markers will be fully validated, the relative
proportion of “high growth” and “low growth” strains in CSS could be adapted in the
QMRA model.
Figure 22 : Dendrogram based on 166 different strains with corresponding Tmin values presenting the participation of low (blue) and high (red) growing strains. (For interpretation of the references to colour in this figure legend, the reader is referred to the web version of this article.)

Chapter 2
89
3.2 Exposure and risk estimates according to the L. monocytogenes subtypes
The proportion of each group is presented in Table 2. The biggest group is represented
by hypovirulent strains (CC9, CC31, CC121, CC193 and CC204) which account for
51.7 % of the total strains. The hypervirulent strains (CC1, CC2, CC6, CC7 and
CC101) show the lowest prevalence and accounts for 12.6 % of the strains isolated in
CSS. Within these categories, 3 % of strains were associated to “low growth” and 97 %
to “high growth” in cold conditions.
Table 9 : Relative frequencies of the subgroups of virulence and growth ability at low temperature observed in L. monocytogenes strains present in cold-smoked salmon.
Low growth High growth Total
Hypervirulent 0.4 % 12.2 % 12.6 %
Medium virulence 1.1 % 34.6 % 35.7 %
Hypovirulent 1.6 % 50.1 % 51.7 %
Total 3.0 % 97.0 % 100.0 %
The generic model in which the population structure in CSS was not considered,
predicted a number of 978 listeriosis cases after consumption of 50 g of CSS with an
initial L. monocytogenes prevalence of 10.4 % while in the model taking into accounts
the prevalence of the subpopulations in CSS, 574 listeriosis cases were predicted. The
number of virulence groups was based on r-values from 26 different strains, wherein
five of them were assessed as hypervirulent. This is a proportion of about 19 %, while
the effective prevalence of strains in CSS with CCs corresponding to hypervirulence
was only 12.6 %. Similarly, for the hypovirulence, where 23 % of strains (6 among 26)
were associated to this group compared to 51.7 % of CCS-prevalent hypovirulent
strains. Omitting the specific prevalence leads, in this case, to the over-estimation of
the predicted listeriosis cases. In consequences, it is necessary to track and identify
all food and clinical isolates by sequencing for obtaining the needed information and
data on prevalence (Buchanan, Gorris, et al., 2017).
It is noticeable that the highest amounts of listeriosis cases (97.0 %) were caused by
the hypervirulent group despite their low proportion (12.6 %) in contaminated CSS.
Inversely, the most prevalent group (51.7 %) was responsible for only 0.02 % of the
cases of listeriosis in a total of 574 predicted cases. These results show how important
the specific prevalence and the level of virulence are.

Chapter 2
90
Table 10 : Predicted cases of listeriosis of the appropriate virulence and Tmin groups.
Low growth High growth Total
Hypervirulent 9.2 (1.6 %) 547.2 (95.4 %) 556.4 (97.0 %)
Medium virulence 0.3 (0.1 %) 16.9 (3.0 %) 17.2 (3.0 %)
Hypovirulent 0.0 (0.0003 %) 0.1 (0.02 %) 0.1 (0.02 %)
Total 9.5 (1.7 %) 564.2 (98.3 %) 573.7
The predicted cases of listeriosis are highly influenced by the prevalence of CCs and
the associated dose-response. In general the dose-response is estimated by in vitro
and/or in vivo animal tests. However, it is difficult to get accurate dose information after
an outbreak due to the time that passes between the exposure to L. monocytogenes
and the identification of the outbreak (Buchanan, Gorris, et al., 2017). Moreover, the
dose-response relationships in animals are different to those of humans. The
investigation of outbreaks will certainly help to reduce uncertainty of dose-response
model and to improve the knowledge of the virulence potential of CCs (Chen et al.,
2017; Pouillot et al., 2016)
The effect of the low/high growth groups was slighter than the effect of the virulence.
On one hand, this slight influence may be due to the low presence of the low growing
group (3 %). On the other hand, more importance is given to the pathogenicity when
estimating predicted cases. Nevertheless, the impact of the growth ability is visible
considering the discrepancy between the prevalence of low growing strains (3 %)
compared to the predicted cases linked to this group (1.7 %). The mean exposure of
the consumer was two times more important in the high growth groups (1.4 log10
CFU/g, i.e., 25 CFU/g) compared to the low growth groups (1.1 log10 CFU/g, i.e., 13
CFU/g). This tendency is even larger for the extreme percentiles with a 0.5 log10
difference between the two groups of strains for the 99th percentile, i.e., 1 % of portions
contain more than 6.9 log10 CFU/g when they are contaminated with a high growth
strain against 6.4 log10 CFU/g when the contamination occurs with a low growth strain.
As illnesses most frequently come from exposure to the high doses (Buchanan, Gorris,
et al., 2017; EFSA BIOHAZ Panel et al., 2018), this observed factor between the
“growth” groups can be an issue for risk assessment.
This refinement, although using some strong hypotheses, highlighted the effect and
potential impact of implementing genomic data in QMRA. In this work two examples of

Chapter 2
91
different phenotypic behaviors were included. Additional phenotypic traits of foodborne
pathogens could be included that are highly informative in QMRA (Franz et al., 2016),
such as persistence/biofilm forming abilities, stress resistance (Hingston et al., 2017),
and also in the case, for example, of Bacillus, the robustness to lethal treatments
associated to genotypes (den Besten et al., 2010).
Nonetheless, if biomarkers are used to describe a phenotypic behavior, an uncertainty
should be considered (den Besten et al., 2017). In this paper, groups were created and
the corresponding values were taken into account with an appropriate variability. In
other words, the present proposal does not consider the presence of a genetic marker
leading to an exact behavior/value, furthermore the genetic differences were used as
a hint to precise the predicted behavior more in detail compared to the current
approaches without geno-/phenotype associations.
The use of biomarkers is a statistical approach that provides the possibility to perform
risk assessments more targeted on subpopulations presenting the greatest risk (Franz
et al., 2016).
The research field of GWAS to find biomarkers for bacteria genomes is still young
(Sheppard et al., 2013). First associations to food safety relevant phenotypes were
published recently but their phenotypes were not applied in food matrices (Hingston et
al., 2017; Pielaat et al., 2015). Nowadays, it is possible to create the data which is
necessary to start next generation of QMRA that is already well discussed in recent
papers (Cocolin, Mataragas, et al., 2018; Cocolin, Membré, et al., 2018; den Besten et
al., 2017; Rantsiou et al., 2018).
This new era needs still a couple of time to generate accurate models with
implementation of genomic/ omic data and to learn how this data can be used the best.
In near future this evolution could result in a better risk estimation and thus improve
risk management measures. Potentially, it might improve the hazard identification step,
i.e. hypervirulence linked to CCs and thus the risk analysis could be adapted to
particular groups. Such a new approach could lead to changes in risk management by
food authorities and companies e.g. by adapting or by refining the intervention
strategies according the hazards’ properties (Haddad et al., 2018).

Chapter 2
92
Acknowledgement
This work received funds from The French National Research Agency under the 411
project ANR-15-CE21-0011 OPTICOLD. Special thanks go to Dr. Steven Duret for his
kindly aid.

Chapter 3
93
Chapter 3
A novel microscopy method for determining individual lag times and growth
probability of individual bacterial cells
Authors:
Lena Fritsch1, Hélène Bergis1, Abirami Baleswaran1, Jean-Christophe Augustin1,2*, Laurent
Guillier1
Affiliations:
1 French Agency for Food, Environmental and Occupational Health & Safety (Anses), Laboratory for
Food Safety, Université Paris-Est, Maisons-Alfort F-94701, France
2 Ecole Nationale Vétérinaire d'Alfort, Maisons-Alfort F-94704, France
Keywords: single cell, microscopy, Listeria monocytogenes, lag time, growth probability, cold.

Chapter 3
94
Résumé
La détermination des temps de latence unicellulaire et des probabilités de croissance
à basse température est un processus long. Les expériences en laboratoire peuvent
généralement durer plus de trois mois pour obtenir suffisamment de données pour
produire des résultats robustes. Le but de cette étude était de mettre au point une
méthode de microscopie rapide à haut débit pour la détermination de la probabilité de
croissance et du temps de latence des cellules individuelles lors d’une croissance au
froid. Par conséquent, quatre souches de L. monocytogenes ont été sélectionnées.
Les lames de microscope ont été recouvertes d'agar, inoculées avec des cellules de
L. monocytogenes et incubées à 4 °C. Les lames ont été analysées à l'aide d'un
microscope à contraste de phase à différents moments d'observation (c.-à-d. Tobs et
Tprob). Pour chaque observation, une nouvelle lame a été utilisée. Les images des
cellules individuelles et des microcolonies ont été capturées puis examinées à l'aide
d'une procédure d'analyse d'images automatique. La taille des micro-colonies et le
nombre de cellules incapables de se multiplier ont donc été déterminés. Par la suite,
des distributions de temps de latence ont été générées avec succès pour les quatre
souches de L. monocytogenes testées. Cette approche innovante offre une méthode
pratique et rapide pour définir la probabilité de croissance et la distribution de latence
des cellules individuelles avec une application possible dans diverses conditions.

Chapter 3
95
Abstract
The determination of single-cell lag times and growth probabilities in cold conditions is
a long process. Laboratory experiments can commonly run over three months for
obtaining enough data to yield robust results. The aim of this study was to develop a
fast microscopy method with high throughput for the determination of the growth
probability and lag times of bacterial single-cells in cold condition. Therefore, four
unrelated L. monocytogenes strains were selected. Microscope slides were covered
with agar, inoculated with L. monocytogenes cells and incubated at 4 °C. The slides
were analyzed with a phase-contrast microscope at different observation times (i.e.
Tobs and Tprob). For each observation, a new slide was used. Images of the single-cells
and microcolonies were captured and then examined with an automatic image analysis
procedure. The microcolonies size and the number of cells unable to multiply were
therefore determined. Following, lag time distributions were successfully generated for
all four tested L. monocytogenes strains. This innovative approach provides a time-
saving and convenient high throughput method to define growth probability and lag
time distribution of bacterial single-cells with possible application at various conditions.

Chapter 3
96
1. Introduction
1.1 French introduction
Dans le domaine de la microbiologie prévisionnelle, des modèles mathématiques sont
développés depuis des décennies pour décrire le comportement bactérien des
aliments. De multiples facteurs (expérimentaux et biologiques) peuvent affecter le
comportement bactérien empêchant l'évaluation précise de la réponse bactérienne,
surtout dans des conditions environnementales difficiles (Aryani et al., 2015 ; den
Besten et al., 2016). Outre la variabilité entre les différentes souches d'une espèce,
l'hétérogénéité au sein d'une population doit être prise en compte lors des prédictions
phénotypiques (Aspridou et Koutsoumanis, 2015). Deux approches principales sont
généralement adoptées dans une conception expérimentale pour évaluer les
phénotypes bactériens: une approche « populationnelle » et une approche
« cellulaire ». Dans le premier cas, le comportement est modélisé aux conditions
environnementales sans tenir compte de la variabilité des cellules qui constituent la
population. Pourtant, toutes les bactéries d'une population clonale ne réagissent pas
de la même manière aux changements environnementaux (Koutsoumanis et Aspridou,
2017). En effet, certaines cellules individuelles peuvent montrer une tolérance extrême
aux facteurs de stress ou une sensibilité extrême par rapport à la majorité des cellules
de la population. Une attention particulière doit être portée aux cellules bactériennes
présentant une plus grande résistance aux conditions environnementales stressantes
(Aguirre et Koutsoumanis, 2016 ; Aspridou et Koutsoumanis, 2015 ; Margot et al.,
2016). Cette résistance accrue peut favoriser la persistance de pathogènes bactériens
(p. ex. L. monocytogenes) dans les usines de transformation des aliments et la
colonisation de nouveaux environnements, augmentant ainsi le risque de
contamination des aliments (Pascual et al., 2001). De plus, un temps de latence plus
court a été observé pour les cellules bactériennes ayant une résistance accrue aux
stress environnementaux comparativement aux cellules sensibles (Margot et al.,
2016). Les matrices alimentaires sont souvent contaminées par de faibles
concentrations de bactéries (Ross et McMeekin, 2003). Ainsi, l'application de
l'approche cellulaire offre l'avantage de générer des résultats reflétant un scénario plus
réaliste. L'approche "cellules individuelles" considère le comportement individuel de
chaque cellule de manière indépendante. L'acquisition de données au niveau des
cellules individuelles nécessite l'établissement de méthodes capables d'isoler chaque

Chapter 3
97
cellule individuellement et en même temps de recueillir un grand nombre de données
(Swinnen et al., 2004). Différentes méthodes sont disponibles pour déterminer le
temps de latence d'une cellule. Les plus couramment pratiquées reposent sur la
mesure de la densité optique de la croissance bactérienne en milieu liquide au cours
du temps (Smelt et al., 2002). Cette technique repose sur l’observation du temps de
détection, ou temps que met une cellule pour atteindre le niveau de détection pour la
mesure de turbidité (~107 cellules/ml, soit 24 générations). Néanmoins, cette approche
indirecte présente certaines faiblesses, en particulier dans des conditions
expérimentales limites (par exemple, à des températures proches des limites de
croissance bactérienne, les expériences prendront beaucoup de temps). De plus, le
fait que cette approche soit menée en milieu liquide rend plus difficile le transfert des
résultats aux matrices alimentaires solides. Le micro-environnement des cellules
planctoniques est en effet très différent de celui des cellules immobilisées en colonies,
donc la capacité de croissance bactérienne peut être très différente (Verheyen et al.,
2019). L'amélioration des connaissances sur la croissance immobilisée est primordiale
pour éviter les sur- ou sous-estimations des modèles prévisionnels (Skandamis et
Jeanson, 2015). D'autres méthodes indirectes d'estimation du temps de latence
individuel de la croissance bactérienne en milieu solide ont été publiées (Guillier et al.,
2006 ; Levin-Reisman et al., 2014). Ces auteurs ont proposé une méthode basée sur
l'analyse d'images de la croissance de colonies bactériennes à la surface de gélose,
où les temps de latence sont estimés par le temps de détection requis pour former des
colonies macroscopiquement visibles. Mertens et al (2012) ont publié une méthode
basée sur une approche similaire, mais la croissance a été suivie par la mesure de la
DO des colonies (Mertens et al., 2012). Dans ce cas, le débit a été amélioré grâce à
l'utilisation des plaques de 48 puits. Cependant, toutes ces approches présentent le
même inconvénient que la méthode indirecte en bouillon quant au temps nécessaire
pour atteindre un niveau d'observation, surtout dans des conditions proches des limites
de croissance. Pour surmonter cette limite, les approches basées sur l'utilisation d'une
cassette de gel en combinaison avec l'analyse d'images pour étudier les paramètres
de croissance des colonies bactériennes individuelles sont un point de départ
intéressant (Brocklehurst et al., 1997 ; Skandamis et al., 2007). En outre, certaines
méthodes directes basées sur la microscopie ont été proposées, telles que la
technique de la chambre d'écoulement et la microscopie en temps réel (Elfwing et al.,
2004 ; Koutsoumanis et Lianou, 2013). La technique de chambre d'écoulement

Chapter 3
98
d'Elfwing et de ses collègues est basée sur la surveillance des divisions consécutives
d'une même cellule. Les cellules individuelles sont cultivées dans un environnement
liquide, tandis que les cellules mères sont fixées à une surface solide (Elfwing et al.,
2004 ; Niven et al., 2006). D'autre part, Koutsoumanis et Lianou (2013) ont présenté
un système moins complexe pour étudier le temps de latence cellulaire par
microscopie de contraste de phase. Cette méthode permet un suivi direct d'une cellule
à une microcolonie en temps réel, mais une seule cellule est suivie à chaque fois. De
plus, les systèmes liquides ont généralement un débit plus élevé et une installation
expérimentale moins complexe (Mertens et al., 2012).
Outre le temps de latence individuel, il est essentiel d'explorer l'impact de la probabilité
de croissance sur les résultats des modèles prédictifs et donc sur l'évaluation de
l'exposition. Augustin et Czarnecka-Kwasiborski ont étudié la probabilité de croissance
de L. monocytogenes dans différentes conditions (c.-à-d. température, pH et activité
de l'eau) en bouillon en utilisant la méthode du nombre le plus probable (NPP)
(Augustin et Czarnecka-Kwasiborski, 2012). Les inconvénients de cette méthode sont,
d'une part, la longue durée de l'expérience (c'est-à-dire trois mois) et, d'autre part, la
grande incertitude des concentrations estimées par la méthode NPP (da Silva et al.,
2019). Dans cette optique, l'objectif de cette étude était de mettre au point une étude
expérimentale quantitative pour déterminer la probabilité de croissance d'une seule
cellule et le temps de latence de différentes souches de L. monocytogenes, en utilisant
une méthode de microscopie automatisée et permettant de gagner du temps.

Chapter 3
99
1.2 English introduction
In the field of predictive microbiology, mathematical models are developed since
decades to describe the bacterial behavior in foods. Multiple (experimental and
biological) factors may affect the bacterial behavior hampering the precise assessment
of bacterial response, especially in harsh environmental conditions (Aryani et al., 2015;
den Besten et al., 2016). Besides the variability between different strains of a species,
the heterogeneity within a population should be taken into account during growth or
inactivation predictions (Aspridou and Koutsoumanis, 2015). Two main approaches
are usually adopted in an experimental design to assess bacterial phenotypes: the
“populational” and the “individual cells” ones. In the first case, the behavior is modeled
without taking into account the variability of the cells that constitute the population. Yet,
not all bacteria in a clonal population react in the same way to environmental changes
(Koutsoumanis and Aspridou, 2017). Indeed, some individual cells can show extreme
tolerance to stressor or extreme sensitivity compared to the majority of the cells within
the population. A particular attention should be paid to the bacterial cells showing
higher resistance to stressful environmental conditions (Aguirre and Koutsoumanis,
2016; Aspridou and Koutsoumanis, 2015; Margot et al., 2016). This enhanced
resistance can promote the persistence of bacterial pathogens (e.g.
L. monocytogenes) in food processing plants and the colonization of new
environments, increasing the risk of food contamination (Pascual et al., 2001). In
addition, a shorter lag time has been reported for bacterial cells with enhanced
resistance to environmental stresses in comparison to sensitive ones (Margot et al.,
2016).
Food matrices are often contaminated with low levels of bacteria (Ross and McMeekin,
2003). Thus, the application of single-cell approach offers the advantage of generating
more realistic scenario. The “individual cells” approach considers the individual
behavior of each cell in an independent manner. The acquisition of data at individual
cell level requires the establishment of methods capable of isolating each cell
individually and at the same time to gather a large number of data (Swinnen et al.,
2004). For the determination of single-cell lag time, different methods are available.
The most commonly practiced rely on the measurement of the optical density in broth
media over time (Smelt et al., 2002). This technique requires that one cell develops a
high number of generations to reach the detection level for turbidity

Chapter 3
100
measurement (~107 cells/ml). Nevertheless, there are certain weaknesses in this
indirect approach especially in particular experimental conditions (e.g. at temperatures
close to bacterial growth limits the experiments will take a long time). In addition, the
fact that this approach is conducted in broth medium makes it harder to transfer results
into solid food matrices. The micro-environment of planktonic cells is indeed quite
different from that of immobilized cells in colonies, thus the bacterial growth capacity
might differ greatly (Verheyen et al., 2019). In case of pathogens’ growth prediction,
the improvement of knowledge on immobilized growth is of greater concern to avoid
over- or under-estimations (Skandamis and Jeanson, 2015). Other indirect methods to
estimate the individual lag time of bacterial growth in solid media were published
(Guillier et al., 2006; Levin-Reisman et al., 2014). These authors proposed a method
based on image analysis of the bacterial colony growth on agar, where the lag times
are estimated by detection times required to form macroscopically visible colonies.
Mertens et al. (2012) published a method based on a similar approach, but the growth
was monitored through the measurement of OD of colonies (Mertens et al., 2012). In
this case, the throughput was improved with the use of 48 well-plates. However, all
these approaches are presenting the same weakness as the indirect method in broth
regarding the time required to reach an observation level, especially in conditions close
to growth limits. To overcome this limit, approaches based on the use of a gel cassette
in combination with image analysis to study the growth parameters of bacterial single
colonies are interesting starting point (Brocklehurst et al., 1997; Skandamis et al.,
2007). In addition, some direct methods have been proposed based on microscopy,
such as the flow chamber technique and the time-lapse microscopy (Elfwing et al.,
2004; Koutsoumanis and Lianou, 2013). Elfwing and colleagues’ flow chamber
technique is based on the monitoring of the consecutive divisions of a single cell
attached to a solid surface (Elfwing et al., 2004; Niven et al., 2006).
Koutsoumanis and Lianou (2013) presented a less complex system to study the single-
cell lag time by contrast phase microscopy. This method allows a direct follow up from
one cell to a microcolony in real-time, but only one cell is recorded at each time. In
addition, the liquid systems generally have a higher throughput and a less complex
experimental setup (Mertens et al., 2012).
Besides the single-cell lag time, it is essential to explore the impact of the growth
probability on the outcome of predictive models and thus exposure assessment.

Chapter 3
101
Augustin and Czarnecka-Kwasiborski studied the single-cell growth probability of
L. monocytogenes in different conditions (i.e. temperature, pH and water activity) in
broth media by using most probable number (MPN) approach (Augustin and
Czarnecka-Kwasiborski, 2012). The drawbacks of this method are, the long
experiment duration (i.e. three months) and, the great uncertainty of concentrations
estimated with the MPN method (da Silva et al., 2019). In this perspective, the objective
of this study was to develop a quantitative experimental investigation to determine the
single-cell growth probability and lag time of different L. monocytogenes strains, using
a time-saving and automated microscopy method.

Chapter 3
102
2 Material and methods
2.1 Strains
Four strains of L. monocytogenes have been tested for establishing the herein
developed method (Table 11). They were selected based on their phenotypic and
genetic diversity. Three of them (i.e. SOR100, AER101 and Lm14) were part of
Symp’Previus project with known cardinal temperatures (i.e. Tmin). Before use, the
strains were stored in cryobeads at 80°C.
Table 11 : Metadata of L. monocytogenes stains
Isolate Origin Tmin
SOR100 Sausage -2.52 °C
AER101 Dairy -0.15 °C
Lm14 Meat processing plant environment -0.86 °C
O228 Shrimp unknown
2.2 Preparation of inocula
The preculture of each strain was carried out by inoculating a cryobead in 10 ml
tryptone soy broth with yeast extract (TSB-YE, Oxoid, UK). After seven hours at 37 °C,
0.1 ml was transfered to 9.9 ml fresh TSB-YE. The dilution was then incubated for 17 h
at 37 °C. Following, successive dilutions were made in tryptone salt diluent
(TS, Biomerieux, UK) to obtain a final concentration of 105 CFU/ml.
2.3 Preparation and storage of the microscope slides
Glass slides were prepared by placing 200 µl of melted tryptone soy agar (TSA, Oxoid)
in the middle of the slide. After a cooling time, 10 µl of the diluted inoculum were
pipetted on the solid layer TSA. The samples were dried in a laminar flow hood for
5 minutes and then covered with a glass coverslip. Following, the prepared glass slides
were put in a sealable box and were stored in the incubator at 4 °C. At each point of
measurement, the required number of slides were pulled out for analyses. Before
starting the microscopic observation, coverslips were fixed with silicone.

Chapter 3
103
2.4 Microscopic observation of cells
For the microscopic observation of the cells, a motorized phase-contrast microscope
(Nikon, Eclipse Ni-E) was used in combination with a 100 x objective and a high-
resolution camera (Nikon, DS-Fi3). Software from Nikon (NIS-Elements, version 4.60)
was applied for automatically capture images in two different areas, each with a surface
of 0.25 mm2, corresponding to 88 images per area (Figure 23).
Figure 23 : Schema of a prepared slide with agar layer and coverslip. The two analyzed areas are highlighted with their dimensions.
2.5 Image analysis procedure
The images were captured in TIFF format. Images were then analyzed with Matlab
(R2018b) including the Image Processing Toolbox™ (Figure 24). The applied image
analysis procedure was previously adapted from Guillier and colleagues (Guillier et al.,
2006). For object recognition, a threshold was estimated to separate pixels associated
to bacterial cells from the TSA background pixels. Because of the variation in thickness
of the TSA, the threshold was adapted for each of the image series. Based on the
threshold, intensities associated to background were displayed in black and those
corresponding to cells in white by using the ind2gray and im2double functions of
Matlab (B). Following, two morphological operations were applied using bwmorph
Matlab function. One to bridge the previously unconnected pixels and another for gap
closing (C). Images with more than three cells or colonies were discarded to avoid bias

Chapter 3
104
due to interactions. The detected objects were filtered out when smaller than a single
L. monocytogenes cell (e.g. arrow in Figure 24 bottom).
As last step of the procedure, each detected object and the relative number of pixels
were exported into a csv file.

Chapter 3
105
Figure 24 : Different process steps of image analysis. A) Captured images; B) Black and white contrast; C) Gap closing; D) Detection of objects corresponding
to the given pixel size threshold. The arrow is highlighting an example of a filtered object according to its size.
A B C D

Chapter 3
106
2.6 Growth curve at population level
For the determination of growth parameters of each tested strain at 4 °C, a total of
20 tubes containing each 50 ml TSA were inoculated with 200 µl of the 105 CFU/ml
suspension to obtain a final concentration of 103 CFU/ml. Kinetics were characterized
with a minimum of 20 data points. Three repetitions were carried out. Growth kinetics
were adjusted with the Baranyi & Roberts primary model (Baranyi and Roberts, 1994)
using the nlsMicrobio package (Baty and Delignette-Muller, 2004) in order to the
population growth parameters (i.e. lag time and growth rate).
2.7 Determination of growth probability
The individual cell growth probability was determined by comparing the number of
single-cells (ns) and number of micro colonies (nc), after a long incubation time at 4°C.
The incubation time was chosen to ensure that the individual cells that did not initiate
growth at that stage have a low probability to still be in lag phase. The relationships
proposed by Guillier and Augustin (2006) were first used to estimate the distribution of
physiological state values (h0i) according to the lag time duration observed at
population level. The 95th percentile of the estimated h0 values (h0i-95) was used to
estimate the incubation time (Tprob) with the following relation h0i-95/µmax. Thus at Tprob,
the probability that an observed single-cell is still a cell in the lag phase is lower than
5 %.
The uncertainty of observed probability of growth at Tobs were calculated by using the
beta distribution (Vose, 1998):
Beta((1-ns)+1, nc+1)
2.8 Individual lag time determination
The estimation of single-cell lag time is based on the vertical distribution method
(d’Arrigo et al., 2006). This method relies on the distribution of numbers of cells
observed in different samples (each sample being inoculated with one cell) after a
given incubation time. The distribution of lag times of the cells is then transposed with
the help of maximum growth rate.
The individual cell lag time ���� was thus determined using the time of observation
Tobs, the cell number per micro colony (ln(x)) and the growth rate (µ) of the

Chapter 3
107
corresponding strain based on number of cells in the microcolony and the growth rate
(Figure 25).
���� = ���� −ln(�)
�
Figure 25 : Schema of the principle to determine single-cell lag time.
Twenty samples were stored in the incubator (4 °C) during the experiment. Then the
samples were analyzed at three different Tobs, to ensure at least that one point of
analysis corresponds to a time where most of the cells have already left lag-time, but
without starting to grow in the third dimension (double-layer and multi-layer). After
microscopic observation is carried out at room temperature in less than 20 minutes,
the samples were destroyed. For each measurement point, new samples were used.
The number of cells per colony was estimated based on the number of pixels per
colony and a correlation function.
The estimated individual lag time distributions were fitted with the lognormal
distribution and the fitdistcens function from fitdistrplus package (Delignette-Muller and
Dutang, 2015). Parametric bootstrap was used to assess credibility interval on
quantiles characterizing the median of individual lag times. The rogme package
(https://github.com/GRousselet/rogme) was used to compare all deciles.

Chapter 3
108
3 Results
3.1 Growth rates
Table 12 shows the population growth parameters at 4 °C for all tested strains. The
strain SOR100 had the longest lag time (58 h) compared to the others. Contrary, the
strain O228 showed the shortest lag time with 28 h.
Regarding the maximal growth rate, AER101 (0.049 h-1) was the fastest while Lm14
(0.038 h-1) the slowest strain under the tested conditions. It is worth to notice that
SOR100 had the highest h0 value with 2.5 and O228 the lowest one with 1.2.
Table 12 : Population growth parameters of the four tested strains with their 95th confidence interval [0.025 0.0975].
SOR100 AER101 Lm14 O228
Lag time [h] 58 [18 94] 44 [23 55] 42 [8 86] 28 [10 43]
maximal growth
rate �� (h-1)
0.044 [0.039 0.052] 0.049 [0.047 0.052] 0.038 [0.035 0.045] 0.043 [0.039 0.045]
Physiological
state h0
2.5 2.2 1.6 1.2
3.2 Determination of cell numbers in the captured images
Figure 26 presents four examples of the captured images. Figure 26a shows a single-
cell of strain AER101 after 3 days at 4 °C. The cell had already initiate cell elongation
(compared to cells at day 0). Figure 26b displays a microcolony of AER101 at Tobs for
lag time determination. Figure 26c and d were both captured at Tprob. The single-cell
(c) was not able to grow in the tested conditions, whereas the Figure 26d presents an
example of a microcolony (with double-layer) developed from a single-cell of the same
strain as in Figure 26 (SOR100).

Chapter 3
109
In order to determine the number of cells in a microcolony from pixel size, a calibration
curve was established for each strain. An example is presented in Figure 27.
Especially, the number of pixels that corresponds to single cells are quite variable,
ranging from 875 to 2624 pixels. In contrast, for the number of pixels corresponding to
microcolonies a lower variability can be observed.
a
c d
b
Figure 26 : Images obtained with phase-contrast microscope (Nikon, Eclipse Ni-E) in combination with a 100 x objective and a high-resolution camera (Nikon, DS-Fi3), the arrow is indicating a double-layer.

Chapter 3
110
Figure 27 : Relationship between the number of cells per colony and the number of pixels for strain O228. The linear regression lines are adjusted with several series of points corresponding to the different repetitions of the experiment; blue=R1, red=R2 and green=R3.
0
0.5
1
1.5
2
2.5
2.5 3 3.5 4 4.5 5 5.5
log 1
0(n
um
ber
of
cells
)
log10(number of pixels)

Chapter 3
111
3.3 Growth probability
Figure 28 shows the difference between the different experiments carried out for the
four strains. The variability observed between experiments is smaller than the
variability between strains. The different experiments were thus merged in a single
dataset for each strain. The comparison of individual cell growth probability according
to the strain was thus carried out on merged dataset. More than 200 observations were
used to determine the growth probability for each strain.
Figure 28 : Cell growth probability at 4 °C of the four L. monocytogenes strains tested according to the different repetitions.
Figure 29 represents the uncertainty distributions of individual cell growth probabilities
for the four tested strains.
The strain SOR100 has the highest growth probability with 81 % [76 %, 85 %]. The
lowest growth probability is represented by strain O228 with 18 % [17 %, 22 %]. For
strain Lm14 a growth probability of 57 % [51 %, 63 %] was determined. It is the second
lowest of the tested strains and significantly different to AER101, SOR100, and O228.
The growth probabilities of the strains SOR100 (81 % [76 %, 85 %]) and AER101
(73 % [67 %, 78 %]) are not significantly different.

Chapter 3
112
Figure 29 : Uncertainty distribution of individual probability of the four strains of L. monocytogenes at 4°C.

Chapter 3
113
3.4 Individual lag times of single-cells
Figure 30 shows the difference between the different experiments carried out for the
four strains. The variability observed between experiments is smaller than the
variability between strains. The different experiments were thus merged in a single
dataset for each strain.
Figure 30 : Median of the individual cell lag times of the four strains tested according to the different repetitions of the experiment.
The range and variability of individual cell lag times are shown in Figure 31A. The
Figure 31B presents the pairwise comparison of deciles of the individual cell lag times.
Regarding Figure 31B1 B3 and B5, O228 strain shows significantly lower deciles.
Individual lag times of strains Lm14 and SOR100 cannot be distinguished (Figure
31B2). The first fifth deciles of strain AER101 are similar to SOR100 and Lm14. The
other deciles for this strain are significantly lower compared to SOR100 and Lm14
(Figure 31B4 and B6).

Chapter 3
114
(A)
(B)
Figure 31 : A) Random individual lag times drawn from fitted lognormal distributions for the four strains. B) Pairwise comparisons of deciles.
B1 B2
B3
B5 B6
B4

Chapter 3
115
4 Discussion
The method presented in this study allows to generate a high amount of observations
for single-cells in harsh conditions in order to estimate lag time and growth probability.
Compared to indirect methods where the duration of the experiment is dependent on
the time needed for a cell to generate enough generations according to the detection
threshold, the proposed microscopy method saves time by reducing the number of
generations to obtain lag time and growth probability results. For instance, Augustin
and Czarnecka-Kwasiborski studied the single-cell growth probability in broth based
on MPN approach (Augustin and Czarnecka-Kwasiborski, 2012). In cold conditions
(5 °C), their experiments took up to three months to determine the growth probability
of L. monocytogenes. The herein developed method was more than six times faster
(less than two weeks) in similar temperature conditions.
Compared to indirect methods, the microscopy appears much faster also regarding the
single-cell lag time determination. Francois and colleagues inoculated microtiter plates
with approximately one cell per well. They determined about 100 individual lag phases
for each set of conditions. Based on a relation between optical density and cell count,
they were able to estimate single-cell lag time. However, the lower limit of linearity for
optical density measurement (around 107 CFU/ml) to estimate the cell concentration
required to overcome 24 generations for one cell to determine the lag time (Francois
et al., 2005). The microscopy method counteracts the drawback of detection limit since
each single-cell can be directly observed. Hence, between these methods a difference
in experimental duration is observed especially in cold conditions, where generations
times are particularly long. In the case of Francois et al (2005), the experiments took
approximately three weeks at 4 °C for lag time determination, whereas the microscopy
method took around one week (depending on the tested strain) at the same
temperature.
Koutsoumanis and Lianou proposed a direct method in agar media based on singe-
cell time-lapse (Koutsoumanis and Lianou, 2013). Compared to optical density
measurement and its correlation to obtain the cell number (Francois et al., 2005), the
advantage of this method is the direct following up of cells. Even though the time to
determine the lag time of one cell is shorter, with this approach it is possible to track
only few cells at the same time. In contrast, the novel approach herein presented
Chapter 3
116
permits to investigate many slides at the same time resulting in a higher amount of
data achievable in comparison to the time-lapse approach. Both these microscopy
approaches permit the following up of cells on agar. Due to the fact that planktonic cell
behave in a different manner compared to immobilized cells, the use of agar better
simulates the food matrix (Skandamis and Jeanson, 2015). Moreover, the colonial
growth dynamics of bacteria in solid foods can be influenced by matrix-specific
interactions and gradients within or around the microcolony (Malakar et al., 2003;
Walker et al., 1997). The above-mentioned method proposed by Elfwing and
colleagues permits to study bacterial mother cells attached to a solid surface and its
daughter cell, however, it is not able to observe colonial growth (Elfwing et al., 2004)
as the case of agar-based methods. Another huge advantage lies in the possibility to
apply dynamic experimental conditions to estimate the growth probability. The slides
can be easily stored in incubator with changing temperature to study the effect of
temperature flows on the bacterial growth ability, for example to reproduce possible
cold chain scenarios.
The presented results for the growth probability are different from those obtained by
Augustin and Czarnecka-Kwasiborski. They used in their study the strain Lm14 and
obtained at 5 °C a growth probability of 14 % [7 %, 20 %), whereas in the present study
the probability of growth for the same strain was 57 % [51 %, 63 %] at 4 °C. One
reason could be explained by the different experimental approach, which is based on
microtiter plates with broth media. In this system, the oxygen transfer to the bottom of
the wells is limited due to missing agitation, likely impacting the growth probability.
Regarding the results for single cell growth probability, a huge variability can be
observed between different L. monocytogenes strains. More precisely, the growth
probability is highly variable between SOR100 and O228 (18 % and 81 %
respectively), highlighting that growth variability could have an impact on exposure
assessment. Interestingly, the strain SOR100 with the lowest minimal growth
temperature (-2.52 °C) showed the highest growth probability at 4 °C and seems thus
more resistant to cold than the other tested strains.
In case of the individual lag time (without prior stress exposure), the work of Francois
and co-workers observed a mean of 40.1 h in broth at 4 °C (Francois et al., 2005). A
similar time was observed for the strain O228 in the present work. However, the

Chapter 3
117
median of individual lag times of O228 was about 70 h shorter compared to the other
here tested strains. The longer lag times compared to those in the study of Francois
and co-workers could be explained by the use of a single strain and/or different culture
media (broth vs agar). Indeed, Koutsoumanis and colleagues showed that growth limits
of L. monocytogenes are affected by the use of solid or liquid media (Koutsoumanis et
al., 2004). They observed a lower growth probability when bacteria are grown on a
solid surface compared to suspensions. They supposed that modifications of the local
environment can lead to a reduced metabolic activity in some regions of the colony.
Although the main purpose of this study was to set up an efficient method for high
throughput phenotypic data generation, between the experimental repetitions of the
four strains unexpected differences were observed. Even when the observed variability
between experiments is smaller than the variability between strains, the variability
could be decreased by the standardization of datasets to correct the sources of
variability between experiments as applied by Guillier et al. (Guillier et al., 2005).
5 Conclusion
This work describes a novel approach to study individual lag times as also single cell
growth probability with a high throughput data generation in a short time. This is a
promising method for the study of bacterial cells’ behaviors in different environmental
conditions (e.g. static or dynamic), during colonial growth starting from a single cell.
Findings from this study demonstrate that the herein presented approach allows to
obtain a high amount of data faster than using indirect or time-lapse methods, even in
extreme experimental conditions. In addition, investigating the growth of microcolonies
on agar gives the advantage of predicting the effects that can influence the colonial
growth dynamics in food matrices.
Acknowledgement
This work received funds from The French National Research Agency under the project
ANR-15-CE21-0011 OPTICOLD. Special thanks go to Dr. Federica Palma for her
kindly aid in reviewing.

General discussion
118
General discussion
When dealing with GWAS and QMRA, there are several questions popping up. In the
following paragraphs, these questions will be addressed and should inspire further
investigations in this field.
Since the beginning of this thesis, which new developments in GWAS happened?
Nowadays, a multiplicity of new methods to conduct microbial GWAS are freely
accessible, well documented and user-friendly. One of these new promising
approaches is DBGWAS (Jaillard et al., 2018). It is an alignment-free end-to-end
bacterial GWAS solution from draft assemblies to associated graph elements. The
offered graphical framework helps to interpret the outcome. DBGWAS does apply the
principle of GEMMA (Zhou and Stephens, 2012), linear mixed model (LMM) proposed
in the “bugwas” method (Earle et al., 2016), to account for population structure. As
reported in a recent benchmarking study on different GWAS approaches (Saber and
Shapiro, 2019), GEMMA is the most efficient method to control for false positive
“errors” caused by population structure. The novelty of DBGWAS consists in the use
of unitigs instead of k-mers. K-mers often lead to redundant descriptions and results
that can be difficult to interpret due to missing information of surrounding sequence of
the k-mers of interest. Unitigs can be defined as high quality contigs. The advantage
of using unitigs is the decrease of computational burden, due to fewer resources
required to count the unitigs, and lower multiple testing burden, as unitigs reduce
redundancy derived by k-mer counting. Additionally, they are easier to interpret than
k-mers because they are usually longer.
What kind of additional analysis could be made based on our genomes?
The GWAS analysis of the accessory genome simply targets genes of interest without
investigating to which compartment they belong. A targeted analysis of the accessory
genome, in particular of mobile genetic elements (MGEs) such as plasmids and
prophages, could thus be made in addition to what has been done in Chapter 1. For
instance, L. monocytogenes plasmids often harbor genes associated to enhanced
survival under acidic, salt and oxidative stress as also contributing to heat and
disinfectant stress survival (Naditz et al., 2019). Plasmid maintenance costs the host
cells energy and imposes metabolic burden, thus it can be also an explanation for

General discussion
119
variability in bacterial growth (Ow et al., 2006). Not only the presence but also the
number of copies of plasmids might affect the growth behavior in the tested conditions.
Besides the plasmids, prophages are important mobile DNA elements (Bushman,
2002). In fact, many virulence factors of bacterial pathogens are phage-coded (Boyd
et al., 2012). Comparing the genomes of closely related bacteria, it comes clear that
prophage sequences have a significant role in shaping differences across the
genomes (Glaser et al., 2001). In this thesis (Chapter 1), the GWAS results show that
several prophages-related accessory genes are statistically associated to the
observed phenotype. This indicates that further analysis focusing on the phagosome
(whole phage content) of L. monocytogenes would be of great interest to find specific
genotypes with a high level of phenotype-association.
By focusing on a gene known to be involved in a particular phenotype (e.g. resistance
to cold, antimicrobials, biocides, etc.), the identification of the surrounding sequence
(often MGEs) from short reads can be challenging. PlasmidTron tries to disentangle
the complex associations between the gene, the linked MGEs (e.g. plasmids and
phages) and the specific phenotypic trait (Page et al., 2018). More precisely, this tool
is specialized on the identification of MGEs that are difficult to assemble from raw reads
due to the numerous repeats which lead to fragmented consensus sequences. This
new promising approach, as well as the above-mentioned unitigs-based GWAS,
should be applied on the present (or expanded) dataset, in order to gain additional
insights on the genetic elements responsible for the phenotypes observed in this
thesis.
How to deal with quantitative phenotypes in GWAS?
The most commonly studied phenotypes in predictive microbiology are quantitative, as
the maximal growth rate, inactivation rate or cardinal values. Dividing strains into well-
defined groups based on a specific trait is often tricky, even in discriminatory conditions
close to growth limits, due to minor differences between strains and uncertainty.
There are different possibilities to use quantitative phenotypic data in association
studies. One simple approach is based on a tree topology comparison. In this
approach, the maximum likelihood phylogenic tree is compared to a neighbor-joining

General discussion
120
dendrogram built on the quantitative phenotypic data and the trees similarity is
statistically analyzed by using Robinson-Folds metric (Supplementary material 8).
A different approach is to study the evolution of the phenotype during time. A
researcher may be interested in whether, for example, a bacterial phenotypic trait (e.g.
lower temperature limit for growth) has evolved in association with environmental
conditions (e.g. temperature) or in association with other traits (e.g. minimal pH limit).
For solving this issue, Phylogenetic Comparative Methods (PCM) are an active field,
that has seen many developments in the last few years (Bastide et al., 2017; Pennell
and Harmon, 2013). Several methods have been specifically developed to study
adaptive evolution (O'Meara, 2012). They rely on different models, such Brownian
motion or OU models that are implemented in R packages (e.g. phytools (Revell,
2012a), l1ou package (https://github.com/khabbazian/l1ou), SURFACE package
(Ingram and Mahler, 2013), PhylogeneticEM (Bastide et al., 2018; Bastide et al.,
2017)). All these modelling approaches have been mainly applied on eukaryotic
organisms, and only few articles described their application to prokaryotes yet (Krause
et al., 2014).
Besides these phylogeny based approaches, a recently developed GWAS approach,
Treewas, can also manage quantitative data as input (Collins and Didelot, 2018).
Is it possible to transform quantitative into qualitative phenotypes?
If a binary input for the phenotype is requested to conduct a GWAS, there is the
possibility to group continuous values into a case and a control group. Therefore, it is
necessary to cluster strains based on the distances between the values of the
quantitative data. Following, the main branches can be associated to case and control
group.
How to deal with the uncertainty of the phenotypes?
As mentioned before, phenotypic data is uncertain (due to measurement uncertainty,
or experimental conditions of reproducibility and repeatability). Uncertainty in
phenotypes can lead to a wrong attribution of a strain to a phenotypic group. In this
work, a temperature of 2 °C was chosen supposing that in this extreme condition, the
differences in strain behaviors would have been easy to observe. It worked out the
experimental set up, and the two groups (e.g. case and control) were separated

General discussion
121
through to a number of days. In contrast, Aryani et al. (2015) showed that the
observable variability is a complex mix of biological patchiness, even when determining
cardinal values as pHmin or [NaCl]max (Aryani et al., 2015).
One possibility to deal with the uncertainty of phenotypes is to use bootstrap in order
to quantify the uncertainty of the outcome. Clustering will be made n-times and at each
outcome a GWAS will be conducted to finally compare the output. For other pathogens
than L. monocytogenes it might be easier to distinguish between uncertainty and
variability as Carlin et al. showed with Bacillus cereus (Carlin et al., 2013).
Another approach applied by Hingston et al. relies on the sole use of the “extreme”
values of the distribution (Hingston et al., 2017). Isolates were classified as sensitive
or tolerant based on their standard deviation from the median of the standardized
maximum growth rate. Within a set of 166 strains, 13 of them were identified as cold
sensitive and 18 as cold tolerant. This kind of approach guarantees that the
phenotypes are well distinguished. On the other hand, the drawback in this case is the
high amount of strains and associated data that is needed to ensure enough strains
on each side of the distribution.
How to validate genetic variants associated to the target phenotype?
As mentioned above, GWAS associate genetic variants to a phenotypic trait. These
associations are evaluated by p-values. These p-values are statistically associations
and not a validation of the outcome. As far as the studied phenotypes are less complex,
the probability to find highly associated variants is enhanced. For example, the
resistance to a specific antibiotic is often related to few genes or single point mutations.
In these cases, a knockout mutant can be created to validate the variant explaining the
phenotype.
In contrast, phenotypes related to food and its processing environment are often linked
to complex networks that involve several genes. The outcome of the genome-wide
analysis showing more than hundreds associated genes or even more SNPs is thus
not surprising. In this context, a validation by knockout would be a heavy workload,
especially testing all the possible combinations. In this case, it would be more
appropriate to perform a validation by testing independent strains that were not
included in the GWAS. For this kind of validation, a number of strains with the
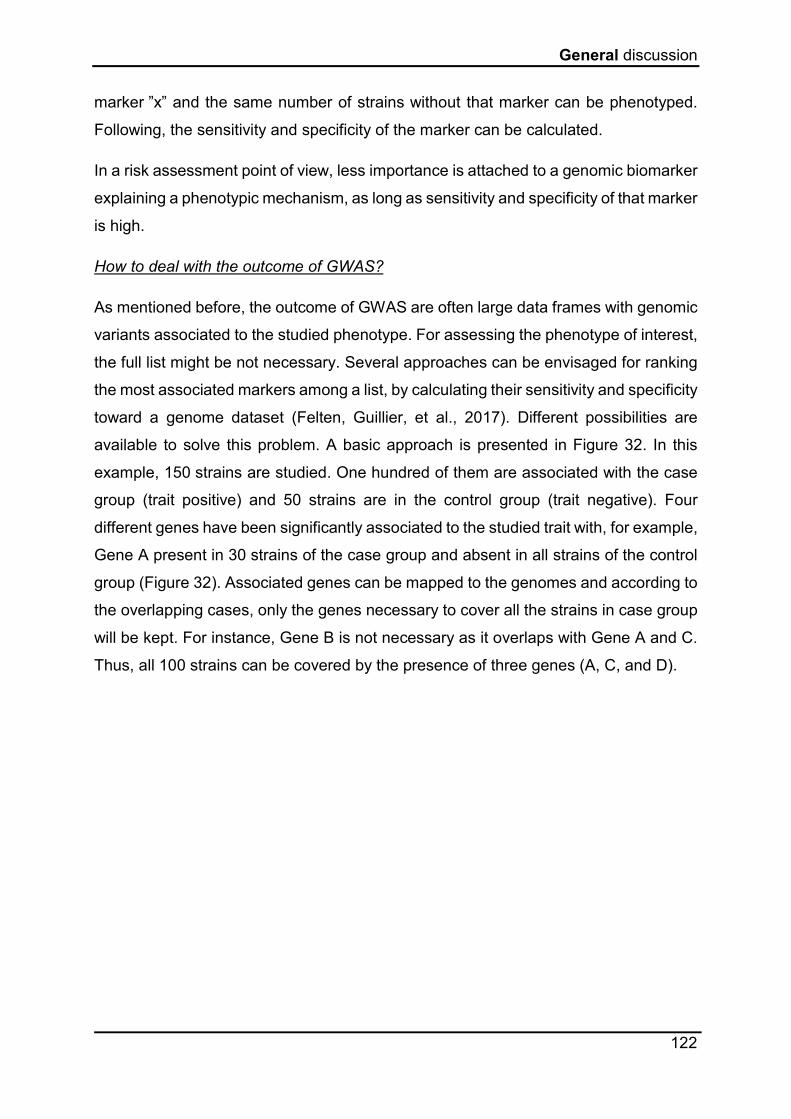
General discussion
122
marker ”x” and the same number of strains without that marker can be phenotyped.
Following, the sensitivity and specificity of the marker can be calculated.
In a risk assessment point of view, less importance is attached to a genomic biomarker
explaining a phenotypic mechanism, as long as sensitivity and specificity of that marker
is high.
How to deal with the outcome of GWAS?
As mentioned before, the outcome of GWAS are often large data frames with genomic
variants associated to the studied phenotype. For assessing the phenotype of interest,
the full list might be not necessary. Several approaches can be envisaged for ranking
the most associated markers among a list, by calculating their sensitivity and specificity
toward a genome dataset (Felten, Guillier, et al., 2017). Different possibilities are
available to solve this problem. A basic approach is presented in Figure 32. In this
example, 150 strains are studied. One hundred of them are associated with the case
group (trait positive) and 50 strains are in the control group (trait negative). Four
different genes have been significantly associated to the studied trait with, for example,
Gene A present in 30 strains of the case group and absent in all strains of the control
group (Figure 32). Associated genes can be mapped to the genomes and according to
the overlapping cases, only the genes necessary to cover all the strains in case group
will be kept. For instance, Gene B is not necessary as it overlaps with Gene A and C.
Thus, all 100 strains can be covered by the presence of three genes (A, C, and D).

General discussion
123
Figure 32 : Schema to reduce variants in associations’ studies.
In a more complex situation, modelling approaches can be applied to handle the
outcome. For instance, Njage and co-workers published two studies that focus on
machine learning-based predictive risk modelling using random forest algorithms
(Njage, Henri, et al., 2019; Njage, Leekitcharoenphon, et al., 2019). Machine learning
algorithms improve with experience. In the study focusing on the virulence genes of
L. monocytogenes, they reduced a list of 136 virulence and stress resistance genes to
13 genes that were the ‘best’ predictors for higher frequency of illness (Njage, Henri,
et al., 2019). Their finding suggest that machine learning approaches are a suitable
solution to handle in the next future the high amount of microbial genomic data
produced today. These approaches would also allow implementing the possible
interactions of predictors with other predictors, which were considered less related to
the associated phenotype yet important in combination with other predictors (Okser et
al., 2013).
An alternative modelling approach to machine learning is the stepwise multinomial
logistic model. This method has been proposed to identify within the genes enriched
in different animal sources. Based on accuracy and the Aikaike Information criterion,
the approach permitted to select 8 genes within the 2,802 accessory genes to predict
the animal source (Guillier et al., 2019).
General discussion
124
Do different GWAS tools provide the same results?
There is clearly a need to benchmark GWAS methods. As mentioned before,
nowadays a variety of GWAS tools have been developed and are freely available.
These methods adopt different correction models and association approaches, just to
mention two examples. Thus, it is necessary to define best practices for microbial
GWAS. The methods should be tested regarding their performance dealing with
different recombination rates, realistic effect sizes and sample sizes. Recently, Saber
and Shapiro (2019) proposed a tool called BacGWASim for benchmarking of new
GWAS methods (Saber and Shapiro, 2019). This pipeline simulates bacterial genomic
dataset with different genotypes (e.g. varying rates of mutation, recombination and
other evolutionary parameters) associated to phenotypes of interest in order to assess
the performance of GWAS approaches.
Sources of variability and number of phenotypes are high in QMRA models; do we
need to introduce biomarkers for all of them?
Regarding QMRA models, a high number of variability sources can be found as
mentioned before. Not all of these sources have the same importance concerning the
outcome of QMRA models, thus the implementation of biomarkers is only meaningful
for the most prioritized sources of microbiological variability. It would be more rational
to identify significant factors that mostly affect the exposure assessment. Therefore,
sensitivity analysis can be conducted to identify and rank the most important factors
(Duret, Guillier, et al., 2014). Ellouze and colleagues published a global sensitivity
analysis applied to a contamination assessment model of L. monocytogenes in cold
smoked salmon at consumption (Ellouze et al., 2010). They showed that the duration
and the temperature of the storage at the domestic refrigerator were identified as major
factors as well as the optimum growth rate, μopt, and the physiological state, h0. This
kind of analysis helps to find concrete entry point to introduce genomic data in
exposure assessment along with to the crucial part: the hazard characterization for
strain virulence (main source of variability).

General discussion
125
What is the bottleneck of application of biomarkers in QMRA?
Since several years, scientists discuss about implementing omics data into risk
assessment (Cocolin, Mataragas, et al., 2018; den Besten et al., 2017; Franz et al.,
2016). So far, few publications proposing approaches or presenting some first steps
towards the implementation of omics in risk assessment are available today (Pielaat et
al., 2015). One reason for that is the lack of robust biomarkers. As mentioned before,
not only the complexity of phenotypes is a big challenge but also their uncertainty and
variability. While it is possible to determine some phenotypes with a high reproducibility
and repeatability, thus a low uncertainty, other phenotypes may be difficult to ascertain.
Especially, dose-response relationships are pretty hard to define entailing a much
higher uncertainty. However, dose-response relationships are of key importance in
QMRA. If the exposure assessment is accurate, but dose-response relationship is
poorly performing, the outcome of the model would be greatly affected. As mentioned
before, dose-response models are often based on animal models or Caco-2 models.
Pouillot et al. proposed a dose-response model that uses the variability observed in a
mice model (with different strains) and the dose-response relationships gained through
quantitative epidemiological data (Pouillot et al., 2015). Unfortunately, epidemiological
quantitative data is rarely available.
The progress of WGS data in surveillance might lead to earlier detection and
identification of the contamination source. This augments the probability to obtain more
quantitative data by analyzing the contaminated lot. Therefore, a future goal will be to
replace mice model data by quantitative epidemiological data and link attack rates to
specific CCs of L. monocytogenes.
Once the biomarkers for specific phenotypes are established, genomic sequences are
needed to investigate the presence or absence of the known predictors. In context of
the industrial application, e.g., when a pathogenic strain is isolated from the production
environment, its ability to persist can be “easily” estimated with the application of known
biomarkers. The isolate should be sequenced and the presence or absence of the
marker in silico determined. However, the applicability of biomarkers in QMRA is
dependent on the knowledge of prevalent genotypes. Therefore, representative
prevalence data for specific food products and regions are needed to align biomarkers
with prevalent strains’ genotype and then predicting the behavior of subpopulations.
General discussion
126
This kind of data is nowadays not available on a sufficient scale. The case of cold
smoked salmon was untangled in this thesis because a large dataset of 294 strains
representative of European’s situation were accessible to conduct a scientifically
sound study. Whereas, a lower number of sequences was available for other food
categories and thus not enough representative to conduct QMRA based on the
selected data sets.
The amount of prevalence data will increase since WGS became the standard method
for investigations in many countries. Consequently, the behavior of subpopulations
might be predicted more accurately than at present.
How would it be possible to obtain robust biomarkers for prediction?
The number of sequenced genomes has to be fairly high when performing GWAS
studies to obtain robust biomarkers. Automated platforms can be implemented today
for affordable DNA extraction and wide-scale sequencing. These platforms allow a high
throughput with reasonable effort. On the other hand, laboratory experiments to
estimate reliable phenotypes of several hundreds to thousands of strains is more
challenging. For this, specialized platforms enabling fast, automated and high
throughput phenotyping with a wide applicability across laboratories are in demand.
Multiwell format platforms, such as bioscreen© or biolog©, provide numerous features
allowing quantitative measurement on large scale. Through these technologies,
samples are isolated in wells and different conditions can be adjusted per well (adding
compounds) as also different sizes of inoculum. Contents of each well can be
monitored at each time automatically. However, ready-to use systems more efficient
for the end-users are also available. An example of such a platform is the microfluidic
platform from Amselem et al. (2016). It provides all necessary for end-users: a culturing
environment (liquid or gel) to relate phenotype and genotype measurements on clonal
colonies in multiwall plates (Amselem et al., 2016). The optimal goal for phenotyping
are lab-on-a-chip (LOC) models. These systems can handle thousands of
measurements in parallel for phenotypes like antibiotic susceptibility or microbial
physiology by using droplet microfluidics (Kaminski et al., 2016). The development of
such miniaturized and highly automated technologies takes several years. Starting by
simple manual protocols and extending the automation combining complex protocols
is a challenge of LOC, as also the development from few large reactors to many ultra-
General discussion
127
small reactors. These LOC systems are currently not available on the market, but once
accessible and affordable, they will revolutionize the high throughput phenotyping.
What has to be done to make of the microscopy method a platform for phenotyping?
The herein developed microscopy method represents a promising possibility for high
throughput determination of individual lag time and growth probability. Different points
of this method should be optimized in order to create a platform for quantitative
measurements applicable by any end-user. Instead of object slides, multi well plates
with a thin agar layer could be implemented for phase-contrast microscopy. The agar
could then be inoculated by a multichannel pipette. The development of a specific
program for guiding the motorized board would be helpful to automatically scan every
well (including stack in z-direction). This equipment combined with an ad hoc software
to analyze the high amount of data could be a promising platform in the future.
Which are the possible applications of the proposed microscopy method?
The method developed in this thesis opens the door to different possibilities of
application. As already mentioned, temperatures are often fluctuating along the cold
chain. Thus, studying the impact of dynamic changes in temperatures on the bacterial
behavior would be of great interest.
The microscopy approach also enable to monitor the follow up of interactions between
the pathogen of interest and the background flora or any other competitive
contaminations.
An interesting approach is the adaptation of the agar to simulate food matrices. For
instance, Overney and colleagues proposed a modified broth to mimic smoked salmon
(Overney et al., 2016). Moreover, in a recent work, Verheyen et al. (2019) discuss also
the impact of food microstructure and fat content, which appear to affect the growth
dynamics of L. monocytogenes in a fish-based model (Verheyen et al., 2019).
Regarding the observed differences in lag time and growth probability, what could be
additionally investigated?
For a better understanding of the results of Chapter 3 (single cell lag time and growth
probability), more comprehensive experiments should be carried out. Especially the
strain O228, which showed short lag times but a low growth probability, should be in

General discussion
128
the center of interest. For instance, microscopy could be used in combination with
fluorescent reporter genes for a better understanding of the physiological mechanisms
during adaptation. Français et al. (2019) recently published such kind of approach for
Bacillus cereus (Français et al., 2019). Using a microscopy method, they searched
potential lag time molecular markers at low temperature (12 °C) and low pH (5),
identifying the cshA gene as reliable marker for Bacillus cereus’ lag phase. This marker
is systematically expressed during lag phase, before initiation of growth, even during
exposure to cold and acidic conditions.
Differences in lag time and growth probability between the strains could be also
explained by the presence of plasmids. Plasmids can be an advantage for adaptation,
but their maintenance imposes a metabolic burden on the host cells, resulting in
reduced growth rate and cell density (Ow et al., 2006). Depending on the number of
plasmid copies, the growth rate may change (e.g. decrease with the increasing of
copies) (Bentley et al., 1990). In this perspective, one hypothesis could be that strains
harboring large plasmids or a high number of copies of small plasmids have a longer
lag time due to the metabolic burden for the maintenance of plasmids. However, once
they initiated growth, they are better adapted to cold thanks to the genes sheltered in
the plasmid, finally showing a higher growth probability. In contrast, strains without
plasmids will start to grow earlier but with less success (low growth probability).
Regarding single-cell level observed in this study, the differences between cells to
initiate growth or not could be explained by this reason. As MGEs can exchange easily,
the burden to overcome adaptation and starting to growth is variable due to huge
differences in the accessory genomes between single cells. In order to confirm this
presumption, the strains should be sequenced and a plasmid targeted analysis
performed.
QMRA towards future, what will be the challenge?
Besides the already mentioned problems, a careful evaluation of the bioinformatics
infrastructure and data storage possibilities should be considered. As suggested
above, huge amounts of data are needed to improve the quality of biomarkers and
prevalence data across different food production chains. Thus, big data management
will be included in future work. Servers of computing and storage along with competent
human resources are costly. Nowadays, it is possible to easily download genomic

General discussion
129
sequences (e.g., reads or assemblies) from public databases as NCBI, but QMRA
models require phenotypic data too. A databank combining harmonized genotypic and
phenotypic (e.g. persistence in food processing environment) information together with
strains metadata would be the ultimate accomplishment for QMRA scientists and
beyond. However, its realization will be extremely challenging, if not unreachable in
the next future.

Conclusion and future perspectives
130
Conclusion and future perspectives
1 Conclusion
The discovery of genomic markers for phenotype prediction through genome wide
association studies have the potential to refine QMRA models. For this reason, the first
aim of this thesis was the exploration and application of different tools to conduct
GWAS. Three different approaches that cover the pan-genome as also a
phylogenomic-based method were applied to a set of 51 L. monocytogenes strains to
detect the genomic features associated with their ability to grow at low
temperatures (2 °C). Several genes and SNPs, as well as specific phylogenetic
sublineages, were identified as associated to L. monocytogenes' growth at low
temperatures. These biomarkers can feed QMRA models in future studies to perform
risk assessments targeted to the subpopulations that pose the greatest risk, i.e.
isolates with higher ability to survive and/or grow in the food chain.
Results from the second study of this thesis emphasize the asset of implementing
genomic data into a QMRA model. The contribution of WGS-based subtyping data was
evaluated in a view of QMRA model refinement. Even if this model refinement is still
using some strong hypotheses (e.g. virulence and minimal growth temperature), this
work highlighted the potential impact of implementing genomic data in QMRA. The
development of new genomic-based approaches in QMRA, as presented in this work,
is still in its infancy and more time and comprehensive data are required to generate
accurate models with the implementation of genomic data.
To obtain robust genetic markers, large-scale data sets are necessary. DNA extraction
and sequencing are already fully-automated with high throughput. However, for the
selected number of genomes, the same number of strains has to be phenotypically
characterized. Experiments for phenotyping performed on large data sets are often
time-consuming and labor-intensive. The microscopy method presented in this thesis
is the first step towards a high throughput method at the single-cell level. Thanks to
further automatization in sample preparing and image acquisition, the next goals will
be to characterize a high number of strains (or conditions). This method allows applying
various conditions like temperature, pH and aw.
Conclusion and future perspectives
131
2 Perspectives
This work has shown that future QMRA will demand certain interdisciplinary
approaches. Knowledge on WGS-based analytical approaches as well as the
necessary bioinformatics skills to manage Unix-, Python- and R-based open-source
tools were acquired during this thesis. Freely available open-source bioinformatics
tools have been essential to reach the goal of this thesis. Nevertheless, knowledge
about the physiology of the targeted pathogen and expertise in bacterial behavior
under different conditions remained indispensable to carry out QMRA studies.
Soon, the evolution and integration of omics sciences could result in better risk
estimation and thus improve risk management measures. Potentially, it might improve
the hazard identification step (i.e. hypervirulence linked to CCs) and thus the risk
analysis could be adapted to particular bacterial population subgroups. Such a new
approach could lead to changes in risk management activities by food authorities and
companies (e.g. by adapting or by refining the intervention). However, considerable
improvements and agreements are still needed before Food Safety Authorities will
form their opinions based on genomic data. Therefore, it is necessary to reach full
confidence in the robustness of the data and to convince FBO of the reliability and
benefit of the use of the new genomic-based achievements. Especially, the potential
risk might be re-evaluated for the food categories where L. monocytogenes
hypervirulent strains are prevalent.
In that perspective, risk communication will take a central role once genomic data will
be fully implemented. Scientists are charged with responsibility because genomic-
based behavior prediction can be easily misinterpreted. In particular, when speaking
about risk and the associated virulence, great attention should be paid to “how to
communicate the results” to make sure that for example, hypovirulence is not equal to
no risk.

Valorization
132
Valorization
___________________________________________________________________
Publications:
Next generation quantitative microbiological risk assessment: Refinement of the
cold smoked salmon-related listeriosis risk model by integrating genomic data.
Lena Fritsch, Laurent Guillier and Jean-Christophe Augustin.
Microbial Risk Analysis, Volume 10, December 2018, Pages 20-27.
Insights from genome-wide approaches to identify variants associated to
phenotypes at pan-genome scale: Application to Listeria monocytogenes' ability
to grow in cold conditions.
Lena Fritsch, Arnaud Felten, Federica Palma, Jean-François Mariet, Nicolas
Radomski, Michel-Yves Mistou, Jean-Christophe Augustin, Laurent Guillier.
International Journal of Food Microbiology.
___________________________________________________________________
Oral communications:
ICPMF11 Bragança, (Portugal), September 2019.
Determination of growth probability and lag time at single cell level by the use of an
automated microscopy method
Lena Fritsch, Adrienne Lintz, Abirami Baleswaran, Bernard Hézard, Erwann Hamon,
Hélène Bergis, Jean-Christophe Augustin, Laurent Guillier, Valérie Stahl
Colloquium: Experiences in Listeria consulting, Bern, (Switzerland), August 2019.
Opportunities of Whole Genome Sequencing

Valorization
133
EFET/EFSA Workshop L. monocytogenes in RTE meat products, Athens
(Greece), February 2019.
The use of Whole Genome Sequencing in Risk Assessment
IAFP US, Salt Lake City (USA), July 2018.
Core and Accessory Genome-Wide Association Studies to Investigate Genetic
Determinants Involved in L.monocytogenes Cold Adaptation.
Lena Fritsch, Arnaud Felten, Jean-François Mariet, Jean-Christophe Augustin and
Laurent Guillier.
Workshop Listeria NRL, Teramo (Italy), June 2018.
Clonal Clomplex grouping in L.monocytogenes and implication regarding origin and
virulence.
Lena Fritsch, Benjamin Félix and Laurent Guillier.
IAFP Europe, Stockholm (Sweden), April 2018.
Integrating WGS data into Quantitative Microbial Risk Assessment: Refinement of the
L.monocytogenes in cold smoked salmon model.
Lena Fritsch, Laurent Guillier and Jean-Christophe Augustin.
ICPMF 10, Cordoba (Spain), September 2017.
Modelling approaches for Geno-Phenotype Association Studies based on WGS:
Application on L. monocytogenes.
Lena Fritsch, Arnaud Felten, Jean-François Mariet, Jean-Christophe Augustin and
Laurent Guillier.
Valorization
134
___________________________________________________________________
Poster presentations
IAFP Europe, Brussels (Belgium), March 2017.
Can Listeria monocytogenes growth variability be explained by the genotype?
Lena Fritsch, Anne-Laure Lardeux, Damien Michelon, Jean-Christophe Augustin and
Laurent Guillier
(Supplementary material 8)
ICPMF 10, Cordoba (Spain), September 2017.
Including genotypic data into quantitative microbial risk assessment: Application on
Listeria monocytogenes in cold smoked salmon.
Lena Fritsch, Laurent Guillier, Charlotte Lebouleux and Jean-Christophe Augustin.
(Supplementary material 9)

References
135
References
Abee, T., Koomen, J., Metselaar, K., Zwietering, M., Den Besten, H., 2016. Impact of pathogen population heterogeneity and stress-resistant variants on food safety. Annual review of food science and technology 7, 439-456.
Aguirre, J.S., Koutsoumanis, K.P., 2016. Towards lag phase of microbial populations at growth-limiting conditions: The role of the variability in the growth limits of individual cells. International journal of food microbiology 224, 1-6.
Alam, M.T., Petit III, R.A., Crispell, E.K., Thornton, T.A., Conneely, K.N., Jiang, Y., Satola, S.W., Read, T.D., 2014. Dissecting vancomycin-intermediate resistance in Staphylococcus aureus using genome-wide association. Genome biology and evolution 6, 1174-1185.
Allerberger, F., Wagner, M., 2010. Listeriosis: a resurgent foodborne infection. Clinical Microbiology and Infection 16, 16-23.
Amselem, G., Guermonprez, C., Drogue, B., Michelin, S., Baroud, C.N., 2016. Universal microfluidic platform for bioassays in anchored droplets. Lab on a Chip 16, 4200-4211.
Andrews, S., 2010. FastQC: a quality control tool for high throughput sequence data. Angelidis, A.S., Smith, G.M., 2003. Role of the glycine betaine and carnitine
transporters in adaptation of Listeria monocytogenes to chill stress in defined medium. Appl. Environ. Microbiol. 69, 7492-7498.
Angelo, K., Conrad, A., Saupe, A., Dragoo, H., West, N., Sorenson, A., Barnes, A., Doyle, M., Beal, J., Jackson, K., 2017. Multistate outbreak of Listeria monocytogenes infections linked to whole apples used in commercially produced, prepackaged caramel apples: United States, 2014–2015. Epidemiology & Infection 145, 848-856.
Annous, B.A., Becker, L.A., Bayles, D.O., Labeda, D.P., Wilkinson, B.J., 1997. Critical role of anteiso-C15: 0 fatty acid in the growth of Listeria monocytogenes at low temperatures. Appl. Environ. Microbiol. 63, 3887-3894.
Ansari, M.A., Didelot, X., 2016. Bayesian Inference of the Evolution of a Phenotype Distribution on a Phylogenetic Tree. Genetics 204, 89-98.
ANSES, 2011. Listeria monocytogenes : Fiche de description de danger biologique transmissible par les aliments. . Edited by Anses - Agence nationale de sécurité sanitaire.
Arakawa, T., Timasheff, S., 1985. The stabilization of proteins by osmolytes. Biophysical journal 47, 411-414.
Arguedas-Villa, C., Stephan, R., Tasara, T., 2010. Evaluation of cold growth and related gene transcription responses associated with Listeria monocytogenes strains of different origins. Food Microbiology 27, 653-660.
Aryani, D., Den Besten, H., Hazeleger, W., Zwietering, M., 2015. Quantifying strain variability in modeling growth of Listeria monocytogenes. International journal of food microbiology 208, 19-29.
Aspridou, Z., Koutsoumanis, K.P., 2015. Individual cell heterogeneity as variability source in population dynamics of microbial inactivation. Food Microbiology 45, 216-221.
Augustin, J.-C., Czarnecka-Kwasiborski, A., 2012. Single-cell growth probability of Listeria monocytogenes at suboptimal temperature, pH, and water activity. Frontiers in microbiology 3, 157.
Authority, E.F.S., Prevention, E.C.f.D., Control, 2018. Multi‐country outbreak of Listeria monocytogenes serogroup IV b, multi‐locus sequence type 6, infections linked
References
136
to frozen corn and possibly to other frozen vegetables–first update. EFSA Supporting Publications 15, 1448E.
Bajard, S., Rosso, L., Fardel, G., Flandrois, J., 1996. The particular behaviour of Listeria monocytogenes under sub-optimal conditions. International journal of food microbiology 29, 201-211.
Balding, D.J., 2006. A tutorial on statistical methods for population association studies. Nature Reviews Genetics 7, 781.
Bankevich, A., Nurk, S., Antipov, D., Gurevich, A.A., Dvorkin, M., Kulikov, A.S., Lesin, V.M., Nikolenko, S.I., Pham, S., Prjibelski, A.D., 2012. SPAdes: a new genome assembly algorithm and its applications to single-cell sequencing. Journal of computational biology 19, 455-477.
Bao, Y.-J., Shapiro, B.J., Lee, S.W., Ploplis, V.A., Castellino, F.J., 2016. Phenotypic differentiation of Streptococcus pyogenes populations is induced by recombination-driven gene-specific sweeps. Scientific Reports 6.
Baranyi, J., 1998. Comparison of stochastic and deterministic concepts of bacterial lag. Journal of theoretical biology 192, 403-408.
Baranyi, J., Roberts, T.A., 1994. A dynamic approach to predicting bacterial growth in food. International journal of food microbiology 23, 277-294.
Barria, C., Malecki, M., Arraiano, C., 2013. Bacterial adaptation to cold. Microbiology 159, 2437-2443.
Bastide, P., Ané, C., Robin, S., Mariadassou, M., 2018. Inference of adaptive shifts for multivariate correlated traits. Systematic biology 67, 662-680.
Bastide, P., Mariadassou, M., Robin, S., 2017. Detection of adaptive shifts on phylogenies by using shifted stochastic processes on a tree. Journal of the Royal Statistical Society: Series B (Statistical Methodology) 79, 1067-1093.
Baty, F., Delignette-Muller, M.-L., 2004. Estimating the bacterial lag time: which model, which precision? International journal of food microbiology 91, 261-277.
Bayles, D., Wilkinson, B., 2000. Osmoprotectants and cryoprotectants for Listeria monocytogenes. Letters in Applied Microbiology 30, 23-27.
Becker, L.A., Evans, S.N., Hutkins, R.W., Benson, A.K., 2000. Role of ςB in Adaptation ofListeria monocytogenes to Growth at Low Temperature. Journal of bacteriology 182, 7083-7087.
Bentley, D.R., Balasubramanian, S., Swerdlow, H.P., Smith, G.P., Milton, J., Brown, C.G., Hall, K.P., Evers, D.J., Barnes, C.L., Bignell, H.R., 2008. Accurate whole human genome sequencing using reversible terminator chemistry. Nature 456, 53.
Bentley, W.E., Mirjalili, N., Andersen, D.C., Davis, R.H., Kompala, D.S., 1990. Plasmid‐encoded protein: the principal factor in the “metabolic burden” associated with recombinant bacteria. Biotechnology and bioengineering 35, 668-681.
Bertsch, D., Rau, J., Eugster, M.R., Haug, M.C., Lawson, P.A., Lacroix, C., Meile, L., 2013. Listeria fleischmannii sp. nov., isolated from cheese. International journal of systematic and evolutionary microbiology 63, 526-532.
Beumer, R., Te Giffel, M., Cox, L., Rombouts, F., Abee, T., 1994. Effect of exogenous proline, betaine, and carnitine on growth of Listeria monocytogenes in a minimal medium. Appl. Environ. Microbiol. 60, 1359-1363.
Bolger, A.M., Lohse, M., Usadel, B., 2014. Trimmomatic: a flexible trimmer for Illumina sequence data. Bioinformatics 30, 2114-2120.
Booth, I.R., 2002. Stress and the single cell: intrapopulation diversity is a mechanism to ensure survival upon exposure to stress. International journal of food microbiology 78, 19-30.

References
137
Borezee, E., Pellegrini, E., Berche, P., 2000. OppA of Listeria monocytogenes, an oligopeptide-binding protein required for bacterial growth at low temperature and involved in intracellular survival. Infection and immunity 68, 7069-7077.
Boyd, E.F., Carpenter, M.R., Chowdhury, N., 2012. Mobile effector proteins on phage genomes. Bacteriophage 2, 139-148.
Brocklehurst, T., Mitchell, G., Smith, A., 1997. A model experimental gel-surface for the growth of bacteria on foods. Food Microbiology 14, 303-311.
Brosch, R., Chen, J., Luchansky, J.B., 1994. Pulsed-field fingerprinting of listeriae: identification of genomic divisions for Listeria monocytogenes and their correlation with serovar. Appl. Environ. Microbiol. 60, 2584-2592.
Brüssow, H., Canchaya, C., Hardt, W.-D., 2004. Phages and the evolution of bacterial pathogens: from genomic rearrangements to lysogenic conversion. Microbiol. Mol. Biol. Rev. 68, 560-602.
Brynildsrud, O., Bohlin, J., Scheffer, L., Eldholm, V., 2016. Rapid scoring of genes in microbial pan-genome-wide association studies with Scoary. Genome biology 17, 238.
Buchanan, C.J., Webb, A.L., Mutschall, S.K., Kruczkiewicz, P., Barker, D.O., Hetman, B.M., Gannon, V.P., Abbott, D.W., Thomas, J.E., Inglis, G.D., 2017. A Genome-Wide Association Study to Identify Diagnostic Markers for Human Pathogenic Campylobacter jejuni Strains. Frontiers in microbiology 8.
Buchanan, R., Lindqvist, R., Ross, T., Smith, M., Todd, E., Whiting, R., 2004. Risk assessment of Listeria monocytogenes in ready-to-eat foods-Interpretative Summary.
Buchanan, R.L., 1993. Predictive food microbiology. Trends in food science & technology 4, 6-11.
Buchanan, R.L., Damert, W.G., Whiting, R.C., van SCHOTHORST, M., 1997. Use of epidemiologic and food survey data to estimate a purposefully conservative dose-response relationship for Listeria monocytogenes levels and incidence of listeriosis. Journal of food protection 60, 918-922.
Buchanan, R.L., Gorris, L.G.M., Hayman, M.M., Jackson, T.C., Whiting, R.C., 2017. A review of Listeria monocytogenes: An update on outbreaks, virulence, dose-response, ecology, and risk assessments. Food Control 75, 1-13.
Buchanan, R.L., Smith, J.L., Long, W., 2000. Microbial risk assessment: dose-response relations and risk characterization. International journal of food microbiology 58, 159-172.
Buchrieser, C., Rusniok, C., Consortium, L., Kunst, F., Cossart, P., Glaser, P., 2003. Comparison of the genome sequences of Listeria monocytogenes and Listeria innocua: clues for evolution and pathogenicity. FEMS Immunology & Medical Microbiology 35, 207-213.
Bushman, F., 2002. Lateral DNA transfer: mechanisms and consequences. Cold Spring Harbor Laboratory Press Cold Spring Harbor, NY:.
Cabrita, P., Batista, S., Machado, H., Moes, S., Jenö, P., Manadas, B., Trigo, M.J., Monteiro, S., Ferreira, R.B., Brito, L., 2013. Comparative analysis of the exoproteomes of Listeria monocytogenes strains grown at low temperatures. Foodborne pathogens and disease 10, 428-434.
Cacace, G., Mazzeo, M.F., Sorrentino, A., Spada, V., Malorni, A., Siciliano, R.A., 2010. Proteomics for the elucidation of cold adaptation mechanisms in Listeria monocytogenes. Journal of proteomics 73, 2021-2030.
Carlin, F., Albagnac, C., Rida, A., Guinebretière, M.-H., Couvert, O., Nguyen-the, C., 2013. Variation of cardinal growth parameters and growth limits according to

References
138
phylogenetic affiliation in the Bacillus cereus Group. Consequences for risk assessment. Food Microbiology 33, 69-76.
Carpentier, B., Cerf, O., 2011. Persistence of Listeria monocytogenes in food industry equipment and premises. International journal of food microbiology 145, 1-8.
Carriço, J., Rossi, M., Moran-Gilad, J., Van Domselaar, G., Ramirez, M., 2018. A primer on microbial bioinformatics for nonbioinformaticians. Clinical Microbiology and Infection 24, 342-349.
Carrico, J., Sabat, A., Friedrich, A., Ramirez, M., 2013. Bioinformatics in bacterial molecular epidemiology and public health: databases, tools and the next-generation sequencing revolution. Eurosurveillance 18, 20382.
Cerutti, F., Mallet, L., Painset, A., Hoede, C., Moisan, A., Bécavin, C., Duval, M., Dussurget, O., Cossart, P., Gaspin, C., 2017. Unraveling the evolution and coevolution of small regulatory RNAs and coding genes in Listeria. BMC genomics 18, 882.
Cetin, M.S., Zhang, C., Hutkins, R.W., Benson, A.K., 2004. Regulation of transcription of compatible solute transporters by the general stress sigma factor, σB, in Listeria monocytogenes. Journal of bacteriology 186, 794-802.
Chan, Y.C., Hu, Y., Chaturongakul, S., Files, K.D., Bowen, B.M., Boor, K.J., Wiedmann, M., 2008. Contributions of two-component regulatory systems, alternative σ factors, and negative regulators to Listeria monocytogenes cold adaptation and cold growth. Journal of food protection 71, 420-425.
Chan, Y.C., Raengpradub, S., Boor, K.J., Wiedmann, M., 2007. Microarray-based characterization of the Listeria monocytogenes cold regulon in log-and stationary-phase cells. Appl. Environ. Microbiol. 73, 6484-6498.
Chan, Y.C., Wiedmann, M., 2008. Physiology and genetics of Listeria monocytogenes survival and growth at cold temperatures. Critical reviews in food science and nutrition 49, 237-253.
Charlier, C., Perrodeau, É., Leclercq, A., Cazenave, B., Pilmis, B., Henry, B., Lopes, A., Maury, M.M., Moura, A., Goffinet, F., 2017. Clinical features and prognostic factors of listeriosis: the MONALISA national prospective cohort study. The Lancet Infectious Diseases 17, 510-519.
Chaston, J.M., Newell, P.D., Douglas, A.E., 2014. Metagenome-wide association of microbial determinants of host phenotype in Drosophila melanogaster. mBio 5, e01631-01614.
Chaturongakul, S., Raengpradub, S., Palmer, M.E., Bergholz, T.M., Orsi, R.H., Hu, Y., Ollinger, J., Wiedmann, M., Boor, K.J., 2011. Transcriptomic and phenotypic analyses identify coregulated, overlapping regulons among PrfA, CtsR, HrcA, and the alternative sigma factors σB, σC, σH, and σL in Listeria monocytogenes. Appl. Environ. Microbiol. 77, 187-200.
Chen, P.E., Shapiro, B.J., 2015. The advent of genome-wide association studies for bacteria. Current opinion in microbiology 25, 17-24.
Chen, Y., Gonzalez-Escalona, N., Hammack, T.S., Allard, M.W., Strain, E.A., Brown, E.W., 2016. Core genome multilocus sequence typing for identification of globally distributed clonal groups and differentiation of outbreak strains of Listeria monocytogenes. Appl. Environ. Microbiol. 82, 6258-6272.
Chen, Y., Luo, Y., Curry, P., Timme, R., Melka, D., Doyle, M., Parish, M., Hammack, T.S., Allard, M.W., Brown, E.W., 2017. Assessing the genome level diversity of Listeria monocytogenes from contaminated ice cream and environmental samples linked to a listeriosis outbreak in the United States. PloS one 12, e0171389.

References
139
Chen, Y., Ross, W., Scott, V.N., E, G.D., 2003. Listeria monocytogenes: low levels equal low risk. Journal of food protection 66, 570-577.
Chen, Y., Ross, W.H., Gray, M.J., Wiedmann, M., Whiting, R.C., Scott, V.N., 2006. Attributing risk to Listeria monocytogenes subgroups: dose response in relation to genetic lineages. Journal of food protection 69, 335-344.
Chewapreecha, C., Marttinen, P., Croucher, N.J., Salter, S.J., Harris, S.R., Mather, A.E., Hanage, W.P., Goldblatt, D., Nosten, F.H., Turner, C., 2014. Comprehensive identification of single nucleotide polymorphisms associated with beta-lactam resistance within pneumococcal mosaic genes. PLoS genetics 10, e1004547.
Cocolin, L., Mataragas, M., Bourdichon, F., Doulgeraki, A., Pilet, M.-F., Jagadeesan, B., Rantsiou, K., Phister, T., 2018. Next generation microbiological risk assessment meta-omics: The next need for integration. International journal of food microbiology 287, 10-17.
Cocolin, L., Membré, J.-M., Zwietering, M., 2018. Integration of omics into MRA. International journal of food microbiology 287, 1-2.
Collins, C., Didelot, X., 2018. A phylogenetic method to perform genome-wide association studies in microbes that accounts for population structure and recombination. PLoS computational biology 14, e1005958.
Cordero, N., Maza, F., Navea-Perez, H., Aravena, A., Marquez-Fontt, B., Navarrete, P., Figueroa, G., González, M., Latorre, M., Reyes-Jara, A., 2016. Different transcriptional responses from slow and fast growth rate strains of Listeria monocytogenes adapted to low temperature. Frontiers in microbiology 7.
Coroller, L., Kan-King-Yu, D., Leguerinel, I., Mafart, P., Membré, J.-M., 2012. Modelling of growth, growth/no-growth interface and nonthermal inactivation areas of Listeria in foods. International journal of food microbiology 152, 139-152.
Cummins, A., Fielding, A., McLauchlin, J., 1994. Listeria ivanovii infection in a patient with AIDS. Journal of infection 28, 89-91.
da Silva, N.B., Carciofi, B.A.M., Ellouze, M., Baranyi, J., 2019. Optimization of turbidity experiments to estimate the probability of growth for individual bacterial cells. Food Microbiology 83, 109-112.
De Valk, H., Vaillant, V., Jacquet, C., Rocourt, J., Le Querrec, F., Stainer, F., Quelquejeu, N., Pierre, O., Pierre, V., Desenclos, J.-C., 2001. Two consecutive nationwide outbreaks of listeriosis in France, October 1999–February 2000. American Journal of Epidemiology 154, 944-950.
Delignette-Muller, M., Cornu, M., Pouillot, R., Denis, J.-B., 2006. Use of bayesian modelling in risk assessment: application to growth of Listeria monocytogenes and food flora in cold-smoked salmon. International journal of food microbiology 106, 195-208.
Delignette-Muller, M.L., Dutang, C., 2015. fitdistrplus: An R package for fitting distributions. Journal of Statistical Software 64, 1-34.
den Bakker, H.C., Cummings, C.A., Ferreira, V., Vatta, P., Orsi, R.H., Degoricija, L., Barker, M., Petrauskene, O., Furtado, M.R., Wiedmann, M., 2010. Comparative genomics of the bacterial genus Listeria: Genome evolution is characterized by limited gene acquisition and limited gene loss. BMC genomics 11, 688.
den Bakker, H.C., Warchocki, S., Wright, E.M., Allred, A.F., Ahlstrom, C., Manuel, C.S., Stasiewicz, M.J., Burrell, A., Roof, S., Strawn, L.K., 2014. Listeria floridensis sp. nov., Listeria aquatica sp. nov., Listeria cornellensis sp. nov., Listeria riparia sp. nov. and Listeria grandensis sp. nov., from agricultural and natural

References
140
environments. International journal of systematic and evolutionary microbiology 64, 1882-1889.
den Besten, H.M., Amézquita, A., Bover-Cid, S., Dagnas, S., Ellouze, M., Guillou, S., Nychas, G., O'Mahony, C., Pérez-Rodriguez, F., Membré, J.-M., 2017. Next generation of microbiological risk assessment: Potential of omics data for exposure assessment. International journal of food microbiology.
den Besten, H.M., Aryani, D.C., Metselaar, K.I., Zwietering, M.H., 2016. Microbial variability in growth and heat resistance of a pathogen and a spoiler: All variabilities are equal but some are more equal than others. International journal of food microbiology.
den Besten, H.M.W., Arvind, A., Gaballo, H.M., Moezelaar, R., Zwietering, M.H., Abee, T., 2010. Short-and long-term biomarkers for bacterial robustness: a framework for quantifying correlations between cellular indicators and adaptive behavior. PloS one 5, e13746.
Deng, X., den Bakker, H.C., Hendriksen, R.S., 2016. Genomic epidemiology: whole-genome-sequencing–powered surveillance and outbreak investigation of foodborne bacterial pathogens. Annual review of food science and technology 7, 353-374.
Didelot, X., Wilson, D.J., 2015. ClonalFrameML: efficient inference of recombination in whole bacterial genomes. PLoS computational biology 11, e1004041.
Donnelly, C.W., 2001. Listeria monocytogenes: a continuing challenge. Nutrition Reviews 59, 183-194.
Donnelly, C.W., Nyachuba, D.G., 2007. Conventional methods to detect and isolate Listeria monocytogenes. FOOD SCIENCE AND TECHNOLOGY-NEW YORK-MARCEL DEKKER- 161, 215.
Drake, J.W., Charlesworth, B., Charlesworth, D., Crow, J.F., 1998. Rates of spontaneous mutation. Genetics 148, 1667-1686.
Drouin, A., Giguère, S., Déraspe, M., Marchand, M., Tyers, M., Loo, V.G., Bourgault, A.-M., Laviolette, F., Corbeil, J., 2016. Predictive computational phenotyping and biomarker discovery using reference-free genome comparisons. BMC genomics 17, 754.
Dupont, C., Augustin, J.-C., 2009. Influence of stress on single-cell lag time and growth probability for Listeria monocytogenes in half Fraser broth. Appl. Environ. Microbiol. 75, 3069-3076.
Durack, J., Ross, T., Bowman, J.P., 2013. Characterisation of the transcriptomes of genetically diverse Listeria monocytogenes exposed to hyperosmotic and low temperature conditions reveal global stress-adaptation mechanisms. PloS one 8, e73603.
Duret, S., Guillier, L., Hoang, H.-M., Flick, D., Laguerre, O., 2014. Identification of the significant factors in food safety using global sensitivity analysis and the accept-and-reject algorithm: application to the cold chain of ham. International journal of food microbiology 180, 39-48.
Duret, S., Hoang, H.-M., Flick, D., Laguerre, O., 2014. Experimental characterization of airflow, heat and mass transfer in a cold room filled with food products. International journal of refrigeration 46, 17-25.
Durst, J., 1975. The role of temperature factors in the epidemiology of listeriosis. Zentralblatt fur Bakteriologie, Parasitenkunde, Infektionskrankheiten und Hygiene. Erste Abteilung Originale. Reihe A: Medizinische Mikrobiologie und Parasitologie 233, 72-74.

References
141
Dutilh, B.E., Backus, L., Edwards, R.A., Wels, M., Bayjanov, J.R., van Hijum, S.A., 2013. Explaining microbial phenotypes on a genomic scale: GWAS for microbes. Briefings in Functional Genomics 12, 366-380.
Earle, S.G., Wu, C.-H., Charlesworth, J., Stoesser, N., Gordon, N.C., Walker, T.M., Spencer, C.C.A., Iqbal, Z., Clifton, D.A., Hopkins, K.L., Woodford, N., Smith, E.G., Ismail, N., Llewelyn, M.J., Peto, T.E., Crook, D.W., McVean, G., Walker, A.S., Wilson, D.J., 2016. Identifying lineage effects when controlling for population structure improves power in bacterial association studies. Nature Microbiology 1, 16041.
EFSA, 2013. Analysis of the baseline survey on the prevalence of Listeria monocytogenes in certain ready‐to‐eat foods in the EU, 2010–2011 Part A: Listeria monocytogenes prevalence estimates. EFSA Journal 11.
EFSA, ECDC, 2018. The European Union summary report on trends and sources of zoonoses, zoonotic agents and food‐borne outbreaks in 2017. EFSA Journal 16, e05500.
EFSA BIOHAZ Panel, 2018. Listeria monocytogenes contamination of ready-to-eat foods and the risk for human health in the EU. EFSA Journal 16, :5134, 5173 pp.
EFSA BIOHAZ Panel, Ricci, A., Allende, A., Bolton, D., Chemaly, M., Davies, R., Fernández Escámez, P., Girones, R., Herman, L., Koutsoumanis, K., Nørrung, B., Robertson, L., Ru, G., Sanaa, M., Simmons, M., Skandamis, P., Snary, E., Speybroeck, N., Ter Kuile, B., Threlfall, J., Wahlstrom, H., Takkinen, J., Wagner, M., Arcella, D., Da Silva Felicio, M., Georgiadis, M., Messens, W., Lindqvist, R., 2018. Scientific Opinion on the Listeria monocytogenes contamination of ready-to-eat foods and the risk for human health in the EU. EFSA Journal 16, 173 pp. .
Elfwing, A., LeMarc, Y., Baranyi, J., Ballagi, A., 2004. Observing growth and division of large numbers of individual bacteria by image analysis. Appl. Environ. Microbiol. 70, 675-678.
Elhanafi, D., Dutta, V., Kathariou, S., 2010. Genetic characterization of plasmid-associated benzalkonium chloride resistance determinants in a Listeria monocytogenes strain from the 1998-1999 outbreak. Applied and environmental microbiology 76, 8231-8238.
Ellouze, M., Gauchi, J.P., Augustin, J.C., 2010. Global sensitivity analysis applied to a contamination assessment model of Listeria monocytogenes in cold smoked salmon at consumption. Risk Analysis: An International Journal 30, 841-852.
Ericsson, H., Eklöw, A., Danielsson-Tham, M.-L., Loncarevic, S., Mentzing, L., Persson, I., Unnerstad, H., Tham, W., 1997. An outbreak of listeriosis suspected to have been caused by rainbow trout. Journal of Clinical Microbiology 35, 2904-2907.
Ermolenko, D., Makhatadze, G., 2002. Bacterial cold-shock proteins. Cellular and Molecular Life Sciences CMLS 59, 1902-1913.
Eshwar, A.K., Guldimann, C., Oevermann, A., Tasara, T., 2017. Cold-shock domain family proteins (Csps) are involved in regulation of virulence, cellular aggregation, and flagella-based motility in Listeria monocytogenes. Frontiers in cellular and infection microbiology 7, 453.
Fagerlund, A., Langsrud, S., Schirmer, B.C., Møretrø, T., Heir, E., 2016. Genome analysis of Listeria monocytogenes sequence type 8 strains persisting in salmon and poultry processing environments and comparison with related strains. PloS one 11, e0151117.

References
142
Falush, D., 2016. Bacterial genomics: microbial GWAS coming of age. Nature Microbiology 1, 16059.
FAO/WHO, 2016. Codex Alimentarius commission. Procedural Manual 25th ed. Rome. Farhat, M.R., Shapiro, B.J., Kieser, K.J., Sultana, R., Jacobson, K.R., Victor, T.C.,
Warren, R.M., Streicher, E.M., Calver, A., Sloutsky, A., 2013. Genomic analysis identifies targets of convergent positive selection in drug-resistant Mycobacterium tuberculosis. Nature genetics 45, 1183.
FDA/FSIS, 2003. Quantitative assessment of relative risk to public health from foodborne Listeria monocytogenes among selected categories of ready-to-eat foods. Food and Drug Administration, U.S. Department of Agriculture, Centers for Disease Control and Prevention.
Feil, E.J., Li, B.C., Aanensen, D.M., Hanage, W.P., Spratt, B.G., 2004. eBURST: inferring patterns of evolutionary descent among clusters of related bacterial genotypes from multilocus sequence typing data. Journal of bacteriology 186, 1518-1530.
Felten, A., Guillier, L., Radomski, N., Mistou, M.-Y., Lailler, R., Cadel-Six, S., 2017. Genome Target Evaluator (GTEvaluator): A workflow exploiting genome dataset to measure the sensitivity and specificity of genetic markers. PloS one 12, e0182082.
Felten, A., Nova, M.V., Durimel, K., Guillier, L., Mistou, M.-Y., Radomski, N., 2017. First gene-ontology enrichment analysis based on bacterial coregenome variants: insights into adaptations of Salmonella serovars to mammalian-and avian-hosts. BMC microbiology 17, 222.
Ferreira, V., Wiedmann, M., Teixeira, P., Stasiewicz, M.J., 2014. Listeria monocytogenes persistence in food-associated environments: epidemiology, strain characteristics, and implications for public health. Journal of food protection 77, 150-170.
Fortier, L.-C., Sekulovic, O., 2013. Importance of prophages to evolution and virulence of bacterial pathogens. Virulence 4, 354-365.
Foster, P.L., 2006. Methods for determining spontaneous mutation rates. Methods in enzymology 409, 195-213.
Fox, E.M., Allnutt, T., Bradbury, M.I., Fanning, S., Chandry, P.S., 2016. Comparative genomics of the Listeria monocytogenes ST204 subgroup. Frontiers in microbiology 7, 2057.
Français, M., Carlin, F., Broussolle, V., 2019. Bacillus cereus cshA is expressed during the lag-phase and serves as a potential marker of early adaptation to low temperature and pH. Appl. Environ. Microbiol., AEM. 00486-00419.
Francois, K., Devlieghere, F., Smet, K., Standaert, A., Geeraerd, A., Van Impe, J., Debevere, J., 2005. Modelling the individual cell lag phase: effect of temperature and pH on the individual cell lag distribution of Listeria monocytogenes. International journal of food microbiology 100, 41-53.
Franz, E., Gras, L.M., Dallman, T., 2016. Significance of whole genome sequencing for surveillance, source attribution and microbial risk assessment of foodborne pathogens. Current Opinion in Food Science 8, 74-79.
Fraser, K.R., O'Byrne, C.P., 2002. Osmoprotection by carnitine in a Listeria monocytogenes mutant lacking the OpuC transporter: evidence for a low affinity carnitine uptake system. FEMS microbiology letters 211, 189-194.
Galardini, M., Koumoutsi, A., Herrera-Dominguez, L., Varela, J.A.C., Telzerow, A., Wagih, O., Wartel, M., Clermont, O., Denamur, E., Typas, A., 2017. Phenotype inference in an Escherichia coli strain panel. eLife 6, e31035.

References
143
Galili, T., 2015. dendextend: an R package for visualizing, adjusting and comparing trees of hierarchical clustering. Bioinformatics 31, 3718-3720.
Gerhardt, P., Smith, L.T., Smith, G.M., 1996. Sodium-driven, osmotically activated glycine betaine transport in Listeria monocytogenes membrane vesicles. Journal of bacteriology 178, 6105-6109.
Gerhardt, P.N., Smith, L.T., Smith, G.M., 2000. Osmotic and chill activation of glycine betaine porter II in Listeria monocytogenes membrane vesicles. Journal of bacteriology 182, 2544-2550.
Gill, A., 2017. The Importance of Bacterial Culture to Food Microbiology in the Age of Genomics. Frontiers in microbiology 8.
Glaser, P., Frangeul, L., Buchrieser, C., Rusniok, C., Amend, A., Baquero, F., Berche, P., Bloecker, H., Brandt, P., Chakraborty, T., 2001. Comparative genomics of Listeria species. Science 294, 849-852.
Gossner, C.M., 2016. New version of the Epidemic Intelligence Information System for food-and waterborne diseases and zoonoses (EPIS-FWD) launched. Eurosurveillance 21.
Graumann, P.L., Marahiel, M.A., 1999. Cold shock response in Bacillus subtilis. Journal of molecular microbiology and biotechnology 1, 203-209.
Graves, L.M., Helsel, L.O., Steigerwalt, A.G., Morey, R.E., Daneshvar, M.I., Roof, S.E., Orsi, R.H., Fortes, E.D., Milillo, S.R., Den Bakker, H.C., 2010. Listeria marthii sp. nov., isolated from the natural environment, Finger Lakes National Forest. International journal of systematic and evolutionary microbiology 60, 1280-1288.
Graves, L.M., Swaminathan, B., 2001. PulseNet standardized protocol for subtyping Listeria monocytogenes by macrorestriction and pulsed-field gel electrophoresis. International journal of food microbiology 65, 55-62.
Gray, M., McWade, D., 1954. The isolation of Listeria monocytogenes from the bovine cervix. Journal of bacteriology 68, 634.
Guglielmetti, P., Coulombier, D., Van, F.L., Schreck, S., 2006. The Early Warning and Response System for communicable diseases in the EU: an overview from 1999 to 2005. Euro surveillance: bulletin Europeen sur les maladies transmissibles= European communicable disease bulletin 11, 7-8.
Guillet, C., Join-Lambert, O., Le Monnier, A., Leclercq, A., Mechaï, F., Mamzer-Bruneel, M.-F., Bielecka, M.K., Scortti, M., Disson, O., Berche, P., 2010. Human listeriosis caused by Listeria ivanovii. Emerging infectious diseases 16, 136.
Guillier, L., 2005. Variabilité des temps de latence cellulaires de Listeria monocytogenes en fonction des stress subis et des conditions de re-croissance. Ph. D. thesis. Institut National Agronomique de Paris-Grignon, Paris, France.
Guillier, L., Augustin, J.-C., 2006. Modelling the individual cell lag time distributions of Listeria monocytogenes as a function of the physiological state and the growth conditions. International journal of food microbiology 111, 241-251.
Guillier, L., Gourmelon, M., Lozach, S., Cadel-Six, S., Vignaud, M.-L., Munck, N., Hald, T., Palma, F., 2019. AB_SA: Tracing the source of bacterial strains based on accessory genes. Application to <em>Salmonella</em> Typhimurium environmental strains. bioRxiv, 814459.
Guillier, L., Pardon, P., Augustin, J.-C., 2005. Influence of stress on individual lag time distributions of Listeria monocytogenes. Appl. Environ. Microbiol. 71, 2940-2948.

References
144
Guillier, L., Pardon, P., Augustin, J.-C., 2006. Automated image analysis of bacterial colony growth as a tool to study individual lag time distributions of immobilized cells. Journal of microbiological methods 65, 324-334.
Guldimann, C., Guariglia-Oropeza, V., Harrand, S., Kent, D., Boor, K.J., Wiedmann, M., 2017. Stochastic and differential activation of σB and PrfA in Listeria monocytogenes at the single cell level under different environmental stress conditions. Frontiers in microbiology 8, 348.
Gurevich, A., Saveliev, V., Vyahhi, N., Tesler, G., 2013. QUAST: quality assessment tool for genome assemblies. Bioinformatics 29, 1072-1075.
Haas, C.N., Thayyar-Madabusi, A., Rose, J.B., Gerba, C.P., 1999. Development and validation of dose-response relationship for Listeria monocytogenes. Quantitative Microbiology 1, 89-102.
Haberbeck, L., Oliveira, R., Vivijs, B., Wenseleers, T., Aertsen, A., Michiels, C., Geeraerd, A., 2015. Variability in growth/no growth boundaries of 188 different Escherichia coli strains reveals that approximately 75% have a higher growth probability under low pH conditions than E. coli O157: H7 strain ATCC 43888. Food microbiology 45, 222-230.
Haberbeck, L.U., Plaza-Rodríguez, C., Desvignes, V., Dalgaard, P., Sanaa, M., Guillier, L., Nauta, M., Filter, M., 2018. Harmonized terms, concepts and metadata for microbiological risk assessment models: the basis for knowledge integration and exchange. Microbial Risk Analysis 10, 3-12.
Haddad, N., Johnson, N., Kathariou, S., Métris, A., Phister, T., Pielaat, A., Tassou, C., Wells-Bennik, M.H., Zwietering, M.H., 2018. Next generation microbiological risk assessment—Potential of omics data for hazard characterisation. International journal of food microbiology 287, 28-39.
Hain, T., Ghai, R., Billion, A., Kuenne, C.T., Steinweg, C., Izar, B., Mohamed, W., Mraheil, M.A., Domann, E., Schaffrath, S., 2012. Comparative genomics and transcriptomics of lineages I, II, and III strains of Listeria monocytogenes. BMC genomics 13, 144.
Halter, E.L., Neuhaus, K., Scherer, S., 2013. Listeria weihenstephanensis sp. nov., isolated from the water plant Lemna trisulca taken from a freshwater pond. International journal of systematic and evolutionary microbiology 63, 641-647.
Harvey, J., Gilmour, A., 2001. Characterization of recurrent and sporadic Listeria monocytogenes isolates from raw milk and nondairy foods by pulsed-field gel electrophoresis, monocin typing, plasmid profiling, and cadmium and antibiotic resistance determination. Appl. Environ. Microbiol. 67, 840-847.
Hébraud, M., Potier, P., 1999. Cold shock response and low temperature adaptation in psychrotrophic bacteria. Journal of molecular microbiology and biotechnology 1, 211-219.
Henri, C., Leekitcharoenphon, P., Carleton, H.A., Radomski, N., Kaas, R.S., Mariet, J.-F., Felten, A., Aarestrup, F.M., Gerner Smidt, P., Roussel, S., Guillier, L., Mistou, M.-Y., Hendriksen, R.S., 2017. An Assessment of Different Genomic Approaches for Inferring Phylogeny of Listeria monocytogenes. Frontiers in microbiology 8.
Hingston, P., Brenner, T., Truelstrup Hansen, L., Wang, S., 2019. Comparative Analysis of Listeria monocytogenes Plasmids and Expression Levels of Plasmid-Encoded Genes during Growth under Salt and Acid Stress Conditions. Toxins 11, 426.
Hingston, P., Chen, J., Dhillon, B.K., Laing, C., Bertelli, C., Gannon, V., Tasara, T., Allen, K., Brinkman, F.S., Hansen, L.T., 2017. Genotypes Associated with

References
145
Listeria monocytogenes Isolates Displaying Impaired or Enhanced Tolerances to Cold, Salt, Acid, or Desiccation Stress. Frontiers in microbiology 8.
Hoffmann, R.F., McLernon, S., Feeney, A., Hill, C., Sleator, R.D., 2013. A single point mutation in the Listerial betL σA-dependent promoter leads to improved osmo-and chill-tolerance and a morphological shift at elevated osmolarity. Bioengineered 4, 401-407.
Ingram, T., Mahler, D.L., 2013. SURFACE: detecting convergent evolution from comparative data by fitting Ornstein‐Uhlenbeck models with stepwise Akaike Information Criterion. Methods in Ecology and Evolution 4, 416-425.
Jagadeesan, B., Gerner-Smidt, P., Allard, M.W., Leuillet, S., Winkler, A., Xiao, Y., Chaffron, S., Van Der Vossen, J., Tang, S., Katase, M., 2018. The use of next generation sequencing for improving food safety: Translation into practice. Food Microbiology.
Jaillard, M., Lima, L., Tournoud, M., Mahé, P., Van Belkum, A., Lacroix, V., Jacob, L., 2018. A fast and agnostic method for bacterial genome-wide association studies: Bridging the gap between k-mers and genetic events. PLoS genetics 14, e1007758.
Jarmoskaite, I., Russell, R., 2011. DEAD‐box proteins as RNA helicases and chaperones. Wiley Interdisciplinary Reviews: RNA 2, 135-152.
Jolley, K.A., Bliss, C.M., Bennett, J.S., Bratcher, H.B., Brehony, C., Colles, F.M., Wimalarathna, H., Harrison, O.B., Sheppard, S.K., Cody, A.J., 2012. Ribosomal multilocus sequence typing: universal characterization of bacteria from domain to strain. Microbiology 158, 1005.
Jones, C.E., Shama, G., Jones, D., Roberts, I., Andrew, P., 1997. Physiological and biochemical studies on psychrotolerance in Listeria monocytogenes. Journal of applied microbiology 83, 31-35.
Juneja, V.K., Foglia, T.A., Marmer, B.S., 1998. Heat resistance and fatty acid composition of Listeria monocytogenes: effect of pH, acidulant, and growth temperature. Journal of food protection 61, 683-687.
Junttila, J.R., Niemelä, S., Hirn, J., 1988. Minimum growth temperatures of Listeria monocytogenes and non‐haemolytic listeria. Journal of Applied Bacteriology 65, 321-327.
Kaan, T., Homuth, G., Mäder, U., Bandow, J., Schweder, T., 2002. Genome-wide transcriptional profiling of the Bacillus subtilis cold-shock response. Microbiology 148, 3441-3455.
Kaminski, T.S., Scheler, O., Garstecki, P., 2016. Droplet microfluidics for microbiology: techniques, applications and challenges. Lab on a Chip 16, 2168-2187.
Kazmierczak, M.J., Mithoe, S.C., Boor, K.J., Wiedmann, M., 2003. Listeria monocytogenes σB regulates stress response and virulence functions. Journal of bacteriology 185, 5722-5734.
Kazmierczak, M.J., Wiedmann, M., Boor, K.J., 2005. Alternative sigma factors and their roles in bacterial virulence. Microbiol. Mol. Biol. Rev. 69, 527-543.
Kensche, P.R., van Noort, V., Dutilh, B.E., Huynen, M.A., 2007. Practical and theoretical advances in predicting the function of a protein by its phylogenetic distribution. Journal of the Royal Society Interface 5, 151-170.
Kerouanton, A., Brisabois, A., Denoyer, E., Dilasser, F., Grout, J., Salvat, G., Picard, B., 1998. Comparison of five typing methods for the epidemiological study of Listeria monocytogenes. International journal of food microbiology 43, 61-71.

References
146
Kim, H., Boor, K.J., Marquis, H., 2004. Listeria monocytogenes σB contributes to invasion of human intestinal epithelial cells. Infection and immunity 72, 7374-7378.
Kim, H., Marquis, H., Boor, K.J., 2005. σB contributes to Listeria monocytogenes invasion by controlling expression of inlA and inlB. Microbiology (Reading, England) 151, 3215.
Kleinheinz, K.A., Joensen, K.G., Larsen, M.V., 2014. Applying the ResFinder and VirulenceFinder web-services for easy identification of acquired antibiotic resistance and E. coli virulence genes in bacteriophage and prophage nucleotide sequences. Bacteriophage 4, e27943.
Knudsen, G.M., Nielsen, J.B., Marvig, R.L., Ng, Y., Worning, P., Westh, H., Gram, L., 2017. Genome‐wide‐analyses of Listeria monocytogenes from food‐processing plants reveal clonal diversity and date the emergence of persisting sequence types. Environmental microbiology reports 9, 428-440.
Ko, R., Smith, L.T., 1999. Identification of an ATP-driven, osmoregulated glycine betaine transport system in Listeria monocytogenes. Appl. Environ. Microbiol. 65, 4040-4048.
Ko, R., Smith, L.T., Smith, G.M., 1994. Glycine betaine confers enhanced osmotolerance and cryotolerance on Listeria monocytogenes. Journal of bacteriology 176, 426-431.
Kolstad, J., Caugant, D.A., Rørvik, L.M., 1992. Differentiation of Listeria monocytogenes isolates by using plasmid profiling and multilocus enzyme electrophoresis. International journal of food microbiology 16, 247-260.
Koutsoumanis, K.P., Aspridou, Z., 2017. Individual cell heterogeneity in Predictive Food Microbiology: Challenges in predicting a “noisy” world. International journal of food microbiology 240, 3-10.
Koutsoumanis, K.P., Kendall, P.A., Sofos, J.N., 2004. A comparative study on growth limits of Listeria monocytogenes as affected by temperature, pH and aw when grown in suspension or on a solid surface. Food Microbiology 21, 415-422.
Koutsoumanis, K.P., Lianou, A., 2013. Stochasticity in colonial growth dynamics of individual bacterial cells. Applied and environmental microbiology 79, 2294-2301.
Kovacevic, J., Arguedas-Villa, C., Wozniak, A., Tasara, T., Allen, K.J., 2013. Examination of food chain-derived Listeria monocytogenes strains of different serotypes reveals considerable diversity in inlA genotypes, mutability, and adaptation to cold temperatures. Applied and environmental microbiology 79, 1915-1922.
Krause, S., van Bodegom, P.M., Cornwell, W.K., Bodelier, P.L., 2014. Weak phylogenetic signal in physiological traits of methane‐oxidizing bacteria. Journal of evolutionary biology 27, 1240-1247.
Kremer, P., Lees, J., Koopmans, M., Ferwerda, B., Arends, A., Feller, M., Schipper, K., Seron, M.V., van der Ende, A., Brouwer, M., 2017. Benzalkonium tolerance genes and outcome in Listeria monocytogenes meningitis. Clinical Microbiology and Infection 23, 265. e261-265. e267.
Kuenne, C., Billion, A., Mraheil, M.A., Strittmatter, A., Daniel, R., Goesmann, A., Barbuddhe, S., Hain, T., Chakraborty, T., 2013. Reassessment of the Listeria monocytogenes pan-genome reveals dynamic integration hotspots and mobile genetic elements as major components of the accessory genome. BMC genomics 14, 47.

References
147
Kuenne, C., Voget, S., Pischimarov, J., Oehm, S., Goesmann, A., Daniel, R., Hain, T., Chakraborty, T., 2010. Comparative analysis of plasmids in the genus Listeria. PloS one 5, e12511.
Kutalik, Z., Razaz, M., Elfwing, A., Ballagi, A., Baranyi, J., 2005. Stochastic modelling of individual cell growth using flow chamber microscopy images. International journal of food microbiology 105, 177-190.
Laabei, M., Recker, M., Rudkin, J.K., Aldeljawi, M., Gulay, Z., Sloan, T.J., Williams, P., Endres, J.L., Bayles, K.W., Fey, P.D., 2014. Predicting the virulence of MRSA from its genome sequence. Genome research 24, 839-849.
Lammerding, A.M., Fazil, A., 2000. Hazard identification and exposure assessment for microbial food safety risk assessment. International journal of food microbiology 58, 147-157.
Larsen, H.E., Seeliger, H., 1966. A mannitol fermenting Listeria: Listeria grayi sp. n, Proceedings of the third international symposium on listeriosis. Bilthoven/Holland, pp. 35-39.
Lebrun, M., Audurier, A., Cossart, P., 1994. Plasmid-borne cadmium resistance genes in Listeria monocytogenes are present on Tn5422, a novel transposon closely related to Tn917. Journal of bacteriology 176, 3049-3061.
Lebrun, M., Loulergue, J., Chaslus-Dancla, E., Audurier, A., 1992. Plasmids in Listeria monocytogenes in relation to cadmium resistance. Appl. Environ. Microbiol. 58, 3183-3186.
Leclercq, A., Clermont, D., Bizet, C., Grimont, P.A., Le Fleche-Mateos, A., Roche, S.M., Buchrieser, C., Cadet-Daniel, V., Le Monnier, A., Lecuit, M., 2010. Listeria rocourtiae sp. nov. International journal of systematic and evolutionary microbiology 60, 2210-2214.
Lees, J.A., Bentley, S.D., 2016. Bacterial GWAS: not just gilding the lily. Nature Reviews Microbiology 14, 406-406.
Lees, J.A., Galardini, M., Bentley, S.D., Weiser, J.N., Corander, J., 2018. pyseer: a comprehensive tool for microbial pangenome-wide association studies. Bioinformatics 34, 4310-4312.
Lees, J.A., Vehkala, M., Välimäki, N., Harris, S.R., Chewapreecha, C., Croucher, N.J., Marttinen, P., Davies, M.R., Steer, A.C., Tong, S.Y., 2016. Sequence element enrichment analysis to determine the genetic basis of bacterial phenotypes. Nature communications 7, 12797.
Lemon, K.P., Higgins, D.E., Kolter, R., 2007. Flagellar motility is critical for Listeria monocytogenes biofilm formation. Journal of bacteriology 189, 4418-4424.
Leuschner, R.G., Hristova, A., Robinson, T., Hugas, M., 2013. The Rapid Alert System for Food and Feed (RASFF) database in support of risk analysis of biogenic amines in food. Journal of food composition and analysis 29, 37-42.
Levin-Reisman, I., Fridman, O., Balaban, N.Q., 2014. ScanLag: High-throughput quantification of colony growth and lag time. JoVE (Journal of Visualized Experiments), e51456.
Li, L., Olsen, R.H., Shi, L., Ye, L., He, J., Meng, H., 2016. Characterization of a plasmid carrying cat, ermB and tetS genes in a foodborne Listeria monocytogenes strain and uptake of the plasmid by cariogenic Streptococcus mutans. International journal of food microbiology 238, 68-71.
Lianou, A., Koutsoumanis, K.P., 2012. Strain variability of the biofilm-forming ability of Salmonella enterica under various environmental conditions. International journal of food microbiology 160, 171-178.

References
148
Lindqvist, R., Westöö, A., 2000. Quantitative risk assessment for Listeria monocytogenes in smoked or gravad salmon and rainbow trout in Sweden. International journal of food microbiology 58, 181-196.
Liu, Y., Orsi, R.H., Boor, K.J., Wiedmann, M., Guariglia-Oropeza, V., 2017. Home alone: elimination of all but one alternative sigma factor in Listeria monocytogenes allows prediction of new roles for σB. Frontiers in microbiology 8, 1910.
Loncarevic, S., Danielsson-Tham, M.-L., Gerner-Smidt, P., Sahlström, L., Tham, W., 1998. Potential sources of human listeriosis in Sweden. Food Microbiology 15, 65-69.
Lu, Z., Sebranek, J.G., Dickson, J.S., Mendonca, A.F., Bailey, T.B., 2005. Application of predictive models to estimate Listeria monocytogenes growth on frankfurters treated with organic acid salts. Journal of food protection 68, 2326-2332.
Lynch, T., Petkau, A., Knox, N., Graham, M., Van Domselaar, G., 2016. A primer on infectious disease bacterial genomics. Clinical microbiology reviews 29, 881-913.
Malakar, P., Barker, G., Zwietering, M., Van't Riet, K., 2003. Relevance of microbial interactions to predictive microbiology. International journal of food microbiology 84, 263-272.
Margot, H., Zwietering, M., Joosten, H., Stephan, R., 2016. Determination of single cell lag times of Cronobacter spp. strains exposed to different stress conditions: Impact on detection. International journal of food microbiology 236, 161-166.
Maria-Rosario, A., Davidson, I., Debra, M., Verheul, A., Abee, T., Booth, I.R., 1995. The role of peptide metabolism in the growth of Listeria monocytogenes ATCC 23074 at high osmolarity. Microbiology 141, 41-49.
Marinier, E., Zaheer, R., Berry, C., Weedmark, K.A., Domaratzki, M., Mabon, P., Knox, N.C., Reimer, A.R., Graham, M.R., Chui, L., 2017. Neptune: a bioinformatics tool for rapid discovery of genomic variation in bacterial populations. Nucleic Acids Research.
Markkula, A., Mattila, M., Lindström, M., Korkeala, H., 2012. Genes encoding putative DEAD‐box RNA helicases in Listeria monocytogenes EGD‐e are needed for growth and motility at 3° C. Environmental microbiology 14, 2223-2232.
Martín, B., Perich, A., Gómez, D., Yangüela, J., Rodríguez, A., Garriga, M., Aymerich, T., 2014. Diversity and distribution of Listeria monocytogenes in meat processing plants. Food Microbiology 44, 119-127.
Martinez, J., Baquero, F., 2000. Mutation frequencies and antibiotic resistance. Antimicrobial agents and chemotherapy 44, 1771-1777.
Mattila, M., Lindström, M., Somervuo, P., Markkula, A., Korkeala, H., 2011. Role of flhA and motA in growth of Listeria monocytogenes at low temperatures. International journal of food microbiology 148, 177-183.
Mattila, M., Somervuo, P., Rattei, T., Korkeala, H., Stephan, R., Tasara, T., 2012. Phenotypic and transcriptomic analyses of Sigma L-dependent characteristics in Listeria monocytogenes EGD-e. Food Microbiology 32, 152-164.
Maury, M.M., Tsai, Y.-H., Charlier, C., Touchon, M., Chenal-Francisque, V., Leclercq, A., Criscuolo, A., Gaultier, C., Roussel, S., Brisabois, A., 2016. Uncovering Listeria monocytogenes hypervirulence by harnessing its biodiversity. Nature genetics 48, 308-313.
McLauchlin, J., Hampton, M., Shah, S., Threlfall, E., Wieneke, A., Curtis, G., 1997. Subtyping of Listeria monocytogenes on the basis of plasmid profiles and

References
149
arsenic and cadmium susceptibility. Journal of applied microbiology 83, 381-388.
McLauchlin, J., Mitchell, R., Smerdon, W., Jewell, K., 2004. Listeria monocytogenes and listeriosis: a review of hazard characterisation for use in microbiological risk assessment of foods. International journal of food microbiology 92, 15-33.
Membré, J.-M., Guillou, S., 2016. Latest developments in foodborne pathogen risk assessment. Curr Opin Food Sci 8, 120-126.
Mertens, L., Van Derlinden, E., Van Impe, J.F., 2012. A novel method for high-throughput data collection in predictive microbiology: optical density monitoring of colony growth as a function of time. Food Microbiology 32, 196-201.
Métris, A., George, S.M., Peck, M.W., Baranyi, J., 2003. Distribution of turbidity detection times produced by single cell-generated bacterial populations. Journal of microbiological methods 55, 821-827.
Miladi, H., Elabed, H., Slama, R.B., Rhim, A., Bakhrouf, A., 2017. Molecular analysis of the role of osmolyte transporters opuCA and betL in Listeria monocytogenes after cold and freezing stress. Archives of microbiology 199, 259-265.
Milkman, R., Bridges, M.M., 1990. Molecular evolution of the Escherichia coli chromosome. III. Clonal frames. Genetics 126, 505-517.
Mitchell, M.E., 1978. Carnitine metabolism in human subjects I. Normal metabolism. The American journal of clinical nutrition 31, 293-306.
Møller-Nielsen, E., Björkman, J.T., Kiil, K., Grant, K., Dallman, T., Painset, A., Amar, C., Roussel, S., Guillier, L., Félix, B., Rotariou, O., Perez-Reche, F., Forbes, K., Strachan, N., 2017. Closing gaps for performing a risk assessment on Listeria monocytogenes in ready‐to‐eat (RTE) foods: activity 3, the comparison of isolates from different compartments along the food chain, and from humans using whole genome sequencing (WGS) analysis. EFSA Supporting Publications 14.
Møretrø, T., Schirmer, B.C., Heir, E., Fagerlund, A., Hjemli, P., Langsrud, S., 2017. Tolerance to quaternary ammonium compound disinfectants may enhance growth of Listeria monocytogenes in the food industry. International journal of food microbiology 241, 215-224.
Moura, A., Criscuolo, A., Pouseele, H., Maury, M.M., Leclercq, A., Tarr, C., Björkman, J.T., Dallman, T., Reimer, A., Enouf, V., 2017. Whole genome-based population biology and epidemiological surveillance of Listeria monocytogenes. Nature Microbiology 2, 16185.
Muhterem-Uyar, M., Ciolacu, L., Wagner, K.-H., Wagner, M., Schmitz-Esser, S., Stessl, B., 2018. New aspects on Listeria monocytogenes ST5-ECVI predominance in a heavily contaminated cheese processing environment. Frontiers in microbiology 9, 64.
Mujahid, S., Orsi, R.H., Boor, K.J., Wiedmann, M., 2013. Protein level identification of the Listeria monocytogenes sigma H, sigma L, and sigma C regulons. BMC microbiology 13, 156.
Murray, E.G.D., Webb, R.A., Swann, M.B.R., 1926. A disease of rabbits characterised by a large mononuclear leucocytosis, caused by a hitherto undescribed bacillus Bacterium monocytogenes (n. sp.). The Journal of Pathology and Bacteriology 29, 407-439.
Naditz, A.L., Dzieciol, M., Wagner, M., Schmitz-Esser, S., 2019. Plasmids contribute to food processing environment–associated stress survival in three Listeria monocytogenes ST121, ST8, and ST5 strains. International journal of food microbiology 299, 39-46.

References
150
Nadon, C., Van Walle, I., Gerner-Smidt, P., Campos, J., Chinen, I., Concepcion-Acevedo, J., Gilpin, B., Smith, A.M., Kam, K.M., Perez, E., 2017. PulseNet International: Vision for the implementation of whole genome sequencing (WGS) for global food-borne disease surveillance. Eurosurveillance 22.
Nauta, M.J., 2000. Separation of uncertainty and variability in quantitative microbial risk assessment models. International journal of food microbiology 57, 9-18.
Nauta, M.J., 2002. Modelling bacterial growth in quantitative microbiological risk assessment: is it possible? International journal of food microbiology 73, 297-304.
NicAogáin, K., O’Byrne, C.P., 2016. The Role of Stress and Stress Adaptations in Determining the Fate of the Bacterial Pathogen Listeria monocytogenes in the Food Chain. Frontiers in microbiology 7.
Niven, G.W., Fuks, T., Morton, J.S., Rua, S.A., Mackey, B.M., 2006. A novel method for measuring lag times in division of individual bacterial cells using image analysis. Journal of microbiological methods 65, 311-317.
Njage, P., Henri, C., Leekitcharoenphon, P., Roussel, S., Hendriksen, R.S., Hald, T., 2017. Oral communication :Application of next generation sequencing data in Microbial Risk Assessment: Case of Listeria monocytogenes, ICPMF10, Cordoba, Spain.
Njage, P.M.K., Henri, C., Leekitcharoenphon, P., Mistou, M.Y., Hendriksen, R.S., Hald, T., 2019. Machine Learning Methods as a Tool for Predicting Risk of Illness Applying Next‐Generation Sequencing Data. Risk analysis 39, 1397-1413.
Njage, P.M.K., Leekitcharoenphon, P., Hald, T., 2019. Improving hazard characterization in microbial risk assessment using next generation sequencing data and machine learning: Predicting clinical outcomes in shigatoxigenic Escherichia coli. International journal of food microbiology 292, 72-82.
Nogueira, T., Rankin, D.J., Touchon, M., Taddei, F., Brown, S.P., Rocha, E.P., 2009. Horizontal gene transfer of the secretome drives the evolution of bacterial cooperation and virulence. Current Biology 19, 1683-1691.
Nowak, J., Cruz, C.D., Tempelaars, M., Abee, T., van Vliet, A.H.M., Fletcher, G.C., Hedderley, D., Palmer, J., Flint, S., 2017. Persistent Listeria monocytogenes strains isolated from mussel production facilities form more biofilm but are not linked to specific genetic markers. International Journal of Food Microbiology 256, 45-53.
Núñez-Montero, K., Leclercq, A., Moura, A., Vales, G., Peraza, J., Pizarro-Cerdá, J., Lecuit, M., 2018. Listeria costaricensis sp. nov. International journal of systematic and evolutionary microbiology 68, 844-850.
O'Meara, B.C., 2012. Evolutionary inferences from phylogenies: a review of methods. Annual Review of Ecology, Evolution, and Systematics 43, 267-285.
O'Neil, H.S., Marquis, H., 2006. Listeria monocytogenes flagella are used for motility, not as adhesins, to increase host cell invasion. Infection and immunity 74, 6675-6681.
O’Byrne, C.P., Karatzas, K.A., 2008. The role of sigma B (sB) in the stress adaptations of Listeria monocytogenes: overlaps between stress adaptation and virulence. Adv. Appl. Microbiol 65.
Okada, Y., Ohnuki, I., Suzuki, H., Igimi, S., 2013. Growth of Listeria monocytogenes in refrigerated ready-to-eat foods in Japan. Food Additives & Contaminants: Part A 30, 1446-1449.

References
151
Okser, S., Pahikkala, T., Aittokallio, T., 2013. Genetic variants and their interactions in disease risk prediction–machine learning and network perspectives. BioData mining 6, 5.
Oliver, H., Orsi, R., Wiedmann, M., Boor, K., 2010. Listeria monocytogenes σB has a small core regulon and a conserved role in virulence but makes differential contributions to stress tolerance across a diverse collection of strains. Appl. Environ. Microbiol. 76, 4216-4232.
Orsi, R.H., den Bakker, H.C., Wiedmann, M., 2011. Listeria monocytogenes lineages: genomics, evolution, ecology, and phenotypic characteristics. International Journal of Medical Microbiology 301, 79-96.
Orsi, R.H., Wiedmann, M., 2016. Characteristics and distribution of Listeria spp., including Listeria species newly described since 2009. Applied microbiology and biotechnology 100, 5273-5287.
Overney, A., Chassaing, D., Carpentier, B., Guillier, L., Firmesse, O., 2016. Development of synthetic media mimicking food soils to study the behaviour of Listeria monocytogenes on stainless steel surfaces. International journal of food microbiology 238, 7-14.
Overney, A., Jacques-André-Coquin, J., Ng, P., Carpentier, B., Guillier, L., Firmesse, O., 2017. Impact of environmental factors on the culturability and viability of Listeria monocytogenes under conditions encountered in food processing plants. International journal of food microbiology 244, 74-81.
Ow, D.S.-W., Nissom, P.M., Philp, R., Oh, S.K.-W., Yap, M.G.-S., 2006. Global transcriptional analysis of metabolic burden due to plasmid maintenance in Escherichia coli DH5α during batch fermentation. Enzyme and Microbial Technology 39, 391-398.
Page, A.J., Cummins, C.A., Hunt, M., Wong, V.K., Reuter, S., Holden, M.T., Fookes, M., Falush, D., Keane, J.A., Parkhill, J., 2015. Roary: rapid large-scale prokaryote pan genome analysis. Bioinformatics 31, 3691-3693.
Page, A.J., Wailan, A., Shao, Y., Judge, K., Dougan, G., Klemm, E.J., Thomson, N.R., Keane, J.A., 2018. PlasmidTron: assembling the cause of phenotypes and genotypes from NGS data. Microbial genomics 4.
Painset, A., Björkman, J.T., Kiil, K., Guillier, L., Mariet, J.-F., Félix, B., Amar, C., Rotariu, O., Roussel, S., Perez-Reche, F., 2019. LiSEQ–whole-genome sequencing of a cross-sectional survey of Listeria monocytogenes in ready-to-eat foods and human clinical cases in Europe. Microbial genomics 5.
Paradis, E., Claude, J., Strimmer, K., 2004. APE: analyses of phylogenetics and evolution in R language. Bioinformatics 20, 289-290.
Pascual, C., Robinson, T., Ocio, M., Aboaba, O., Mackey, B., 2001. The effect of inoculum size and sublethal injury on the ability of Listeria monocytogenes to initiate growth under suboptimal conditions. Letters in Applied Microbiology 33, 357-361.
Paterson, J.S., 1940. The Antigenic Structure of Organisms of the Genus Listerella. Journal of Pathology and Bacteriology 51, 427-436.
Patterson, M.F., Quinn, M., Simpson, R., Gilmour, A., 1995. Sensitivity of vegetative pathogens to high hydrostatic pressure treatment in phosphated-buffered saline and foods. J. Food Prot. 58, 524-529.
Pennell, M.W., Harmon, L.J., 2013. An integrative view of phylogenetic comparative methods: connections to population genetics, community ecology, and paleobiology. Annals of the New York Academy of Sciences 1289, 90-105.

References
152
Perez-Diaz, J., Vicente, M., Baquero, F., 1982. Plasmids in Listeria. Plasmid 8, 112-118.
Peterkin, P.I., Gardiner, M.-A., Malik, N., Idziak, E.S., 1992. Plasmids in Listeria monocytogenes and other Listeria species. Canadian journal of microbiology 38, 161-164.
Pielaat, A., Boer, M.P., Wijnands, L.M., van Hoek, A.H., Bouw, E., Barker, G.C., Teunis, P.F., Aarts, H.J., Franz, E., 2015. First step in using molecular data for microbial food safety risk assessment; hazard identification of Escherichia coli O157: H7 by coupling genomic data with in vitro adherence to human epithelial cells. International journal of food microbiology 213, 130-138.
Piercey, M.J., Ells, T.C., Macintosh, A.J., Truelstrup Hansen, L., 2017. Variations in biofilm formation, desiccation resistance and Benzalkonium chloride susceptibility among Listeria monocytogenes strains isolated in Canada. International Journal of Food Microbiology 257, 254-261.
Piffaretti, J.-C., Kressebuch, H., Aeschbacher, M., Bille, J., Bannerman, E., Musser, J.M., Selander, R.K., Rocourt, J., 1989. Genetic characterization of clones of the bacterium Listeria monocytogenes causing epidemic disease. Proceedings of the National Academy of Sciences 86, 3818-3822.
Pin, C., Sutherland, J., Baranyi, J., 1999. Validating predictive models of food spoilage organisms. Journal of applied microbiology 87, 491-499.
Pine, L., Kathariou, S., Quinn, F., George, V., Wenger, J.D., Weaver, R., 1991. Cytopathogenic effects in enterocytelike Caco-2 cells differentiate virulent from avirulent Listeria strains. Journal of Clinical Microbiology 29, 990-996.
Pine, L., Malcolm, G., Plikaytis, B., 1990. Listeria monocytogenes intragastric and intraperitoneal approximate 50% lethal doses for mice are comparable, but death occurs earlier by intragastric feeding. Infection and immunity 58, 2940-2945.
Pirie, J.H., 1940. The genus Listerella pirie. Science 91, 383-383. Pöntinen, A., Aalto-Araneda, M., Lindström, M., Korkeala, H., 2017. Heat resistance
mediated by pLM58 plasmid-borne ClpL in Listeria monocytogenes. Msphere 2, e00364-00317.
Pouillot, R., Goulet, V., Delignette‐Muller, M.L., Mahé, A., Cornu, M., 2009. Quantitative Risk Assessment of Listeria monocytogenes in French Cold‐Smoked Salmon: II. Risk Characterization. Risk analysis 29, 806-819.
Pouillot, R., Hoelzer, K., Chen, Y., Dennis, S.B., 2015. Listeria monocytogenes dose response revisited—incorporating adjustments for variability in strain virulence and host susceptibility. Risk analysis 35, 90-108.
Pouillot, R., Klontz, K.C., Chen, Y., Burall, L.S., Macarisin, D., Doyle, M., Bally, K.M., Strain, E., Datta, A.R., Hammack, T.S., 2016. Infectious dose of Listeria monocytogenes in outbreak linked to ice cream, United States, 2015. Emerging infectious diseases 22, 2113.
Pouillot, R., Miconnet, N., Afchain, A.L., Delignette‐Muller, M.L., Beaufort, A., Rosso, L., Denis, J.B., Cornu, M., 2007. Quantitative risk assessment of Listeria monocytogenes in French cold‐smoked salmon: I. Quantitative exposure assessment. Risk analysis 27, 683-700.
Power, R.A., Parkhill, J., de Oliveira, T., 2017. Microbial genome-wide association studies: lessons from human GWAS. Nature Reviews Genetics 18, 41.
Püttmann, M., Ade, N., Hof, H., 1993. Dependence of fatty acid composition of Listeria spp. on growth temperature. Research in microbiology 144, 279-283.

References
153
Ragon, M., Wirth, T., Hollandt, F., Lavenir, R., Lecuit, M., Le Monnier, A., Brisse, S., 2008. A new perspective on Listeria monocytogenes evolution. PLoS Pathogens 4, e1000146.
Rantsiou, K., Kathariou, S., Winkler, A., Skandamis, P., Saint-Cyr, M.J., Rouzeau-Szynalski, K., Amézquita, A., 2018. Next generation microbiological risk assessment: opportunities of whole genome sequencing (WGS) for foodborne pathogen surveillance, source tracking and risk assessment. International journal of food microbiology 287, 3-9.
Rasmussen, O.F., Skouboe, P., Dons, L., Rossen, L., Olsen, J.E., 1995. Listeria monocytogenes exists in at least three evolutionary lines: evidence from flagellin, invasive associated protein and listeriolysin O genes. Microbiology 141, 2053-2061.
Record Jr, M.T., Courtenay, E.S., Cayley, D.S., Guttman, H.J., 1998. Responses of E. coli to osmotic stress: large changes in amounts of cytoplasmic solutes and water. Trends in biochemical sciences 23, 143-148.
Renier, S., Micheau, P., Talon, R., Hébraud, M., Desvaux, M., 2012. Subcellular localization of extracytoplasmic proteins in monoderm bacteria: rational secretomics-based strategy for genomic and proteomic analyses. PloS one 7, e42982.
Revell, L.J., 2012a. phytools: An R package for phylogenetic comparative biology (and other things). Methods in Ecology and Evolution 3, 217 - 223.
Revell, L.J., 2012b. phytools: an R package for phylogenetic comparative biology (and other things). Methods in Ecology and Evolution 3, 217-223.
Ribeiro, V., Mujahid, S., Orsi, R., Bergholz, T., Wiedmann, M., Boor, K., Destro, M., 2014. Contributions of σB and PrfA to Listeria monocytogenes salt stress under food relevant conditions. International journal of food microbiology 177, 98-108.
Rizzi, V., Felicio, T.D.S., Felix, B., Gossner, C.M., Jacobs, W., Johansson, K., Kotila, S., Michelon, D., Monguidi, M., Mooijman, K., 2017. The ECDC-EFSA molecular typing database for European Union public health protection. Euroreference 2, 4-12.
Roberts, A., Nightingale, K., Jeffers, G., Fortes, E., Kongo, J.M., Wiedmann, M., 2006. Genetic and phenotypic characterization of Listeria monocytogenes lineage III. Microbiology 152, 685-693.
Robinson, T.P., Aboaba, O.O., Kaloti, A., Ocio, M.J., Baranyi, J., Mackey, B.M., 2001. The effect of inoculum size on the lag phase of Listeria monocytogenes. International journal of food microbiology 70, 163-173.
Rocourt, J., BenEmbarek, P., Toyofuku, H., Schlundt, J., 2003. Quantitative risk assessment of Listeria monocytogenes in ready-to-eat foods: the FAO/WHO approach. FEMS Immunology & Medical Microbiology 35, 263-267.
Rocourt, J., Grimont, P.A., 1983. Listeria welshimeri sp. nov. and Listeria seeligeri sp. nov. International journal of systematic and evolutionary microbiology 33, 866-869.
Rodrigues, C.S., Sá, C.V.G.C.d., Melo, C.B.d., 2017. An overview of Listeria monocytogenes contamination in ready to eat meat, dairy and fishery foods. Ciência Rural 47.
Ross, T., McMeekin, T.A., 2003. Modeling microbial growth within food safety risk assessments. Risk analysis 23, 179-197.

References
154
Ross, T., Rasmussen, S., Fazil, A., Paoli, G., Sumner, J., 2009. Quantitative risk assessment of Listeria monocytogenes in ready-to-eat meats in Australia. International journal of food microbiology 131, 128-137.
Rossen, J.W., Friedrich, A., Moran-Gilad, J., 2018. Practical issues in implementing whole-genome-sequencing in routine diagnostic microbiology. Clinical Microbiology and Infection 24, 355-360.
Ruppitsch, W., Pietzka, A., Prior, K., Bletz, S., Fernandez, H.L., Allerberger, F., Harmsen, D., Mellmann, A., 2015. Defining and evaluating a core genome multilocus sequence typing scheme for whole-genome sequence-based typing of Listeria monocytogenes. Journal of Clinical Microbiology 53, 2869-2876.
Rychli, K., Wagner, E.M., Ciolacu, L., Zaiser, A., Tasara, T., Wagner, M., Schmitz-Esser, S., 2017. Comparative genomics of human and non-human Listeria monocytogenes sequence type 121 strains. PloS one 12, e0176857.
Saber, M.M., Shapiro, J., 2019. Benchmarking bacterial genome-wide association study (GWAS) methods using simulated genomes and phenotypes. bioRxiv, 795492.
Salcedo, C., Arreaza, L., Alcala, B., De La Fuente, L., Vazquez, J., 2003. Development of a multilocus sequence typing method for analysis of Listeria monocytogenes clones. Journal of Clinical Microbiology 41, 757-762.
Salipante, S.J., Roach, D.J., Kitzman, J.O., Snyder, M.W., Stackhouse, B., Butler-Wu, S.M., Lee, C., Cookson, B.T., Shendure, J., 2015. Large-scale genomic sequencing of extraintestinal pathogenic Escherichia coli strains. Genome research 25, 119-128.
Saunders, L.P., Sen, S., Wilkinson, B.J., Gatto, C., 2016. Insights into the Mechanism of Homeoviscous Adaptation to Low Temperature in Branched-Chain Fatty Acid-Containing Bacteria through Modeling FabH Kinetics from the Foodborne Pathogen Listeria monocytogenes. Frontiers in microbiology 7.
Schärer, K., Stephan, R., Tasara, T., 2013. Cold shock proteins contribute to the regulation of listeriolysin O production in Listeria monocytogenes. Foodborne pathogens and disease 10, 1023-1029.
Schmid, B., Klumpp, J., Raimann, E., Loessner, M.J., Stephan, R., Tasara, T., 2009. Role of cold shock proteins in growth of Listeria monocytogenes under cold and osmotic stress conditions. Applied and environmental microbiology 75, 1621-1627.
Schmitz-Esser, S., Müller, A., Stessl, B., Wagner, M., 2015. Genomes of sequence type 121 Listeria monocytogenes strains harbor highly conserved plasmids and prophages. Frontiers in microbiology 6, 380.
Schürch, A., Arredondo-Alonso, S., Willems, R., Goering, R.V., 2018. Whole genome sequencing options for bacterial strain typing and epidemiologic analysis based on single nucleotide polymorphism versus gene-by-gene–based approaches. Clinical Microbiology and Infection 24, 350-354.
Seeliger, H., Höhne, K., 1979. Chapter II serotyping of Listeria monocytogenes and related species, Methods in microbiology. Elsevier, pp. 31-49.
Seelinger, H.P., Rocourt, J., Schrettenbrunner, A., Grimont, P.A., Jones, D., 1984. Listeria ivanovii sp. nov. International journal of systematic and evolutionary microbiology 34, 336-337.
Seemann, T., 2014. Prokka: rapid prokaryotic genome annotation. Bioinformatics 30, 2068-2069.

References
155
Shabala, L., Lee, S.H., Cannesson, P., Ross, T., 2008. Acid and NaCl limits to growth of Listeria monocytogenes and influence of sequence of inimical acid and NaCl levels on inactivation kinetics. Journal of food protection 71, 1169-1177.
Sheehan, B., Kocks, C., Dramsi, S., Gouin, E., Klarsfeld, A., Mengaud, J., Cossart, P., 1994. Molecular and genetic determinants of the Listeria monocytogenes infectious process, Bacterial Pathogenesis of Plants and Animals. Springer, pp. 187-216.
Sheppard, S.K., Didelot, X., Meric, G., Torralbo, A., Jolley, K.A., Kelly, D.J., Bentley, S.D., Maiden, M.C., Parkhill, J., Falush, D., 2013. Genome-wide association study identifies vitamin B5 biosynthesis as a host specificity factor in Campylobacter. Proceedings of the National Academy of Sciences 110, 11923-11927.
Sheppard, S.K., Guttman, D.S., Fitzgerald, J.R., 2018. Population genomics of bacterial host adaptation. Nature Reviews Genetics 19, 549.
Skandamis, P., Brocklehurst, T., Panagou, E., Nychas, G.J., 2007. Image analysis as a mean to model growth of Escherichia coli O157: H7 in gel cassettes. Journal of applied microbiology 103, 937-947.
Skandamis, P.N., Jeanson, S., 2015. Colonial vs. planktonic type of growth: mathematical modeling of microbial dynamics on surfaces and in liquid, semi-liquid and solid foods. Frontiers in microbiology 6, 1178.
Sleator, R., Francis, G., O'Beirne, D., Gahan, C., Hill, C., 2003. Betaine and carnitine uptake systems in Listeria monocytogenes affect growth and survival in foods and during infection. Journal of applied microbiology 95, 839-846.
Sleator, R.D., Gahan, C.G., Abee, T., Hill, C., 1999. Identification and disruption of BetL, a secondary glycine betaine transport system linked to the salt tolerance of Listeria monocytogenes LO28. Appl. Environ. Microbiol. 65, 2078-2083.
Sleator, R.D., Gahan, C.G., O’Driscoll, B., Hill, C., 2000. Analysis of the role of betL in contributing to the growth and survival of Listeria monocytogenes LO28. International journal of food microbiology 60, 261-268.
Smelt, J.P., Otten, G.D., Bos, A.P., 2002. Modelling the effect of sublethal injury on the distribution of the lag times of individual cells of Lactobacillus plantarum. International Journal of Food Microbiology 73, 207-212.
Smith, A.M., Tau, N.P., Smouse, S.L., Allam, M., Ismail, A., Ramalwa, N.R., Disenyeng, B., Ngomane, M., Thomas, J., 2019. Outbreak of Listeria monocytogenes in South Africa, 2017–2018: Laboratory Activities and Experiences Associated with Whole-Genome Sequencing Analysis of Isolates. Foodborne pathogens and disease.
Smith, L.T., 1996. Role of osmolytes in adaptation of osmotically stressed and chill-stressed Listeria monocytogenes grown in liquid media and on processed meat surfaces. Appl. Environ. Microbiol. 62, 3088-3093.
Snapir, Y.M., Vaisbein, E., Nassar, F., 2006. Low virulence but potentially fatal outcome—Listeria ivanovii. European Journal of Internal Medicine 17, 286-287.
Souvorov, A., Agarwala, R., Lipman, D.J., 2018. SKESA: strategic k-mer extension for scrupulous assemblies. Genome biology 19, 153.
Stamatakis, A., 2014. RAxML version 8: a tool for phylogenetic analysis and post-analysis of large phylogenies. Bioinformatics 30, 1312-1313.
Stecchini, M.L., Del Torre, M., Sarais, I., Saro, O., Messina, M., Maltini, E., 1998. Influence of structural properties and kinetic constraints on Bacillus cereus growth. Appl. Environ. Microbiol. 64, 1075-1078.

References
156
Stelma, G., Reyes, A., Peeler, J., Francis, D., Hunt, J., Spaulding, P., Johnson, C., Lovett, J., 1987. Pathogenicity test for Listeria monocytogenes using immunocompromised mice. Journal of Clinical Microbiology 25, 2085-2089.
Suzuki, M., Shibayama, K., Yahara, K., 2016. A genome-wide association study identifies a horizontally transferred bacterial surface adhesin gene associated with antimicrobial resistant strains. Scientific Reports 6, 37811.
Swinnen, I.A., Bernaerts, K., Dens, E.J., Geeraerd, A.H., Van Impe, J.F., 2004. Predictive modelling of the microbial lag phase: a review. International Journal of Food Microbiology 94, 137-159.
Syvänen, A.-C., 2001. Accessing genetic variation: genotyping single nucleotide polymorphisms. Nature Reviews Genetics 2, 930.
Taboada, E.N., Graham, M.R., Carriço, J.A., Van Domselaar, G., 2017. Food safety in the age of next generation sequencing, bioinformatics, and open data access. Frontiers in microbiology 8, 909.
Tasara, T., Stephan, R., 2006. Cold stress tolerance of Listeria monocytogenes: a review of molecular adaptive mechanisms and food safety implications. Journal of Food Protection® 69, 1473-1484.
Thorpe, H.A., Bayliss, S.C., Hurst, L.D., Feil, E.J., 2017. Comparative analyses of selection operating on non-translated intergenic regions of diverse bacterial species. Genetics, genetics. 116.195784.
Thorpe, H.A., Bayliss, S.C., Sheppard, S.K., Feil, E.J., 2017. Piggy: A Rapid, Large-Scale Pan-Genome Analysis Tool for Intergenic Regions in Bacteria. bioRxiv, 179515.
Toledo-Arana, A., Dussurget, O., Nikitas, G., Sesto, N., Guet-Revillet, H., Balestrino, D., Loh, E., Gripenland, J., Tiensuu, T., Vaitkevicius, K., 2009. The Listeria transcriptional landscape from saprophytism to virulence. Nature 459, 950.
Tompkin, R., 2002. Control of Listeria monocytogenes in the food-processing environment. Journal of food protection 65, 709-725.
Van Der Veen, S., Moezelaar, R., Abee, T., Wells‐Bennik, M.H., 2008. The growth limits of a large number of Listeria monocytogenes strains at combinations of stresses show serotype‐and niche‐specific traits. Journal of applied microbiology 105, 1246-1258.
van Hemert, S., Meijerink, M., Molenaar, D., Bron, P.A., de Vos, P., Kleerebezem, M., Wells, J.M., Marco, M.L., 2010. Identification of Lactobacillus plantarum genes modulating the cytokine response of human peripheral blood mononuclear cells. BMC microbiology 10, 293.
Verghese, B., Lok, M., Wen, J., Alessandria, V., Chen, Y., Kathariou, S., Knabel, S., 2011. comK prophage junction fragments as markers for Listeria monocytogenes genotypes unique to individual meat and poultry processing plants and a model for rapid niche-specific adaptation, biofilm formation, and persistence. Appl. Environ. Microbiol. 77, 3279-3292.
Verheul, A., Rombouts, F.M., Beumer, R.R., Abee, T., 1995. An ATP-dependent L-carnitine transporter in Listeria monocytogenes Scott A is involved in osmoprotection. Journal of bacteriology 177, 3205-3212.
Verheyen, D., Xu, X.M., Govaert, M., Baka, M., Skåra, T., Van Impe, J.F., 2019. Food microstructure and fat content affect growth morphology, growth kinetics, and the preferred phase for cell growth of Listeria monocytogenes in fish-based model systems. Applied and environmental microbiology, AEM. 00707-00719.
Vose, D.J., 1998. The application of quantitative risk assessment to microbial food safety. Journal of food protection 61, 640-648.

References
157
Walker, S., Brocklehurst, T., Wimpenny, J., 1997. The effects of growth dynamics upon pH gradient formation within and around subsurface colonies of Salmonella typhimurium. Journal of applied microbiology 82, 610-614.
Wang, X., Kim, Y., Ma, Q., Hong, S.H., Pokusaeva, K., Sturino, J.M., Wood, T.K., 2010. Cryptic prophages help bacteria cope with adverse environments. Nature communications 1, 147.
Ward, T.J., Ducey, T.F., Usgaard, T., Dunn, K.A., Bielawski, J.P., 2008. Multilocus genotyping assays for single nucleotide polymorphism-based subtyping of Listeria monocytogenes isolates. Appl. Environ. Microbiol. 74, 7629-7642.
Wei, Q., Wang, X., Sun, D.-W., Pu, H., 2019. Rapid detection and control of psychrotrophic microorganisms in cold storage foods: A review. Trends in food science & technology.
Weller, D., Andrus, A., Wiedmann, M., den Bakker, H.C., 2015. Listeria booriae sp. nov. and Listeria newyorkensis sp. nov., from food processing environments in the USA. International journal of systematic and evolutionary microbiology 65, 286-292.
Wemekamp-Kamphuis, H.H., Sleator, R.D., Wouters, J.A., Hill, C., Abee, T., 2004. Molecular and physiological analysis of the role of osmolyte transporters BetL, Gbu, and OpuC in growth of Listeria monocytogenes at low temperatures. Appl. Environ. Microbiol. 70, 2912-2918.
Wiedmann, M., Zhang, W., 2011. Genomics of foodborne bacterial pathogens. Springer Science & Business Media.
Wilson, P., Brocklehurst, T., Arino, S., Thuault, D., Jakobsen, M., Lange, M., Farkas, J., Wimpenny, J., Van Impe, J., 2002. Modelling microbial growth in structured foods: towards a unified approach. International journal of food microbiology 73, 275-289.
Wood, L., Woodbine, M., 1979. Low temperature virulence of Listeria monocytogenes in the avian embryo. Zentralblatt fur Bakteriologie, Parasitenkunde, Infektionskrankheiten und Hygiene. Erste Abteilung Originale. Reihe A: Medizinische Mikrobiologie und Parasitologie 243, 74-81.
Wu, Y., Griffiths, M., McKellar, R., 2000. A comparison of the Bioscreen method and microscopy for the determination of lag times of individual cells of Listeria monocytogenes. Letters in Applied Microbiology 30, 468-472.
Yang, Z., Rannala, B., 2012. Molecular phylogenetics: principles and practice. Nature Reviews Genetics 13, 303.
Yeni, F., Acar, S., Soyer, Y., Alpas, H., 2017. How can we improve foodborne disease surveillance systems: A comparison through EU and US systems. Food Reviews International 33, 406-423.
Zeisel, S.H., Mar, M.-H., Howe, J.C., Holden, J.M., 2003. Concentrations of choline-containing compounds and betaine in common foods. The Journal of nutrition 133, 1302-1307.
Zerbino, D.R., Birney, E., 2008. Velvet: algorithms for de novo short read assembly using de Bruijn graphs. Genome research 18, 821-829.
Zhang, W., Jayarao, B.M., Knabel, S.J., 2004. Multi-virulence-locus sequence typing of Listeria monocytogenes. Appl. Environ. Microbiol. 70, 913-920.
Zhou, X., Stephens, M., 2012. Genome-wide efficient mixed-model analysis for association studies. Nature genetics 44, 821.
Zoz, F., Grandvalet, C., Lang, E., Iaconelli, C., Gervais, P., Firmesse, O., Guyot, S., Beney, L., 2017. Listeria monocytogenes ability to survive desiccation:

References
158
Influence of serotype, origin, virulence, and genotype. International Journal of Food Microbiology 248, 82-89.

Supplementary material
159
Supplementary material
Supplementary material 1: Characteristics of 51 Listeria monocytogenes strains
included in the study
Strain ID Lineage Clonal Complex Origin Mean time to
visible growth at
2°C (days)
02CEB369LM I CC1 Dairy products 21
03CEB46LM II CC9 Dairy products 31*
04CEB500LM II CC26 Dairy products 17
05CEB256LM I CC6 Dairy products 17
05CEB373LM I CC54 Dairy products 17
05CEB376LM II CC18 Dairy products 17
05CEB394LM I CC6 Seafood 19
05CEB671LM I CC6 Seafood 19
05CEB716LM II CC14 Dairy products 17
05CEB795LM I CC2 Seafood 19
06CEB420LM I CC4 Dairy products 19
06CEB587LM I CC54 Dairy products 19
07CEB235LM I CC4 Dairy products 19
07CEB308LM I CC6 Dairy products 19
07CEB374LM I CC54 Dairy products 19
07CEB380LM I CC54 Dairy products 19.5
07CEB430LM II CC26 Dairy products 17
07CEB768LM I CC6 Dairy products 17
07CEB794LM I CC2 Seafood 17
08CEB244LM II CC412 Dairy products 22
08CEB287LM II CC207 Dairy products 17
08CEB397LM II CC121 Seafood 22
08CEB85LM I CC2 sea food 17
09CEB616LM I CC1 Seafood 17
10CEB366LM II CC31 Seafood 17
10CEB368LM II CC121 Seafood 17
10CEB588LM II CC121 Seafood 17
10CEB68LM I CC2 Seafood 26.5*
11CEB239LM I CC5 Seafood 22.5
11CEB241LM I CC2 Seafood 17
11CEB426LM II CC155 Seafood 19
11CEB429LM II CC9 Seafood 19

Supplementary material
160
11CEB431LM II CC121 Seafood 45.5*
11CEB475LM II CC121 Seafood 45.5*
11CEB656LM I CC59 Seafood 17
12CEB366LM I CC2 Meat products 42.5*
12CEB367LM I CC2 Meat products 17
12CEB368LM I CC2 Meat products 17
12CEB383LM I CC6 Meat products 19.5
14SEL860LM II CC9 Meat products 36.5*
14SEL861LM II CC31 Meat products 19
14SEL862LM I CC3 Industrial environment 17
14SEL863LM I CC2 Industrial environment 43*
14SEL872LM I CC2 Meat products 19
14SEL873LM I CC1 Meat products 17
14SEL874LM I CC2 Meat products 17
14SEL875LM II CC121 Industrial environment 17
14SEL876LM I CC3 Industrial environment 17
14SEL877LM I CC3 Industrial environment 17
14SEL878LM I CC2 Industrial environment 17
14SEL879LM I CC5 Dairy products 30*
14SEL906LM I CC2 Meat products 17
* strains classified as “slow” growing strain at 2°C

Supplementary material
161
Supplementary material 2: Quality parameters of raw reads and genome assemblies.
Strain ID Reads Deep Coverage Breadth Coverage Total length N50
02CEB369LM 592.6316 86.61% 2916196 2916196
03CEB46LM 413.5260 97.98% 2984694 2983372
04CEB500LM 398.2204 95.13% 2899096 2899096
05CEB256LM 540.1698 86.08% 2880169 2880169
05CEB373LM 253.0781 85.73% 2779662 2772309
05CEB376LM 665.8138 95.16% 2838841 2838841
05CEB394LM 477.2362 85.6% 3138210 3138210
05CEB671LM 328.2228 85.81% 2920488 2920488
05CEB716LM 911.1483 94.74% 2942538 2942301
05CEB795LM 263.7213 85.51% 3152067 3152067
06CEB420LM 111 87.17% 2918278 244902
06CEB587LM 337.6334 85.61% 2897238 2891523
07CEB235LM 679.7624 85.42% 2883553 2883553
07CEB308LM 256.8279 85.88% 3170479 3170479
07CEB374LM 416.8330 86.44% 2936976 2936976
07CEB380LM 470.7155 86.64% 2937399 2937199
07CEB430LM 598.4284 95.06% 2860128 2859814
07CEB768LM 421.1201 86.28% 2874961 2874961
07CEB794LM 510.0839 85.91% 2999656 2999656
08CEB244LM 71.1349 94.62% 2872591 2869407
08CEB287LM 566.5650 95.38% 3063695 2980989
08CEB397LM 318.8124 95.4% 3111502 3044157
09CEB616LM 172.0089 85.71% 2974093 2960992
10CEB366LM 395.0897 94.38% 3095332 3006029
10CEB368LM 519.2391 95.11% 2983553 2982985
10CEB588LM 309.9157 95.43% 3060115 2993100
10CEB68LM 296.1250 85.26% 2958019 2958019
11CEB239LM 302.1884 87.97% 3015910 2925016
11CEB241LM 169.3014 85.25% 2990583 2990583
11CEB426LM 455.6619 94.91% 2975388 2931277
11CEB429LM 90 98.0% 3019676 330138
11CEB431LM 557.9262 95.31% 3087055 3086193
11CEB475LM 330.3424 95.45% 3117270 3111620
11CEB656LM 376.5166 88.29% 2929122 2921504
12CEB366LM 207.4452 85.32% 3109433 3109433
12CEB367LM 40 88.83% 3015827 144616
12CEB368LM 233.1621 85.02% 3035802 3035416
12CEB383LM 278.3006 87.74% 3062612 3019002
14SEL860LM 326.7772 97.81% 2907238 2907238
14SEL861LM 384.1521 94.78% 3099066 3037310

Supplementary material
162
Supplementary material 3: Pangenome characteristics of the 51 Listeria
monocytgenes strains.
14SEL862LM 219.3390 87.39% 2978317 2921062
14SEL863LM 264.0851 85.7% 3066248 3065660
14SEL872LM 196.9262 85.16% 3001583 3001583
14SEL873LM 284.0920 86.55% 2951324 2950739
14SEL874LM 255.7525 86.0% 2963497 2963497
14SEL875LM 266.9115 95.24% 3055756 3055756
14SEL876LM 361.2296 87.64% 2987115 2937466
14SEL877LM 420.5283 88.36% 2995303 2995303
14SEL878LM 453.3566 85.95% 3030556 3030556
14SEL879LM 217.2113 88.32% 3001911 2915272
14SEL906LM 206.9351 85.52% 2891388 2891388

Supplementary material
163
Supplementary material 4: List of 114 genes with a statistical association with the
growth ability at 2°C obtained with the gene-based GWAS method (Scoary)
https://www.sciencedirect.com/science/article/pii/S0168160518309218
Supplementary material 5: List of SNPs with a statistical association (p-value < 0.01)
with the growth ability at 2 °C.
https://www.sciencedirect.com/science/article/pii/S0168160518309218
Supplementary material 6: Prevalence of the different CCs associated to virulence
levels in cold smoked salmon.
ClonalComplex Frequency in CSS Virulence group
CC1 1 hypervirulent
CC101 7 hypervirulent
CC121 93 hypovirulent
CC14 5 medium virulent
CC155 24 medium virulent
CC177 1 medium virulent
CC18 0 medium virulent
CC2 4 hypervirulent
CC20 4 medium virulent
CC204 8 hypovirulent
CC21 1 medium virulent
CC220 0 hypervirulent
CC224 0 hypervirulent
CC26 0 medium virulent
CC3 9 medium virulent
CC31 5 hypovirulent
CC37 0 medium virulent
CC379 0 medium virulent
CC388 0 medium virulent
CC398 0 medium virulent
CC4 0 hypervirulent
CC451 1 hypervirulent
CC5 1 medium virulent
CC54 0 hypervirulent
CC59 6 medium virulent
CC6 10 hypervirulent
CC7 8 hypervirulent
CC8 49 medium virulent
CC87 6 hypervirulent
CC9 37 hypovirulent

Supplementary material
164
CC193 4 hypovirulent
CC403 4 medium virulent
CC19 3 hypovirulent
ST124 2 hypovirulent
new CC 1 medium virulent

Supplementary material
165
Supplementary material 7: Log10 r-values of 26 different L. monocytogenes strains
(FDA/FSIS, 2003).
Strain log10(LD50) log10(r_whole population)
G9599 2.57 -11.36
G1032 2.69 -11.48
G2618 2.89 -11.68
F4244 3.62 -12.41
F5738 3.67 -12.46
F6646 4.49 -13.28
15U 4.56 -13.35
F4246S 4.57 -13.36
F7208 4.61 -13.4
G2228 4.66 -13.45
F2381 4.73 -13.52
G2261 4.95 -13.74
F2380 4.96 -13.75
F2392 5.08 -13.87
NCTC 7973 5.47 -14.26
F7243 5.75 -14.54
F7245 5.91 -14.7
SLCC 5764 6 -14.79
V37 CE 6.04 -14.83
F7191 6.23 -15.02
V7 6.8 -15.59
Brie 1 7.28 -16.07
Murray B 7.3 -16.09
Scott A 7.54 -16.33
G970 8.88 -17.67
NCTC 5101 9.7 -18.49

Supplementary material
166
Supplementary material 8: Poster IAFP Europe 2017.

Supplementary material
167
Supplementary material 9: Poster ICPMF 2017.