CARABIDAE (COLEOPTERA) SELECTED NATURAL ENVIRONMENTS IN PUSZCZA BORECKA
24
Stanis³aw HURUK 1, 2* , Alicja HURUK 1 , Arvîds BARŠEVSKIS 3 , Grzegorz WRÓBEL 1 and Anna DEGÓRSKA 4 CARABIDAE (COLEOPTERA) SELECTED NATURAL ENVIRONMENTS IN PUSZCZA BORECKA CARABIDAE (COLEOPTERA) WYBRANYCH ŒRODOWISK PRZYRODNICZYCH W PUSZCZY BORECKIEJ Abstract: The paper presents the results of research on Carabidae of a mixed forest site and an oak-hornbeam forest site carried out between 2004 and 2011 within the Integrated Natural Environment Monitoring Base Station in Puszcza Borecka. Carabidae were captured into glycol-filled Barber pitfall traps between May and September every year in five one-month catch cycles. The aim of the study was to characterise assemblage structures of Carabidae in these two habitats with regard to selected abiotic environmental factors. A total of 13,227 individuals of Carabidae representing 31 species were captured. The total yield in the mixed forest was 8,023 individuals of 25 species, compared to 5,204 individuals of 26 species in the oak-hornbeam forest. Both habitats supported species associated with forest, open and forested areas, and open areas. The species represented all zoogeographical elements found in Poland. However, their proportions differed between the two habitats. There was also a difference in the pattern of activity, with peak activity of the mixed forest assemblage seen in August and in the oak-hornbeam forest, in July. Species diversity, measured with the Shannon-Wiener index (H’), and evenness, measured with the Pielou index (J’), were H’ = 1.8981, J’ = 0.5897 for the mixed mesic forest assemblage and H’ = 2.1328, J’ = 0.6546 for the oak-hornbeam forest site. Catch results were analysed with regard to such factors as air temperature, ground temperature, precipitation, relative air humidity, and air levels of SO 2 and NO 2 . There was a statistically significant positive correlation between the Carabidae catch yield and air temperature at 2 metres in both habitats: for the mixed forest, r = 0.4, df = 38, p = 0.01; for the oak-hornbeam forest, r = 0.35, df = 38, p = 0.02; and between catch yield and ground temperature at a depth of 0.05 m: for the mixed forest, r = 0.49, df = 38, p = 0.001; for the DOI: 10.2428/ecea.2014.21(2)12 ECOL CHEM ENG A. 2014;21(2):143-165 1 Department of Zoology and Biological Didactics, Institute of Biology, The Jan Kochanowski University, ul. Œwiêtokrzyska 15A, 25–406 Kielce, Poland, phone: +48 41 349 63 57. 2 The Œwiêtokrzyski National Park, ul. Suchedniowska 4, 26–010 Bodzentyn, Poland. 3 Systematic Biology Institute, Daugavpils University, Vienibas Str. 13, Daugavpils, Latvia. 4 Institute of Environmental Protection, ul. Krucza 5/11d, 00–584 Warszawa, Poland. * Corresponding author: [email protected]
Transcript of CARABIDAE (COLEOPTERA) SELECTED NATURAL ENVIRONMENTS IN PUSZCZA BORECKA

Stanis³aw HURUK1, 2*, Alicja HURUK1,Arvîds BARŠEVSKIS3, Grzegorz WRÓBEL1
and Anna DEGÓRSKA4
CARABIDAE (COLEOPTERA)SELECTED NATURAL ENVIRONMENTS
IN PUSZCZA BORECKA
CARABIDAE (COLEOPTERA)WYBRANYCH ŒRODOWISK PRZYRODNICZYCH
W PUSZCZY BORECKIEJ
Abstract: The paper presents the results of research on Carabidae of a mixed forest site and an oak-hornbeamforest site carried out between 2004 and 2011 within the Integrated Natural Environment Monitoring BaseStation in Puszcza Borecka. Carabidae were captured into glycol-filled Barber pitfall traps between May andSeptember every year in five one-month catch cycles. The aim of the study was to characterise assemblagestructures of Carabidae in these two habitats with regard to selected abiotic environmental factors. A total of13,227 individuals of Carabidae representing 31 species were captured. The total yield in the mixed forest was8,023 individuals of 25 species, compared to 5,204 individuals of 26 species in the oak-hornbeam forest. Bothhabitats supported species associated with forest, open and forested areas, and open areas. The speciesrepresented all zoogeographical elements found in Poland. However, their proportions differed between thetwo habitats. There was also a difference in the pattern of activity, with peak activity of the mixed forestassemblage seen in August and in the oak-hornbeam forest, in July. Species diversity, measured with theShannon-Wiener index (H’), and evenness, measured with the Pielou index (J’), were H’ = 1.8981,J’ = 0.5897 for the mixed mesic forest assemblage and H’ = 2.1328, J’ = 0.6546 for the oak-hornbeam forestsite. Catch results were analysed with regard to such factors as air temperature, ground temperature,precipitation, relative air humidity, and air levels of SO2 and NO2. There was a statistically significant positivecorrelation between the Carabidae catch yield and air temperature at 2 metres in both habitats: for the mixedforest, r = 0.4, df = 38, p = 0.01; for the oak-hornbeam forest, r = 0.35, df = 38, p = 0.02; and between catchyield and ground temperature at a depth of 0.05 m: for the mixed forest, r = 0.49, df = 38, p = 0.001; for the
DOI: 10.2428/ecea.2014.21(2)12 ECOL CHEM ENG A. 2014;21(2):143-165
1 Department of Zoology and Biological Didactics, Institute of Biology, The Jan Kochanowski University,ul. Œwiêtokrzyska 15A, 25–406 Kielce, Poland, phone: +48 41 349 63 57.
2 The Œwiêtokrzyski National Park, ul. Suchedniowska 4, 26–010 Bodzentyn, Poland.3 Systematic Biology Institute, Daugavpils University, Vienibas Str. 13, Daugavpils, Latvia.4 Institute of Environmental Protection, ul. Krucza 5/11d, 00–584 Warszawa, Poland.
* Corresponding author: [email protected]

oak-hornbeam forest, r = 0.42, df = 38, p = 0.007. Correlations between catch yield and the remaining factorswere less marked and reached statistical significance only in three cases.
Keywords: Carabidae, nature monitoring, atmospheric factors, environmental pollution
Introduction
For several dozen years, base stations of the Integrated Natural EnvironmentMonitoring System have been responsible for the measurement of environmentalindices in the area where they are situated. The underlying methodological assumptionbehind Integrated Natural Environment Monitoring is that the field stations carry outfocused stationary research on selected elements of the natural environment [1],including physical, chemical and biological factors. The monitoring of physical andchemical factors in conjunction with biological monitoring may be an important tool foranalysing changes in the environment provided it is carried out over the long term andfollows a unified methodology to allow for comparison of results obtained within oneobject as well as between objects [2]. The biological monitoring includes observationsof epigeic fauna, including ground beetles (Carabidae, Coleoptera), as this taxon iseligible for monitoring [3–8].
In view of the above, the aim of the present study was to analyse Carabidaeassemblage structures and correlations between structural indices (ie the number ofspecies and individuals captured) and the following selected abiotic factors: airtemperature at 0.05 m and 2 m above ground, ground temperature at a depth of 0.05 m;0.1 m; 0.2 m; 0.5 m; and 1 m, mean monthly precipitation, mean monthly relative airhumidity, and mean monthly air pollutant (SO2, NO2) levels. Correlations were verifiedwith the t test and significance was assessed with Pearson’s linear correlationcoefficient. Assemblage diversity was also assessed with Shannon-Wiener’s index ofspecies diversity (H’) [9], and assemblage evenness was measured with Pielou’s indexof evenness (J’) [10].
Material and methods
The research was carried out between 2004 and 2011 within the Integrated NaturalEnvironment Monitoring Base Station in Puszcza Borecka (catchment area of LakeLekuk, located in the mesoregion of Pojezierze Elckie, macroregion of PojezierzeMazurskie, subprovince of Pojezierze Wschodniobaltyckie – Fig. 1), in Borki ForestInspectorate, Diabla Gora forest district, Przerwanki surveying section. Samples werecollected in two habitat variants: a mixed forest site (variant I) and an oak-hornbeamforest site (variant II). (Fig. 1). The mixed forest grew on rusty pseudogley and rustybrown pseudogley soils. It was composed of hornbeam (30 %), spruce (20 %) and oak(20 %) trees, all aged 117 years, with admixtures of linden (10 %) and birch (10 %)aged 117 years and 24-year-old hornbeam (10 %). The oak-hornbeam forest wascomposed of spruce (30 %), oak (30 %) and hornbeam (30 %) aged 119 years growingon pseudogley soils, with admixtures of 39-year-old hornbeam trees (10 %). Threepermanent study sites were established in both types of forest. Five Barber pitfall traps
144 Stanis³aw Huruk et al

were buried in the ground at 3-metre intervals at each site and filled with ethyleneglycol to a third of their height. Carabidae were collected in five monthly catch cyclesfrom May to October.
Abundance was determined on the basis of the catch yield of species and individuals,dominance patterns were represented by a dominance index [11], dominance distribu-tion by Simpson’s dominance index [12], constancy was characterised with a constancyindex [13], and a fidelity index was used to study fidelity [13]. Carabidae wereclassified into particular ecological categories on the basis of papers by such authors asKoch [14], Larsson [15], Lindroth [16], Sarova [17, 18], Szyszko [19], and Aleksan-drowicz [20].
Correlations were investigated between the following combinations of catch yield(abundance) data and selected abiotic factors: a) catch yield (abundance) of Carabidaeindividuals in particular months of the growing season in a given year vs. mean monthlyvalues of a given factor (separately for each year in the period 2004–2011); b) overallcatch yield in particular months of the growing season in consecutive years of study vs.the value of a given factor in a given month (Table 1); c) catch yield in a given year vs.mean value of a given factor in the growing season; d) catch yield in a given year vs.mean value of a given factor in that year. The analyses were then replicated with regardto species classified as dominants (eudominants, dominants, subdominants) collectivelyand separately for each species of that group. The t test was used to determine thesignificance of Pearson’s linear correlation coefficient. Correlations were also assessedwith canonical correspondence analysis (CCA) [21]. Assemblage diversity was alsoinvestigated, using Shannon-Wiener’s index of species diversity (H’) [9], whileassemblage evenness was evaluated with Pielou’s index of evenness (J’) [10].
Carabidae (Coleoptera) Selected Natural Environments in Puszcza Borecka 145
Fig. 1. Location of the study area (A, B) and permanent study sites (C) [ � – divisions, � – study sites]

146 Stanis³aw Huruk et al
Tab
le1
Cor
rela
tion
betw
een
Car
abid
aeab
unda
nce
and
sele
cted
abio
ticen
viro
nmen
tal
fact
ors
inth
eye
ars
2004
–201
1
Fact
orT
P[o C
]T
G[o C
]R
HPR
S-SO
2N
-NO
2
2m
0.05
m0.
05m
0.1
m0.
2m
0.5
m1
m[%
][m
m]
[�g/
m3 ]
[�g/
m3 ]
Mix
edfo
rest
r0.
403
0.49
40.
486
0.48
60.
468
0.40
00.
265
0.11
20.
279
0.00
40.
061
p0.
0099
0.00
120.
0015
0.00
150.
0023
0.01
050.
0980
0.50
820.
0817
0.97
830.
7099
Oak
-hor
nbea
mfo
rest
r0.
355
0.35
60.
417
0.41
70.
391
0.29
40.
126
0.01
80.
187
–0.0
120.
010
p0.
0247
0.02
400.
0074
0.00
740.
0125
0.06
510.
4403
0.91
640.
2489
0.93
950.
9518
Key
tosy
mbo
ls:
r–
Pear
son’
slin
ear
corr
elat
ion
coef
fici
ent,
p–
leve
lof
sign
ific
ance
,R
H–
air
hum
idity
,T
G–
grou
ndte
mpe
ratu
re,
TP
–ai
rte
mpe
ratu
re,
PR–
prec
ipita
tion.

Results
The total catch yield during the study was 13.227 individuals of Carabidaerepresenting 31 species (Table 2). In the mixed forest the total abundance was 8.023individuals representing 25 species (Table 3). The figures varied over time, butdisplayed a general growing trend (Fig. 2). As regards dominance patterns, P. niger
accounted for a constantly high proportion of the assemblage.It was clearly the dominant species and maintained a eudominant rank throughout the
study period (Table 7), with annual contributions from 18.01 % in 2004 to 59.51 % in2009. Another species that was also a eudominant in individual years of the studyperiod was P. melanarius, whose contribution to the assemblage ranged from 11.90 %in 2007 to 39.88 % in 2004, falling into the dominant range only once (5.37 % in 2006).The abundance of the remaining 22 species varied considerably, placing them into therecendent, subdominant, dominant or eudominant bracket depending on the particularspecies and year. The distribution of individuals between species was assessed withSimpson’s index. These figures are presented in Table 7 and reveal the greatestevenness for the assemblage of the year 2005. The only species in the highest constancyclass of euconstant species was P. niger (92.5 %) (Table 9), while three species:P. melanarius (72.5 %), C. hortensis (61 %) and P. oblongopunctatus (53 %), wereclassified as constant species. The accessory species group comprised C. granulatus
(48 %), N. brevicolis (44.2 %), A. assimile (40.8 %), C. caraboides (37.5 %),C. violaceus (36 %), C. coriaceus (32 %) and C. cancellatus (25 %). The remaining14 species (56 % of all species recorded in the mixed forest) were classified asaccidental. An analysis of fidelity revealed 16 characteristic species, of which 6 wereselective and 10 were preferential. Unique exclusive species (100 %) comprisedCarabus convexus, C. glabratus, A. plebeja, A. ater, and A. viduum, with exclusivespecies including also P. nigrita (80.28 %). Selective characteristic species comprisedC. caraboides (74.01 %), P. aethiops (70 %), P. melanarius (69.45 %), N. brevicolis
(65.41 %), C. violaceus (64.11 %), P. niger (64.01 %), C. granulatus (63.61 %),C. hortensis (52.04 %), C. coriaceus (50.99 %), H. latus (50 %).
Overall peak activity of the carabid assemblage from the mixed forest site during theentire period of study was noted in August (Fig. 3). As regards ecological indices, thedominant habitat preference of the constituent species was for forest habitats (Table 5),while in terms of humidity preferences the dominant type was mesohygrophilousspecies, with large zoophages dominating with regard to feeding habits and springbreeders being the dominant breeding type.
A variety of zoogeographic elements were noted (Table 6), with the Palaearcticelement dominant among the 8 types recorded. Species diversity, measured as Shannon-Wiener’s index (H’), and evenness, measured as Pielou’s index (J’), were H’ = 1.8981(H’ max = 3.2189) and J’ = 0.5897, respectively, in the mixed forest assemblage.
The total abundance of ground beetles in the oak-hornbeam site was 5,204individuals representing 26 species (Table 4). Abundance varied between years ofstudy, but as with the mixed forest habitat, a clear tendency towards increasing catchyield was noted (Fig. 2).
Carabidae (Coleoptera) Selected Natural Environments in Puszcza Borecka 147

Table 2
Zoogeographic and ecological characteristics of Carabidae and overall species abundancein the entire study period in both habitat variants
No. Species
Ecological category Zoogeo-graphicelement
AbundanceHabitat
Feedinghabits
Humiditypreferences
Breedingtype
1 Carabus coriaceus L. F Lz Mh A Efp 151
2 C. violaceus L. F Lz Mh S Pal 170
3 C. convexus Fabr. OFa Lz Mh S Esb 1
4 C. granulatusL. OFa Lz Hg S Esb 742
5 C. cancellatus Ill. OFa Lz Mh S Esb 210
6 C. arcensis Herbst F Lz Mh S Pal 250
7 C. nemoralis O. F. Müller F Lz Mh S Efp 155
8 C. hortensis L. F Lz Mh A Efp 513
9 C. glabratus Payk. F Lz Mh S Ear 2
10 Cychrus caraboides (L.) F Lz Mh S Ear 153
11 Leistus piceus Frol. F Sz Hg S Efpm 11
12 Nebria brevicollis (Fabr.) OFa Sz Hg A Emd 1064
13 Patrobus atrorufus (Stroem) F Sz Hg S Esb 58
14 Amara plebeja (Gyll.) Oa Hz Hg S Pal 2
15 Pterostichus oblongopunctatus
(Fabr.) F Sz Mh S Pal 674
16 P. niger (Schall.) F Lz Mh S Esb 5460
17 P. melanarius (L.) OFa Lz Mh A Esb 2239
18 P. nigrita (Fabr.) OFa Sz Hg S Pal 142
19 P. strenuus (Panz.) F Sz Mh S Pal 4
20 P. aethiops (Panz.) F Sz Mh S Eca 10
21 Abax carinatus (Duft.) F Sz Mh S Efpm 8
22 A. ater (Pill. et Mitt.) F Sz Mh A Efp 1
23 Calathus micropterus (Duft.) F Sz Mh A Pal 3
24 Agonum muelleri (Herbst) OFa Sz Mh S Hol 57
25 A. viduum (Panz.) Oa Sz Hg S Esb 1
26 A. assimile (Payk.) F Sz Hg S Pal 1084
27 A. obscurum (Herbst) F Sz Hg S Hol 1
28 A. gracile Sturm Oa Sz Hg S Pal 3
29 Harpalus rufipes (De Geer) Oa Hz Mh A Pal 1
30 H. latus (L.) F Hz Mh S Pal 56
31 H. guadripunctatus Dej. F Hz Mh S Pal 1
Total 13227
Key: F – Forest (species), Oa – open-area, OFa – open and forested area; Lz – Large zoophage, Sz – Smallzoophage, Hz – Hemizoophage; Hg – Hygrophilous, Mh – Mesohygrophilous; S – Spring breeder, A –Autumn breeder; Hol – Holarctic; Pal – Palaearctic, Esb – Euro-Siberian, Eca – Euro-Central Asian, Ear –Euro-Arctic, Emd – Euro-Mediterranean, Efp – European Forest Province, Efpm – European Forest Province(montane).
148 Stanis³aw Huruk et al

Table 3
Abundance of Carabidae species collected in mixed forest by year of study
No. Species
Number of individuals
Mixed forest (Variant I)
2004 2005 2006 2007 2008 2009 2010 2011 Total
1 C. coriaceus L. 3 5 24 15 11 7 12 77
2 C. violaceus L. 4 9 32 19 18 24 3 109
3 C. convexus Fabr. 1 1
4 C. granulatus L. 139 115 57 85 54 22 472
5 C. cancellatus Ill. 16 22 2 1 5 38 2 86
6 C. arcensis Herbst 25 87 112
7 C. nemoralis O. F. Müller 15 11 18 14 6 1 3 7 75
8 C. hortensis L. 14 25 66 54 30 30 29 19 267
9 C. glabratus Payk. 2 2
10 Cychrus caraboides (L.) 11 6 7 35 18 12 11 14 114
11 Leistus piceus Frol. 3 1 4
12 Nebria brevicollis (Fabr.) 20 55 68 238 101 90 124 696
13 Patrobus atrorufus (Stroem) 5 5 6 2 4 22
14 Amara plebeja (Gyll.) 2 2
15 Pt. oblongopunctatus (Fabr.) 96 67 68 31 14 18 22 20 336
16 P. niger (Schall.) 154 220 208 640 439 741 712 381 3495
17 P. melanarius (L.) 341 87 272 141 75 161 226 252 1555
18 P. nigrita (Fabr.) 3 9 102 114
19 P. aethiops (Panz.) 7 7
20 A. ater (Pill. et Mitt.) 1 1
21 Calathus micropterus (Duft.) 1 1
22 Agonum muelleri (Herbst) 2 1 3
23 A. viduum (Panz.) 1 1
24 A. assimile (Payk.) 35 49 41 54 4 11 167 82 443
25 H. latus (L.) 1 25 1 1 28
Total 855 667 774 1184 931 1245 1358 1009 8023
Number of species collected 14 13 12 13 16 18 15 14 25
Carabidae (Coleoptera) Selected Natural Environments in Puszcza Borecka 149

Also in this variant, P. niger was a eudominant throughout the study period, withcontributions to assemblage abundance from 11.39 % in 2005 to 55.42 % in 2009.P. melanarius was a eudominant in almost every year of the study period (except 2008and 2010), as was A. assimile (except 2005 and 2009, when it was a subdominant).N. brevicollis and C. granulatus also had constantly high contributions to overallabundance. The dominance patterns of the remaining 21 species demonstrated con-
150 Stanis³aw Huruk et al
2004 2005 2006 2007 2008 2009 2010 2011
Time [years]
1600
1400
1200
1000
800
600
400
200
0
n
855
667
774
11841245
1358
507
398 364
499
856
931
765
606
12091009
Fig. 2. Carabid abundance in oak-hornbeam forest and mixed forest by year of study (� – mixed forest, � –oak-hornbeam forest)
V VI VII VIII IX
2500
2000
1500
1000
500
0
n
Time [months]
Fig. 3. Activity of Carabid assemblages in oak-hornbeam forest and mixed forest in years 2004–2011 (fromMay (V) to September (IX), � – mixed forest, � – oak-hornbeam forest)

Table 4
Abundance of Carabidae species collected in the oak-hornbeam forest by year of study
No. Species
Number of individuals
Oak-hornbeam forest (Variant II)
2004 2005 2006 2007 2008 2009 2010 2011 Total
1 Carabus coriaceus L. 7 11 10 12 15 13 1 5 74
2 C. violaceus L. 2 8 20 14 8 6 3 61
3 C. granulatusL. 32 88 40 40 43 27 270
4 C. cancellatus Ill. 12 13 3 4 81 11 124
5 C. arcensis Herbst 37 101 138
6 C. nemoralis O. F. Müller 26 8 16 11 5 4 4 6 80
7 C. hortensis L. 17 4 17 27 53 47 53 28 246
8 Cychrus caraboides (L.) 5 1 7 9 10 4 3 39
9 Leistus piceus Frol. 1 1 5 7
10 Nebria brevicollis (Fabr.) 6 11 8 201 64 46 32 368
11 Patrobus atrorufus (Stroem) 15 4 1 8 2 6 36
12 Pt. oblongopunctatus (Fabr.) 76 56 68 31 16 13 41 37 338
13 P. niger (Schall.) 140 45 88 203 388 424 474 203 1965
14 P. melanarius (L.) 75 130 53 67 46 108 104 101 684
15 P. nigrita (Fabr.) 27 1 28
16 P. strenuus (Panz.) 1 3 4
17 P. aethiops (Panz.) 2 1 3
18 Abax carinatus (Duft.) 8 8
19 Calathus micropterus (Duft.) 2 2
20 Agonum muelleri (Herbst) 20 13 16 5 54
21 A. assimile (Payk.) 37 19 40 49 44 37 346 69 641
22 A. obscurum (Herbst) 1 1
23 A. gracile Sturm 3 3
24 Harpalus rufipes (De Geer) 1 1
25 H. latus (L.) 2 14 5 1 1 4 1 28
26 H. guadripunctatus Dej. 1 1
Total 507 398 364 499 856 765 1209 606 5204
Number of species collected 21 15 12 14 17 15 15 14 26
Carabidae (Coleoptera) Selected Natural Environments in Puszcza Borecka 151

siderable variability between species and between years. The distribution of individualsbetween species was evaluated with Simpson’s index. These data are presented inTable 8 and show that the most uniform distribution of species was noted in 2010 andalso in 2004 and 2006.
P. niger (79.2 %) was the sole member of the group of the most constant species(euconstant), while P. melanarius (61.2 %) was classified as a constant species.Accessory species were represented by N. brevicolis (42.5 %), P. oblongopunctatus
(42.5 %), C. hortensis (40.8 %), C. granulatus (38.3 %), A. assimile (36.7 %),C. nemoralis (33.3 %), C. cancellatus (29.1 %), and C. coriaceus (28.3 %) (Table 9).The remaining 16 species (61 % of all species captured in the oak-hornbeam habitat)were classified as accidental. A fidelity analysis revealed 16 characteristic species,including 7 exclusive and 9 preferential species. Unique exclusive (100 %) speciescomprised P. strenuus, A. carinatus, A. obscurum, A. gracile, H. rufipes, and H. guadri-
punctatus. A. müelleri (94.73 %) was classified as exclusive, while the group ofpreferential characteristic species comprised C. micropterus (66.66 %), L. piceus
(63.63 %), P. atrorufus (62.06 %), A. assimile (59.13 %), C. cancellatus (59.04 %),C. arcensis (55.2 %), C. nemoralis (51.61 %), P. oblongopunctatus (50.14 %), andH. latus (50 %).
The highest activity of this assemblage was noted in July (Fig. 3). The dominantecological elements were the same as in the mixed forest assemblage, with theexception of ranking by feeding habits, as it was small zoophages which were thedominant element in this dimension in qualitative analysis (Table 5), accounting for50 % of the assemblage, while the proportion of large zoophages was 38.5 %.
Table 5
Ecological characteristics of Carabid assemblages
Ecologicalcategory
Ecologicalelement
Variant I(Mixed forest)
Variant II(Oak-hornbeam forest)
M [%] N [%] M [%] N [%]
Habitat
F 16 64.0 5093 63.480 18 69.231 3672 70.561
OFa 7 28.0 2927 36.483 6 23.077 1528 29.362
Oa 2 8.0 3 0.037 2 7.692 4 0.077
Feedinghabits
Lz 12 48.0 6365 79.334 10 38.462 3681 70.734
Sz 11 44.0 1628 20.292 13 50.000 1523 29.266
Hz 2 8.0 30 0.374 3 11.538 30 0.576
Humidityrequirements
Hg 8 32.0 1754 21.862 8 30.769 1354 26.018
Mh 17 68.0 6269 78.138 18 69.231 3850 73.982
Breedingtype
S 19 76.0 5426 67.631 20 76.923 3829 73.578
A 6 24.0 2597 32.369 6 23.077 1375 26.422
Key: F – Forest (species), Oa – open-area, OFa – open and forested area; Lz – Large zoophage, Sz – Smallzoophage, Hz – Hemizoophage; Hg – Hygrophilous, Mh – Mesohygrophilous; S – Spring breeder,A – Autumn breeder; M – number of species, N – number of individuals, % – percentage of assemblage.
152 Stanis³aw Huruk et al

Zoogeographic variety in the oak-hornbeam site assemblage was at the same level (8elements) and the dominant element was also Palaearctic (Table 6). The indices ofspecies diversity and evenness amounted to H’ = 2.1328 (H’ max = 3.2581) andJ’ = 0.6546, respectively.
Table 6
Contribution of zoogeographic elements to Carabidae abundance
Zoogeographic element
Variant I(Mixed forest)
Variant II(Oak-hornbeam forest)
M [%] N [%] M [%] N [%]
Holarctic 1 4.0 3 0.037 2 7.692 55 1.057
Palaearctic 8 32.0 1145 14.271 11 42.308 1245 23.924
Euro-Siberian 7 28.0 5632 70.198 5 19.231 3079 59.166
Euro-Arctic 2 8.0 116 1.446 1 3.846 39 0.749
Euro-Central Asian 1 4.0 7 0.087 1 3.846 3 0.058
Euro-Mediterranean 1 4.0 696 8.675 1 3.846 368 7.071
European Forest Province 4 16.0 420 5.235 3 11.538 400 7.686
Euro. Forest Province (montane) 1 4.0 4 0.050 2 7.692 15 0.288
Key: M – number of species, N – number of individuals, % – percentage of assemblage.
There was a statistically significant positive correlation between the number ofcarabids captured in particular months during the growing season and mean monthly airtemperature at 2 m in both habitat variants: for the mixed forest (r = 0.4, df = 38,p = 0.01) and for the oak-hornbeam forest (r = 0.35, df = 38, p = 0.02); and alsobetween the number of carabids captured in particular months during the growingseason and mean monthly ground temperature at a depth of 0.05 m: for the mixed forest(r = 0.49, df = 38, p = 0.001) and for the oak-hornbeam forest (r = 0.42, df = 38,p = 0.007). Data from different years of study show that in 2010 there was a strongpositive correlation between carabid abundance in the mixed forest and mean monthlyvalues of the following indices: air temperature at 2 m (r = 0.95, df = 3, p = 0.012) andat 0.5 m (r = 0.95, df = 3, p = 0.013), and ground temperature at a depth of 0.05 m(r = 0.96, df = 3, p = 0.008), 0.1 m (r = 0.96, df = 3, p = 0.011) and 0.2 m (r = 0.95,df = 3, p = 0.015).
With regard to SO2 and NO2 levels in the air, a significant negative correlation wasnoted between carabid abundance and mean monthly SO2 levels in the air in the mixedforest in 2004 (r = –0.89, df = 3, p = 0.043), while a positive correlation with regard tothis index was noted in 2008 (r = 0.95, df = 3, p = 0.013). Of note is also a positive andsignificant correlation between carabid abundance and mean monthly NO2 levels in theair in the mixed forest in 2006 (r = 0.95, df = 3, p = 0.015).
An analysis of correlations between the capture rates of dominant species and theabiotic factors revealed that changes in the abundance of Pterostichus niger in both
Carabidae (Coleoptera) Selected Natural Environments in Puszcza Borecka 153

Table 7
Dominance patterns in Carabidae assemblages in mixed forest by year of study
No. Species
Dominance [%]
Mixed forest
2004 2005 2006 2007 2008 2009 2010 2011
1 Carabus coriaceus 0.35 0.75 2.03 1.61 0.88 0.52 1.19
2 C. violaceus 0.60 1.16 2.70 2.04 1.45 1.77 0.30
3 C. convexus 0.11
4 C. granulatus 16.26 17.24 7.36 7.18 5.80 1.77
5 C. cancellatus 1.87 3.30 0.26 0.08 0.40 2.80 0.20
6 C. arcensis 1.84 8.62
7 C. nemoralis 1.75 1.65 2.33 1.18 0.64 0.08 0.22 0.69
8 C. hortensis 1.64 3.75 8.53 4.56 3.22 2.41 2.14 1.88
9 C. glabratus 0.20
10 Cychrus caraboides 1.29 0.90 0.90 2.96 1.93 0.96 0.81 1.39
11 Leistus piceus 0.32 0.07
12 Nebria brevicollis 2.34 8.25 5.74 25.56 8.11 6.63 12.29
13 Patrobus atrorufus 0.42 0.54 0.48 0.15 0.40
14 Amara plebeja 0.16
15 Pt. oblongopunctatus 11.23 10.04 8.79 2.62 1.50 1.45 1.62 1.98
16 P. niger 18.01 32.98 26.87 54.05 47.15 59.52 52.43 37.76
17 P. melanarius 39.88 13.04 35.14 11.91 8.06 12.93 16.64 24.98
18 P. nigrita 0.35 0.97 8.19
20 P. aethiops 0.82
22 A. ater 0.13
23 Calathus micropterus 0.12
24 Agonum muelleri 0.16 0.07
25 A. viduum 0.08
26 A. assimile 4.09 7.35 5.30 4.56 0.43 0.88 12.30 8.13
30 H. latus 0.15 3.23 0.11 0.08
�* 0.23 0.18 0.23 0.32 0.30 0.39 0.32 0.23
* Simpson’s dominance index.
154 Stanis³aw Huruk et al

Table 8
Dominance patterns in Carabidae assemblages in oak-hornbeam forest by year of study
No. Species
Dominance [%]
Oak-hornbeam forest
2004 2005 2006 2007 2008 2009 2010 2011
1 Carabus coriaceus 1.38 2.76 2.75 2.40 1.75 1.70 0.08 0.83
2 C. violaceus 0.39 2.20 4.01 1.64 1.05 0.50 0.50
3 C. granulatus 6.31 22.11 10.99 8.02 5.02 3.53
4 C. cancellatus 2.37 3.27 0.82 0.52 6.70 1.82
5 C. arcensis 3.06 16.67
6 C. nemoralis 5.13 2.01 4.40 2.20 0.58 0.52 0.33 0.99
7 C. hortensis 3.35 1.01 4.67 5.41 6.19 6.14 4.38 4.62
8 Cychrus caraboides 0.99 0.25 1.92 1.80 1.17 0.52 0.50
9 Leistus piceus 0.20 0.12 0.41
10 Nebria brevicollis 1.18 2.76 1.60 23.48 8.37 3.80 5.28
11 Patrobus atrorufus 2.96 0.80 0.12 1.05 0.17 0.99
12 Pt. oblongopunctatus 14.99 14.07 18.68 6.21 1.87 1.70 3.39 6.11
13 P. niger 27.61 11.31 24.18 40.68 45.33 55.42 39.21 33.50
14 P. melanarius 14.79 32.66 14.56 13.43 5.37 14.12 8.60 16.67
15 P. nigrita 5.33 0.12
16 P. strenuus 0.25 0.39
17 P. aethiops 0.39 0.25
18 Abax carinatus 2.01
19 Calathus micropterus 0.39
20 Agonum muelleri 3.94 2.61 1.87 0.41
21 A. assimile 7.30 4.77 10.99 9.82 5.14 4.84 28.62 11.39
22 A. obscurum 0.20
23 A. gracile 0.59
24 Harpalus rufipes 0.12
25 H. latus 0.50 3.85 1.00 0.12 0.13 0.33 0.17
26 H. guadripunctatus 0.20
�* 0.14 0.19 0.14 0.21 0.27 0.34 < 0.01 0.19
* Simpson’s index of dominance.
Carabidae (Coleoptera) Selected Natural Environments in Puszcza Borecka 155

Table 9
Fidelity and constancy of occurrence of Carabidae species in the two habitat variants
No. Species
Fidelity [%] Constancy [%]
Mixed forestOak-hornbeam
forestMixed forest
Oak-hornbeamforest
1 Carabus coriaceus 50.99 49.01 32.21 28.32
2 C. violaceus 64.12 35.88 36.72 21.63
3 C. convexus 100.00 0.81
4 C. granulatus 63.61 36.39 48.11 38.31
5 C. cancellatus 40.95 59.05 25.32 29.13
6 C. arcensis 44.80 55.20 11.06 15.82
7 C. nemoralis 48.39 51.61 27.03 33.33
8 C. hortensis 52.05 47.95 61.26 40.83
9 C. glabratus 100.00 1.73
10 Cychrus caraboides 74.51 25.49 37.52 19.26
11 Leistus piceus 36.36 63.64 2.51 2.54
12 Nebria brevicollis 65.41 34.59 44.24 42.54
13 Patrobus atrorufus 37.93 62.07 11.72 7.53
14 Amara plebeja 100.00 0.81
15 P. oblongopunctatus 49.85 50.15 53.23 42.52
16 P. niger 64.01 35.99 92.58 79.28
17 P. melanarius 69.45 30.55 72.51 61.26
18 P. nigrita 80.28 19.72 4.23 5.84
19 P. strenuus 100.00 1.62
20 P. aethiops 70.00 30.00 4.23 2.53
21 Abax carinatus 100.00 1.62
22 A. ater 100.00 0.81
23 Calathus micropterus 33.33 66.67 0.81 1.62
24 Agonum muelleri 5.26 94.74 2.51 7.53
25 A. viduum 100.00 0.81
26 A. assimile 40.87 59.13 40.83 36.72
27 A. obscurum 100.00 0.81
28 A. gracile 100.00 1.62
29 Harpalus rufipes 100.00 0.81
30 H. latus 50.00 50.00 6.66 11.73
31 H. guadripunctatus 100.00 0.81
habitat variants correlated significantly with changes in mean monthly air temperaturesat the height of 2 m in the mixed forest (r = 0.585, df = 38, p = 0.0001) and in theoak-hornbeam forest (r = 0.622, df = 38, p = 0.0001), and at the height of 0.05 m in themixed forest (r = 0.669, df = 38, p = 0.0001) and in the oak-hornbeam forest (r = 0.634,df = 38, p = 0.0001). There was also a correlation with changes in mean monthly
156 Stanis³aw Huruk et al
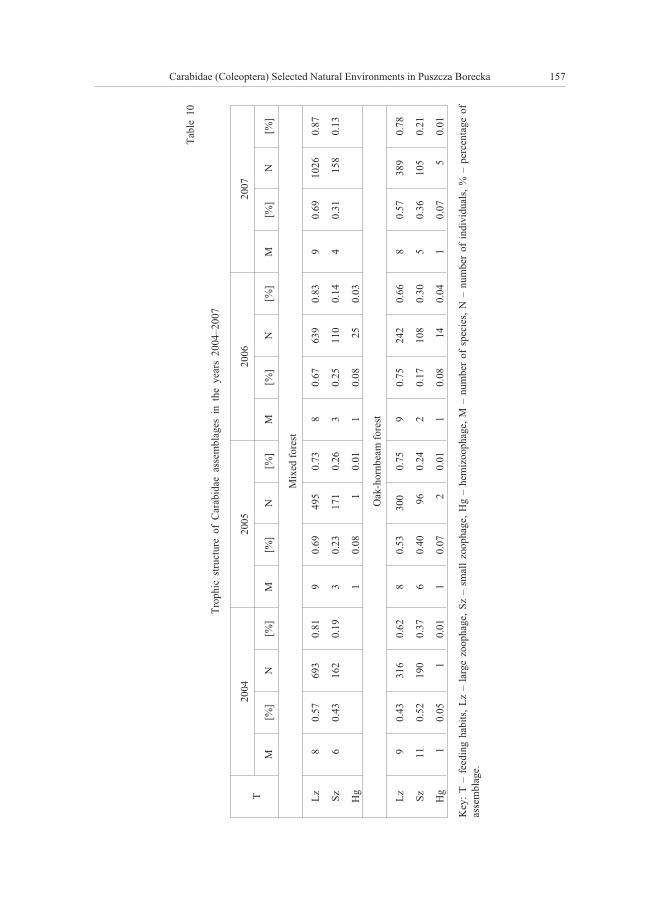
Carabidae (Coleoptera) Selected Natural Environments in Puszcza Borecka 157
Tab
le10
Tro
phic
stru
ctur
eof
Car
abid
aeas
sem
blag
esin
the
year
s20
04–2
007
T20
0420
0520
0620
07
M[%
]N
[%]
M[%
]N
[%]
M[%
]N
[%]
M[%
]N
[%]
Mix
edfo
rest
Lz
80.
5769
30.
819
0.69
495
0.73
80.
6763
90.
839
0.69
1026
0.87
Sz6
0.43
162
0.19
30.
2317
10.
263
0.25
110
0.14
40.
3115
80.
13
Hg
10.
081
0.01
10.
0825
0.03
Oak
-hor
nbea
mfo
rest
Lz
90.
4331
60.
628
0.53
300
0.75
90.
7524
20.
668
0.57
389
0.78
Sz11
0.52
190
0.37
60.
4096
0.24
20.
1710
80.
305
0.36
105
0.21
Hg
10.
051
0.01
10.
072
0.01
10.
0814
0.04
10.
075
0.01
Key
:T
–fe
edin
gha
bits
,L
z–
larg
ezo
opha
ge,
Sz–
smal
lzo
opha
ge,
Hg
–he
miz
ooph
age,
M–
num
ber
ofsp
ecie
s,N
–nu
mbe
rof
indi
vidu
als,
%–
perc
enta
geof
asse
mbl
age.

158 Stanis³aw Huruk et al
Tab
le11
Tro
phic
stru
ctur
eof
Car
abid
aeas
sem
blag
esin
the
year
s20
08–2
011
T20
0820
0920
1020
11
M[%
]N
[%]
M[%
]N
[%]
M[%
]N
[%]
M[%
]N
[%]
Mix
edfo
rest
Lz
90.
5665
70.
719
0.50
1001
0.80
90.
6010
750.
7910
0.71
779
0.77
Sz6
0.38
273
0.28
70.
3924
10.
196
0.40
283
0.21
40.
2923
00.
23
Hg
10.
061
0.01
20.
113
0.01
Oak
-hor
nbea
mfo
rest
Lz
80.
4757
40.
679
0.60
639
0.84
80.
5376
00.
6310
0.71
493
0.81
Sz7
0.41
280
0.32
50.
3312
50.
156
0.40
445
0.36
30.
2111
20.
18
Hg
20.
122
0.01
10.
071
0.01
10.
074
0.01
10.
071
0.01
Key
:T
–fe
edin
gha
bits
,Z
d–
larg
ezo
opha
ge,
Zm
–sm
all
zoop
hage
,H
g–
hem
izoo
phag
e,M
–nu
mbe
rof
spec
ies,
N–
num
ber
ofin
divi
dual
s,%
–pe
rcen
tage
ofas
sem
blag
e.

Carabidae (Coleoptera) Selected Natural Environments in Puszcza Borecka 159
Fig.
4.C
anon
ical
corr
espo
nden
cean
alys
is(C
CA
)di
agra
mfo
rC
arab
idae
asse
mbl
ages
from
the
mix
edfo
rest

160 Stanis³aw Huruk et al
Fig.
5.C
anon
ical
corr
espo
nden
cean
alys
is(C
CA
)di
agra
mfo
rC
arab
idae
asse
mbl
ages
from
the
oak-
horn
beam
fore
st

temperatures of the ground at various depths: at 0.05 m (mixed forest: r = 0.579,df = 38, p = 0.0001; oak-hornbeam forest: r = 0.611, df = 38, p = 0.0001), 0.1 m (mixedforest: r = 0.584, df = 38, p = 0.0001; oak-hornbeam forest: r = 0.621, df = 38,p = 0.0001), 0.2 m (mixed forest: r = 0.601, df = 38, p = 0.0001; oak-hornbeam forest:r = 0.636, df = 38, p = 0.0001), 0.5 m (mixed forest: r = 0.631, df = 38, p = 0.0001;oak-hornbeam forest: r = 0.661, df = 38, p = 0.0001), 1 m (mixed forest: r = 0.593,df = 38, p = 0.0001; oak-hornbeam forest: r = 0.609, df = 38, p = 0.0001). Carabus
arcensis also merits a note as the only dominant species to demonstrate a positive andsignificant correlation between its abundance and mean monthly precipitation in theoak-hornbeam forest in the study period 2004–2011 (r = 0.329, df = 38, p = 0.038).
Canonical correspondence analysis (CCA), whose results reflect correlations betweenthe presence of a particular species and environmental factors [21], revealed, for bothforest habitat variants studied, that the greatest effect on the Carabidae assemblages wasexerted by ground temperature (Fig. 4, Fig. 5).
Discussion
The 8 years of research yielded quite abundant Carabidae material representinga variety of species, ecological categories and zoogeographic elements. The trapabilityindex (number of Carabidae individuals captured daily into one trap) reached mediumvalues similar to those reported from other studies [22, 23].
The Carabidae assemblage inhabiting the oak-hornbeam forest site demonstratedgreater variety than its counterpart from the mixed forest site. The index of similarityfor the two assemblages was 0.645. The assemblages differed distinctly with regard topeak activity, with the mixed forest assemblage displaying one peak in August and theoak-hornbeam forest assemblage showing two peaks of activity: a minor one in Mayand a major one in July. Ecological analysis showed a predominance of the sameecological elements in both assemblages with regard to the various categories, exceptfor feeding habits. Representatives of 8 zoogeographic elements were found, ie allelements listed by Leœniak [24, 25].
Correlations were also studied between abundance and selected abiotic factors. Withregard to temperature, which ranks among the most important ecological factors, it wasrevealed that higher catch yields correlated positively and significantly with temperaturein both habitat variants throughout the study period. Szujecki [26] points out that everyinsect species has an optimal temperature range where its basic life functions are at theirbest and most efficient. A The existence of a strong correlation between the activity ofepigeic Carabidae and changes in soil temperature has been indicated by [27], Saskaand Honek [28] and Tuf et al [29]. Williams and Gormally [30], in a study involvingcontinuous monitoring of ground temperature, found a positive correlation between theabundance of Carabus clatratus and ground temperature (with higher temperaturesbeing associated with increased abundance of that species). In a 4-year study, Olszewski[31] found a highly positive correlation between Carabidae abundance and airtemperature. At the same time, Gutowski [32] failed to observe significant correlationsbetween Carabidae catch counts and meteorological indices including mean air
Carabidae (Coleoptera) Selected Natural Environments in Puszcza Borecka 161

temperature during the growing season in Puszcza Bia³owieska in the years1988–1999. The same authors indicate (Olszewski [31], Gutowski [32]) the absence ofa correlation between the amount and distribution of precipitation in a given year andthe year before vs. the number of Carabidae captured into Barber’s traps. Still anotherstudy failed to show an association between Carabidae catch yield and precipitation [23,33]. Besides temperature, humidity is also a very important abiotic factor that plays amajor role in the development of soil-dwelling insects and influences these animals in acomplex and multifaceted manner [34]. A positive correlation between soil humidityand the activity of selected species of Carabidae was shown by Nève [35], withincreased soil humidity causing an increase in the abundance of species preferring suchhabitat conditions. The present study did not analyse the correlation between soilhumidity and abundance of Carabidae since soil humidity data were not available.However, we studied the link between relative air humidity and Carabidae catch yield,finding no significant correlations between these factors. This finding is partiallyattributable to the fact that, while air humidity is an important factor in insect life [26],the association between this factor and abundance is more difficult to grasp.
As regards SO2 and NO2 content in the air, only three instances of significantcorrelations between these factors and Carabidae catch yield were identified. Thesefindings appear quite explicable in view of the fact that daily air concentrations of SO2
and NO2 did not exceed levels considered harmless to human health [36]. It might bespeculated that air levels of sulphur dioxide and nitrogen dioxide that pose no harm tohumans are also not harmful to plants or animals, which may explain the lack ofsignificant correlations between these factors and catch yield for most analytical pairs.Other studies have revealed a strong negative correlation between Carabidae abundanceand SO2 and NO2, concentrations, which were, however, determined in the soil (groundbeetle abundance fell with increasing levels of these compounds in the soil) [31, 37–40].
Faunal monitoring within the system of INEM Base Stations aims also to assess thecondition of the environment by evaluating a particular taxon or a group of taxa. In thecase of Carabidae, indices serving to evaluate environmental health include abundance,dominance patterns, contributions of particular zoogeographic elements to an as-semblage, trophic structure [3–8], geographical ranges of particular species [41] ormean individual biomass [42]. The monitoring of Carabidae by the INEM Base Stationsinvolves such indices as the number of individuals and species, trapability, dominance,trophic structure, diversity and evenness. Of these, dominance patterns (Tables 7 and 8)and trophic structure (Tables 10 and 11) were found to be most useful for environmentalmonitoring. It is believed that good environmental conditions are paralleled by balanceddominance relations, with no species showing excessive quantitative advantage over theothers. As regards the feeding habits of species in a community, it is believed that goodenvironmental health is accompanied by a predominance of zoophagous species,especially large zoophages, while progressive destruction of a forest ecosystem shiftsthis index in favour of hemizoophages [7]. Our data (Tables 7 and 8 and Tables 10 and11) allow the conclusion that the pressure of negative factors in the study habitats maynot be high, as indicated by low values of Simpson’s index and a predominance ofzoophages in the two assemblages.
162 Stanis³aw Huruk et al

Conclusions
Studies of Carabidae assemblages conducted by INEM Base Stations are ofconsiderable value owing to the continuity of data and the determination of abioticfactors at the site of collection of Carabidae, which affords unique possibilities forstudying the correlation between a given factor and the catch yield. There are not manyopportunities for carrying out such studies outside the base station network.
References
[1] Kostrzewski A. Zintegrowany Monitoring Œrodowiska Przyrodniczego – cele zamierzenia, zadania. In:A. Kostrzewski, editor. ZMŒP, Propozycje programowe. Warszawa: Biblioteka Monitoringu Œrodo-wiska; 1995;7-22.
[2] Kostrzewski A, Mazurek M, Stach A. Zintegrowany Monitoring Œrodowiska Przyrodniczego. Zasadyorganizacji, system pomiarowy, wybrane metody badañ. Warszawa: Biblioteka Monitoringu Œrodo-wiska; 1995;15-23.
[3] Arndt E. Carabidae as monitoring subject in the light of EU Natura 2000 (Habitats Directive), In:Penev L, Erwin T, Assmann T, editors. Back to the Roots and Back to the Future. Towards a NewSynthesis amongst Taxonomic, Ecological and Biogeographical Approaches in Carabidology. Blago-evgrad; 2008;373-384.Available at: http://f3.tiera.ru/1/genesis/570-574/574000/1356f72c0490e42487d2a6b9d42e0eeb.
[4] Rainio J, Niemelä J. Ground beetles (Coleoptera: Carabidae) as bioindicators. Biodivers. Conserv.2003;12:487-506. DOI:10.1023/A:1022412617568.
[5] New TR. The role of ground beetles (Coleoptera: Ground beetleae) in monitoring programmes inAustralia. Annales Zoologici Fennici. 1998;35:163-171.Available at: http://www.sekj.org/PDF/anzf35/anzf35-163p.pdf
[6] Meitzner V, Schmidt J, Schultz R. Wald-Monitoring im Müritz-Nationalpark: Status-Quo-Erfassung derLaufkäfer (Coleoptera: Carabidae) in den Jahren 2001 und 2002. Angewandte Carabidologie.2006;7:1-12.Available at: http://www.laufkaefer.de/gac/pdf/GAC-Bd7/GAC-Bd7-S1-12-Meitzner_et_al.pdf
[7] Leœniak A. Metody analizy zgrupowañ biegaczowatych (Carabidae, Col) w zooindykacji procesówekologicznych. In: Waloryzacja ekosystemów leœnych metodami zooindykacyjnymi. Warszawa: Wyd.SGGW; 1997;29-41.
[8] Leœniak A. Studies on the terrestial entomofauna of the sod and shrubbs tiers of industriogenousvegetation. Spr. IBL dla US Dep. of Agricult. Warszawa; 1977;150-171.
[9] Shannon CE, Weiner W. The Mathematical Theory of Communication. University of Illinois PressUrbana. Illinois. 1963;117-118.
[10] Pielou, EC. Ecological diversity. New York: John Wiley and Sons; 1975;165-166.[11] Balogh J. Lebensgemeinschaften der Landtiere ihre Erforschung unter besonderer berücksichtigung der
Zoozönologischen Arbeitmethoden. Berlin: Akademie-Verlag; 1958;560.[12] Weiner J. ¯ycie i ewolucja biosfery. Warszawa: PWN; 1999;591.[13] Kasprzak K, Niedba³a W. WskaŸniki biocenotyczne stosowane przy porz¹dkowaniu i analizie danych
w badaniach iloœciowych. In: M. Górny, L. Grüm, editors. Metody stosowane w zoologii gleby.Warszawa: PWN; 198;397-416.
[14] Koch K. Die Käfer Mitteleuropas. Ökologie. Krefeld: Goecke & Evers Verlag; 1989;413.[15] Larsson SG. Entwicklungstypen und Entwicklungszeiten der dänischen Carabiden. Entomol Medd.
1939;20:277-560.[16] Lindroth CH. Die fennoskandichen Carabidae. Eine tiergeographisce Studie. 3. Allgemeiner Teil.
Zuglelh eine biogeographische Prinzipdiskussion. Goteborgs Kungl. Vetenskaps-och Vitterhets-Sam-hälles, Slätte Följden. 1949;Bd 4(3)911.
[17] Šarova ICh. �iznennye formy �u�elic (Coleoptera, carabidae). Moskva: Izd-vo Nauka; 1981;359.[18] Šarova I. Morfo-ekologièeskie tipy lièinok �u�elic (Carabidae). Zool �. 1960;39:691-708.
Carabidae (Coleoptera) Selected Natural Environments in Puszcza Borecka 163

[19] Szyszko J. State of Carabidae (Col) fauna in fresh pine forest and tentative valorization of thisenvironment. Warszawa: Warsaw Agricultural Unoversity Press; 1983:1-80.
[20] Aleksandrowicz OR. Biegaczowate (Carabidae). In: Bogdanowicz W, Chudzicka E, Pilipiuk I, SkibiñskaE, editors. Fauna Polski – charakterystyka i wykaz gatunków. Warszawa: MiIZ PAN; 2004;1:28-31.Available at: http://www.biologia.apsl.edu.pl/pracownicy/aleksandrowiczaleh/publikacje/71.pdf
[21] Piernik A. Metody numeryczne w ekologii na przyk³adzie zastosowañ pakietu MVSP do analizroœlinnoœci. Toruñ: Wyd. Nauk. Uniwersytetu Miko³aja Kopernika; 2008;62-88.
[22] Huruk S, Huruk A. Zgrupowania biegaczowatych (Coleoptera, Carabidae) borów sosnowych orazjod³owych w Górach Œwiêtokrzyskich. Wiad Entomol. 2010;29(4):247-258.Available at: http://pte.up.poznan.pl/we/2010/29_huruk.pdf
[23] Huruk S. Analiza struktur i aktywnoœci polnych zgrupowañ biegaczowatych (Carabidae, Coleoptera) nawybranych typach gleb. Kielce: Wyd. Akademii Œwiêtokrzyskiej; 2007;183.
[24] Huruk S, Huruk A. Struktura zgrupowañ biegaczowatych w uroczysku Serwis Œwiêtokrzyskiego ParkuNarodowego w dwu odleg³ych okresach badawczych. Regionalny Monitoring Œrodowiska, Kielce: KTN;2002;3:75-81. Available at: http://www.ujk.edu.pl/ios/wydawnictwa/z3/Huruk.pdf
[25] Leœniak A. Zoogeografical analysis of the Carabidae (Coleoptera) of Poland. Fragm Faun.1987;30(17):297-312.
[26] Szujecki A. Ekologia owadów leœnych. Warszawa: PWN; 1980;44-50.[27] Honek A. The effect of temperature on the activity of Carabidae (Coleoptera) in a fallow field. Eur J
Entomol.1997;94(1):97-104. Available at: http://www.eje.cz/pdfs/eje/1997/01/10.pdf[28] Saska P, Honek A. Temperature development of central European species of Amara (Coleoptera,
Carabidae). Eur J Entomol. 2003;100:509-515. DOI: 10.14411/eje.2003.078.[29] Tuf IH, Dedek P, Veselý M. Does the diurnal activity pattern of carabid beetles depend on season,
ground temperature and habitat? Arch Biol Sci, Belgrade. 2012;64(2):721-732.DOI:10.2298/ABS1202721T.
[30] Williams CD, Gormally, MJ. The effects of blanket bog management on ground beetles (Carabidae) withparticular reference to the threatened Carabus clatratus L. Irish Wildlife Manuals, No 47. National Parksand Wildlife Service, Department of the Environment, Heritage and Local Government, Dublin, Ireland;2010;25-28. Available at: http://www.npws.ie/publications/irishwildlifemanuals/IWM47.pdf
[31] Olszewski JL. Catches of Carabidae (Coleoptera) and Geotrupes stercorosus (Sc) (Scarabeidae,Coleoptera) in the Bia³owie¿a National Park, and the ecoclimatic parameters. Ecol Pol.1979;27:437-447.
[32] Gutowski JM. Bezkrêgowce jako obiekt monitoringu biologicznego w Puszczy Bia³owieskiej. LeœnePrace Badawcze. 2004;1:39-46.Available at: http://www.ibles.pl/web/lesne-prace-badawcze/-/lesne-prace-badawcze-2004-nr-1
[33] Moraes RM, de Souza Mendonça M, Ott R. Carabid beetle assemblages in three environments in theAraucaria humid forest of southern Brazil. Revista Brasileira de Entomologia, São Paulo.2013;57(1):67-74. Available at: http://dx.doi.org/10.1590/S0085-56262013000100011.
[34] Thiele HU. Carabid beetles in their environments. Berlin: Springer-Verlag; 1977;1-370.[35] Néve, G. Influence of temperature and humidity on the activity of three Carabus species. In: Desender K
et al, editors. Carabid Beetles: Ecology and Evolution. Dordrecht: Kluwer Academic Publishers;1994;189-192. DOI:10.1007/978-94-017-0968-2_29.
[36] Œnie¿ek T, editor. Ocena stanu œrodowiska Stacji Bazowej ZMŒP Puszcza Borecka w roku hydro-logicznym 2008. Warszawa: Instytut Ochrony Œrodowiska; 2008;29-30.Available at: http://www.ios.edu.pl/pol/zaklady/puszcza/raport%20zmsp_2008.pdf
[37] Rybak J. Effect of sulphur contaminants on macroinvertebrates in the Karkonosze Mountains(Sudeten,Poland). Environ Protect Eng. 2009;35(1):111-119.Available at: http://epe.pwr.wroc.pl/2009/Rybak_1-2009.pdf
[38] Cárcamo HA, Parkinson D, Volney JWA. Effects of sulphur contamination on macroinvertebrates inCanadian pine forests, Applied Soil Ecology. 1998;9:459-464.Available at: http://nofc.cfs.nrcan.gc.ca/bookstore_pdfs/18742.pdf
[39] Paoletti MG, Bressan M. Soil Invertebrates as bioindicators of Human Disturbance. Critical Reviews inPlant Science. 1996;15(1):21-62. DOI:10.1080/07352689609701935.
[40] Puszkar T. Zmiany wybranych elementów zoocenoz w agroekosystemach poddawanych silnej presjiemisji przemys³owych. Pu³awy: IUNG; 1981;157:78.
[41] Odum EP. Ekologia. Warszawa: PWN; 1969;219.
164 Stanis³aw Huruk et al

[42] Sk³odowski J. Interpreting the condition of the forest environment with use of the SCP/MIB model ofcarabid communities (Coleoptera: Carabidae). Baltic J Coleopterol. 2009;9:89-100. Available at:http://www.bjc.sggw.pl/arts/2009v9n2/294.pdf
CARABIDAE (COLEOPTERA) WYBRANYCH ŒRODOWISK PRZYRODNICZYCHW PUSZCZY BORECKIEJ
1 Zaklad Zoologii i Dydaktyki Biologii, Instytut Biologii, Uniwersytet Jana Kochanowskiego w Kielcach2 Œwiêtokrzyski Park Narodowy, Bodzentyn
3 Instytut Biologii Systematycznej Uniwersytet w Daugavpils4 Instytut Ochrony Œrodowiska w Warszawie
Abstrakt: W pracy przedstawiono wyniki badañ nad Carabidae lasu mieszanego oraz gr¹du prowadzonychw latach 2004–2011 w obrêbie Stacji Bazowej ZMŒP w Puszczy Boreckiej. Celem pracy by³a charakterystykastruktur zgrupowañ Carabidae funkcjonuj¹cych w wymienionych œrodowiskach na tle wybranych abiotycz-nych czynników œrodowiska. Podczas badañ od³owiono ³¹cznie 13227 osobników Carabidae nale¿¹cych do31 gatunków. W lesie mieszanym od³owiono ³¹cznie 8023 osobniki nale¿¹ce do 25 gatunków, w gr¹dzie 5204osobniki nale¿¹ce do 26 gatunków. Ró¿norodnoœæ gatunkowa mierzona wskaŸnikiem Shannona-Wienera (H’)oraz równomiernoœæ mierzona wskaŸnikiem Pielou (J’) wynios³y w przypadku lasu mieszanego H’ = 1,8981;J’ = 0,5897 a dla gr¹du odpowiednio H’ = 2,1328; J’ = 0,6546. Wyniki od³owów analizowano na tle takichczynników, jak temperatura powietrza, gruntu, opady atmosferyczne, wilgotnoœæ wzglêdna powietrza, zawar-toœæ w powietrzu SO2, NO2. Stwierdzono istotn¹ statystycznie, dodatni¹ korelacjê miêdzy liczebnoœci¹od³owów Carabidae a temperatur¹ powietrza na wysokoœci 2 m w obydwu badanych œrodowiskach: las mie-szany – r = 0,4, df = 38, p = 0,01, gr¹d – r = 0,35, df = 38, p = 0,02; jak równie¿ miêdzy liczebnoœci¹od³owów biegaczowatych a temperatur¹ gruntu na g³êbokoœci 0,05 m, odpowiednio: dla lasu mieszanego –r = 0,49, df = 38, p = 0,001 oraz gr¹du – r = 0,42, df = 38, p = 0,007. Zale¿noœci miêdzy liczebnoœci¹od³owów, a wartoœci¹ pozosta³ych czynników by³y s³abo wyra¿one, tylko w trzech przypadkach istotne sta-tystycznie.
S³owa kluczowe: Carabidae, monitoring przyrodniczy, temperatury, opady, SO2, NO2 w powietrzu
Carabidae (Coleoptera) Selected Natural Environments in Puszcza Borecka 165