Capital Structure Choices in Technology Firms - MDPI
20
Journal of Risk and Financial Management Article Capital Structure Choices in Technology Firms: Empirical Results from Polish Listed Companies Marcin Kedzior 1, * , Barbara Grabinska 2 , Konrad Grabinski 1 and Dorota Kedzior 3 1 Financial Accounting Department, College of Economics, Finance and Law, Cracow University of Economics, Rakowicka 27, 31-510 Cracow, Poland; [email protected] 2 Finance and Financial Policy Department, College of Economics, Finance and Law, Cracow University of Economics, Rakowicka 27, 31-510 Cracow, Poland; [email protected] 3 Corporate Finance Department, College of Economics, Cracow, Finance and Law, University of Economics, Rakowicka 27, 31-510 Cracow, Poland; [email protected] * Correspondence: [email protected]; Tel.: +48-12-293-56-94 Received: 31 August 2020; Accepted: 17 September 2020; Published: 22 September 2020 Abstract: The main aim of the paper is the identification of capital structure determinants, with a special emphasis on investments in the innovativeness of Polish New Technology-Based Firms (NTBFs). Poland is a unique country in that it is an emerging market that was also promoted in 2018 to the status of a developed country. The study sample consisted of 31 companies listed in the Warsaw Stock Exchange that are classified as high-tech firms and covers the period 2014–2018. The following factors influencing the capital structure were analyzed: internal and external innovativeness and the firm’s size, liquidity, intangibility, age, profitability, and growth opportunities. The results of the research provide empirical evidence that liquidity, age, and investments in innovativeness determine capital structure, which provides an additional argument supporting the trade-off theory and the modified version of the pecking order theory. More specifically, the results suggest that companies whose process of investment in innovativeness is based on the external acquisition of technology are able to attract external financing, while the process based on internally generated innovativeness (R&D activity) deters external capital. The results are interesting for policymakers in emerging markets. Keywords: capital structure; New Technology-Based Firms (NTBFs); internal and external innovativeness; intangibility 1. Introduction Over one hundred years ago, entrepreneurial activity undertaken in technologically advanced sectors was considered to be a primary source of innovation and economic growth (Schumpeter 1911). Nowadays, economic growth and competitive power are ascribed to the innovativeness of the economy to an even greater degree (Gherghina et al. 2020). From a policymaking perspective, special attention is devoted to high-tech companies and tools supporting innovative activity. Anecdotal evidence implies that the high-tech sector is a crucial driver of economic development. Furthermore, the endogenous growth theory assumes that the long-run growth rate has an endogenous character, and that the human factor plays a vital role (Kopf 2007). The decision of whether to invest more in R&D or to increase public spending on education is crucial in this context. The problem is especially important for EU countries, where, over the last decade, the lower level of investments in R&D and innovativeness has created a gap as compared to the main economic partners like the U.S. or China (Gil et al. 2019). Furthermore, investments in innovativeness create a knowledge-based society, produce intellectual capital, and finally, as (Popescu 2019) suggests, become an integral part of national wealth. J. Risk Financial Manag. 2020, 13, 221; doi:10.3390/jrfm13090221 www.mdpi.com/journal/jrfm
-
Upload
khangminh22 -
Category
Documents
-
view
0 -
download
0
Transcript of Capital Structure Choices in Technology Firms - MDPI

Journal of
Risk and FinancialManagement
Article
Capital Structure Choices in Technology Firms:Empirical Results from Polish Listed Companies
Marcin Kedzior 1,* , Barbara Grabinska 2, Konrad Grabinski 1 and Dorota Kedzior 3
1 Financial Accounting Department, College of Economics, Finance and Law, Cracow Universityof Economics, Rakowicka 27, 31-510 Cracow, Poland; [email protected]
2 Finance and Financial Policy Department, College of Economics, Finance and Law, Cracow Universityof Economics, Rakowicka 27, 31-510 Cracow, Poland; [email protected]
3 Corporate Finance Department, College of Economics, Cracow, Finance and Law, University of Economics,Rakowicka 27, 31-510 Cracow, Poland; [email protected]
* Correspondence: [email protected]; Tel.: +48-12-293-56-94
Received: 31 August 2020; Accepted: 17 September 2020; Published: 22 September 2020�����������������
Abstract: The main aim of the paper is the identification of capital structure determinants, with aspecial emphasis on investments in the innovativeness of Polish New Technology-Based Firms(NTBFs). Poland is a unique country in that it is an emerging market that was also promoted in 2018to the status of a developed country. The study sample consisted of 31 companies listed in the WarsawStock Exchange that are classified as high-tech firms and covers the period 2014–2018. The followingfactors influencing the capital structure were analyzed: internal and external innovativeness andthe firm’s size, liquidity, intangibility, age, profitability, and growth opportunities. The results of theresearch provide empirical evidence that liquidity, age, and investments in innovativeness determinecapital structure, which provides an additional argument supporting the trade-off theory and themodified version of the pecking order theory. More specifically, the results suggest that companieswhose process of investment in innovativeness is based on the external acquisition of technology areable to attract external financing, while the process based on internally generated innovativeness (R&Dactivity) deters external capital. The results are interesting for policymakers in emerging markets.
Keywords: capital structure; New Technology-Based Firms (NTBFs); internal and externalinnovativeness; intangibility
1. Introduction
Over one hundred years ago, entrepreneurial activity undertaken in technologically advancedsectors was considered to be a primary source of innovation and economic growth (Schumpeter 1911).Nowadays, economic growth and competitive power are ascribed to the innovativeness of the economyto an even greater degree (Gherghina et al. 2020). From a policymaking perspective, special attention isdevoted to high-tech companies and tools supporting innovative activity. Anecdotal evidence impliesthat the high-tech sector is a crucial driver of economic development. Furthermore, the endogenousgrowth theory assumes that the long-run growth rate has an endogenous character, and that the humanfactor plays a vital role (Kopf 2007). The decision of whether to invest more in R&D or to increasepublic spending on education is crucial in this context. The problem is especially important for EUcountries, where, over the last decade, the lower level of investments in R&D and innovativenesshas created a gap as compared to the main economic partners like the U.S. or China (Gil et al. 2019).Furthermore, investments in innovativeness create a knowledge-based society, produce intellectualcapital, and finally, as (Popescu 2019) suggests, become an integral part of national wealth.
J. Risk Financial Manag. 2020, 13, 221; doi:10.3390/jrfm13090221 www.mdpi.com/journal/jrfm

J. Risk Financial Manag. 2020, 13, 221 2 of 20
According to the results of the McKinsey Global Survey of Business Executives, on thecorporate level, executives believe that innovation is the most required element of growth(Carden et al. 2005, p. 25). (Hay and Kamshad 1994), at the beginning of the 1990s, designed andperformed a questionnaire based on Small and medium—sized enterprises located in the U.K.The results of the study imply that investment in product innovation was, at that time, perceived asthe single most crucial strategy, followed by the policy of broadening the product range andgeographic expansion.
In recent years small, medium, and young companies active in high tech sectors have attractedspecial attention in economic literature, as they are deemed to be a major source of innovation anddevelopment for the economy. Some authors claim that these firms have a specific business model.(Giraudo et al. 2019), Aghion and Howitt (2005), Hall (2002) stress that these firms are characterized bya specific attitude toward grasping technological innovation. Still, they also suffer from inefficientmechanisms of capital allocations, which are very severe, especially for young firms which lack trackrecord, stable cash flows, and collaterals. (Giraudo et al. 2019) indicate that financial constraints can beespecially severe for so-called bank-based economies, like Europe. Howell (2016), who investigatesbarriers in financing innovative firms in China, stresses that the problem of financial constraints forinnovative firms can be especially severe in transitioning economies with a less developed system offinancial intermediaries.
From the policymaking point of view, special attention is devoted to so-called NewTechnology-Based Firms (NTBFs). The term was supposedly coined by Arthur D. Little (Little 1977),who defined NTBFs as an independent venture less than 25 years old that supplies a product or servicebased on the exploitation of an invention or technological innovation. The issue invoked by manyresearchers is financial constraints, which are encountered by NTBFs at the early stage of development.So far, most studies have been focused on developed countries like the US, UK, Germany, France,or Ireland, where the institutional market environment is well established and at the same time mostdeveloped in terms of technology and science. These countries also represent a long history and haveextensive experience in supporting the development of innovative activity. The high-technology firmsin these countries have access to the best research centers, the best universities, and are subject to a verycompetitive market, and therefore their activity is based mostly on internally generated innovation.
However, scant research is devoted to the other emerging or less developed countries whoseeconomies are trying to catch up with the leading innovators. This is especially apparent,as (Vintilă et al. 2017, p. 38) note, for countries from Eastern Europe, which endeavor to line upwith Western Europe. The specific NTBFs located in these countries have other distinctive attributes.Firstly, since they are usually in emerging economies, there is no equivalent to the best research centersand access to the best universities. Secondly, there are almost no headquarters and/or research centersof multinational companies, which are usually located in the most developed countries. Thirdly, it ismuch more difficult for high-tech companies to compete for leading researchers with multinationalcompanies. Fourthly, it is much more challenging to compete with high-tech companies from leadingcountries due to scarce resources in terms of finance, marketing, patent protection, etc.
As a result, high-tech companies in developing countries often adopt a different strategy in whichinnovative activity is based in substantial part on the acquisition of external technology and to a minordegree on internally generated innovation. The purchase and implementation of new technology is thepreferred and less risky strategy in comparison to the development of in-house produced innovativeprocesses. Therefore, the specificity of the high-tech companies in emerging and developing markets isslightly different in comparison to NTBFs from leading countries. The problem is especially visiblewithin the EU, where the concept of “Two-Speed Europe” is apparent in the economic press. Therefore,as (Vintilă et al. 2018, p. 571) point out, the disparities between the West and East require a deeperunderstanding of proper public policy.
The main aim of the paper is the identification of determinants of the capital structure ofNTBFs in a country that has an emerging economy. The focus of this study is on technological
J. Risk Financial Manag. 2020, 13, 221 3 of 20
firms (NTBFs) headquartered in Poland, which is a very unique and specific case. Poland wasthe first CEE economy promoted by FTSE Russel’s index provider with the Emerging Market toDeveloped Market status. Since 2018, Poland has been classified as one of the 25 most advanced globaleconomies, including the U.S., U.K., Germany, France, Japan, etc. Therefore, Poland is considered asuccess story in terms of economic development, but at the same time is a country with one of thelowest levels of corporate R&D expenditures within EU countries. This contradiction urges us toinvestigate deeper the determinants of the capital structure of Polish NTBFs with special attentiongiven to investments in innovativeness. We select companies at a certain stage of development thatare listed on the stock exchange, mostly because of the higher quality of accounting informationreported in the financial statements as compared to the non-listed companies. We hypothesize thatinvestment in innovation has an inconclusive influence on financial leverage. Therefore, we separatedit into two categories: innovation generated internally (R&D projects) and innovation acquiredexternally. These two types of investments have significant and distinct attributes, which we posithave a differential impact on financial leverage. We provide empirical evidence that the former kindof investment has negative, while the latter one a positive impact on financial leverage. The otherhypotheses conjecture the impact of the other firm’s attributes like a firm’s size, liquidity, intangibility,age, profitability, and growth opportunities.
As far as we know, there is no study related to emerging economies in which investmentsin innovativeness are separated into externally acquired and internally generated and treated as apotential determinant of capital structure. Our hypotheses are tested on a sample of 102 firm-yearobservations (34 companies). The study period (2014–2018) ends at the moment when Poland waspromoted to a group of countries with Developed Market status, so it can be regarded as a study of acountry with the Emerging Market status.
The first section presents a literature review of the most important studies related to the problem ofthe financial structure of high-tech companies, the theories, and hypothesis development. The secondsection presents the sample characteristics, research design, and empirical results. The last sectionconcludes with the most important issues resulting from empirical research.
2. Theories of Capital Structure
Over the past several decades a number of capital structure theories have been developed whichattempt to explain the creation of structures of economic entities’ financing. The classical capitalstructure theories include Net Income Theory, Net Operating Income Theory, and Traditional Theory.Net Income Theory is based on the assumption that a firm’s value is proportionate to its share of debtin capital structure, so a firm’s maximum value is reached in the situation of its maximum indebtedness.Net Operating Income Theory assumes the dependence of a firm’s value on the value of operatingincome; in the situation of determined conditions capital structure does not affect a firm’s value.According to Traditional Theory, a proper balance should be maintained between internal and externalsources of financing. Therefore, a reasonable level of debt increases a firm’s value (Durand 1952).However, the best known classical theories are those created by F. Modigliani and M. Miller (MM).In their famous paper MM argue that a firm’s value is not dependent on the capital structure but ratherowners’ expectations with regard to cash flows (Modigliani and Miller 1958). The conclusions basedon the assumption of perfect capital markets were partly rejected in MM’s next work, which took intoaccount the issue of taxation (Modigliani and Miller 1963). MM finally admitted that indebtednesshas a positive impact on a firm’s value thanks to possible tax burden reductions. In the context ofdetermining the capital structures of high-tech companies, MM and the remaining classical theoriesare of limited practical application (Coleman and Robb 2012; Ullah et al. 2010). High-tech firms, due tohigh-risk levels, do not heavily rely on debt financing; however, high debt levels have a negativeimpact on the value of high-tech companies.
The capital structure of high-tech firms can be more affected by the agency costs theory. Its basicswere developed by Fama and Miller (1972), and initially by Jensen and Meckling (1976). It assumes the

J. Risk Financial Manag. 2020, 13, 221 4 of 20
existence of conflicts of interest between owners, lenders, and managers. Managers do not always actwith the intention of protecting owners’ interests—they often pursue their own interests, which canbe different (Novaes and Zingales 1995). In such a situation owners are forced to exercise additionalcontrol over the management’s activities, which generates additional costs—agency costs. One ofthe ways of linking the interests of the above groups is relating the management’s compensation tothe company’s shares. Another situation can occur in which managers implement risky investmentprojects, generating additional risk for lenders, while only owners benefit from higher profits. Debt canthen act as a factor that disciplines the management, enforcing more active operating policies, and moreeffective investment policies (Kenourgios et al. 2019). In this situation, debt decreases agency costs(Novaes and Zingales 1995). Agency costs tend to be very high in companies with high unique value(Colombo et al. 2014; Sau 2007). The higher the agency costs, the lower the firm’s value (Lins 2003).
A possibly significant role in high-tech firms is played by trade-off theory. Its creatorsare Kraus and Litzenberger (1973). All financing methods have both advantages and drawbacks.Higher debt levels provide an opportunity to deduct interest from taxable income. However,it should be noted that there are other methods of reducing tax burden with the use of non-interesttax shields including effective depreciation policies, or, in a broader sense, tax optimization(DeAngelo and Masulis 1980). It should be stressed that a company can benefit considerably fromrelatively high tax rates. A company’s heavy reliance on indebtedness in its capital structure increasesbusiness risk and results in the costs of bankruptcy (Baxter 1967). The higher the bankruptcy costs,the lower a firm’s value. Higher debt levels in the balance sheet total originally increase a firm’s value,but at a certain point, a firm’s value decreases (Adrienn 2014). The costs of bankruptcy are then higherthan tax shield positive effects. A practical confirmation of the trade-off theory is the occurrence ofthe so-called industry effect. The functioning of an enterprise within one industry is dependent onsimilar factors—economic entities are characterized by similar operating cycles, risk levels, and agencycosts, hence their similar share of debt in overall financing. The companies whose share of debt in thestructure of financing is below industry average tend to increase it, unlike entities that have a large shareof debt in their financing structure and try to lower its level (Kedzior 2012). The industry effect is notidentical in all industries. In industries characterized by stiff competition and diversified agency costs,debt levels can vary. Unequal access to advanced technologies has a similar impact on indebtedness(Michaelas et al. 1999). The above factors result in the existence of an optimal industry capital structure,which economic entities seek to achieve in their long-term operations (M’ng et al. 2017).
In the case of innovative companies, it is difficult to estimate the risk of the sources of financingwithin the framework of trade-off theory. Many threats should be regarded as potential, and theirmaterialization is conditional and not easy to estimate (Sau 2007), hence difficulties in choosingadequate sources of financing. Choices made by high-tech firms with regard to financing are affectedby a rapidly changing business environment and the complexity of applied technologies (Li et al. 2006).These entities do not have the ability to offer adequate guarantees to mitigate lenders’ risk (Sau 2007).Innovative firms have higher bankruptcy costs (Aghion et al. 2004; Sau 2007), so the share of liabilitiesin the balance sheet total cannot be dominant. High-tech companies with a relatively high volume ofintangible assets are less inclined to borrow funds. On the other hand, high growth companies relyon debt financing to a smaller degree (Castro et al. 2015). Transaction costs in such entities are alsohigh due to risk factors and, generally, limited volumes (Revest and Sapio 2012). Their market valueis subject to large fluctuations, especially as their financial standing deteriorates. It results from thefact that their valuation is based on specialized assets as well as large growth potential. Therefore,valuation changes on stock exchanges play a crucial role in high-tech firms (Revest and Sapio 2012).
The financial conditions and capital requirements of high-tech firms depend on the stage of theirdevelopment (Sau 2007). At the initial stage of development economic entities’ cash flows are oftennegative, so they are not able to repay their debts, and the acquisition of funds is difficult. In their earlystages, high-tech firms’ biggest problem in product commercialization based on the use of familiartechnologies is the acquisition of funds for operating activities (Minola et al. 2013).

J. Risk Financial Manag. 2020, 13, 221 5 of 20
The creation of capital structure is greatly affected by the pecking order theory. The theorywas created by Donaldson (1961), and then elaborated and modified by Myers and Majluf (1984).The authors divide sources of financing into external and internal sources. The choice of the sourcesof financing is mainly determined by their cost which is lower for internal capital. Therefore,companies should finance their operations by relying on retained earnings, followed by debt and,finally, the issue of shares (Stulz 1990). This order is justified by information asymmetry in relationshipsbetween companies, banks and external investors. Banks and external investors have more difficultyaccessing information about companies than people operating within company structures, so inlight of the higher risk of transferring capital, they require higher interest on loans and higherrates of return. Information asymmetry leads to moral hazard and adverse selection. The adverseselection indicates that banks find it difficult to distinguish between effective and ineffective investmentprojects, which generates additional costs and increases risk. A high level of adverse selection alsoresults from great uncertainty with regard to future return on investment rates as compared withtraditionally implemented projects (Carpenter and Petersen 2002). Moral hazard indicates that ownersbenefit more from implementing risky investment projects than debtors (Aoun and Heshmati 2006).High information asymmetry results, to a considerable degree, from the large development potential ofhigh-tech firms (Castro et al. 2015). High information asymmetry in the technology sector mainly appliesto small companies. Therefore, such companies can often be undervalued (Coleman and Robb 2012).
Pecking order theory assumes that the accessibility of information about a high-tech firm hasan impact on the choice of capital structure. To avoid problems resulting from the disclosure ofinternal information to a larger group of stakeholders, high-tech firms give preference to internalsources of financing (Hogan et al. 2017; Scherr et al. 1993). Due to such factors as uncertainty withregard to the ultimate results of innovative investment projects, possible cases of underinvestingand overtrading, difficulties in monitoring R&D activities, and the frequent lack of comprehensiveknowledge about technology among investors and banks, access to external financing can be limited(Revest and Sapio 2012). Generally, high reinvestment rates in technology firms force them to seekexternal sources of financing in the absence of their own funds (Berggren et al. 2000).
The acquisition of external capital implies the necessity of disclosing additional information aboutplanned operating or investment activities. Small and medium-sized high-tech firms are not inclinedto disclose such information. Similar opinions are held by Revest and Sapio (2012). Technology firmsare unwilling to disclose detailed information about R&D programs due to a very competitive marketand the fear of losing competitive advantage. Aoun and Heshmati (2006) also claim that because of theconfidential character of business operations high-tech firms have difficulty disclosing comprehensivefinancial data, and hence face problems with acquiring funds for business activities. As a result,markets do not possess full information, and lenders have limited knowledge about the currentoperations of high-tech firms (Ullah et al. 2010). Transaction costs and greater flexibility of operationsjustify reliance on retained earnings as a source of financing (Grinblatt and Titman 2002). A numberof empirical research studies point to a negative correlation between profitability and indebtedness(Bhayani 2010a; Korkmaz and Karaca 2014). Therefore, profitable firms rely on debt financing on alimited scale.
Technology firms tend to choose financing through the issue of shares rather than indebtedness.This mainly refers to young firms at an early stage of development (Minola et al. 2013).Innovative firms are characterized by attractive investment possibilities as compared with otherbusiness entities, but the costs of the issue of shares should be regarded as high (Aghion et al. 2004;Castro et al. 2015). Larger technology firms have a greater ability to raise funds through the issue ofshares (Mac an Bhaird and Lucey 2010). Frequently, young firms without a long credit history andrelationships with banks are left with no other option but to issue shares (Carpenter and Petersen 2002).Because of the lack of collateral in the form of tangible assets, innovative companies tend to rely morefrequently on share capital. The issue of shares does not have to be secured by tangible assets and doesnot increase the threat of bankruptcy. High-tech firms can successfully implement R&D programmes if
J. Risk Financial Manag. 2020, 13, 221 6 of 20
they are able to convince investors to purchase issued shares (Carpenter and Petersen 2002). The ideaof the issue of shares is also justified by technology firms’ tendency to implement high returns but alsorisky investments (Carpenter and Petersen 2002).
Because of the risk of share dilution and takeovers, innovative companies tend to rely on debtfinancing (Aghion et al. 2004). If the lack of transparency of disclosures is acceptable, high-tech firmscan also resort to bank loans (Berggren et al. 2000). As firms grow and gain more experience, the rangeof information asymmetry reduces, the value of assets (especially tangible assets) increases, and accessto bank loans becomes easier (Hogan et al. 2017). High-risk firms may not be granted loans, but theyare still able to successfully implement the process of issuing shares.
It seems, however, that pecking order theory turns out to be more useful in large economicentities, which rarely issue shares because of the high values of retained earnings and the possibilityof acquiring corporate bonds (Akgül and Sigali 2018). Nevertheless, within a short time horizon,enterprises are likely to create their capital structure based on the pecking order theory. On the otherhand, in longer periods of time in which the changeability of cash flows and economic conditions isless severe, companies are likely to rely on trade-off theory (Bontempi 2002). Pecking order theory(POT) is probably more effective in describing the choice of sources of financing in mature companiesas compared with high growth entities.
The signaling theory, created by Ross (1977), has a different impact on capital structure creation.Due to information asymmetry, people operating inside and outside of an organization have unequalaccess to information about a company’s financial standing. External stakeholders make intensiveefforts to obtain information about a company’s future financial condition and future share valuations.Therefore, they seek additional signals concerning an economic entity’s actual financial condition.The most reliable signals and those that cannot be easily imitated refer to dividend policies and capitalstructure decisions (Frankfurter and Wood 2002; Deesomsak et al. 2004). Increased indebtednessshould be regarded as a positive signal—it indicates a bank’s favorable assessment of an entity’screditworthiness and stable projected financial results and cash flows. It can be assumed that current andprojected financial results will not be diluted. On the other hand, the issue of shares is sometimes treatedby financial markets as a negative signal. Companies with less optimistic financial result predictionstend to finance their operations through the issue of shares (Leland and Pyle 1977). Managers choosethe issue of shares if their current valuation is excessively high. The market’s negative response tothe issue of shares can be even more severe if investors perceive a company as being characterized bygreat information asymmetry (Minola et al. 2013). The range of information asymmetry is very highfor new investment projects, new areas of activity and new strategies. Over time asymmetry tendsto decrease (Harris and Raviv 1988). Information asymmetry relates to new areas and issues—pastevents of key significance are reflected in the price of shares (Harris and Raviv 1988).
Last but not least important is the financial life cycle theory, which assumes that a firm’s capitalstructure preferences vary with their life cycle (Butzbach and Sarno 2018). The life cycle determinedthe availability of financial resources and the cost of capital. The theory implies that smaller andyounger companies exhibit higher information asymmetry, which in turn increases the cost of capital.We expect that in the case of NTBFs the financial life cycle theory may be of use due to the fact thatR&D activity increases information asymmetry and the fact that NTBFs are typically young companieswith low or no reputation, and have almost no (or very low) carrying amount of tangible assets.
3. Literature Review and Hypothesis Development
Determinants of capital structure have been at the heart of finance theory for many decades. Still,as Dobusch and Kapeller (2018) indicate, innovation advancements and digital technologies have a biginfluence on changes in firms’ strategic choices, so there is a need to reconsider factors influencingcorporate financing decisions, especially in high-tech sectors. The sector is expected to be a crucialfactor affecting access to finance, in part because firms in different industries will be seeking to accessfinance for diverse reasons. High–tech firms very often look for sources of financing for innovative or

J. Risk Financial Manag. 2020, 13, 221 7 of 20
R&D activity. Hall (2010) addresses the extent to which innovative firms are fundamentally differentfrom established companies and how it is reflected in their financing.
In terms of methodology, the critical problem concerns the identification and measuring offinancial constraints. In other words, the operationalization of this problem may be expressed by theidentification determinants of financial leverage, and there is vast literature concerning that problem.However, papers related to the determinants of high-tech companies or NTBFs represent a muchnarrower field of study. There are at least several significant factors whose impact on financial leveragewas empirically investigated and documented. These factors include, among others, the intangibility ofassets, R&D intensity, the firm’s size, age, liquidity, profitability, intangibility, and institutional setting.
Several researchers identified and documented the fact that access to finance for high-techcompanies is constrained. Lee et al. (2015), based on the study of 10,000 UK small and medium-sizedcompanies1, found that access to finance is much more difficult for innovative firms and that this problemhas worsened since the 2008 financial crisis. They investigated the relationship between innovationand access to funding while controlling for firm characteristics (size, age, sector, several personalfeatures of the management), and the likelihood of applying. Their focus was on the change in accessto capital for innovative firms caused by the 2008 economic crises. It is important to note that theirdefinition of innovative firms is much broader than in other studies, and extends beyond R&D intensive,high technology industries. The results suggest that there are barriers to obtaining external financefor innovative projects, even controlling for several factors that might have influenced more difficultaccess to funds. They indicate that there are two kinds of problems in financial systems. The first oneis related to structural problems connected with financial constraints for innovative firms. The secondproblem concerns cyclical issues caused by the financial crisis, which, surprisingly, has had a moresevere effect on non-innovative firms’ access to finance. They find that innovative firms in the UKshow higher demand for external capital but encounter more significant barriers to obtaining financing(restricted supply). In their case, there is a much higher imbalance between demand and supplycompared with non-innovative firms.
Brown and Lee (2019) challenged the assumption of innovative firms having problems with accessto credit. They concluded, based on the survey of 8000 UK SMEs in the period following the financialcrisis of 2008, that there is no difference in access to external finance for high growth SMEs and othercompanies. The authors focus on the high growth of SME firms but admit that those are particularlylikely to be innovative firms, and R&D activity is especially seen as growth-inducing. They find thata vast majority of high growth companies (achieving rapid growth in turnover and employment)rely strongly on debt, not equity finance for investment purposes (the situation is different in thecase of working capital purposes). Based on these findings, the authors question the rationale for UKgovernment policy aimed at increasing credit availability for high growth innovative companies.
An important strand of literature concerning the financing of innovative firms is focused onventure capital and other forms of equity financing tailored to financing risky, innovative projects.Economic literature shows that innovative firms are more dependent on equity than debt financing(Brown et al. 2009; Brown et al. 2013; Falato et al. 2018). Still, there is also a growing interest in accessto bank financing (the more standard, traditional form of funding).
3.1. Intangibility
Studies exploring the relationship between intangible assets and capital structure are still relativelyrare. In the economic literature, tangible assets are widely recognized as an important determinantof financial leverage because of their potential to be treated as collateral. However, investigating theinfluence of intangibles on the corporate capital structure is of vital importance because in today’seconomy a large and still increasing part of companies’ assets is represented by intangibles. For obvious
1 SMEs are defined as those with fewer than 250 employees, but excluding those without employees—so SME Employers.
J. Risk Financial Manag. 2020, 13, 221 8 of 20
reasons, it should be assumed that this phenomenon is especially evident in the case of high techcompanies, where innovation activity is crucial. For that reason, intangible assets account for asubstantial part of total assets. However, the situation is more complicated because of the phenomenaof underreporting of R&D outlays, which is a visible problem in today’s financial reporting onemerging economies.
As Lim et al. (2020) indicate, internally generated intangible assets are reported in balance sheetsand other companies’ reports. For that reason, it is very difficult to evaluate the impact of intangibleson financial leverage (under accounting rules, most of the internally generated intangible assets are notrecognized on the balance sheet).
Peters and Taylor (2017), based on a sample of U.S. firms, estimated that an average firm acquiresexternally only 19% of intangible capital. Therefore, the vast majority of intangible assets are missingfrom the balance sheet, so they construct a proxy to measure the value of internally acquired assetsby accumulating past intangible investments reported on firms’ income statements. They define thestock of international intangible capital as the sum of knowledge capital and organizational capital.Knowledge capital is created in the process of R&D activity, and to measure it, Peters and Taylor (2017)use the perpetual inventory method. The accounting approach is different from externally acquiredintangible assets that are capitalized.
Lim et al. (2020) also point out that intangible assets may discourage debt financing because ofpoor collateralizibility and high valuation risk. However, they come to the conclusions that identifiableintangible assets have the same positive influence on financial leverage as tangible assets, and thatthey support debt. The study is based on a sample of 469 US public companies between 2002 to2014. The dataset consists of targets of acquisitions, and in such transactions, there is a disclosurerequirement for the acquiring firms to allocate the purchase price paid for the target to two mainsubsets of tangible and intangible assets. Authors in their research use fair value estimates (not theusually used book value) of both tangible and intangible assets. They divide intangible assets into twocategories: identifiable intangible assets (among them technology-related as patents and in-processR&D, marketing-related as trademarks, trade names, customer contracts, customer relationships,and others as non-compete agreements, unproven mineral or gas properties) and unidentifiableintangible assets—goodwill.
Hall (2010) indicates that in the case of high-tech companies, not only are a significant part ofresults intangible, but “much of it is in the form of human capital embedded in the heads of theemployees.” It has low salvage value and is also idiosyncratic, which means that when a companygoes out of business, it is a signal that its value is low. As Hall stresses, except for certain types ofpatents, there is little market for distressed intangible assets. This is one more reason for debt financingbeing poorly suited to the financing of R&D intensive sectors.
Some studies in the economic literature investigate the relationship between one subset ofintangible assets—patent counts—and financial leverage. The main limitation of these studies is thatthere are no objective methods in the valuation of patents.
Mann (2018) calculated that in 2013, 38% of US patenting firms used patent portfolios as collateralfor secured debt, so this type of intangible assets contributes significantly to the financing of innovation.Mann (2018) also stressed that 16% of patents produced by American firms have been pledged ascollateral at some point. The pledgeability of patents depends on their high level of citation counts andgenerality. Brown et al. (2009) points out that companies using patents as collateral mainly belong tothe high-tech sector and feature low tangibility. Therefore, we posit the following hypothesis:
Hypothesis 1 (H1). Intangibility has a significant and negative impact on the financial leverage of NTBFs.

J. Risk Financial Manag. 2020, 13, 221 9 of 20
3.2. Investment in Innovativeness
There is ample empirical evidence suggesting that the capital structure of R&D intensive firmsexhibits significantly less debt than in the case of other firms. The problem of financial constraints infinancing R&D intensive or innovative firms is well pronounced in economic literature. These problemsare also referred to in economic literature as structural problems of the financial system in financingR&D or, more broadly, innovations. The reasons for that include higher risk, information asymmetrybetween financing providers and companies themselves (the main theoretical premise for the difficultiesSMEs face when accessing external capital, which are due to the context-specific nature of R&D projects,which makes them very difficult for valuation), and the lack of collateral in the case of firms basedmainly on intangible assets (denied finance due to their lack of collateral). Studies typically suggestthat all these reasons cause innovative firms to encounter severe obstacles when it comes to acquiringdebt financing. Internal finance is usually insufficient to finance rapid growth.
A study by Alderson and Betker (1996) provides evidence that there is a positive relation betweenliquidation costs and R&D in the corporate sector. Therefore, R&D activity is associated with highersunk costs than other types of investments.
Guiso (1998) finds evidence for a representative sample of about 1000 Italian manufacturingfirms with 50 or more employees. Those which belong to the high-tech sector are more likely to becredit-constrained than low-tech companies. Measurement problems in the proxies for high-tech firmsmake it difficult to provide a precise estimate of the size of the effect. The author also points out thatcredit constraints have a highly counter-cyclical pattern with the proportion of firms, with limitedaccess to financing increasing during the downturn.
A very important issue is the relation between intangibility and investment in innovativeness.We distinguish two types of investments in innovativeness, which are measurable in the accountingsystem: external and internal. The internal one refers to R&D outlays expended in a given period(usually one year) on the firm’s own invention. The external one refers to the expenditureson other intangible assets acquired externally, having mainly an innovative character. The lastconcept—intangibility—refers to the attribute of total assets, which has a cumulative and resourcecharacter. Usually, high intangibility is caused by heavy investments in innovativeness over a longerperiod. However, in some instances, it can be triggered by a low carrying amount of tangible assets.Therefore, from the perspective of a given reporting period, the mutual correlation between intangibilityand investments in innovativeness is not necessary. Both concepts: intangibility and investments ininnovativeness refer to similar but different concepts.
Firstly, we conjecture that, in a country that is at the stage of development classified as anemerging market, the more a firm invests in an innovative in-house project, the less the bank sector iswilling to provide external capital. We argue that in the case of emerging markets, the informationalasymmetry gap caused by the R&D project is even higher than in the case of developed markets.Secondly, we hypothesize that the external acquisition of innovation (i.e., technology) does not createinformational asymmetry. Therefore, it does not increase the cost of external capital. Quite theopposite, it makes a company a more attractive client for the bank sector, with better prospects forthe future. Therefore, we posit that the more a company invests in externally acquired innovation,the more leveraged it will be. Based on the above-mentioned chain of reasoning, we posit thefollowing hypotheses:
Hypothesis 2 (H2). Internal investments in innovativeness in NTBFs from emerging countries have asignificant and negative impact on financial leverage.
Hypothesis 3 (H3). External investments in innovativeness in NTBFs from emerging countries have asignificant and positive impact on financial leverage.

J. Risk Financial Manag. 2020, 13, 221 10 of 20
3.3. Liquidity
Liquidity is another determinant that has an impact on capital structure and is usually understoodas a measure of a firm’s capability of debt repayment. High liquidity implies that a company has thepotential to pay back debt or shareholders (Ozkan 2001). Low risk of insolvency allows acquiring debtat a lower cost (Morellec 2001). More liquid companies are more prone to undertake riskier projectsand finance them via bank loans thanks to a lower risk of solvency problems (Ramli et al. 2019).
According to the pecking order theory, more liquid companies tend to finance their activitymainly by their funds (retained earnings). By doing that, companies avoid taking more costly debtand disclosing confidential information to financial institutions (banks) or investors. Therefore,many researchers hypothesize an inverse relationship between liquidity and financial leverage(Kara and Erdur 2015; Karacaer et al. 2016). Internal financing is preferred over debt, and the surplus ofcash flows allows the financing of investment projects. Higher liquidity translates to financial flexibilityand opens up possibilities of acquiring debt at a lower cost. Based on our experience, we suppose thatin the case of emerging markets liquidity may play an important factor in shaping the capital structureof high-tech companies. Therefore, we conjecture the following hypothesis:
Hypothesis 4 (H4). The liquidity of NTBFs located in emerging markets has a significant and negative impacton financial leverage.
3.4. Size
One of the most studied firm parameters is company size. Firm size is likely to influence capitalstructure in several ways. Larger firms are usually treated as less risky and believed to have fewerconstraints in obtaining a bank loan. Risk is higher in the case of small firms, which, due to the lack ofscale, cannot diversify the risk and invest in multiple projects (Freel 2007). The financial constraintsin financing are well pronounced, especially in the case of small and medium-sized innovative firms(Schneider and Veugelers 2010; Hutton and Lee 2012; Mina et al. 2013; Lee et al. 2015).
At least several important characteristics of a firm’s size are invoked in the literature.Bigger companies are able to operationalize more debt in their balance sheets due to more collateral onthe asset side (Karacaer et al. 2016; Cai and Ghosh 2003). The size of a company is correlated with itsage. In other words, bigger companies are usually the older ones, which means that they are alreadyestablished in the market, have a deeper knowledge of the market and customer preferences, and havehigher credibility, which results in lower operational risk. The financial situation of bigger companies isusually more stable, and the variability of their cash flows and financial risk is lower. Bigger companiesmay utilize the economies of scale and transfer the cost of short-term financing to their suppliers orclients. Bigger companies tend to engage in international activities, therefore they are more able todiversify their operations and raise funds in foreign capital markets. The cost of external capital istypically lower for bigger companies in comparison to smaller ones. Additionally, bankruptcy costsare lower for bigger companies, and as a result, they are more flexible in terms of managing theirliabilities (Demir 2009). Informational asymmetry is lower for bigger companies, which corresponds toa higher quality of financial reporting. Finally, transaction costs necessary to obtain bank loans areusually lower for bigger companies (Hall et al. 2004). All the above factors supposedly make the costof attracting external capital lower and may imply that the bigger a company, the higher its financialleverage. The study conducted by Nenu et al. (2018), based on the sample of Romanian companiesprovides empirical evidence supporting this statement. The authors of that study point out that thetrade-off theory may explain the research outcome.
In the literature, one can also find the opposite arguments. Bigger companies often accumulatedretained earnings for many years, and external capital was not necessary (Kara and Erdur 2015).Bigger companies are also more prone to the problem of moral hazard (Frank and Goyal 2008).Many cases from the past show that bigger companies tend to accept excessive growth, which translates
J. Risk Financial Manag. 2020, 13, 221 11 of 20
to lower operational efficiency and, finally, an increased cost of external capital (Ammar et al. 2003).Agency costs are usually higher for bigger companies, which means that monitoring and auditing aremore costly (Yildirim et al. 2018). However, higher long-term debt may provide additional incentivesto managers for the creation of shareholder value (Izdihar 2019).
External finance is vital for innovative SMEs, as they usually lack the internal sources offinancing needed for the commercialization of their innovations (Beck and Demirguc-Kunt 2006;Schneider and Veugelers 2010). The business model of innovative firms is riskier, and the intangibleassets account for a bigger part than physical property in their balance sheets, which creates a problemin bank valuation. Intangibles are context-specific, which creates a problem for banks who valuethem and use them as collateral for lending. Also, Canepa and Stoneman (2008), Czarnitzki (2006),and Freel (2007) suggest that all these structural problems with innovative financing firms are amplifiedin the case of SMEs. Finally, as Kijkasiwat and Phuensane (2020) documented, bigger companies aremore able to benefit from external and internal innovative projects, while the smaller ones only benefitfrom internal projects.
In the case of NTBFs, an increase in size should result in a decrease in operational and investmentrisk. However, it is probably at a higher level compared to other firms. Likewise, bankruptcy costsshould be lower, yet substantial. The scope of information asymmetry will decrease, agency costs maybe lower, but not low. It can be expected that NTBFs’ willingness to attract external capital will increasewith its size (Berggren et al. 2000). Therefore, we conjecture the following hypothesis:
Hypothesis 5 (H5). The size of NTBFs located in emerging markets has a significant and positive impact onfinancial leverage.
3.5. Age
The next important determinant of capital structure—a firm’s age—is especially important inthe case of the high-tech sector. Some authors take into account the age of the firm as a determinantin obtaining a bank loan. According to Cowling et al. (2012), the size of the company and its trackrecord influence bankers’ decisions to credit an entity, putting small and young firms at a disadvantage.Older companies also have more fixed assets, which can serve as collateral for the long-term creditloan, which also makes the debt more accessible and less costly. The results of empirical studies suggestthat the firm’s age allows it to curtail limits typical for high-tech companies, especially higher risk.Older firms have lower bankruptcy costs, lower costs of external capital, a broader customer base,more stable financial results over time, and more profitable companies (Malik 2011; Bhayani 2010b).
The firm’s age, or the period counted since the IPO on the stock market, is positively correlatedwith the quality of corporate governance, and, consequently, lowers the agency costs and the cost ofthe bank loan (Kieschnick and Moussawi 2018). On the other hand, older firms usually accumulatedretained earnings from the previous periods and may not strive for capital offered by the bank sector(Mac an Bhaird and Lucey 2010). Younger firms suffer more from agency problems, and this is thereason why access to external capital is hampered (Mac an Bhaird and Lucey 2010). As the firm gainsexperience and records a more extended credit history, the risk of moral hazard becomes lower.
Younger firms usually suffer from lack of capital, and for this reason, they often apply for externalcapital to finance their investment projects (Bhayani 2010b; Hall et al. 2004). At the same time, due to theproblem of moral hazard, which is a very distinctive feature of young, technological firms, applying forand getting a bank loan is the way through torment (Hogan et al. 2017). Easier access to externalcapital for NTBFs is possible and can be observed in countries where the financial system is based on awell-developed banking sector. Therefore, we posit the following hypothesis:
Hypothesis 6 (H6). The age of NTBFs located in emerging markets has a significant and positive impact onfinancial leverage.
J. Risk Financial Manag. 2020, 13, 221 12 of 20
3.6. Profitability
The next important characteristic of the company—profitability—is an important determinantof capital structure. According to the pecking order theory, a firm first instances its activity fromretained earnings. If this source is not sufficient, a company tries to obtain external sources of capital(Myers and Majluf 1984). From this perspective, higher financial leverage does not always imply orcorrelate with higher profitability.
Another implication may be derived from the trade-off theory, which assumes a state of balancebetween equity and debt capital, while the cost of debt capital is lower. More profitable companiesusually have sufficient financial resources necessary to pursue their investment plans. However,more profitable companies may find a tax shield to be a decisive argument for increasing financialleverage (Bouallegui 2006), which is especially important for companies from countries where the taxrate is high. The theory of free cash flows also posits that more profitable companies should indebtthemselves because it provides a self-control mechanism. It forces management to transfer free cashflows as dividends to their shareholders instead of investing in less profitable investment projects(Izdihar 2019).
Highly profitable companies have much easier access to external financing at a much lowercost (Cassar and Holmes 2003). This is also supported by the substitutive theory, which posits thatless risky and more profitable companies are much more able to finance their activity from externalsources, especially debt. High profitability also minimizes the risk of bankruptcy, and for this reason,the capacity of indebtedness is increased (Ramli et al. 2019). Highly profitable companies, which financetheir activity from internal sources, are not required to disclose detailed information on their operations(Li and Islam 2019). Internal sources of finance (retained earnings) and increased indebtedness may beattractive for investors since a firm’s shareholding is not diluted (Karacaer et al. 2016). On the basis ofthe above discussion, it may seem that the impact of profitability on capital structure is ambiguous(Degryse et al. 2012). However, from the perspective of NTBFs, we can suppose that more profitablecompanies would have much better credit standing and better access to debt. Therefore, we treat thefirm’s profitability parameter as a control variable.
3.7. Growth Opportunities
Growth opportunities are an important firm characteristic influencing capital structure in thehigh-tech sector. Most often, high-tech companies tend to use their own equity funds because ofinnate higher risk and the necessity of more costly supervision of this type of company (Myers 1977).High growth opportunities, on the one hand, create the chance of development, but on the otherhand, pave the way for new risk. Usually, enormous growth opportunities accompany low equityvalues which are necessary to finance important investment projects. Fortunately, these companies,even when dealing with severe financial problems, don’t have problems with raising equity capital.Indebtedness may put pressure and discipline on the management and enforce a more efficientdecision-making process. The valuation process of high-tech companies is based on their futurepotential (option), which is heavily burdened with risk. Therefore, the market valuation is under thethreat of impairment. This is especially important considering that the asset is in substantial partintangible and, as a result, cannot serve as collateral (Karacaer et al. 2016). Thus, some researchers(Rajan and Zingales 1995) hypothesize an inverse relationship between growth opportunities andfinancial leverage. This relationship is also implied by the pecking order theory, which posits that afirm tends to finance its activity by internal funds and, afterward, look for external ones. Agency coststheory provides similar implications for high-tech companies. Additional monitoring costs relatedto management supervision may be substantial, especially when growth opportunities do exist,which supposedly will lead to an increased cost of debt. High-tech companies will be discouragedfrom taking on more debt in their balance sheet in order to minimize potential conflict betweenshareholders and creditors (Ramli et al. 2019). The implication of the substitution theory also confirms

J. Risk Financial Manag. 2020, 13, 221 13 of 20
that relationship, because high-tech companies are more prone to the risk of financial situationdeterioration. Therefore, we treat the firm’s growth opportunities as a control variable.
4. Sample Characteristics, Research Design, and Results
The study sample consisted of 31 companies listed on the Warsaw Stock Exchange classified ashigh-tech firms in sectors like biotechnology, R&D in physics, natural sciences, engineering, biology,medical laboratories, computer software, e-commerce, marketing analysis, etc. We decided to usedata derived from firms listed on the stock exchange because of a higher quality of accounting data.These companies, under the scrutiny of stock market institutions and the public, are obliged to meethigher standards of transparency and are audited. Companies may also be classified as NTBFs becausethe oldest firm in the study period is 17 years old, and the average age is around six years. The initialsample consists of 155 firm-year observations covering the period of 2014–2018. The final sample islimited to only 102 firm-year observations due to the missing data.
Our main object of interest is capital structure, and as a dependent variable, we use the leverageratio calculated as total liabilities to total assets. As a proxy for the innovation generated internally,we use a ratio of the sum of R&D expenses recorded in the P&L statement and year-to-year change inR&D outlays recorded in the balance sheet, deflated by the total assets. In our opinion, this is the onlypossible way to measure R&D outlays based on information derived from a financial statement. As theproxy for the innovation acquired externally, we use a year-to-year change of intangibles extractedfrom the balance sheet, excluding R&D expenses recognized. We also use a set of control variables suchas profitability (ROE) and growth opportunities. In order to avoid the influence of outliers, all datawere winsorized. Table 1 presents the characteristics of the main variables used in the model.
Table 1. Sample statistics.
Variable No. of Obs. Min. Max. Mean Median St. Dev. Variance Skewness Kurtosis
LEV 155 0.004 1.000 0.448 0.375 0.298 0.089 0.392 2.029INTANGIBILITY 155 0.000 0.939 0.216 0.121 0.238 0.057 1.125 3.438
INNOV_INT 155 0.000 0.543 0.067 0.003 0.099 0.010 1.795 6.650INNOV_EXT 155 0.000 1.000 0.091 0.003 0.168 0.028 3.443 3.260CUR_RATIO 155 0.007 10.000 2.737 1.592 2.862 8.193 1.552 4.329
SIZE 155 4.143 14.952 9.793 9.818 2.093 4.380 −0.131 3.443AGE 155 0.000 17.000 6.072 6.000 3.934 15.475 0.655 2.957ROE 155 −1.000 1.000 −0.140 −0.043 0.484 0.234 −0.123 3.026
SALES_TR 117 −1.000 1.000 0.111 0.091 0.656 0.431 −0.177 2.010
Source: our own elaboration based on the data from financial statements.
In order to avoid intercorrelated variables in the model, we performed a correlation analysis,the results of which are presented in Table 2. The highest correlations, however moderate, are betweena firm’s age and profitability (ROE), financial leverage, and size. The results are logical and correspondto the conclusions of the literature review section. The older a company is, the higher its profitability.Similarly, the older the firm is, the more able it is to indebt itself. Finally, bigger companies tendto be more profitable. The results show that variables INNOV_INT and INNOV_EXT are weaklycorrelated. The rest of the correlation coefficients of independent variables are at a low or moderatelevel, so including them in the model is not controversial.
J. Risk Financial Manag. 2020, 13, 221 14 of 20
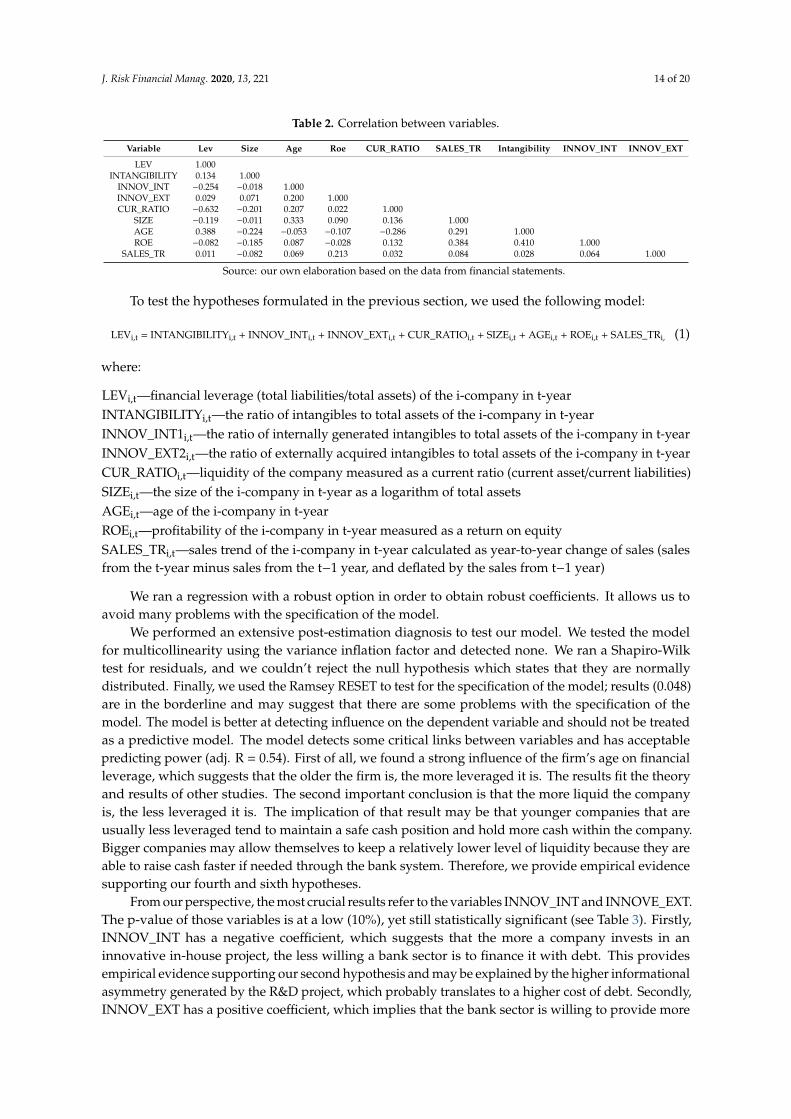
Table 2. Correlation between variables.
Variable Lev Size Age Roe CUR_RATIO SALES_TR Intangibility INNOV_INT INNOV_EXT
LEV 1.000INTANGIBILITY 0.134 1.000
INNOV_INT −0.254 −0.018 1.000INNOV_EXT 0.029 0.071 0.200 1.000CUR_RATIO −0.632 −0.201 0.207 0.022 1.000
SIZE −0.119 −0.011 0.333 0.090 0.136 1.000AGE 0.388 −0.224 −0.053 −0.107 −0.286 0.291 1.000ROE −0.082 −0.185 0.087 −0.028 0.132 0.384 0.410 1.000
SALES_TR 0.011 −0.082 0.069 0.213 0.032 0.084 0.028 0.064 1.000
Source: our own elaboration based on the data from financial statements.
To test the hypotheses formulated in the previous section, we used the following model:
LEVi,t = INTANGIBILITYi,t + INNOV_INTi,t + INNOV_EXTi,t + CUR_RATIOi,t + SIZEi,t + AGEi,t + ROEi,t + SALES_TRi, (1)
where:
LEVi,t—financial leverage (total liabilities/total assets) of the i-company in t-yearINTANGIBILITYi,t—the ratio of intangibles to total assets of the i-company in t-yearINNOV_INT1i,t—the ratio of internally generated intangibles to total assets of the i-company in t-yearINNOV_EXT2i,t—the ratio of externally acquired intangibles to total assets of the i-company in t-yearCUR_RATIOi,t—liquidity of the company measured as a current ratio (current asset/current liabilities)SIZEi,t—the size of the i-company in t-year as a logarithm of total assetsAGEi,t—age of the i-company in t-yearROEi,t—profitability of the i-company in t-year measured as a return on equitySALES_TRi,t—sales trend of the i-company in t-year calculated as year-to-year change of sales (salesfrom the t-year minus sales from the t−1 year, and deflated by the sales from t−1 year)
We ran a regression with a robust option in order to obtain robust coefficients. It allows us toavoid many problems with the specification of the model.
We performed an extensive post-estimation diagnosis to test our model. We tested the modelfor multicollinearity using the variance inflation factor and detected none. We ran a Shapiro-Wilktest for residuals, and we couldn’t reject the null hypothesis which states that they are normallydistributed. Finally, we used the Ramsey RESET to test for the specification of the model; results (0.048)are in the borderline and may suggest that there are some problems with the specification of themodel. The model is better at detecting influence on the dependent variable and should not be treatedas a predictive model. The model detects some critical links between variables and has acceptablepredicting power (adj. R = 0.54). First of all, we found a strong influence of the firm’s age on financialleverage, which suggests that the older the firm is, the more leveraged it is. The results fit the theoryand results of other studies. The second important conclusion is that the more liquid the companyis, the less leveraged it is. The implication of that result may be that younger companies that areusually less leveraged tend to maintain a safe cash position and hold more cash within the company.Bigger companies may allow themselves to keep a relatively lower level of liquidity because they areable to raise cash faster if needed through the bank system. Therefore, we provide empirical evidencesupporting our fourth and sixth hypotheses.
From our perspective, the most crucial results refer to the variables INNOV_INT and INNOVE_EXT.The p-value of those variables is at a low (10%), yet still statistically significant (see Table 3). Firstly,INNOV_INT has a negative coefficient, which suggests that the more a company invests in aninnovative in-house project, the less willing a bank sector is to finance it with debt. This providesempirical evidence supporting our second hypothesis and may be explained by the higher informationalasymmetry generated by the R&D project, which probably translates to a higher cost of debt. Secondly,INNOV_EXT has a positive coefficient, which implies that the bank sector is willing to provide more

J. Risk Financial Manag. 2020, 13, 221 15 of 20
external funds to companies acquiring innovation externally. We ascribe that result to the fact thatexternal acquisition of technology/invention is perceived to be less risky and the final output morepredictable. Again, we provide an argument supporting the third hypothesis. The results must beinterpreted with caution, and the hypotheses need to be tested on high-tech companies from otheremerging markets.
Table 3. Regression analysis.
Independent Variables Coefficient p-Value
INTANGIBILITY 0.126 0.256INNOV_INT −0.334 0.095 *INNOV_EXT 0.138 0.091 *CUR_RATIO −0.045 0.000 ***
SIZE −0.012 0.328AGE 0.024 0.000 ***ROE −0.062 0.361
SALES_TR 0.011 0.758Constant 0.504 0.000
A number of obs. 102R2 0.55
Adjusted R2 0.54
* significance at 10% level; ** significance at 5% level; *** significance at 1% level. Source: our own elaboration basedon the data from financial statements.
Unfortunately, we find no empirical evidence supporting the first and the fifth hypothesis.With regard to the firm’s size, this may be explained by the fact that the majority of companies areof moderate size. In the case of the intangibility parameter, we suppose that this parameter wouldbe more important for companies in sectors other than high-tech. In our opinion, this matter needsfurther investigation.
5. Concluding Remarks
High-tech firms play an increasingly important role in the contemporary economy. Their growth ismore dynamic than classical industries. Employment in high-tech industries has increased considerably,while other industries often record reductions in the number of employees. High-tech firms,especially NTBFs, are characterized by high risk, great information asymmetry, high agency andbankruptcy costs, and a great likelihood of deterioration in their financial standing, which makesaccess to external financing and, in particular, debt financing, more difficult.
The results of empirical studies allow for the verification of the second hypothesis which states thatinternal investments in innovativeness have a negative impact on the level of indebtedness in NTBFs,while external investments in innovativeness have a positive impact on the level of debt. These resultscan undoubtedly be attributed to higher information asymmetry and risk in financing new technologiesgenerated internally as compared with innovations purchased on the market, the usefulness of whichis well known and proven. It should be noted that internal investments in innovativeness are notalways bound to succeed, and their output is very risky. Financial liquidity has an adverse effect on thelevel of indebtedness in the structure of financing, so companies with high liquidity and availability oftheir own funds rely on their own resources and, possibly, on debt financing (Hypothesis 4). Due to bigmarket changes and changes in technologies, highly liquid NTBFs give preference to financing based ontheir own funds. Age has a positive impact on the share of debt in the capital structure (Hypothesis 6).Those NTBFs which are well established on the market and have long credit history and high reliabilitytend to rely on debt financing. This effect can be limited in NTBFs with excess liquidity. The impact ofintangibility turns out to be statistically insignificant. This may result from the fact that the possessionof intangible assets is not a necessary, sufficient or decisive factor in determining a decrease in debtfinancing. The size of NTBFs does not have a positive impact on indebtedness probably due to the fact
J. Risk Financial Manag. 2020, 13, 221 16 of 20
that the analyzed sample comprises moderate-sized entities. The impact of profitability and growthpotential is also limited. The impact of these factors on debt levels in NTBFs is probably diversified.
Polish NTBFs create their capital structure, which to a certain degree can be explained by thetrade-off theory. This view can be justified by the positive impact of age and liquidity on the levelof indebtedness, resulting in lower bankruptcy costs. The analyzed NTBF’s population also fitsthe agency theory because of the limited scale of business operations and relatively limited marketexperience. Pecking order theory applies to the analysis to a smaller degree—an impact of profitability,size, and risk on indebtedness is not visible. Polish NTBFs apply the following order of financing:retained earnings followed by share capital and debt financing.
The obtained results can be useful for high-tech firms, stock market investors, banks and standardsetters. Without support offered by the government and various public institutions the developmentof NTBFs, especially in countries with a low level of innovativeness, can be hindered due to difficultiesin acquiring necessary funds for expansion.
This paper attempts to narrow a theoretical gap in the area of capital structure creation andexplore the impact of capital structure theory on the level of indebtedness in NTBFs in an emergingeconomy. We believe that the empirical verification of the impact of internally and externally generatedinvestment in innovativeness, and the verification of the impact of other capital structure factors onNTFBs in emerging markets characterized by low innovativeness, can be regarded as a significantcontribution to the research of the determinants of capital structure in NTBFs. In our opinion, there arenot many research studies on emerging markets which empirically verify the determinants of NTBFcapital structure, hence the need for further analyses.
The major limitations of this work include a relatively short period of research and a small numberof analyzed NTBFs. Further analyses should comprise a larger number of countries and observations,as well as a longer period of study. Possibly significant determinants of NTFB capital structure includevarious corporate governance characteristics and macroeconomic and country-level factors.
Author Contributions: Conceptualization M.K., B.G., K.G. and D.K.; methodology M.K., B.G., K.G. and D.K.;software, K.G.; validation M.K., B.G., K.G. and D.K.; formal analysis M.K., B.G., K.G. and D.K.; investigation M.K.,B.G., K.G. and D.K.; resources B.G. and D.K.; data curation B.G. and D.K.; writing—original draft preparationM.K., B.G., K.G. and D.K.; writing—review and editing, M.K., B.G., K.G. and D.K.; visualization, M.K., B.G., K.G.and D.K.; supervision, M.K., B.G., K.G. and D.K.; project administration, M.K.; funding acquisition, M.K. and K.G.All authors have read and agreed to the published version of the manuscript.
Funding: This research was funded by the Ministry of Science and Higher Education within the “RegionalInitiative of Excellence” Programme for 2019–2022. Project no.: 021/RID/2018/19.
Conflicts of Interest: The authors declare no conflict of interest.
References
Adrienn, Herczeg. 2014. Summary of theories in capital structure decisions. Annals of the University of Oradea,Economic Science Series 23: 912–18.
Aghion, Philippe, and Peter Howitt. 2005. Growth with quality-improving innovations: An integrated framework.Handbook of Economic Growth 1: 67–110.
Aghion, Philippe, Stephen Bond, Alexander Klemm, and Ioana Marinescu. 2004. Technology and financialstructure: Are innovative firms different? Journal of the European Economic Association 2: 277–88. [CrossRef]
Akgül, Ersin Fırat, and Seçil Sigali. 2018. Determinants of Capital Structure: An Application on BIST TransportationIndex. Journal of Accounting & Finance 77: 193–215.
Alderson, Michael J., and Brian L. Betker. 1996. Liquidation costs and accounting data. Financial Management 25:25–36. [CrossRef]
Ammar, Abdurahman, S. Hanna Awad, Erik V. Nordheim, and Jeffrey S. Russell. 2003. Indicator variables modelof firm’s size-profitability relationship of electrical contractors using financial and economic data. Journal ofConstruction Engineering and Management 129: 192–97. [CrossRef]
Aoun, Dany, and Almas Heshmati. 2006. The causal relationship between capital structure and cost of capital:Evidence from ict companies listed at nasdaq. Stockholm School of Economics 1–26.

J. Risk Financial Manag. 2020, 13, 221 17 of 20
Baxter, Nevins D. 1967. Leverage, risk of ruin and the cost of capital. The Journal of Finance 22: 395–403.Beck, Thorsten, and Asli Demirguc-Kunt. 2006. Small and medium-size enterprises: Access to finance as a growth
constraint. Journal of Banking & Finance 30: 2931–43.Berggren, Björn, Christer Olofsson, and Lars Silver. 2000. Control aversion and the search for external financing in
Swedish SMEs. Small Business Economics 15: 233–42. [CrossRef]Bhayani, Sanjay J. 2010a. Determinant of Profitability in Indian Cement Industry: An Economic Analysis.
South Asian Journal of Management 17: 6–20.Bhayani, Sanjay J. 2010b. Intangible assets, research and development expenditure, knowledge capital and capital
structure: A study of Indian pharmaceutical firms. Indian Journal of Accounting 40: 41–52.Bontempi, Maria Elena. 2002. The dynamic specification of the modified pecking order theory: Its relevance to
Italy. Empirical Economics 27: 1–22. [CrossRef]Bouallegui, Imen. 2006. Capital structure determinants and the new High-Tech firms: The critical distinction
between fixed and random effects through a static panel data investigation. MPRA Paper 22477: 1–24.Brown, Ross, and Neil Lee. 2019. Strapped for cash? Funding for UK high growth SMEs since the global financial
crisis. Journal of Business Research 99: 37–45. [CrossRef]Brown, James R., Steven M. Fazzari, and Bruce C. Petersen. 2009. Financing innovation and growth: Cash flow,
external equity, and the 1990s R&D boom. The Journal of Finance 64: 151–85.Brown, James R., Gustav Martinsson, and Bruce C. Petersen. 2013. Law, stock markets, and innovation. The Journal
of Finance 68: 1517–49. [CrossRef]Butzbach, Olivier, and Domenico Sarno. 2018. To What Extent Do Regional Effects Influence Firms’ Capital
Structure? The Case of Southern Italian SMEs’. International Journal of Financial Studies 7: 3. [CrossRef]Cai, Francis, and Arvin Ghosh. 2003. Tests of capital structure theory: A binomial approach. The Journal of Business
and Economic Studies 9: 20–32.Canepa, Alessandra, and Paul Stoneman. 2008. Financial constraints to innovation in the UK: Evidence from CIS2
and CIS3. Oxford Economic Papers 60: 711–30. [CrossRef]Carden, Steven D., Lenny T. Mendonca, and Tim Shavers. 2005. What global executives think about growth and
risk. McKinsey Quarterly 2: 16–25.Carpenter, Robert E., and Bruce C. Petersen. 2002. Capital market imperfections, high-tech investment, and new
equity financing. The Economic Journal 112: F54–F72. [CrossRef]Cassar, Gavin, and Scott Holmes. 2003. Capital structure and financing of SMEs: Australian evidence.
Accounting & Finance 43: 123–47.Castro, Paula, María T. Tascón, and Borja Amor-Tapia. 2015. Dynamic analysis of the capital structure in
technological firms based on their life cycle stages. Spanish Journal of Finance and Accounting/Revista Españolade Financiación y Contabilidad 44: 458–86. [CrossRef]
Coleman, Susan, and Alicia Robb. 2012. Capital structure theory and new technology firms: Is there a match?Management Research Review 35: 106–20. [CrossRef]
Colombo, Massimo G., Annalisa Croce, and Samuele Murtinu. 2014. Ownership structure, horizontal agency costsand the performance of high-tech entrepreneurial firms. Small Business Economics 42: 265–82. [CrossRef]
Cowling, Marc, Weixi Liu, and Andrew Ledger. 2012. Small business financing in the UK before and during thecurrent financial crisis. International Small Business Journal 30: 778–800. [CrossRef]
Czarnitzki, Dirk. 2006. Research and development in small and medium-sized enterprises: The role of financialconstraints and public funding. Scottish Journal of Political Economy 53: 335–57. [CrossRef]
DeAngelo, Harry, and Ronald W. Masulis. 1980. Optimal capital structure under corporate and personal taxation.Journal of Financial Economics 8: 3–29. [CrossRef]
Deesomsak, Rataporn, Krishna Paudyal, and Gioia Pescetto. 2004. The determinants of capital structure:Evidence from the Asia Pacific region. Journal of Multinational Financial Management 14: 387–405. [CrossRef]
Degryse, Hans, Peter de Goeij, and Peter Kappert. 2012. The impact of firm and industry characteristics on smallfirms’ capital structure. Small Business Economics 38: 431–47. [CrossRef]
Demir, Firat. 2009. Financialization and manufacturing firm profitability under uncertainty and macroeconomicvolatility: Evidence from an Emerging Market. Review of Development Economics 13: 592–609. [CrossRef]
Dobusch, Leonhard, and Jakob Kapeller. 2018. Open strategy-making with crowds and communities:Comparing Wikimedia and Creative Commons. Long Range Planning 51: 561–79. [CrossRef]
J. Risk Financial Manag. 2020, 13, 221 18 of 20
Donaldson, Gordon. 1961. Corporate Debt Capacity: A Study of Corporate Debt Policy and the Determination of CorporateDebt Capacity. Boston: Division of Research, Harvard School of Business Administration.
Durand, David. 1952. Cost of Debt and Equity Funds for Business. Trends and Problems of Measurement.In Conference on Research in Business Finance. New York: National Bureau of Economic Research, pp. 215–61.
Falato, Antonio, Dalida Kadyrzhanova, and Jae W. Sim. 2018. Rising intangible capital, shrinking debt capacity,and the US corporate savings glut. Shrinking Debt Capacity, and the US Corporate Savings Glut 1–59. [CrossRef]
Fama, Eugene F., and Merton H. Miller. 1972. The Theory of Finance. New York: Holt Rinehart & Winston.Frank, Murray Z., and Vidhan K. Goyal. 2008. Trade-off and pecking order theories of debt. In Handbook of
Empirical Corporate Finance. Amsterdam: Elsevier, pp. 135–202.Frankfurter, George M., and Bob G. Wood Jr. 2002. Dividend policy theories and their empirical tests.
International Review of Financial Analysis 11: 111–38. [CrossRef]Freel, Mark. 2007. Are small innovators credit rationed? Small Business Economics 28: 23–35. [CrossRef]Gherghina, S, tefan Cristian, Mihai Alexandru Botezatu, Alexandra Hosszu, and Liliana Nicoleta Simionescu. 2020.
Small and Medium-Sized Enterprises (SMEs): The Engine of Economic Growth through Investments andInnovation. Sustainability 12: 347. [CrossRef]
Gil, Pedro Mazeda, Oscar Afonso, and Paulo Brito. 2019. Economic growth, the high-tech sector, and thehigh skilled: Theory and quantitative implications. Structural Change and Economic Dynamics 51: 89–105.[CrossRef]
Giraudo, Emanuele, Giancarlo Giudici, and Luca Grilli. 2019. Entrepreneurship policy and the financing of younginnovative companies: Evidence from the Italian Startup Act. Research Policy 48: 103801. [CrossRef]
Grinblatt, Mark, and Sheridan Titman. 2002. Financial Markets and Corporate Strategy. New York:MCGraw Hill Irwin.
Guiso, Luigi. 1998. High-tech firms and credit rationing. Journal of Economic Behavior & Organization 35: 39–59.Hall, Bronwyn H. 2002. The financing of Research and Development. Oxford Review of Economic Policy 18: 35–51.
[CrossRef]Hall, Bronwyn H. 2010. The financing of innovative firms. Review of Economics and Institutions 1: 1–30. [CrossRef]Hall, Graham C., Patrick J. Hutchinson, and Nicos Michaelas. 2004. Determinants of the capital structures of
European SMEs. Journal of Business Finance & Accounting 31: 711–28.Harris, Milton, and Artur Raviv. 1988. Corporate control contests and capital structure. Journal of
Financial Economics 20: 55–86. [CrossRef]Hay, Michael, and Kimya Kamshad. 1994. Small firm growth: Intentions, implementation and impediments.
Business Strategy Review 5: 49–68. [CrossRef]Hogan, Teresa, Elaine Hutson, and Paul Drnevich. 2017. Drivers of external equity funding in small high-tech
ventures. Journal of Small Business Management 55: 236–53. [CrossRef]Howell, Anthony. 2016. Firm R&D, innovation and easing financial constraints in China: Does corporate tax
reform matter? Research Policy 45: 1996–2007.Hutton, Will, and Neil Lee. 2012. The city and the cities: Ownership, finance and the geography of recovery.
Cambridge Journal of Regions, Economy and Society 5: 325–337. [CrossRef]Izdihar, Baharin. 2019. Capital Structure Determinants of Financially Distressed Firms at the Bursa Malaysia.
Kuala Lumpur: Asia e University.Jensen, Michael C., and William H. Meckling. 1976. Theory of the firm: Managerial behavior, agency costs and
ownership structure. Journal of Financial Economics 3: 305–60. [CrossRef]Kara, Esen, and Duygu Acar Erdur. 2015. Determinants of Capital Structure: A Research on Sectors That
Contribute to Exports in Turkey. Istanbul University Journal of the School of Business Administration 44: 27–38.Karacaer, Semra, Hüseyin Temiz, and Omer Faruk Gulec. 2016. Determinants of capital structure: An application on
manufacturing firms in Borsa Istanbul. International Academic Journal of Accounting and Financial Management3: 47–59.
Kedzior, Marcin. 2012. Capital structure in EU selected countries–micro and macro determinants.Argumenta Oeconomica 28: 69–117.
Kenourgios, Dimitris, Georgios A. Savvakis, and Theofanis Papageorgiou. 2019. The capital structure dynamics ofEuropean listed SMEs. Journal of Small Business & Entrepreneurship 1–18. [CrossRef]
Kieschnick, Robert, and Rabih Moussawi. 2018. Firm age, corporate governance, and capital structure choices.Journal of Corporate Finance 48: 597–614. [CrossRef]
J. Risk Financial Manag. 2020, 13, 221 19 of 20
Kijkasiwat, Ploypailin, and Pongsutti Phuensane. 2020. Innovation and Firm Performance: The Moderatingand Mediating Roles of Firm Size and Small and Medium Enterprise Finance. Journal of Risk andFinancial Management 13: 97. [CrossRef]
Kopf, Dennis A. 2007. Endogenous growth theory applied: Strategies for university R&D. Journal ofBusiness Research 60: 975–78.
Korkmaz, Özge, and Süleyman Serdar Karaca. 2014. Financial Determinants of Firm Profitability in ManufacturingFirms and an Application on BIST Manifacturing Firms. Ege Akademik Bakıs Dergisi 14: 21–29.
Kraus, Alan, and Robert H. Litzenberger. 1973. A state-preference model of optimal financial leverage. The Journalof Finance 28: 911–22. [CrossRef]
Lee, Neil, Hiba Sameen, and Marc Cowling. 2015. Access to finance for innovative SMEs since the financial crisis.Research Policy 44: 370–80. [CrossRef]
Leland, Hayne E., and David H. Pyle. 1977. Informational asymmetries, financial structure, and financialintermediation. The Journal of Finance 32: 371–87. [CrossRef]
Li, Larry, and Silvia Z. Islam. 2019. Firm and industry specific determinants of capital structure: Evidence fromthe Australian market. International Review of Economics & Finance 59: 425–37.
Li, Yan-xi, Shi-ze Bao, and Xian-jing Kong. 2006. Environment risk, capital structure, growth and high-tech firm’sperformance. Science Research Management 6: 40–46.
Lim, Steve C., Antonio J. Macias, and Thomas Moeller. 2020. Intangible assets and capital structure. Journal ofBanking & Finance 118: 1–59.
Lins, Karl V. 2003. Equity ownership and firm value in emerging markets. Journal of Financial andQuantitative Analysis 38: 159–84. [CrossRef]
Little, Arthur D. 1977. New Technology-Based Firms in the United Kingdom and the Federal Republic of German. London:Wilton House.
M’ng, Jacinta Chan Phooi, Mahfuzur Rahman, and Selvam Sannacy. 2017. The determinants of capital structure:Evidence from public listed companies in Malaysia, Singapore and Thailand. Cogent Economics & Finance 5:1–34.
Mac an Bhaird, Ciarán, and Brian Lucey. 2010. Determinants of capital structure in Irish SMEs.Small Business Economics 35: 357–75. [CrossRef]
Malik, Hifza. 2011. Determinants of insurance companies profitability: An analysis of insurance sector of Pakistan.Academic Research International 1: 315–21.
Mann, William. 2018. Creditor rights and innovation: Evidence from patent collateral. Journal of FinancialEconomics 130: 25–47. [CrossRef]
Michaelas, Nicos, Francis Chittenden, and Panikkos Poutziouris. 1999. Financial policy and capital structurechoice in UK SMEs: Empirical evidence from company panel data. Small Business Economics 12: 113–30.[CrossRef]
Mina, Andrea, Henry Lahr, and Alan Hughes. 2013. The demand and supply of external finance for innovativefirms. Industrial and Corporate Change 22: 869–901. [CrossRef]
Minola, Tommaso, Lucio Cassia, and Giuseppe Criaco. 2013. Financing patterns in new technology-based firms:An extension of the pecking order theory. International Journal of Entrepreneurship and Small Business 25:212–33. [CrossRef]
Modigliani, Franco, and Merton H. Miller. 1958. The cost of capital, corporation finance and the theory ofinvestment. The American Economic Review 48: 261–97.
Modigliani, Franco, and Merton H. Miller. 1963. Corporate income taxes and the cost of capital: A correction.The American Economic Review 53: 433–43.
Morellec, Erwan. 2001. Asset liquidity, capital structure, and secured debt. Journal of Financial Economics 61:173–206. [CrossRef]
Myers, Stewart C. 1977. Determinants of corporate borrowing. Journal of Financial Economics 5: 147–75. [CrossRef]Myers, Stewart C., and Nicholas S. Majluf. 1984. Corporate financing and investment decisions when firms have
information that investors do not have. National Bureau of Economic Research 1396: 1–61. [CrossRef]Nenu, Elena A., Georgeta Vintila, and Stefan C. Gherghina. 2018. The Impact of Capital Structure on Risk and Firm
Performance: Empirical Evidence for the Bucharest Stock Exchange Listed Companies. International Journalof Financial Studies 6: 41. [CrossRef]
J. Risk Financial Manag. 2020, 13, 221 20 of 20
Novaes, Walter, and Luigi Zingales. 1995. Capital structure choice when managers are in control:Entrenchment versus efficiency. National Bureau of Economic Research 5384: 1–42.
Ozkan, Aydin. 2001. Determinants of capital structure and adjustment to long run target: Evidence from UKcompany panel data. Journal of Business Finance & Accounting 28: 175–98.
Peters, Ryan H., and Lucian A. Taylor. 2017. Intangible capital and the investment-q relation. Journal ofFinancial Economics 123: 251–72. [CrossRef]
Popescu, Cristina R. 2019. Intellectual Capital: Major Role, Key Importance and Decisive Influences onOrgamizations’ Performance. Journal of Human Resources Management Research 2019: 1–17.
Rajan, Raghuram G., and Luigi Zingales. 1995. What do we know about capital structure? Some evidence frominternational data. The Journal of Finance 50: 1421–60. [CrossRef]
Ramli, Nur Ainna, Hengky Latan, and Grace T. Solovida. 2019. Determinants of capital structure and firmfinancial performance—A PLS-SEM approach: Evidence from Malaysia and Indonesia. The Quarterly Reviewof Economics and Finance 71: 148–60. [CrossRef]
Revest, Valérie, and Alessandro Sapio. 2012. Financing technology-based small firms in Europe: What do weknow? Small Business Economics 39: 179–205. [CrossRef]
Ross, Stephen A. 1977. The Determination of Financial Structure: The Incentive-Signalling Approach. The BellJournal of Economics 8: 23–40. [CrossRef]
Sau, Lino. 2007. New pecking order financing for innovative firms: An overview. MPRA Paper 3659: 1–28.Scherr, Frederick C., Timothy F. Sugrue, and Janice B. Ward. 1993. Financing the small firm start-up:
Determinants of debt use. The Journal of Entrepreneurial Finance 3: 17–36.Schneider, Cédric, and Reinhilde Veugelers. 2010. On young highly innovative companies: Why they matter and
how (not) to policy support them. Industrial and Corporate Change 19: 969–1007. [CrossRef]Schumpeter, Joseph Alois. 1911. The Theory of Economic Development. Cambridge: Harvard University Press.Stulz, René M. 1990. Managerial discretion and optimal financing policies. Journal of Financial Economics 26: 3–27.
[CrossRef]Ullah, Farid, Qaisar Abbas, and Saeed Akbar. 2010. The relevance of pecking order hypothesis for the financing of
computer software and biotechnology small firms: Some UK evidence. International Entrepreneurship andManagement Journal 6: 301–15. [CrossRef]
Vintilă, Georgeta, Radu Alin Păunescu, and Stefan Cristian Gherghina. 2017. Determinants of effective corporatetax rate. Empirical evidence from listed companies in Eastern European Stock Exchanges. Theoretical &Applied Economics 24: 39–46.
Vintilă, Georgeta, Stefan Cristian Gherghina, and Radu Alin Păunescu. 2018. Study of effective corporate tax rateand its influential factors: Empirical evidence from emerging european markets. Emerging Markets Financeand Trade 54: 571–90. [CrossRef]
Yildirim, Ramazan, Mansur Masih, and Obiyathulla Ismath Bacha. 2018. Determinants of capital structure:Evidence from Shari’ah compliant and non-compliant firms. Pacific-Basin Finance Journal 51: 198–219.[CrossRef]
© 2020 by the authors. Licensee MDPI, Basel, Switzerland. This article is an open accessarticle distributed under the terms and conditions of the Creative Commons Attribution(CC BY) license (http://creativecommons.org/licenses/by/4.0/).