WCDMA : KPI ANALYSIS & OPTIMIZATION Network planning& Optimization
Upload
khangminh22Category
view
1download
0
Abdul Mawjoud: Capacity Enhancement In WCDMA Cellular Network
111
Capacity Enhancement In WCDMA Cellular Network
Dr. S. Abdul Mawjoud A.T.Hussien
Dept. of Electrical Engineering
College of Engineering/ Mosul University, Iraq
Abstract
The third generation (3G) cellular system offers high data rate services
compared with 1G and 2G systems, for good services and increased number of users,
therefore for an operator, it is most important to utilize all possible resources to
improve the network capacity and quality of service (QOS).
The aim of this paper is to investigate using simulation, the impact of
sectorisation, antenna beam width and antenna tilting on capacity. The area of study is
a cellular network in urban area with 13*13 Km containing 19 sites, four different
sectors used are 1sector,3sectors,4sectors and 6sectors, five different antennas are used
in the simulations with 3dB beam width of 120o,90
o,65
o and 33
o and also an Omni-
directional antenna, two types of tilting considered are mechanical and electrical tilt, the
result obtained show that the capacity depends on many parameters (load, interference,
service type, sectors number, antenna tilt) and can be increased in the proper choice of
these parameters.
Keywords: Cellular system, Cell sectorisation, Antenna tilt, Capacity.
WCDMA انخهت ع شبكتأنتحس أنسؼت ف
أحذ ط حس د.ساي ػبذ انجد
قسى انذست انكزبائت
جايؼت انصم/انؼزاق/ كهت انذست
نهخصأ
,نهحصل ػهى خذياث بانقارت يغ األظت انسابقت انجم انثانث نهظاو انخهي قذو خذيت بااث ػانت
ستؼم كم اإليكااث انتاحت نتحس انسؼت ػت انخذيت ت كتبإدارة انشفأ نذنك انستخذي ػذد زادةنجذة
نهشبكت.
تأثز انتقطغ,ػزض شؼاع انائ ,تحقق استخذاو أيثم نهشبكت بانحاكاة ي احت انذف ي انبحث
يقغ, تى 31تحتي ػهى كى 31*31 ساحتب يذتيزكز ف شبكت خهت دراستتى .انائ ػهى انسؼت تج
120بؼزض شؼاع استخذاو خست أاع ي انائاث ف انحاكاةo,90
o,65
o,33
o غز اتجاباإلضافت إنى ائ
(Omni-directional antenna) يقاطغ, 6 يقاطغ 4 يقاطغ, 1, يقطغ احذ أاع ي انتقطغ أربؼت, استخذو
انسؼت تؼتذ أأ انتائج انحصم ػها تب انكزبائ, انكاك أنتج تج أنائتى تطبق ػ ي
تحس انسؼت ف ذا انبحث باالختار ك ( تج انائ د انقاطغ,ػذ ,ػت انخذيت انحم, ) يتغزاثػهى ػذة
أأليثم نذ انتغزاث.
Received: 13 – 12 - 2010 Accepted: 8 – 5 - 2011

Al-Rafidain Engineering Vol.20 No.1 Feb. 2012
111
1- Introduction :
In wide band code division multiple access (WCDMA) cellular system the capacity is strongly
effect by interference, so reducing the interference leads to improve capacity. Hence, interference
level should be kept to minimum as possible at all times to avoid network congestions. The
level of interference can be controlled in many ways using cell sectoring, correct base station
antenna configurations and antenna tilt.
2- Factors Influencing the Capacity of WCDMA System:
Sectorisation The capacity in WCDMA system can be improved using cell sectorisation, since
sectorisation cell can reduces the interference. Which leads to increase the capacity, the
capacity in a cellular system with sectorisation is increased by a factor equal to the number of
sectors because the interference is effectively reduced by the same factor. Thus, if Ns is the
number of users per sector, than cell capacity (number of users per cell),N, is [1] :
N= Δ NS …(1)
Where Δ is the number of sectors per cell. In the cell of three sectors Δ is equal to three (120o
sectoring) the number of interference (co channel interference) sources seen by an antenna is
decreased by third compared Omni-directional antenna.
For imperfect sectorisation, the overlap angle Є is introduced as shown in Figure (1), than
capacity with imperfect sectorisation (Nimp) is given by [1] :
Nimp=
NS …(2)
For large overlap angle, interference leaks to the other
sectors directly results reducing capacity. The overlaps in
the antenna radiation patterns as well as the influence of
the propagation environment on the pattern itself make it
difficult to control the interference leakage into
neighboring sectors [1].
The sectorisation gain (ξ), can be estimated as the
average number of simultaneous of sectorisation users
relative to the average number of users of the Omni-site
configuration according to Equation (3) [2].
ξ =
…(3)
Figure (1) Sector coverage
with an imperfect radiation
pattern of the directional
antenna

Abdul Mawjoud: Capacity Enhancement In WCDMA Cellular Network
111
Tilted Antenna Tilted antenna is another technique that can be used to improve the system capacity. The
tilted antenna generally reduces the interference by controlling the range of coverage over a
sector as shown in Figure (2) [1][3][4].
Figure (2) Tilted antenna cell coverage
There are two types of tilting electrical and mechanical tilt. Comparison of mechanical
and electrical tilt is as shown in Figure (3). Mechanical down tilt (MDT) refers to setting the
down tilt angle by adjusting the antenna support to let the antenna down to a certain position.
Figure (3) Mechanical and Electrical down tilt

Al-Rafidain Engineering Vol.20 No.1 Feb. 2012
111
Electricity down tilt (EDT) refers to controlling the down tilt angle by changing the phase
of the dipole. Electrically controlled down tilt and the mechanical down tilt have different
influence on the back lobe. Electrically controlled down tilt allows further control of the
influence on the back lobe, while mechanical down tilt enlarges the influence on the back
lobe, as shown in Figure (4) If the mechanical down tilt angle is very large, the emission
signals of the antenna will propagate to high buildings in backward direction through the
back lobe, thus resulting in additional interference.
Figure (4) MDT and EDT influence on the back lobe
Uplink and Down link load factor
In WCDMA system all users use single frequency in the cell for different code, the
system interference and capacity can be estimated using the uplink load factor (ηUL). The
uplink load factor (include the effect of sectorisation) can be shown as [2][5] :
ηUL =
(
) …(4)
Where R is the bit rate, W is the chip rate, N is the number of served user, υ is the activity
factor, Eb/No is the signal energy per bit divided by noise spectral density, i is the other to
own cell interference ratio, Ns is the number of sectors, ξ is the sectorisation gain.
The downlink load factor (ηDL), can be defined based on a similar principle as for the
uplink, although the parameters are slightly different as shown in Equation (5) [5].
ηDL= ∑ (
)
[(1- αj)+ij] …(5)
Where N is the number of user per cell, vj is the activity factor of user j, Rj is the bit rate of
user j, αj is the orthogonality factor of user j in the downlink, (
)j is the signal energy per bit
divided by noise spectral density of user j, ij is the other to own cell interference ratio
received by user j.
3-Simulator description :
The simulation consists of four parts: initialization, uplink iteration, downlink iteration
and post processing of the analysis results [6][7].

Abdul Mawjoud: Capacity Enhancement In WCDMA Cellular Network
111
Initialization The main task of the initialization is to calculate the link loss from each base station to
each pixels (1048*1084) in the area considered.
Uplink iterations In the uplink iteration process, the target is allocated the minimum transmit power to each
base station (BS) for the specific Eb/No requirements. When the transmit powers of the
mobiles stations to each base station are estimated the best server is determined as the base
station, to which the mobile station (MS) has to transmit with minimum power. The
minimum transmit powers are then compared to the maximum allowed transmit power of a
mobile and terminals exceeding this limit are excluded during this iteration step. If this
happens a specified number of iterations in a row, the MS is finally put to outage. After the
transmit powers of all mobile stations have been allocated, the interference at each BS can be
re-estimated and new loading value and sensitivity is estimated. The impact of the loading on
the sensitivity is taken into account by adjusting it with (1-η). Now the mobile station can be
re-allocated to a new base station, the mobile station transmit powers are re-estimated and the
interference analysis is performed again. This is repeated until the changes in the BS
sensitivity values are smaller than specified.
Downlink iterations In the downlink iteration the BS transmit powers for each link including power control
for all mobile stations receive their signal of BS with the required carrier-to-interference-
ratio C/I, defined by Equation (6) [6].
Target C/I =
…(6)
Where Eb/No is the received requirement of the MS depending on speed and service, W is
the chip rate and R is the data rate.
The actual received (C/I)m of MSm is calculated using maximum ratio combining (MRC)
algorithm according to Equation (7) by summing the C/I values of all links k (k=1…K), MSm
is having [8] :
(C/I)m = ∑
…(7)
Where α is the orthogonality factor, Pk is the total transmit power of the BS to which link k is
established, Lkm is the path loss from cell k to the MSm, Pkm is the power allocated from BSk
to MSm, Ioth,k is the other cell interference and Nm is the background and receiver noise of the
MSm.
The initial transmit powers are adjusted iteratively according to the difference
between the achieved and the targeted C/I is achieved.
Post processing In the post-processing phase basically all outputs are generated.

Al-Rafidain Engineering Vol.20 No.1 Feb. 2012
111
4- simulation parameters :
Table (1) Parameters used in simulations
Chip rate (W) 3.84Mchips/s
Base station maximum transmit power 43dBm
Mobile station maximum transmit power 21dBm
Thermal noise density -174dBm
MS/BS Noise figure 8/5 dB
Path loss model Okumura-Hata
Standard deviations for shadow fading 7dB
P-CPICH 30dBm
Orthogonally factor 0.5
Base station antenna height 35m
Mobile station antenna height 1.5m
Cable losses 3dB
5- Network scenarios:
The scenarios consisting of 19 sites in 169 Km2area, there are four types of sectors (1,3,4
and 6 sectors) and antenna beam width (33o,65
o,90
o,120
o) are used. The site distribution
with different sectors is depicted in figures (5-8).
Figure (5) 19 sites with one secto Figure (6) 19 sites with three sectors

Abdul Mawjoud: Capacity Enhancement In WCDMA Cellular Network
111
Figure (7) 19 sites with four sectors Figure (8) 19 sites with six sectors
The users distribution is assumed to be uniform with a typical 1.5m antenna height with
different bit rate of transmitted data as shown in figures (9) and (10).
6-Simulation and Results:
In this section, simulation program were developed using matlab (Release 2010a). Figures
(11,12) show the number of sectors versus the capacity for different bit rates
(12.2kbps,144kbps), as shown in the figures, increasing the cell sectors leads to increased
capacity due to reducing the interference using directional antennas, while the number of
users is decreased when using high data rate (144kbps) because the power consumed in
downlink direction is higher
Figure (9) 12.2kbps users initial
distributions with three sectors network Figure (10) 144kbps users initial
distributions with three sectors network

Al-Rafidain Engineering Vol.20 No.1 Feb. 2012
111
.
Figure (13) illustrates the number of sectors (with different antenna beamwidth) versus the
sectorisation gain.
Figure (13) Sectorisation gain for different antenna beamwidth
Figure (14) illustrates the antenna beamwidth (for different Sectorisation) versus
interference, while Figure (15) illustrates antenna beam versus number of users. In the
simulations, the 65o antenna is optimum for the three sectors case and the 33
o antenna is best
for the four and six sectors scenario.
Figure (11) Different sectorisation with
users used 12.2kbps
Figure (12) Different sectorisation with
users used 144kbps

Abdul Mawjoud: Capacity Enhancement In WCDMA Cellular Network
111
Figure (14) Impact of the antenna beamwidth on interference
Figure (15) Impact of the antenna beamwidth on the capacity
The results related to the sectorisation study are shown in Table (2). In the case of Omni
directional sites, the capacity is very poor and only 937 users could be served. Table (2)
cleary indicates that with higher sectorisation, the more users can be served. Simultaneously
the amount of interference leaking into neighboring cells increases, but with proper choice of
the antenna beamwidth also these effect can be controlled to acceptable level (0.4092 is the
optimum value for three sectors, then three sectors is good choice for this network). Also
form Table (2) it can be noticed that for each sectorisation case the selection of the antenna
beamwidth is important. The amount of users per site however is increasing but not linearly

Al-Rafidain Engineering Vol.20 No.1 Feb. 2012
111
with the number of sectors, because of overlaps in the sectors leaking interference from one
sector to another.
Table (2) The impact of the antenna selection on capacity and interference
Figure (16) illustrates the antenna tilt (MDT and EDT) versus interference for three sectors,
the down tilt angle increases for both the MDT and the EDT since interference decrease due
to the overlap between adjacent sites is decreased.
Figure (16) Impact of antenna tilt on interference-3sector network
Figure (17) illustrates the antenna tilt (MDT and EDT) versus interference for six sectors, as
shown in figure the EDT decrease the interference more than MDT because MDT may
deform the pattern (see Figure 3).
Antenna Types Served users Interference ( I other/I own)
Omni-case 937 0.5900
Three sectors case
33o 2660 0.5019
65o 2689 0.4092
90o 2372 0.6528
120o 2209 0.9167
Four sectors case
33o 3300 0.5895
65o 3164 0.5948
90o 2683 0.9814
120o 2387 1.2415
Six sectors case
33o 4873 0.5766
65o 3626 0.9138
90o 2878 1.5763
120o 2604 1.9073
Abdul Mawjoud: Capacity Enhancement In WCDMA Cellular Network
111
Figure (17) Impact of antenna tilt on interference-6sector network
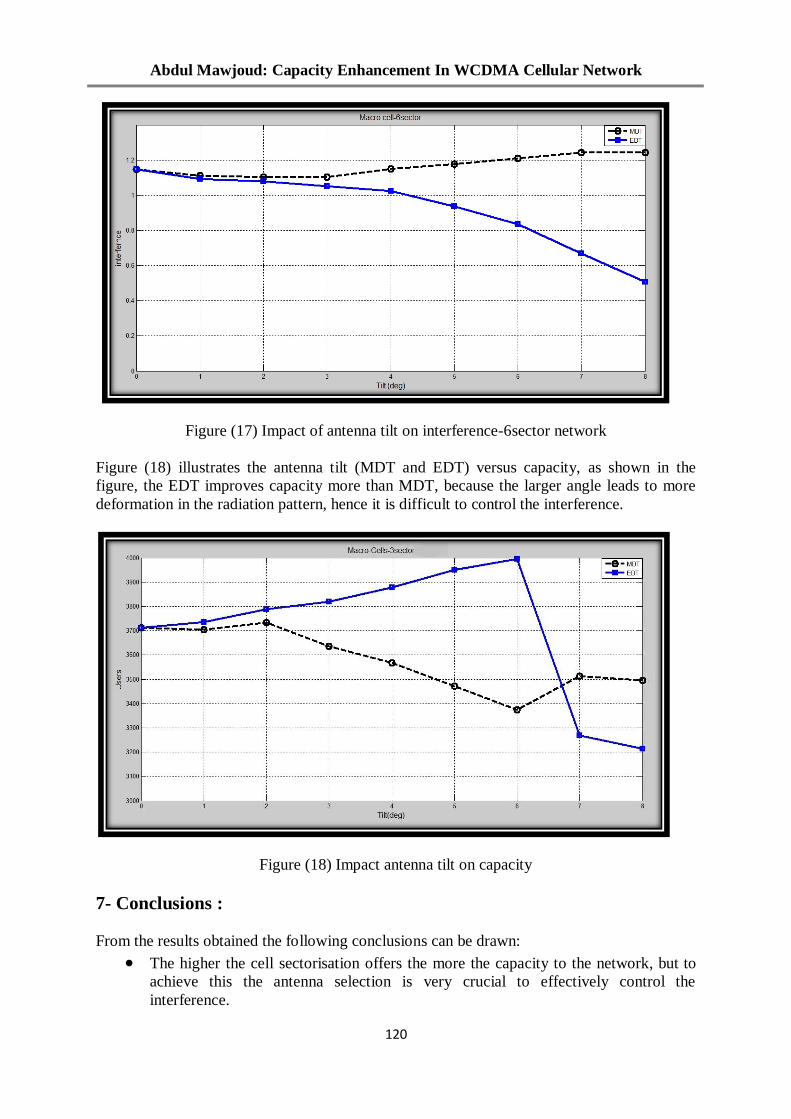
Figure (18) illustrates the antenna tilt (MDT and EDT) versus capacity, as shown in the
figure, the EDT improves capacity more than MDT, because the larger angle leads to more
deformation in the radiation pattern, hence it is difficult to control the interference.
Figure (18) Impact antenna tilt on capacity
7- Conclusions :
From the results obtained the following conclusions can be drawn:
The higher the cell sectorisation offers the more the capacity to the network, but to
achieve this the antenna selection is very crucial to effectively control the
interference.

Al-Rafidain Engineering Vol.20 No.1 Feb. 2012
111
For each sectorisation case an optimum beamwidth exists.
Increasing the cell sector/site leads to increasing number of handoff (soft/softer), thus
increasing the load on the switching and control link elements of the mobile system,
so balance between load and capacity is required.
The capacity gains with simulated network topology for MDT from 3700 users to
3730 users, when EDT capacity gain from 3700 users to 4000 users.
The EDT controls the interference occurring between the adjacent main lobes, side
lobes and back lobes, while in MDT the control of the main adjacent lobes is less
effect that the EDT.
For optimum planning to WCDMA network the choice three sectors with 65o
antenna beamwidth and 6o EDT.
References :
[1] T.V. Nguyen," Capacity Improvement Using Adaptive Sectorisation in WCDMA
Cellular Systems with Non-Uniform and Packet Mode Traffic" , PhD. Thesis ,Victoria
University, Melbourne, Australia, March. 2005.
[2] J.Laiho and A.Wacker, " Radio Network Planning and Optimization for UMTS",
2nd
edition John Wiley & Sons Ltd, 2006.
[3] T.Isotalo,J Niemela and J.Lempiainen, "Electrical Antenna Down Tilt in UMTS
Network", institute of communication engineering, Tampere university of technology,
Finland,2005.
[4] "Comparison of Mechanical and Electrical Down tilt", Available on web site,
www.kathrein-scala.com/tech_bulletins/MEdowntilt.pdf
[5] H.Holma and A.Toskala "WCDMA FOR UMTS HSPA Evolution and LTE ",5th edition
John Wiley and Sons Ltd, 2010.
[6] A. Wacker, et al., "NPSW Matlab implementation of static radio network planning tool
for WCDMA", Documentation; Version 5.0.0, 2005.
[7] A. Wacker, et al., “NPSW Matlab implementation of static radio network planning tool
for WCDMA”, Code; Version 5.0.0, 2005.
[8] A.Wacker , Kari Sipila and Antti Kuurne, " Automated and Remotely Optimization of
Antenna SubsysteAm based on Radio Network Performance " , proc of IEEE,2002. PP. 752-
756.
The work was carried out at the college of Engineering. University of Mosul
Copyright © 2022 FDOKUMEN