WCDMA PS Service Optimization Guide
272
WCDMA PS Service Optimization Guide For Internal Use Only Product name Confidentiality level WCDMA RNP For internal use only Product version Total 166 pages 3.2 WCDMA PS Service Optimization Guide (For internal use only) Prepared by Yu Yongxian Date 2006-03-22 Reviewed by Xie Zhibin, Chen Qi, Xu Zili, Xu Dengyu, Jiao Anqiang, Hu Wensu, Ji Yinyu, Qin Yan, Wan Liang, and Ai Hua Date 2006-03-22 Reviewed by Qin Yan and Wang Chungui Date 2006-03-30
-
Upload
independent -
Category
Documents
-
view
5 -
download
0
Transcript of WCDMA PS Service Optimization Guide
WCDMA PS Service Optimization GuideFor Internal
Use Only
Product name Confidentiality level
WCDMA RNP For internal use only
Product versionTotal 166 pages
3.2
WCDMA PS Service Optimization Guide(For internal use only)
Prepared by Yu Yongxian Date 2006-03-22
Reviewed by Xie Zhibin, Chen Qi, XuZili, Xu Dengyu, Jiao Anqiang, Hu Wensu, Ji Yinyu, Qin Yan, Wan Liang, and Ai Hua
Date
2006-03-22
Reviewed by Qin Yan and Wang Chungui
Date 2006-03-30
Approved by Date
Huawei Technologies Co., Ltd.All Rights Reserved
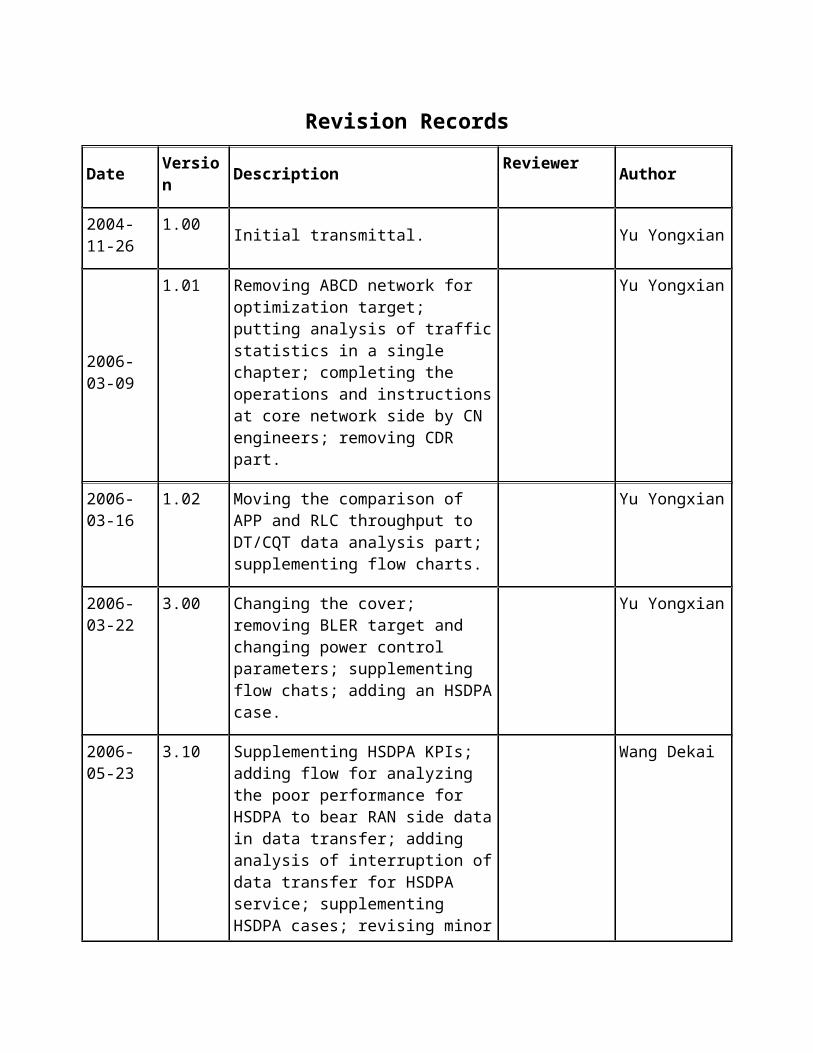
Revision Records
Date Version Description Reviewer Author
2004-11-26
1.00 Initial transmittal. Yu Yongxian
2006-03-09
1.01 Removing ABCD network for optimization target; putting analysis of trafficstatistics in a single chapter; completing the operations and instructionsat core network side by CN engineers; removing CDR part.
Yu Yongxian
2006-03-16
1.02 Moving the comparison of APP and RLC throughput to DT/CQT data analysis part; supplementing flow charts.
Yu Yongxian
2006-03-22
3.00 Changing the cover; removing BLER target and changing power control parameters; supplementing flow chats; adding an HSDPAcase.
Yu Yongxian
2006-05-23
3.10 Supplementing HSDPA KPIs; adding flow for analyzing the poor performance for HSDPA to bear RAN side datain data transfer; adding analysis of interruption ofdata transfer for HSDPA service; supplementing HSDPA cases; revising minor
Wang Dekai
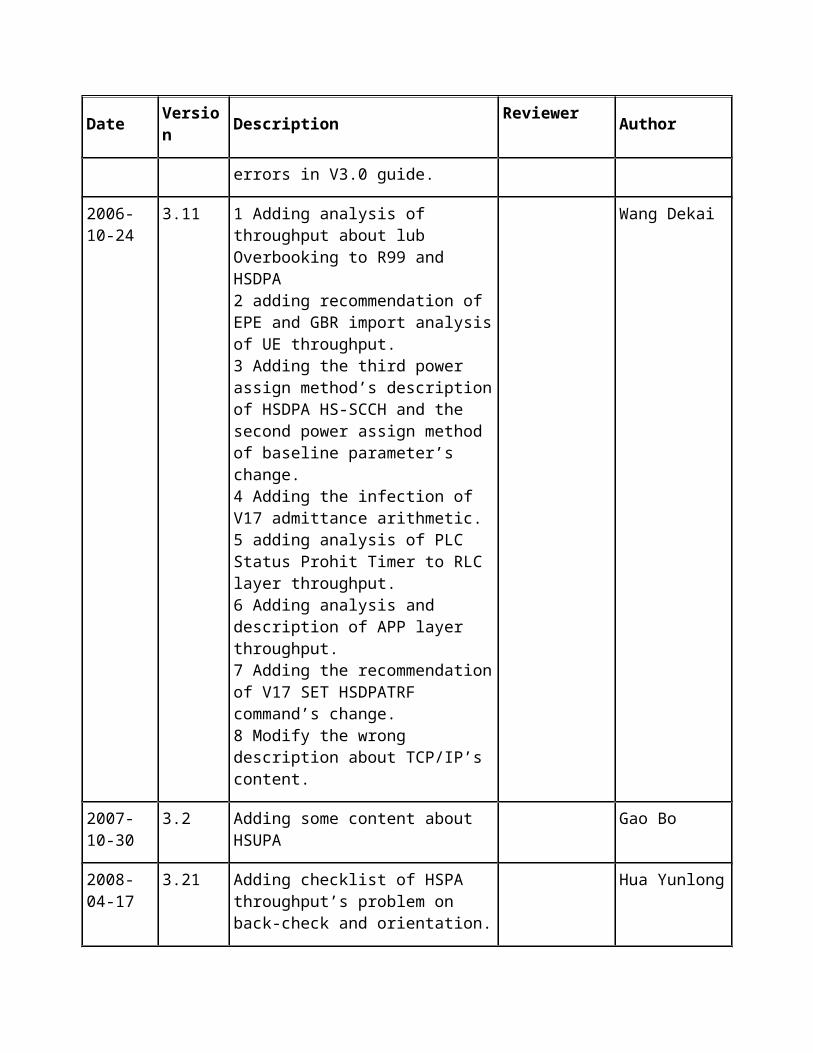
Date Version Description Reviewer Author
errors in V3.0 guide.
2006-10-24
3.11 1 Adding analysis of throughput about lub Overbooking to R99 and HSDPA2 adding recommendation of EPE and GBR import analysisof UE throughput.3 Adding the third power assign method’s descriptionof HSDPA HS-SCCH and the second power assign method of baseline parameter’s change.4 Adding the infection of V17 admittance arithmetic.5 adding analysis of PLC Status Prohit Timer to RLC layer throughput.6 Adding analysis and description of APP layer throughput.7 Adding the recommendationof V17 SET HSDPATRF command’s change.8 Modify the wrong description about TCP/IP’s content.
Wang Dekai
2007-10-30
3.2 Adding some content about HSUPA
Gao Bo
2008-04-17
3.21 Adding checklist of HSPA throughput’s problem on back-check and orientation.
Hua Yunlong
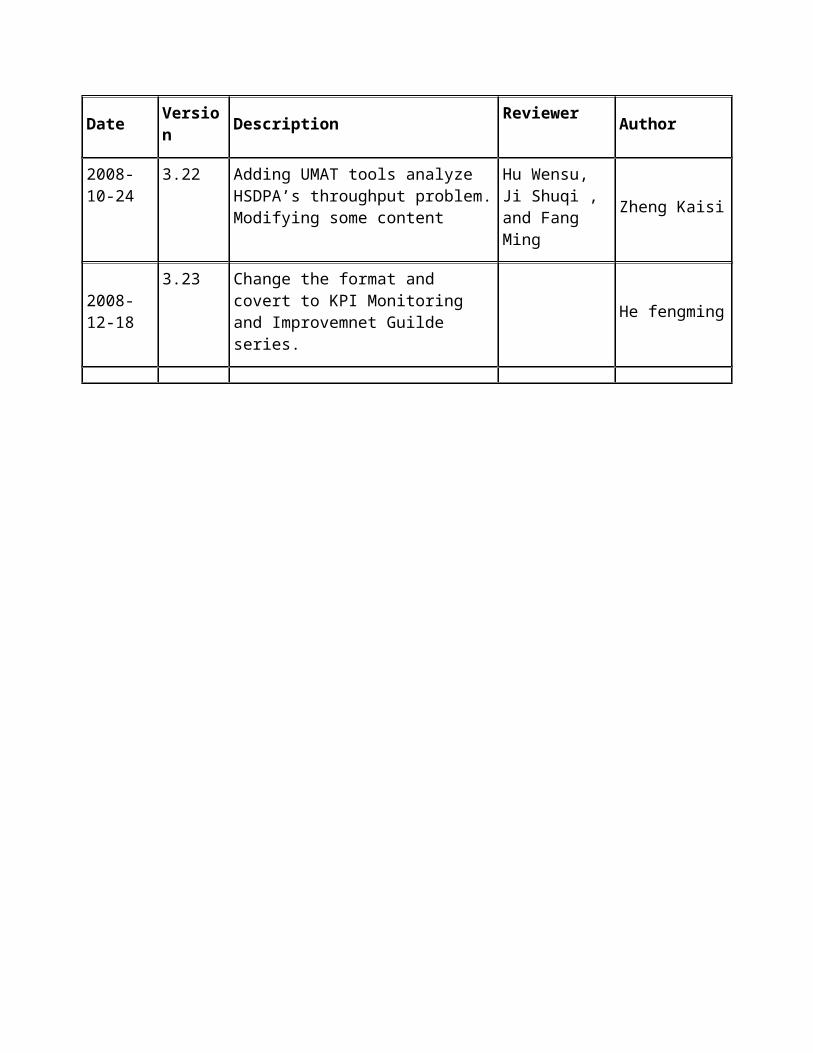
Date Version Description Reviewer Author
2008-10-24
3.22 Adding UMAT tools analyze HSDPA’s throughput problem.Modifying some content
Hu Wensu, Ji Shuqi , and Fang Ming
Zheng Kaisi
2008-12-18
3.23 Change the format and covert to KPI Monitoring and Improvemnet Guilde series.
He fengming
Contents
3.1 Traffic Statistics 193.2 DT/CQT 203.3 Others 224.1 Traffic Statistics Indexes Related to Throughput 254.2 Generic Analysis Flow 294.2.1 Flow for Analyzing RNC-level Traffic Statistics Data 294.2.2 Flow for Analyzing Cell-level Traffic Statistics Data 32
5.1 Access Failure 395.1.1 Originating PS Service by UE Directly 395.1.2 UE as the Modem of PC 40
5.2 Disconnection of Service Plane 465.2.1 Analyze Problems at RAN Side 465.2.2 Analyzing Problems at CN Side 51
5.3 Poor Performance of Data Transfer 545.3.1 Checking Alarms 555.3.2 Comparing Operations and Analyzing Problem 565.3.3 Analyzing Poor Performance of Data Transfer by DCH 575.3.4 Analyzing Poor Performance of Data Transfer by HSDPA at RAN Side 625.3.5 Analysis of the Problem about Poor Data Transmission Performance of the HSUPA on the RAN Side 815.3.6 Analyzing Poor Performance of Data Transfer at CN Side 115
5.4 Interruption of Data Transfer 1195.4.1 Analzying DCH Interruption of Data Transfer 1195.4.2 Analyzing HSDPA Interruption of Data Transfer 121
6.1 Cases at RAN Side 1246.1.1 Call Drop due to Subscriber Congestion (Iub Resource Restriction) 124
6.1.2 Uplink PS64k Service Rate Failing to Meet Acceptance Requirements ina Test (Air Interface Problem) 1246.1.3 Statistics and Analysis of Ping Time Delay in Different Service Types 1256.1.4 Low Rate of HSDPA Data Transfer due to Over Low Pilot Power 1266.1.5 Unstable HSDPA Rate due to Overhigh Receiving Power of Data Card 1276.1.6 Decline of Total Throughput in Cell due to AAL2PATH Bandwidth largerthan Actual Physical Bandwidth 1286.1.7 Causes for an Exceptional UE Throughput and Location Method in a Field Test 130
6.2 Cases at CN Side 1336.2.1 Low FTP Downloading Rate due to Over Small TCP Window on Server TCP 1336.2.2 Simultaneous Uploading and Downloading 1346.2.3 Decline of Downloading Rate of Multiple UEs 1356.2.4 Unstable PS Rate (Loss of IP Packets) 1366.2.5 Unstable PS Rate of Single Thread in Commercial Deployment (Loss of IP Packets) 1386.2.6 Unavailable Streaming Service for a Subscriber 1396.2.7 Unavailable PS Services due to Firewall of Laptop 1396.2.8 Low PS Service Rate in Presentation Occasion 1396.2.9 Abnormal Ending after Long-time Data Transfer by FTP 1406.2.10 Analysis of Failure in PS Hanodver Between 3G Network and 2G Network 144
8.1 Transport Channel of PS Data 1518.2 Theoretical Rates at Each Layer 1528.2.1 TCP/IP Layer 1528.2.2 RLC Layer 1528.2.3 Retransmission Overhead 1538.2.4 MAC-HS Layer 153
8.3 Bearer Methods of PS Services 1548.3.1 DCH 1548.3.2 HSDPA 1548.3.3 CCH 155
8.4 Method for Modifying TCP Receive Window 1568.4.1 Tool Modification 1568.4.2 Regedit Modification 156
8.5 Method for Modifying MTU 157
8.5.1 Tool Modification 1578.5.2 Regedit Modification 158
8.6 Confirming APN and Rate in Activate PDP Context Request Message 1598.6.1 Traffic Classes: 1598.6.2 Maximum Bit Rates and Guaranteed Bit Rates 1608.6.3 APN 160
8.7 APN Effect 1628.7.1 Major Effect 1628.7.2 Method for Naming APN 1628.7.3 APN Configuration 162
8.8 PS Tools 1638.8.1 TCP Receive Window and MTU Modification Tools 1638.8.2 Sniffer 1638.8.3 Common Tool to Capture Packet: Ethereal 1648.8.4 HSDPA Test UE 164
8.9 Analysis of PDP Activation 165
Figures
Flow for analyzing RNC-level traffic statistics data 30
Flow for analyzing cell-level traffic statistics data 32
Flow for analyzing DT/CQT data 38
Flow for analyzing access failure problems when originating PS services by UE directly 39
Flow for analyzing access problem when the UE serves as the modemof PC 40
Flow for processing problem of failure in opening port 41
Flow for analyzing access failure problems 42
Signaling flow of successful setup of a PS service in Probe 43
Flow for analyzing disconnection of service plane 46
Flow for analyzing RAN side problem about disconnection of service plane for DCH bearer 47
Connection Performance Measurement-Downlink Throughput and Bandwidth window 48
HSDPA parameters in Probe 50
Flow for analyzing problems at CN side about disconnection of service plane 52
Flow for analyzing poor performance of data transfer 55
Flow for analyzing RAN side problem about poor performance of data transfer on DCH 58
Flow for analyzing data transfer affected by Uu interface 59
Flow for analyzing data transfer affected by Iub interface 61
Flow for analyzing poor performance of data transfer on HSDPA at RAN side 64
Confirming in the RNC message that PS service is set up on HSDPA channel 65
Confirming in Probe that service is set up on HSDPA channel 65
High code error of ACK->NACK/DTX in Probe 76
Uplink and downlink RL imbalance in handover areas 77
Residual BLER at MAC layer in WCDMA HSDPA Decoding Statistics window 80
Working process of an HSUPA UE 82
Optimization flow of a low throughput of the HSUPA UE 85
Confirming the service is set up on the HSUPA according to a signaling message of the RNC 86
How to confirm the service is set up on the HSUPA through the drive test tool Probe 87
RRC CONNECTION REQUEST message 90
RRC CONNECT SETUP CMP message 91
RL RECFG PREPARE message 92
Display of the Assistant HSUPA related information (limited transmit power of the UE) 93
Display of the Assistant HSUPA related information (limited traffic) 94
PHYSICAL SHARED CHANNEL RECONFIGURATION REQUEST message (containing the target RTWP and the background) 96
ATM transmission efficiency 97
P bandwidth utilization 98
RAB assignment request message (containing an MBR) 99
RL RECFG PREPARE message (containing NodeB MBR) 100
RB SETUP message (containing the maximum number of available channel codes) 101
RLC PDU retransmission rate on the Probe 109
Receiver's CPU performance observation window 113
Flow for analyzing poor performance of data transfer at CN side 116
Flow for analyzing interruption of data transfer 120
Interruption delay of TCP displayed in Ethereal 122
Variation of total throughput of one IMA link of HSDPA codes 128
Variation of total throughput of two IMA links of HSDPA codes 129
Unstable PS rate (1) 137
Unstable PS rate (2) 137
Analyzing packets captured by Ethereal upon unstable PS rate 138
Interactive interface in CuteFTP 141
Signaling of normal downloading by FTP 142
Signaling of abnormal downloading by FTP 143
Signaling of normal handover between 3G network and 2G network 145
Normal signaling flow between UE and 2G SGSN. 146
Signaling flow traced on 2G SGSN 147
Transport channel of PS data 151
Packet Service Data Flow 152
Running interface of DRTCP 157
Detailed resolution of Activate PDP Context Request message 159
Converting ASCII codes into a character string by using the UltraEdit 161
PDP context activation process originated by MS 165
Tables
Requirements by DT/CQT on PS throughput 15
Major parameters to be collected in DT/CQT 20
Tools for collecting data 22
Measured items related to PS throughput in overall performance measurement of RNC 25
Measured items related to PS throughput in cell performance measurement 26
Measured items related to HSDPA throughput (cell measurement) 27
related to HSUPA throughput (cell measurement) 27
Other measured items related to throughput 28
Indexes to judge whether a cell has PS service request 33
Cell measurement/cell algorithm measurement analysis 33
Analysis of cell performance/Iub interface measurement 34
Cell Measurement/Cell RLC Measurement Analysis 35
Comparing operations and analyzing problem 56
Relationship between CQI and TB size when the UE is in category 11–12 67
Relationship between CQI and TB size when the UE is at the level 1–6 68
HS-SCCH power offset 71
Categories of UE HSUPA capability levels 89
PO for the E-AGCH when the Ec/Io at the edge of cells is –12 dB 103
PO for the E-RGCH when the Ec/Io at the edge of cells is –12 dB 104
PO for the E-HICH when the Ec/Io at the edge of cells is –12 dB 107
Delay test result of ping packet 126
WCDMA PS Service Optimization Guide
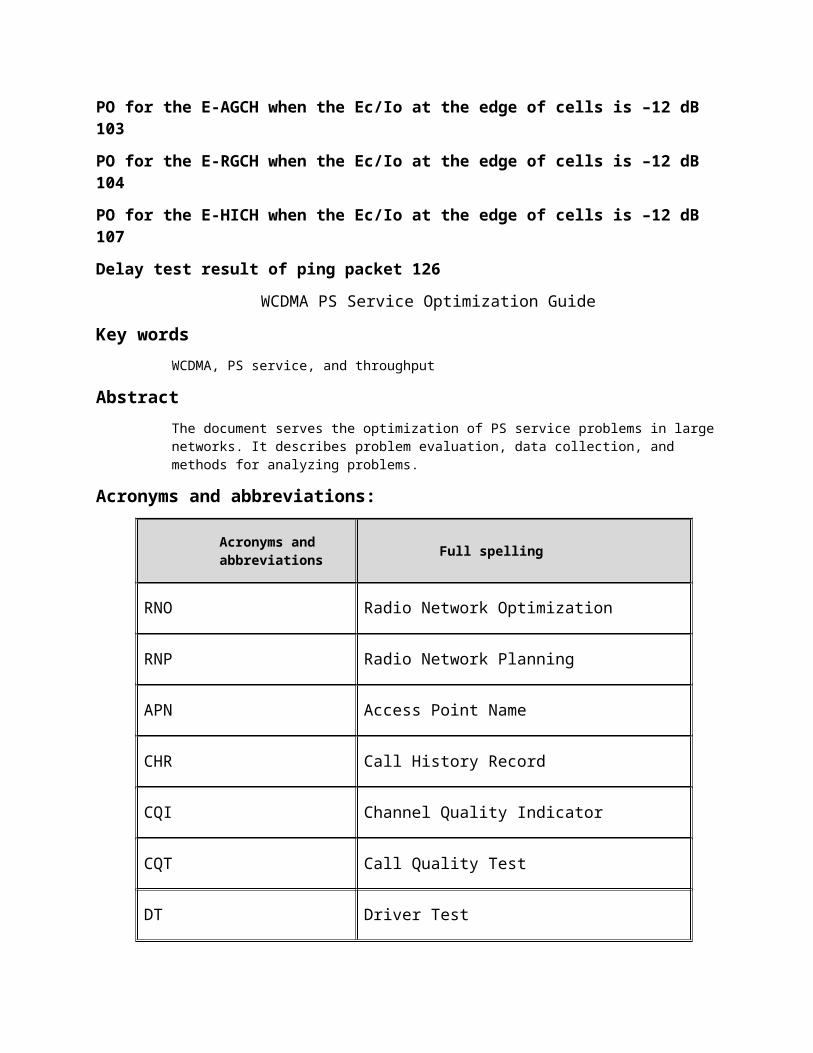
Key wordsWCDMA, PS service, and throughput
AbstractThe document serves the optimization of PS service problems in largenetworks. It describes problem evaluation, data collection, and methods for analyzing problems.
Acronyms and abbreviations:
Acronyms and abbreviations Full spelling
RNO Radio Network Optimization
RNP Radio Network Planning
APN Access Point Name
CHR Call History Record
CQI Channel Quality Indicator
CQT Call Quality Test
DT Driver Test
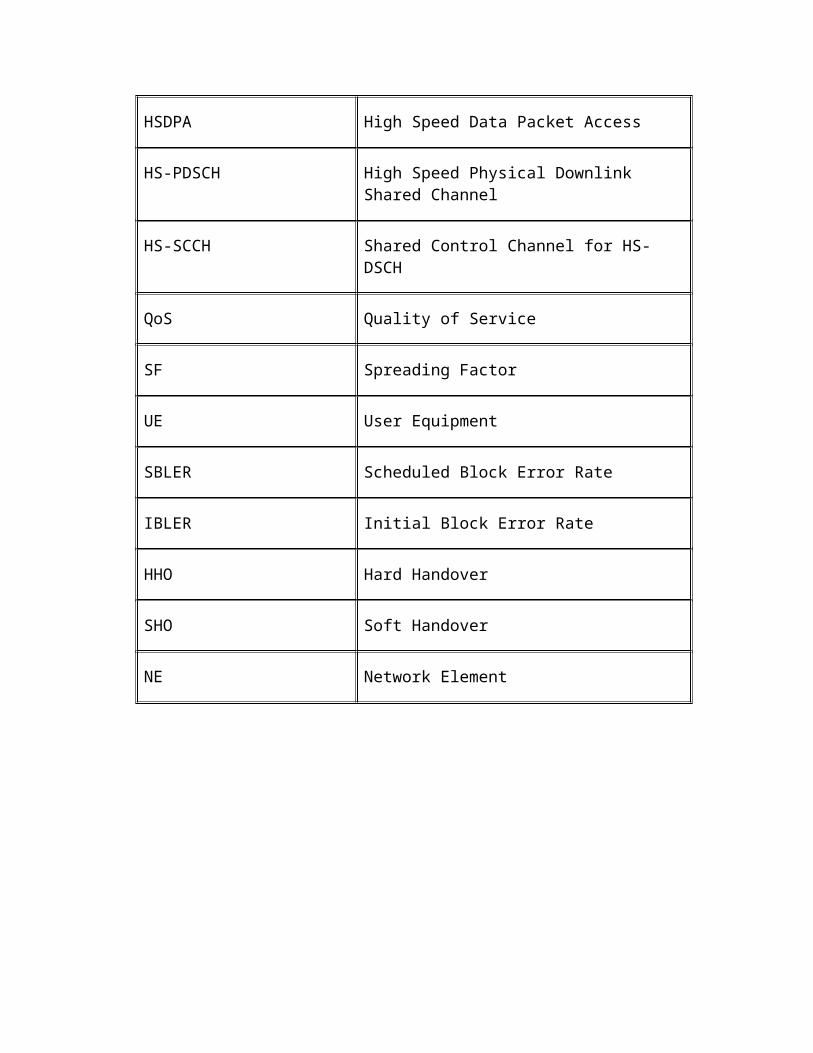
HSDPA High Speed Data Packet Access
HS-PDSCH High Speed Physical Downlink Shared Channel
HS-SCCH Shared Control Channel for HS-DSCH
QoS Quality of Service
SF Spreading Factor
UE User Equipment
SBLER Scheduled Block Error Rate
IBLER Initial Block Error Rate
HHO Hard Handover
SHO Soft Handover
NE Network Element
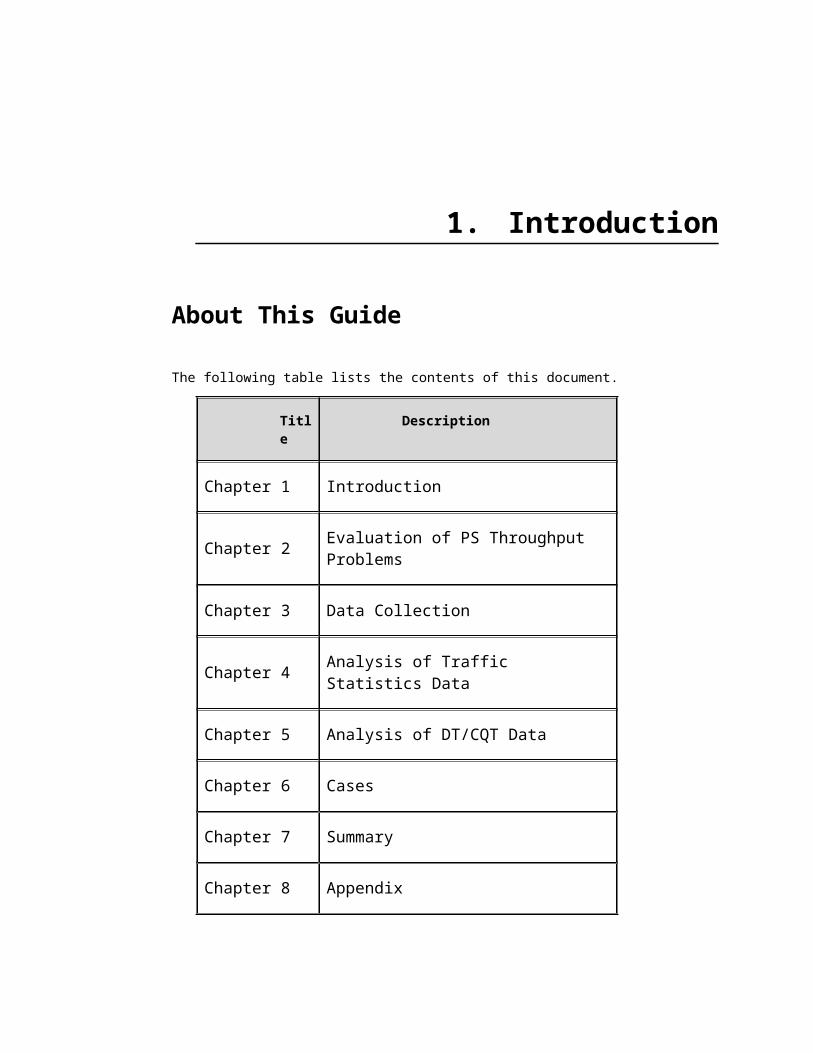
1. Introduction
About This Guide
The following table lists the contents of this document.
Title
Description
Chapter 1 Introduction
Chapter 2 Evaluation of PS Throughput Problems
Chapter 3 Data Collection
Chapter 4 Analysis of Traffic Statistics Data
Chapter 5 Analysis of DT/CQT Data
Chapter 6 Cases
Chapter 7 Summary
Chapter 8 Appendix
In WCDMA networks, besides traditional conversational service, data service is growing with features. It has a significant perspective.
The indexes to indicate the performance of WCDMA data service includes:
Access performanceIt is reflected by the following indexes of data service:
Success rate of RRC setup Success rate of RAB setup Success rate of PDP activation Call drop rate of PS service Throughput Delay
There are access delay and the service interruption delay caused by HHO.
This document addresses on problems in PS service optimization, suchas access problems, data transfer failure, low throughput of data transfer, unstable rate of data transfer, and interruption of data transfer. It describes the method to analyze and solve DT/CQT problems. In addition, it describes the flow for processing access failure and data transfer failure problems in optimization of PS throughput.
For access problems, call drop and handover problems, see W-KPI Monitoring and Improvement Guide, which provides analysis in terms of signaling flow and performance statistics. This guide supplements the possible causes and solutions to PS service access problems in terms of operations.
This guide is for RNO in commercial network, not in benchmark trial network.
The HSDPA problem analysis and description of MML command and product function are based on the following product versions:
BSC6800V100R006C01B064 BTS3812E V100R006C02B040
When refer RRC arithmetic and product realization default is RNC V16, refer V17 it will be labeled.

The HSUPA problem analyses, description of MML command and product function are based on the following product versions:
BSC6800V100R008C01B082 DBS3800-BBU3806V100R008C01B062
2. Evaluation of PS ThroughputProblems
About This Chapter
This chapter describes the evaluation of PS throughput problems.
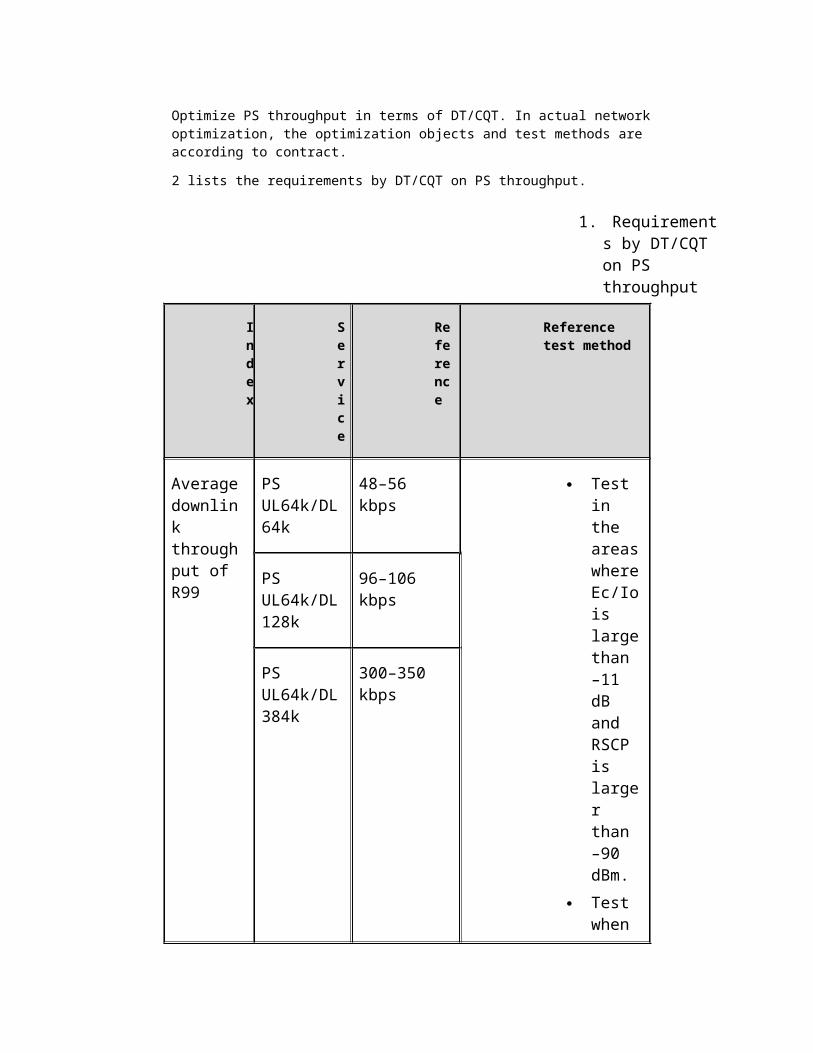
Optimize PS throughput in terms of DT/CQT. In actual network optimization, the optimization objects and test methods are according to contract.
2 lists the requirements by DT/CQT on PS throughput.
1. Requirements by DT/CQT on PS throughput
Index
Service
Reference
Reference test method
Averagedownlink throughput of R99
PS UL64k/DL64k
48–56 kbps
Test in the areaswhereEc/Iois largethan –11 dB and RSCP is larger than –90 dBm.
Test when
PS UL64k/DL128k
96–106 kbps
PS UL64k/DL384k
300–350 kbps
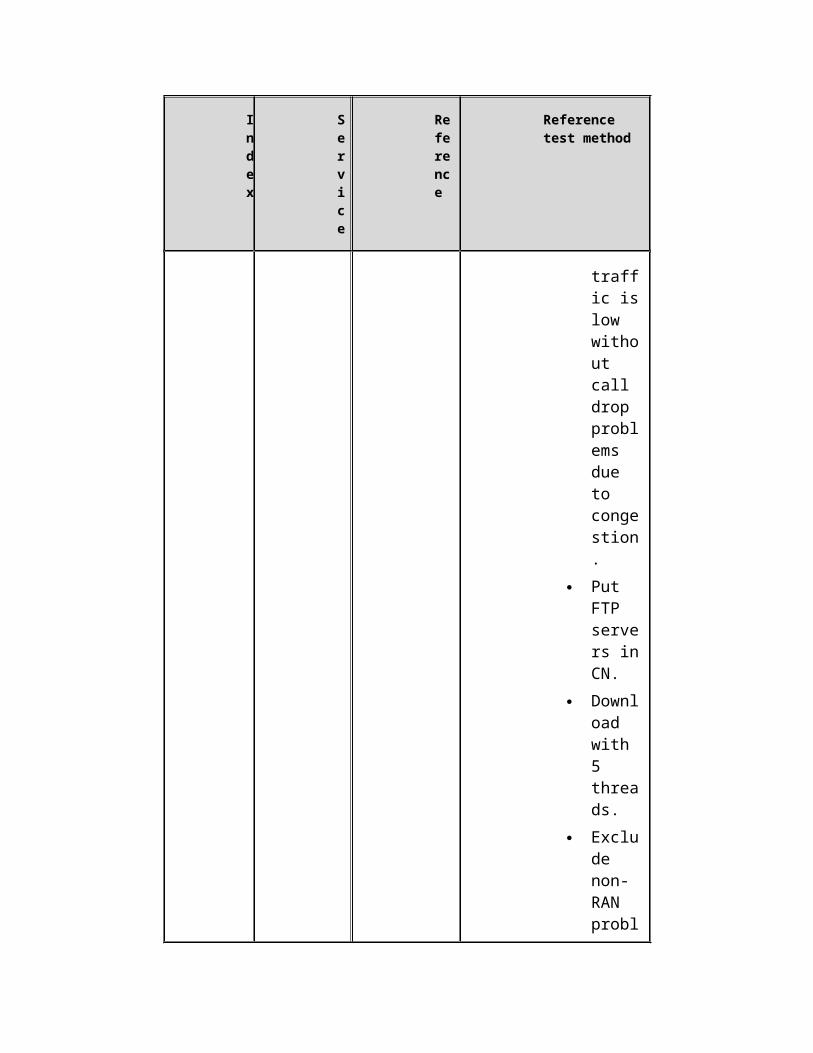
Index
Service
Reference
Reference test method
traffic islow without call drop problems due to congestion.
Put FTP servers inCN.
Download with 5 threads.
Exclude non-RAN probl
Index
Service
Reference
Reference test method
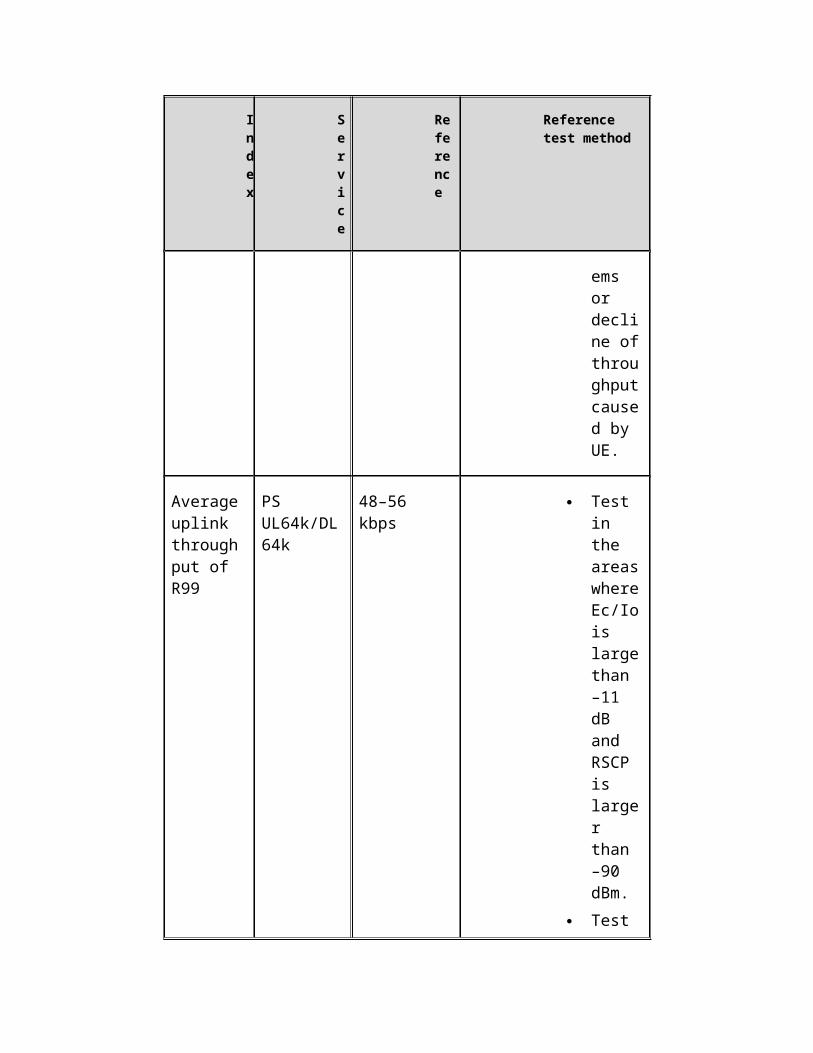
ems or decline ofthroughputcaused by UE.
Averageuplink throughput of R99
PS UL64k/DL64k
48–56 kbps
Test in the areaswhereEc/Iois largethan –11 dB and RSCP is larger than –90 dBm.
Test

Index
Service
Reference
Reference test method
when traffic islow (the uplink anddownlink load is not larger than planned load)without call drop problems due to congestion.
Put FTP
Index
Service
Reference
Reference test method
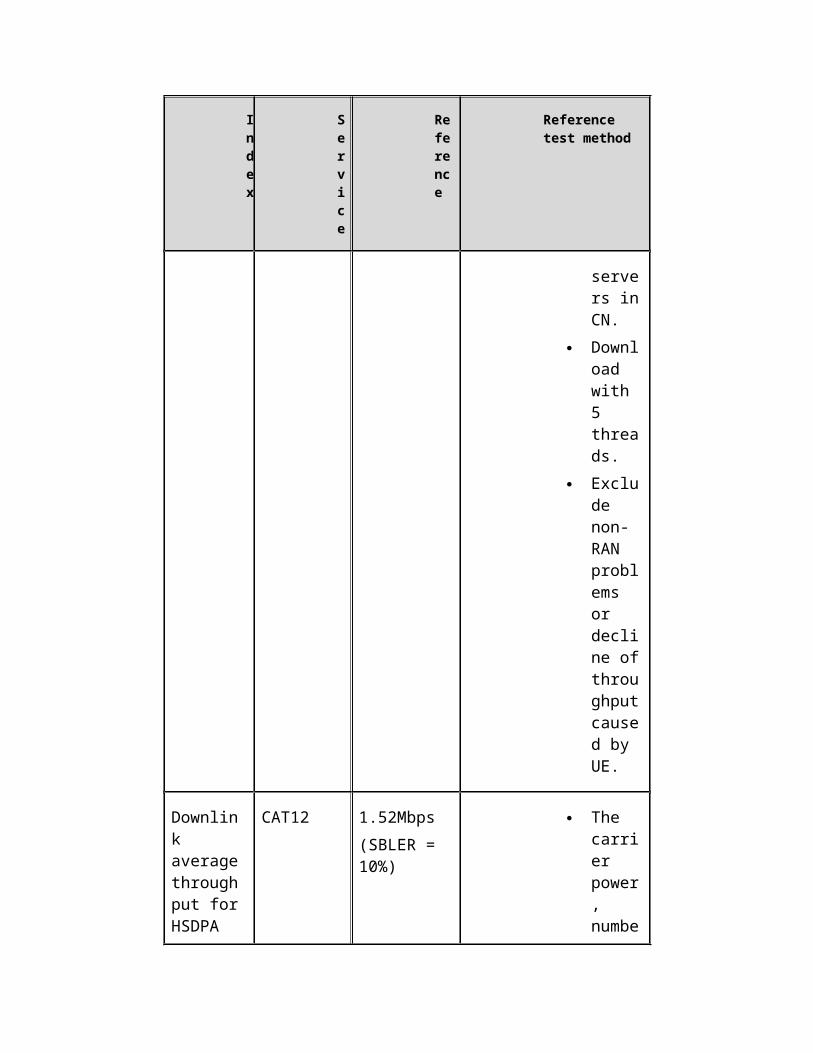
servers inCN.
Download with 5 threads.
Exclude non-RAN problems or decline ofthroughputcaused by UE.
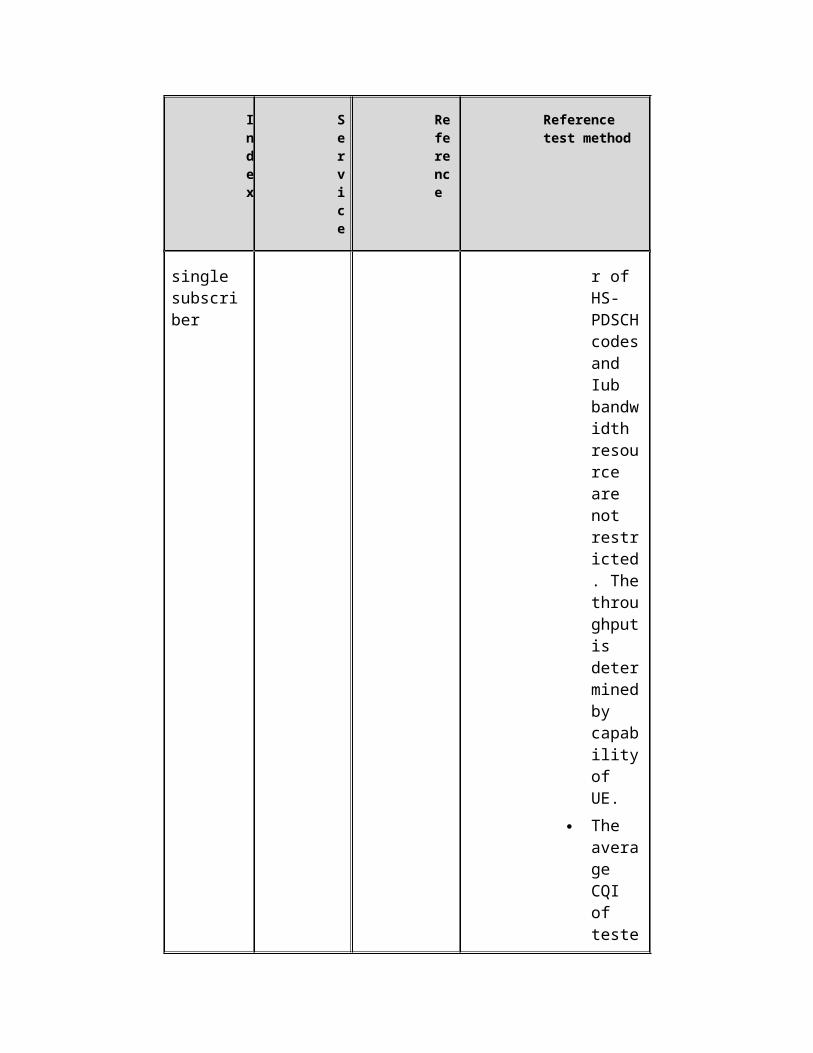
Downlink averagethroughput forHSDPA
CAT12 1.52Mbps(SBLER = 10%)
The carrier power, numbe
Index
Service
Reference
Reference test method
single subscriber
r of HS-PDSCHcodesand Iub bandwidth resource are not restricted. Thethroughputis determinedby capabilityof UE.
The average CQI of teste
Index
Service
Reference
Reference test method
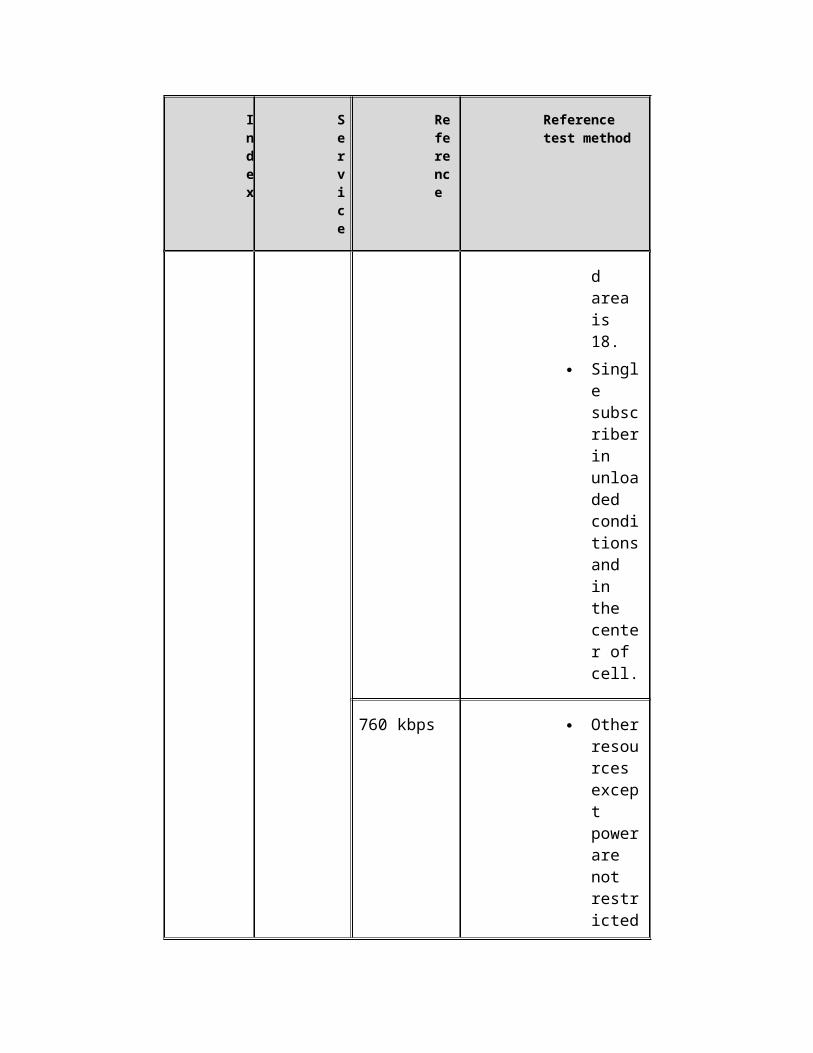
d area is 18.
Single subscriberin unloaded conditionsand in the center of cell.
760 kbps Otherresources except powerare not restricted
Index
Service
Reference
Reference test method
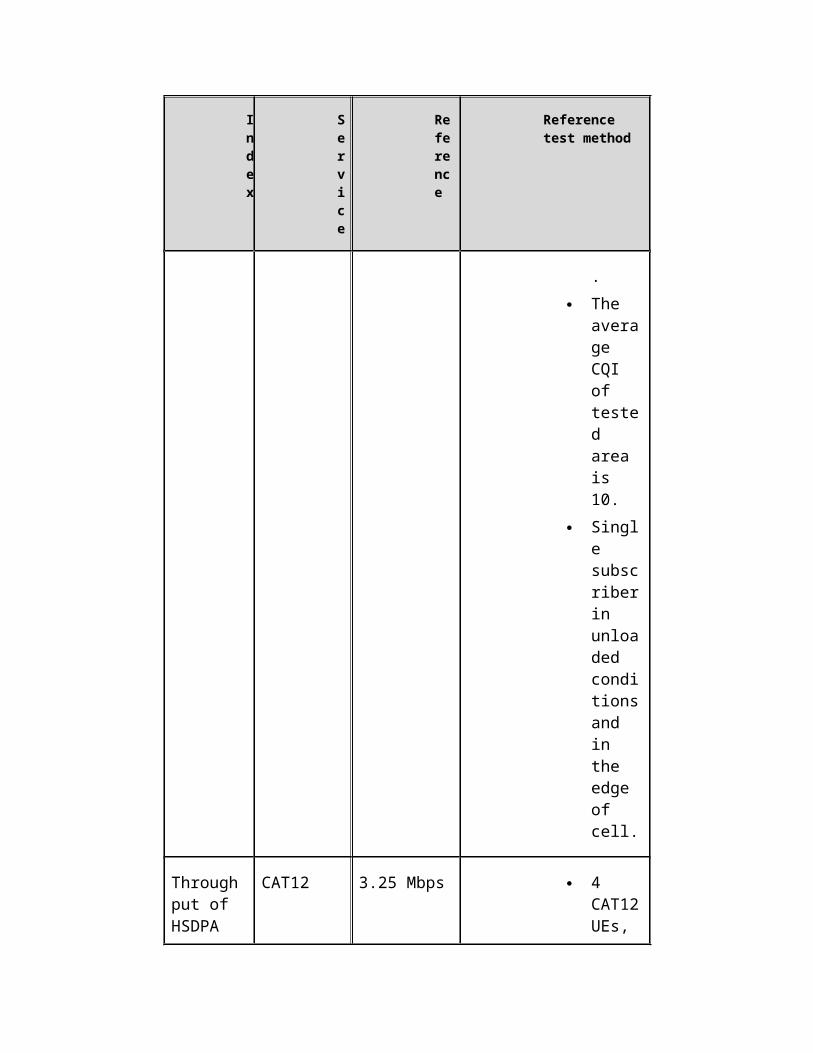
. The
average CQI of tested area is 10.
Single subscriberin unloaded conditionsand in the edge of cell.
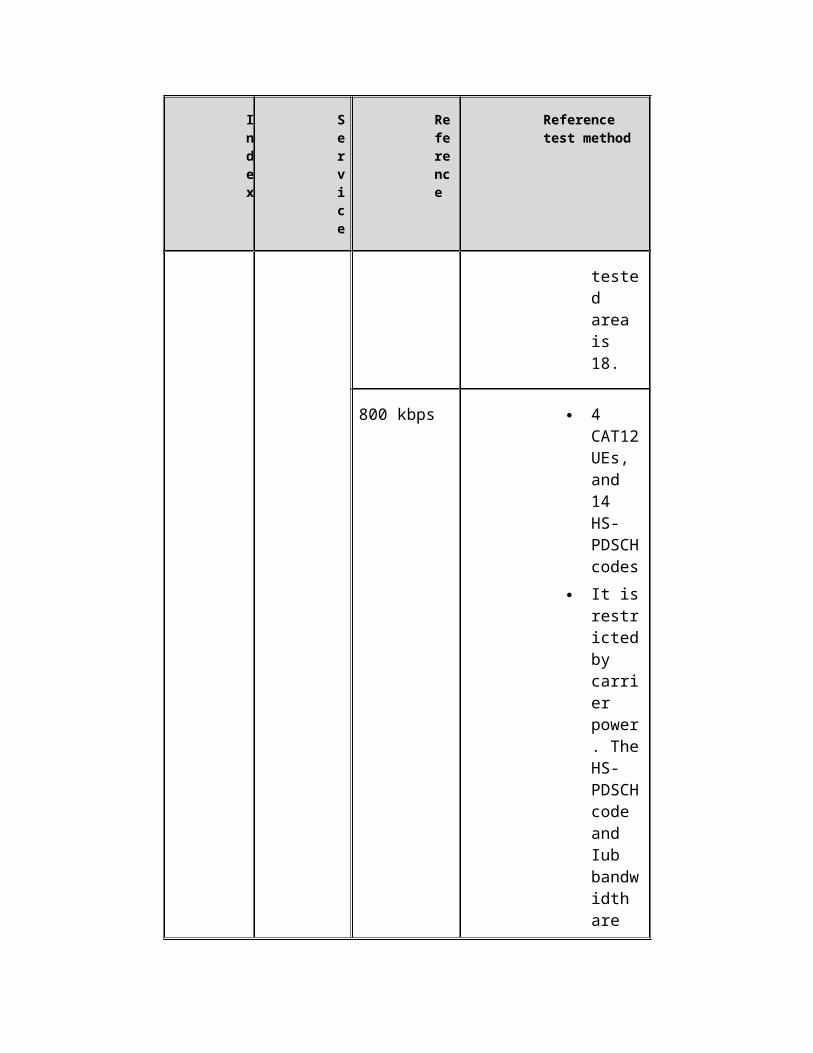
Throughput of HSDPA
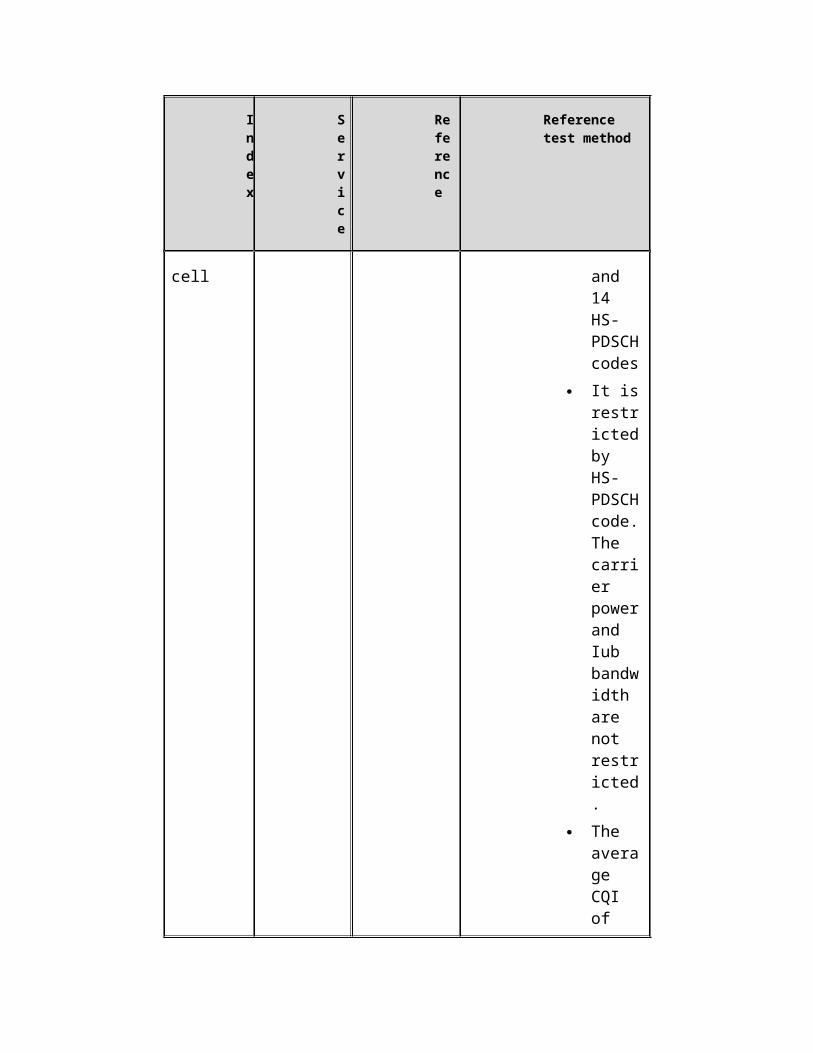
CAT12 3.25 Mbps 4 CAT12UEs,
Index
Service
Reference
Reference test method
cell and 14 HS-PDSCHcodes
It isrestrictedby HS-PDSCHcode.The carrier powerand Iub bandwidth are not restricted.
The average CQI of
Index
Service
Reference
Reference test method
tested area is 18.
800 kbps 4 CAT12UEs, and 14 HS-PDSCHcodes
It isrestrictedby carrier power. TheHS-PDSCHcode and Iub bandwidth are
Index
Service
Reference
Reference test method
not restricted.
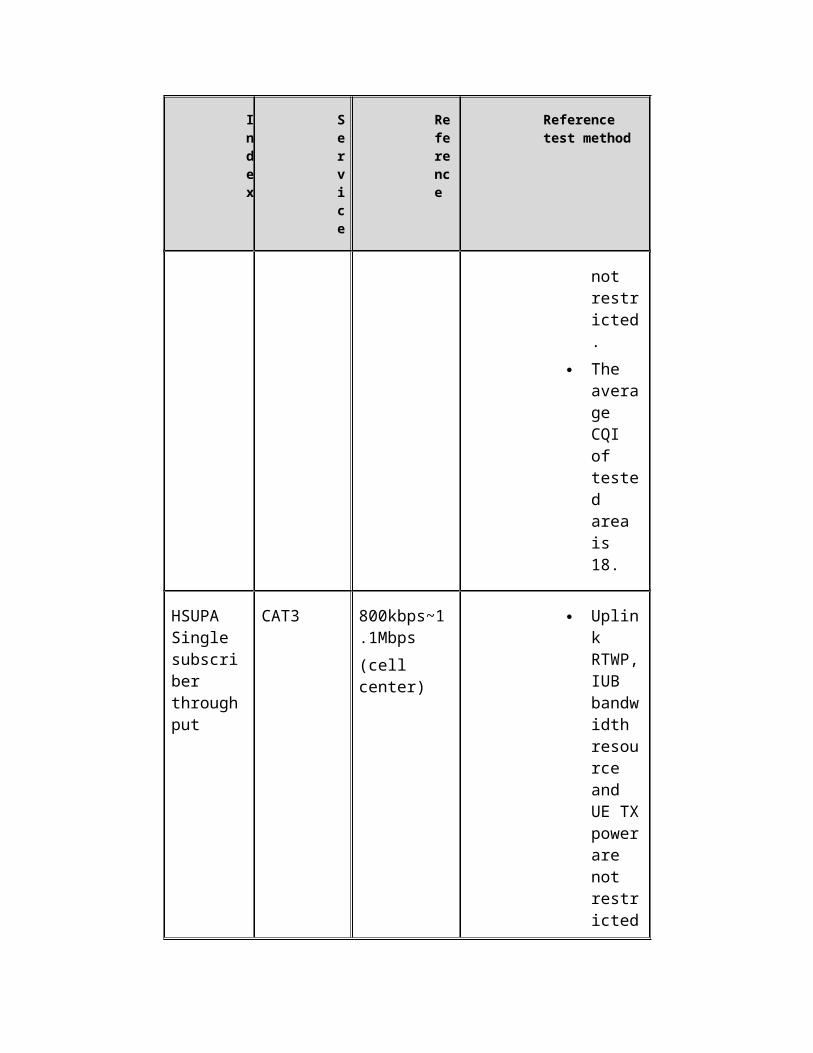
The average CQI of tested area is 18.
HSUPA Single subscriber throughput
CAT3 800kbps~1.1Mbps(cell center)
Uplink RTWP,IUB bandwidth resource and UE TXpowerare not restricted
Index
Service
Reference
Reference test method
. Pilot
power33dBm,RSCP>=-70dBm;
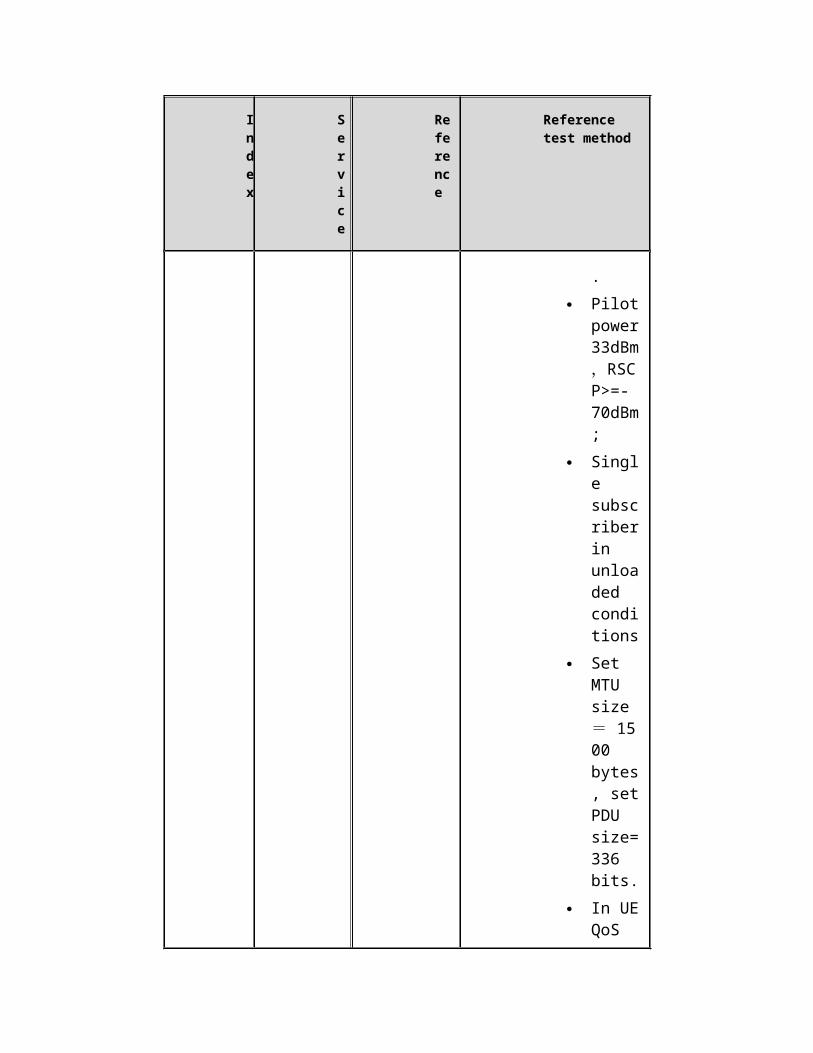
Single subscriberin unloaded conditions
Set MTU size= 1500 bytes, setPDU size=336 bits.
In UEQoS
Index
Service
Reference
Reference test method
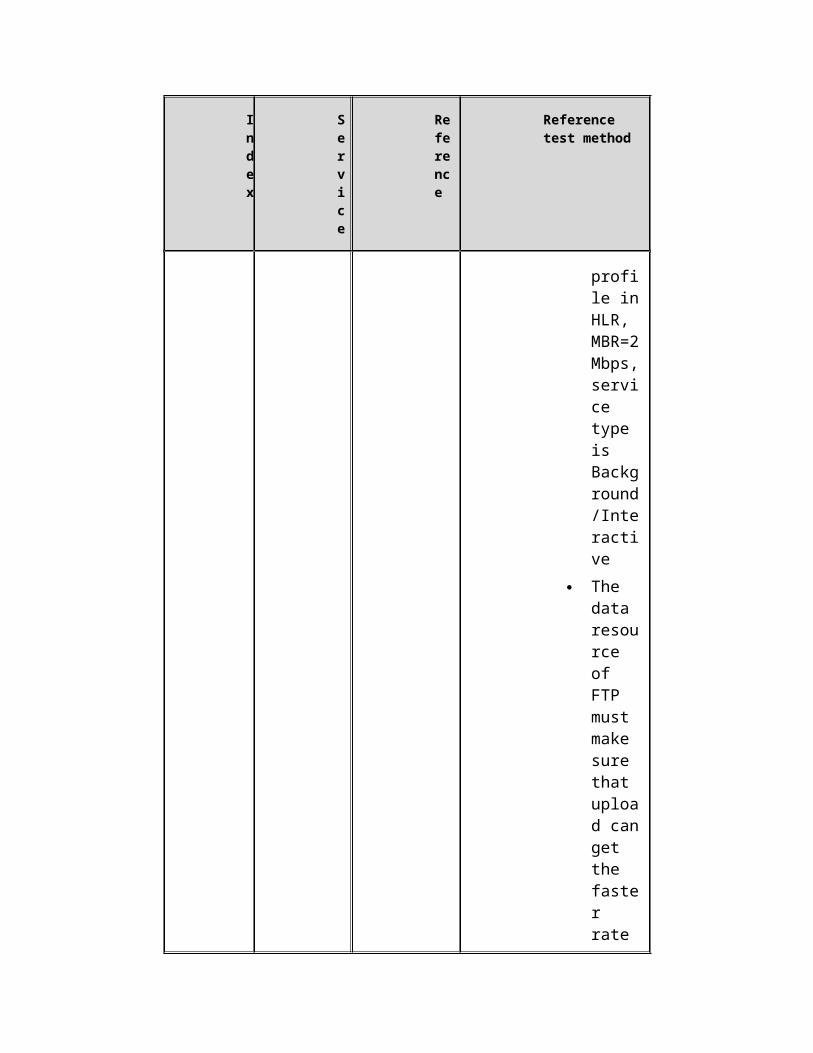
profile inHLR, MBR=2Mbps,service type is Background/Interactive
The data resource of FTP must make sure that upload canget the faster rate
Index
Service
Reference
Reference test method
in the wire connectionconditions.
Obtain thefaster rate,combine UEcapability, getAPP rate in the conditionsof uplink RTWP,IUB bandwidth
Index
Service
Reference
Reference test method
are not restricted.
200kbps~400kbps(cell edge)
Uplink RTWP,IUB bandwidth resource and UE TXpowerare not restricted.
Pilotpower33dBm,RSCP>=-100dBm;
Singl
Index
Service
Reference
Reference test method
e subscriberin unloaded conditions
set MTU = 1500 bytes, setPDU =336 bits
In UEQoS profile inHLR, MBR=2Mbps,service type is Background
Index
Service
Reference
Reference test method
/Interactive
The data resource of FTP must make sure that upload canget the fast rate in the wire connectionconditions.
Get the fast
Index
Service
Reference
Reference test method
rate , combine UEcapability, getAPP rate in the conditionsof uplink RTWP,IUB bandwidth are not restricted.
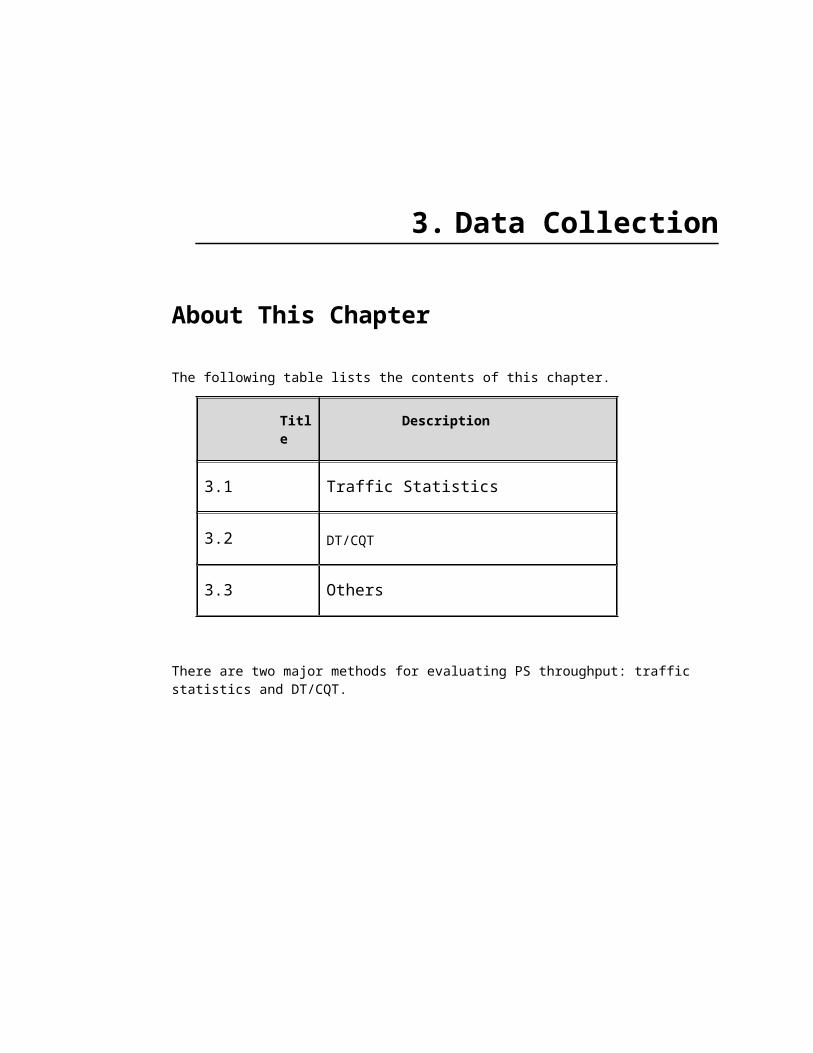
3. Data Collection
About This Chapter
The following table lists the contents of this chapter.
Title
Description
3.1 Traffic Statistics
3.2 DT/CQT
3.3 Others
There are two major methods for evaluating PS throughput: traffic statistics and DT/CQT.
1. Traffic StatisticsFor collecting traffic statistics data, see W-Equipment Room Operations Guide.
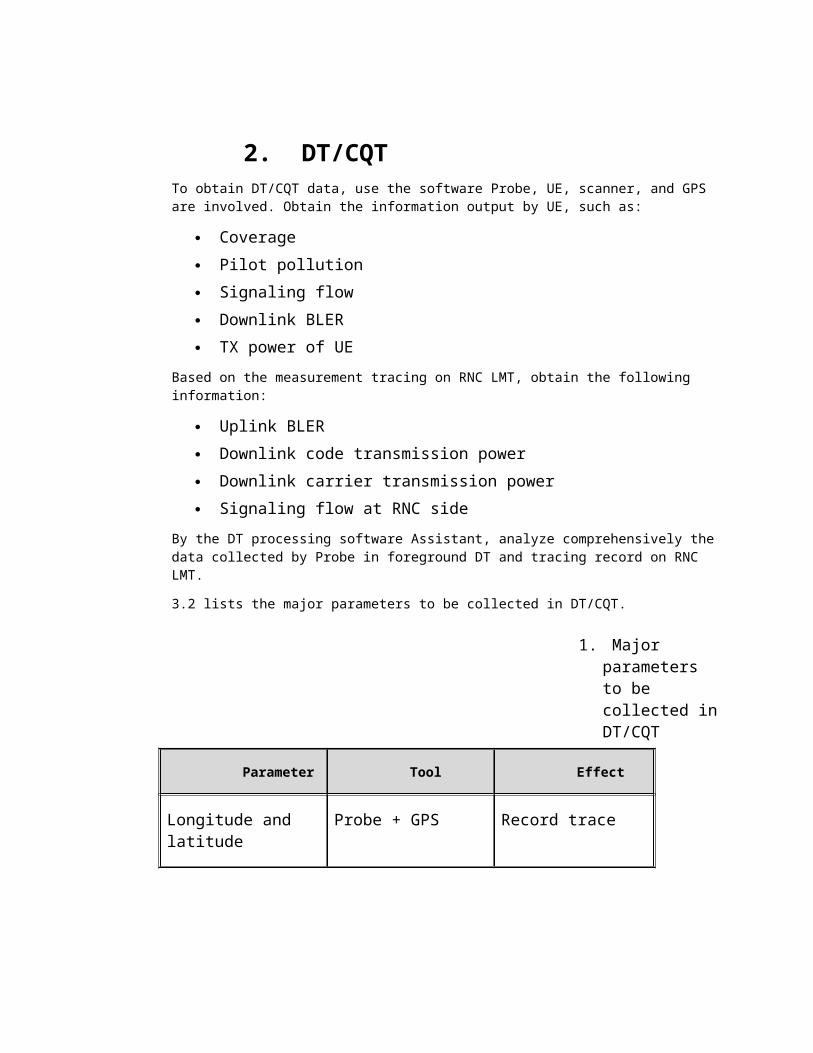
2. DT/CQTTo obtain DT/CQT data, use the software Probe, UE, scanner, and GPS are involved. Obtain the information output by UE, such as:
Coverage Pilot pollution Signaling flow Downlink BLER TX power of UE
Based on the measurement tracing on RNC LMT, obtain the following information:
Uplink BLER Downlink code transmission power Downlink carrier transmission power Signaling flow at RNC side
By the DT processing software Assistant, analyze comprehensively thedata collected by Probe in foreground DT and tracing record on RNC LMT.
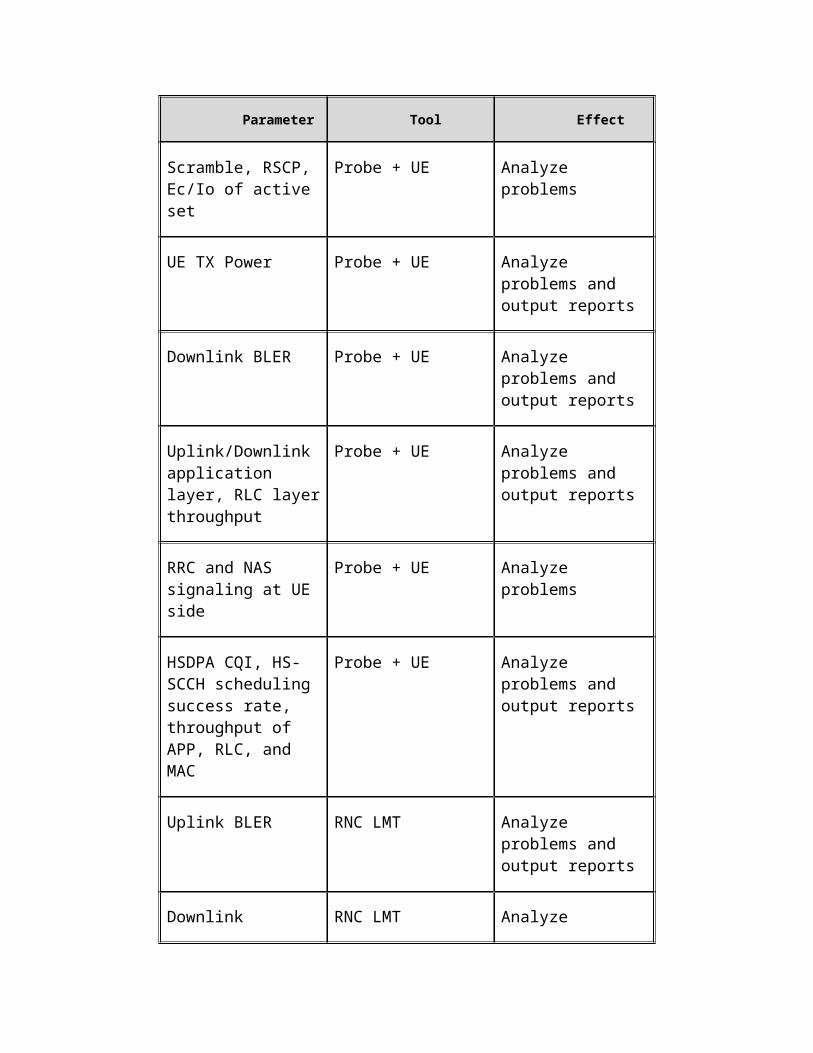
3.2 lists the major parameters to be collected in DT/CQT.
1. Major parameters to be collected inDT/CQT
Parameter Tool Effect
Longitude and latitude
Probe + GPS Record trace
Parameter Tool Effect
Scramble, RSCP, Ec/Io of active set
Probe + UE Analyze problems
UE TX Power Probe + UE Analyze problems and output reports
Downlink BLER Probe + UE Analyze problems and output reports
Uplink/Downlink application layer, RLC layerthroughput
Probe + UE Analyze problems and output reports
RRC and NAS signaling at UE side
Probe + UE Analyze problems
HSDPA CQI, HS-SCCH scheduling success rate, throughput of APP, RLC, and MAC
Probe + UE Analyze problems and output reports
Uplink BLER RNC LMT Analyze problems and output reports
Downlink RNC LMT Analyze
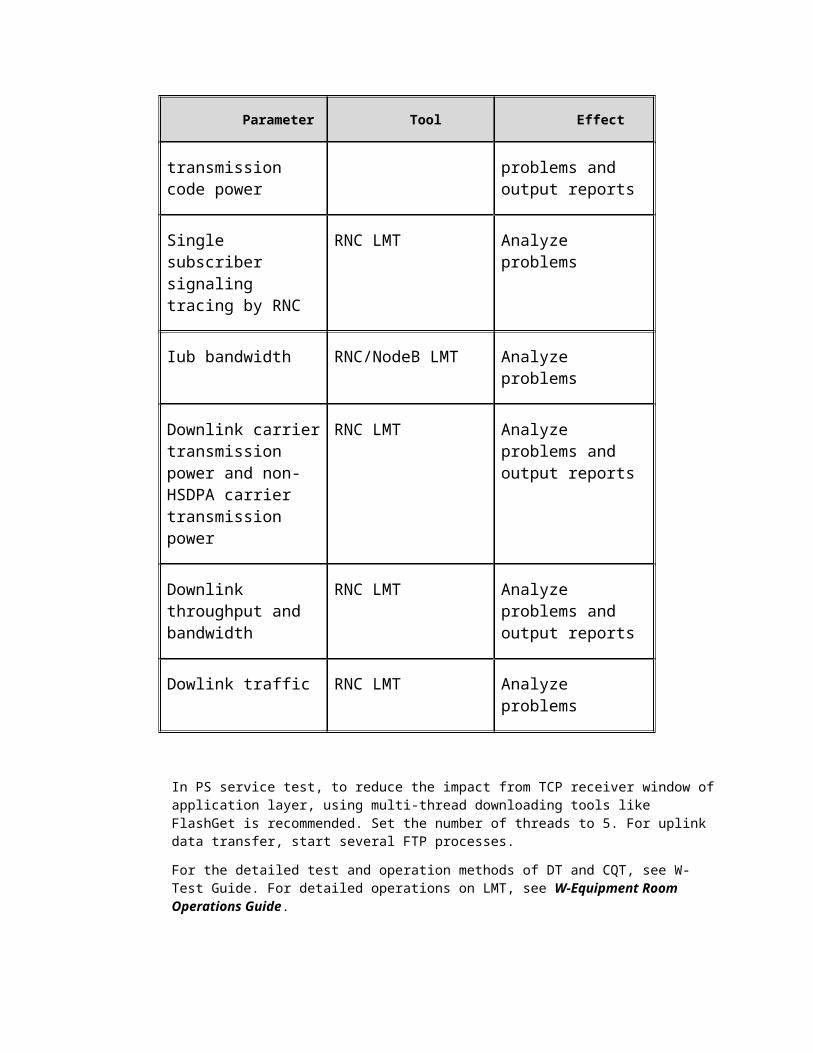
Parameter Tool Effect
transmission code power
problems and output reports
Single subscriber signaling tracing by RNC
RNC LMT Analyze problems
Iub bandwidth RNC/NodeB LMT Analyze problems
Downlink carriertransmission power and non-HSDPA carrier transmission power
RNC LMT Analyze problems and output reports
Downlink throughput and bandwidth
RNC LMT Analyze problems and output reports
Dowlink traffic RNC LMT Analyze problems
In PS service test, to reduce the impact from TCP receiver window ofapplication layer, using multi-thread downloading tools like FlashGet is recommended. Set the number of threads to 5. For uplink data transfer, start several FTP processes.
For the detailed test and operation methods of DT and CQT, see W-Test Guide. For detailed operations on LMT, see W-Equipment Room Operations Guide.
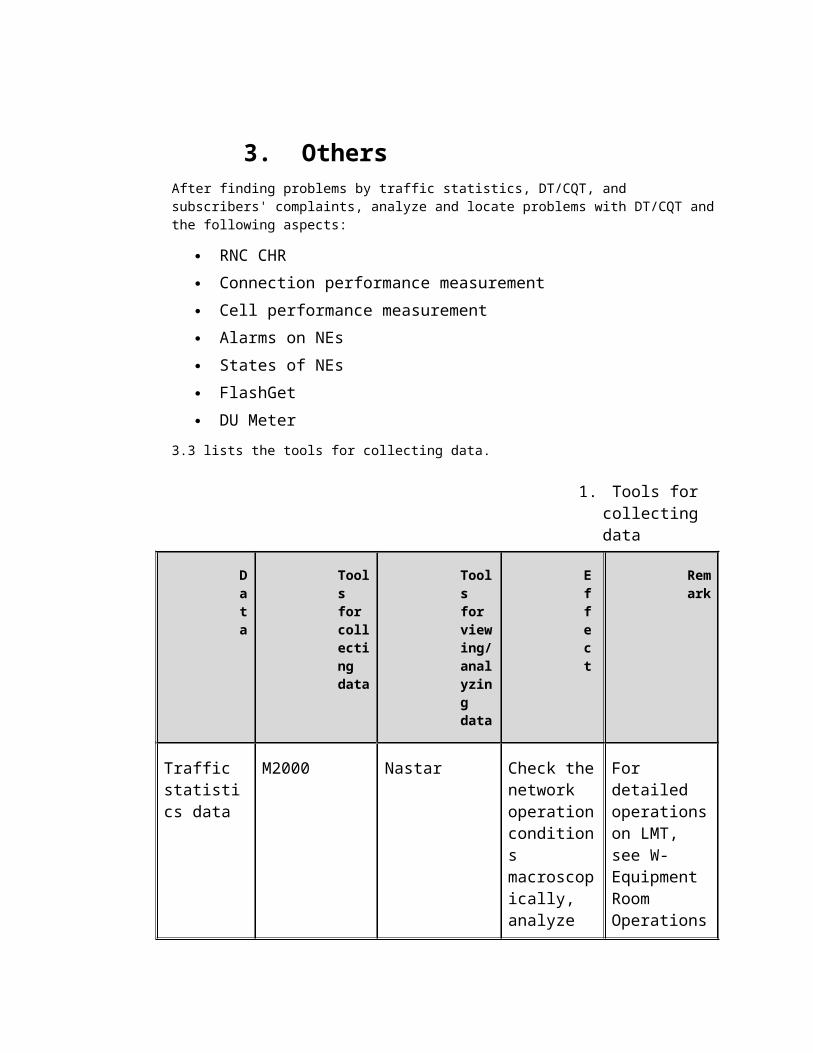
3. OthersAfter finding problems by traffic statistics, DT/CQT, and subscribers' complaints, analyze and locate problems with DT/CQT andthe following aspects:
RNC CHR Connection performance measurement Cell performance measurement Alarms on NEs States of NEs FlashGet DU Meter
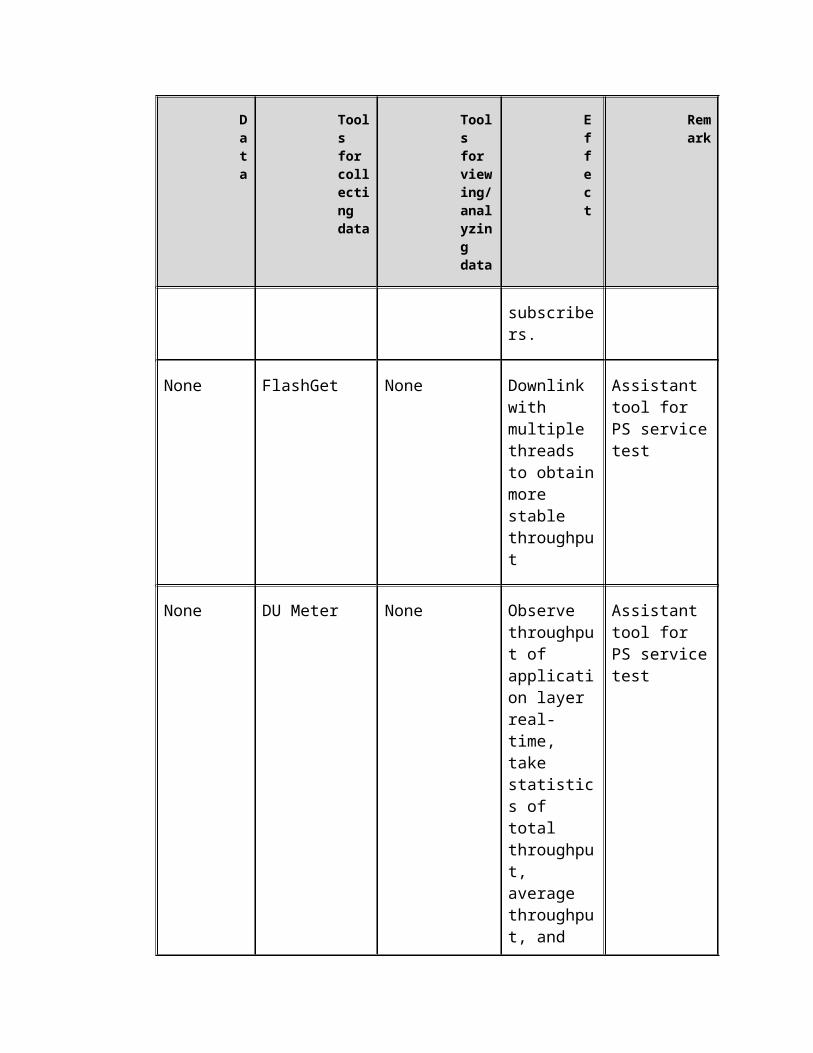
3.3 lists the tools for collecting data.
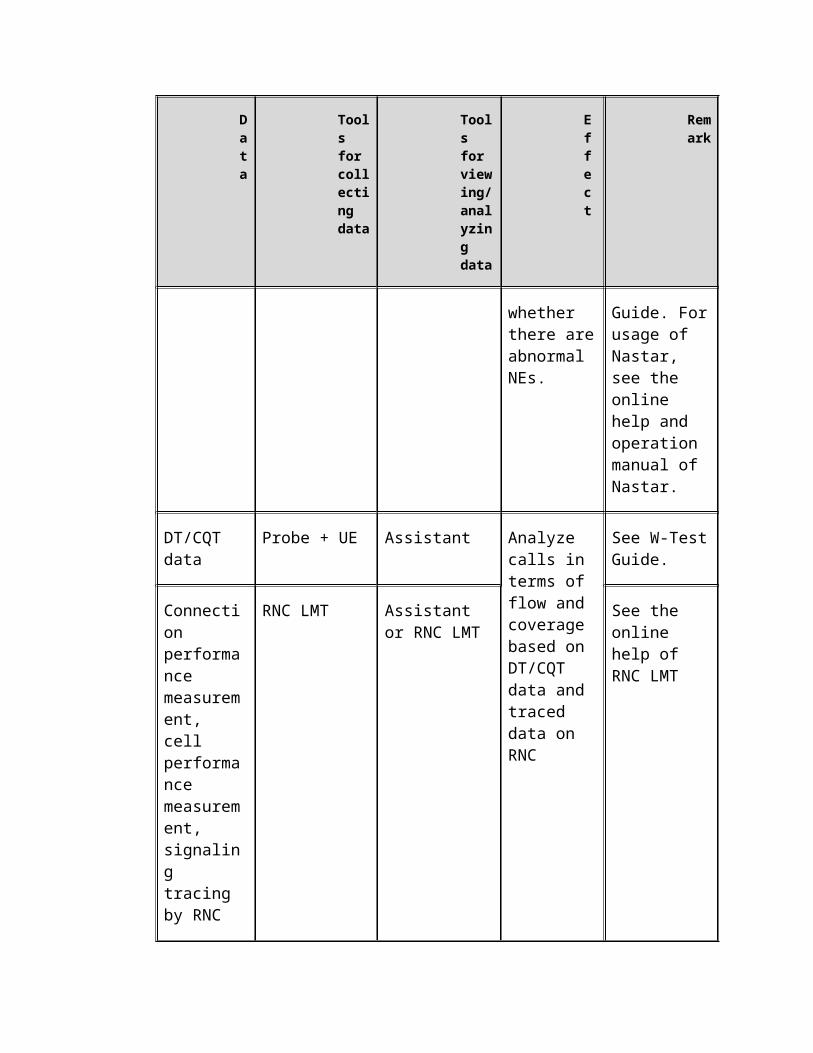
1. Tools for collecting data
Data
Tools for collecting data
Tools for viewing/analyzing data
Effect
Remark
Traffic statistics data
M2000 Nastar Check thenetwork operationconditions macroscopically, analyze
For detailed operationson LMT, see W-Equipment Room Operations
Data
Tools for collecting data
Tools for viewing/analyzing data
Effect
Remark
whether there areabnormal NEs.
Guide. Forusage of Nastar, see the online help and operation manual of Nastar.
DT/CQT data
Probe + UE Assistant Analyze calls in terms of flow and coverage based on DT/CQT data and traced data on RNC
See W-TestGuide.
Connection performance measurement, cell performance measurement, signaling tracing by RNC
RNC LMT Assistant or RNC LMT
See the online help of RNC LMT

Data
Tools for collecting data
Tools for viewing/analyzing data
Effect
Remark
Alarm M2000 or RNC LMT
M2000 or RNC LMT
Check alarms whether there areabnormal NEs
CHR RNC LMT Nastar or RNC InsightPlus
Record historic record ofabnormal calls forall subscribers, help to locateproblems.For subscribers' complaints, analyzingCHR helpsto find the problem happeningto
Data
Tools for collecting data
Tools for viewing/analyzing data
Effect
Remark
subscribers.
None FlashGet None Downlink with multiple threads to obtainmore stable throughput
Assistant tool for PS servicetest
None DU Meter None Observe throughput of application layer real-time, take statistics of total throughput, average throughput, and
Assistant tool for PS servicetest
Data
Tools for collecting data
Tools for viewing/analyzing data
Effect
Remark
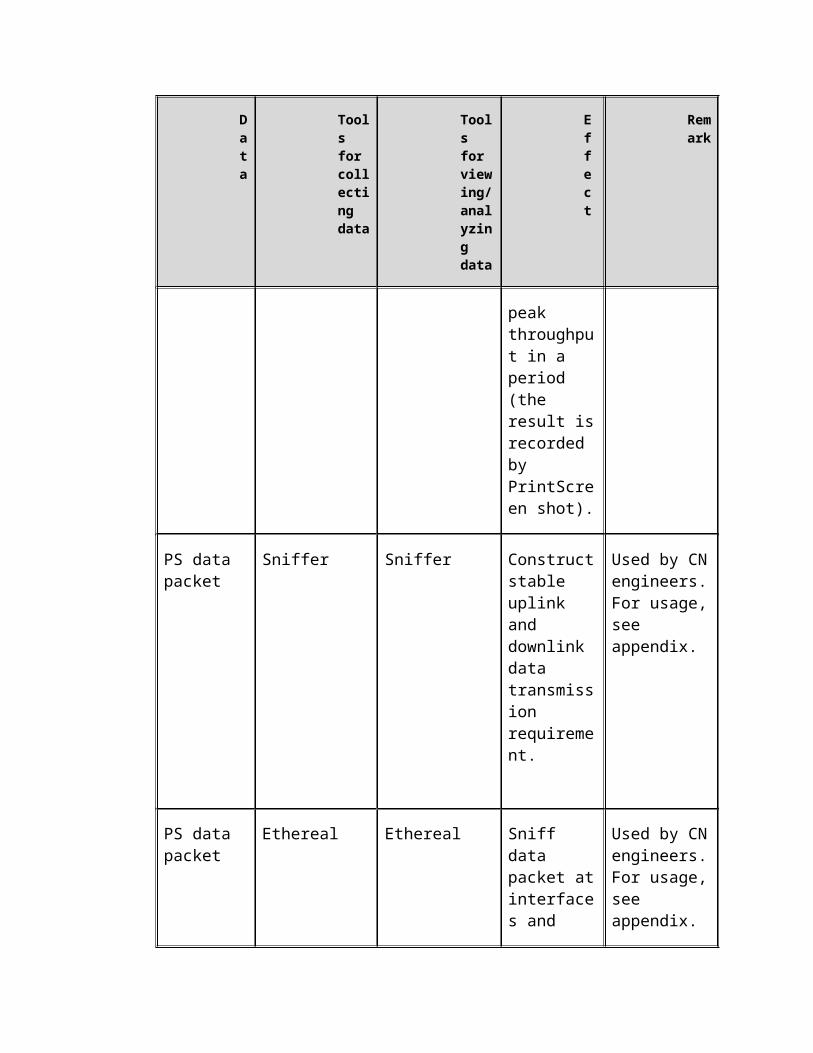
peak throughput in a period (the result isrecorded by PrintScreen shot).
PS data packet
Sniffer Sniffer Constructstable uplink and downlink data transmission requirement.
Used by CNengineers.For usage,see appendix.
PS data packet
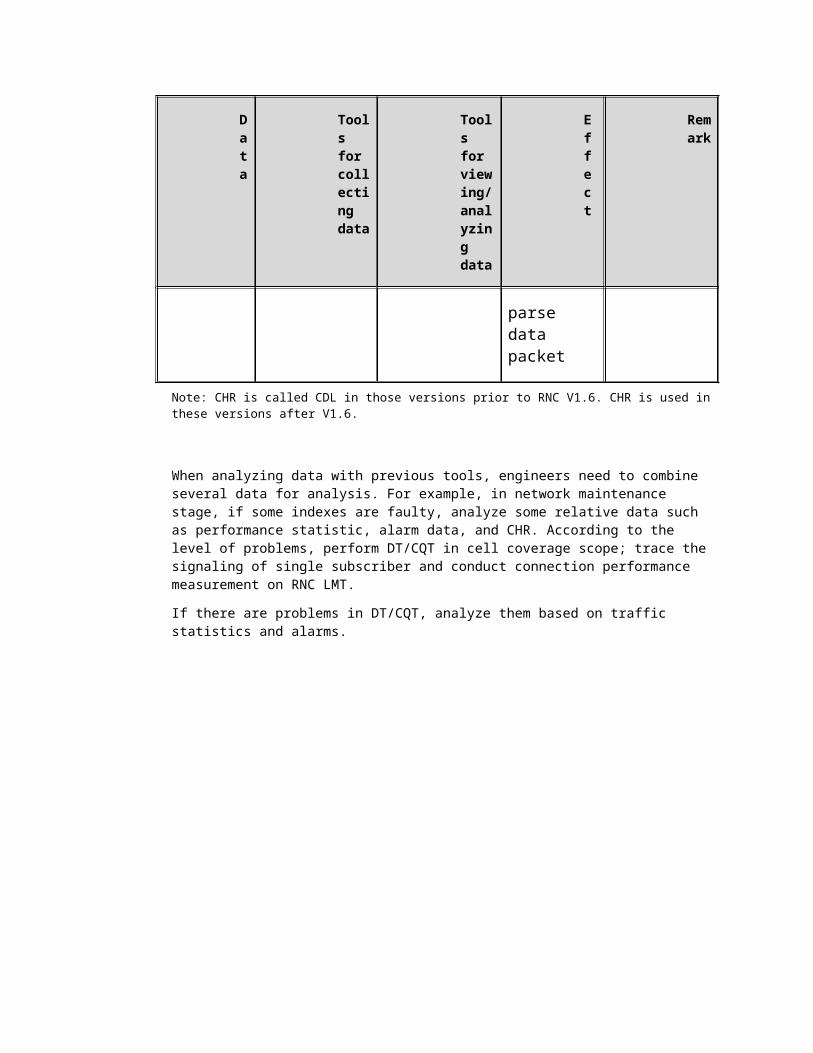
Ethereal Ethereal Sniff data packet atinterfaces and
Used by CNengineers.For usage,see appendix.
Data
Tools for collecting data
Tools for viewing/analyzing data
Effect
Remark
parse data packet
Note: CHR is called CDL in those versions prior to RNC V1.6. CHR is used in these versions after V1.6.
When analyzing data with previous tools, engineers need to combine several data for analysis. For example, in network maintenance stage, if some indexes are faulty, analyze some relative data such as performance statistic, alarm data, and CHR. According to the level of problems, perform DT/CQT in cell coverage scope; trace the signaling of single subscriber and conduct connection performance measurement on RNC LMT.
If there are problems in DT/CQT, analyze them based on traffic statistics and alarms.
4. Analysis of TrafficStatistics Data
About This Chapter
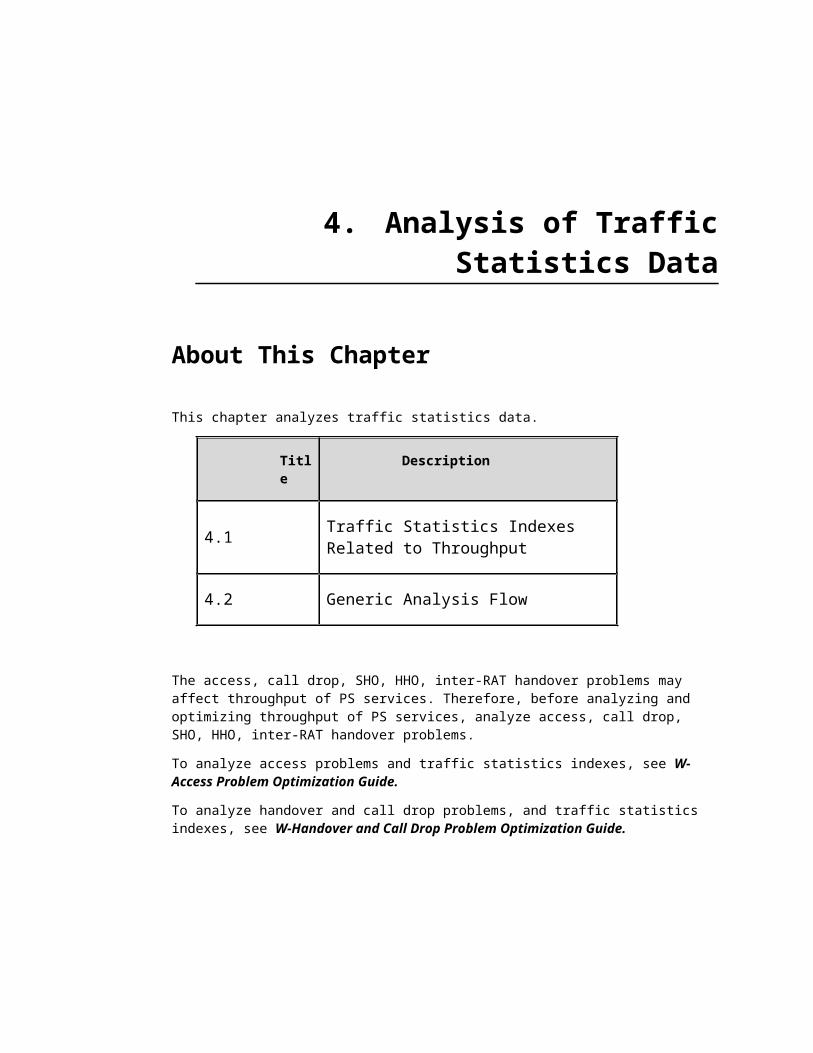
This chapter analyzes traffic statistics data.
Title
Description
4.1 Traffic Statistics Indexes Related to Throughput
4.2 Generic Analysis Flow
The access, call drop, SHO, HHO, inter-RAT handover problems may affect throughput of PS services. Therefore, before analyzing and optimizing throughput of PS services, analyze access, call drop, SHO, HHO, inter-RAT handover problems.
To analyze access problems and traffic statistics indexes, see W-Access Problem Optimization Guide.
To analyze handover and call drop problems, and traffic statistics indexes, see W-Handover and Call Drop Problem Optimization Guide.
1. Traffic Statistics Indexes Related to Throughput
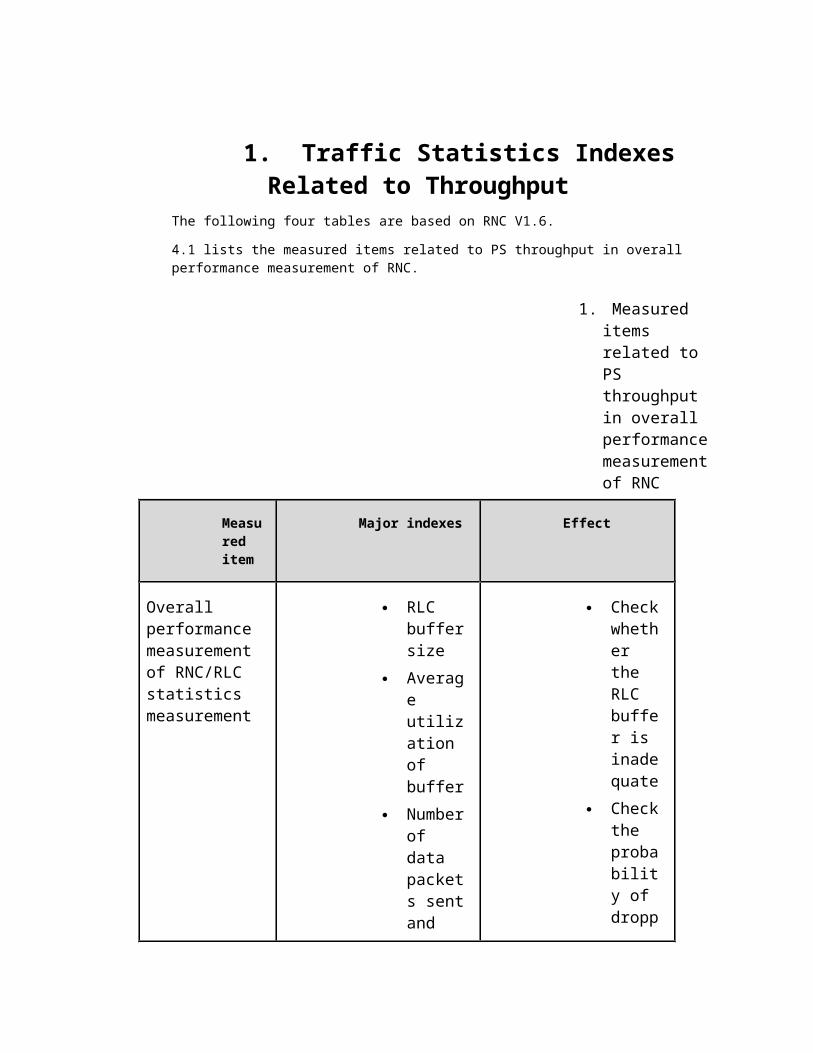
The following four tables are based on RNC V1.6.
4.1 lists the measured items related to PS throughput in overall performance measurement of RNC.
1. Measured items related to PS throughput in overall performance measurement of RNC
Measured item
Major indexes Effect
Overall performance measurement of RNC/RLC statistics measurement
RLC buffersize
Average utilization of buffer
Numberof data packets sentand
Checkwhether the RLC buffer is inadequate
Checkthe probability of dropp
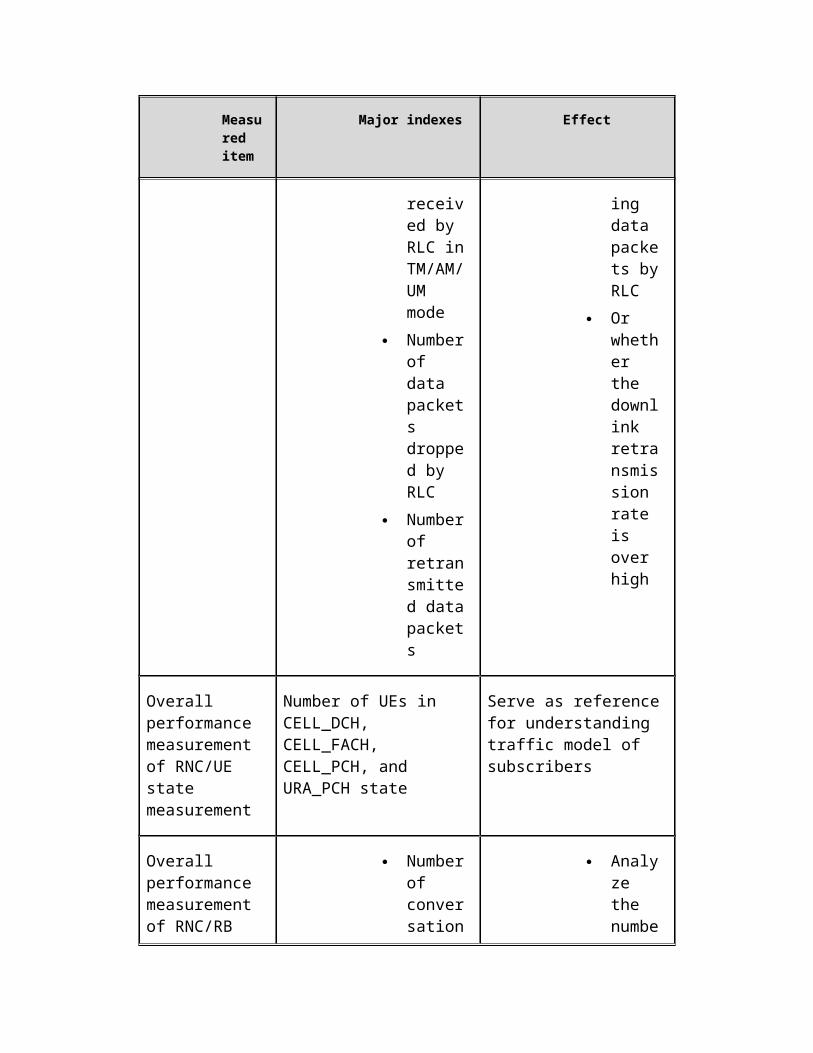
Measured item
Major indexes Effect
received by RLC inTM/AM/UM mode
Numberof data packets dropped by RLC
Numberof retransmitted datapackets
ing data packets byRLC
Or whether the downlink retransmission rate is over high
Overall performance measurement of RNC/UE state measurement
Number of UEs in CELL_DCH, CELL_FACH, CELL_PCH, and URA_PCH state
Serve as referencefor understanding traffic model of subscribers
Overall performance measurement of RNC/RB
Numberof conversation
Analyze the numbe
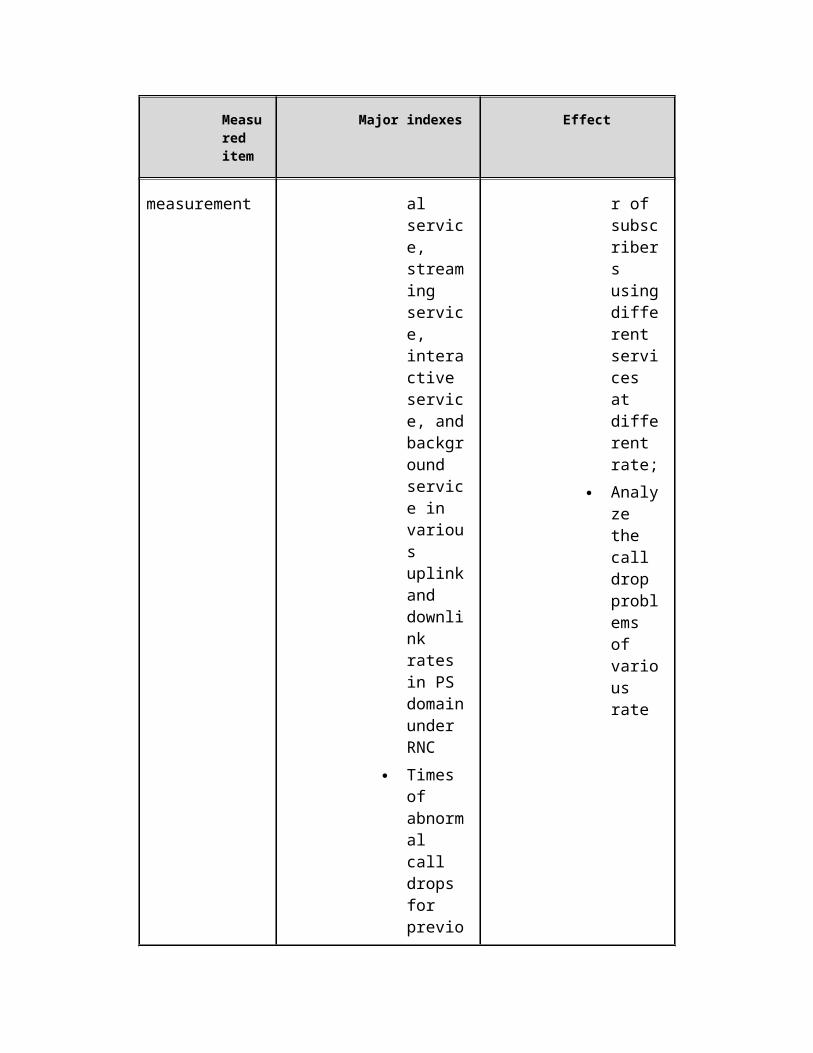
Measured item
Major indexes Effect
measurement al service, streaming service, interactive service, andbackground service in various uplinkand downlink rates in PS domainunder RNC
Times of abnormal call drops for previo
r of subscribers usingdifferent services at different rate;
Analyze the call drop problems of various rate
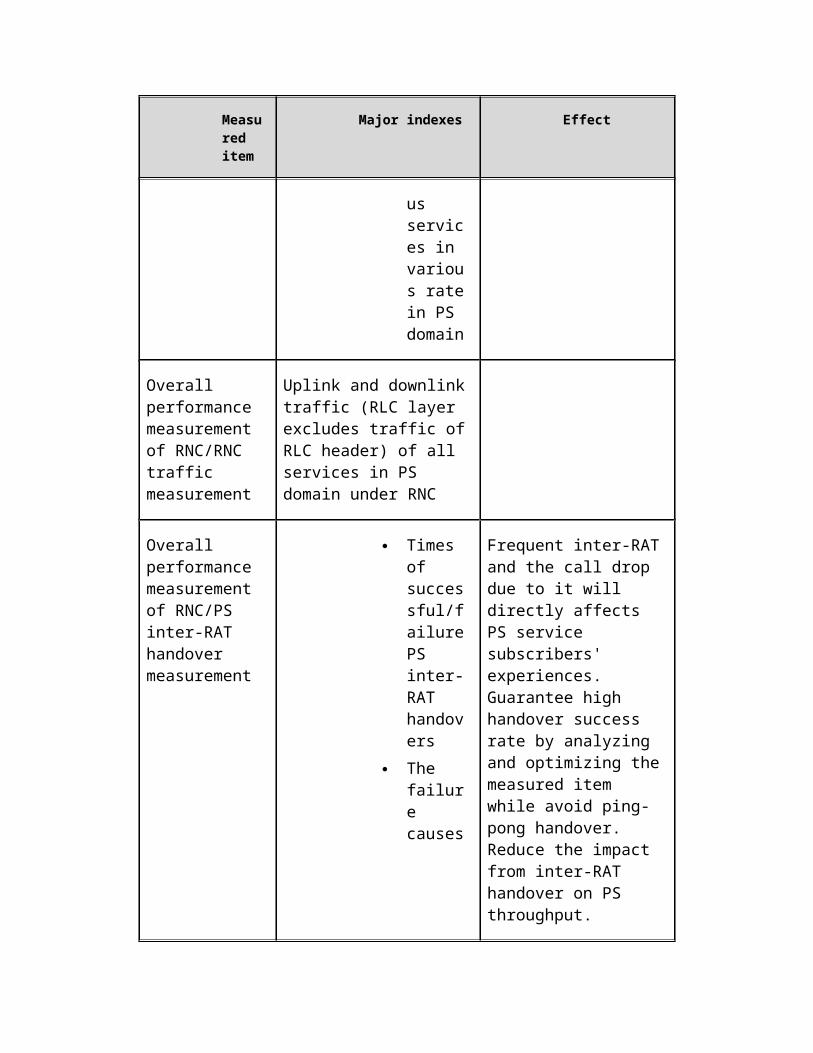
Measured item
Major indexes Effect
us services in various ratein PS domain
Overall performance measurement of RNC/RNC traffic measurement
Uplink and downlinktraffic (RLC layer excludes traffic ofRLC header) of all services in PS domain under RNC
Overall performance measurement of RNC/PS inter-RAT handover measurement
Times of successful/failurePS inter-RAT handovers
The failure causes
Frequent inter-RATand the call drop due to it will directly affects PS service subscribers' experiences. Guarantee high handover success rate by analyzing and optimizing themeasured item while avoid ping-pong handover. Reduce the impact from inter-RAT handover on PS throughput.
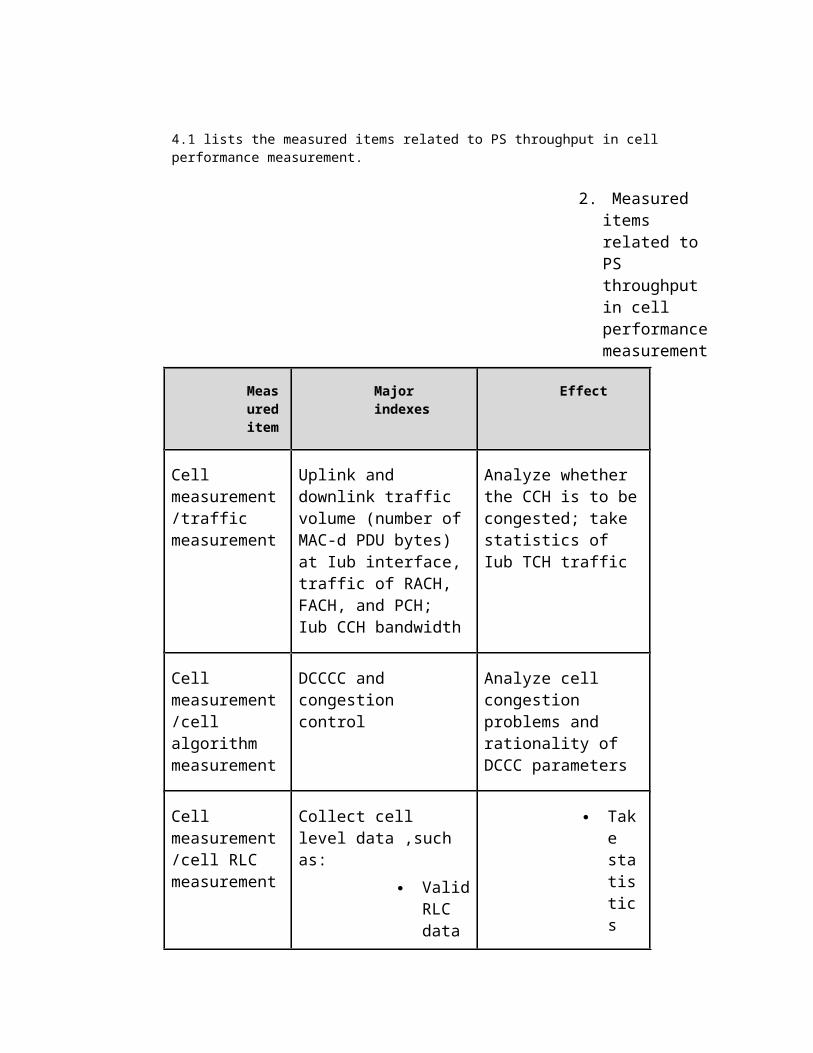
4.1 lists the measured items related to PS throughput in cell performance measurement.
2. Measured items related to PS throughput in cell performance measurement
Measureditem
Major indexes
Effect
Cell measurement/traffic measurement
Uplink and downlink traffic volume (number ofMAC-d PDU bytes) at Iub interface,traffic of RACH, FACH, and PCH; Iub CCH bandwidth
Analyze whether the CCH is to becongested; take statistics of Iub TCH traffic
Cell measurement/cell algorithm measurement
DCCCC and congestion control
Analyze cell congestion problems and rationality of DCCC parameters
Cell measurement/cell RLC measurement
Collect cell level data ,such as:
ValidRLC data
Take statistics
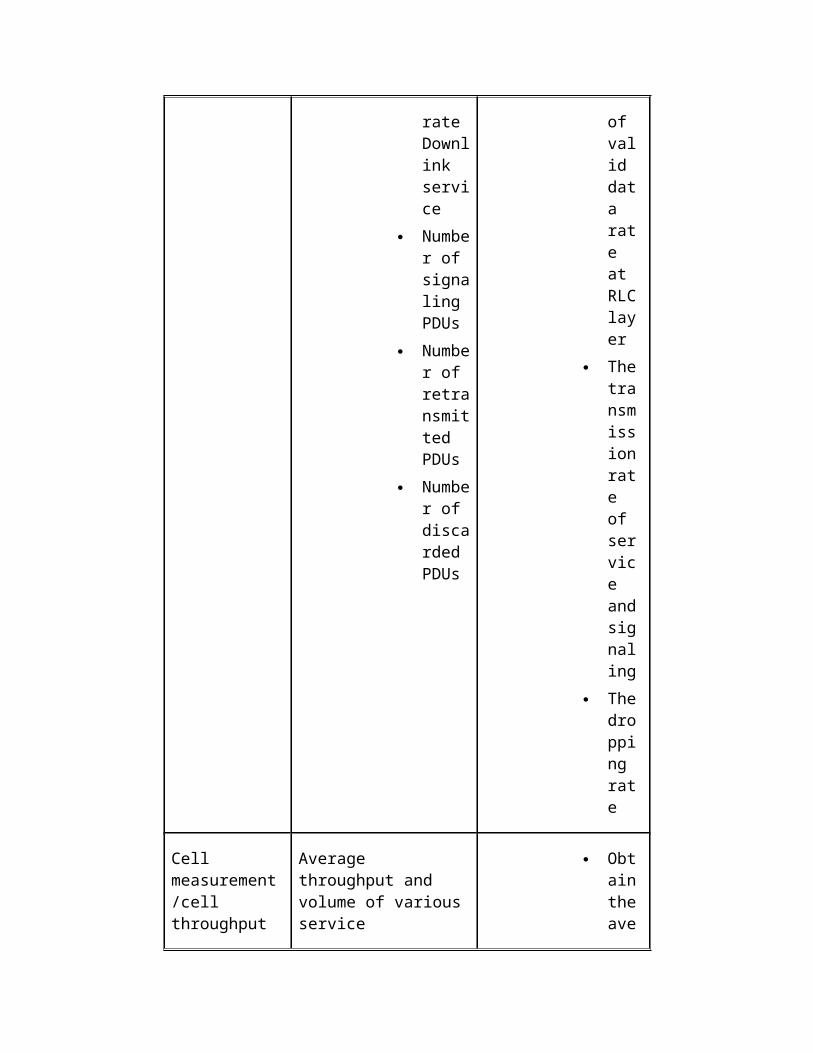
rate Downlink service
Number of signaling PDUs
Number of retransmitted PDUs
Number of discarded PDUs
of valid data rate at RLClayer
Thetransmissionrate of service andsignaling
Thedropping rate
Cell measurement/cell throughput
Average throughput and volume of variousservice
Obtaintheave
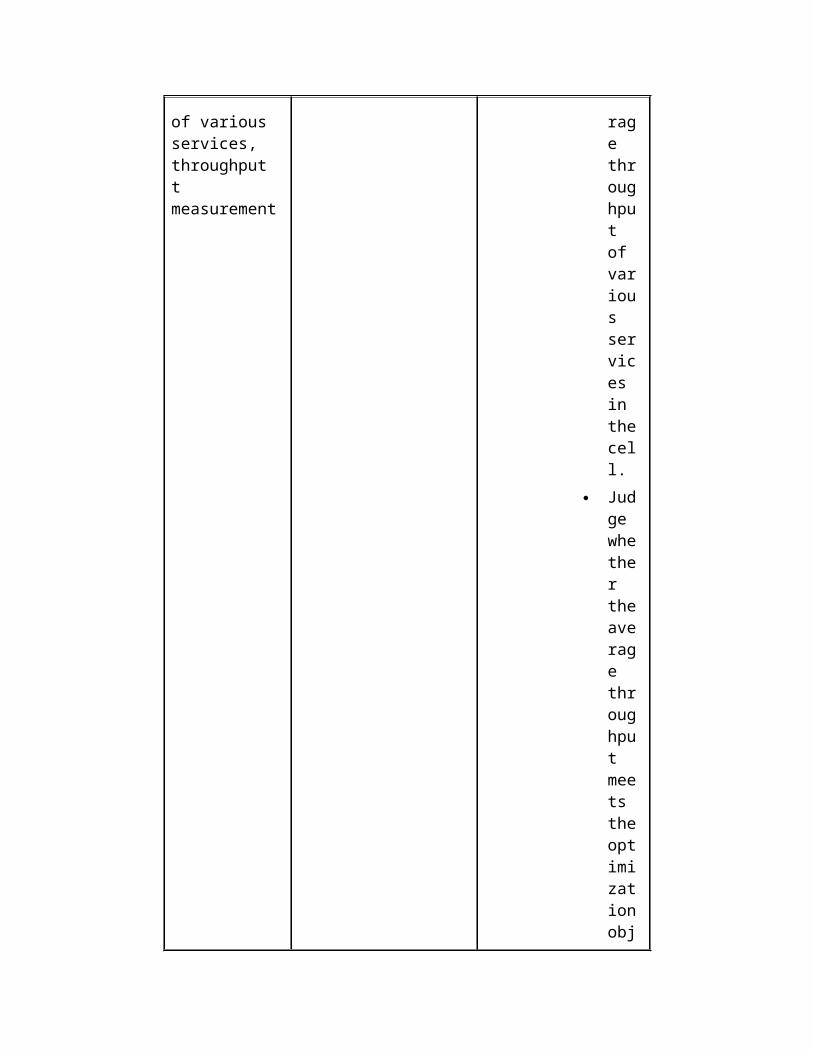
of various services, throughput t measurement
rage throughput of various services in thecell.
Judge whether theaverage throughput meets theoptimizationobj
ectives
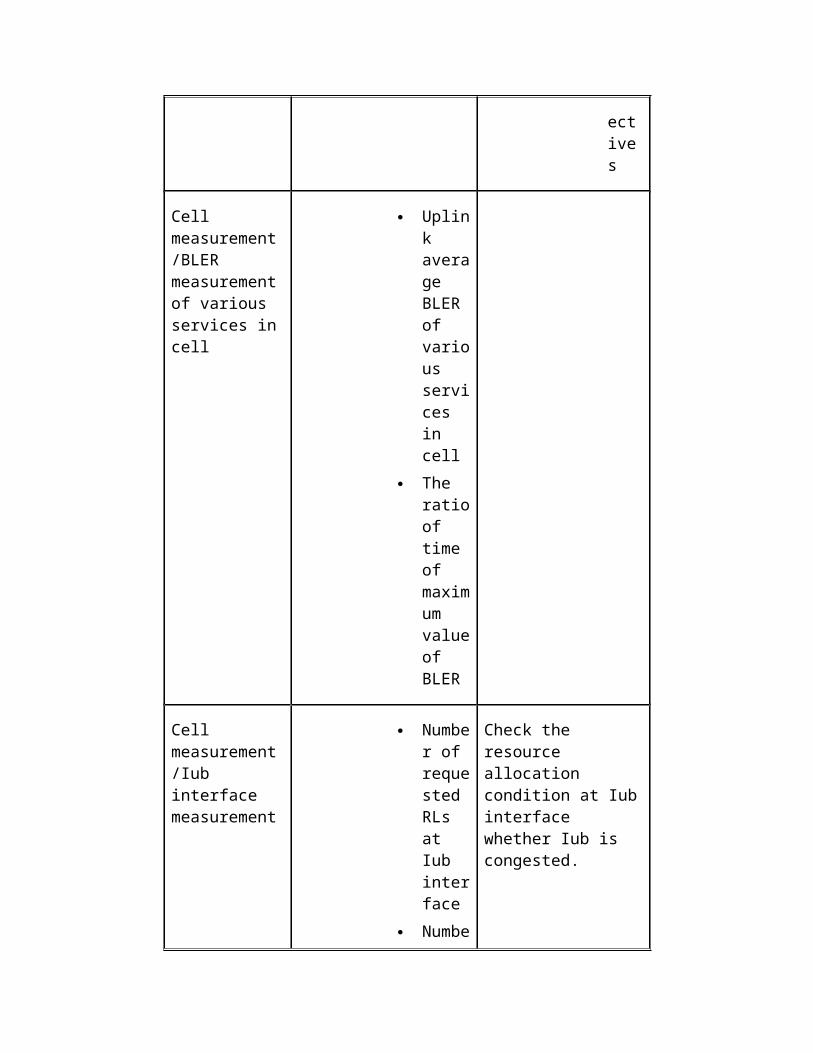
Cell measurement/BLER measurementof various services incell
Uplink average BLER of various services in cell
The ratioof time of maximum valueof BLER
Cell measurement/Iub interface measurement
Number of requested RLs at Iub interface
Numbe
Check the resource allocation condition at Iubinterface whether Iub is congested.
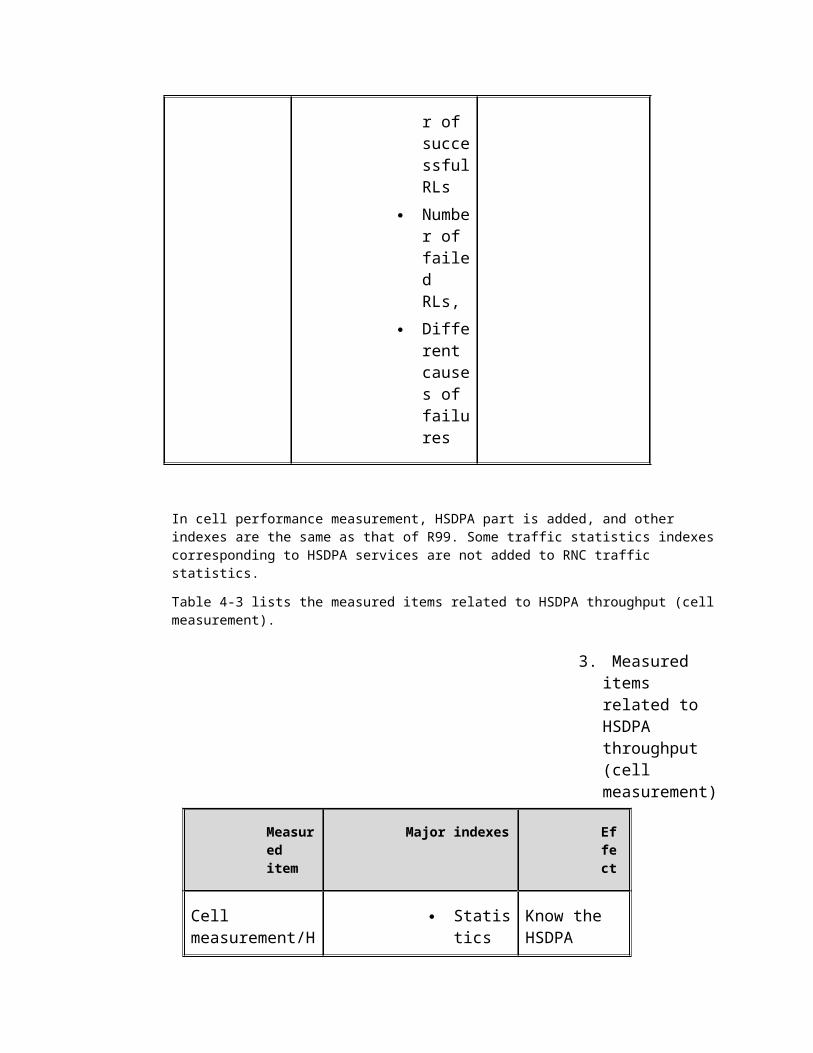
r of successfulRLs
Number of failed RLs,
Different causes of failures
In cell performance measurement, HSDPA part is added, and other indexes are the same as that of R99. Some traffic statistics indexescorresponding to HSDPA services are not added to RNC traffic statistics.
Table 4-3 lists the measured items related to HSDPA throughput (cellmeasurement).
3. Measured items related to HSDPA throughput (cell measurement)
Measured item
Major indexes Effect
Cell measurement/H
Statistics
Know the HSDPA
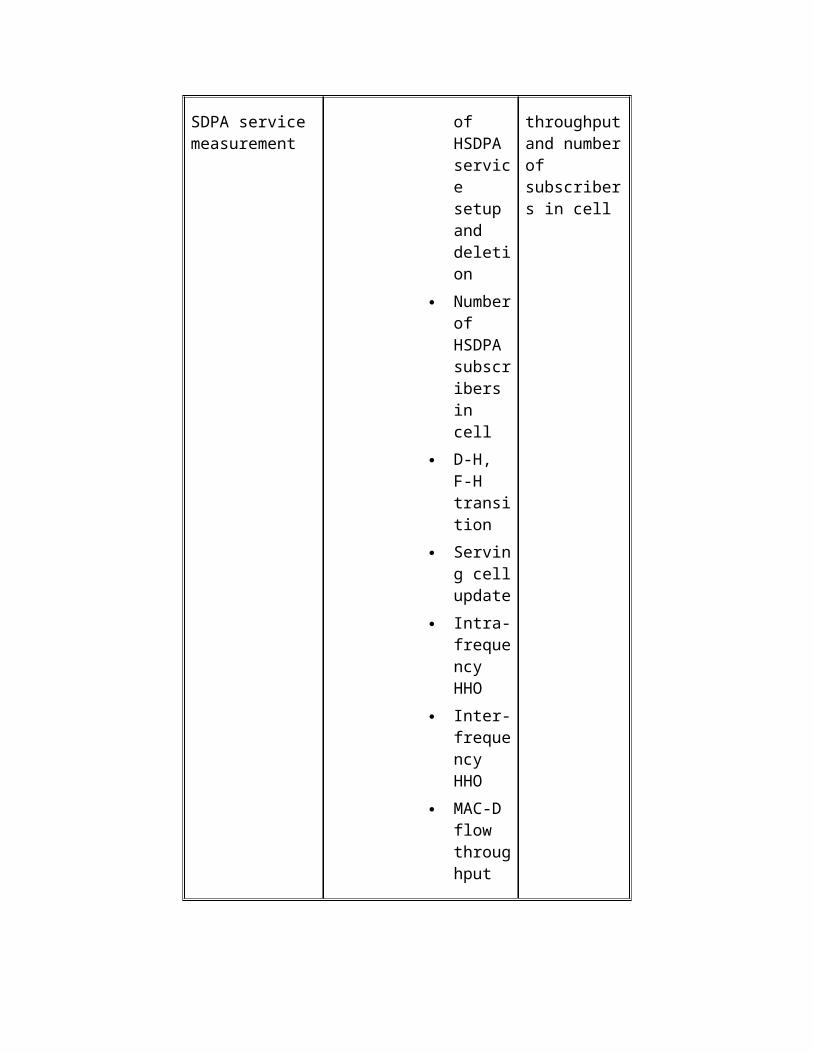
SDPA service measurement
of HSDPA service setup and deletion
Numberof HSDPA subscribers in cell
D-H, F-H transition
Serving cellupdate
Intra-frequency HHO
Inter-frequency HHO
MAC-D flow throughput
throughputand numberof subscribers in cell
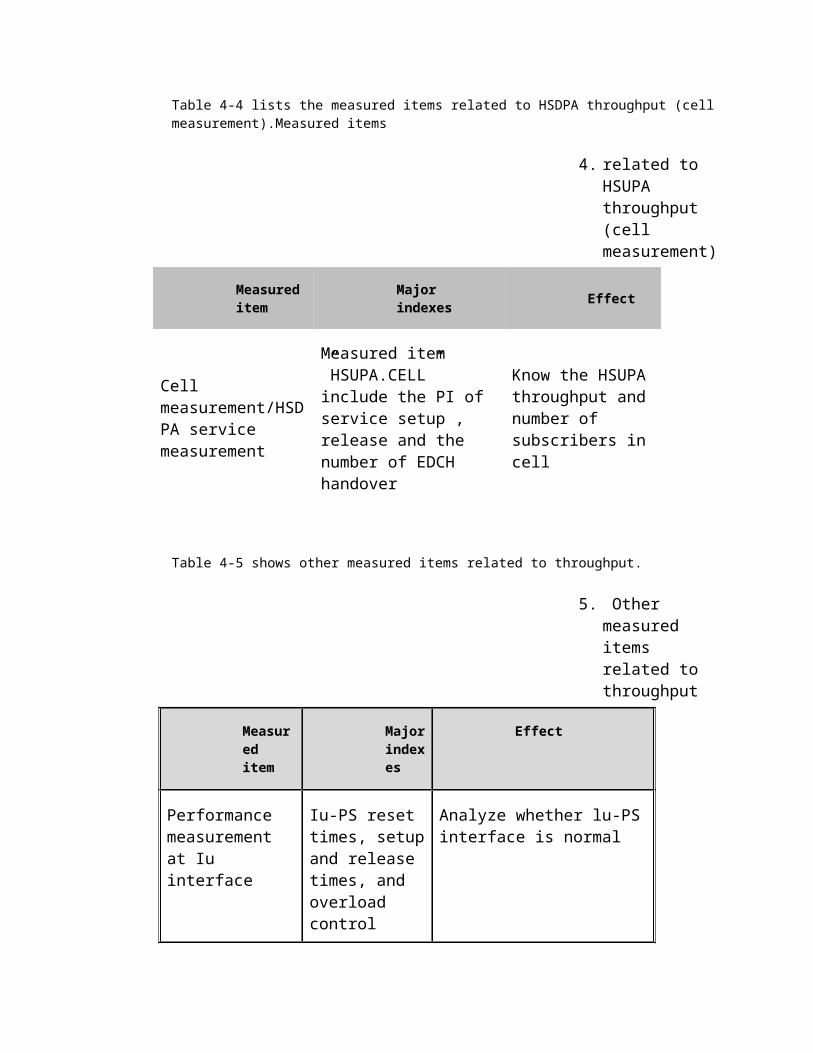
Table 4-4 lists the measured items related to HSDPA throughput (cellmeasurement).Measured items
4. related to HSUPA throughput (cell measurement)
Measureditem
Major indexes Effect
Cell measurement/HSDPA service measurement
Measured item ”HSUPA.CELL” include the PI of service setup , release and the number of EDCH handover
Know the HSUPAthroughput andnumber of subscribers incell
Table 4-5 shows other measured items related to throughput.
5. Other measured items related to throughput
Measured item
Majorindexes
Effect
Performance measurement at Iu interface
Iu-PS reset times, setupand release times, and overload control
Analyze whether lu-PSinterface is normal
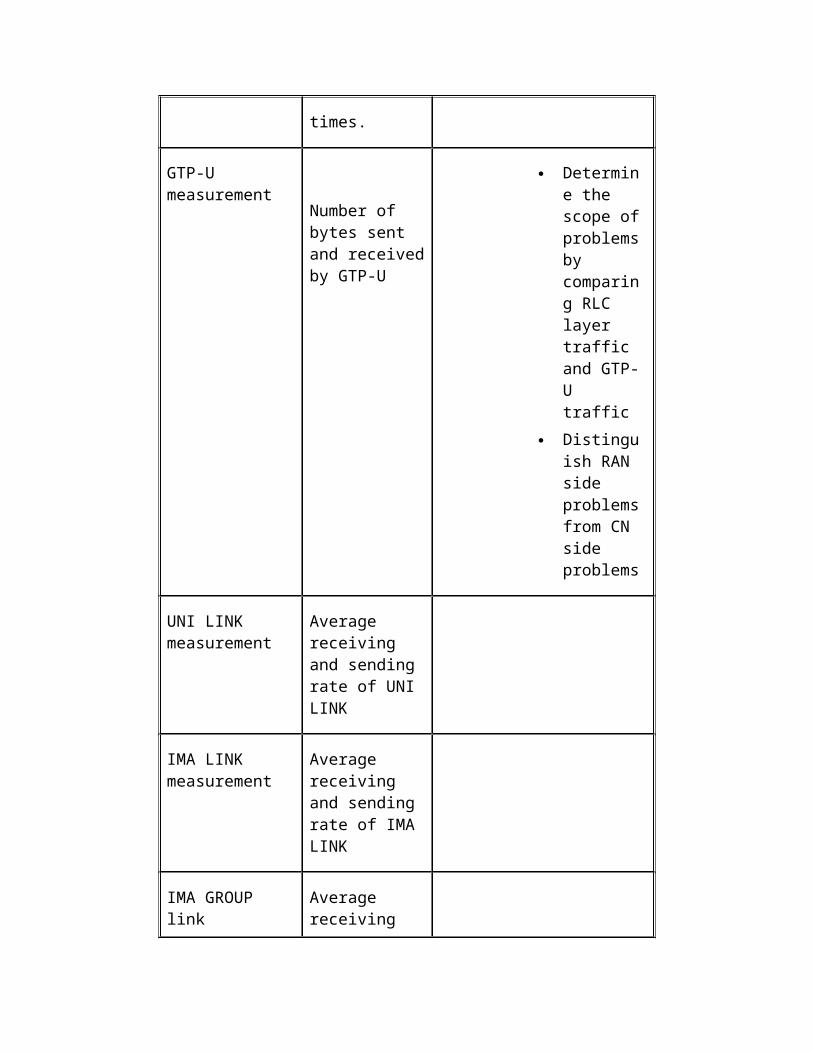
times.
GTP-U measurement
Number of bytes sent and receivedby GTP-U
Determine the scope ofproblemsby comparing RLC layer traffic and GTP-U traffic
Distinguish RAN side problemsfrom CN side problems
UNI LINK measurement
Average receiving and sending rate of UNI LINK
IMA LINK measurement
Average receiving and sending rate of IMA LINK
IMA GROUP link
Average receiving

measurement and sending rate of IMA GROUP
2. Generic Analysis FlowAccording to 4.1, the indexes related to PS throughput include:
Overall performance measurement of RNC Cell measurement Performance measurement at Iu interface GTP-U measurement UNIUNI LINK measurement IMA LINK measurement IMA GROUP link measurement
Analyzing traffic statistics data is mainly based on overall performance measurement of RNC and cell measurement. Analyzing RNC-level data addresses on evaluating and analyzing performance of entire network. Analyzing cell-level data addresses on locating cellproblems. Other measured items like Iu interface and transmission help engineers to analyze problems in the whole process of performance data analysis.
In actual traffic statistics analysis, evaluate the indexes of entire network and then locate cell-level problems.
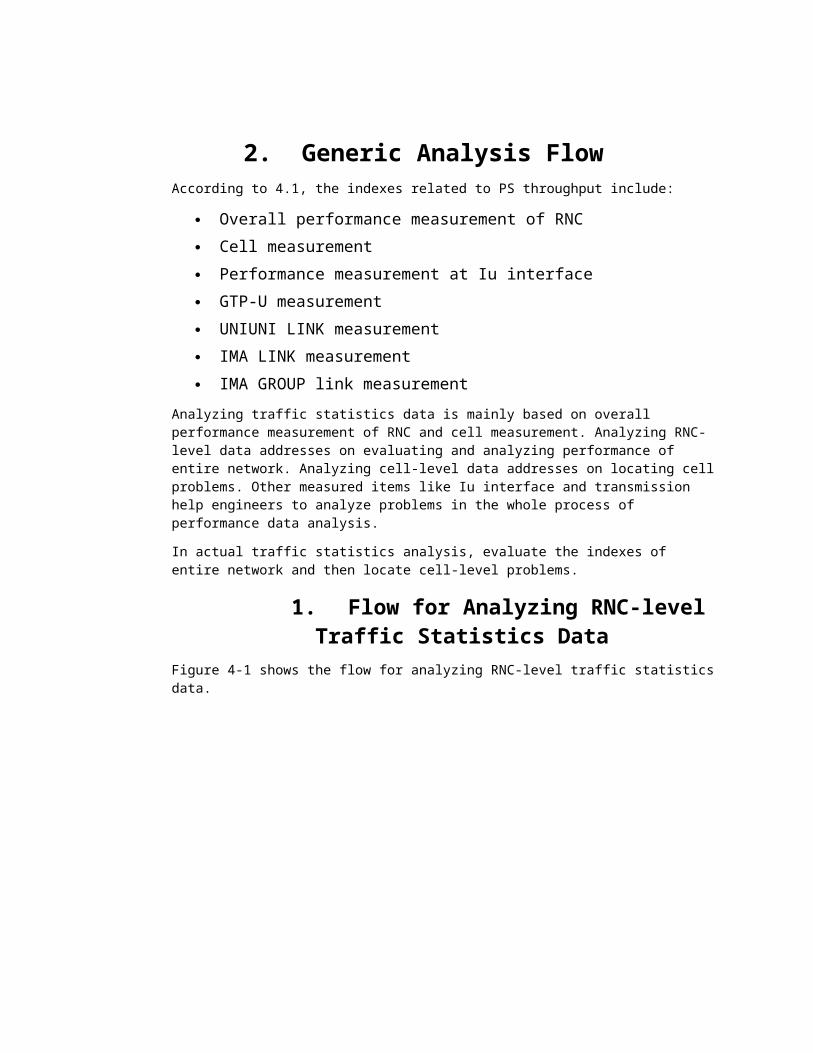
1. Flow for Analyzing RNC-level Traffic Statistics Data
Figure 4-1 shows the flow for analyzing RNC-level traffic statisticsdata.
1. Flow for analyzing RNC-level trafficstatistics data
The RNC traffic statistics indexes of current version do not includestatistics of throughput of various services, but include RNC traffic volume measurement. The traffic volume measurement is relevant to subscribers' behaviors and traffic model.
The traffic volume is not the same every day, but is fluctuating periodically from Monday to Saturday and Sunday. Therefore, upon analysis of RNC traffic volume, observe the fluctuation of weekly traffic volume. For example, compare the curve chart of traffic volume for a weak with that of last weak. If they are similar, the network is running normally according to RNC-level analysis. If theyare greatly different from each other, analyze the problem in details.
When analyzing problems, check whether the RNC-level traffic statistics indexes are normal in synchronization, such as RB, RLC, Iu interface. Then follow the flow for analyzing cell-level traffic statistics data.
If the PS throughput of one or two cells is abnormal, this cannot bereflected by RNC-level traffic statistics. Therefore, analyzing cell-level traffic statistics data is necessary even if RNC-level traffic statistics is normal.
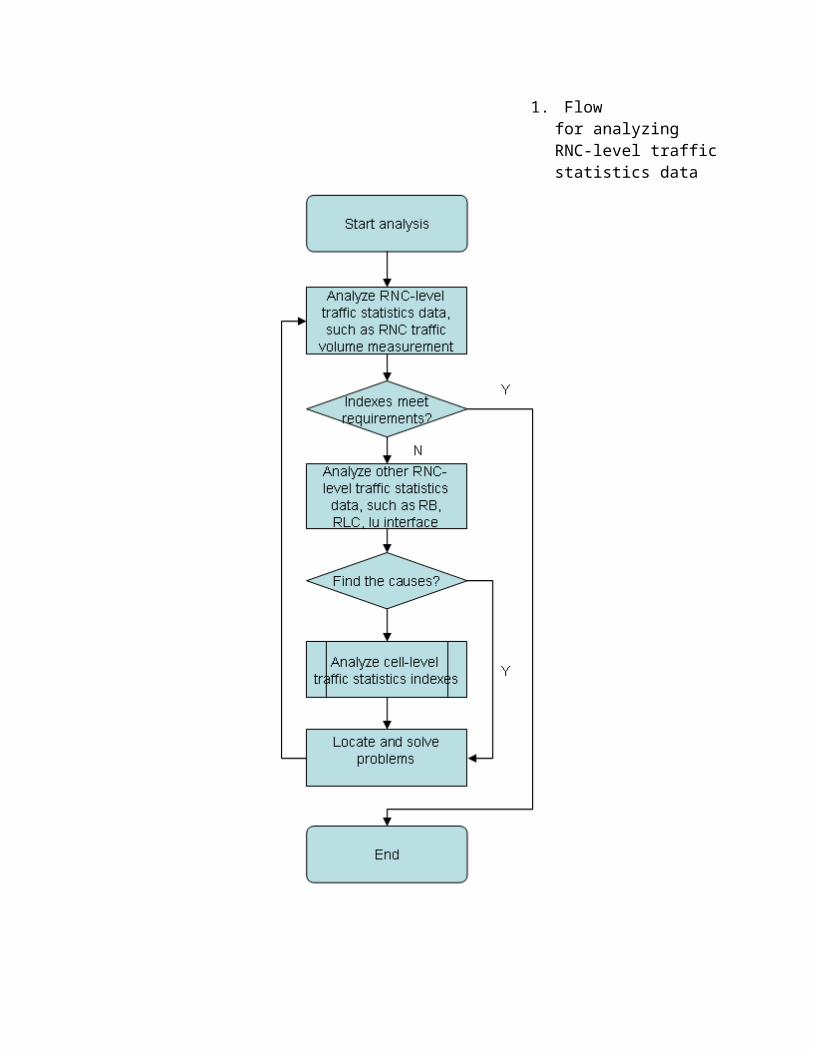
2. Flow for Analyzing Cell-levelTraffic Statistics Data
1. Flow for analyzing cell-level traffic statistics data
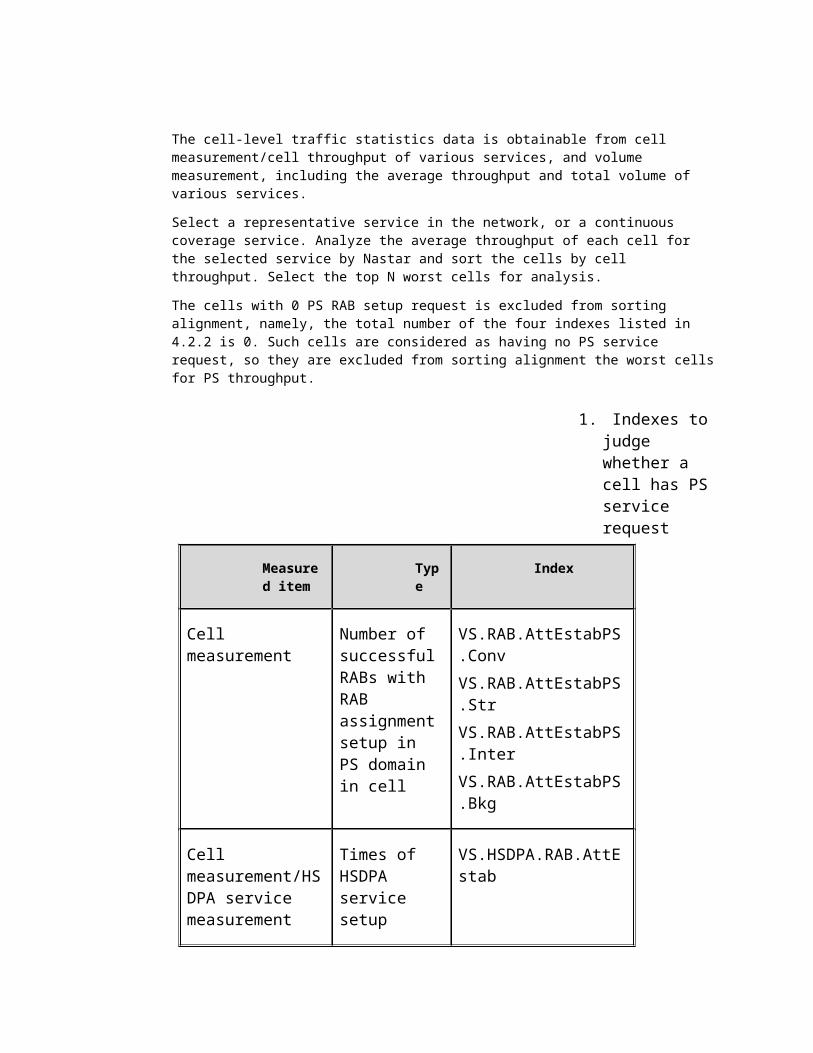
The cell-level traffic statistics data is obtainable from cell measurement/cell throughput of various services, and volume measurement, including the average throughput and total volume of various services.
Select a representative service in the network, or a continuous coverage service. Analyze the average throughput of each cell for the selected service by Nastar and sort the cells by cell throughput. Select the top N worst cells for analysis.
The cells with 0 PS RAB setup request is excluded from sorting alignment, namely, the total number of the four indexes listed in 4.2.2 is 0. Such cells are considered as having no PS service request, so they are excluded from sorting alignment the worst cellsfor PS throughput.
1. Indexes to judge whether a cell has PS service request
Measured item
Type
Index
Cell measurement
Number of successfulRABs with RAB assignmentsetup in PS domain in cell
VS.RAB.AttEstabPS.ConvVS.RAB.AttEstabPS.StrVS.RAB.AttEstabPS.InterVS.RAB.AttEstabPS.Bkg
Cell measurement/HSDPA service measurement
Times of HSDPA service setup
VS.HSDPA.RAB.AttEstab
requests in cell
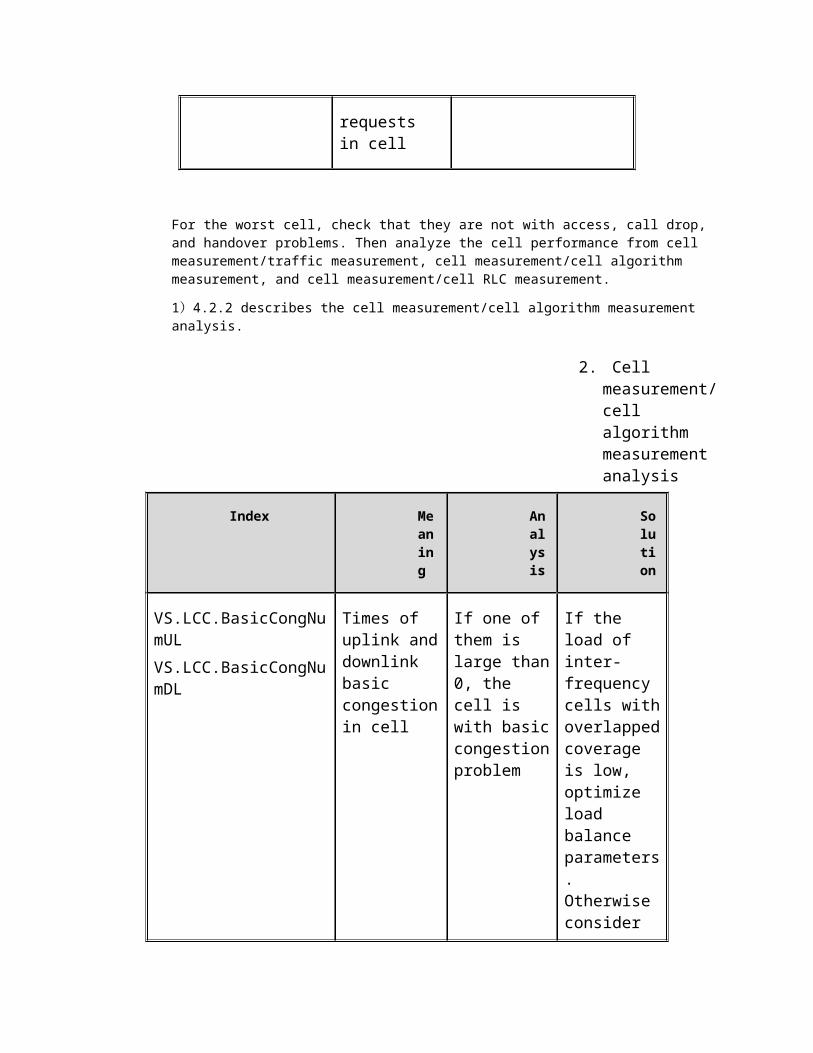
For the worst cell, check that they are not with access, call drop, and handover problems. Then analyze the cell performance from cell measurement/traffic measurement, cell measurement/cell algorithm measurement, and cell measurement/cell RLC measurement.
1)4.2.2 describes the cell measurement/cell algorithm measurement analysis.
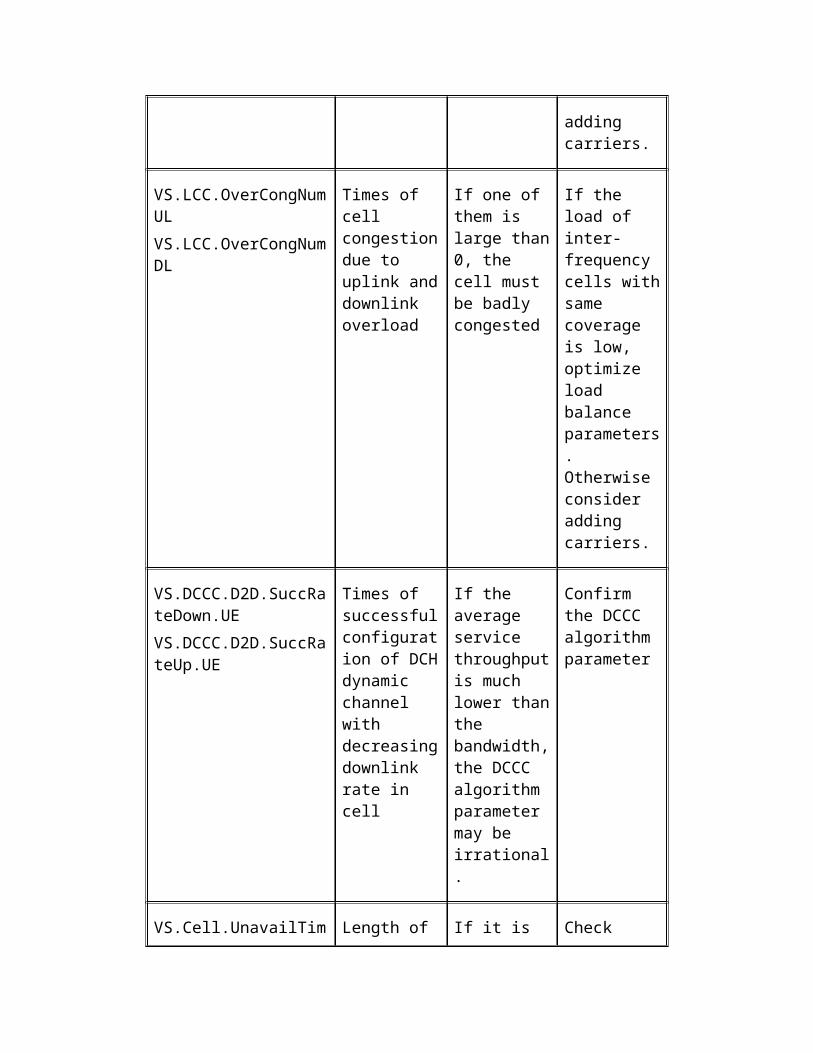
2. Cell measurement/cell algorithm measurement analysis
Index Meaning
Analysis
Solution
VS.LCC.BasicCongNumULVS.LCC.BasicCongNumDL
Times of uplink anddownlink basic congestionin cell
If one of them is large than0, the cell is with basiccongestionproblem
If the load of inter-frequency cells withoverlappedcoverage is low, optimize load balance parameters. Otherwise consider
adding carriers.
VS.LCC.OverCongNumULVS.LCC.OverCongNumDL
Times of cell congestiondue to uplink anddownlink overload
If one of them is large than0, the cell must be badly congested
If the load of inter-frequency cells withsame coverage is low, optimize load balance parameters. Otherwise consider adding carriers.
VS.DCCC.D2D.SuccRateDown.UEVS.DCCC.D2D.SuccRateUp.UE
Times of successfulconfiguration of DCHdynamic channel with decreasingdownlink rate in cell
If the average service throughputis much lower thanthe bandwidth,the DCCC algorithm parameter may be irrational.
Confirm the DCCC algorithm parameter
VS.Cell.UnavailTim Length of If it is Check
e.OM unavailable time of cell
large than0, the cell must have been unavailable.
alarms andCHR for causes of system abnormalities
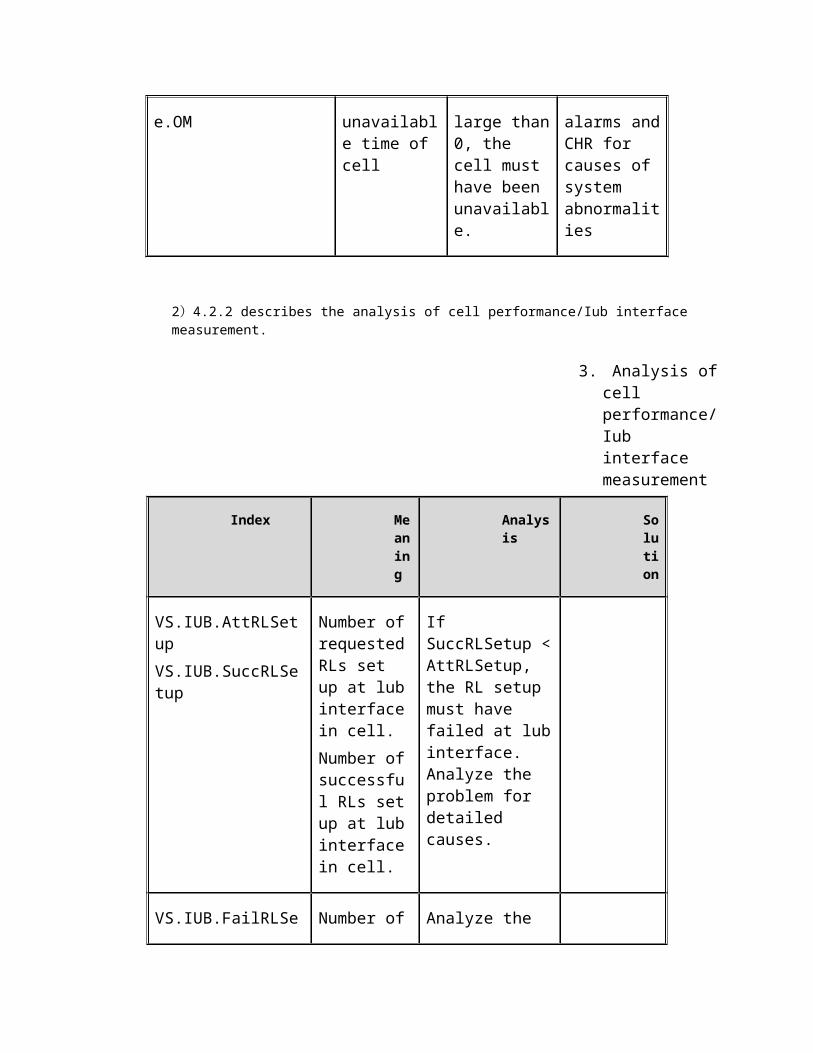
2)4.2.2 describes the analysis of cell performance/Iub interface measurement.
3. Analysis ofcell performance/Iub interface measurement
Index Meaning
Analysis
Solution
VS.IUB.AttRLSetupVS.IUB.SuccRLSetup
Number ofrequestedRLs set up at lubinterfacein cell.Number ofsuccessful RLs setup at lubinterfacein cell.
If SuccRLSetup <AttRLSetup, the RL setup must have failed at lubinterface. Analyze the problem for detailed causes.
VS.IUB.FailRLSe Number of Analyze the
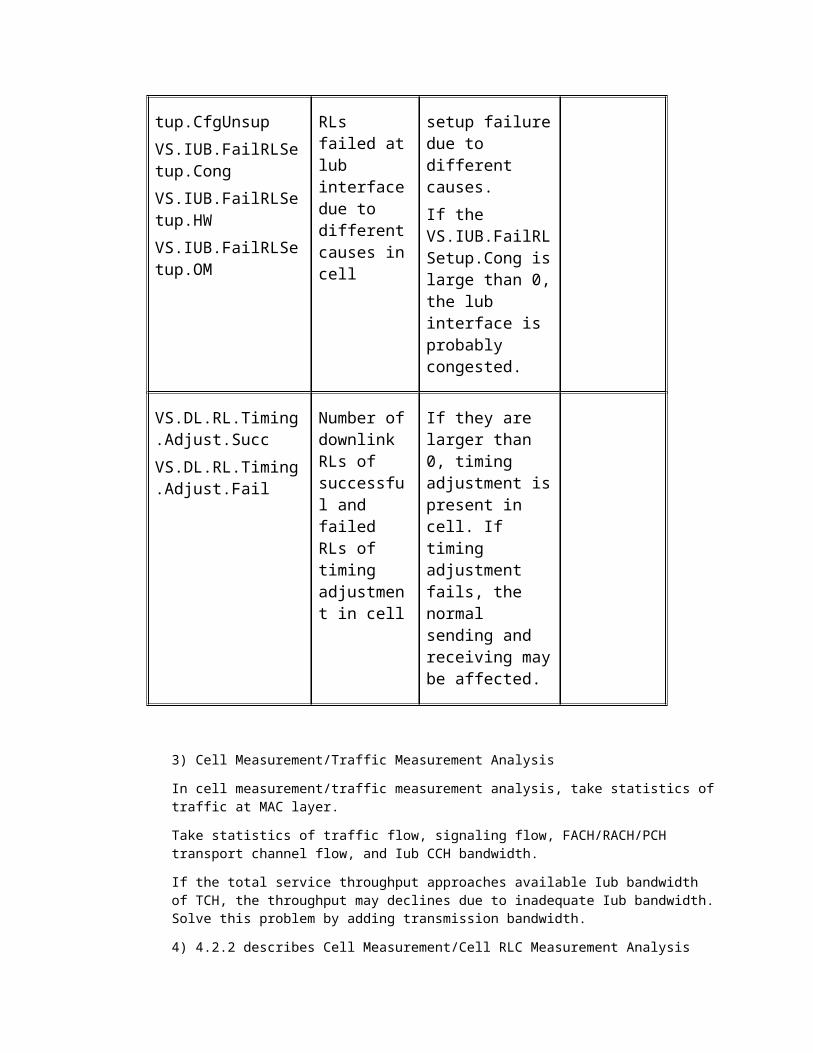
tup.CfgUnsupVS.IUB.FailRLSetup.CongVS.IUB.FailRLSetup.HWVS.IUB.FailRLSetup.OM
RLs failed atlub interfacedue to differentcauses incell
setup failuredue to different causes.If the VS.IUB.FailRLSetup.Cong islarge than 0,the lub interface is probably congested.
VS.DL.RL.Timing.Adjust.SuccVS.DL.RL.Timing.Adjust.Fail
Number ofdownlink RLs of successful and failed RLs of timing adjustment in cell
If they are larger than 0, timing adjustment ispresent in cell. If timing adjustment fails, the normal sending and receiving maybe affected.
3) Cell Measurement/Traffic Measurement Analysis
In cell measurement/traffic measurement analysis, take statistics oftraffic at MAC layer.
Take statistics of traffic flow, signaling flow, FACH/RACH/PCH transport channel flow, and Iub CCH bandwidth.
If the total service throughput approaches available Iub bandwidth of TCH, the throughput may declines due to inadequate Iub bandwidth.Solve this problem by adding transmission bandwidth.
4) 4.2.2 describes Cell Measurement/Cell RLC Measurement Analysis
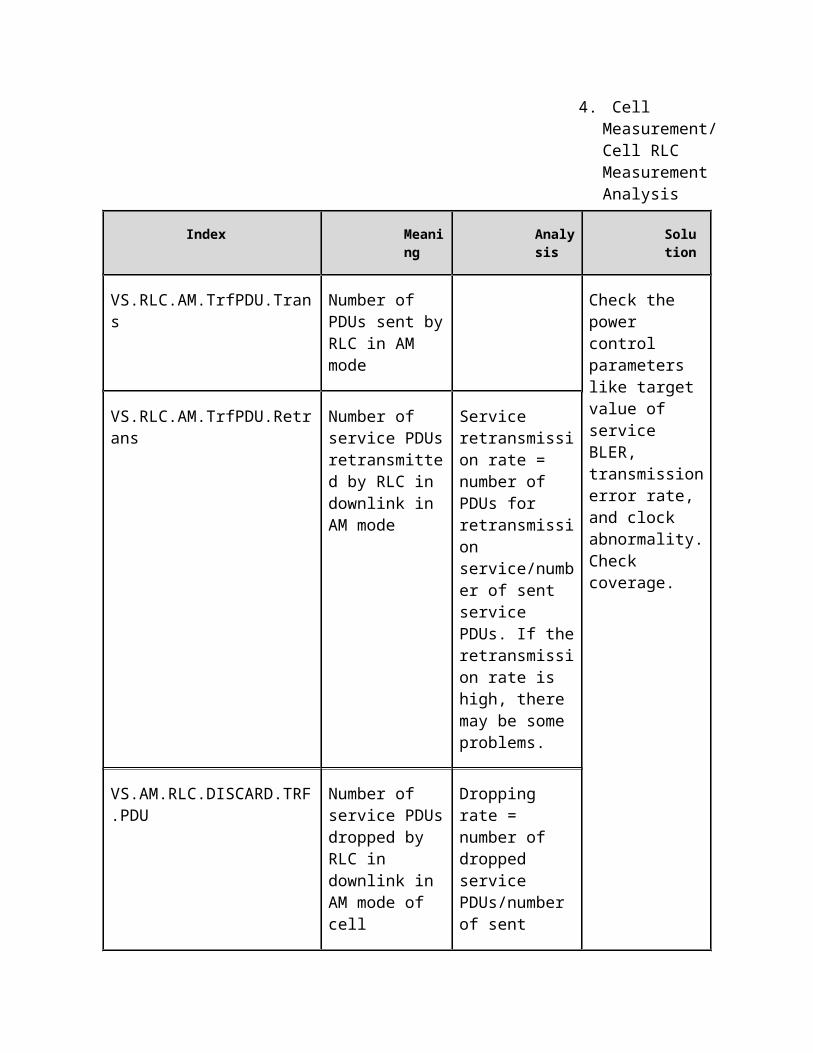
4. Cell Measurement/Cell RLC Measurement Analysis
Index Meaning
Analysis
Solution
VS.RLC.AM.TrfPDU.Trans
Number of PDUs sent byRLC in AM mode
Check the power control parameters like target value of service BLER, transmissionerror rate, and clock abnormality.Check coverage.
VS.RLC.AM.TrfPDU.Retrans
Number of service PDUsretransmitted by RLC in downlink in AM mode
Service retransmission rate = number of PDUs for retransmission service/number of sent service PDUs. If theretransmission rate is high, there may be some problems.
VS.AM.RLC.DISCARD.TRF.PDU
Number of service PDUsdropped by RLC in downlink in AM mode of cell
Dropping rate = number of dropped service PDUs/number of sent
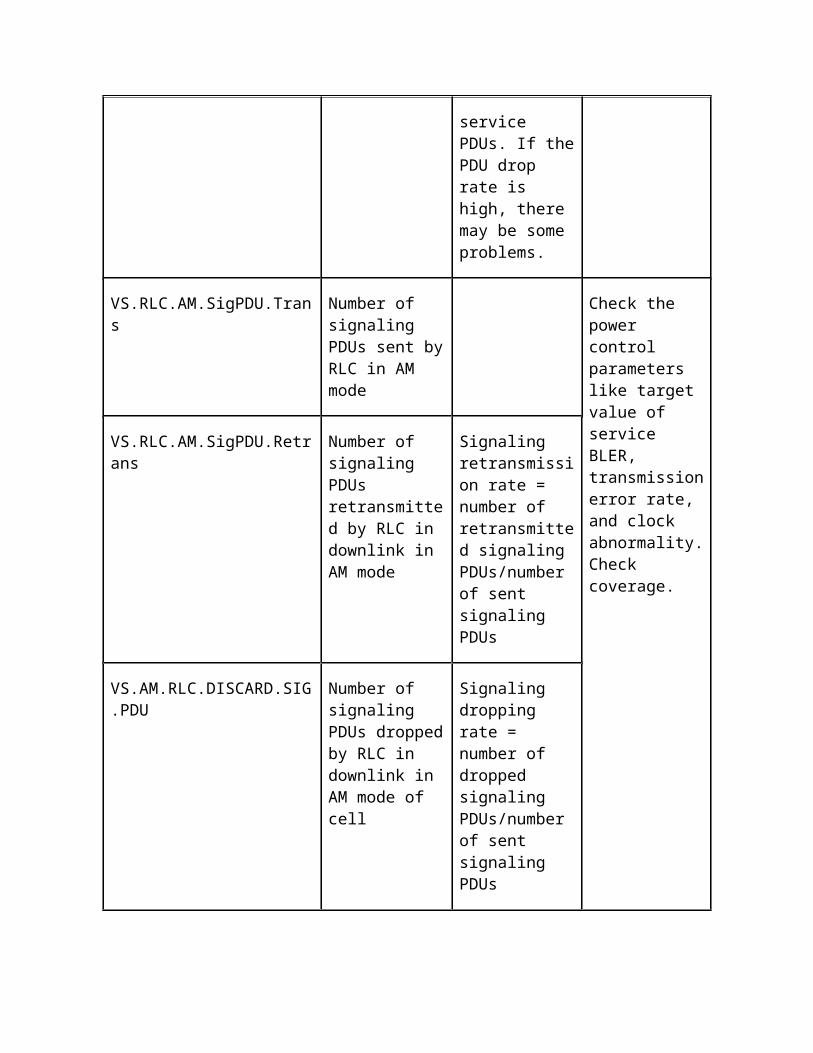
service PDUs. If thePDU drop rate is high, there may be some problems.
VS.RLC.AM.SigPDU.Trans
Number of signaling PDUs sent byRLC in AM mode
Check the power control parameters like target value of service BLER, transmissionerror rate, and clock abnormality.Check coverage.
VS.RLC.AM.SigPDU.Retrans
Number of signaling PDUs retransmitted by RLC in downlink in AM mode
Signaling retransmission rate = number of retransmitted signaling PDUs/number of sent signaling PDUs
VS.AM.RLC.DISCARD.SIG.PDU
Number of signaling PDUs droppedby RLC in downlink in AM mode of cell
Signaling dropping rate = number of dropped signaling PDUs/number of sent signaling PDUs
The causes of high RLC retransmission rate and PDU packet dropping rate are:
Bad BLER of radio link (including weak coverage) High transmission error rate Clock abnormality
To confirm weak coverage problem, perform DT/CQT and analyze CHR as below:
Perform DT/CQT to know the overall coverage conditions
Analyze CHR to know the RSCP and Ec/Io of subscribers in the environment
Sort the subscribers by RSCP in CHR analysis Record the worst N subscribers and visit the
location Perform DT/CQT accordingly in these locations
5. Analysis of DT/CQT Data
About This Chapter
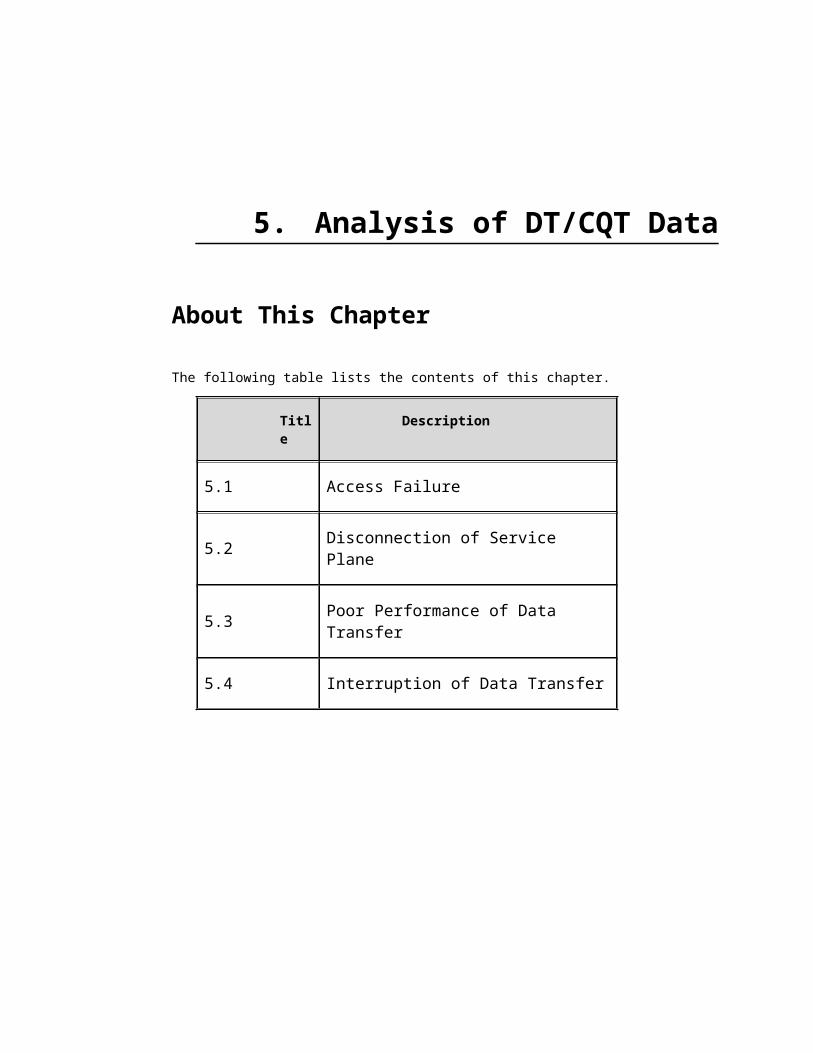
The following table lists the contents of this chapter.
Title
Description
5.1 Access Failure
5.2 Disconnection of Service Plane
5.3 Poor Performance of Data Transfer
5.4 Interruption of Data Transfer
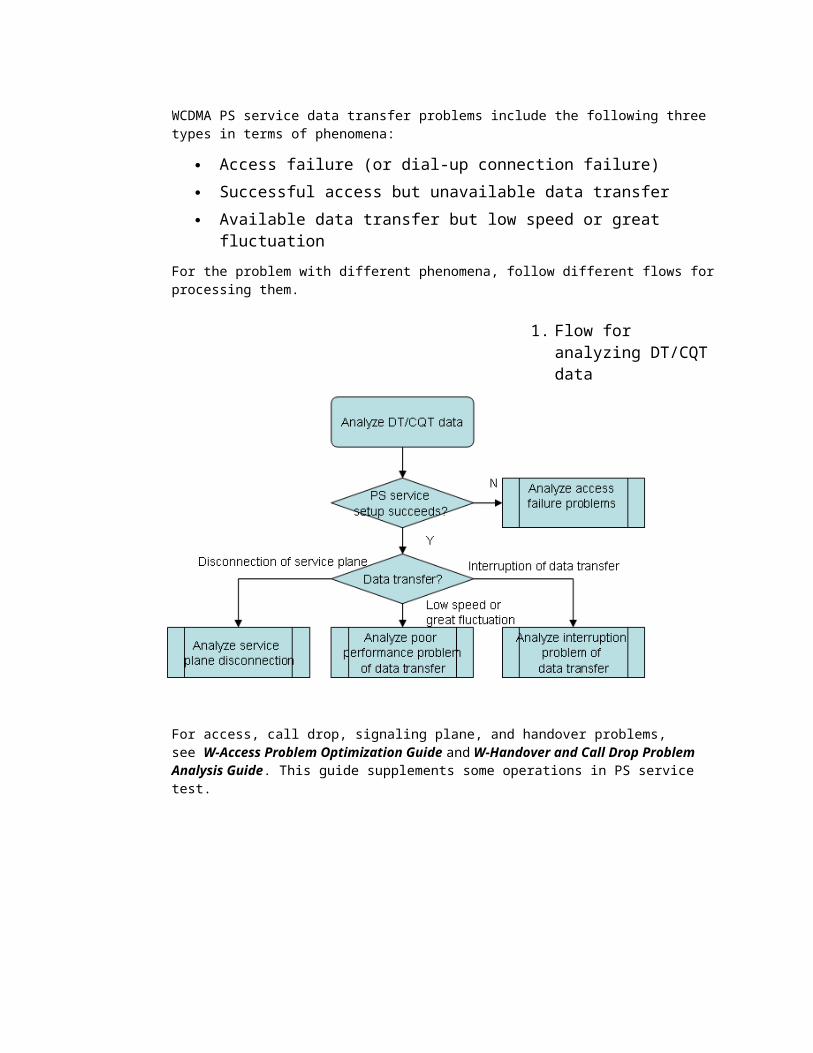
WCDMA PS service data transfer problems include the following three types in terms of phenomena:
Access failure (or dial-up connection failure) Successful access but unavailable data transfer Available data transfer but low speed or great
fluctuationFor the problem with different phenomena, follow different flows forprocessing them.
1. Flow for analyzing DT/CQT data
For access, call drop, signaling plane, and handover problems, see W-Access Problem Optimization Guide and W-Handover and Call Drop Problem Analysis Guide. This guide supplements some operations in PS service test.
1. Access FailureThere are two ways to use PS services:
Originating PS services directly on UE, browsing webpages, and watching video streaming directly on UE
Combining personal computer (PC) and UE. Namely, UE serves as the modem of PC, and the service is originated through PC
In optimization test, the combination of PC and UE is most widely used. In DT/CQT, the PC is usually a laptop with the DT software Probe installed on it. This is called Probe + UE. When the UE fails to directly originate PS services, it can obtain more information byusing Probe + UE. Therefore, the following analysis is mainly based on Probe + UE.
1. Originating PS Service by UE Directly
5.1.1 shows the flow for analyzing access failure problems when originating PS services by UE directly.
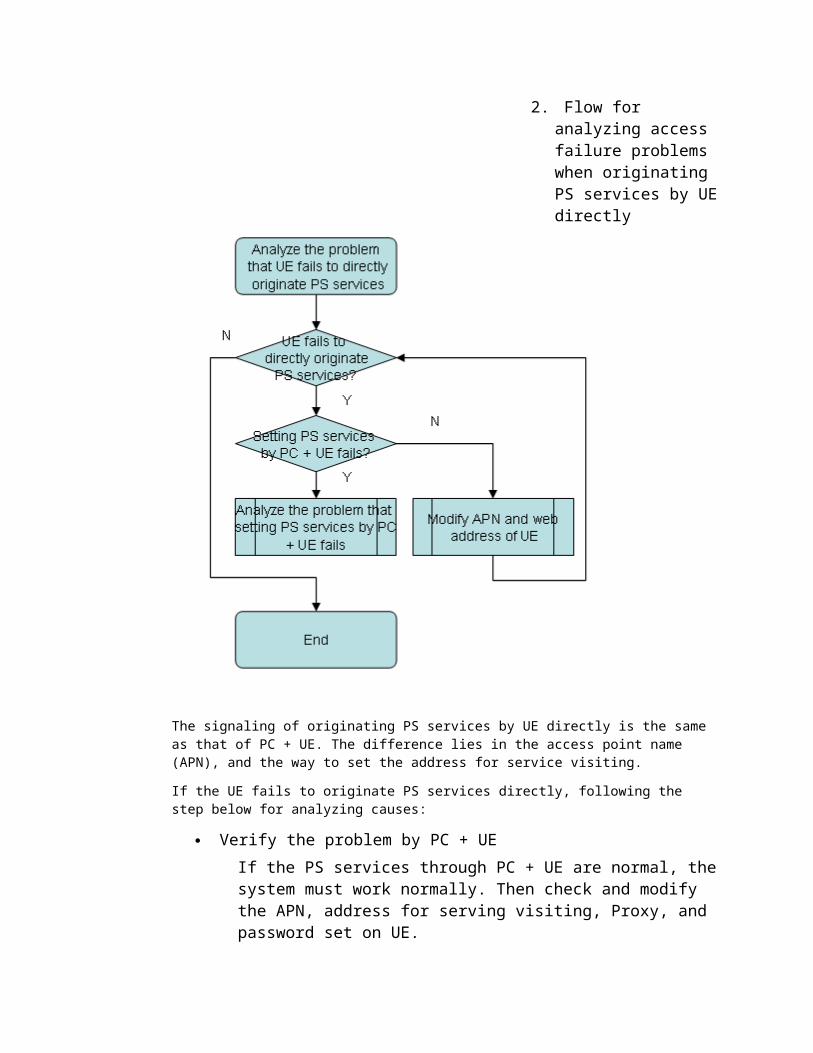
2. Flow for analyzing access failure problems when originating PS services by UEdirectly
The signaling of originating PS services by UE directly is the same as that of PC + UE. The difference lies in the access point name (APN), and the way to set the address for service visiting.
If the UE fails to originate PS services directly, following the step below for analyzing causes:
Verify the problem by PC + UEIf the PS services through PC + UE are normal, thesystem must work normally. Then check and modify the APN, address for serving visiting, Proxy, and password set on UE.
Follow 5.1.2 if originating PS services by PC + UE fails.
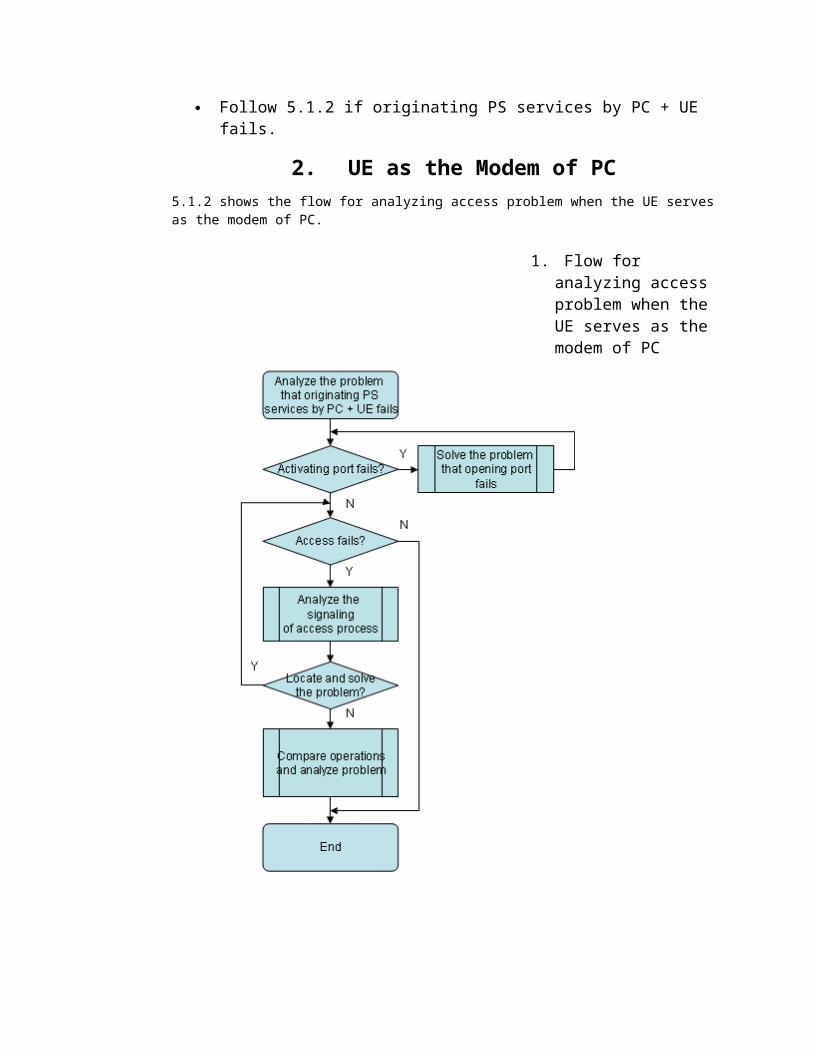
2. UE as the Modem of PC5.1.2 shows the flow for analyzing access problem when the UE servesas the modem of PC.
1. Flow for analyzing access problem when the UE serves as the modem of PC
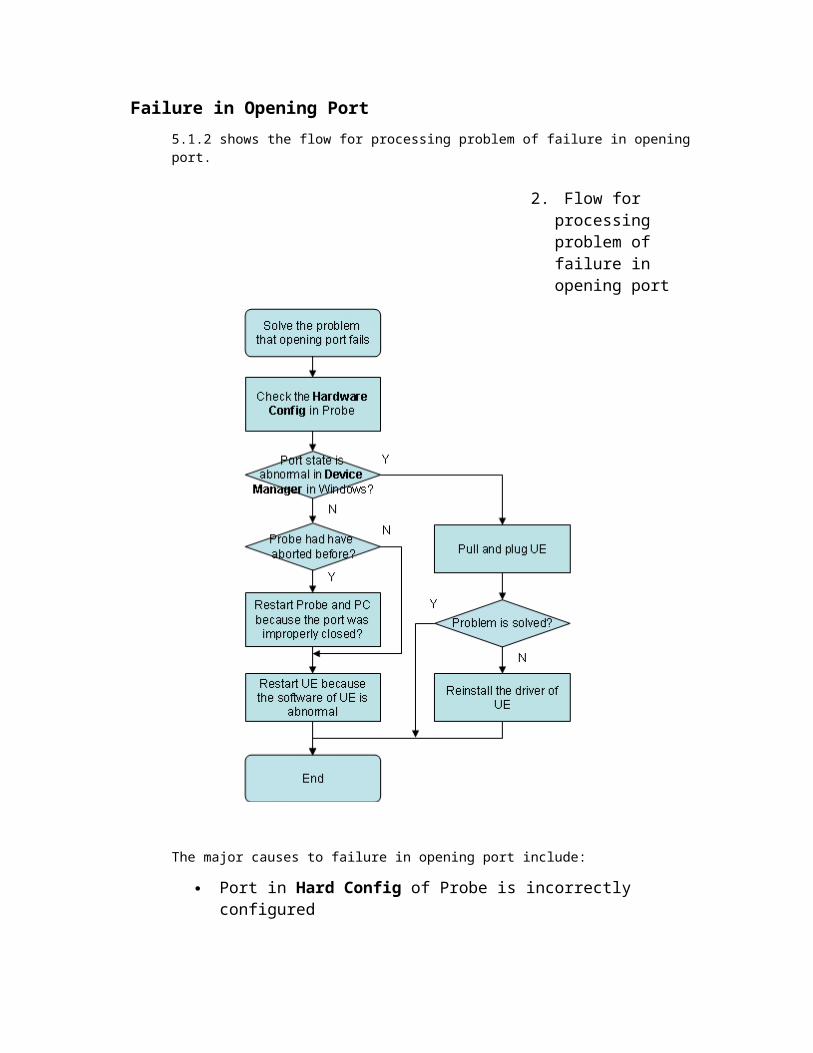
Failure in Opening Port5.1.2 shows the flow for processing problem of failure in opening port.
2. Flow for processing problem of failure in opening port
The major causes to failure in opening port include:
Port in Hard Config of Probe is incorrectly configured
Check the configuration in Hardware Config. The port must be consistent with the Com port and Modem port in Device Manager in Windows operating system.
The port state is abnormalThe driver is improperly installed. Or during DT, the DT tool may abort abnormally, so the port mapped in Windows Device Manager is marked by a yellow exclamatory mark.To solve this problem, reinstall the driver, pull and plug data line or data card of UE.
After the software aborts abnormally, the port is not deactivatedThe DT software like Probe may abort abnormally, so the corresponding port is improperly closed.To solve the problem, quit the Probe and restart it. If the problem is still present, restart PC.
The software of UE is faultyRestart UE to solve the problem.
The driver of UE is incompletely installedReinstall the driver. This problem usually occurs upon the first connection of PC and UE.
Successful Activation of Port but Access FailureOpening port succeeds, but access fails. This is probably due to signaling flow problem.
5.1.2 shows the flow for analyzing access failure problems
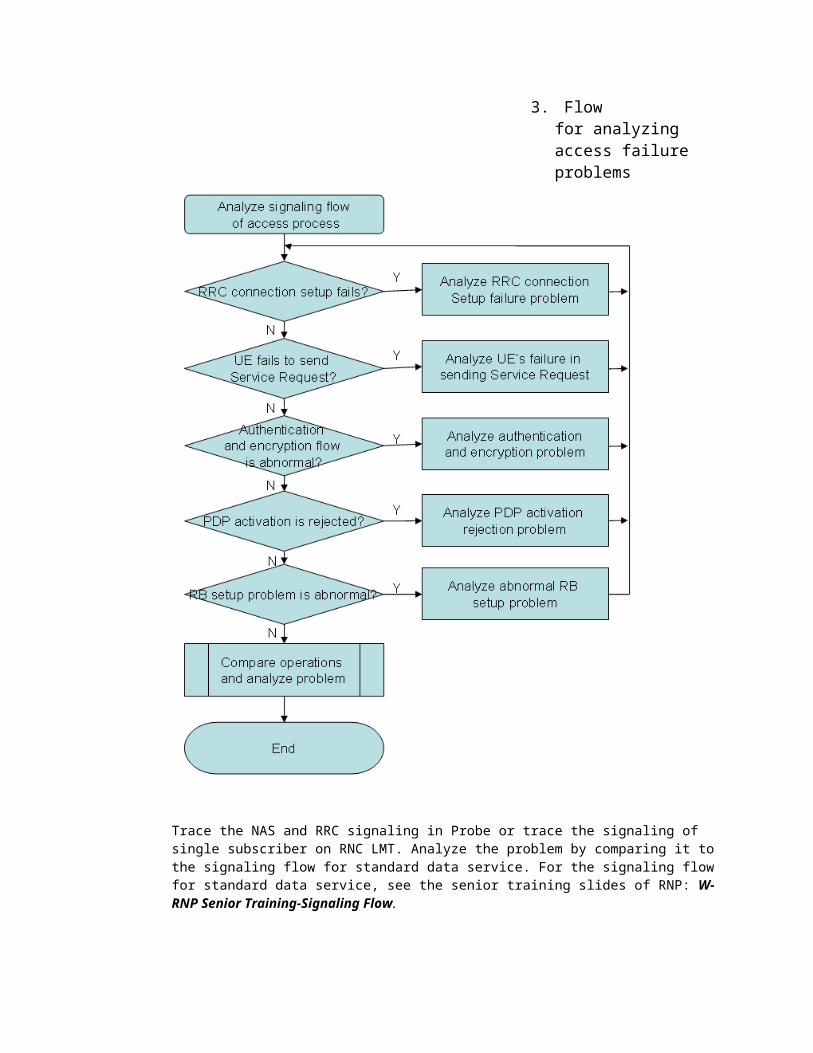
3. Flow for analyzing access failure problems
Trace the NAS and RRC signaling in Probe or trace the signaling of single subscriber on RNC LMT. Analyze the problem by comparing it tothe signaling flow for standard data service. For the signaling flowfor standard data service, see the senior training slides of RNP: W-RNP Senior Training-Signaling Flow.
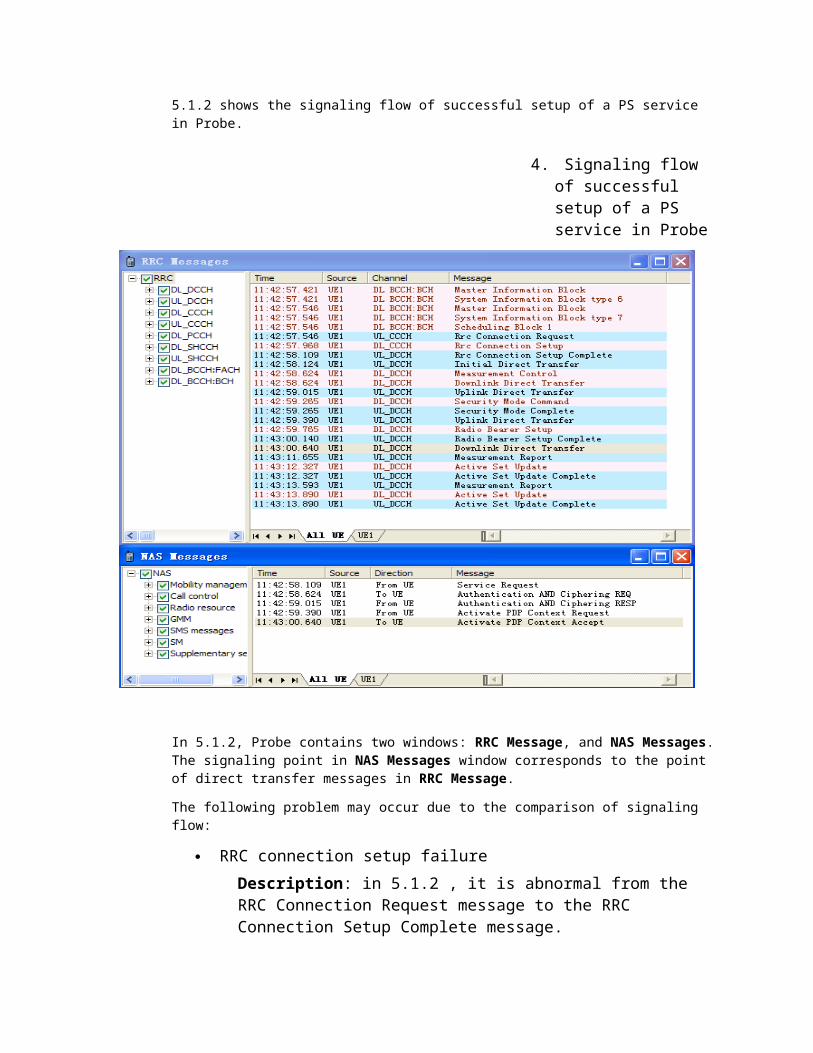
5.1.2 shows the signaling flow of successful setup of a PS service in Probe.
4. Signaling flow of successful setup of a PS service in Probe
In 5.1.2, Probe contains two windows: RRC Message, and NAS Messages.The signaling point in NAS Messages window corresponds to the point of direct transfer messages in RRC Message.
The following problem may occur due to the comparison of signaling flow:
RRC connection setup failureDescription: in 5.1.2 , it is abnormal from the RRC Connection Request message to the RRC Connection Setup Complete message.
Analysis: the UE fails to send the RRC Connection Request message according to the RRC Messages window in Probe, probably due to:
Modem port is not selected in the Hardware Config widow in Probe.
Test Plan is not configured in Probe or improperly configured.
The port of UE is abnormal. See the Failure in Opening Port in 5.1.2for solution.After the UE sends the RRC Connection Request message, it receives no response or receives RRC Connection Reject message due to the admission rejection caused by weak coverage and uplink and downlink overload. For details, see the section Analyzing RRC Connection Setup Problems in W-KPI Monitoring and Improvement Guide.
UE's failure in sending Service RequestDescription: There in no Service Request message in NAS Messages.Analysis: The UE may have disabled PS functions ormay have not registered in PS domain.
The UE may have disabled PS functions. Some UE supports CS or PS, or CS + PS. If the UE is set to support CS, PS services will be unavailable on it. Check the UE configuration and Set it to support PS or CS + PS.
The UE may have not registered in PS domain. According to signaling flow, after the UE sends the Attach Request message, the network side responds the Attach Reject message. The engineers at CN side need to check whether the USIM supports PS services.
The flow for authentication and encryption is abnormalDescription: it is abnormal from the Authentication AND Ciphering REQ in NAS messages to the Security Mode Complete in RRC messages.
Analysis: the engineers at CN side need to check whether the authentication switch in PS domain of CN is on, whether the CN CS domain, PS domain, encryption algorithm of RNC, and the integrity protection algorithm is consistent.On RNC LMT, query the encryption algorithm by executing the command LST UEA. Query the integrityprotection algorithm by executing the command LST UIA.For details, see the section Analyzing Authentication Problems and the section Analyzing Security Mode Problems in W-KPI Monitoring and Improvement Guide.
PDP activation is rejectedDescription: after the UE sends the Activate PDP Context Request message, it receives the Activate PDP Context Reject message.Analysis: there are two types of problems, the improper configuration of APN and rate at UE side,or CN problems.
Improper APN at UE sideIf the cause value of Activate PDP Context Reject is Missing or unknown APN, the APN configuration is probably inconsistent with CN side. Check the Probe and APN at UE side, and compare them with HLR APN. For the method to setAPN of UE and Probe, see the section Connecting Test Device in Genex Probe Online Help. Ask the CN engineers to check the APN in HLR.
Improper rate at UE sideIf the cause value of Activate PDP Context Reject is Service option not supported, the requested rate of UE is probably higher than subscribed rate in HLR. Check the requested rateat Probe and UE side, and compare them with the subscribed rate in HLR. Ask the CN engineers to check the subscriber rate in HLR.
Check the APN and requested rate in the ActivatePDP Context Request message. See the appendix 8.6.
CN problemIf the APN at UE side and restricted rate are properly configured, the problem is probably dueto CN problem. If some interfaces of CN are unavailable, locate the problem with engineers on PS domain of CN.If the PS service is the initial commissioning, the APN for defining a subscriber by HLR is inconsistent with that of gateway GPRS support node (GGSN). Confirm this with engineers on PS domain of CN.For the analysis of causes of PDP activation rejection, see 8.9.
RB setup failureDescription: after Activate PDP Context Request, the system fails to receive Radio Bearer Setup message, but receives the release message.Analysis: for details, see the section Analyzing RAB or RB Setup Problems in W-KPI Monitoring and Improvement Guide.
OthersSee 5.3.2. Shrink the scope of the problem by changing each device.
2. Disconnection of Service Plane
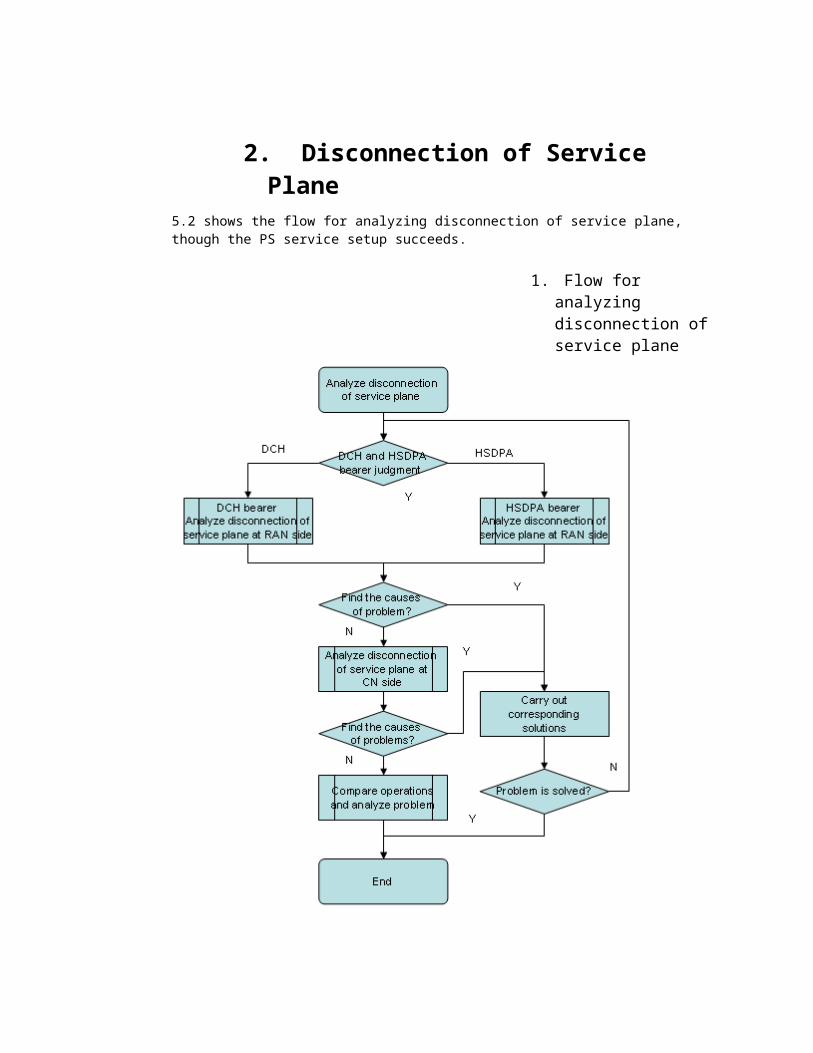
5.2 shows the flow for analyzing disconnection of service plane, though the PS service setup succeeds.
1. Flow for analyzing disconnection of service plane
1. Analyze Problems at RAN SideThe connection setup succeeds, so the signaling plane is connected but the service plane is disconnected. This is probably due to TRB reset at RAN side. For HSDPA, the service is carried by HS-PDSCH andthe signaling is carried by DCH. When the power of HS-PDSCH is inadequate, probably the signaling plane is connected and service plane is disconnected. The following sections distinguish PS services carried on DCH from PS services carried on HSDPA.
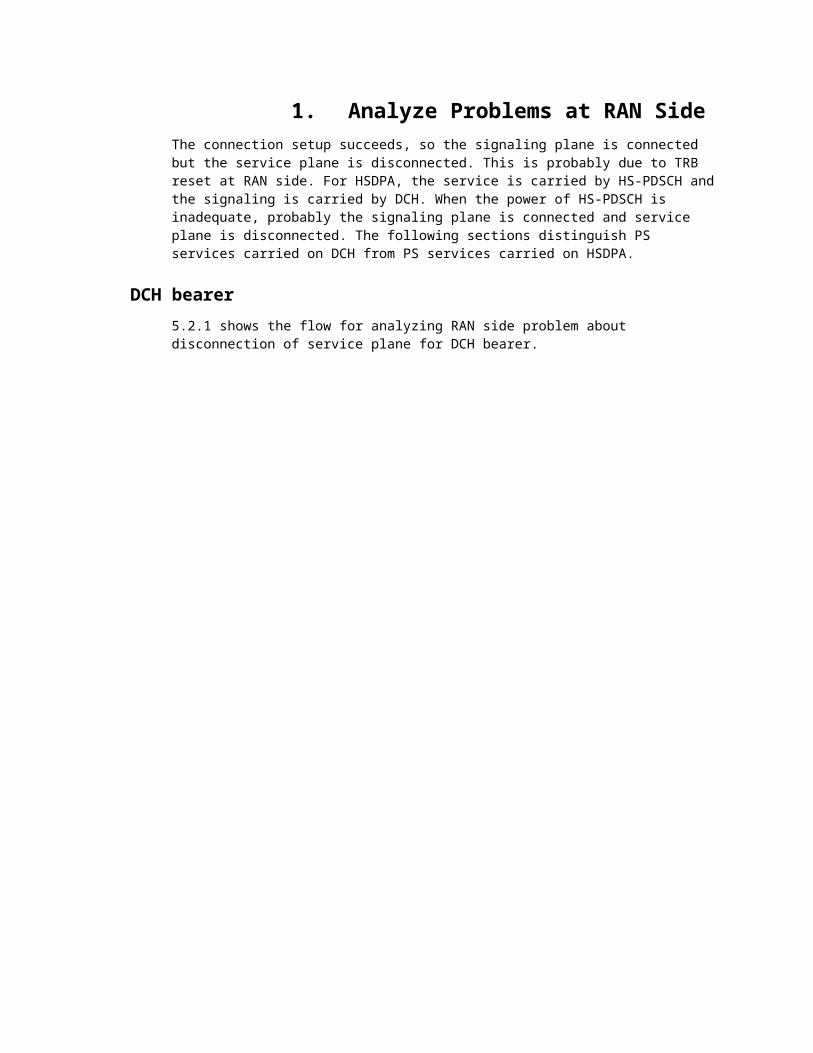
DCH bearer5.2.1 shows the flow for analyzing RAN side problem about disconnection of service plane for DCH bearer.
2. Flow for analyzing RANside problem about disconnection of service plane forDCH bearer
Check coverage conditions
Trace the pilot RSCP and Ec/Io of serving cell by Probe + UE. Judge whether a point is in weak coverage area. For weak coverage area, such as
RSCP < –100 dBm or Ec/Io < –18 dB, the data transfer for PS services is probably unavailable.Solution: If the RSCP is bad, optimize it by improving coverage quality. If the RSCP is qualified, but Ec/Io is bad, check:
Pilot pollution. Then optimize the serious pilot pollution.
Power configuration of pilot channel (LST PCPICH), usually 33 dBm.
There is no external interference
Check call drop problem due to TRB reset
Obtain the CHR files corresponding to the occurrence point of problem. On RNC LMT or in Nastar, check whether there is abnormal information near the point of problem occurrence. This provides the evidence for judgment.For the analysis tool, see W-KPI Monitoring and Improvement Guide.
Trace uplink and downlink throughput and bandwidth
On RNC LMT, select Connection Performance Measurement > Uplink Throughput and Bandwidth, Downlink Throughput and Bandwidth. For details, see the online help for RNC LMT. Check the uplink and downlink throughput and bandwidth.5.2.1 shows the Connection Performance Measurement-Downlink Throughput and Bandwidth window.
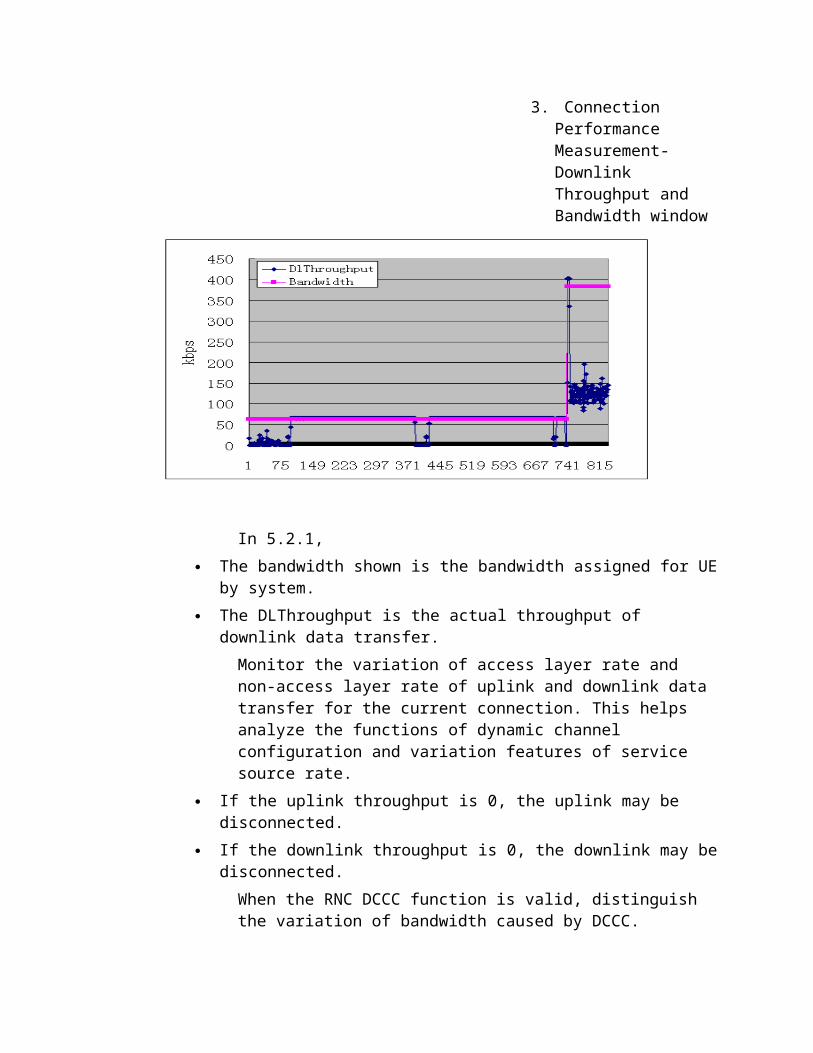
3. Connection Performance Measurement-Downlink Throughput and Bandwidth window
In 5.2.1, The bandwidth shown is the bandwidth assigned for UE
by system. The DLThroughput is the actual throughput of
downlink data transfer.Monitor the variation of access layer rate and non-access layer rate of uplink and downlink data transfer for the current connection. This helps analyze the functions of dynamic channel configuration and variation features of service source rate.
If the uplink throughput is 0, the uplink may be disconnected.
If the downlink throughput is 0, the downlink may bedisconnected.When the RNC DCCC function is valid, distinguish the variation of bandwidth caused by DCCC.
If the problem is still not located after previousoperations, collect the data packets received and sent at RNC L2 and by GTPU by using the tracing tool RNC CDT. This helps judge whether the disconnection of subscriber plane is in uplink or downlink, at CN side or RAN side.
Further
Check problems at the CN side according to analysis of problems at CN side in 5.2.2.Refer to Comparing Operations and Analyzing Problem. Change each part and compare the operations. This helps reduce the scope of the problem. Feed back the problem.
HSDPA BearerThe HSDPA feature of cell is activated, The UE supports HSDPA. The rate requested by UE or the subscribed rate is higher than HSDPA threshold for downlink BE service (for BE service) or HSDPA threshold for downlink streaming service (for streaming service). When the PS services are carried by HSDPA, follow the steps below:
Alarms in RNCs and CHR
Check the alarms and CHR for the point of problem occurrence whether there are abnormalities. Provide diagnosis.
Deactivate HSDPA features so that PS services are set up on DCH
Deactivate HSDPA features by executing the commandDEA CELLHSDPA. Connect UE to the network by dial-up so that PS services are set up on DCH.If the data transfer is unavailable on DCH, see the troubleshooting in previous block DCH Bearer.If the data transfer is available on DCH, the problem must be about HSDPA. Follow the steps below.
Check the CQI, HS-SCCH success rate, and SBLER
Check the CQI, HS-SCCH success rate, and SBLER by Probe + UE as below:
CQIThe UE estimates and reports CQI based on PCPICH Ec/Nt.If the CQI reported by UE is 0, the NodeB will notsend UE any data.In the current version, if the CQI calculated by NodeB based on current available power is smaller than 2, the NodeB will not schedule the UE and send it any data.If the common parameters like pilot Ec/Io, CellMaxPower, PcpichPower, and MPO are normal, butthe CQI is bad, change a PC. The PCs of different types have different thermal noises, so they have different impact on reported CQI.
HS-SCCH success rateThe HS-SCCH success rate is obtainable in the WCDMA HSDPA Decoding Statistics window and WCDMA HSDPA Link Statistics window, as shown in 5.2.1.
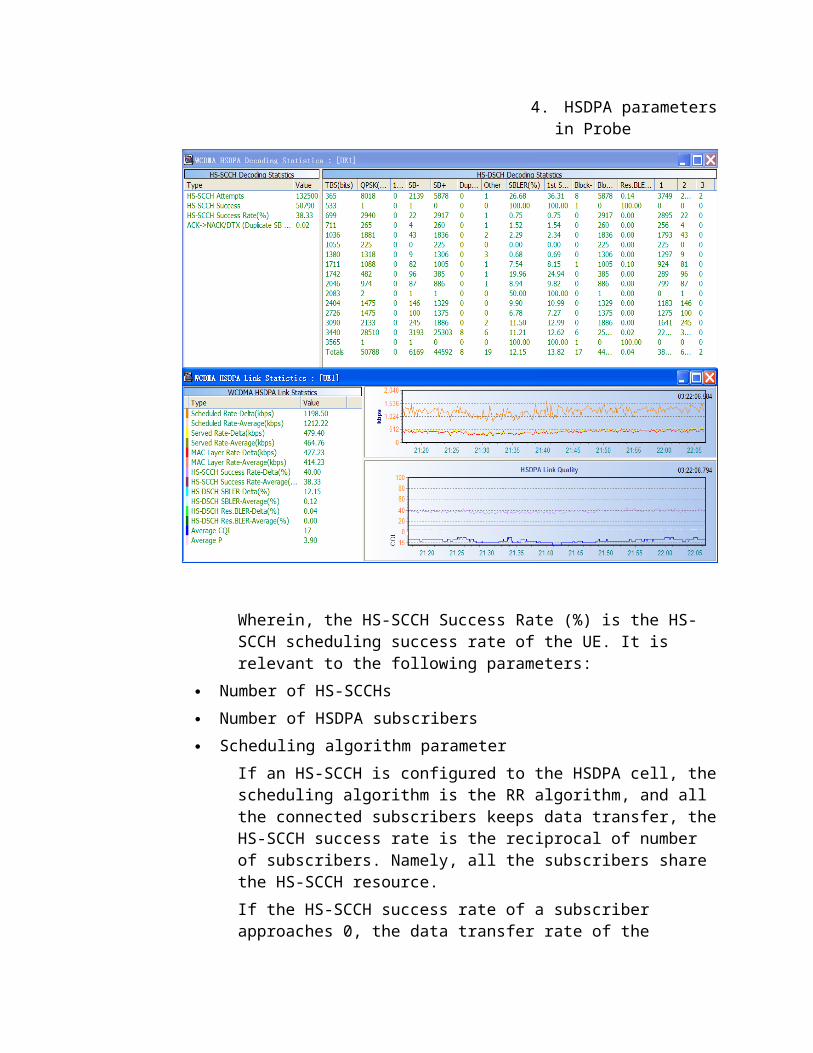
4. HSDPA parametersin Probe
Wherein, the HS-SCCH Success Rate (%) is the HS-SCCH scheduling success rate of the UE. It is relevant to the following parameters:
Number of HS-SCCHs Number of HSDPA subscribers Scheduling algorithm parameter
If an HS-SCCH is configured to the HSDPA cell, thescheduling algorithm is the RR algorithm, and all the connected subscribers keeps data transfer, theHS-SCCH success rate is the reciprocal of number of subscribers. Namely, all the subscribers share the HS-SCCH resource.If the HS-SCCH success rate of a subscriber approaches 0, the data transfer rate of the
subscriber approaches 0, and the service plane maybe disconnected.The HS-SCCH success rate approaches 0 due to:
The scheduling algorithm is much similar to MAX C/I algorithm, more than one HSDPA subscribers connects to the cell, and the CQI of the subscriber is low.
The transmit power of HS-SCCH is over low. Now in the indoor scenario, the transmit power of HS-SCCH is fixed to 2% of total transmit power of cell. In outdoor scenarios, the proportion is 5%. If the transmit power of HS-SCCH is lower than the fixed power, the UE may fail to demodulate HS-SCCH data.
No data is transmitted at the application layer. Confirm this by the actual transmitted data volume in the Connection Performance Measurement-Uplink Throughput and Bandwidth, Downlink Throughput and Bandwidth on RNC LMT.
The CQI reported by UE is over low, so the NodeB will not schedule the subscriber.
SBLER being 100%The SLBER is the slot block error rate of HS-DSCH.In 5.2.1, the right pane of the WCDMA HSDPA Decoding Statistics window shows the SBLER and retransmission conditions of transport blocks of different sizes. The WCDMA HSDPA Link Statistics window shows the following parameters:
HS-DSCH SBLER-Deta HS-DSCH SBLER-Average
Wherein, the Delta is the instantaneous value. The Average is the average value.When the HS-PDSCH Ec/Nt is over low, the SBLER will be 100%. This is actually caused by inadequate HSDPA power. Check the HSDPA power configuration by executing the command LST CELLHSDPA. Wherein, the HS-PDSCH and HS-SCCH powerare the HSDPA power configuration.
There are two methods for HSDPA power configuration: static power configuration and dynamic power configuration.
If the power of the parameter configuration is higher than or equal to the maximum transmit power of cell, use dynamic power configuration.
If the power of the parameter configuration is lowerthan the maximum transmit power of cell, use static power configuration.The available power of HS-PDSCH in static power configuration = maximum transmit power of cell – power margin – R99 downlink load (including CCH load) – HS-SCCH power.The available power of HS-PDSCH in dynamic power configuration = power of HS-PDSCH and HS-SCCH – HS-SCCH power.Note the static power configuration. Due to power control, the R99 services can use HS-PDSCH power.According to previous two formulas, in dynamic power configuration of HSDPA power, if the power margin is over large, R99 downlink load is over high, or HS-SCCH power is over high, the availablepower of HS-PDSCH is over low. In static power configuration of HSDPA power, if the HS-PDSCH and HS-SCCH power are over low, or HS-SCCH power is over high, the available power of HS-PDSCH is overlow.SBLER is 100% seldom due to inadequate power, unless the CQI reported by UE is over small. When the power of NodeB is inadequate, the CQI calculated by NodeB is smaller, the scheduled TB blocks becomes smaller, so the rate obtained by UEdeclines.Solution: adjust parameter configuration. If the R99 load is over high, add carriers.
Check the available bandwidth, occupied bandwidth, andassigned bandwidth at Iub interface
Query Iub bandwidth by executing the command DSP AAL2PATH on RNC LMT. Or start the task Periodic Reporting of Iub Bandwidth Assignment Conditions of HSDPA on NodeB console.If errors occur in data transmission, the IMA group number of AAL2PATH (For HSDPA) on NodeB fails to match that on RNC. When the available bandwidth of HSDPA is inadequate due to product software problems, the data transfer is unavailable.
2. Analyzing Problems at CN SideThe problems at CN side include abnormal work state of service servers and incorrect user name and password.
5.2.2 shows the flow for analyzing problems at CN side about disconnection of service plane.
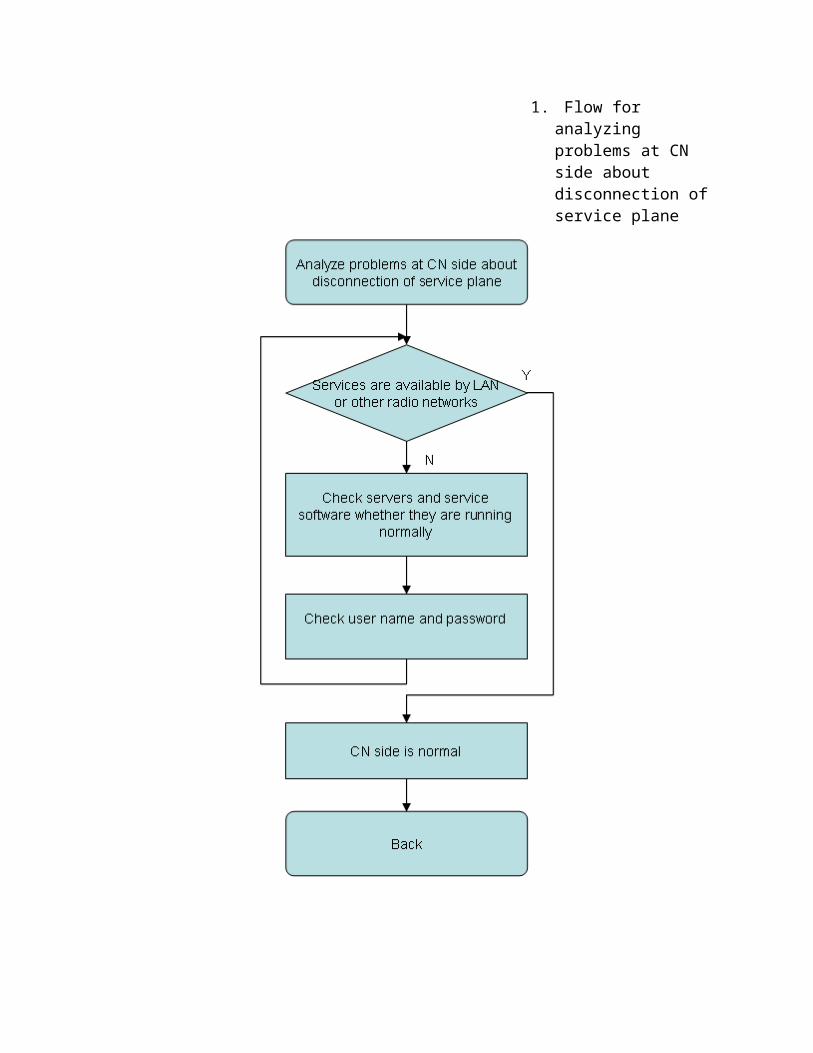
1. Flow for analyzing problems at CN side about disconnection of service plane
Confirm by other access network or LAN that the service software servers and service software run normally.
LANUse FTP or HTTP service on a PC connected to LAN, and check whether the service is available. In addition, verify the user name and password of theconnected user.
Other radio access network under the same CNIf different 3G access networks under the same CN sets up PS service or sets up PS service from the GRPS network, check whether the service is normal.
After previous checks, if the service servers work normally, focus on the problems at RAN side for analysis. If the service servers areabnormal according to previous checks, ask the on-site engineers of CN PS domain to solve the problem.
The IP address for visiting FTP and HTTP service servers by LAN is different from that for visiting service servers after the UE sets up wireless connection. For details, turn to on-site engineers of CN PS domain.
3. Poor Performance of Data Transfer
The poor performance of data transfer, in terms of throughput measurement, lies in the following problems:
Unstable rate like great fluctuation Low rate
The poor performance of data transfer, in terms of QoS, lies in the following problems:
Unclear streaming image Buffering Low rate in browsing web pages
The appendix 8.1contains the transport path of PS data. The PS data passes Internet service servers, GGSN, SGSN, RNC, NodeB, and finallyUE. Meanwhile the PS data passes Gi, Gn, IuPS, Iub, and Uu interfaces. During the process, the PS data passes Internet servers to GGSN using IP protocol. Between them, there may be one or more devices like router and firewall.
The PS services use the AM mode of RLC and support retransmission function. The FTP and HTTP services use TCP protocol which supports retransmission. The parameters of these two protocols (RLC/TCP) havegreat impact on rate.
If the parameter configuration is improper, or missing and dropping data packet may cause the data rate to decline. When checking the quality of service (QoS), engineers make UE as the modem of a computer running applications, so the performance of computer and servers will influence the QoS.
By and large, several factors affect the performance of data transfer of PS services, and they include:
RAN side CN equipment Applications and service software
The applications and service software problems are contained in the CN side problems. 5.3 shows the flow for analyzing poor performance of data transfer.
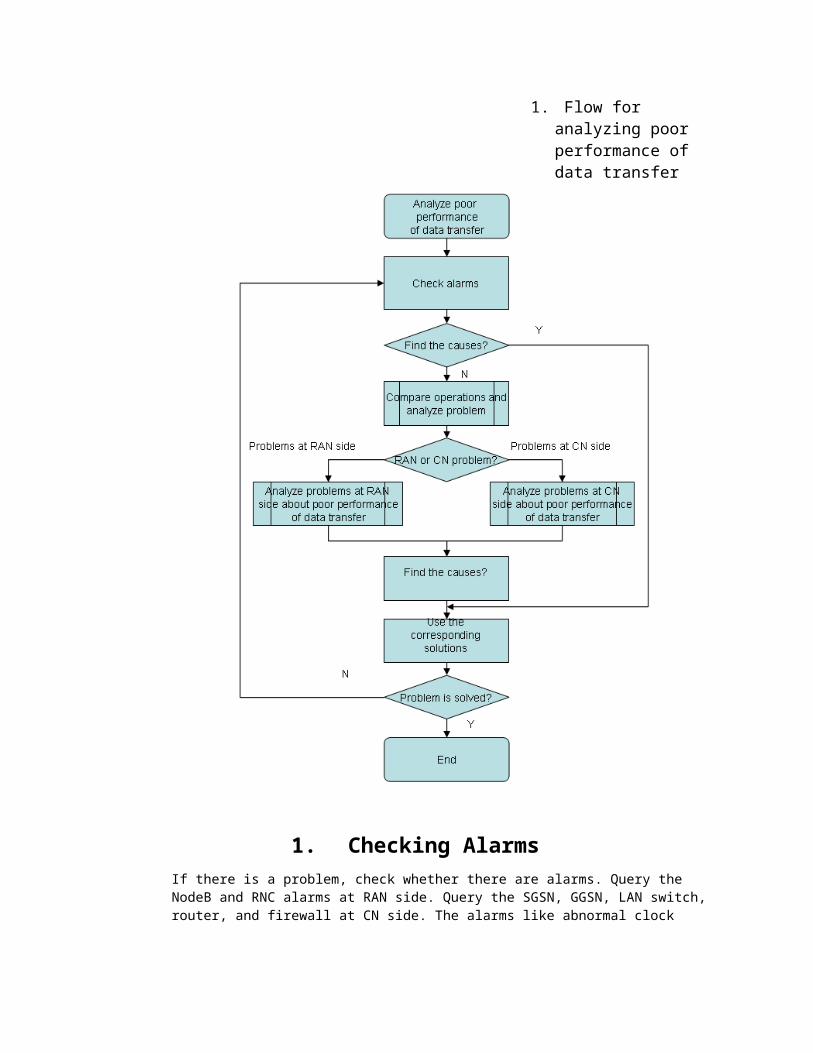
1. Flow for analyzing poor performance of data transfer
1. Checking AlarmsIf there is a problem, check whether there are alarms. Query the NodeB and RNC alarms at RAN side. Query the SGSN, GGSN, LAN switch, router, and firewall at CN side. The alarms like abnormal clock
alarms, high transmission error rate, and abnormal equipment affect data transfer.
If problems cannot be located according NE alarms, refer to 5.3.2. By comparing operations and analyzing problem, reduce the scope of problem.
If the problem is at RAN side, refer to 5.3.3. If the problem is at CN side, refer to 5.3.6. If the problem concerns both the RAN and CN side,
analyze it from both sides.
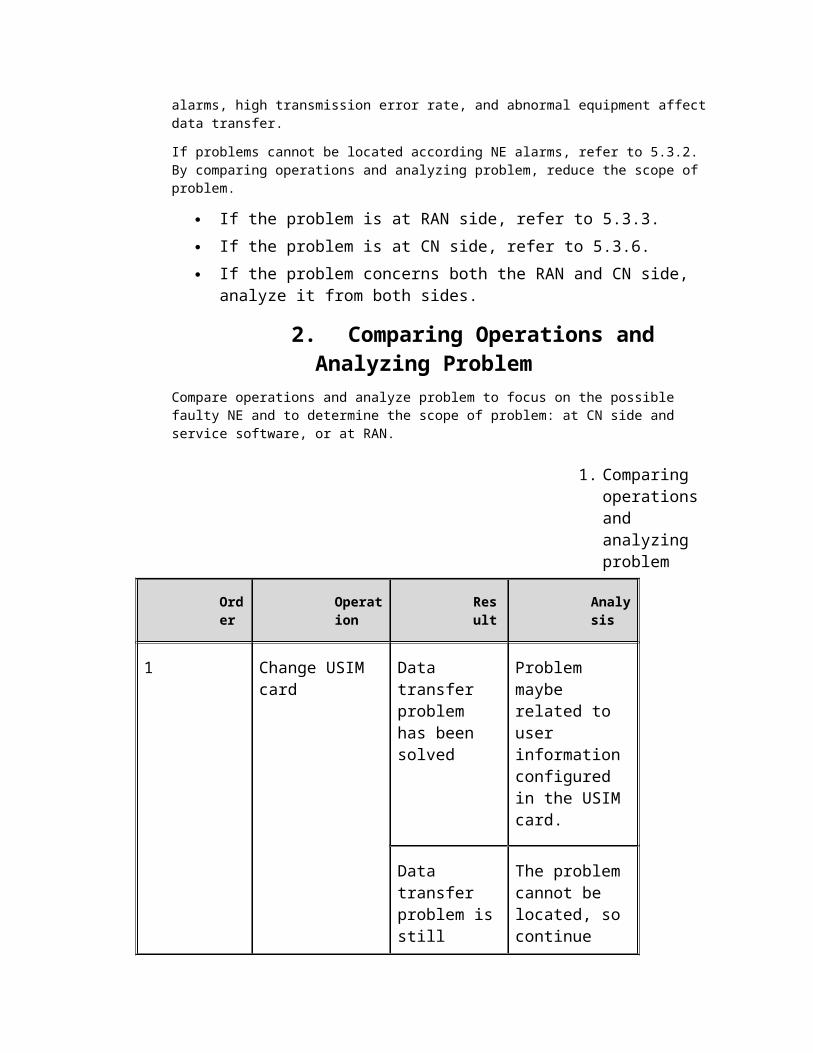
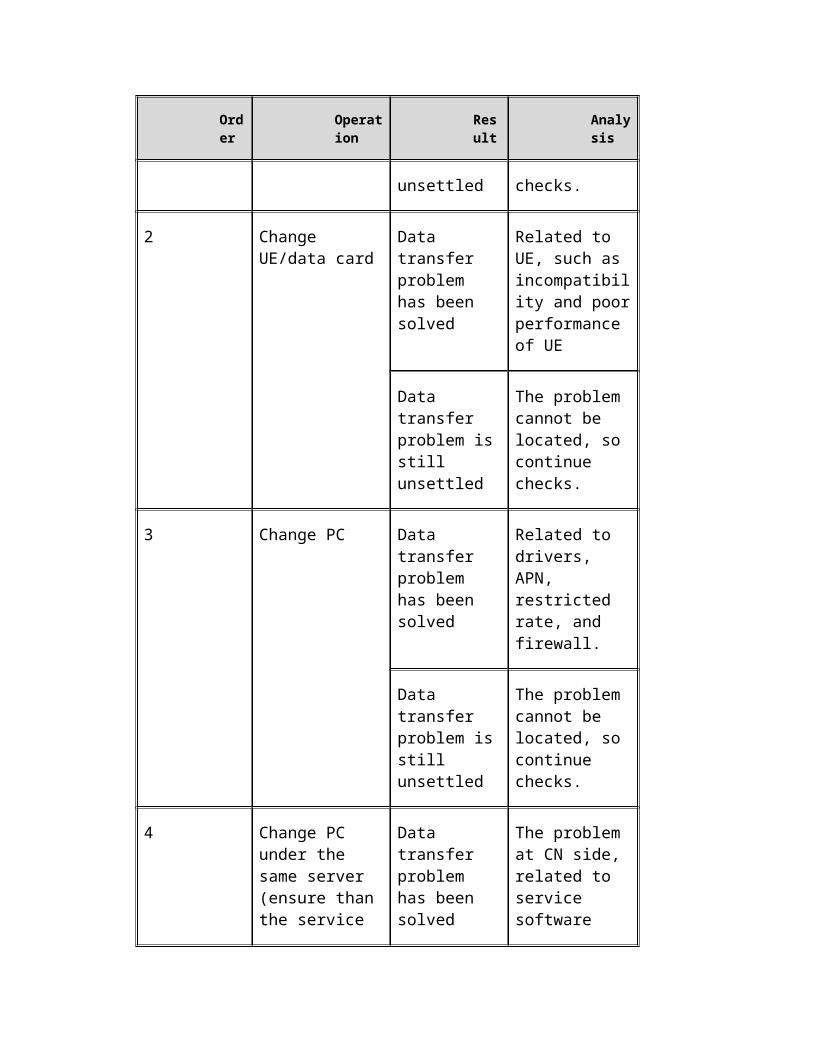
2. Comparing Operations and Analyzing Problem
Compare operations and analyze problem to focus on the possible faulty NE and to determine the scope of problem: at CN side and service software, or at RAN.
1. Comparing operations and analyzing problem
Order
Operation
Result
Analysis
1 Change USIM card
Data transfer problem has been solved
Problem maybe related to user information configured in the USIM card.
Data transfer problem isstill
The problem cannot be located, so continue
Order
Operation
Result
Analysis
unsettled checks.
2 Change UE/data card
Data transfer problem has been solved
Related to UE, such as incompatibility and poorperformance of UE
Data transfer problem isstill unsettled
The problem cannot be located, so continue checks.
3 Change PC Data transfer problem has been solved
Related to drivers, APN, restricted rate, and firewall.
Data transfer problem isstill unsettled
The problem cannot be located, so continue checks.
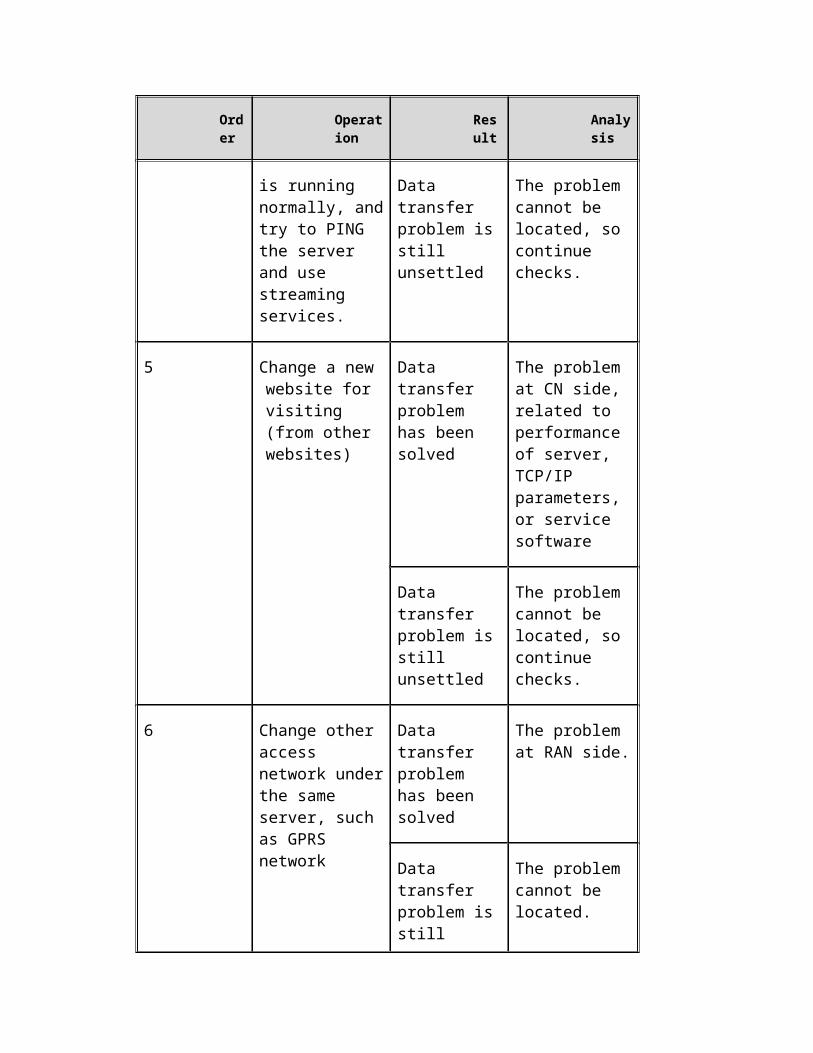
4 Change PC under the same server (ensure than the service
Data transfer problem has been solved
The problem at CN side, related to service software
Order
Operation
Result
Analysis
is running normally, andtry to PING the server and use streaming services.
Data transfer problem isstill unsettled
The problem cannot be located, so continue checks.
5 Change a new website for visiting (from other websites)
Data transfer problem has been solved
The problem at CN side, related to performance of server, TCP/IP parameters, or service software
Data transfer problem isstill unsettled
The problem cannot be located, so continue checks.
6 Change other access network underthe same server, such as GPRS network
Data transfer problem has been solved
The problem at RAN side.
Data transfer problem isstill
The problem cannot be located.
Order
Operation
Result
Analysis
unsettled
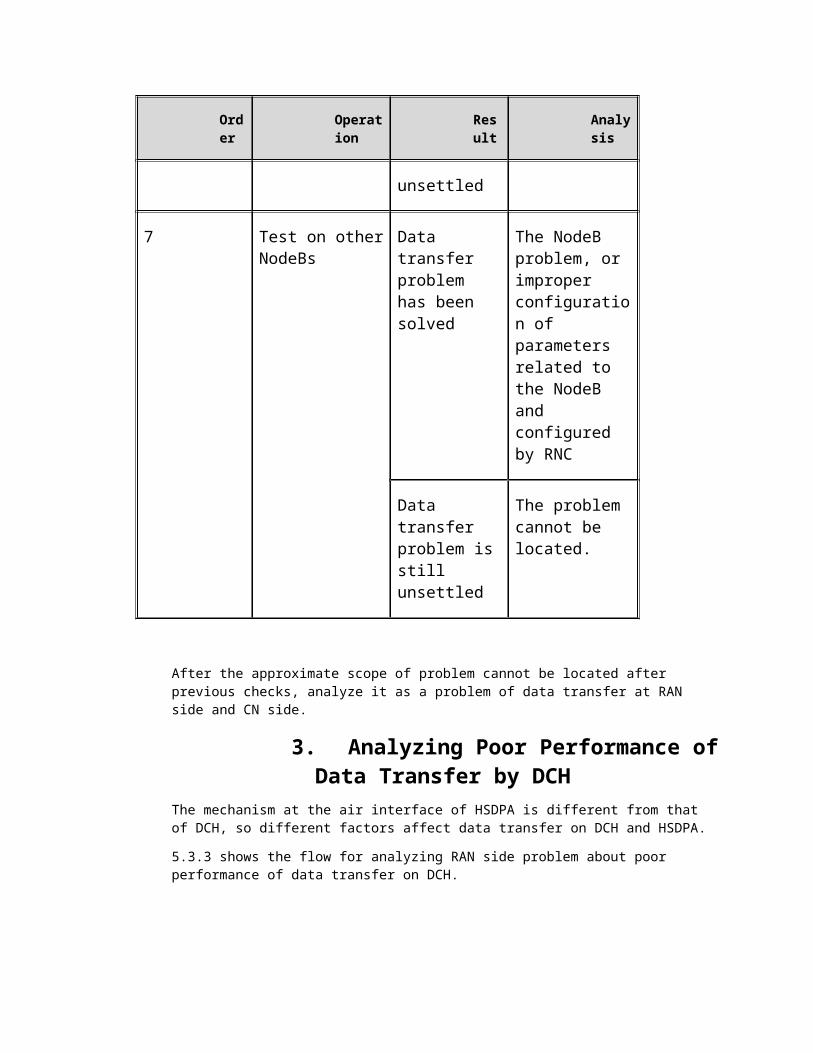
7 Test on otherNodeBs
Data transfer problem has been solved
The NodeB problem, or improper configuration of parameters related to the NodeB and configured by RNC
Data transfer problem isstill unsettled
The problem cannot be located.
After the approximate scope of problem cannot be located after previous checks, analyze it as a problem of data transfer at RAN side and CN side.
3. Analyzing Poor Performance ofData Transfer by DCH
The mechanism at the air interface of HSDPA is different from that of DCH, so different factors affect data transfer on DCH and HSDPA.
5.3.3 shows the flow for analyzing RAN side problem about poor performance of data transfer on DCH.
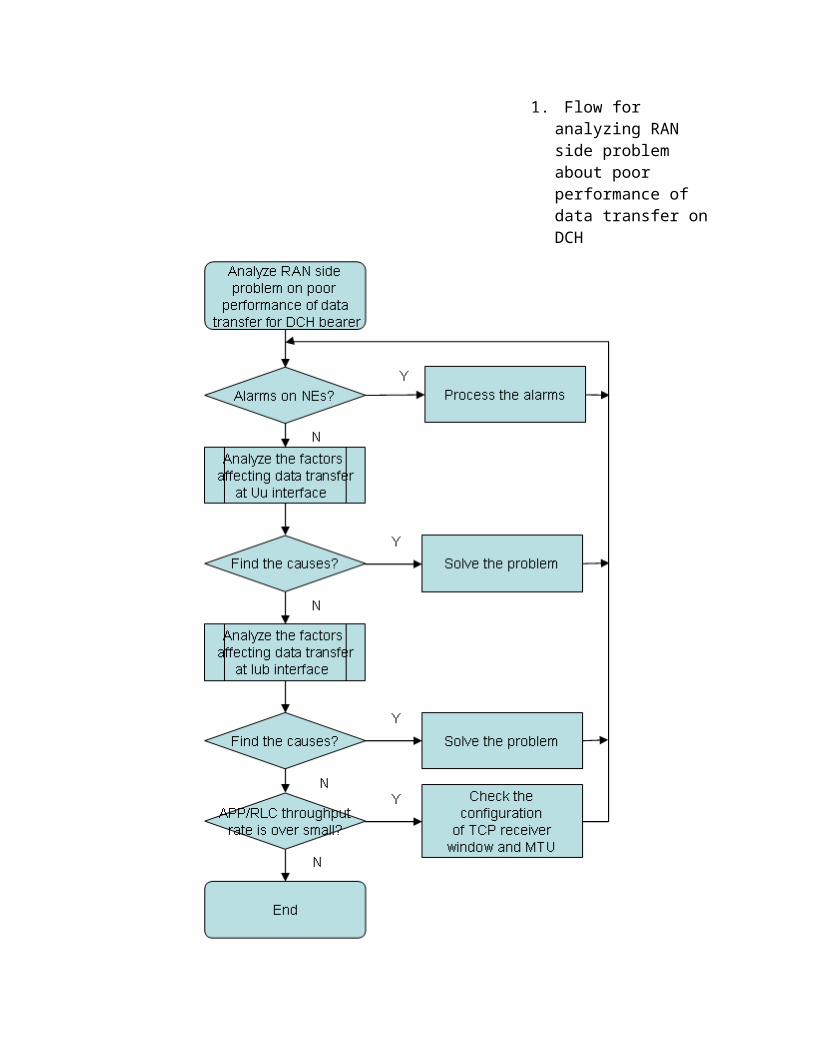
1. Flow for analyzing RAN side problem about poor performance of data transfer on DCH
NE AlarmsAlarm check
If the performance of data transfer for PS services is poor, analyze NodeB and RNC alarms. The clock alarms, alarms on transmission error rate, and transmission interruption may cause fluctuation of PS data. For querying NodeB and RNCalarms, see W-Equipment Room Operations Guide.
Data transfer affected by Uu interface
When PS services are carried by DCH, the factors affecting data transfer at Uu interface includes:
DCH bandwidth State transition Block error rate (BLER) at Uu interface
5.3.3 shows the flow for analyzing data transfer affected by Uu interface.
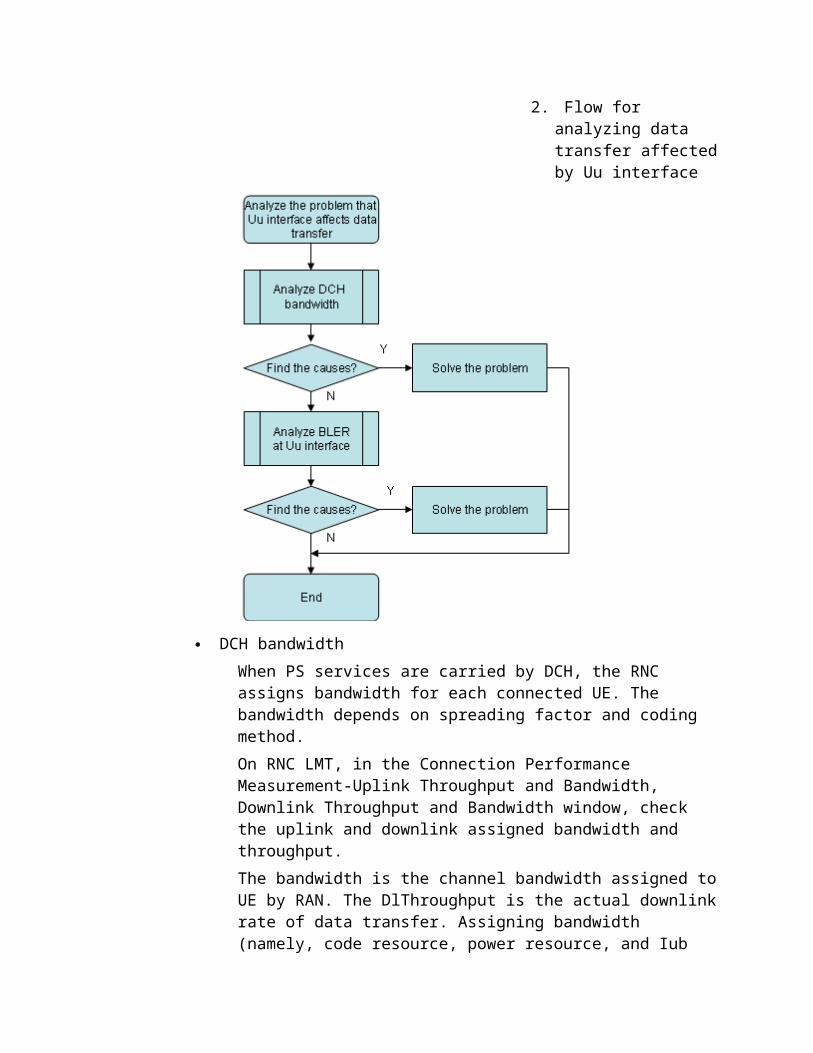
2. Flow for analyzing data transfer affectedby Uu interface
DCH bandwidthWhen PS services are carried by DCH, the RNC assigns bandwidth for each connected UE. The bandwidth depends on spreading factor and coding method.On RNC LMT, in the Connection Performance Measurement-Uplink Throughput and Bandwidth, Downlink Throughput and Bandwidth window, check the uplink and downlink assigned bandwidth and throughput.The bandwidth is the channel bandwidth assigned toUE by RAN. The DlThroughput is the actual downlinkrate of data transfer. Assigning bandwidth (namely, code resource, power resource, and Iub
resource are normal) is normal if one of the following conditions is met:
The bandwidth is the same as the request rate or subscribed rate.
Maximum assignable rate (such as 384 kbps) is met upon DCH bearer.If the bandwidth assigned to UE is smaller than the expectation, there are two causes:
Congestion or other causes. The RAN cannot assign UEwith channels of higher rate, which is abnormal.
DCCC algorithm of RNC. If the DCCC algorithm parameter is rational, the decline of rate is normal.Enable the DCCC algorithm in the existing network so that the system can save resource by reducing assigned bandwidth upon decline or pause of data transfer. However, the DCCC algorithm configuration may be irrational. DCCC algorithm involves rate adjustment based on traffic and coverage, and rate adjustment in soft handover (SHO) SHO areas. According to the parameters configured on site and based on algorithm, judge whether the assignment and adjustment of DCH bandwidth are rational, whether there are abnormalities, and whether the problem is solve byadjusting parameters.If the assigned DCH bandwidth is small due to congestion and other abnormalities, solve the problem by the following methods:
Trace signaling of single subscriber Query cell downlink load, assignment of code
resource, and available bandwidth at Iub interface Obtain CHR from BAM and check the abnormalities on
RNC INSIGHT PLUS or Nastar. BLER at Uu interface
The BLER at uplink and downlink Uu interface directly affect data transfer of PS services. If the average of UL BLER or DL BLER measured in a period is equal to or better than BLER Target, thecode errors at Uu interface are normal. Otherwise,analyze this problem.DL BLER measurement: collect DT data by Probe and UE, and then import the DT data to Assistant for analysis.UL BLER measurement: In Connection Performance Measurement-Uplink Transport Channel BLER window, import the measurement file to Assistant, and analyze together with the Probe DT data files.The power control and coverage affects the uplink and downlink BLER in the following aspects:
Outer loop power control switch. Check that the outer loop power control switch of RNC is on.
Coverage. Check whether the uplink and downlink are restricted in the areas with bad UL BLER and DL BLER. For details, see W-RF Optimization Guide.
Performance of UE. Change a UE of other types and compare their performance.
In Sequence Delivery Set the sequence submission to TURE or FALSE. This
affects the rate and fluctuation of downlink. If youset the sequence submission to TURE, the RLC keeps the transfer sequence of upper-layer PDUs. If set the sequence submission to FALSE, the receiver RLC entity allows sending SDUs to upper-layer in a sequence different from the sender. If you set the sequence submission to FALSE, the uplink rate for data transfer will be low and data transfer fluctuates much.
Setting sequence submission to TURE by executing thecommand MOD GPRS on Huawei HLR is recommended.
Data Transfer Affected by Iub Interface
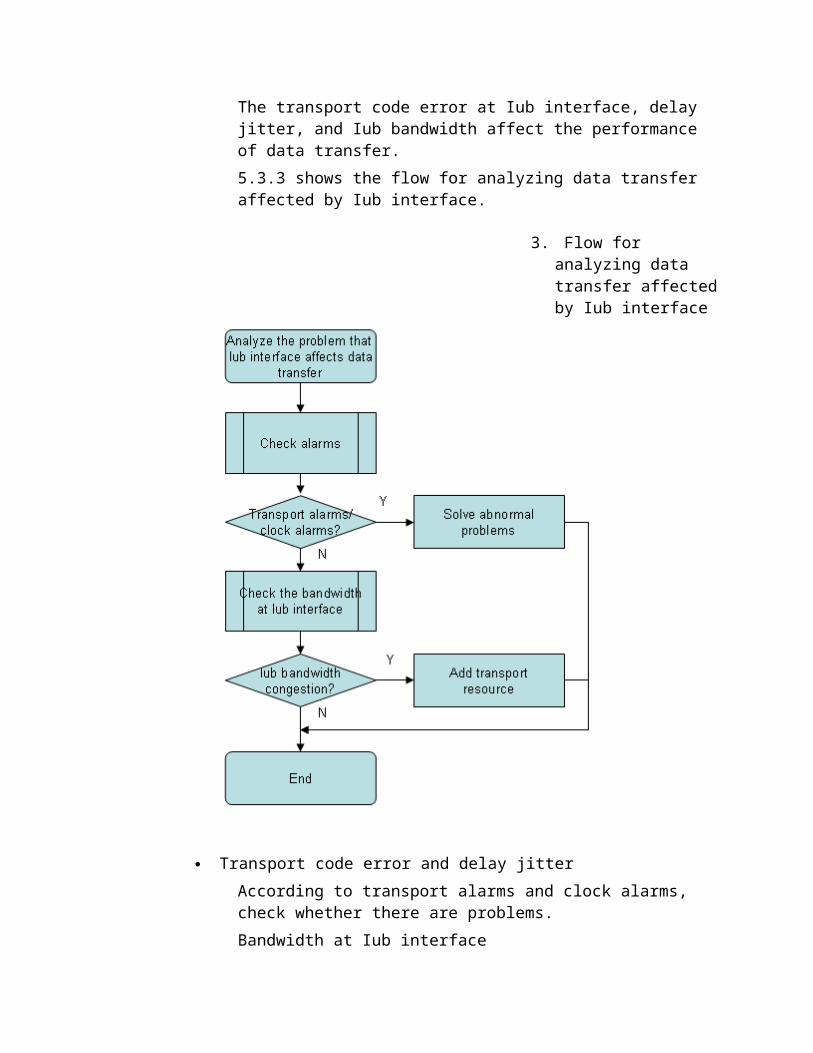
The transport code error at Iub interface, delay jitter, and Iub bandwidth affect the performance of data transfer.5.3.3 shows the flow for analyzing data transfer affected by Iub interface.
3. Flow for analyzing data transfer affectedby Iub interface
Transport code error and delay jitterAccording to transport alarms and clock alarms, check whether there are problems.Bandwidth at Iub interface
Check whether the Iub interface is congested by the following methods:
Querying the bandwidth at Iub interface on RNC LMT and NodeB LMT.
Referring to the section Flow for Analyzing Cell-level Traffic Statistics Data.
Checking abnormal record in CHR
Querying bandwidth at Iub interface at RNC side proceeds as below: Query adjacent node corresponding to each cell by executing the
command LST AAL2ADJNODE Query the path of the NodeB by executing the command LST AAL2PATH. Query the bandwidth by executing the command LST ATMTRF. Query the residual bandwidth by executing the commands DSP
AAL2ADJNODE and DSP AAL2PATH at RNC side.Querying the bandwidth at Iub interface at NodeB side proceeds as below:AAL2PATH is necessary at NodeB. The relevant commands include LST AAL2PATH and DSP AAL2PATH.
Comparison of Throughput at APP and RLC Layer
The throughput at APP and RLC layer is obtainable by DT/CQT. For the theoretical relationship of rate at each layer, see the appendix 8.2.If the rate of APP throughput and RLC throughoutis lower than the normal range according to theoretical analysis, the retransmission cost ofTCP/IP is over large. Check and modify the TCP receiver window and MTU configuration. For the method, see the appendix 8.4 and 8.5.
4. Analyzing Poor Performance ofData Transfer by HSDPA at RAN Side
The HSDPA network schedules power and code resources by code division or time division between multiple subscribers. When there
is only one HSDPA subscriber in a cell, the following factors affectthe rate for data transfer:
HSDPA available power Number of HS-PDSCH codes in cell (when there is only
one subscriber, a HS-SCCH is necessary) Category of UE (maximum number of codes supported by
UE and whether to support 16QAM) Radio signals near UE
In addition, the following factors affect the reachable maximum rate:
Subscribed rate Bandwidth at Iub interface Maximum rate supported by RNC, NodeB, GGSN, and
SGSN.When there are multiple subscribers, besides previous factors, the scheduling algorithm used by NodeB and number of HS-SCCH configured to cell affects the rate of data transfer.
An HSDPA subscriber works as below:
The UE reports CQI on HS-DPCCH. The NodeB obtains the CQI of UE's location.
The scheduling module inside NodeB evaluates different subscribers by channel conditions, the amount of data in cache for each subscriber, the last serving time. It then determines the HS-DSCH parameters.
The NodeB sends HS-DSCH parameters on HS-SCCH, and after two slots it sends data on HS-DSCH.
The UE monitors HS-SCCH for information sent to it. If there is any schedule information, it starts receiving HS-DSCH data and buffers them.
According to HS-SCCH data, the UE judges whether to combine the received HS-DSCH data and data in soft buffer.
The UE demodulates the received HS-DSCH data, and send the ACK/NACK message on uplink HS-DPCCH according to CRC result.
If the NodeB receives the NACK message, it resends the data until it receives the ACK message or reaches the maximum retransmission times.
In the DT tool Probe, out of consideration for multiple subscriber scheduling and retransmission at MAC-HS layer, there are three ratesat MAC-HS layer:Scheduled Rate,Served Rate,MAC Layer Rate.
Served Rate = Scheduled Rate * HS-SCCH Success RateMAC Layer Rate = Served Rate * (1- SBLER)
Scheduled rateSchedule rate = total bits of all TBs received in statistics period/total time with TB scheduled in statistics periodThe total bits of all TBs received in statistics period include all the bits of received correct and wrong TBs.The total time with TB scheduled in statistics period includes the time with data received and excludes the time without data received.
Served rateServed rate = total bits of all TBs received in statistics period/statistics periodThe total bits of all TBs received in statistics period include the bits of received correct and wrong TBs.The statistics period includes the time with and without data received.
MAC layer rateMAC Layer Rate = total bits of correct TBs received in statistics period/statistics period
The total bits of correct TBs received in statistics period include the bits of correct TBs and exclude bits of wrong TBs.The statistics period includes the time with and without data received.
HS-SCCH success rate is the success rate for receiving HS-SCCH data by UE
SLBER = wrong TBs received at MAC-HS layer/(receivedcorrect and wrong TBs)
ACK->NACK/DTX is the ratio that NodeB judges the ACKmessage as NACK/DTX message.
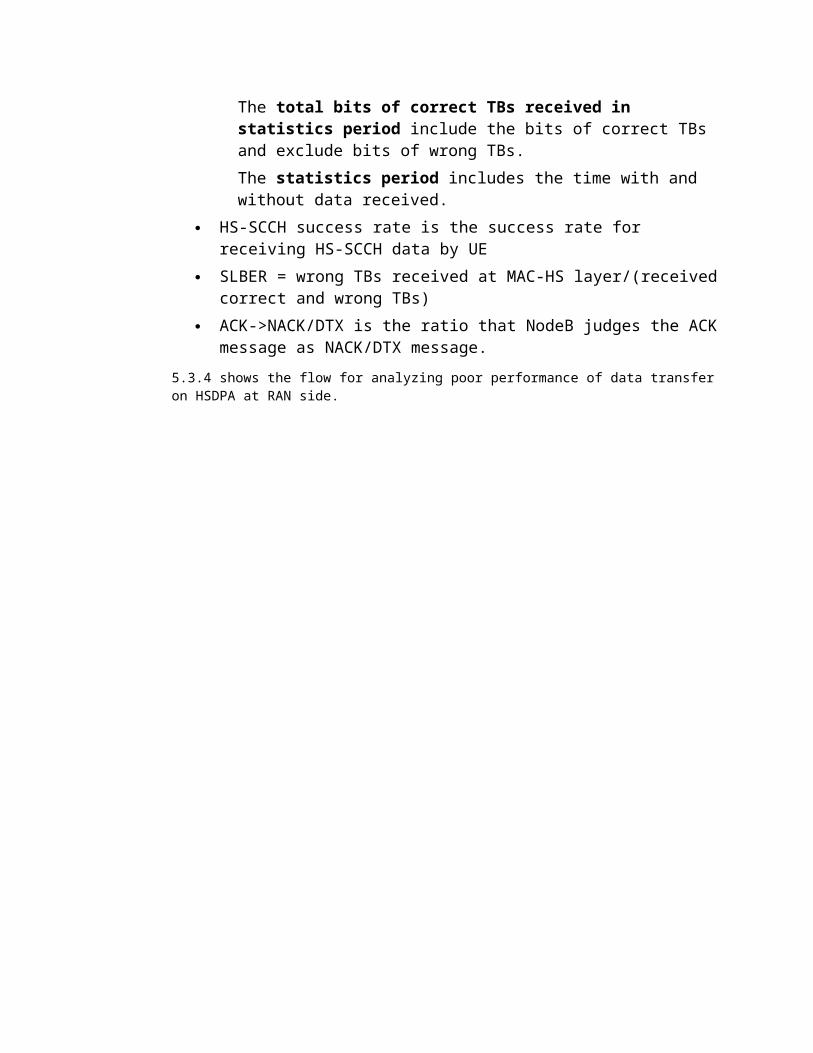
5.3.4 shows the flow for analyzing poor performance of data transferon HSDPA at RAN side.
1. Flow for analyzing poor performance of data transfer on HSDPA at RAN side
NE AlarmsWhen the performance of data transfer for PS services is poor, analyze the NodeB and RNC alarms. The clock alarms, alarms on transport code error, and transmission interruption may lead to fluctuation of PS data. For querying NodeB and RNC alarms, see W-Equipment Room Operations Guide.
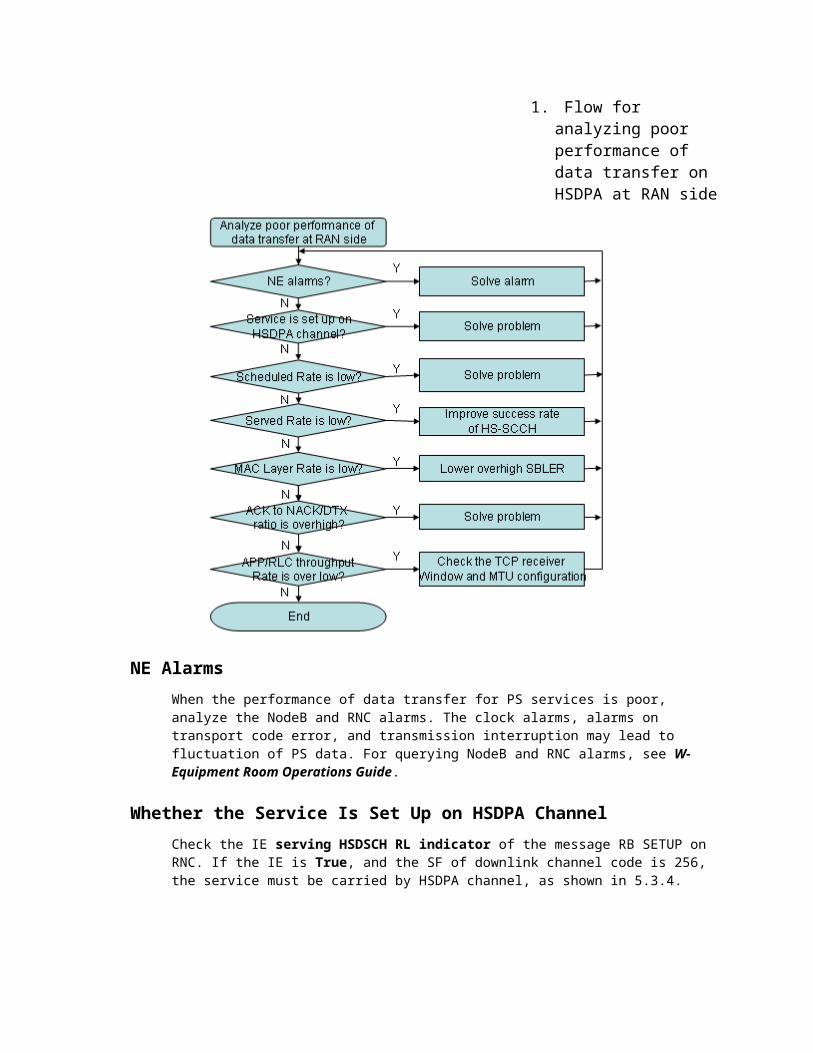
Whether the Service Is Set Up on HSDPA ChannelCheck the IE serving HSDSCH RL indicator of the message RB SETUP on RNC. If the IE is True, and the SF of downlink channel code is 256, the service must be carried by HSDPA channel, as shown in 5.3.4.
2. Confirming in the RNC message that PS service is set up on HSDPA channel
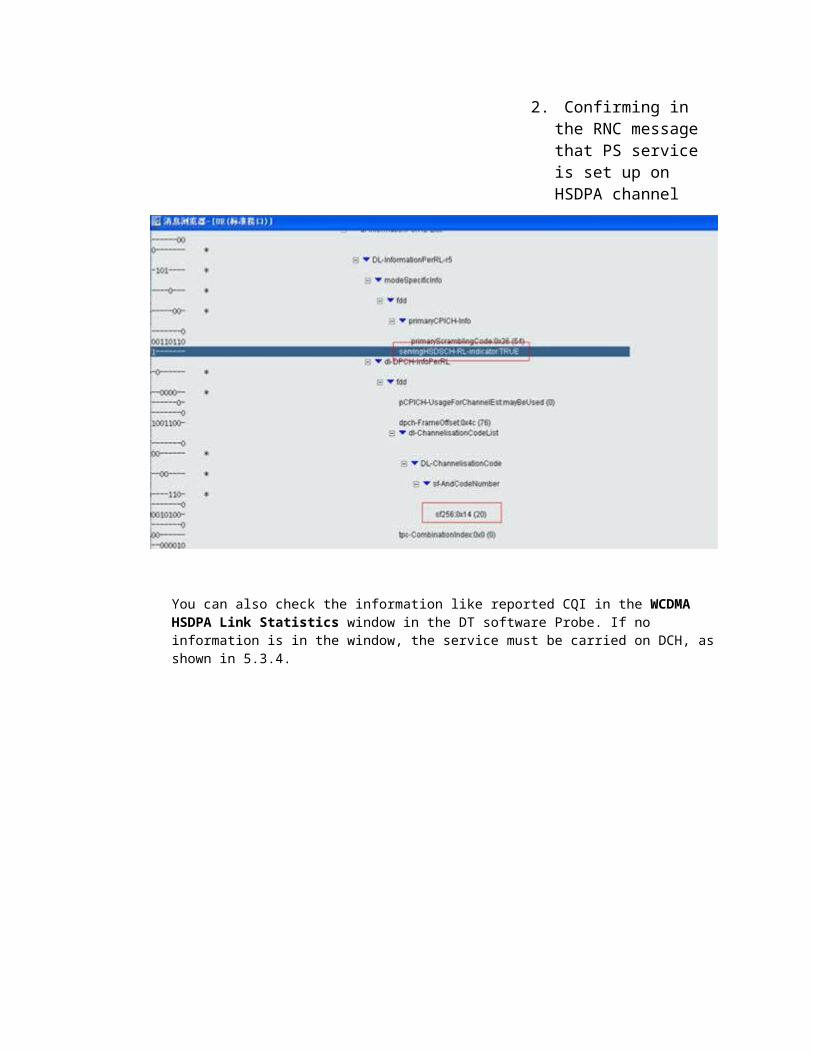
You can also check the information like reported CQI in the WCDMA HSDPA Link Statistics window in the DT software Probe. If no information is in the window, the service must be carried on DCH, asshown in 5.3.4.
3. Confirming in Probe that service is set upon HSDPA channel
If the service is not set up on HSDPA channel, it will automaticallybe set up on DCH. Now the service rate is the rate of R99 service, usually equal to or smaller than 384 kbps.
If it is confirmed that the service is not set up on HSDPA channel, analyze it from the following aspects.
HSDPA cell is not set upCheck at RNC side whether the HSDPA cell is activated by executing the command LST CELLHSDPA.Check at NodeB side whether the local cell supports HSDPA. Check by executing the command LSTLOCELL whether the value of the local cell is TRUEor FALSE.If the HSDPA cell at RNC side is not activated, activate it by executing the command MOD LOCELL: LOCELL=0, HSDPA=TRUE.
In addition, during modifying the HSDPA cell configuration on RNC, if HSDPA codes are statically assigned, and if there are excessive R99 subscribers connected to the cell so the code assigned to HSDPA is inadequate, the RNC still displays that the modifying HSDPA cell configuration succeeds. However, actually the HSDPA cell is not successfully set up. Check whether the codes assigned to HSDPA cell are successful by selecting Realtime Performance Monitoring > Cell Performance Monitoring > Code Tree Tracing on RNC.
Incorrect type of HSDPA AAL2PATH or No ConfigurationSet the type of HSPDA AAL2PATH to HSDPA_RT or HSDPA_NRT. Otherwise the cell can support R99 services only, but not HSDPA services. It is recommended that one HSDPA AAL2PATH is configured to one NodeB. If multiple HSDPA AAL2PATHs are configured, the data packets are easily dropped inthe current version. Query it at RNC or NodeB sideby executing the commandLST AAL2PATH.If the HSDPA AAL2PATH is set to RT or NRT, the downlink subscription rate of UE is 2 Mbps. When the UE accesses the network, setting subscriber plane for HSDPA service fails, and the RNC will automatically set up the subscriber plane of PS 384kbps service. According to signaling of the RB Setup message, the service is set up on R99, and SF is 8.
HSDPA subscriber's admission failureThe HSDPA subscriber's admission failure leads to that the RNC reconfigures HSDPA service to be carried by PS384K channel of R99 service. If the service cannot be set up, the UE continues to access the network after lowering the rate of R99 service. If the rate of connected HSDPA subscriberis as low as 384 kbps, 128 kbps, or 64 kbps of R99
services according to test, confirm whether the service is set up on HSDPA channel and whether theadmission fails.Check whether the following aspects are rational:
Uplink and downlink load of R99 services Downlink code resource Iub transmission resource Number of HSDPA subscribers Threshold of HSDPA cell rate Guaranteed rate threshold of streaming service Guaranteed power threshold Over high HSDPA threshold for downlink BE service
The HSDPA threshold for downlink BE service defines the rate judgment threshold for backgroundor interactive services carried on HS-DSCH in PS domain. If the request rate is great than or equalto the threshold, the PS service is carried on HS-DSCH; otherwise, the PS service is carried on DCH.Set HSDPA threshold for downlink BE service by executing the command SET FRC: DlBeTraffThsOnHsdpa=D384 on RNC.
Low Scheduled RateThe TB size of NodeB scheduling depends on CQI, HSDPA codes, available power for HSDPA, and so on. TB size/2ms is scheduled rate.
Normally, there is mapping relationship (depending on mapping table of NodeB CQI in actual use) between the schedule rate and CQI reported by UE. The NodeB will filter and adjust the CQI reported byUE, so the scheduled rate and CQI scheduled by NodeB have mapping relationship, not completely having mapping relationship with the CQI reported by UE.
5.3.4 lists the relationship between CQI and TB size according to the protocol 3GPP 25.306. It is only for reference, the product realization does not completely consist with protocol.
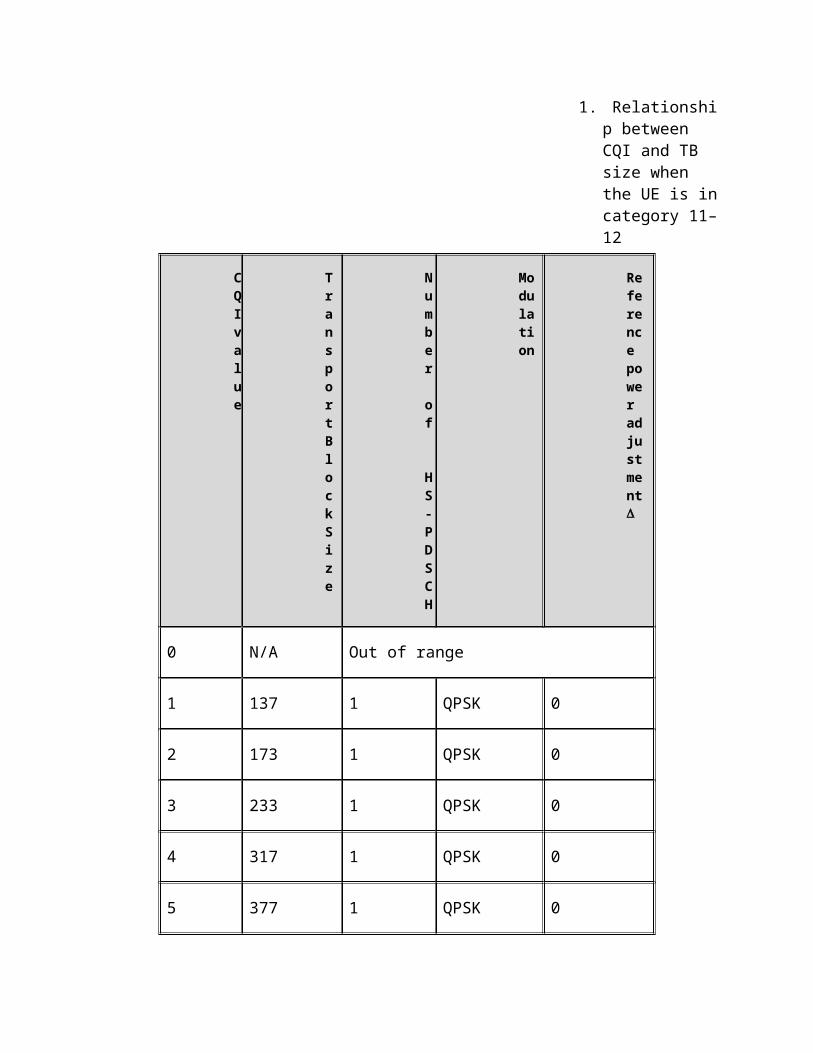
1. Relationship between CQI and TB size when the UE is incategory 11–12
CQIvalue
TransportBlockSize
Number of
HS-PDSCH
Modulation
Reference power adjustment
0 N/A Out of range
1 137 1 QPSK 0
2 173 1 QPSK 0
3 233 1 QPSK 0
4 317 1 QPSK 0
5 377 1 QPSK 0

CQIvalue
TransportBlockSize
Number of
HS-PDSCH
Modulation
Reference power adjustment
6 461 1 QPSK 0
7 650 2 QPSK 0
8 792 2 QPSK 0
9 931 2 QPSK 0
10 1262 3 QPSK 0
11 1483 3 QPSK 0
12 1742 3 QPSK 0
13 2279 4 QPSK 0
14 2583 4 QPSK 0

CQIvalue
TransportBlockSize
Number of
HS-PDSCH
Modulation
Reference power adjustment
15 3319 5 QPSK 0
16 3319 5 QPSK –1
17 3319 5 QPSK –2
18 3319 5 QPSK –3
19 3319 5 QPSK –4
20 3319 5 QPSK –5
21 3319 5 QPSK –6
22 3319 5 QPSK –7
23 3319 5 QPSK –8
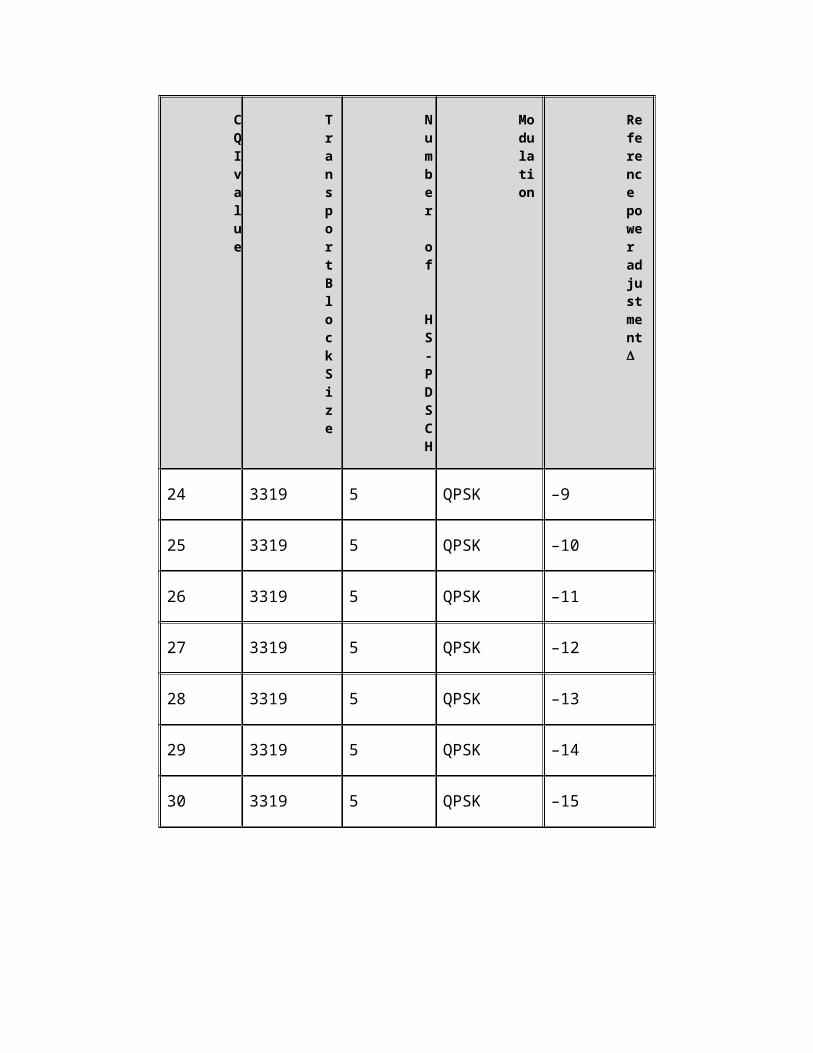
CQIvalue
TransportBlockSize
Number of
HS-PDSCH
Modulation
Reference power adjustment
24 3319 5 QPSK –9
25 3319 5 QPSK –10
26 3319 5 QPSK –11
27 3319 5 QPSK –12
28 3319 5 QPSK –13
29 3319 5 QPSK –14
30 3319 5 QPSK –15
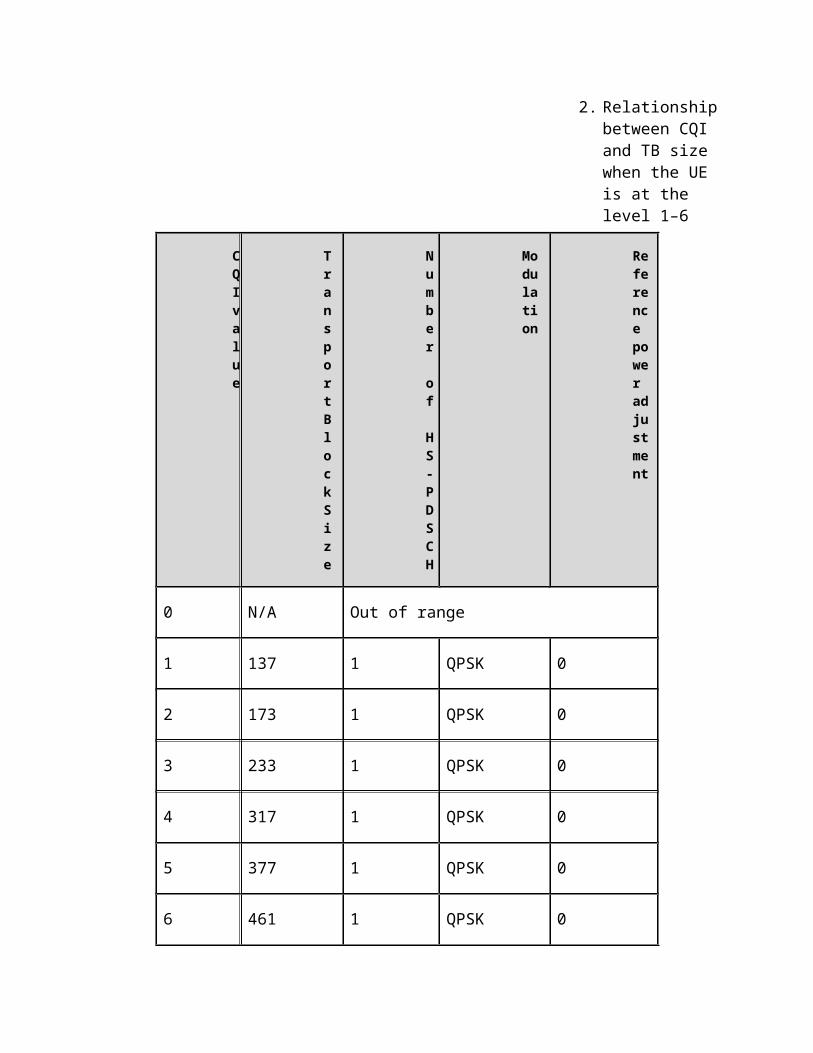
2. Relationshipbetween CQI and TB size when the UE is at the level 1–6
CQIvalue
TransportBlockSize
Number of HS-PDSCH
Modulation
Reference power adjustment
0 N/A Out of range
1 137 1 QPSK 0
2 173 1 QPSK 0
3 233 1 QPSK 0
4 317 1 QPSK 0
5 377 1 QPSK 0
6 461 1 QPSK 0
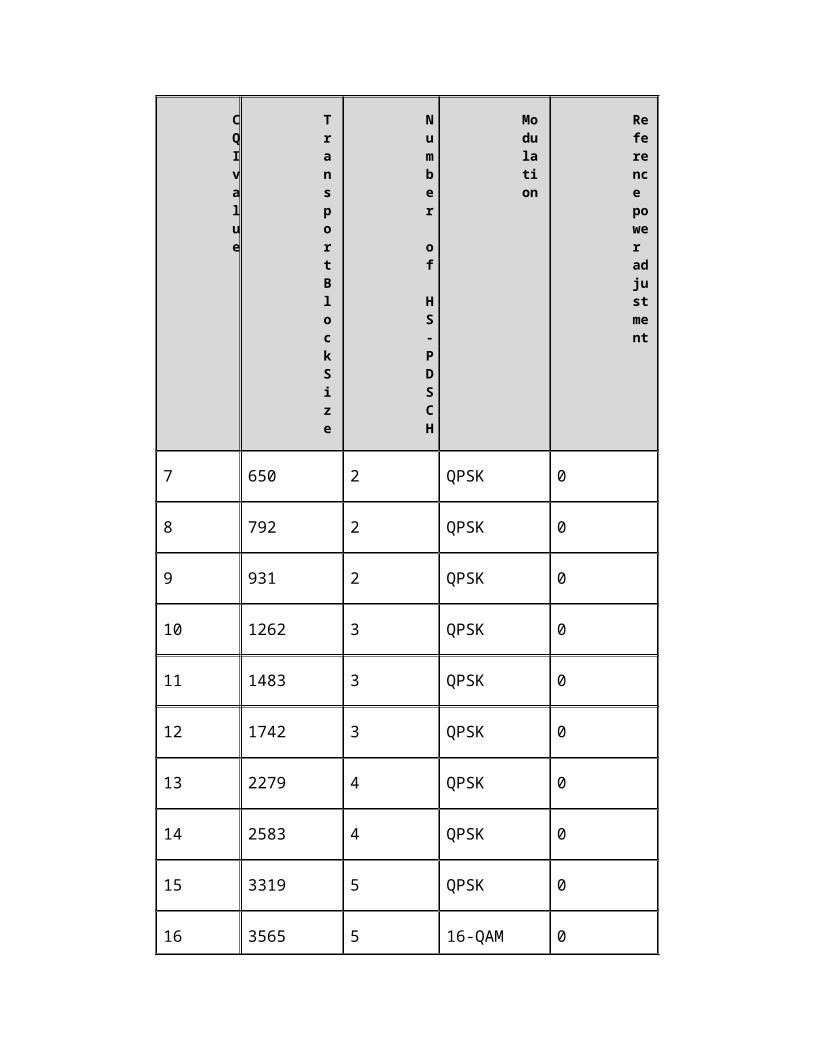
CQIvalue
TransportBlockSize
Number of HS-PDSCH
Modulation
Reference power adjustment
7 650 2 QPSK 0
8 792 2 QPSK 0
9 931 2 QPSK 0
10 1262 3 QPSK 0
11 1483 3 QPSK 0
12 1742 3 QPSK 0
13 2279 4 QPSK 0
14 2583 4 QPSK 0
15 3319 5 QPSK 0
16 3565 5 16-QAM 0
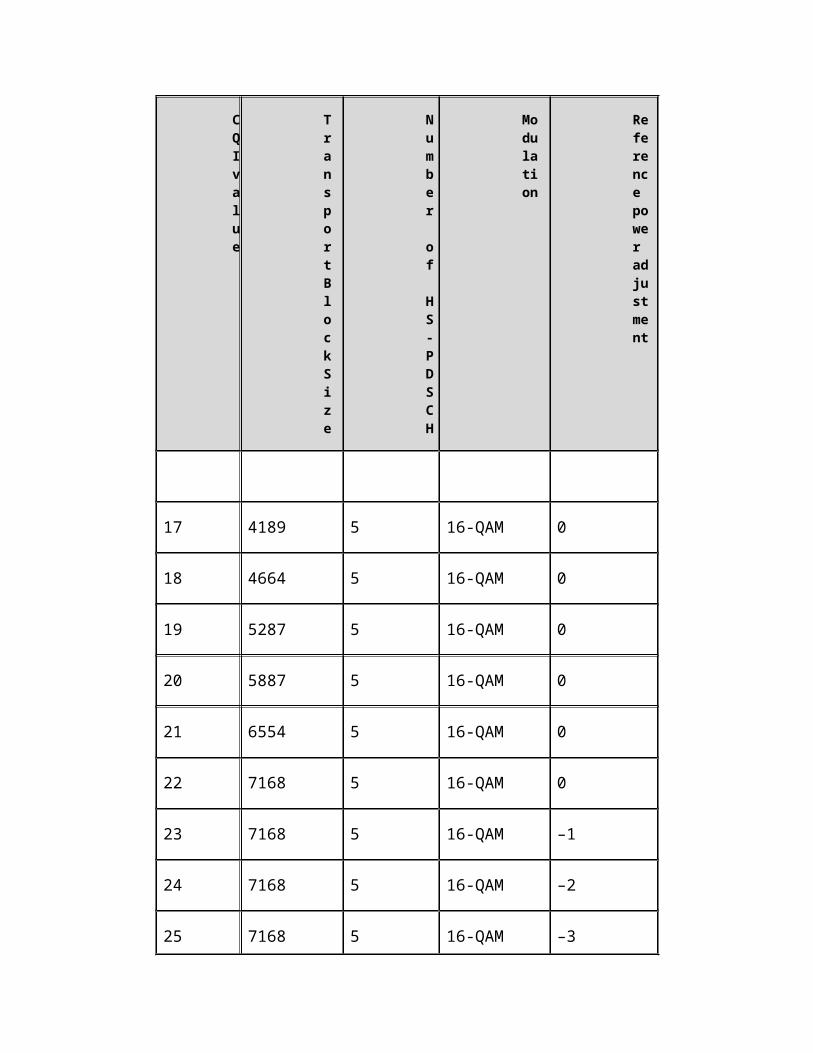
CQIvalue
TransportBlockSize
Number of HS-PDSCH
Modulation
Reference power adjustment
17 4189 5 16-QAM 0
18 4664 5 16-QAM 0
19 5287 5 16-QAM 0
20 5887 5 16-QAM 0
21 6554 5 16-QAM 0
22 7168 5 16-QAM 0
23 7168 5 16-QAM –1
24 7168 5 16-QAM –2
25 7168 5 16-QAM –3
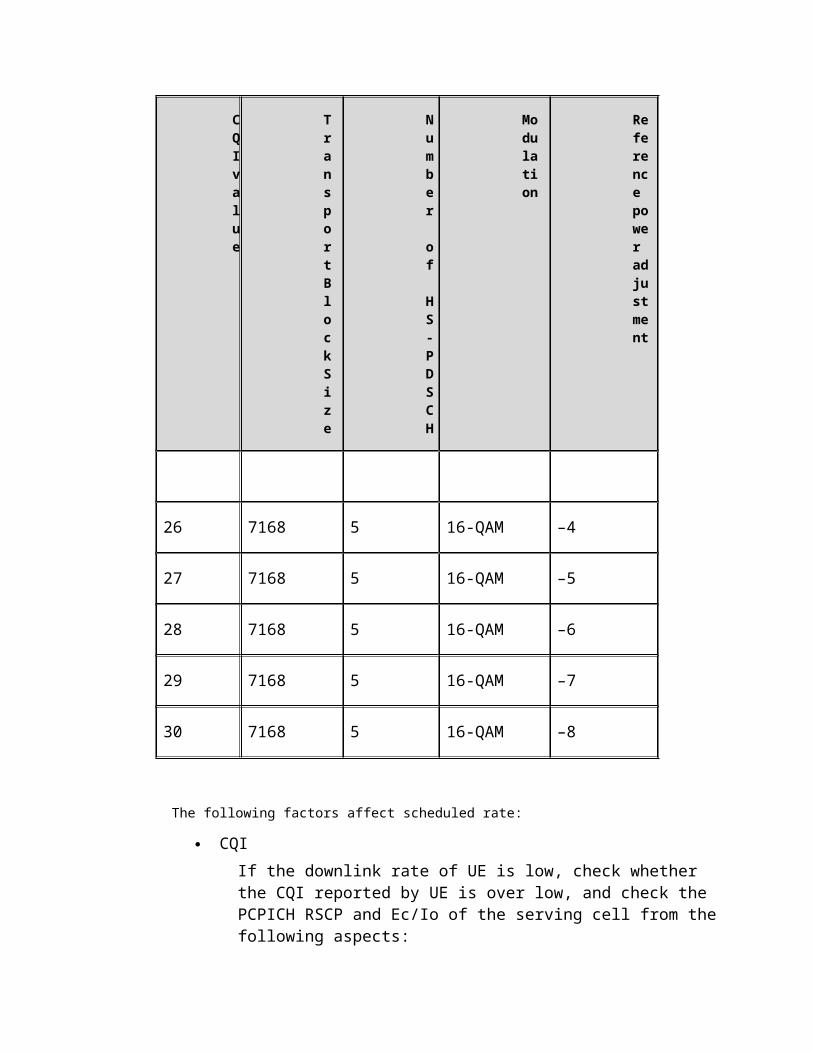
CQIvalue
TransportBlockSize
Number of HS-PDSCH
Modulation
Reference power adjustment
26 7168 5 16-QAM –4
27 7168 5 16-QAM –5
28 7168 5 16-QAM –6
29 7168 5 16-QAM –7
30 7168 5 16-QAM –8
The following factors affect scheduled rate:
CQIIf the downlink rate of UE is low, check whether the CQI reported by UE is over low, and check the PCPICH RSCP and Ec/Io of the serving cell from thefollowing aspects:
The coverage is weak, and the CQI reported by UE is low.
The interference is strong, and there is pilot pollution, and the CQI reported by UE is low.
When the HSDPA serving cell is frequently updated, the HSDPA subscribers cannot change accordingly due to punishment, so the CQI reported by UE is low.
If the coverage is weak, improve the CQI reported by UE by RF optimization and constructing sites.
If the interference is strong, adjust the azimuth and down tilt in RF optimization. This forms a primary cell.
If the HSDPA serving cell is frequently updated, avoid frequent handover by adjusting antenna azimuth and down tiltor constructing sites in RF optimization.
Available power of HSDPA cellIf the available power of HSDPA cell is over low, the TB size of NodeB scheduling will be affected.HSDPA power configuration includes dynamic and static configuration.The RNC MML is MOD CELLHSDPA: HSDPAPOWER=430. The unit of HSDPA power is 0.1 dB. The total power of all HS-PDSCHs and HS-SCCHs must not exceed the HSDPAPOWER.When HSDPAPOWER in previous formula is higher thanor equal to total power of cell, the HSDPA power configuration is dynamic configuration. The available power of HSDPA cell = total power of cell * (1 – power margin) – power used by R99 TCH and CCH.When HSDPAPOWER in previous formula is lower than total power of cell, the HSDPA power configurationis static configuration. Namely, the available power of HSDPA cell is the HSDPAPOWER. However, the maximum available power = total power of cell * (1 – power margin) – CCH power.
In static power distribution, the R99 services may occupy the powerof HSDPA cell, so the actual power used by HSDPA cell is not the configured power.
Analyze the factors affecting available power of HSDPA cell from the following aspects:
Query power margin by executing the command LST MACHSPARA on NodeB. The default power margin is 10%,namely, the total downlink load of cell can use 90% of total power of cell.
On RNC LMT, select Realtime Performance Monitoring > Cell Performance Monitoring > Tx Carrier Power. Observe the transmit carrier power and power used by non-HSDPA subscribers. The available power of HSDPA = transmit carrier power - power used by non-HSDPA subscribers. If the power used by non-HSDPA subscribers is over high, the available power of HSDPA cell becomes low, so the scheduled rate is affected.
Available codes of HSDPA cellIf inadequate codes are assigned to HSDPA subscribers, the TB size of NodeB scheduling will be affected..
HSDPA UE CATEGORYThe 3GPP protocol 25.306 defines 12 types of UE category. In a TTI, the UE of a type obtains different maximum TB size, so the maximum scheduled rate obtained by UE is different.The UE reports its capability in the IE hsdsch physical layer category of the RRC Connection Setup Complete message..
Amount of data to be transmitted being smaller than the maximum TB sizeThe TB size scheduled by NodeB depends on the available power and codes of the subscriber, as well as the amount of data transferred by the subscriber. If the amount of data sent is smaller
than the maximum scheduled TB size, the rate at physical layer is lower than the expectation.This problem occurs when there is data in NodeB buffer but the amount of data is inadequate for a scheduled maximum TB size.
Low Served RateAccording to the previous formula Served Rate = Scheduled Rate * HS-SCCH Success Rate, if the scheduled rate is normal, over low HS-SCCHsuccess rate leads to over low served rate. If there is only one subscriber in normal conditions, and the HS-SCCH power and traffic are not restricted, the success rate of HS-SCCH is shall be highly approach to 100%.
The success rate of HS-SCCH is relevant to HS-SCCH power, number of HS-SCCHs, number of subscribers, scheduling algorithm, and transported traffic. The following paragraphs describe them respectively.
HS-SCCH power distributionThe HS-SCCH is a downlink CCH, shared by all subscribers. The UE keeps monitoring UE ID on HS-SCCH, and judge whether the UE ID is for itself. If the UE ID is for itself, it demodulates HS-PDSCH data. Therefore, correct demodulation of HS-SCCH goes before data transfer.There are three types of HS-SCCH power, transit 【SET MACHSPARA】 in NodeB , 0 shows that HS-SCCH power control is based on CQI . 1 shows HS-SCCH power changeless; 2 shows use a power control mode which go with DCH and keep a fixed power deflection value. Default is 0. (Attention: the edition before NodeB3812EV100R007C03B040 can’tbe set to type 0, need use type 1 .)The HS-SCCH power is in static configuration or dynamic configuration.The default configuration is static configuration.Set the HS-SCCH power to a fixed ratio of maximum transmit power of cell as below:
Set the ratio to 3% in indoor environment.
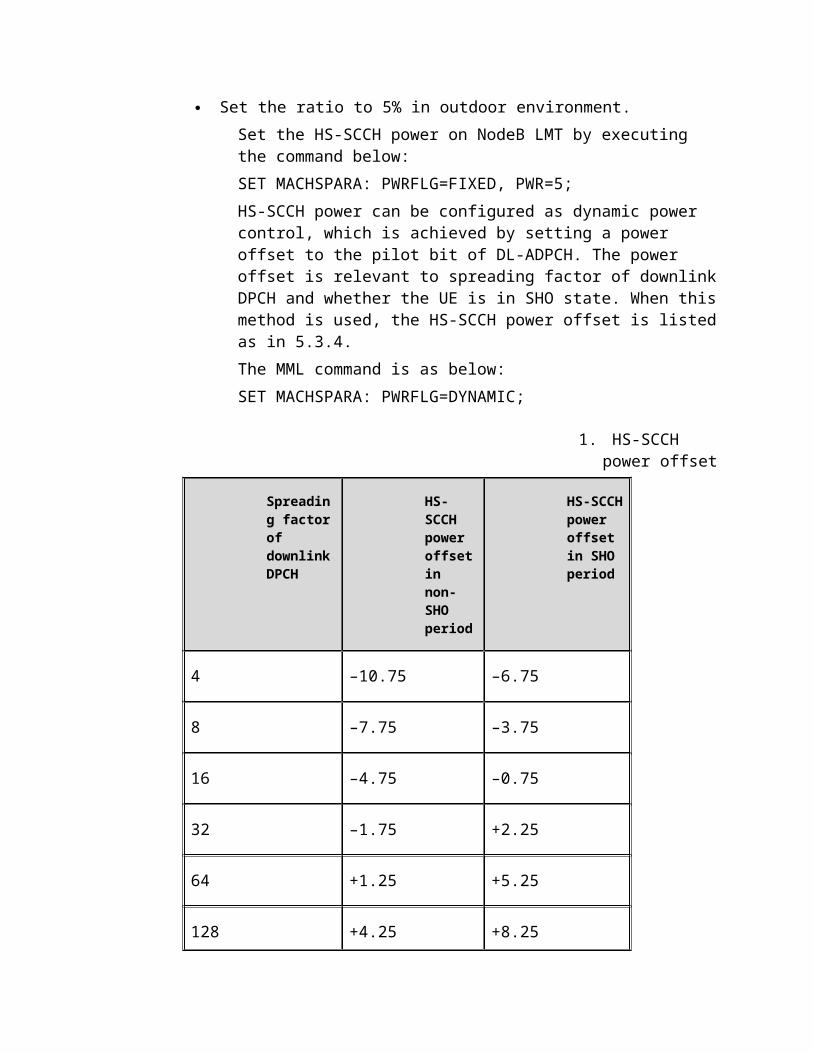
Set the ratio to 5% in outdoor environment.Set the HS-SCCH power on NodeB LMT by executing the command below:SET MACHSPARA: PWRFLG=FIXED, PWR=5;HS-SCCH power can be configured as dynamic power control, which is achieved by setting a power offset to the pilot bit of DL-ADPCH. The power offset is relevant to spreading factor of downlinkDPCH and whether the UE is in SHO state. When thismethod is used, the HS-SCCH power offset is listedas in 5.3.4.The MML command is as below:SET MACHSPARA: PWRFLG=DYNAMIC;
1. HS-SCCH power offset
Spreading factorof downlinkDPCH
HS-SCCH power offsetin non-SHO period
HS-SCCHpower offset in SHO period
4 –10.75 –6.75
8 –7.75 –3.75
16 –4.75 –0.75
32 –1.75 +2.25
64 +1.25 +5.25
128 +4.25 +8.25
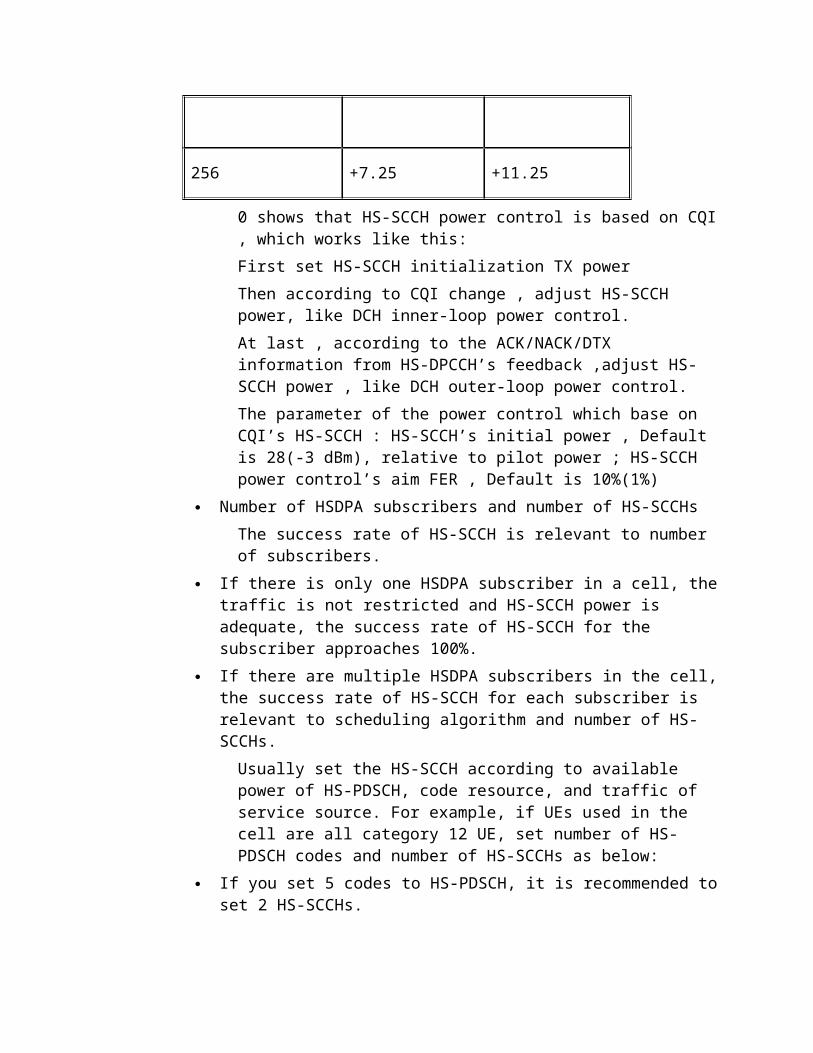
256 +7.25 +11.25
0 shows that HS-SCCH power control is based on CQI, which works like this:First set HS-SCCH initialization TX powerThen according to CQI change , adjust HS-SCCH power, like DCH inner-loop power control.At last , according to the ACK/NACK/DTX information from HS-DPCCH’s feedback ,adjust HS-SCCH power , like DCH outer-loop power control.The parameter of the power control which base on CQI’s HS-SCCH : HS-SCCH’s initial power , Default is 28(-3 dBm), relative to pilot power ; HS-SCCH power control’s aim FER , Default is 10%(1%)
Number of HSDPA subscribers and number of HS-SCCHsThe success rate of HS-SCCH is relevant to number of subscribers.
If there is only one HSDPA subscriber in a cell, thetraffic is not restricted and HS-SCCH power is adequate, the success rate of HS-SCCH for the subscriber approaches 100%.
If there are multiple HSDPA subscribers in the cell,the success rate of HS-SCCH for each subscriber is relevant to scheduling algorithm and number of HS-SCCHs.Usually set the HS-SCCH according to available power of HS-PDSCH, code resource, and traffic of service source. For example, if UEs used in the cell are all category 12 UE, set number of HS-PDSCH codes and number of HS-SCCHs as below:
If you set 5 codes to HS-PDSCH, it is recommended toset 2 HS-SCCHs.
If you set 10 codes to HS-PDSCH, it is recommended to set 3 HS-SCCHs.
If you set 14 codes to HS-PDSCH, it is recommended to set 4 HS-SCCHs.
Scheduling algorithmUsing different scheduling algorithm for multiple subscribers enables each subscriber to be scheduled at different probability. For example, after Max C/I scheduling algorithm is used, the subscribers far from the cell center will hardly or even never be scheduled due to low CQI.The scheduling algorithm is one function of new function entity of HSDPA, the MAC-hs function entity. Four factors are involved as below:
CQICQI is the quality of signals received by UE at the location.
Wait_Inter_TTIIt indicates the length of time that the UE mustwait for service.
Queue priority Queue length
The following scheduling algorithms are typical: Max C/I (only considering CQI value) RR (only considering wait_Inter_TTI) Classic PF (proportional fair, considering previous
factors) EPF(Enhanced Proportional Fair),V17 edition
Parameters are not configured for current scheduling algorithm. Select one of previous threealgorithms by executing the command below:SET MACHSPARA: LOCELL=10131, SM=PF;//The previous algorithm corresponds to the PF scheduling algorithm.
TrafficAfter previous configuration and checks, there is no problem and CQI reported by UE is high, but therate of subscribers fluctuates. Check downlink traffic in Connection Performance Monitoring window on RNC LMT, and see whether there is enough traffic for scheduling. Or check downlink traffic in HSDPA User Flow Control Performance Periodic Report window on NodeB LMT.The cause of this problem is unstable source rate,single thread used upon downloading, and small TCPwindow.In the HSDPA User Flow Control Performance Periodic Report window, there are following selections:
Queue Priority Queue Buffer Used Ratio RLC User Buffer Size Input Data Size Output Data Size
Select Queue Buffer Used Ratio to draw picture on LMT, and check the occupation of NodeB queue.Select RLC User Buffer Size to check RLC buffer.Select Input Data Size and Output Data Size to check the sending and receiving queue data. The data involved in Output Data Size is the data withACK indicator received.
Restricted Rate at UE sideThe request service type, uplink and downlink maximum rate are sent to UE by AT commands. The UEsends the information to CN in the following Active PDP context request message. When the subscribed rate is higher than or equal to the requested maximum rate, the CN sends the RAN Assignment request message at the requested maximum rate. If the resource is not restricted at
RNC side, the final output rate is the request maximum rate. If the downlink maximum rate in the RAB Assignment request message is much lower than scheduled rate, and the traffic in buffer is inadequate upon NodeB's scheduling, the success rate of HS-SCCH must be low.Execute AT commands as below:
Right click My Computer Select Property > Hardware > Device Manager > Modem
> Property > Senior Type AT command into the Initialization Command text
box. Set APN by AT command. If you want to set APN to cmnet, the rate is restricted to 64 kbps in uplink and 384 kbps in downlink, execute the following command: AT+cgdcont=1,"ip","cmnet"; +cgeqreq=1,3,64,384When you remove the restriction on rate, execute AT command to set the rate to 0. The value 0 means thatno specified rate is requested, so the system assigns the subscribed rate as possible. Execute thefollowing command:AT+cgdcont=1,"ip","cmnet"; +cgeqreq=1,3,0,0
Restriction of bandwidth at Iub interfaceIf the physical bandwidth at Iub interface is restricted, the HSDPA service obtains inadequate AAL2PATH bandwidth. As a result, the traffic in NodeB buffer is inadequate, so the success rate ofHS-SCCH is low.In addition, the R99 AAL2PATH and HSDPA AAL2PATH are respectively configured, but they share the physical bandwidth. If multiple R99 subscribers are using the bandwidth at Iub interface in the cell, the HSDPA service obtains inadequate AAL2PATH bandwidth. As a result, the success rate of HS-SCCH is low.
ACK/NACK repeat factor
The following parameters at physical layer are sent to UE and NodeB in the messages at higher layer:
ACK/NACK repeat factor: N_acknack_transmit CQI repeat factor: N_cqi_transmit CQI feedback cycle: CQI Feedback Cycle k
After the UE demodulates HS-PDSCH data, the UE sends an HARQ ACK or NACK message based on cyclic redundancy check (CRC) of MAC-hs, and it repeats sending the ACK/NACK message in the continuous N_acknack_transmit HS-DPCCH subframes. If the N_acknack_transmit is larger than 1, the UE will not try to receive or demodulate transport blocks between the HS-DSCH n+1 and n + N_acknack_transmit– 1 subframes. The n is the sub frame number of last HS-DSCH in the received transport blocks. Nowthe rate obtained by UE is as below:Rate of UE when the ACK/NACK is not repeatedly sent * (1/ N_acknack_transmit)
Low MAC Layer RateAccording to a previous formula MAC Layer Rate = Served Rate * (1- SBLER), low MAC layer rate is a result of high SBLER. Normally, whenthe IBLER is 10%, the SLBER will be lower than 15%. The following factors affect SBLER.
IBLERIBLER affects MAC-HS retransmission, so it consequently affects the actual rate of subscribers. The IBLER here is number of incorrectTBs/number of total new data blocks when the NodeBtransmits new data. The SBLER here is number of incorrect blocks/(number of incorrect and correct blocks) when the NodeB transmits new data or retransmits data.IBLER directly affects SBLER. Now the default IBELR is 10%. IBLER directly affects the power for
scheduling each subscriber. This is similar with outer loop power control of R99.Execute the command SET MACHSPARA to set the following items:
Scheduling algorithm MAC-HS retransmission times Power margin HS-SCCH power Initial BLER
The MML command is as below:SET MACHSPARA: LOCELL=1, SM=PF, MXRETRAN=4, PWRMGN=10, PWRFLG=FIXED, PWR=5, IBLER=10;
Low CQI and inadequate HSDPA powerIf the CQI reported by UE is low, and the available power of HSDPA is inadequate, SBLER willbe high. The size of an MAC-d PDU is 336 bits. TheMAC PDU requires the TB size larger than 336 bits in transmission. As a result, the CQI upon NodeB'sscheduling must be larger than a value to meet that IBLER is within 10%.
CQI reported by UE being higher than actual oneThe CQI reported by UE is inaccurate, higher than the actual one. The NodeB adjusts the CQI according to target IBLER, but it takes some time for adjustment. During this period, the NodeB transfers data with low power according to the CQIreported by UE. As a result, the SLBER is high, sothe performance of data transfer is affected.Solution: by Windows HyperTerminal, connect UE to the data card. Adjust the CQI reported by UE by executing AT commands (This solution caters for Huawei data card only. The current version does not support this).Assume: before the following operations, the CQI reported by connected UE is 25.
Enable the function of adjusting CQI, set the offsetto –200, and lower CQI. Type the following command:AT^CQI=1,-200The UE responds OK. The CQI is 2–3 lower than before, and is 22–23.
Enable the function of adjusting CQI, set the offsetto 0, and the CQI restores to be the actual value. Type the following command:AT^CQI=1,0The UE responds OK. The CQI is 25.
Enable the function of adjusting CQI, set the offsetto 200, and raise CQI. Type the following command:AT^CQI=1,200The UE responds OK. The CQI is 2–3 lower than before, and is 27–28.
Disable the function of adjusting CQI. Type the following command:AT^CQI=0,200The UE responds OK. The CQI remains 27–28.
If you type wrong parameters as below:AT^CQI=1,100,1The UE responds TOO MANY PARAMETERS.
If you query the state of CQI adjustment function, type the following command:AT^CQI?When the UE responds +CME ERROR, the current NV time4448 NV_CQI_ADJUST_I is not activated, and the adjustment function is disabled.When the UE responds ^CQI:0,200, the function of adjusting CQI is disabled.When the UE responds ^CQI:1,200, the function of adjusting CQI is enabled.
Over low pilot powerOn prior version of NodeBs, according to RTT test,
If the power of other channel is 10 dB higher than pilot channel, this leads to a 10% code error for HSDPA.
If the power of other channel is 13 dB higher than pilot channel, this leads to a 100% code error for HSDPA.Now the NodeB can adjust power in a certain scope according to HSDPA SBLER. If the power of other channels is 13 dB higher than the pilot power, theimpact on throughput is little. Setting PICH over low is forbidden; otherwise, the power is inadequate after adjustment by NodeB. This leads to over high SBLER, and consequently the throughput is affected.
Low RLC Layer RateRLC AM use the mode of “positive/ negative affirm decision” to carrythrough dependable data transmission. Use “slip window agreement” carry through flux control.
Before RLC don’t receive affirm package , the most number PDU which can be send is “RLC send window ” . the more betimes send point receive affirm information , the faster the window slip. The faster RLC can send. Whereas , the slower RLC can send . even appear RLC replacement result in drop call.
If Scheduled Rate、Served Rate and MAC Layer Rate is normal , it need more adjust whether RLC Throughput is normal.
The relationship between RLC Throughput andMAC Layer Rate:
RLC Throughput=MAC Layer Rate * (1-MAC-HS PDU’s caput spending rate)
Because PDU’s caput spending rate is small , watch RLC Throughput and MAC Layer Rate from Probe, the curve superposition
If RLC Throughput obvious less than MAC Layer Rate, it is abnormal.
High ACK->NACK/DTX ratioACK->NACK/DTX is the ratio that the NodeB judges ACK as NACK/DTX. Simulation requires the average probability of ACK->NACK/DTX to be lower than 1%. If the NodeB judges ACK as NACK/DTX, the NodeB will retransmit the data correctly received by UE.This wastes resource and lowers subscribers' rate.The following parameters describe an example on Probe, as shown in .
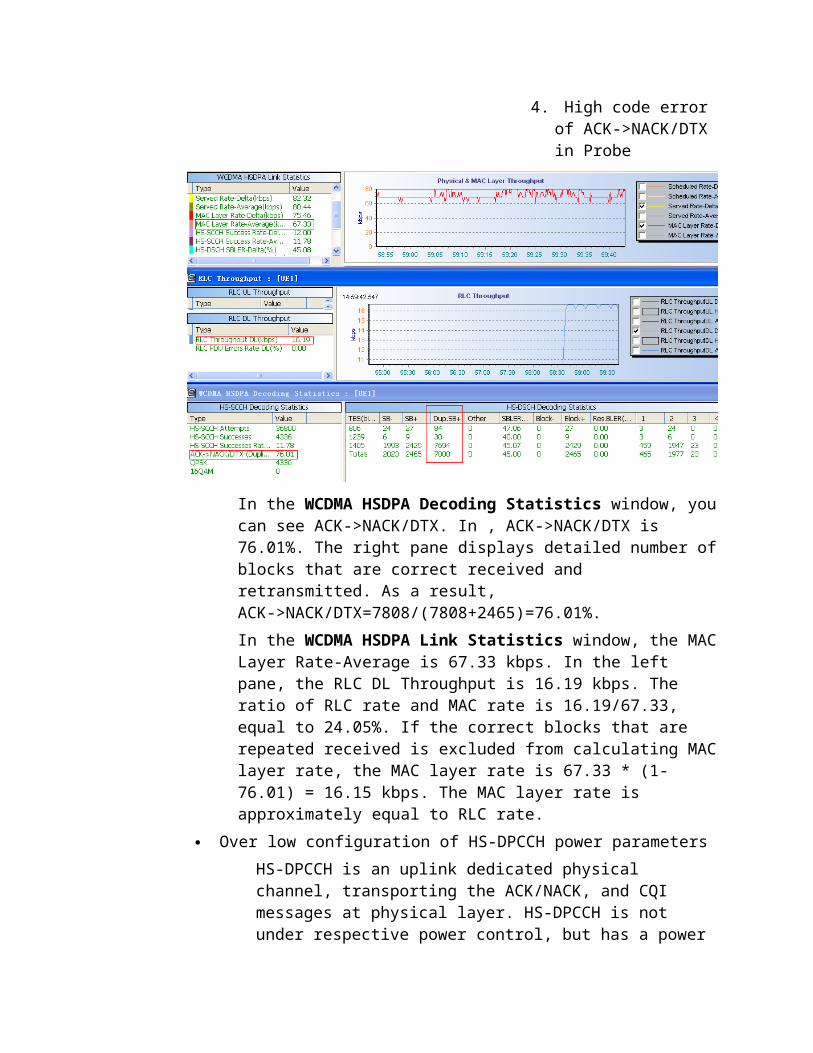
4. High code error of ACK->NACK/DTX in Probe
In the WCDMA HSDPA Decoding Statistics window, youcan see ACK->NACK/DTX. In , ACK->NACK/DTX is 76.01%. The right pane displays detailed number ofblocks that are correct received and retransmitted. As a result, ACK->NACK/DTX=7808/(7808+2465)=76.01%.In the WCDMA HSDPA Link Statistics window, the MACLayer Rate-Average is 67.33 kbps. In the left pane, the RLC DL Throughput is 16.19 kbps. The ratio of RLC rate and MAC rate is 16.19/67.33, equal to 24.05%. If the correct blocks that are repeated received is excluded from calculating MAClayer rate, the MAC layer rate is 67.33 * (1- 76.01) = 16.15 kbps. The MAC layer rate is approximately equal to RLC rate.
Over low configuration of HS-DPCCH power parametersHS-DPCCH is an uplink dedicated physical channel, transporting the ACK/NACK, and CQI messages at physical layer. HS-DPCCH is not under respective power control, but has a power
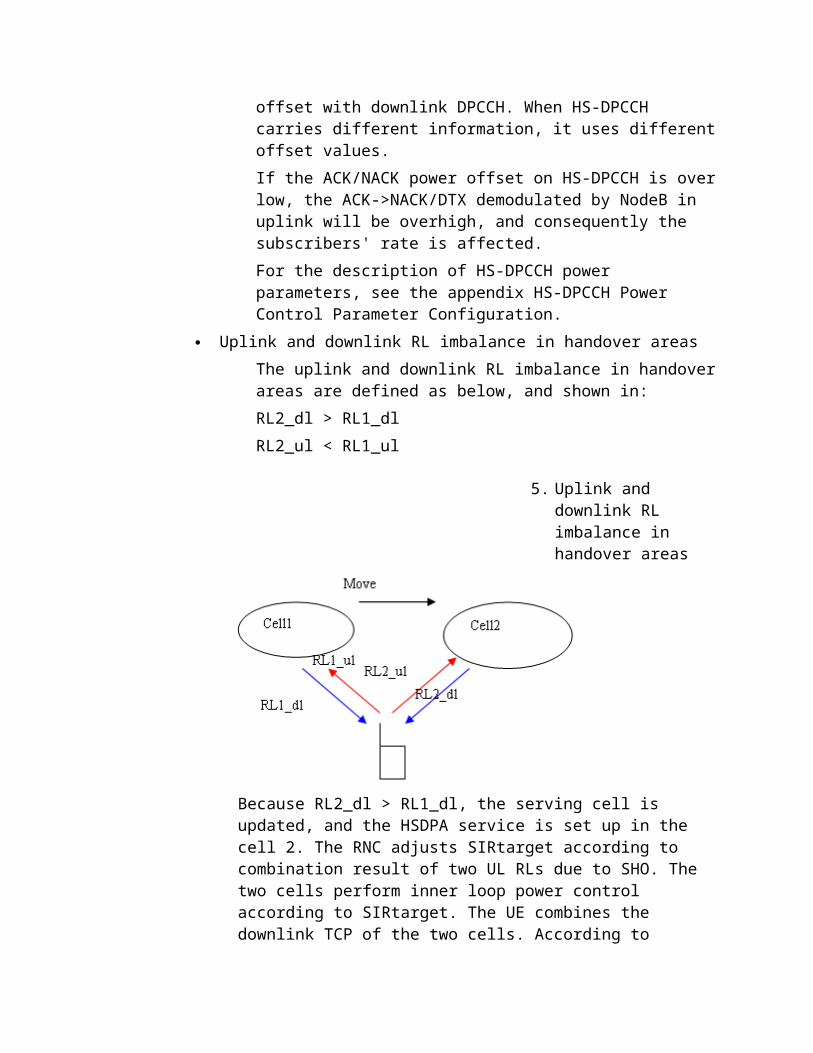
offset with downlink DPCCH. When HS-DPCCH carries different information, it uses differentoffset values.If the ACK/NACK power offset on HS-DPCCH is overlow, the ACK->NACK/DTX demodulated by NodeB in uplink will be overhigh, and consequently the subscribers' rate is affected.For the description of HS-DPCCH power parameters, see the appendix HS-DPCCH Power Control Parameter Configuration.
Uplink and downlink RL imbalance in handover areasThe uplink and downlink RL imbalance in handoverareas are defined as below, and shown in:RL2_dl > RL1_dlRL2_ul < RL1_ul
5. Uplink and downlink RL imbalance in handover areas
Because RL2_dl > RL1_dl, the serving cell is updated, and the HSDPA service is set up in the cell 2. The RNC adjusts SIRtarget according to combination result of two UL RLs due to SHO. The two cells perform inner loop power control according to SIRtarget. The UE combines the downlink TCP of the two cells. According to
combination principles, if the TCP of one cell is –1, lower power accordingly. When the TCP of two cells is +1, raise power.Because RL2_ul < RL1_ul, the RL1_ul SIR is converged to target value, and RL2_ul SIR is lowerthan the target value. The power control over HS-DPCCH is based on the associated channel of RL_ul,so the demodulation performance of HS-DPCCH ACK/NACK/CQI cannot meet requirement. As a result,the performance of data transfer for HSDPA subscribers is poor.Analysis proceeds as below:
Obtain HSDPA-HSDPA handover test data, including thedata at UE side and RNC side.
According to single subscribing signaling tracing, analyze to see whether there is a serving cell updated due to UL RL failure. If yes, find the UE APP throughput at the corresponding point.
With the data at RNC side, draw a chart involving uplink SIR, SIRtarget, UL BLER, downlink throughput,PCPICH RSCP and Ec/No. Obtain the SIR information onHSDPA uplink associated channel.
Based on the results from Step 2 and 3 above, obtainthe information about RL imbalance.
Analyze RL imbalance and provide solutions.
Impact from power control of uplink associated DCHThe impact from power control of uplink associatedDCH includes the following two aspects:
HS-DPCCH is not under individual power control, but has a power offset with uplink DPCCH. If the uplink DCH power control is not converged, and BLER is overhigh, the uplink HS-DPCCH power will be over low, and the NodeB will judge ACK as NACK/DTX in a great probability. As a result, the rate of RLC layer for HSDPA subscribers is over low.
TCP and RLC uses AM mode, so sending the ACK messageis necessary on uplink DCH.
TCP provides reliable transport layer, the receiver responds the ACK message. Any the data and the ACK message may be lost during transmission, so TCP sets a timer upon sending for solving this problem. If the sender does notreceive the ACK message till expiration of the timer, it resends the data. As a result, the rate for data transfer is affected. If the uplink DCH power control is not converged, and BLER is over high, the sender TCP will fail to receive the ACK message and resend the data. As a result, the rate of data transfer is affected.RLC uses AM mode. If the uplink BLER is not converged, the RLC will receive a late ACK response or no response. After expiration, the RLC resend the data, so the rate for data transfer is affected. If the RLC fails to receive the ACK message after multiple times, RLC reset occurs. The RLC sending window can configure the maximum value to 2047 at most. When the rate for sending by RLC is high, and the response to RLC is late, the RLC sending window will be full and no new data can be sent.
Check the uplink BLER in Uplink BLER of RNC Connection Performance Monitoring window. The baseline requires target uplink BLER as 1%. Find the causes of non convergence of uplink power control from the following two aspects:
Check whether the RTWP fluctuates abnormally, and whether there is uplink interference. Check RTWP in RNC cell performance monitoring.
Check whether the configuration of outer loop power control parameters for the current services is proper. Focus on SIRTarget and BLERTarget. Follow the steps below:
Query the index value for current services by executing the command LST TYPRAB. For example, the index value for the 384 kbps services is 22.Query SIRTarget and BLERTarget by executing the command LST TYPRAB: RABINDEX=22, TRCHTYPE=TRCH_HSDSCH, IUBTRANSBEARTYPE=IUB_GROUND_TRANS;Modify SIRTarget and BLERTarget for current service by executing the command MOD TYPRABOLPC:RABINDEX=22, SUBFLOWINDEX=0, TRCHTYPE=TRCH_HSDSCH, IUBTRANSBEARTYPE=IUB_GROUND_TRANS, BLERQUALITY=-20;----End
In addition, in remote deployment test of single HSDPA subscriber in a single HSDPA cell, at the cell edge, the CQI reported by UE is good, but subscriber's rate is low, even as low as 0. The major cause is that the uplink power of UE is restricted, that uplink power control is not converged, and that uplink BLER is high, even as high as 100%.
Wrong configuration of AAL2 PATH (NodeB RCR > RNC PCR, or configured bandwidth > physical bandwidth)The RCR parameter is added to AAL2 PATH at NodeB side to fulfill flow control. It is the receiving rate of NodeB. For ATM driver, the receiving rate cannot be restricted, so the RCR parameter is logical only. The receiving rate is not necessarily equal to the configured RCR parameter,but depends on the sending rate of RNC, namely, the PCR and SCR upon configuration of AAL2PATH by RNC.The NodeB deducts the bandwidth corresponding to R99 call from the total bandwidth of PATH according to receiving rate, and then obtains the
residual bandwidth of all PATH. The RCR is reported to DSP, and the DSP construct frame informs RNC of residual bandwidth. The residual bandwidth is for HSDPA subscribers, so the flow iscontrolled.If the receiving bandwidth RCR of NodeB AAL2 PATH is larger than PCR of RNC AAL2 PATH, the data packets at Iub interface will be dropped.In addition, if the configured bandwidth of AAL2PATH is larger than the physical actual bandwidth, the data packets at Iub interface will be dropped. As a result, the total throughput of cell declines.In V17 edition, when R99 new operation connect, Max-rate multiply activation gene as operation rate to admittance. So if you want to adjust activation gene, you can adjust connection number . if configure activation gene is small , it can connect more connection , but multi-connection whit high rate will bring lub congestion, result in R99 PS or HSDPA PS lose package , touch off a lot of RLC send again , consequently, R99 PS or HSDPA PS RLC layer rate astaticism.Solution: open lub overbooking flow control switchwhich base on RLC retransmission rate. If discoverR99 or HSDPA PS retransmission rate exceed the gateway which set before , initiate R99 PS TF limit fall quickly or HSDPA PS PS rate * fall coefficient , lighten or eliminate congestion. In RLC retransmission rate under gateway , cancel TF limit , renew R99 PS transmit rate , or HSDPA PS rate * rise coefficient , renew HSDPA PS transmit rate.
Over high RLC retransmission rate due to over high residual BLER at MAC layer
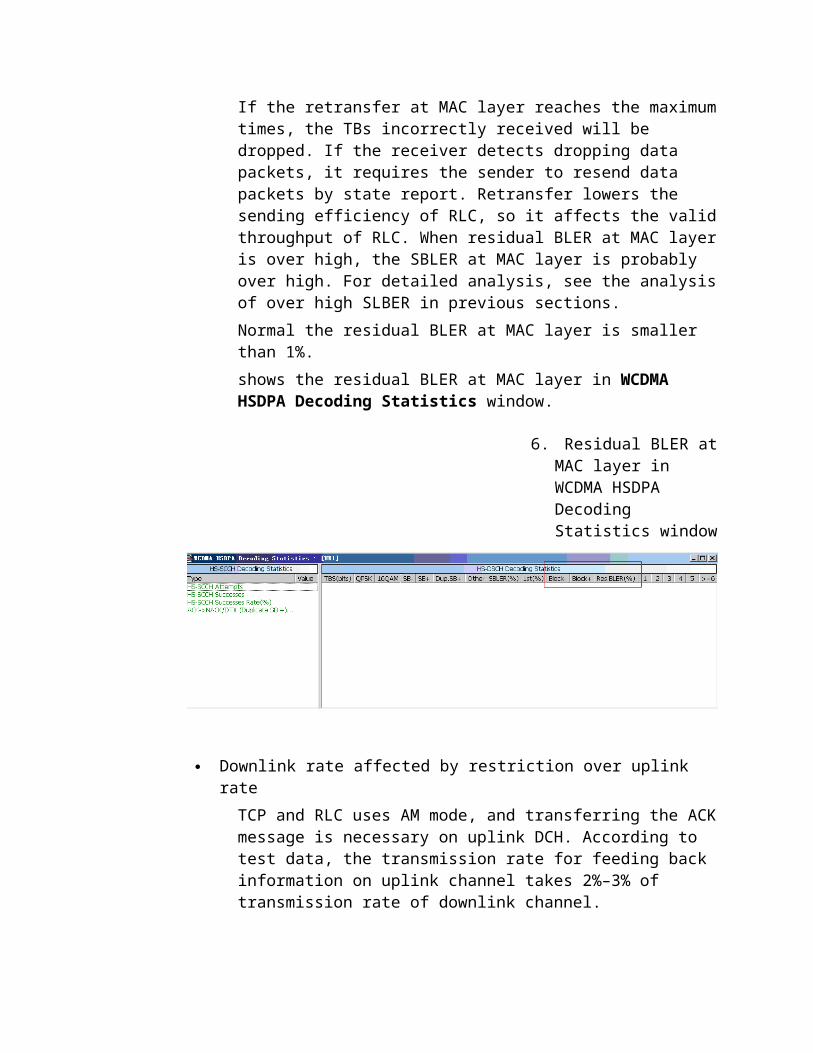
If the retransfer at MAC layer reaches the maximumtimes, the TBs incorrectly received will be dropped. If the receiver detects dropping data packets, it requires the sender to resend data packets by state report. Retransfer lowers the sending efficiency of RLC, so it affects the validthroughput of RLC. When residual BLER at MAC layeris over high, the SBLER at MAC layer is probably over high. For detailed analysis, see the analysisof over high SLBER in previous sections.Normal the residual BLER at MAC layer is smaller than 1%.shows the residual BLER at MAC layer in WCDMA HSDPA Decoding Statistics window.
6. Residual BLER atMAC layer in WCDMA HSDPA Decoding Statistics window
Downlink rate affected by restriction over uplink rateTCP and RLC uses AM mode, and transferring the ACKmessage is necessary on uplink DCH. According to test data, the transmission rate for feeding back information on uplink channel takes 2%–3% of transmission rate of downlink channel.
For example, the downlink rate is 1.6 Mbps, and the corresponding uplink rate is 32–48 kbps. When the downlink rate is 3.6 Mbps, the corresponding uplink rate is 72–108 kbps. If the uplink subscribed rate is 64 kbps, the requirement on uplink rate corresponding to downlink data transfer cannot be met.In addition, if there is data to be transferred inuplink for HSDPA subscribers, the uplink channels must transport the confirmation data of TCP and RLC, as well as uplink data of subscribers. If theuplink subscribed rate is low, the downlink data transfer is affected.Check the uplink rate for service setup in RAB Assignment Request message. If the uplink rate is low, check the HLR subscribed rate.Check the actual uplink bandwidth in RB SETUP message.
The RTT delay at the RLC layer is exceptional (the RLC state report disable timer is not set properly/the uplink BLER is not converged) so that the RLC send window is full.Currently, the maximum size of the RLC send windowcan be set to 2047 (the RLC receive/send window size of the terminal is 2047). When the RLC transmission rate is very high, the RLC send window is easily full and cannot send other data if the state report is not returned in time.For example, the rate on the air interface is 3 Mbit/s and the MAC-D PDU size is 336 bits, the RLCsend window can send data for (2047 x 336)/(3 x 1024) = 224 ms. If the RNC fails to receive a state report within 224 ms, the RLC send window isfull.The return time of the state report is related to the state report disable timer and the uplink air
interface quality. If the state report disable time is set too long, or the uplink BLER is not converged, the RLC send window may be full.Solution:Check whether the state report disable timer is set properly and whether it is set to the default of the baseline. Currently, the default timer length is 120 ms (service-oriented configuration) in the RNC V16 and 80 ms for the 3.6 Mbit/s services (service-oriented configuration) in the RNC V17.Check the convergence of the uplink BLER to ensurethe BLER is converged.
Compare the throughputs at the application layer (APP) and the RLC layer.TCP/IP adopts the inclusive acknowledgment strategy for reliable data transmission and the sliding window protocol for flow control, and performs congestion control when detecting a network congestion.
Flow control (sliding window)Flow control is used to prevent buffer overflowsand saturation of the receiving machine. Flow control generates a window value for the sender to transmit the specified number of bytes in thewindow. After that, the window is closed and thesender must stop data transmission. The window is not opened until the sender receives an ACK from the receiver.
Inclusive acknowledgment strategyAll to-be-transmitted bytes before the confirmedbyte number are acknowledged. Suppose that 10 data fragments are to be transmitted. These datafragments cannot reach the destination in sequence. TCP must acknowledge the highest byte number of consecutive bytes without any error. The highest byte number is not allowed to be
acknowledged before all the middle bytes reach the destination. If the acknowledgment to the middle bytes is not sent to the sender, the sender TCP entity finally times out and retransmits the unacknowledged data.
Congestion control (timeout and retransmission)The TCP determines a network congestion by measuring the round-trip time (RTT) delay timeout or receiving a repeated acknowledgment. When a network congestion is detected, the congestion avoidance algorithm (downspeeding andretransmission) is enabled.
Therefore, the factors affecting the TCP/IP data transmission rate include:
Configured TCP receive/send windowAlthough the receive window size is dynamic (if packets out of sequence are received or packets cannot be submitted to the upper layer in time, the available window size becomes small), the configured window size determines the maximum available size of the receive window.According to the formula Capacity (bit)=bandwidth (b/s)*round-trip time (s), if the receive/send window is too small, the transmission rate is affected.
Congestion caused by RTT fluctuationThe throughput at APP and RLC layer is obtainable by DT/CQT. For the theoretical relationship of rate at each layer, see the appendix 8.2.If the rate of APP throughput and RLC throughoutis lower than the normal range according to theoretical analysis, the retransmission cost ofTCP/IP is over large. Check and modify the TCP receiver window and MTU configuration. For the method, see the appendix 8.4 and 8.5.
5. Analysis of the Problem aboutPoor Data Transmission Performance of the HSUPA on theRAN Side
The PS data transmission performance is end-to-end (UE <->data service server) system performance. Each component in the system mayaffect data transmission. When we test and optimize the HSUPA data transmission performance, we usually focus on the effects of the RANside (RNC-NodeB-UE) on the data transmission performance. We hope that the effects of the other parts (SGSN, GGSN, data service server, and external networks) of the system can be removed before the test so that we can concentrate on the radio network.
From the angle of throughput measurement, poor data transmission performance reflects a low unsteady rate with a wide fluctuation range. From the angle of the QoS, poor data transmission performancereflects unclear streaming images, buffering, and slow response to web browsing.
The working process of an HSUPA UE is as follows:
The UE originates a data transmission request according to the Scheduling Information (determined by the UE power headroom [UPH] and the quantity [Q] of data to be transmitted) carried on the E-DPDCH.
The NodeB determines the granted level (the E-AGCH sends T/P and the E-RGCH sends an adjust command to tune (+1, 0 -1)) according to the UE request (SI), monitored RoT, and the satisfaction (Happy bit indication carried on the E-DPCCH) from the UE.
The UE sends corresponding data according to the granted level. Meanwhile, the UE attaches the next frame request (SI) on the E-DPDCH and feeds back thesatisfaction (Happy bit) at the allocated granted level on the E-DPCCH.
After receiving and demodulating the data, the NodeBreturns an AcK/Nack on the E-HICH.
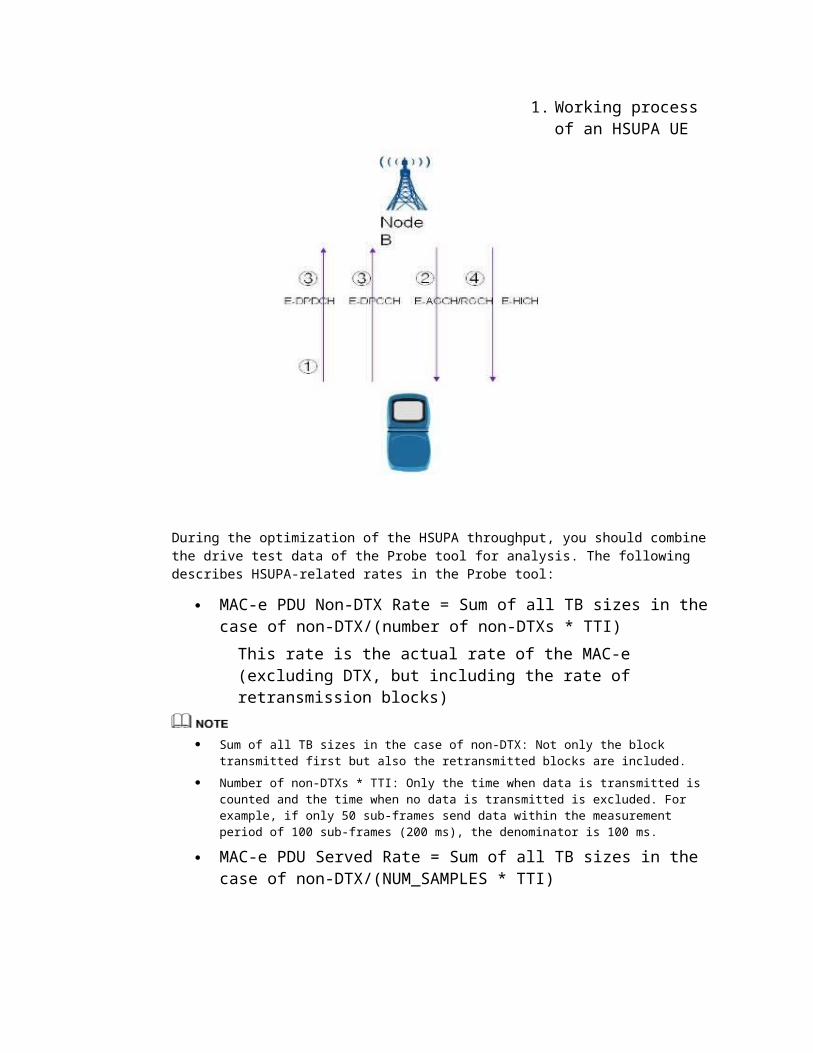
1. Working process of an HSUPA UE
During the optimization of the HSUPA throughput, you should combine the drive test data of the Probe tool for analysis. The following describes HSUPA-related rates in the Probe tool:
MAC-e PDU Non-DTX Rate = Sum of all TB sizes in the case of non-DTX/(number of non-DTXs * TTI)This rate is the actual rate of the MAC-e (excluding DTX, but including the rate of retransmission blocks)
Sum of all TB sizes in the case of non-DTX: Not only the block transmitted first but also the retransmitted blocks are included.
Number of non-DTXs * TTI: Only the time when data is transmitted is counted and the time when no data is transmitted is excluded. For example, if only 50 sub-frames send data within the measurement period of 100 sub-frames (200 ms), the denominator is 100 ms.
MAC-e PDU Served Rate = Sum of all TB sizes in the case of non-DTX/(NUM_SAMPLES * TTI)
This rate is the served rate of the MAC-e (including DTX and the rate of retransmission blocks)
Sum of all TB sizes in the case of non-DTX: Not only the block transmitted first but also the retransmitted blocks are included.
NUM_SAMPLES * TTI: The time when data is transmitted and the time when no data is transmitted are both included. For example, if only 50 sub-frames send data within the measurement period of 100 sub-frames (200 ms), the denominator is 200 ms.
MAC-e PDU Available Rate = Sum of TB sizes when COMB_HICH is ACK or ACK_NS in the case of non-DTX/(NUM_SAMPLES*TTI)
Sum of TB sizes when COMB_HICH is ACK or ACK_NS in the case of non-DTX: Only the TBs transmitted correctly are counted.
NUM_SAMPLES * TTI: The time when data is transmitted and the time when no data is transmitted are both included.
Relationship between these three throughputs: MAC-e PDU Served Rate = MAC-e PDU Non-DTX Rate *
Non-DTX Probability MAC-e PDU Available Rate ≈ MAC-e PDU Served Rate
*(1-SBLER)Where,Non-DTX Probability = Number of non-DTXs/NUM_SAMPLES * 100%SBLER = (Number of non-DTXs – Number of ACK or ACK_NS)/Number of non-DTXs * 100%
UL RLC PDU Throughput = Sum of bits of all RLC PDUs sent by the RLC layer within the measurement period/Measurement period duration
Sum of bits of all RLC PDUs sent by the RLC layer within the measurement period: The first transmitted data and the retransmitted data are included. In addition, the data is transferred by MAC-d and contains the header overhead (16 bits) of the RLC PDU.
Measurement period duration: The time when data is transmitted and the time when no data is transmitted are both included.
Relationship with MAC-e PDU Available Rate:
RLC PDU Throughput UL = MAC-e PDU Available Rate * (1-header overhead ratio of MAC-e PDU)
A precise relationship should exclude the header overhead and the padding bits when the TB size does not match N RLC PDU bits
UL RLC SDU Throughput = Sum of bits of all RLC SDUs sent by the RLC layer within the measurement period/Measurement period duration
Sum of bits of all RLC SDUs sent by the RLC layer within the measurement period: Compared with the sum of RLC PDU bits, the retransmitted data and header overhead (16 bits) of the RLC PDU are excluded.
Measurement period duration: The time when data is transmitted and the time when no data is transmitted are both included.
Relationship between RLC SDU Throughput UL and RLCPDU Throughput UL:
RLC SDU Throughput UL ≈ RLC PDU Throughput UL*(1-RLCPDU Retransmission Rate UL)*header overhead ratio ofthe RLC PDU
The figure below shows the optimization flow of a low throughput of the HSUPA UE.
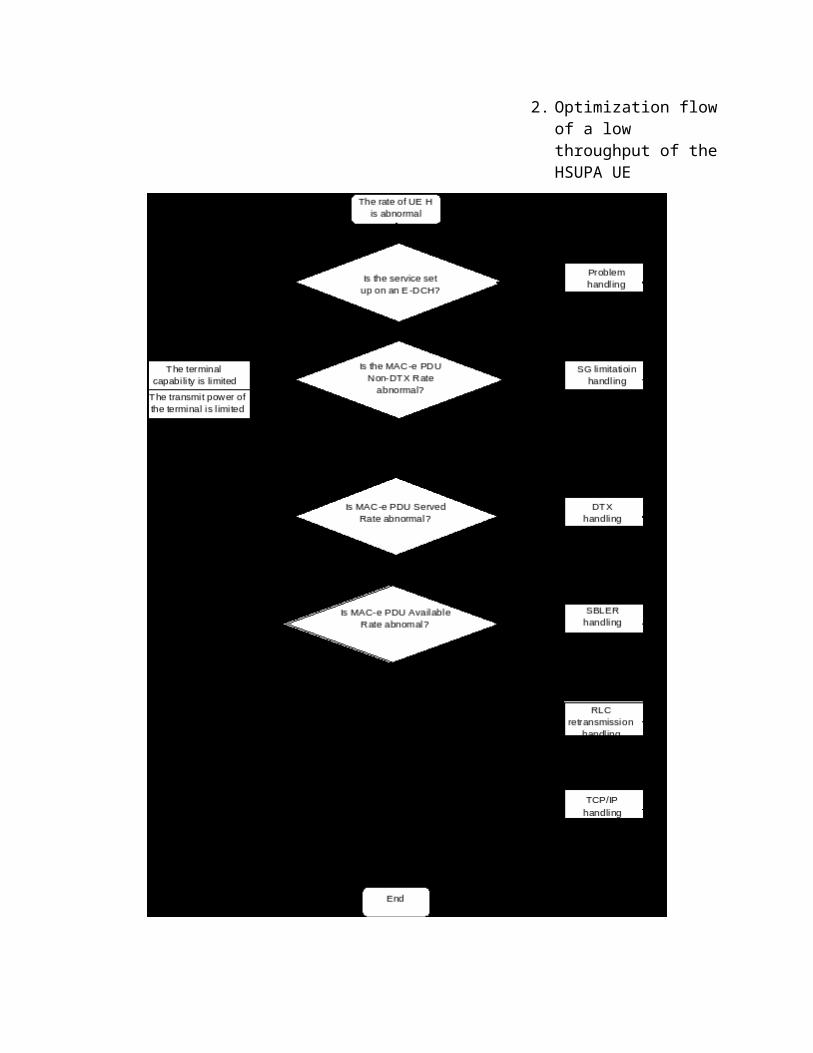
2. Optimization flowof a low throughput of theHSUPA UE
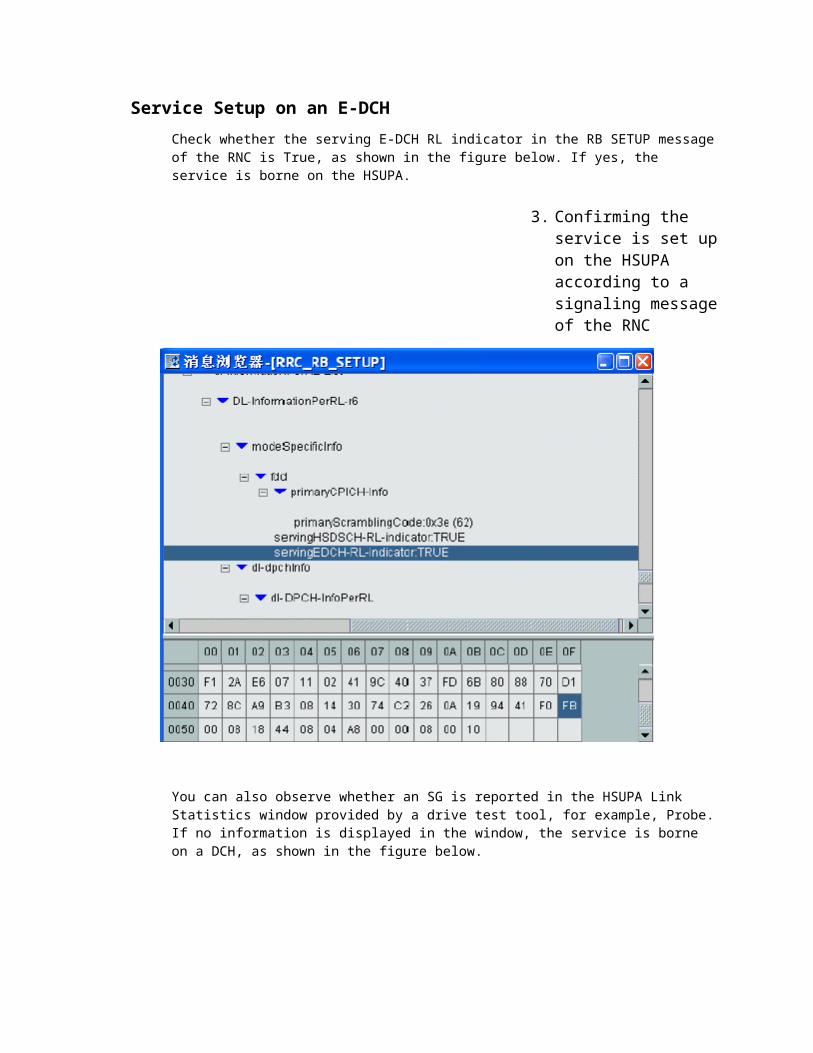
Service Setup on an E-DCHCheck whether the serving E-DCH RL indicator in the RB SETUP messageof the RNC is True, as shown in the figure below. If yes, the service is borne on the HSUPA.
3. Confirming the service is set upon the HSUPA according to a signaling messageof the RNC
You can also observe whether an SG is reported in the HSUPA Link Statistics window provided by a drive test tool, for example, Probe.If no information is displayed in the window, the service is borne on a DCH, as shown in the figure below.
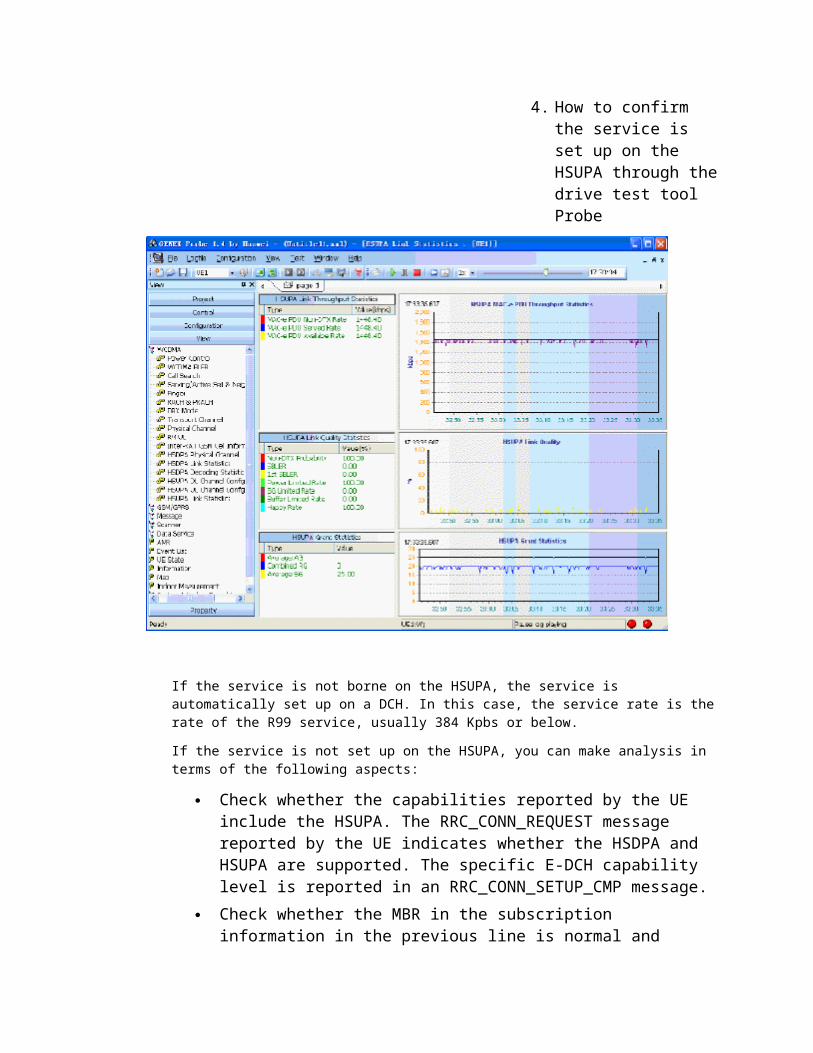
4. How to confirm the service is set up on the HSUPA through thedrive test tool Probe
If the service is not borne on the HSUPA, the service is automatically set up on a DCH. In this case, the service rate is therate of the R99 service, usually 384 Kpbs or below.
If the service is not set up on the HSUPA, you can make analysis in terms of the following aspects:
Check whether the capabilities reported by the UE include the HSUPA. The RRC_CONN_REQUEST message reported by the UE indicates whether the HSDPA and HSUPA are supported. The specific E-DCH capability level is reported in an RRC_CONN_SETUP_CMP message.
Check whether the MBR in the subscription information in the previous line is normal and
whether the rate threshold over an E-DCH is set too high. If the MBR assigned by the CN does not exceed the rate threshold over an E-DCH, the service is setup on a DCH.
Check whether the HSUPA cell is available and activated.
The access of the HSUPA UE fails. Check whether the type of the HSUPA AAL2PATH is
configured correctly and whether a type of HSUPA AAL2PATH is configured.
Abnormal MAC-e PDU Non-DTX RateThe UE compares its current MAC-e PDU Non-DTX Rate with the maximum allowable ETFC according to the corresponding ETFC of the SG that the UE currently maintains. Make analysis in combination with the Happy/Unhappy information reported by the UE.
If the UE reports HAPPY, the user may not feel happy. Make specificanalysis according to the happy reasons.
If the MAC-e PDU Non-DTX Rate is abnormal, use the drive test tool Probe to determine whether the UE reports HAPPY or UNHAPPY.
If the UE reports HAPPY and the UE rate cannot reach the MBR, the possible causes are as follows:
The terminal capability or the RAN capability is limited.
The transmit power of the terminal limited. The traffic of the terminal is limited.
If the UE reports UNHAPPY and the UE rate cannot reach the MBR, the possible causes are as follows:
The SG (UE grant) is limited. The resources (air interface load, IUB bandwidth,
and CE) on the RAN side are limited.Cause 1: The air interface load is limited.Cause 2: The IUB bandwidth is limited.Cause 3: The NodeB CEs are limited.
The service MBR (NodeB MBR) is limited. The UE demodulates incorrectly.
Cause 1: The SG is not updated because the CRC of the AG value failsCause 2: The UE demodulates the RG incorrectly.
The protocol gives the conditions when the UE report HAPPY and UNHAPPY.
The UE indicates that it is ‘unhappy’ if the following criteria are met:
UE is transmitting as much scheduled data as allowedby the current Serving Grant.
UE has enough power available to transmit at higher data rate.
Total buffer status would require more than Happy_Bit_Delay_Condition ms to be transmitted with the current Serving_Grant × the ratio of active processes to the total number of processes.
The first criteria are always true for a deactivated process and theratio of the third criteria is always 1 for 10ms TTI.
Otherwise, the UE indicates that it is ‘happy’.
The terminal capability or the RAN capability is limited.
Principle descriptionCurrently, the capability of Qualcomm HSUPA and Huawei E270 HSUPA is CAT5 (the corresponding MAC-erate is 2 Mbit/s). The maximum capability supported by Huawei RAN6.0 (RNCV1.8 and NodeBV1.8)is 2 x SF4 (the corresponding MAC-e rate is 1.4484Mbit/s). Currently, the maximum rate that a singleUE can obtain is limited to the capability of the RAN6.0.The RAN6.0 supports 2 x SF4, the maximum TB size is 14484), and the MAC-e PDU Non-DTX Rate is 14484/10 = 1.4484 Mbit/s
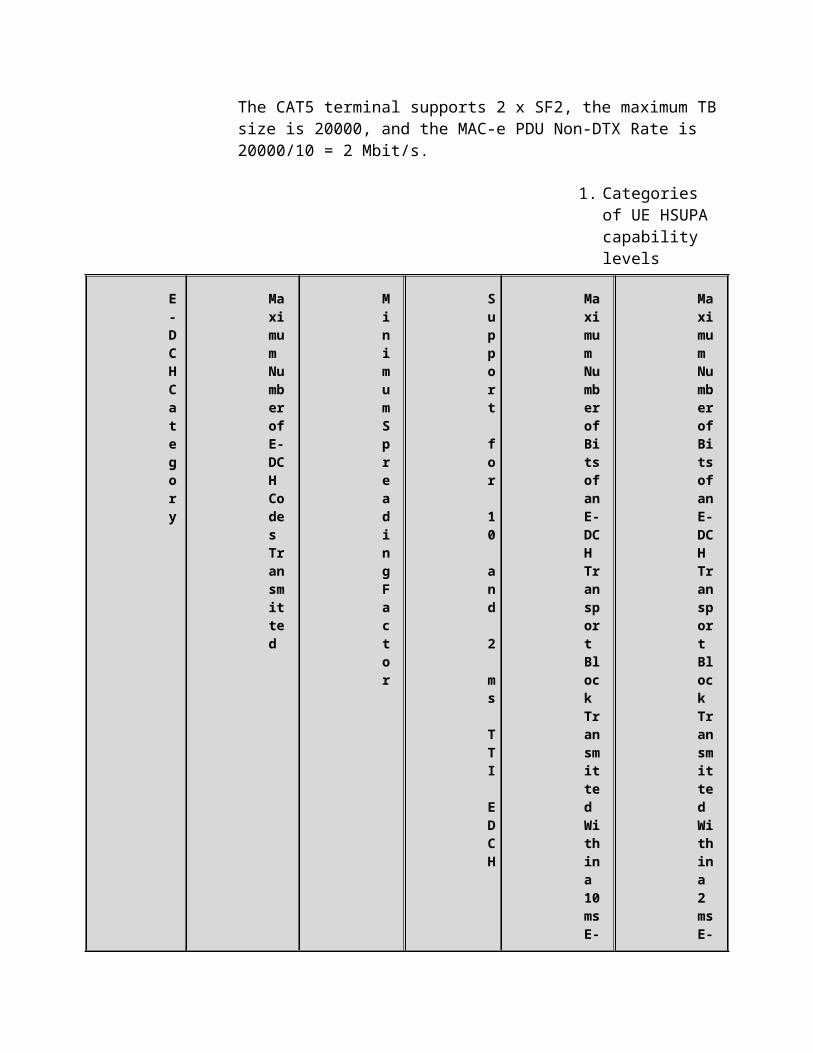
The CAT5 terminal supports 2 x SF2, the maximum TBsize is 20000, and the MAC-e PDU Non-DTX Rate is 20000/10 = 2 Mbit/s.
1. Categories of UE HSUPA capability levels
E-DCHCategory
Maximum NumberofE-DCH Codes Transmitted
MinimumSpreadingFactor
Support for 10 and 2 ms TTI EDCH
Maximum NumberofBitsofanE-DCH Transport Block Transmitted Withina 10msE-
Maximum NumberofBitsofanE-DCH Transport Block Transmitted Withina 2 msE-
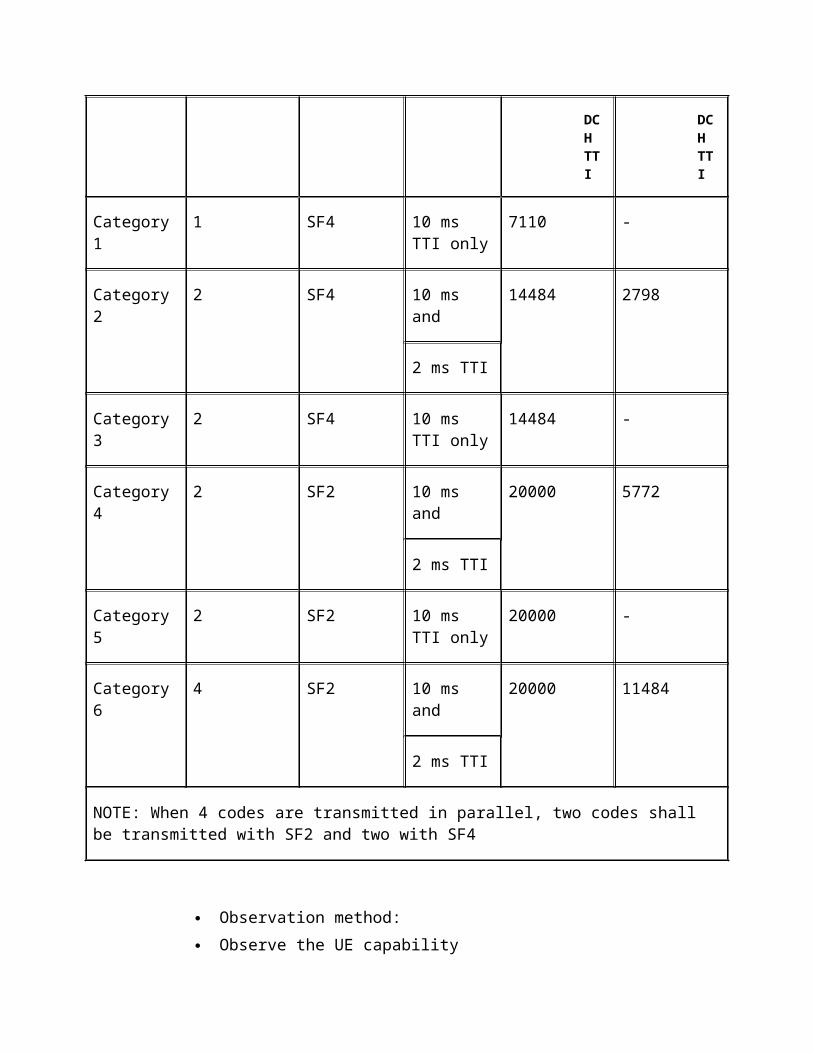
DCH TTI
DCH TTI
Category1
1 SF4 10 ms TTI only
7110 -
Category2
2 SF4 10 ms and
14484 2798
2 ms TTI
Category3
2 SF4 10 ms TTI only
14484 -
Category4
2 SF2 10 ms and
20000 5772
2 ms TTI
Category5
2 SF2 10 ms TTI only
20000 -
Category6
4 SF2 10 ms and
20000 11484
2 ms TTI
NOTE: When 4 codes are transmitted in parallel, two codes shall be transmitted with SF2 and two with SF4
Observation method: Observe the UE capability
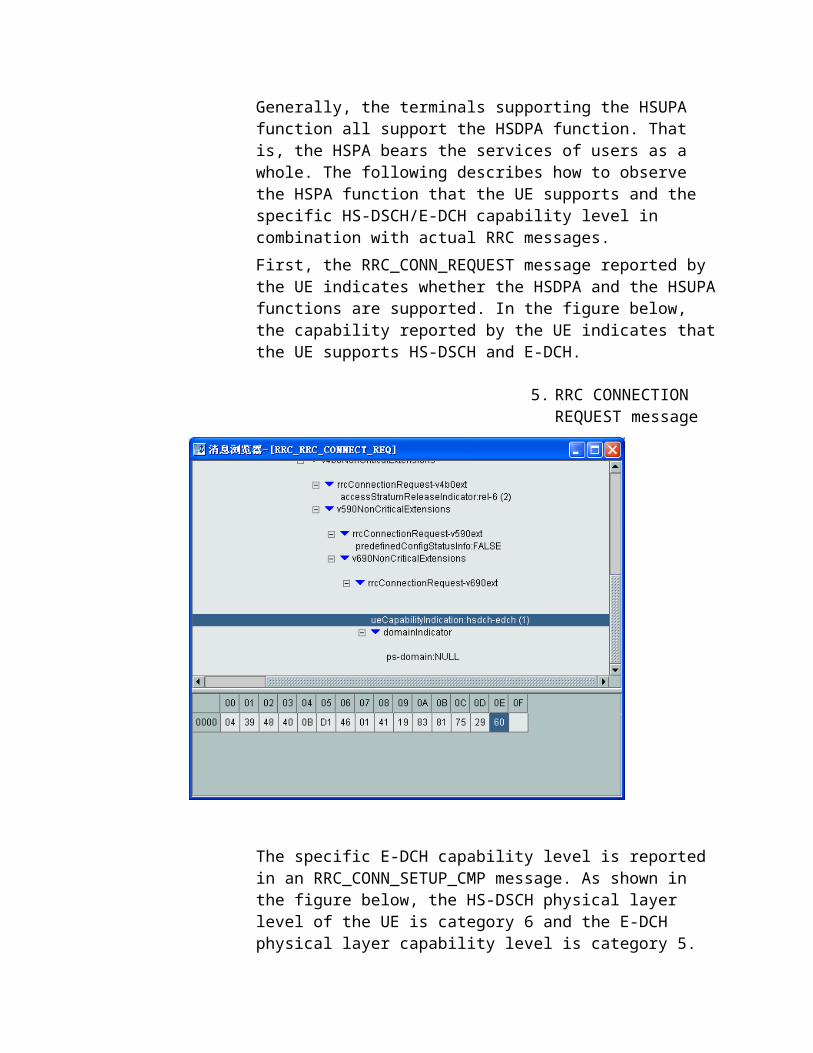
Generally, the terminals supporting the HSUPA function all support the HSDPA function. That is, the HSPA bears the services of users as a whole. The following describes how to observe the HSPA function that the UE supports and the specific HS-DSCH/E-DCH capability level in combination with actual RRC messages.First, the RRC_CONN_REQUEST message reported by the UE indicates whether the HSDPA and the HSUPAfunctions are supported. In the figure below, the capability reported by the UE indicates thatthe UE supports HS-DSCH and E-DCH.
5. RRC CONNECTION REQUEST message
The specific E-DCH capability level is reported in an RRC_CONN_SETUP_CMP message. As shown in the figure below, the HS-DSCH physical layer level of the UE is category 6 and the E-DCH physical layer capability level is category 5.
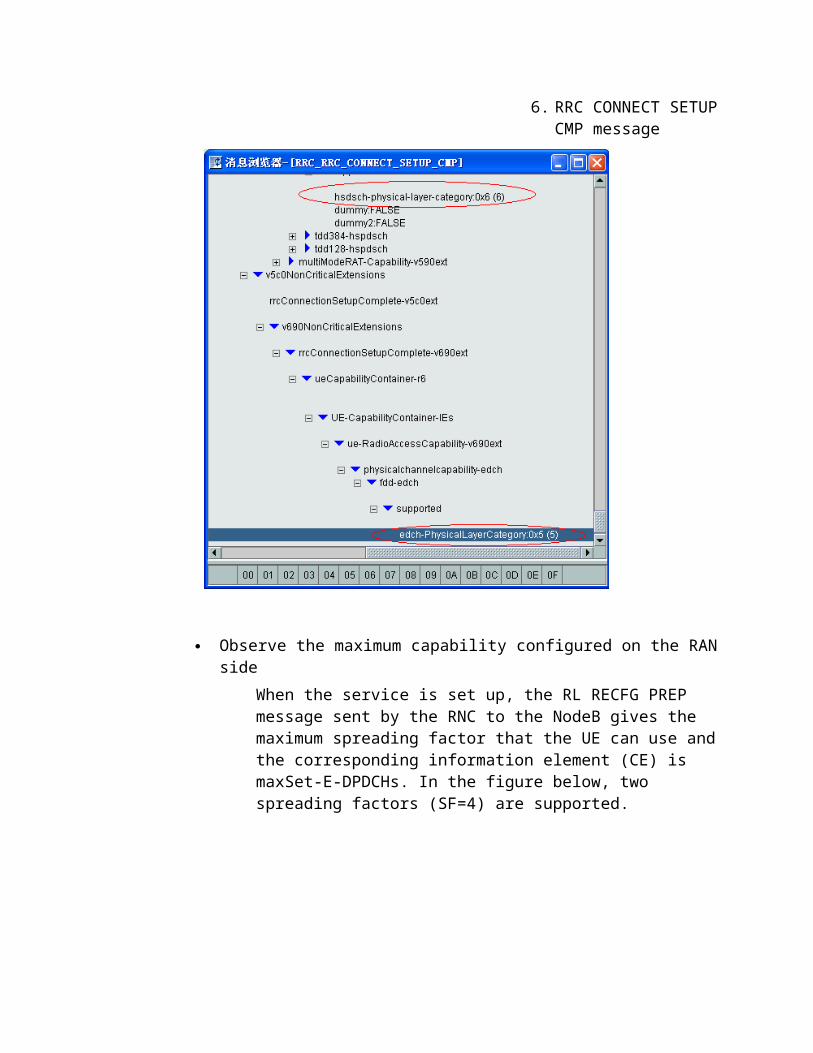
6. RRC CONNECT SETUPCMP message
Observe the maximum capability configured on the RANside
When the service is set up, the RL RECFG PREP message sent by the RNC to the NodeB gives the maximum spreading factor that the UE can use andthe corresponding information element (CE) is maxSet-E-DPDCHs. In the figure below, two spreading factors (SF=4) are supported.
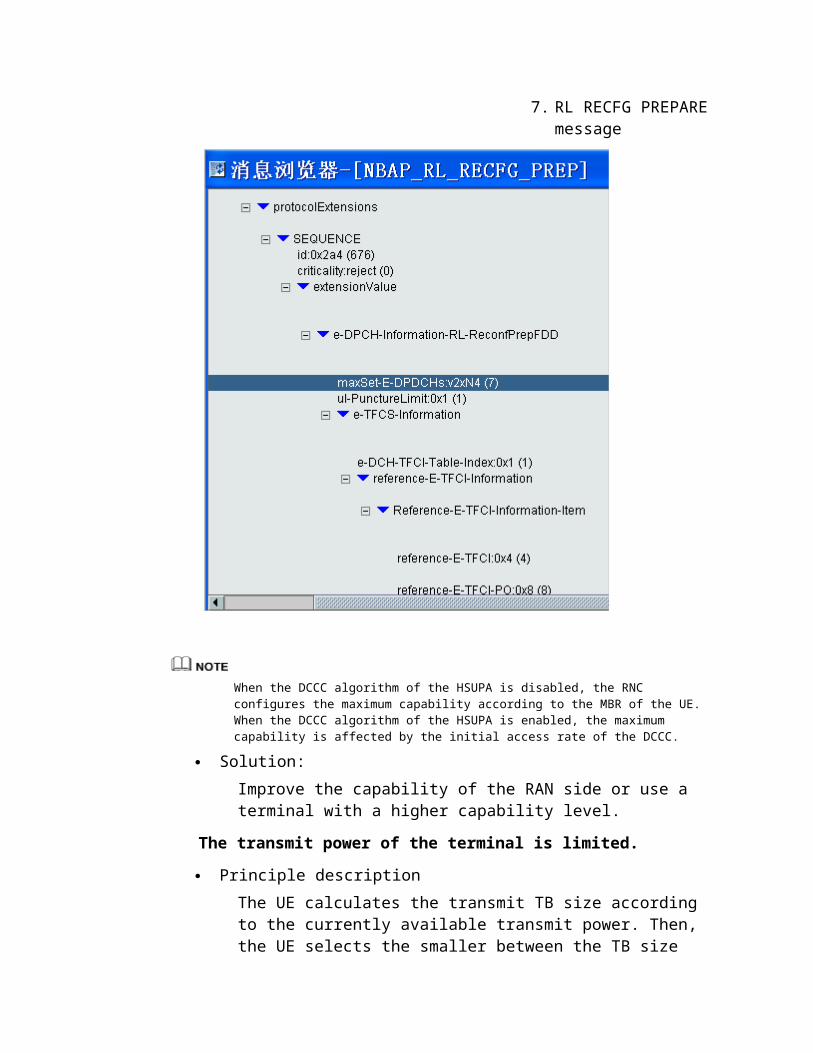
7. RL RECFG PREPARE message
When the DCCC algorithm of the HSUPA is disabled, the RNC configures the maximum capability according to the MBR of the UE. When the DCCC algorithm of the HSUPA is enabled, the maximum capability is affected by the initial access rate of the DCCC.
Solution:Improve the capability of the RAN side or use a terminal with a higher capability level.
The transmit power of the terminal is limited.
Principle descriptionThe UE calculates the transmit TB size according to the currently available transmit power. Then, the UE selects the smaller between the TB size
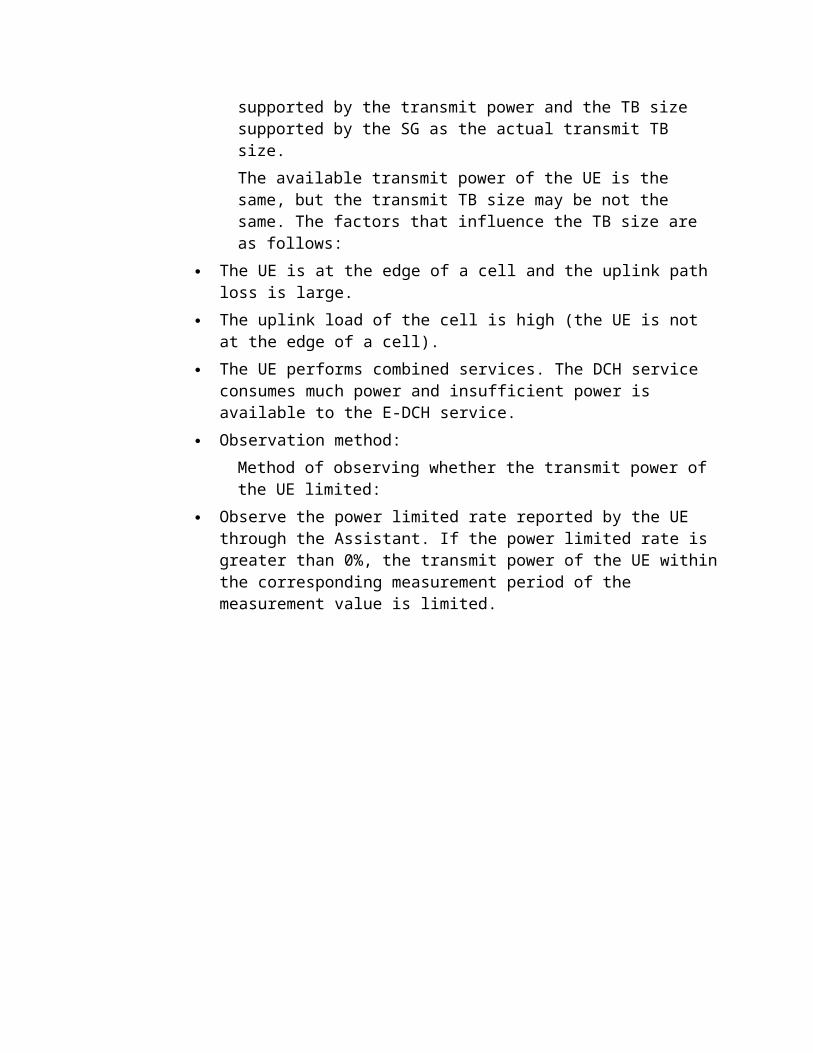
supported by the transmit power and the TB size supported by the SG as the actual transmit TB size.The available transmit power of the UE is the same, but the transmit TB size may be not the same. The factors that influence the TB size are as follows:
The UE is at the edge of a cell and the uplink path loss is large.
The uplink load of the cell is high (the UE is not at the edge of a cell).
The UE performs combined services. The DCH service consumes much power and insufficient power is available to the E-DCH service.
Observation method:Method of observing whether the transmit power of the UE limited:
Observe the power limited rate reported by the UE through the Assistant. If the power limited rate is greater than 0%, the transmit power of the UE withinthe corresponding measurement period of the measurement value is limited.
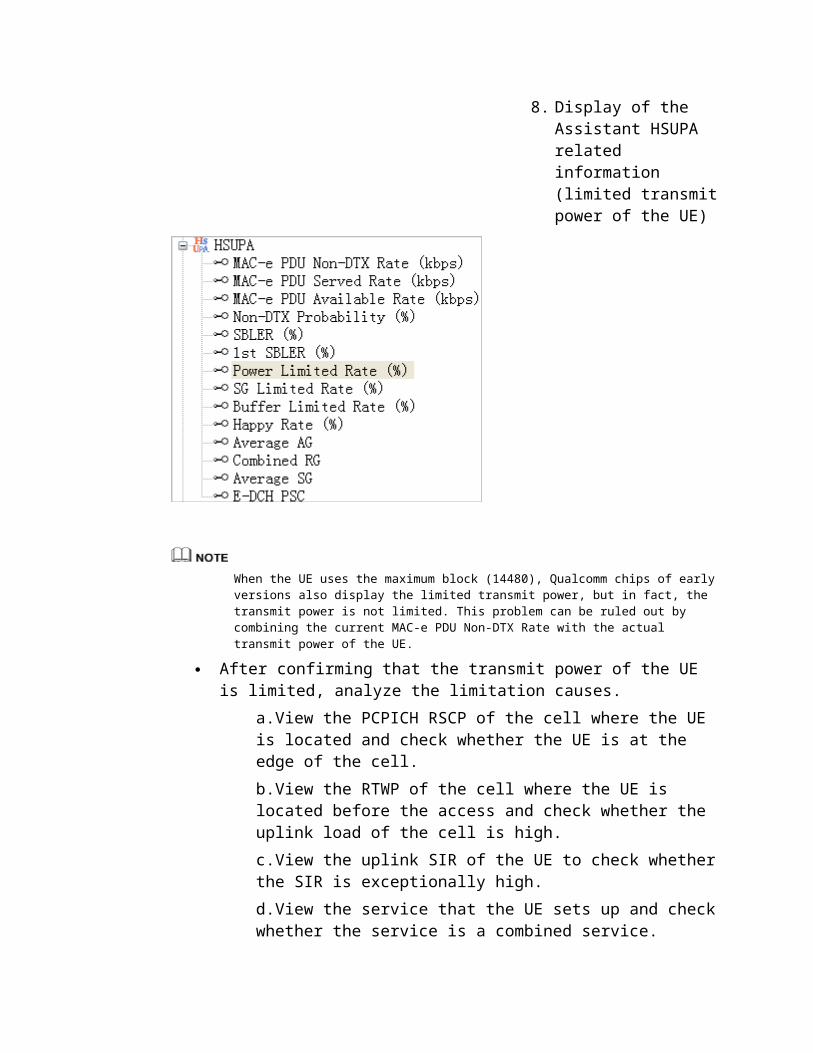
8. Display of the Assistant HSUPA related information (limited transmitpower of the UE)
When the UE uses the maximum block (14480), Qualcomm chips of earlyversions also display the limited transmit power, but in fact, the transmit power is not limited. This problem can be ruled out by combining the current MAC-e PDU Non-DTX Rate with the actual transmit power of the UE.
After confirming that the transmit power of the UE is limited, analyze the limitation causes.
a.View the PCPICH RSCP of the cell where the UE is located and check whether the UE is at the edge of the cell.b.View the RTWP of the cell where the UE is located before the access and check whether the uplink load of the cell is high.c.View the uplink SIR of the UE to check whetherthe SIR is exceptionally high.d.View the service that the UE sets up and checkwhether the service is a combined service.
Solution: If the UE is at the edge of the cell, move the UE to
the center of the cell. If the uplink load of the cell is high and the cell
load is adjustable, reduce the cell load. If the service that the UE sets up is a combined
service, deactivate the R99 service and observe the rate of the HSUPA service.
The traffic of the terminal is limited.
Principle description:If the data in the UE RLC Buffer is insufficient, the actual MAC-e PDU Non-DTX Rate is low.
Observation method: Method of observing whether the traffic of the UE is
limitedObserve the buffer limited rate reported by the UE through the Assistant. If the buffer limited rate greater than 0%, the traffic of the UE within the corresponding measurement period of the measurement value is limited.
9. Display of the Assistant HSUPA related information (limited traffic)
After confirming that the traffic of the UE is limited, probable reasons:
a. The TCP/IP layer is exceptional so that the TCP sends no data.b. The RLC layer is exceptional so that the RLC sends no data.
Solution:You can consider sending packets in the uplink to eliminate the effect of the TCP mechanism. If thismethod does not work, check whether the problem about packet loss exists on the RAN side.In addition, some applications in the portable PC also affect the data transmission. In this case, replace the portable PC. If the problem still exists, use a tool to capture packets and locate the exceptions between the portal PC and the UE.
The SG (UE grant) is limited.
Two basic functions of the HSUPA scheduling [Basic function 1]: Control the cell load
When the actual cell load is greater than the target value, the cell throughput can be reducedby lowering the SG of the UE. When the actual cell load is less than the target value, the cell throughput can be improved by increasing the SG of the unhappy UE.
[Basic function 2]: Limit the MBR of a single UEWhen the actual value of the MAC-e rate (including retransmitted blocks) is greater thanthe MBR, an RG Down is sent to the UE to reduce the SG of the UE. As a result, the transmission rate of the UE is reduced and is kept approximate to the MBR.
The UE maintains the SG according to the AG (AG isused only to increase the rate in the RAN6.0) and the RG (Up, Hold, and Down) sent by the NodeB. TheUE determines the actual transmission rate by reference to the SG. The actual transmission rate is less than or equal to the corresponding transmission rate of the SG.
The resources (air interface load, IUB bandwidth, and CEs) on the RAN side are limited.
If the resources on the RAN side are limited, the SG that the NodeB actually allocates to the UE is small. As a result, the UE reports that the SG is limited.
Cause 1: The air interface load is limited. Principle description:
1) According to basic function 1 of the HSUPA scheduling, when the air interface load on the RAN side is limited, the target load value is the target value configured on the RNC (this value is usually determined at the time of network planning). If the actual value of the
cell load exceeds the target value, the uplink coverage of the cell may shrink (the shrinkage depends on the uplink budget margin) and the service at the edge of the cell is affected. Therefore, the cell load needs to be controlled.2) RNC-related parameter configurationThe RNC-related parameters include MaxTargetUlLoadFactor and BackgroundNoise.MaxTargetUlLoadFactor is the target ROT. Relatedcommand: MOD CELLHSUPA MaxTargetUlLoadFactor=75 (75 represents 75%, namely, 6 dB)BackgroundNoise is the background noise. Relatedcommand: MOD CELLCAC: BackgroundNoise=71 (71 represents –112 + 7.1 = –104.9 dBm)The target RTWP is calculated according to the following formula:Target RTWP = Target ROT + Background Noise.Hence, the target RTWP = –104.9 + 6 = –98.9 dBm3) The RNC sends a message to the NodeB.The RNC carries the target RTWP and the background noise to the NodeB by sending a PHYSICAL SHARED CHANNEL RECONFIGURATION REQUEST message on the Iub interface.The relationship between the protocol value and the physical value is: physical value = –112 + protocol value/10 (unit: dBm)As shown in the figure below, the protocol valueof the target RTWP is 114, the corresponding physical value is –112 + 11.4 = –100.6 dBm. The background noise of the RTWP is 54 and the corresponding physical value of the background noise is –112 + 5.4 = –106.6 dBm.
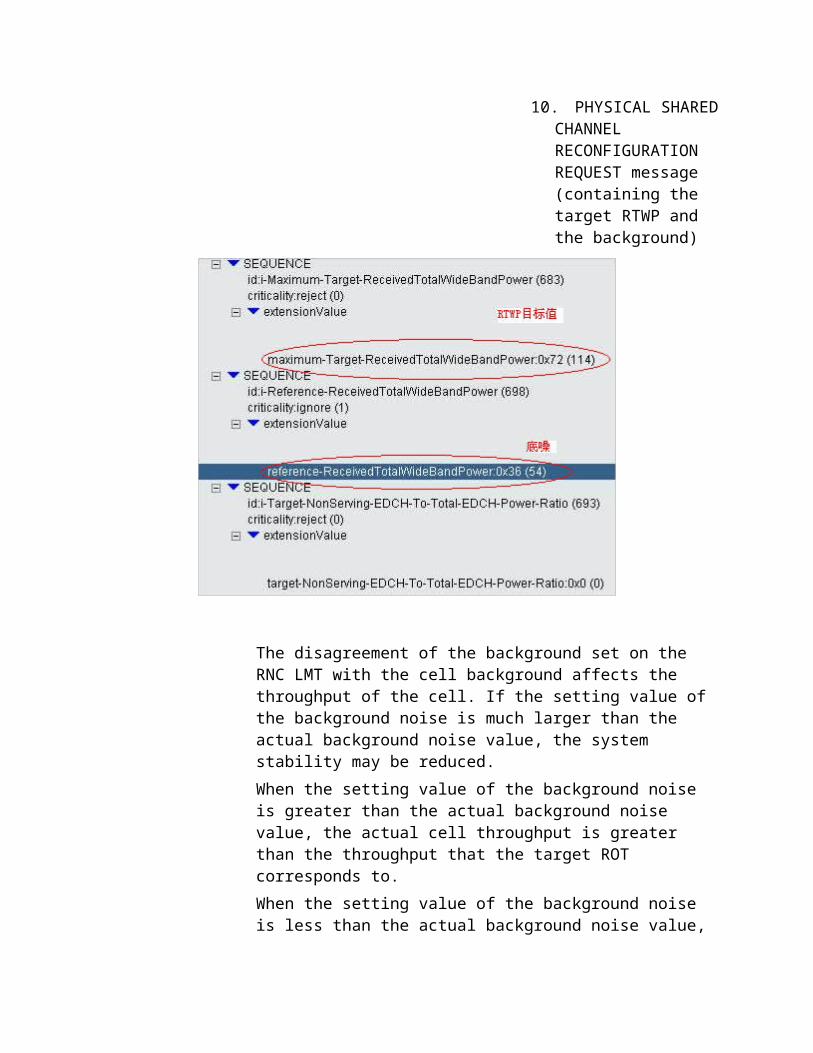
10. PHYSICAL SHAREDCHANNEL RECONFIGURATION REQUEST message (containing the target RTWP and the background)
The disagreement of the background set on the RNC LMT with the cell background affects the throughput of the cell. If the setting value of the background noise is much larger than the actual background noise value, the system stability may be reduced.When the setting value of the background noise is greater than the actual background noise value, the actual cell throughput is greater than the throughput that the target ROT corresponds to.When the setting value of the background noise is less than the actual background noise value,
the actual cell throughput is less than the throughput that the target ROT corresponds to.
Observation method:Observe the cell uplink RTWP measurement recorded and displayed on the RNC LMT to check whether it is close to the configured target RTWP. If the measured value is close to the target RTWP, the air interface load is limited and reaches the target value.
Solution:1) Set the target ROT reasonably.2) Keep the setting value of the background noise equal to the actual background noise value.The background noise update algorithm has not been commercially verified. It will be subsequently supplemented.3) Eliminate external interference.
Cause 2: The IUB bandwidth is limited. Principle description:
1) According to basic function 1 of the HSUPA scheduling, when the available bandwidth of the Iub HSUPA is limited on the RAN side, the targetload is the adjusted target value after flow control (principle of the Iub flow control: adjust the target load according to the buffer change trend on the transmission path). If the actual cell load exceeds the target load value, the data transmission delay is prolonged or evenpacket loss occurs on the Iub interface so that the data transmission performance is affected. Therefore, the actual cell load needs to be controlled.2) When the ATM is adopted on the Iub interface,the HSUPA Iub bandwidth utilization = TCP layer rate/ATM bandwidth
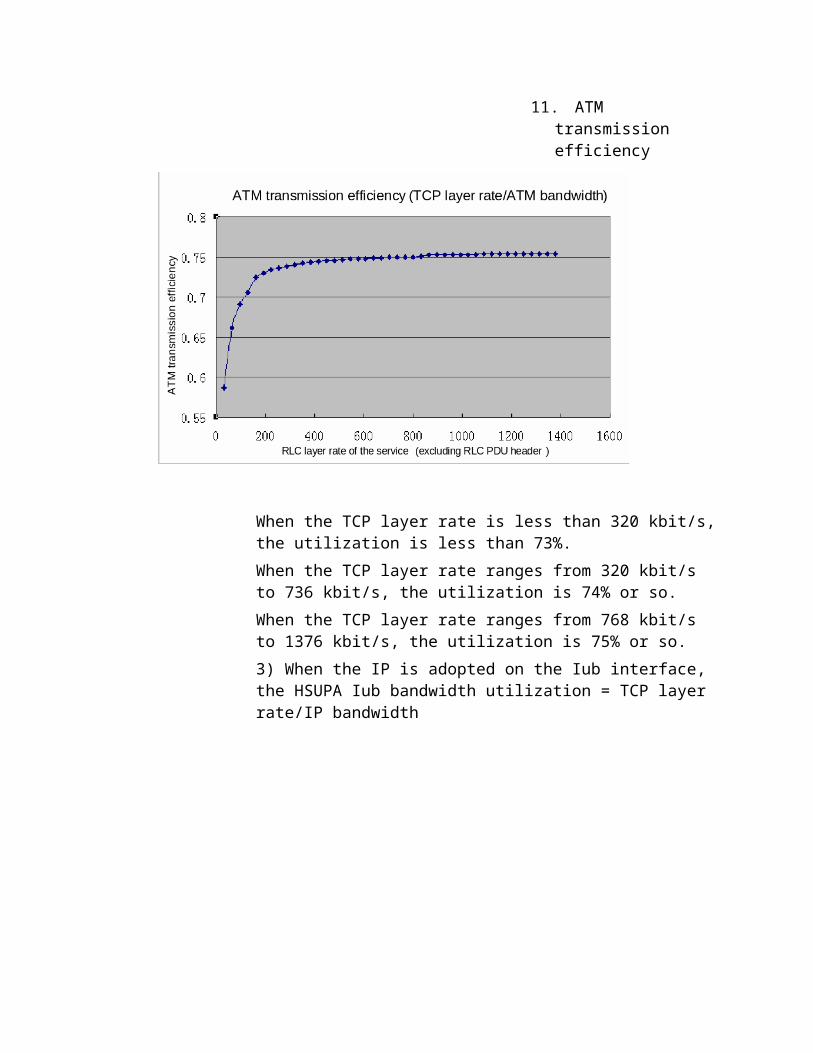
11. ATM transmission efficiency
When the TCP layer rate is less than 320 kbit/s,the utilization is less than 73%.When the TCP layer rate ranges from 320 kbit/s to 736 kbit/s, the utilization is 74% or so.When the TCP layer rate ranges from 768 kbit/s to 1376 kbit/s, the utilization is 75% or so.3) When the IP is adopted on the Iub interface, the HSUPA Iub bandwidth utilization = TCP layer rate/IP bandwidth
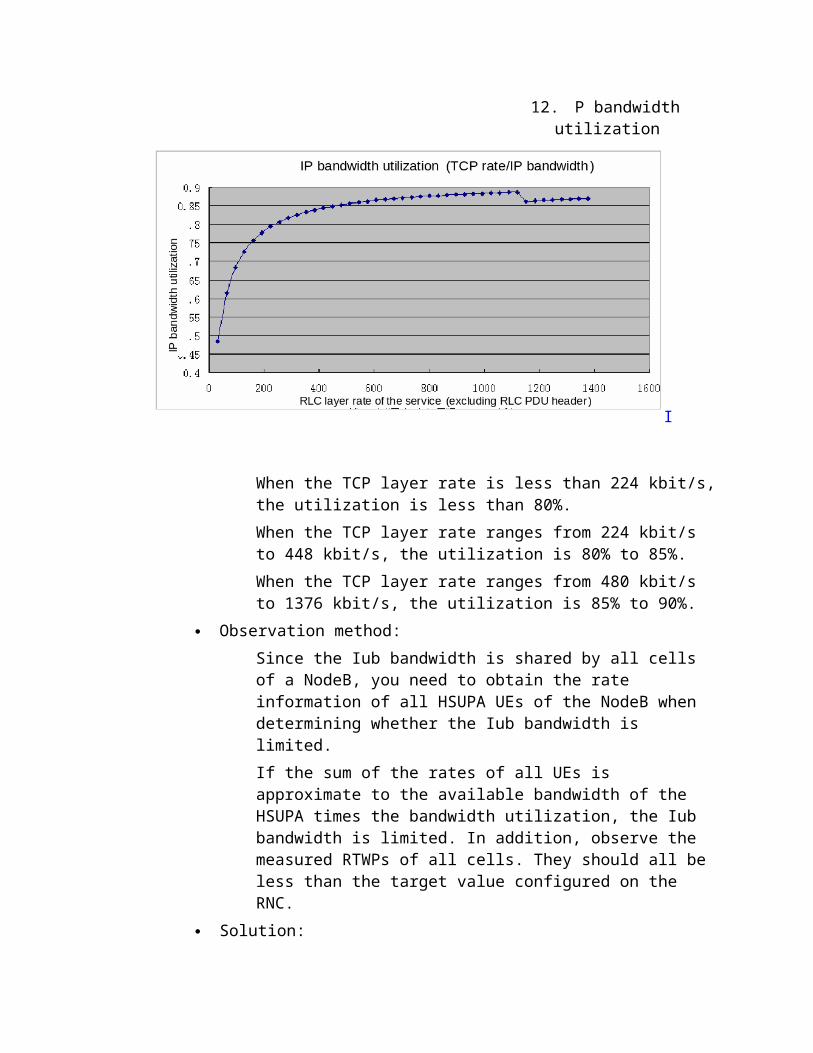
12. P bandwidth utilization
I
When the TCP layer rate is less than 224 kbit/s,the utilization is less than 80%.When the TCP layer rate ranges from 224 kbit/s to 448 kbit/s, the utilization is 80% to 85%.When the TCP layer rate ranges from 480 kbit/s to 1376 kbit/s, the utilization is 85% to 90%.
Observation method:Since the Iub bandwidth is shared by all cells of a NodeB, you need to obtain the rate information of all HSUPA UEs of the NodeB when determining whether the Iub bandwidth is limited.If the sum of the rates of all UEs is approximate to the available bandwidth of the HSUPA times the bandwidth utilization, the Iub bandwidth is limited. In addition, observe the measured RTWPs of all cells. They should all be less than the target value configured on the RNC.
Solution:
Improve the available Iub bandwidth of the HSUPA.
Cause 3: The NodeB CEs are limited. Principle description:
When the NodeB CE resources on the RAN side are limited, the dynamic CE adjustment algorithm (not implemented in NodeB V18 but implemented inlater versions) reduces the MBR of the UEs or the minimum available SF.
Observation method:Make observations on the NodeB debugging console.
Solution:Add CEs.
The service MBR (NodeB MBR) is limited.
Principle description: See the description of basic function 2 of the HSUPA
scheduling. Concepts of CN assigned MBR, RNC MBR, and NodeB MBR
CN assigned MBR:The CN notifies the RNC of the assigned MBR in aRAB Assignment Request message.
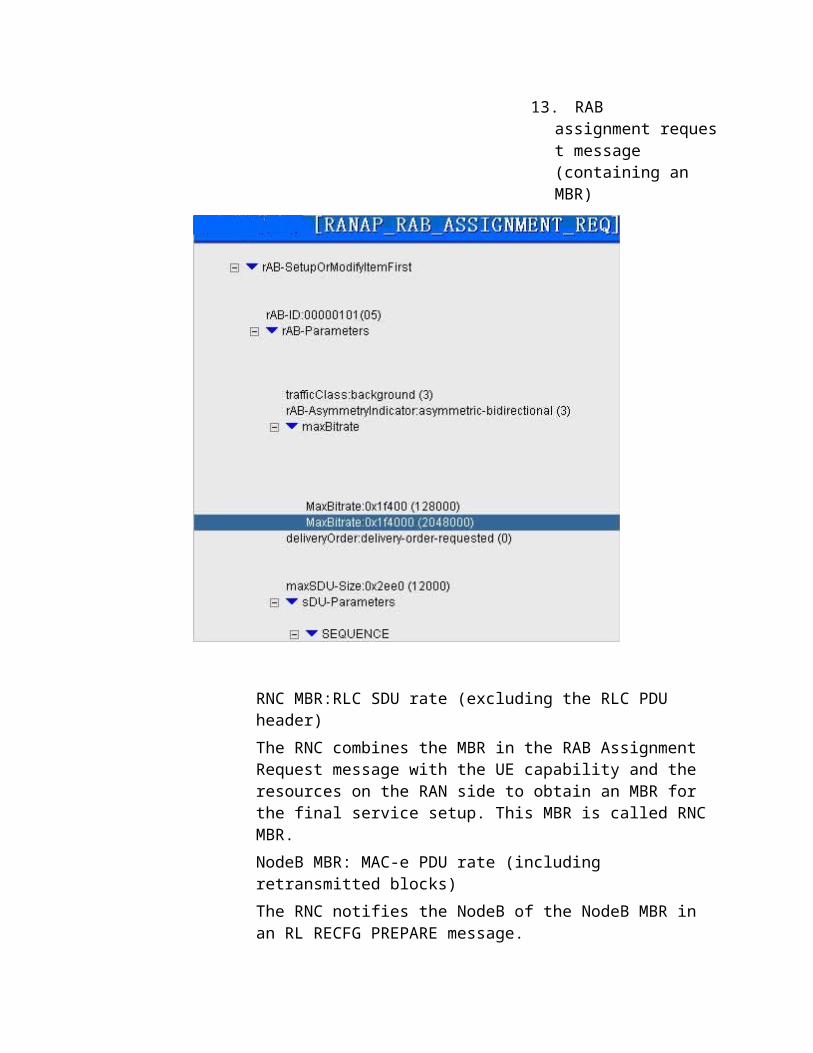
13. RAB assignment request message (containing an MBR)
RNC MBR:RLC SDU rate (excluding the RLC PDU header)The RNC combines the MBR in the RAB Assignment Request message with the UE capability and the resources on the RAN side to obtain an MBR for the final service setup. This MBR is called RNC MBR.NodeB MBR: MAC-e PDU rate (including retransmitted blocks)The RNC notifies the NodeB of the NodeB MBR in an RL RECFG PREPARE message.
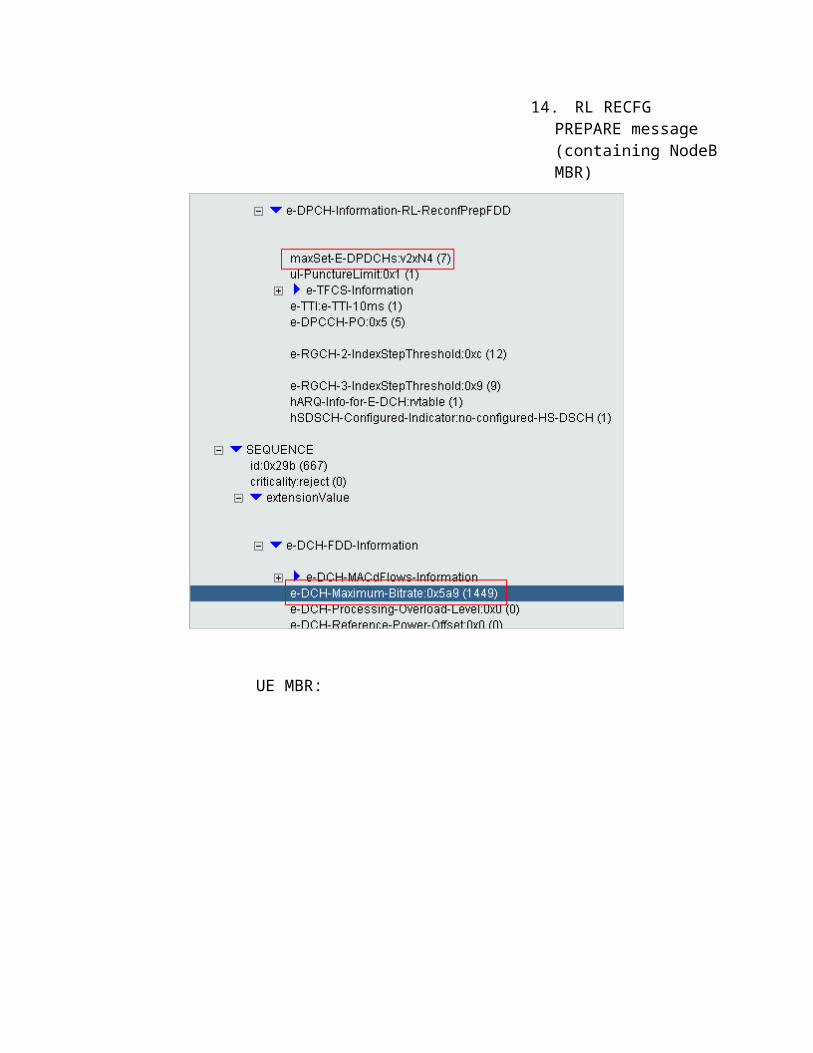
14. RL RECFG PREPARE message (containing NodeBMBR)
UE MBR:
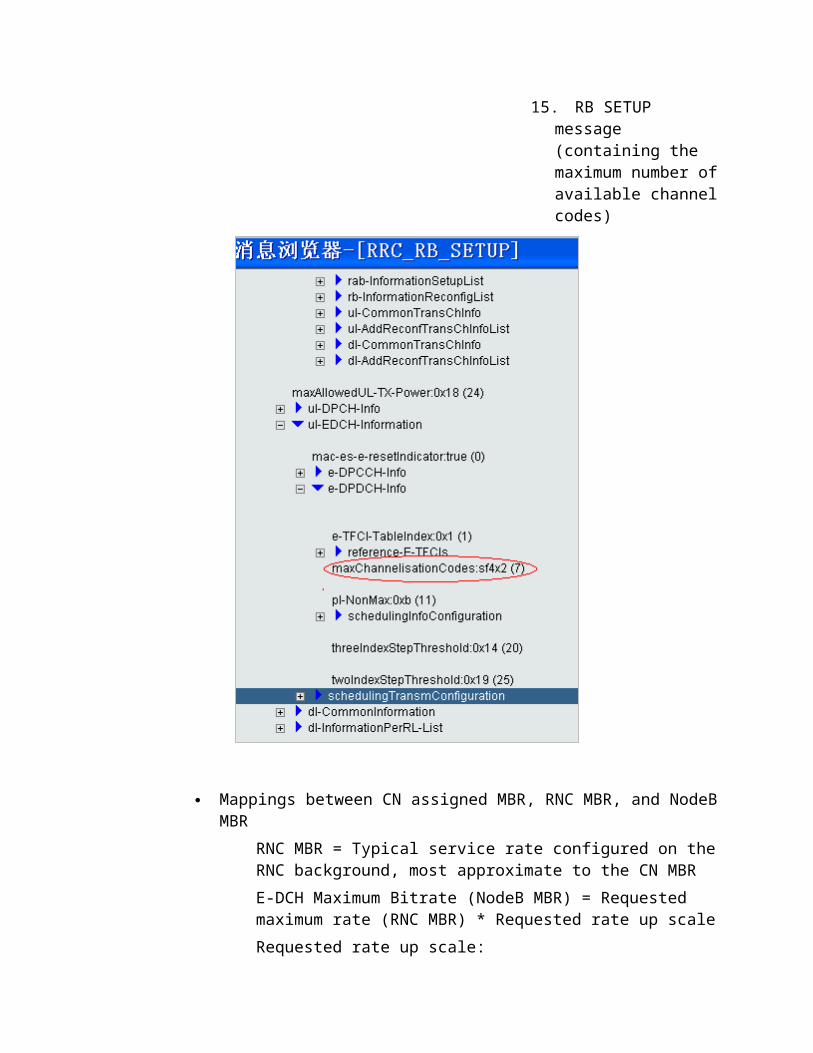
15. RB SETUP message (containing the maximum number ofavailable channelcodes)
Mappings between CN assigned MBR, RNC MBR, and NodeBMBR
RNC MBR = Typical service rate configured on theRNC background, most approximate to the CN MBRE-DCH Maximum Bitrate (NodeB MBR) = Requested maximum rate (RNC MBR) * Requested rate up scaleRequested rate up scale:
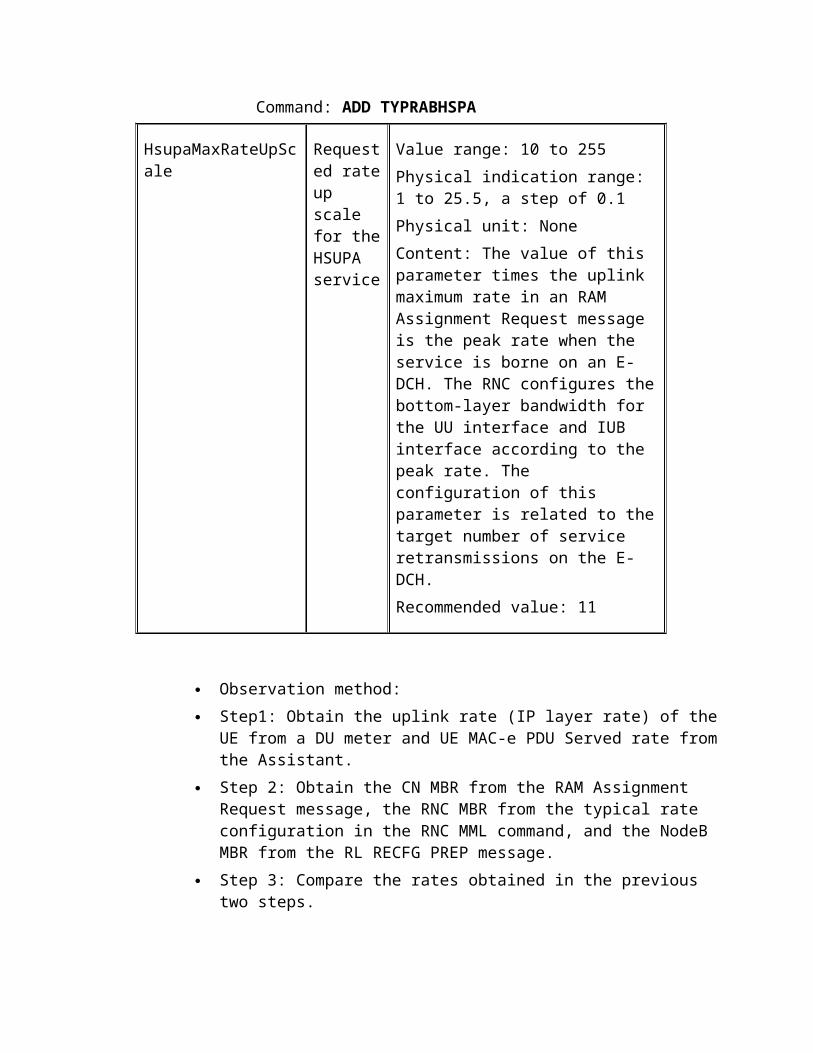
Command: ADD TYPRABHSPA
HsupaMaxRateUpScale
Requested rateup scale for theHSUPA service
Value range: 10 to 255Physical indication range: 1 to 25.5, a step of 0.1Physical unit: NoneContent: The value of this parameter times the uplink maximum rate in an RAM Assignment Request message is the peak rate when the service is borne on an E-DCH. The RNC configures thebottom-layer bandwidth for the UU interface and IUB interface according to the peak rate. The configuration of this parameter is related to thetarget number of service retransmissions on the E-DCH.Recommended value: 11
Observation method: Step1: Obtain the uplink rate (IP layer rate) of the
UE from a DU meter and UE MAC-e PDU Served rate fromthe Assistant.
Step 2: Obtain the CN MBR from the RAM Assignment Request message, the RNC MBR from the typical rate configuration in the RNC MML command, and the NodeB MBR from the RL RECFG PREP message.
Step 3: Compare the rates obtained in the previous two steps.
If the rate on the DU meter is approximate to the RNC MBR and the corresponding UE MAC-e PDU Served Rate is approximate to the NodeB MBR, theNodeB MBR is limited.
Solution:To improve the throughput of a UE, modify the subscription information and configure a higher MBR.
The UE demodulates incorrectly.
Cause 1: The SG is not updated because the CRC of the AG value fails
Principle description:According to the AG, the UE updates the SG that it maintains. If an AG reception error (CRC failure) occurs, the SG maintained by the UE is incorrect.There are two possible causes for the AG reception error:1) The E-AGCH power in the position where the UEis located is low.Huawei RNC provides two power control modes for the HSUPA downlink control channels (including E-RGCH, E-AGCH, and E-HICH).Power control mode 1: Fixed transmit power relative to the PCPICH. In this mode, each channel adopts a fixed power and all UEs use thesame power. This is equivalent to "no power control".Power control mode 2: Power control for UE basedon the DPCH transmit power. Since each UE is assigned with its own E-RGCH and E-HICH and signaling can be sent to only one UE on the E-AGCH at a specific time, the downlink control channel of the HSUPA can separately perform power control for each UE.
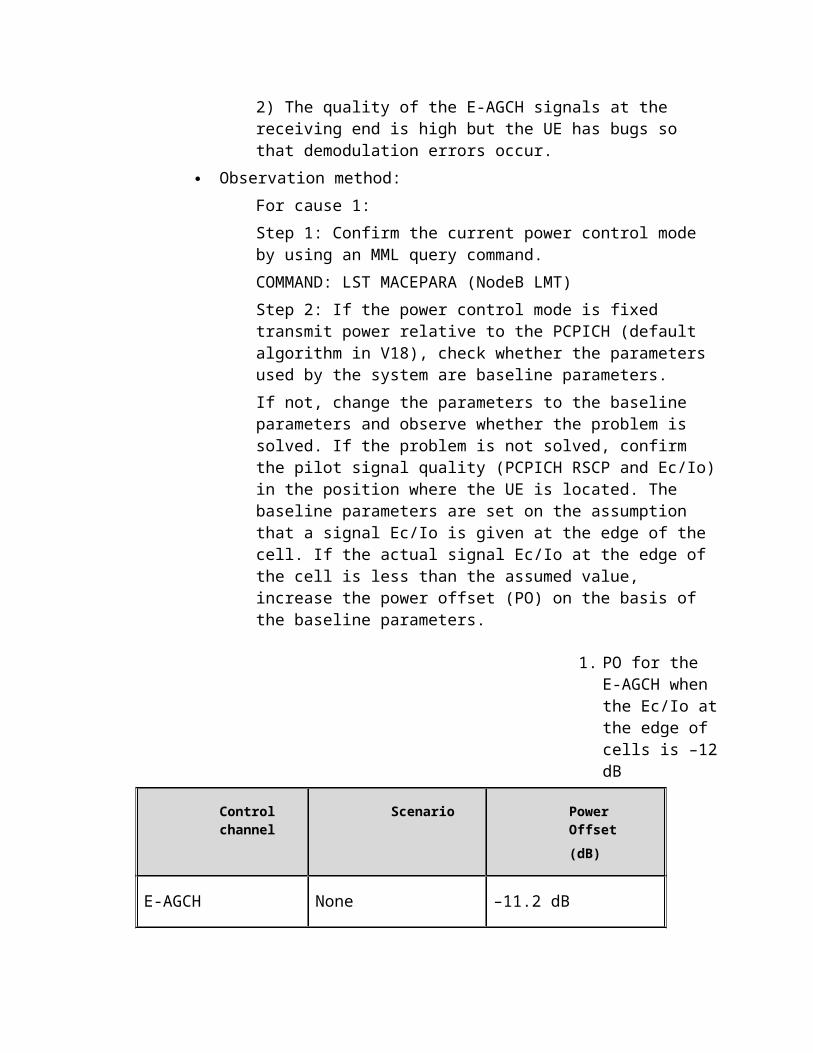
2) The quality of the E-AGCH signals at the receiving end is high but the UE has bugs so that demodulation errors occur.
Observation method:For cause 1:Step 1: Confirm the current power control mode by using an MML query command.COMMAND: LST MACEPARA (NodeB LMT)Step 2: If the power control mode is fixed transmit power relative to the PCPICH (default algorithm in V18), check whether the parameters used by the system are baseline parameters.If not, change the parameters to the baseline parameters and observe whether the problem is solved. If the problem is not solved, confirm the pilot signal quality (PCPICH RSCP and Ec/Io)in the position where the UE is located. The baseline parameters are set on the assumption that a signal Ec/Io is given at the edge of the cell. If the actual signal Ec/Io at the edge of the cell is less than the assumed value, increase the power offset (PO) on the basis of the baseline parameters.
1. PO for the E-AGCH when the Ec/Io atthe edge of cells is –12dB
Control channel
Scenario Power Offset(dB)
E-AGCH None –11.2 dB
If the actual signals at the edge of the cell ina scenario are worse, the Ec/Io decreases by 1 dB and the PO of each channel increases by 1 dB.Compare the AG received by the UE with the one sent by the NodeB (the latter can be obtained from the NodeB scheduling debugging information file).
It is forbidden to use the NodeB debugging management system in a commercial network.
Solution:For cause 1, increase the PO of the E-AGCH on the basis of the baseline parameters according to the actual signal coverage quality at the edge of the cell.For cause 2, remove the bugs from the terminal.
Cause 2: The UE demodulates the RG incorrectly. Principle description:
The UE updates the SG that it maintains based onthe RG information. If an RG reception error occurs, infer that the maintained SG is incorrect.The possible causes for a UE RG demodulation error are as follows:1) The E-RGCH power in the position where the UEis located is low.2) The E-RGCH power is sufficient, but the E-HICH ACK is demodulated into RG UP owing to the E-HICH interference when RG Hold is sent.
Observation method:Make observations on the NodeB maintenance/debugging console.For cause 1:Step 1: Confirm the current power control mode by using an MML query command.
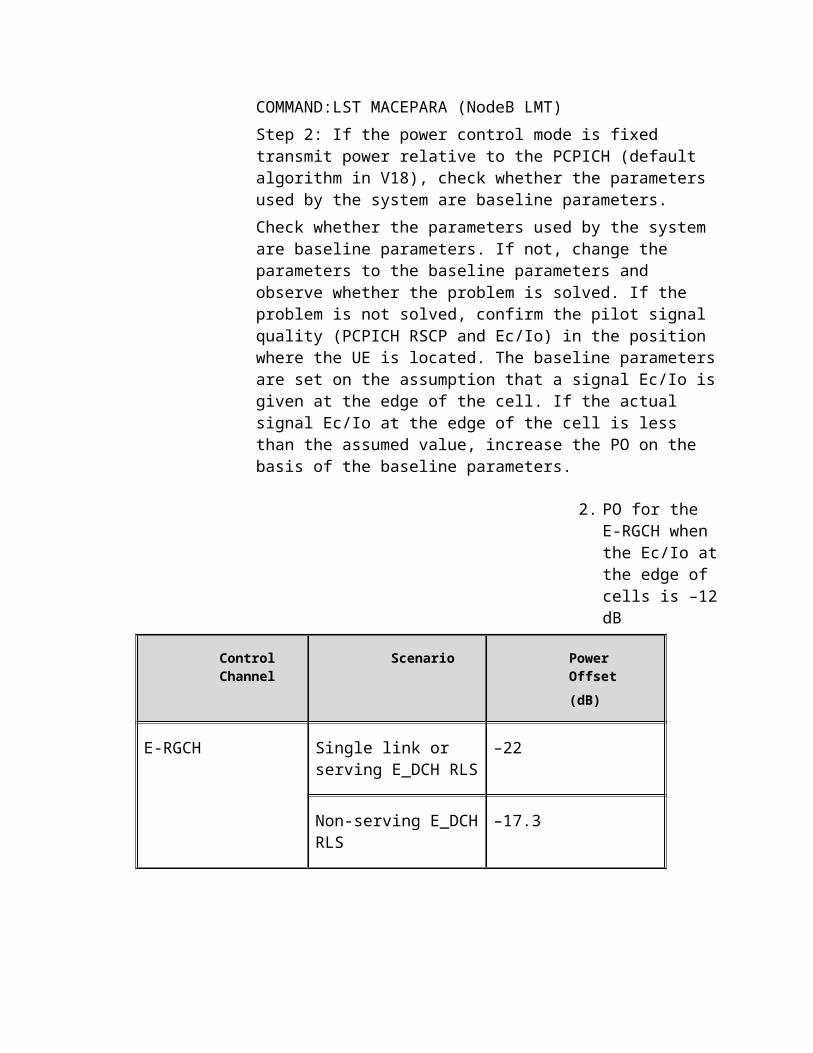
COMMAND:LST MACEPARA (NodeB LMT)Step 2: If the power control mode is fixed transmit power relative to the PCPICH (default algorithm in V18), check whether the parameters used by the system are baseline parameters.Check whether the parameters used by the system are baseline parameters. If not, change the parameters to the baseline parameters and observe whether the problem is solved. If the problem is not solved, confirm the pilot signal quality (PCPICH RSCP and Ec/Io) in the position where the UE is located. The baseline parametersare set on the assumption that a signal Ec/Io isgiven at the edge of the cell. If the actual signal Ec/Io at the edge of the cell is less than the assumed value, increase the PO on the basis of the baseline parameters.
2. PO for the E-RGCH when the Ec/Io atthe edge of cells is –12dB
Control Channel
Scenario Power Offset(dB)
E-RGCH Single link or serving E_DCH RLS
–22
Non-serving E_DCHRLS
–17.3
If the actual signals at the edge of the cell ina scenario are worse, the Ec/Io decreases by 1 dB and the PO of each channel increases by 1 dB.Make comparison tests between NodeB and UE and ensure that the E-RGCH power is properly set.Step 3: If the power control mode is power control for UE based on the DPCH transmit power (default algorithm in V22), no test experience is available in V18 and test experience will be supplemented in later versions.For cause 2:Cause 2 is caused by the signature used by the E-HICH and the E-RGCH. A signature error exists in a NodeB test version. When the pilot power is33 dBm and HICH power is set to 33 – 21 = 12 dBm, AG Hold is normally demodulated. When the HICH power is set to 13 dBm, AG Hold is occasionally demodulated into AG UP. When the HICH power is set to 14 dBm, AG Hold is most demodulated into AG UP. When the HICH power is set to 16 to 18 dBm, AG Hold is basically all demodulated into AG UP.
Solution:For cause 1, increase the PO of the E-RGCH on the basis of the baseline parameters according to the actual signal coverage quality at the edge of the cell.For cause 2, rectify the product.
MAC-e PDU Served Rate Exception LocationIf MAC-e PDU Non-DTX Rate is normal, further determine whether the MAC-e PDU Served Rate is exceptional.
Relationship between the MAC-e PDU Served Rate and the MAC-e PDU Non-DTX Rate:
Served Rate = MAC-e PDU Non-DTX Rate * Non-DTX Probability
Locating an served rate exception is the process of locating a non-DTX probability exception.
When a single HSUPA UE uploads a large-sized file, normally, the non-DTX probability should be 100%.A non-DTX probability less than 100% is considered an exception and the cause needs to be analyzed.
Factors affecting a non-DTX probability:
The RLC layer is exceptional so that RLC data is notsent in time.See "RLC SDU Throughput UL Exception Location".
The TCP/IP layer is exceptional so that TCP data is not sent in time.See "TCP/IP Layer Rate Exception Location".
MAC-e PDU Available Rate Exception LocationIf MAC-e PDU Non-DTX Rate and MAC-e PDU Served Rate are both normal,further determine whether the MAC-e PDU Available Rate is exceptional.
Relationship between the MAC-e PDU Available Rate and the MAC-e PDU Served Rate:
MAC-e PDU Available Rate ≈ MAC-e PDU Served Rate *(1-SBLER)
Locating a MAC-e PDU available rate exception is the process of locating an SBLER exception.
You can set the target number of the MAC-es PDU retransmissions (usually 0.1 on average) on the RNC LMT.
If the measured SBLER deviates greatly from the target number of MAC-es PDU retransmissions, it is considered as an SBLER exception.
Factors affecting the SBLER convergence:
The uplink outer loop power control is exceptional.
The SBLER obtained from the terminal side refers to the block error rate of the MAC-e TB, while theBLER obtained from the RNC side refers to the average number of MAC-esPDU transmissions.
The maximum uplink SIRtarget is set so low that the SBLER is high.
Principle description:When the actual SBLER is greater than the targetvalue, the uplink outer power control of the
HSUPA increases the value of the SIRtarget so that the actual SBLER can be converged to the target value.A maximum SIRtarget value is set on the RNC for the purpose of exception prevention. When the SIRtarget required for power control is greater than the maximum SIRtarget value, the maximum SIRtarget value is used. That is, the SIRtarget value is truncated.If the SIRtarget is set too small, the actual SBLER will be greater than the target value.The maximum SIRtarget value is related to other outer loop power control parameters (including reference ETFCI, reference PO, and target numberof retransmissions).
Observation method:Query the maximum SIRtarget that the system currently uses.MML command: LST TYPRAB
Solution:Step 1: Check whether the maximum SIRtarget is the default. If not, change it to the default value and observe whether the problem is solved.Step 2: If the problem is not solved after the maximum SIRtarget is changed to the default, check whether the outer loop power control parameters (mainly including reference ETFCI, reference PO, and target number of retransmissions) are set to the defaults. If not, change the values of these parameters to the defaults and observe whether the problem is solved.
Packet loss on the Iub interface causes a high SIRtarget but a low SBLER.
Principle description:
The statistics of the number of MAC-es PDU retransmissions for the uplink outer loop power control in the version earlier than V18 involvesbit errors on the air interface and packet loss on the Iub interface. When packet loss occurs onthe Iub interface, the number of MAC-es PDU retransmissions is larger than the target value.As a result, the SIRtarget is high. In this case, the air interface quality is high, that is, the SBLER observed from the UE is low.The statistics of the number of MAC-es PDU retransmissions for the uplink outer loop power control in the version later than V18 involves only bit errors on the air interface, regardlessof packet loss on the Iub interface. Therefore, packet loss on the Iub interface does not affectthe performance of power control.The possible causes for packet loss on the Iub interface are as follows:1) The bottom-layer transmission is exceptional.2) The Iub uplink transmission is configured incorrectly.3) Transmission buffer overflows occur.
Observation method:See "RLC SDU Throughput UL Exception Location".
Solution:See "RLC SDU Throughput UL Exception Location".
The probability of demodulating ACK into NACK/DTX is high.
Principle description:The UE obtains ACK/NACK/DTX information by demodulating the E-HICH. If ACK is taken for NACK or DTX, the UE performs a retransmission. In this case, the SBLER measured on the UE side is greaterthan the actual one and the effective rate is reduced.
If the E-HICH transmit power is low, the probability of demodulating ACK into NACK or DTX is high.There are two power control algorithms for the E-HICH: 1) Fixed transmit power relative to the PCPICH. 2) Power control for UE based on the DPCH transmit power.Currently, the first algorithm (NodeB V1) is adopted. When the E-HICH power offset is set low, the E-HICH demodulation performance of the UE at the edge of a cell is affected.When the UE is located in a soft handover cell, a soft combination is performed for the E-HICHs in the same RLS, and the E-HICHs in the non-serving RLS can send ACK and DTX coming from the E-HICHs in different RLSs.
Observation method:Confirm the current power control mode by using anMML query command.LST MACEPARA
Solution: Step 1: If the power control mode is fixed transmit
power relative to the PCPICH (default algorithm in V18), check whether the parameters used by the system are baseline parameters.
If not, change the parameters to the baseline parameters and observe whether the problem is solved. If the problem is not solved, confirm the pilot signal quality (PCPICH RSCP and Ec/Io)in the position where the UE is located. The baseline parameters are set on the assumption that a signal Ec/Io is given at the edge of the cell. If the actual signal Ec/Io at the edge of the cell is less than the assumed value, increase the Ec/Io on the basis of the baseline parameters.
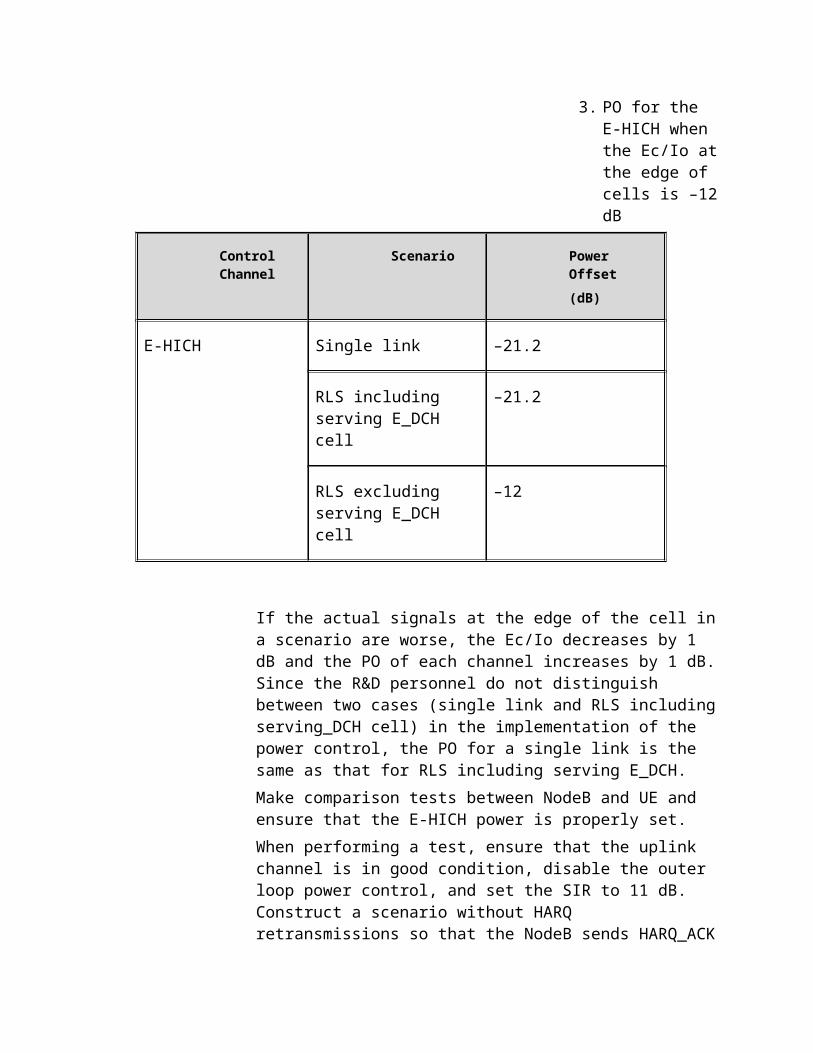
3. PO for the E-HICH when the Ec/Io atthe edge of cells is –12dB
Control Channel
Scenario Power Offset(dB)
E-HICH Single link –21.2
RLS including serving E_DCH cell
–21.2
RLS excluding serving E_DCH cell
–12
If the actual signals at the edge of the cell ina scenario are worse, the Ec/Io decreases by 1 dB and the PO of each channel increases by 1 dB.Since the R&D personnel do not distinguish between two cases (single link and RLS includingserving_DCH cell) in the implementation of the power control, the PO for a single link is the same as that for RLS including serving E_DCH.Make comparison tests between NodeB and UE and ensure that the E-HICH power is properly set.When performing a test, ensure that the uplink channel is in good condition, disable the outer loop power control, and set the SIR to 11 dB. Construct a scenario without HARQ retransmissions so that the NodeB sends HARQ_ACK
all the time. Test the probability of demodulating ACK into NACK from the UE side.
Step 2: If the power control mode is power control for UE based on the DPCH transmit power (default algorithm in V22), no test experience is available in V18 and test experience will be supplemented in later versions.
RLC SDU Throughput UL Exception LocationWorking principle of data transmission at the RLC layer:
RLC transmission includes transparent transmission (TM), un-acknowledgment mode (UM), and acknowledgment mode (AM). PS services (FTP and HTTP)usually adopt the AM and the sequence in which the RLC submits SDUs can be configured (sequential submission and non-sequential submission) on the RNCLMT.
The AM adopts the positive/negative acknowledgment strategy for reliable data transmission and adopts asliding window protocol for flow control.
Before the RLC receives an acknowledgment packet, the maximum number of PDUs that the RLC can send is the RLC Send Window. The sooner the sender receives an acknowledgment, the faster the window slides and the higher the allowed RLC transmission rate is. Otherwise, the RLC transmission rate is lower. Even call drops occur because the RLC is reset.
The sequential submission ensures that no packet loss occurs to the data submitted to the upper-layerand the data is submitted in sequence. PS services usually use TCP/IP. If packet loss happens at the upper layer, it may lead to congestion and slow starting of TCP.. This affects the transmission rate.
Sequential submission is recommended for the RLC andthe non-sequential submission for the core network.
Factors affecting the RLC layer rate:
Packet loss causes a high RLC retransmission rate. The RLC send window is full.
Judge RLC SDU throughput UL exceptions.
If MAC-e PDU Non-DTX Rate and MAC-e PDU Served Rate are both normal, further determine whether the RLC PDU throughput UL and RLC SDU throughput UL are exceptional.
Relationship between the RLC PDU throughput UL and the MAC-e PDU avaivable rate:
RLC PDU Throughput UL = MAC-e PDU Available Rate * (1-header overhead ratio of MAC-e PDU)
As the header overhead ratio is small, seen from the Probe, the RLC throughput curve and the MAC layer rate curve are basically overlapped.
This relationship should be kept between RLC PDU throughput UL and MAC-e PDU available rate all the time and no exception should occur.
Relationship between RLC SDU throughput UL and RLC PDU throughput UL:
RLC SDU Throughput UL ≈ RLC PDU Throughput UL*(1-RLCPDU Retransmission Rate UL)*header overhead ratio ofthe RLC PDU
For BE services, the uplink outer loop power control usually ensuresthat the RLC PDU retransmission rate UL is 0% when only MAC-e PDU retransmission happens. Therefore, RLC SDU throughput UL is approximate to the RLC PDU throughput UL * header overhead ratio of the RLC PDU. Otherwise, an exception is considered, that is, the RLCretransmission high.
For time sensitive services such as VoIP over the HSUPA, to ensure the real-time of services, the uplink outer loop power control ensures that the MAC-es PDU has a residual BLER. In this case, the RLC PDU retransmission rate UL is approximate to the target residualBLER. Otherwise, an exception is considered, that is, the RLC retransmission rate is not converged within the target value.
The version V18 supports only the BE services over the HSUPA. Therefore, the RLC retransmission rate is usually required to approach 0.
Factors affecting the RLC SDU throughput UL:
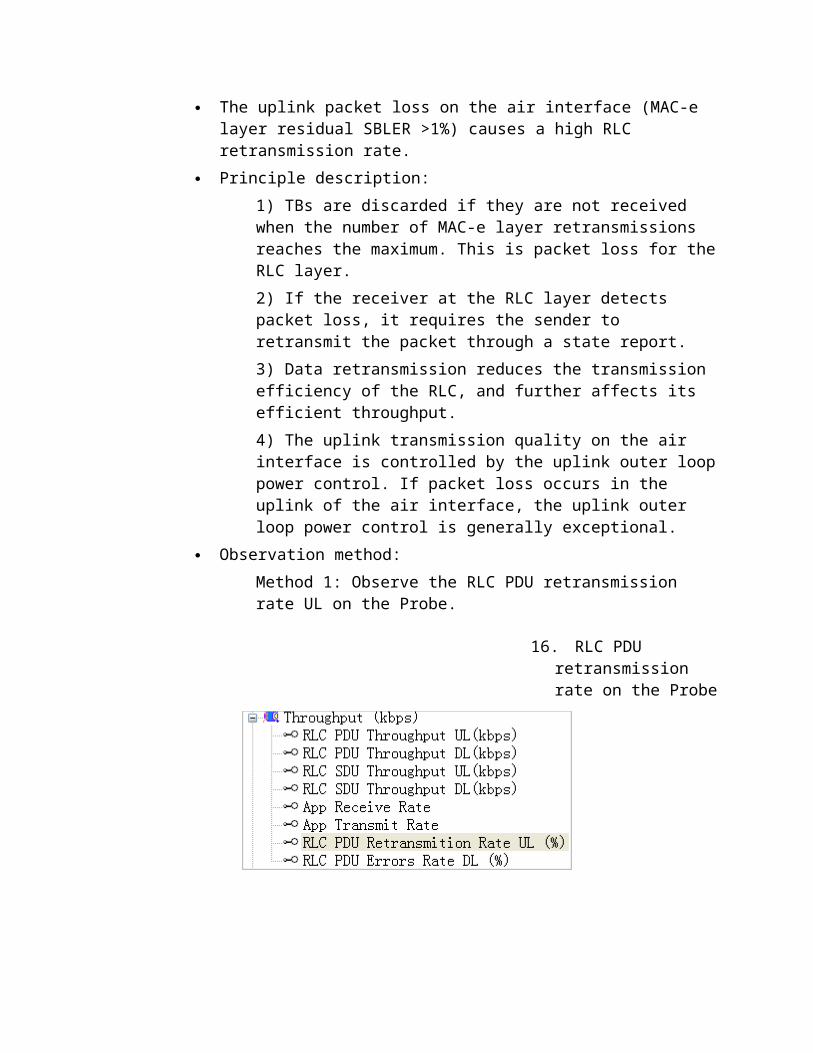
The uplink packet loss on the air interface (MAC-e layer residual SBLER >1%) causes a high RLC retransmission rate.
Principle description:1) TBs are discarded if they are not received when the number of MAC-e layer retransmissions reaches the maximum. This is packet loss for theRLC layer.2) If the receiver at the RLC layer detects packet loss, it requires the sender to retransmit the packet through a state report.3) Data retransmission reduces the transmission efficiency of the RLC, and further affects its efficient throughput.4) The uplink transmission quality on the air interface is controlled by the uplink outer looppower control. If packet loss occurs in the uplink of the air interface, the uplink outer loop power control is generally exceptional.
Observation method:Method 1: Observe the RLC PDU retransmission rate UL on the Probe.
16. RLC PDU retransmission rate on the Probe
Method 2: Observe the residual BLER (Res. BLER) of the MAC-e layer on the Probe. Normally, the Res. BLER is less than 1%.Block –Number of frames failing to be transmitted at the MAC-e layer. That is, if the transmission ofa frame still fails after the MAC-e layer retransmits it for multiple times, the RLC layeroriginates a retransmission. In this case, the value is increased by 1.Block +Number of frames transmitted successfully at theMAC-e layer, equal to SB +Res. BLERResidual block error rate at the MAC-e layer, namely, the number of frames failing to be transmitted at the RLC layer/total number of transmissions at the RLC layer: (Block -) / ((Block -) + (Block +)) * 100%
Solution:The uplink transmission quality on the air interface is controlled by the uplink outer looppower control. If packet loss occurs in the uplink of the air interface, the uplink outer loop power control is usually exceptional.You need to check whethera) Target values for power control are configured correctly.b) The uplink SIRtarget is normal.c) The actual SIR is converged within the targetvalue.
The downlink packet loss on the air interface (the probability of demodulating NACK into ACK is high) causes a high RLC retransmission rate.
Principle description:
If the UE takes the NACK sent by the NodeB for ACK, the corresponding TB is not retransmitted. As a result, a block error is introduced at the RLC layer. The block error causes RLC retransmission and affects the throughput.The possible causes for a UE E-HICH demodulationerror are as follows:The E-HICH power in the position where the UE islocated is low.
Observation method:See High Probability of Demodulating ACK into NACK/DTX.
Solution:See High Probability of Demodulating ACK into NACK/DTX.
The uplink packet loss on the Iub interface (the bottom-layer transmission is exceptional) causes a high RLC retransmission rate.
Principle description:The exceptional bottom-layer transmission (for example, intermittent failure of E1) causes uplink packet loss.
Observation method:The packet loss in the uplink in this case can be observed only on the RNC, instead of the NodeB.
Solution:Observe whether there is any transmission alarm,solve any transmission exception, and clear the alarm.
The uplink packet loss on the Iub interface (the uplink transmission of the Iub interface is configured incorrectly) causes a high RLC retransmission rate.
Principle description:
The incorrect uplink transmission configuration on the Iub causes uplink packet loss.
Observation method:The packet loss in the uplink in this case can be observed only on the RNC, instead of the NodeB.
Solution:Check the configuration data of the transmissionlayer and ensure that the configuration data is correct.
The uplink packet loss on the Iub interface (a transmission buffer overflow occurs) causes a high RLC retransmission rate.
Principle description:The untimely flow control on the Iub interface causes buffer overflows and packet loss.
Observation method:The packet loss in the uplink in this case can be observed through the NodeB debugging console.
Solution:Determine whether the flow control algorithm is exceptional.
The RLC layer fails to return an ACK in time (the RLC state report disable timer is not set properly/the downlink BLER is not converged) so thatthe RLC send window is full.
Principle description:Currently, the maximum size of the RLC send window can be set to 2047 (the RLC receive/send window size of the terminal is 2047). When the RLC transmission rate is very high, the RLC sendwindow is easily full and cannot send other dataif the state report is not returned in time.For example, if the rate on the air interface is1.4 Mbit/s and the RLC PDU size is 336 bits, the
RLC send window can send data for (2047 x 336)/(1.4 x 1000) = 491.28 ms. If the RNC fails to receive a state report within 491.28 ms, the RLC send window is full.The return time of the state report is related to the state report disable timer and the uplinkair interface quality. If the state report disable time is set too long, or the uplink BLERis not converged, the RLC send window may be full.
Observation method:Currently, we have very limited means to observewhether the RLC send window is full on the UE side. We must analyze the data on the user planeand the control plane at the RLC layer to learn whether the RLC window is full. Currently, the Assistant V1.4 does not support this function. We can use only the QCAT to make analysis.Therefore, a simple method is reverse inference.Assume that the RLC send window is full and try the following methods to check whether the problem is solved. If the problem is solved, thecause is that the RLC send window is full.
Solution:Method 1: Increase the RLC send window by changing the RLC PDU size from 336 to 656.Method 2: Check whether the state report disabletimer is set properly and whether it is set to the default of the baseline.Method 3: Check the convergence of the downlink BLER to ensure the BLER is converged.
TCP/IP Layer Rate Exception LocationWorking principle of data transmission at the TCP/IP layer:
TCP/IP adopts the inclusive acknowledgment strategy for reliable data transmission and the sliding window protocol for flow control, and performs congestion control when detecting a network congestion.
Flow control (sliding window)Flow control is used to prevent buffer overflows and saturation of the computer at the receiving end. Flow control generates a window value for thesender to transmit the specified number of bytes in the window. Then, the window is closed and the sender must stop data transmission. The window is not opened until the sender receives an ACK from the receiver.
Inclusive acknowledgment strategyAll to-be-transmitted bytes before the confirmed byte number are acknowledged. Suppose that 10 datafragments are to be transmitted. These data fragments cannot reach the destination in sequence. TCP must acknowledge the highest byte number of consecutive bytes without any error. Thehighest byte number is not allowed to be acknowledged before all the middle bytes reach thedestination. If the acknowledgment to the middle bytes is not sent to the sender, the sender TCP entity finally times out and retransmits the unacknowledged data.
Congestion control (timeout and retransmission)TCP determines a network congestion by measuring the round-trip time (RTT) delay timeout or receiving a repeated acknowledgment. When a network congestion is detected, the congestion avoidance algorithm (downspeeding and retransmission) is enabled.
Therefore, the factors affecting the TCP/IP data transmission rate include:
Configured TCP receive/send windowAlthough the receive window size is dynamic (if packets out of sequence are received or packets cannot be submitted to the upper layer in time, the available window size becomes small), the
configured window size determines the maximum available size of the receive window.According to the formula Capacity (bit)=bandwidth (b/s)*round-trip time (s), if the receive/send window is too small, the transmission rate is affected.
Actual receive window size RTT fluctuation triggers the congestion avoidance
mechanism (packet loss on the CN side, downlink BLERconvergence failure, and too small a reverse bandwidth of TCP/IP)
TCP/IP layer rate exception judgment:
If MAC-e PDU Non-DTX Rate, MAC-e PDU Served Rate, and MAC-e PDU Served Rate are all normal, the traffic of the UE is limited, but the data to be sent is sufficient, it can determined that the TCP/IPlayer rate is exceptional.
Too small a TCP receive window on the receiver side makes the send window easily full.
Principle description:TCP/IP adopts the sliding window protocol. The sliding window protocol allows the sender to transmit multiple consecutive packets before thesender stops transmission and waits for an acknowledgment. As it is unnecessary for the sender to stop and wait for an acknowledgment each time it transmits a packet, the sliding window protocol increases the data transmission rate.Theoretically, TCP receive window size should begreater than the product of the bandwidth and the delay.Capacity(bit)=bandwidth(b/s)*round-trip time(s)A 66535-byte window is sufficient for the 1.6 Mbit/s service, but insufficient for 3.6 Mbit/s service. Especially when the delay is greater than 200 ms, the TCP window is easily full. As a
result, you observe that the buffers of the RLC and the NodeB are 0.
Observation method:1) Query the configuration of the TCP receive window at the receiver end.2) Obtain the current Ping delay (test the RTT)3) Observe the rate on the UE/DU meter is approximate to the TCP receive window size/RTT.
Solution:1) Change the TCP receive window size at the receiver end.Use the following registry entries to set the receive window size to 80 KB (80*1024 = 81920).Method 1:Use the DRTCP tool to modify the receive window size and restart the computer.Method 2:HKEY_LOCAL_MACHINE\System\CurrentControlSet\Services\Tcpip \Parameters\TcpWindowSize (REG_DWORD)Restart the computer.2) If no DRTCP tool is available, use multiple processes to perform verification.
A 100% CPU load at the receiving end cause the TCP receive window to be full.
Principle description:When the CPU load at the receiving end reaches 100%, the data in the TCP receive window cannot be submitted to the upper layer and the TCP receive window is full.When the TCP receive window is full, the receiver notifies the TCP sender of it and the sender stops transmitting data. As a result, theRLC BO is 0 and the UE transmits no data.
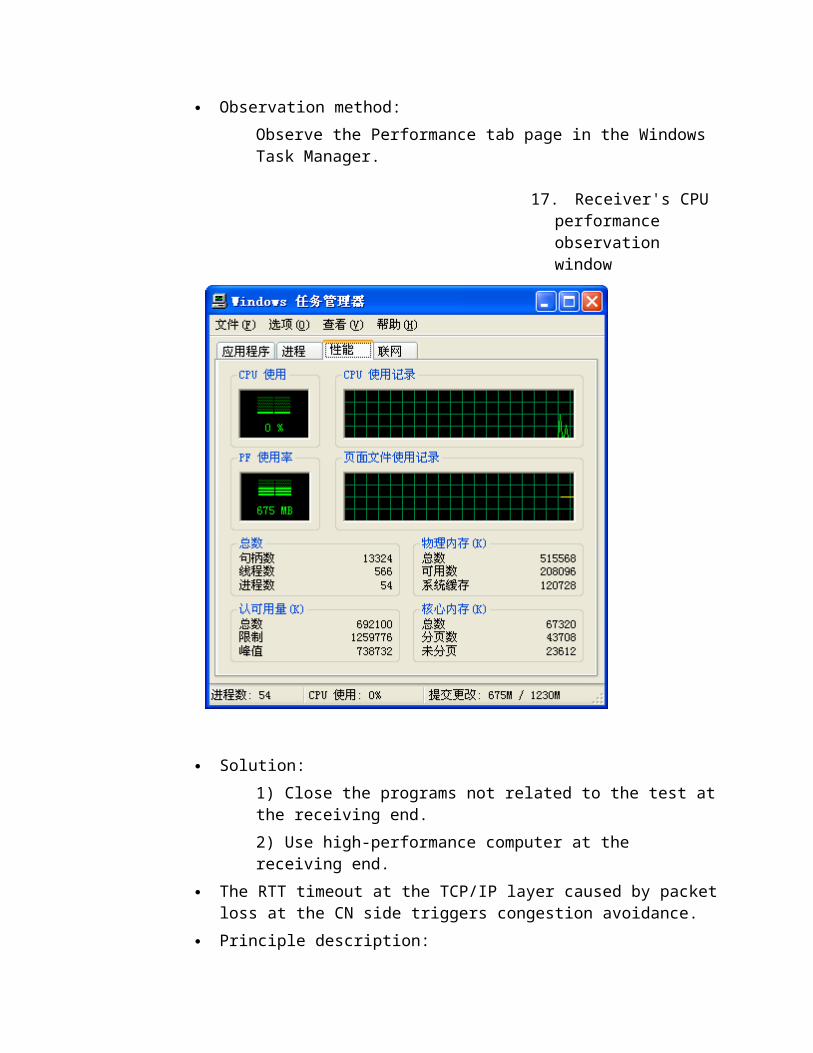
Observation method:Observe the Performance tab page in the Windows Task Manager.
17. Receiver's CPU performance observation window
Solution:1) Close the programs not related to the test atthe receiving end.2) Use high-performance computer at the receiving end.
The RTT timeout at the TCP/IP layer caused by packetloss at the CN side triggers congestion avoidance.
Principle description:
TCP provides the reliable transport layer. One of the methods that TCP uses is acknowledging the data received from the other peer, however, data and acknowledgment may be lost. TCP solves the problem by starting a timer when it starts transmitting data. If no acknowledgment is received when the timer expires, TCP retransmitsthe data.The TCP sender measures the RTT of a connection (measures the RTT from when it transmits a byte with a special sequence number to when it receives an acknowledgment containing this byte)to maintain an RTT timer.If the RTT timer expires, TCP considers that a network congestion occurs and triggers the congestion avoidance mechanism. As a result, thedata transmission rate is affected.IP packet loss on the CN side causes the RTT timeout.
Observation method:Start Ethereal on the portable PC attached with a data card to capture TCP data packets, and then analyze the captured packets. Check whetherthe receiver sends repeated acknowledgment packets.
Solution:Check segment by segment to confirm that the problem lies in the RAN or the CN.Packet loss may happen on the Iu-PS interface, interface between the SGSN and the GGSN, and interface between the GGSN and the receiver.
The RTT timeout at the TCP/IP layer caused by the convergence failure of the downlink BLER triggers congestion avoidance.
Principle description:
TCP provides the reliable transport layer. One of the methods that TCP uses is the acknowledgment to the data received from the other peer. However, data and acknowledgment maybe lost. TCP solves the problem by starting a timer when data transmission begins. If no acknowledgment is received when the timer expires, TCP retransmits the data.The TCP sender measures the RTT of a connection (measures the RTT from when it transmits a byte with a special sequence number to when it receives an acknowledgment containing this byte)to maintain an RTT timer.If the RTT timer expires, TCP considers that a network congestion occurs and triggers the congestion avoidance mechanism. As a result, thedata transmission rate is affected.IP packet loss on the CN side causes the RTT timeout.
Observation method:If the downlink bearer is a DCH,Step 1: Check the convergence of the downlink BLER on the RNC LMT.Often, you are unable to observe the downlink BLER and the terminal does not report the downlink BLER. In this case, you need to use a terminal tool to observe the downlink BLER.Step 2: Observe whether the downlink transmit power is limited and confirm the causes for the downlink BLER convergence failure.If the downlink bearer is an HSDPA,Observe the downlink SBLER and the residual BLERthrough the Probe.
Solution:If the downlink transmit power is limited, analyze the cause (a long distance from the
NodeB) and determine a solution according to thecause.If the downlink transmit power is not limited but the downlink outer loop power control does not converge, the power control performance of the terminal is not ideal. In this case, you canuse another type of terminal to perform a test.
Too small a downlink TCP/IP reverse bandwidth causesa large RTT delay.
Principle description:TCP provides a reliable transport layer. One of the methods that TCP uses is acknowledging the data received from the other peer. However, dataand acknowledgment may be lost. TCP solves the problem by starting a timer when data transmission begins. If no acknowledgment is received when the timer expires, TCP retransmitsthe data.The TCP sender measures the RTT of a connection (measures the RTT from when it transmits a byte with a special sequence number to when it receives an acknowledgment containing this byte)to maintain an RTT timer.If the RTT timer expires, TCP considers that a network congestion occurs and triggers the congestion avoidance mechanism. As a result, thedata transmission rate is affected.IP packet loss on the CN side causes the RTT timer expiration.
Observation method:Step 1: Check the downlink rate of the service through the RAB Assignment Request message.Step 2: When the downlink channel is a DCH, check the actual downlink bandwidth through the RB SETUP message. When the downlink channel is an HSDPA channel, combine the available
bandwidth on the Iub interface to determine the bandwidth that is currently available.Step 3: Query the subscription rate in the HLR. The minimum downlink subscription rate of the HSUPA is recommended to be no less than 128 kbit/s.Step 4: Check whether the AT command is run on the portable test PC to specify a downlink rate.
Solution:If the subscription rate is too low, change the subscription rate or use the AT command to ensure that the downlink rate matches the uplinkrate.If the subscription rate is reasonable but the actual RB rate is low, locate the problem from the RAN side. Usually, network resource congestion causes an RB rate increase failure.
6. Analyzing Poor Performance ofData Transfer at CN Side
5.3.6 shows the flow for analyzing poor performance of data transferat CN side.

1. Flow for analyzing poor performance of data transfer at CN side
NE AlarmsAt CN side, analyze the alarms on SGSN, GGSN, LAN switch, router, and firewall (collecting SGSN and GGSN alarms as key task). Clock alarms and transport code error alarms may lead to fluctuation of PSdata.
Package lose on CN side result in TCP/IP layer RTT overtime touch off congestion avoidance
TCP apply credible transmit layer. One method is to affirm the data which receive from the other side. But data and affirmance may lose . TCP transit set a timer in the send time to solve the problem. When the timer overflow , it don’t receive affirm message, it will retransmission data.
TCP send point will be a measure to a connect RTT. Maintain a RTT timer.
If it measure RTT overtime , TCP think net congestion , it will start-up congestion avoidance. Consequently, it will affect data transmit rate.
IP package lose on CN side will make RTT overtime.
Environment ProblemsThe rate is relevant to PC, OS, and applications. The internal algorithm of software at different application layer and TCP parameters of OS have great impact on performance. If other conditions are the same, the rate of data transfer on Windows 2000 computer is superior to that on Windows 98 computer. Therefore, it is recommended to use Windows 2000 Professional and Windows 2000 server as the OS of PCs and servers.
Now the laptops are installed with Windows XP, so there is no problem concerning perform due to OS. Anyhow, the servers must be installed with Windows 2000 server, because Windows XP will affect the performance of data transfer.
The PC (laptop) for being daemon of UE must be of good performance. Tests prove that IBM laptops have good performance in playing VODs. Now Huawei RNP engineers use the new laptops of D Corporation, whichhave worst performance in data transfer of HSDPA test than the new ones of H Corporation.
If the utilization CPU being daemon of UE is 100%, the TCP/IP receiver window is full. As a result, the performance of data transfer is affected.
The performance of servers may affect service effect, which must be considered.
TCP Receiving and Sending WindowFor the services (such as VOD and FTP) using TCP protocol, the TCP window size of test laptop (client) and server have great impact on
performance of services. Set the window as large as possible to guarantee good performance. Set the window of client and server in the same size, such as 64K.
For modification method, see the appendix.
Maximum Transmission UnitIf a data packet at IP layer is to be sent, and the data packet is larger than the maximum transmission unit (MTU), the IP layer will divide the data packet to pieces. Each piece is smaller than MTU. Using larger MTU and avoiding IP segment and reassembly helps to raise efficiency. MTU is usually smaller than or equal to 1450.
Changing MTU includes changing the MTU of server and changing the MTU of test laptop. After PS service connection setup, the service negotiates with the client. The MTU in use takes the smaller of the two MTUs.
For modification, see the appendix.
Service-related Problems FTP
Use the commercial FTP software, because the FTP software embedded in Windows OS is of average performance. Download data with FTP in binary. Themulti-thread downloading software like FlashGet isrecommended.If update rate is low , it can consider process multi-FTP transmission at the same time, or use tools send fixed rate package to make sure whetherthe bottom has a problem.
VODThe software RealPlayer sets the maximum play rateto larger than 384 kbps. The buffer time must not be over long, and 3s is proper. Some computers areinstalled with qualified video adapter, so the monitor jumps some frames. Change the resolution to 800x600. If the problem is still present, change the video adapter.
Net TV
When the rate of down-layer declines, the Net TV is difficult to restore. Note this.
Video conferenceSet the output rate of convergence TV smaller thanthe rate of down-layer; otherwise, data packets will be dropped. Huawei conference video sets 64 kbps as step from 128 kbps. The recommended configuration is 320 kbps. If the rate is over low, utilization rate of down-layer rate will be over low. Otherwise, using the rate higher than 320 kbps, such as equal to or larger than 384 kbps, leads to dropping data packets because the rate of down-layer cannot meet the requirements byapplication layer. As a result, the performance ofvideo conference declines. If a lightning sign appears on the right upper corner of conference TV, there must be code error or packet dropping during transmission.
HSDPA Subscribed RateIn test, if the downlink throughput of HSDPA subscriber is only 384 kbps, 128 kbps, or 64kbps. By check the HSDPA cell is set up exactly. After confirmation that the problem is not at RAN side, check the HLR subscribed rate and subscribers' QoS parameters of SGSN and GGSN.
HLRThe APN and subscribed rate is changed in MOD GRPSof HLR. You can set multiple APNs to a SIM card. Each APN matches a highest rate.When the maximum rate is not restricted at UE side, the RAB assignment request message sent by CN brings the subscribed rate.If no resource, such as power resource and code resource, is restricted at RNC side, the Activate PDP content Accept message of NAS signaling bringsthe assigned rate to UE. Obtain the rate containedin the Activate PDP content Accept message in Probe or other DT tools.
GGSNModify subscribers'' QoS parameters on GGSN. Set downlink bit rate and downlink guaranteed rate as required. The default configuration is 384 kbps. The commands are as below:SET QOS: MBRDNLK=2048, GBRDNLK=2048;The previous command sets the downlink maximum rate to 2048 kbps. As a result, the CN allows the downlink maximum rate of HSDPA to be 2 Mbps.
SGSNModify downlink maximum rate and downlink guaranteed rate of subscriber by executing the command below:SET 3GSM: MBRDNLK=151, GBRDNLK=151;Set the maximum bandwidth to 151 (standing for 2 Mbps) by executing the command SET 3GSM.
4. Interruption of Data Transfer1. Analzying DCH Interruption ofData Transfer
Description: data transfer is interrupted for a period.
The possible causes include:
Call drop during data transfer After the UE hands over 3G networks to 2G networks,
it cannot perform data transfer. A state transition occurs. After the UE transits
from CELL_DCH to CELL_FACH and CELL_PCH, when restoring data transfer is necessary and the resource for restoring data transfer is inadequate, the UE cannot restore to CELL_DCH state. Therefore data transfer is affected.
Other causes, like interruption of data transfer.Analyze the problem from alarms, signaling flow, and CHR.
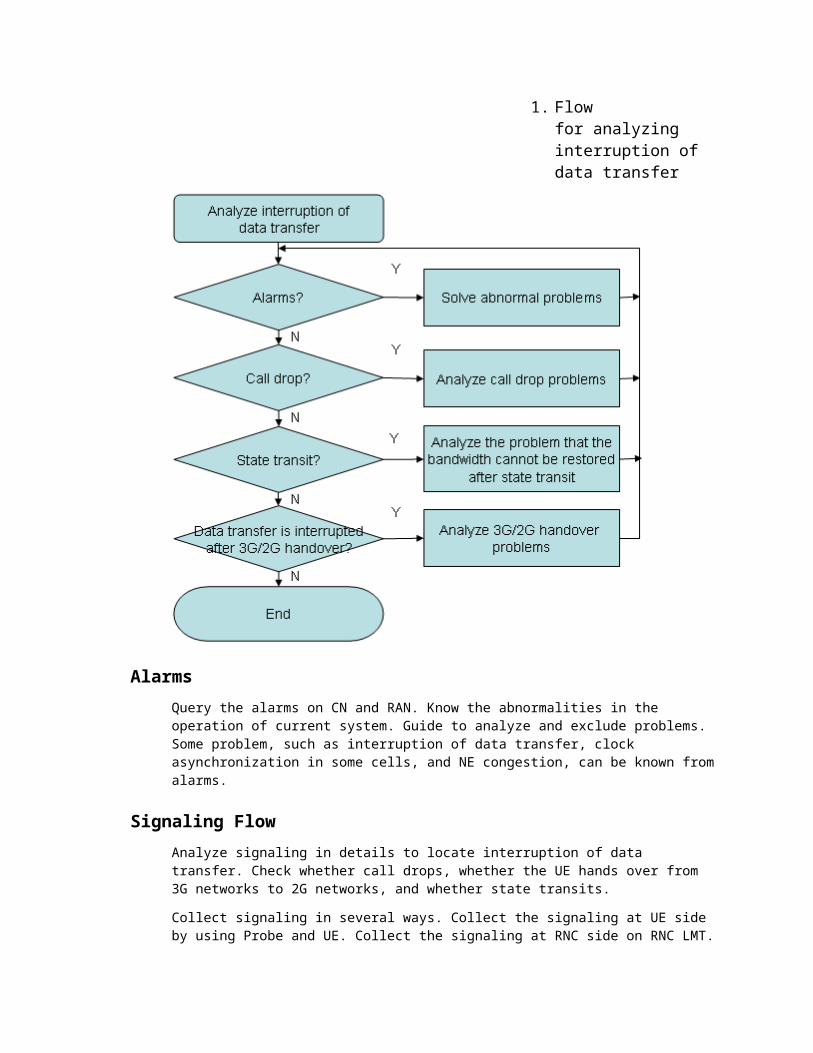
1. Flow for analyzing interruption of data transfer
AlarmsQuery the alarms on CN and RAN. Know the abnormalities in the operation of current system. Guide to analyze and exclude problems. Some problem, such as interruption of data transfer, clock asynchronization in some cells, and NE congestion, can be known fromalarms.
Signaling FlowAnalyze signaling in details to locate interruption of data transfer. Check whether call drops, whether the UE hands over from 3G networks to 2G networks, and whether state transits.
Collect signaling in several ways. Collect the signaling at UE side by using Probe and UE. Collect the signaling at RNC side on RNC LMT.
By comparison of two signaling flow, check whether messages are lostat air interface. Based on analysis and CHR, engineers can locate the problem or obtain the rough direction.
Call DropFor call drop problems, see W-Handover and Call Drop Problem Optimization Guide.
Channel State TransitWhen the cell state transits to CCH, it cannot restore to CELL_DCH. Check the abnormal information in CHR. If the downlink load is over large by confirmation, or the bandwidth at Iub interface is congested, add carriers or transport resources.
3G2G handoverIf the data transfer is problematic after handoverfrom a 3G network to a 2G network, the problem involves the cooperation of the two networks. If the 2G network was constructed by partners, locating the problem will be more difficult.Try to set up PS services in the 2G network, and see whether it runs normally. If the data transferupon access to the 2G network is normal, but the data transfer after handover from the 3G network to the 2G network is abnormal, check the UE and the signaling flow at 3G and 2G NE side.In terms of causes, defining a subscriber or inconsistent configuration of authentication and encryption algorithm may lead to failed update of routing area.Take the case 6.2.10 Analysis of 3G-2G PS HandoverFailure in a Deployment. The 3G SGSN encryption algorithm is UEA1, but the partner does not use encryption algorithm. When the UE hands over from the encrypted 3G network to unencrypted 2G network, the 2G network does not send a message toindicate UE to disable encryption algorithm, and the encryption state of UE's message does not
synchronize. As a result, when the UE sends the RAU (routing area update) Complete message, the network side fails to receive the message because the UE encrypts the message but the network side does not.
2. Analyzing HSDPA Interruption of Data Transfer
An RAB can be mapped on the HS-DSCH of only one cell, so SHO is unavailable on HS-DSCH. As a result, data transfer is interrupted inevitably upon update of serving cell.
The SHO associated HSDPA serving cell update includes two aspects:
Intra-NodeB. In the same DSP of a NodeB, interruption of data transfer does not occur becauseno data needs transiting from one MAC-hs buffer to another MAC-hs buffer.
Inter-NodeB. When MAC-HS is reset, the NodeB drops original data in buffer and restores the dropped data by RNC RLC retransmission. The interruption of data transfer lasts for about 300ms.
During the inter-frequency and intra-frequency HHO associated HSDPA serving cell update, the MAC-HS is reset, the NodeB drops original data in buffer and restores the dropped data by RNC RLC retransmission. The interruption of data transfer also occurs.
During H2D SHO, intra-frequency HHO, inter-frequency HHO, D2H SHO, intra-frequency HHO, and inter-frequency HHO, the interruption of data transfer also will occur.
During the handover between HSDPA and GPRS, data transfer will also be interrupted.
The interruption of data transfer includes two aspects:
The interruption of data transfer without update of serving cell or handover
Over long interruption of data transfer with update of serving cell or handover
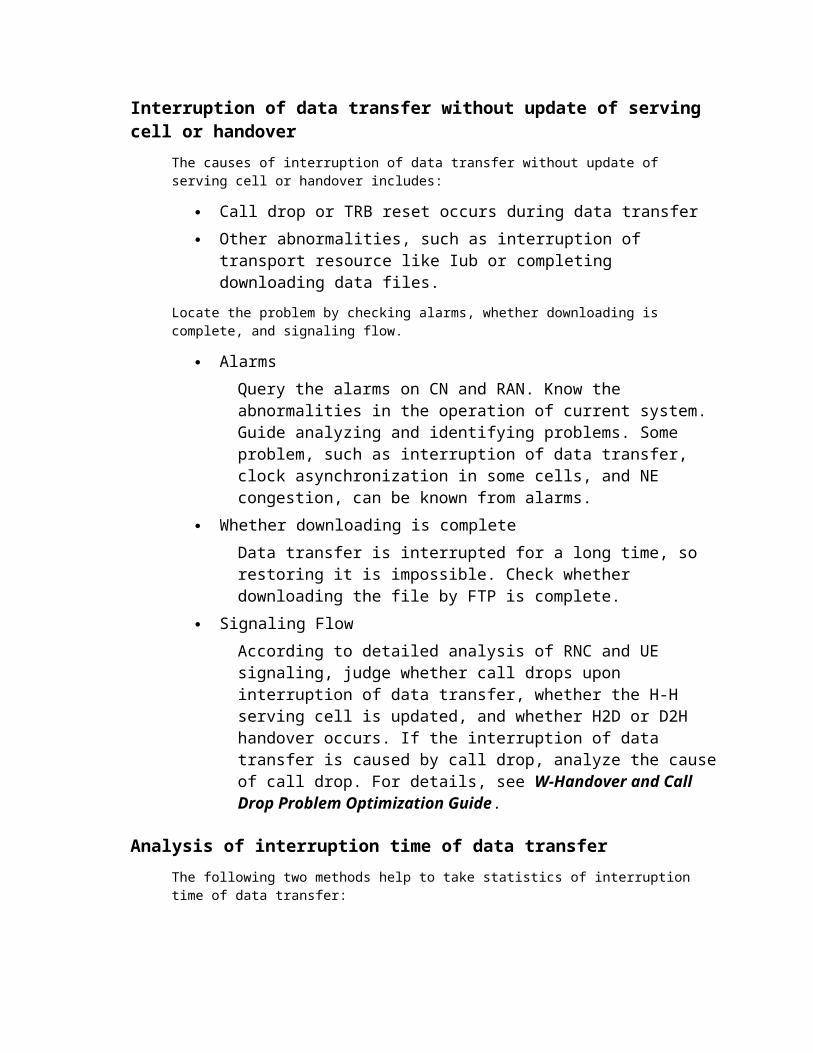
Interruption of data transfer without update of serving cell or handover
The causes of interruption of data transfer without update of serving cell or handover includes:
Call drop or TRB reset occurs during data transfer Other abnormalities, such as interruption of
transport resource like Iub or completing downloading data files.
Locate the problem by checking alarms, whether downloading is complete, and signaling flow.
AlarmsQuery the alarms on CN and RAN. Know the abnormalities in the operation of current system. Guide analyzing and identifying problems. Some problem, such as interruption of data transfer, clock asynchronization in some cells, and NE congestion, can be known from alarms.
Whether downloading is completeData transfer is interrupted for a long time, so restoring it is impossible. Check whether downloading the file by FTP is complete.
Signaling FlowAccording to detailed analysis of RNC and UE signaling, judge whether call drops upon interruption of data transfer, whether the H-H serving cell is updated, and whether H2D or D2H handover occurs. If the interruption of data transfer is caused by call drop, analyze the causeof call drop. For details, see W-Handover and Call Drop Problem Optimization Guide.
Analysis of interruption time of data transferThe following two methods help to take statistics of interruption time of data transfer:
Use Qualcomm QXDM and QCAT tool. The interval between dropping packet at receiver and receiving current data is the interruption time of data transfer.
Capture TCP/IP packets directly by using the software Ethereal. Analyze the interval between TCP/IP.
1. Interruption delay of TCP displayed in Ethereal
In 5.4.2, the data transfer is interrupted for two times, and the interruption delays are respectively 300ms and 300ms. Compare the TCP rate in Ethereal and the rate at application layer in Assistant,and they must match. Therefore, obtain the update point of serving cell in Assistant.

6. Cases
About This Chapter
The following table lists the contents of this chapter.
Title Description
6.1 Cases at RAN Side
6.2 Cases at CN Side
1. Cases at RAN Side1. Call Drop due to Subscriber Congestion (Iub Resource Restriction)
DescriptionIn a project, there are abundant 3G UEs or data cards. The subscribers are test subscribers, so they need not to pay. As a result, the traffic model in the area is special. The busy hour of traffic is around 23:00, when PS call drops.
AnalysisAccording to traffic statistics, the traffic in the cell is heavy. The bandwidth at Iub interface is 1 Mbps, always fully used. If a UEkeeps transferring data on line, the transferring is stable. If the subscriber browses web pages without data transfer, the UE transits to idle mode to save resource according to DCCC algorithm. When the UE needs to transfer data again, it must apply for resource again. However, the resource may be used by other UEs, so no resource is assigned to it. As a result, the connection fails. The subscriber feels that he/she is off line. It is difficult to reconnect to the network. When other subscribers use less resource, the subscriber can succeed in dial to connect to the network.
The essence of the problem lies in that excessive subscribers use the resources, so the resource is congested.
To solve this problem, use the methods below:
Reduce test subscribers Add E1 bandwidth
2. Uplink PS64k Service Rate Failing to Meet Acceptance Requirements in a Test (Air Interface Problem)
DescriptionFor PS64k service, the acceptance contract prescribes that the actual average rate must be larger than 51 kbps, but the uplink rateis about 50 kbps in test.
AnalysisAccording to statistics of rate at RNC RLC layer, the maximum rate exceeds 64 kbps, and it fluctuates sharply. As a result, the averagerate at application layer displayed by the software FTP is low. According to signaling tracing and statistics of uplink BLER, the uplink BLER is about 10%. As a result, the rate at application layerfluctuates and the throughput declines.
SolutionChange the target uplink BLER to 6% or 1%. Change related power control parameter.
Setting different target BLER helps balance the performance of single UE and more UEs. According to the information from other networks, different target BLER are set for different networks, but they are small.
Note that setting target BLER is according to index of service type.The uplink and downlink bandwidth are usually different, namely, theindex of service type is different. Set target BLER after confirmingthe index of service type.
3. Statistics and Analysis of Ping Time Delay in Different Service Types
DescriptionOn SNSN, test the transfer delay of streaming and conversational service. CN test engineers feed back that the transfer delay of conversational service cannot meet the protocol requirement. The test result is that: the ping delay of conversational service is 230ms and that of streaming service is 109ms. According to R5 TS23.107 requirement, the delay of conversational must be smaller than 100ms. The delay in the test is 115ms (230ms/2), so it does notmeet the requirement.
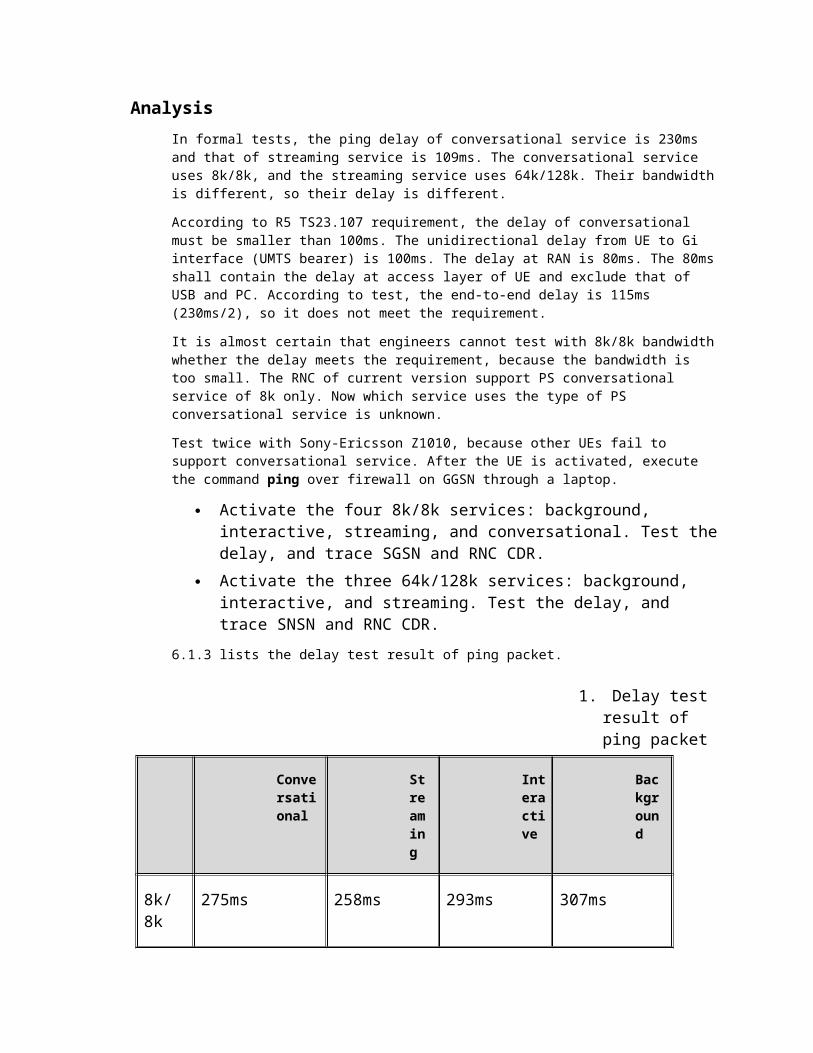
AnalysisIn formal tests, the ping delay of conversational service is 230ms and that of streaming service is 109ms. The conversational service uses 8k/8k, and the streaming service uses 64k/128k. Their bandwidthis different, so their delay is different.
According to R5 TS23.107 requirement, the delay of conversational must be smaller than 100ms. The unidirectional delay from UE to Gi interface (UMTS bearer) is 100ms. The delay at RAN is 80ms. The 80msshall contain the delay at access layer of UE and exclude that of USB and PC. According to test, the end-to-end delay is 115ms (230ms/2), so it does not meet the requirement.
It is almost certain that engineers cannot test with 8k/8k bandwidthwhether the delay meets the requirement, because the bandwidth is too small. The RNC of current version support PS conversational service of 8k only. Now which service uses the type of PS conversational service is unknown.
Test twice with Sony-Ericsson Z1010, because other UEs fail to support conversational service. After the UE is activated, execute the command ping over firewall on GGSN through a laptop.
Activate the four 8k/8k services: background, interactive, streaming, and conversational. Test thedelay, and trace SGSN and RNC CDR.
Activate the three 64k/128k services: background, interactive, and streaming. Test the delay, and trace SNSN and RNC CDR.
6.1.3 lists the delay test result of ping packet.
1. Delay test result of ping packet
Conversational
Streaming
Interactive
Background
8k/8k
275ms 258ms 293ms 307ms
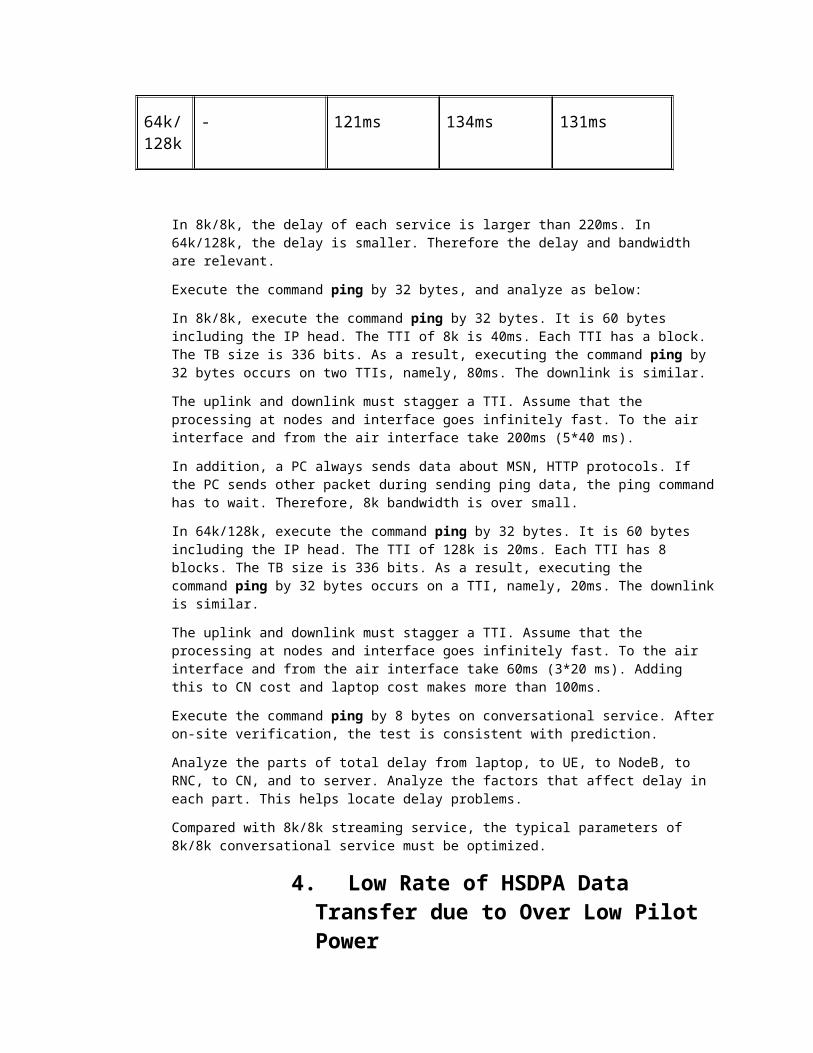
64k/128k
- 121ms 134ms 131ms
In 8k/8k, the delay of each service is larger than 220ms. In 64k/128k, the delay is smaller. Therefore the delay and bandwidth are relevant.
Execute the command ping by 32 bytes, and analyze as below:
In 8k/8k, execute the command ping by 32 bytes. It is 60 bytes including the IP head. The TTI of 8k is 40ms. Each TTI has a block. The TB size is 336 bits. As a result, executing the command ping by 32 bytes occurs on two TTIs, namely, 80ms. The downlink is similar.
The uplink and downlink must stagger a TTI. Assume that the processing at nodes and interface goes infinitely fast. To the air interface and from the air interface take 200ms (5*40 ms).
In addition, a PC always sends data about MSN, HTTP protocols. If the PC sends other packet during sending ping data, the ping commandhas to wait. Therefore, 8k bandwidth is over small.
In 64k/128k, execute the command ping by 32 bytes. It is 60 bytes including the IP head. The TTI of 128k is 20ms. Each TTI has 8 blocks. The TB size is 336 bits. As a result, executing the command ping by 32 bytes occurs on a TTI, namely, 20ms. The downlinkis similar.
The uplink and downlink must stagger a TTI. Assume that the processing at nodes and interface goes infinitely fast. To the air interface and from the air interface take 60ms (3*20 ms). Adding this to CN cost and laptop cost makes more than 100ms.
Execute the command ping by 8 bytes on conversational service. Afteron-site verification, the test is consistent with prediction.
Analyze the parts of total delay from laptop, to UE, to NodeB, to RNC, to CN, and to server. Analyze the factors that affect delay in each part. This helps locate delay problems.
Compared with 8k/8k streaming service, the typical parameters of 8k/8k conversational service must be optimized.
4. Low Rate of HSDPA Data Transfer due to Over Low Pilot Power
DescriptionIn an HSDPA live demonstration, when the commissioning is complete, the rate of HSDPA service is as low as half of standard rate, and the retransmission rate is high.
AnalysisOn-site NodeB engineers have demonstrated the service in laboratory,and the rate is normal, 1400 kbps. They use big antenna and lower the power on site to cover the sites of the operator. After this, the Ec is –50 dBm, and Ec/Io is –3 dB. Namely, the coverage is qualified. In the on-site test, after starting downloading data, theEc/Io deteriorates sharply. According to QXDM tracing, the transmission rate is 100% (engineers doubt that the problem is caused by interference and improper installation of antenna, but thecause is not them according to frequency sweep and SITEMASTER test).As a result, engineers doubt that the transmission on the interface board of NodeB and trunk are faulty. After changing the interface board and trunk, the problem is still present.
Test with PS384k service, the result is normal. According to causes of problem, the HSDPA feature leads to weak Ec/Io, as a result, the BLER and retransmission rate are high. At the beginning of test, to reduce radiation, engineers lower the pilot power. However, the HSDPA network distribute power according to amount of data as its feature, so the network distributes high power (near 35 dBm) to TCH upon downloading. As a result, the Ec/Io declines, which consequently causes decline of demodulation performance and increment of retransmission rate. Raise the pilot power, and then the transmission rate is normal. The problem is solved.
SolutionRaise the pilot power from 23 dBm to 33 dBm, and the transmission rate will be normal.
Suggestions and SummaryAs a habit of test, engineers will lower pilot power and then perform test. However, due to new features of HSDPA, lowering pilot power leads to new problems.
Lower the pilot power and HSDPA power in the following tests, such as by using attenuator.
5. Unstable HSDPA Rate due to Overhigh Receiving Power of Data Card
DescriptionOn HBBU, activate HSDPA service, and the retransmission rate is high. The BLER of data sent at the first time is about 60%, the residual BLER is 5%. The downloading rate is low, and the rate fluctuates sharply.
AnalysisOnce the on-site engineers download data, the CQI fluctuates sharplyand frequently between 15 and 26. The rate fluctuates between 100 kbps and 600 kbps.
The load of HSDPA fluctuates sharply between 3% and 24%. This must be relevant to downloading rate.
No FP packet is missing. No packet is missing because the queue is full. In the scheduling period, abundant DTXs exist according to NodeB, with few NACK messages.
According to check, the receiving power of data card is as high as –45 dBm, exceeding the normal range (–55 dBm to –85 dBm). The signalsare strong, and the attenuation is inadequate, so the measured CQI is inaccurate.
SolutionAdd an attenuator at the antenna port, and keep the receiving power at about –70 dBm. After this, the problem of frequently fluctuation,as well as the BLER problem, is solved.
6. Decline of Total Throughput in Cell due to AAL2PATH Bandwidth larger than Actual Physical Bandwidth
The WCDMA network runs normally. The admission of the cell to be measured is disabled. The cell is unloaded. The neighbor cells are disabled. The HSDPA cell is successfully set up. The power is dynamically distributed. HSDPA uses 5 codes. The MAC-HS scheduling algorithm uses PF. There is one HS-SCCH. The cell uses 8 E1's. One
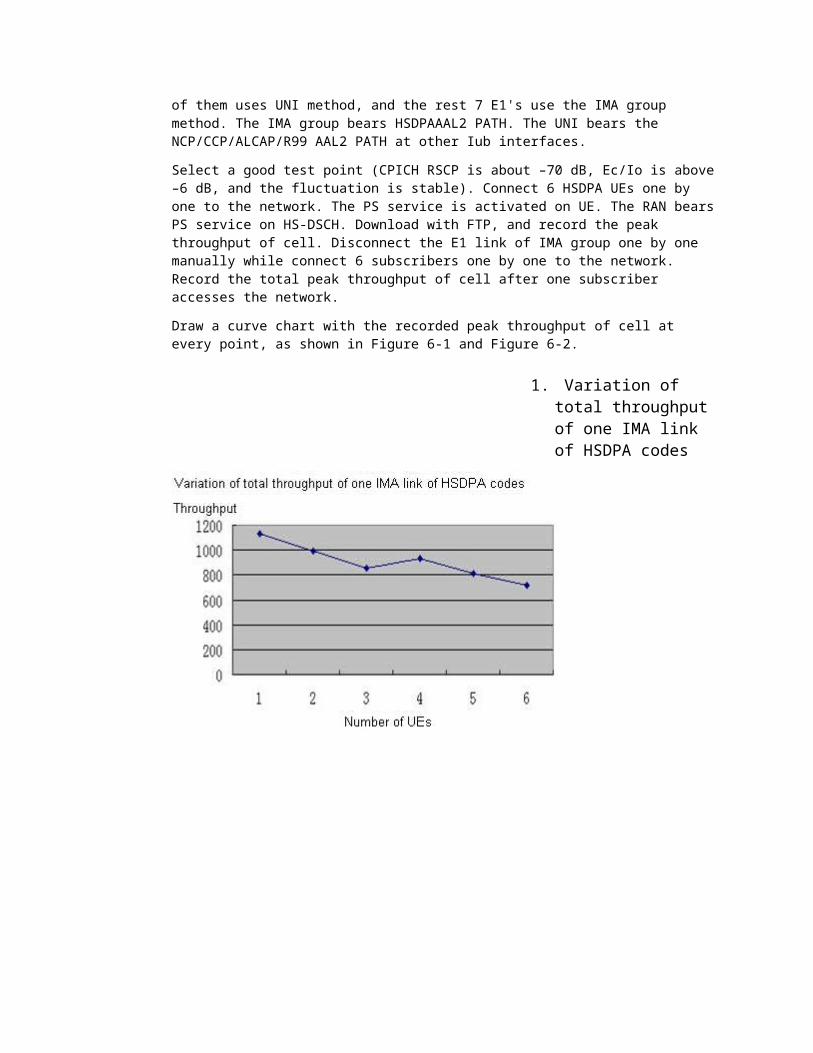
of them uses UNI method, and the rest 7 E1's use the IMA group method. The IMA group bears HSDPAAAL2 PATH. The UNI bears the NCP/CCP/ALCAP/R99 AAL2 PATH at other Iub interfaces.
Select a good test point (CPICH RSCP is about –70 dB, Ec/Io is above–6 dB, and the fluctuation is stable). Connect 6 HSDPA UEs one by one to the network. The PS service is activated on UE. The RAN bearsPS service on HS-DSCH. Download with FTP, and record the peak throughput of cell. Disconnect the E1 link of IMA group one by one manually while connect 6 subscribers one by one to the network. Record the total peak throughput of cell after one subscriber accesses the network.
Draw a curve chart with the recorded peak throughput of cell at every point, as shown in Figure 6-1 and Figure 6-2.
1. Variation of total throughput of one IMA link of HSDPA codes
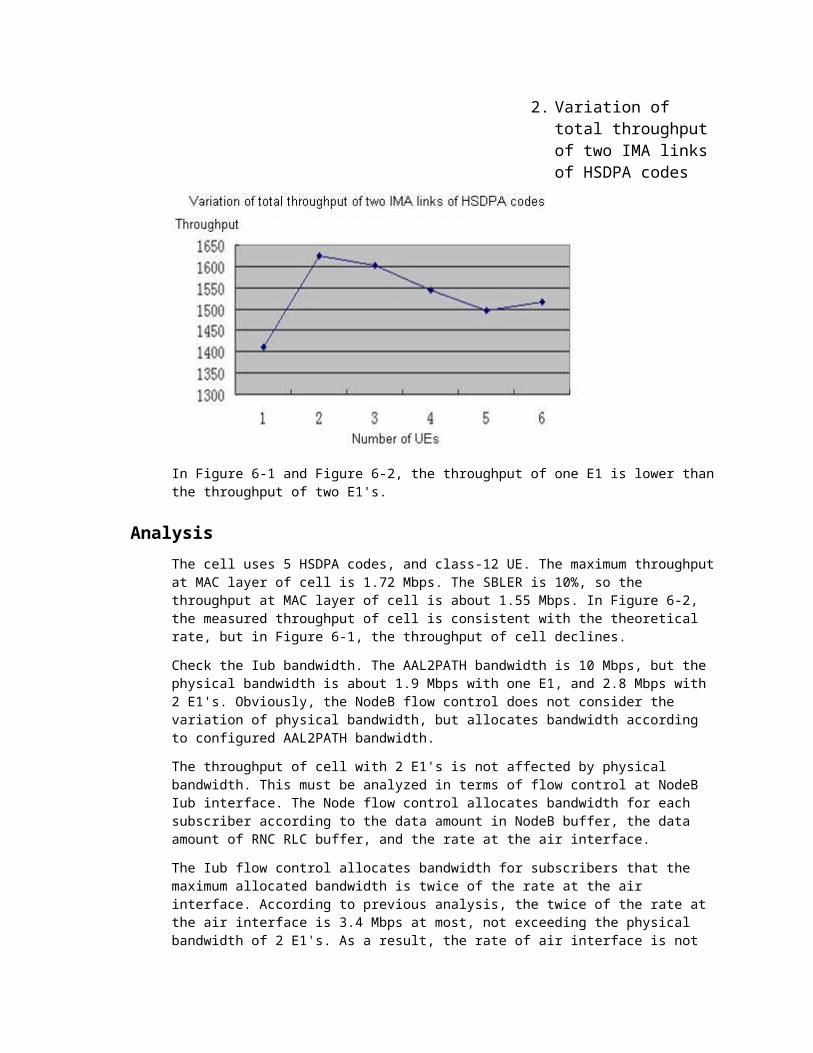
2. Variation of total throughput of two IMA links of HSDPA codes
In Figure 6-1 and Figure 6-2, the throughput of one E1 is lower thanthe throughput of two E1's.
AnalysisThe cell uses 5 HSDPA codes, and class-12 UE. The maximum throughputat MAC layer of cell is 1.72 Mbps. The SBLER is 10%, so the throughput at MAC layer of cell is about 1.55 Mbps. In Figure 6-2, the measured throughput of cell is consistent with the theoretical rate, but in Figure 6-1, the throughput of cell declines.
Check the Iub bandwidth. The AAL2PATH bandwidth is 10 Mbps, but the physical bandwidth is about 1.9 Mbps with one E1, and 2.8 Mbps with 2 E1's. Obviously, the NodeB flow control does not consider the variation of physical bandwidth, but allocates bandwidth according to configured AAL2PATH bandwidth.
The throughput of cell with 2 E1's is not affected by physical bandwidth. This must be analyzed in terms of flow control at NodeB Iub interface. The Node flow control allocates bandwidth for each subscriber according to the data amount in NodeB buffer, the data amount of RNC RLC buffer, and the rate at the air interface.
The Iub flow control allocates bandwidth for subscribers that the maximum allocated bandwidth is twice of the rate at the air interface. According to previous analysis, the twice of the rate at the air interface is 3.4 Mbps at most, not exceeding the physical bandwidth of 2 E1's. As a result, the rate of air interface is not
affected when there are 2 E1's. When there is 1 E1, the twice of therate at the air interface exceeds the physical bandwidth of 1 E1. Asa result, data packets are missing at Iub interface, and the rate ofsubscribers is affected.
SolutionChange the AAL2PATH of HSDPA to 1.9 Mbps when there is one E1. Test again, and the rate of subscribers is about 1.5 Mbps.
In actual networks, guarantee that the AAL2PATH allocated bandwidth to HSDPA is smaller than the physical bandwidth at Iub interface. This will affect throughput of cell. Meanwhile, check NodeB alarms whether there are E1 fault alarms.
7. Causes for an Exceptional UE Throughput and Location Method in a Field Test
Factors Affecting the HSUPA Uplink ThroughputThe uplink throughput of the HSUPA is affected by the following three factors:
Maximum transmit power provided by the UE for uplinkpacket access (UPA)
SG that the UE obtains, which indicates the maximum power that the NodeB allows the UE to transmit
Percentage of the data to be transmitted to the buffer, which indicates the size of data that the UEneeds to transmit
These factors are represented by corresponding parameters in the QXDM and Probe tools accordingly.
In the Probe, the following limited rates are displayed in the HSUPA Link Statistics window to represent these factors.
Power Limited Rate SG Limited Rate Buffer Limited Rate
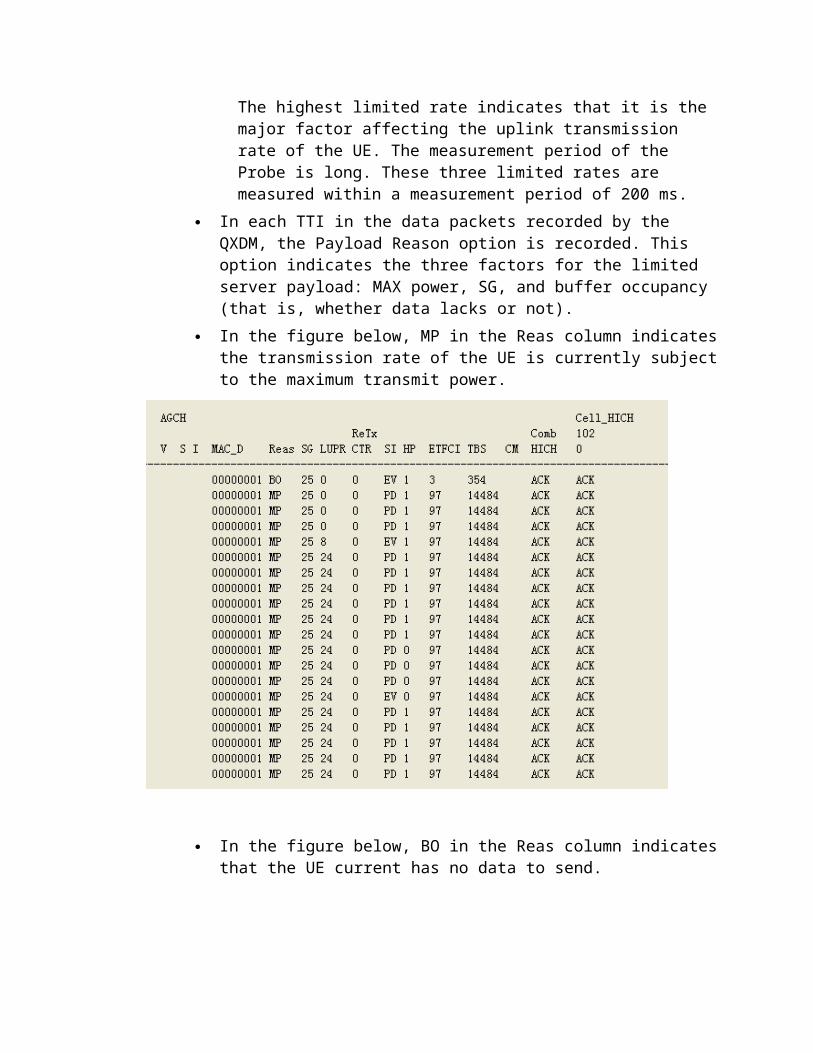
The highest limited rate indicates that it is the major factor affecting the uplink transmission rate of the UE. The measurement period of the Probe is long. These three limited rates are measured within a measurement period of 200 ms.
In each TTI in the data packets recorded by the QXDM, the Payload Reason option is recorded. This option indicates the three factors for the limited server payload: MAX power, SG, and buffer occupancy (that is, whether data lacks or not).
In the figure below, MP in the Reas column indicatesthe transmission rate of the UE is currently subjectto the maximum transmit power.
In the figure below, BO in the Reas column indicatesthat the UE current has no data to send.
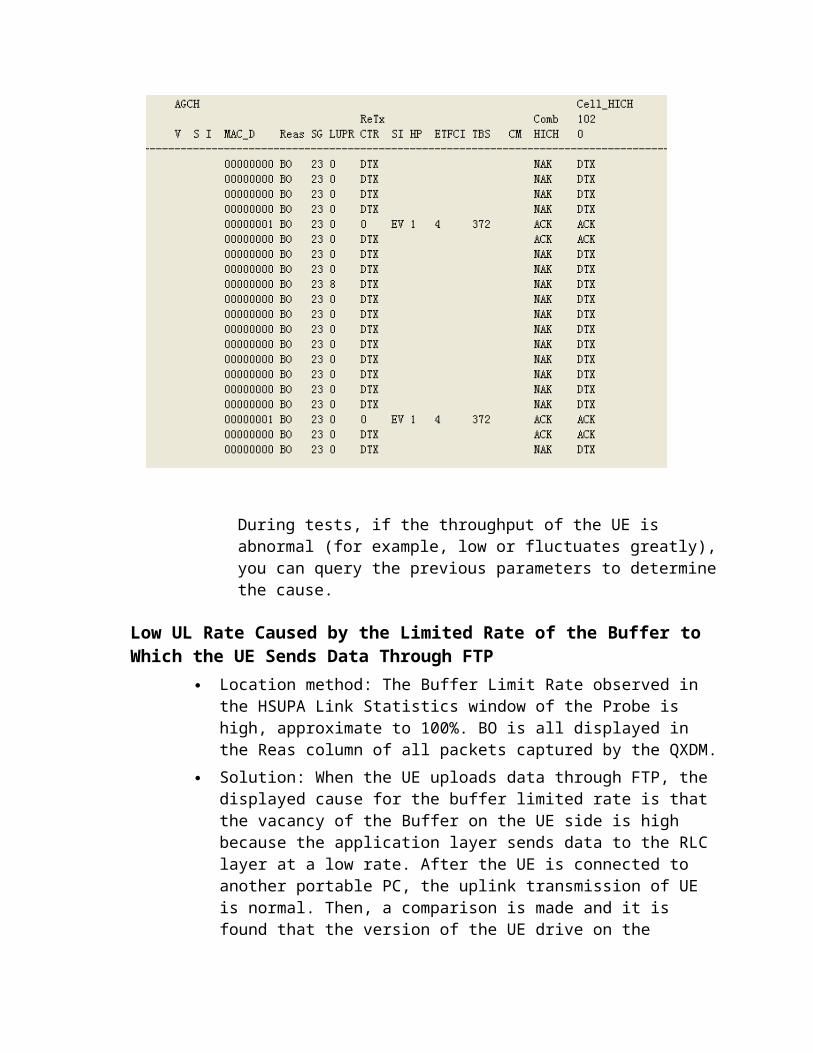
During tests, if the throughput of the UE is abnormal (for example, low or fluctuates greatly),you can query the previous parameters to determinethe cause.
Low UL Rate Caused by the Limited Rate of the Buffer to Which the UE Sends Data Through FTP
Location method: The Buffer Limit Rate observed in the HSUPA Link Statistics window of the Probe is high, approximate to 100%. BO is all displayed in the Reas column of all packets captured by the QXDM.
Solution: When the UE uploads data through FTP, the displayed cause for the buffer limited rate is that the vacancy of the Buffer on the UE side is high because the application layer sends data to the RLC layer at a low rate. After the UE is connected to another portable PC, the uplink transmission of UE is normal. Then, a comparison is made and it is found that the version of the UE drive on the
portable PC is old. After the drive is updated, the uplink transmission rate is improved. The records onthe Probe and the QXDM are observed later. It is found that no buffer limit exists.
It is also found that different configurations on the portable PC and different types of portable PCs affect the uplink throughput to different extents. For example, the uplink throughput tested by an HP portable PC is slightly higher than that tested by aDell portable PC. The larger the memory in the portable PC is, the smaller the buffer limit is.
Low Uplink Transmission Rate Owing to Limited UE SG Caused by Limited Cell Load
Location method: The SG limited rate observed in theHSUPA Link Statistics window on the Probe is very high. SG is displayed in the Reas column in most captured packets but the current SG does not reach the maximum value. The maximum value in HSUPA phase1of E270 (cat3) is 23.
Symptom and cause: If the cell load is limited, you often see that the cellload value reaches 1023 (maximum value) when you observe the cell load information on the NodeB debugging console. In addition, you can find that the RTWP of the cell is increased greatly to –90 dBm or so. There are many causes for cell load increase. For example, when multiple UEs simultaneously upload data, the RTWP isincreased. It is found during the test that the SIR of some UEs is not converged and leads to exceptional rise in the transmit power of another UE. As a result, the cell load also increases exceptionally and the other UEs cannot transmit datanormally.
Solution: When the cell load (or RTWP) is high, first stop the uploading service of all UEs in the cell and observe the RTWP in the cell to determine whether the RTWP increase is caused by the UEs in

the cell or other interference. After other interference is removed, test the RTWP increase in the cell when only one UE uploads data. If the RTWP in the cell is increased exceptionally, the problem is caused by the UE.
2. Cases at CN Side1. Low FTP Downloading Rate due to Over Small TCP Window on Server TCP
DescriptionActivate uplink 64 kbps and downlink 384 kbps services on UE and laptop. Download data from the servers of operator with CUTEFTP. Theaverage downloading rate of UE is 33 kbps, much lower than 384 kbps.The average rate at FTP application layer is about 28 kbps.
AnalysisActivate uplink 64 kbps and downlink 128 kbps services, and downloaddata. Engineers obtain the required rate. However, after activating 384 kbps, the maximum rate cannot be reached. Try to connect the UE to Huawei web server (the GGSN Gi interface <-> Lanswitch <-> NE08 <-> Internet <-> Server of operator. The <-> used here means connection between two network elements (NEs). Huawei web servers connect to Lanswitch by Gi interface. The address of web server and the address of GGSN Gi interface share the same network segment).
The downloading rate reaches 47 kbps. After engineers connect UE to the server of operator, the downloading rate is 30 kbps, far from the required rate. After engineers activate PS service from Huawei SGSN to the GGSN of other vendors (such as N), the rate is about 30 kbps after visiting the server of operator by N's GGSN. Therefore, the problem must not be due to system. Probably the operator restricts the rate on the server, so the downlink 384 kbps is unavailable.
Capture packets on Gn and Gi interface, and UE by Sniffer. Accordingto analysis of packet capture, the TCP at the FTP server of operatorrestricts the sending window (the TCP window of the operator's host server is 63136, but probably the software at application layer restricts the sending window. According to the analysis below, the sending window size of FTP on operator's server is about 8 kbps, much smaller than 64 kbps).
According to the basic regulations of data packet at Gi interface,
FTP server to client: After sending 6 TCP packets (4 * 1500 + 2 *1190), the server stops sending, and 6packets must be confirmed.
The FTP server receives an ACK message. After the FTPserver and client confirm two TCP packets, the server stops sending. There are 4 packets to be confirmed.
The FTP server receives an ACK message again. After the FTP server and client confirm two TCP packets,the server sends three continuous TCP packets (2 *1500 + 1190). There are 5 packets to be confirmed.
The FTP server receives an ACK message again. After the FTP server and client confirm two TCP packets.The server sends 3 continuous TCP packets (2 * 1500 + 1190). There are 6 packets to be confirmed.
It goes back to the first step. A cycle forms.The FTP server sends at most 8.4 kbyte (4 *1500 + 2 * 1190) packets to be confirmed. According to the second step above, the sender needs to send 4 kbyte data continuously. Therefore, the FTP server sets the TCP sending window to be smaller than 10 kbyte, and the TCPis optimized to send large block data (over 4 kbytes). The actual TCP window is 7 kbytes on average for FTP server. Assume that the round-trip delay is t mm, so the maximum available rate is (7 kbytes/t) * 8 kbps.
According to previous analysis, after activating PS service, do not transfer data. Execute ping to server on UE, and check the delay at the air interface. In Huawei system, the average delay for ping packets is 250ms. According to analysis, 7 kbps/0.25 = 28 kbps. Namely, the theoretical average rate at application layer is 28 kbps. This theoretical value is the same as the actual value. Therefore, the operator must have restricted the TCP window at application layer on the server, so the rate keeps low.
Solution To increase rate, engineers must reduce the round-
trip delay. When the delay is smaller than 150ms, the rate can reach 384 kbps (7 kbps/0.15 = 46.7 kbps). Actually reducing the delay at air interface is difficult. The Huawei delay at air interface is
about 250ms. Therefore, the rate cannot reach 284 kbps.
Download data with multiple threads tool, such as FlashGet and NetAnt. Multiple TCP connects to the server, so the rate can increase. According to test result, download data with more than two threads by using FlashGet or NetAnt, the rate can reach 47 kbps.
Remove the restriction on sending window size of server, and set the sending window size of server to65535.
2. Simultaneous Uploading and Downloading
DescriptionActivate uplink 64 kbps and downlink 384 kbps services on UE and laptop. Connect UE to the server of operator, and upload and download data with FTP simultaneous. Wherein, the downloading rate is greatly affected, and fluctuates sharply. The average downloadingrate declines from 47 kbyte to 20 kbyte. However, downloading and uploading respectively are available.
AnalysisUploading and downloading simultaneously affect the ACK delay of TCP. This leads to prolonged delay upon confirmation, and the TCP window size is inadequate. Execute the ping command upon for confirming delay upon simultaneous uploading and downloading. Obtainthe maximum supported rate with the TCP window size/delay.
According to the analysis of the second problem, the TCP window sizeof operator's server is about 8.4 kbyte (the operator may use the FTP software Serv-U. Its default sending and receiving buffer is 8293 bytes). Upon simultaneous uploading and downloading, check the ping packet delay by executing the command ping to the server. The ping packet delay is about 1500ms, 8.4/1.4 = 6 kbyte.
The previous two paragraphs describe the case of single thread. Start 3 threads and the theoretical rate should be 18 KB/s (6 * 3 = 18). According to actual test, download data with 3 threads by usingFlashGet from the operator's server, and upload data with CuteFTP simultaneously. The average sending and receiving rate of UE is 17.9
KB/s in downlink and 7.2 KB/s in uplink. The downlink rate is approximately equal to theoretical value.
Namely, when the UE sends data in uplink, the delay increases sharply, so is the uplink response delay to the ACK message. As a result, the TCP judges it as congestion, so the rate declines. This explains that uploading and downloading respectively are available but simultaneous uploading and downloading lead to decline of downlink rate.
SolutionAccording to previous analysis, increasing TCP window size of serverleads to increasing downlink theoretical rate. Actually, when using Huawei servers for test, set the TCP window size to 65535, download with three threads by using FlashGet. Simultaneously upload data with CuteFTP. The average sending and receiving rate is 46.5 KB/s indownlink and 6 KB/s in uplink.
Download data with multiple threads. According to test, download data with 10 threads from operator's server when the TCP window sizeis 8192. The average sending and receiving rate is 42 KB/s in downlink and 6 KB/s in uplink. The data transfer is unstable with jitters.
Send the ACK message in downlink data packets, and sends uplink datapackets at a fixed rate. Restrict the uplink rate so that the uplinkdata packets will not be blocked at the air interface and the delay at the air interface will not increase, and there is no jitter. Obviously, the decline of downlink rate upon uplink and downlink data transfer is not due to Huawei system, and this problem cannot be mitigated by this solution. This is a defect of TCP/IP protocol used in radio transmission. It is good to combine the UE and the driver of wireless Modem to carry out the solution.
3. Decline of Downloading Rate of Multiple UEs
DescriptionActivate 6 UEs with downlink 384k service, and connect them to the operator's server simultaneously. Download data with FTP, and the rate declines to 30 KB/s.
AnalysisDownload data on one UE by FTP from operator's server, and the rate is as normal as above 47 KB/s. Download data on two UEs, and then onthree. The downloading rate keeps at about 47 KB/s with 4 UEs connected at most. When the fifth UE connects to the server, the rate declines. Try on site as below:
Download data with four UEs from the operator's server, and with two UEs from Huawei servers. Check whether the rate is faulty.As a result, the downloading rate of 6 UEs reaches47 KB/s.Probably, the operator's server does not well cooperate with Huawei networks.
Download data with six UEs from Huawei servers. Checkwhether the rate is faulty.Huawei servers cooperate well with Huawei networks. Probably the operator's server does not well cooperate with Huawei networks.
The difference between the operator's server and Huawei server lies in the router and firewall overthe operator's server. Try to avoid the impact from firewall and router, and check whether the rate increases.Connect the Gi interface of GGSN to NE08 directly,and download data with UE from the operator's server. Check whether the rate increases. The result proves that the rate remains the same.Therefore, the firewall has no impact on the rate.
Download data with six UEs from Huawei servers, and there is no problem. Connect Huawei server to NE08port to replace the operator's server for test, and check whether the rate is faulty.As a result, the downloading rate of six UEs reaches above 47 KB/s. Therefore, the router is normal.
Connect a laptop to Gi interface. Download data with 4 UEs and with a laptop simultaneously, and check whether their downloadings affect each other.
Tests prove that they seldom affect each other. The rate of some UEs declines a little, and that of some UEs are seldom affected. The rate of downloading data directly by laptop is 388 KB/s (single thread) or 1000 KB/s (three threads).The export bandwidth to the operator's server is enough, so decline of rate must not be due to bandwidth used for downloading data by multiple UEs simultaneously.
After previous verifications, the peripheral equipment problems are excluded, so probably the problem lies in the cooperation between the operator's server and Huawei network. The major differences between Huawei server and the operatorserver lie in two aspects: MTU and TcpWindowSize. Still on Huawei Server, modify the two parameters for verification:The configuration in the regedit on server is MTU 1450, and TcpWindowSize is 65535. Activate six UEssimultaneously, and the rate is as stable as above47 KB/s.Keep the MTU of web server at 1450. Modify the TcpWindowSize in regedit to 10 KB (10240). After restart, the rate of simultaneous rate by six UEs keeps above 47 KB/s.Delete the MTU from the regedit of web server (usethe default value 1500). Keep TcpWindowSize at 65535. After restart, the rate of six UEs declinessharply (20–30 KB/s). The downloading rate of three UEs keeps at 47 KB/s until the fourth UE joins.Therefore, when the MTU is the default value 1500,the rate of simultaneous downloading by multiple UEs declines. According to the packets captured bySniffer, the MTU on the operator's server is the default value 1500.According to analysis, when the MTU is 1500, due to the TCP header encapsulated along the path, the
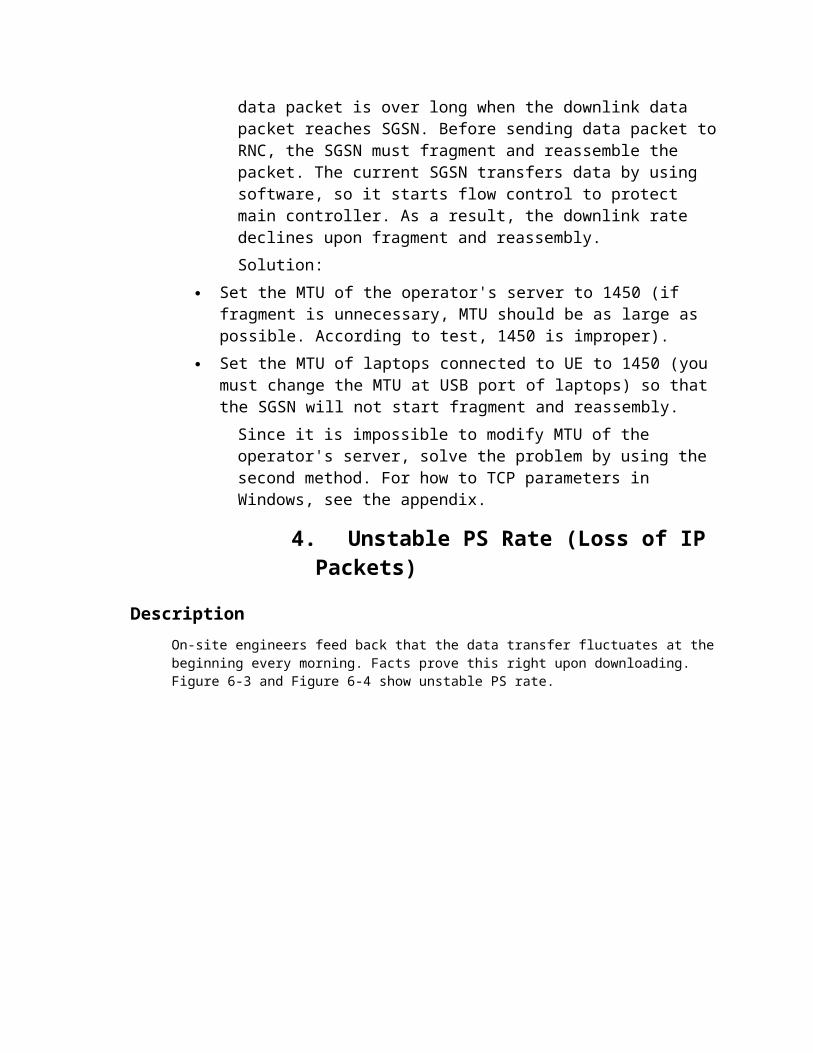
data packet is over long when the downlink data packet reaches SGSN. Before sending data packet toRNC, the SGSN must fragment and reassemble the packet. The current SGSN transfers data by using software, so it starts flow control to protect main controller. As a result, the downlink rate declines upon fragment and reassembly.Solution:
Set the MTU of the operator's server to 1450 (if fragment is unnecessary, MTU should be as large as possible. According to test, 1450 is improper).
Set the MTU of laptops connected to UE to 1450 (you must change the MTU at USB port of laptops) so that the SGSN will not start fragment and reassembly.Since it is impossible to modify MTU of the operator's server, solve the problem by using the second method. For how to TCP parameters in Windows, see the appendix.
4. Unstable PS Rate (Loss of IP Packets)
DescriptionOn-site engineers feed back that the data transfer fluctuates at thebeginning every morning. Facts prove this right upon downloading. Figure 6-3 and Figure 6-4 show unstable PS rate.
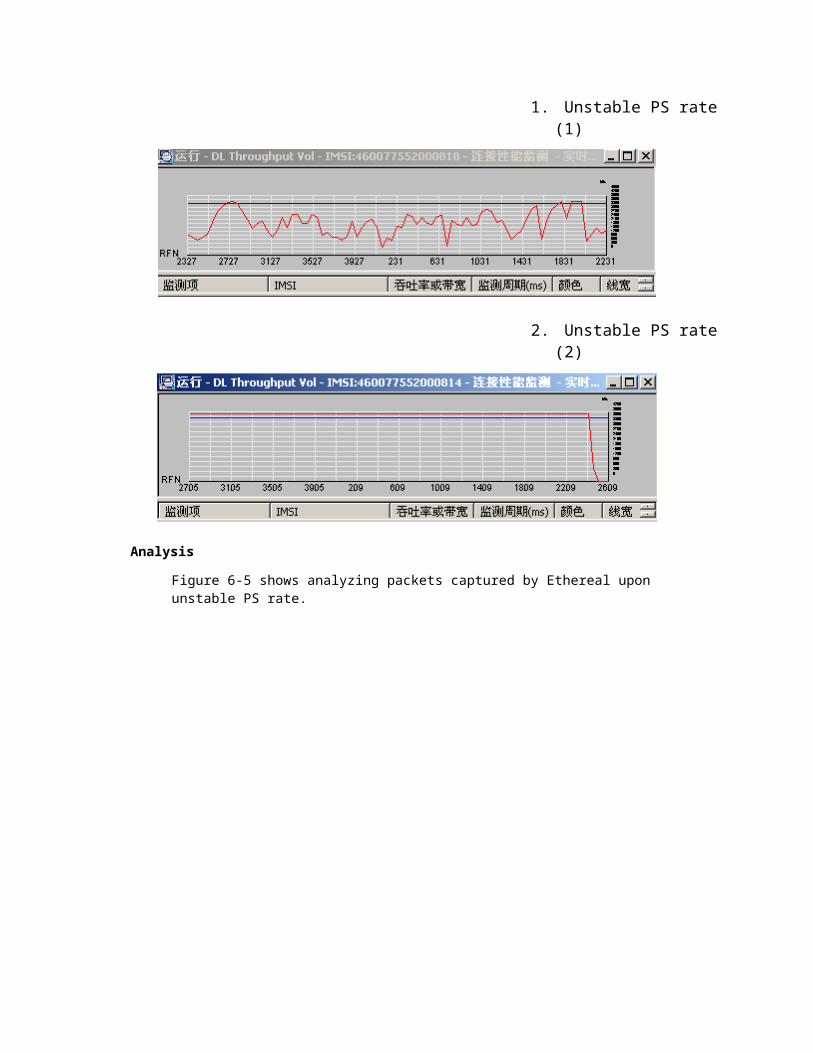
1. Unstable PS rate(1)
2. Unstable PS rate(2)
Analysis
Figure 6-5 shows analyzing packets captured by Ethereal upon unstable PS rate.
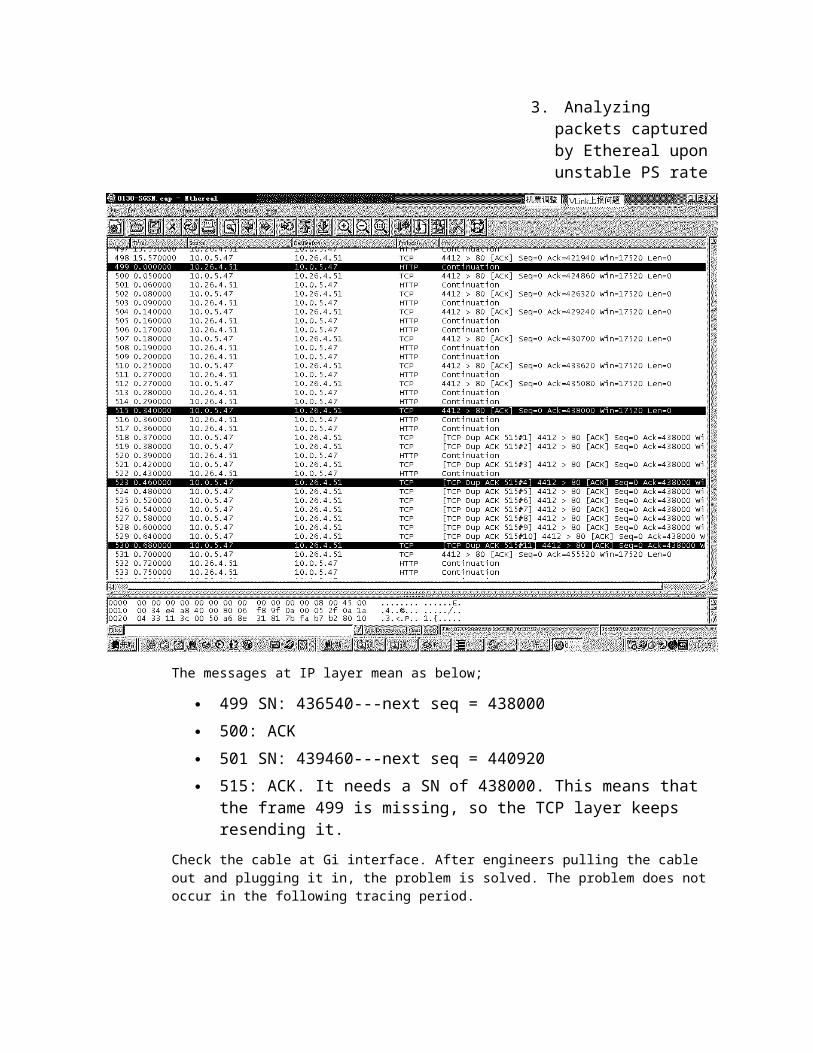
3. Analyzing packets captured by Ethereal upon unstable PS rate
The messages at IP layer mean as below;
499 SN: 436540---next seq = 438000 500: ACK 501 SN: 439460---next seq = 440920 515: ACK. It needs a SN of 438000. This means that
the frame 499 is missing, so the TCP layer keeps resending it.
Check the cable at Gi interface. After engineers pulling the cable out and plugging it in, the problem is solved. The problem does not occur in the following tracing period.
5. Unstable PS Rate of Single Thread in Commercial Deployment(Loss of IP Packets)
DescriptionAfter the commercial network is launched, the rate of 384 kbps service is unstable. It cannot reach the required rate, and even keeps at several dozen kbps.
AnalysisProbably the problem is caused by loss of data packets and delay. After capturing packets by segment, the cause proves on the firewall.
After repeated tests, the Up/Down and CRC Error occur frequently at the firewall 2 interface 2/2. After another 3 hours' test, the cablebetween the firewall 2 interface 2/2 and LS12 must not be physicallybroken, and CRC error must be due to improper installation of fiber.
A faulty firewall leads to loss of packets at the application layer,which has great impact on rate.
When the firewall is normal, the PS rate increases greatly. However,the rate is still unstable. According to further analysis, the BLER at the air interface is 10%, so it is normal for PS rate to fluctuate at the air interface. After engineers modify the BLER to 1%, the problem is solved. However, the cost is more consumption of power at the air interface and impact on capacity.
6. Unavailable Streaming Servicefor a Subscriber
DescriptionA subscriber cannot use streaming service in a deployment.
AnalysisThe subscriber can browse the portal websites, but cannot use streaming service. Meanwhile other subscribers can use streaming service. Therefore, the PS service bearer is normal, and the cause cannot be on RAN, SGSN, and GGSN. Probably the UE, USIM card, and server are faulty. According to further analysis, the problem must be on the USIM card, and the subscriber did not pay for using
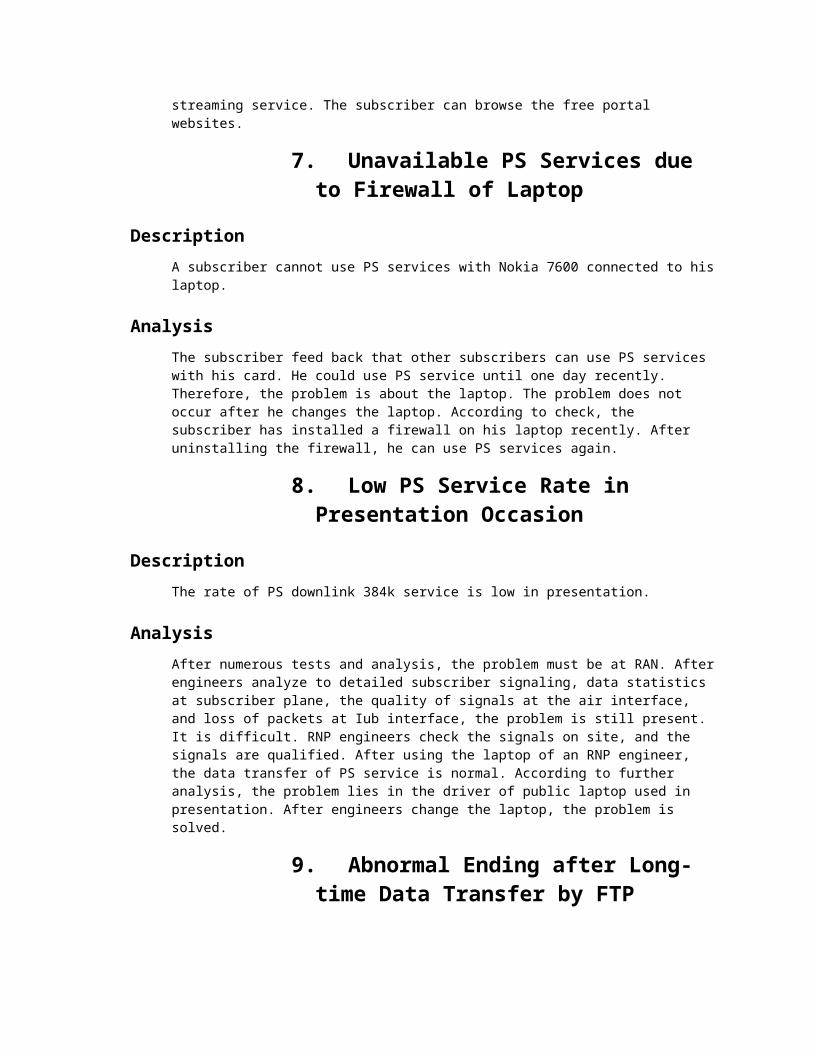
streaming service. The subscriber can browse the free portal websites.
7. Unavailable PS Services due to Firewall of Laptop
DescriptionA subscriber cannot use PS services with Nokia 7600 connected to hislaptop.
AnalysisThe subscriber feed back that other subscribers can use PS services with his card. He could use PS service until one day recently. Therefore, the problem is about the laptop. The problem does not occur after he changes the laptop. According to check, the subscriber has installed a firewall on his laptop recently. After uninstalling the firewall, he can use PS services again.
8. Low PS Service Rate in Presentation Occasion
DescriptionThe rate of PS downlink 384k service is low in presentation.
AnalysisAfter numerous tests and analysis, the problem must be at RAN. Afterengineers analyze to detailed subscriber signaling, data statistics at subscriber plane, the quality of signals at the air interface, and loss of packets at Iub interface, the problem is still present. It is difficult. RNP engineers check the signals on site, and the signals are qualified. After using the laptop of an RNP engineer, the data transfer of PS service is normal. According to further analysis, the problem lies in the driver of public laptop used in presentation. After engineers change the laptop, the problem is solved.
9. Abnormal Ending after Long-time Data Transfer by FTP
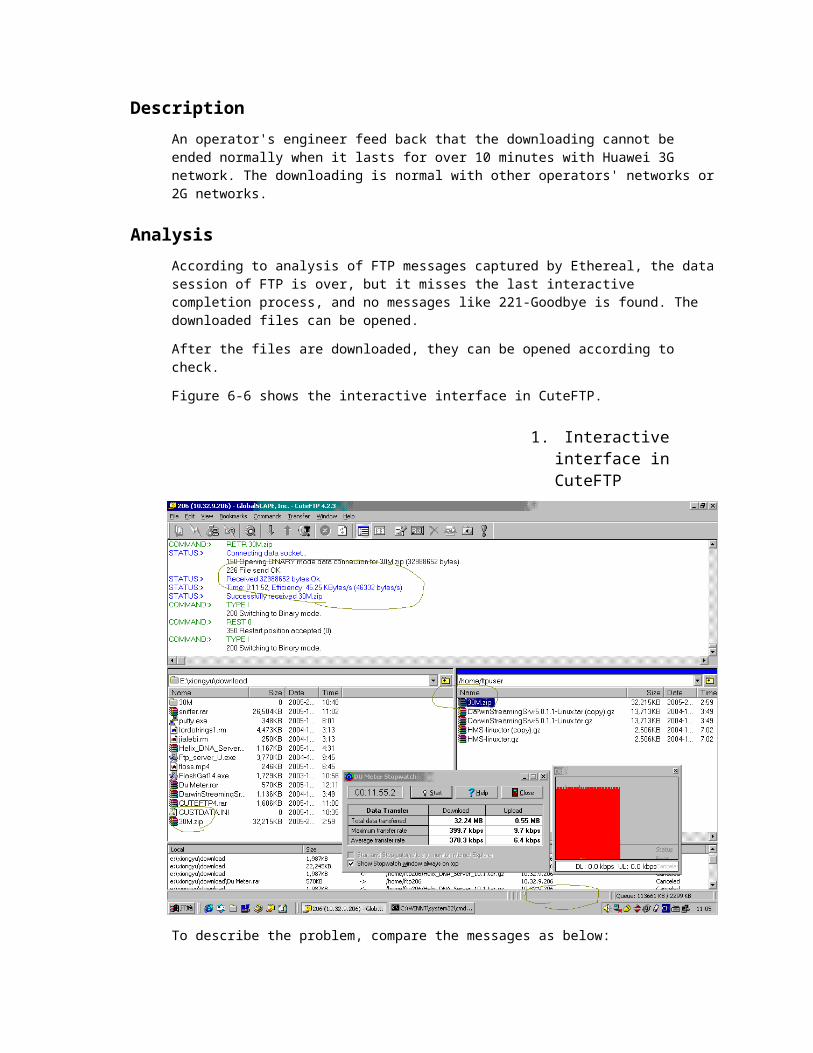
DescriptionAn operator's engineer feed back that the downloading cannot be ended normally when it lasts for over 10 minutes with Huawei 3G network. The downloading is normal with other operators' networks or2G networks.
AnalysisAccording to analysis of FTP messages captured by Ethereal, the datasession of FTP is over, but it misses the last interactive completion process, and no messages like 221-Goodbye is found. The downloaded files can be opened.
After the files are downloaded, they can be opened according to check.
Figure 6-6 shows the interactive interface in CuteFTP.
1. Interactive interface in CuteFTP
To describe the problem, compare the messages as below:
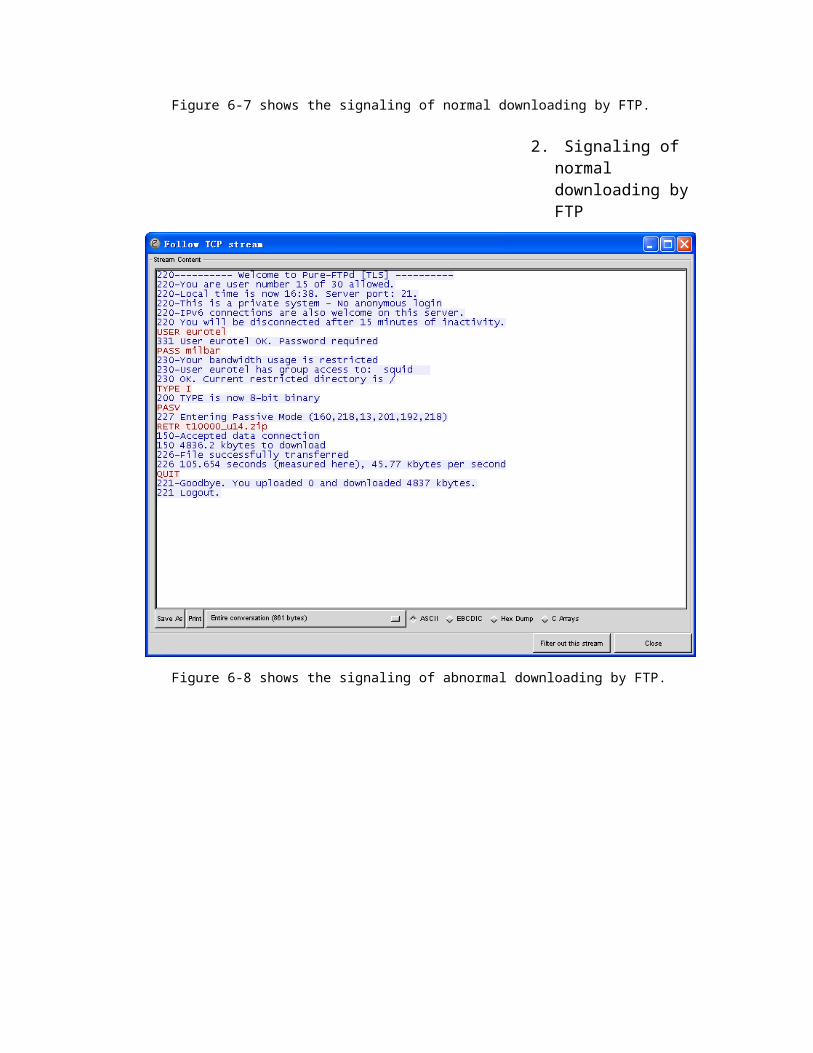
Figure 6-7 shows the signaling of normal downloading by FTP.
2. Signaling of normal downloading by FTP
Figure 6-8 shows the signaling of abnormal downloading by FTP.
3. Signaling of abnormal downloading by FTP
According to comparison of previous two figures, there are differences.
Activate UL64k/DL 32k service, and download data with Qualcomm 6250,and capture packets on RNC and SGSN.
Download a 3.5 Mb file with the operator's FTP, and it takes 12 minutes. The problem is still present.
Download a 3.5 Mb file with the Windows FTP command, and it takes 30minutes. After downloading is complete, quit the FTP by typing bye. The problem is still present. Maybe the Outlook is transferring datain daemon during data transfer, so there may be impact. After the transfer is complete, the transfer is abnormally disconnected after a long time.
Download a 0.4 Mb file with the Windows FTP command, and it takes 2 minutes. Quit the FTP by typing bye. The problem is not present.
Download a 0.4 Mb file with the operator's FTP, and it takes 2 minutes. The problem is not present.
Perform the same operations as the second step. Disconnect the downloading by Outlook in daemon. The result is the same as the second step. See the following print.
----End
According to previous operations, the downloading is relevant to time, not the file size. Based on analysis of massive data, the datatransfer by FTP is normal, the downloaded content is correct and available, but the signaling is abnormally closed.
Without other better method, the method of exchanging NEs and segment is used.
Check whether the problem is about UE and server.The problem is still present with verification by three UEs: Nokia 6630, Qualcomm 6250, and Moto 835. The problem is still present withverification by two servers: Eurotel FTP server and Huawei FTP server. The problem is still present with verification by Huawei FTPserver in UNIX operating system and in Windows 2000 Professional FTPserver.
Search for the configuration of FTP server, and no relevant configuration is found.
Conclusion: the problem is present with multiple UEs, operators, andHuawei FTP server, so the problem is irrelevant to UEs and FTP server, but relevant to Huawei network.
Compare the tests in the 3G network, the 2G network, and the tests of handover to the 2G network after access in the 3G network.
According to tests, the problem must be between GGSN and FTP server.This reduces the scope of problem.
According to other tests, the problem does not occur when no firewall is over Huawei server. This shows the cause. The problem does not reoccur due to no firewall.
According to data analysis, the data transfer at the FTP port is normal, but the signaling port is disconnected after 10 minutes. This must be due to firewall. It is the firewall that can disconnecta port without data transfer after 10 minutes, so the problem is dueto firewall.
Processing the problem goes smoothly after focusing on the firewall.The expert on firewall explains as below:
The FTP session includes two session tables on firewall. One is for FTP control channel, and the default aging time is 10 minutes. The other is FTP data channel, and the default aging time is 4 minutes. The no detect ftp command is configured between domains, the data channel will not update the aging time of control channel upon data transfer. As a result, the control channel is aging and deleted after 10 minutes with the following phenomenon.
If the detect ftp command is configured, the data channel will update the aging time of control channel. As a result, the problem does not occur.
The problem, in whole process, is irrelevant to RAN. However, the process and result of locating problem is considerable.
Changing NEs in test is significantly useful.
The difficulty of problem may exceed engineers' consideration. It needs wide-range knowledge. However, after the problem is solved, itseams easy.
10. Analysis of Failure in PS Hanodver Between 3G Network and2G Network
DescriptionA test of handover between Huawei 3G network of trial deployment andthe 2G network of a partner is going in a deployment. The test UE isHuawei U626. When the UE hands over from the 3G network to the 2G network in connection mode, it keeps being in PS connection, but it cannot transfer data normally. When the UE hands over from the 2G network to the 3G network, it can transfer data normally.
AnalysisThe UE hands over between the 3G network and 2G network. The UE camps on 3G network, and has activated PDP, in PMM Connected state. When the UE moves at the edge of 3G network coverage areas, it starts handing over to 2G network. When the handover is complete, the PS user plane is restores and can perform data transfer. However, the problem lies in that the UE cannot continue data transfer.
Analyze traced signaling.
Figure 6-9 shows the signaling of normal handover between 3G networkand 2G network.
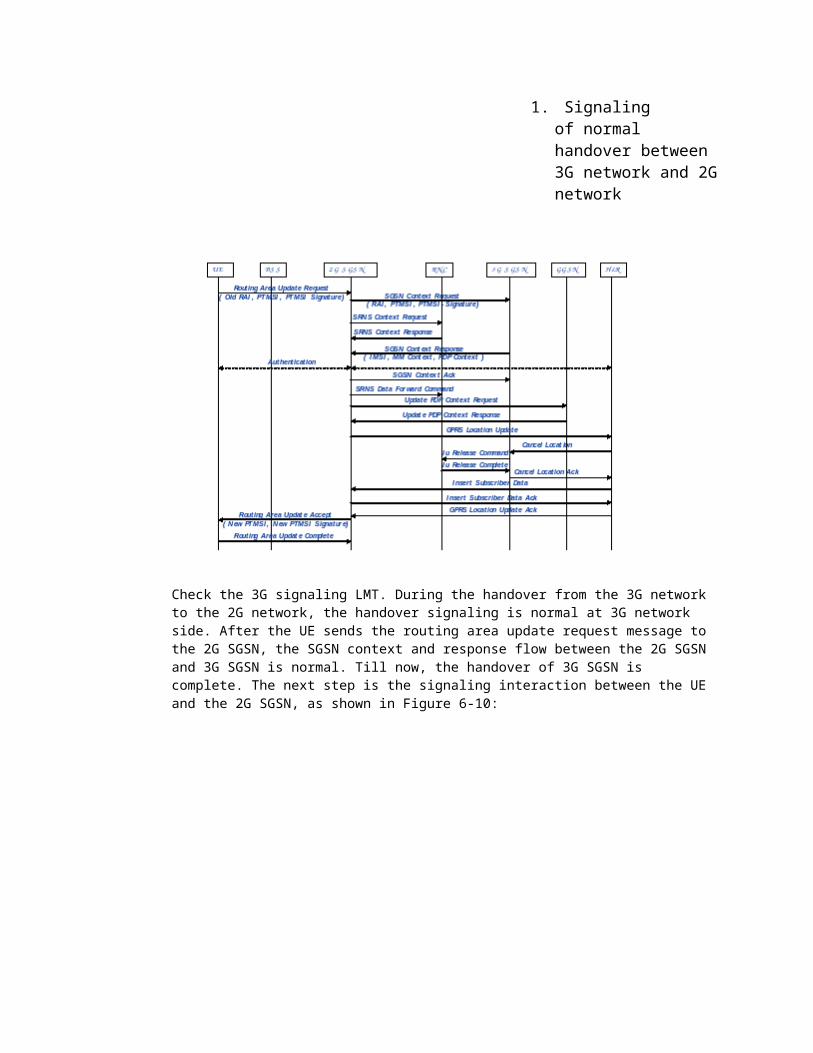
1. Signaling of normal handover between 3G network and 2Gnetwork
Check the 3G signaling LMT. During the handover from the 3G network to the 2G network, the handover signaling is normal at 3G network side. After the UE sends the routing area update request message to the 2G SGSN, the SGSN context and response flow between the 2G SGSN and 3G SGSN is normal. Till now, the handover of 3G SGSN is complete. The next step is the signaling interaction between the UE and the 2G SGSN, as shown in Figure 6-10:
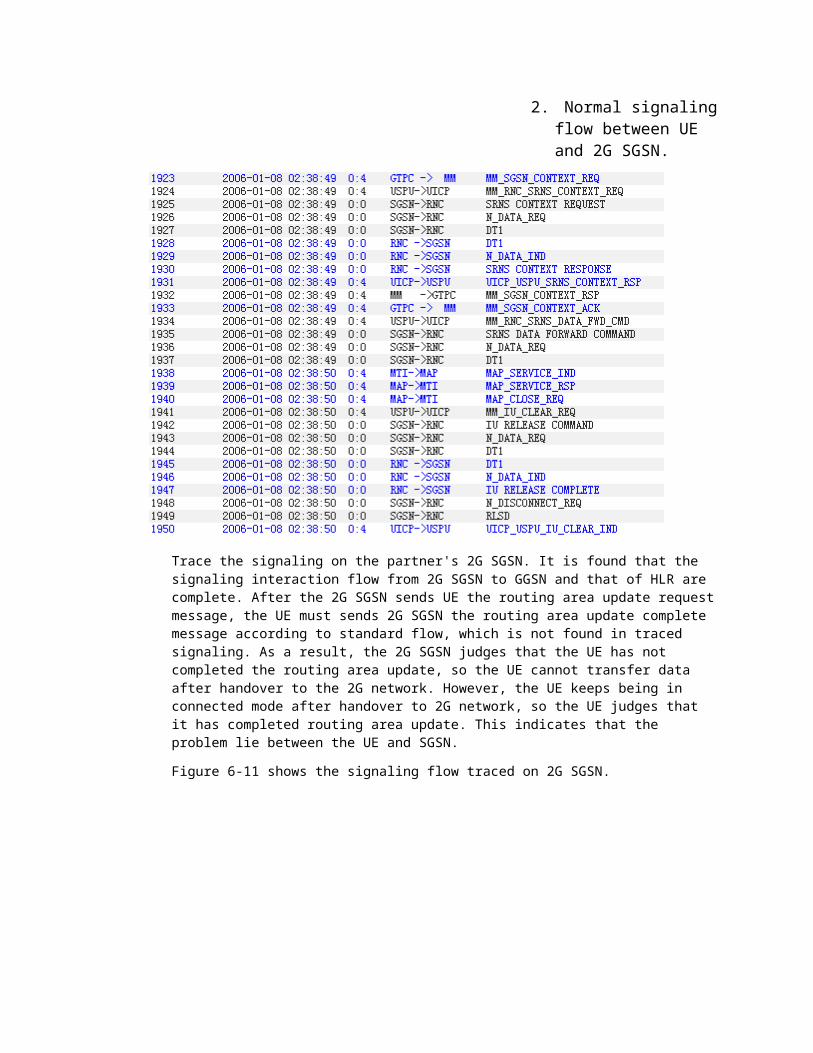
2. Normal signalingflow between UE and 2G SGSN.
Trace the signaling on the partner's 2G SGSN. It is found that the signaling interaction flow from 2G SGSN to GGSN and that of HLR are complete. After the 2G SGSN sends UE the routing area update requestmessage, the UE must sends 2G SGSN the routing area update complete message according to standard flow, which is not found in traced signaling. As a result, the 2G SGSN judges that the UE has not completed the routing area update, so the UE cannot transfer data after handover to the 2G network. However, the UE keeps being in connected mode after handover to 2G network, so the UE judges that it has completed routing area update. This indicates that the problem lie between the UE and SGSN.
Figure 6-11 shows the signaling flow traced on 2G SGSN.
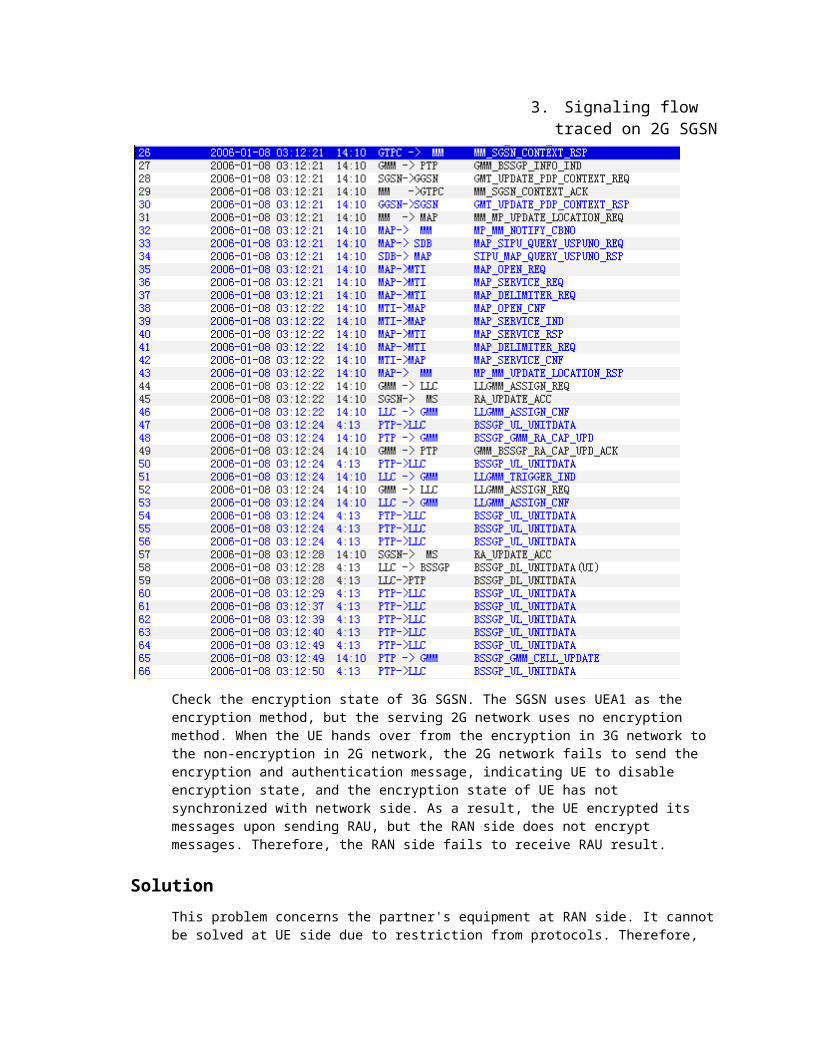
3. Signaling flow traced on 2G SGSN
Check the encryption state of 3G SGSN. The SGSN uses UEA1 as the encryption method, but the serving 2G network uses no encryption method. When the UE hands over from the encryption in 3G network to the non-encryption in 2G network, the 2G network fails to send the encryption and authentication message, indicating UE to disable encryption state, and the encryption state of UE has not synchronized with network side. As a result, the UE encrypted its messages upon sending RAU, but the RAN side does not encrypt messages. Therefore, the RAN side fails to receive RAU result.
SolutionThis problem concerns the partner's equipment at RAN side. It cannotbe solved at UE side due to restriction from protocols. Therefore,
the solution is to set the encryption item to non-encryption so thatthe messages sent by UE are not encrypted. As a result, the problem is mitigated.
Suggestion and SummaryThe problem concerns the partner's equipment at RAN side. Not every type of UE meets the problem, because the problem is just incidental. Therefore locate the problem based on signaling and analyze the problem to obtain the correct result.
7. Summary
This document describe the access, disconnection of data transfer, low rate of data transfer, unstable rate of data transfer, and interruption of data transfer. It provides the methods for analyzingand processing these problems in terms of traffic statistics and DT/CQT. The experience from analyzing problems in terms of traffic statistics is little, and will be supplemented.
In addition, the document details the flow for optimizing DCH bearerof data service and the flow for optimizing HSDPA bearer of data service.
The used cases include abundant cases at CN side. Actually, analyzing problems or modifying parameters at CN side must be processed by engineers at CN side. These CN cases just serve as reference for analyzing problems.
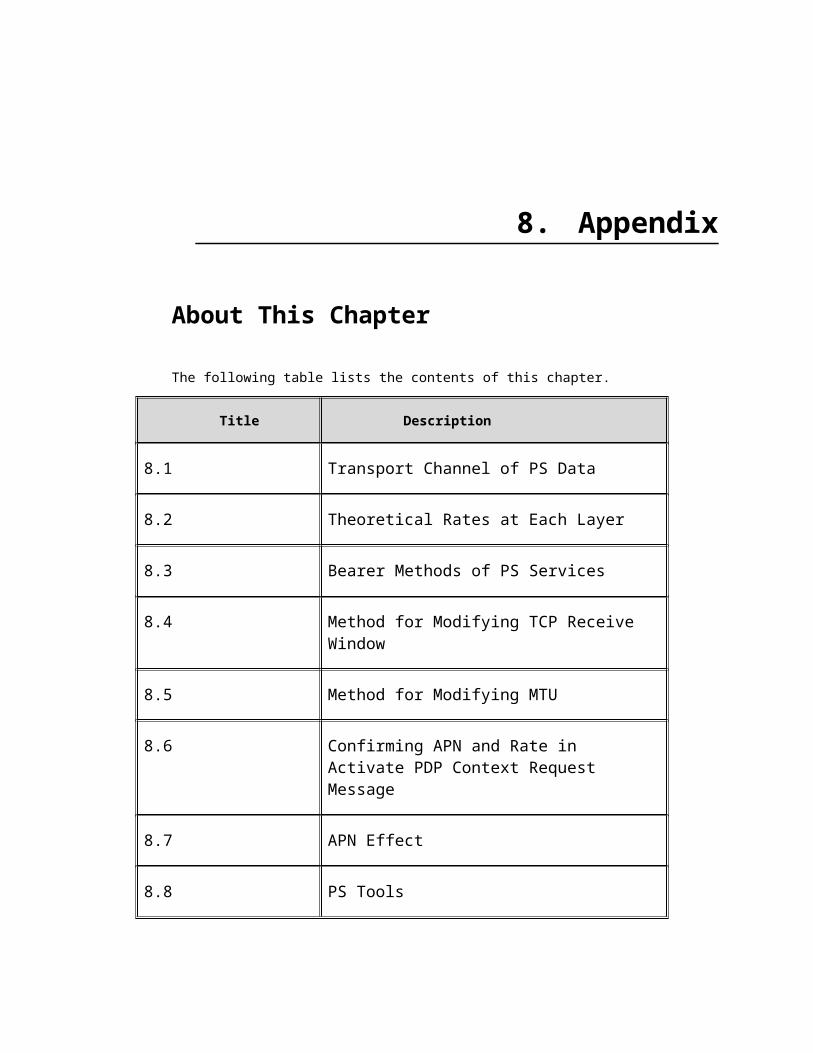
8. Appendix
About This Chapter
The following table lists the contents of this chapter.
Title Description
8.1 Transport Channel of PS Data
8.2 Theoretical Rates at Each Layer
8.3 Bearer Methods of PS Services
8.4 Method for Modifying TCP Receive Window
8.5 Method for Modifying MTU
8.6 Confirming APN and Rate in Activate PDP Context Request Message
8.7 APN Effect
8.8 PS Tools
8.9 Analysis of PDP Activation
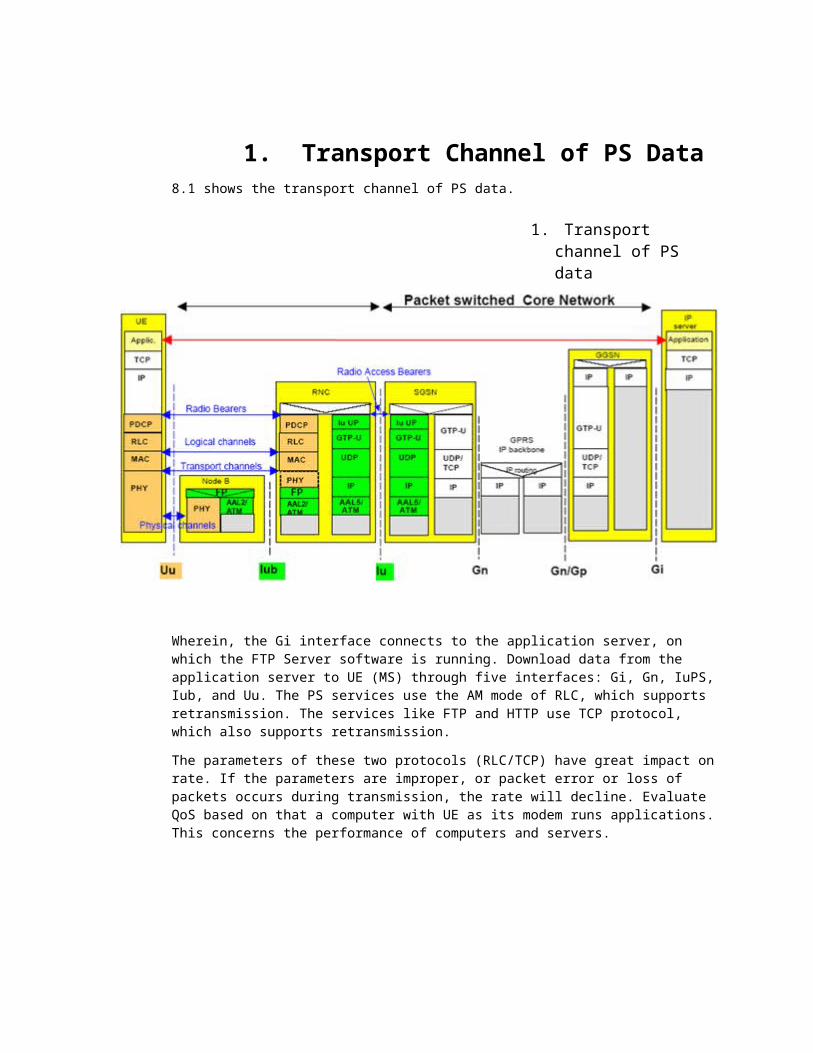
1. Transport Channel of PS Data8.1 shows the transport channel of PS data.
1. Transport channel of PS data
Wherein, the Gi interface connects to the application server, on which the FTP Server software is running. Download data from the application server to UE (MS) through five interfaces: Gi, Gn, IuPS,Iub, and Uu. The PS services use the AM mode of RLC, which supports retransmission. The services like FTP and HTTP use TCP protocol, which also supports retransmission.
The parameters of these two protocols (RLC/TCP) have great impact onrate. If the parameters are improper, or packet error or loss of packets occurs during transmission, the rate will decline. Evaluate QoS based on that a computer with UE as its modem runs applications.This concerns the performance of computers and servers.
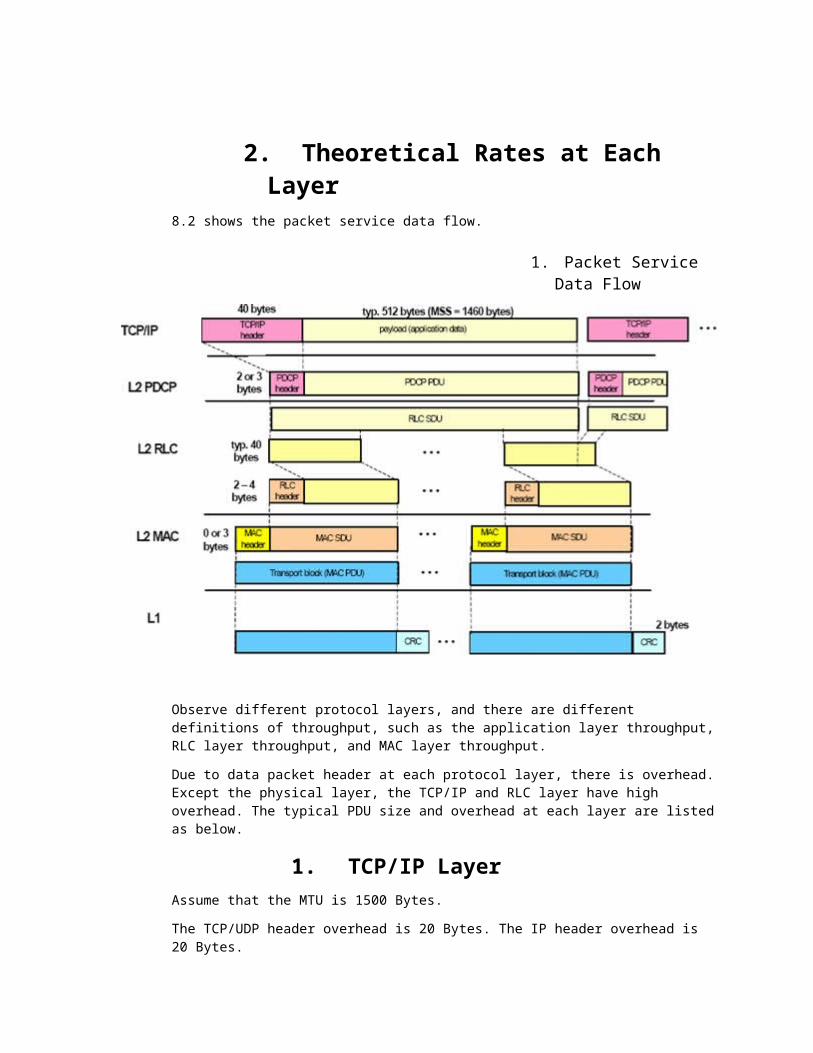
2. Theoretical Rates at Each Layer
8.2 shows the packet service data flow.
1. Packet Service Data Flow
Observe different protocol layers, and there are different definitions of throughput, such as the application layer throughput,RLC layer throughput, and MAC layer throughput.
Due to data packet header at each protocol layer, there is overhead.Except the physical layer, the TCP/IP and RLC layer have high overhead. The typical PDU size and overhead at each layer are listedas below.
1. TCP/IP LayerAssume that the MTU is 1500 Bytes.
The TCP/UDP header overhead is 20 Bytes. The IP header overhead is 20 Bytes.
The TCP/UDP PDU size, namely, the payload at application layer, is 1460 Bytes, but the whole IP packet size is 1500 Bytes.
2. RLC LayerThe RLC header overhead is 16 Bits.
The RLC PDU size is 336 Bits.
Assume that the rate at the application layer is 1 Bytes/s. if retransmission at each layer is not considered, the corresponding rate at RLC layer is 1500/1460, namely, 1.027. The rate at MAC-d layer is 1500/1460 * 336/320, namely, 1.079.
3. Retransmission OverheadIf the TCP layer retransmission (assume that the retransmission rateis r1) and RLC layer retransmission are considered, the corresponding rate at RLC layer is 1500 * (1 + r1)/1460. The rate atMAC-d layer is 1500 * (1 + r1)/1460 * (1 + r2) * 336/320.
4. MAC-HS LayerIf there is only one subscriber, without retransmission at MAC-HS layer, the rate at MAC-HS is (scheduling transport block size TBs)/2ms, and the rate at MAC-d layer is 336 * (TBs/336s)/2ms.
In the DT tool Probe, with consideration of multiple subscriber scheduling and retransmission at MAC-HS, there are three rate involved at MAC-HS layer: scheduled rate, served rate, and MAC layerrate.
Served Rate = Scheduled Rate * HS-SCCH Success Rate
MAC Layer Rate = Served Rate * (1- SBLER)
Wherein, the HS-SCCH Success Rate is the success rate for receiving HS-SCCH data by a subscriber, and SLBER is incorrect TB received at MAC-HS layer/total TBs received.
3. Bearer Methods of PS ServicesIn Rel 4 and R99 protocol versions, data service is carried on DCH. If the data services are low in traffic, it can also be carried on FACH.
When HSDPA is used in Rel 5, the data service can be carried on DCH or HSDPA. If the traffic is low, the data service can be carried by FACH through state transition.
The following three paragraphs describe the method for RNC to judge whether a PS service is carried by DCH or HSDPA in a cell supportingHSDPA.
Two parameters are relevant to the SET FRC command on RNC LMT: downlink streaming service HSDPA threshold and downlink BE service HSDPA threshold.
Downlink streaming service HSDPA threshold indicates the rate judgment threshold of PS streaming service carried on HS-DSCH. When the downlink maximum rate of PS streaming service is equal to or larger than the threshold, the service can be carried on HS-DSCH. Otherwise, it is carried on DCH.
Downlink BE service HSDPA threshold indicates the rate judgment threshold of PS background/interactive service carried on HS-DSCH. When the downlink maximum rate of PS background/interactive service is larger than or equal to the threshold, the service can be carriedon HS-DSCH. Otherwise, it is carried on DCH.
The service is carried by from DCH or HSDPA to FACH through state transition.
1. DCHThe DCH bandwidth depends on the current power resource, code resource, and Iub bandwidth resource. Typical rates include 8 kbps, 32 kbps, 64 kbps, 128 kbps, 144 kbps, and 384 kbps. The DCH bandwidth is adjustable by algorithms like DCCC according to the current traffic and coverage conditions, but the adjustment is limited to previous rates. In addition, the interval to trigger adjustment is long. As a result, the adjustment is not frequent.
2. HSDPAThe network does not allocate fixed bandwidth or resources for the PS services carried by HSDPA, but perform fast schedule every 2ms.
Therefore, the throughput that a subscriber can reach depends on abundant factors, such as:
UE category (capacity level) Available code resource of HSDPA Available power resource of HSDPA Number of HSDPA subscribers Scheduling algorithm Radio environment
Therefore, the throughput of single PS service carried by HSDPA fluctuates more sharply than that carried by DCH. However, HSDPA uses new technologies, such as fast schedule, HARQ, and 16QAM, so the utilization rate of resources is higher, and throughput of wholecell is higher.
3. CCHFACH can carried PS services of low traffic, it can also bear broadcasting services like CMB.
FACH uses code resource of different SFs, so it support variable channel rate. This depends on the need by broadcasting services likeCMB.
4. Method for Modifying TCP Receive Window
For the services (such as VOD and FTP) using TCP protocol, the TCP window size of test laptop (client) and server have great impact on performance of service. To obtain better performance, set the windowsize as large as possible, and set the window size of client and server to the same, such as 64K (65535).
1. Tool ModificationRun the DRTCP.exe attached in the appendix 8.8.1. For the running interface, see the method for modifying MTU.
Change the TCP Receive Window, such as 65535.
2. Regedit ModificationDetailed operations are as below:
In Windows 2000,
In HKEY_LOCAL_MACHINE\SYSTEM\CurrentControlSet\Services\Tcpip, add string: "TcpWindowSize"="65535"
In HKEY_LOCAL_MACHINE\SYSTEM\CurrentControlSet\Services\Tcpip\Parameters, add double type value TcpWindowSize. Set it to 65535 or ffff (hex).
5. Method for Modifying MTUThe MTU here is IP packet size. As shown in Figure 5-27, GGSN has two layer IP. The maximum IP packet size is 1500 bytes. If a data packet at IP layer is to be transmitted, and the packet is larger than MTU at IP layer after encapsulation, IP packet fragment is necessary. After fragment, each fragment is smaller than the MTU at IP layer.
In terms of PS CN efficiency, avoid IP fragment and reassembly, and meanwhile use the MTU as large as possible. The MTU is usually smaller than or equal to 1450 bytes. The data transmission rate of PS CN is usually higher than the rate at air interface, so the MTU has little impact on the rate at air interface. The default MTU in computers is 1500 bytes.
Modifying MTU includes modifying the MTU of server and modifying theMTU of test laptop. The server and client will negotiate, so the actual MTU is the smaller one.
Modify MTU by using DRTCP tool or modifying Windows Register. The following sections detail the operations.
1. Tool ModificationRun the DRTCP.exe attached in the appendix 8.8.1, with the running interface as shown in .
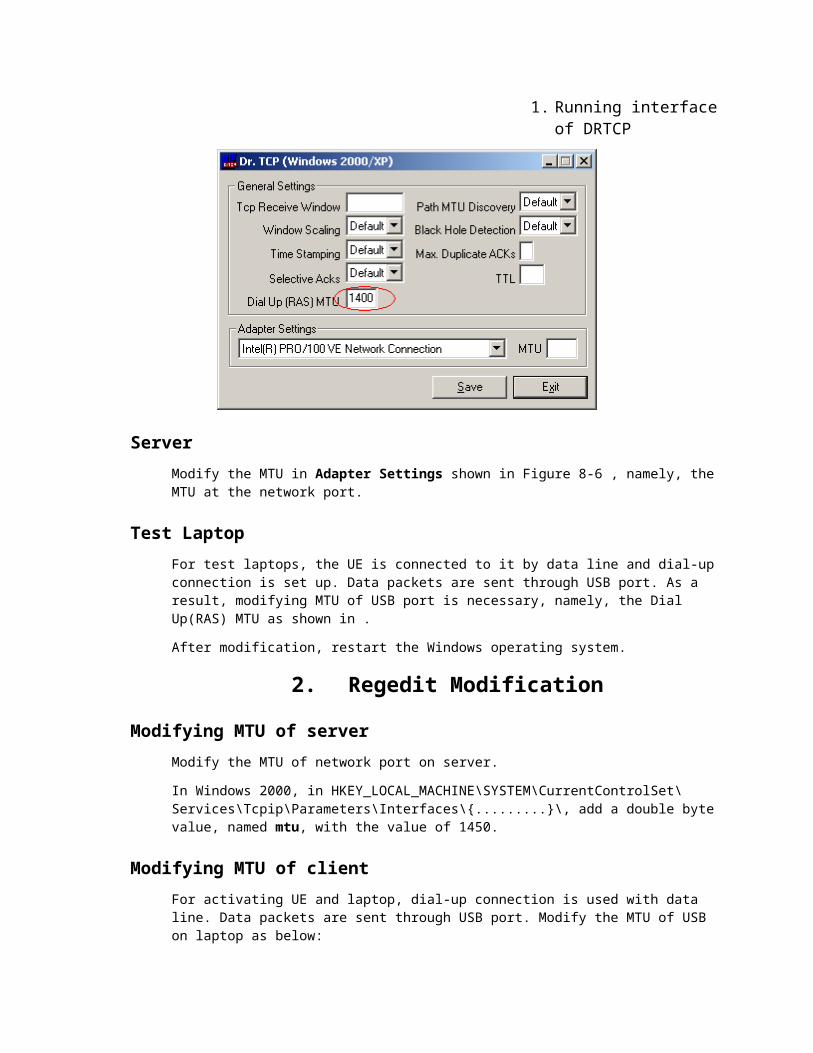
1. Running interfaceof DRTCP
ServerModify the MTU in Adapter Settings shown in Figure 8-6 , namely, theMTU at the network port.
Test LaptopFor test laptops, the UE is connected to it by data line and dial-upconnection is set up. Data packets are sent through USB port. As a result, modifying MTU of USB port is necessary, namely, the Dial Up(RAS) MTU as shown in .
After modification, restart the Windows operating system.
2. Regedit Modification
Modifying MTU of serverModify the MTU of network port on server.
In Windows 2000, in HKEY_LOCAL_MACHINE\SYSTEM\CurrentControlSet\Services\Tcpip\Parameters\Interfaces\{.........}\, add a double bytevalue, named mtu, with the value of 1450.
Modifying MTU of clientFor activating UE and laptop, dial-up connection is used with data line. Data packets are sent through USB port. Modify the MTU of USB on laptop as below:
In Windows 2000, in HKEY_LOCAL_MACHINE\SYSTEM\CurrentControlSet\Services\NdisWan\Parameters\Protocols\0\, modify the ProtocolMTU to 1450.
After modification, restart the Windows operating system.
6. Confirming APN and Rate in Activate PDP Context Request Message
When the UE originates data services, the QoS is sent to the system in Activate PDP Context Request message. The message result is as shown in 8.6.
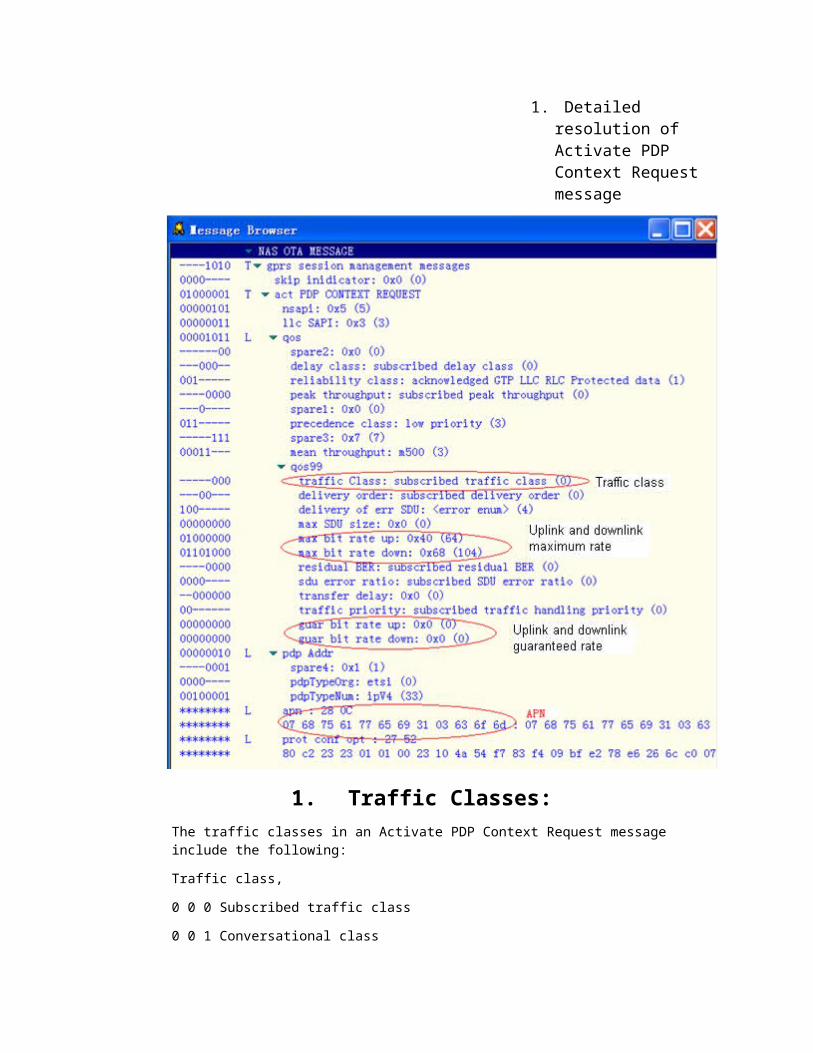
1. Detailed resolution of Activate PDP Context Request message
1. Traffic Classes:The traffic classes in an Activate PDP Context Request message include the following:
Traffic class,
0 0 0 Subscribed traffic class
0 0 1 Conversational class
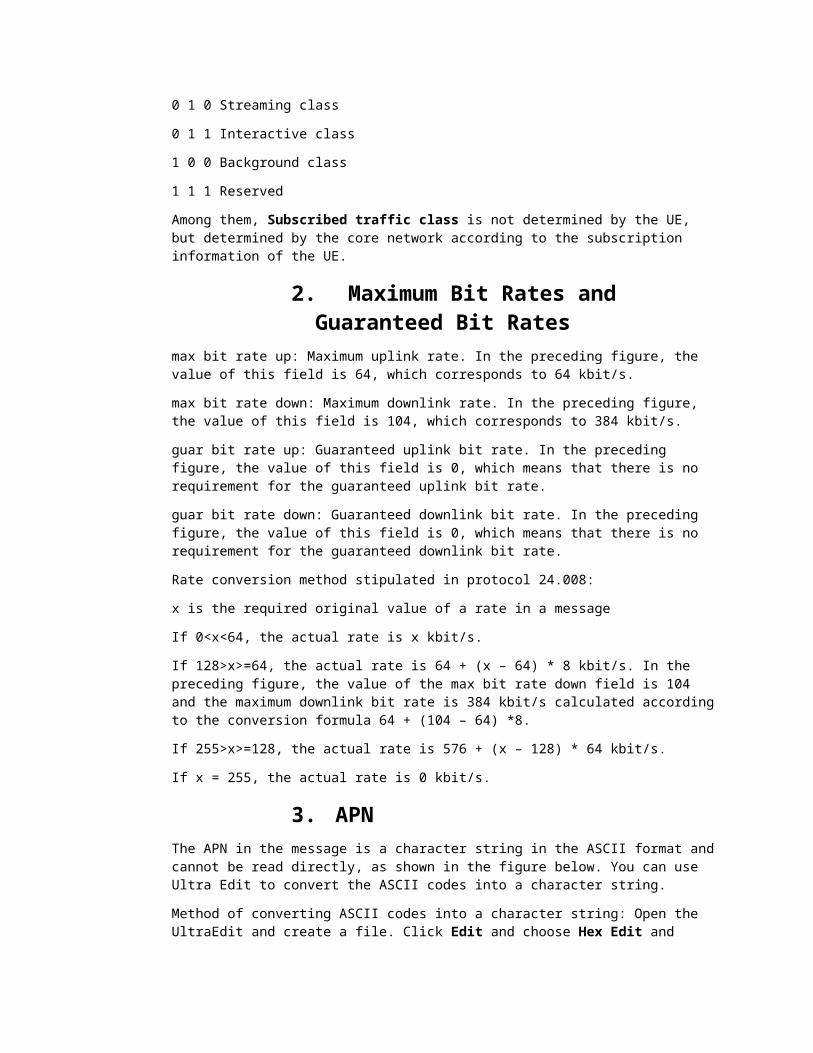
0 1 0 Streaming class
0 1 1 Interactive class
1 0 0 Background class
1 1 1 Reserved
Among them, Subscribed traffic class is not determined by the UE, but determined by the core network according to the subscription information of the UE.
2. Maximum Bit Rates and Guaranteed Bit Rates
max bit rate up: Maximum uplink rate. In the preceding figure, the value of this field is 64, which corresponds to 64 kbit/s.
max bit rate down: Maximum downlink rate. In the preceding figure, the value of this field is 104, which corresponds to 384 kbit/s.
guar bit rate up: Guaranteed uplink bit rate. In the preceding figure, the value of this field is 0, which means that there is no requirement for the guaranteed uplink bit rate.
guar bit rate down: Guaranteed downlink bit rate. In the preceding figure, the value of this field is 0, which means that there is no requirement for the guaranteed downlink bit rate.
Rate conversion method stipulated in protocol 24.008:
x is the required original value of a rate in a message
If 0<x<64, the actual rate is x kbit/s.
If 128>x>=64, the actual rate is 64 + (x – 64) * 8 kbit/s. In the preceding figure, the value of the max bit rate down field is 104 and the maximum downlink bit rate is 384 kbit/s calculated accordingto the conversion formula 64 + (104 – 64) *8.
If 255>x>=128, the actual rate is 576 + (x – 128) * 64 kbit/s.
If x = 255, the actual rate is 0 kbit/s.
3. APNThe APN in the message is a character string in the ASCII format andcannot be read directly, as shown in the figure below. You can use Ultra Edit to convert the ASCII codes into a character string.
Method of converting ASCII codes into a character string: Open the UltraEdit and create a file. Click Edit and choose Hex Edit and
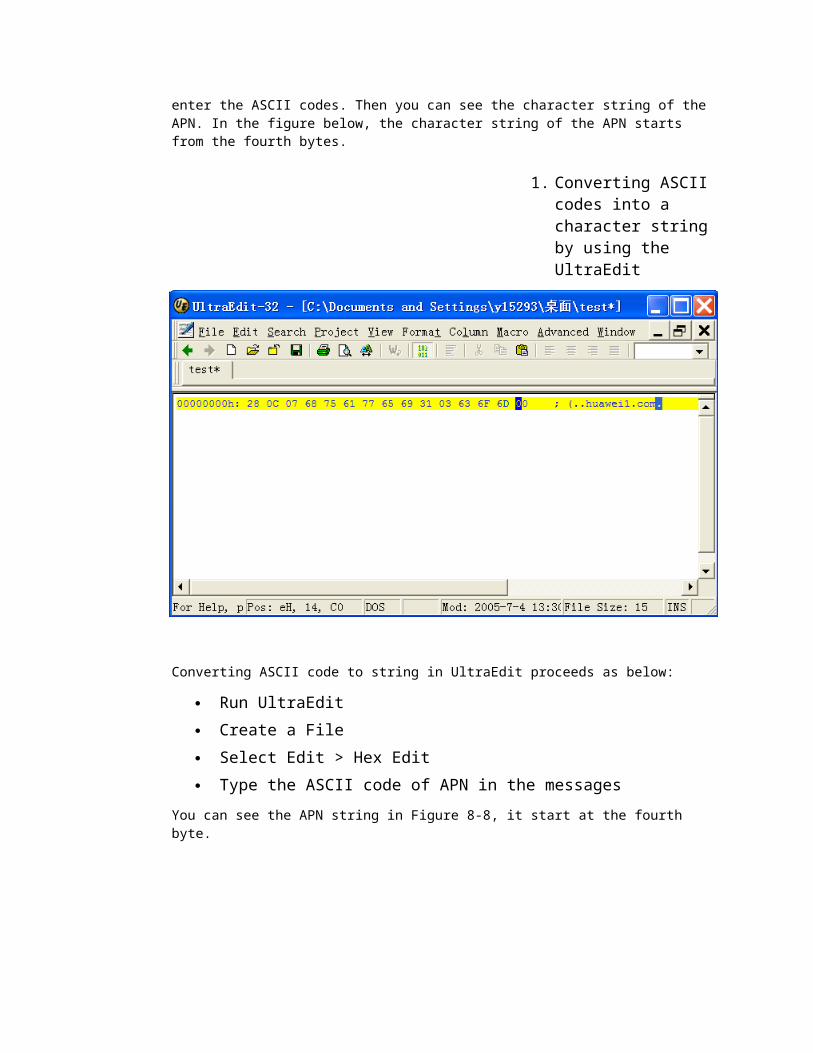
enter the ASCII codes. Then you can see the character string of the APN. In the figure below, the character string of the APN starts from the fourth bytes.
1. Converting ASCII codes into a character string by using the UltraEdit
Converting ASCII code to string in UltraEdit proceeds as below:
Run UltraEdit Create a File Select Edit > Hex Edit Type the ASCII code of APN in the messages
You can see the APN string in Figure 8-8, it start at the fourth byte.
7. APN Effect1. Major Effect
In GPRS/WCDMA networks, APN has the following effects:
In GRPS/WCDMA backbone networks, APN identifies GGSN.
APN defines the external PDN that GGSN can connect to, such as ISP networks, private networks, and enterprise intranets.
2. Method for Naming APNAPN consists the following two parts:
APN network identityIt defines the external networks that subscribers can connect to by the GGSN. This part is compulsory. It is assigned to ISP or Huawei by network operators, the same identity as the fixed Internet domain name. For example, to define subscribers to connect to Huawei enterprise intranet by the GGSN, the APN network identity must be huawei.com.
APN operator identityIt defines the GPRS/WCDMA backbone network. This part is optional. For example, in a GPRS network, it could be xxx.yyy.gprs (such as MNC.MCC.gprs), which identifies the PLMN network of GGSN.
APN network identity is saved in HLR as a subscribed data. When a UEoriginate packet services, it provides APN for SGSN. APN is used by SGSN to select the GGSN to be connected and by GGSN to judge the external networks to be connected. In addition, HLR can save a wildcard. In this way, the MS or SGSN can select an APN that is not saved in HLR.
Subscribers select GGSN by different APNs. Namely, subscribers can activate multiple PDP context, and each PDP context is related to an
APN. Subscribers select different APNs to connect to different external networks through different GGSNs.
3. APN ConfigurationBefore configuring APN on GGSN9811, the PDN that can be visited by subscribers must be clearly known. Set different APNs to different PDNs. For example, the GGSN9811 allows a subscriber to visit Internet through an ISP and an enterprise intranet simultaneously, and two APNs must be set up on GGSN9811: one for visiting Internet, and the other for visiting the enterprise intranet.
8. PS Tools1. TCP Receive Window and MTU Modification Tools
Modify TCP receive window and MTU with the following tool:
For the detailed method, see the appendix 8.4 and 8.5.
2. SnifferSniffer can capture, construct, and send packets. It constructs transfer data at a fixed rate, and then obtains the rate at other NEs. This eliminates the external impact. Sniffer can send packets at UE side or on server. It can construct data transfer at fixed rate in uplink and downlink simultaneously, or just construct data transfer in uplink or downlink.
Verifying Bearer Capacity of System by IP Data Packet ofFixed Rate Constructed by Sniffer
In service demonstration, if the rate declines, it is difficult to judge whether the system is faulty or the source rate declines. By IP data packet of fixed rate constructed by sniffer, engineers can focus on system problems without being disturbed by source rate.
How to construct IP data packet of uplink and downlink fixed rateExecute the ping command on a computer of UE daemon to the application server. Capture the pingpacket by using capture function of Sniffer. Send the ping packet automatically and continuously by using the packet generator function of Sniffer, and then obtain the data flow of uplink and downlink fixed rate (if the system is normal). Calculate the rate according to sending interval and ping packet size. Monitor by the monitoring
software at UE daemon whether the uplink and downlink rate are normal.Execute the ping command on the application service to UE. Capture the ping packet by using capture function of Sniffer. Send the ping packet automatically and continuously by using the packetgenerator function of Sniffer, and then obtain thedata flow of uplink and downlink fixed rate (if the system is normal).
How to construct IP data packet of unidirectional uplink fixed rateCapture the ping packet by using capture function of Sniffer. Destroy the IP packet and data relatedto ping by using the packet generator function of Sniffer. The IP header remains the same. Send the IP packet automatically and continuously. When theIP packet reaches the application server, it will be dropped by the server because the server cannotidentify the content of IP packet. As a result, the data flow of unidirectional uplink fixed rate is obtained (if the system is normal).
How to construct IP data packet of unidirectional downlink fixed rateUse the same method as mentioned in how to construct IP data packet of unidirectional uplink fixed rate. The data flow of unidirectional uplinkfixed rate is obtained (if the system is normal).
Judge by Sniffer Whether Packets are lost in Uplink and Downlink
Use the previous method for capturing packets. Set the Sniffer to send ping packets of fixed number. Monitor at the destination by Sniffer whether the ping packets of the same number are received. This checks whether packets are lost during transmission.
3. Common Tool to Capture Packet: Ethereal
Ethereal captures packets. It can parse protocols like HTTP, RTP, and FTP, even WAP, and GSM-MAP protocols. It can also analyze the throughput of TCP flow, delay distribution, and RTP flow. It features to resolute IP packet and time label of high precision (ms level). The latest version of Ethereal can record the content of PPPprotocol on laptop. It helps to analyze end-to-end problems and delay conveniently.
4. HSDPA Test UEIn terms of test methods, the PS service test carried by HSDPA is the same as that carried by DCH. Select the test UEs that support HSDPA.
Now the UEs available in HSDPA PS service test include Huawei E620 data card, Qualcomm TM6275, and UB TM500.
Huawei E620 data card is a category 12 UE. It supports 5 HS-PDSCH codes at most. It supports QPSK, but not 16QAM. The maximum throughput at physical layer is 1.8 Mbps. The actual throughput at application rate is 1.4 Mbps. Huawei E620 data card supports combination of PS and AMR services, but not VP service.
Qualcomm TM6275 is a category 11 or 12 UE. It supports 5 HS-PDSCH codes at most. It supports QPSK, but not 16QAM. It supports streaming and VP services.
UB TM500 is an emulation test UE. It can emulate the UEs of multiplecategories. It supports 15 HS-PDSCH codes at most. It supports QPSK and 16QAM. It supports the combination of PS and CS services, namely, after a subscriber starts PS service, it then start CS service.
Huawei E620 data card and Qualcomm TM6275 are for DT. TM500 is large, unfit for DT, but it can emulate multiple UE categories. In laboratory, HSDPA performance test requires UE to support 10 or 15 codes, but no UE or data card support 10 or 15 codes. As a result, using TM500 for test is necessary.
9. Analysis of PDP ActivationThe GRPS subscribed data can include the subscribed information of multiple packet data protocol (PDP) address. In MS, SGSN, and GGSN, one or more PDP contexts describe each PDP address. Each PDP contextis in the following two states: inactive or active state.
In active state, PDP context is activated in MS, SGSN, and GGSN. It contains the routing and mapping information to process PDP PDU between MS and GGSN. The PDP context activation process contains theactivation process originated by MS, the activation process originated by network, and the second activation process. The activation process originated by MS is used upon PS service connection.
8.9 shows the PDP context activation process originated by MS.
1. PDP context activation process originated by MS
The MS sends SGSN the Activate PDP Context Request (NSAPI, TI, PDP Type, PDP Address, Access Point Name, QoS Requested). The PDP Address indicates the dynamic address or the static address. If the PDP Address is dynamic address, set it to null.
The following aspects lead to unsuccessful PDP activation process:
Activation rejected, unspecified (#31): Huawei SGSN defines GTPU interaction failure, expiration, operation SDB failure, activation failure due to other abnormalities to this kind of failure.
Activation rejected by GGSN (#30): GGSN rejects or fails to decode the corresponding activation request.
Missing or unknown APN (#27): APN is not contained in the activation request message or cannot be extracted. Huawei SGSN takes DNS resolution failure,DHCP or MIP GGSN address acquisition failure, APN error specified by activation at network side, otherAPN error as activation failure. These are internal causes.
Unknown PDP address or PDP type (#28): the PDP address or PDP type cannot be identified by SGSN.
User Authentication failed (#29): user authentication fails.
Service option not supported (#32): the requested serving PLMN does not support this. Huawei SGSN takes wildcard (*) activation rejection, service non-supportive, IPV6 non-supportive as this type.
Requested service option not subscribed (#33): requested service is not subscribed. Huawei SGSN takes mismatch subscribed information, VPLMN access inhibit, and charging restricted callingVPLMN as this type.
Insufficient resources (#26): activation fails due to inadequate resource. Huawei SGSN takes the following causes as inadequate resource.
UGBI PDP resource congestion UGBI board congestion RPU failure Inadequate SDB or SM CB resource Activation failure due to internal charging
restricted calling Operator Determined Barring (#8): operators bar PDP
activation process. Service option temporarily out of order (#34): this
is a cause value which MSC use to indicate that
function are inadequate to support corresponding requests. Huawei SGSN is seldom used, so neglect it.
NSAPI already used (#35): the requested NSAPI is already used by PDP activated by the subscriber, butthe cause value will not be sent.
Protocol error, unspecified (#111): Huawei SGSN in abnormal SDB or SM state may confront this type of activation rejection.
2008-12-15 All rights reserved Page166 , Total166