Enhanced Analysis of WCDMA Networks with Repeaters Deployment
Upload
khangminh22Category
view
0download
0
1
Capacity and Coverage Tradeoff in WCDMA Environments with Repeaters Deployment.
M. Garcia-Lozano, L. Alonso, F. Casadevall, S. Ruiz
Universitat Politècnica de Catalunya (UPC) Department of Signal Theory and Communications Phone: +34 934 13 72 13
Fax: +34 934 13 70 07
E-mail: [email protected]
This work has been funded by the Spanish Research Council CICYT+FEDER through the projects TEC2005-07326-C02-01/TCM and TIC2003-08609. Part of this work was originally presented in the Wireless Personal Multimedia Communications conference 2005. Abstract. This work derives the analytic expression of the feasibility condition for the uplink of a
WCDMA mobile communications system with repeaters deployment in a multiservice
environment with a general heterogeneous layout. In particular, a compact closed expression for
the admission region is presented, suitable for a system where the users belong to an arbitrary
number of different service classes. A tradeoff between capacity and coverage arises and it has
been analysed both theoretically and by means of simulations. Different parameters are shown to
have a major impact and their adjustment is discussed.
Keywords: radio planning, WCDMA, repeaters, capacity and coverage.
1. Introduction
Mobile communications systems often work under high heterogeneous
conditions, both in time and space domains. This fact makes the proper design of
the network infrastructures very important, especially the radio access part.
Optimizing this design is a technical and economical challenge. Active repeaters
(non-regenerative) are of special interest when considering the deployment of the
coverage of a mobile communications system in a certain set of situations that
include filling holes in a certain coverage area (including indoor and inside
tunnels), or extending the service area beyond its boundaries. Moreover, repeaters
are expected to play an important role in planning WCDMA systems because they
will also be a cost-effective option to reduce inter-cell interference. Moreover, the
improvement of operation and maintenance capabilities as well as of technologies

2
such as radio over fiber and optical wireless will promote a dense deployment of
these devices.
Unfortunately, since a repeater is not a noiseless device, it modifies the
interference and thermal noise patterns of the donor base station (BS) receiver
(RX). This has and effect on both the coverage of the BS and the capacity. The
noise floor of the donor is increased, and consequently its effective cell area is
shrunk. Obviously this loss is clearly compensated by the coverage area of the
repeaters themselves. However this noise rise has also an important impact on
(W)CDMA systems capacity, as it is shown later.
Although much previous research efforts have been focused on the analysis of
CDMA-based systems ([1]-[3] only to cite a few), not many studies in the
literature analyse the effect of repeaters deployment on CDMA mobile
communication systems [4]-[6]. Moreover, these studies consider simplified
scenarios with the presence of users that belong to a single service class and radio
resource management algorithms are usually not considered when evaluating
networks performance.
This paper derives the analytic expression of the feasibility condition for the
uplink (UL) of a CDMA mobile communications system with repeaters in a
multiservice environment with a general heterogeneous layout. In particular, a
compact closed expression for the admission region is presented, suitable for a
system where the users belong to an arbitrary number of different service classes.
This generic analysis could be used for both the deployment of mobile
communication systems and the implementation of suitable admission control
mechanisms. Moreover, as it is shown later, a tradeoff between capacity and
coverage arises and this is analysed both theoretically and by means of Monte
Carlo simulations. Different parameters are shown to have a major impact and
their adjustment is discussed.
Thus, the organization of the paper is as follows. After this introduction,
section 2 deals with the impact of repeaters on admission control. This is done
along two subsections and in a comparative way with environments without
repeaters. Section 3 presents simulations and studies the tradeoff between capacity
and coverage. Finally, section 4 closes the paper with the conclusions of the work.

3
2. Admission Control in UMTS Systems
2.1. Admission Control in Environments without Repeaters
Admission Control (AC) is a key Radio Resource Management strategy in
WCDMA systems. Since coverage and capacity are tightly coupled, a method that
handles all new incoming traffic is mandatory. AC strategies decide whether a
new radio access bearer (RAB) can be admitted or not according to a certain
estimation of the current load. If the load stays below a certain threshold the new
RAB will be allowed.
The parameter η(m) defined in (1) represents the load factor in the UL
measured at BS m. It is directly related with the noise rise due to interference
levels [7]. Note that the summations are calculated over the MTs connected to BS
m, this is indicated by ‘i ∈ m’¸ being i the summation index.
[ ]
[ ]
1
1
11
1 ( ) ( , )( , )
( )( , ) ( ) 1 ( ) ( , ) ( )
MT
MT
MT MT
NN
RXiRXi mi
N N
RX B RX Biii m
f m P m iP m i
mP m i n m f m P m i n m
η=∈=
==∈
+
= =+ + +
∑∑
∑ ∑ (1)
Where:
NMT: Number of mobile terminals (MT) in the system.
nB(m): Thermal noise power at BS m.
f(m): Quotient between intercell and intracell power, measured at BS m.
PRX(m,i): Power received at BS m from MT i.
On the other hand, in WCDMA systems, the power control algorithm is
composed by the so called inner and outer loops. Whereas the 1st one aims at
adjusting the transmitted powers so that a certain signal to interference plus noise
ratio γ(k) target is reached, the 2nd one intends to keep the quality of
communications at a desired level in terms of block error rate. The expression for
γ(k) measured in the UL before de-spreading is given by (2).
[ ]
[ ]{ } [ ] [ ] [ ]1( )
( ),( )
1 ( ) ( ), ( ), ( )MT
RXN
RX RX Bi
i s k
P s k kk
f s k P s k i P s k k n s kγ
=∈
=+ − +∑
(2)

4
Where:
s(k): BS that is serving the MT k. Primary station that has a connection with k.
On the other hand, and in order to simplify subsequent expressions, we define
the parameter φ(k) as γ(k)/[1+ γ(k)], that is the signal to signal-plus-interference-
plus-noise ratio (3).
[ ]
[ ]{ } [ ] [ ]1( )
( ),( )( )1 ( ) 1 ( ) ( ), ( )
MT
RXN
RX Bi
i s k
P s k kkkk f s k P s k i n s k
γφγ
=∈
≡ =+
+ +∑ (3)
Then, after combining (1) and (3), (4) is obtained, which establishes a
relationship between the load factor at BS m, η(m), and the summation of all the φ
targets of those users connected with BS m.
[ ]1
( ) 1 ( ) ( )MTN
ii m
m f m iη φ=∈
= + ∑ (4)
In order to simplify the expression, we define the ASSIR(m), Aggregated Signal
to Signal-plus-Interference-plus-noise ratio:
1( ) ( )
MTN
ii m
ASSIR m iφ=∈
≡ ∑ (5)
And thus, (4) can be simplified and re-written as follows:
[ ]( ) 1 ( ) ( )m f m ASSIR mη = + ⋅ (6)
The expression in (6) has to be always lower than the maximum allowed load
factor ηmax, so that interference levels are kept sufficiently low and connections
are not degraded. That means the condition in (7) has to be accomplished by all
the cells in the system.
( )1 ( )
maxASSIR mf m
η≤
+ (7)
This condition states how many users of each type can be admitted without
exceeding the maximum allowed load in the cell, or rather it defines an admission
region. Note that the expression is general and independent on the type of service
the users are using.

5
2.2. Admission Control in Environments with Repeaters
Subsequently, a general deployment with the presence of repeaters in a
multiservice scenario is considered. An analytical solution of the feasibility
condition for the UL of a CDMA system is derived and compared with that in
subsection 2.1.
As it was previously pointed, repeaters are not noiseless devices, a certain
noise rise appears whenever new equipment is installed. Consequently, some
changes must be introduced in the previous expressions. Particularly, φ(k)
becomes (8).
[ ]
[ ]{ } [ ] [ ] [ ][ ]( )
1 1( )
( ),( )
1 ( ) ( ), ( ) , ( )RMT
RXN s kN
RX B R gi r
i s k
P s k kk
f s k P s k i n s k n G r s kφ
= =∈
=+ + +∑ ∑
(8)
Where:
NR(m): Number of repeaters connected to BS m.
nR: Thermal noise power at the repeaters.
Gg(r,m) Global Gain, this is the absolute gain between the repeater and its
donor BS (denoted by m). Note, however, that s(k) appears in (8)
because we are not talking about a generic BS m, but the one that is
serving the MT k. This gain considers:
The internal gain of the repeater itself.
The gain of the transmitter of the repeater in the link with the BS.
The gain of the RX of the BS in this link.
The absolute loss in the link between the BS and the repeater.
Note that, in order to avoid amplifiers saturation at the repeaters, the maximum
possible value for Gg(r,m) is the quotient between the repeater maximum
transmission power PR,max(r) and the BS maximum transmission power PBS,max(m).
Also note that if m is not the donor BS of the repeater r, then Gg(r,m)=0.
( ) P ( ) ( , )R,max BS,max gP r m G r m≥ ⋅ (9)
Because of the introduction of an extra noise power, the load factor must be
also redefined (10). Moreover, in order to compare with environments without
repeaters, the number of users has been maintained to NMT. It is irrelevant if they
have established their connection through the donor BS or one of its repeaters, the
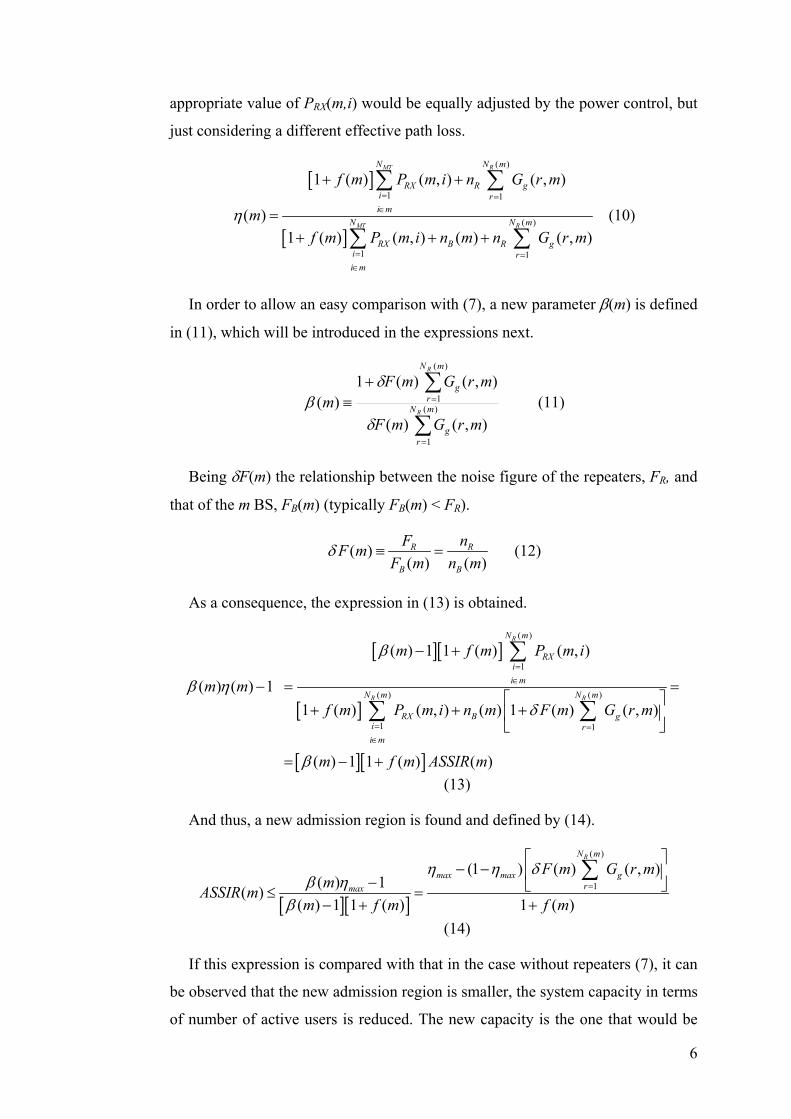
6
appropriate value of PRX(m,i) would be equally adjusted by the power control, but
just considering a different effective path loss.
[ ]
[ ]
( )
1 1
( )
1 1
1 ( ) ( , ) ( , )
( )1 ( ) ( , ) ( ) ( , )
MT R
MT R
N N m
RX R gi ri m
N N m
RX B R gi ri m
f m P m i n G r m
mf m P m i n m n G r m
η= =∈
= =∈
+ +
=+ + +
∑ ∑
∑ ∑ (10)
In order to allow an easy comparison with (7), a new parameter β(m) is defined
in (11), which will be introduced in the expressions next.
∑
∑
=
=
+≡ )(
1
)(
1
),()(
),()(1)( mN
rg
mN
rg
R
R
mrGmF
mrGmFm
δ
δβ (11)
Being δF(m) the relationship between the noise figure of the repeaters, FR, and
that of the m BS, FB(m) (typically FB(m) < FR).
( )( ) ( )R R
B B
F nF mF m n m
δ ≡ = (12)
As a consequence, the expression in (13) is obtained.
[ ][ ]
[ ]
[ ][ ]
( )
1
( ) ( )
1 1
( ) 1 1 ( ) ( , )
( ) ( ) 11 ( ) ( , ) ( ) 1 ( ) ( , )
( ) 1 1 ( ) ( )
R
R R
N m
RXii m
N m N m
RX B gi ri m
m f m P m i
m mf m P m i n m F m G r m
m f m ASSIR m
β
β ηδ
β
=∈
= =∈
− +
− = =
+ + +
= − +
∑
∑ ∑
(13)
And thus, a new admission region is found and defined by (14).
[ ][ ]
( )
1
(1 ) ( ) ( , )( ) 1( )
( ) 1 1 ( ) 1 ( )
RN m
max max grmax
F m G r mmASSIR m
m f m f m
η η δβ η
β=
− − − ≤ =
− + +
∑
(14)
If this expression is compared with that in the case without repeaters (7), it can
be observed that the new admission region is smaller, the system capacity in terms
of number of active users is reduced. The new capacity is the one that would be

7
obtained in a network without repeaters but imposing a lower ηmax. This effect is
extended and analysed by means of theoretical figures and simulations later on but
it is clear that planning a WCDMA network with repeaters will not be such
straightforward as in classical 2G FDMA/TDMA networks.
Thus, when considering the presence of repeaters, a new parameter ξ(m),
depending on the admission control threshold ηmax, can be defined (15).
( )
1( ) (1 ) ( ) ( , )
RN m
max max gr
m F m G r mξ η η δ=
≡ − −
∑ (15)
And therefore the definition of the admission region can be re-written as
follows:
( )( )1 ( )
mASSIR mf m
ξ≤
+ (16)
Where ξ (m) represents the equivalent ηmax that should be imposed at the BS m
in an environment without repeaters to obtain the same new admission region. It
can be seen that the capacity reduction depends on the extra level of noise that is
measured at the donor. The higher the number of installed repeaters, their noise
figure or the global gain term, the smaller the admission region becomes. Note as
well, that this degradation also depends on the maximum allowable load factor,
for higher thresholds, the reduction is smaller, unfortunately this is a rather fixed
design parameter.
Nevertheless, the conclusions in the previous paragraph are straightforward as
long as the relationship between the intra and the intercell power f(m) is
maintained after installing repeaters. This is accomplished, for example, by those
situations in which repeaters are ‘isolated’ from the rest of the system, for instance
when covering a tunnel or inside a building with high propagation losses. On the
other hand, there are other situations in which the installation of these devices
modifies f(m). In these cases, the analytical expression of the admission region is
identical but substituting f(m) by the new value, ϕ(m). The impact of ϕ(m) on the
new admission region should be evaluated for each particular scenario. For
example, repeaters could transmit more intercell power to the donor BS and
decrease even more the admission region.
Figure 1 shows some different examples of the facts that have been discussed
(f(m) is not modified after installing the repeaters). Indeed, the admission regions

8
are plotted in a particular case of 3 different types of services and values of ηmax.
Note that each axis represents one of the first three services in table 1, depicted
later with other simulation conditions. The darker graph represents those possible
combinations of types of users that would not exceed a load threshold of 0.8. On
the other hand, the gains are set so that Gg is equal to 0 dB and the repeaters noise
factor is considered to be the same as the donor BS. It can be seen that if one
repeater is installed, the number of users would be drastically reduced. Under
these assumptions, the number of accepted users would be equal to a situation
without repeaters in which the maximum allowable load ξ is 0.6. If a second
repeater is introduced, the equivalent maximum load ξ would be 0.4. Finally, the
installation of four repeaters would imply such a noise rise that no users could be
admitted in the cell. The degradation of capacity induced by the installation of
repeaters is clear. Moreover, it is interesting that thanks to the definition of ξ,
there is an easy way to quantify the reduction and compare the network
performance before and after installing repeaters.
Figure 2, can also help to the analysis of the plotted admission regions since it
shows the maximum allowed load factor and the different equivalent loads ξ that
would be obtained for different total received power at the BS. These curves allow
an easy comparison of four situations, ranging from 1 to 4 repeaters, all of them
with adjusted internal gains so that Gg is 0 dB. It can be seen that the higher the
maximum allowed power at the RX, the smaller the differences between ηmax and
the equivalent loads. Also, it can be seen those combinations of ηmax and number
of repeaters which would imply that no users can access the cell, for example,
when three repeaters are installed and ηmax must be below 0.75, or installing four
repeaters and imposing ηmax ≤ 0.8. Finally, just note that these curves would be
scaled by the term (1+f)/(1+ϕ) if the f factor was modified after installing the
repeater, see equation (16).
3. Capacity and Coverage Tradeoff in WCDMA Systems with Repeaters.
From the previous expressions, it can be stated that:
0 0 0lim ( ) ; lim ( ) ; lim ( )
gmax max maxG r F
m m mδ
ξ η ξ η ξ η→ → →
= = = (17)
9
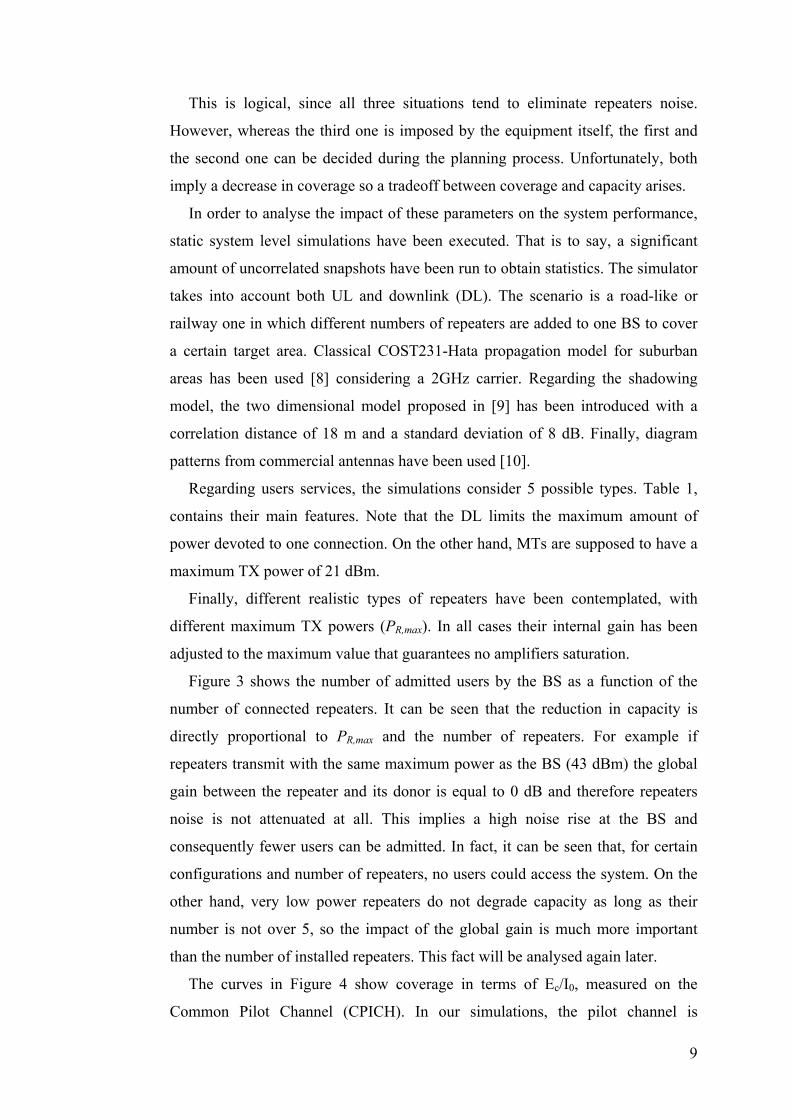
This is logical, since all three situations tend to eliminate repeaters noise.
However, whereas the third one is imposed by the equipment itself, the first and
the second one can be decided during the planning process. Unfortunately, both
imply a decrease in coverage so a tradeoff between coverage and capacity arises.
In order to analyse the impact of these parameters on the system performance,
static system level simulations have been executed. That is to say, a significant
amount of uncorrelated snapshots have been run to obtain statistics. The simulator
takes into account both UL and downlink (DL). The scenario is a road-like or
railway one in which different numbers of repeaters are added to one BS to cover
a certain target area. Classical COST231-Hata propagation model for suburban
areas has been used [8] considering a 2GHz carrier. Regarding the shadowing
model, the two dimensional model proposed in [9] has been introduced with a
correlation distance of 18 m and a standard deviation of 8 dB. Finally, diagram
patterns from commercial antennas have been used [10].
Regarding users services, the simulations consider 5 possible types. Table 1,
contains their main features. Note that the DL limits the maximum amount of
power devoted to one connection. On the other hand, MTs are supposed to have a
maximum TX power of 21 dBm.
Finally, different realistic types of repeaters have been contemplated, with
different maximum TX powers (PR,max). In all cases their internal gain has been
adjusted to the maximum value that guarantees no amplifiers saturation.
Figure 3 shows the number of admitted users by the BS as a function of the
number of connected repeaters. It can be seen that the reduction in capacity is
directly proportional to PR,max and the number of repeaters. For example if
repeaters transmit with the same maximum power as the BS (43 dBm) the global
gain between the repeater and its donor is equal to 0 dB and therefore repeaters
noise is not attenuated at all. This implies a high noise rise at the BS and
consequently fewer users can be admitted. In fact, it can be seen that, for certain
configurations and number of repeaters, no users could access the system. On the
other hand, very low power repeaters do not degrade capacity as long as their
number is not over 5, so the impact of the global gain is much more important
than the number of installed repeaters. This fact will be analysed again later.
The curves in Figure 4 show coverage in terms of Ec/I0, measured on the
Common Pilot Channel (CPICH). In our simulations, the pilot channel is

10
realistically introduced according to UMTS networks. The CPICH allows the MT
to execute the cell selection and soft handover procedures [12] and therefore a
correct reception is mandatory in the target area of coverage. If the Ec/I0 measured
on the pilot channel at one pixel is over -12 dB with a probability higher than
95%, then that position is considered to be correctly covered in terms of CPICH.
The figure shows a clear tradeoff, since those situations with higher capacity
degradation are the ones with better pilot reception. Nevertheless, low power
repeaters allow clear increases of coverage and with those configurations there
was no significant loss in capacity. Thus, it seems that the tradeoff can be
mitigated by means of many low power repeaters. However, this fact might
obviously jeopardize a third parameter to optimize: the network cost.
Although the Ec/I0 level is usually admitted as a metric of networks
coverage, both UL and DL are limited in power. So CPICH coverage does not
guarantee service availability. In fact, Figure 5 shows the medium power that a
static voice user has to transmit as a function of its distance to the BS. The
black horizontal line shows the maximum available UL TX power. It can be
seen that users would have to commute to a degraded mode from around 3500
m if no repeaters are installed in the scenario. Three situations with four
repeaters are shown too. It can be seen that users would have enough power
until around 11 km with 37 dBm repeaters. With 30 dBm repeaters, some
deadspots would rise in the line between the donor and the last repeater.
Finally, with 15 dBm repeaters, the extra coverage would be very low. Keeping
these facts in mind, Figure 6 shows the probability that a service is available
(that is, CPICH coverage is satisfactory and the power control does not require
more than the maximum power in the UL and in the DL). The figure represents
the values for repeaters with 37 and 15 dBm of PR,max. The notation Si stands
for service i, where i is the row in table 1. It can be seen that the probability
increases monotically with PR,max and the number of repeaters. However, as
expected, both absolute values and increases are quite lower in the 15 dBm
case, which shows modest improvements in the services availability.
The advantage of using low power repeaters can be seen in Figure 7. This
shows those configurations (number of repeaters and PR,max) that would
succeed in covering a certain target area (65% of the scenario) along with the
11
reduction that they would imply in terms of capacity. For example, if a 10%
reduction is tolerated, 4 repeaters with PR,max = 30 dBm could be planned. But
if degradation is desired to be below 2.5%, this configuration would not be
valid whereas six repeaters with PR,max = 20dBm would accomplish the
requisite. The desired coverage could be guaranteed without a noticeable
capacity loss but, as pointed out, with a much more costly solution. Indeed, 12
low power repeaters (PR,max = 15 dBm) would be a valid configuration because
of the high attenuation suffered by the noise.
4. Conclusions
Along this work an analytic expression of the feasibility condition for the UL
of a WCDMA mobile communications system with repeaters has been obtained.
A compact closed and generalist expression for the admission region has been
presented and a new parameter ξ has been defined in order to quantify the
resulting capacity degradation. It has been pointed out that planning WCDMA
networks with repeaters implies a tradeoff between capacity and coverage, that is
why introducing these devices will not be such straight forward as in classical
FDMA/TDMA 2G systems. Repeaters noise figure, the global gain in the link
between each repeater and the donor, and the number of repeaters itself are
parameters with high impact on this tradeoff. The global gain shows an
outstanding influence on capacity and service availability, however, by means of
simulation it has been seen that degradation is not such significant with low power
repeaters. In these situations a high noise rise can be avoided and the tradeoff is
partially controlled. Installation of many repeaters could guarantee both coverage
and capacity as long as their internal gains are adjusted so that the global gain is
low. The cost of the network, however, might invalidate some of the solutions and
certain capacity or coverage reduction could have to be accepted.
References
[1] J. Zander, “Performance of Optimum Transmitter Power Control in Cellular Radio
Systems”, IEEE Trans. on Vehicular Technology, Vol. 41, No. 1, pp. 57–62, Feb. 1992.
[2] S. A. Jafar, A. Goldsmith, “Adaptive Multirate CDMA for Uplink Throughput
Maximization”, IEEE Trans. on Wireless Comm., Vol. 2, No. 2, pp. 218–228, Mar. 2003.

12
[3] A. Baier, U.C. Fiebig, W. Granzow, W. Koch, P. Teder, J. Thielecke, “Design Study for a
CDMA-based Third-generation Mobile Radio System”, IEEE Journal on Selected Areas
in Comm., Vol. 12, pp. 733 –743, May 1994.
[4] W. Lee, D. Lee, “The Impact of Repeaters on CDMA System Performance”, in Proc. of
IEEE Vehicular Technology Conf., 2000 (VTC 2000), Tokyo (Japan), May 15-18, 2000.
[5] M. Rahman, P. Ernstrom, “Repeaters for Hotspot Capacity in DS-CDMA Networks”,
IEEE Trans. on Vehicular Technology, Vol. 53, No. 3, pp. 626 – 633, May 2004.
[6] T.W. Ban, B.Y. Cho, W. Choi, H. Cho, “On the Capacity of a DS-CDMA System with
Automatic On-Off Switching Repeaters”, in Proc. of IEEE International Conf. on Comm.,
2001 (ICC 2001), Helsinki (Finland), June 11-15, 2001.
[7] H. Holma, A. Toskala, WCDMA for UMTS Radio Access for Third Generation Mobile
Communications, Ed. Wiley & Sons, 2nd ed., 2002.
[8] P.E. Mogensen, P. Eggers, C. Jensen and J.B. Andersen, “Urban area radio propagation
measurements at 955 and 1845 MHz for small and microcells”, in Proc. of IEEE Global
Telecomm. Conf., 1991, (GLOBECOM 1991), Phoenix (USA), Dec 2-5, 1991.
[9] R. Fraile, O. Lázaro, N. Cardona, “Two Dimensional Shadowing Model”, COST-273,
Report TD(03)-171, Prague, Czech Rep., Sept 24-26, 2003 (http://www.lx.it.pt/cost273/).
[10] http://www.kathrein.de/
[11] 3GPP Specification. TS 25.133 (Release5) – “Requirement for Support of Radio
Resource Management (FDD)” http://www.3gpp.org/
[12] 3GPP Specification. TR 25.956 (Release4) – “UTRA Repeaters Planning Guidelines and
System Analysis” http://www.3gpp.org/

13
Figure legends and Tables
Figure 1. Correspondence of admission regions with and without repeaters.
Figure 2 ηmax and equivalent loads (ξ) as a function of the total received power at the donor BS
Figure 3. Number of admitter users for different number and types of repeaters
Figure 4 Probability of CPICH coverage in target area
Figure 5. Medium UL transmitted power as a function of the distance to the donor BS
Figure 6. Probability of service availability.
Figure 7. Degradation of capacity when guaranteeing coverage in a 65% of the scenario, for
different number of repeaters and PR,max.
Table 1. Services Features
Type of service UL Eb/N0 (dB)
DL Eb/N0 (dB)
Max DL power (dBm)
Voice – 12.2 kbps 2.9 4.4 21 Voice – 12.2 kbps
(50 km/h) 5.5 7 21
Data – 64 kbps 1 2.5 30 Data – 144 kbps 0.4 2.3 30 Data – 384 kbps 0.6 2.4 30

14
Figures
Figure 1:
ηmax=0.4
(ηmax=0.8, r=Gg=δF=1) ⇒ ξ=0.6ηmax=0.6
ηmax=0.8
(ηmax=0.8, r=2, Gg=δF=1) ⇒ ξ=0.4
ηmax=0.2
Num of users with service 2
Num of userswith service 1
Num
ofus
ersw
ithse
rvic
e3
ηmax=0.4
(ηmax=0.8, r=Gg=δF=1) ⇒ ξ=0.6ηmax=0.6
ηmax=0.8
(ηmax=0.8, r=2, Gg=δF=1) ⇒ ξ=0.4
ηmax=0.2
Num of users with service 2
Num of userswith service 1
Num
ofus
ersw
ithse
rvic
e3
Figure 2:
00.1
0.20.3
0.40.50.6
0.70.8
0.91
... -99 -98 -97 -96 -95 -94 -93 -92 -91 -90 -89
Total received power at the donor BS [dBm]
ηmaxEq ηmax (1 rep)Eq ηmax (2 rep)Eq ηmax (3 rep)Eq ηmax (4 rep)
load
00.1
0.20.3
0.40.50.6
0.70.8
0.91
... -99 -98 -97 -96 -95 -94 -93 -92 -91 -90 -89
Total received power at the donor BS [dBm]
ηmaxEq ηmax (1 rep)Eq ηmax (2 rep)Eq ηmax (3 rep)Eq ηmax (4 rep)
load
Figure 3:
0
10
20
30
40
50
60
70
80
90
100
0 1 2 3 4 5Number of repeaters
Num
ber a
dmitt
ed u
sers
43 dBm40 dBm37 dBm33 dBm30 dBm20 dBm15 dBm

15
Figure 4:
0.35
0.45
0.55
0.65
0.75
0.85
0.95
0 1 2 3 4 5Number of repeaters
Prob
CPI
CH
Cov
erag
e in
targ
et a
rea
43 dBm40 dBm37 dBm33 dBm30 dBm20 dBm15 dBm
Figure 5:
-20
-10
0
10
20
30
40
50
1000 3000 5000 7000 9000 11000
distance to donor BS [m]
med
ium
UE
tx p
ower
[dBm
]
No R4R, 15dBm4R, 30dBm4R, 37dBm
Figure 6:
0.15
0.25
0.35
0.45
0.55
0.65
0.75
0.85
0.95
0 1 2 3 4 5Number of repeaters
Prob
of S
ervi
ce A
vaila
bilit
y
S1, 37 dBm S1, 15 dBmS2, 37 dBm S2, 15 dBmS3, 37 dBm S3, 15 dBmS4, 43 dBm S4, 15 dBmS5, 43 dBm S5, 15 dBm
Different Services,Prep,max=37 dBmPrep,max=15 dBm

16
Figure 7:
0
5
10
15
20
25
30
35
(3,37
)(3,
33)
(4,30
)(5,
30)
(5,25
)(6,
20)
(12,15
)
Configurations (num of repeaters, P rep,max )
Cap
acity
deg
rada
tion
[%]

17
Biographies and author’s photos
MARIO GARCIA-LOZANO ([email protected])
received the Degree in Telecommunications Engineering from the
Technical University of Catalonia (UPC), Spain, in 2001.
Currently, he is working toward the Ph.D. degree in
Telecommunications Engineering. From 1999 to 2002 he was a member of the
technical staff at Retevision, Spain where he worked on the design and
development of LMDS networks. In 2002 he joined the Department of Signal
Theory and Communications at UPC, where he worked as a Research Assistant
until 2003 under a grant from the Catalan Government. He currently lectures at
the Technical School of Castelldefels (UPC). He has actively participated in
several research projects, funded by the European Union, the Spanish and Catalan
Governments and private companies. His research activities are focused in the
field of mobile communication systems, especially radio network planning and
radio resource management issues and optimization of cellular networks.
LUIS ALONSO ([email protected]) received his Ph.D. in
telecommunications engineering from the Technical University of
Catalonia (UPC), Spain, in 2001, where he is Associate Professor in
the Radio Communications Group of the Signal Theory and
Communications Department. He participates in research programs and projects
funded by the European Union and the Spanish Government, and also collaborates
with some telecommunications companies. His current research interests are in
the field of medium access protocols, radio resource management, cross-layer
optimization and QoS features for all kind of wireless communications systems.
FERNANDO J. CASADEVALL ([email protected]) received
the Engineer of Telecommunication and Dr Engineering degrees
from the Universitat Politècnica de Catalunya (UPC), Spain, in 1977
and 1983 respectively. In 1978 he joined UPC, where he was an
Associate Professor from 1983 to 1991. He is currently Full Professor in the
Signal Theory and Communications Department.

18
After graduation he was concerned with equalisation techniques for digital
fibre optic systems. He has also been working in the field of digital
communications with particular emphasis on digital radio and its performance
under multipath propagation conditions. In the last fifteen years, he has mainly
been concerned with the performance analysis and development of digital mobile
radio systems. In particular his research interest include cellular and personal
communication system, multipath transceiver design (including Software Radio
techniques), Mobility and Radio Resources Management, End to end QoS issues.
During the last ten years he participated in more than thirty research-projects
funded by both public and private organizations. In particular, he actively
participated in ten research projects founded by the European Commission, being
the Project Manager of three of them: ARROWS, EVEREST and AROMA. (see
http://www.gcr.tsc.upc.edu for details)
Prof. Casadevall has published around one hundred of technical papers in both
International Conferences and Magazines; most of them correspond to IEEE
publications. He has also been Technical Program Committee member of different
international IEEE supported conferences as well as reviewer of several IEEE
magazines.
From October 1992 to January 1996 was the responsible for the Information
Technology Area in the National Agency for Evaluation and Forecasting (Spanish
Nation Research Council).
SILVIA RUIZ ([email protected]) received the Engineer and
Doctor Engineer degrees in Telecommunication from the Technical
University of Catalonia (UPC), Spain, in 1986 and 1989
respectively. He joined the Signal Theory and Communications
department becoming Associate Professor in 1992. She has participated in several
UE projects, COST actions and Network of Excellence, as well as in projects
funded by the Spanish government and private projects (Alcatel, Vodafone.
Telefónica Móviles, etc.) She has also strongly collaborated in university
management issues and has been Vice-Dean of Academic Affairs for three years,
and Assistant Director of External Relations of the Technical School of
Castelldefels since December 2005 (UPC). Her research interests are in the field

19
of mobile communication systems, especially radio network planning issues and
optimization of 3G and heterogeneous networks.
Copyright © 2022 FDOKUMEN