Capability Assessment of Australian Dairy Technology and ...
329
Capability Assessment of Australian Dairy Technology and Services ‐ AANC Pty Ltd, July 2010 Page 1 of 329 AUSTRALIAN AGRICULTURAL NUTRITION CONSULTING PTY LTD Capability Assessment of Australian Dairy Technology and Services 1 September, 2010 The Australian Trade Commission (Austrade) has contracted AANC Pty Ltd to undertake a scoping study to determine the potential for the Australian dairy industry to increase its participation in international markets. This exercise will explore the opportunity for participants in the Australian dairy industry supply chain to provide services, technologies, equipment and animals that improve the productive capacity of offshore dairy industries, particularly in emerging markets, in addition to exporting dairy products. 1 Photo curtesy of Lely Australia Pty Ltd www.lely.com Lely Dairy Equipment Catalogue, 2010.
-
Upload
khangminh22 -
Category
Documents
-
view
3 -
download
0
Transcript of Capability Assessment of Australian Dairy Technology and ...
Capability Assessment of Australian Dairy Technology and Services ‐ AANC Pty Ltd, July 2010
Page 1 of 329
AUSTRALIAN AGRICULTURAL NUTRITION CONSULTING PTY LTD
Capability Assessment of Australian Dairy Technology and Services1
September, 2010
The Australian Trade Commission (Austrade) has contracted AANC Pty Ltd to undertake a scoping study to determine the potential for the Australian dairy industry to increase its participation in international markets. This exercise will explore the opportunity for participants in the Australian dairy industry supply chain to provide services, technologies, equipment and animals that improve the productive capacity of offshore dairy industries, particularly in emerging markets, in addition to exporting dairy products.
1 Photo curtesy of Lely Australia Pty Ltd www.lely.com Lely Dairy Equipment Catalogue, 2010.
Capability Assessment of Australian Dairy Technology and Services ‐ AANC Pty Ltd, July 2010
Page 2 of 329
Table of Contents
LIST OF ACRONYMS............................................................................................................................................................. 4
EXECUTIVE SUMMARY....................................................................................................................................................... 5
1. OVERVIEW OF THE AUSTRALIAN DAIRY INDUSTRY ........................................................................................... 9
1.1 Australia’s position as supplier to the global market – where we fit in production and supply................................. 14
Australia’s position in International Dairy Food product markets .................................................................................... 16
Australia’s Live Export Markets for Dairy Cattle ............................................................................................................... 22
Australia’s position in Exported Dairy Technology & Equipment Markets ..................................................................... 32
1.2 Global Recognition – What AUSTRALIAN DAIRY PROFESSIONALS are considered best at ............................. 37
2. MAPPING THE SUPPLY CHAIN.................................................................................................................................... 46
3. CLUSTER APPROACHES................................................................................................................................................ 48
Examples of cluster approaches by services/equipment/technology suppliers................................................................... 48
Potential for further cluster approaches ............................................................................................................................... 49
4. POTENTIAL FOR OUTWARD INVESTMENT BY AUSTRALIAN DAIRY PRODUCT EXPORTERS............... 51
Case studies of Outward Investment by Australian dairy product exporters ................................................................... 52
Potential for further Outward Investment (by market, by supply chain capabilities), including barriers ..................... 53
5. POTENTIAL FOR OUTWARD INVESTMENT BY THE AUSTRALIAN AGRIBUSINESS INVESTOR COMMUNITY (EXCLUDING DAIRY PRODUCT EXPORTERS)................................................................................. 61
Case studies of Outward Investment ..................................................................................................................................... 61
Potential for further Outward Investment (by market, by supply chain capabilities), including barriers. .................... 62
6. GOVERNMENT AGENCIES, TRAINING INSTITUTIONS AND INDUSTRY ASSOCIATIONS ......................... 63
Names, location and contact details required for individual organisations plus description of function and activities. 63
7. POTENTIAL IN NOMINATED OVERSEAS MARKETS ............................................................................................ 70
FINAL RANKING OF NOMINATED COUNTRIES AS POTENTIAL NEW MARKETS FOR AUSTRALIAN DAIRY TECHNOLOGY AND SERVICES ......................................................................................................................... 71
A.) CHINA ............................................................................................................................................................................... 74
B.) RUSSIAN FEDERATION.............................................................................................................................................. 109
C.) THE PHILIPPINES........................................................................................................................................................ 136
D.) BRAZIL ........................................................................................................................................................................... 160
E.) INDIA............................................................................................................................................................................... 179
F.) INDONESIA .................................................................................................................................................................... 200
Capability Assessment of Australian Dairy Technology and Services ‐ AANC Pty Ltd, July 2010
Page 3 of 329
G.) MALAYSIA..................................................................................................................................................................... 219
H.) VIETNAM ....................................................................................................................................................................... 231
I.) PAKISTAN ....................................................................................................................................................................... 249
J.) MEXICO........................................................................................................................................................................... 264
K.) SAUDI ARABIA ............................................................................................................................................................. 279
L.) EGYPT............................................................................................................................................................................. 292
M.) SOUTH AFRICA ........................................................................................................................................................... 307
N.) TURKEY.......................................................................................................................................................................... 322
Capability Assessment of Australian Dairy Technology and Services ‐ AANC Pty Ltd, July 2010
Page 4 of 329
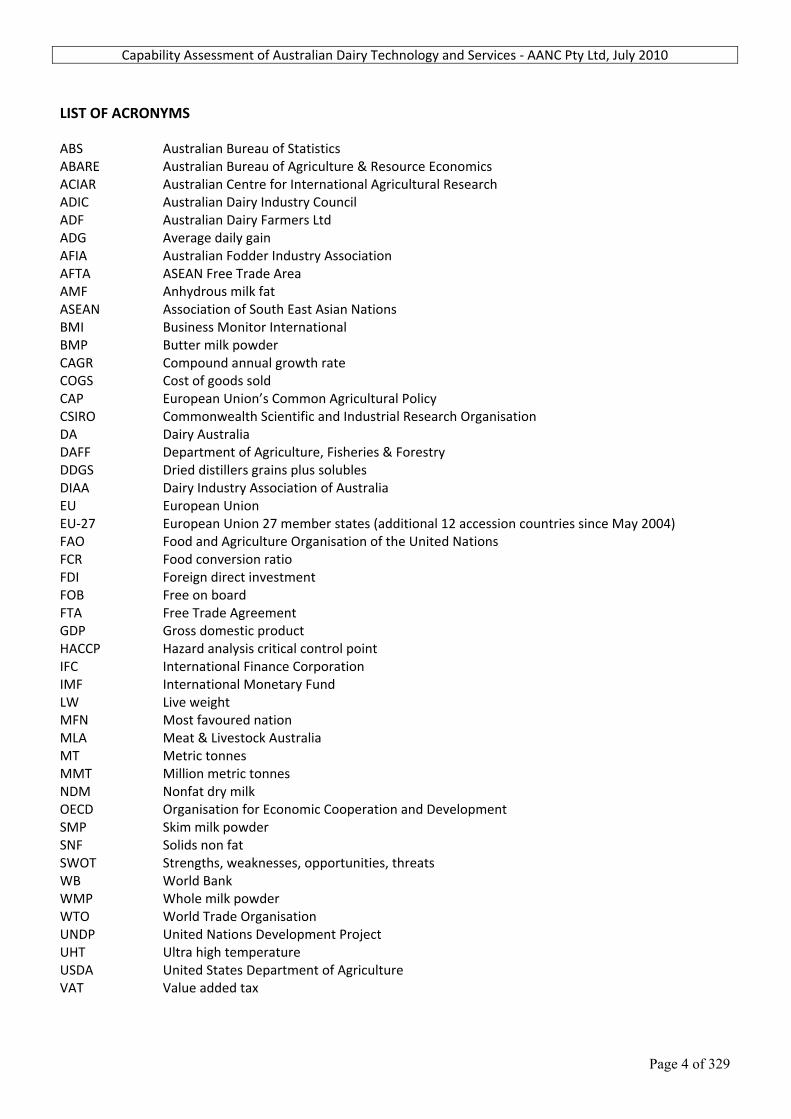
LIST OF ACRONYMS ABS Australian Bureau of Statistics ABARE Australian Bureau of Agriculture & Resource Economics ACIAR Australian Centre for International Agricultural Research ADIC Australian Dairy Industry Council ADF Australian Dairy Farmers Ltd ADG Average daily gain AFIA Australian Fodder Industry Association AFTA ASEAN Free Trade Area AMF Anhydrous milk fat ASEAN Association of South East Asian Nations BMI Business Monitor International BMP Butter milk powder CAGR Compound annual growth rate COGS Cost of goods sold CAP European Union’s Common Agricultural Policy CSIRO Commonwealth Scientific and Industrial Research Organisation DA Dairy Australia DAFF Department of Agriculture, Fisheries & Forestry DDGS Dried distillers grains plus solubles DIAA Dairy Industry Association of Australia EU European Union EU‐27 European Union 27 member states (additional 12 accession countries since May 2004) FAO Food and Agriculture Organisation of the United Nations FCR Food conversion ratio FDI Foreign direct investment FOB Free on board FTA Free Trade Agreement GDP Gross domestic product HACCP Hazard analysis critical control point IFC International Finance Corporation IMF International Monetary Fund LW Live weight MFN Most favoured nation MLA Meat & Livestock Australia MT Metric tonnes MMT Million metric tonnes NDM Nonfat dry milk OECD Organisation for Economic Cooperation and Development SMP Skim milk powder SNF Solids non fat SWOT Strengths, weaknesses, opportunities, threats WB World Bank WMP Whole milk powder WTO World Trade Organisation UNDP United Nations Development Project UHT Ultra high temperature USDA United States Department of Agriculture VAT Value added tax
Capability Assessment of Australian Dairy Technology and Services ‐ AANC Pty Ltd, July 2010
Page 5 of 329
EXECUTIVE SUMMARY Mapping of the Supply Chain for Australia’s Dairy Technology and Services This capability assessment of Australian dairy technology and services, as commissioned by Austrade, began with an overview of the Australian Dairy Industry and a detailed mapping of key participants in the supply chain, as it currently exists within this country. Industry associations, research bodies, Government agencies, academic and technical training institutions were included in this listing, which extended from the dairy farm‐gate level up to manufacturing and retail. This work was presented as spreadsheets in an Excel file, which forms an addendum to this report. Current Status of the Australian Dairy Industry The dairy industry is Australia's third largest rural industry, and is therefore a major economic contributor to many regional communities throughout the country. The industry is also Australia’s largest processed food exporter, and has achieved a ten‐fold growth in exports since the 1980’s. The Australian dairy industry is now one of the world’s most efficient producers of high quality dairy products. According to the industry’s peak body, Dairy Australia, the dairy industry in 2008/09 consisted of approximately 8,000 dairy farms, 1.6 million cows in milk averaging 5,750 litres per cow per year, and a direct employment of more than 60,000 people on farms and in local manufacturing and distribution. Many more downstream jobs and productive investments are created by the economic activity of the industry, with ABARE estimating a regional economic multiplier of 2.5. The industry has a farm‐gate value of $4 billion, and a wholesale value‐added worth of $12 billion. Over two‐thirds of the 9.4 billion litres of milk produced in 2008/09 was produced in Victoria, 10 % in New South Wales and 7 % in Tasmania. Just over half the milk produced in Australia during 2008/09 was consumed by the domestic market, the remainder being exported as either drinking milk or manufactured products. Australia’s key export markets for dairy products in 2008/09 were Japan, Singapore, China and the Philippines. A reduction in dairy farm numbers since deregulation of the industry in the 1990’s has been more than offset by an increase in average herd size and productivity, the effect being that the volume of milk produced by the 8,000 farms in 2009 is over 70 % above the volume produced by the 22,000 farms in 1980. Australia’s global position regarding Milk Production, Live Exports, and Dairy Food Exports In terms of numbers of cows in milk, Australia with 1.6 million falls well short of India (38.5 million) and Brazil (17.6 million), while New Zealand has 4.5 million. Regarding total milk production, Australia’s 9.5 billion litres falls well below the USA’s world leading 85 billion litres, followed by India with 48 billion, while New Zealand produces 17 billion litres per year. However, yields per cow per year in Australia at 5,750 litres compare favourably with many countries including New Zealand (3,800 litres) and Russia (3,470 litres), although they fall well short of the USA on 9,500 and Canada on 8,400 litres. Australia has long held an enviable global position as the world’s largest live exporter of beef and dairy cattle and sheep. Not only can we supply the numbers, but we can also supply the healthiest animals in the world, with an extremely valuable ‘disease free’ status with regards the most serious exotic diseases of livestock, including the greatly feared FMD, BSE and TB. During 2009, Australia live exported nearly 33,000 dairy cattle (mainly pregnant heifers) to China, and over 16,000 head to Indonesia, these numbers far exceeding our main competitor, New Zealand, or any other live exporting country.
Capability Assessment of Australian Dairy Technology and Services ‐ AANC Pty Ltd, July 2010
Page 6 of 329
With regards to dairy food product exports, approximately 45% of total Australian production was exported in 2008/09, with our key markets being SE Asia (worth $890 million), other parts of Asia ($618 million), and Japan ($554 million). On a global basis, Australia’s exports comprise 9% of total world trade in dairy products, with the front runners here being the European Union on 31%, New Zealand 28% and the USA with 10%. Exports of Hay and Dairy Machinery Australia is one of the world’s largest exporters of hay and straw, having peaked in 2005/06 with the shipping of almost 700,000 tonnes of mainly cereal hay (92%) and straw (8%) to mostly Asian countries, with Japan in fact completely dominating the market by taking 85%. South Korea and Taiwan took most of the remainder. Japan uses large volumes of imported hay for its 840,000 dairy cows, which happen to be the world’s second highest producers at 9,350 litres per cow per year, just under the USA. Australia does have a growing export market for ‘Milking Machines and Dairy Machinery’, although with severe competition from traditional manufacturers in Europe, the USA, Canada and Scandinavian countries, our share of world trade was only 0.9% in 2008. China was our main customer for these items. Key areas of Australia’s Dairy Industry Expertise Throughout this study, 14 key areas of Australian dairy industry expertise were identified which would appear to be highly competitive at a global level in terms of the supply of live animals, technologies, equipment, dairy products and/or advisory or consulting services. These areas are summarized below. 1.) Reputation as a premium supplier of whole milk, milk powder, butter, cheese, UHT lines and other dairy
products. 2.) World leaders in the sourcing and live export by ship and air of ‘disease free’ pregnant dairy heifers, with
lesser numbers of mature cows and bulls. 3.) Expertise in soil conservation, efficiency of water useage and proficiency in irrigation management. 4.) Proficiency in pasture & grazing management, weed control, fodder conservation and ruminant nutrition. 5.) Expertise in hay making. 6.) Expertise in livestock genetic research, breed development and reproductive physiology, with particular
specialist experience in tropical environments. 7.) Expertise in electronic animal identification, as well as live animal and food product traceability systems. 8.) Expertise in modern dairy farming techniques, such as semi‐automated dairy cow management systems,
high tech milking machinery and equipment (such as robotic milking machines and transponder‐based feeding systems), modern approaches to internal climate control and effluent management, solar water pumping, GPS laser leveling, electric fencing, web cam and remote scanning telemetry, water bore management, weed control, and natural resource management.
9.) Efficiency of labour usage in dairy farming. 10.) Good knowledge of environmental regulation, including effluent & compost management. 11.) Good knowledge of organic and biodynamic farming systems. 12.) Good knowledge of food safety & hygiene standards, milk processing, UHT methodolgy and shelf‐life
preservation techniques. 13.) High level skills in software development, for farming applications, dairy herd improvement schemes, milk
factory and sales management, inventory control, environmental management, etc. 14.) Highly regarded standards of teaching and higher education.
Composition of future Austrade Trade Missions to Developing Dairy Markets The supply chain mapping exercise performed as a key component of this industry capability assessment can be used as a guide to the composition of future Austrade Trade Missions to foreign developing countries which
Capability Assessment of Australian Dairy Technology and Services ‐ AANC Pty Ltd, July 2010
Page 7 of 329
have expressed an interest in establishing ‘greenfields’ integrated dairy operations. Members of such a trade mission could be individuals drawn from the following specialist categories.
Farm level • Consultants ‐ Dairy Farm design & layout • Consultants ‐ Pastures, Crops & Farm Management • Fencing requirements • Pasture & forage crop seeds • Pasture & forage crop protection • Silage making additives & equipment • Farm sheds, silos, steel yards, etc • Farm merchandise & equipment • Milking machinery, maintenance & testing • Irrigation management, water supply & regulation • Environmental, effluent mgt & regulatory authorities • Live Export Agents • Australian Livestock Export Corporation • Artificial Breeding ‐ AI, embryos, genomic selection • Dairy Breed Societies ‐ Holstein Australia; Jersey Australia • Consultants ‐ Health, Nutrition & Herd Management • (ASSUME ALL FEEDS SOURCED LOCALLY, with micro‐additives imported as required) • Veterinary health products • Veterinary services re health & reproductive management • Herd Management Software
Processing & Manufacturing level • Dairy product manufacturing consultants/trainers • Equipment suppliers • Packaging suppliers • Engineering consultants • Refrigeration/cold chain specialists • Dairy foods sales & marketing consultants
Potential for outward investment by Australian agribusiness and dairy product exporters Key factors for consideration when examining the potential for outward investment into overseas markets by Australian dairy product exporters and other agribusiness investors were discussed as a secondary component of this report. Potential held by 14 nominated Overseas Markets for Australian Dairy Live Animals, Technology and Services Finally, a large desktop study was undertaken into the potential held by 13 overseas markets nominated by Austrade as showing good potential for the Australian dairy industry. Turkey was later added to this list. It was not possible in the time allocated to fully assess all aspects of each of these countries, but worthwhile indicative data was obtained and presented, with the assistance of Austrade Australian and offshore office personnel. Based on various country specific agricultural sector and dairy industry factors, as well as broader country specific economic, business, political, trade history, geographic and cultural factors, a comprehensive matrix was constructed by which all 14 countries were assigned scores for 12 different categories, most of which were based on solid economic data, others on educated subjective estimates by the author following the desktop study. Business Monitor International’s ‘Global Agribusiness Environment Ratings’ formed one of the 12 categories that were ultimately used to produce a final total score for each country. These scores were then ranked to form an ordered listing of countries showing the most potential for Australian exporters of dairy live animals, technology and services. This list is shown below.
Capability Assessment of Australian Dairy Technology and Services ‐ AANC Pty Ltd, July 2010
Page 8 of 329
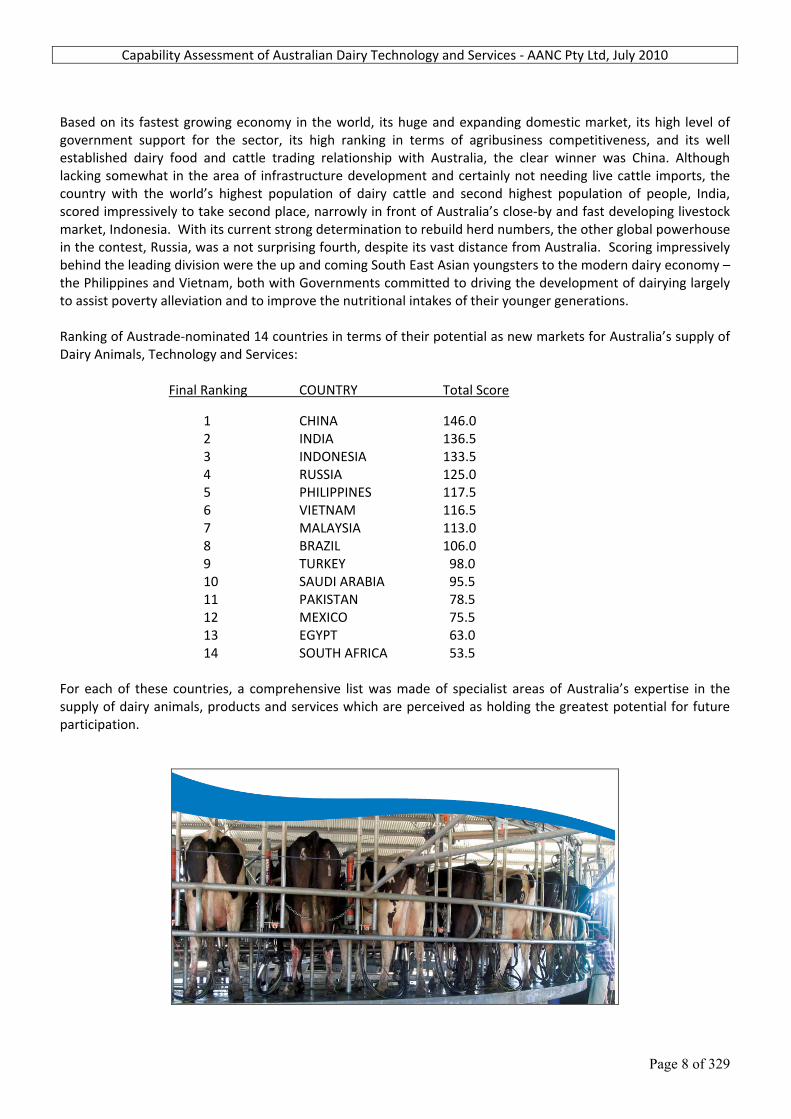
Based on its fastest growing economy in the world, its huge and expanding domestic market, its high level of government support for the sector, its high ranking in terms of agribusiness competitiveness, and its well established dairy food and cattle trading relationship with Australia, the clear winner was China. Although lacking somewhat in the area of infrastructure development and certainly not needing live cattle imports, the country with the world’s highest population of dairy cattle and second highest population of people, India, scored impressively to take second place, narrowly in front of Australia’s close‐by and fast developing livestock market, Indonesia. With its current strong determination to rebuild herd numbers, the other global powerhouse in the contest, Russia, was a not surprising fourth, despite its vast distance from Australia. Scoring impressively behind the leading division were the up and coming South East Asian youngsters to the modern dairy economy – the Philippines and Vietnam, both with Governments committed to driving the development of dairying largely to assist poverty alleviation and to improve the nutritional intakes of their younger generations. Ranking of Austrade‐nominated 14 countries in terms of their potential as new markets for Australia’s supply of Dairy Animals, Technology and Services:
Final Ranking COUNTRY Total Score
1 CHINA 146.0 2 INDIA 136.5 3 INDONESIA 133.5 4 RUSSIA 125.0 5 PHILIPPINES 117.5
6 VIETNAM 116.5 7 MALAYSIA 113.0 8 BRAZIL 106.0 9 TURKEY 98.0 10 SAUDI ARABIA 95.5 11 PAKISTAN 78.5 12 MEXICO 75.5 13 EGYPT 63.0 14 SOUTH AFRICA 53.5
For each of these countries, a comprehensive list was made of specialist areas of Australia’s expertise in the supply of dairy animals, products and services which are perceived as holding the greatest potential for future participation.
Capability Assessment of Australian Dairy Technology and Services ‐ AANC Pty Ltd, July 2010
Page 9 of 329
1. OVERVIEW OF THE AUSTRALIAN DAIRY INDUSTRY o The dairy industry is Australia's third largest rural industry, and is therefore a major economic contributor to
many regional communities throughout the country. o The dairy industry is Australia’s largest processed food exporter. o The dairy industry in Australia is one of the world’s most efficient producers of high quality dairy products. o The dairy industry has achieved a ten‐fold growth in exports since the 1980’s.
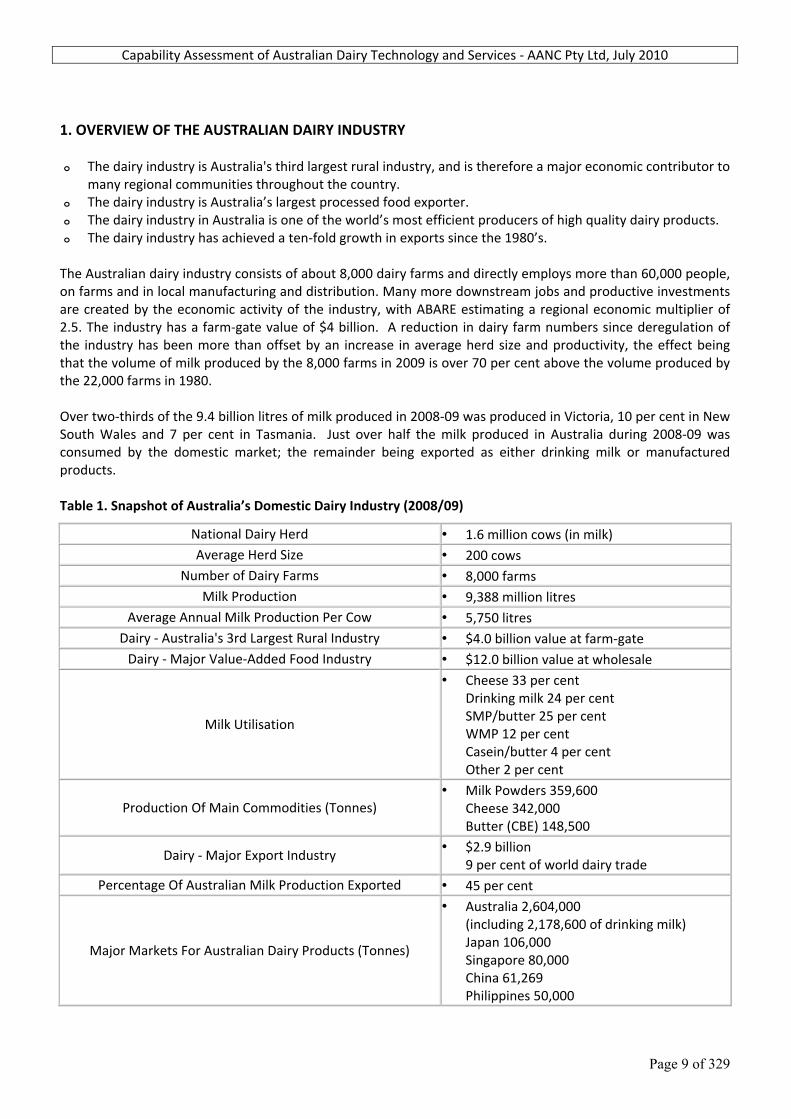
The Australian dairy industry consists of about 8,000 dairy farms and directly employs more than 60,000 people, on farms and in local manufacturing and distribution. Many more downstream jobs and productive investments are created by the economic activity of the industry, with ABARE estimating a regional economic multiplier of 2.5. The industry has a farm‐gate value of $4 billion. A reduction in dairy farm numbers since deregulation of the industry has been more than offset by an increase in average herd size and productivity, the effect being that the volume of milk produced by the 8,000 farms in 2009 is over 70 per cent above the volume produced by the 22,000 farms in 1980. Over two‐thirds of the 9.4 billion litres of milk produced in 2008‐09 was produced in Victoria, 10 per cent in New South Wales and 7 per cent in Tasmania. Just over half the milk produced in Australia during 2008‐09 was consumed by the domestic market; the remainder being exported as either drinking milk or manufactured products. Table 1. Snapshot of Australia’s Domestic Dairy Industry (2008/09)
National Dairy Herd • 1.6 million cows (in milk) Average Herd Size • 200 cows
Number of Dairy Farms • 8,000 farms Milk Production • 9,388 million litres
Average Annual Milk Production Per Cow • 5,750 litres Dairy ‐ Australia's 3rd Largest Rural Industry • $4.0 billion value at farm‐gate
Dairy ‐ Major Value‐Added Food Industry • $12.0 billion value at wholesale
Milk Utilisation
• Cheese 33 per cent Drinking milk 24 per cent SMP/butter 25 per cent WMP 12 per cent Casein/butter 4 per cent Other 2 per cent
Production Of Main Commodities (Tonnes) • Milk Powders 359,600
Cheese 342,000 Butter (CBE) 148,500
Dairy ‐ Major Export Industry • $2.9 billion
9 per cent of world dairy trade Percentage Of Australian Milk Production Exported • 45 per cent
Major Markets For Australian Dairy Products (Tonnes)
• Australia 2,604,000 (including 2,178,600 of drinking milk) Japan 106,000 Singapore 80,000 China 61,269 Philippines 50,000
Capability Assessment of Australian Dairy Technology and Services ‐ AANC Pty Ltd, July 2010
Page 10 of 329
National Dairy Herd • 1.6 million cows (in milk)
Per Capita Consumption • Drinking milk 104 Ltr
Cheese 12 kgs
Dairy Industry Workforce • Direct employment of approximately 40,000
people ABARE estimates a regional economic multiplier of 2.5 from the
dairy industry
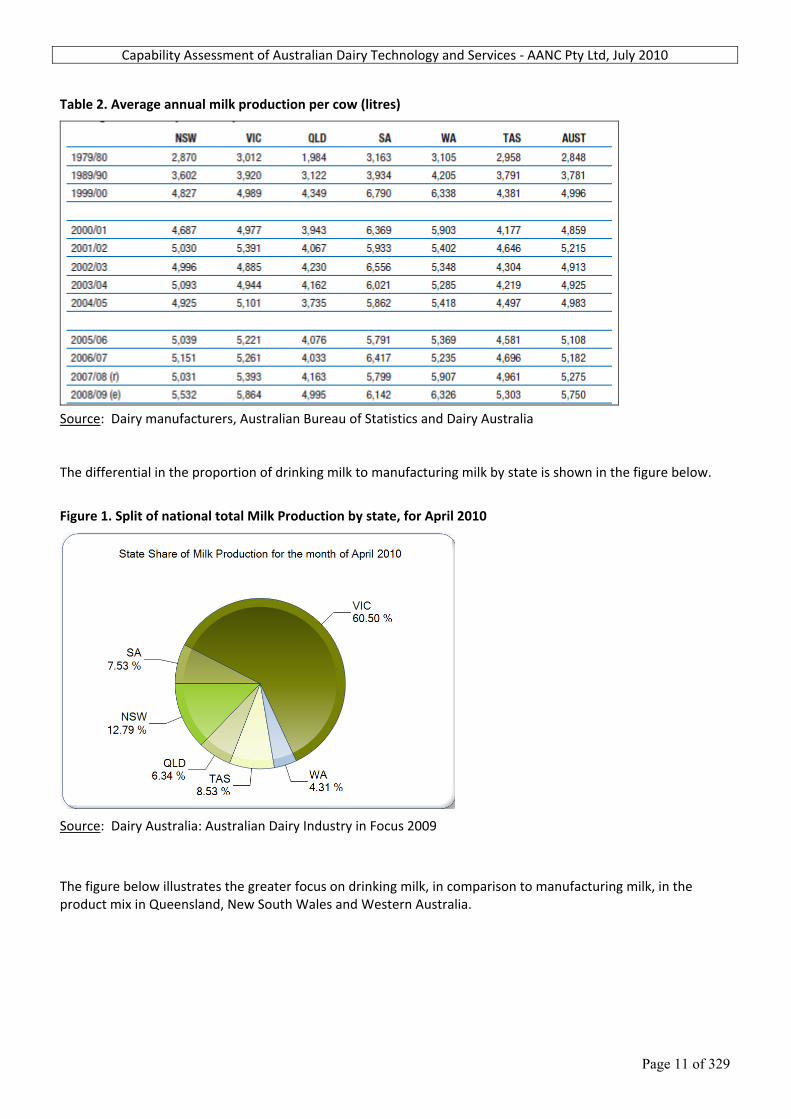
Source: Dairy Australia: Australian Dairy Industry in Focus 2009 Australia’s climate and natural resources are generally favourable to dairying and allow the industry to be predominantly pasture‐based, with approximately 75% of cattle feed requirements coming from grazing years with ‘traditional’ seasonal conditions. This results in efficient, low cost, high‐quality milk production. Most dairy production regions are located in coastal areas, where pasture growth generally depends on natural rainfall. Nevertheless, the inland irrigation schemes in northern Victoria and southern NSW are significant, accounting for around a quarter of national milk production. Feedlot‐based dairying remains the exception in Australia, although the use of supplementary feed – grains, hay and silage – is widespread and has increased significantly in recent seasons as farmers have had to adapt to drier conditions in many dairying regions. According to Dairy Australia’s 2009 National Dairy Farmer Survey, some 93% of dairy farms fed an average of 1.5 tonnes of grain, grain mixes or feed concentrates per cow during the 2008/09 season. Owner‐operated farms dominate the Australian dairy industry. Corporate farms make up just 2% of the total, with share farmers involved in 18% of local farms in 2007/08. The number of dairy farms has halved over the past two decades – to 7,920 in 2009. Falling farm numbers reflect a long‐term trend observed in agriculture around the world, as reduced price support and changing business practices have encouraged a shift to larger, more efficient operating systems. The average herd size has increased from 85 cows in 1980 to over 200 in 2008/09. The dominant dairy breed in Australia is the Holstein Friesian, accounting for approximately 67% of all dairy cattle, followed by the Jersey at more than 10% and then the Holstein/Jersey cross. More than 85% of dairy farmers use artificial insemination and access some of the best genetic material in the world. Improvements in herd genetics, pasture management practices and supplementary feeding regimes have seen the average yield per cow increase from 2,850 litres a year to around 5,750 litres over the past three decades. Table 2 below details the increase in productivity per cow on a state by state basis since 1980. However, in trying to ascertain the most productive dairying regions, figures such as those below are confusing in that the level of grain, concentrate, hay or silage supplementation of cows is not indicated, nor the quality of pasture on offer each year – as determined largely by seasonal rainfall. In general, productivity has increased similarly across all six states. Figure 1 below illustrates quite dramatically how the large bulk of milk produced in Australia is now produced in Victoria, with that state currently producing over 60 % of the nation’s total. The reason for this is largely due to the more favourable climatic and pastoral conditions for Holstein Friesian dominated dairy herds in the cooler, temperate pasture regions of the lower south eastern corner of the country. Victoria also has extensive grain and hay producing areas, plus advanced cold chain milk collection and processing infrastructure, together with a vast array of dairy support industries and services.
Capability Assessment of Australian Dairy Technology and Services ‐ AANC Pty Ltd, July 2010
Page 11 of 329
Table 2. Average annual milk production per cow (litres)
Source: Dairy manufacturers, Australian Bureau of Statistics and Dairy Australia The differential in the proportion of drinking milk to manufacturing milk by state is shown in the figure below.
Figure 1. Split of national total Milk Production by state, for April 2010
Source: Dairy Australia: Australian Dairy Industry in Focus 2009
The figure below illustrates the greater focus on drinking milk, in comparison to manufacturing milk, in the product mix in Queensland, New South Wales and Western Australia.

Capability Assessment of Australian Dairy Technology and Services ‐ AANC Pty Ltd, July 2010
Page 12 of 329
Figure 2. Drinking Milk vs Manufacturing Milk split by state, 2008/09
Source: Dairy Australia: Australian Dairy Industry in Focus 2009 The Australian dairy manufacturing sector is quite diverse and includes farmer‐owned co‐operatives, public, private and multi‐national companies. Co‐operatives no longer dominate the industry and now account for approximately 40% of Australia’s milk production. The largest is Murray Goulburn, accounting for some 37% of national milk output. Major multi‐national dairy companies have operated in the Australian dairy industry for many years and currently include Fonterra, National Foods and Parmalat. The former Bonlac cooperative is now owned by Fonterra, and the Dairy Farmers Group has been acquired by National Foods. Fonterra (20 %),together with Murray Goulburn (the largest remaining farmer owned cooperative, supplying 37 % of Australia's milk) are the prominent market players in the manufacturing milk market, as shown in Figure 3. Figure 3. Market share of total Milk volume by Australian manufacturers, 2008/09
Manufacturer's Share of Total Milk Volume, May 2010
United DP, 2%
Parmalat, 6%
Tatura, 3%
Warrnambool, 8%
National Foods, 15%
Fonterra, 20%
Murray Goulburn, 37%
Others, 8%
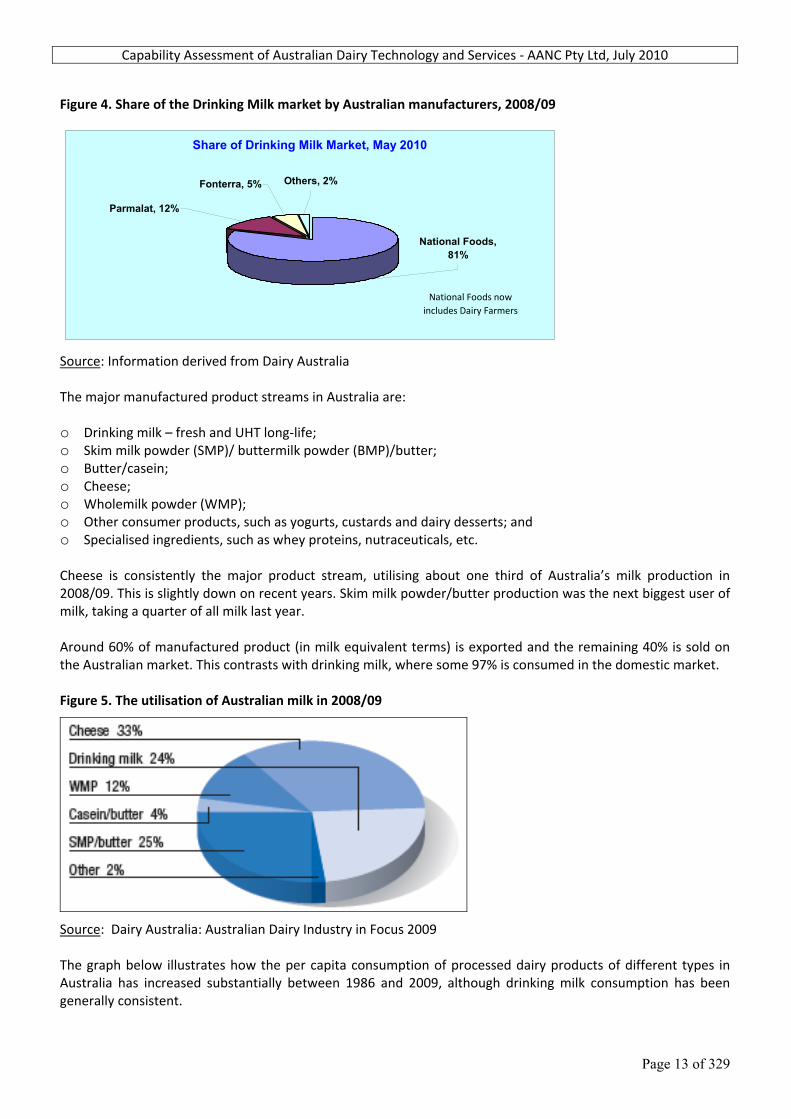
Source: Information derived from Dairy Australia The remaining milk produced in Australia is sold into the domestic drinking milk market which, like the manufacturing milk market, is dominated by two players – National Foods and Parmalat, as shown in Figure 4.
Capability Assessment of Australian Dairy Technology and Services ‐ AANC Pty Ltd, July 2010
Page 13 of 329
Figure 4. Share of the Drinking Milk market by Australian manufacturers, 2008/09
Share of Drinking Milk Market, May 2010
Parmalat, 12%
Fonterra, 5% Others, 2%
National Foods, 81%
National Foods now includes Dairy Farmers
Source: Information derived from Dairy Australia The major manufactured product streams in Australia are: o Drinking milk – fresh and UHT long‐life; o Skim milk powder (SMP)/ buttermilk powder (BMP)/butter; o Butter/casein; o Cheese; o Wholemilk powder (WMP); o Other consumer products, such as yogurts, custards and dairy desserts; and o Specialised ingredients, such as whey proteins, nutraceuticals, etc. Cheese is consistently the major product stream, utilising about one third of Australia’s milk production in 2008/09. This is slightly down on recent years. Skim milk powder/butter production was the next biggest user of milk, taking a quarter of all milk last year. Around 60% of manufactured product (in milk equivalent terms) is exported and the remaining 40% is sold on the Australian market. This contrasts with drinking milk, where some 97% is consumed in the domestic market. Figure 5. The utilisation of Australian milk in 2008/09
Source: Dairy Australia: Australian Dairy Industry in Focus 2009 The graph below illustrates how the per capita consumption of processed dairy products of different types in Australia has increased substantially between 1986 and 2009, although drinking milk consumption has been generally consistent.
Capability Assessment of Australian Dairy Technology and Services ‐ AANC Pty Ltd, July 2010
Page 14 of 329
Figure 6. Per capita consumption of dairy products in Australia (litres or kg per head per year)
Source: Dairy Australia: Australian Dairy Industry in Focus 2009
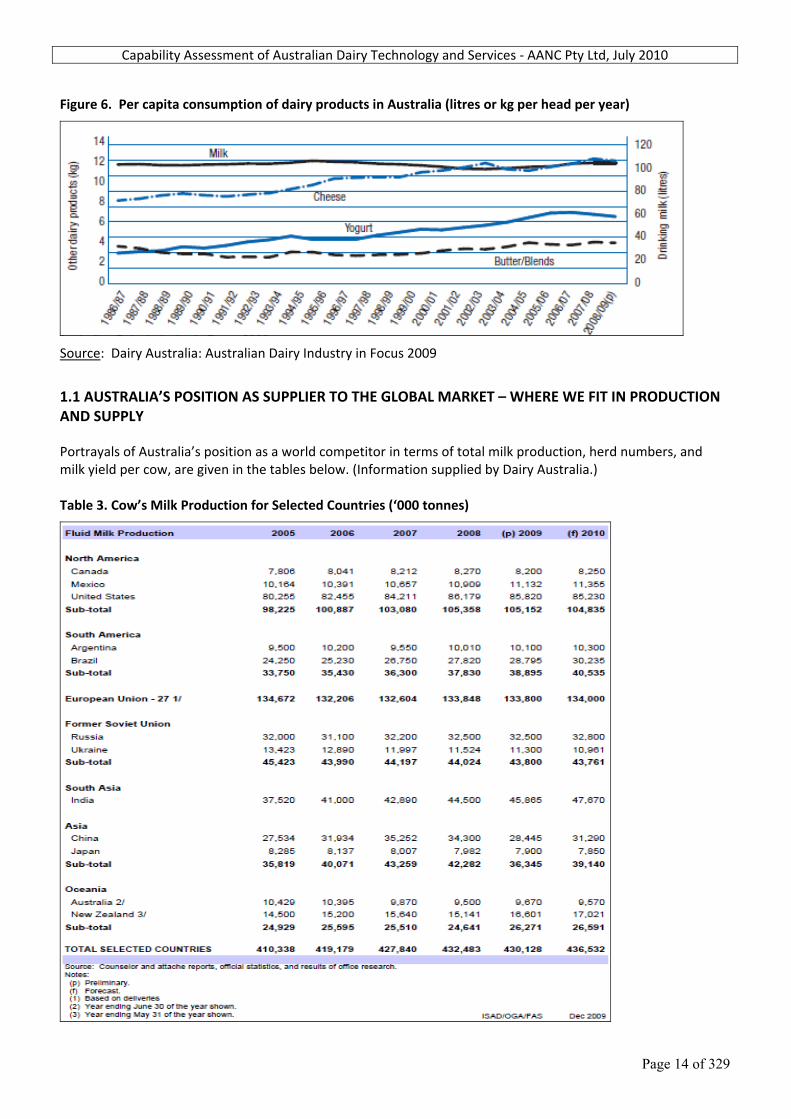
1.1 AUSTRALIA’S POSITION AS SUPPLIER TO THE GLOBAL MARKET – WHERE WE FIT IN PRODUCTION AND SUPPLY Portrayals of Australia’s position as a world competitor in terms of total milk production, herd numbers, and milk yield per cow, are given in the tables below. (Information supplied by Dairy Australia.) Table 3. Cow’s Milk Production for Selected Countries (‘000 tonnes)

Capability Assessment of Australian Dairy Technology and Services ‐ AANC Pty Ltd, July 2010
Page 15 of 329
From the above, it is apparent that according to 2010 forecasts, the world’s leading milk producers are currently: 1.) The expanded EU, 2.) The USA, 3.) India, 4.) Russia, 5.) China, 6.) Brazil. It is worth noting that New Zealand is forecast to produce almost twice the milk volume of Australia in 2010. The table below highlights that New Zealand has roughly three times the number of dairy cows as has Australia. It also shows the huge numbers of cows in India and Brazil, relative to their total production levels, which is explained by their generally low outputs per cow, commonly due to poor nutrition levels and the fact that calves are often reared on these cows whilst being milked. Table 4. Cow Numbers (cows in milk) for Selected Countries (‘000 head)
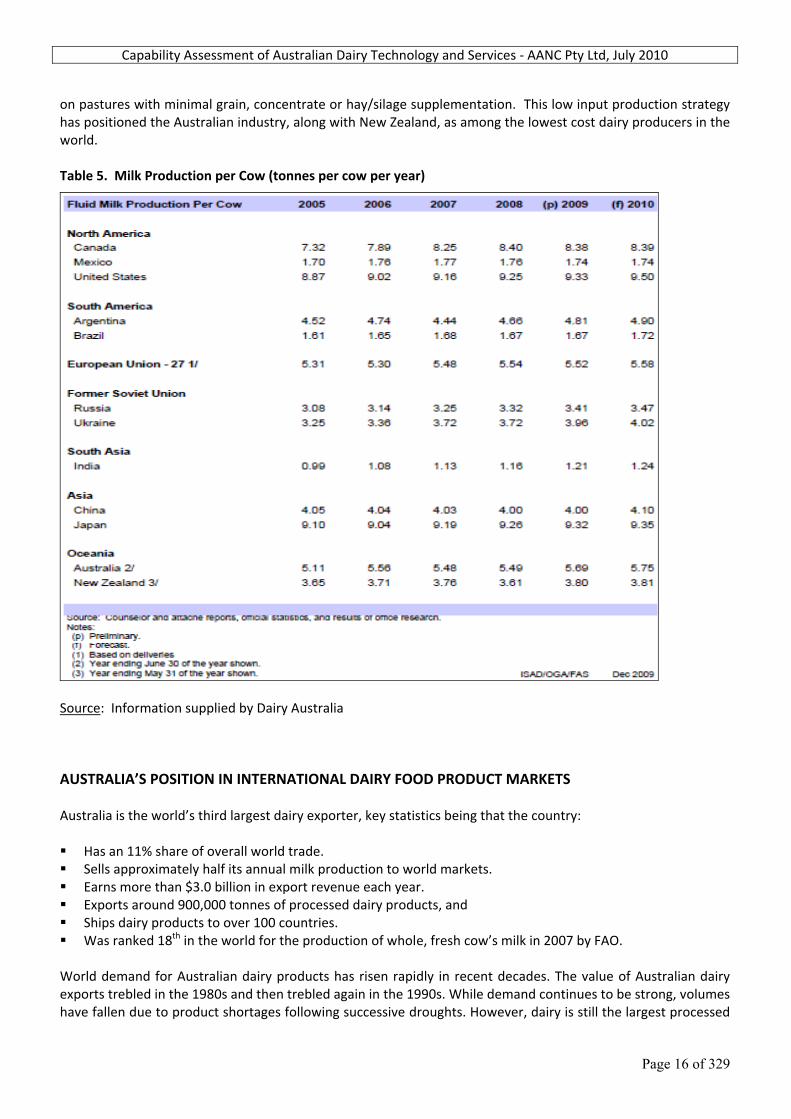
Source: Information supplied by Dairy Australia Milk production per cow is shown in Table 5 below, but from this data, the Australian dairy herd appears to have a lower level of production than the US herd ‐ typically 5,000 to 6,000 litres per 300 day lactation compared to a US level of 8,000 to 10,000 litres. However, this is because most cows in Australia, unlike in the US, are grazed
Capability Assessment of Australian Dairy Technology and Services ‐ AANC Pty Ltd, July 2010
Page 16 of 329
on pastures with minimal grain, concentrate or hay/silage supplementation. This low input production strategy has positioned the Australian industry, along with New Zealand, as among the lowest cost dairy producers in the world. Table 5. Milk Production per Cow (tonnes per cow per year)
Source: Information supplied by Dairy Australia
AUSTRALIA’S POSITION IN INTERNATIONAL DAIRY FOOD PRODUCT MARKETS Australia is the world’s third largest dairy exporter, key statistics being that the country: Has an 11% share of overall world trade. Sells approximately half its annual milk production to world markets. Earns more than $3.0 billion in export revenue each year. Exports around 900,000 tonnes of processed dairy products, and Ships dairy products to over 100 countries. Was ranked 18th in the world for the production of whole, fresh cow’s milk in 2007 by FAO.
World demand for Australian dairy products has risen rapidly in recent decades. The value of Australian dairy exports trebled in the 1980s and then trebled again in the 1990s. While demand continues to be strong, volumes have fallen due to product shortages following successive droughts. However, dairy is still the largest processed
Capability Assessment of Australian Dairy Technology and Services ‐ AANC Pty Ltd, July 2010
Page 17 of 329
food exporter in Australia, and there is significant potential for further expansion with a return to normal seasons, with Australian dairy producers being amongst the most efficient in the world.
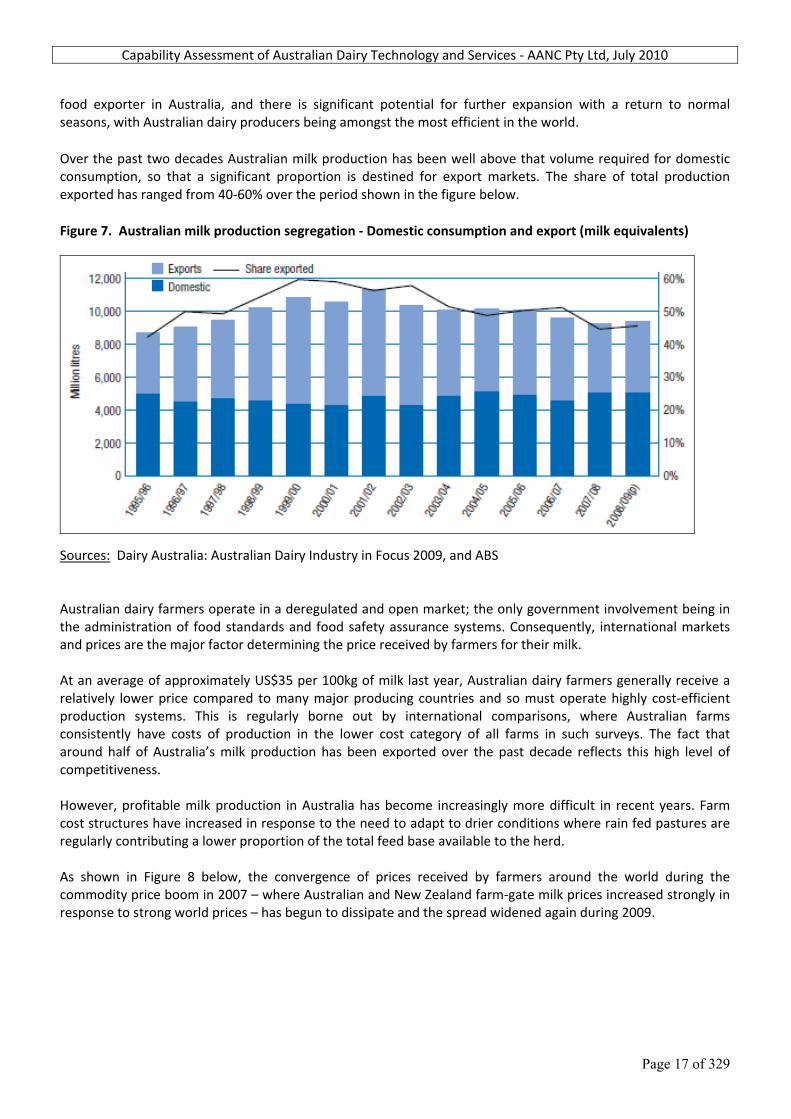
Over the past two decades Australian milk production has been well above that volume required for domestic consumption, so that a significant proportion is destined for export markets. The share of total production exported has ranged from 40‐60% over the period shown in the figure below.
Figure 7. Australian milk production segregation ‐ Domestic consumption and export (milk equivalents)
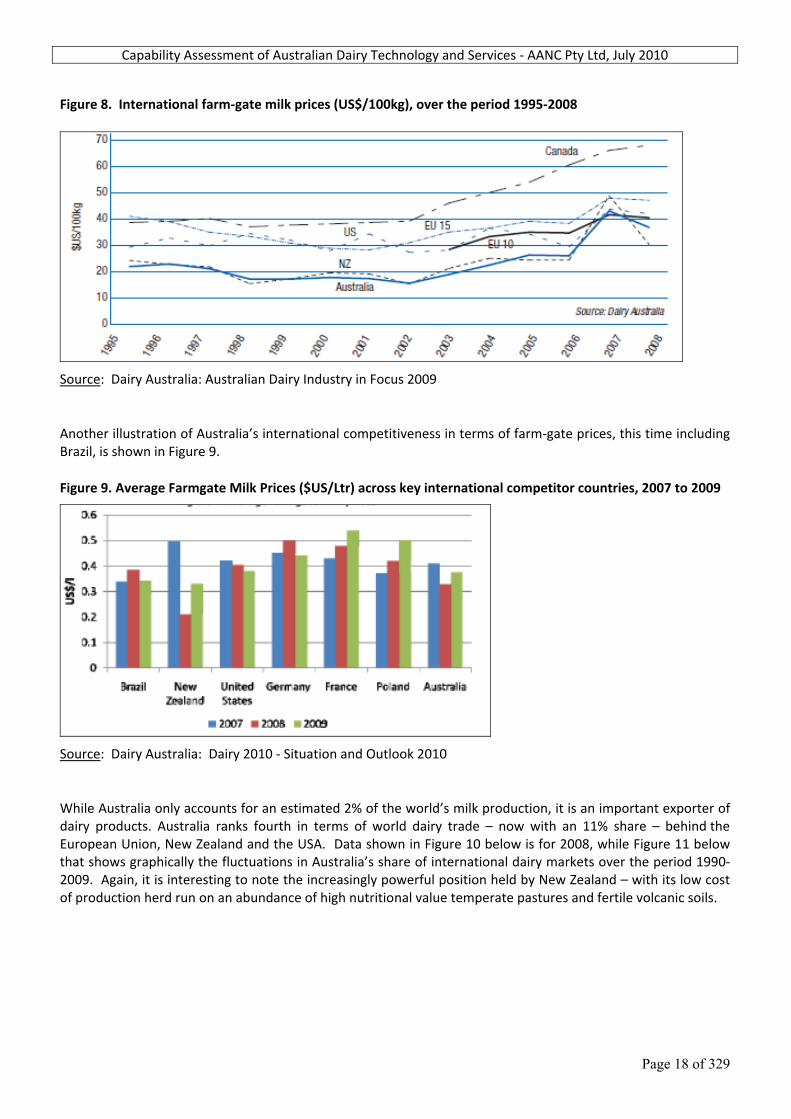
Sources: Dairy Australia: Australian Dairy Industry in Focus 2009, and ABS Australian dairy farmers operate in a deregulated and open market; the only government involvement being in the administration of food standards and food safety assurance systems. Consequently, international markets and prices are the major factor determining the price received by farmers for their milk. At an average of approximately US$35 per 100kg of milk last year, Australian dairy farmers generally receive a relatively lower price compared to many major producing countries and so must operate highly cost‐efficient production systems. This is regularly borne out by international comparisons, where Australian farms consistently have costs of production in the lower cost category of all farms in such surveys. The fact that around half of Australia’s milk production has been exported over the past decade reflects this high level of competitiveness. However, profitable milk production in Australia has become increasingly more difficult in recent years. Farm cost structures have increased in response to the need to adapt to drier conditions where rain fed pastures are regularly contributing a lower proportion of the total feed base available to the herd. As shown in Figure 8 below, the convergence of prices received by farmers around the world during the commodity price boom in 2007 – where Australian and New Zealand farm‐gate milk prices increased strongly in response to strong world prices – has begun to dissipate and the spread widened again during 2009.
Capability Assessment of Australian Dairy Technology and Services ‐ AANC Pty Ltd, July 2010
Page 18 of 329
Figure 8. International farm‐gate milk prices (US$/100kg), over the period 1995‐2008
Source: Dairy Australia: Australian Dairy Industry in Focus 2009
Another illustration of Australia’s international competitiveness in terms of farm‐gate prices, this time including Brazil, is shown in Figure 9.
Figure 9. Average Farmgate Milk Prices ($US/Ltr) across key international competitor countries, 2007 to 2009
Source: Dairy Australia: Dairy 2010 ‐ Situation and Outlook 2010
While Australia only accounts for an estimated 2% of the world’s milk production, it is an important exporter of dairy products. Australia ranks fourth in terms of world dairy trade – now with an 11% share – behind the European Union, New Zealand and the USA. Data shown in Figure 10 below is for 2008, while Figure 11 below that shows graphically the fluctuations in Australia’s share of international dairy markets over the period 1990‐2009. Again, it is interesting to note the increasingly powerful position held by New Zealand – with its low cost of production herd run on an abundance of high nutritional value temperate pastures and fertile volcanic soils.

Capability Assessment of Australian Dairy Technology and Services ‐ AANC Pty Ltd, July 2010
Page 19 of 329
Figure 10. Exporters’ share of world trade in 2008 in Dairy Products (milk equivalents)
Sources: Dairy Australia: Australian Dairy Industry in Focus 2009, and ABS Figure 11. Exporters’ share of international trade in Dairy Products (milk equivalents), from 1990‐2009
Exporter's Share of the International Market
0
10
20
30
40
50
60
1990 1991 1992 1993 1994 1995 1996 1997 1998 1999 2000 2001 2002 2003 2004 2005 2006 2007 2008 2009
% li
tres
milk
equ
ival
ents
Australia EU NZ USA Other
Source: Dairy Australia, personal communication, 2010
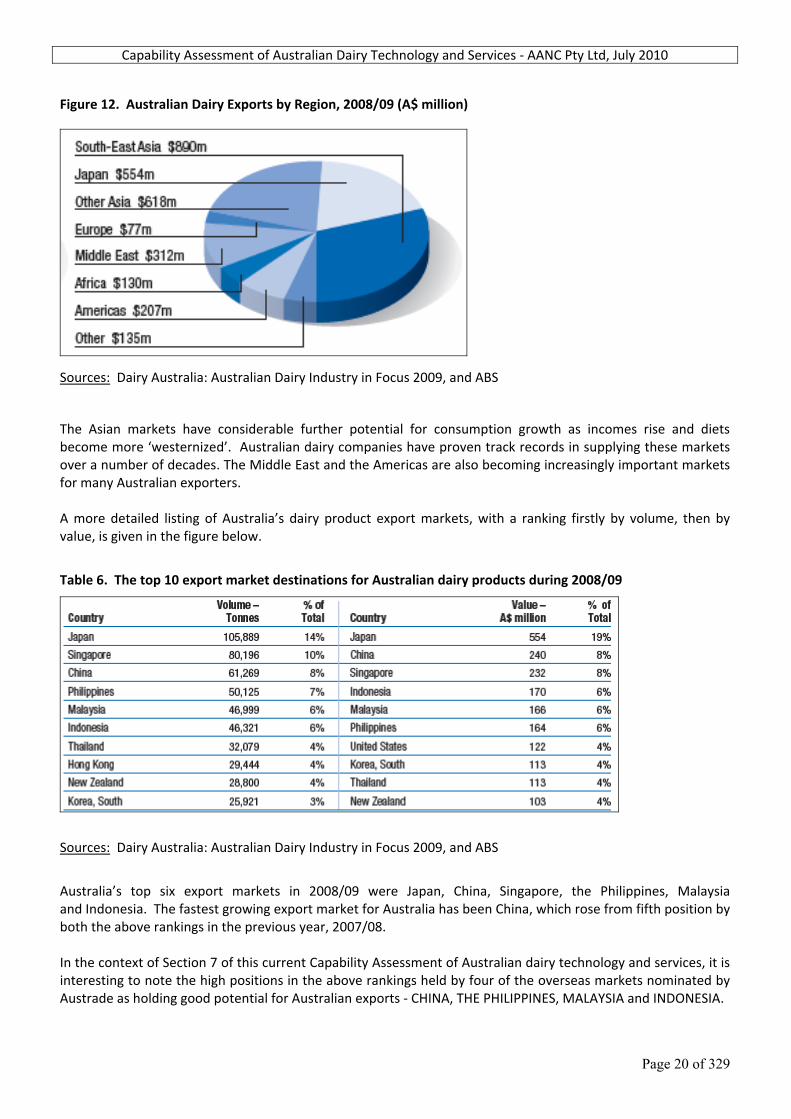
Australian exports are currently concentrated in Asia, which represented 71% of the total dairy exports value of A$2.9 billion in 2008/09. Japan is the single most important export market for Australia, accounting for 19% of exports by value. This concentration of exports in South East Asia or other parts of Asia reflects both Australia’s geographic proximity to these markets and the extent to which Australia is excluded from other major markets by direct restrictions (as in the case of the European Union) or the impact of the export subsidy programs of major competitor countries.
Capability Assessment of Australian Dairy Technology and Services ‐ AANC Pty Ltd, July 2010
Page 20 of 329
Figure 12. Australian Dairy Exports by Region, 2008/09 (A$ million)
Sources: Dairy Australia: Australian Dairy Industry in Focus 2009, and ABS
The Asian markets have considerable further potential for consumption growth as incomes rise and diets become more ‘westernized’. Australian dairy companies have proven track records in supplying these markets over a number of decades. The Middle East and the Americas are also becoming increasingly important markets for many Australian exporters. A more detailed listing of Australia’s dairy product export markets, with a ranking firstly by volume, then by value, is given in the figure below.
Table 6. The top 10 export market destinations for Australian dairy products during 2008/09
Sources: Dairy Australia: Australian Dairy Industry in Focus 2009, and ABS
Australia’s top six export markets in 2008/09 were Japan, China, Singapore, the Philippines, Malaysia and Indonesia. The fastest growing export market for Australia has been China, which rose from fifth position by both the above rankings in the previous year, 2007/08. In the context of Section 7 of this current Capability Assessment of Australian dairy technology and services, it is interesting to note the high positions in the above rankings held by four of the overseas markets nominated by Austrade as holding good potential for Australian exports ‐ CHINA, THE PHILIPPINES, MALAYSIA and INDONESIA.
Capability Assessment of Australian Dairy Technology and Services ‐ AANC Pty Ltd, July 2010
Page 21 of 329
The table below shows the relative importance, by value, of various dairy product types in different export regions. A comparison with product values in the Australian domestic market is also shown.
Table 7. Value of Australian Dairy Exports by region, by product, 2008/09 (A$ million)
Sources: Dairy Australia: Australian Dairy Industry in Focus 2009, and ABS
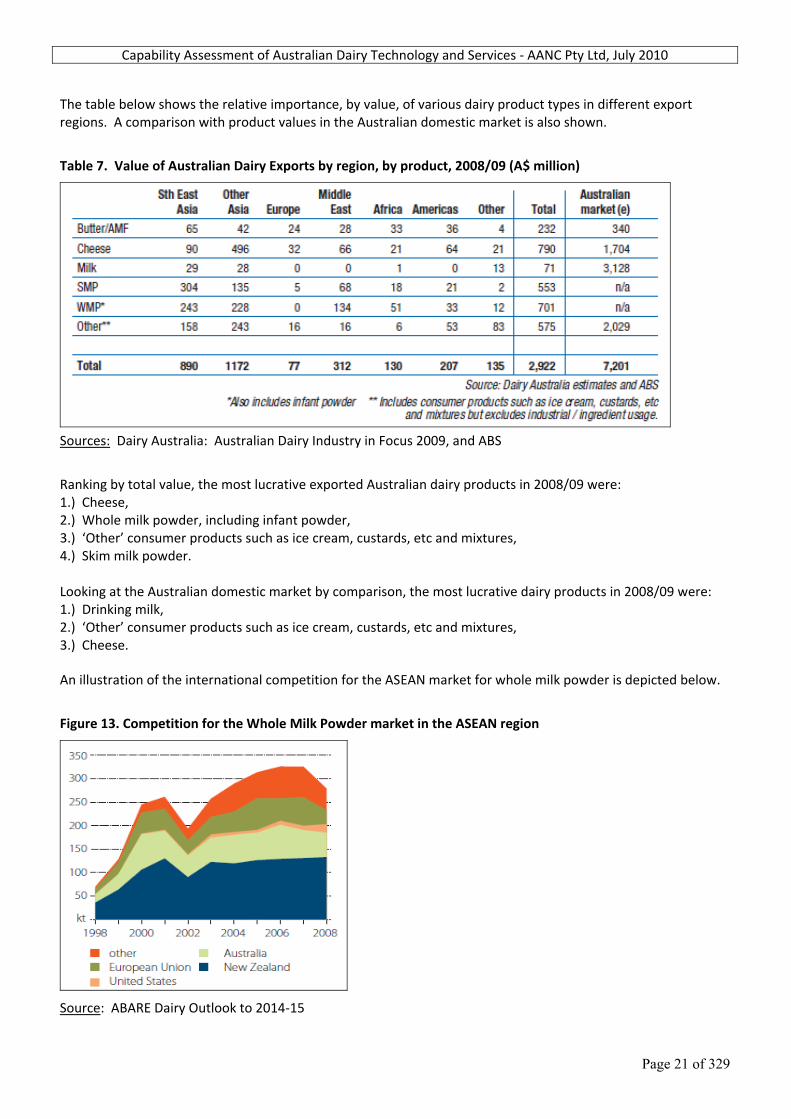
Ranking by total value, the most lucrative exported Australian dairy products in 2008/09 were: 1.) Cheese, 2.) Whole milk powder, including infant powder, 3.) ‘Other’ consumer products such as ice cream, custards, etc and mixtures, 4.) Skim milk powder. Looking at the Australian domestic market by comparison, the most lucrative dairy products in 2008/09 were: 1.) Drinking milk, 2.) ‘Other’ consumer products such as ice cream, custards, etc and mixtures, 3.) Cheese. An illustration of the international competition for the ASEAN market for whole milk powder is depicted below.
Figure 13. Competition for the Whole Milk Powder market in the ASEAN region
Source: ABARE Dairy Outlook to 2014‐15
Capability Assessment of Australian Dairy Technology and Services ‐ AANC Pty Ltd, July 2010
Page 22 of 329
AUSTRALIA’S LIVE EXPORT MARKETS FOR DAIRY CATTLE
An important additional dimension to Australia’s position as a supplier to the global market is the number of dairy cattle (principally pregnant heifers) exported live to various nations of the world.
“The Australian dairy industry is internationally recognised as one of the world’s most competitive and integral parts of the global food market. The nation’s enviable disease free status has seen it dominate the supply of dairy cattle to China, South East Asia, Middle East and Mexico for the past 10 years.” ‐ Landmark Global Exports, quote from website: www.landmarkglobalexports.com.au
Australia’s World Leadership in Live Exporting Australia is a world leader in the export of commercial livestock, exporting on average over 500,000 cattle (approx 60,000 of these being dairy heifers), 4 million sheep and 50,000 goats each year by sea and by air (LiveCorp statistics, www.livecorp.com.au). The country’s leadership in this market is attributed to a number of factors: 1.) The Australian livestock industry is underpinned by a solid commitment to food safety, product quality,
animal health and welfare. Our industry is one of the most stringently controlled in the world, with independently audited food safety systems in place across the whole supply chain.
2.) According to MLA‐Livecorp, Australia has the world’s highest livestock export standards, ensuring animals
arrive at overseas destinations in premium condition. 3.) Australia’s diverse climatic conditions ensure that livestock can be bred and reared to be well suited to
either tropical or temperate climates. 4.) Australia has an animal health status superior to almost all other nations of the world, with the country
being officially recognized by the international animal health authority, the OIE, as being “free” from all major exotic diseases of farm animals. Australian Live Export Protocols, involving pre‐loading inspection of all animals and the issuing of Health Certificates by AQIS accredited veterinarians, the cleaning of ships, and accreditation of all exporters, helps guarantee the critically important “disease free” status of all beef and dairy cattle, sheep and goats exported from Australia to many countries of the world.
5.) The Australian Federal Government tightly controls the livestock export industry through legislation and
regulation. All livestock exporters must have an operations and governance manual as a requirement of their Australian livestock export licence. This manual acts as a quality assurance manual, covering all aspects of the Australian Standards for the Export of Livestock. Exporters are audited by the Federal Government twice a year.
6.) The Australian livestock industry, through Meat and Livestock Australia (MLA) and LiveCorp, provide after
sales technical support for buyers of the country’s livestock.
Location of dairy animals for export
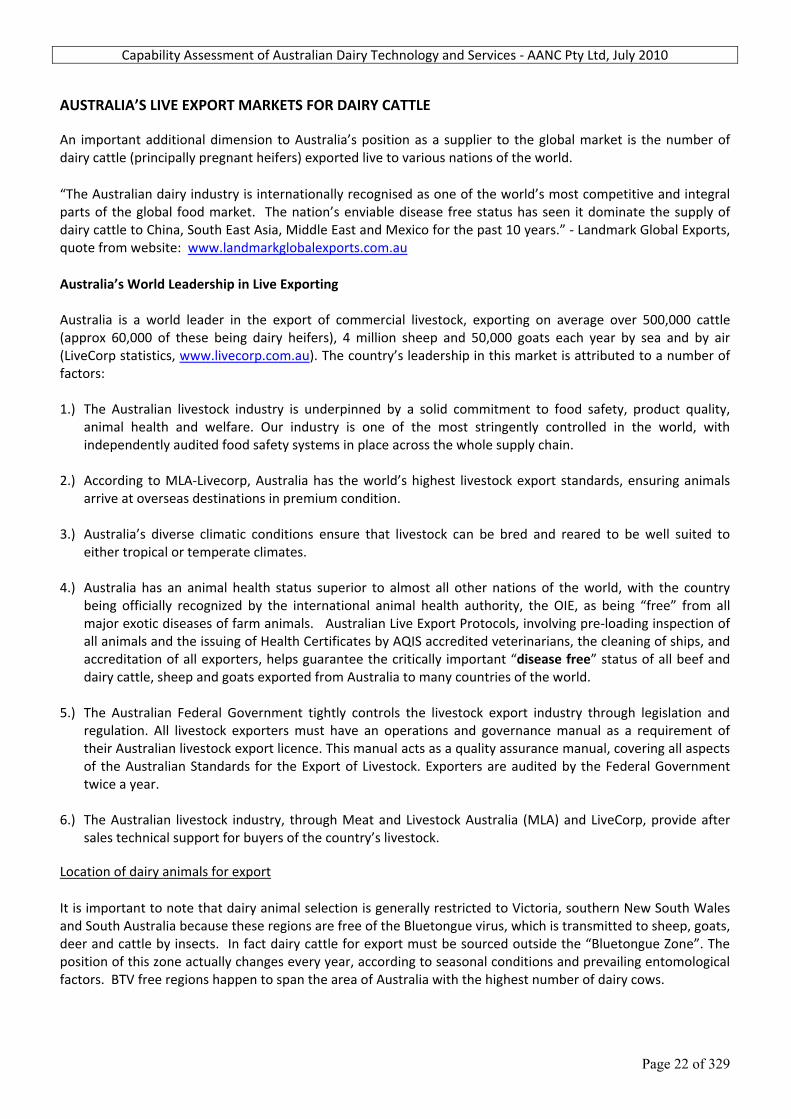
It is important to note that dairy animal selection is generally restricted to Victoria, southern New South Wales and South Australia because these regions are free of the Bluetongue virus, which is transmitted to sheep, goats, deer and cattle by insects. In fact dairy cattle for export must be sourced outside the “Bluetongue Zone”. The position of this zone actually changes every year, according to seasonal conditions and prevailing entomological factors. BTV free regions happen to span the area of Australia with the highest number of dairy cows.
Capability Assessment of Australian Dairy Technology and Services ‐ AANC Pty Ltd, July 2010
Page 23 of 329
Australia remains free of clinical Bluetongue Disease. However, the distribution of the Bluetongue virus across the country is determined by the distribution of insect vectors. Vectors have complex interactions with geography, climate, the host animals and the viruses. These interactions result in southern and inland areas of Australia being continuously free of livestock arboviruses (i.e., insect‐borne viruses). However, in northern, and some eastern and western coastal areas, there is fluctuation in the distribution of arboviruses from year to year. The Bluetongue Zone map is available from Animal Health Australia and is based on OIE (World Organisation for Animal Health) guidelines. It defines areas in which no viral activity has been detected for at least the past two years.
Figure 14. Variation in position of the ‘Bluetongue Zone’ throughout Australia from 2006‐2009
Source: www.animalhealthaustralia.com.au/programs/adsp/namp/namp_home.cfm
Type of dairy animal suitable for export
In selecting dairy cattle for export, it is advisable to restrict their selection to heifers, either pregnancy tested in calf (PTIC) or maiden (unjoined), for the following reasons: o If non‐lactating adult cows are selected, they will be either heavy in calf (>6 months) and have difficulty
travelling or, if less than 6 months in calf, they are likely to have a history of reproductive problems. o Empty or early pregnant heifer will travel much better with low levels of ship‐board abortion. o Heifers will not carry the same level of sub‐clinical mastitis as adult cows. o They are lighter and cheaper to transport. o They will last longer than mature cows so represent better lifetime value.
According to the Australian Standards for the Export of Livestock, Version 2.2, October 2008 (Department of Agriculture, Fisheries & Forestry, 2008), cattle for live export must “have an individual liveweight of more than 200 kg and less than 650 kg or, if outside these weights, have written prior approval from the relevant Australian Government agency”.
The Statistics below illustrate the significance of the live export trade to the Australian dairy industry. Dairy heifer export data for the twelve months to March 2010 indicates that the total number of animals exported increased very strongly by 64% over last year to 82,600, for a value of some $A140 million. With the national herd at approx 1.6 million cows, live export heifers would now account for nearly 4.5% of milking cows ‐ a record high level.
While Victoria is the largest source of export dairy heifers by numbers – due to the size of the industry ‐ the proportion is traditionally highest in WA [reaching 6% this year].
Capability Assessment of Australian Dairy Technology and Services ‐ AANC Pty Ltd, July 2010
Page 24 of 329
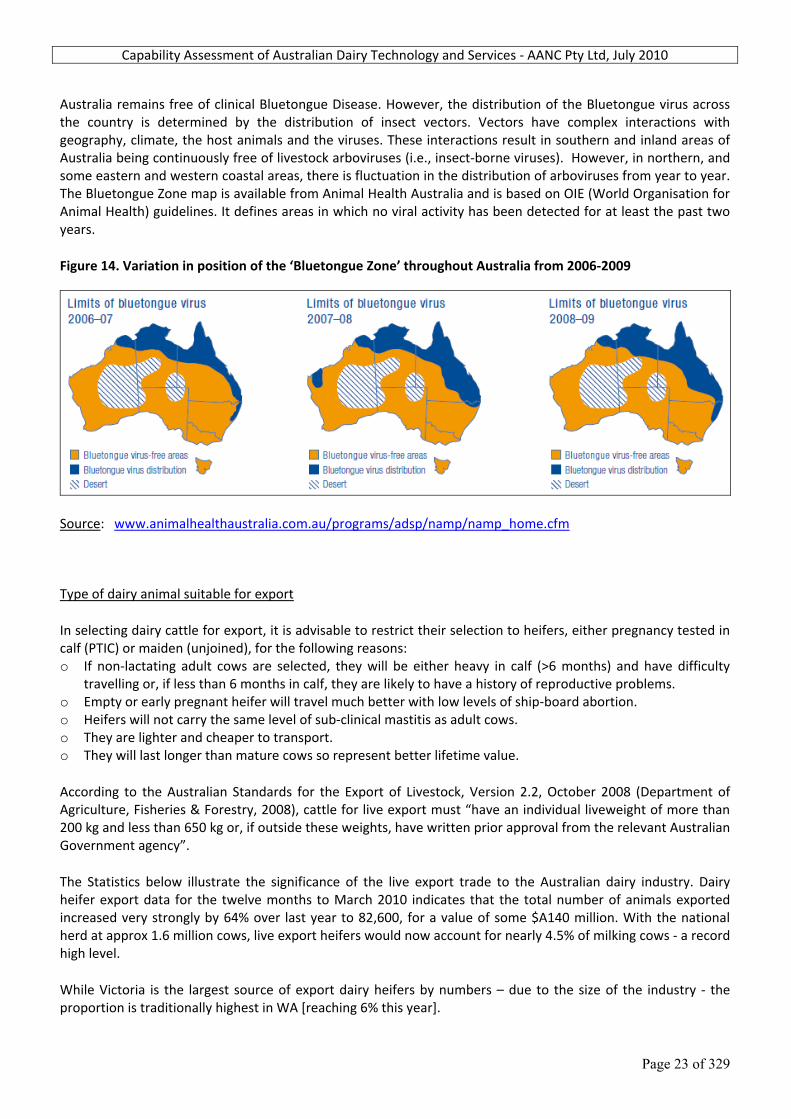
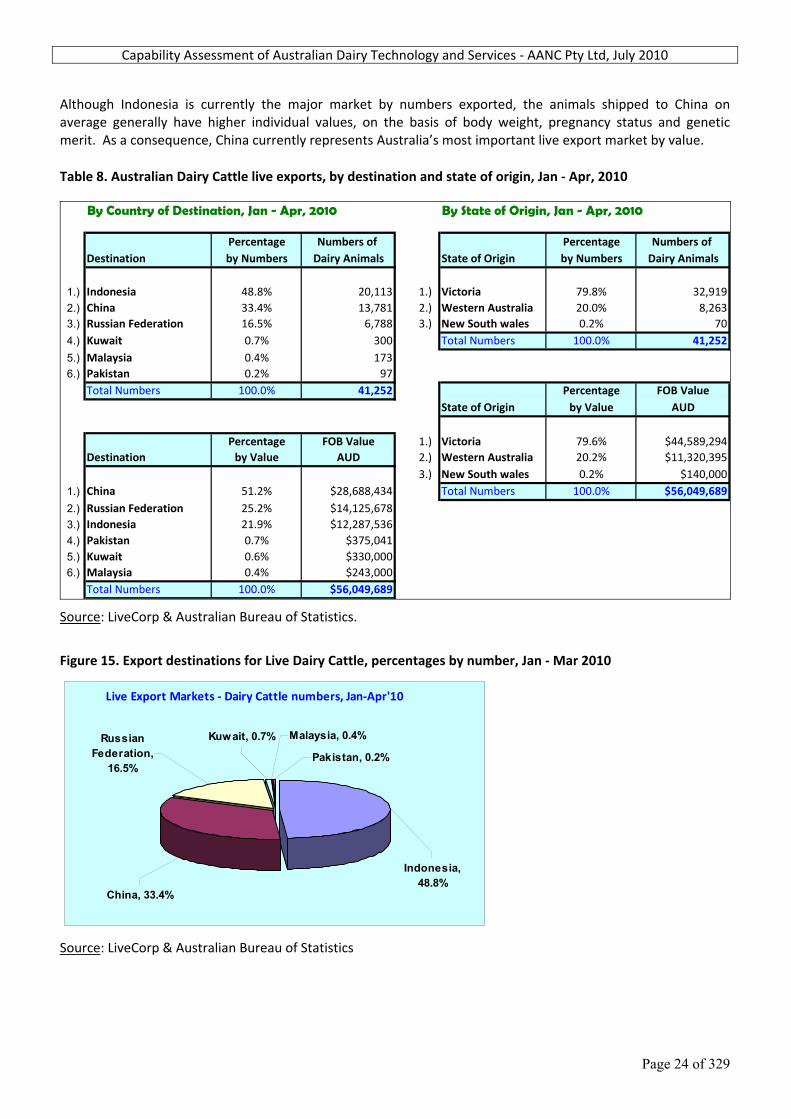
Although Indonesia is currently the major market by numbers exported, the animals shipped to China on average generally have higher individual values, on the basis of body weight, pregnancy status and genetic merit. As a consequence, China currently represents Australia’s most important live export market by value.
Table 8. Australian Dairy Cattle live exports, by destination and state of origin, Jan ‐ Apr, 2010
By Country of Destination, Jan - Apr, 2010 By State of Origin, Jan - Apr, 2010
Percentage Numbers of Percentage Numbers of Destination by Numbers Dairy Animals State of Origin by Numbers Dairy Animals
1.) Indonesia 48.8% 20,113 1.) Victoria 79.8% 32,9192.) China 33.4% 13,781 2.) Western Australia 20.0% 8,2633.) Russian Federation 16.5% 6,788 3.) New South wales 0.2% 704.) Kuwait 0.7% 300 Total Numbers 100.0% 41,2525.) Malaysia 0.4% 1736.) Pakistan 0.2% 97
Total Numbers 100.0% 41,252 Percentage FOB ValueState of Origin by Value AUD
Percentage FOB Value 1.) Victoria 79.6% $44,589,294Destination by Value AUD 2.) Western Australia 20.2% $11,320,395
3.) New South wales 0.2% $140,0001.) China 51.2% $28,688,434 Total Numbers 100.0% $56,049,6892.) Russian Federation 25.2% $14,125,6783.) Indonesia 21.9% $12,287,5364.) Pakistan 0.7% $375,0415.) Kuwait 0.6% $330,0006.) Malaysia 0.4% $243,000
Total Numbers 100.0% $56,049,689
Source: LiveCorp & Australian Bureau of Statistics.
Figure 15. Export destinations for Live Dairy Cattle, percentages by number, Jan ‐ Mar 2010
Live Export Markets ‐ Dairy Cattle numbers, Jan‐Apr'10
Pakistan, 0.2%
Malaysia, 0.4%Kuwait, 0.7%
Indonesia, 48.8%
Russian Federation,
16.5%
China, 33.4%
Source: LiveCorp & Australian Bureau of Statistics
Capability Assessment of Australian Dairy Technology and Services ‐ AANC Pty Ltd, July 2010
Page 25 of 329
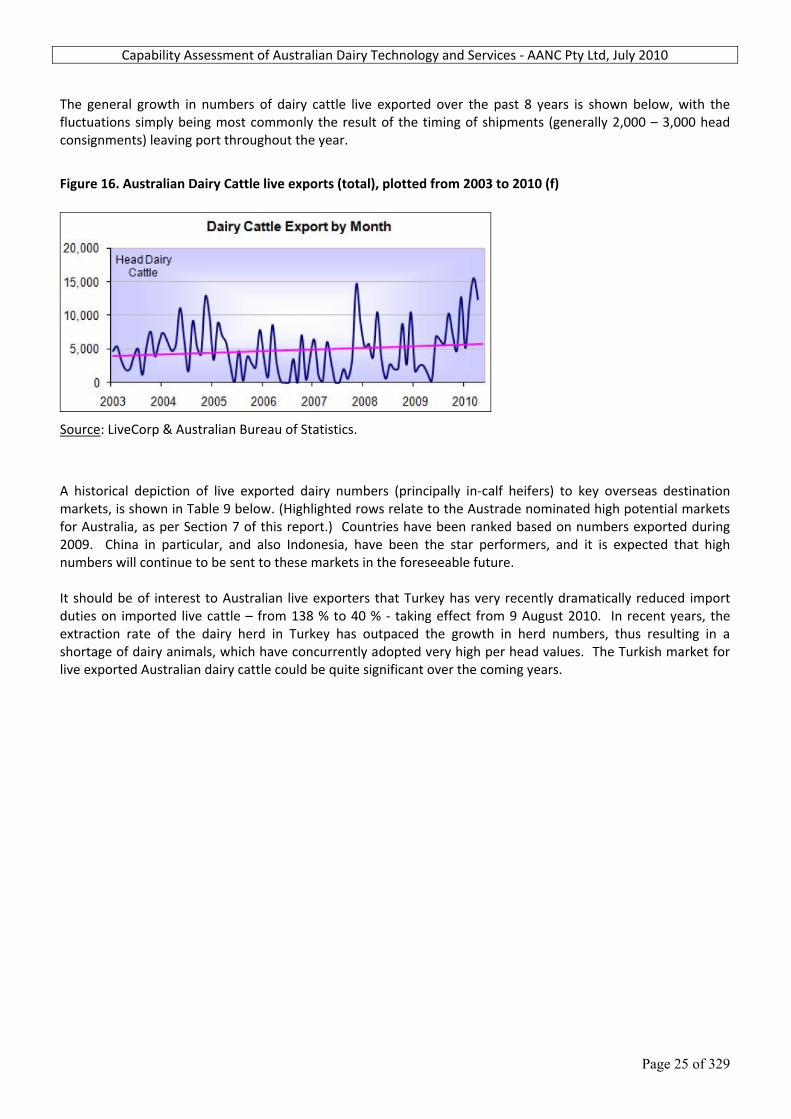
The general growth in numbers of dairy cattle live exported over the past 8 years is shown below, with the fluctuations simply being most commonly the result of the timing of shipments (generally 2,000 – 3,000 head consignments) leaving port throughout the year.
Figure 16. Australian Dairy Cattle live exports (total), plotted from 2003 to 2010 (f)
Source: LiveCorp & Australian Bureau of Statistics.
A historical depiction of live exported dairy numbers (principally in‐calf heifers) to key overseas destination markets, is shown in Table 9 below. (Highlighted rows relate to the Austrade nominated high potential markets for Australia, as per Section 7 of this report.) Countries have been ranked based on numbers exported during 2009. China in particular, and also Indonesia, have been the star performers, and it is expected that high numbers will continue to be sent to these markets in the foreseeable future. It should be of interest to Australian live exporters that Turkey has very recently dramatically reduced import duties on imported live cattle – from 138 % to 40 % ‐ taking effect from 9 August 2010. In recent years, the extraction rate of the dairy herd in Turkey has outpaced the growth in herd numbers, thus resulting in a shortage of dairy animals, which have concurrently adopted very high per head values. The Turkish market for live exported Australian dairy cattle could be quite significant over the coming years.

Capability Assessment of Australian Dairy Technology and Services ‐ AANC Pty Ltd, July 2010
Page 26 of 329
Table 9. Australian Dairy Cattle live export numbers by destination, Jan 2005 to Apr, 2010 (Highlighted are the nominated high potential markets for Australia, as per Section 7 of this report.)
Ranked
Rank Importers 2005 2006 2007 2008 2009Jan‐Apr
2010WORLD 49,427 31,051 46,265 58,364 62,197 41,252
1 China 26,471 2,600 3,526 12,209 32,782 13,7812 Indonesia 700 1,601 0 0 16,312 20,1133 Kuwait 3,039 3,331 4,479 3,936 3,434 3004 Russia 0 7,360 6,575 20,071 2,437 6,7885 Saudi Arabia 0 0 4,463 1,700 1,9006 Pakistan 0 0 0 3,680 1,704 977 Malaysia 0 755 83 2,858 1,270 1738 Philippines 275 93 67 90 7359 Oman 250 350 0 0 374
10 Japan 662 978 0 0 34011 Qatar 31 0 0 223 30012 United Arab Emirates 2,818 1,825 328 272 26813 Singapore 0 0 0 0 14914 Vietnam 0 0 0 0 10815 Thailand 0 8 0 44 7516 New Zealand 0 0 0 0 517 New Caledonia 0 0 0 0 418 Mexico 15,181 11,263 22,167 10,131 019 Turkey 0 0 2,838 3,150 020 Jordan 0 0 1,200 0 021 Brunei Darussalam 0 740 0 0 022 Taiwan 0 70 539 0 023 Iraq 0 30 0 0 024 South Africa 0 24 0 0 025 Bangladesh 0 13 0 0 026 Chile 0 10 0 0 0
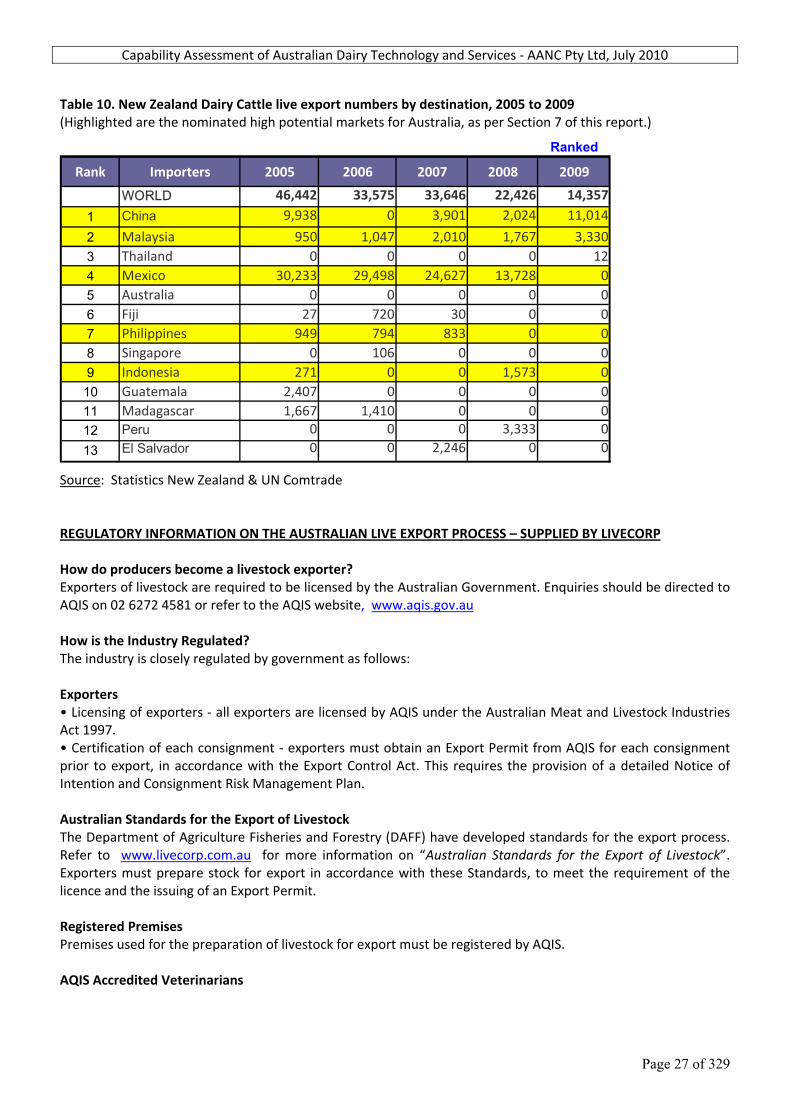
Source: Australian Bureau of Statistics. By way of comparison, Table 10 below details live exports of dairy cattle from New Zealand. It should be appreciated that, as shown previously, New Zealand has approximately three times the number of cows as has Australia, and that it currently exports large numbers to China ‐ Australia’s number one live export destination. Until 2009, New Zealand was also highly competitive in supplying heifers to Mexico. The country is very actively involved in promoting its dairy cattle, dairy products and advisory services in China and several parts of SE Asia and other countries. New Zealand can also boast equally as well or better than Australia, its clean, green, disease free image to foreign countries. Although exported numbers are currently well below Australia, New Zealand should be regarded a substantial on‐going competitor to Australia in our pursuit of offshore markets.
Capability Assessment of Australian Dairy Technology and Services ‐ AANC Pty Ltd, July 2010
Page 27 of 329
Table 10. New Zealand Dairy Cattle live export numbers by destination, 2005 to 2009 (Highlighted are the nominated high potential markets for Australia, as per Section 7 of this report.)
Ranked
Rank Importers 2005 2006 2007 2008 2009
WORLD 46,442 33,575 33,646 22,426 14,357
1 China 9,938 0 3,901 2,024 11,014
2 Malaysia 950 1,047 2,010 1,767 3,3303 Thailand 0 0 0 0 124 Mexico 30,233 29,498 24,627 13,728 05 Australia 0 0 0 0 06 Fiji 27 720 30 0 07 Philippines 949 794 833 0 08 Singapore 0 106 0 0 09 Indonesia 271 0 0 1,573 010 Guatemala 2,407 0 0 0 011 Madagascar 1,667 1,410 0 0 012 Peru 0 0 0 3,333 0
13 El Salvador 0 0 2,246 0 0
Source: Statistics New Zealand & UN Comtrade REGULATORY INFORMATION ON THE AUSTRALIAN LIVE EXPORT PROCESS – SUPPLIED BY LIVECORP How do producers become a livestock exporter? Exporters of livestock are required to be licensed by the Australian Government. Enquiries should be directed to AQIS on 02 6272 4581 or refer to the AQIS website, www.aqis.gov.au How is the Industry Regulated? The industry is closely regulated by government as follows: Exporters • Licensing of exporters ‐ all exporters are licensed by AQIS under the Australian Meat and Livestock Industries Act 1997. • Certification of each consignment ‐ exporters must obtain an Export Permit from AQIS for each consignment prior to export, in accordance with the Export Control Act. This requires the provision of a detailed Notice of Intention and Consignment Risk Management Plan. Australian Standards for the Export of Livestock The Department of Agriculture Fisheries and Forestry (DAFF) have developed standards for the export process. Refer to www.livecorp.com.au for more information on “Australian Standards for the Export of Livestock”. Exporters must prepare stock for export in accordance with these Standards, to meet the requirement of the licence and the issuing of an Export Permit. Registered Premises Premises used for the preparation of livestock for export must be registered by AQIS. AQIS Accredited Veterinarians
Capability Assessment of Australian Dairy Technology and Services ‐ AANC Pty Ltd, July 2010
Page 28 of 329
Only AQIS accredited veterinarians may undertake veterinary functions in an approved export program. Refer to AQIS website www.aqis.gov.au/live export/accredited veterinarians for more information. Ships Livestock ships must be approved by the Australian Maritime Safety Authority as meeting the requirements of Marine Order 45. Prevention of Cruelty Legislation State legislation on the prevention of cruelty to animals applies to the handling, management and transport of animals. Airfreight Airfreight requirements are in accordance with the Australian Standards for the Export of Livestock and IATA (International Air Transport Association) Live Animal Regulations. Licensing (responsibility of AQIS) An exporter must have a licence. Without a license an exporter cannot export. Each consignment needs an Export Permit to obtain a customs release from Australia. Without an Export Permit the ship or aircraft cannot leave Australia. Failure to observe government orders under the AMLI Act can result in the loss of licence. State Prevention of Cruelty to Animals Acts are to be observed at all times and failure in basic animal welfare can see a consignment stopped by AQIS. Customer Country Protocols (responsibility of AQIS) Some customer countries have protocols requiring an Import Permit, which in turn requires a Health Certificate from AQIS. This Health Certificate guarantees that all health protocol conditions have been met. Without this, entry into the country concerned may be prevented and as a result the consignment would be prevented from leaving Australia. Where protocols do not apply, AQIS/Customs can, should problems arise, withhold the issuance of an Export Permit, preventing the consignment from leaving Australia. Shipboard (responsibility of AMSA) Each livestock vessel is licensed by the Australian Maritime Safety Authority (AMSA). If a vessel fails to comply with the provisions of Marine Order 43 of the Navigation Act, the vessel may be barred from loading future consignments and penalties will apply to the shipping company. False declarations supplied to any Government department are covered under the various “Oath Acts” and penalties apply. Sanctions include loss of a ship’s licence to carry livestock. In addition, the ship is subject to additional engineering inspection and scrutiny by AMSA on arrival back in Australia. EXAMPLE OF THE DAIRY LIVE EXPORT PROCESS Document prepared by Austock Exports and Precision Beef : “Exporting Dairy Cows to China - A description of the process and the role of the exporter.” Two Australian companies, Austock Exports and Precision Beef, have joined forces to provide a more comprehensive service to their overseas clients. This document is intended to provide prospective clients in China with an overview of the steps associated with selecting and transporting dairy cattle to that country. 1. Cattle selection A number of issues associated with identifying and selecting the appropriate cattle are discussed below. 1.1. Customer’s requirements
Capability Assessment of Australian Dairy Technology and Services ‐ AANC Pty Ltd, July 2010
Page 29 of 329
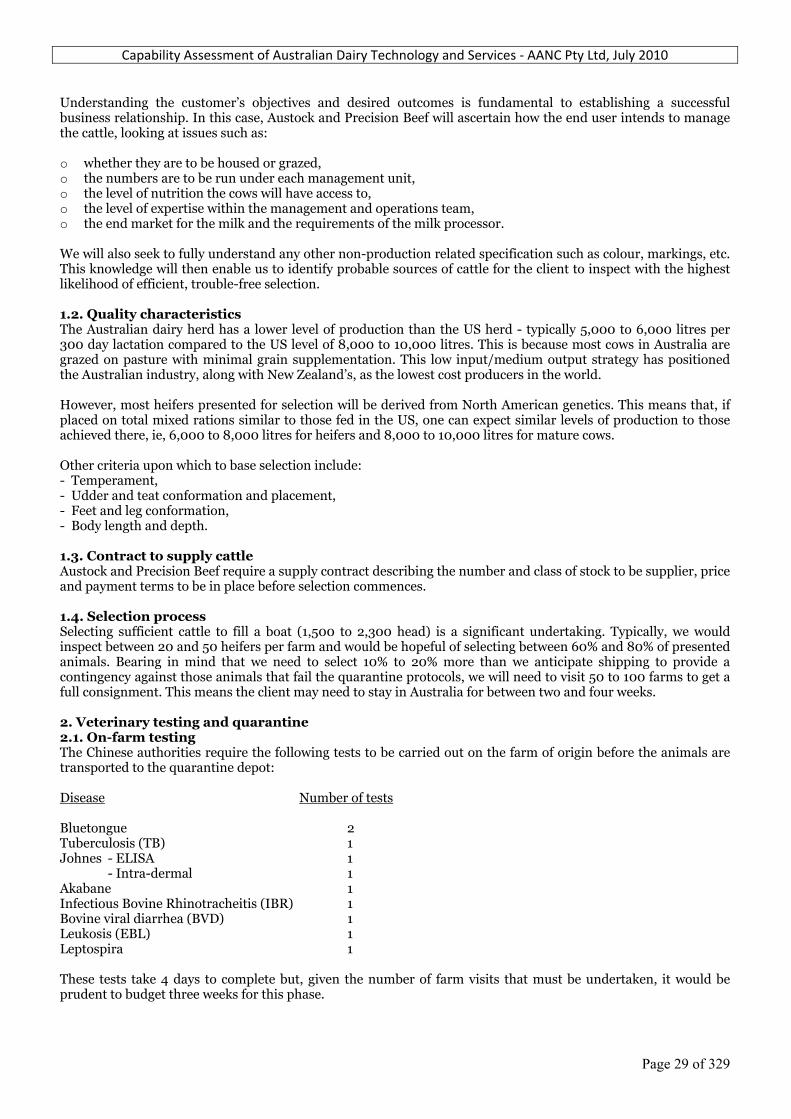
Understanding the customer’s objectives and desired outcomes is fundamental to establishing a successful business relationship. In this case, Austock and Precision Beef will ascertain how the end user intends to manage the cattle, looking at issues such as: o whether they are to be housed or grazed, o the numbers are to be run under each management unit, o the level of nutrition the cows will have access to, o the level of expertise within the management and operations team, o the end market for the milk and the requirements of the milk processor. We will also seek to fully understand any other non-production related specification such as colour, markings, etc. This knowledge will then enable us to identify probable sources of cattle for the client to inspect with the highest likelihood of efficient, trouble-free selection. 1.2. Quality characteristics The Australian dairy herd has a lower level of production than the US herd - typically 5,000 to 6,000 litres per 300 day lactation compared to the US level of 8,000 to 10,000 litres. This is because most cows in Australia are grazed on pasture with minimal grain supplementation. This low input/medium output strategy has positioned the Australian industry, along with New Zealand’s, as the lowest cost producers in the world. However, most heifers presented for selection will be derived from North American genetics. This means that, if placed on total mixed rations similar to those fed in the US, one can expect similar levels of production to those achieved there, ie, 6,000 to 8,000 litres for heifers and 8,000 to 10,000 litres for mature cows. Other criteria upon which to base selection include: - Temperament, - Udder and teat conformation and placement, - Feet and leg conformation, - Body length and depth. 1.3. Contract to supply cattle Austock and Precision Beef require a supply contract describing the number and class of stock to be supplier, price and payment terms to be in place before selection commences. 1.4. Selection process Selecting sufficient cattle to fill a boat (1,500 to 2,300 head) is a significant undertaking. Typically, we would inspect between 20 and 50 heifers per farm and would be hopeful of selecting between 60% and 80% of presented animals. Bearing in mind that we need to select 10% to 20% more than we anticipate shipping to provide a contingency against those animals that fail the quarantine protocols, we will need to visit 50 to 100 farms to get a full consignment. This means the client may need to stay in Australia for between two and four weeks. 2. Veterinary testing and quarantine 2.1. On-farm testing The Chinese authorities require the following tests to be carried out on the farm of origin before the animals are transported to the quarantine depot: Disease Number of tests Bluetongue 2 Tuberculosis (TB) 1 Johnes - ELISA 1 - Intra-dermal 1 Akabane 1 Infectious Bovine Rhinotracheitis (IBR) 1 Bovine viral diarrhea (BVD) 1 Leukosis (EBL) 1 Leptospira 1 These tests take 4 days to complete but, given the number of farm visits that must be undertaken, it would be prudent to budget three weeks for this phase.
Capability Assessment of Australian Dairy Technology and Services ‐ AANC Pty Ltd, July 2010
Page 30 of 329
2.2. Quarantine depot Once the on-farm testing is complete, animals which pass the tests must be transported to a central quarantine depot and stay there for at least 30 days as mandated by the Chinese authorities. A further battery of tests and treatments must be conducted during this period. Disease Number of tests Bluetongue 1 Akabane 1 Infectious Bovine Rhinotracheitis (IBR) 1 Internal parasites 1 External parasites 2 Leptospira 1 Nutritional management at this stage is critical to ensure that the pregnant animal receives the nutrients she needs for foetus development while at the same time controlling weight gain so that freight costs are minimized. 2.3. Chinese veterinarian The Chinese government requires that a Chinese veterinarian supervises the testing process. This involves inspecting the laboratory that will conduct the tests and approving their methods, overseeing a number of the blood sampling and other veterinary procedures, inspecting and approving the quarantine depot, liaising with the Australian quarantine authorities (AQIS) and supervising the dispatch. The quarantine phase cannot commence until he arrives. It is the responsibility of the Chinese client to arrange for the Chinese veterinarian to come to Australia and to cover his costs while here. 3. Transport and delivery 3.1. Freight Two options exist for transporting live cattle to China, air freight or sea freight. Air freight has the advantage of speed with less than 24 hour elapsing between dispatch from the depot until the cattle are unloaded in China. It also enables to importer to bring in smaller numbers. Typically, an aircraft will carry approximately 200 pregnant heifers. The major drawback to air freight is cost, which generally is in excess of USD1,200 per head. Sea freight is much cheaper; around USD250 to USD300 per head. However, it needs large numbers of cattle (1,500 to 2,500 head per shipment) to be effective and obviously takes longer to get there - between 15 and 20 days, depending on the vessel. 3.2. Import permit It is the client’s responsibility to secure the necessary permits from the Chinese government. The Australian authorities are unlikely to allow the quarantine testing to commence without those permits in place. 3.3. Customs and quarantine in China On arrival in China, the cattle must under go a further quarantine period and veterinary tests. It is the responsibility of the importer to fund this. It is also the client’s responsibility to ensure that all customs and quarantine measures are in place for the consignments arrival in China, including the provision of quarantine facilities. 4. Austock’s role 4.1. Selection Precision Beef’s principal, Dr Shane Blakeley, is a veterinarian with experience in managing large dairy operations and is familiar with the criteria by which superior dairy cattle are selected. He will work in close association with a subsidiary company of the Victorian Dairyfarmers Organisation that has been specially established to identify stock suitable for export to China. It is also wise to have provisional approval for the Chinese veterinarian’s visit. 4.2. Testing and quarantine Dr Blakeley will supervise and coordinate the on-farm and depot quarantine process. He will also oversee the management, nutrition and animal health of the cattle while they are in the depot. 4.3. Transport Austock is fully familiar with the shipping function and will organize the transport of the stock to the wharf or airport, chartering the ship or aircraft, generation of customs, quarantine and shipping documentation, provision of ship-board fodder and bedding, on-board supervision of the cattle during transit.

Capability Assessment of Australian Dairy Technology and Services ‐ AANC Pty Ltd, July 2010
Page 31 of 329
4.4. Documentation The export of livestock from Australia generates a considerable amount of documentation. Austock staff coordinate this on a daily basis and can confidently fulfill this task for Chinese clients. 5. Payment terms Austock is prepared to supply cattle on a CIF, C&F or FOB basis against a letter of credit acceptable to the ANZ Banking Corporation. However, whichever scenario is employed, the letter of credit must be configured in a way which enables Austock to draw down funds against that LC over the quarantine and depot period. This is needed to pay the farmers for the cattle once they are delivered to the depot and to pay for the veterinary tests, depot charges, freight to ship or aircraft and, if the contract is C&F or CIF, to pay the deposit on the ship or plane. All draw-downs would be against documentation agreed to by both parties. The balance would then be payable on presentation of loading documents and health certificates. 6. After-sales service Austock and Precision Beef are well positioned to offer a range of after-sales services. 6.1. Operations review Austock and Precision Beef personnel would accompany the cattle to China and, while in the country, we would be happy to provide an overview of the clients existing operations, free of charge, along with a series of recommendations for management’s consideration. 6.2. Fee based consultancy Dr Blakeley’s veterinary and dairy management experience provides him with the skills to offer consultancy advice on areas associated with nutrition, genetics and animal health. More importantly, he has specialized in developing management systems to ensure the efficient, profitable operation of beef and dairy businesses. These systems cover business strategy and planning, operating procedures, human resource management, marketing and customer relations and financial management. He is also expert in designing and supervising the construction of dairy feedlots. These services would be charged at a rate agreed to by both parties. 6.3. Contract management Austock and Precision Beef jointly manage two beef cattle feedlots in the Philippines and is negotiating with another concern on a similar project in Indonesia. We would be interested in discussing a similar arrangement with Chinese dairy and beef enterprises. 6.4. Supply of equipment and genetic material We are also able to source dairy equipment and superior dairy genetic material in the form of semen and embryos for our Chinese clients.
Capability Assessment of Australian Dairy Technology and Services ‐ AANC Pty Ltd, July 2010
Page 32 of 329
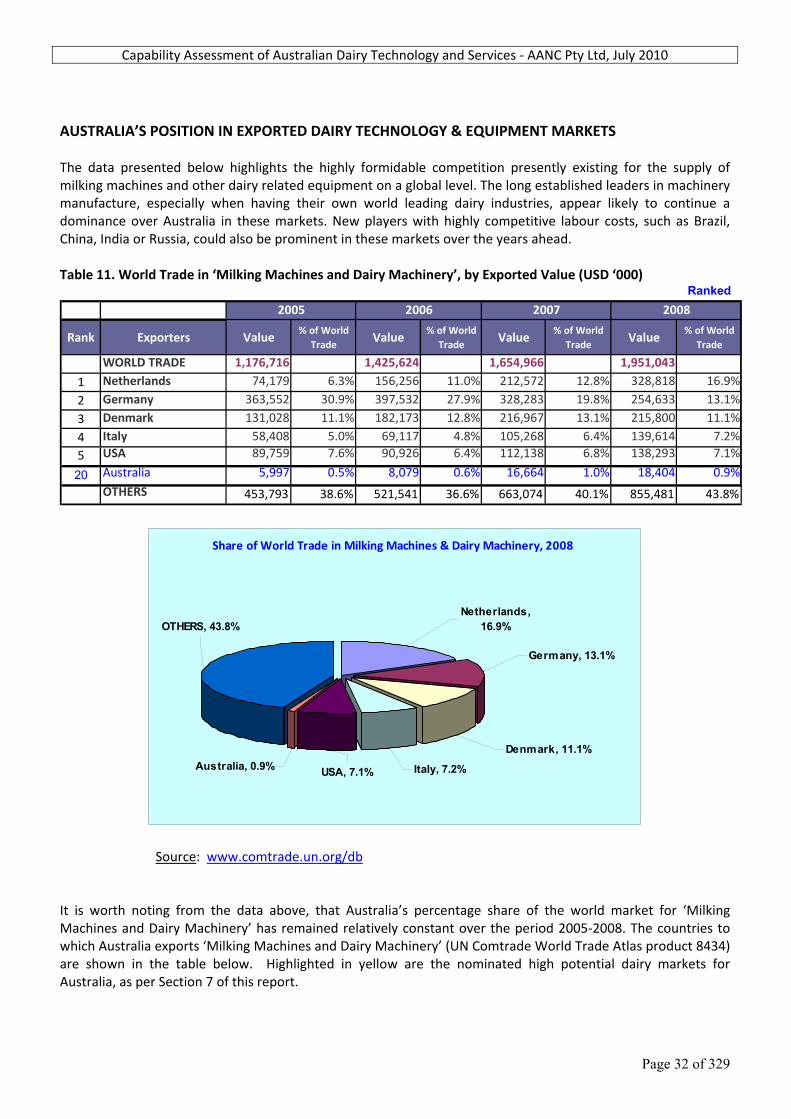
AUSTRALIA’S POSITION IN EXPORTED DAIRY TECHNOLOGY & EQUIPMENT MARKETS The data presented below highlights the highly formidable competition presently existing for the supply of milking machines and other dairy related equipment on a global level. The long established leaders in machinery manufacture, especially when having their own world leading dairy industries, appear likely to continue a dominance over Australia in these markets. New players with highly competitive labour costs, such as Brazil, China, India or Russia, could also be prominent in these markets over the years ahead. Table 11. World Trade in ‘Milking Machines and Dairy Machinery’, by Exported Value (USD ‘000)
Ranked
Rank Exporters Value% of World
TradeValue
% of World Trade
Value% of World
TradeValue
% of World Trade
WORLD TRADE 1,176,716 1,425,624 1,654,966 1,951,043
1 Netherlands 74,179 6.3% 156,256 11.0% 212,572 12.8% 328,818 16.9%
2 Germany 363,552 30.9% 397,532 27.9% 328,283 19.8% 254,633 13.1%
3 Denmark 131,028 11.1% 182,173 12.8% 216,967 13.1% 215,800 11.1%
4 Italy 58,408 5.0% 69,117 4.8% 105,268 6.4% 139,614 7.2%
5 USA 89,759 7.6% 90,926 6.4% 112,138 6.8% 138,293 7.1%
20 Australia 5,997 0.5% 8,079 0.6% 16,664 1.0% 18,404 0.9%
OTHERS 453,793 38.6% 521,541 36.6% 663,074 40.1% 855,481 43.8%
2005 2006 2007 2008
Share of World Trade in Milking Machines & Dairy Machinery, 2008
OTHERS, 43.8%Netherlands,
16.9%
Germany, 13.1%
Denmark, 11.1%
Italy, 7.2%USA, 7.1%Australia, 0.9%
Source: www.comtrade.un.org/db It is worth noting from the data above, that Australia’s percentage share of the world market for ‘Milking Machines and Dairy Machinery’ has remained relatively constant over the period 2005‐2008. The countries to which Australia exports ‘Milking Machines and Dairy Machinery’ (UN Comtrade World Trade Atlas product 8434) are shown in the table below. Highlighted in yellow are the nominated high potential dairy markets for Australia, as per Section 7 of this report.
Capability Assessment of Australian Dairy Technology and Services ‐ AANC Pty Ltd, July 2010
Page 33 of 329
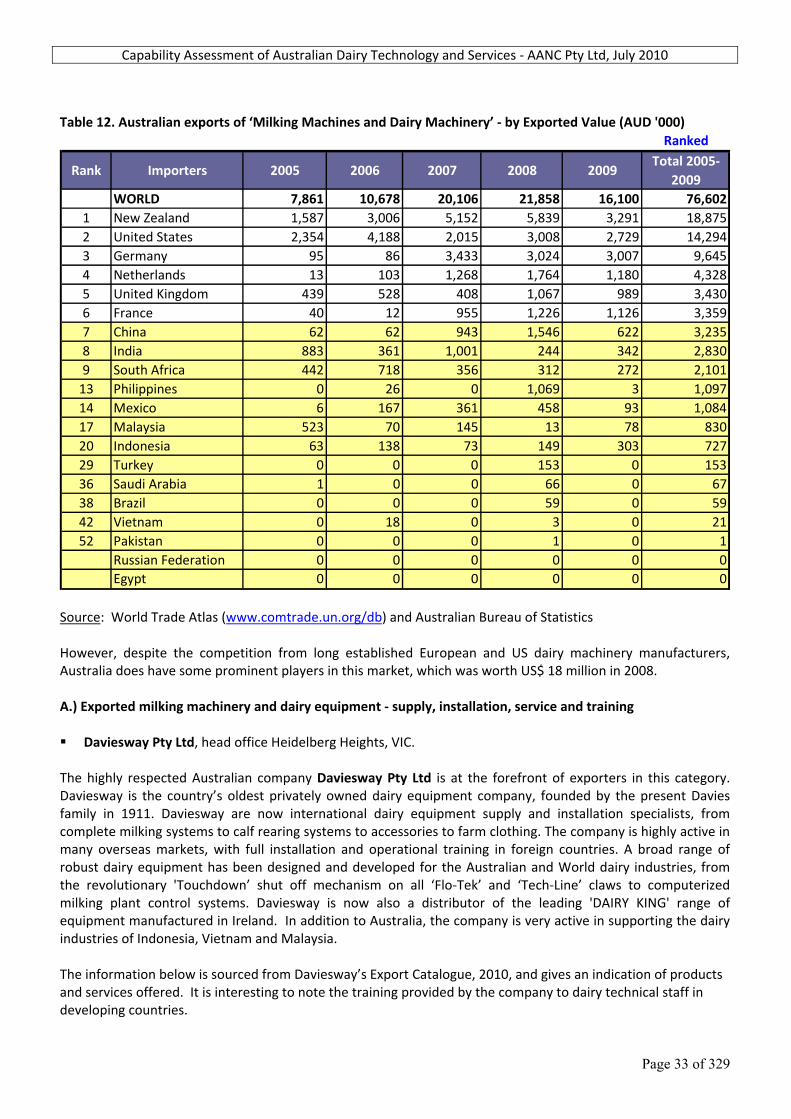
Table 12. Australian exports of ‘Milking Machines and Dairy Machinery’ ‐ by Exported Value (AUD '000)
Ranked
Rank Importers 2005 2006 2007 2008 2009Total 2005‐
2009WORLD 7,861 10,678 20,106 21,858 16,100 76,602
1 New Zealand 1,587 3,006 5,152 5,839 3,291 18,8752 United States 2,354 4,188 2,015 3,008 2,729 14,2943 Germany 95 86 3,433 3,024 3,007 9,6454 Netherlands 13 103 1,268 1,764 1,180 4,3285 United Kingdom 439 528 408 1,067 989 3,4306 France 40 12 955 1,226 1,126 3,3597 China 62 62 943 1,546 622 3,2358 India 883 361 1,001 244 342 2,8309 South Africa 442 718 356 312 272 2,101
13 Philippines 0 26 0 1,069 3 1,09714 Mexico 6 167 361 458 93 1,08417 Malaysia 523 70 145 13 78 83020 Indonesia 63 138 73 149 303 72729 Turkey 0 0 0 153 0 15336 Saudi Arabia 1 0 0 66 0 6738 Brazil 0 0 0 59 0 5942 Vietnam 0 18 0 3 0 2152 Pakistan 0 0 0 1 0 1
Russian Federation 0 0 0 0 0 0Egypt 0 0 0 0 0 0
Source: World Trade Atlas (www.comtrade.un.org/db) and Australian Bureau of Statistics However, despite the competition from long established European and US dairy machinery manufacturers, Australia does have some prominent players in this market, which was worth US$ 18 million in 2008. A.) Exported milking machinery and dairy equipment ‐ supply, installation, service and training Daviesway Pty Ltd, head office Heidelberg Heights, VIC.
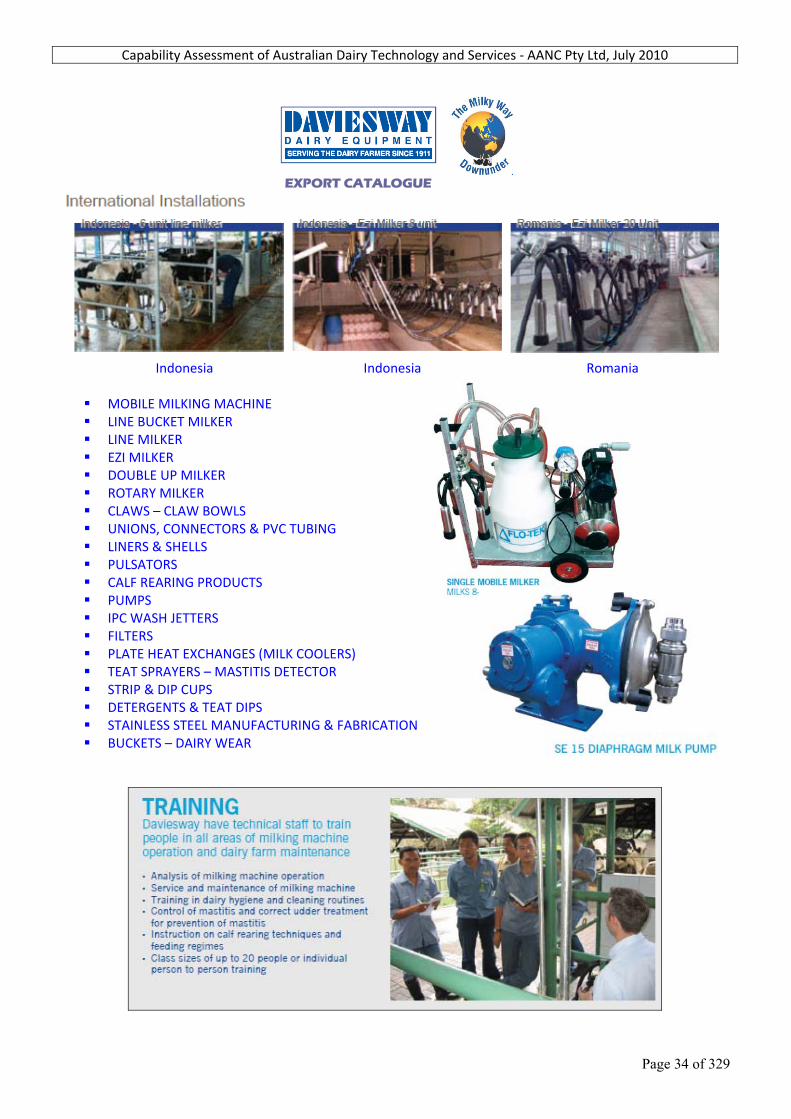
The highly respected Australian company Daviesway Pty Ltd is at the forefront of exporters in this category. Daviesway is the country’s oldest privately owned dairy equipment company, founded by the present Davies family in 1911. Daviesway are now international dairy equipment supply and installation specialists, from complete milking systems to calf rearing systems to accessories to farm clothing. The company is highly active in many overseas markets, with full installation and operational training in foreign countries. A broad range of robust dairy equipment has been designed and developed for the Australian and World dairy industries, from the revolutionary 'Touchdown’ shut off mechanism on all ‘Flo‐Tek’ and ‘Tech‐Line’ claws to computerized milking plant control systems. Daviesway is now also a distributor of the leading 'DAIRY KING' range of equipment manufactured in Ireland. In addition to Australia, the company is very active in supporting the dairy industries of Indonesia, Vietnam and Malaysia. The information below is sourced from Daviesway’s Export Catalogue, 2010, and gives an indication of products and services offered. It is interesting to note the training provided by the company to dairy technical staff in developing countries.
Capability Assessment of Australian Dairy Technology and Services ‐ AANC Pty Ltd, July 2010
Page 34 of 329
EXPORT CATALOGUE
Indonesia Indonesia Romania
MOBILE MILKING MACHINE LINE BUCKET MILKER LINE MILKER EZI MILKER DOUBLE UP MILKER ROTARY MILKER CLAWS – CLAW BOWLS UNIONS, CONNECTORS & PVC TUBING LINERS & SHELLS PULSATORS CALF REARING PRODUCTS PUMPS IPC WASH JETTERS FILTERS PLATE HEAT EXCHANGES (MILK COOLERS) TEAT SPRAYERS – MASTITIS DETECTOR STRIP & DIP CUPS DETERGENTS & TEAT DIPS STAINLESS STEEL MANUFACTURING & FABRICATION BUCKETS – DAIRY WEAR
Capability Assessment of Australian Dairy Technology and Services ‐ AANC Pty Ltd, July 2010
Page 35 of 329
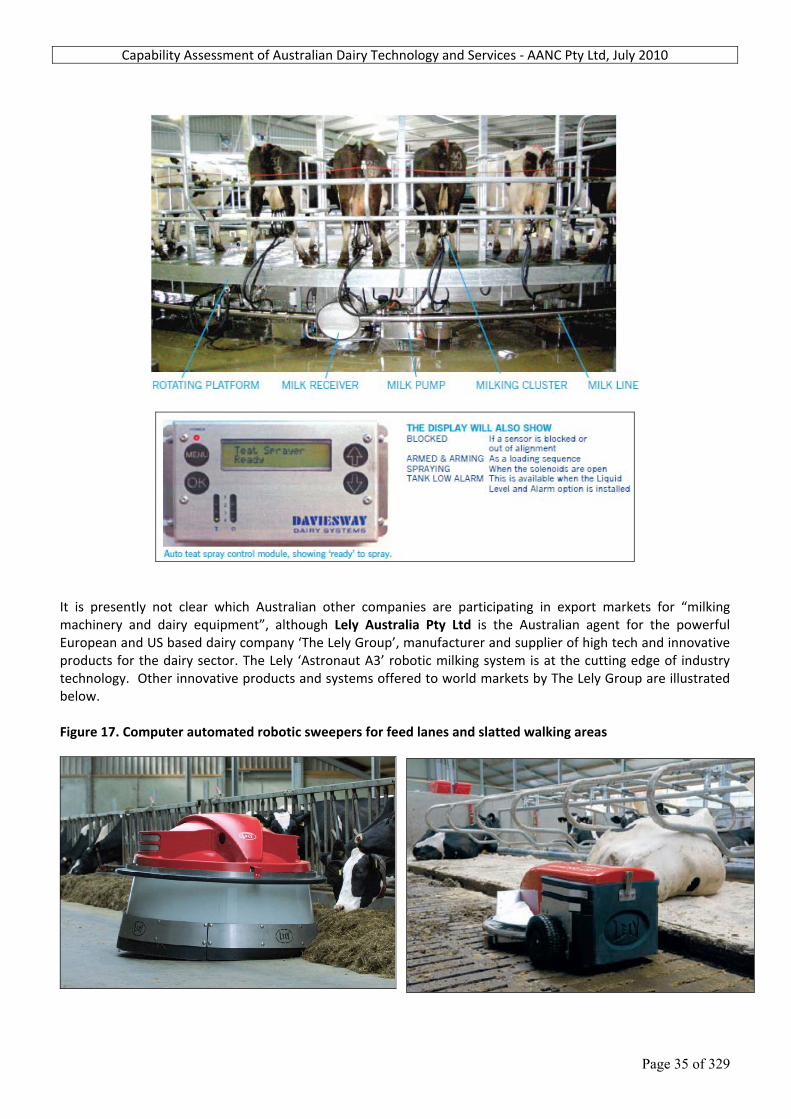
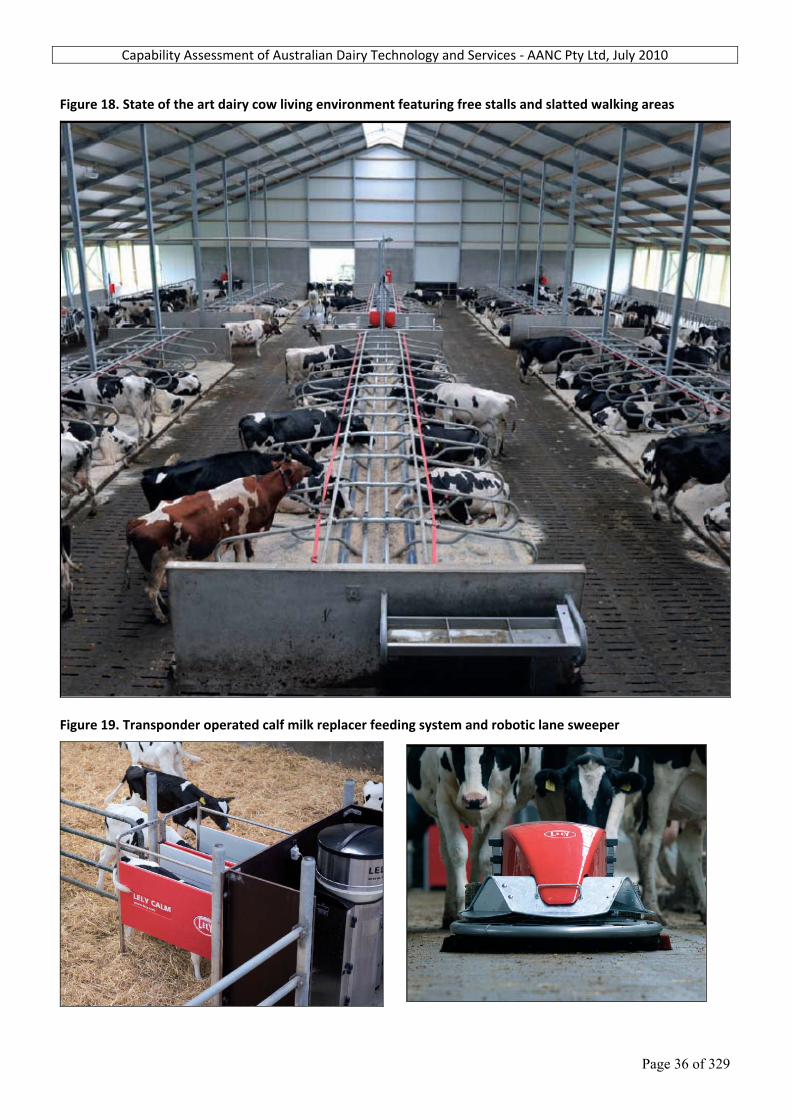
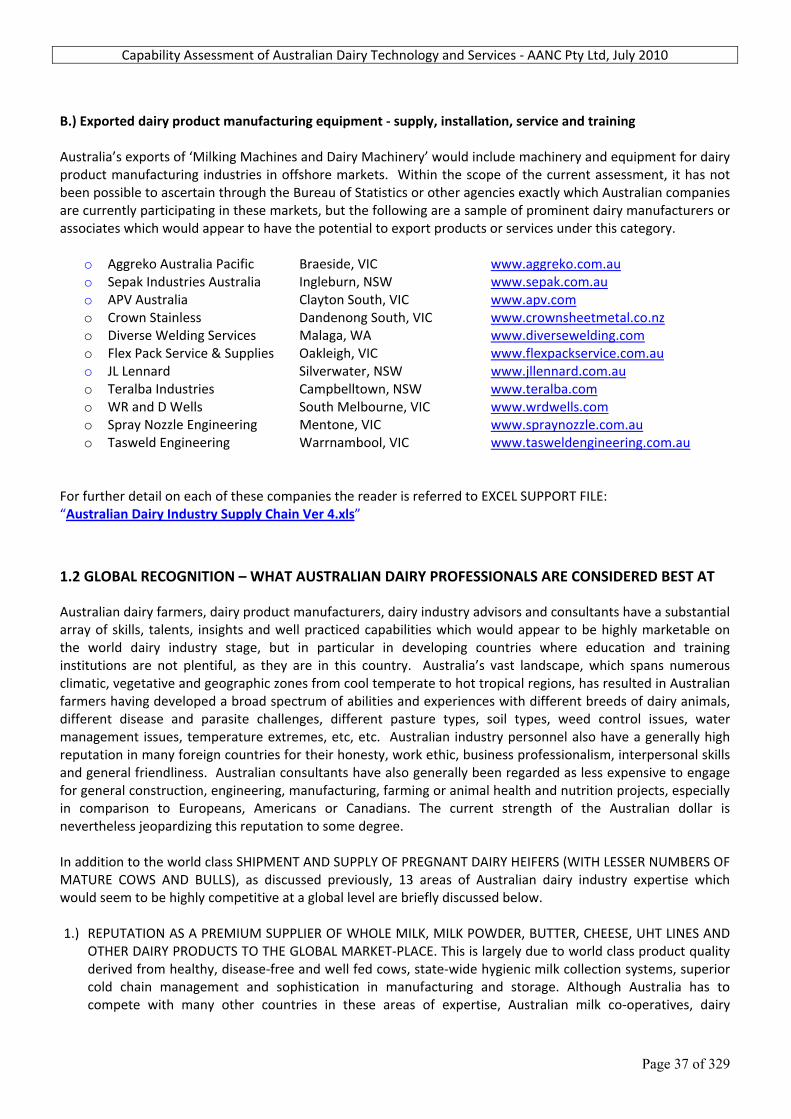
It is presently not clear which Australian other companies are participating in export markets for “milking machinery and dairy equipment”, although Lely Australia Pty Ltd is the Australian agent for the powerful European and US based dairy company ‘The Lely Group’, manufacturer and supplier of high tech and innovative products for the dairy sector. The Lely ‘Astronaut A3’ robotic milking system is at the cutting edge of industry technology. Other innovative products and systems offered to world markets by The Lely Group are illustrated below. Figure 17. Computer automated robotic sweepers for feed lanes and slatted walking areas
Capability Assessment of Australian Dairy Technology and Services ‐ AANC Pty Ltd, July 2010
Page 36 of 329
Figure 18. State of the art dairy cow living environment featuring free stalls and slatted walking areas
Figure 19. Transponder operated calf milk replacer feeding system and robotic lane sweeper
Capability Assessment of Australian Dairy Technology and Services ‐ AANC Pty Ltd, July 2010
Page 37 of 329
B.) Exported dairy product manufacturing equipment ‐ supply, installation, service and training Australia’s exports of ‘Milking Machines and Dairy Machinery’ would include machinery and equipment for dairy product manufacturing industries in offshore markets. Within the scope of the current assessment, it has not been possible to ascertain through the Bureau of Statistics or other agencies exactly which Australian companies are currently participating in these markets, but the following are a sample of prominent dairy manufacturers or associates which would appear to have the potential to export products or services under this category.
o Aggreko Australia Pacific Braeside, VIC www.aggreko.com.au o Sepak Industries Australia Ingleburn, NSW www.sepak.com.au o APV Australia Clayton South, VIC www.apv.com o Crown Stainless Dandenong South, VIC www.crownsheetmetal.co.nz o Diverse Welding Services Malaga, WA www.diversewelding.com o Flex Pack Service & Supplies Oakleigh, VIC www.flexpackservice.com.au o JL Lennard Silverwater, NSW www.jllennard.com.au o Teralba Industries Campbelltown, NSW www.teralba.com o WR and D Wells South Melbourne, VIC www.wrdwells.com o Spray Nozzle Engineering Mentone, VIC www.spraynozzle.com.au o Tasweld Engineering Warrnambool, VIC www.tasweldengineering.com.au
For further detail on each of these companies the reader is referred to EXCEL SUPPORT FILE: “Australian Dairy Industry Supply Chain Ver 4.xls”
1.2 GLOBAL RECOGNITION – WHAT AUSTRALIAN DAIRY PROFESSIONALS ARE CONSIDERED BEST AT Australian dairy farmers, dairy product manufacturers, dairy industry advisors and consultants have a substantial array of skills, talents, insights and well practiced capabilities which would appear to be highly marketable on the world dairy industry stage, but in particular in developing countries where education and training institutions are not plentiful, as they are in this country. Australia’s vast landscape, which spans numerous climatic, vegetative and geographic zones from cool temperate to hot tropical regions, has resulted in Australian farmers having developed a broad spectrum of abilities and experiences with different breeds of dairy animals, different disease and parasite challenges, different pasture types, soil types, weed control issues, water management issues, temperature extremes, etc, etc. Australian industry personnel also have a generally high reputation in many foreign countries for their honesty, work ethic, business professionalism, interpersonal skills and general friendliness. Australian consultants have also generally been regarded as less expensive to engage for general construction, engineering, manufacturing, farming or animal health and nutrition projects, especially in comparison to Europeans, Americans or Canadians. The current strength of the Australian dollar is nevertheless jeopardizing this reputation to some degree. In addition to the world class SHIPMENT AND SUPPLY OF PREGNANT DAIRY HEIFERS (WITH LESSER NUMBERS OF MATURE COWS AND BULLS), as discussed previously, 13 areas of Australian dairy industry expertise which would seem to be highly competitive at a global level are briefly discussed below. 1.) REPUTATION AS A PREMIUM SUPPLIER OF WHOLE MILK, MILK POWDER, BUTTER, CHEESE, UHT LINES AND
OTHER DAIRY PRODUCTS TO THE GLOBAL MARKET‐PLACE. This is largely due to world class product quality derived from healthy, disease‐free and well fed cows, state‐wide hygienic milk collection systems, superior cold chain management and sophistication in manufacturing and storage. Although Australia has to compete with many other countries in these areas of expertise, Australian milk co‐operatives, dairy
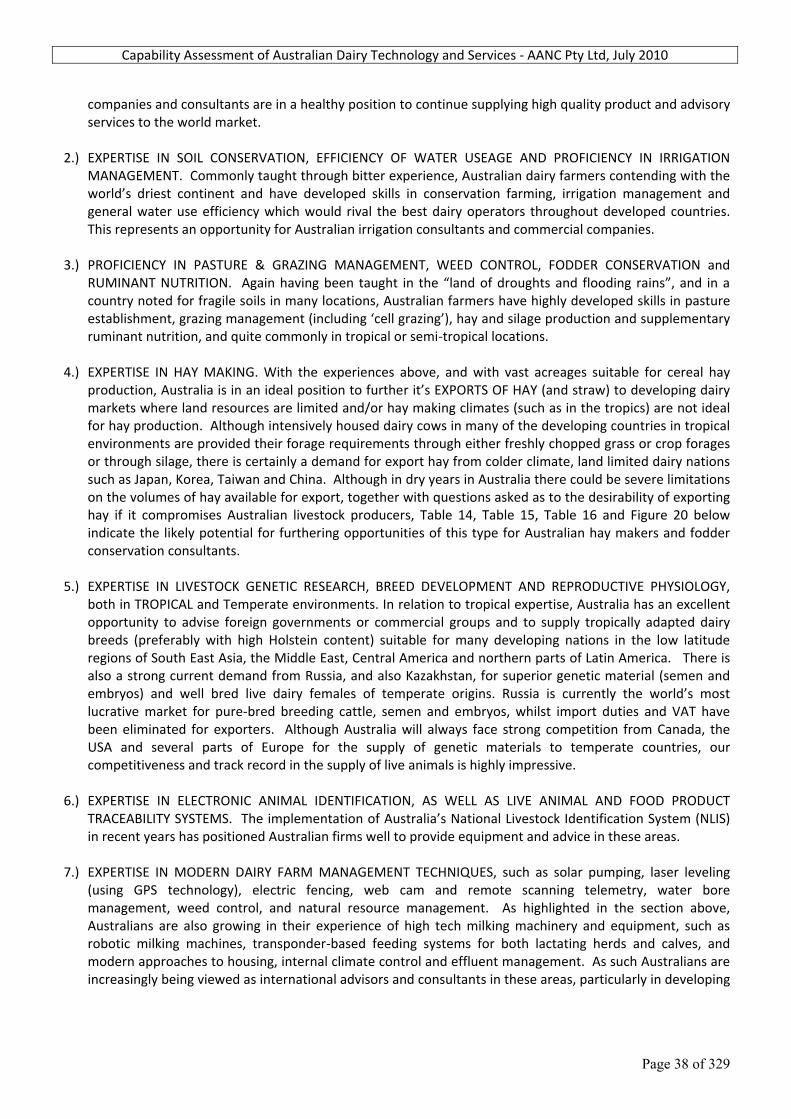
Capability Assessment of Australian Dairy Technology and Services ‐ AANC Pty Ltd, July 2010
Page 38 of 329
companies and consultants are in a healthy position to continue supplying high quality product and advisory services to the world market.
2.) EXPERTISE IN SOIL CONSERVATION, EFFICIENCY OF WATER USEAGE AND PROFICIENCY IN IRRIGATION
MANAGEMENT. Commonly taught through bitter experience, Australian dairy farmers contending with the world’s driest continent and have developed skills in conservation farming, irrigation management and general water use efficiency which would rival the best dairy operators throughout developed countries. This represents an opportunity for Australian irrigation consultants and commercial companies.
3.) PROFICIENCY IN PASTURE & GRAZING MANAGEMENT, WEED CONTROL, FODDER CONSERVATION and
RUMINANT NUTRITION. Again having been taught in the “land of droughts and flooding rains”, and in a country noted for fragile soils in many locations, Australian farmers have highly developed skills in pasture establishment, grazing management (including ‘cell grazing’), hay and silage production and supplementary ruminant nutrition, and quite commonly in tropical or semi‐tropical locations.
4.) EXPERTISE IN HAY MAKING. With the experiences above, and with vast acreages suitable for cereal hay
production, Australia is in an ideal position to further it’s EXPORTS OF HAY (and straw) to developing dairy markets where land resources are limited and/or hay making climates (such as in the tropics) are not ideal for hay production. Although intensively housed dairy cows in many of the developing countries in tropical environments are provided their forage requirements through either freshly chopped grass or crop forages or through silage, there is certainly a demand for export hay from colder climate, land limited dairy nations such as Japan, Korea, Taiwan and China. Although in dry years in Australia there could be severe limitations on the volumes of hay available for export, together with questions asked as to the desirability of exporting hay if it compromises Australian livestock producers, Table 14, Table 15, Table 16 and Figure 20 below indicate the likely potential for furthering opportunities of this type for Australian hay makers and fodder conservation consultants.
5.) EXPERTISE IN LIVESTOCK GENETIC RESEARCH, BREED DEVELOPMENT AND REPRODUCTIVE PHYSIOLOGY,
both in TROPICAL and Temperate environments. In relation to tropical expertise, Australia has an excellent opportunity to advise foreign governments or commercial groups and to supply tropically adapted dairy breeds (preferably with high Holstein content) suitable for many developing nations in the low latitude regions of South East Asia, the Middle East, Central America and northern parts of Latin America. There is also a strong current demand from Russia, and also Kazakhstan, for superior genetic material (semen and embryos) and well bred live dairy females of temperate origins. Russia is currently the world’s most lucrative market for pure‐bred breeding cattle, semen and embryos, whilst import duties and VAT have been eliminated for exporters. Although Australia will always face strong competition from Canada, the USA and several parts of Europe for the supply of genetic materials to temperate countries, our competitiveness and track record in the supply of live animals is highly impressive.
6.) EXPERTISE IN ELECTRONIC ANIMAL IDENTIFICATION, AS WELL AS LIVE ANIMAL AND FOOD PRODUCT
TRACEABILITY SYSTEMS. The implementation of Australia’s National Livestock Identification System (NLIS) in recent years has positioned Australian firms well to provide equipment and advice in these areas.
7.) EXPERTISE IN MODERN DAIRY FARM MANAGEMENT TECHNIQUES, such as solar pumping, laser leveling
(using GPS technology), electric fencing, web cam and remote scanning telemetry, water bore management, weed control, and natural resource management. As highlighted in the section above, Australians are also growing in their experience of high tech milking machinery and equipment, such as robotic milking machines, transponder‐based feeding systems for both lactating herds and calves, and modern approaches to housing, internal climate control and effluent management. As such Australians are increasingly being viewed as international advisors and consultants in these areas, particularly in developing
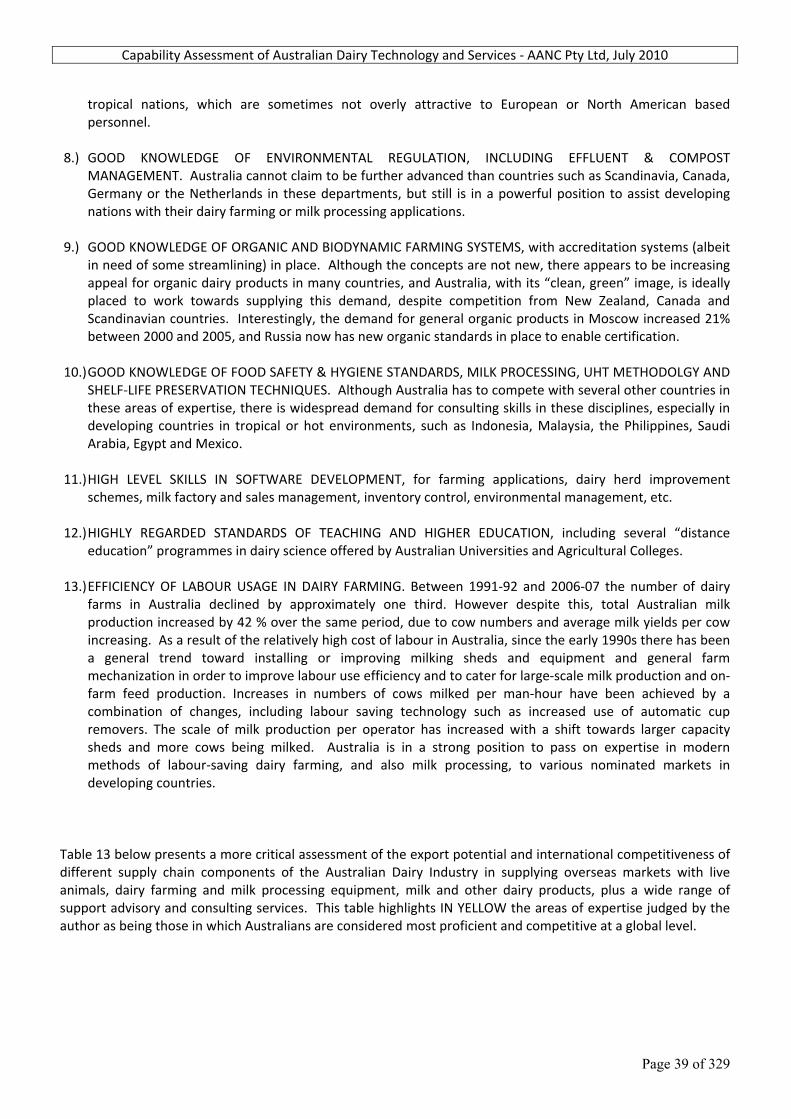
Capability Assessment of Australian Dairy Technology and Services ‐ AANC Pty Ltd, July 2010
Page 39 of 329
tropical nations, which are sometimes not overly attractive to European or North American based personnel.
8.) GOOD KNOWLEDGE OF ENVIRONMENTAL REGULATION, INCLUDING EFFLUENT & COMPOST
MANAGEMENT. Australia cannot claim to be further advanced than countries such as Scandinavia, Canada, Germany or the Netherlands in these departments, but still is in a powerful position to assist developing nations with their dairy farming or milk processing applications.
9.) GOOD KNOWLEDGE OF ORGANIC AND BIODYNAMIC FARMING SYSTEMS, with accreditation systems (albeit
in need of some streamlining) in place. Although the concepts are not new, there appears to be increasing appeal for organic dairy products in many countries, and Australia, with its “clean, green” image, is ideally placed to work towards supplying this demand, despite competition from New Zealand, Canada and Scandinavian countries. Interestingly, the demand for general organic products in Moscow increased 21% between 2000 and 2005, and Russia now has new organic standards in place to enable certification.
10.) GOOD KNOWLEDGE OF FOOD SAFETY & HYGIENE STANDARDS, MILK PROCESSING, UHT METHODOLGY AND
SHELF‐LIFE PRESERVATION TECHNIQUES. Although Australia has to compete with several other countries in these areas of expertise, there is widespread demand for consulting skills in these disciplines, especially in developing countries in tropical or hot environments, such as Indonesia, Malaysia, the Philippines, Saudi Arabia, Egypt and Mexico.
11.) HIGH LEVEL SKILLS IN SOFTWARE DEVELOPMENT, for farming applications, dairy herd improvement
schemes, milk factory and sales management, inventory control, environmental management, etc. 12.) HIGHLY REGARDED STANDARDS OF TEACHING AND HIGHER EDUCATION, including several “distance
education” programmes in dairy science offered by Australian Universities and Agricultural Colleges. 13.) EFFICIENCY OF LABOUR USAGE IN DAIRY FARMING. Between 1991‐92 and 2006‐07 the number of dairy
farms in Australia declined by approximately one third. However despite this, total Australian milk production increased by 42 % over the same period, due to cow numbers and average milk yields per cow increasing. As a result of the relatively high cost of labour in Australia, since the early 1990s there has been a general trend toward installing or improving milking sheds and equipment and general farm mechanization in order to improve labour use efficiency and to cater for large‐scale milk production and on‐farm feed production. Increases in numbers of cows milked per man‐hour have been achieved by a combination of changes, including labour saving technology such as increased use of automatic cup removers. The scale of milk production per operator has increased with a shift towards larger capacity sheds and more cows being milked. Australia is in a strong position to pass on expertise in modern methods of labour‐saving dairy farming, and also milk processing, to various nominated markets in developing countries.
Table 13 below presents a more critical assessment of the export potential and international competitiveness of different supply chain components of the Australian Dairy Industry in supplying overseas markets with live animals, dairy farming and milk processing equipment, milk and other dairy products, plus a wide range of support advisory and consulting services. This table highlights IN YELLOW the areas of expertise judged by the author as being those in which Australians are considered most proficient and competitive at a global level.
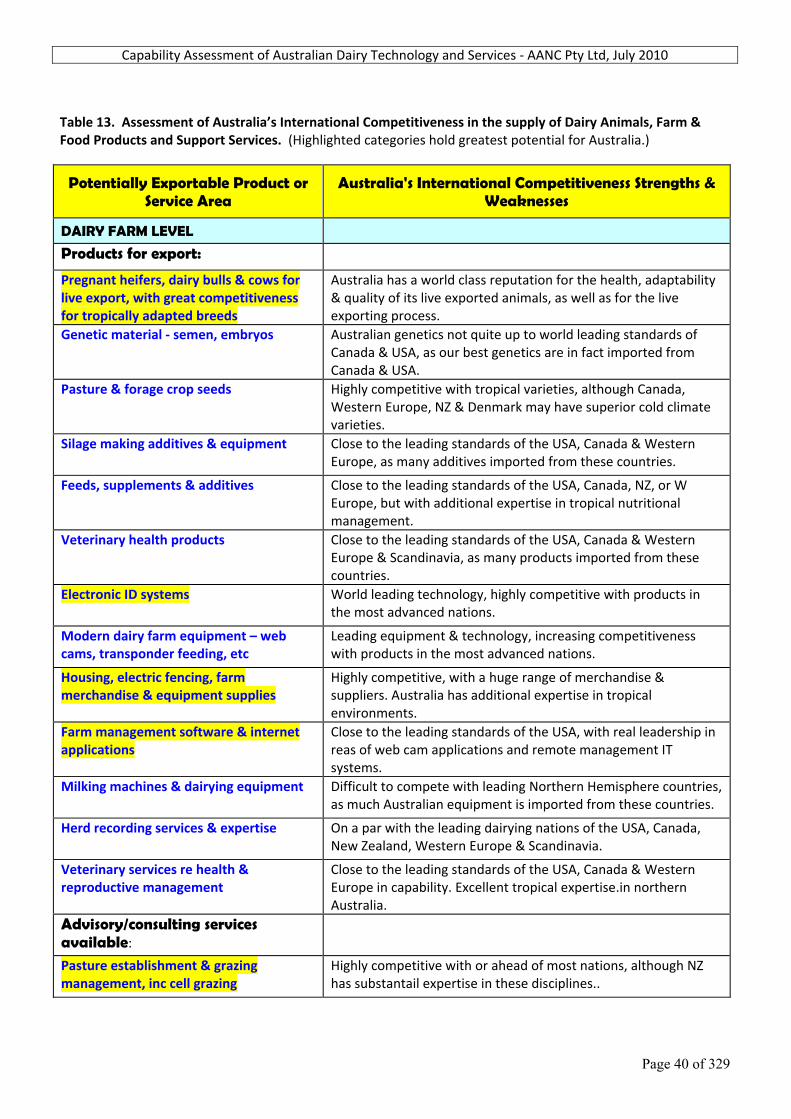
Capability Assessment of Australian Dairy Technology and Services ‐ AANC Pty Ltd, July 2010
Page 40 of 329
Table 13. Assessment of Australia’s International Competitiveness in the supply of Dairy Animals, Farm & Food Products and Support Services. (Highlighted categories hold greatest potential for Australia.)
Potentially Exportable Product or Service Area
Australia's International Competitiveness Strengths & Weaknesses
DAIRY FARM LEVEL
Products for export:
Pregnant heifers, dairy bulls & cows for live export, with great competitiveness for tropically adapted breeds
Australia has a world class reputation for the health, adaptability & quality of its live exported animals, as well as for the live exporting process.
Genetic material ‐ semen, embryos Australian genetics not quite up to world leading standards of Canada & USA, as our best genetics are in fact imported from Canada & USA.
Pasture & forage crop seeds Highly competitive with tropical varieties, although Canada, Western Europe, NZ & Denmark may have superior cold climate varieties.
Silage making additives & equipment Close to the leading standards of the USA, Canada & Western Europe, as many additives imported from these countries.
Feeds, supplements & additives Close to the leading standards of the USA, Canada, NZ, or W Europe, but with additional expertise in tropical nutritional management.
Veterinary health products Close to the leading standards of the USA, Canada & Western Europe & Scandinavia, as many products imported from these countries.
Electronic ID systems World leading technology, highly competitive with products in the most advanced nations.
Modern dairy farm equipment – web cams, transponder feeding, etc
Leading equipment & technology, increasing competitiveness with products in the most advanced nations.
Housing, electric fencing, farm merchandise & equipment supplies
Highly competitive, with a huge range of merchandise & suppliers. Australia has additional expertise in tropical environments.
Farm management software & internet applications
Close to the leading standards of the USA, with real leadership in reas of web cam applications and remote management IT systems.
Milking machines & dairying equipment Difficult to compete with leading Northern Hemisphere countries, as much Australian equipment is imported from these countries.
Herd recording services & expertise On a par with the leading dairying nations of the USA, Canada, New Zealand, Western Europe & Scandinavia.
Veterinary services re health & reproductive management
Close to the leading standards of the USA, Canada & Western Europe in capability. Excellent tropical expertise.in northern Australia.
Advisory/consulting services available:
Pasture establishment & grazing management, inc cell grazing
Highly competitive with or ahead of most nations, although NZ has substantail expertise in these disciplines..
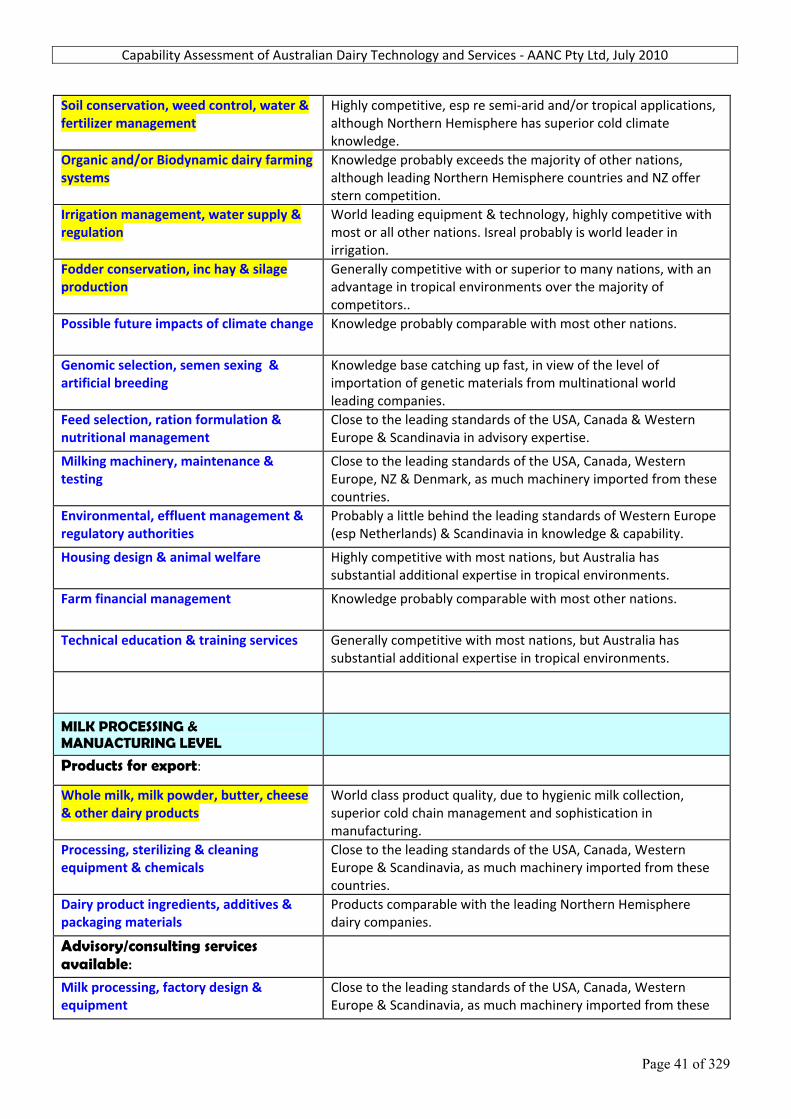
Capability Assessment of Australian Dairy Technology and Services ‐ AANC Pty Ltd, July 2010
Page 41 of 329
Soil conservation, weed control, water & fertilizer management
Highly competitive, esp re semi‐arid and/or tropical applications, although Northern Hemisphere has superior cold climate knowledge.
Organic and/or Biodynamic dairy farming systems
Knowledge probably exceeds the majority of other nations, although leading Northern Hemisphere countries and NZ offer stern competition.
Irrigation management, water supply & regulation
World leading equipment & technology, highly competitive with most or all other nations. Isreal probably is world leader in irrigation.
Fodder conservation, inc hay & silage production
Generally competitive with or superior to many nations, with an advantage in tropical environments over the majority of competitors..
Possible future impacts of climate change Knowledge probably comparable with most other nations.
Genomic selection, semen sexing & artificial breeding
Knowledge base catching up fast, in view of the level of importation of genetic materials from multinational world leading companies.
Feed selection, ration formulation & nutritional management
Close to the leading standards of the USA, Canada & Western Europe & Scandinavia in advisory expertise.
Milking machinery, maintenance & testing
Close to the leading standards of the USA, Canada, Western Europe, NZ & Denmark, as much machinery imported from these countries.
Environmental, effluent management & regulatory authorities
Probably a little behind the leading standards of Western Europe (esp Netherlands) & Scandinavia in knowledge & capability.
Housing design & animal welfare Highly competitive with most nations, but Australia has substantial additional expertise in tropical environments.
Farm financial management Knowledge probably comparable with most other nations.
Technical education & training services Generally competitive with most nations, but Australia has substantial additional expertise in tropical environments.
MILK PROCESSING & MANUACTURING LEVEL
Products for export:
Whole milk, milk powder, butter, cheese & other dairy products
World class product quality, due to hygienic milk collection, superior cold chain management and sophistication in manufacturing.
Processing, sterilizing & cleaning equipment & chemicals
Close to the leading standards of the USA, Canada, Western Europe & Scandinavia, as much machinery imported from these countries.
Dairy product ingredients, additives & packaging materials
Products comparable with the leading Northern Hemisphere dairy companies.
Advisory/consulting services available:
Milk processing, factory design & equipment
Close to the leading standards of the USA, Canada, Western Europe & Scandinavia, as much machinery imported from these
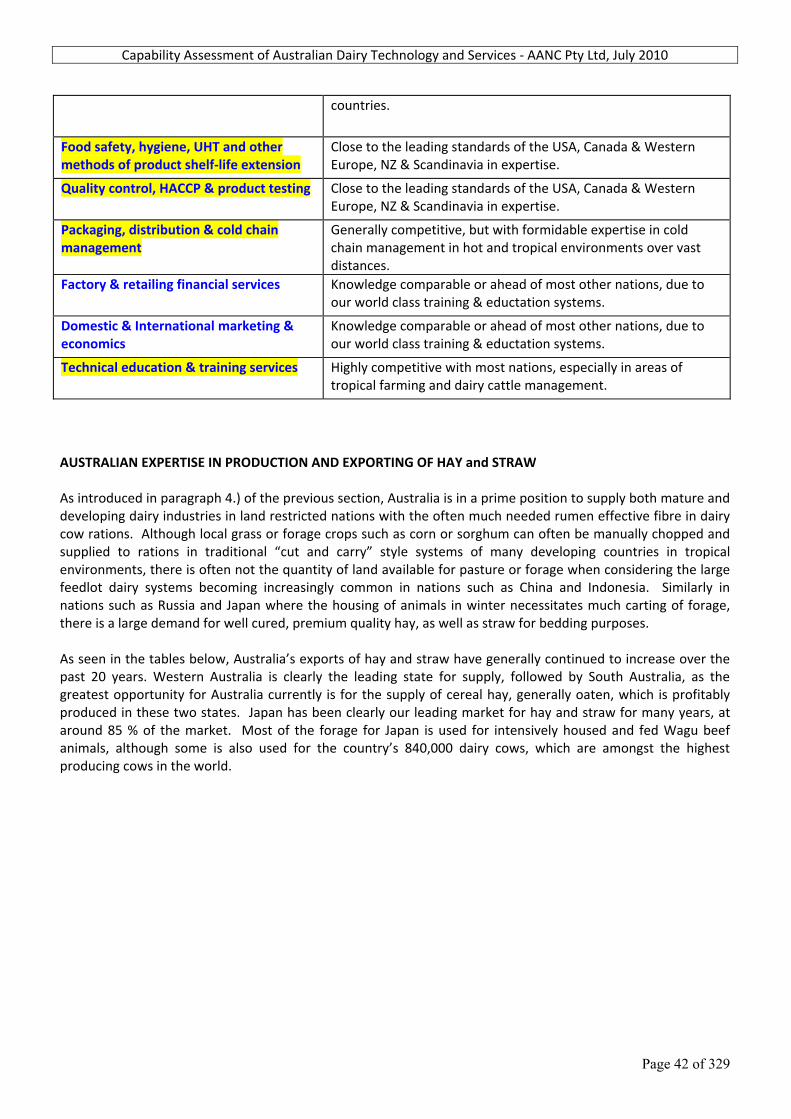
Capability Assessment of Australian Dairy Technology and Services ‐ AANC Pty Ltd, July 2010
Page 42 of 329
countries.
Food safety, hygiene, UHT and other methods of product shelf‐life extension
Close to the leading standards of the USA, Canada & Western Europe, NZ & Scandinavia in expertise.
Quality control, HACCP & product testing Close to the leading standards of the USA, Canada & Western Europe, NZ & Scandinavia in expertise.
Packaging, distribution & cold chain management
Generally competitive, but with formidable expertise in cold chain management in hot and tropical environments over vast distances.
Factory & retailing financial services Knowledge comparable or ahead of most other nations, due to our world class training & eductation systems.
Domestic & International marketing & economics
Knowledge comparable or ahead of most other nations, due to our world class training & eductation systems.
Technical education & training services Highly competitive with most nations, especially in areas of tropical farming and dairy cattle management.
AUSTRALIAN EXPERTISE IN PRODUCTION AND EXPORTING OF HAY and STRAW As introduced in paragraph 4.) of the previous section, Australia is in a prime position to supply both mature and developing dairy industries in land restricted nations with the often much needed rumen effective fibre in dairy cow rations. Although local grass or forage crops such as corn or sorghum can often be manually chopped and supplied to rations in traditional “cut and carry” style systems of many developing countries in tropical environments, there is often not the quantity of land available for pasture or forage when considering the large feedlot dairy systems becoming increasingly common in nations such as China and Indonesia. Similarly in nations such as Russia and Japan where the housing of animals in winter necessitates much carting of forage, there is a large demand for well cured, premium quality hay, as well as straw for bedding purposes. As seen in the tables below, Australia’s exports of hay and straw have generally continued to increase over the past 20 years. Western Australia is clearly the leading state for supply, followed by South Australia, as the greatest opportunity for Australia currently is for the supply of cereal hay, generally oaten, which is profitably produced in these two states. Japan has been clearly our leading market for hay and straw for many years, at around 85 % of the market. Most of the forage for Japan is used for intensively housed and fed Wagu beef animals, although some is also used for the country’s 840,000 dairy cows, which are amongst the highest producing cows in the world.

Capability Assessment of Australian Dairy Technology and Services ‐ AANC Pty Ltd, July 2010
Page 43 of 329
Figure 20. Australian exports of Hay and Straw (‘000 MT), 1989 to 2009
Table 14. Australian Exports of Hay and Straw ('000 MT), by State, 1989‐2009
Year AUSTRALIA NSW Vic Qld SA WA Tas NT ACT
1989/90 118.6 3.4 15.5 12.1 10.9 76.8 0 0.090/91 103.4 8.1 11.6 3.6 17.5 62.6 0 0.091/92 145.4 10.7 23.1 2.7 40.3 68.5 0 0.092/93 158.9 15.8 19.2 2.9 34.6 86.0 0 0.493/94 216.3 21.5 32.9 3.9 59.1 96.7 0 2.394/95 209.7 5.6 34.0 4.7 49.3 114.0 0 2.195/96 277.0 10.6 48.9 6.8 108.5 100.2 0 2.096/97 323.5 15.6 63.7 17.8 125.9 98.3 0 2.297/98 282.8 15.7 56.0 12.0 83.0 115.8 0 0.398/99 415.7 21.6 70.2 15.7 134.6 173.5 0 0.199/00 405.5 22.0 71.0 16.0 155.0 141.0 0 0.5
2000/01 431.001/02 477.3 14.3 82.8 195.8 184.302/03 558.4 18.5 95.9 185.0 259.003/04 544.3 14.3 72.9 173.1 284.004/05 685.005/06 713.006/07 504.007/08 640.208/09 678.7 59.1 113.5 217.2
Sources of above data: Australian Bureau of Statistics (1989‐2008), and Australian Fodder Industry Association (2008‐2009).
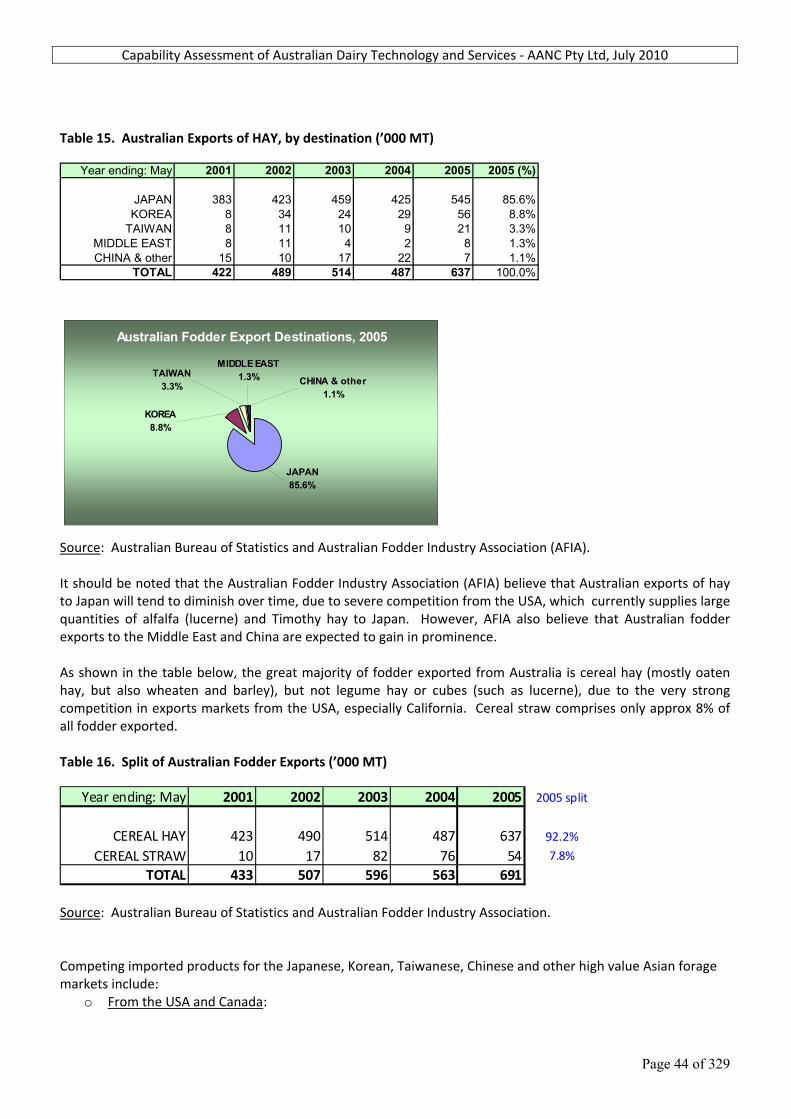
Capability Assessment of Australian Dairy Technology and Services ‐ AANC Pty Ltd, July 2010
Page 44 of 329
Table 15. Australian Exports of HAY, by destination (’000 MT)
Year ending: May 2001 2002 2003 2004 2005 2005 (%)
JAPAN 383 423 459 425 545 85.6%KOREA 8 34 24 29 56 8.8%
TAIWAN 8 11 10 9 21 3.3%MIDDLE EAST 8 11 4 2 8 1.3%CHINA & other 15 10 17 22 7 1.1%
TOTAL 422 489 514 487 637 100.0%
Australian Fodder Export Destinations, 2005
CHINA & other1.1%
MIDDLE EAST1.3%TAIWAN
3.3%
KOREA8.8%
JAPAN85.6%
Source: Australian Bureau of Statistics and Australian Fodder Industry Association (AFIA). It should be noted that the Australian Fodder Industry Association (AFIA) believe that Australian exports of hay to Japan will tend to diminish over time, due to severe competition from the USA, which currently supplies large quantities of alfalfa (lucerne) and Timothy hay to Japan. However, AFIA also believe that Australian fodder exports to the Middle East and China are expected to gain in prominence. As shown in the table below, the great majority of fodder exported from Australia is cereal hay (mostly oaten hay, but also wheaten and barley), but not legume hay or cubes (such as lucerne), due to the very strong competition in exports markets from the USA, especially California. Cereal straw comprises only approx 8% of all fodder exported. Table 16. Split of Australian Fodder Exports (’000 MT)
Year ending: May 2001 2002 2003 2004 2005 2005 split
CEREAL HAY 423 490 514 487 637 92.2%
CEREAL STRAW 10 17 82 76 54 7.8%
TOTAL 433 507 596 563 691 Source: Australian Bureau of Statistics and Australian Fodder Industry Association. Competing imported products for the Japanese, Korean, Taiwanese, Chinese and other high value Asian forage markets include:
o From the USA and Canada:

Capability Assessment of Australian Dairy Technology and Services ‐ AANC Pty Ltd, July 2010
Page 45 of 329
Alfalfa (Lucerne) Hay, Timothy Hay, Bermuda Hay, Oaten Hay, Ryegrass Hay, Sudan Grass Hay, Fescue Hay.
o From Indonesia, Thailand or the Philippines: Sugar Cane Tops, Rice Straw, Sugar Cane Bagasse.
China hay import statistics. http://www.hesitan.com/jgqb_tpxw/2010‐07‐08/17544.chtml From January ‐ May 2010, a total of 82,800 MT (valued at approx US$21,715,700, with average import price of US$262.20/ton) alfalfa/lucerne were imported into China, an increase of 500% compared with the same period last year. From January ‐ Dec 2009, a total of 76,600 MT (valued at approx US$20,434,100, with an average import price of US$266.71/ton) alfalfa/lucerne were imported into China, an increase of 261% compared with 2008. AUSTRALIAN EXPERTISE IN THE NUTRITION OF DAIRY CATTLE Supplementary feeding of cows on grains and concentrates has increased significantly in Australia since the early 1990s. The average quantity of purchased grains and concentrates used in 2006‐07 was more than three times higher than in 1991‐92, while the average quantity fed per cow has doubled. These statistics have been followed by concomitant increases in milk yields per cow per day, often as farmers are forced to feed higher levels of concentrates during periods of drought. However, the seemingly too frequent need to more intensively feed dairy cows and heifers has lead to the development of a vast pool of knowledge in Australia when it comes to total mixed rations, or the supplementary feeding of dairy cows, and this extends to applications such as the use of molasses‐based liquid concentrates, urea‐based mineral loose mixes, as well as compressed lick‐block formulations. Figure 21. Increasing use of Feed Grains, Concentrates & By‐products on Aust Dairy Farms, 1991 to 2007
Source: Ashton, D and Mackinnon, D (2008): Australian Dairy Industry: Use of technology and management practices on dairy farms, 1991‐92 to 2006‐07. ABARE Research Report 08.12, Canberra, Dec 2008. An indication of the level of expertise in animal nutrition in Australia is given by considering the membership of the Stockfeed Manufacturers Council of Australia (SFMCA), which represents feed milling companies throughout
Capability Assessment of Australian Dairy Technology and Services ‐ AANC Pty Ltd, July 2010
Page 46 of 329
the country. SFMCA members manufacture over 5,500,000 tonnes of feed annually, which is principally feed supplied to commercial poultry, pig, beef, dairy, sheep, horse, aquaculture and household livestock producers. SFMCA members operate 116 feed milling sites located in all States of Australia. The number of mills and volume of feed manufactured represents over 90 % of all commercial feed sold within Australia. Although not all these feedmills manufacture dairy feeds, the majority of them do, and nearly all of these mills have specialist consulting or full time employed animal nutritionists, many of which have good knowledge of dairy and ruminant production systems. Potentially many of these nutritionists would be in a position of knowledge in order to be of value in an advisory or consulting role for developing dairy industries in offshore markets.
2. MAPPING THE SUPPLY CHAIN
KEY PARTICIPANTS IN THE SUPPLY CHAIN OF AUSTRALIAN DAIRY TECHNOLOGY AND SERVICES The reader is referred to EXCEL SUPPORT FILE:
“Australian Dairy Industry Supply Chain Ver 4 (Final).xls” This supply chain can be used as a guide to the formation of future Austrade missions to foreign developing countries which have expressed an interest in establishing ‘greenfields’ integrated dairy operations. Members of such a trade mission could be individuals drawn from the following specialist categories. Farm level
Consultants ‐ Dairy Farm design & layout Consultants ‐ Pastures, Crops & Farm Management Fencing requirements Pasture & forage crop seeds Pasture & forage crop protection Silage making additives & equipment Farm sheds, silos, steel yards, etc Farm merchandise & equipment Milking machinery, maintenance & testing Irrigation management, water supply & regulation Environmental, effluent mgt & regulatory authorities Live Export Agents Australian Livestock Export Corporation Artificial Breeding ‐ AI, embryos, genomic selection Dairy Breed Societies ‐ Holstein Australia; Jersey Australia Consultants ‐ Health, Nutrition & Herd Management
(ASSUME ALL FEEDS SOURCED LOCALLY, with micro‐additives imported as required) Veterinary health products Veterinary services re health & reproductive management Herd Management Software
Processing & Manufacturing level
Dairy product manufacturing consultants/trainers Equipment suppliers Packaging suppliers Engineering consultants Refrigeration/cold chain specialists Dairy foods sales & marketing consultants

Capability Assessment of Australian Dairy Technology and Services ‐ AANC Pty Ltd, July 2010
Page 47 of 329
Figure 22. Key components of the Value Chain for the Australian Dairy Industry, highlighting volatility‐driving points of uncertainty in the chain
Source: Dairy Australia: Dairy 2010 ‐ Situation and Outlook
Capability Assessment of Australian Dairy Technology and Services ‐ AANC Pty Ltd, July 2010
Page 48 of 329
3. CLUSTER APPROACHES
As used by the United Nations Industrial Development Organisation, the term “cluster” can be defined as a sectoral and geographical concentration of enterprises, in particular small and medium sized enterprises, faced with common opportunities and threats.
EXAMPLES OF CLUSTER APPROACHES BY SERVICES/EQUIPMENT/TECHNOLOGY SUPPLIERS A.) Example of a Dairy Industry Cluster in South Western Victoria (PRIMARY CLUSTER) ‐ Dairy Farms / Milk Processing Plants / Services.
Dairy farmers – east to west from Geelong to Hamilton, and north to south from Ballarat to Warrnambool. Local district dairy farms, from 400 cow feedlots on ‘total mixed ration’, to pasture based ryegrass/clover/medic grazing farms with 50 milking cows on grain supplements at milking time only.
Milk and dairy product processing plants ‐ Murray Goulburn Co‐operative Co Ltd, and Warrnambool Cheese & Butter Factory Holdings Ltd. Both located throughout Victoria.
Commercial stockfeed mills ‐ Five Star Stockfeeds, Camperdown; Ridley AgriProducts, Terang, Noorat
and St Arnaud.
Veterinary pathology laboratories ‐ Regional Veterinary Laboratory (Vic DPI), Benalla; Timboon Veterinary Group, Timboon.
Dairy product food testing laboratories ‐ DTS Food Laboratories, Flemington; Silliker Australia,
Blackburn.
Multinational Animal Health companies (eg, for parasitides, vaccines, antibiotics) ‐ Intervet/Schering‐Plough Animal Health/Coopers Animal Health, Bendigo East.
Multinational Animal Nutrition companies (for additives, eg, vitamin/mineral premixes, antioxidants) –
Alltech Biotechnology Pty Ltd, Dandenong South; Feedworks, Romsey.
Multinational Genetic Improvement companies – Genetics Australia, Bacchus Marsh; Alta Genetics Australia Pty Ltd, Tullamarine; Agri‐Gene Pty Ltd, Wangaratta; Semex Pty Ltd, Melton.
Herd Recording Centres ‐ Hico Australia (Gippsland & Colac Herd Improvement Co‐ops), Colac; Northern
Herd Development Co‐Op, Cohuna.
Pasture Seed Companies – Heritage Seeds, Mulgrave; DPI, Victoria ‐ Hamilton Centre.
Multinational Fertilizer Companies ‐ Incitec Pivot Ltd, Melbourne.
Silage consultants & inoculant suppliers ‐ Vic DPI, Ellinbank Centre.
Multinational equipment supply companies ‐ milking machinery, plus dairy processing plant machinery & equipment ‐ DeLaval (Australian agent), Melbourne; Daviesway Dairy Equipment, Heidelberg Heights; Lely Australia Pty Ltd, Rochester; Tetra Pak Marketing, Mulgrave; Dairy Pumping Systems, Lilydale; Dairy Tech Refrigeration, Leongatha.
Farm merchandise & equipment – Combined Rural Traders (CRT); Murray Goulburn Co‐operative Co Ltd;
Elders Farm supplies; Landmark Merchandise – all Victoria wide.
Capability Assessment of Australian Dairy Technology and Services ‐ AANC Pty Ltd, July 2010
Page 49 of 329
Transport & distribution companies, including refrigeration specialists – UDT Logistics, South Melbourne;
Coolpac, Glenhuntly.
Private veterinarians – Dr Jacob Malmo (Maffra Veterinary Centre), Timboon Veterinary Group; Nutritionists – Dr John Moran; food safety & HACCP inspectors and other service providers,
Wholesale and retail participants.
Public sector members:
Department of Primary Industries, Victoria ‐ provides general industry advisory services, together with food safety & hygiene inspection services, plus environmental regulation of the industry.
Teaching and Research Institutions ‐ CRC for Innovative Dairy Products, Southbank; Dairy Futures Cooperative Research Centre (CRC), Bundoora; National Centre for Dairy Education Australia (NCDEA), Werribee; Dairy Innovation Australia, Werribee; International Cheese Advisory Service, Doncaster.
Dairy Food Safety Authority ‐ Dairy Food Safety Victoria, Hawthorn. B.) Example of Animal Industry Clusters in South Western Victoria (SECONDARY CLUSTERS) ‐ Beef Cattle, Sheep, Pig & Poultry Farms / Processing Plants / Services.
Private sector members:
Livestock farms of all types, from large beef feedlots, intensive piggeries and poultry farms, to small and medium sized farms.
Beef, lamb, pig & poultry meat processing plants. Veterinary pathology laboratories ‐ Regional Vet Lab, Benalla; Timboon Veterinary Group, Timboon. Food testing laboratories ‐ DTS Food Laboratories, Flemington; Silliker Australia, Blackburn. Animal Health companies ‐ Intervet/Schering‐Plough/Coopers Animal Health, Bendigo East. Commercial stockfeed mills ‐ Five Star Stockfeeds, Camperdown; Ridley AgriProducts, Terang, Noorat
and St Arnaud. Feed additives ‐ Alltech Biotechnology Pty Ltd, Dandenong South; Feedworks, Romsey. Genetic Improvement companies ‐ Genetics Australia, Bacchus Marsh. International Trading companies for veterinary health products, protein meals, feed supplements, etc. Transport & distribution companies, including refrigeration specialists. Private veterinarians, nutritionists, food safety & HACCP inspectors and other service providers. Exporters and importers of beef, lamb, pig & poultry meats. Wholesale and retail participants.
Public sector members:
Department of Primary Industries, Victoria ‐ provides general industry advisory services, together with food safety & hygiene inspection services, plus environmental regulation of the industry.
It is interesting to note the degree of overlap of cluster members above, due to the majority of support institutions, testing laboratories, animal product companies, feedmills, transport companies, etc being multi‐functional in their relationship with the food producing animal industries.
POTENTIAL FOR FURTHER CLUSTER APPROACHES
Further dairy industry cluster development, similar to the above, can be expected in the major dairy regions of the country, which are illustrated in Figure 23 below. This diagram provides an indication of likely growth trends in each region, according to results of ‘Dairy Australia’ farmer surveys conducted during 2009 and 2010.
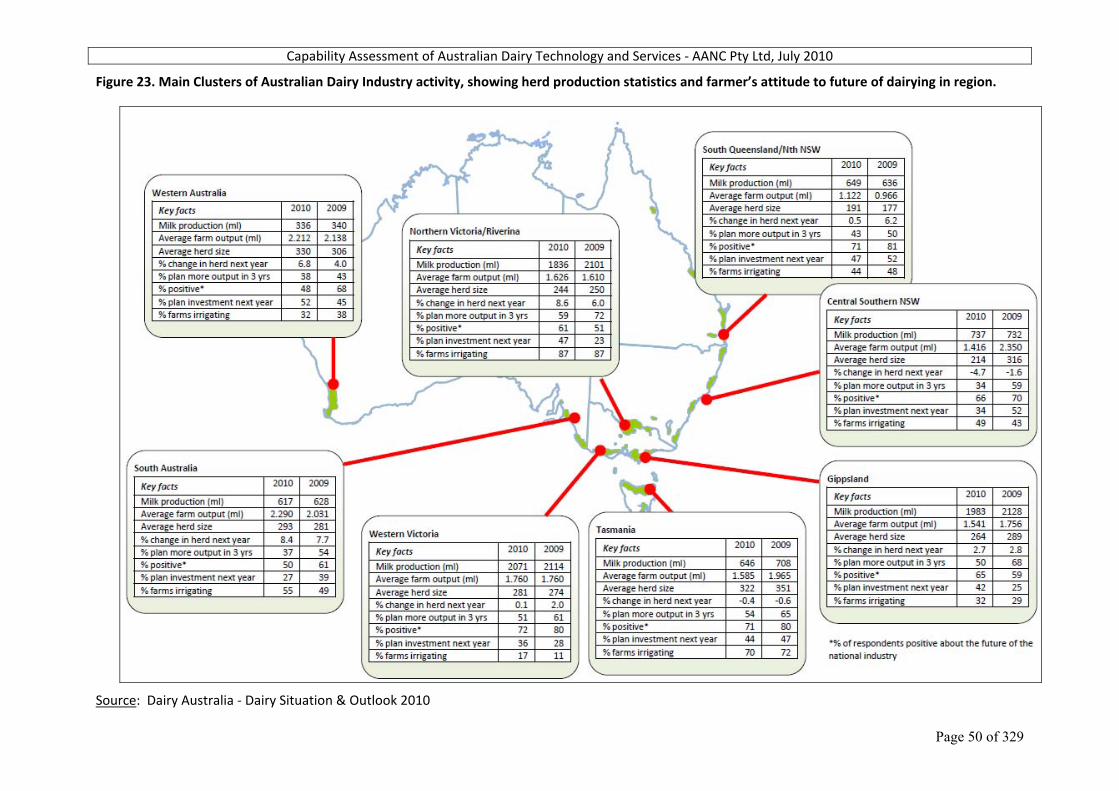
Capability Assessment of Australian Dairy Technology and Services ‐ AANC Pty Ltd, July 2010
Page 50 of 329
Figure 23. Main Clusters of Australian Dairy Industry activity, showing herd production statistics and farmer’s attitude to future of dairying in region.
Source: Dairy Australia ‐ Dairy Situation & Outlook 2010
Capability Assessment of Australian Dairy Technology and Services ‐ AANC Pty Ltd, July 2010
Page 51 of 329
4. POTENTIAL FOR OUTWARD INVESTMENT BY AUSTRALIAN DAIRY PRODUCT EXPORTERS SUCCESS TO DATE OF AUSTRALIAN DAIRY PRODUCT EXPORTS Australia is the world’s third biggest dairy exporter and continues to improve in this industry. Some highlights include:
o Securing an 11 % share of overall world trade, o Selling approximately 50 % of annual milk production to world markets, o Earning more than $3.0 billion in export revenue each year, o Exporting around 900,000 tonnes per year of processed dairy products, and o Shipping to over 100 countries.
CURRENT SITUATION OUTLOOK FOR AUSTRALIAN DAIRY PRODUCT EXPORTS (Derived from Dairy Australia’s report ‘Dairy Situation & Outlook 2010.) According to Dairy Australia, operating conditions for the Australian dairy industry have improved dramatically in 2010. In 2009, the industry was facing a crisis, with the global economic downturn cutting milk prices, and continued dry conditions placing many farm businesses at risk. In 2010, the industry’s position has changed significantly for the better. Economic recovery has underpinned renewed demand growth in key markets, while reduced supplies have seen dairy commodity prices rise sharply in US dollar terms. While the benefit of the international market recovery for Australian exporters has been constrained by the strong Australian dollar, farm‐gate prices for southern producers have improved in the second half of the 2009/10 season from relatively low opening prices compared with the previous two seasons. Improved milk prices, combined with low grain prices and generally favourable seasonal conditions see southern farmers enjoying the best production conditions for several years. Supplies of grain and irrigation water continue to improve. The Australian economy has emerged relatively unscathed from the economic downturn. Household incomes have continued to grow steadily over the past couple of years. As the international market downturn hit, the Australian dairy market proved resilient, providing volume and value growth throughout 2009.
However, as production has contracted in recent years, the local domestic market has accounted for an increasing proportion of the industry’s production – around 55% of annual output. The Australian market will continue to represent a relatively “safe haven” of steady sales growth for the industry with neither the extreme highs nor lows of the international commodity market. Nevertheless, a higher Australian dollar is expected to continue to provide some constraint to further increases in farm gate prices and key export markets such as Japan are expected to continue their sluggish performance. Also, the negative cash flow conditions of 2009 are still weighing heavily on farm businesses – with debt estimated to have increased by an average of 20% over the two years to 2009/10. Increased debt loads and higher interest rates will maintain pressure on farm finances. Undoubtedly, the domestic industry is not without some nervousness. Market and margin volatility has undermined confidence for many dairy producers, in particular younger farmers and those with low equity. Confidence in the future of the national industry, as measured by the National Dairy Farmer Survey, was unchanged in 2010 form 2009 at only 65% of respondents positive about the future of the industry. This is despite improving conditions for many producers. Those with a positive outlook cited demand for dairy products and adequate or improving prices as the basis for their views. However, milk price remained the greatest
Capability Assessment of Australian Dairy Technology and Services ‐ AANC Pty Ltd, July 2010
Page 52 of 329
challenge farmers are seeing currently and into the future, while climate issues have receded in farmers’ minds. While the second half of 2009/10 saw a significant increase in prices to southern farmers, and grain prices are at their lowest point for four years, 50% of farmers surveyed did not believe they would make a margin over costs for the January to June 2010 period. Looking further ahead however, three year production intentions from the 2010 survey showed a significant decline in growth expectations compared with the 2009 survey. However, with a sustained improvement in both milk price and climate for the majority of producers, there is potential for stronger growth into the medium term.
CASE STUDIES OF OUTWARD INVESTMENT BY AUSTRALIAN DAIRY PRODUCT EXPORTERS 1.) Murray Goulburn Co‐operative was formed in 1950 and has grown to become the largest processor of milk
in Australia and the nation’s largest exporter of processed food. With eight plants located throughout Victoria, Murray Goulburn processes over 35% of the nation’s milk supply into quality products which are sold on both domestic and export markets. MG also operates a trading division consisting of some 26 stores mainly located throughout Victoria. These are located for supplier convenience and service all the requirements of the farming community with particular emphasis on dairy hygiene, animal health, pasture renovations, traditional and electrical fencing and special farming requirements.
In recent years, Murray Goulburn has invested USD10 million in the Qingdao province of China and set up a food processing plant in May 2007. MG’s main products include infant formula and adult nutrition products. It is estimated that by 2011, the sales volume of Murray Goulburn's Qingdao plant will reach A$50 million.
2.) Since the company was formed in New Zealand in 2001, Fonterra has become the largest processor of milk
in the world and is now responsible for more than a third of international dairy trade. In Australia, Fonterra collects 1.75 billion litres of milk annually from around 1,500 milk farmer suppliers in regional areas of Australia including Gippsland, Northern Victoria, South west Victoria, Tasmania and Western Australia. This represents approximately 20 per cent of Australia’s total milk production. Excepts from: “Fonterra moves cautiously to develop China project”. The Press (Christchurch), Fairfax New Zealand Ltd., 12 February 2010. Fonterra, the giant New Zealand based co‐operative which sells 203,000 tonnes of mainly dairy ingredients into China, about 10 % of its total product, has recently received approval to add two more farms to its trial Tangshan Farm in Hangu, in the Hebei province of China. The China dairy market is set to become the world’s largest dairy market in the next few decades and is forecast to experience double digit annual growth over the next 10 years. The Chinese Government has acknowledged that the development of the dairy farming industry is not only crucial for meeting the growth in demand, but also for developing rural communities and their livelihoods.
Fonterra owns 85 per cent of its first farm and sells high quality milk independently for a premium to manufacturers in Beijing. China and its 1.4 billion people nation is an important market, helping to drive world commodity prices up. The nation produces and consumes 22 to 28 billion litres of milk a year and the predictions are this will increase to 80 billion litres in the next decade. However, China is unlikely to be able to produce this much milk without considerable foreign investment.
Capability Assessment of Australian Dairy Technology and Services ‐ AANC Pty Ltd, July 2010
Page 53 of 329
POTENTIAL FOR FURTHER OUTWARD INVESTMENT (BY MARKET, BY SUPPLY CHAIN CAPABILITIES), INCLUDING BARRIERS The wider global economic situation remains the greatest threat to a sustained market recovery. As reported in June 2010 by the USDA’s Global Agricultural Information Network (GAIN Report Number: AS1023, Australia ‐ Ag DownUnder Issue 4 ‐ 2010), Australian dairy exports are becoming increasingly sought‐after on world markets, but on current trends there is a short supply of milk to fill overseas orders. During the next 10 years Australia, New Zealand and some South American nations are set to be more important to the international dairy trade as traditional suppliers such at the US and Europe are likely to consume everything their farmers can deliver. Previously big production subsidies in the northern hemisphere which resulted in mounting stockpiles have all but ended, with world stocks now reduced to minimal levels. Although Industry sources report that Australia and New Zealand already supply half the world’s export dairy trade but the next decade could be not without difficulties. As reported in May 2010 in the USDA’s GAIN Report Number: AS1013, Australia ‐ Dairy and Products Semi‐annual, 2010, despite falls in production of fluid milk, domestic fresh milk consumption is expected to remain strong and this is expected to reduce the availability of milk for manufacturing purposes as well as exports. This will likely put greater downward pressure on the production of butter and milk powders with cheese production remaining the least affected. Industry reports suggest that a succession of interest rate rises have constrained many dairy producers in their response to improved conditions. A high Australian dollar has partially blunted stronger world prices. CURRENT CHARACTERISTICS OF THE INTERNATIONAL DAIRY MARKET (Derived from Dairy Australia’s report ‘Dairy Situation & Outlook 2010.) Volatility in the market Volatility has become a key feature of the global dairy commodity market with shorter and sharper price swings. This is drawing increasing attention and many industries around the world are looking at ways to manage this volatility. In the past 3 years, the volatility in dairy prices has been far greater than in the past for the major commodities. The challenge for the world’s dairy industries is that the global market will continue to be volatile in the future. There are a number of reasons for this. Firstly, the global dairy market is very thin. Annually less than 8% of all the milk produced each year is traded between countries as milk and dairy products. As a result, the global market is susceptible to price swings even when there are small shifts in supply and/or demand conditions. In addition, new factors in the market are leading to volatility and will see the range and frequency of price cycles intensify. Key factors at play include: o Highly variable weather impacting on production systems, o Variable input costs impacting of farmers production intentions, o Changing structure of the global market with emerging suppliers and lower structural surpluses of stocks in
Northern Hemisphere, o New market indicators such as globalDairyTrade (gDT) ‐ and soon dairy futures, and o Volatile global economic environment which impacts demand and affordability. Many other agricultural commodity markets are exhibiting volatility through severe price swings. This includes grains and oilseed markets, which in turn can have a bearing on input costs for dairy farmers. There has been a greater range of commodity spot prices in the past 3 years compared to previously.
Capability Assessment of Australian Dairy Technology and Services ‐ AANC Pty Ltd, July 2010
Page 54 of 329
In summary, the main sources of dairy market volatility are: o Wider economic uncertainty, o Low structural stocks and surpluses, o Swinging key market players (USA, Latin America , Russia), o New ways of interacting, eg, globalDairyTrade (gDT), o Shortening of buyer commitment – ‘just in time’ purchasing and low stocks, o Climatic variability and its effect on supply, o Sensitivity of developing world demand to price and income changes. A number of initiatives are being implemented to assist participants to manage volatility in the dairy market. o globalDairyTrade
The advent of the globalDairyTrade (gDT) online auction platform has allowed forward buying and selling of Fonterra product, and provided greater price transparency for whole and skim milk powder sales. From May gDT is publishing a dairy price index, the gDT‐Trade Weighted Index. The significance of the gDT for world trade is increasing. During 2009, approximately 30% of all WMP produced in New Zealand and 12% of world trade in WMP for that year were sold through the auction system.
o Futures markets In response to increasing volatility a number of exchanges have seen an opportunity to launch dairy futures products. Markets are being established in the US, Europe and New Zealand. While the underlying dairy market will still be exposed to the risk of volatility due to the influence of demand and supply factors, over time these products will allow participants to manage the extent of their exposure to the price effects of these changes. Futures facilities will also open dairy to a range of new participants and investors who don’t deal in the physical product. Futures provide important reference pricing to set value, provided there is sufficient liquidity. Companies creating the futures market stand to profit from each trade. There is significant interest from potential users, but most would prefer to ‘wait and see’ how the trading platforms take off and what sort of liquidity is available. Despite the opportunities for dairy product manufacturers, exporters and importers, there is little scope for direct access by milk producers who wish to manage the milk price risk.
Supply weakened by lower milk prices 2009 was a year of lower than normal growth in global milk production. Traditionally global milk production grows around 2% each year but was constrained to less than 1% in 2009, reaching more than 560 billion litres. In general, the slowdown in growth was driven by dairy farmers from some of the leading, first world milk producing countries facing lower farm‐gate prices and high costs of production. 2010 will see a period of ongoing correction in global milk supply with improving, but still low, farmgate prices. Improving commodity pricing conditions should flow through to the farm‐gate by the end of the year, but this can be delayed by various factors along the supply chain. Whether this translates into a strong recovery in production in 2011 will depend heavily on farmer confidence and the situation with input costs. With supply growth likely to be more constrained in low cost regions such as the Southern Hemisphere, the market will be dependent on securing product from higher cost suppliers such as Europe and the USA. This underpins expectations that the global commodity market will trade above traditional levels in the short term. Demand factors
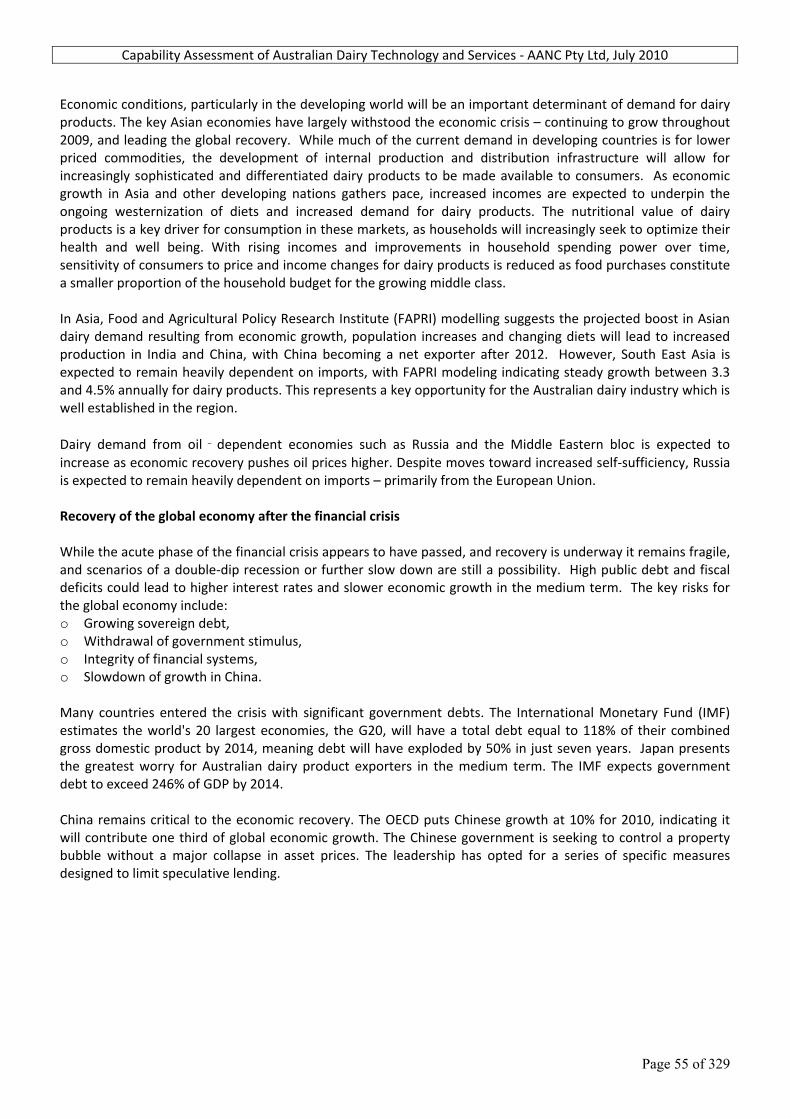
Capability Assessment of Australian Dairy Technology and Services ‐ AANC Pty Ltd, July 2010
Page 55 of 329
Economic conditions, particularly in the developing world will be an important determinant of demand for dairy products. The key Asian economies have largely withstood the economic crisis – continuing to grow throughout 2009, and leading the global recovery. While much of the current demand in developing countries is for lower priced commodities, the development of internal production and distribution infrastructure will allow for increasingly sophisticated and differentiated dairy products to be made available to consumers. As economic growth in Asia and other developing nations gathers pace, increased incomes are expected to underpin the ongoing westernization of diets and increased demand for dairy products. The nutritional value of dairy products is a key driver for consumption in these markets, as households will increasingly seek to optimize their health and well being. With rising incomes and improvements in household spending power over time, sensitivity of consumers to price and income changes for dairy products is reduced as food purchases constitute a smaller proportion of the household budget for the growing middle class. In Asia, Food and Agricultural Policy Research Institute (FAPRI) modelling suggests the projected boost in Asian dairy demand resulting from economic growth, population increases and changing diets will lead to increased production in India and China, with China becoming a net exporter after 2012. However, South East Asia is expected to remain heavily dependent on imports, with FAPRI modeling indicating steady growth between 3.3 and 4.5% annually for dairy products. This represents a key opportunity for the Australian dairy industry which is well established in the region. Dairy demand from oil‐dependent economies such as Russia and the Middle Eastern bloc is expected to increase as economic recovery pushes oil prices higher. Despite moves toward increased self‐sufficiency, Russia is expected to remain heavily dependent on imports – primarily from the European Union. Recovery of the global economy after the financial crisis While the acute phase of the financial crisis appears to have passed, and recovery is underway it remains fragile, and scenarios of a double‐dip recession or further slow down are still a possibility. High public debt and fiscal deficits could lead to higher interest rates and slower economic growth in the medium term. The key risks for the global economy include: o Growing sovereign debt, o Withdrawal of government stimulus, o Integrity of financial systems, o Slowdown of growth in China. Many countries entered the crisis with significant government debts. The International Monetary Fund (IMF) estimates the world's 20 largest economies, the G20, will have a total debt equal to 118% of their combined gross domestic product by 2014, meaning debt will have exploded by 50% in just seven years. Japan presents the greatest worry for Australian dairy product exporters in the medium term. The IMF expects government debt to exceed 246% of GDP by 2014. China remains critical to the economic recovery. The OECD puts Chinese growth at 10% for 2010, indicating it will contribute one third of global economic growth. The Chinese government is seeking to control a property bubble without a major collapse in asset prices. The leadership has opted for a series of specific measures designed to limit speculative lending.
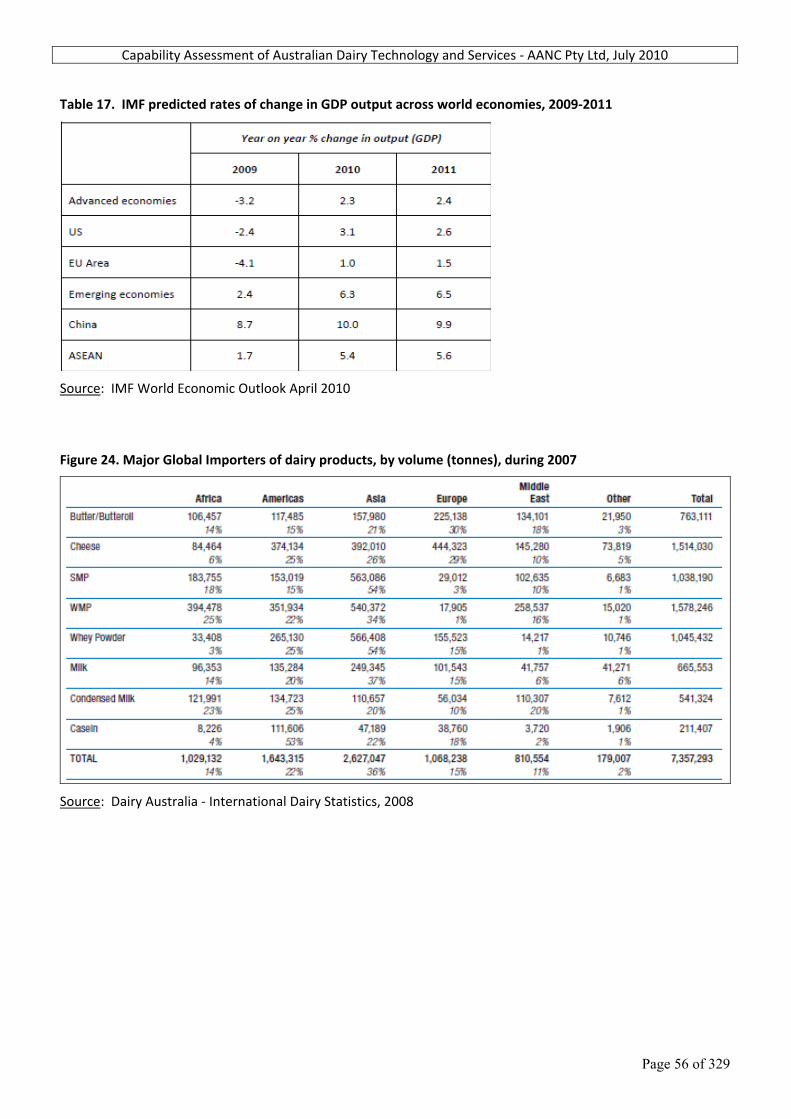
Capability Assessment of Australian Dairy Technology and Services ‐ AANC Pty Ltd, July 2010
Page 56 of 329
Table 17. IMF predicted rates of change in GDP output across world economies, 2009‐2011
Source: IMF World Economic Outlook April 2010 Figure 24. Major Global Importers of dairy products, by volume (tonnes), during 2007
Source: Dairy Australia ‐ International Dairy Statistics, 2008
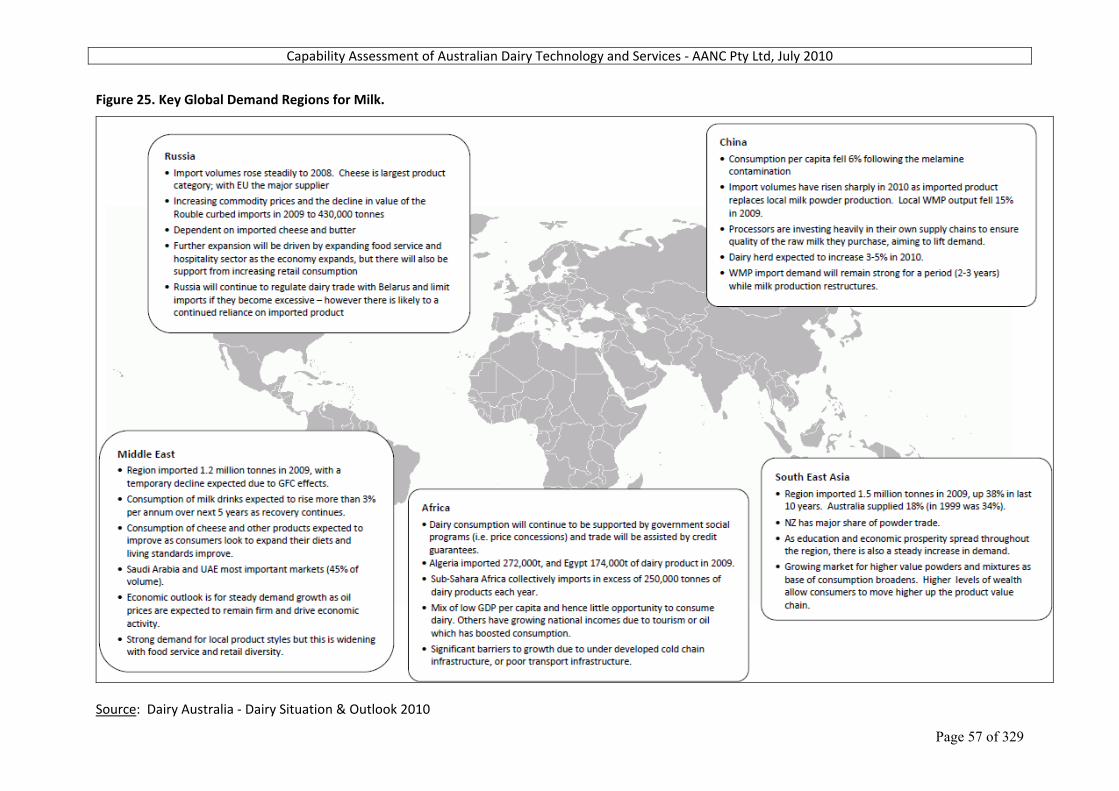
Capability Assessment of Australian Dairy Technology and Services ‐ AANC Pty Ltd, July 2010
Page 57 of 329
Figure 25. Key Global Demand Regions for Milk.
Source: Dairy Australia ‐ Dairy Situation & Outlook 2010

Capability Assessment of Australian Dairy Technology and Services ‐ AANC Pty Ltd, July 2010
Page 58 of 329
Figure 26. Key Competitors in the Global Market for Milk
Source: Dairy Australia ‐ Dairy Situation & Outlook 2010

Capability Assessment of Australian Dairy Technology and Services ‐ AANC Pty Ltd, July 2010
Page 59 of 329
International dairy product supply factors ‐ long term global outlook Domestic dairy consumption for major producing regions with exportable supplies will be critical to global dairy market balance. This is because local markets are the primary focus and international markets are a secondary channel. Shifts in local demand in the US, Argentina, Brazil and most parts of Europe have a direct impact on the export availability of dairy commodities. In these markets the domestic market absorbs in excess of 80% of all milk produced. The South America region provides a good example. While milk production is likely to grow in both Argentina and Brazil in 2010, local consumption patterns are expected to outpace this growth and actually limit milk available for export markets this year. In contrast, both Australia and New Zealand are much more reliant on the export market and have been continuous net exporters for many decades. Farmgate milk prices in 2010 are generally more positive than last year, with an expectation that milk prices will continue to improve. As economic conditions for dairying improve around the world, so will production intentions, yet there is likely to be a lagged impact on the world dairy market. Weather patterns over the remainder of the year will be critical. The Australian dairy industry is an exporting industry with established customer relationships in markets and regions that will lead demand growth into the future. Global demand is likely to continue to rise in the long term with growing awareness of milk’s nutritional value and functional diversity, and the improvement of living standards in developing economies. According to the USDA Foreign Agricultural Service’s report, December 2009, Dairy: World Markets and Trade, Australian milk production is forecast to decline primarily due to lower cow numbers – down 2 %, following severe drought and a cost squeeze between high input costs and lower milk prices. The situation is improving following reasonable recent rainfall and improved irrigation water availability. Nevertheless, there is considerable uncertainty over Australia’s longer term ability to resume consistent growth and even return to levels of production attained between 2000 and 2003. In contrast, New Zealand milk production is expected to reach a record high as the herd is forecast to expand by 2.5 percent. This is much in line with the 5‐year (2003‐2008) annual average growth rate of around 2 % annually. In the EU‐27, milk output is forecast to rise marginally in 2010 as producers recover from the low prices experienced in 2009. The EU has supported dairy prices by extending the period of intervention to bridge the gap between August 2009 and March 2010 and heavy use of export subsidies to move surplus dairy products onto world markets. For 2010, US milk production is forecast to decline by less than 1 %. Although higher prices are anticipated in 2010, the liquidation of dairy cows will lower the herd by a significant 2.4 %. Intensive modelling for the future trade in world dairy products over the 10 year period 2009‐2019, suggests an apparent gap in future world milk supply to meet projected demand to the extent of approximately 5 billion litres milk equivalents, by 2019. This gap is beyond what is forecast to be supplied by Australian and New Zealand, South America, the USA and European Union. This modelling has been based on detailed demand and supply assumptions using available information and latest outlook projections from the Food and Agricultural Policy Research Institute (FAPRI) in Asia, the EU, projected Chinese production in farm output and ingredient manufacture, and assumed growth in production in Australia of 1% per annum and New Zealand of 2.5% per annum. This gap implies that there are substantial opportunities for existing and new suppliers to increase their participation in a growing world market.
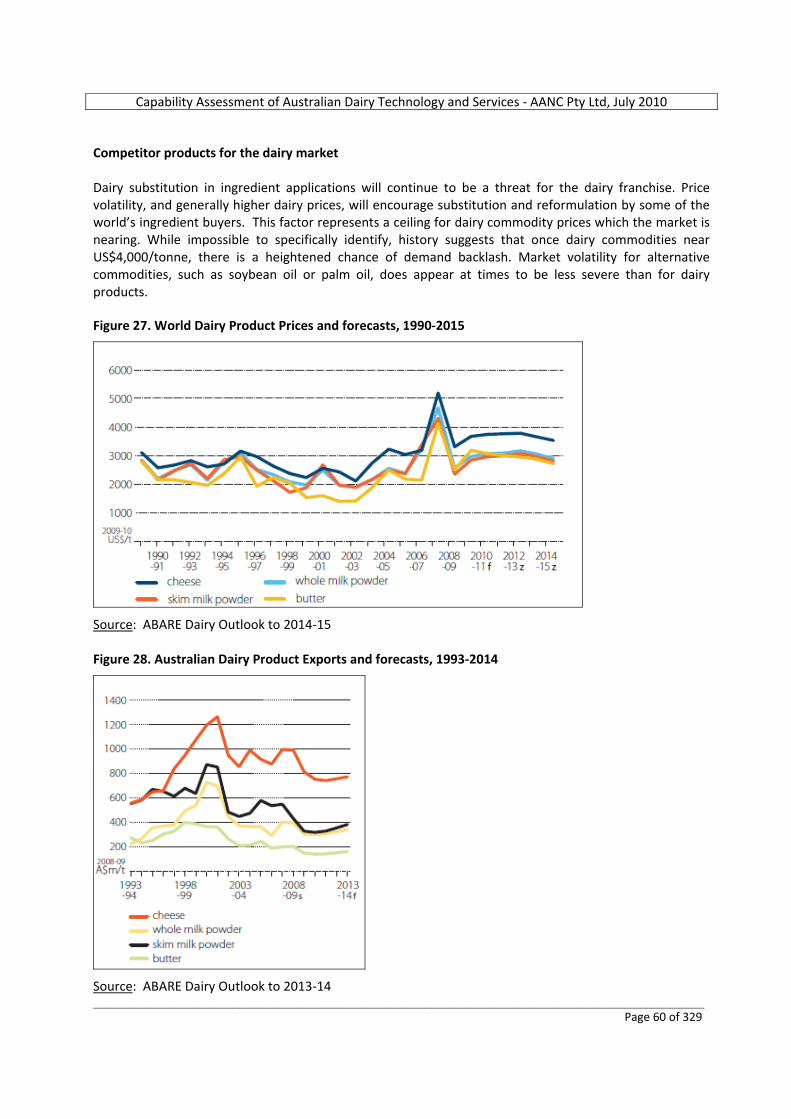
Capability Assessment of Australian Dairy Technology and Services ‐ AANC Pty Ltd, July 2010
_________________________________________________________________________________________________________ Page 60 of 329
Competitor products for the dairy market Dairy substitution in ingredient applications will continue to be a threat for the dairy franchise. Price volatility, and generally higher dairy prices, will encourage substitution and reformulation by some of the world’s ingredient buyers. This factor represents a ceiling for dairy commodity prices which the market is nearing. While impossible to specifically identify, history suggests that once dairy commodities near US$4,000/tonne, there is a heightened chance of demand backlash. Market volatility for alternative commodities, such as soybean oil or palm oil, does appear at times to be less severe than for dairy products. Figure 27. World Dairy Product Prices and forecasts, 1990‐2015
Source: ABARE Dairy Outlook to 2014‐15 Figure 28. Australian Dairy Product Exports and forecasts, 1993‐2014
Source: ABARE Dairy Outlook to 2013‐14
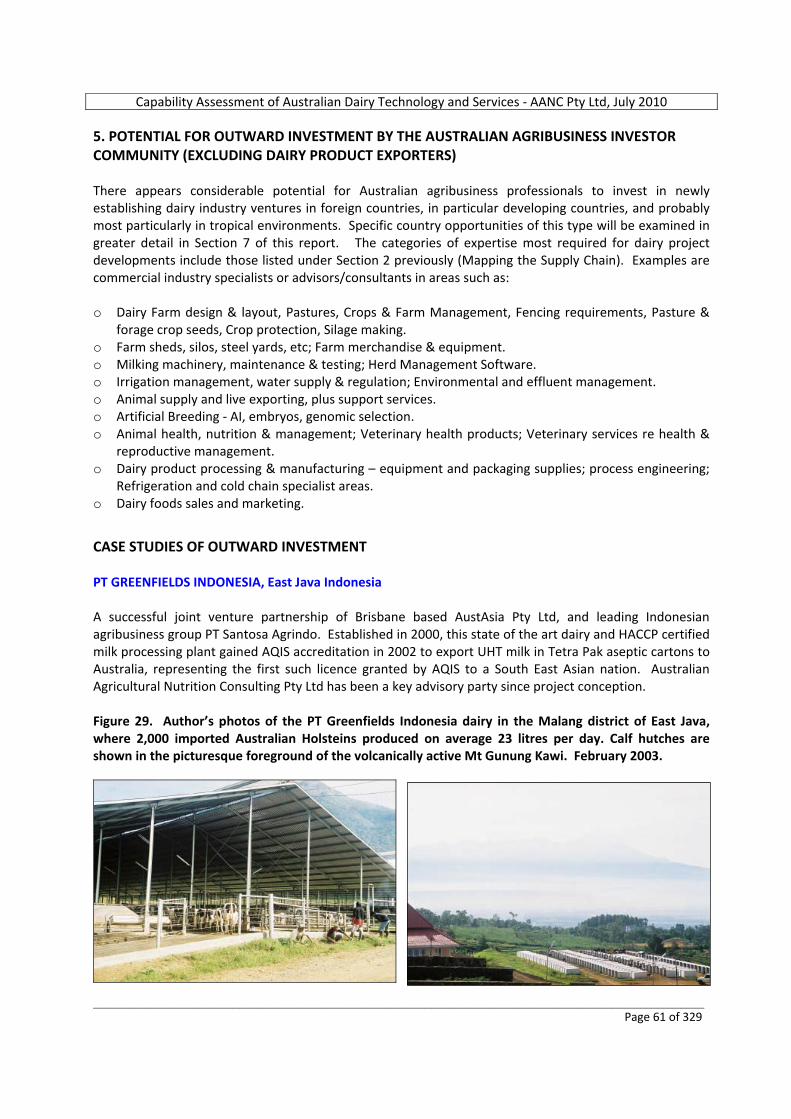
Capability Assessment of Australian Dairy Technology and Services ‐ AANC Pty Ltd, July 2010
_________________________________________________________________________________________________________ Page 61 of 329
5. POTENTIAL FOR OUTWARD INVESTMENT BY THE AUSTRALIAN AGRIBUSINESS INVESTOR COMMUNITY (EXCLUDING DAIRY PRODUCT EXPORTERS) There appears considerable potential for Australian agribusiness professionals to invest in newly establishing dairy industry ventures in foreign countries, in particular developing countries, and probably most particularly in tropical environments. Specific country opportunities of this type will be examined in greater detail in Section 7 of this report. The categories of expertise most required for dairy project developments include those listed under Section 2 previously (Mapping the Supply Chain). Examples are commercial industry specialists or advisors/consultants in areas such as: o Dairy Farm design & layout, Pastures, Crops & Farm Management, Fencing requirements, Pasture &
forage crop seeds, Crop protection, Silage making. o Farm sheds, silos, steel yards, etc; Farm merchandise & equipment. o Milking machinery, maintenance & testing; Herd Management Software. o Irrigation management, water supply & regulation; Environmental and effluent management. o Animal supply and live exporting, plus support services. o Artificial Breeding ‐ AI, embryos, genomic selection. o Animal health, nutrition & management; Veterinary health products; Veterinary services re health &
reproductive management. o Dairy product processing & manufacturing – equipment and packaging supplies; process engineering;
Refrigeration and cold chain specialist areas. o Dairy foods sales and marketing.
CASE STUDIES OF OUTWARD INVESTMENT PT GREENFIELDS INDONESIA, East Java Indonesia A successful joint venture partnership of Brisbane based AustAsia Pty Ltd, and leading Indonesian agribusiness group PT Santosa Agrindo. Established in 2000, this state of the art dairy and HACCP certified milk processing plant gained AQIS accreditation in 2002 to export UHT milk in Tetra Pak aseptic cartons to Australia, representing the first such licence granted by AQIS to a South East Asian nation. Australian Agricultural Nutrition Consulting Pty Ltd has been a key advisory party since project conception. Figure 29. Author’s photos of the PT Greenfields Indonesia dairy in the Malang district of East Java, where 2,000 imported Australian Holsteins produced on average 23 litres per day. Calf hutches are shown in the picturesque foreground of the volcanically active Mt Gunung Kawi. February 2003.

Capability Assessment of Australian Dairy Technology and Services ‐ AANC Pty Ltd, July 2010
_________________________________________________________________________________________________________ Page 62 of 329
MACQUARIE BANK Macquarie Bank has been continuously investing in China since 1995. After 13 years development, Macquarie successfully attracted and retained top tier management personnel and has assembled a team with over 150 professionals dedicated to the China business market, one of the largest IB teams in China. Macquarie Bank opened a Shanghai office in 2006 and a Guangzhou office in year 2007, as supplements to its Beijing office. To set up a trust company in China with a strong local partner, in order to offer more attractive financial products, Macquarie has demonstrated strong interest in China's economy and agricultural assets, which increasingly include modern dairy farm establishments.
POTENTIAL FOR FURTHER OUTWARD INVESTMENT (BY MARKET, BY SUPPLY CHAIN CAPABILITIES), INCLUDING BARRIERS. Refer to information supplied under Section 4 above.
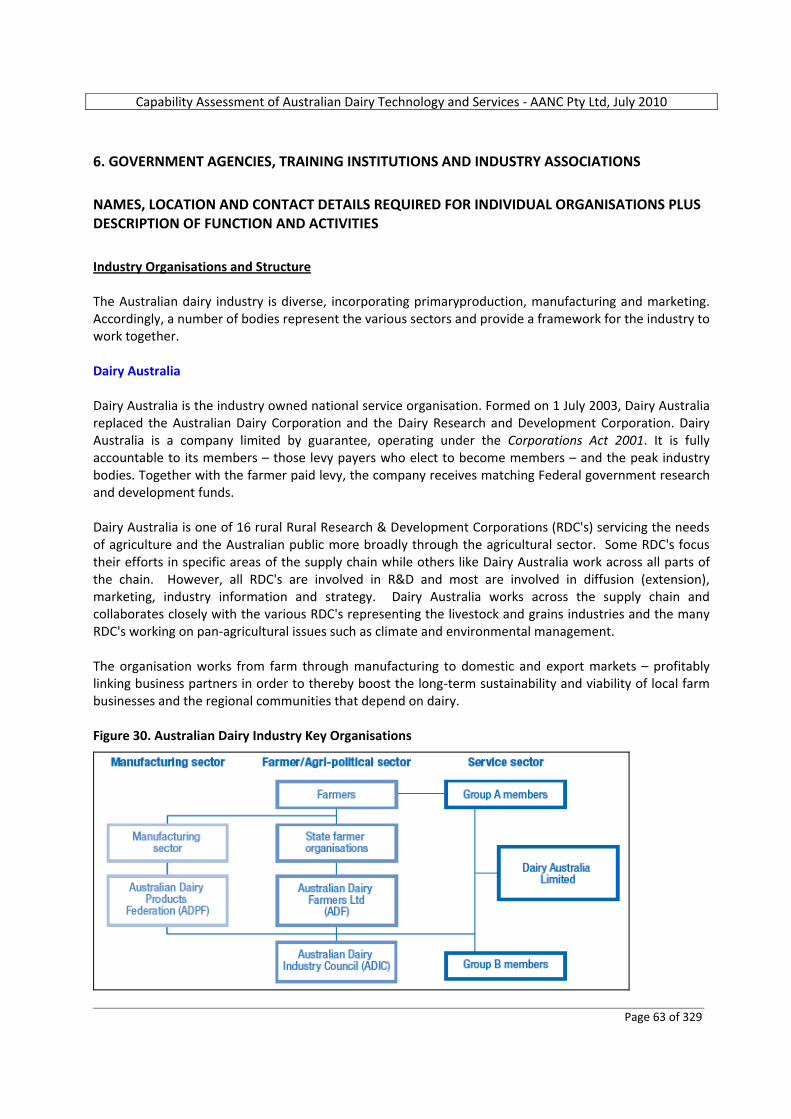
Capability Assessment of Australian Dairy Technology and Services ‐ AANC Pty Ltd, July 2010
_________________________________________________________________________________________________________ Page 63 of 329
6. GOVERNMENT AGENCIES, TRAINING INSTITUTIONS AND INDUSTRY ASSOCIATIONS
NAMES, LOCATION AND CONTACT DETAILS REQUIRED FOR INDIVIDUAL ORGANISATIONS PLUS DESCRIPTION OF FUNCTION AND ACTIVITIES
Industry Organisations and Structure The Australian dairy industry is diverse, incorporating primaryproduction, manufacturing and marketing. Accordingly, a number of bodies represent the various sectors and provide a framework for the industry to work together. Dairy Australia Dairy Australia is the industry owned national service organisation. Formed on 1 July 2003, Dairy Australia replaced the Australian Dairy Corporation and the Dairy Research and Development Corporation. Dairy Australia is a company limited by guarantee, operating under the Corporations Act 2001. It is fully accountable to its members – those levy payers who elect to become members – and the peak industry bodies. Together with the farmer paid levy, the company receives matching Federal government research and development funds. Dairy Australia is one of 16 rural Rural Research & Development Corporations (RDC's) servicing the needs of agriculture and the Australian public more broadly through the agricultural sector. Some RDC's focus their efforts in specific areas of the supply chain while others like Dairy Australia work across all parts of the chain. However, all RDC's are involved in R&D and most are involved in diffusion (extension), marketing, industry information and strategy. Dairy Australia works across the supply chain and collaborates closely with the various RDC's representing the livestock and grains industries and the many RDC's working on pan‐agricultural issues such as climate and environmental management. The organisation works from farm through manufacturing to domestic and export markets – profitably linking business partners in order to thereby boost the long‐term sustainability and viability of local farm businesses and the regional communities that depend on dairy. Figure 30. Australian Dairy Industry Key Organisations
Capability Assessment of Australian Dairy Technology and Services ‐ AANC Pty Ltd, July 2010
_________________________________________________________________________________________________________ Page 64 of 329
Australian Dairy Industry Council The Australian Dairy Industry Council (ADIC) is the dairy industry’s peak policy body. It co‐ordinates industry policy and represents all sectors of the industry on national and international issues. The ADIC represents farmers, dairy product manufacturers and milk processors through its constituent organisations: o Australian Dairy Farmers Limited; and o Australian Dairy Products Federation. The ADIC has the task of bringing these bodies together to form a united view on issues affecting the dairy industry. Australian Dairy Farmers Limited Australian Dairy Farmers Limited (ADF) provides national representation for dairy farmers and forms the dairy commodity council of the National Farmers’ Federation. Its members include the six dairy farmer organisations, representing each state: o New South Wales Farmers’ Association’s Dairy Committee NSWFA); o Queensland Dairyfarmers’ Organisation (QDO); o South Australian Dairyfarmers’ Association (SADA); o Tasmanian Farmers and Graziers Association’s Dairy Council (TFGA); o United Dairyfarmers of Victoria (UDV); and o Western Australian Farmers’ Federation’s Dairy Council (WAFF). Australian Dairy Products Federation The Australian Dairy Products Federation (ADPF) is the national organisation representing the interests of dairy product manufacturers and traders. The ADPF’s primary purpose is to promote the interests of its members, and the dairy industry in general, to the Australian and State Governments and other sectors of the community. State Food Safety Organisations Each state has a food safety organisation to ensure that individual processors and dairy farmers comply with food safety standards. The Australian Dairy Authorities Standards Committee (ADASC), with representatives from each state food safety organisation, ensures there is a national approach to dairy food safety issues. ADASC is responsible for the Australian Milk Residue Analysis (AMRA) survey. The six relevant state food safety organisations are: o New South Wales Food Authority; o Safe Food Queensland; o Dairy Authority of South Australia; o Tasmanian Dairy Industry Authority; o Dairy Food Safety Victoria; and o Department of Health, Western Australia Dairy Safety Unit. Research Partners in the Dairy Industry
Capability Assessment of Australian Dairy Technology and Services ‐ AANC Pty Ltd, July 2010
_________________________________________________________________________________________________________ Page 65 of 329
The Australian dairy industry maximises outcomes through formal partnerships with various Industry Associations, State Government agencies, Federal agencies, training institutions and leading commercial dairy companies in the fields of milk processing, distribution & export, on‐farm efficiencies, genetic improvement, etc. Some of the key partner groups are as follows: o Dairy Australia ‐ Australia’s dairy industry key organisation. www.dairyaustralia.com.au o Dairy Innovation Australia Limited ‐ Company formed by membership from Dairy Australia and
Australian Dairy Manufacturing Companies. www.dairyinnovation.com.au o Australian Dairy Herd Improvement Scheme ‐ The Australian dairy industry's independent genetic
evaluation service. www.adhis.com.au o CRC for Innovative Dairy Products ‐ A seven‐year $90 million research consortium involving a number
of Australia's leading research institutes and commercial companies. www.ausbiotech.org/directory o National Dairy Alliance ‐ A voluntary grouping of investors, providers and industry that seeks to
improve the sustainable competitiveness of the on‐farm sector of the Australian dairy industry. www.dairyaustralia.com.au
o National Centre for Dairy Education Australia ‐ Joint venture between Dairy Australia and GOTAFE responsible for national development and delivery of vocational dairy education. www.ncdea.edu.au
o Dairy Extension Centre ‐ Centre of extension capability and program delivery established by the Victorian Government and Dairy Australia. www.dairyextension.com.au
o Geoffrey Gardiner Dairy Foundation ‐ Funding organisation for the benefit of the Victorian dairy industry. www.gardinerfoundation.com.au
o De Laval ‐ Large transnational company specialising in milking systems, equipment and products. www.delaval.com
o Department of Agriculture, Fisheries & Forestry (DAFF) ‐ Australian Government agency for agricultural, fisheries, food and forestry industries. www.daff.gov.au
o Commonwealth Scientific and Industrial Research Organisation (CSIRO). www.csiro.au/org o Australian Centre for International Agricultural Research (ACIAR). www.aciar.gov.au o Department of Primary Industries Victoria. new.dpi.vic.gov.au o NSW Department of Primary Industries. www.dpi.nsw.gov.au o Queensland Department of Primary Industries & Fisheries. www.dpi.qld.gov.au o Department of Agriculture and Food Western Australia. www.agric.wa.gov.au o Primary Industries & Resources South Australia. www.pir.sa.gov.au o South Australian Research and Development Institute. www.sardi.sa.gov.au o Tasmanian Institute of Agricultural Research. www.tiar.tas.edu.au A.) Dairy Farm Research Programs
o Countdown Downunder was launched in 1998 to help dairy farmers control mastitis and reduce the somatic milk cell counts of their dairy herds.
o InCalf ‐ Genetics and Reproduction ‐ was established in 1996 to help dairy farmers improve herd fertility. Herd reproductive performance is vital to the productivity of Australia's dairy farms because it impacts heavily on farm profitability.
o CowTime established in 2001 as a national industry project that makes milking easier and more efficient for dairy farmers.
o Cool Cows is a program that helps dairy farmers deal with heat stress in their herds.
Capability Assessment of Australian Dairy Technology and Services ‐ AANC Pty Ltd, July 2010
_________________________________________________________________________________________________________ Page 66 of 329
o FutureDairy is an industry‐driven research program to help Australia's dairy farmers manage the challenges they are likely to face during the next 20 years. It is a national project investigating alternative systems to increase on‐farm productivity and innovations that have the greatest potential to impact on farmers' economic well‐being and lifestyle. FutureDairy's primarily investors are Dairy Australia, Industry & Investment New South Wales (formerly Department of Primary Industries), The University of Sydney and DeLaval. In addition, the project receives support from Dairy NSW and The Dairy Research Foundation. FutureDairy is a research program to help Australia's dairy farmers manage the challenges they are likely to face during the next 20 years. The challenges are expected to be related to: a.) The availability and cost of land and water resources, and b.) The availability and cost of labour and associated lifestyle issues. FutureDairy started in 2004, exploring opportunities for productivity gains by substantially increasing forage and feed production and utilisation on farm and technological innovations with the potential greatest impact on farmers' lifestyle ‐ labour management. www.futuredairy.com.au
B.) Manufacturing Research Programs
Dairy Australia co‐ordinates much of the dairy industry’s investment in pre‐competitive manufacturing research as well as investing it own funds in this area. Dairy Australia publishes a regular comprehensive report titled “Australian Dairy Manufacturing Industry Sustainability”. Over half of Dairy Australia’s spend on manufacturing research goes to support Dairy Innovation Australia Ltd, the new innovation centre established in Werribee, Victoria in 2007. The centre’s main areas of expertise are in: ingredients and applications, process engineering, culture research, cheese technology, health and nutrition.
Dairy Innovation Australia will invest more than $15 million over the next three years to generate innovations in dairy processing and bulk ingredients, functional foods and ingredients, and cheese starter cultures and fermented products.
The other key areas of Dairy Australia‐backed manufacturing research include:
• Bioscience technologies ‐ e.g. bioactives ingredients discovery and the bioremediation of waste and other innovative applications of biotechnology.
• Sustainable production systems ‐ the development of novel higher yielding, lower cost, more efficient and sustainable processing technologies and strategies.
• Technology transfer ‐ the adoption and commercialisation of new technologies developed from current or past R&D projects in Australia and overseas.
• Health and nutrition – research into dairy fat, trans fat and obesity to accurately position the health and nutritional benefits of dairy products and ingredients.
Capability Assessment of Australian Dairy Technology and Services ‐ AANC Pty Ltd, July 2010
_________________________________________________________________________________________________________ Page 67 of 329
EXAMPLE OF AUSTRALIAN TECHNOLOGY AT DAIRY FARM RESEARCH LEVEL
Adapted from: FUTUREDAIRY Information Sheet, December 2009 Dr Kendra Kerrisk, Research Fellow, Automatic Milking Automated voluntary Milking Systems (AMS), are firstly a major time saving innovation for dairy farming, but they also have the potential to provide information not seen in the past. This information will enable dairy managers to be proactive rather than reactive, especially in terms of nutrition, reproduction and animal health. Modern dairy technology now has the capability to revolutionize heat detection, mastitis prevention and detection, everyday milking routines, body condition scoring and monitoring of heat stress and pregnancy. The following is a sample of automated dairy technology currently available on some of the more advanced overseas markets, or which are currently on trial prior to commercial release:
Portable milking “Robots” (AMS) that can be moved around the farm, saving the cows from walking to the dairy.
A robotic milking unit that takes daily milk samples which can be analysed on-site to identify cows losing body condition, on heat, pregnant, with anoestrus, mastitis infections, cystic ovaries, or other illnesses.
A robot that accurately applies teat spray on rotary platforms, either pre or post milking or both.
Heat detection using a GPS device attached to cows’ collars that monitors activity as an indicator of oestrus.
Robotic fencing that moves break fences at pre-set times and pre-set distances. Automatic gates that can be set to open and shut or draft in different directions
and at pre-set times, using many different criteria such as number of cows already drafted, day of the week or individual cow’s milking history.
Sensors in the cow’s rumen that monitor feed intake, energy balance (affecting liveweight changes), heat stress levels and other indicators of nutritional or health status, with an automatic message sent to a computer to alert when treatments are required or the ration needs adjusting.
Remote monitoring of farm performance, cow health, milk production and composition to allow managers to alert farm staff to potential problems early, even when they are absent from the property.
Milking machines that automatically advise the service company of faults and parts needed and when repairs and maintenance are due.
A sensor that monitors silage fermentation process to track feed quality. Robots that perform a multitude of tasks previously involving strenuous labour or
heavy lifting.
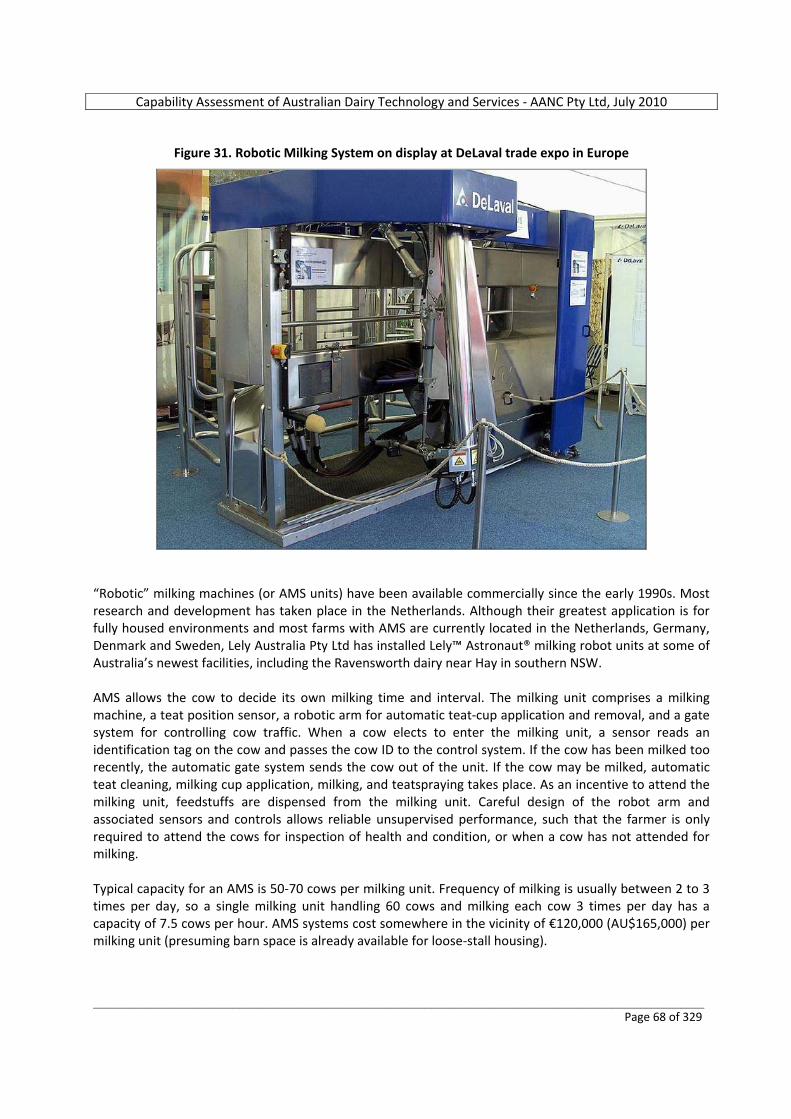
Capability Assessment of Australian Dairy Technology and Services ‐ AANC Pty Ltd, July 2010
_________________________________________________________________________________________________________ Page 68 of 329
Figure 31. Robotic Milking System on display at DeLaval trade expo in Europe
“Robotic” milking machines (or AMS units) have been available commercially since the early 1990s. Most research and development has taken place in the Netherlands. Although their greatest application is for fully housed environments and most farms with AMS are currently located in the Netherlands, Germany, Denmark and Sweden, Lely Australia Pty Ltd has installed Lely™ Astronaut® milking robot units at some of Australia’s newest facilities, including the Ravensworth dairy near Hay in southern NSW. AMS allows the cow to decide its own milking time and interval. The milking unit comprises a milking machine, a teat position sensor, a robotic arm for automatic teat‐cup application and removal, and a gate system for controlling cow traffic. When a cow elects to enter the milking unit, a sensor reads an identification tag on the cow and passes the cow ID to the control system. If the cow has been milked too recently, the automatic gate system sends the cow out of the unit. If the cow may be milked, automatic teat cleaning, milking cup application, milking, and teatspraying takes place. As an incentive to attend the milking unit, feedstuffs are dispensed from the milking unit. Careful design of the robot arm and associated sensors and controls allows reliable unsupervised performance, such that the farmer is only required to attend the cows for inspection of health and condition, or when a cow has not attended for milking. Typical capacity for an AMS is 50‐70 cows per milking unit. Frequency of milking is usually between 2 to 3 times per day, so a single milking unit handling 60 cows and milking each cow 3 times per day has a capacity of 7.5 cows per hour. AMS systems cost somewhere in the vicinity of €120,000 (AU$165,000) per milking unit (presuming barn space is already available for loose‐stall housing).
Capability Assessment of Australian Dairy Technology and Services ‐ AANC Pty Ltd, July 2010
_________________________________________________________________________________________________________ Page 69 of 329
EXAMPLE OF AUSTRALIAN TECHNOLOGY AT MANUFACTURERING RESEARCH LEVEL
Adapted from: The Dairy Australian, International Edition, September 2010 ‘Researchers aim to boost milk security and safety’ Three research projects recently completed by Australia’s CSIRO scientists, and jointly funded by the Gardiner Foundation, offer the assurance of improved security and safety of Australian milk products, making them more attractive to both new and existing export markets. 1.) Pulsed Electric Field (PEF) to double milk shelf life and protect proteins and vitamins Researchers have been able to double the shelf life of drinking milk to 6 weeks without destroying valuable proteins and vitamins, using Pulsed Electric Field (PEF) to pasteurise milk. PEF can be used to kill microorganisms in liquid foods using lower temperatures and less heating time than conventional heat pasteurization. PEF is a food processing technology which delivers high intensity electric pulses for short durations (in a range of microseconds). When conducted under conditions that are sufficient for microbial inactivation, it has been shown that PEF treatment has little effect on the heat-sensitive food components such as vitamins and proteins. 2.) State of the art milk product traceability using isotopic ratio analysis A recent research project has been investigating whether new tests could determine the geographic origin of Australian milk powders. The study evaluated the potential of multi-element isotope ratio analysis to discriminate between milk powders manufactured in different, relatively small geographical areas. The test is similar to that used by archaeologists and geologists to determine the age of artifacts and rocks. However, instead of working out the age, the researchers use it as a fingerprint that indicates the origin of the milk.
“We’ve shown that you can determine where the milk that was used to make a milk powder came from, by analysing the levels of certain chemical elements and the different ratios of isotopes of carbon, nitrogen and sulphur,” Dr Singh said. “From a sample of milk powder I can be 98 % sure whether the cows lived in East, West or North Victoria. “We could extend this technique to test whether a milk powder really was from where it claimed to be from. This could have real benefits for protecting the reputation of Australia’s dairy exports,” Dr Singh said. 3.) Reduction of Listeria contamination through greater control of Biofilms Other researchers have been developing practical strategies for more effective control of biofilms in order to reduce the prevalence and growth of the highly significant Listeria bacteria in dairy processing environments, and the rate of thermophile growth in heated processing equipment. Biofilms are a major source of microbial contamination for dairy products causing pathogen contamination, product specification failure and processing inefficiencies, particularly for milk powders.
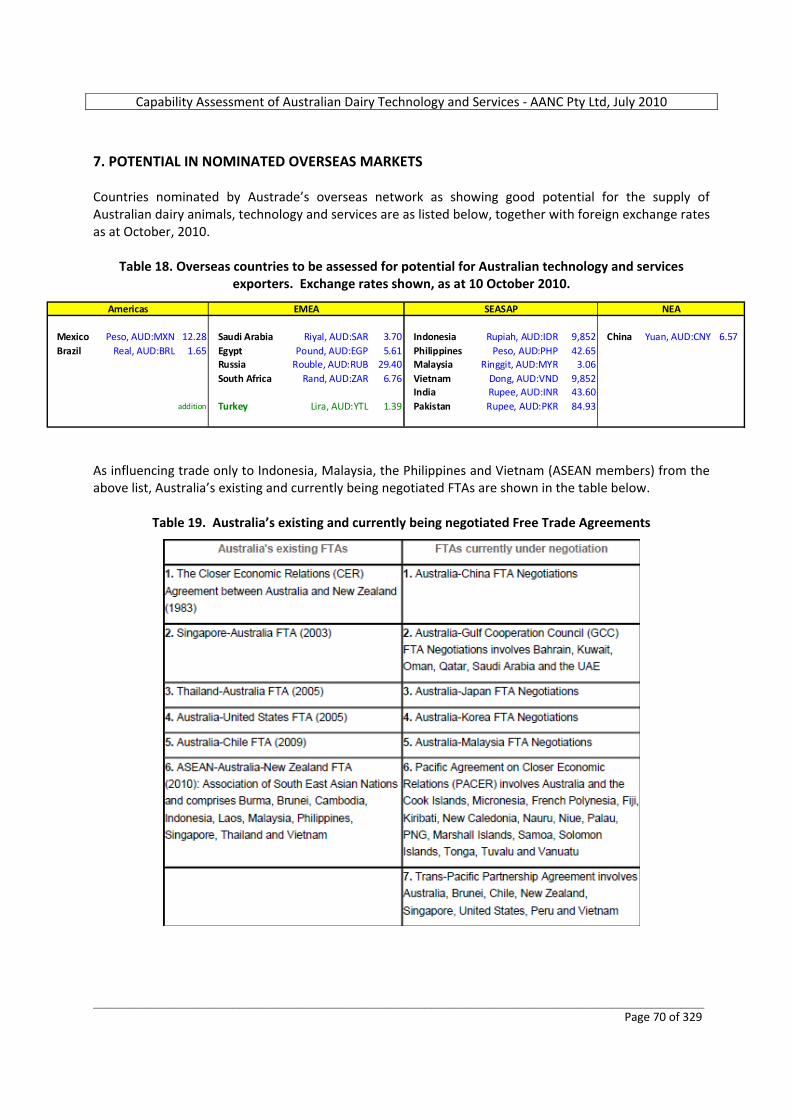
Capability Assessment of Australian Dairy Technology and Services ‐ AANC Pty Ltd, July 2010
_________________________________________________________________________________________________________ Page 70 of 329
7. POTENTIAL IN NOMINATED OVERSEAS MARKETS Countries nominated by Austrade’s overseas network as showing good potential for the supply of Australian dairy animals, technology and services are as listed below, together with foreign exchange rates as at October, 2010.
Table 18. Overseas countries to be assessed for potential for Australian technology and services exporters. Exchange rates shown, as at 10 October 2010.
As influencing trade only to Indonesia, Malaysia, the Philippines and Vietnam (ASEAN members) from the above list, Australia’s existing and currently being negotiated FTAs are shown in the table below.
Table 19. Australia’s existing and currently being negotiated Free Trade Agreements
Mexico Peso, AUD:MXN 12.28 Saudi Arabia Riyal, AUD:SAR 3.70 Indonesia Rupiah, AUD:IDR 9,852 China Yuan, AUD:CNY 6.57Brazil Real, AUD:BRL 1.65 Egypt Pound, AUD:EGP 5.61 Philippines Peso, AUD:PHP 42.65
Russia Rouble, AUD:RUB 29.40 Malaysia Ringgit, AUD:MYR 3.06South Africa Rand, AUD:ZAR 6.76 Vietnam Dong, AUD:VND 9,852
India Rupee, AUD:INR 43.60addition Turkey Lira, AUD:YTL 1.39 Pakistan Rupee, AUD:PKR 84.93
SEASAP NEAEMEAAmericas
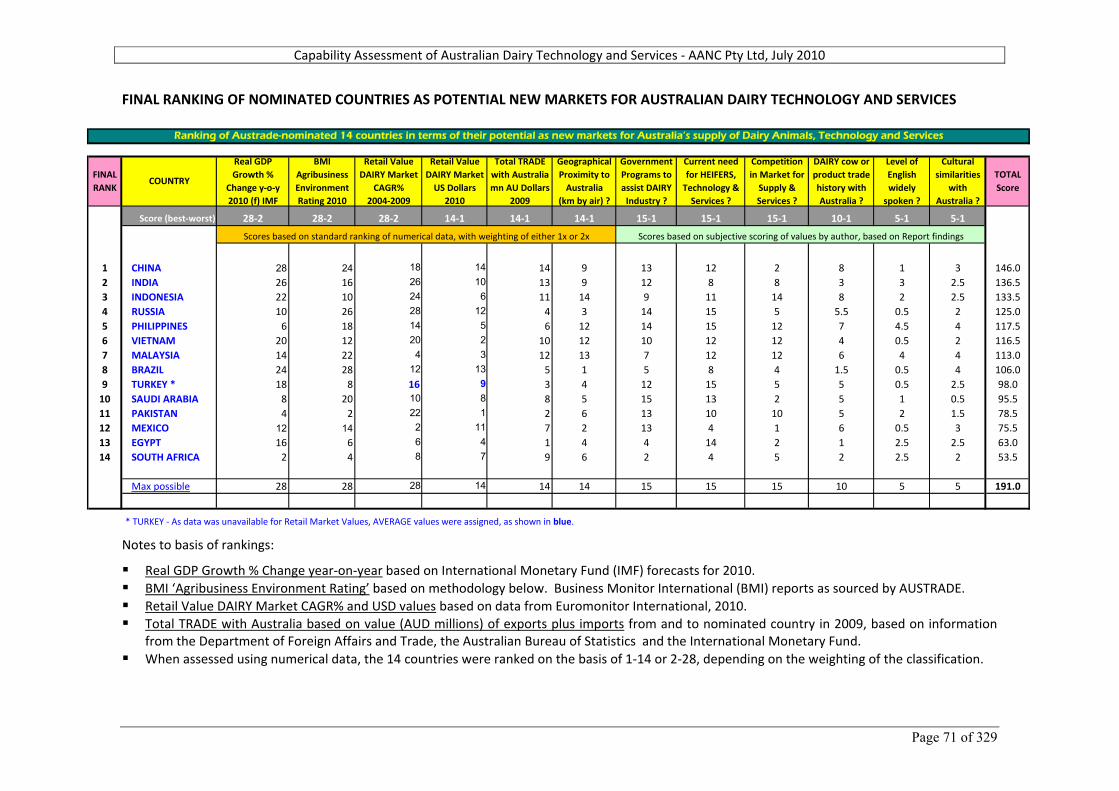
Capability Assessment of Australian Dairy Technology and Services ‐ AANC Pty Ltd, July 2010
Page 71 of 329
FINAL RANKING OF NOMINATED COUNTRIES AS POTENTIAL NEW MARKETS FOR AUSTRALIAN DAIRY TECHNOLOGY AND SERVICES
Notes to basis of rankings:
Real GDP Growth % Change year‐on‐year based on International Monetary Fund (IMF) forecasts for 2010. BMI ‘Agribusiness Environment Rating’ based on methodology below. Business Monitor International (BMI) reports as sourced by AUSTRADE. Retail Value DAIRY Market CAGR% and USD values based on data from Euromonitor International, 2010. Total TRADE with Australia based on value (AUD millions) of exports plus imports from and to nominated country in 2009, based on information
from the Department of Foreign Affairs and Trade, the Australian Bureau of Statistics and the International Monetary Fund. When assessed using numerical data, the 14 countries were ranked on the basis of 1‐14 or 2‐28, depending on the weighting of the classification.
Score (best‐worst) 28‐2 28‐2 28‐2 14‐1 14‐1 14‐1 15‐1 15‐1 15‐1 10‐1 5‐1 5‐1
1 CHINA 28 24 18 14 14 9 13 12 2 8 1 3 146.02 INDIA 26 16 26 10 13 9 12 8 8 3 3 2.5 136.53 INDONESIA 22 10 24 6 11 14 9 11 14 8 2 2.5 133.54 RUSSIA 10 26 28 12 4 3 14 15 5 5.5 0.5 2 125.05 PHILIPPINES 6 18 14 5 6 12 14 15 12 7 4.5 4 117.56 VIETNAM 20 12 20 2 10 12 10 12 12 4 0.5 2 116.57 MALAYSIA 14 22 4 3 12 13 7 12 12 6 4 4 113.08 BRAZIL 24 28 12 13 5 1 5 8 4 1.5 0.5 4 106.09 TURKEY * 18 8 16 9 3 4 12 15 5 5 0.5 2.5 98.0
10 SAUDI ARABIA 8 20 10 8 8 5 15 13 2 5 1 0.5 95.511 PAKISTAN 4 2 22 1 2 6 13 10 10 5 2 1.5 78.512 MEXICO 12 14 2 11 7 2 13 4 1 6 0.5 3 75.513 EGYPT 16 6 6 4 1 4 4 14 2 1 2.5 2.5 63.014 SOUTH AFRICA 2 4 8 7 9 6 2 4 5 2 2.5 2 53.5
Max possible 28 28 28 14 14 14 15 15 15 10 5 5 191.0
* TURKEY ‐ As data was unavailable for Retail Market Values, AVERAGE values were assigned, as shown in blue.
Cultural similarities
with Australia ?
Geographical Proximity to
Australia (km by air) ?
Competition in Market for
Supply & Services ?
Scores based on subjective scoring of values by author, based on Report findings
DAIRY cow or product trade history with Australia ?
Scores based on standard ranking of numerical data, with weighting of either 1x or 2x
Current need for HEIFERS,
Technology & Services ?
Level of English widely
spoken ?
FINAL RANK
Ranking of Austrade-nominated 14 countries in terms of their potential as new markets for Australia’s supply of Dairy Animals, Technology and Services
TOTAL Score
COUNTRY
Real GDP Growth %
Change y‐o‐y 2010 (f) IMF
BMI Agribusiness Environment Rating 2010
Retail Value DAIRY Market
CAGR% 2004‐2009
Retail Value DAIRY Market
US Dollars 2010
Total TRADE with Australia mn AU Dollars
2009
Government Programs to assist DAIRY
Industry ?
Capability Assessment of Australian Dairy Technology and Services ‐ AANC Pty Ltd, July 2010
Page 72 of 329
GLOBAL AGRIBUSINESS BUSINESS ENVIRONMENT RATINGS Business Monitor International (BMI) Agribusiness Reports Q3 2010 sourced by AUSTRADE and supplied to Australian Agricultural Nutrition Consulting Pty Ltd for the current project. www.businessmonitor.com BMI's Agribusiness Business Environment Ratings (BERs) provide a comparative risk/reward analysis for investors in agribusiness markets globally. These ratings are designed to provide an industry neutral assessment of the opportunities and risks of investing in global agricultural markets, by examining both industry and country‐specific market traits that are of consequence to agricultural investors. Each agribusiness investment opportunity is assessed on criteria that fall under two broad headings. A. Limits of Potential Returns ‐ the size of the opportunity on offer, in turn broken into two components:
A.1. Agribusiness industry limits, which assess investment opportunities in terms of: o Agricultural market value, o Value growth, o Downstream prospects in value‐added production, and o Yield growth.
A.2. Country‐specific limits assesses opportunity in terms of: o Climatic suitability for agricultural production, o Domestic demand, o Government policy framework in relation to agriculture, o Government policy in relation to free and open trade, and o Access to credit for farmers.
B. Risks to Realisation of Potential Returns, that is the likelihood of investors being able to realise the opportunity on offer. Again this is assessed in two ways:
B.1. Agribusiness industry risks, which include: o Urbanisation, o Availability of water, resources and the frequency of natural disasters.
B.2. Country specific risks, which include: o The market's physical and labour infrastructure, and o Its general policy continuity and its exchange rate stability, which can weigh heavily on
global demand for its agricultural exports, or on the affordability of agricultural inputs for which it is import‐dependent.
Application of BMI’s Agribusiness Business Environment Ratings to nominated overseas dairy markets
An example of how BERs work. In terms of the US dollar value of its agricultural output, India is the world's largest agricultural market, the US a fairly distant second, with China and Brazil behind the US. However, the US is the clear market leader in BMI’s agribusiness BERs with India down in 17th place, a consequence of the advantages the North American market has over India, regardless of its relatively 'inferior' size. On the opportunity side, the US offers far stronger domestic demand and far more in terms of downstream added‐value production, as well as offering impressive yield growth rates, owing to its willingness to commercialise and, in many areas, embrace biotechnology. The US also outperforms India in terms of agricultural policy framework and lower trade bureaucracy, although BMI would stress that India betters the US in terms of its score for agricultural value growth. In terms of risks, it is no surprise to see the US out‐perform India, the US offering more in the way of infrastructure development, policy continuity and exchange rate stability ‐ all areas in which India falls short.
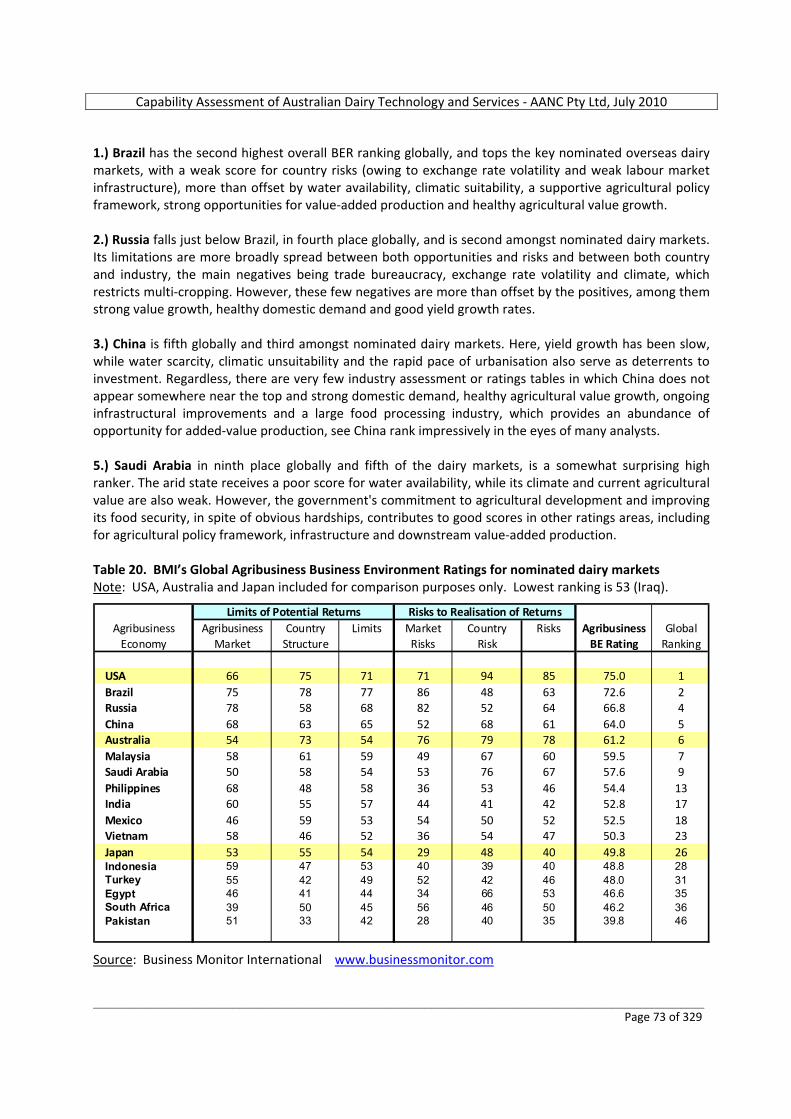
Capability Assessment of Australian Dairy Technology and Services ‐ AANC Pty Ltd, July 2010
_________________________________________________________________________________________________________ Page 73 of 329
1.) Brazil has the second highest overall BER ranking globally, and tops the key nominated overseas dairy markets, with a weak score for country risks (owing to exchange rate volatility and weak labour market infrastructure), more than offset by water availability, climatic suitability, a supportive agricultural policy framework, strong opportunities for value‐added production and healthy agricultural value growth. 2.) Russia falls just below Brazil, in fourth place globally, and is second amongst nominated dairy markets. Its limitations are more broadly spread between both opportunities and risks and between both country and industry, the main negatives being trade bureaucracy, exchange rate volatility and climate, which restricts multi‐cropping. However, these few negatives are more than offset by the positives, among them strong value growth, healthy domestic demand and good yield growth rates. 3.) China is fifth globally and third amongst nominated dairy markets. Here, yield growth has been slow, while water scarcity, climatic unsuitability and the rapid pace of urbanisation also serve as deterrents to investment. Regardless, there are very few industry assessment or ratings tables in which China does not appear somewhere near the top and strong domestic demand, healthy agricultural value growth, ongoing infrastructural improvements and a large food processing industry, which provides an abundance of opportunity for added‐value production, see China rank impressively in the eyes of many analysts. 5.) Saudi Arabia in ninth place globally and fifth of the dairy markets, is a somewhat surprising high ranker. The arid state receives a poor score for water availability, while its climate and current agricultural value are also weak. However, the government's commitment to agricultural development and improving its food security, in spite of obvious hardships, contributes to good scores in other ratings areas, including for agricultural policy framework, infrastructure and downstream value‐added production. Table 20. BMI’s Global Agribusiness Business Environment Ratings for nominated dairy markets Note: USA, Australia and Japan included for comparison purposes only. Lowest ranking is 53 (Iraq).
Agribusiness Agribusiness Country Limits Market Country Risks Agribusiness GlobalEconomy Market Structure Risks Risk BE Rating Ranking
USA 66 75 71 71 94 85 75.0 1Brazil 75 78 77 86 48 63 72.6 2Russia 78 58 68 82 52 64 66.8 4China 68 63 65 52 68 61 64.0 5Australia 54 73 54 76 79 78 61.2 6Malaysia 58 61 59 49 67 60 59.5 7Saudi Arabia 50 58 54 53 76 67 57.6 9Philippines 68 48 58 36 53 46 54.4 13India 60 55 57 44 41 42 52.8 17Mexico 46 59 53 54 50 52 52.5 18Vietnam 58 46 52 36 54 47 50.3 23Japan 53 55 54 29 48 40 49.8 26Indonesia 59 47 53 40 39 40 48.8 28Turkey 55 42 49 52 42 46 48.0 31Egypt 46 41 44 34 66 53 46.6 35South Africa 39 50 45 56 46 50 46.2 36Pakistan 51 33 42 28 40 35 39.8 46
Limits of Potential Returns Risks to Realisation of Returns
Source: Business Monitor International www.businessmonitor.com
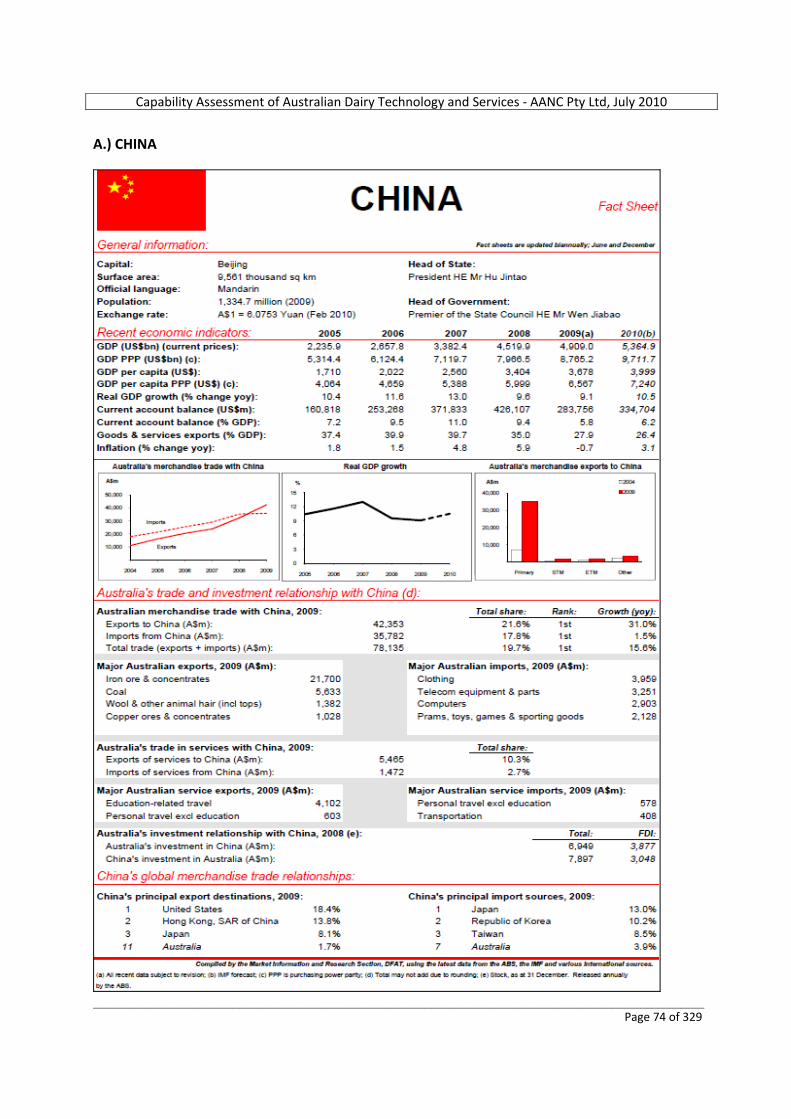
Capability Assessment of Australian Dairy Technology and Services ‐ AANC Pty Ltd, July 2010
_________________________________________________________________________________________________________ Page 74 of 329
A.) CHINA
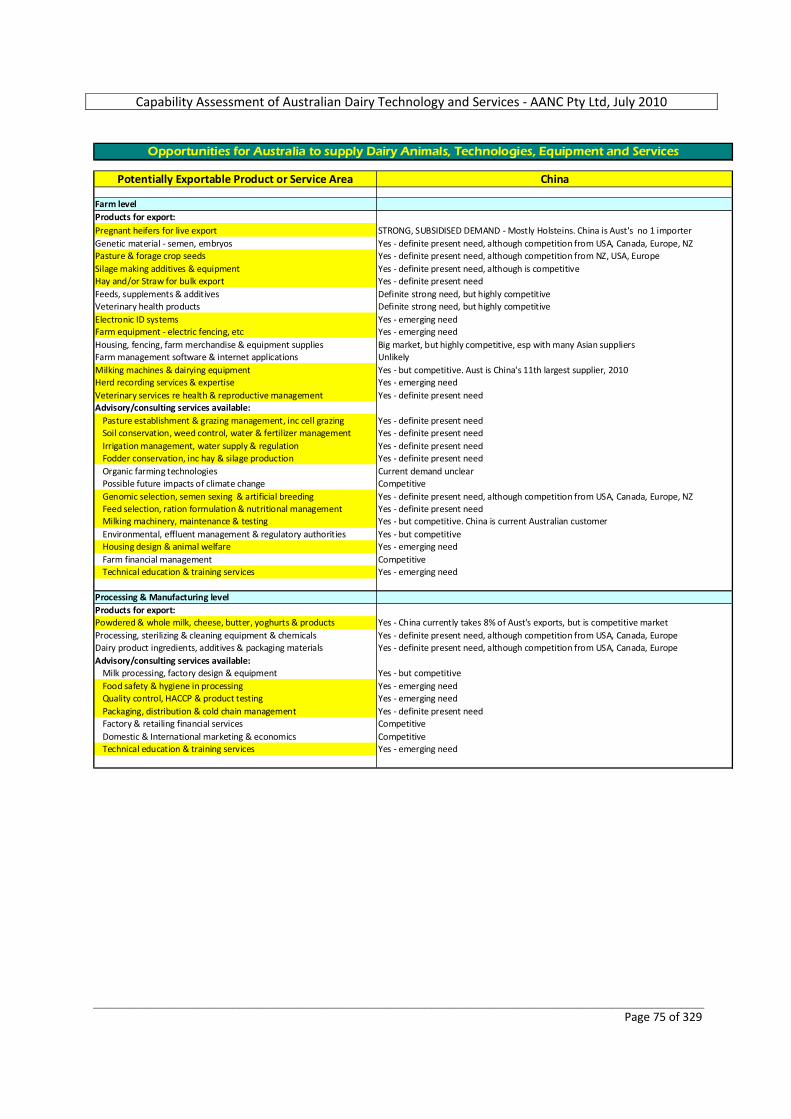
Capability Assessment of Australian Dairy Technology and Services ‐ AANC Pty Ltd, July 2010
_________________________________________________________________________________________________________ Page 75 of 329
Potentially Exportable Product or Service Area China
Farm levelProducts for export:Pregnant heifers for live export STRONG, SUBSIDISED DEMAND ‐ Mostly Holsteins. China is Aust's no 1 importerGenetic material ‐ semen, embryos Yes ‐ definite present need, although competition from USA, Canada, Europe, NZPasture & forage crop seeds Yes ‐ definite present need, although competition from NZ, USA, EuropeSilage making additives & equipment Yes ‐ definite present need, although is competitiveHay and/or Straw for bulk export Yes ‐ definite present needFeeds, supplements & additives Definite strong need, but highly competitiveVeterinary health products Definite strong need, but highly competitiveElectronic ID systems Yes ‐ emerging needFarm equipment ‐ electric fencing, etc Yes ‐ emerging needHousing, fencing, farm merchandise & equipment supplies Big market, but highly competitive, esp with many Asian suppliersFarm management software & internet applications UnlikelyMilking machines & dairying equipment Yes ‐ but competitive. Aust is China's 11th largest supplier, 2010Herd recording services & expertise Yes ‐ emerging needVeterinary services re health & reproductive management Yes ‐ definite present needAdvisory/consulting services available:
Pasture establishment & grazing management, inc cell grazing Yes ‐ definite present needSoil conservation, weed control, water & fertilizer management Yes ‐ definite present needIrrigation management, water supply & regulation Yes ‐ definite present needFodder conservation, inc hay & silage production Yes ‐ definite present needOrganic farming technologies Current demand unclearPossible future impacts of climate change CompetitiveGenomic selection, semen sexing & artificial breeding Yes ‐ definite present need, although competition from USA, Canada, Europe, NZFeed selection, ration formulation & nutritional management Yes ‐ definite present needMilking machinery, maintenance & testing Yes ‐ but competitive. China is current Australian customer Environmental, effluent management & regulatory authorities Yes ‐ but competitiveHousing design & animal welfare Yes ‐ emerging needFarm financial management CompetitiveTechnical education & training services Yes ‐ emerging need
Processing & Manufacturing levelProducts for export:Powdered & whole milk, cheese, butter, yoghurts & products Yes ‐ China currently takes 8% of Aust's exports, but is competitive marketProcessing, sterilizing & cleaning equipment & chemicals Yes ‐ definite present need, although competition from USA, Canada, EuropeDairy product ingredients, additives & packaging materials Yes ‐ definite present need, although competition from USA, Canada, EuropeAdvisory/consulting services available:
Milk processing, factory design & equipment Yes ‐ but competitiveFood safety & hygiene in processing Yes ‐ emerging needQuality control, HACCP & product testing Yes ‐ emerging needPackaging, distribution & cold chain management Yes ‐ definite present needFactory & retailing financial services CompetitiveDomestic & International marketing & economics CompetitiveTechnical education & training services Yes ‐ emerging need
Opportunities for Australia to supply Dairy Animals, Technologies, Equipment and Services
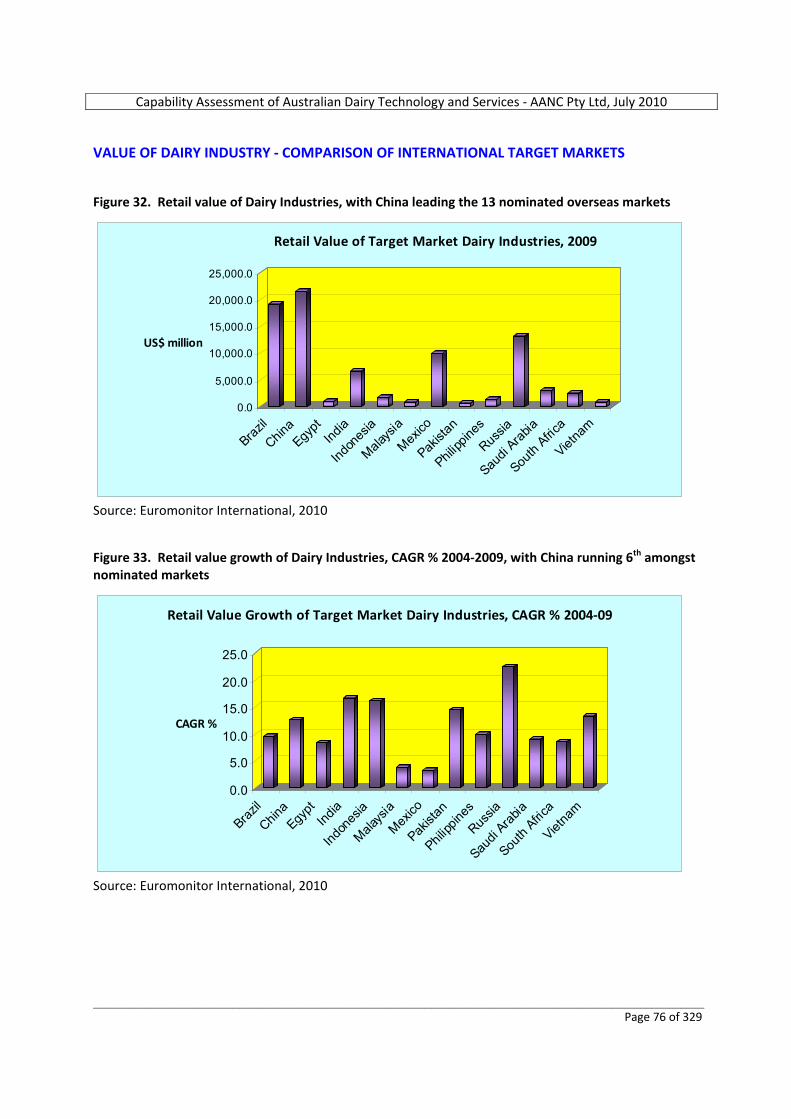
Capability Assessment of Australian Dairy Technology and Services ‐ AANC Pty Ltd, July 2010
_________________________________________________________________________________________________________ Page 76 of 329
VALUE OF DAIRY INDUSTRY ‐ COMPARISON OF INTERNATIONAL TARGET MARKETS Figure 32. Retail value of Dairy Industries, with China leading the 13 nominated overseas markets
0.0
5,000.0
10,000.0
15,000.0
20,000.0
25,000.0
US$ million
Brazil
China
Egypt
India
Indon
esia
Malays
ia
Mexico
Pakist
an
Philipp
ines
Russia
Saudi
Arabia
South
Africa
Vietna
m
Retail Value of Target Market Dairy Industries, 2009
Source: Euromonitor International, 2010 Figure 33. Retail value growth of Dairy Industries, CAGR % 2004‐2009, with China running 6th amongst nominated markets
0.0
5.0
10.0
15.0
20.0
25.0
CAGR %
Brazil
China
Egypt
India
Indon
esia
Malays
ia
Mexico
Pakist
an
Philipp
ines
Russia
Saudi
Arabia
South
Africa
Vietna
m
Retail Value Growth of Target Market Dairy Industries, CAGR % 2004‐09
Source: Euromonitor International, 2010
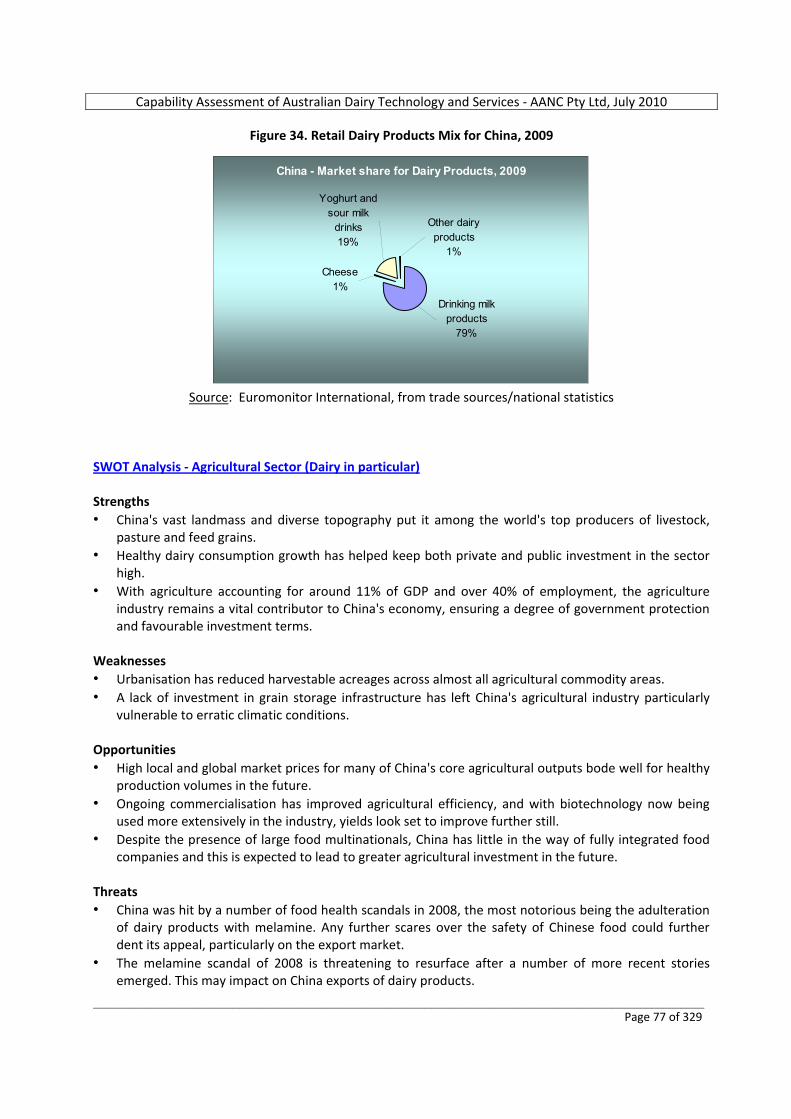
Capability Assessment of Australian Dairy Technology and Services ‐ AANC Pty Ltd, July 2010
_________________________________________________________________________________________________________ Page 77 of 329
Figure 34. Retail Dairy Products Mix for China, 2009
China - Market share for Dairy Products, 2009
Drinking milk products
79%
Cheese1%
Yoghurt and sour milk
drinks19%
Other dairy products
1%
Source: Euromonitor International, from trade sources/national statistics
SWOT Analysis ‐ Agricultural Sector (Dairy in particular) Philippines Agricultural SWOT Strengths • China's vast landmass and diverse topography put it among the world's top producers of livestock,
pasture and feed grains. • Healthy dairy consumption growth has helped keep both private and public investment in the sector
high. • With agriculture accounting for around 11% of GDP and over 40% of employment, the agriculture
industry remains a vital contributor to China's economy, ensuring a degree of government protection and favourable investment terms.
Weaknesses • Urbanisation has reduced harvestable acreages across almost all agricultural commodity areas. • A lack of investment in grain storage infrastructure has left China's agricultural industry particularly
vulnerable to erratic climatic conditions. Opportunities • High local and global market prices for many of China's core agricultural outputs bode well for healthy
production volumes in the future. • Ongoing commercialisation has improved agricultural efficiency, and with biotechnology now being
used more extensively in the industry, yields look set to improve further still. • Despite the presence of large food multinationals, China has little in the way of fully integrated food
companies and this is expected to lead to greater agricultural investment in the future. Threats • China was hit by a number of food health scandals in 2008, the most notorious being the adulteration
of dairy products with melamine. Any further scares over the safety of Chinese food could further dent its appeal, particularly on the export market.
• The melamine scandal of 2008 is threatening to resurface after a number of more recent stories emerged. This may impact on China exports of dairy products.
Capability Assessment of Australian Dairy Technology and Services ‐ AANC Pty Ltd, July 2010
_________________________________________________________________________________________________________ Page 78 of 329
• Slowing GDP growth will see the rate of expansion in demand for some agricultural commodities such as beef and some dairy products decline.
SWOT Analysis ‐ Political Environment Strengths • The Communist Party of China, which has governed for the past 60 years, remains secure in its
position as the sole political party in China. Weaknesses • As with any other one‐party state, China’s political system is inherently unstable and unable to
respond to the wider changes taking place in Chinese society. Provincial governments often fail to enforce central government directives.
• China’s relationship with Taiwan remains problematic, with Beijing refusing to rule out the threat of force in the event of a declaration of independence by Taiwan.
Opportunities • China is actively expanding its political and economic ties with major emerging markets, such as Latin
America, Africa and the Middle East. Threats • Growing corruption, widening inequalities, increasing rural poverty and environmental degradation
have led to an increase in social unrest in recent years. SWOT Analysis ‐ Economic Environment Strengths • China is the fastest‐growing major economy in the world, and this has lifted hundreds of millions of
people out of poverty over the past generation. • China has a massive trade surplus and its huge foreign exchange reserves serve as a major cushion
against external shocks. Weaknesses • China’s dependency on exports to boost growth has made it vulnerable to the global recession.
Private consumption remains weak at less than 40% of GDP. Opportunities • China’s economic growth is slowly becoming more broad‐based, with domestic consumption likely to
rise in importance vis‐à‐vis exports, thanks to a middle class of 200‐300 million people. • As China moves up the value chain, it will develop its own global brand name companies, fostering
innovation and growth. Threats • Business Monitor International believes that the global recession of 2008‐2010 will mean an end to
China’s double‐digit annual growth rate. The recession is leading to job losses in China’s export sector and thus increasing social instability.
SWOT Analysis ‐ Business Environment

Capability Assessment of Australian Dairy Technology and Services ‐ AANC Pty Ltd, July 2010
_________________________________________________________________________________________________________ Page 79 of 329
Strengths • China is continuing to open up various sectors of its economy to foreign investment. • With its vast supply of cheap labour, the country remains the top destination for foreign direct
investment in the developing world. Weaknesses • Foreign companies continue to complain about the poor protection of intellectual property in China. • Chinese corporate governance is weak and non‐transparent by Western standards. There is a
considerable risk for foreign companies in choosing the right local partner. Opportunities • The Chinese government is giving more protection and encouragement to the private sector. Threats • China’s government may block attempts by foreign firms to take over assets of national importance. • China is experiencing rising labour costs, prompting some investors to turn to cheaper destinations
such as Vietnam. CHINA DAIRY INDUSTRY OVERVIEW Business Monitor International (BMI) China Agribusiness Report Q3 2010 Including 5‐year industry forecasts by BMI, May 2010. The dairy industry remains one of the fastest growing sub‐sectors in China's food industry. This is being fuelled by rising disposable incomes, increased urbanisation, improved affordability of domestic cold storage facilities and improved awareness of the health benefits of dairy products. The production of dairy products in China, especially milk and whole milk powder, has increased rapidly in recent years, with farmers encouraged by high local market prices. Bumper profits have been reported by some of the country's largest dairy producers including Bright Dairy, Inner Mongolia Yili Industrial Group and China Mengniu Dairy. Nevertheless, the sector remains notoriously inefficient due to its fragmented nature ‐ over 70% of Chinese milk production comes from farms with less than 20 head of cattle. This combined with the continued dampening effects of the economic downturn and the latest melamine scandal in 2010 will limit the sector's prospects and keep supply growth in check. Consumer demand for dairy products has remained robust despite the combined effects of the rising cost of dairy products, the 2008 melamine scandal and the economic slowdown. A brightening economic outlook, ongoing urbanisation and the increased prevalence of white goods in the home should help drive consumption growth over at least the next 5 years. Government initiatives to lift demand promoting the health benefits of dairy consumption ‐ initiatives that include government price caps ‐ will help fuel liquid milk consumption growth, while strong demand for butter and cheese will be a result of income growth and increased Western investment in the local marketplace. The September 2008 melamine scandal hurt the sector considerably. The scandal, which started with the discovery of toxic levels of melamine in milk and resulted in widespread condemnation and two death sentences, resulted in the volume of Chinese dairy product exports falling by 10% year‐on‐year (y‐o‐y) in 2008, though the value of exports was still up by 25% y‐o‐y due to the high prices for dairy products. While
Capability Assessment of Australian Dairy Technology and Services ‐ AANC Pty Ltd, July 2010
_________________________________________________________________________________________________________ Page 80 of 329
it had looked like a line had been drawn under the scandal, the arrest of three company executives for supplying melamine‐contaminated products reported in January 2010 raised further concerns. Indeed, Chinese consumers have shown a marked increase in demand for imported dairy goods, particularly dairy powder. BMI remains bullish on the medium‐term future of China's dairy sector, despite the melamine scandal. They expect China's dairy sector to continue posting strong growth over our forecast period to 2014, although large dairy producer Taizinai's demise in April 2010 due to the scandal, is an indication of the continuing risk/reward nature of the sector. The melamine scandal has dented domestic consumer confidence in the dairy sector. The most severe effect of this is expected to be on exports, with Chinese consumers having shown themselves to be fairly forgiving to producers if they are seen to follow directives for product recalls and safety standard improvements. While the domestic market should recover quickly as confidence is restored and consumers have little other options, it will take longer to win back the trust of consumers abroad. Nevertheless, after another melamine scandal in early 2010, Chinese consumers may be less forgiving and begin to lose faith in government food inspection agencies. To retain export market share, dairy producers need to plough investment into marketing initiatives promoting the health and safety of their products. Despite the economic slowdown and suspicion over dairy products, things do seem to be looking up for China’s dairy industry. Three of the country's major producers that were involved with melamine have managed to restore their financial health after witnessing heavy losses in 2008, although the company most embroiled in the scandal, Sanlu, declared bankruptcy in February 2009. In general, demand for dairy products seems to have recovered form around 60 to 90% of pre‐scandal levels. The return of confidence in China's dairy producers was shown by a number of investments in the sector in mid‐2009. In June, US private equity firm Kohlberg Kravis Roberts & Co invested in Anhui‐based Ma Anshan Modern Farming (neé Modern Dairy). In July, China National Oils, Foodstuffs and Cereals Corporation and Hopu Fund purchased 20% of Mengniu and in September another US private equity firm, the Carlyle Group, bought a 17.3% stake in infant formula maker Guangdong Yashili Group. These deals reflect the fact that despite the recent setbacks there is still huge potential in China's dairy sector. It is expected that more foreign money will flow into the sector in the coming years as investors fight to gain a foothold in the market. Despite this positive news, after effects of the crisis are still lingering. Chinese consumers have shown a marked increase in demand for imported dairy goods, particularly dairy powder. Swiss giant Nestlé has reported rapid growth in its dairy products, in part because they were found not to contain melamine when the scandal broke. Efforts to ensure there is no repeat of the scandal are still underway. In June 2009, the director of the China Dairy Industry Association (CDIA) said 3,908 of China's 20,393 milk collection centres had been closed down owing to a lack of testing equipment or poor hygiene conditions. The centres still operating will be checked on a regular basis by provincial and regional agriculture departments. Despite being one of the most dynamic subsectors of China's agricultural industry, the dairy market is blighted by inefficiency. Major local processors have been joined by large multinationals to create a dynamic dairy processing industry, yet primary production is hampered by structural problems. The main of these has been the fragmented nature of the industry ‐ over 70% of Chinese milk production is accounted for by farms with less than 20 head of cattle.
Capability Assessment of Australian Dairy Technology and Services ‐ AANC Pty Ltd, July 2010
_________________________________________________________________________________________________________ Page 81 of 329
China's dairy industry is inefficient by global standards. Milk production per cow is less than half the levels achieve in Australia (2,443kg in 2007, compared to 5,493kg in Australia) and has failed to improve in the subsequent two years. While China's vast dairy industry has been touted as a means of improving rural living standards, farmers in deep rural areas lack the access to markets that would enable them to benefit from high prices. The perishable nature of dairy products, poor rural distribution infrastructure and a lack of farm storage have all forced small‐scale dairy enterprises to accept lower prices for their output. This problem has been exacerbated by the difficulties small‐scale farms have in obtaining credit to fund infrastructural improvements. Commercialisation and ongoing investment in nationwide infrastructural improvements will alleviate this problem in time. However, the government will have to tread a fine line between dairy subsidies and price caps in the meantime to ensure that participation in the industry remains beneficial for all and that production can meet strong demand increases. The government has moved to boost production, introducing raw milk subsidies to shore up supplies and convince even small‐scale enterprises of the financial benefits of dairy farming. Sustained high milk prices should also help. Even though the government caps milk prices to try and ensure the availability of the product for all, it has acknowledged the importance of a sustainable supply chain and has already increased the price cap by 10%, providing some relief to profit squeezed farmers. Supply assurances should also come via the slow but steady commercialisation of the industry. Secondary dairy producers in China ‐ at the processing level where most private sector investment has occurred ‐ are increasingly acknowledging the importance of managing their own supply chain. China has few fully integrated dairy operations but the intense pressure producers have come under from rising input and distribution costs has led to a rapid education in the importance of upstream integration. Furthermore, China should experience strong demand growth for milk products, which BMI forecasts to increase by 52% to 62 million tonnes by 2014, owing to population increases and rising incomes due to economic growth. As such, barring any further scandals, the sector should remain a lucrative opportunity for firms that correctly judge the market. The first half of 2010 has already seen several bouts of investment and consolidation. Leading producer Bright Dairy revealed plans for a CNY1.47 billion (AU$0.2 billion) investment to establish a new industrial park in Shanghai. The park is expected to take 30 months to construct, will cover a land area of 15.78 hectares and give the company a daily dairy capacity of 2,000 tonnes. Meanwhile global dairy export group Fonterra Cooperative announced plans to develop its milk supply in China by investing in two more dairy farms in the country. DATAMONITOR www.datamonitor.com Dairy in China. Industry Profile. Ref Code: 0099‐0711. November, 2009. Market Value The Chinese dairy market grew by 8.1% in 2008 to reach a value of $17 billion. Market Value Forecast In 2013, the Chinese dairy market is forecast to have a value of $24 billion, an increase of 41.2% since 2008. Market Segmentation I Milk sales dominated the Chinese dairy market in 2008, generating 58.8% of the market's overall revenues.
Capability Assessment of Australian Dairy Technology and Services ‐ AANC Pty Ltd, July 2010
_________________________________________________________________________________________________________ Page 82 of 329
Market Segmentation II China accounts for 34.1% of the Asia‐Pacific dairy market's value. Market Share Bright Food Group accounts for 12.3% of the Chinese dairy market's value. Distribution Independent retailers lead the Chinese dairy market, distributing 57.1% of the market’s overall value. Table 21. Breakdown of liquid milk products in China, by output and proportion, 1999‐2004
China accounts for 34.1% of the Asia‐Pacific dairy market's value. By comparison, Japan accounts for a further 33.2% of the regional market's value. USDA Foreign Agricultural Service. Global Agricultural Information Network. GAIN Report Number: CH9086. Date 11/12/2009 China ‐ Peoples Republic of DAIRY AND PRODUCTS ANNUAL. 2009 Annual Report. Fresh milk imports continue to surge. While still a niche market, Chinese fluid milk imports have tripled in recent years, up from just over 4,000 tons in 2007 to an estimated 12,000 tons in 2009. The strong demand is fueled by sales to wealthier Chinese and expats who are willing to pay up to 18 rmb ($2.64) per liter of imported milk at retail. New Zealand, Australia and France account for almost 90 percent of sales. Fluid milk imports are expected to approach 15,000 metric tons in 2010. Table 22. Source of China Fluid Milk Imports, 2007‐2009 (Year‐To‐Date) (Metric Tonnes)
Source: GTA China Customs Statistics
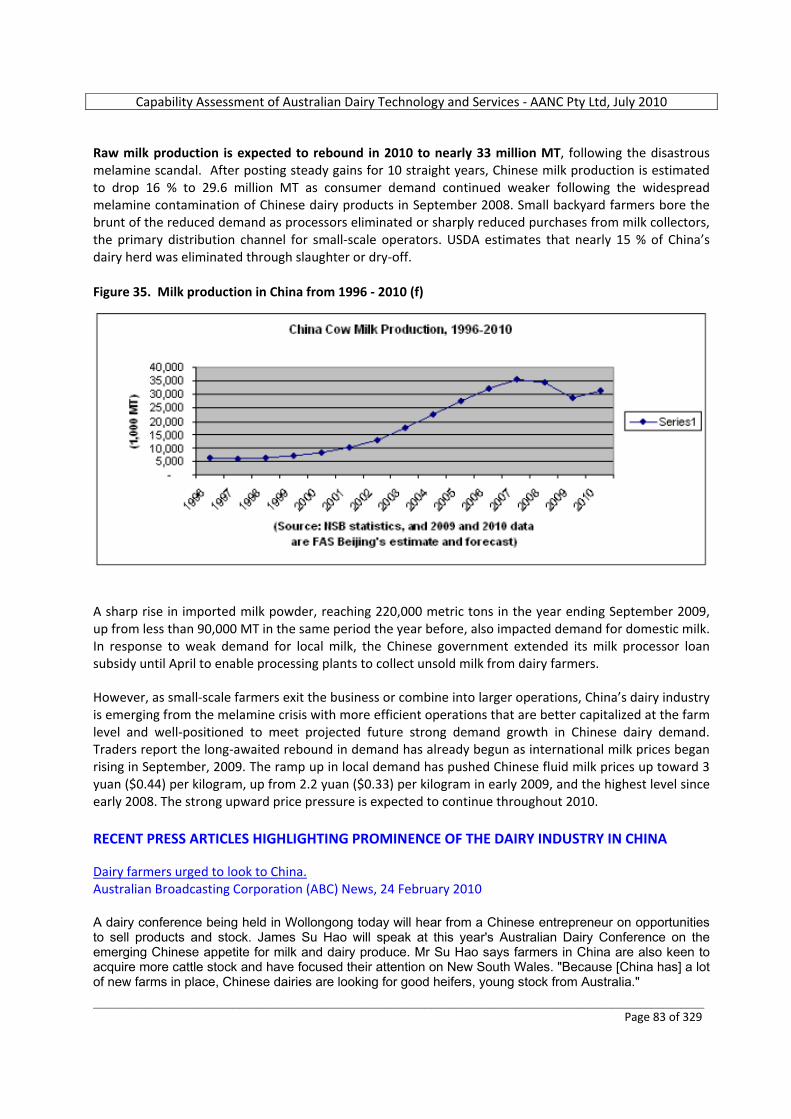
Capability Assessment of Australian Dairy Technology and Services ‐ AANC Pty Ltd, July 2010
_________________________________________________________________________________________________________ Page 83 of 329
Raw milk production is expected to rebound in 2010 to nearly 33 million MT, following the disastrous melamine scandal. After posting steady gains for 10 straight years, Chinese milk production is estimated to drop 16 % to 29.6 million MT as consumer demand continued weaker following the widespread melamine contamination of Chinese dairy products in September 2008. Small backyard farmers bore the brunt of the reduced demand as processors eliminated or sharply reduced purchases from milk collectors, the primary distribution channel for small‐scale operators. USDA estimates that nearly 15 % of China’s dairy herd was eliminated through slaughter or dry‐off. Figure 35. Milk production in China from 1996 ‐ 2010 (f)
A sharp rise in imported milk powder, reaching 220,000 metric tons in the year ending September 2009, up from less than 90,000 MT in the same period the year before, also impacted demand for domestic milk. In response to weak demand for local milk, the Chinese government extended its milk processor loan subsidy until April to enable processing plants to collect unsold milk from dairy farmers. However, as small‐scale farmers exit the business or combine into larger operations, China’s dairy industry is emerging from the melamine crisis with more efficient operations that are better capitalized at the farm level and well‐positioned to meet projected future strong demand growth in Chinese dairy demand. Traders report the long‐awaited rebound in demand has already begun as international milk prices began rising in September, 2009. The ramp up in local demand has pushed Chinese fluid milk prices up toward 3 yuan ($0.44) per kilogram, up from 2.2 yuan ($0.33) per kilogram in early 2009, and the highest level since early 2008. The strong upward price pressure is expected to continue throughout 2010. RECENT PRESS ARTICLES HIGHLIGHTING PROMINENCE OF THE DAIRY INDUSTRY IN CHINA Dairy farmers urged to look to China. Australian Broadcasting Corporation (ABC) News, 24 February 2010 A dairy conference being held in Wollongong today will hear from a Chinese entrepreneur on opportunities to sell products and stock. James Su Hao will speak at this year's Australian Dairy Conference on the emerging Chinese appetite for milk and dairy produce. Mr Su Hao says farmers in China are also keen to acquire more cattle stock and have focused their attention on New South Wales. "Because [China has] a lot of new farms in place, Chinese dairies are looking for good heifers, young stock from Australia."
Capability Assessment of Australian Dairy Technology and Services ‐ AANC Pty Ltd, July 2010
_________________________________________________________________________________________________________ Page 84 of 329
Mr Su Hao says the melamine outbreak in China has created new opportunities for south coast dairy farmers. He says the melamine-in-milk scandal two years ago that killed several babies has led to an interest in proper dairy farming in China. "The melamine scandal was actually a breaking point for the dairy industry in China, the industry was almost destroyed," Mr Su Hao said. "The Chinese economy is growing, so the Chinese consumers are really looking for high quality milk, so there's a good chance for our Australian dairy colleagues to think about progress in the export of their milk powders and other dairy products to China." Heifers set to be cash cows in China. Rebecca Turner, The Countryman, West Australian Newspapers Ltd, 18 March 2010 A boom in Chinese dairy construction is driving demand for Aussie heifers, which could see exports reach 40,000 head this year. The trade peaked back in 2004, when more than 70,000 head were exported, but then crashed as China slashed investment. But rapid large scale dairy construction in 2010 — to feed domestic demand — is likely to see the Asian giant’s appetite for live cattle skyrocket. Elders’ South-West livestock operations co-ordinator, Daniel Delaney, is responsible for selecting WA diary heifers for Elders International, one of several dairy heifer exporters operating in Australia. “The boom for dairy heifers is based on supply and demand,” he said. “Elders International has a standing order for 4700 heifers every six weeks and our other competitors would be around the same, so that would see 8 to 10,000 heifers leaving Australia every second month,” Mr Delaney said. “Over the last couple of months we have seen prices jump from $900/head to $1100/head and I think these prices will keep going. “The only thing holding exports back here is WA’s capacity to supply.” Mr Delaney said Elders International was looking for dairy heifers between 160 and 350kg from eight to 15 months old. He said an increased uptake of using sexed semen would be the best thing for this industry in WA. “As conception rates for sexed semen increases I think we will see more people using this technology; it makes sense when you are receiving $1000 a heifer compared to $200 for a Friesian steer,” Mr Delaney said. US Grain Council sponsored “First Large Dairy Farm Management Seminar” in Beijing. China Dairy Business, VOL 1011, Jun 18, 2010 The “First Large Dairy Farm Management Seminar”, sponsored by USGC and Huaxia Animal farming, was held in Beijing on June 10th, 2010. The sponsors invited 8 American experts to give lectures on dairy cattle nutrition, microelements, new technology on feed formula, gender-control frozen semen, improvement of reproduction rate and herd management. There were more than 200 participants and were mainly managers and technicians of dairy farms of different scales in the nation and representatives from dairy farming enterprises. Organizers of the seminar were American Elanco Animal Health, American Pfizer Animal Health, Land O’Lakes Great Wall Enterprise, Novus, Alta-Agricorp, Biotracking, East Rock, and Hayday Farms. 1st China Dairy Conference Held in Qingdao to Promote Dairy Integration. China Dairy Business, VOL 1011, Jun 18, 2010 DAC held the 1st China Dairy Conference & 8th China International Dairy Exhibition in Qingdao, Shandong from June 8-10, 2010. The theme of the conference was promotion of dairy industrial integration and establishment of long-term effective joint-interest mechanism of production and sales so as to provide guarantee for prospering the dairy industry. The 8th China International Dairy Exhibition and High-level Forum were held concurrently. There were 170 exhibitors from 17 countries including China, the US, Canada and Australia. There were altogether more than 2000 participants to the conference and they were representatives of various sectors of the dairy industry, diplomats from foreign embassies and counterparts of the foreign dairy industry.
Capability Assessment of Australian Dairy Technology and Services ‐ AANC Pty Ltd, July 2010
_________________________________________________________________________________________________________ Page 85 of 329
Top 20 Global Dairy Companies issued on Jun 15 ‐ Mengniu and Yili in the list. China Dairy Business, VOL 1011, Jun 18, 2010 Rabobank International has released its annual list of top 20 global dairy companies on Jun.15. China’s Mengniu ranks 16th this year, 3 places ahead of 2009, with total sales of ¥25.75 billion, while another Chinese dairy giant, Yili, ranks 17th for the first time, with total sales of ¥24.18 billion. The Top-10 is still headed by Nestlé, and dominated by players from the mature markets of Europe and the US. “The main conclusion of this year’s ranking is that the number of representatives of non-western countries is steadily increasing”, says Mark Voorbergen, Rabobank’s dairy market analyst. “All together, this clearly shows that companies mainly operating in the mature markets of Europe and the United States may find it hard to achieve further growth, while companies operating in developing markets have ample opportunity to increase sales simply by keeping up with domestic market growth.” New Zealand is the main exporting country of milk powder to China. China Dairy Business, VOL 1011, Jun 18, 2010 According to customs statistics, China imported 180,200 MT of milk powder in total from January to May, rising 70 % year on year and the import value was US$562 million, rising 112 % year on year. Among the total import volume, 154,771 MT was from New Zealand, 8,464 MT from Australia and 8,451 MT from Europe Union. The average import price in Jan-May was US$ 3,117 per ton, up 25 % year on year. China imported 9,668 MT of Cheese in Jan‐May, 2010, up 75% year on year. China Dairy Business, VOL 1011, Jun 18, 2010 According to customs statistics, China imported 9,668 tonnes of cheese in total from January to May, rising 75 % year on year and the import value was US$42.59 million, rising 72 % year on year. Among the total import volume, 4,994 MT was from New Zealand, 1,993 MT from Australia,1,262 MT from USA,296 MT from Argentina,140 MT from Uruguay,134 MT from Italy, 225 MT from France, 120 MT from Germany and 106 MT from Denmark. 1.) Historical data on the volume of dairy cattle and dairy equipment imports (from Australia and internationally) ‐ over past 5 years In 2009, China was clearly the number one destination for live exported dairy cattle (generally in‐calf heifers) from Australia, with nearly 33,000 head shipped. In terms of competitor nations supplying the China market with dairy animals, US Comtrade and Chinese data on this is inconclusive, as such data refers to “Live bovine animals” and therefore does not distinguish beef animals from dairy. However, it appears likely that Australia would have been clearly the largest supplier of dairy heifers in 2009, as only four countries exported live bovine animals to China in that year, these being Australia, New Zealand, Uruguay and South Africa. US Comtrade data clearly suggests New Zealand is the second largest live exporter, but from Table 10 previously on page 27, it is apparent that only 11,000 dairy animals were shipped to China from that country during 2009, which is well below the number exported by Australia.
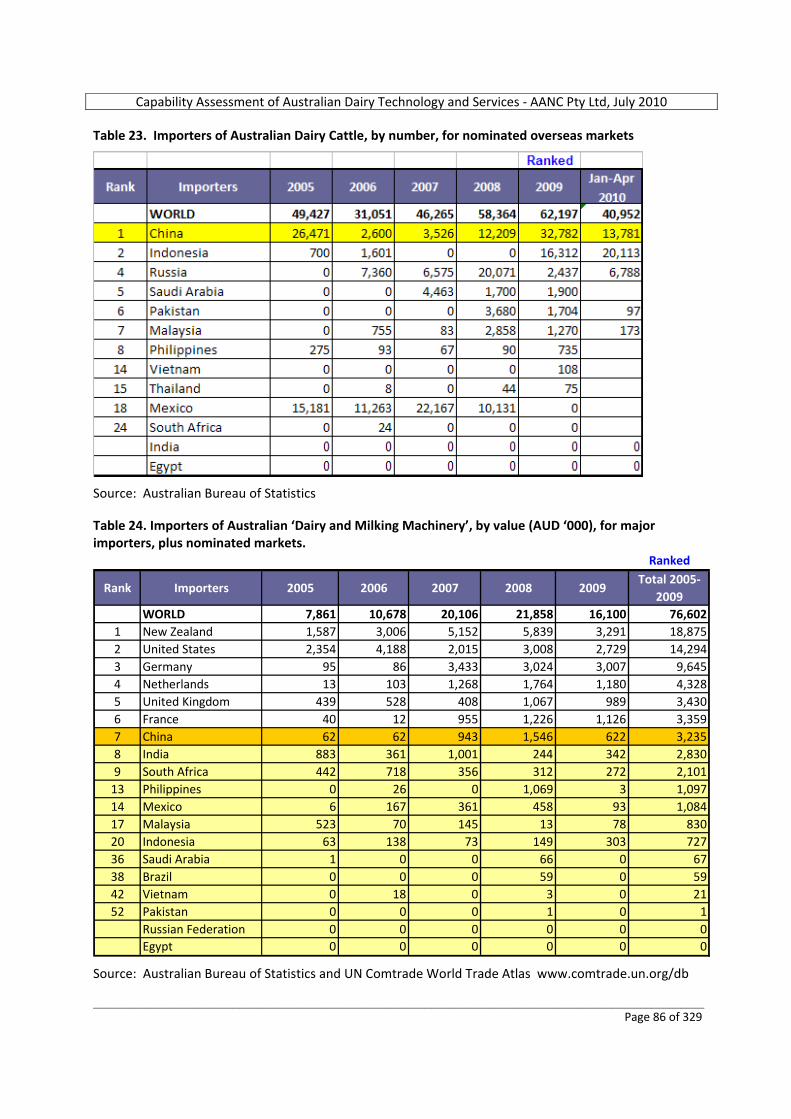
Capability Assessment of Australian Dairy Technology and Services ‐ AANC Pty Ltd, July 2010
_________________________________________________________________________________________________________ Page 86 of 329
Table 23. Importers of Australian Dairy Cattle, by number, for nominated overseas markets
Source: Australian Bureau of Statistics Table 24. Importers of Australian ‘Dairy and Milking Machinery’, by value (AUD ‘000), for major importers, plus nominated markets.
Ranked
Rank Importers 2005 2006 2007 2008 2009Total 2005‐
2009WORLD 7,861 10,678 20,106 21,858 16,100 76,602
1 New Zealand 1,587 3,006 5,152 5,839 3,291 18,8752 United States 2,354 4,188 2,015 3,008 2,729 14,2943 Germany 95 86 3,433 3,024 3,007 9,6454 Netherlands 13 103 1,268 1,764 1,180 4,3285 United Kingdom 439 528 408 1,067 989 3,4306 France 40 12 955 1,226 1,126 3,3597 China 62 62 943 1,546 622 3,2358 India 883 361 1,001 244 342 2,8309 South Africa 442 718 356 312 272 2,101
13 Philippines 0 26 0 1,069 3 1,09714 Mexico 6 167 361 458 93 1,08417 Malaysia 523 70 145 13 78 83020 Indonesia 63 138 73 149 303 72736 Saudi Arabia 1 0 0 66 0 6738 Brazil 0 0 0 59 0 5942 Vietnam 0 18 0 3 0 2152 Pakistan 0 0 0 1 0 1
Russian Federation 0 0 0 0 0 0Egypt 0 0 0 0 0 0
Source: Australian Bureau of Statistics and UN Comtrade World Trade Atlas www.comtrade.un.org/db
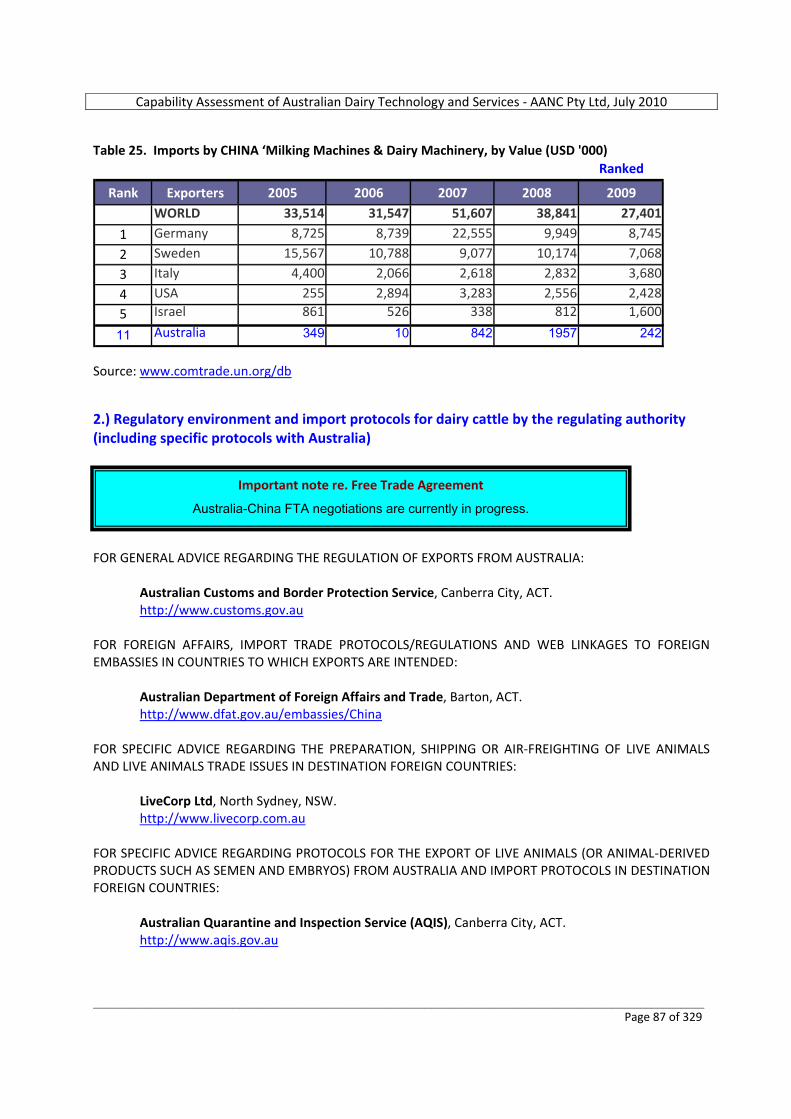
Capability Assessment of Australian Dairy Technology and Services ‐ AANC Pty Ltd, July 2010
_________________________________________________________________________________________________________ Page 87 of 329
Table 25. Imports by CHINA ‘Milking Machines & Dairy Machinery, by Value (USD '000)
Ranked
Rank Exporters 2005 2006 2007 2008 2009WORLD 33,514 31,547 51,607 38,841 27,401
1 Germany 8,725 8,739 22,555 9,949 8,745
2 Sweden 15,567 10,788 9,077 10,174 7,068
3 Italy 4,400 2,066 2,618 2,832 3,680
4 USA 255 2,894 3,283 2,556 2,428
5 Israel 861 526 338 812 1,600
11 Australia 349 10 842 1957 242
Source: www.comtrade.un.org/db 2.) Regulatory environment and import protocols for dairy cattle by the regulating authority (including specific protocols with Australia) FOR GENERAL ADVICE REGARDING THE REGULATION OF EXPORTS FROM AUSTRALIA:
Australian Customs and Border Protection Service, Canberra City, ACT. http://www.customs.gov.au
FOR FOREIGN AFFAIRS, IMPORT TRADE PROTOCOLS/REGULATIONS AND WEB LINKAGES TO FOREIGN EMBASSIES IN COUNTRIES TO WHICH EXPORTS ARE INTENDED:
Australian Department of Foreign Affairs and Trade, Barton, ACT. http://www.dfat.gov.au/embassies/China
FOR SPECIFIC ADVICE REGARDING THE PREPARATION, SHIPPING OR AIR‐FREIGHTING OF LIVE ANIMALS AND LIVE ANIMALS TRADE ISSUES IN DESTINATION FOREIGN COUNTRIES:
LiveCorp Ltd, North Sydney, NSW. http://www.livecorp.com.au
FOR SPECIFIC ADVICE REGARDING PROTOCOLS FOR THE EXPORT OF LIVE ANIMALS (OR ANIMAL‐DERIVED PRODUCTS SUCH AS SEMEN AND EMBRYOS) FROM AUSTRALIA AND IMPORT PROTOCOLS IN DESTINATION FOREIGN COUNTRIES:
Australian Quarantine and Inspection Service (AQIS), Canberra City, ACT. http://www.aqis.gov.au
Important note re. Free Trade Agreement
Australia-China FTA negotiations are currently in progress.
Capability Assessment of Australian Dairy Technology and Services ‐ AANC Pty Ltd, July 2010
_________________________________________________________________________________________________________ Page 88 of 329
Specific China information: USDA Foreign Agricultural Service. Global Agricultural Information Network. GAIN Report Number: CH9063. Date 7/24/2009 China ‐ Peoples Republic of. Food and Agricultural Import Regulations and Standards. References to dozens of Food Safety and Agricultural Import Regulations and Standards, in GAIN Reports, by report number. USDA Foreign Agricultural Service. Global Agricultural Information Network. GAIN Report Number: CH9086. Date 11/12/2009 China ‐ DAIRY AND PRODUCTS ANNUAL, 2009. To encourage dairy industry restructuring, the National Development and Reform Commission (NDRC) and the Ministry of Industry and Information Technology jointly announced the “China Dairy Industry Policy” (Revision 2009) on June 26, 2009. The policy directs firms building new dairy processing facilities to source at least 40 percent of its raw milk from its own herd, up from 30 percent previously. Furthermore, companies that improve or expand existing facilities must control no less than 75 percent of its raw milk source sent to the improved plants. In addition, the policy directs fluid milk processors (including pasteurized and UHT) to use raw milk for all fluid milk sales. In the past processors were allowed to use reconstituted product for sales of UHT fluid milk. The government is also undertaking a broad revision of China’s dairy product standards geared to better ensure safety and quality, and improve consumer confidence. In late October 2009, the Ministry of Health (MOH) issued draft updated standards for a number of products including fluid milk, milk powder, whey, and infant formula. The revisions include new microbiological standards and guidelines for storage and transportation. Subsidies for Breeding Dairy Cows on the Rise According to the Ministry of Agriculture (MOA), the Chinese central government provided CNY 990 million (US$114.7 million) in breeding animal subsidies in 2009. The amount is double the total amount of the previous two years. Subsidies for breeding cows include more than 7 million head of Holstein and Jersey cows, in addition to minor breeds. Each productive Holstein or Jersey cow is subsidized with CNY30 (AU$4.60) for two straws of frozen bull semen (for artificial insemination) a year, while other breeds get CNY20 ($3.06) for two straws of frozen bull semen a year. China’s urgent need for improvement in genetics will translate into rising animal genetic imports in 2009 and 2010. Policy: Fresh Milk, Milk Powder, and Whey Imports under ARF Management On July 16, 2009, the Chinese Ministry of Commerce (MOFCOM) and the General Customs Administration (GCA) jointly announced that as of August 1, 2009 imported fresh milk, milk powder, and whey are included in the list of major agricultural commodities subject to import monitoring. Importers must complete an Automatic Registration Form (ARF) to receive a permit from the China Chamber of Commerce for Import and Export Foodstuffs, Native Produce and Animal Byproducts (CCFNA) under MOFCOM prior to importation. While the purpose of the ARF is to monitor imports, there can be business disruptions to the importer.
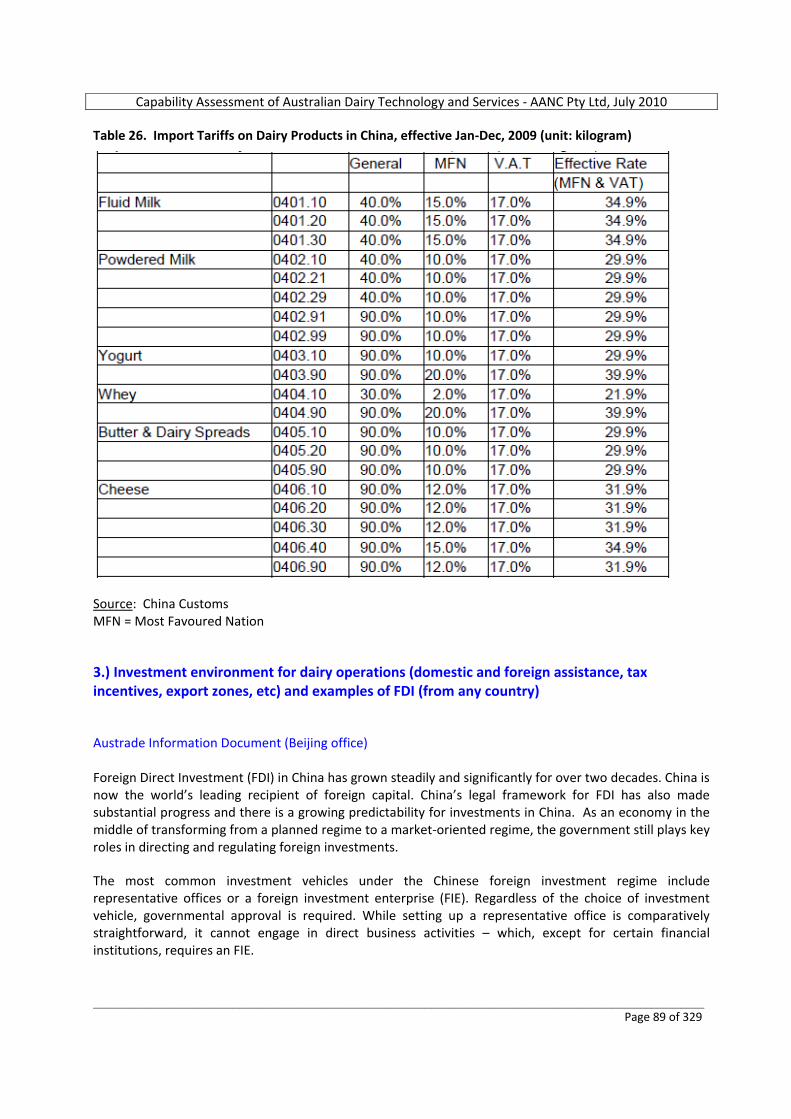
Capability Assessment of Australian Dairy Technology and Services ‐ AANC Pty Ltd, July 2010
_________________________________________________________________________________________________________ Page 89 of 329
Table 26. Import Tariffs on Dairy Products in China, effective Jan‐Dec, 2009 (unit: kilogram)
Source: China Customs MFN = Most Favoured Nation 3.) Investment environment for dairy operations (domestic and foreign assistance, tax incentives, export zones, etc) and examples of FDI (from any country) Austrade Information Document (Beijing office) Foreign Direct Investment (FDI) in China has grown steadily and significantly for over two decades. China is now the world’s leading recipient of foreign capital. China’s legal framework for FDI has also made substantial progress and there is a growing predictability for investments in China. As an economy in the middle of transforming from a planned regime to a market‐oriented regime, the government still plays key roles in directing and regulating foreign investments. The most common investment vehicles under the Chinese foreign investment regime include representative offices or a foreign investment enterprise (FIE). Regardless of the choice of investment vehicle, governmental approval is required. While setting up a representative office is comparatively straightforward, it cannot engage in direct business activities – which, except for certain financial institutions, requires an FIE.
Capability Assessment of Australian Dairy Technology and Services ‐ AANC Pty Ltd, July 2010
_________________________________________________________________________________________________________ Page 90 of 329
Wholly foreign owned enterprises (WFOEs) and Sinoforeign joint ventures (JVs) are the two main forms of FIE. Broadly speaking, WFOEs offer control (preferred by many foreign investors) and JVs offer the Chinese partner’s local knowledge. Foreign investment companies limited by shares and holding companies can also offer benefits to the larger investor. According to the statistics of Ministry of Commerce, 470 foreign investment projects in the Agriculture industry (Agriculture Industry (Code A01) were set up in 2008, 79 less than that of the same period in 2007, and the amount of the actual utilized foreign capital reached USD 554,490,000, up by 40.2 % year‐on‐year. For the Agriculture industry in 2008, o Ten Asian countries/regions (Hong Kong, Macau, Taiwan, Japan, Philippines, Thailand, Malaysia,
Singapore, Indonesia and Korea) set up 418 new enterprises in China. o The EU set up 13 new enterprises in China, 41 % less than the same period of 2007. o The US set up 13 new enterprises in China, down by 48 % year‐on‐year. Newly established projects in the Agriculture industry in 2008 are as follows: 62 Chinese‐foreign equity joint venture projects, 18 wholly foreign‐invested projects, 390 Chinese‐foreign contractual joint venture projects. Extracts of National Tax Policies for foreign investment Preferential taxes for West Development: o Enterprise income tax could be reduced to 15% for Chinese enterprises and foreign enterprises
established in West China and engaged in nationally encouraged industries from 2001 to 2010. Current preferential policies regarding enterprise income tax: o Enterprises engaged in various items (including the raising of livestock and poultry) may enjoy
preferential tax exemption and deduction. Enterprise income tax may be exempted or deducted for incomes of enterprises from agriculture, forestry, husbandry, and fishery items.
Foreign invested enterprises must obtain “Foreign Invested Enterprises Certificate” to repatriate its profit to overseas and, profit repatriation also requires “profit share scheme of the board” and “evidence of all taxes paid”. However, Chinese government encourages foreign enterprises to reinvest its profits in China and granted tax concessions for profit reinvestment. Case Studies 1. Murray Goulburn, established in 1950 and has become the largest processor of milk in Australia and is
Australia’s largest exporter of processed food. Murray Goulburn processes over 35% of the nation’s milk supply into quality products which are sold on both domestic and export markets. Murray Goulburn invested USD10 million in Qingdao and set up a food processing plant in May 2007, its main products including infant formula and adult nutrition products. It is estimated that by 2011, the sales volume of Murray Goulburn's Qingdao plant will reach A$50 million.
2. Macquarie Bank has been continuously investing in China since 1995. After 13 years development,
Macquarie successfully attracted and retained top tier talents and has assembled a team with over 150 professionals dedicated to China market, one of the largest IB teams in China. Macquarie Bank opened Shanghai office in 2006 and Guangzhou office in year 2007, as supplements to Beijing office.
Capability Assessment of Australian Dairy Technology and Services ‐ AANC Pty Ltd, July 2010
_________________________________________________________________________________________________________ Page 91 of 329
To set up a trust company in China with a strong local partner, to offer more attractive financial products, Macquarie shows strong interest in China's agricultural assets, eg., modern dairy farms.
China: Dairy product quality as the new industry driver. FAO Corporate Document Repository. Dinghuan Hu, Agricultural Economic Research Institute, Chinese Academy of Agriculture Science, Beijing. Foreign investment has played a very important role in accelerating the development of dairy products in China . There are three ways for foreign capital enterprises to enter the Chinese market: 1. The first method is to directly establish a dairy‐processing enterprise in China and produce branded
dairy products. Nestlé built up a large‐scale milk powder processing enterprise in the 1990s in Shuangcheng City, Heilongjiang province, through a joint venture, and since then has continuously expanded its production scale. By 2004, its total investment in milk powder production reached nearly $84 million (China Network, Harbin Channel). Nestlé’s revenues reached $3 billion, ranking the joint venture as fourth among dairy‐processing enterprises in China . Among the top‐ten dairy‐processing enterprises, three are linked to direct foreign investment.
2. The second method is through joint ventures, such as the Daneng Co., which bought up shares of the
Bright Dairy through stock purchases. By end 2005, through numerous purchases, Daneng owned 12 % of Bright Dairy stock. Meanwhile, Daneng handed over its brands to the Bright Dairy, and both parties agreed to establish a dairy product research centre.
3. The third method is through direct investment. For example, in 2002, Morgan Stanley Dinghui
Investment and Yinglian Investment invested more than $26 million in the Meng Niu Group, buying 32 % of the company stock. In 2003, these institutions injected an additional $35.2 million into Meng Niu from their foreign mother companies. Currently, the three companies own one‐third of Meng Niu Group stock.
Financial support for dairy industry development in China Large quantities of capital funds have been invested into the dairy‐processing enterprises in the North China agricultural region. Having listed on the Chinese exchange in 1996, Yili’s stock had acquired $49 million from capital markets as of end 2003. Meng Niu procured a total of $1.706 billion from the Hong Kong stock market. The investment has provided enterprises in the region with adequate funds to expand factories, invest in modern equipment and technologies, assist rural households in dairy cattle husbandry in surrounding regions to expand their milk supply and develop sophisticated product‐marketing strategies. Foreign capital entered the North China agricultural region through joint ventures, establishing processing enterprises and making use of the local resource advantages to benefit from the growing demand for dairy products throughout the country. The Shuangcheng Nestlé Co. is a joint venture between the Swiss Nestlé Co. and Shuangcheng Dairy and Food Industry Co., producing milk powder as its major product. Total investment, generating an average daily fresh milk processing capacity of 900 tonnes, has increased from $10 million to $75.8 million. The three international financial institutions of Morgan Stanley, Yinglian Investment and Dinghui Investment injected funds into the enterprise in October 2002 and October 2003. In the first‐round capital increment, those three institutions provided a total of $26 million, drawn from companies abroad; in the second round, they invested a total of $35 million.
Capability Assessment of Australian Dairy Technology and Services ‐ AANC Pty Ltd, July 2010
_________________________________________________________________________________________________________ Page 92 of 329
USDA Foreign Agricultural Service. Global Agricultural Information Network. GAIN Report Number: CH9086. Date 11/12/2009 China ‐ Peoples Republic of DAIRY AND PRODUCTS ANNUAL. 2009 Annual Report. In response to the need for stepped up modernization and industry restructuring in the wake of the melamine scandal, several major dairy companies have launched new investments in raw milk and processing. Yili Dairy Group, China’s largest dairy company based in Inner Mongolia, reports that 75 % of its raw milk is now under the company’s control. Yili continues to build new production facilities, including a 12,000 head operation scheduled to open in late 2009. In July 2009, China Oil and Foodstuffs Corporation (COFCO) bought 20 % of stock shares from Mengniu, the second largest Chinese dairy company, to help bolster Mengniu’s production capacity. New Hope Co. has just invested RMB100 million ($11.6 million) in dairy farm construction. PRESS ARTICLES Fonterra moves cautiously to develop China project. Tim Cronshaw, The Press (Christchurch), Fairfax New Zealand Ltd., 12 February 2010. Fonterra seems set to revive its ambitions in China but remains cautious about expanding on its three‐farm base after exiting the SanLu company because of the melamine milk poisoning crisis. The giant New Zealand based co‐operative sells 203,000 tonnes of mainly dairy ingredients into China, about 10 % of its total product, and received approval to add two more farms this month to its trial Tangshan Farm in Hangu, in the Hebei province. The Tangshan farm has 5,200 cows and calves with 2,600 mature cows milking up to three times a day in a covered feedlot operation. These cows appear to be performing as well as they would in New Zealand, under the feedlot housing conditions, where temperatures could get to below 30 degrees Celsius. The China dairy market is set to become the world’s largest dairy market in the next few decades and is forecast to experience double digit annual growth over the next 10 years. The Chinese Government has acknowledged that the development of the dairy farming industry is not only crucial for meeting the growth in demand, but also for developing rural communities and their livelihoods. China and its 1.4 billion people nation is an important dairy market, helping to drive world commodity prices up. The nation produces and consumes 22 to 28 billion litres of milk a year and the predictions are this will increase to 80 billion litres in the next decade. However, it is expected that China will be unable to produce this much milk itself, and will need the help of multinationals. Articles from China Dairy Business, VOL 1012, Jul 02, 2010 Subsidized Import of 3,000 Dairy Cattle from Australia for Shaanxi Recently, 3,000 quality Holstein dairy cattle from Australia were transported to dairy farms in Shaanxi Province in batches after quarantine. They are part of the import of 10,000 dairy cattle subsidized by the Agricultural Department of Shaanxi Province. The cattle are subsidized AU$850 each by the Agricultural Department of Shaanxi Province. Out of this batch, 2,000 were transported to Qianyang County, Shaanxi for dairy farming in 18 dairy farms and farming zones. Qianyang County is a key dairy farming county in Shaanxi, with 35,600 dairy cattle, 108,000 dairy goats, 45 milking parlors and automated milking venues. The remaining 1,000 dairy cattle were transported to six dairy farms of Tongchuan City, Shaanxi Province.
Capability Assessment of Australian Dairy Technology and Services ‐ AANC Pty Ltd, July 2010
_________________________________________________________________________________________________________ Page 93 of 329
Shandong Dongying Aoya 10,000 inventory fFarm being set up; 2nd 10,000 farm to be set up in 2010 Aoya Modern Farm Co., Ltd. in Dongying, Shandong was invested by Singapore Aoya Investment Group and it belongs to Indonesia Jiafa (transliteration) Group. The registered capital is USD 50 million, land occupation, 50 hectares, total investment, USD 65.9 million, of which investment in the first phase, USD 21.7 million. The 11 sheds can rear 6,600 lactating cows, there are two sets of shoulder to shoulder milking equipment of 2 X 60 and shall be put into operation in the end of June. Dairy cattle are mainly imported, the first batch of 2,800 heads from New Zealand shall arrive in mid July; the 2nd batch of 3,000 from Australia shall arrive in October. In addition, Aoya shall set up the 2nd 10,000 inventory farm in Dongying. Construction shall be commenced in August. 2nd Phase Completed while 3rd Phase Began for Anda Inc. of Beingmate. Early 2006, Beingmate decided to invest 190.3 million US dollars in three phases for the construction of an infant formula project in Anda, with the annual output capacity of 100,000 tons of high quality infant formula milk powder. More recently, Beingmate is in technological cooperation with a French company for the construction of the first high‐tech mature desalinated whey powder project in China. The 10,000‐cattle dairy farm project also began, with civil construction and preparation for the import of dairy cattle expected to complete by the end of this year. The farm is expected to complete construction and be ready for operation by the end of 2011. 4.) National government programs to assist with the development of dairy operations China: Dairy product quality as the new industry driver. FAO Corporate Document Repository. Dinghuan Hu, Agricultural Economic Research Institute, Chinese Academy of Agriculture Science, Beijing. Policies promoting dairy development in China. “I have a dream and my dream is that each Chinese person, and especially the children, can afford to buy one jin [500 g] of milk to drink every day,” Chinese Premier Wen Jiabao said in 2006. In recognition of the relative profitability of dairy operations, the central Government as well as local governments interested in supporting industry development have formulated favourable policies to encourage farm households to buy dairy cattle breeding stock. Since 2000, the State Council and its relevant departments enacted favourable policies to promote the sector, which led to: 1.) 10,000 high‐yielding cow embryo transfers, 2.) Development plans in large milk‐producing regions, 3.) Studies on key technologies and integrated demonstration of technologies in the Fifth Five‐year
Development Plan, 4.) Circular of the Ministry of Agriculture on the “Rapid Development of Animal Husbandry” transmitted
by the General Office of the State Council, 5.) The Fifth Five‐year Plan of Animal Husbandry, Feed, National Food Industry and Light Industry and the
long‐range objective plan of 2015, and 6.) A programme of Dairy Industry in the land reclamation and cultivation sectors. The more important objectives of the Government are focused on increasing farmer incomes through dairy cow husbandry and dairy‐processing projects. In supporting these policies, relevant ministries and

Capability Assessment of Australian Dairy Technology and Services ‐ AANC Pty Ltd, July 2010
_________________________________________________________________________________________________________ Page 94 of 329
commissions as well as local governments have invested considerable resources. Since 2002, for example, the central Government has issued national debt funds to support 16 dairy‐processing projects. In total, these projects received US$21 million. Use of national debt funds has mobilized the resources of banks, local governments, enterprises and social forces to assist the sector. The ministries and commissions, under the State Council, have continuously invested in dairy industries, such as with the Ministry of Agriculture’s Good Animal and Poultry Varieties Engineering Programme. The central finance department alone invested US$6.5 million in animal breeding, or one quarter of the programme’s total investments from 1998 to 2001. In 2002, the Ministry of Agriculture invested 126 million yuan (US$15 million) to set up 17 original stock dairy farms, 9 bull stations and 6 embryo‐transfer centres. In 2003, the Ministry invested more than US$14 million in animal and poultry variety/stock engineering. Local governments have supplied funding for dairy‐processing enterprises to buy equipment from foreign countries, to invest in dairy barns and dairy plants and construct dairy farms. They have provided farm households with loans and allowed farmers to raise mortgage credits on their dairy cows, cattle barns, related facilities or equipment and other fixed assets from the banks. To ensure and stabilize the raw milk supply, dairy‐processing enterprises helped farmers to procure loans by providing guarantees. The rapid increase of raw milk in China is also closely related to the strong link between dairy processing enterprises and dairy producers. Dairy processing enterprises have assisted farm households buy cows and improve their husbandry knowledge, which became an incentive both for farmers to enhance their income and also to expand the milk supply. Interventions by large processors Sanlu and Jinniu, as well as Meng Niu, Yili and others have focused on helping farm households to first access cows or a bank loan for buying cows and then offering technical guidance. Future policies for dairy development in China The development of China’s dairy industry over the past decade has been impressive. Encouraging participation of smallholders in milk production has been a component of national and regional policies to promote regional development and reduce poverty. Large processors also have played a significant role in expanding and keeping smallholders in operation. Through the introduction of centralized milk collection stations, millions of small farmers have entered the sector, particularly in the poor western provinces. However, China’s dairy industry is experiencing considerable transformation, with the quantity based expansion is being accompanied by the need to ensure milk quality. It is difficult for scattered smallholder dairy farmers to produce the quality of milk that processors and markets require. Developing large commercial dairy farms is unlikely to be a viable model in China, particularly in the medium term. Alternative models in which an enterprise provides a milking station and proper management to smallholder dairy farmers, dairy parks and farmer associations are developing and proving to be practical. Many other different organizational models exist in practice. This calls for further evaluation on the performance of different models for linking smallholder farmers with processors. Critical to ensuring strong growth in the sector is the development of incentive systems for rewarding good practices to increase milk quality, either market based or institution based. The processors need to take a leadership role in setting up effective premium‐based pricing systems to support a sustainable dairy sector. It is important for industry regulators to look at innovative ways of sharing the costs of milk quality compliance between farmers and processors, ensuring that farmers receive a fair price for high‐quality milk. An example of current government assistance given to large dairy enterprises in China is provided by the below press article.
Capability Assessment of Australian Dairy Technology and Services ‐ AANC Pty Ltd, July 2010
_________________________________________________________________________________________________________ Page 95 of 329
Jiangsu Guannan Invests US$11.7 Million for Dairy Farming Project with 4,000 Cow Inventory Press Article from China Dairy Business, VOL 1011, Jun 18, 2010. Guannan County, Jiangsu held the signature signing ceremony for a standard dairy farming project of 4,000 cow inventory on May 21st, 2010. The total investment in the project is USD 11.7 million. There shall be preferential treatment on taxation: full‐sum award in the first five years, half‐sum award in the following five years; the portion of VAT for the county shall be awarded totally in the first five years. There is no administrative charge at all, service charge shall be at a favorable level and shall be collected by the administrative center of Guannan County. For investment in fixed assets over USD 1.5 million, no fee is imposed. 5.) Overview of typical dairy farming arrangements Despite being one of the most dynamic subsectors of China's agricultural industry, the dairy market is blighted by inefficiency. Major local processors have been joined by large multinationals to create a dynamic dairy processing industry, yet primary production is hampered by structural problems. The main of these has been the fragmented nature of the industry ‐ over 70% of Chinese milk production is accounted for by farms with less than 20 head of cattle. The lack of access to rural credit has been an on‐going obstacle to dairy industry expansion among China’s small and medium enterprises (SME). In 2007, the price for purchasing a dairy cow in China was over 10,000 Yuan (US$1,200, based on USD:CNY = 8.33), but the annual income of a farm household was only 3,000–5,000 Yuan (US$361‐600). Milk production estimates for January 2010, from FAS Beijing Reports (cited in USDA GAIN Report China 2009 Annual Report) were:
Cows in milk: 7,632,000 head Cow milk production: 31,290,000 MT/year Yield per cow per year: 4,100 kg/cow/year Yield per day per day: 4,100 kg/300 d = 13.7 kg/cow/day
However this milk yield differs markedly from the 2007 figure of 2,443 kg/cow/year (= 8.1 kg/cow/day) reported by International Business Monitor (IBM), as given in the Overview section previously. A yield of 13.7 kg/cow/day also differs widely from calculations performed by the author on yearly cow data presented in the table below, which indicates daily milk yields only averaging 6.51 kg/cow in 2002 and 5.53 kg/cow in 2006. China: Dairy product quality as the new industry driver. FAO Corporate Document Repository. Dinghuan Hu, Agricultural Economic Research Institute, Chinese Academy of Agriculture Science, Beijing.

Capability Assessment of Australian Dairy Technology and Services ‐ AANC Pty Ltd, July 2010
_________________________________________________________________________________________________________ Page 96 of 329
Table 27. Number of dairy farms and no of cows owned in China, in 2002 and 2006, by herd size
Herd Size No Farms No Cows Milk Yield (MT) Milk % Kg/cow/yr Kg/cow/dYr 2002
1‐5 1,140,022 3,042,197 4,951,102 37.3% 1,627 5.45‐20 200,083 1,991,830 3,665,841 27.6% 1,840 6.1
21‐100 25,698 950,090 2,115,959 15.9% 2,227 7.4101‐200 1,789 243,137 673,210 5.1% 2,769 9.2201‐500 650 193,814 603,855 4.5% 3,116 10.4
501‐1000 262 172,991 605,886 4.6% 3,502 11.7>1000 112 198,488 658,050 5.0% 3,315 11.1Total 1,368,616 6,792,547 13,273,903 100.0% 1,954 6.51 ave
Yr 20061‐5 1,271,729 4,034,876 5,356,552 35.3% 1,328 4.4
5‐20 263,715 2,714,241 4,135,290 27.3% 1,524 5.121‐100 30,780 1,257,814 2,827,367 18.6% 2,248 7.5
101‐200 2,294 335,503 713,905 4.7% 2,128 7.1201‐500 950 336,148 741,448 4.9% 2,206 7.4
501‐1000 336 235,228 707,555 4.7% 3,008 10.0>1000 162 234,816 688,867 4.5% 2,934 9.8Total 1,569,966 9,148,626 15,170,984 100.0% 1,658 5.53 ave
Sources: China Dairy Statistical Yearbook, 2006; China Dairy Information, 2007 The table above presents a clear snapshot of the dairy herd demographic in China, from 2002 to 2006. The following should be noted: 1.) The high proportion of total milk (over 35%) produced by farms with only 1 ‐ 5 cows. This highlights
the traditional, fragmented nature of much of the dairy production occurring throughout China. 2.) The fact that the smallest herd size farms also yield the lowest milk production per cow, but accepting
that many of these farms would be rearing calves on these “dual‐purpose” cows for meat consumption, thereby dramatically reducing the collected yields of milk. However, the very small herd sizes are commonly associated with generally inefficient animal health, biosecurity, nutritional, genetic improvement, and general management systems.
3.) The large and increasing number of farms milking over 1000 cows throughout China. 4.) In terms of yield per cow, the optimum herd size appears to be between 500‐1000 cows, but not
higher. 5.) Surprisingly, yields per cow were lower in 2006 as compared with 2002, across almost all herd sizes.
The reasons for this are presently unknown, but could quite conceivably be due to a factor such as lower rainfall in 2006 jeopardizing pastoral conditions.
The economics of dairy production in Chinese farm households were estimated in 2005, when it was concluded by Hu Dinghuan et al (2005)B that most farm households shifting from crop growing to dairy husbandry experienced favourable economic returns as a result. Farmer incomes from growing crops were considerably lower. Average milk yield from dairy cows in farm households was 4,875 kg per year, which
B Hu Dinghuan et al. 2005. Analysis report on dairy industry of China: Challenges and opportunities. Beijing Orient Dairy Consultants Ltd. pp.41–42, 150–152.
Capability Assessment of Australian Dairy Technology and Services ‐ AANC Pty Ltd, July 2010
_________________________________________________________________________________________________________ Page 97 of 329
equated in 2005 to a value of US$1,334. The total cost of production of the milk was US$1,062, leaving a net annual profit of US$273 and a cost–profit rate of return of nearly 27 %. By comparison, a farmer choosing to grow 1 mu (0.067 ha) of potatoes realizes annual net profits of US$76, while that of a farmer growing 1 mu (0.067 ha) of maize earns US$19 of net profit. The net profit from raising one dairy cow is 14 times larger than from growing 1 mu of maize and 3.6 times larger than growing 1 mu of potatoes. However, smallholder dairying households in China encounter considerable problems, mainly related to: i) poor payments for milk, and ii) difficulties in meeting quality standards for raw milk. 1.) Declining incomes for dairy producers
According to the Ministry of Agriculture, since early 2007, dairy cow farmers’ incomes have decreased gradually, with 40 % of households are not breaking even, and the average earnings from each cow now being 1,500 yuan (US$221, at USD:CNY = 6.775), which is lower than in 2006. Some dairy cow farmers have resorted to selling or slaughtering their cows due to low profitability. The reduction in incomes is due to higher production costs alongside relatively stable milk prices paid by the processors. Price collusion among processors has also resulted from an oligopolistic market structure, with the purchasing price of raw milk controlled by only a small number of dairy processing enterprises. The dispersed farm households have no bargaining power and are unable to negotiate higher prices. While milk price paid remains fairly constant, the price of feed is rising. Over a one‐year period, feed corn prices increased by 16 % and dry alfalfa hay prices increased by more than 20 %. In comparison, the purchasing price of milk in Heilongjiang, Inner Mongolia and Shanxi increased only by 7 %, 6 % and 3 %, respectively, despite rising prices of milk products in international markets.
2.) Quality control of raw milk Of considerable concern to the industry and consumers are effective controls on milk quality. The quality of raw milk not only influences the quality of dairy products and the safety of consumers on the one hand, but it limits its use in the production of value‐added products. For example, for the fermentation of sour milk drinks, raw milk cannot be used if the level of antibiotics is too high. Before the 1980s, most raw milk was supplied by state‐owned dairy farms to consumers in urban areas, and the quality could be controlled. However, after the 1990s and the expansion of smallholder farms, effective supervision became very difficult. Considering that most dairying households had a capacity of less than five head of cattle and owing to the great difference among households in technical and management skills, sanitary conditions and quality awareness, quality problems in raw milk production have evolved into a major concern. Current quality problems in raw milk include: i.) Variable protein levels due to the influence of different feeding regimes, ii.) High bacteria counts in milk, and iii.) High levels of antibiotic residues. Often when cows are treated with antibiotics, the farmers,
due to economic interests or lack of knowledge, do not adhere to antibiotic withhold periods prior to offering affected milk for sale (Hu Dinghuan et al, 2005).
6.) Brief overview of major companies with integrated dairy operations
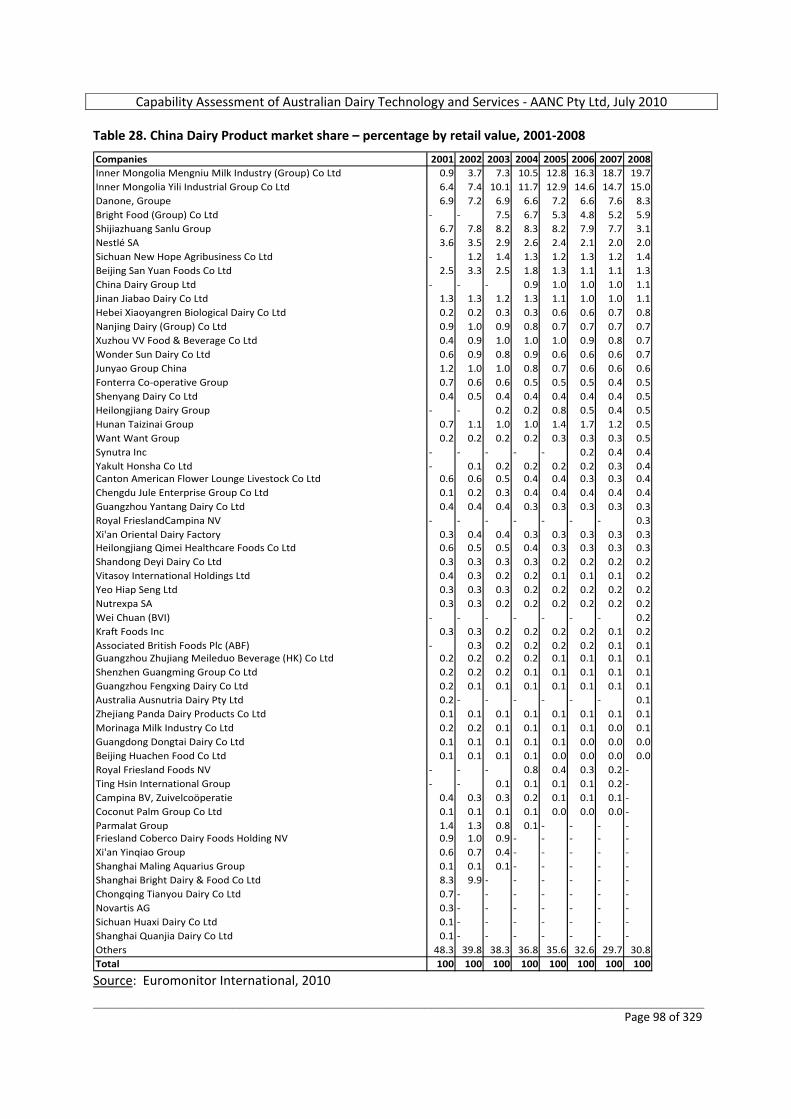
Capability Assessment of Australian Dairy Technology and Services ‐ AANC Pty Ltd, July 2010
_________________________________________________________________________________________________________ Page 98 of 329
Table 28. China Dairy Product market share – percentage by retail value, 2001‐2008
Companies 2001 2002 2003 2004 2005 2006 2007 2008Inner Mongolia Mengniu Milk Industry (Group) Co Ltd 0.9 3.7 7.3 10.5 12.8 16.3 18.7 19.7Inner Mongolia Yili Industrial Group Co Ltd 6.4 7.4 10.1 11.7 12.9 14.6 14.7 15.0Danone, Groupe 6.9 7.2 6.9 6.6 7.2 6.6 7.6 8.3Bright Food (Group) Co Ltd ‐ ‐ 7.5 6.7 5.3 4.8 5.2 5.9Shijiazhuang Sanlu Group 6.7 7.8 8.2 8.3 8.2 7.9 7.7 3.1Nestlé SA 3.6 3.5 2.9 2.6 2.4 2.1 2.0 2.0Sichuan New Hope Agribusiness Co Ltd ‐ 1.2 1.4 1.3 1.2 1.3 1.2 1.4Beijing San Yuan Foods Co Ltd 2.5 3.3 2.5 1.8 1.3 1.1 1.1 1.3China Dairy Group Ltd ‐ ‐ ‐ 0.9 1.0 1.0 1.0 1.1Jinan Jiabao Dairy Co Ltd 1.3 1.3 1.2 1.3 1.1 1.0 1.0 1.1Hebei Xiaoyangren Biological Dairy Co Ltd 0.2 0.2 0.3 0.3 0.6 0.6 0.7 0.8Nanjing Dairy (Group) Co Ltd 0.9 1.0 0.9 0.8 0.7 0.7 0.7 0.7Xuzhou VV Food & Beverage Co Ltd 0.4 0.9 1.0 1.0 1.0 0.9 0.8 0.7Wonder Sun Dairy Co Ltd 0.6 0.9 0.8 0.9 0.6 0.6 0.6 0.7Junyao Group China 1.2 1.0 1.0 0.8 0.7 0.6 0.6 0.6Fonterra Co‐operative Group 0.7 0.6 0.6 0.5 0.5 0.5 0.4 0.5Shenyang Dairy Co Ltd 0.4 0.5 0.4 0.4 0.4 0.4 0.4 0.5Heilongjiang Dairy Group ‐ ‐ 0.2 0.2 0.8 0.5 0.4 0.5Hunan Taizinai Group 0.7 1.1 1.0 1.0 1.4 1.7 1.2 0.5Want Want Group 0.2 0.2 0.2 0.2 0.3 0.3 0.3 0.5Synutra Inc ‐ ‐ ‐ ‐ ‐ 0.2 0.4 0.4Yakult Honsha Co Ltd ‐ 0.1 0.2 0.2 0.2 0.2 0.3 0.4Canton American Flower Lounge Livestock Co Ltd 0.6 0.6 0.5 0.4 0.4 0.3 0.3 0.4Chengdu Jule Enterprise Group Co Ltd 0.1 0.2 0.3 0.4 0.4 0.4 0.4 0.4Guangzhou Yantang Dairy Co Ltd 0.4 0.4 0.4 0.3 0.3 0.3 0.3 0.3Royal FrieslandCampina NV ‐ ‐ ‐ ‐ ‐ ‐ ‐ 0.3Xi'an Oriental Dairy Factory 0.3 0.4 0.4 0.3 0.3 0.3 0.3 0.3Heilongjiang Qimei Healthcare Foods Co Ltd 0.6 0.5 0.5 0.4 0.3 0.3 0.3 0.3Shandong Deyi Dairy Co Ltd 0.3 0.3 0.3 0.3 0.2 0.2 0.2 0.2Vitasoy International Holdings Ltd 0.4 0.3 0.2 0.2 0.1 0.1 0.1 0.2Yeo Hiap Seng Ltd 0.3 0.3 0.3 0.2 0.2 0.2 0.2 0.2Nutrexpa SA 0.3 0.3 0.2 0.2 0.2 0.2 0.2 0.2Wei Chuan (BVI) ‐ ‐ ‐ ‐ ‐ ‐ ‐ 0.2Kraft Foods Inc 0.3 0.3 0.2 0.2 0.2 0.2 0.1 0.2Associated British Foods Plc (ABF) ‐ 0.3 0.2 0.2 0.2 0.2 0.1 0.1Guangzhou Zhujiang Meileduo Beverage (HK) Co Ltd 0.2 0.2 0.2 0.2 0.1 0.1 0.1 0.1Shenzhen Guangming Group Co Ltd 0.2 0.2 0.2 0.1 0.1 0.1 0.1 0.1Guangzhou Fengxing Dairy Co Ltd 0.2 0.1 0.1 0.1 0.1 0.1 0.1 0.1Australia Ausnutria Dairy Pty Ltd 0.2 ‐ ‐ ‐ ‐ ‐ ‐ 0.1Zhejiang Panda Dairy Products Co Ltd 0.1 0.1 0.1 0.1 0.1 0.1 0.1 0.1Morinaga Milk Industry Co Ltd 0.2 0.2 0.1 0.1 0.1 0.1 0.0 0.1Guangdong Dongtai Dairy Co Ltd 0.1 0.1 0.1 0.1 0.1 0.0 0.0 0.0Beijing Huachen Food Co Ltd 0.1 0.1 0.1 0.1 0.0 0.0 0.0 0.0Royal Friesland Foods NV ‐ ‐ ‐ 0.8 0.4 0.3 0.2 ‐Ting Hsin International Group ‐ ‐ 0.1 0.1 0.1 0.1 0.2 ‐Campina BV, Zuivelcoöperatie 0.4 0.3 0.3 0.2 0.1 0.1 0.1 ‐Coconut Palm Group Co Ltd 0.1 0.1 0.1 0.1 0.0 0.0 0.0 ‐Parmalat Group 1.4 1.3 0.8 0.1 ‐ ‐ ‐ ‐Friesland Coberco Dairy Foods Holding NV 0.9 1.0 0.9 ‐ ‐ ‐ ‐ ‐Xi'an Yinqiao Group 0.6 0.7 0.4 ‐ ‐ ‐ ‐ ‐Shanghai Maling Aquarius Group 0.1 0.1 0.1 ‐ ‐ ‐ ‐ ‐Shanghai Bright Dairy & Food Co Ltd 8.3 9.9 ‐ ‐ ‐ ‐ ‐ ‐Chongqing Tianyou Dairy Co Ltd 0.7 ‐ ‐ ‐ ‐ ‐ ‐ ‐Novartis AG 0.3 ‐ ‐ ‐ ‐ ‐ ‐ ‐Sichuan Huaxi Dairy Co Ltd 0.1 ‐ ‐ ‐ ‐ ‐ ‐ ‐Shanghai Quanjia Dairy Co Ltd 0.1 ‐ ‐ ‐ ‐ ‐ ‐ ‐Others 48.3 39.8 38.3 36.8 35.6 32.6 29.7 30.8Total 100 100 100 100 100 100 100 100 Source: Euromonitor International, 2010
Capability Assessment of Australian Dairy Technology and Services ‐ AANC Pty Ltd, July 2010
_________________________________________________________________________________________________________ Page 99 of 329
USDA Foreign Agricultural Service. Global Agricultural Information Network. GAIN Report Number: CH9086. Date 11/12/2009 China ‐ Peoples Republic of DAIRY AND PRODUCTS ANNUAL. 2009 Annual Report. There are a total of about 2,000 milk processors in China, and the domestic major players can be roughly divided into two groups: resource‐oriented manufacturers and market‐oriented manufacturers. The representatives of the former are Yili and Mengniu from Inner Mongolia, Wandashan from Heilongjiang, and Yinqiao from Shan’xi, while Bright Dairy from Shanghai, Sanyuan from Beijing, Nanjing Dairy Group from Nanjing and Jiabao Dairy from Jinan are the major players in the latter group. Geographically, the resource‐oriented manufacturers are located in the north, and urban‐oriented dairy manufacturers are closer to the major markets in the more populated east and south. Yili, Mengniu and Bright Dairy rank among the top three manufacturers in terms of annual output, and the three together have more than 50% market share countrywide. Although all the three giants suffered huge losses after the 2008 melamine scandal, they still keep the top three positions till now. Mengniu has the highest market share in fluid milk, while Bright Dairy ranks No. 1 in yoghurt and cheese. Yili is more focusing on milk powder production, while its ice cream sales have also increased rapidly in recent years. Strong competition in the marketplace has been forcing the major players to seek to build up raw milk bases and production facilities nationwide, and has resulted in industry consolidation. The Chinese government has been also pumping money to larger companies helping them to expand significantly. Two of Yili’s new milk powder production base, commissioned in second quarter of 2009, greatly enhanced its leading position in this sector. In July 2009, Mengniu claimed that China National Oils, Foodstuffs and Cereal Corp (COFCO), the largest oils and food importer and exporter as well as a leading food manufacturer acquired 20% of its shares, and became its biggest stakeholder. The deal has for the first time converted Mengniu into a state‐owned company. Mengniu then announced their plan to build up 20 new large scale farms with the new investment. In June 2009, Bright Dairy finished its Haifeng Dairy Farm phase I project in Jiangsu Province, and received the first 6,000 cows from Australia. This new farm is expected to supply 200,000 tons of milk annually to Shanghai market. Meanwhile, Heilongjiang, Tianjin, Shanxi, Xining respectively announced their plans to build up large scale farms of over 10,000 cows in first half of 2009. Major foreign dairy brands competing in the marketplace are mainly from Europe, the United States, Australia and New Zealand. Land O’Lakes, Anchor, and Suki have numerous loyal consumers who consume cheese and butter regularly. These multinationals normally do not have their own raw milk resources in China, instead, they rely on imported milk powders, which are at similar price levels with domestic products, but the supply is more stable and quality is consistent. The USDA forecasts that within the next 8 years, dairy production could increase from the 34 million metric tons in 2009 to 70 million metric tons. The consolidation of producers will be expedited, with more small brands disappearing, but the map of the competition among the three giants will not change much. Imported dairy products will keep enjoying a larger group of loyal consumers, with more diversified brands emerging in first tier cities in China. 7.) Availability of forage and raw materials for feed & nutrition
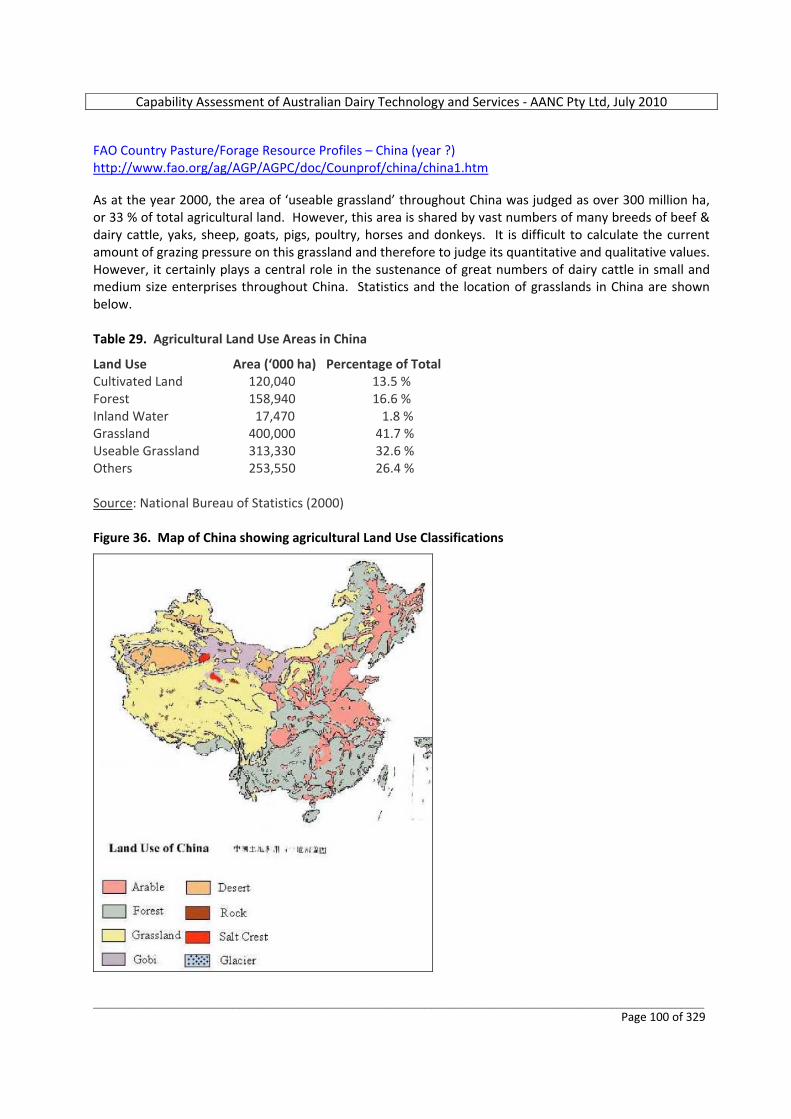
Capability Assessment of Australian Dairy Technology and Services ‐ AANC Pty Ltd, July 2010
_________________________________________________________________________________________________________ Page 100 of 329
FAO Country Pasture/Forage Resource Profiles – China (year ?) http://www.fao.org/ag/AGP/AGPC/doc/Counprof/china/china1.htm As at the year 2000, the area of ‘useable grassland’ throughout China was judged as over 300 million ha, or 33 % of total agricultural land. However, this area is shared by vast numbers of many breeds of beef & dairy cattle, yaks, sheep, goats, pigs, poultry, horses and donkeys. It is difficult to calculate the current amount of grazing pressure on this grassland and therefore to judge its quantitative and qualitative values. However, it certainly plays a central role in the sustenance of great numbers of dairy cattle in small and medium size enterprises throughout China. Statistics and the location of grasslands in China are shown below. Table 29. Agricultural Land Use Areas in China
Land Use Area (‘000 ha) Percentage of Total Cultivated Land 120,040 13.5 % Forest 158,940 16.6 % Inland Water 17,470 1.8 % Grassland 400,000 41.7 % Useable Grassland 313,330 32.6 % Others 253,550 26.4 % Source: National Bureau of Statistics (2000) Figure 36. Map of China showing agricultural Land Use Classifications
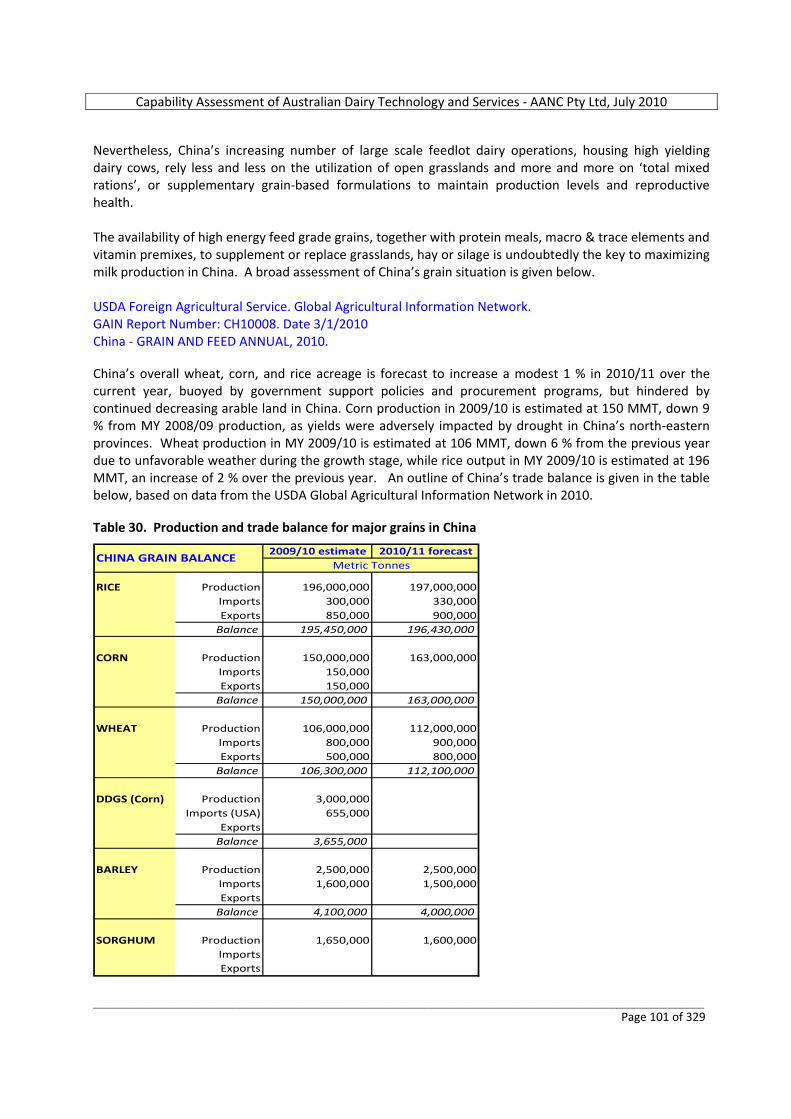
Capability Assessment of Australian Dairy Technology and Services ‐ AANC Pty Ltd, July 2010
_________________________________________________________________________________________________________ Page 101 of 329
Nevertheless, China’s increasing number of large scale feedlot dairy operations, housing high yielding dairy cows, rely less and less on the utilization of open grasslands and more and more on ‘total mixed rations’, or supplementary grain‐based formulations to maintain production levels and reproductive health. The availability of high energy feed grade grains, together with protein meals, macro & trace elements and vitamin premixes, to supplement or replace grasslands, hay or silage is undoubtedly the key to maximizing milk production in China. A broad assessment of China’s grain situation is given below. USDA Foreign Agricultural Service. Global Agricultural Information Network. GAIN Report Number: CH10008. Date 3/1/2010 China ‐ GRAIN AND FEED ANNUAL, 2010. China’s overall wheat, corn, and rice acreage is forecast to increase a modest 1 % in 2010/11 over the current year, buoyed by government support policies and procurement programs, but hindered by continued decreasing arable land in China. Corn production in 2009/10 is estimated at 150 MMT, down 9 % from MY 2008/09 production, as yields were adversely impacted by drought in China’s north‐eastern provinces. Wheat production in MY 2009/10 is estimated at 106 MMT, down 6 % from the previous year due to unfavorable weather during the growth stage, while rice output in MY 2009/10 is estimated at 196 MMT, an increase of 2 % over the previous year. An outline of China’s trade balance is given in the table below, based on data from the USDA Global Agricultural Information Network in 2010. Table 30. Production and trade balance for major grains in China
2009/10 estimate 2010/11 forecast
RICE Production 196,000,000 197,000,000Imports 300,000 330,000Exports 850,000 900,000
Balance 195,450,000 196,430,000
CORN Production 150,000,000 163,000,000Imports 150,000Exports 150,000
Balance 150,000,000 163,000,000
WHEAT Production 106,000,000 112,000,000Imports 800,000 900,000Exports 500,000 800,000
Balance 106,300,000 112,100,000
DDGS (Corn) Production 3,000,000Imports (USA) 655,000
ExportsBalance 3,655,000
BARLEY Production 2,500,000 2,500,000Imports 1,600,000 1,500,000Exports
Balance 4,100,000 4,000,000
SORGHUM Production 1,650,000 1,600,000ImportsExports
Metric TonnesCHINA GRAIN BALANCE
Capability Assessment of Australian Dairy Technology and Services ‐ AANC Pty Ltd, July 2010
_________________________________________________________________________________________________________ Page 102 of 329
Notes on the usage of grain for animal feeding in China: o It must be appreciated that grains available for animal feeding purposes are often only second grade
or reject quality grains or by‐products that are not required for direct human consumption, or for food or beverage manufacturing.
o In relation to rice, the low quality early rice varieties and stale or rancid rice reserves are most commonly used to feed pigs and poultry in both commercial farms and rural households.
o Of the feed grade grains available for dairy cows, these must be shared by the huge pig and poultry populations of China, as well as the supplementary feeding of millions of grazing cattle (many of them dual purpose), sheep, goats, yaks and buffalo.
o High corn prices during 2009/10 resulted in a greater proportion of both rice and wheat being used for animal feed use. While there is no reliable data on feed rice use, USDA estimates that approximately 11 million MT of rice (unmilled) was used as animal feed in 2009.
o Sorghum is high energy grain used very widely for dairy cattle in many countries when milled or processed in some way. However in China, sorghum is mostly planted on so‐called marginal land with little or no irrigation. Currently, neither the Ministry of Agriculture nor provincial authorities consider sorghum an important feed grain, and the crop receives no production assistance. The majority of China’s sorghum is used to produce ‘hard liquor’.
o China imports feed wheat and DDGS from the US, and cassava meal from Thailand, Indonesia and Vietnam for feed use or ethanol production.
o To encourage grain production and maintain profit margins for grain farmers, China implemented a series of policies, effective since 2004, including the elimination of taxes on agricultural land, direct payments to grain farmers, adjustments to price support programs, and in 2005, a subsidy for the purchase of farm machinery. In 2006, China added a direct subsidy for farm use of fuel and fertilizers. As in previous years, in 2009/10, the GOC expanded support programs and pledged to extend these existing programs into 2010/11, with more funds earmarked.
www.allaboutfeed.com The stockfeed industry of China The Chinese commercial animal feed production industry amounted to 137 million tonnes in 2008, with the great majority of this intended for the huge intensive pig and poultry industries of China. Of total feed produced, the breakdown of types was approximately: 77.5 % compound feed, 18.5 % concentrate feed and 4 % feed additive premixes. China's feed market grew an incredible 24% in 2009, stretching the ability of home‐grown crops to supply enough grain for manufacture of stockfeeds. China could even become a net corn importer as early as 2011‐12, as demand for livestock feed overtakes China's internal supplies of corn and more acreage goes to horticultural production. The Ministry of Agriculture’s China Industrial Feed Association tracks national industrial feed production. According to MOA, corn content is estimated at 55 ‐ 65 % of “industrial” (large scale commercial) compound feed, while industrial feed is estimated at 50 ‐ 65 % of total feed use. At the household farm level, farmers tend to purchase concentrate, and premix feed (protein meals, vitamins & minerals) exclusively, then blend with grains to reduce costs. The Chinese compound feed market had the potential to reach 275 million tonnes by about 2020‐2025, based on "market ceiling" factors. That would be a major share of the global animal feed market. If the
Capability Assessment of Australian Dairy Technology and Services ‐ AANC Pty Ltd, July 2010
_________________________________________________________________________________________________________ Page 103 of 329
global feed market continues to grow at its current rate of 2%, the world would be producing 750 million tonnes of industrial feed by 2015 ‐ up from its current level of 708 million tonnes. PRESS ARTICLE HIGHLIGHTING POTENTIAL FOR EXPORTS OF HAY TO CHINA USDA Foreign Agricultural Service. Global Agricultural Information Network. GAIN Report Number: CH9625. Date 5/26/2009 China ‐ Peoples Republic of Why sales of U.S. Alfalfa to South China are poised to grow. According to a dairy farm manager interviewed in April 2009 by the USDA team, he feeds over 1,700 head, among which 1,000 are lactating, at a large dairy farm in Guangzhou. On average, each cow produces 6 tons of milk yearly. Milk processors pay him RMB3,900 (US$572) for a ton of milk, which costs him RMB2,000 (US$293) for feed and RMB1,600 (US$234) for management fees (veterinary, labor, electricity and maintenance). He annually buys 1,000 tons U.S. baled alfalfa hay fed to his lactating cows by 5 kilograms (11 pounds) per cow daily. Chinese hay dealers may ship alfalfa baled hay (protein 18%, ADF 40%, NDF 48%) from Gansu or Ningxia to his farm at RMB2,500 (US$367) per ton, which he can accept, given the above profit margin and feed ration. However, he is more willing to pay a premium of RMB100‐200 (US$15‐30) for quality U.S. alfalfa hay (protein 18‐20%, ADF 30%, NDF 40%). If prices reach RMB2,800 (US$410), he deems it expensive. If prices go beyond RMB3,000 (US$440), he cannot afford it. Given farmers need to pay, on top of CIF prices, 9% for tariff and 3% for import agency and land transportation from port to farm, it means if U.S. alfalfa exporters can ship hay to Guangzhou ports at CIF US$330‐365, their products will be competitive. Nevertheless, if CIF prices reach or exceed US$400, sales will be reduced. Ocean freight is a key factor in pricing. Current freights are at a reasonable level of US$50‐60 per MT and much lower than those in 2008 at US$100‐120 because of lower fuel prices. This significantly impacts upon sales. When alfalfa is not available or too expensive, his farm will switch to feed sheep grass (three kilogram, or 6.6 pound per cow daily) with increased amounts of grains such as soybean meal. Compared to alfalfa, sheep grass is low in protein (9% protein) and less palatable. In May of 2009, sheep grass arrives at South China farms at RMB1,200 (US$176) per ton. It costs RMB600 (US$88) per ton to truck sheep grass or alfalfa hay from North China such as Heilongjiang, Gansu and Ningxia. The USDA team also learned that Canadian, Australian and Spanish are interested in exporting alfalfa hay to China. In South China, there is no farm buying hay from any of these countries, which may need to work with AQSIQ to conduct pest risk assessment for their hay products. 8.) Availability of Artificial Insemination laboratories and testing facilities for cattle; also veterinary services Beef in China. Agribusiness Opportunities and Challenges. JW Longworth, CG Brown & SA Waldron University of Queensland Press, 2001
Capability Assessment of Australian Dairy Technology and Services ‐ AANC Pty Ltd, July 2010
_________________________________________________________________________________________________________ Page 104 of 329
Artificial insemination has long been widely established as the basis of dairy cow reproduction in China. The country has established a fairly sophisticated network of dairy and beef breeding centres, generally known as “bull stations”, and AI distribution centres in many provinces. The dairy AI programs were established back in the 1970’s, with beef programs starting later, but expanding rapidly in the 1990’s. In 1995, the latest year for which comprehensive data was available (in 2001), China had approximately 130 State‐owned and operated Bovine Breeding Centres. These centres all kept bulls for semen collection, processing, storage and distribution throughout the country. Of these 130 centres, about 50 were considered by the Australian researchers in 2001 to be viable in the longer term. These larger‐scale bull stations had the combined capacity to produce about 15 million doses of frozen semen (pellets or straws) per year. Of this total, dairy semen accounted for approximately one third, or 5 million doses. There are also AI stations at the township level of all major dairy farming areas, which provide breeding services for private small‐holder dairy farmers. According to a Central Government regulation, village bulls cannot be used for natural matings within 10 km of an AI service centre, although apparently many local authorities do not strictly enforce this rule. 9.) Agribusiness educational facilities to support dairy production Some of the leading agricultural universities in China are listed below.
o Chinese Academy of Agricultural Sciences Wulanchabu Donglu, Hohhehot 010010, Inner Mongolia Autonomous Region
o Beijing Animal Husbandry Institute, Chinese Academy of Agricultural Sciences Yuanmingyaunxi Road No. 2, Beijing 100094
o College of Gansu Agricultural University Yingmencun 1, Lanzhou 730070, Gansu Province
o Inner Mongolia Agricultural University Zhaowuda Road, Huhhehot 010018, Inner Mongolia Autonomous Region
o Xinjiang Agricultural University Nanchang Road, Urumchi 830052, Xinjiang Uigur Autonomous Region
o Grassland Science Department of Qinghai University Ningzhang Road, Xining, Qinghai Province
o China Agricultural University Yuanmingyuanxilu 2, Beijing 100094
o Sichuan Agricultural University Xinkang Road 36, Yaan City, Sichuan Province
o Nanjing Agricultural University Weigang, Nanjing 210095, Jiangsu Province
o Tropical Pasture Research Center of Chinese Academy of Tropical Agricultural Sciences Danzhou 571737, Hainan Province
o Ningxia Agricultural College Wangtaipu, Yunning 750105, Ningxia Hui Autonomous Region
o Inner Mongolia Academy of Animal Science West Suburbs, Huhhot 010030, Inner Mongolia Autonomous Region
10.) Dairy food production facilities (milk, yoghurt, cheese, etc)
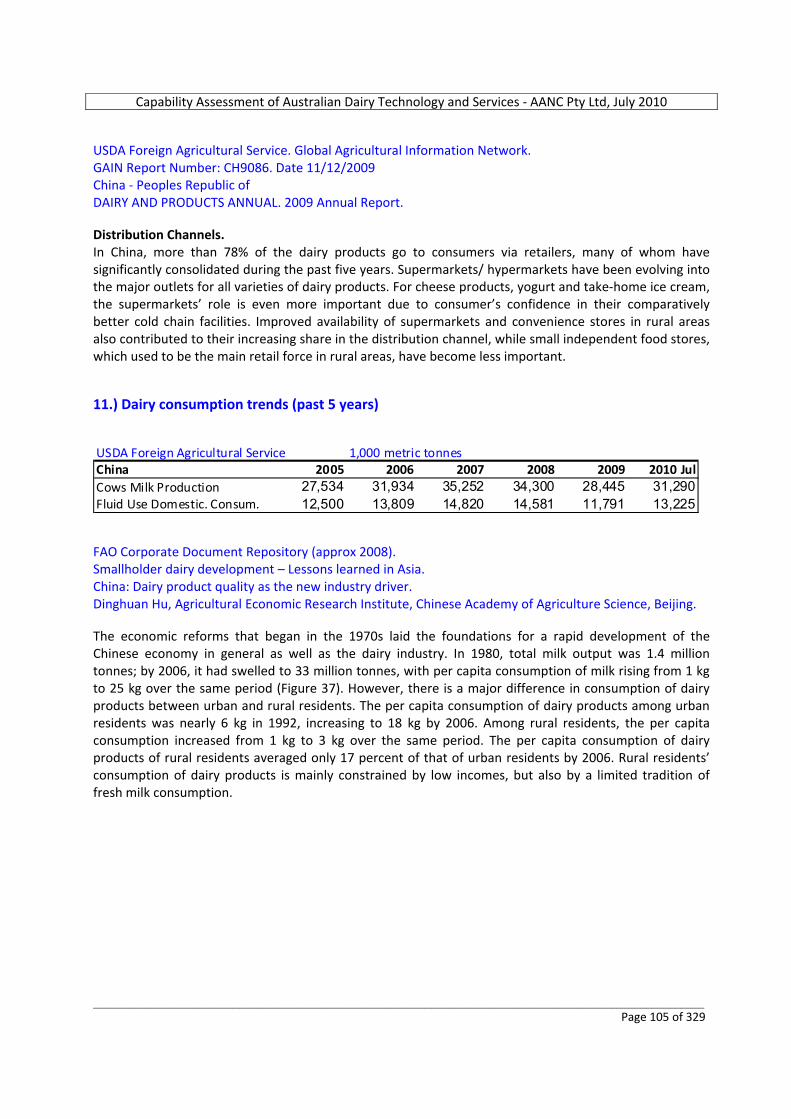
Capability Assessment of Australian Dairy Technology and Services ‐ AANC Pty Ltd, July 2010
_________________________________________________________________________________________________________ Page 105 of 329
USDA Foreign Agricultural Service. Global Agricultural Information Network. GAIN Report Number: CH9086. Date 11/12/2009 China ‐ Peoples Republic of DAIRY AND PRODUCTS ANNUAL. 2009 Annual Report. Distribution Channels. In China, more than 78% of the dairy products go to consumers via retailers, many of whom have significantly consolidated during the past five years. Supermarkets/ hypermarkets have been evolving into the major outlets for all varieties of dairy products. For cheese products, yogurt and take‐home ice cream, the supermarkets’ role is even more important due to consumer’s confidence in their comparatively better cold chain facilities. Improved availability of supermarkets and convenience stores in rural areas also contributed to their increasing share in the distribution channel, while small independent food stores, which used to be the main retail force in rural areas, have become less important. 11.) Dairy consumption trends (past 5 years) USDA Foreign Agricultural Service 1,000 metric tonnesChina 2005 2006 2007 2008 2009 2010 JulCows Milk Production 27,534 31,934 35,252 34,300 28,445 31,290Fluid Use Domestic. Consum. 12,500 13,809 14,820 14,581 11,791 13,225 FAO Corporate Document Repository (approx 2008). Smallholder dairy development – Lessons learned in Asia. China: Dairy product quality as the new industry driver. Dinghuan Hu, Agricultural Economic Research Institute, Chinese Academy of Agriculture Science, Beijing. The economic reforms that began in the 1970s laid the foundations for a rapid development of the Chinese economy in general as well as the dairy industry. In 1980, total milk output was 1.4 million tonnes; by 2006, it had swelled to 33 million tonnes, with per capita consumption of milk rising from 1 kg to 25 kg over the same period (Figure 37). However, there is a major difference in consumption of dairy products between urban and rural residents. The per capita consumption of dairy products among urban residents was nearly 6 kg in 1992, increasing to 18 kg by 2006. Among rural residents, the per capita consumption increased from 1 kg to 3 kg over the same period. The per capita consumption of dairy products of rural residents averaged only 17 percent of that of urban residents by 2006. Rural residents’ consumption of dairy products is mainly constrained by low incomes, but also by a limited tradition of fresh milk consumption.
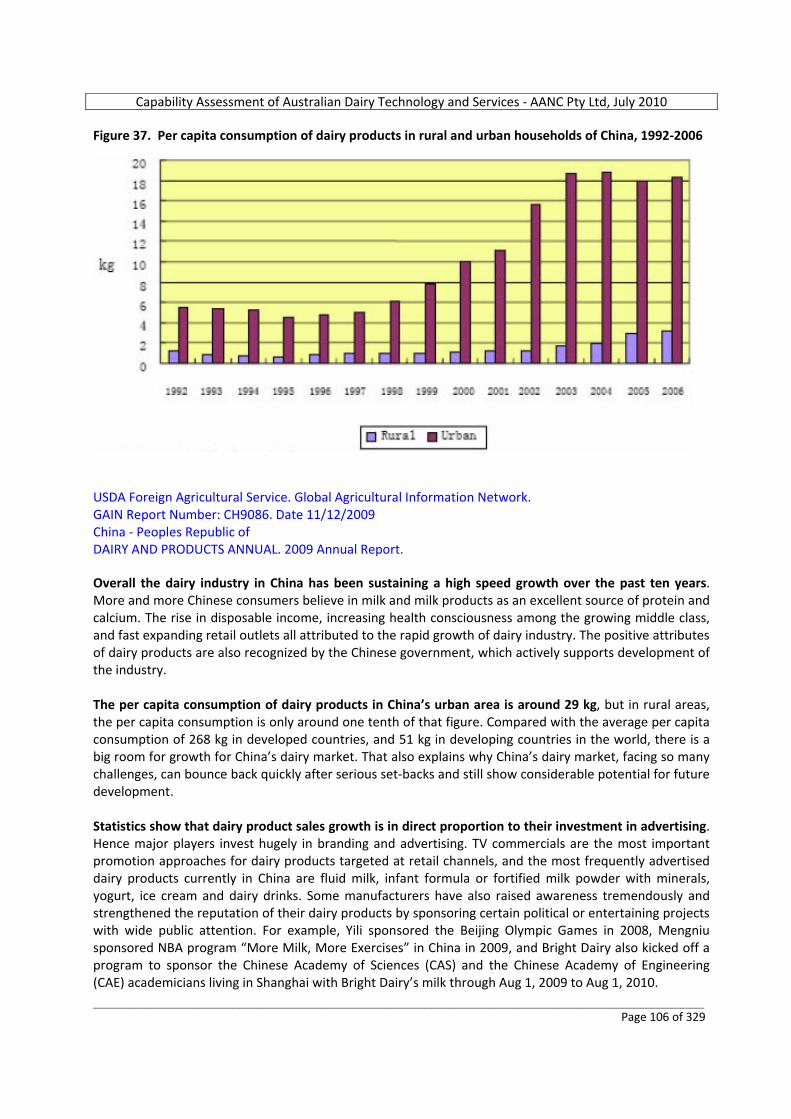
Capability Assessment of Australian Dairy Technology and Services ‐ AANC Pty Ltd, July 2010
_________________________________________________________________________________________________________ Page 106 of 329
Figure 37. Per capita consumption of dairy products in rural and urban households of China, 1992‐2006
USDA Foreign Agricultural Service. Global Agricultural Information Network. GAIN Report Number: CH9086. Date 11/12/2009 China ‐ Peoples Republic of DAIRY AND PRODUCTS ANNUAL. 2009 Annual Report. Overall the dairy industry in China has been sustaining a high speed growth over the past ten years. More and more Chinese consumers believe in milk and milk products as an excellent source of protein and calcium. The rise in disposable income, increasing health consciousness among the growing middle class, and fast expanding retail outlets all attributed to the rapid growth of dairy industry. The positive attributes of dairy products are also recognized by the Chinese government, which actively supports development of the industry. The per capita consumption of dairy products in China’s urban area is around 29 kg, but in rural areas, the per capita consumption is only around one tenth of that figure. Compared with the average per capita consumption of 268 kg in developed countries, and 51 kg in developing countries in the world, there is a big room for growth for China’s dairy market. That also explains why China’s dairy market, facing so many challenges, can bounce back quickly after serious set‐backs and still show considerable potential for future development. Statistics show that dairy product sales growth is in direct proportion to their investment in advertising. Hence major players invest hugely in branding and advertising. TV commercials are the most important promotion approaches for dairy products targeted at retail channels, and the most frequently advertised dairy products currently in China are fluid milk, infant formula or fortified milk powder with minerals, yogurt, ice cream and dairy drinks. Some manufacturers have also raised awareness tremendously and strengthened the reputation of their dairy products by sponsoring certain political or entertaining projects with wide public attention. For example, Yili sponsored the Beijing Olympic Games in 2008, Mengniu sponsored NBA program “More Milk, More Exercises” in China in 2009, and Bright Dairy also kicked off a program to sponsor the Chinese Academy of Sciences (CAS) and the Chinese Academy of Engineering (CAE) academicians living in Shanghai with Bright Dairy’s milk through Aug 1, 2009 to Aug 1, 2010.
Capability Assessment of Australian Dairy Technology and Services ‐ AANC Pty Ltd, July 2010
_________________________________________________________________________________________________________ Page 107 of 329
Some dairy products, particularly fluid milk, reach consumers through special channels, and a “school milk program” which began in November 2000, is one of them. Under this program, milk is delivered to school students directly by the government‐designated manufacturers who have good reputation on product quality and safety. Despite the September 2008 melamine scandal, the Chinese dairy industry is still one sector of the food industry that enjoys the best growing momentum. According to China Ministry of Industry and Information Technology (MIIT), dairy industry turnover accounted for 20% of the whole food industry in China in 2008. China’s dairy industry showed a surprising resilience to the melamine scandal – by July 2009, the dairy market has recovered to 90% of the pre‐scandal consumption level, according to relevant industry associations. The dairy production during January‐August this year reached 12.52 million metric tons, nearly up to the same level one year ago. August 2009 even saw a production growth of 9.4% over same period in 2008. In the first half of 2009, the four dairy giants Yili, Mengniu, Bright and San Yuan achieved a total profit of around RMB 1billion ($ 147 million), representing a 16.6% growth over same period in 2008. Strong Gains in Dairy Consumption Expected in 2010 Fluid Milk: China’s fluid consumption in 2010 is expected to rise 12 percent to 13.2 MMT following a 19 percent decrease in the previous year. UHT milk accounts for 90 percent of Chinese consumption as cold‐chain constraints limit sales growth in pasteurized milk. UHT milk greatly improved the availability of fluid milk for consumers in urban areas, and it has quickly come to the fore and gained a larger market share during the past five years. Yili and Mengniu, both based in Inner Mongolia, are the largest UHT producers, with a huge presence as each operate over 500,000 sales stations across China. Industry is increasingly focusing on consumers outside of urban areas where growth potential is considered greatest. Government initiatives to encourage milk consumption are also on the rise. These include a “One Glass of Milk a Day” (UHT) project aimed at expecting mothers in poor rural areas. Fluid milk has been the fastest‐growing segment during the past five years. Fluid milk has become a feature of the middle class’ daily diet. There are currently more than 2,000 companies in China involved in fluid milk manufacturing. Flavored milk drinks with fruit were the fastest growing sub‐sector among drinking milk in 2008. By targeting teenage consumers who favor taste more than health benefits, flavored milk drinks marketed effectively among younger consumers by positioning themselves as unique and trendy. Some flavored drinks also added DHA, calcium or multivitamins and successfully attracted the attention of children’s parents. Fierce competition has forced the profit of fluid milk to hit historically low levels. Unit price of fluid milk increased slowly due to rising production cost and feed cost. The Chinese government, however, tries to maintain a stable price level in the fluid milk sector, and those leading dairy manufacturers must submit applications to the National Development and Reform Commission (NDRC) before they increase their prices. Non‐fat Dry Milk (NFDM): China’s NFDM consumption growth has been robust in recent years with imported NFDM accounting for nearly all the gains. The USDA forecasts China’s NFDM consumption in 2010 to increase five percent to 125,000 MT, up from an 11 percent increase in 2009. NFDM is mainly for products geared to specific consumer groups such as older people or dieting adults. With China’s aging population, NFDM demand is expected to continue strong.
Capability Assessment of Australian Dairy Technology and Services ‐ AANC Pty Ltd, July 2010
_________________________________________________________________________________________________________ Page 108 of 329
Whole‐fat Milk Powder (WMP): The USDA forecasts China’s WMP consumption in 2010 to increase 11 percent to 1.17 MMT. WMP consumption is expected higher in both the retail milk powder and dairy foods markets. Cheese: Not a traditional food in the Chinese diet, the cheese market is small, but one with great growth potential. The concept that cheese is a good source of protein and calcium for supposedly lactose‐intolerant Asian people has found its way in the middle class consumers’ mind. From 2003 to 2008, China toped the emerging markets in the world with total volume sales growth of 114%. According to Euromonitor, retail value sales of cheese grew by 16% in 2008 to $ 97.9 million. Starting in China only ten years ago, the pizza restaurants have increased to over 4,000 by 2008. While food service remains the important channel of cheese consumption, e.g. mozzarella cheese from Europe, New Zealand and United States are widely used in pizza and fast food making. The lack of an integral and unbroken cold chain is the No.1 factor that holds back cheese sales in China. Yoghurt and sour drinks: Yogurt is another fast growing dairy product in China. It has been growing at an average annual rate of over 20% since 2000.
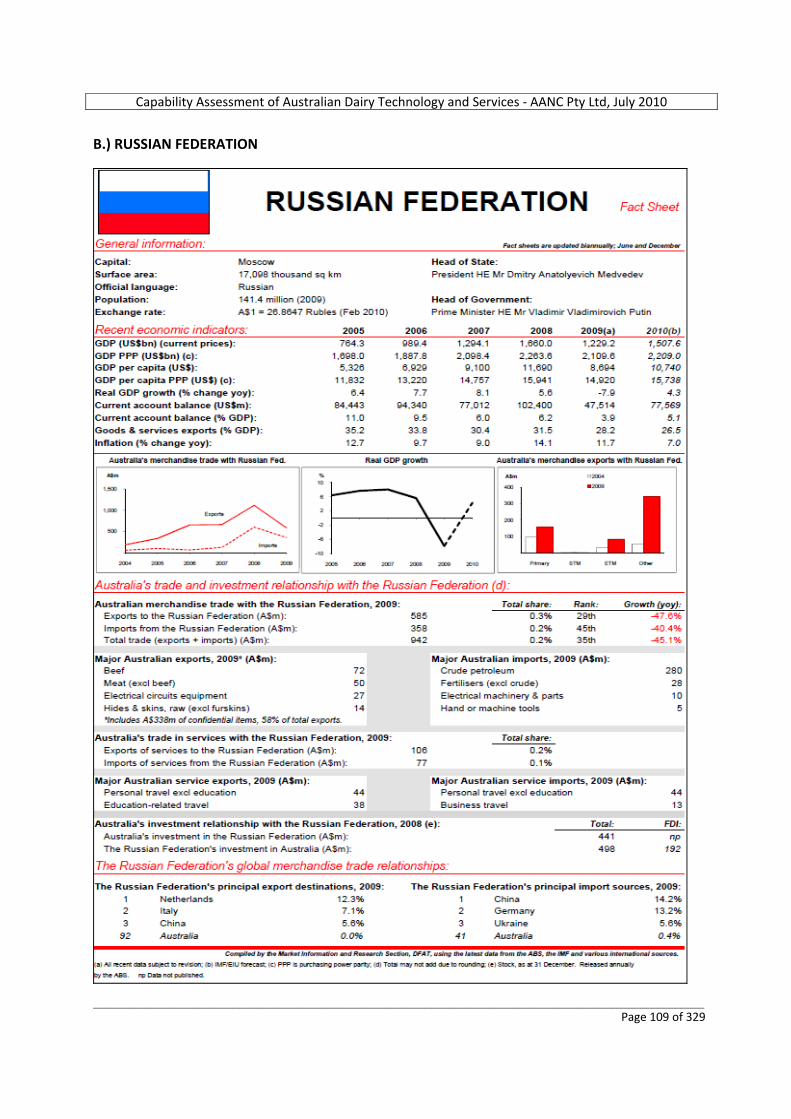
Capability Assessment of Australian Dairy Technology and Services ‐ AANC Pty Ltd, July 2010
_________________________________________________________________________________________________________ Page 109 of 329
B.) RUSSIAN FEDERATION
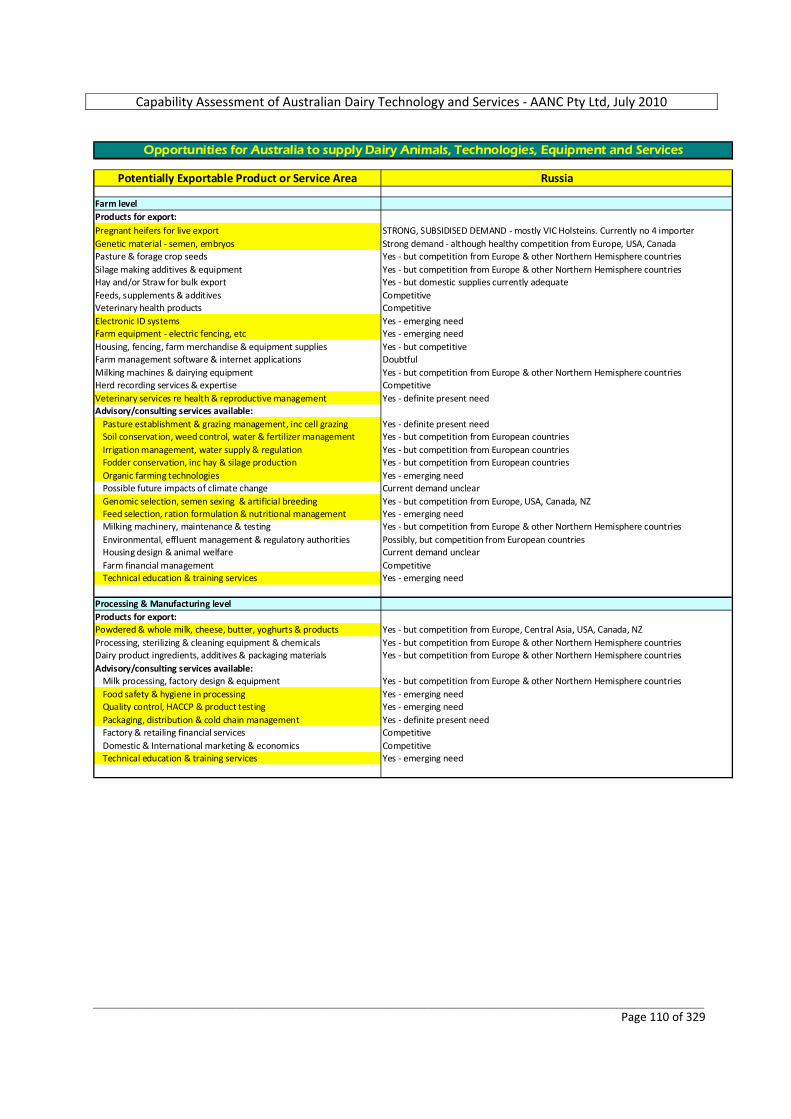
Capability Assessment of Australian Dairy Technology and Services ‐ AANC Pty Ltd, July 2010
_________________________________________________________________________________________________________ Page 110 of 329
Potentially Exportable Product or Service Area Russia
Farm levelProducts for export:Pregnant heifers for live export STRONG, SUBSIDISED DEMAND ‐ mostly VIC Holsteins. Currently no 4 importerGenetic material ‐ semen, embryos Strong demand ‐ although healthy competition from Europe, USA, CanadaPasture & forage crop seeds Yes ‐ but competition from Europe & other Northern Hemisphere countriesSilage making additives & equipment Yes ‐ but competition from Europe & other Northern Hemisphere countriesHay and/or Straw for bulk export Yes ‐ but domestic supplies currently adequateFeeds, supplements & additives CompetitiveVeterinary health products CompetitiveElectronic ID systems Yes ‐ emerging needFarm equipment ‐ electric fencing, etc Yes ‐ emerging needHousing, fencing, farm merchandise & equipment supplies Yes ‐ but competitiveFarm management software & internet applications DoubtfulMilking machines & dairying equipment Yes ‐ but competition from Europe & other Northern Hemisphere countriesHerd recording services & expertise CompetitiveVeterinary services re health & reproductive management Yes ‐ definite present needAdvisory/consulting services available:
Pasture establishment & grazing management, inc cell grazing Yes ‐ definite present needSoil conservation, weed control, water & fertilizer management Yes ‐ but competition from European countriesIrrigation management, water supply & regulation Yes ‐ but competition from European countriesFodder conservation, inc hay & silage production Yes ‐ but competition from European countriesOrganic farming technologies Yes ‐ emerging needPossible future impacts of climate change Current demand unclearGenomic selection, semen sexing & artificial breeding Yes ‐ but competition from Europe, USA, Canada, NZFeed selection, ration formulation & nutritional management Yes ‐ emerging needMilking machinery, maintenance & testing Yes ‐ but competition from Europe & other Northern Hemisphere countriesEnvironmental, effluent management & regulatory authorities Possibly, but competition from European countriesHousing design & animal welfare Current demand unclearFarm financial management CompetitiveTechnical education & training services Yes ‐ emerging need
Processing & Manufacturing levelProducts for export:Powdered & whole milk, cheese, butter, yoghurts & products Yes ‐ but competition from Europe, Central Asia, USA, Canada, NZProcessing, sterilizing & cleaning equipment & chemicals Yes ‐ but competition from Europe & other Northern Hemisphere countriesDairy product ingredients, additives & packaging materials Yes ‐ but competition from Europe & other Northern Hemisphere countriesAdvisory/consulting services available:
Milk processing, factory design & equipment Yes ‐ but competition from Europe & other Northern Hemisphere countriesFood safety & hygiene in processing Yes ‐ emerging needQuality control, HACCP & product testing Yes ‐ emerging needPackaging, distribution & cold chain management Yes ‐ definite present needFactory & retailing financial services CompetitiveDomestic & International marketing & economics CompetitiveTechnical education & training services Yes ‐ emerging need
Opportunities for Australia to supply Dairy Animals, Technologies, Equipment and Services
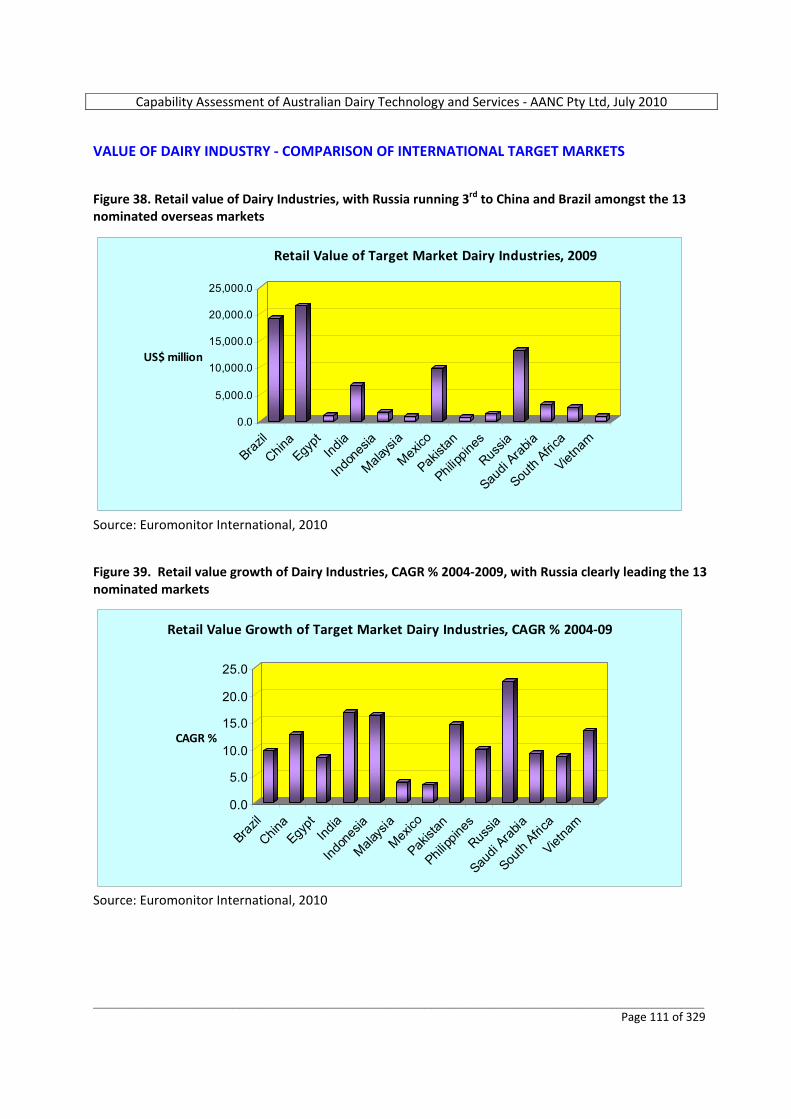
Capability Assessment of Australian Dairy Technology and Services ‐ AANC Pty Ltd, July 2010
_________________________________________________________________________________________________________ Page 111 of 329
VALUE OF DAIRY INDUSTRY ‐ COMPARISON OF INTERNATIONAL TARGET MARKETS Figure 38. Retail value of Dairy Industries, with Russia running 3rd to China and Brazil amongst the 13 nominated overseas markets
0.0
5,000.0
10,000.0
15,000.0
20,000.0
25,000.0
US$ million
Brazil
China
Egypt
India
Indon
esia
Malays
ia
Mexico
Pakist
an
Philipp
ines
Russia
Saudi
Arabia
South
Africa
Vietna
m
Retail Value of Target Market Dairy Industries, 2009
Source: Euromonitor International, 2010 Figure 39. Retail value growth of Dairy Industries, CAGR % 2004‐2009, with Russia clearly leading the 13 nominated markets
0.0
5.0
10.0
15.0
20.0
25.0
CAGR %
Brazil
China
Egypt
India
Indon
esia
Malays
ia
Mexico
Pakist
an
Philipp
ines
Russia
Saudi
Arabia
South
Africa
Vietna
m
Retail Value Growth of Target Market Dairy Industries, CAGR % 2004‐09
Source: Euromonitor International, 2010
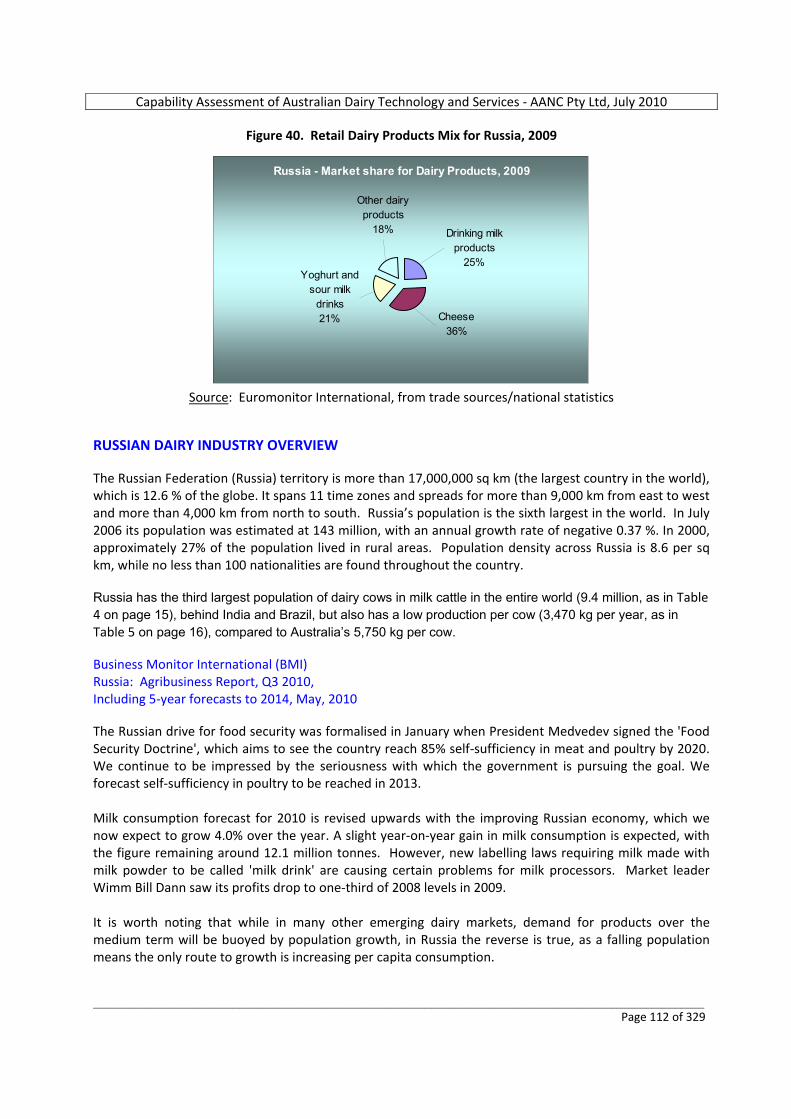
Capability Assessment of Australian Dairy Technology and Services ‐ AANC Pty Ltd, July 2010
_________________________________________________________________________________________________________ Page 112 of 329
Figure 40. Retail Dairy Products Mix for Russia, 2009
Russia - Market share for Dairy Products, 2009
Drinking milk products
25%
Cheese36%
Yoghurt and sour milk
drinks21%
Other dairy products
18%
Source: Euromonitor International, from trade sources/national statistics
RUSSIAN DAIRY INDUSTRY OVERVIEW The Russian Federation (Russia) territory is more than 17,000,000 sq km (the largest country in the world), which is 12.6 % of the globe. It spans 11 time zones and spreads for more than 9,000 km from east to west and more than 4,000 km from north to south. Russia’s population is the sixth largest in the world. In July 2006 its population was estimated at 143 million, with an annual growth rate of negative 0.37 %. In 2000, approximately 27% of the population lived in rural areas. Population density across Russia is 8.6 per sq km, while no less than 100 nationalities are found throughout the country. Russia has the third largest population of dairy cows in milk cattle in the entire world (9.4 million, as in Table 4 on page 15), behind India and Brazil, but also has a low production per cow (3,470 kg per year, as in Table 5 on page 16), compared to Australia’s 5,750 kg per cow. Business Monitor International (BMI) Russia: Agribusiness Report, Q3 2010, Including 5‐year forecasts to 2014, May, 2010 The Russian drive for food security was formalised in January when President Medvedev signed the 'Food Security Doctrine', which aims to see the country reach 85% self‐sufficiency in meat and poultry by 2020. We continue to be impressed by the seriousness with which the government is pursuing the goal. We forecast self‐sufficiency in poultry to be reached in 2013. Milk consumption forecast for 2010 is revised upwards with the improving Russian economy, which we now expect to grow 4.0% over the year. A slight year‐on‐year gain in milk consumption is expected, with the figure remaining around 12.1 million tonnes. However, new labelling laws requiring milk made with milk powder to be called 'milk drink' are causing certain problems for milk processors. Market leader Wimm Bill Dann saw its profits drop to one‐third of 2008 levels in 2009. It is worth noting that while in many other emerging dairy markets, demand for products over the medium term will be buoyed by population growth, in Russia the reverse is true, as a falling population means the only route to growth is increasing per capita consumption.

Capability Assessment of Australian Dairy Technology and Services ‐ AANC Pty Ltd, July 2010
_________________________________________________________________________________________________________ Page 113 of 329
The table below illustrates how total milk production in Russia is well in excess of what is consumed as liquid drinking milk, but the volumes of butter and cheese manufactured are well below what is consumed as of these products, such that the net trade balance for butter and cheese is significantly in deficit. BMI have forecast that this trend will continue at an escalating rate through to the end of the forecast period, 2014. Table 31. Milk, Butter & Cheese production and consumption in Russia, 2009 to 2014 (forecast)
Gradual improvements since Soviet times The output of Russia's dairy industry fell precipitously following the collapse of the Soviet Union in 1991. Fluid milk production fell from more than 55 million tonnes in 1990 to a little over 32 million tonnes in 2007, as the national dairy herd dropped from more than 20 million head of cattle to under 10 million over the same period, with farmers struggling to make ends meet after government subsidies were removed. Most of the decline in milk output came in the 1990s and, since the end of that decade, production has stabilised, even as the number of dairy cattle in the country continued to fall. Consumption of dairy products was also hit hard in the 1990s as falling real incomes among much of the population forced people to cut back on food consumption. Milk and cheese consumption fell by more than a third from 1990 to 1995, while butter consumption dropped by over a quarter. Fluid milk
Capability Assessment of Australian Dairy Technology and Services ‐ AANC Pty Ltd, July 2010
_________________________________________________________________________________________________________ Page 114 of 329
consumption continued to flounder after the turn of the millennium and, between 2000 and 2007, it contracted by a further 15.2%. With the number of milk cows in Russia having fallen by more than 50% since 1990 and numbers continuing to fall, if at a slower rate, any immediate recovery in milk production will have to come from improved yields, or imports. Milk production per cow has indeed been rising since the mid‐1990s, even as overall production levels continued to fall. This trend has been spurred by inefficient farmers being forced to slaughter their cattle stock, as without government assistance they were unable to make a profit. Despite having risen by around 40% over the last decade, at 3,229kg of milk per cow, average yields are still well below Australia, and only around one‐third of that seen in the US. This leaves plenty of room for growth, and BMI expect yields to improve considerably over their five year forecast period. Rising feed and energy costs over the past two years have put pressure on profit margins in the dairy industry, which forced more consolidation in the sector as smaller operators began losing money and shut down. However, as smaller farms go out of business more efficient corporate farms will expand and drive yields higher. Indeed, in February 2008, Wimm‐Bill‐Dann (WBD), Russia's leading dairy producer, invested more than US$12 million in the opening of a large‐scale dairy farm outside of St Petersburg. The company said that the farm will have 1,200 Holstein cows and is aiming for yields of 8,500kg of milk per cow, not far below average yields in the US. WBD is already eyeing further acquisition targets throughout the region. Organic dairy product potential The USDA reported in June 2008 that while organic products only account for about 2‐5% of supermarket sales, the demand in Moscow increased 21% between 2000 and 2005. The report noted that the government had created Russia's first national organic standard and retailers were expecting a national certification process to follow. The most promising categories for organic production included dairy products. Although the current economic downturn is likely to drag down the consumption of more expensive organic options but the sector could see growth in the future. RUSSIAN MACROECONOMIC FORECAST Business Monitor International (BMI) Russia: Agribusiness Report, Q3 2010, Including 5‐year forecasts to 2014, May, 2010 Exports to Lead Recovery Russia is only just beginning to emerge from a deep macroeconomic crisis and BMI now expects the economy in 2009 to have contracted by 8.1% in real terms. The outlook for household consumption is weak, as the private sector slashes output and retail credit is constricted. Real GDP growth is expected to improve to 4.0% in 2010, but purchasing habits will be affected in the short term. With average oil prices expected to remain above US$70.00/bbl in 2010, base effects should propel export growth back to a healthy 5.0%. The recovery in energy prices will also significantly improve foreign capital inflows and liquidity in domestic credit markets. This in turn should help underpin a tentative recovery in private consumption. However, BMI cautions that trend growth going forward is unlikely to return to the pre‐recession average above 7.0%, with a weak labour market and feed‐through effects from the Russian financial crisis in Q408/Q109 continuing to weigh on credit growth over the medium term.
Capability Assessment of Australian Dairy Technology and Services ‐ AANC Pty Ltd, July 2010
_________________________________________________________________________________________________________ Page 115 of 329
SWOT ANALYSIS Business Monitor International (BMI) Russia: Agribusiness Report, Q3 2010, Including 5‐year forecasts to 2014, May, 2010 Russian Agricultural Sector SWOT Strengths • With 10% of the world's arable land, about 35 million hectares of which reportedly lie fallow, Russia
has enormous potential for expanding agricultural production. • Russia's population of around 140 million people provides a vast market for agricultural products. Weaknesses • Decades of collective and state farming with little incentive to maximise production have left Russian
agriculture with poor yields by international standards. • Creaking Soviet‐era infrastructure increases costs and makes expansion into new areas difficult. • Many farmers lack the skills to run a profitable business without government aid. Opportunities • Poor yields leave much room for increasing production through better farming practices. • Large and efficient corporate farms are beginning to emerge with much opportunity for further
expansion. • Rising disposable incomes in the long term will allow Russians to spend more on food. • Agricultural expansion could substantially benefit from Putin's latest land reform legislation, which
means that for the first time since 1917 Russia will permit the trading of national farmlands. This could go a long way towards attracting the types of investment that can help Russia fulfill its vision of being a major agricultural player.
• Foreign investment is playing an increasingly important role in the development of the agri‐food industry.
Threats • The rural population is declining rapidly with many young people heading for the cities. • Much of the country suffered from environmental degradation in Soviet times, which, if not dealt
with, could threaten agricultural production in the future. • The government has been threatening to reassert its former role of directing agriculture and has
signed into being the United Grain Company, although the full implications of this development are as yet unclear.
• The global recession has taken its toll. The economy is estimated to have shrunk by 8.1% in 2009, the outlook for household consumption is weak and unemployment spiralled to an eight‐year high in March 2009. The economy will improve in 2010 but consumer spending is likely to remain subdued for the short term. Investment slow down and the government's plans to expand the sector could also be affected.
Political Environment SWOT Strengths • The Russian government maintains a strong parliamentary majority and overwhelming public support.
Capability Assessment of Australian Dairy Technology and Services ‐ AANC Pty Ltd, July 2010
_________________________________________________________________________________________________________ Page 116 of 329
Weaknesses • A lack of transparency in decision‐making, including high levels of behind‐the‐scenes activity by
various power groups, makes for a large element of unpredictability in domestic politics over the long run.
• The high degree of political authority in the executive poses a risk to further institutional development in the legislative and judicial sectors.
Opportunities • President Dmitry Medvedev has expressed a more compromising tone on foreign policy matters and
has suggested a new emphasis on the development of civil society. • Tight energy markets increase Russia's foreign policy options, especially as regards consumer states. Threats • Russia's moves to increase its regional dominance in the energy sector risk a further deterioration in
relations with the Western‐leaning countries of the 'Near Abroad'. • Persistent frozen conflicts with separatist regions in Georgia and Moldova threaten to undermine
Russia's foreign relations with key trading partners Economic Environment SWOT Strengths • Russia maintains enviable external account dynamics, with a robust current account surplus, limited
foreign debt and high reserve holdings. This will continue to provide significant stability during financial crises.
• Russia's large resource base will provide a strong foundation for foreign investments and export growth over the long term.
Weaknesses • The economy's dependence on the oil sector makes it particularly vulnerable to a sustained decline in
energy prices. • The deterioration of Soviet‐era infrastructure is a constraint to private sector activity, especially
outside major cities. Opportunities • A revitalisation of the structural reform agenda, including support for small and medium‐sized
businesses, restructuring of the banking sector, administrative reform to tackle red tape and corruption, and a revamp of the 'natural monopolies', would go a long way towards developing the non‐oil economy and improving long‐term growth prospects.
• A US$1 trillion public‐private investment plan over the long‐term will substantially modernise Russia's transport, communications, electricity and utilities infrastructure.
Threats • The Russian economy is in a state of transition, with large current account and fiscal surpluses to be
eroded significantly. With this will come new challenges to macroeconomic stability. • The global financial crisis has created significant volatility in oil prices, which significantly elevates
macroeconomic uncertainty. Business Environment SWOT
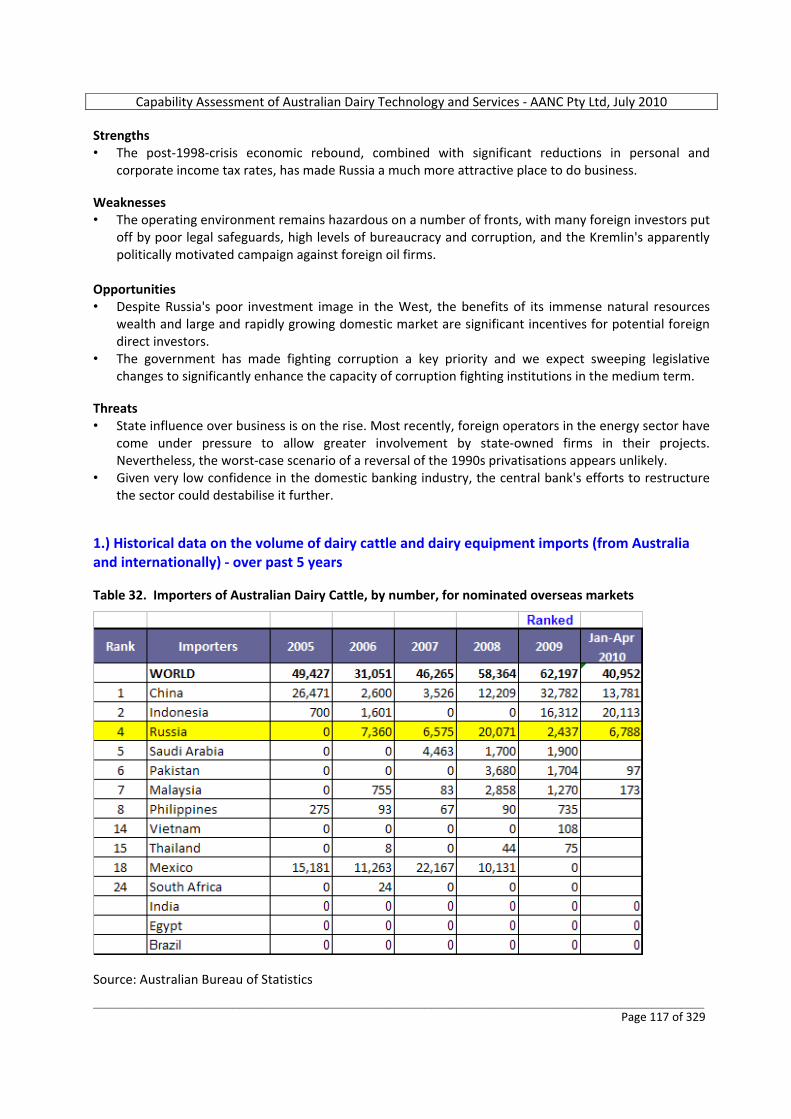
Capability Assessment of Australian Dairy Technology and Services ‐ AANC Pty Ltd, July 2010
_________________________________________________________________________________________________________ Page 117 of 329
Strengths • The post‐1998‐crisis economic rebound, combined with significant reductions in personal and
corporate income tax rates, has made Russia a much more attractive place to do business. Weaknesses • The operating environment remains hazardous on a number of fronts, with many foreign investors put
off by poor legal safeguards, high levels of bureaucracy and corruption, and the Kremlin's apparently politically motivated campaign against foreign oil firms.
Opportunities • Despite Russia's poor investment image in the West, the benefits of its immense natural resources
wealth and large and rapidly growing domestic market are significant incentives for potential foreign direct investors.
• The government has made fighting corruption a key priority and we expect sweeping legislative changes to significantly enhance the capacity of corruption fighting institutions in the medium term.
Threats • State influence over business is on the rise. Most recently, foreign operators in the energy sector have
come under pressure to allow greater involvement by state‐owned firms in their projects. Nevertheless, the worst‐case scenario of a reversal of the 1990s privatisations appears unlikely.
• Given very low confidence in the domestic banking industry, the central bank's efforts to restructure the sector could destabilise it further.
1.) Historical data on the volume of dairy cattle and dairy equipment imports (from Australia and internationally) ‐ over past 5 years Table 32. Importers of Australian Dairy Cattle, by number, for nominated overseas markets
Source: Australian Bureau of Statistics
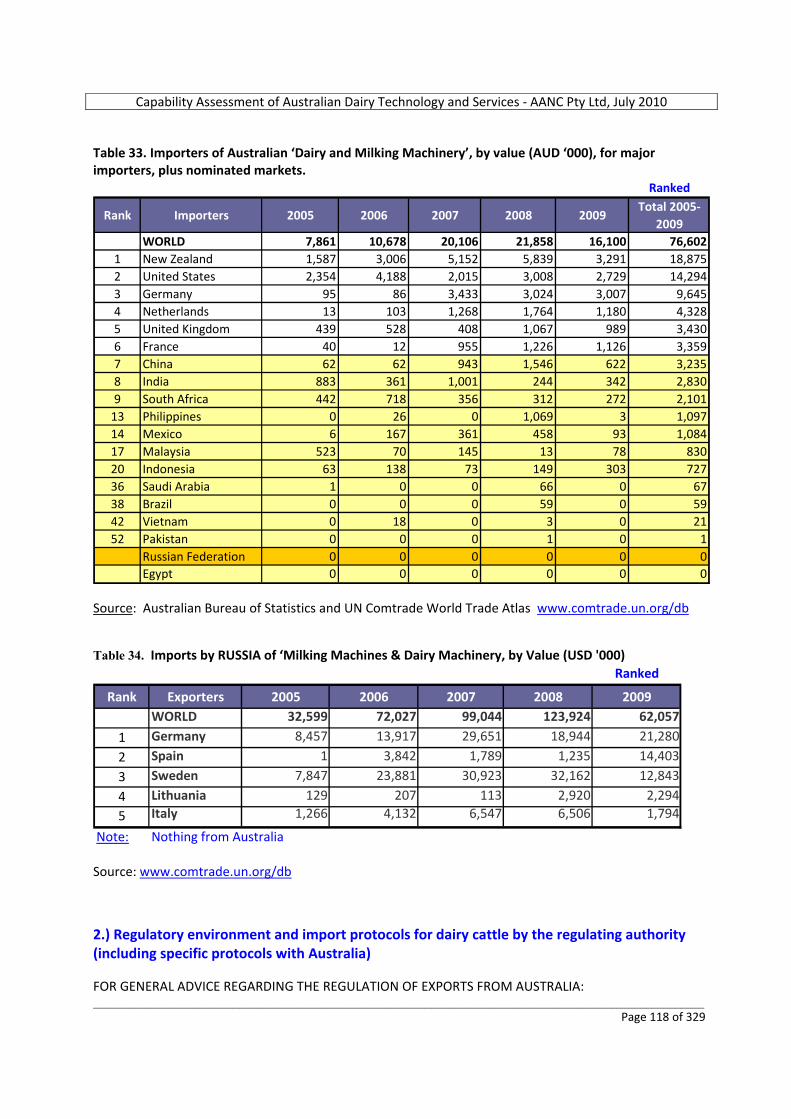
Capability Assessment of Australian Dairy Technology and Services ‐ AANC Pty Ltd, July 2010
_________________________________________________________________________________________________________ Page 118 of 329
Table 33. Importers of Australian ‘Dairy and Milking Machinery’, by value (AUD ‘000), for major importers, plus nominated markets.
Ranked
Rank Importers 2005 2006 2007 2008 2009Total 2005‐
2009WORLD 7,861 10,678 20,106 21,858 16,100 76,602
1 New Zealand 1,587 3,006 5,152 5,839 3,291 18,8752 United States 2,354 4,188 2,015 3,008 2,729 14,2943 Germany 95 86 3,433 3,024 3,007 9,6454 Netherlands 13 103 1,268 1,764 1,180 4,3285 United Kingdom 439 528 408 1,067 989 3,4306 France 40 12 955 1,226 1,126 3,3597 China 62 62 943 1,546 622 3,2358 India 883 361 1,001 244 342 2,8309 South Africa 442 718 356 312 272 2,101
13 Philippines 0 26 0 1,069 3 1,09714 Mexico 6 167 361 458 93 1,08417 Malaysia 523 70 145 13 78 83020 Indonesia 63 138 73 149 303 72736 Saudi Arabia 1 0 0 66 0 6738 Brazil 0 0 0 59 0 5942 Vietnam 0 18 0 3 0 2152 Pakistan 0 0 0 1 0 1
Russian Federation 0 0 0 0 0 0Egypt 0 0 0 0 0 0
Source: Australian Bureau of Statistics and UN Comtrade World Trade Atlas www.comtrade.un.org/db Table 34. Imports by RUSSIA of ‘Milking Machines & Dairy Machinery, by Value (USD '000)
Ranked
Rank Exporters 2005 2006 2007 2008 2009WORLD 32,599 72,027 99,044 123,924 62,057
1 Germany 8,457 13,917 29,651 18,944 21,280
2 Spain 1 3,842 1,789 1,235 14,403
3 Sweden 7,847 23,881 30,923 32,162 12,843
4 Lithuania 129 207 113 2,920 2,294
5 Italy 1,266 4,132 6,547 6,506 1,794
Note: Nothing from Australia Source: www.comtrade.un.org/db 2.) Regulatory environment and import protocols for dairy cattle by the regulating authority (including specific protocols with Australia) FOR GENERAL ADVICE REGARDING THE REGULATION OF EXPORTS FROM AUSTRALIA:
Capability Assessment of Australian Dairy Technology and Services ‐ AANC Pty Ltd, July 2010
_________________________________________________________________________________________________________ Page 119 of 329
Australian Customs and Border Protection Service, Canberra City, ACT. http://www.customs.gov.au
FOR FOREIGN AFFAIRS, IMPORT TRADE PROTOCOLS/REGULATIONS AND WEB LINKAGES TO FOREIGN EMBASSIES IN COUNTRIES TO WHICH EXPORTS ARE INTENDED:
Australian Department of Foreign Affairs and Trade, Barton, ACT. http://www.dfat.gov.au/embassies/Russia
FOR SPECIFIC ADVICE REGARDING THE PREPARATION, SHIPPING OR AIR‐FREIGHTING OF LIVE ANIMALS AND LIVE ANIMALS TRADE ISSUES IN DESTINATION FOREIGN COUNTRIES:
LiveCorp Ltd, North Sydney, NSW. http://www.livecorp.com.au
FOR SPECIFIC ADVICE REGARDING PROTOCOLS FOR THE EXPORT OF LIVE ANIMALS (OR ANIMAL‐DERIVED PRODUCTS SUCH AS SEMEN AND EMBRYOS) FROM AUSTRALIA AND IMPORT PROTOCOLS IN DESTINATION FOREIGN COUNTRIES:
Australian Quarantine and Inspection Service (AQIS), Canberra City, ACT. http://www.aqis.gov.au
Specific Russian information: USDA Foreign Agricultural Service. Global Agricultural Information Network. GAIN Report Number: ….. Date 10/08/2009 Russian Federation ‐ Food and Agricultural Import Regulations and Standards Despite Russia’s ongoing preparation for WTO accession, agencies’ control over imported foodstuffs remains complicated and bureaucratic. Barriers to trade depend on the type of product, customs clearance location, importer’s status, and other non‐transparent factors. Food Laws In general, it is recommended that customs clearance be carried out by an agency located in the country where the customs clearance must be performed, or at least by a representative of this party in situ. Import permits are issued in the name of physical or legal entities that are officially registered in the territory of the Russian Federation with the Russian tax authorities. Typically, a product’s exporter handles export customs‐clearance and the product’s importer handles import customs‐clearance. Exporting products into the Russian Federation can be a difficult task for inexperienced exporters, because import requirements and customs clearance rules frequently change. It is recommended that the importer, with the help of up‐to‐date information sources, check all import documents closely and not violate Russian laws and Russian agencies’ product‐specific regulations. Important mandatory requirements for safety and identification are articulated not only in sanitary and regulatory documents, such as the Sanitary Rules and Regulations (“SanPiN”) but also in some national standards (known by the Russian abbreviation “GOST”) and technical regulations.
Capability Assessment of Australian Dairy Technology and Services ‐ AANC Pty Ltd, July 2010
_________________________________________________________________________________________________________ Page 120 of 329
For food products of animal origin, an import (veterinary) permit is needed and for products of plant origin an import quarantine permit is necessary. Both Veterinary and Quarantine permits are needed for fodder crops, and feeds. Live Animals (including dairy heifers) Live animals, like other animal‐origin products, are subject to state border veterinary supervision. Exports from Australia to Russia is possible only for live animals for which the two countries have agreed on a veterinary health protocol. To clear customs, the shipment is subject to state veterinary supervision. Veterinary certificates issued by the border veterinary point must be exchanged for the veterinary certificates from the supplier’s country of origin, and the documents accompanying the shipment with the original stamp of the border veterinary point, stating that “release is allowed”. When brood domestic animals are exported to the Russian Federation, traders should take into account: Resolution 244 of April 24, 2007, exempting from value added tax (VAT) the following commodity line items: • From 0102 Brood cattle, • From 0103 Brood swine, • From 0104 Brood sheep and goats. Milk and Dairy Products The requirements for the import of dairy products are much like the requirements for the majority of animal origin products. However, not all dairy products require a veterinary certificate and import permit. More information pertaining to specific tariff lines can also be found at http://www.tks.ru/db/tnved/tree. Dairy products may not contain melamine. The Russian Chief Medical Officer and the Federal Service for the Protection of Consumer Rights and Human Well‐being of the Ministry of Health (Rospotrebnadzor), signed Resolution No. 56 dated October 21, 2008, that bans the use of melamine in dairy products and adds it to the list of monitored products in food items. Russian Import Specialist Contacts: Russian Federation web sites include:
o Ministry of Health and Social Development: http://www.minzdravsoc.ru/ http://www.government.ru/institutions/ministries/details.html?he_id=143
o Ministry of Economic Development: http://www.economy.gov.ru/wps/portal o Federal Customs Service of Russia: http://www.customs.ru/en/ o Ministry of Agriculture: http://www.mcx.ru/ o Ministry of Industry and Trade: http://www.minprom.gov.ru/
Most veterinary certificates for imports to Russia of livestock, embryos, and semen were signed in May 2008. Copies of the veterinary certificates can be found at the Russian Federal Veterinary Service website: http://www.fsvps.ru/fsvps/importExport/usa/sertificates.html Business Monitor International (BMI) Russia: Agribusiness Report, Q3 2010, Including 5‐year forecasts to 2014, May, 2010
Capability Assessment of Australian Dairy Technology and Services ‐ AANC Pty Ltd, July 2010
_________________________________________________________________________________________________________ Page 121 of 329
The USDA reports that the government has introduced temporary (9 month duration) measures to limit imports of milk and butter. January 2009 resolutions were introduced to increase the import duty on butter to no less than EUR 0.35 per kilogram, up from EUR 0.22/kg and to increase the import duty on milk and cream from 15 % ad valorem to 20 %. USDA adds that major suppliers of butter include New Zealand, Finland and the US. In a bid to stimulate Russian cheese production, the government changed the custom duties for imported cheese when it issued Resolution #680 on August 20 2009, effective from September 25 2009. All custom duties on cheeses were set at 15 % for shipments EUR 0.5/kg and above. Previously the lower limit for duty on most cheese varieties was set at EUR 0.3/kg. Despite the objective of the measure, there remains a risk that the move could downwardly affect Russian cheese consumption levels and open the door for more cheese imports from Belarus and Ukraine, whose exports to Russia, as members of the Commonwealth of Independent States, are duty‐free. Threats to create State Milk Processing Factories In March 2010 the international Dairy Site reported that former Russian Prime Minister, Viktor Zubkov, warned Russian dairy processors that if they could not agree on a minimum price for milk, the government would subsidise the creation of state milk processing factories. Zubkov's threat came after the Russian Dairy Union failed to come to an agreement over a minimum price for 2010. A suggested price of RUB11/Ltr was felt by processors to be too high. They suggested RUB8/Ltr, which was rejected as too low for farmers. BMI believes Zubkov's threat will, in the long run, help to prop up less‐efficient dairy farmers and boost the viability of some farms as processors are forced to dig deeper for their milk. New Labelling laws regarding ‘Milk Drinks’ Russian processors have struggled with new labelling laws introduced in December 2008, which state that milk made from milk powder must now be named “milk drink”. The international Dairy Site reported in March 2010 that processors were reluctant to change labelling at a time of seasonal decline in milk production and 'unexpected’ shortages of milk powder. Market leader Wimm‐Bill‐Dann experienced a massive decline in year‐on year profit that saw revenues drop to just one‐third of 2008 levels. The Dairy Site reported that in response to a decline in consumer spending, companies such as Danone were focussing on 'value‐added' products and discount lines. 'The crisis has lead Russian consumers to shy away from luxury dairy products such as desserts and mousses and return to more traditional products such as keifir and curd', the Dairy Site reported. 3.) Investment environment for dairy operations (domestic and foreign assistance, tax incentives, export zones, etc) and examples of FDI (from any country) Business Monitor International (BMI) Russia: Agribusiness Report, Q3 2010, Including 5‐year forecasts to 2014, May, 2010 Foreign investment is expected to play a role in increasing milk production in Russia. On July 2 2009, Unilever announced the construction of a new Inmarko (Unilever group of companies) ice cream production complex in the Tula region. The investment will total US$140 million by the end of 2014 and is considered to be one of the most significant Unilever investment projects in Central and Eastern Europe.
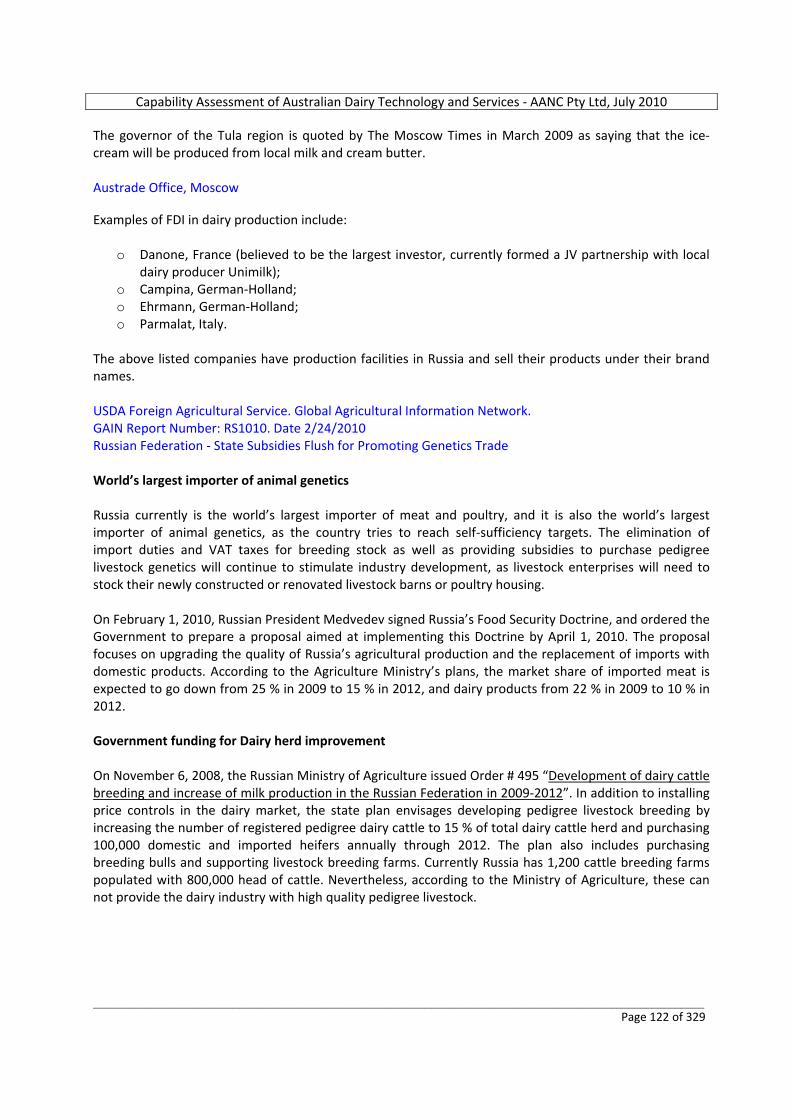
Capability Assessment of Australian Dairy Technology and Services ‐ AANC Pty Ltd, July 2010
_________________________________________________________________________________________________________ Page 122 of 329
The governor of the Tula region is quoted by The Moscow Times in March 2009 as saying that the ice‐cream will be produced from local milk and cream butter. Austrade Office, Moscow Examples of FDI in dairy production include:
o Danone, France (believed to be the largest investor, currently formed a JV partnership with local dairy producer Unimilk);
o Campina, German‐Holland; o Ehrmann, German‐Holland; o Parmalat, Italy.
The above listed companies have production facilities in Russia and sell their products under their brand names. USDA Foreign Agricultural Service. Global Agricultural Information Network. GAIN Report Number: RS1010. Date 2/24/2010 Russian Federation ‐ State Subsidies Flush for Promoting Genetics Trade World’s largest importer of animal genetics Russia currently is the world’s largest importer of meat and poultry, and it is also the world’s largest importer of animal genetics, as the country tries to reach self‐sufficiency targets. The elimination of import duties and VAT taxes for breeding stock as well as providing subsidies to purchase pedigree livestock genetics will continue to stimulate industry development, as livestock enterprises will need to stock their newly constructed or renovated livestock barns or poultry housing. On February 1, 2010, Russian President Medvedev signed Russia’s Food Security Doctrine, and ordered the Government to prepare a proposal aimed at implementing this Doctrine by April 1, 2010. The proposal focuses on upgrading the quality of Russia’s agricultural production and the replacement of imports with domestic products. According to the Agriculture Ministry’s plans, the market share of imported meat is expected to go down from 25 % in 2009 to 15 % in 2012, and dairy products from 22 % in 2009 to 10 % in 2012. Government funding for Dairy herd improvement On November 6, 2008, the Russian Ministry of Agriculture issued Order # 495 “Development of dairy cattle breeding and increase of milk production in the Russian Federation in 2009‐2012”. In addition to installing price controls in the dairy market, the state plan envisages developing pedigree livestock breeding by increasing the number of registered pedigree dairy cattle to 15 % of total dairy cattle herd and purchasing 100,000 domestic and imported heifers annually through 2012. The plan also includes purchasing breeding bulls and supporting livestock breeding farms. Currently Russia has 1,200 cattle breeding farms populated with 800,000 head of cattle. Nevertheless, according to the Ministry of Agriculture, these can not provide the dairy industry with high quality pedigree livestock.
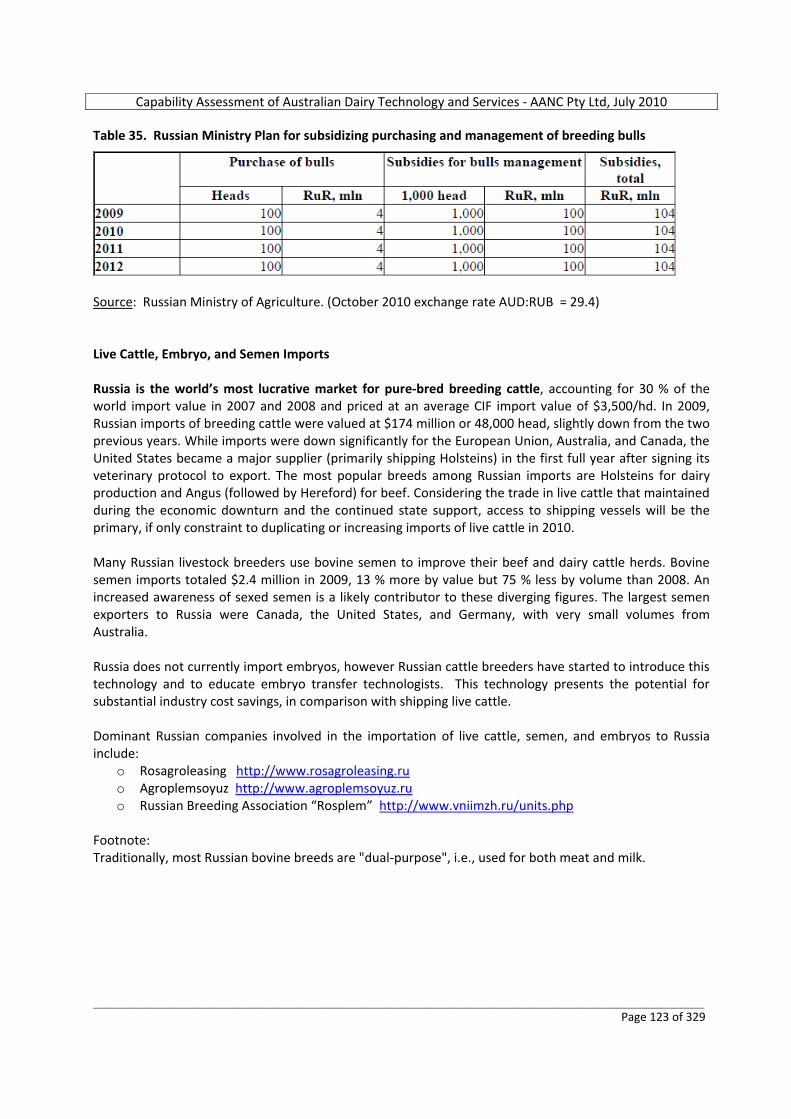
Capability Assessment of Australian Dairy Technology and Services ‐ AANC Pty Ltd, July 2010
_________________________________________________________________________________________________________ Page 123 of 329
Table 35. Russian Ministry Plan for subsidizing purchasing and management of breeding bulls
Source: Russian Ministry of Agriculture. (October 2010 exchange rate AUD:RUB = 29.4) Live Cattle, Embryo, and Semen Imports Russia is the world’s most lucrative market for pure‐bred breeding cattle, accounting for 30 % of the world import value in 2007 and 2008 and priced at an average CIF import value of $3,500/hd. In 2009, Russian imports of breeding cattle were valued at $174 million or 48,000 head, slightly down from the two previous years. While imports were down significantly for the European Union, Australia, and Canada, the United States became a major supplier (primarily shipping Holsteins) in the first full year after signing its veterinary protocol to export. The most popular breeds among Russian imports are Holsteins for dairy production and Angus (followed by Hereford) for beef. Considering the trade in live cattle that maintained during the economic downturn and the continued state support, access to shipping vessels will be the primary, if only constraint to duplicating or increasing imports of live cattle in 2010. Many Russian livestock breeders use bovine semen to improve their beef and dairy cattle herds. Bovine semen imports totaled $2.4 million in 2009, 13 % more by value but 75 % less by volume than 2008. An increased awareness of sexed semen is a likely contributor to these diverging figures. The largest semen exporters to Russia were Canada, the United States, and Germany, with very small volumes from Australia. Russia does not currently import embryos, however Russian cattle breeders have started to introduce this technology and to educate embryo transfer technologists. This technology presents the potential for substantial industry cost savings, in comparison with shipping live cattle. Dominant Russian companies involved in the importation of live cattle, semen, and embryos to Russia include:
o Rosagroleasing http://www.rosagroleasing.ru o Agroplemsoyuz http://www.agroplemsoyuz.ru o Russian Breeding Association “Rosplem” http://www.vniimzh.ru/units.php
Footnote: Traditionally, most Russian bovine breeds are "dual‐purpose", i.e., used for both meat and milk.
Capability Assessment of Australian Dairy Technology and Services ‐ AANC Pty Ltd, July 2010
_________________________________________________________________________________________________________ Page 124 of 329
Table 36. Russian imports of Bovine Semen – both beef & dairy breeds – 2007 to 2009
Source: UN Comtrade World Trade Atlas www.comtrade.un.org/db 4.) National government programs to assist with the development of dairy operations USDA Foreign Agricultural Service. Global Agricultural Information Network. GAIN Report Number: RS9035. Date 5/20/2009 Russian Federation – Dairy and Products Semi‐annual. Snapshot of other Government support schemes A Russian government commission has approved a new program developed by the Ministry of
Agriculture that allocates 9 billion rubles per year for the development of milk and meat production. The plan calls for allocating 4 billion rubles per year from the federal budget aimed at developing beef cattle breeding in Russia in 2009‐2012 and 5 billion rubles per year for a program to develop dairy cattle breeding and increase milk production in the same period. The main goals of the programs are to create and strengthen a core of pedigree cattle as well as increase the production of competitive beef and milk. In addition, the dairy cattle program envisions measures to regulate the dairy market.
Russian President Dimitriy Medvedev signed an Order #1146 dated July 30, 2008, for the creation of a
new “Center of Excellence for Livestock Breeding”. This Center will composed of 22 breeding farms that are consolidated to form a State managed entity. The main goal of the new Center will be to form highly productive cattle herds and improve livestock genetics. It also hopes to develop and introduce up‐to‐date technologies in livestock breeding and artificial insemination. The Center will not only trade semen but will also provide all types of services for breeding farms. The Ministry of Agriculture’s Director for of Livestock Breeding and Animal Improvement Vasiliy Shapochkin stated that the Center would focus on promoting the best domestic genetics possible. Currently, Russia has 1,200 livestock breeding farms populated with 800,000 head of cattle.
Capability Assessment of Australian Dairy Technology and Services ‐ AANC Pty Ltd, July 2010
_________________________________________________________________________________________________________ Page 125 of 329
At the end of April 2009, the Ministry of Finance prepared a draft resolution that exempts domestic and imported breeding livestock from VAT that is currently set at 10 %. The resolution would take effect until January 1, 2012. The list of livestock includes breeding cattle, pigs, sheep and goats, eggs for hatching and others.
Ministry of Agriculture officials will continue to invest in milk production by subsidizing credit for
construction of new dairy farm operations and for renovation projects of older dairy operations. Milk production is forecast to increase 1 % in 2009 reaching 32.8 million metric tons as dairy operations continue to replace low‐yielding domestic herds with imported pedigree animals and genetics, introduce new feeding technologies, and purchase modern farm equipment.
Dairy imports are expected to drop in 2009 as Russia implements trade‐restricting policies to support
domestic producers. The Russian government is taking active measures to protect domestic producers such as increasing import tariffs, and making government purchases of non‐fat dried milk, and as the Russian ruble continues to strengthen.
The Russian government will fund a national campaign to increase milk consumption called “School
Milk”. The School Milk campaign will allocate funds to Russian schools to purchase fluid milk for students in all Russian schools. This campaign was covering 33 Russian regions by the end of 2009.
Business Monitor International (BMI) Russia: Agribusiness Report, Q3 2010, Including 5‐year forecasts to 2014, May, 2010 Government support will be important if dairy production in Russia is to increase significantly. According to the USDA, the 'State Program for Development of Agriculture and Regulation of Food and Agricultural Markets 2008‐2012' is aiming to turn around falling cattle numbers, including measures to stimulate domestic production and protect local producers. The Moscow Times reported in March 2009 that the government may allocate RUB72bn (US$2.1bn) to enable the construction of new, and the restoration of older, dairies and meat processing plants. First Deputy Prime Minister Viktor Zubkov is quoted as saying: 'We must come out of this year with a greater volume of domestically produced milk and meat'. According to an article published by Russia Today, the government is also looking at helping smaller dairy producers through improved technology. Mr Viktor Zubkov is quoted as saying that standard projects were needed for small farms and private households of 20, 30 or 100 cows. The report noted that Russia was looking to Sweden for some of this technology, particularly DeLaval International AB, which already has a presence in the country. An article in The Moscow Times quotes Agriculture Minister Yelena Skrynnik as saying that her ministry plans to support the establishment of 50 new small milk farms to produce and process milk and deliver to local people and businesses. These farms will have between 50‐100 milking cows and are to be built as a single complex for production, processing and marketing of dairy products. Each such farm will cost about 30 million rubles. To date, 5 Russian regions have signed agreements with the Ministry of Agriculture to jointly fund such a project including Belgorod, Leningrad, Lipetsk and Tambov oblasts as well as the Republic of Mordoviya. If successful, the plan is for the Ministry of Agriculture to build 300 of these small dairy farms by 2011, and more than 3,000 small dairy farms in long term period. Federal funds will pay for all construction and

Capability Assessment of Australian Dairy Technology and Services ‐ AANC Pty Ltd, July 2010
_________________________________________________________________________________________________________ Page 126 of 329
necessary infrastructure costs such as gas and electricity supplies. In addition, federal funds will be use to provide soft loans for herd purchase. 5.) Existing or proposed external assistance programs to develop the industry (foreign government and/or aid programs) Austrade Office, Moscow: There are no foreign government and /or aid programs in place. However, there is a National Priority Program for the accelerated development of the cattle industry (both dairy and beef), under which 100% of interest rate on a credit is covered by the Federal and regional governments. Subsidies are provided per head, plus leasing options via Rosagroleasing (100% State organisation). This assistance is available for pedigree cattle only. Also when importing pedigree cattle, companies or farms pay nil import tax. Otherwise the import tax is 5%. 6.) Overview of the typical dairy farming arrangements Figure 41. Author’s photos of 6,000 cow dairy 60 km SE of Moscow, showing free stall barns with wood shavings and cast iron slatted walk‐ways, plus impressive rotary milking parlour. September 2010.
USDA Foreign Agricultural Service. Global Agricultural Information Network. GAIN Report Number: RS9035. Date 5/20/2009 Russian Federation – Dairy and Products Semi‐annual. The number of milk cows is forecast to decrease 1% by the end of 2009. One‐third of total domestic Russian milk is produced in seven provinces throughout Russia. This demonstrates that the production of dairy products gravitates towards milk factories near major population centers or other areas with some sort of relative advantage. Per cow productivity in 2008 rose to 4,024 kg (13.4 kg/cow/day) compared to

Capability Assessment of Australian Dairy Technology and Services ‐ AANC Pty Ltd, July 2010
_________________________________________________________________________________________________________ Page 127 of 329
3,796 kg (12.6 kg/cow/day) in 2007. This is well below genetic potential and leaves room for considerable growth in Russia’s per‐cow productivity merely through better genetics, nutrition, herd management and proper veterinary care. Approximately 48 % of Russia’s milk is produced on private subsidiary plots. Milk production was very profitable from mid 2007 to early 2008. During this time, strong demand increased farmgate prices to 15 rubles/kg. Many large dairy operations took out bank loans to expand their operations as market analysts predicted increasing demand and even higher prices. In April 2008, farm gate prices for raw milk suddenly dropped to 8‐9 rubles/kg due, in part, to season fluctuations. The situation worsened in 2009, when purchase prices were well below production costs. At the same time demand for dairy products is decreasing, pushing prices down further. PROFILE OF SOME OF RUSSIA’S MOST ADVANCED HIGH PRODUCTION DAIRIES Barybino Farms Agro Complex http://www.milkproduction.com/Visit_The_Dairies/europe/Barybino_Farm/default.htm o Located 60 km south‐east of Moscow in the Domodedovsky district. o Milk 3,200 cows (Black and White Holsteins). Average milk yield is 7,000 kg, 4% fat, 3.23% protein,
somatic cell count: 120,000. Three milkings per day. o The largest dairy herd in the Russian Federation with the highest productivity of 6,800 kg/cow (in 1986
it was only 2,600 kg/cow). o 3,150 heifers; 1,800 fattening bulls that are sold for slaughter at 450kg. o Participate in the National Programs "Milk of Moscow area" and "Milk Concept 2010". Under these
programs, Russian dairy producers will produce milk meeting European consumer quality standards. o Average workload per employee in milk production is 40 animals per person. o Milkers receive the highest salaries in the Moscow region. o Feeding stations have corn and grass silage, combicorn, molasses and grain byproducts. o Major protein and energy sources: combicorn, sunflower meal, wheat, barley and corn silage. o All silage, haylage, wheat and barley needs are grown on farm. o Arable land is 9,570 ha: Grain 3,050 ha, yield 12,302 tonnes; Corn silage 1,217 ha, yield 26,143
tonnes; Perennials 4,043 ha, yield 22,269 tonnes; Annuals 907 ha, 17,015 tonnes. o Harvested in 2002: 12,246 tonnes hay, 21,904 tonnes corn silage, 14,428 tonnes hay silage. o Feedstuff reserves for 1.5 years. o Cows are milked in a Herringbone Parlour 2x8 (4 pcs), Herringbone Parlour MidiLine (4 pcs) and a
EuroParallel 2x12 (1 pcs), UNICALA 220 Comfort with "EasyLine" (1 pcs) and UNICALA Standard 200. OOO‐Rozhdestvo http://www.milkproduction.com/Visit_The_Dairies/europe/Rozhdestvo/default.htm o Located in Vladimir Oblast, Petushki Region, Russia. o Breeds: 1,800 Danish Holstein‐Friesians and 285 German Brown Swiss. Over 1,500 head of young stock
for replacements. This brings the total dairy herd to 2,100 head of milking and dry cows and approximately 500 transition heifers.
o Milk production: 8,500 litres of milk per year (28‐30 liters/cow/day). o Milkings per day: 3. o Ship approximately 50 tons of milk each day. All milk is high quality Euro standard and is shipped to
Wim Bill Dann (largest dairy processor in Russia). o Milk fat is 3.7%, protein is 3.46%. o Somatic cell count averages 151,000; Bacteria count is on average less than 10 000.
Capability Assessment of Australian Dairy Technology and Services ‐ AANC Pty Ltd, July 2010
_________________________________________________________________________________________________________ Page 128 of 329
o Cows are fed a TMR ration twice a day. Feed five different rations. o Ration consists of 60% corn silage which is grown on farm. Grass silage, corn, gluten, brewers waste,
soya, minerals, beet pulp, peas, urea and molasses are typical ingredients in rations. o Concentrates are shipped in to complete the mix. o All rations are computer formulated and programmed into a computer chip which is plugged into the
mixer wagon. o A ten member management team and 28 employees working around the clock with the cows. Five
veterinarians on staff, each with separate specialties. o Equipment installed includes: Double 24 and Double 12 parlors with milk meters, transponders,
activity meters, automatic cow brushes, water fountains, manure pumps, cooling tanks, auto wash system, sort gates, crowd gate and automatic manure scrapers.
Dmitrov Dairy Farms (DDF) http://www.milkproduction.com/Visit_The_Dairies/europe/Dmitrov+farm/default.htm o Located 70 km from Moscow. o Ownership: 75% by Russian Farms and 25% by Russian Dairy Farms Inc. o Dmitrov Dairy Farms is 50% financed through equity and 50%through a US bank. o 530 dairy cows (Holstein‐Friesian), with approximately 400 young stock heifers. o Milkings per day: 3. o Milking system: 2x12 Blue Diamond Gang Exit/Gang Index parlour. o Milking parlour is a Double 12 expandable to a Double 20 for when production moves from 900 to
1,200 cows in the near future. o In 2004 the operation sold about 8,000 kgs of milk per cow and is currently averaging 31 to 32 litres
per cow. In 2005, they expected to sell around 9,500 to 10,000 litres per cow. o Rations: Forage components based on 60% corn silage, the remaining 40% being clover and annual
grass haylage. All additional grain based concentrates are purchased as a commercial dairy cow complete mixes.
MAIN DAIRY BREEDS IN RUSSIA FAO Country Pasture/Forage Resource Profiles Russian Federation (approx 2008) http://www.fao.org/ag/AGP/AGPC/doc/Counprof/Russia/russia.htm The main dairy emphasis breeds in Russia are 48–50% Black and White (Holsteins), 20% Red and White (including Simmentals and Sychev), 8% Red (including Red Steppe at 93%), 4% Brown (including Brown Swiss at 78%, Kostromskaya 19%, and Caucasus Brown 3%). Furthermore 7 breeds are used mainly for pure‐bred rearing. Their proportion in the total herd are: 8.4% Holmogorskaya, 3.8% Bestuzhevskaya, 2.7% Ayrshire, and 2.0% Yaroslavskaya breed. In the future, it is planned to increase the proportion of Black and White breeds up to 55%, and in some regions up to 60‐70% to maximise milk yields on farms dedicated to dairy production. In dairy‐beef cattle (dual‐purpose) operations, the main breeds are: Simmental and Brown Swiss, and some dairy breeds (Holsteins, Holmogorskaya, Yaroslavskaya). 7.) Brief overview of major companies with integrated dairy operations
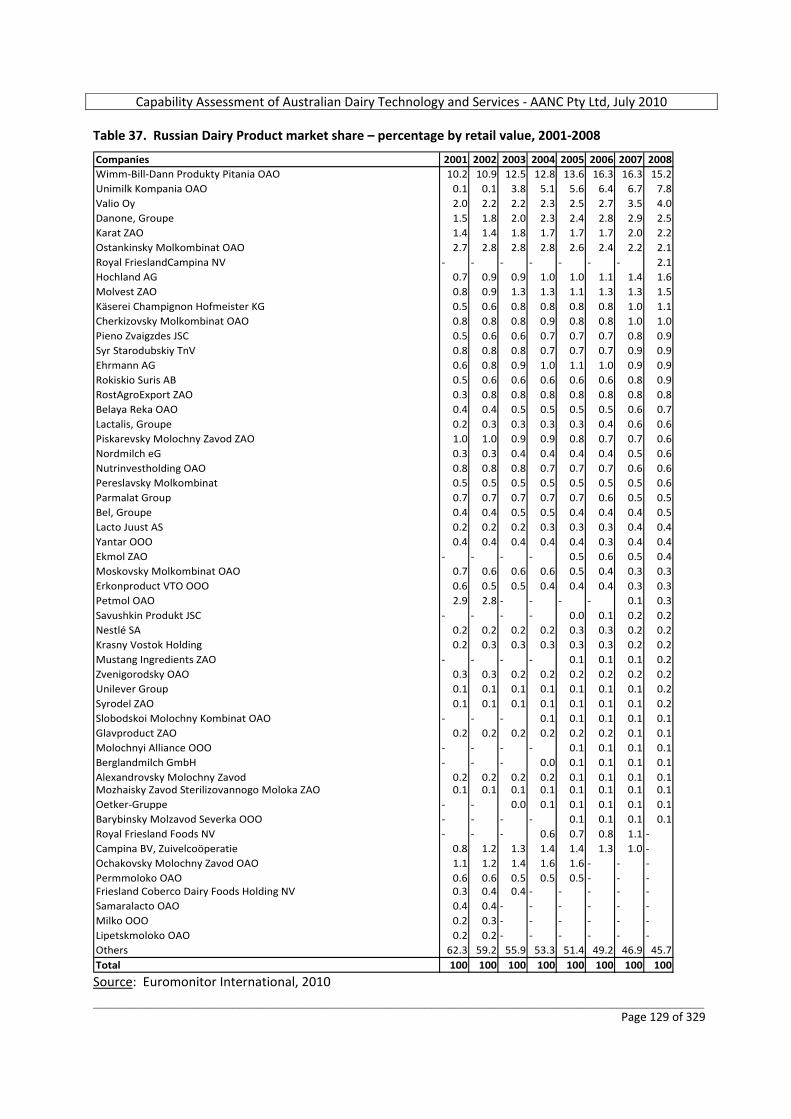
Capability Assessment of Australian Dairy Technology and Services ‐ AANC Pty Ltd, July 2010
_________________________________________________________________________________________________________ Page 129 of 329
Table 37. Russian Dairy Product market share – percentage by retail value, 2001‐2008
Companies 2001 2002 2003 2004 2005 2006 2007 2008Wimm‐Bill‐Dann Produkty Pitania OAO 10.2 10.9 12.5 12.8 13.6 16.3 16.3 15.2Unimilk Kompania OAO 0.1 0.1 3.8 5.1 5.6 6.4 6.7 7.8Valio Oy 2.0 2.2 2.2 2.3 2.5 2.7 3.5 4.0Danone, Groupe 1.5 1.8 2.0 2.3 2.4 2.8 2.9 2.5Karat ZAO 1.4 1.4 1.8 1.7 1.7 1.7 2.0 2.2Ostankinsky Molkombinat OAO 2.7 2.8 2.8 2.8 2.6 2.4 2.2 2.1Royal FrieslandCampina NV ‐ ‐ ‐ ‐ ‐ ‐ ‐ 2.1Hochland AG 0.7 0.9 0.9 1.0 1.0 1.1 1.4 1.6Molvest ZAO 0.8 0.9 1.3 1.3 1.1 1.3 1.3 1.5Käserei Champignon Hofmeister KG 0.5 0.6 0.8 0.8 0.8 0.8 1.0 1.1Cherkizovsky Molkombinat OAO 0.8 0.8 0.8 0.9 0.8 0.8 1.0 1.0Pieno Zvaigzdes JSC 0.5 0.6 0.6 0.7 0.7 0.7 0.8 0.9Syr Starodubskiy TnV 0.8 0.8 0.8 0.7 0.7 0.7 0.9 0.9Ehrmann AG 0.6 0.8 0.9 1.0 1.1 1.0 0.9 0.9Rokiskio Suris AB 0.5 0.6 0.6 0.6 0.6 0.6 0.8 0.9RostAgroExport ZAO 0.3 0.8 0.8 0.8 0.8 0.8 0.8 0.8Belaya Reka OAO 0.4 0.4 0.5 0.5 0.5 0.5 0.6 0.7Lactalis, Groupe 0.2 0.3 0.3 0.3 0.3 0.4 0.6 0.6Piskarevsky Molochny Zavod ZAO 1.0 1.0 0.9 0.9 0.8 0.7 0.7 0.6Nordmilch eG 0.3 0.3 0.4 0.4 0.4 0.4 0.5 0.6Nutrinvestholding OAO 0.8 0.8 0.8 0.7 0.7 0.7 0.6 0.6Pereslavsky Molkombinat 0.5 0.5 0.5 0.5 0.5 0.5 0.5 0.6Parmalat Group 0.7 0.7 0.7 0.7 0.7 0.6 0.5 0.5Bel, Groupe 0.4 0.4 0.5 0.5 0.4 0.4 0.4 0.5Lacto Juust AS 0.2 0.2 0.2 0.3 0.3 0.3 0.4 0.4Yantar OOO 0.4 0.4 0.4 0.4 0.4 0.3 0.4 0.4Ekmol ZAO ‐ ‐ ‐ ‐ 0.5 0.6 0.5 0.4Moskovsky Molkombinat OAO 0.7 0.6 0.6 0.6 0.5 0.4 0.3 0.3Erkonproduct VTO OOO 0.6 0.5 0.5 0.4 0.4 0.4 0.3 0.3Petmol OAO 2.9 2.8 ‐ ‐ ‐ ‐ 0.1 0.3Savushkin Produkt JSC ‐ ‐ ‐ ‐ 0.0 0.1 0.2 0.2Nestlé SA 0.2 0.2 0.2 0.2 0.3 0.3 0.2 0.2Krasny Vostok Holding 0.2 0.3 0.3 0.3 0.3 0.3 0.2 0.2Mustang Ingredients ZAO ‐ ‐ ‐ ‐ 0.1 0.1 0.1 0.2Zvenigorodsky OAO 0.3 0.3 0.2 0.2 0.2 0.2 0.2 0.2Unilever Group 0.1 0.1 0.1 0.1 0.1 0.1 0.1 0.2Syrodel ZAO 0.1 0.1 0.1 0.1 0.1 0.1 0.1 0.2Slobodskoi Molochny Kombinat OAO ‐ ‐ ‐ 0.1 0.1 0.1 0.1 0.1Glavproduct ZAO 0.2 0.2 0.2 0.2 0.2 0.2 0.1 0.1Molochnyi Alliance OOO ‐ ‐ ‐ ‐ 0.1 0.1 0.1 0.1Berglandmilch GmbH ‐ ‐ ‐ 0.0 0.1 0.1 0.1 0.1Alexandrovsky Molochny Zavod 0.2 0.2 0.2 0.2 0.1 0.1 0.1 0.1Mozhaisky Zavod Sterilizovannogo Moloka ZAO 0.1 0.1 0.1 0.1 0.1 0.1 0.1 0.1Oetker‐Gruppe ‐ ‐ 0.0 0.1 0.1 0.1 0.1 0.1Barybinsky Molzavod Severka OOO ‐ ‐ ‐ ‐ 0.1 0.1 0.1 0.1Royal Friesland Foods NV ‐ ‐ ‐ 0.6 0.7 0.8 1.1 ‐Campina BV, Zuivelcoöperatie 0.8 1.2 1.3 1.4 1.4 1.3 1.0 ‐Ochakovsky Molochny Zavod OAO 1.1 1.2 1.4 1.6 1.6 ‐ ‐ ‐Permmoloko OAO 0.6 0.6 0.5 0.5 0.5 ‐ ‐ ‐Friesland Coberco Dairy Foods Holding NV 0.3 0.4 0.4 ‐ ‐ ‐ ‐ ‐Samaralacto OAO 0.4 0.4 ‐ ‐ ‐ ‐ ‐ ‐Milko OOO 0.2 0.3 ‐ ‐ ‐ ‐ ‐ ‐Lipetskmoloko OAO 0.2 0.2 ‐ ‐ ‐ ‐ ‐ ‐Others 62.3 59.2 55.9 53.3 51.4 49.2 46.9 45.7Total 100 100 100 100 100 100 100 100 Source: Euromonitor International, 2010
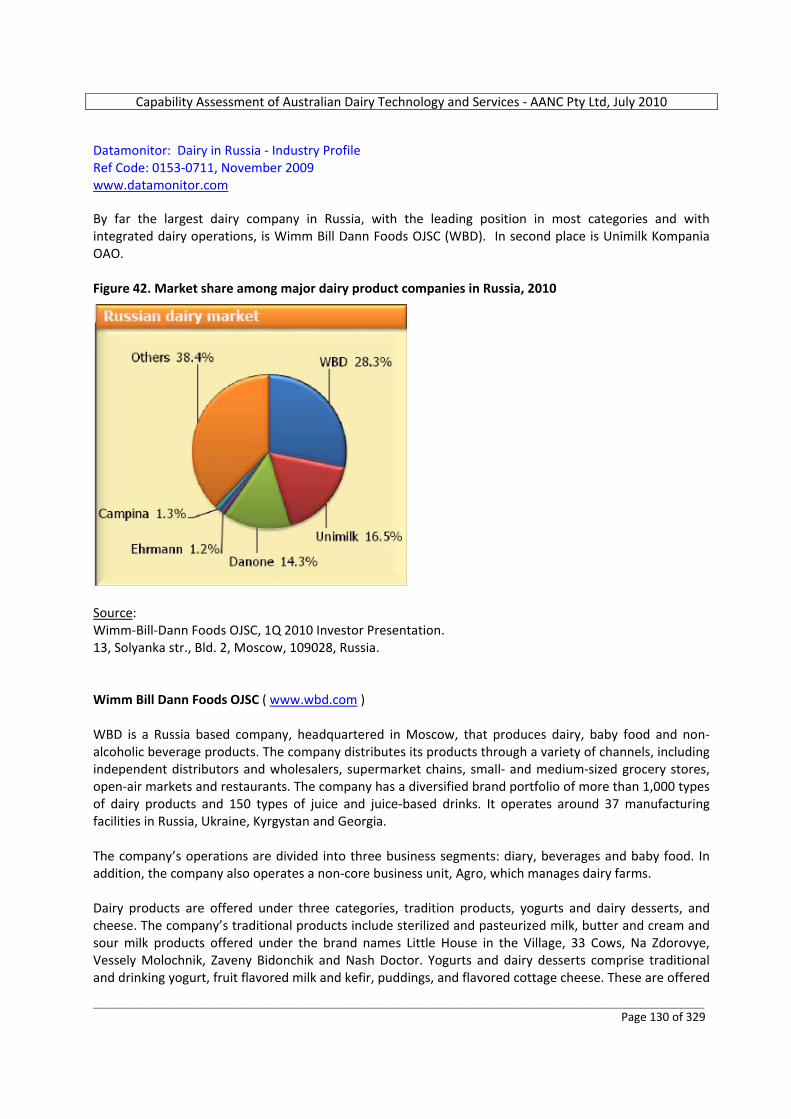
Capability Assessment of Australian Dairy Technology and Services ‐ AANC Pty Ltd, July 2010
_________________________________________________________________________________________________________ Page 130 of 329
Datamonitor: Dairy in Russia ‐ Industry Profile Ref Code: 0153‐0711, November 2009 www.datamonitor.com By far the largest dairy company in Russia, with the leading position in most categories and with integrated dairy operations, is Wimm Bill Dann Foods OJSC (WBD). In second place is Unimilk Kompania OAO. Figure 42. Market share among major dairy product companies in Russia, 2010
Source: Wimm‐Bill‐Dann Foods OJSC, 1Q 2010 Investor Presentation. 13, Solyanka str., Bld. 2, Moscow, 109028, Russia. Wimm Bill Dann Foods OJSC ( www.wbd.com ) WBD is a Russia based company, headquartered in Moscow, that produces dairy, baby food and non‐alcoholic beverage products. The company distributes its products through a variety of channels, including independent distributors and wholesalers, supermarket chains, small‐ and medium‐sized grocery stores, open‐air markets and restaurants. The company has a diversified brand portfolio of more than 1,000 types of dairy products and 150 types of juice and juice‐based drinks. It operates around 37 manufacturing facilities in Russia, Ukraine, Kyrgystan and Georgia. The company’s operations are divided into three business segments: diary, beverages and baby food. In addition, the company also operates a non‐core business unit, Agro, which manages dairy farms. Dairy products are offered under three categories, tradition products, yogurts and dairy desserts, and cheese. The company’s traditional products include sterilized and pasteurized milk, butter and cream and sour milk products offered under the brand names Little House in the Village, 33 Cows, Na Zdorovye, Vessely Molochnik, Zaveny Bidonchik and Nash Doctor. Yogurts and dairy desserts comprise traditional and drinking yogurt, fruit flavored milk and kefir, puddings, and flavored cottage cheese. These are offered
Capability Assessment of Australian Dairy Technology and Services ‐ AANC Pty Ltd, July 2010
_________________________________________________________________________________________________________ Page 131 of 329
under the brand names Bio‐Max, Chudo, Frugurt and Lada. Cheese products include hard yellow and processed cheese, under Lamber, and Vesley Molochnik brand names. WBD generated revenues of $2.8 billion in the financial year ended December 2008, an increase of 15.8% compared to the previous year. The dairy segment accounted for 74.2 % of total revenues generated in FY2008. Revenues from the dairy segment reached $2.1 billion in FY2008, an increase of 13.1 % compared to FY2007. Unimilk Kompania OAO ( www.unimilk.ru ) Unimilk is the second largest dairy company in Russia. The company produces dairy products and baby foods, which are sold in Russia, Kazakhstan and Ukraine. The company is headquartered in Moscow, employs around 14,000 people, owns 31 plants, and processes 1,620 million liters of milk annually. It distributes its products through more than 40,000 retail and chain stores in Russia, and sells to more than 7,500 customers in 70 regions of Russia. Unimilk’s brands include Aktual, Bio Balance, Prostokvashino, Tema, Letnii Den, Celo Lugovoe and Petmol. Furthermore, Unimilk produces a wide range of products for cooking, such as cream, sour cream, vegetable cream and other products. It also produces a range of dairy food ingredients, such as dried whole milk, skimmed milk, dry whey and butter. Austrade Office, Moscow: Another large company is Russian Farms ( www.rusfarms.ru ) There are a few regional players that have a farm and a processing facility with processing capacities between 200 – 300 – 400 tonnes of milk per day. They have their own farms and out source milk as well. Some examples are: o Stolitsa Moloka (Altai region), o Molvest (Voronezh), o Velikoluksky Dairy Plant (Velikie Luki). The largest milk producer is Krasny Vostok – Agro (KV – Agro). 8.) Availability of forage and raw materials for feed & nutrition FAO Country Pasture/Forage Resource Profiles Russian Federation (approx 2008) http://www.fao.org/ag/AGP/AGPC/doc/Counprof/Russia/russia.htm Due to its vast size Russia has many landscapes, climatic and soil zones and rich flora and fauna. Forests occupy almost half of its territory ‐ 45%, water – 4%, agricultural land – 13%, deer pastures – 19%, the remainder – 19%. About 70% of its territory is occupied by vast plains. Russia is in a risky zone for farming, as the average soil fertility level is low. Moreover, great damage is caused by anthropic factors. Russia’s agricultural land is about 200 million hectares, including over 120 million ha arable, about 2 million ha of fallow, 2 million ha of perennial crops, and over 87 million ha of permanent meadows and pastures. Russia's far northern location and harsh climate causes most of the area to be unsuitable for crop production. Most rain‐fed agricultural activities are located between 40 degrees N and 60 degrees N
Capability Assessment of Australian Dairy Technology and Services ‐ AANC Pty Ltd, July 2010
_________________________________________________________________________________________________________ Page 132 of 329
latitude. The transitional seasons of autumn and spring here are short, creating a brief window of opportunity for crop seeding and harvest. Higher latitudes are associated with long, cold winters, and short, hot summers that limit the growing season. The important agricultural regions of black soil lands are forest‐steppe and steppe zones of European Russia. Farms mainly produce grain, Beta vulgaris var. altissima, Helianthus here; 60‐80% of land is arable. Forage crops cover 25% of sown land. Management of soil protection and erosion control has lead to a reduction of bare fallow and row crops and the retention of more perennial grassland. Perennial pasture is generally 50% of slopes in soil protection crop rotation strips. Dairy cattle raising is mainly concentrated in the forest zone of European Russia and to a lesser extent in Asian Russia. Most farms have feeding systems based on native and sown pastures. In spring, before the pasture is ready for grazing, cattle are given green chop from winter crops. In autumn cattle graze on the aftermath of perennial grasses on arable land, or eat green chop transported and distributed to troughs. Some farms prefer stall summer maintenance of dairy herds with walk‐in pens, feeding green chop on a "cut‐and‐carry" system with different forage crops, including forage from grassland. Such a system is used on farms with high cattle concentrations. Dairy farms with native pastures far from cowsheds set up summer camps with milking equipment, electricity supply and sheds. However, pasture establishment close to cowsheds has big advantages in comparison with summer camps. Nevertheless, it is economically feasible to use remote pastures for rearing replacement young stock. Russian grain production outlook, 2010 USDA Foreign Agricultural Service. Global Agricultural Information Network. GAIN Report Number: RS1022. Date 4/9/2010 Russian Federation – Grain and Feed Annual. Assuming normal weather conditions, total grain production in marketing year 2010 is forecast to decrease by 2 million metric tons (MMT) to 95 MMT, due to a decrease in area sown to spring wheat, Russia’s major grain crop. Still, this will be the third largest grain crop in the last 16 years. Production of wheat is forecast to decrease from 62 MMT in MY 2009 to 59 MMT. The reduction in spring area may be caused by low domestic wheat prices and farmers’ expected switch to energy and protein rich fodder crops, such as corn, triticale, legumes, soybeans, rapeseeds. Given that sunflower seeds gave farmers more stable income than grain in the last two years, farmers may also increase area sown to sunflower seeds at the expense of wheat. However, grain yields are expected to be close to the 5‐year average. The majority of Russian farms’ harvests still depend on weather more than on other factors. Barley production is forecast to decrease by 2% to 18 MMT, while corn production might increase by 29% to 5 MMT. Grain exports are forecast at 20 MMT, 1 MMT more than in MY 2009. The increase in exports may be attributed to the state owned United Grain Company’s export of intervention stocks. Grain carry‐over stocks by the end of the year are forecast at 14 MMT, 3 MMT lower than at the beginning of year, but still high enough to keep domestic grain prices low. This situation augers well for there being sufficient stockfeed grade grains and grain by‐products, such as wheat bran and pollard, for the important purpose of supplementing the diets of high producing dairy cows in Russia. Without significant grain based supplements (such as 4 – 5 kg/cow/day), milk yields from pasture, forage or silage alone cannot be expected to exceed levels in the order of 3,000 – 4,000 kg per cow per lactation. There is commonly a 3:1 return in milk from the feeding of grain based concentrates to genetically advanced dairy cows.
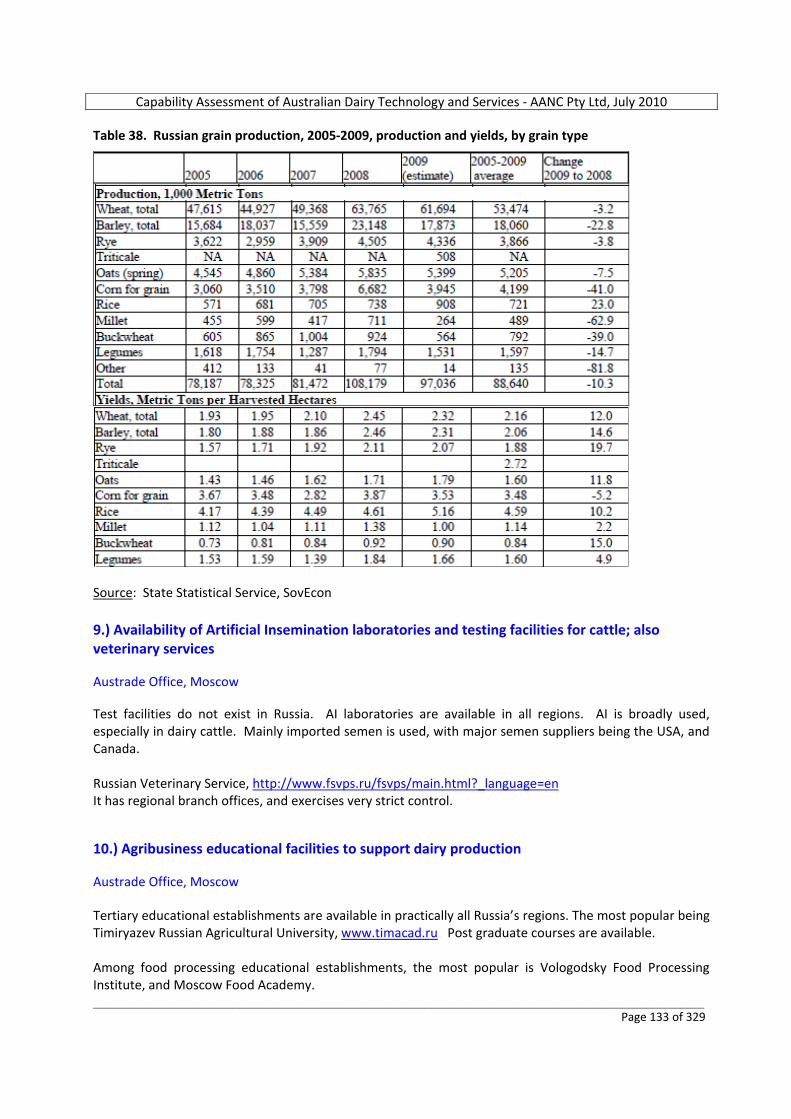
Capability Assessment of Australian Dairy Technology and Services ‐ AANC Pty Ltd, July 2010
_________________________________________________________________________________________________________ Page 133 of 329
Table 38. Russian grain production, 2005‐2009, production and yields, by grain type
Source: State Statistical Service, SovEcon 9.) Availability of Artificial Insemination laboratories and testing facilities for cattle; also veterinary services Austrade Office, Moscow Test facilities do not exist in Russia. AI laboratories are available in all regions. AI is broadly used, especially in dairy cattle. Mainly imported semen is used, with major semen suppliers being the USA, and Canada. Russian Veterinary Service, http://www.fsvps.ru/fsvps/main.html?_language=en It has regional branch offices, and exercises very strict control. 10.) Agribusiness educational facilities to support dairy production Austrade Office, Moscow Tertiary educational establishments are available in practically all Russia’s regions. The most popular being Timiryazev Russian Agricultural University, www.timacad.ru Post graduate courses are available. Among food processing educational establishments, the most popular is Vologodsky Food Processing Institute, and Moscow Food Academy.
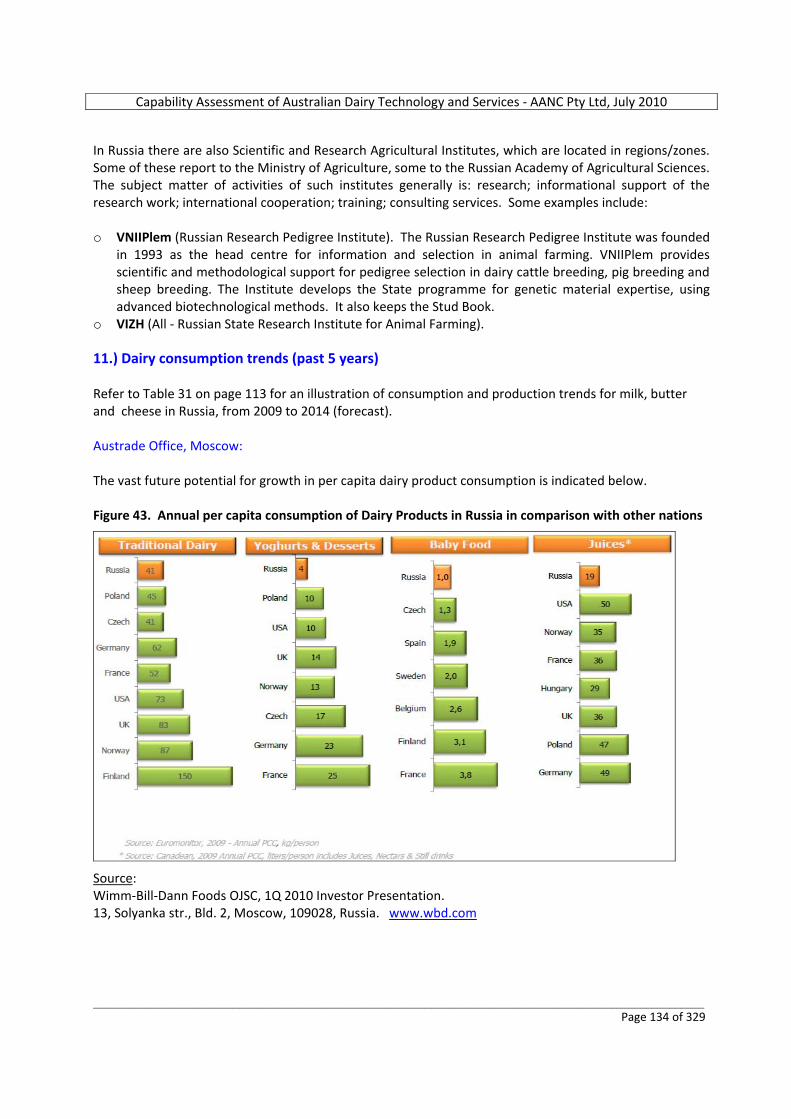
Capability Assessment of Australian Dairy Technology and Services ‐ AANC Pty Ltd, July 2010
_________________________________________________________________________________________________________ Page 134 of 329
In Russia there are also Scientific and Research Agricultural Institutes, which are located in regions/zones. Some of these report to the Ministry of Agriculture, some to the Russian Academy of Agricultural Sciences. The subject matter of activities of such institutes generally is: research; informational support of the research work; international cooperation; training; consulting services. Some examples include: o VNIIPlem (Russian Research Pedigree Institute). The Russian Research Pedigree Institute was founded
in 1993 as the head centre for information and selection in animal farming. VNIIPlem provides scientific and methodological support for pedigree selection in dairy cattle breeding, pig breeding and sheep breeding. The Institute develops the State programme for genetic material expertise, using advanced biotechnological methods. It also keeps the Stud Book.
o VIZH (All ‐ Russian State Research Institute for Animal Farming).
11.) Dairy consumption trends (past 5 years) Refer to Table 31 on page 113 for an illustration of consumption and production trends for milk, butter and cheese in Russia, from 2009 to 2014 (forecast). Austrade Office, Moscow: The vast future potential for growth in per capita dairy product consumption is indicated below. Figure 43. Annual per capita consumption of Dairy Products in Russia in comparison with other nations
Source: Wimm‐Bill‐Dann Foods OJSC, 1Q 2010 Investor Presentation. 13, Solyanka str., Bld. 2, Moscow, 109028, Russia. www.wbd.com
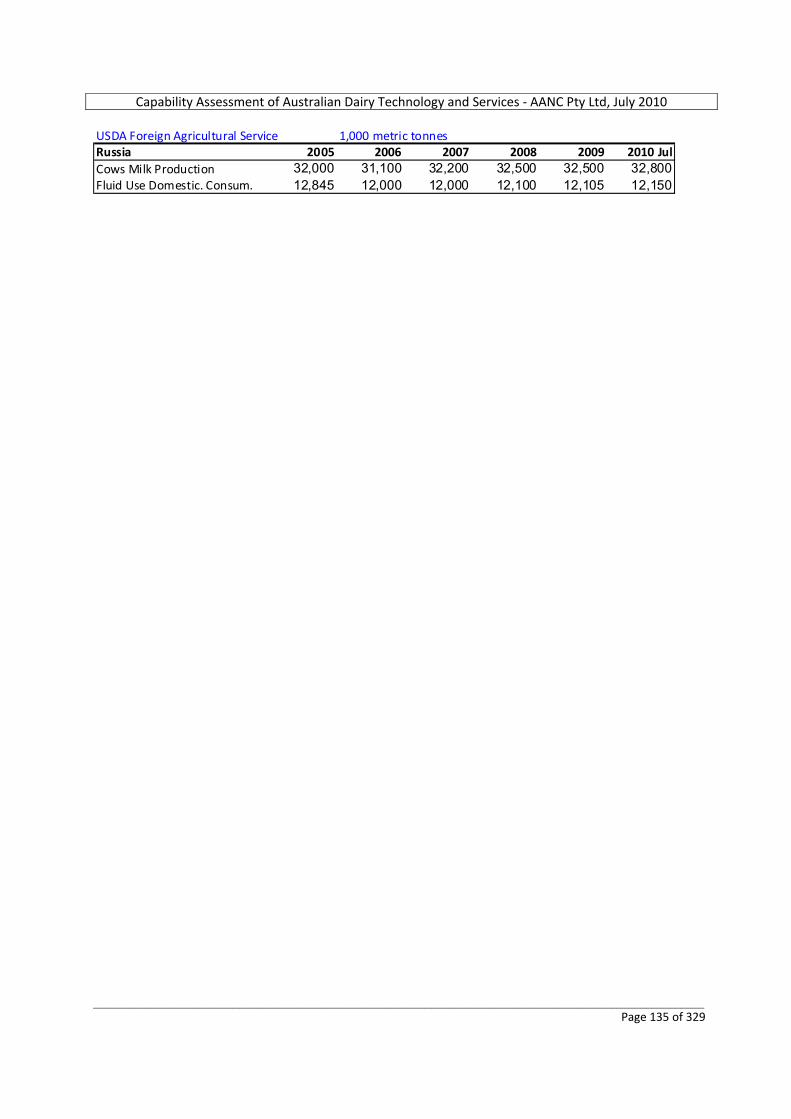
Capability Assessment of Australian Dairy Technology and Services ‐ AANC Pty Ltd, July 2010
_________________________________________________________________________________________________________ Page 135 of 329
USDA Foreign Agricultural Service 1,000 metric tonnesRussia 2005 2006 2007 2008 2009 2010 JulCows Milk Production 32,000 31,100 32,200 32,500 32,500 32,800Fluid Use Domestic. Consum. 12,845 12,000 12,000 12,100 12,105 12,150
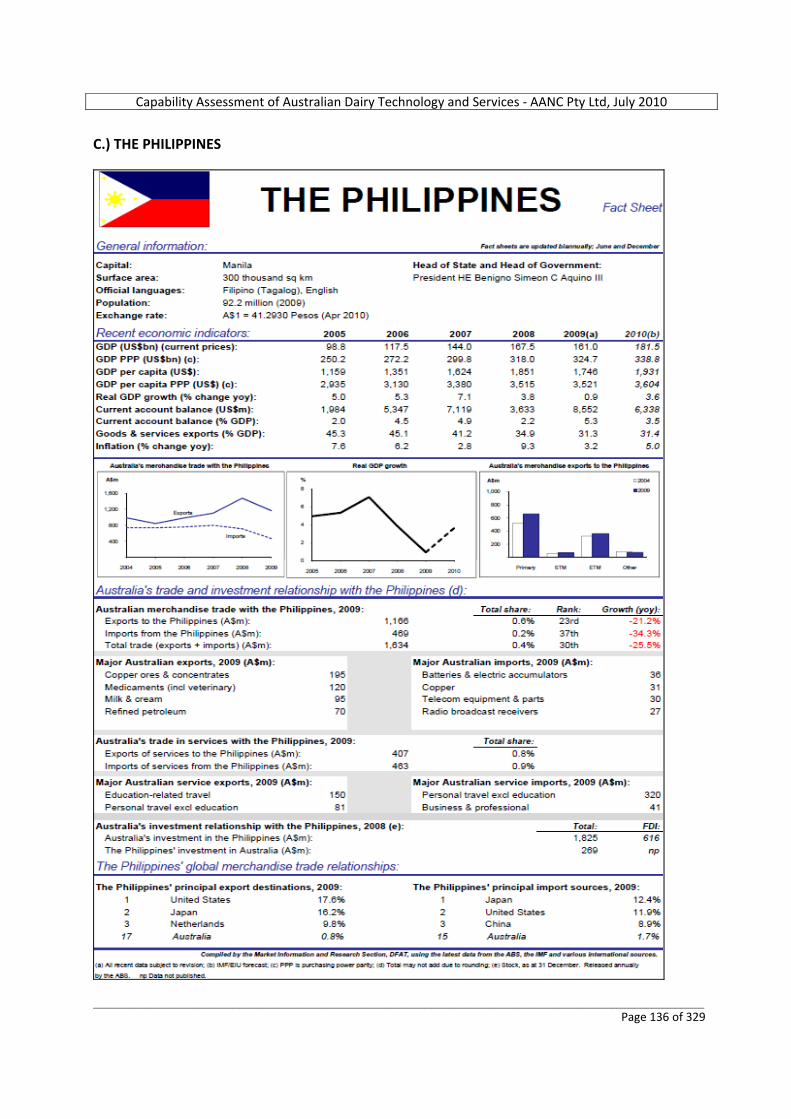
Capability Assessment of Australian Dairy Technology and Services ‐ AANC Pty Ltd, July 2010
_________________________________________________________________________________________________________ Page 136 of 329
C.) THE PHILIPPINES
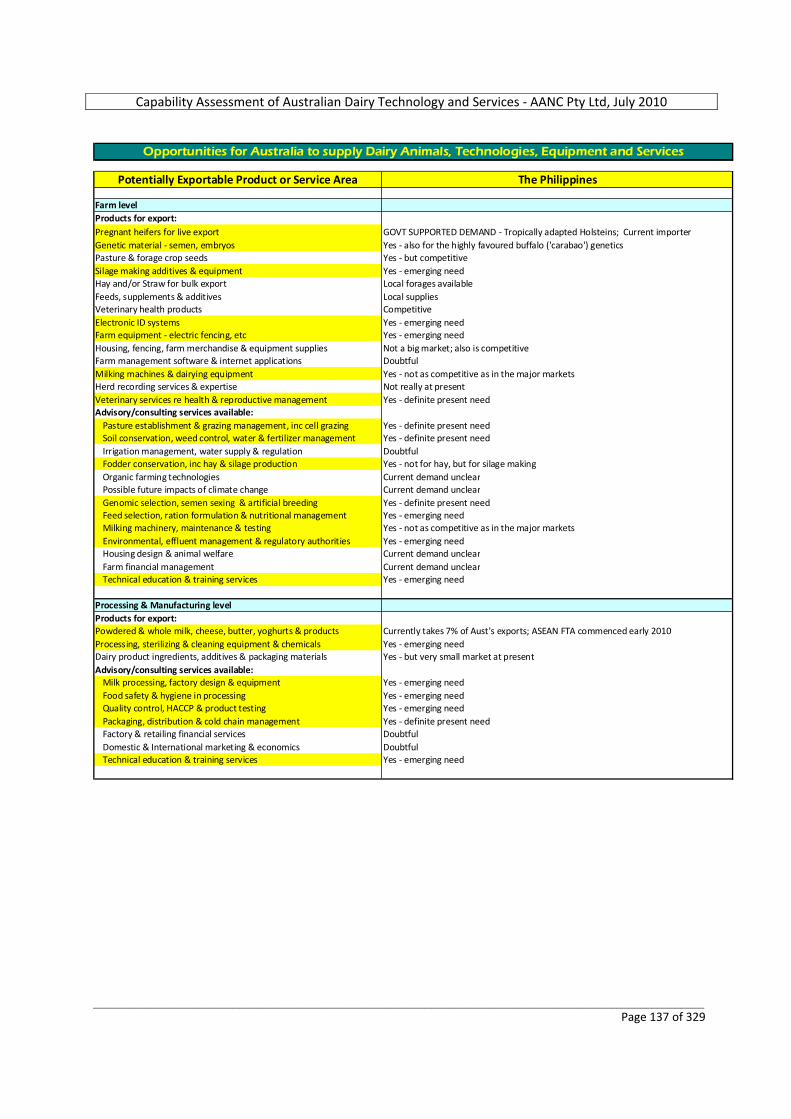
Capability Assessment of Australian Dairy Technology and Services ‐ AANC Pty Ltd, July 2010
_________________________________________________________________________________________________________ Page 137 of 329
Potentially Exportable Product or Service Area The Philippines
Farm levelProducts for export:Pregnant heifers for live export GOVT SUPPORTED DEMAND ‐ Tropically adapted Holsteins; Current importerGenetic material ‐ semen, embryos Yes ‐ also for the highly favoured buffalo ('carabao') geneticsPasture & forage crop seeds Yes ‐ but competitiveSilage making additives & equipment Yes ‐ emerging needHay and/or Straw for bulk export Local forages availableFeeds, supplements & additives Local suppliesVeterinary health products CompetitiveElectronic ID systems Yes ‐ emerging needFarm equipment ‐ electric fencing, etc Yes ‐ emerging needHousing, fencing, farm merchandise & equipment supplies Not a big market; also is competitiveFarm management software & internet applications DoubtfulMilking machines & dairying equipment Yes ‐ not as competitive as in the major marketsHerd recording services & expertise Not really at presentVeterinary services re health & reproductive management Yes ‐ definite present needAdvisory/consulting services available:
Pasture establishment & grazing management, inc cell grazing Yes ‐ definite present needSoil conservation, weed control, water & fertilizer management Yes ‐ definite present needIrrigation management, water supply & regulation DoubtfulFodder conservation, inc hay & silage production Yes ‐ not for hay, but for silage makingOrganic farming technologies Current demand unclearPossible future impacts of climate change Current demand unclearGenomic selection, semen sexing & artificial breeding Yes ‐ definite present needFeed selection, ration formulation & nutritional management Yes ‐ emerging needMilking machinery, maintenance & testing Yes ‐ not as competitive as in the major marketsEnvironmental, effluent management & regulatory authorities Yes ‐ emerging needHousing design & animal welfare Current demand unclearFarm financial management Current demand unclearTechnical education & training services Yes ‐ emerging need
Processing & Manufacturing levelProducts for export:Powdered & whole milk, cheese, butter, yoghurts & products Currently takes 7% of Aust's exports; ASEAN FTA commenced early 2010Processing, sterilizing & cleaning equipment & chemicals Yes ‐ emerging needDairy product ingredients, additives & packaging materials Yes ‐ but very small market at present Advisory/consulting services available:
Milk processing, factory design & equipment Yes ‐ emerging needFood safety & hygiene in processing Yes ‐ emerging needQuality control, HACCP & product testing Yes ‐ emerging needPackaging, distribution & cold chain management Yes ‐ definite present needFactory & retailing financial services DoubtfulDomestic & International marketing & economics DoubtfulTechnical education & training services Yes ‐ emerging need
Opportunities for Australia to supply Dairy Animals, Technologies, Equipment and Services
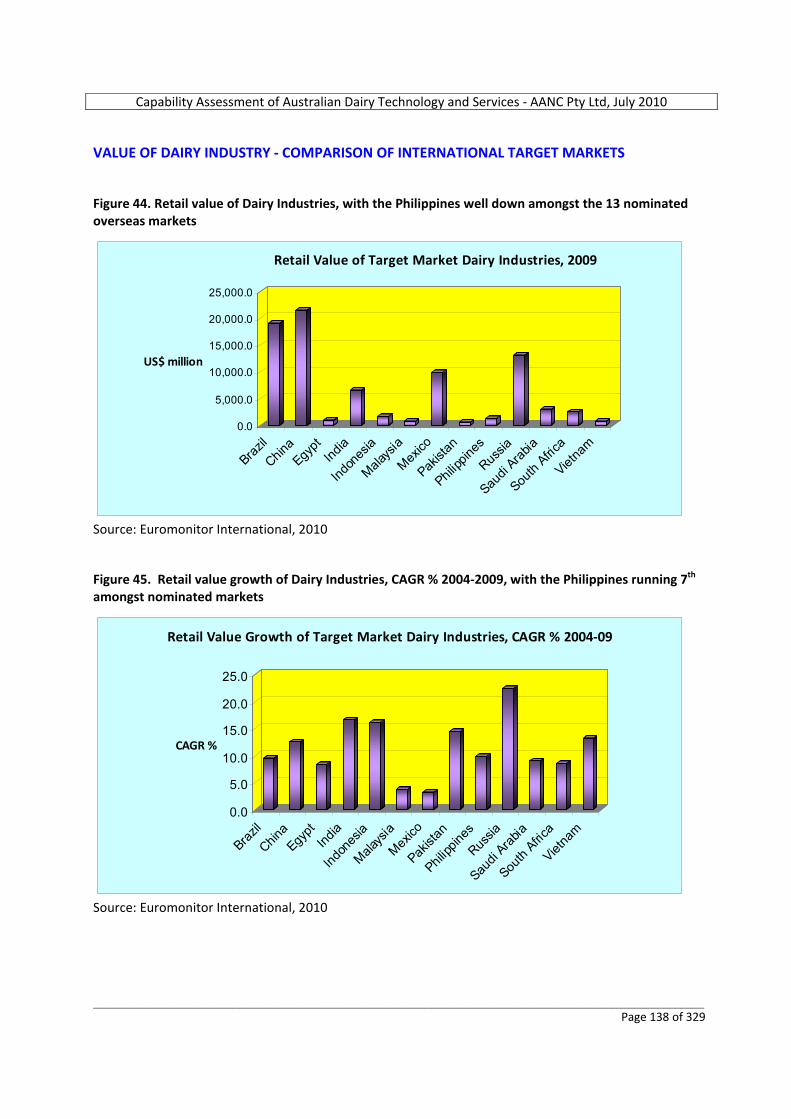
Capability Assessment of Australian Dairy Technology and Services ‐ AANC Pty Ltd, July 2010
_________________________________________________________________________________________________________ Page 138 of 329
VALUE OF DAIRY INDUSTRY ‐ COMPARISON OF INTERNATIONAL TARGET MARKETS Figure 44. Retail value of Dairy Industries, with the Philippines well down amongst the 13 nominated overseas markets
0.0
5,000.0
10,000.0
15,000.0
20,000.0
25,000.0
US$ million
Brazil
China
Egypt
India
Indon
esia
Malays
ia
Mexico
Pakist
an
Philipp
ines
Russia
Saudi
Arabia
South
Africa
Vietna
m
Retail Value of Target Market Dairy Industries, 2009
Source: Euromonitor International, 2010 Figure 45. Retail value growth of Dairy Industries, CAGR % 2004‐2009, with the Philippines running 7th amongst nominated markets
0.0
5.0
10.0
15.0
20.0
25.0
CAGR %
Brazil
China
Egypt
India
Indon
esia
Malays
ia
Mexico
Pakist
an
Philipp
ines
Russia
Saudi
Arabia
South
Africa
Vietna
m
Retail Value Growth of Target Market Dairy Industries, CAGR % 2004‐09
Source: Euromonitor International, 2010
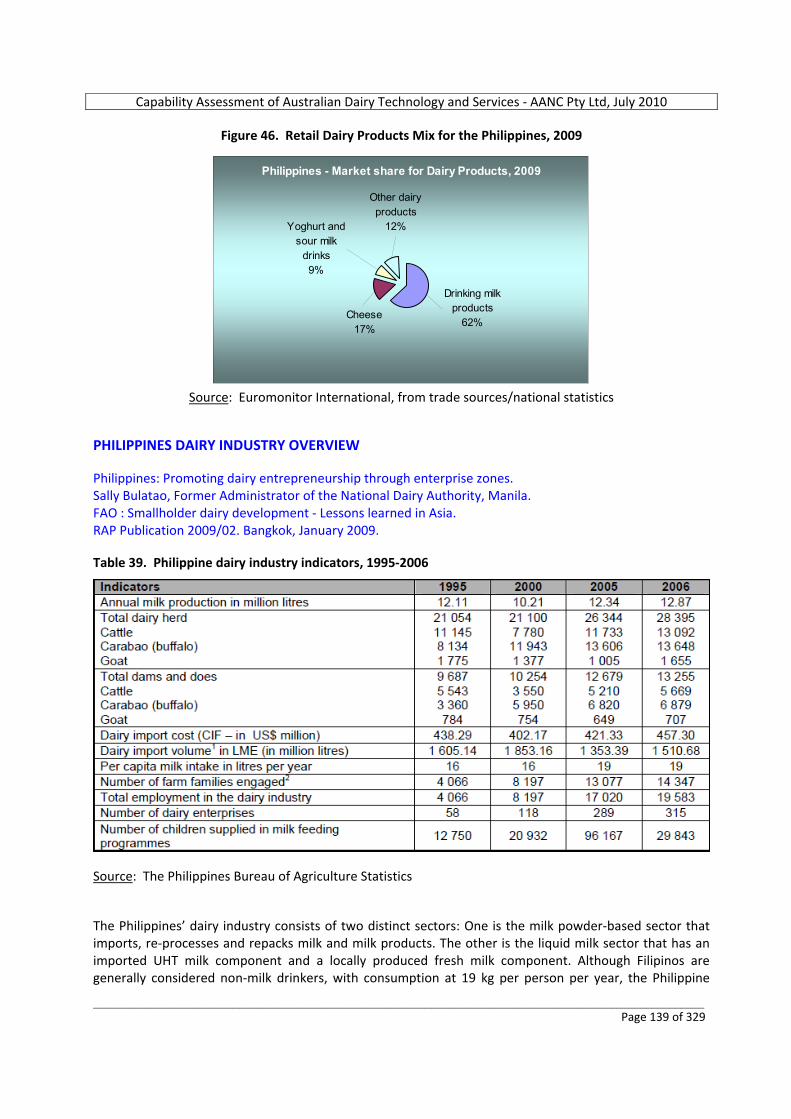
Capability Assessment of Australian Dairy Technology and Services ‐ AANC Pty Ltd, July 2010
_________________________________________________________________________________________________________ Page 139 of 329
Figure 46. Retail Dairy Products Mix for the Philippines, 2009
Philippines - Market share for Dairy Products, 2009
Other dairy products
12%Yoghurt and sour milk
drinks9%
Cheese17%
Drinking milk products
62%
Source: Euromonitor International, from trade sources/national statistics
PHILIPPINES DAIRY INDUSTRY OVERVIEW Philippines: Promoting dairy entrepreneurship through enterprise zones. Sally Bulatao, Former Administrator of the National Dairy Authority, Manila. FAO : Smallholder dairy development ‐ Lessons learned in Asia. RAP Publication 2009/02. Bangkok, January 2009. Table 39. Philippine dairy industry indicators, 1995‐2006
Source: The Philippines Bureau of Agriculture Statistics The Philippines’ dairy industry consists of two distinct sectors: One is the milk powder‐based sector that imports, re‐processes and repacks milk and milk products. The other is the liquid milk sector that has an imported UHT milk component and a locally produced fresh milk component. Although Filipinos are generally considered non‐milk drinkers, with consumption at 19 kg per person per year, the Philippine

Capability Assessment of Australian Dairy Technology and Services ‐ AANC Pty Ltd, July 2010
_________________________________________________________________________________________________________ Page 140 of 329
dairy market, including the market for imported milk, generates more than US$1 billion in revenues annually. Some 44 % of the demand for milk is concentrated in Metro Manila. Table 40. Market shares in the Philippine Dairy Products market
As shown above, the two players in the dairy market – the importer/re‐processors and the local producer/processors – are very distinct from each other. The importing sector is dominated by thrree importer/re‐processors that accounted for 55 % of total imports in 2006. More than 80 % of milk product imports is in powder form. This data is supported by the Philippines News Agency, which states on 28 April 2010, “Dairy producers report hike in local milk production”, that the Philippines imports 99 % of the milk it consumes.
o 45 % of imports come from New Zealand, o 17 % from Australia, o 15 % from the USA, o 3 % from the Netherlands.
Business Monitor International (BMI) Philippines: Agribusiness Report, Q3 2010, Including 5‐year forecasts to 2014, May, 2010 Dairy Industry Summary Current domestic dairy production in the Philippines is minuscule, with the industry being heavily reliant on imports which account for around 99% of demand. Dairy products are the Philippines' second most significant agricultural import after wheat. During 2010, BMI expect production to expand by 3% year‐on‐year to 15,460 tonnes. There is no significant domestic production of milk powder or butter, but in 2008 2,000 tonnes of cheese was produced in the country. In 2008, 49% of milk produced came from cattle, 48% from carabao (buffalo) and 3% from goats. Plans are underway to expand production, and BMI forecast growth in milk production of 38.4% to 2014 to reach 20,760 tonnes. Despite this healthy growth rate, BMI’s forecast still lags a long way behind the government's ambitious aims for expanding production under the 2008‐2030 National Dairy Development Plan. By 2015, the plan is targeting milk production of 71.08 million litres (approximately 73,190 tonnes). With this figure more than doubling to 153.86 million litres (158,430 tonnes) in 2020 and then reaching 647.83 million litres (667,100 tonnes) in 2030. While BMI expect strong growth in dairy production from its current low base, they do not see these targets as realistic. Despite the current, low consumption levels, the Philippines' large and fast‐growing population offers plenty of opportunities for dairy producers, particularly in urban centres where most of the consumption growth is likely to be centred.
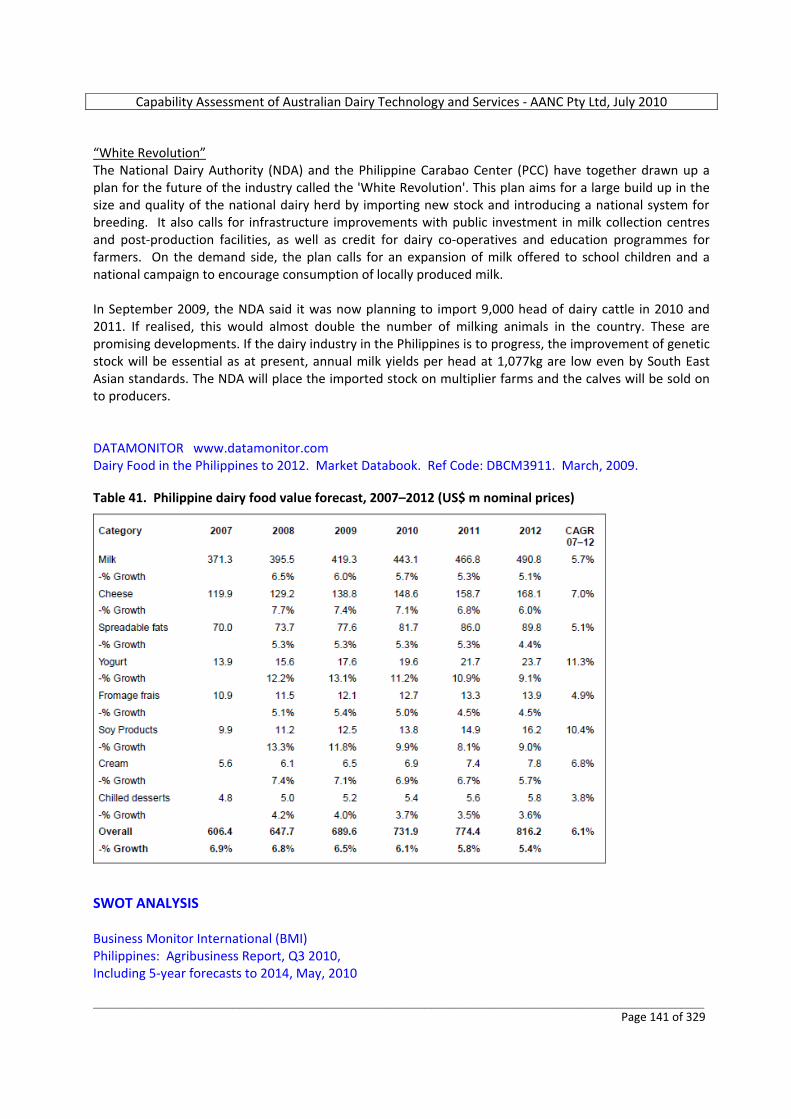
Capability Assessment of Australian Dairy Technology and Services ‐ AANC Pty Ltd, July 2010
_________________________________________________________________________________________________________ Page 141 of 329
“White Revolution” The National Dairy Authority (NDA) and the Philippine Carabao Center (PCC) have together drawn up a plan for the future of the industry called the 'White Revolution'. This plan aims for a large build up in the size and quality of the national dairy herd by importing new stock and introducing a national system for breeding. It also calls for infrastructure improvements with public investment in milk collection centres and post‐production facilities, as well as credit for dairy co‐operatives and education programmes for farmers. On the demand side, the plan calls for an expansion of milk offered to school children and a national campaign to encourage consumption of locally produced milk. In September 2009, the NDA said it was now planning to import 9,000 head of dairy cattle in 2010 and 2011. If realised, this would almost double the number of milking animals in the country. These are promising developments. If the dairy industry in the Philippines is to progress, the improvement of genetic stock will be essential as at present, annual milk yields per head at 1,077kg are low even by South East Asian standards. The NDA will place the imported stock on multiplier farms and the calves will be sold on to producers. DATAMONITOR www.datamonitor.com Dairy Food in the Philippines to 2012. Market Databook. Ref Code: DBCM3911. March, 2009. Table 41. Philippine dairy food value forecast, 2007–2012 (US$ m nominal prices)
SWOT ANALYSIS Business Monitor International (BMI) Philippines: Agribusiness Report, Q3 2010, Including 5‐year forecasts to 2014, May, 2010
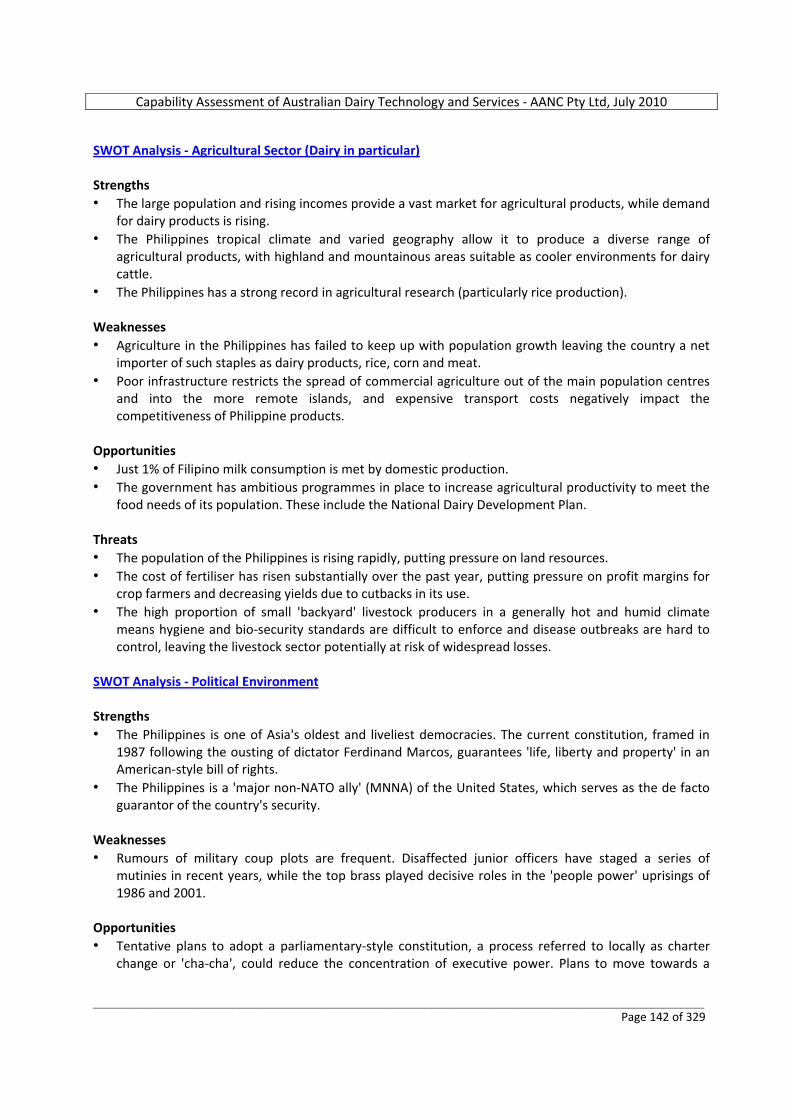
Capability Assessment of Australian Dairy Technology and Services ‐ AANC Pty Ltd, July 2010
_________________________________________________________________________________________________________ Page 142 of 329
SWOT Analysis ‐ Agricultural Sector (Dairy in particular) Philippines Agricultural SWOT Strengths • The large population and rising incomes provide a vast market for agricultural products, while demand
for dairy products is rising. • The Philippines tropical climate and varied geography allow it to produce a diverse range of
agricultural products, with highland and mountainous areas suitable as cooler environments for dairy cattle.
• The Philippines has a strong record in agricultural research (particularly rice production). Weaknesses • Agriculture in the Philippines has failed to keep up with population growth leaving the country a net
importer of such staples as dairy products, rice, corn and meat. • Poor infrastructure restricts the spread of commercial agriculture out of the main population centres
and into the more remote islands, and expensive transport costs negatively impact the competitiveness of Philippine products.
Opportunities • Just 1% of Filipino milk consumption is met by domestic production. • The government has ambitious programmes in place to increase agricultural productivity to meet the
food needs of its population. These include the National Dairy Development Plan. Threats • The population of the Philippines is rising rapidly, putting pressure on land resources. • The cost of fertiliser has risen substantially over the past year, putting pressure on profit margins for
crop farmers and decreasing yields due to cutbacks in its use. • The high proportion of small 'backyard' livestock producers in a generally hot and humid climate
means hygiene and bio‐security standards are difficult to enforce and disease outbreaks are hard to control, leaving the livestock sector potentially at risk of widespread losses.
SWOT Analysis ‐ Political Environment Strengths • The Philippines is one of Asia's oldest and liveliest democracies. The current constitution, framed in
1987 following the ousting of dictator Ferdinand Marcos, guarantees 'life, liberty and property' in an American‐style bill of rights.
• The Philippines is a 'major non‐NATO ally' (MNNA) of the United States, which serves as the de facto guarantor of the country's security.
Weaknesses • Rumours of military coup plots are frequent. Disaffected junior officers have staged a series of
mutinies in recent years, while the top brass played decisive roles in the 'people power' uprisings of 1986 and 2001.
Opportunities • Tentative plans to adopt a parliamentary‐style constitution, a process referred to locally as charter
change or 'cha‐cha', could reduce the concentration of executive power. Plans to move towards a
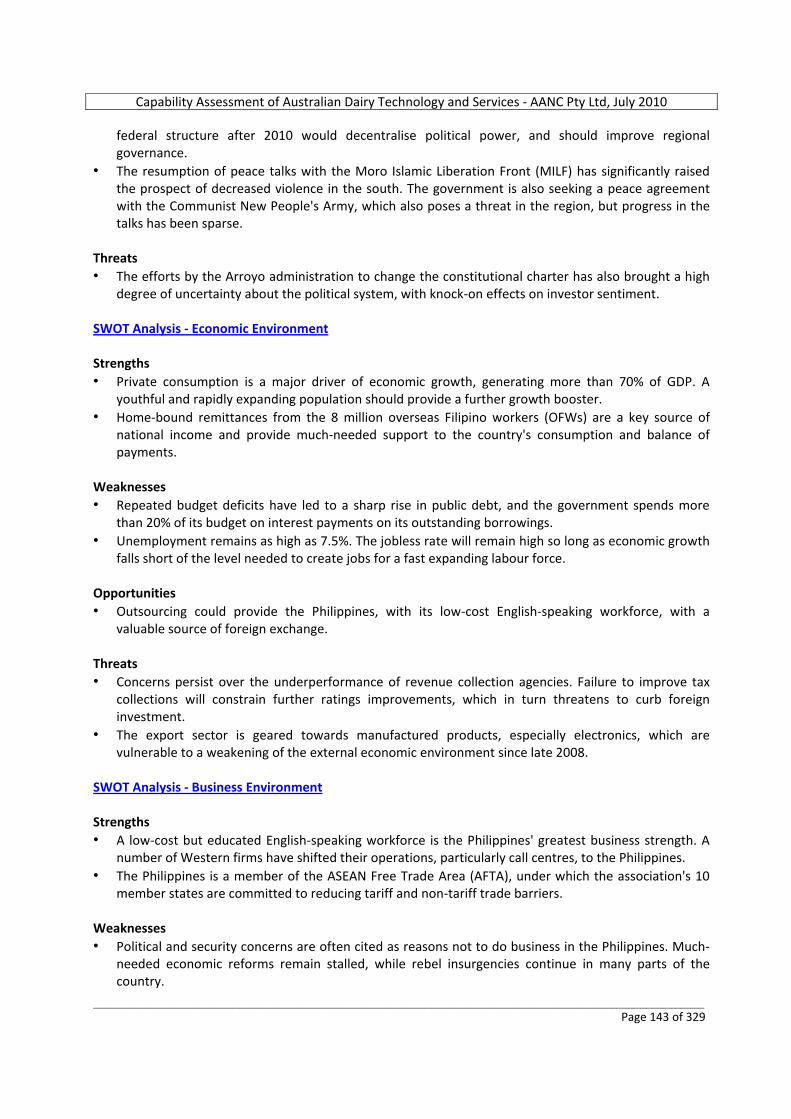
Capability Assessment of Australian Dairy Technology and Services ‐ AANC Pty Ltd, July 2010
_________________________________________________________________________________________________________ Page 143 of 329
federal structure after 2010 would decentralise political power, and should improve regional governance.
• The resumption of peace talks with the Moro Islamic Liberation Front (MILF) has significantly raised the prospect of decreased violence in the south. The government is also seeking a peace agreement with the Communist New People's Army, which also poses a threat in the region, but progress in the talks has been sparse.
Threats • The efforts by the Arroyo administration to change the constitutional charter has also brought a high
degree of uncertainty about the political system, with knock‐on effects on investor sentiment. SWOT Analysis ‐ Economic Environment Strengths • Private consumption is a major driver of economic growth, generating more than 70% of GDP. A
youthful and rapidly expanding population should provide a further growth booster. • Home‐bound remittances from the 8 million overseas Filipino workers (OFWs) are a key source of
national income and provide much‐needed support to the country's consumption and balance of payments.
Weaknesses • Repeated budget deficits have led to a sharp rise in public debt, and the government spends more
than 20% of its budget on interest payments on its outstanding borrowings. • Unemployment remains as high as 7.5%. The jobless rate will remain high so long as economic growth
falls short of the level needed to create jobs for a fast expanding labour force. Opportunities • Outsourcing could provide the Philippines, with its low‐cost English‐speaking workforce, with a
valuable source of foreign exchange. Threats • Concerns persist over the underperformance of revenue collection agencies. Failure to improve tax
collections will constrain further ratings improvements, which in turn threatens to curb foreign investment.
• The export sector is geared towards manufactured products, especially electronics, which are vulnerable to a weakening of the external economic environment since late 2008.
SWOT Analysis ‐ Business Environment Strengths • A low‐cost but educated English‐speaking workforce is the Philippines' greatest business strength. A
number of Western firms have shifted their operations, particularly call centres, to the Philippines. • The Philippines is a member of the ASEAN Free Trade Area (AFTA), under which the association's 10
member states are committed to reducing tariff and non‐tariff trade barriers. Weaknesses • Political and security concerns are often cited as reasons not to do business in the Philippines. Much‐
needed economic reforms remain stalled, while rebel insurgencies continue in many parts of the country.
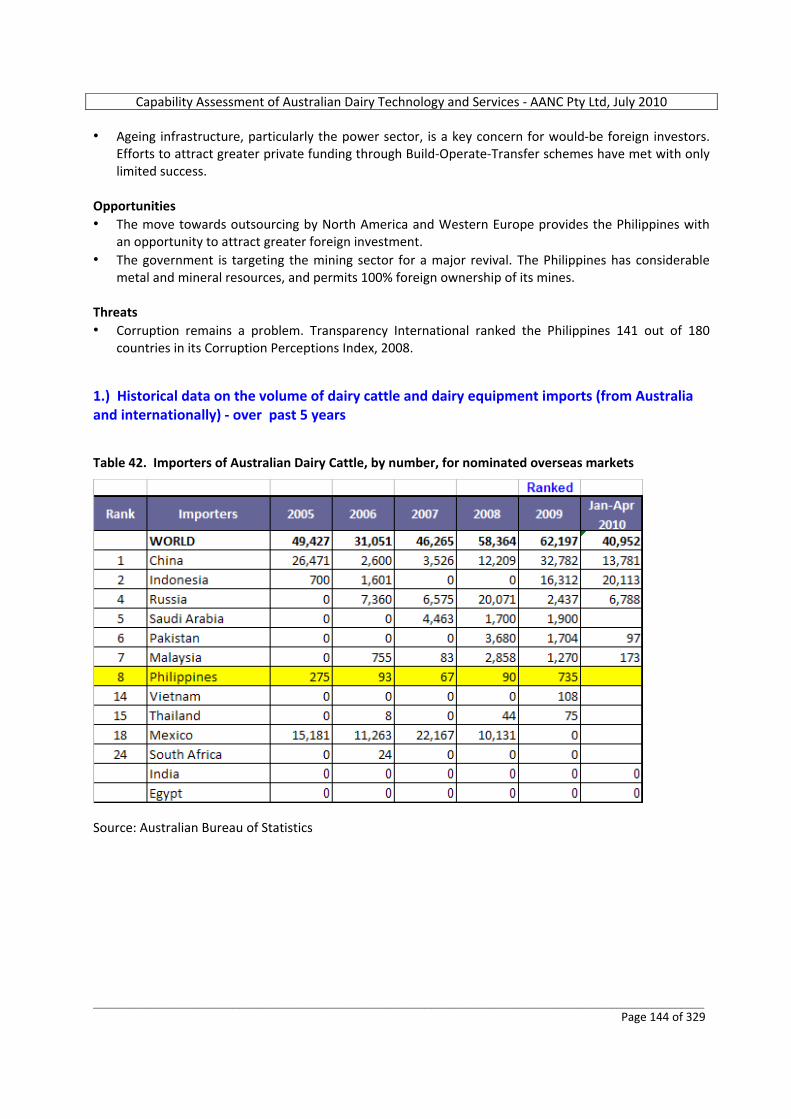
Capability Assessment of Australian Dairy Technology and Services ‐ AANC Pty Ltd, July 2010
_________________________________________________________________________________________________________ Page 144 of 329
• Ageing infrastructure, particularly the power sector, is a key concern for would‐be foreign investors. Efforts to attract greater private funding through Build‐Operate‐Transfer schemes have met with only limited success.
Opportunities • The move towards outsourcing by North America and Western Europe provides the Philippines with
an opportunity to attract greater foreign investment. • The government is targeting the mining sector for a major revival. The Philippines has considerable
metal and mineral resources, and permits 100% foreign ownership of its mines. Threats • Corruption remains a problem. Transparency International ranked the Philippines 141 out of 180
countries in its Corruption Perceptions Index, 2008. 1.) Historical data on the volume of dairy cattle and dairy equipment imports (from Australia and internationally) ‐ over past 5 years Table 42. Importers of Australian Dairy Cattle, by number, for nominated overseas markets
Source: Australian Bureau of Statistics
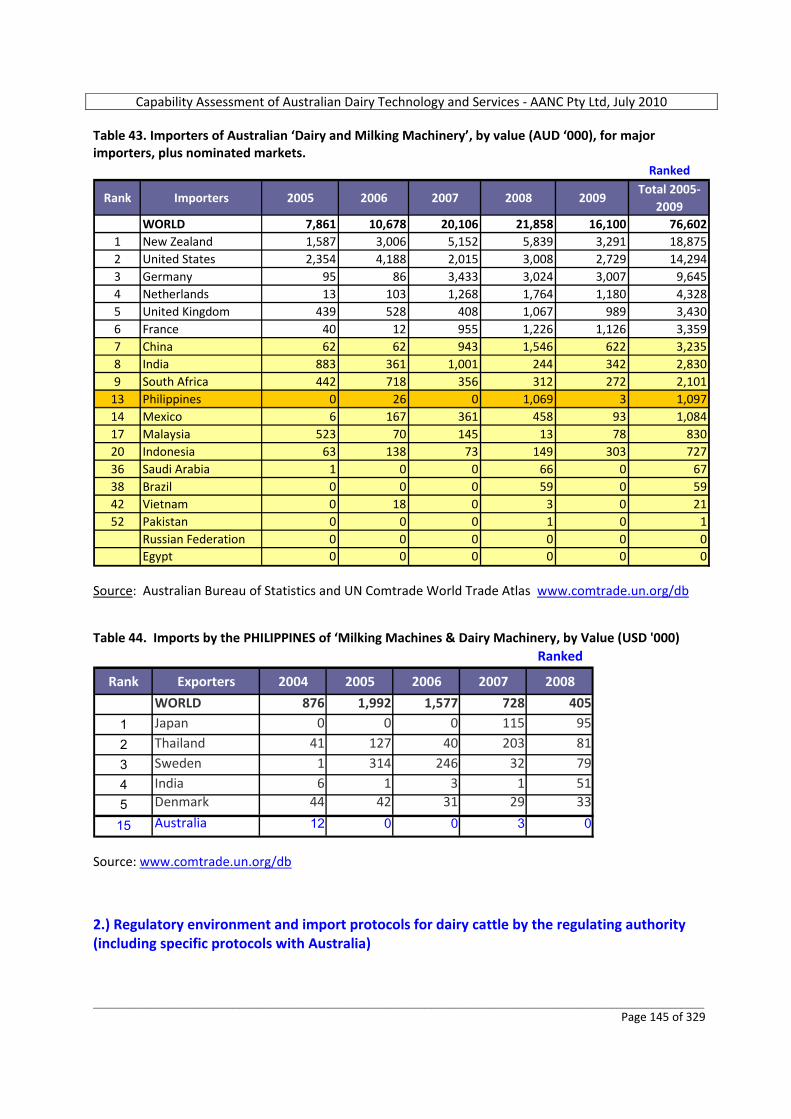
Capability Assessment of Australian Dairy Technology and Services ‐ AANC Pty Ltd, July 2010
_________________________________________________________________________________________________________ Page 145 of 329
Table 43. Importers of Australian ‘Dairy and Milking Machinery’, by value (AUD ‘000), for major importers, plus nominated markets.
Ranked
Rank Importers 2005 2006 2007 2008 2009Total 2005‐
2009WORLD 7,861 10,678 20,106 21,858 16,100 76,602
1 New Zealand 1,587 3,006 5,152 5,839 3,291 18,8752 United States 2,354 4,188 2,015 3,008 2,729 14,2943 Germany 95 86 3,433 3,024 3,007 9,6454 Netherlands 13 103 1,268 1,764 1,180 4,3285 United Kingdom 439 528 408 1,067 989 3,4306 France 40 12 955 1,226 1,126 3,3597 China 62 62 943 1,546 622 3,2358 India 883 361 1,001 244 342 2,8309 South Africa 442 718 356 312 272 2,101
13 Philippines 0 26 0 1,069 3 1,09714 Mexico 6 167 361 458 93 1,08417 Malaysia 523 70 145 13 78 83020 Indonesia 63 138 73 149 303 72736 Saudi Arabia 1 0 0 66 0 6738 Brazil 0 0 0 59 0 5942 Vietnam 0 18 0 3 0 2152 Pakistan 0 0 0 1 0 1
Russian Federation 0 0 0 0 0 0Egypt 0 0 0 0 0 0
Source: Australian Bureau of Statistics and UN Comtrade World Trade Atlas www.comtrade.un.org/db Table 44. Imports by the PHILIPPINES of ‘Milking Machines & Dairy Machinery, by Value (USD '000)
Ranked
Rank Exporters 2004 2005 2006 2007 2008
WORLD 876 1,992 1,577 728 405
1 Japan 0 0 0 115 95
2 Thailand 41 127 40 203 81
3 Sweden 1 314 246 32 79
4 India 6 1 3 1 51
5 Denmark 44 42 31 29 33
15 Australia 12 0 0 3 0
Source: www.comtrade.un.org/db 2.) Regulatory environment and import protocols for dairy cattle by the regulating authority (including specific protocols with Australia)

Capability Assessment of Australian Dairy Technology and Services ‐ AANC Pty Ltd, July 2010
_________________________________________________________________________________________________________ Page 146 of 329
FOR GENERAL ADVICE REGARDING THE REGULATION OF EXPORTS FROM AUSTRALIA:
Australian Customs and Border Protection Service, Canberra City, ACT. http://www.customs.gov.au
FOR FOREIGN AFFAIRS, IMPORT TRADE PROTOCOLS/REGULATIONS AND WEB LINKAGES TO FOREIGN EMBASSIES IN COUNTRIES TO WHICH EXPORTS ARE INTENDED:
Australian Department of Foreign Affairs and Trade, Barton, ACT. http://www.dfat.gov.au/embassies/Philippines
FOR SPECIFIC ADVICE REGARDING THE PREPARATION, SHIPPING OR AIR‐FREIGHTING OF LIVE ANIMALS AND LIVE ANIMALS TRADE ISSUES IN DESTINATION FOREIGN COUNTRIES:
LiveCorp Ltd, North Sydney, NSW. http://www.livecorp.com.au
FOR SPECIFIC ADVICE REGARDING PROTOCOLS FOR THE EXPORT OF LIVE ANIMALS (OR ANIMAL‐DERIVED PRODUCTS SUCH AS SEMEN AND EMBRYOS) FROM AUSTRALIA AND IMPORT PROTOCOLS IN DESTINATION FOREIGN COUNTRIES:
Australian Quarantine and Inspection Service (AQIS), Canberra City, ACT. http://www.aqis.gov.au
Specific Filipino information: USDA Foreign Agricultural Service. Global Agricultural Information Network. GAIN Report Number: …... Date 17/07/2009 Philippines ‐ Food and Agricultural Import Regulations and Standards. The two main agencies tasked with developing and enforcing food safety standards in the Philippines are the Bureau of Food and Drugs (BFAD) under the Department of Health (DOH), and the Bureau of Agriculture and Fisheries Product Standards (BAFPS) of the Department of Agriculture (DA). Regulatory Agencies: A number of different regulatory bodies exist in the Philippines and these are often supported by specialist commissions which focus on specific technical matters such as meat inspection, biosafety, etc. The main regulatory bodies monitoring the safety aspects of imported agriculture and food products are the Bureau of Animal Industry (BAI), Bureau of Fisheries & Aquatic Resources (BFAR) and the Bureau of Plant Industry (BPI). All these bureaus are under the jurisdiction of DA. Import Regulations:
Important note re. Free Trade Agreement (FTA)
The Philippines is a member of the Association of South East Asian Nations (ASEAN). The ASEAN‐Australia‐New Zealand FTA came into effect at the beginning of 2010.
Capability Assessment of Australian Dairy Technology and Services ‐ AANC Pty Ltd, July 2010
_________________________________________________________________________________________________________ Page 147 of 329
All imported food and agricultural products are required to comply with the Philippines’ food health and phytosanitary laws. In general, no products are allowed to enter the Philippines if they are deemed to pose a danger to human life or well‐being, either directly or indirectly. All food and agricultural products, including plant products that enter the Philippines, are required to pass through procedures designed to check that they are not contaminated with any pest and that they are fit for their intended use. At present, national microbiological standards for food have not yet been established. Philippine food regulations are thus generally patterned after CODEX Alimentarius Commission guidelines as well as regulations established by the FDA of the United States and similar regulatory bodies in other countries. The health and phytosanitary regulations and procedures applied on imported agriculture and food products are broadly similar for all types of products. Under Philippine import laws, it is the responsibility of the importer to ensure that any product entering the country’s customs territory is in full compliance with Philippine health and phytosanitary regulations. The enforcing authorities will check for compliance by inspecting the goods and relevant import/export documentation and decide on whether the goods may enter the Philippines. In cases of non‐compliance, the goods may be required to be treated before being released or they may be rejected and ordered destroyed or disposed of outside the Philippines. It is therefore important that importers and exporters ensure that compliance is achieved before the goods are shipped to the Philippines. Import Regulations for Live Animals: On December 22, 2005, the Philippine Department of Agriculture formally agreed to allow U.S. live breeder cattle imports into the country subject to the terms and conditions specified in the Philippine Import Health Protocol for Live Cattle from the United States, negotiated by the APHIS and the Bureau of Animal Industry. As with meat and meat products, importers are required to obtain a Veterinary Quarantine Clearance (VQC) Certificate from BAI prior to the shipment of animals. Specific import terms and conditions contained in the protocol can be obtained from APHIS Veterinary Services. Specific Philippine import requirements for live animals and animal products from the USA may be obtained from: http://www.aphis.usda.gov/vs/ncie/iregs/animals/rp.html 3.) Investment environment for dairy operations (domestic and foreign assistance, tax incentives, export zones, etc) and examples of FDI (from any country) Austrade SE Asian offices The National Dairy Authority (NDA) is keen for foreign investors in the dairy sector. The NDA also guides in the formation, management, and marketing of dairy cooperatives. Philippines: Promoting dairy entrepreneurship through enterprise zones. Sally Bulatao, Former Administrator of the National Dairy Authority, Manila. FAO : Smallholder dairy development ‐ Lessons learned in Asia. RAP Publication 2009/02. Bangkok, January 2009. Operating in a trade regime of liberalization, the local dairy sector of the Philippines hardly enjoys any protection, with tariffs on dairy imports down in the range of 0–3 %. However, quality assurance has received a big boost in recent years, highlighted by the introduction of milk payments based on quality in some zones.
Capability Assessment of Australian Dairy Technology and Services ‐ AANC Pty Ltd, July 2010
_________________________________________________________________________________________________________ Page 148 of 329
Business Monitor International (BMI) Philippines: Agribusiness Report, Q3 2010, Including 5‐year forecasts to 2014, May, 2010 Investment in large dairies While dairy farming in the Philippines is overwhelmingly small scale and low technology, larger farms are beginning to appear. In Lanao del Norte province on the southern island of Mindanao, there is a farm with around 5,000 head of cattle all descended from stock imported from Australia. The development of the farm has been driven by the provincial government with assistance from American dairy giant Land O' Lakes. If the project proves a success, we would expect other provinces to push for the development of large‐scale dairy farms. Land O' Lakes is working on projects to develop dairy farming and the dairy supply chain in a number of regions of the Philippines with funding from the US Department of Agriculture. In July 2009, the company handed over a farm in Bical to the NDA. 4.) National government programs to assist with the development of dairy operations Business Monitor International (BMI) Philippines: Agribusiness Report, Q3 2010, Including 5‐year forecasts to 2014, May, 2010 Live cattle import plans The Department of Agriculture is aiming to import almost 5,000 head of high‐yielding dairy cattle over the next two years to improve the genetic stock of the Philippines' dairy herd. In September 2009, the NDA said it was now planning to import 9,000 head of dairy cattle in 2010 and 2011. If realised, this would almost double the number of milking animals in the country. These are promising developments. If the dairy industry in the Philippines is to progress, the improvement of genetic stock will be essential as at present, annual milk yields per head at 1,077kg are low even by South East Asian standards. The NDA will place the imported stock on multiplier farms and the calves will be sold on to producers. “No Moo‐ing Matter”. The Manila Bulletin, 3 May 2010, Philippine Government milk‐feeding programs are on the rise, from feeding 12,750 children in 1995, the number increased to almost 30,000 in 2006. These government initiated programs absorb around 40 % of local milk production because the National Dairy Authority requires that smallholder dairies be given priority as suppliers of these programs. In a speech delivered at the Dairy Congress and Expo 2009, Rep. Edcel Lagman emphasized the “amazing potential of the Philippines to emerge as a dairy hub. The Philippine dairy industry has been progressively improving in the past decade and the advances are quantifiable.” According to Lagman, despite the global economic downturn, dairy cooperative farms progressed well last year. “Local dairy production still grew by almost 3 %. Available data also shows that since 2002, milk production in MT per day has increased by almost 100 %. ”With the attention it is getting from both the Government and private sectors, the Philippine dairy industry may be growing. The challenge, Lagman says, really boils down to how the local producers will protect and develop it. “Dairy producers report hike in local milk production”. Philippines News Agency, 28 April 2010,
Capability Assessment of Australian Dairy Technology and Services ‐ AANC Pty Ltd, July 2010
_________________________________________________________________________________________________________ Page 149 of 329
The Department of Agriculture will provide a roadmap to address the needs of the dairy community. In 2009, some 812 imported dairy cattle were distributed to expand the existing dairy herd and boost local milk production. The Multi‐year Dairy Animal Procurement and Breeding program was also approved recently and enabled the National Dairy Authority to bring to the country 3,300 head of dairy cattle over two years. These will comprise the base stock for dairy multiplier farms. These farms are to supply the dairy cattle requirements of existing and emerging dairy zones (clusters) in the country. Last year, 17 farmers in Bohol were given an initial 10 cows to start their own dairy projects, as the province of Bohol shows potential in becoming a future dairy zone. With these projects, the National Dairy Authority hopes there will be an increase in local milk production, which will benefit all the dairy families in the country. “Gov't targets to procure 11,000 heads of dairy animals to boost milk output“. Manila Bulletin, 22 March 2010, CAGAYAN DE ORO – The government is targeting to procure 11,000 heads of dairy animals to boost milk production and reduce the country’s dependence on imported milk. Of theses animals, 7,000 will be buffaloes and 4,000 are dairy cattle. “Bohol to play ace role in premium cow's milk production “. Manila Bulletin, 7 April 2010, The Ubay Stock Farm in the Bohol Province is one of the largest government stock farms in the country. The 4,500‐hectare stock farm is located in Ubay, Brgy, Lomangog, and is expected to house some 500 imported cows as the National Dairy Authority’s Region 7 office gets ready to increase dairy production by purchasing a large number of imported cows from New Zealand, to serve as multipliers. They will reproduce by using artificial insemination. The offspring of the imported cows will be distributed to members of NDA‐accredited cooperatives to further increase milk production. Ubay Farm, with its vast rolling hills and plains, not only houses imported breeds of cattle but is also a research facility for cattle, carabao, goat, sheep and ostrich‐breeding. The recently purchased Holstein‐Friesian cows will be in the country by August this year, with each cow costing an estimated PHP30,000 (US$ 2,826). The said Holstein breed is known today as the world's highest production dairy animal. “DA pushes multiplier farm to solve dairy woes”. Philippine Daily Inquirer, 20 April 2010, The national government through the Department of Agriculture (DA) and the Department of Agrarian Reform (DAR) has partnered with the Dairy Confederation of the Philippines to improve dairy production in the country. DA plan to create a “multiplier farm” and promote a herd build‐up for dairy producing herds in order to increase the volume of milk produced in the country and reduce its dependency on imported supplies. “To do that we will be cross‐breeding our local breed with dairy‐producing breed from other countries to improve the number of dairy producing herds which includes goat, cow and carabao (buffalo) ‐ thus increasing the volume of milk,” the DA undersecretary said. In 2008 the total milk importation was valued at US$712 million (or roughly PHP32.75 billion at USD:PHP = 46.0), making dairy products the second in rank of imported goods after crops. Potential for Australian exporters of live heifers
Capability Assessment of Australian Dairy Technology and Services ‐ AANC Pty Ltd, July 2010
_________________________________________________________________________________________________________ Page 150 of 329
In summary, it would appear there is considerable opportunity for Australian Holstein producers to supply pregnant heifers (and possibly semen) to government farms in the highland areas of the Philippines, to serve as multiplier cows. The preferred model seems to be that imported pregnant heifers are calved and the offspring distributed to members of National Dairy Authority accredited cooperatives (in numbers or 10 or so) to assist in the development of local herds. In subsequent years, these cows and their offspring are artificially inseminated with semen imported from dairy genetic improvement companies in more advanced nations. 5.) Existing or proposed external assistance programs to develop the industry (foreign government and/or aid programs) Austrade SE Asian offices: o New Zealand AID is conducting a research program to assess the requirements of the dairy industry in
the Philippines. o USDA, through the Land O’ Lakes program, provides technical assistance to farms and cooperatives
through the creation or improvement of dairy zones in milk pasteurisation, milk handling and marketing.
o USA's Public Law 480, or the Agricultural Trade Development Assistance Act, aims to address food and nutritional problems of countries in need of food to enhance long term food security. Several batches of livestock/dairy importations into the Philippines have been funded by the PL480.
Philippines: Promoting dairy entrepreneurship through enterprise zones. Sally Bulatao, Former Administrator of the National Dairy Authority, Manila. FAO : Smallholder dairy development ‐ Lessons learned in Asia. RAP Publication 2009/02. Bangkok, January 2009. Official development assistance With very limited resources channelled to the smallholder dairy sector, support through official development assistance has significantly accelerated dairy zone expansion in the past six years. Specifically, official development assistance from the US Government’s Section 416(b) facility and the Food for Progress programme has been a significant source of investment in smallholder dairy. In partnerships with the US Department of Agriculture, the National Dairy Authority and the American Land O’Lakes (LOL), local capacity‐building has been undertaken in four new dairy zones, with four more in progress. Even a LOL milk feeding programme in one region had a dairy capacity‐building component with smallholder farmers. That site now is being scaled up to a dairy zone. Assistance from the FAO for improving milk quality and from the Japanese and Australian Governments for improved milk quality and breeding has provided valuable support to the smallholder dairy sector. The success of the foreign‐funded programmes may be attributed, to a large extent, to the high degree of collaboration achieved between the foreign donor and the local partners. Other foreign‐assisted programmes have been installed but did not succeed due, in part, to the lack of recognition of the smallholders’ role in the success of dairying and the desire to go big and establish huge communal farms. Business Monitor International (BMI) Philippines: Agribusiness Report, Q3 2010, Including 5‐year forecasts to 2014, May, 2010
Capability Assessment of Australian Dairy Technology and Services ‐ AANC Pty Ltd, July 2010
_________________________________________________________________________________________________________ Page 151 of 329
New Zealand Aid Program The strategy will be helped by news that NZAID, the New Zealand government's development agency, will make the development of the Philippines' dairy industry one of the key aims of its programme in the country. With NZAID's total budget in the country for 2008/09 only NZD4mn (US$2.62mn), the impact will not be massive. However, with New Zealand a major player in the world dairy trade, its input in training and genetic stock could be a boost to the sector. Investment in large dairies While dairy farming in the Philippines is overwhelmingly small scale and low technology, larger farms are beginning to appear. In Lanao del Norte province on the southern island of Mindanao, there is a farm with around 5,000 head of cattle all descended from stock imported from Australia. The development of the farm has been driven by the provincial government with assistance from American dairy giant Land O' Lakes. If the project proves a success, we would expect other provinces to push for the development of large‐scale dairy farms. Land O' Lakes is working on projects to develop dairy farming and the dairy supply chain in a number of regions of the Philippines with funding from the US Department of Agriculture. In July 2009, the company handed over a farm in Bical to the NDA. 6.) Overview of the typical dairy farming arrangements Philippines: Promoting dairy entrepreneurship through enterprise zones. Sally Bulatao, Former Administrator of the National Dairy Authority, Manila. FAO : Smallholder dairy development ‐ Lessons learned in Asia. RAP Publication 2009/02. Bangkok, January 2009. The local dairy farm sector is small, comprising 13,000 families and some 300 dairy enterprises. The total dairy herd consists of some 28,000 head, of a total livestock population of 9.6 million. The single biggest obstacle to dairy development is the shortage of dairy animals. Hence, programmes to upgrade local animals to dairy breeds are dominant livestock interventions. Recent pronouncements from the Department of Agriculture have indicated the intent to concentrate on the upgrading of native carabao. Located within dairy zones, smallholder dairy farmers (with 2–10 cows) and bigger producers (with 20–400 cows) operate side by side. A 2002 survey by the Bureau of Agriculture Statistics indicated that 4,194, or 85 %, of 4,957 farmers surveyed owned 1–5 dairy animals. Including the farmers owning 5–10 dairy animals, the percentage of smallholder dairy farmers rises to 96 %. “Govt eyes breeding to cut cow imports”. The Manila Times, 13 March 2010, To date, the industry has about 15,000 cows that produce all kinds of liquid milk. Total local production last year stood at 56 million liters but the country's demand stood at 1.6 billion litres, or equivalent to $752 million. By expanding the number of milk producers, the country hopes to achieve self‐sufficiency by 2018. There are 140 milk cooperatives in the country today, but only 40 of them are actively producing milk that make up 26 % of the total liquid milk requirement of the country. “DA pushes multiplier farm to solve dairy woes”. Philippine Daily Inquirer, 20 April 2010,
Capability Assessment of Australian Dairy Technology and Services ‐ AANC Pty Ltd, July 2010
_________________________________________________________________________________________________________ Page 152 of 329
Dairy Confederation of the Philippines chairman Danilo Fausto said that as at 2008, the Philippine livestock population was 10,077,347 head, broken down into 2,565,662 cattle, 3,319,856 carabaos (buffalo) and 4,191,729 goats. Of those numbers, only 31,791 are used as dairy animals. “With a dairy animal's production estimated at 5 liters per day, we need about 898,000 dairy animals to satisfy the imported requirement of 4.49 million liters per day. Assuming that these dairy animals represented one‐third of the total dairy herd, we should have at least 2,694,000 dairy animals to meet our country's total dairy requirement,” he said. Locally bred cows are 50 % cheaper at P50,000 to P75,000 (US$1,100 – US$1,600) each compared with imported ones that cost at least P125,000 (US$2,700) each. To date, there are 15,212 families engaged in dairy production in the country, with 347 primary cooperatives and institutions. “We are also trying our best to encourage farmers to use their farm animals for dual purpose: meat and milk. One milk‐producing animal can produce an average monthly income of P7,000 and a family can handle up to six dairy animals without hiring additional people,” Fausto said. “Dairy producers report hike in local milk production”. Philippines News Agency, 28 April 2010, From a more than 10 million livestock population in the Philippines, only around 40,000 of these are dairy cows, carabaos (buffalo) and goats. Cow’s milk accounted for an estimated 63 % of domestic milk production in 2009, followed by carabao’s millk (36 %), and goat’s milk (1 %). Austrade SE Asian offices: Most local dairy farms are smallholder farms with only 2‐10 head. However, there are now some major integrated companies producing dairy cattle: o Lanao Foundation Inc ‐ about 8,000 head. Produces milk, yoghurt, cheese. o Hacienda Macalauan ‐ about 300 head. Produces milk, yoghurt, cheese. They also have their own
semen collection laboratory. Estimates of milk productivity per cow depend largely on whether cows are of imported or local origins. Business Monitor International (BMI) suggest that national annual milk yields per head are only 1,077kg (3.6 Ltr/day), which are low even by South East Asian standards. However, the coordinator of the Cebu Federation of Dairy Cooperatives (CFDC) has estimated that the Central Visayas herd of 1,639 cows was expected to produce an average of 3,203 liters of milk (10.7 Ltr/day). 7.) Brief overview of major companies with integrated dairy operations

Capability Assessment of Australian Dairy Technology and Services ‐ AANC Pty Ltd, July 2010
_________________________________________________________________________________________________________ Page 153 of 329
Table 45. Philippines Dairy Product market share – percentage by retail value, 2001‐2008
Companies 2001 2002 2003 2004 2005 2006 2007 2008Nestlé SA 38.1 39.2 39.7 39.6 41.4 42.2 41.7 42.0Alaska Milk Corp 13.6 13.5 13.5 13.4 13.2 13.5 14.9 15.1Kraft Foods Inc 11.2 11.3 11.1 10.9 10.7 10.5 10.2 10.1Fonterra Co‐operative Group 5.7 5.5 5.9 6.6 6.7 6.8 6.6 6.2Associated British Foods Plc (ABF) ‐ 4.3 4.7 4.9 5.2 5.4 5.7 6.0Yakult Honsha Co Ltd 4.4 4.7 5.0 6.1 5.4 5.3 5.1 5.6San Miguel Corp 4.4 4.5 4.7 5.2 5.2 5.2 5.3 5.1RFM Corp 0.4 0.4 0.6 0.5 0.5 0.4 0.6 0.7United Dairymen Holland 1.7 1.5 1.2 1.0 0.8 0.8 0.8 0.7New Zealand Creamery Inc 1.3 1.3 1.1 0.7 0.6 0.5 0.5 0.4Bega Co‐operative Society Ltd, The 0.6 0.6 0.5 0.5 0.4 0.4 0.3 0.3Philippine Health Food Manufacturing Inc 0.3 0.4 0.3 0.3 0.3 0.3 0.3 0.3Hershey Co, The 0.3 0.3 0.3 0.3 0.3 0.3 0.3 0.3Lactalis, Groupe 0.3 0.2 0.2 0.2 0.2 0.2 0.3 0.2ConAgra Foods Inc 0.2 0.2 0.3 0.3 0.2 0.2 0.2 0.2Bongrain SA 0.3 0.3 0.3 0.3 0.3 0.2 0.2 0.2Columbia International Food Products Inc ‐ ‐ ‐ ‐ 0.1 0.2 0.2 0.2Commonwealth Foods Inc 0.2 0.2 0.2 0.2 0.2 0.1 0.1 0.1Gebrüder Woerle GesmbH 0.6 0.4 0.3 0.2 0.2 0.2 0.1 0.1Fraser & Neave Ltd 0.1 0.1 0.1 0.0 0.0 ‐ ‐ ‐Novartis AG 4.3 ‐ ‐ ‐ ‐ ‐ ‐ ‐Others 12.0 11.3 10.0 8.9 8.0 7.1 6.6 6.2Total 100 100 100 100 100 100 100 100 Source: Euromonitor International, 2010 “No Moo‐ing Matter”. The Manila Bulletin, 3 May 2010, The Philippine dairy industry is clearly segmented into: A.) Dairy product Importers Major importing companies are ‐ Nestle, Consolidated Dairy and Fonterra Philippines. The importing sector clearly dominates the Philippine dairy industry, accounting for 99 % of the dairy market. o Consolidated Dairy and Frozen Food Corporation
The company has recently expanded into importing bulk dairy ingredients like powdered skim milk, whey powder, cheddar and mozzarella cheeses, butter, cream cheese and milk fats. These unbranded ingredients supply the needs of hotels, fast food chains, noodle factories, bakeries, and candy and biscuit manufacturers. Much of Consolidated Dairy’s bulk ingredients, which make up 65 to 70 % of the company’s total sales, are now imported from Australia, one of the top two exporters of milk and dairy products to the country, alongside New Zealand. Consolidated Dairy is currently the exclusive distributor of Murray Goulburn, the biggest dairy producer in Australia.
o Fonterra Philippines
Now the leading distributor of bulk, fresh milk from New Zealand.
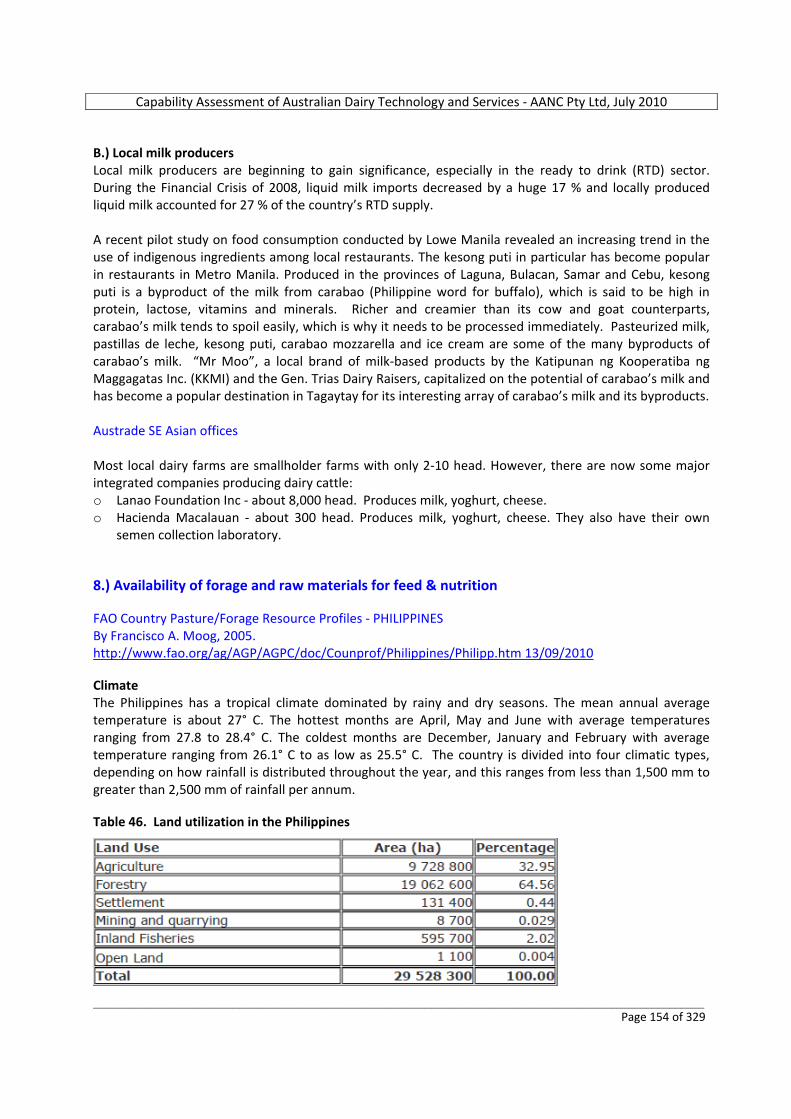
Capability Assessment of Australian Dairy Technology and Services ‐ AANC Pty Ltd, July 2010
_________________________________________________________________________________________________________ Page 154 of 329
B.) Local milk producers Local milk producers are beginning to gain significance, especially in the ready to drink (RTD) sector. During the Financial Crisis of 2008, liquid milk imports decreased by a huge 17 % and locally produced liquid milk accounted for 27 % of the country’s RTD supply. A recent pilot study on food consumption conducted by Lowe Manila revealed an increasing trend in the use of indigenous ingredients among local restaurants. The kesong puti in particular has become popular in restaurants in Metro Manila. Produced in the provinces of Laguna, Bulacan, Samar and Cebu, kesong puti is a byproduct of the milk from carabao (Philippine word for buffalo), which is said to be high in protein, lactose, vitamins and minerals. Richer and creamier than its cow and goat counterparts, carabao’s milk tends to spoil easily, which is why it needs to be processed immediately. Pasteurized milk, pastillas de leche, kesong puti, carabao mozzarella and ice cream are some of the many byproducts of carabao’s milk. “Mr Moo”, a local brand of milk‐based products by the Katipunan ng Kooperatiba ng Maggagatas Inc. (KKMI) and the Gen. Trias Dairy Raisers, capitalized on the potential of carabao’s milk and has become a popular destination in Tagaytay for its interesting array of carabao’s milk and its byproducts. Austrade SE Asian offices Most local dairy farms are smallholder farms with only 2‐10 head. However, there are now some major integrated companies producing dairy cattle: o Lanao Foundation Inc ‐ about 8,000 head. Produces milk, yoghurt, cheese. o Hacienda Macalauan ‐ about 300 head. Produces milk, yoghurt, cheese. They also have their own
semen collection laboratory. 8.) Availability of forage and raw materials for feed & nutrition FAO Country Pasture/Forage Resource Profiles ‐ PHILIPPINES By Francisco A. Moog, 2005. http://www.fao.org/ag/AGP/AGPC/doc/Counprof/Philippines/Philipp.htm 13/09/2010 Climate The Philippines has a tropical climate dominated by rainy and dry seasons. The mean annual average temperature is about 27° C. The hottest months are April, May and June with average temperatures ranging from 27.8 to 28.4° C. The coldest months are December, January and February with average temperature ranging from 26.1° C to as low as 25.5° C. The country is divided into four climatic types, depending on how rainfall is distributed throughout the year, and this ranges from less than 1,500 mm to greater than 2,500 mm of rainfall per annum. Table 46. Land utilization in the Philippines
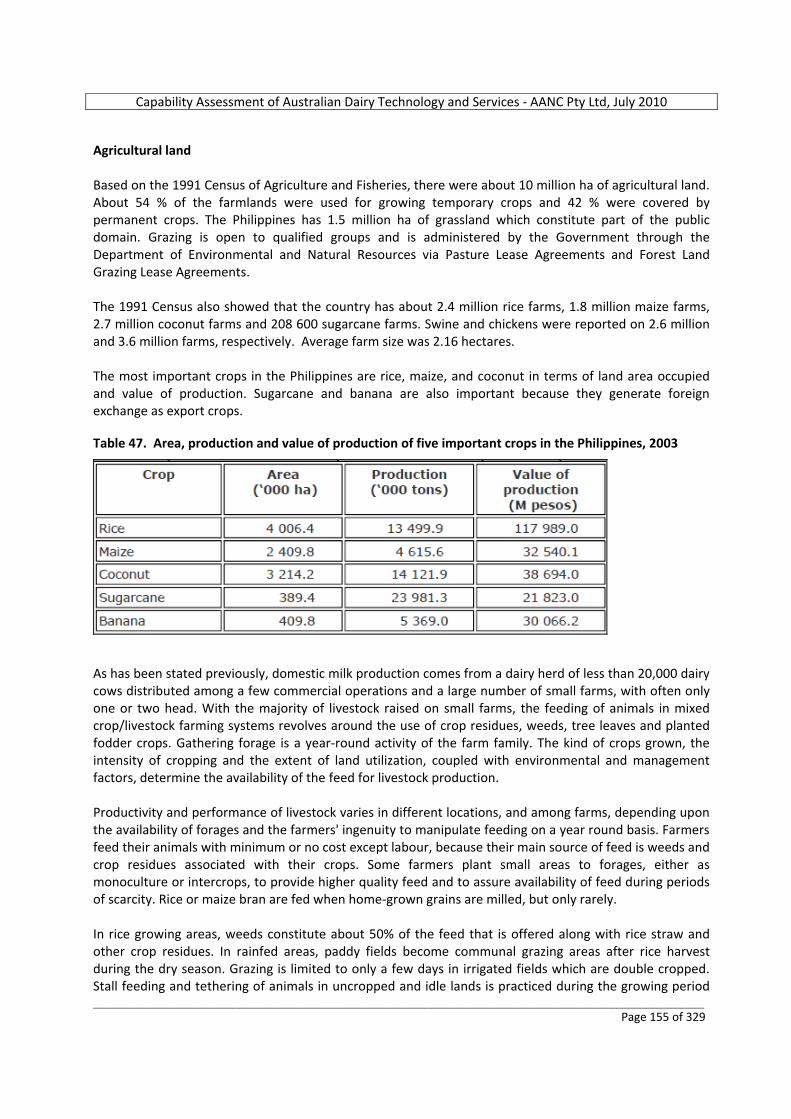
Capability Assessment of Australian Dairy Technology and Services ‐ AANC Pty Ltd, July 2010
_________________________________________________________________________________________________________ Page 155 of 329
Agricultural land Based on the 1991 Census of Agriculture and Fisheries, there were about 10 million ha of agricultural land. About 54 % of the farmlands were used for growing temporary crops and 42 % were covered by permanent crops. The Philippines has 1.5 million ha of grassland which constitute part of the public domain. Grazing is open to qualified groups and is administered by the Government through the Department of Environmental and Natural Resources via Pasture Lease Agreements and Forest Land Grazing Lease Agreements. The 1991 Census also showed that the country has about 2.4 million rice farms, 1.8 million maize farms, 2.7 million coconut farms and 208 600 sugarcane farms. Swine and chickens were reported on 2.6 million and 3.6 million farms, respectively. Average farm size was 2.16 hectares. The most important crops in the Philippines are rice, maize, and coconut in terms of land area occupied and value of production. Sugarcane and banana are also important because they generate foreign exchange as export crops. Table 47. Area, production and value of production of five important crops in the Philippines, 2003
As has been stated previously, domestic milk production comes from a dairy herd of less than 20,000 dairy cows distributed among a few commercial operations and a large number of small farms, with often only one or two head. With the majority of livestock raised on small farms, the feeding of animals in mixed crop/livestock farming systems revolves around the use of crop residues, weeds, tree leaves and planted fodder crops. Gathering forage is a year‐round activity of the farm family. The kind of crops grown, the intensity of cropping and the extent of land utilization, coupled with environmental and management factors, determine the availability of the feed for livestock production. Productivity and performance of livestock varies in different locations, and among farms, depending upon the availability of forages and the farmers' ingenuity to manipulate feeding on a year round basis. Farmers feed their animals with minimum or no cost except labour, because their main source of feed is weeds and crop residues associated with their crops. Some farmers plant small areas to forages, either as monoculture or intercrops, to provide higher quality feed and to assure availability of feed during periods of scarcity. Rice or maize bran are fed when home‐grown grains are milled, but only rarely. In rice growing areas, weeds constitute about 50% of the feed that is offered along with rice straw and other crop residues. In rainfed areas, paddy fields become communal grazing areas after rice harvest during the dry season. Grazing is limited to only a few days in irrigated fields which are double cropped. Stall feeding and tethering of animals in uncropped and idle lands is practiced during the growing period
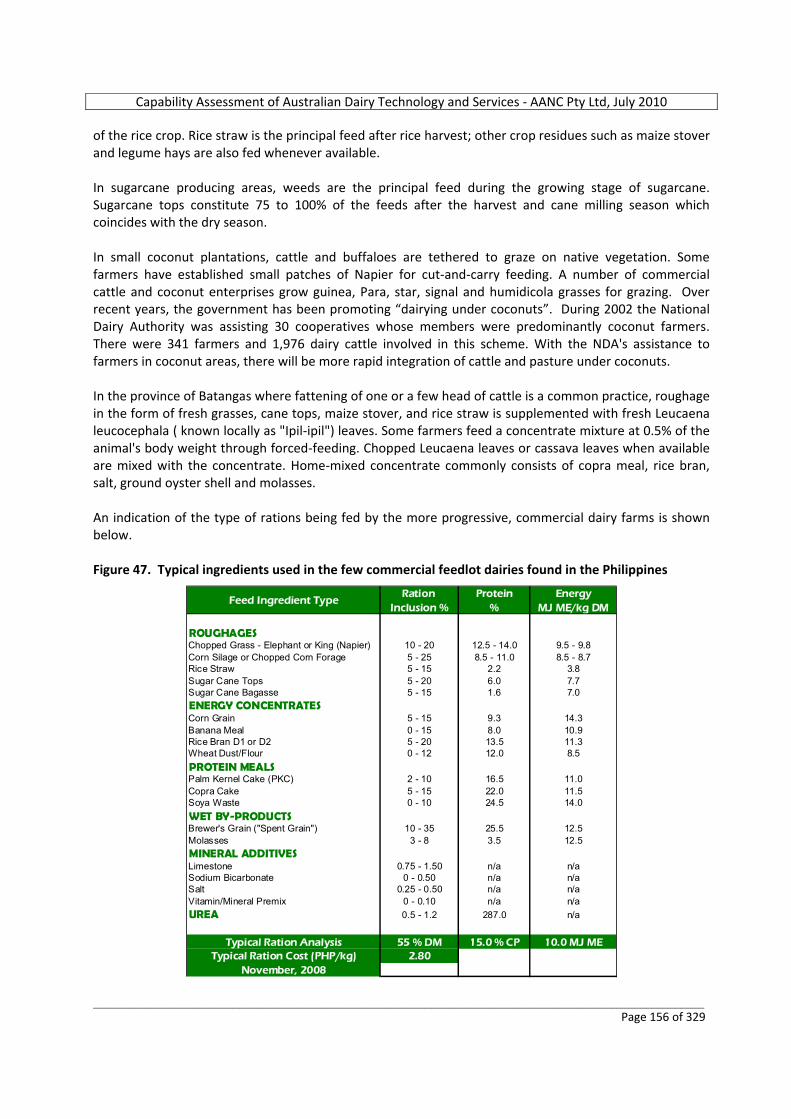
Capability Assessment of Australian Dairy Technology and Services ‐ AANC Pty Ltd, July 2010
_________________________________________________________________________________________________________ Page 156 of 329
of the rice crop. Rice straw is the principal feed after rice harvest; other crop residues such as maize stover and legume hays are also fed whenever available. In sugarcane producing areas, weeds are the principal feed during the growing stage of sugarcane. Sugarcane tops constitute 75 to 100% of the feeds after the harvest and cane milling season which coincides with the dry season. In small coconut plantations, cattle and buffaloes are tethered to graze on native vegetation. Some farmers have established small patches of Napier for cut‐and‐carry feeding. A number of commercial cattle and coconut enterprises grow guinea, Para, star, signal and humidicola grasses for grazing. Over recent years, the government has been promoting “dairying under coconuts”. During 2002 the National Dairy Authority was assisting 30 cooperatives whose members were predominantly coconut farmers. There were 341 farmers and 1,976 dairy cattle involved in this scheme. With the NDA's assistance to farmers in coconut areas, there will be more rapid integration of cattle and pasture under coconuts. In the province of Batangas where fattening of one or a few head of cattle is a common practice, roughage in the form of fresh grasses, cane tops, maize stover, and rice straw is supplemented with fresh Leucaena leucocephala ( known locally as "Ipil‐ipil") leaves. Some farmers feed a concentrate mixture at 0.5% of the animal's body weight through forced‐feeding. Chopped Leucaena leaves or cassava leaves when available are mixed with the concentrate. Home‐mixed concentrate commonly consists of copra meal, rice bran, salt, ground oyster shell and molasses. An indication of the type of rations being fed by the more progressive, commercial dairy farms is shown below. Figure 47. Typical ingredients used in the few commercial feedlot dairies found in the Philippines
Ration Protein EnergyInclusion % % MJ ME/kg DM
ROUGHAGESChopped Grass - Elephant or King (Napier) 10 - 20 12.5 - 14.0 9.5 - 9.8Corn Silage or Chopped Corn Forage 5 - 25 8.5 - 11.0 8.5 - 8.7Rice Straw 5 - 15 2.2 3.8Sugar Cane Tops 5 - 20 6.0 7.7Sugar Cane Bagasse 5 - 15 1.6 7.0ENERGY CONCENTRATESCorn Grain 5 - 15 9.3 14.3Banana Meal 0 - 15 8.0 10.9Rice Bran D1 or D2 5 - 20 13.5 11.3Wheat Dust/Flour 0 - 12 12.0 8.5PROTEIN MEALSPalm Kernel Cake (PKC) 2 - 10 16.5 11.0Copra Cake 5 - 15 22.0 11.5Soya Waste 0 - 10 24.5 14.0WET BY-PRODUCTSBrewer's Grain ("Spent Grain") 10 - 35 25.5 12.5Molasses 3 - 8 3.5 12.5MINERAL ADDITIVESLimestone 0.75 - 1.50 n/a n/aSodium Bicarbonate 0 - 0.50 n/a n/aSalt 0.25 - 0.50 n/a n/aVitamin/Mineral Premix 0 - 0.10 n/a n/aUREA 0.5 - 1.2 287.0 n/a
Typical Ration Analysis 55 % DM 15.0 % CP 10.0 MJ METypical Ration Cost (PHP/kg) 2.80
November, 2008
Feed Ingredient Type
Capability Assessment of Australian Dairy Technology and Services ‐ AANC Pty Ltd, July 2010
_________________________________________________________________________________________________________ Page 157 of 329
Source: Author’s original work, 2008. Depending on their location, commercial dairies and beef feedlots utilize sugarcane tops, bananas rejected for export, brewers' ‘spent grain’ or pineapple pulp. Green maize fodder is produced and supplied by a large number of farmers to feedlot operators in Davao and in the General Santos area. Maize fodder production has taken over a significant portion of the maize grain production area. Some farmers prefer growing maize for fodder because they can have 3 to 4 crops a year and under this farming system they do not experience crop failure, particularly if droughts occur. 9.) Availability of Artificial Insemination laboratories and testing facilities for cattle; also veterinary services Austrade SE Asian offices: AI and veterinary services are available through the Regional Offices of the Department of Agriculture. There is also a National Artificial Breeding Center that studies dairy breeds such as Holstein Sahiwal and Jersey. The Dairy Training and Research Institute (see below) also maintains a semen‐collection facility that supplies dairy farms in Luzon. 10.) Agribusiness educational facilities to support dairy production Austrade SE Asian offices: Dairy Training and Research Institute. With its core staff of dairy specialists, the DTRI continues to be a resource for the industry although its facilities are in need of improvement. Training courses for cooperative based dairy technicians are conducted in coordination with the DTRI. It also maintains a semen‐collection facility that supplies dairy farms in Luzon. “Bohol to play ace role in premium cow's milk production “. Manila Bulletin, 7 April 2010, The Ubay Stock Farm in the Bohol Province is one of the largest government stock farms in the country. The 4,500‐hectare stock farm is located in Ubay, Brgy, Lomangog, and is expected to house some 500 imported cows from New Zealand, to serve as multipliers. The offspring of the imported cows will be distributed to members of NDA‐accredited cooperatives to further increase milk production. Ubay Farm not only houses imported breeds of cattle but is also a research facility for cattle, carabao, goat, sheep and ostrich‐breeding. FAO Country Pasture/Forage Resource Profiles ‐ PHILIPPINES By Francisco A. Moog, 2005. http://www.fao.org/ag/AGP/AGPC/doc/Counprof/Philippines/Philipp.htm 13/09/2010 Current active researchers in forage and pastures:
o Asis, Perla ‐ Farmers Participatory Research. City Veterinary Office, Cagayan De Oro City.
o Calub, Blesilda ‐ Forages in Farming Systems.
Capability Assessment of Australian Dairy Technology and Services ‐ AANC Pty Ltd, July 2010
_________________________________________________________________________________________________________ Page 158 of 329
Farming System and Soil Resources Institute, University of the Philippines, Los Banos, Laguna. o Cuyugan, Orlando – Planning and Development.
Livestock Development Council, Department of Agriculture, Elliptical Road, Diliman, Quezon City. o Darang , Sergio ‐ Pasture Seed Production.
Department of Agriculture, Region II – Gamu, Isabela. o Gabunada, Jr, Francisco – Primary Species Evaluation and Farmers Participatory Research.
CIAT‐AIDAB Forages for Smallholder Project, International Rice Research Institute, Los Banos, Laguna.
o Lanting, Elaine – Animal Nutrition. Livestock Research Division, PCARRD, Los Banos, Laguna.
o Magboo, Eduedo – Participatory Research. Livestock Research Division, PCARRD, Los Banos, Laguna.
o Sair, Roseminda ‐ Regional Performance Trial (cut‐and‐carry system for smallholder production). MarianoMarcosStateUniversity, Batac, Ilocos Norte.
o San Buenaventura, Arlene –On‐farm Trials. Department of Agriculture, Regional Field Unit 5, Pili, Camarines Sur.
o Subsuban, Maizeelio ‐ Forages in Plantation Crops.
Philippine CarabaoCenter, University of Southern Mindanao, Kabacan, North Cotabato. Bureau of Animal Industry
o Research Division, Visayas Avenue, Diliman, Quezon City. o Moog, Francisco A. ‐ Farming Systems, Grassland Improvement and Technology Promotion. o Acasio, Remedios N. ‐ Forages in Farming Systems and Leucaena. o Marbella, Annabelle F. ‐ Seed Production and Animal Utilization.
Other Bureau of Animal Husbandry
o Deocareza, Anita G. ‐ Animal Utilization and Seed Production. o Milagros Stock Farm, Milagros, Masbate. o Diesta, Helen ‐ Pasture‐Livestock Integration Under Coconuts.
Sorsogon Dairy Farm, Sorsogon, Sorsogon. o Lariosa, Larry L. ‐ Grassland Improvement, Seed Production and Animal Utilization.
Buswanga Breeding and Experiment Station, Bureau of Animal Industry, Busuanga, Palawan. 11.) Dairy consumption trends (past 5 years) For per capita milk consumption trends, refer to Table 39 on page 139. “No Moo‐ing Matter”. The Manila Bulletin, 3 May 2010, At the recent Dairy Congress and Expo 2010 held in Cebu last month, the Dairy Confederation of the Philippines reported that dairy is approximately a 65 billion Peso (US $1.5 billion) business in the country, with milk being the country’s top agricultural import worth around US $500 million annually. Even with increasing world milk prices, the local demand for milk and milk products isn’t showing any signs of decreasing. Liquid milk consumption was at its highest in 2005, 25 times the consumption level in 1991. On a daily basis, this was 125,233 liters per day, well up from 5,424 liters per day in 1991.
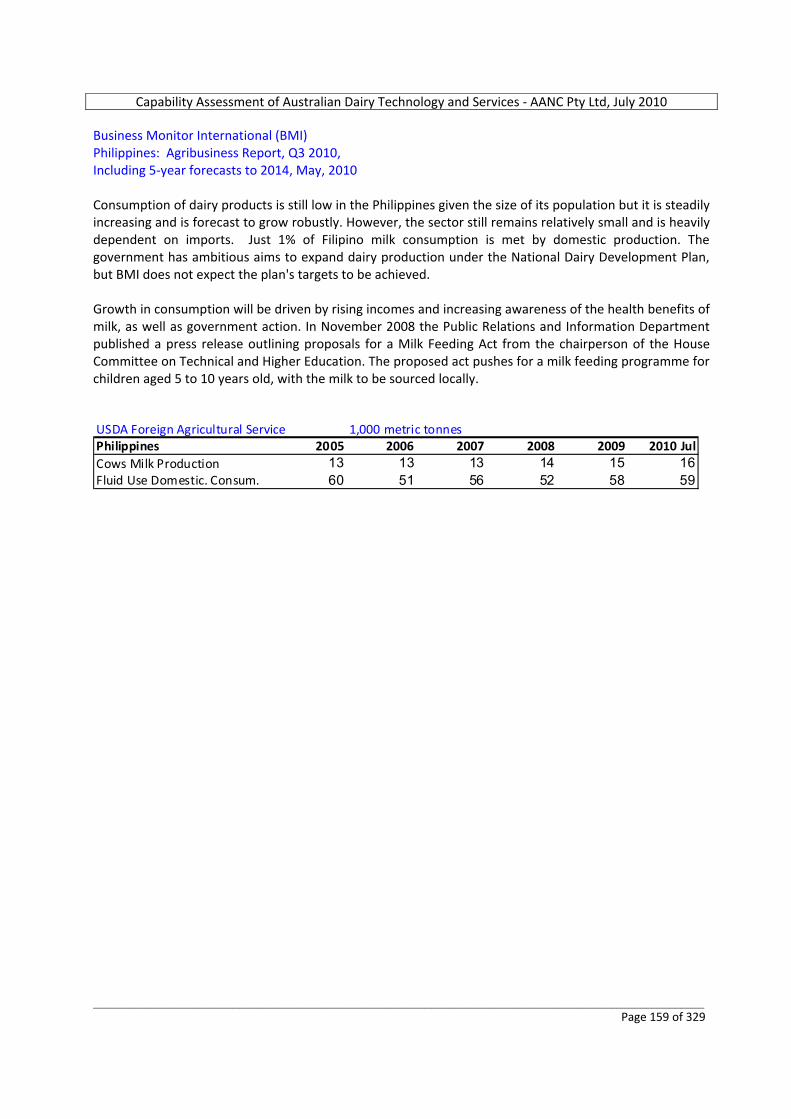
Capability Assessment of Australian Dairy Technology and Services ‐ AANC Pty Ltd, July 2010
_________________________________________________________________________________________________________ Page 159 of 329
Business Monitor International (BMI) Philippines: Agribusiness Report, Q3 2010, Including 5‐year forecasts to 2014, May, 2010 Consumption of dairy products is still low in the Philippines given the size of its population but it is steadily increasing and is forecast to grow robustly. However, the sector still remains relatively small and is heavily dependent on imports. Just 1% of Filipino milk consumption is met by domestic production. The government has ambitious aims to expand dairy production under the National Dairy Development Plan, but BMI does not expect the plan's targets to be achieved. Growth in consumption will be driven by rising incomes and increasing awareness of the health benefits of milk, as well as government action. In November 2008 the Public Relations and Information Department published a press release outlining proposals for a Milk Feeding Act from the chairperson of the House Committee on Technical and Higher Education. The proposed act pushes for a milk feeding programme for children aged 5 to 10 years old, with the milk to be sourced locally. USDA Foreign Agricultural Service 1,000 metric tonnesPhilippines 2005 2006 2007 2008 2009 2010 JulCows Milk Production 13 13 13 14 15 16Fluid Use Domestic. Consum. 60 51 56 52 58 59
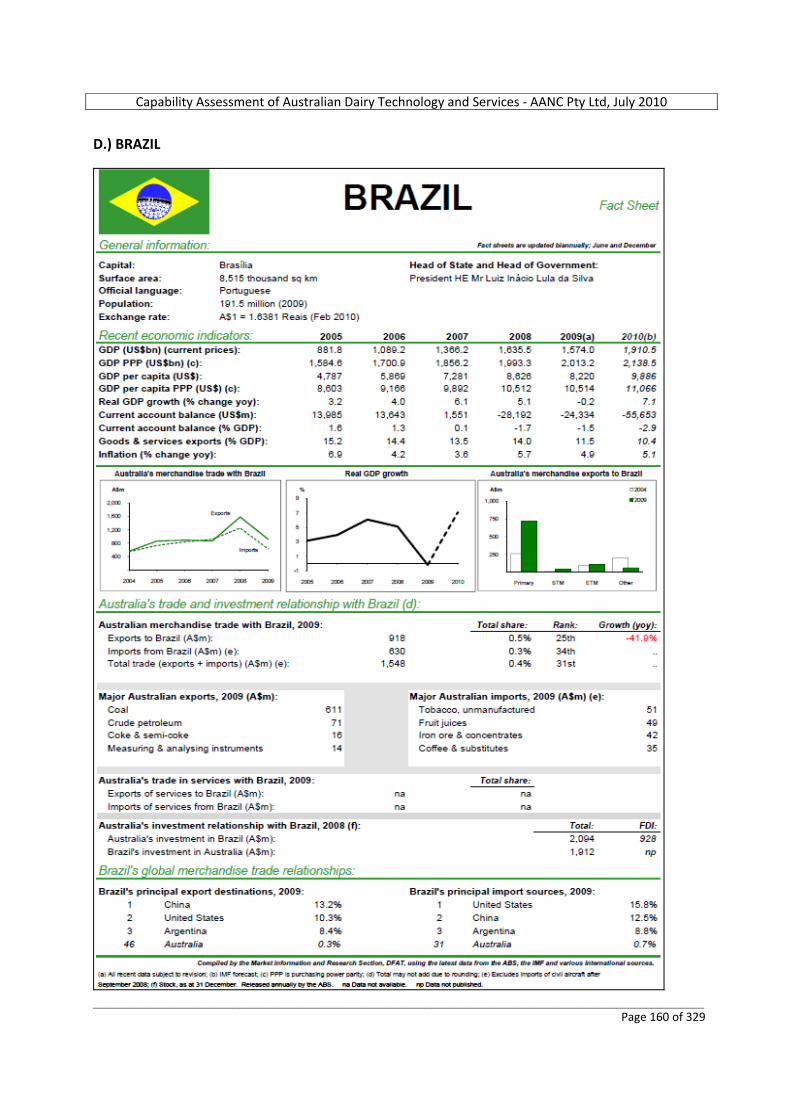
Capability Assessment of Australian Dairy Technology and Services ‐ AANC Pty Ltd, July 2010
_________________________________________________________________________________________________________ Page 160 of 329
D.) BRAZIL
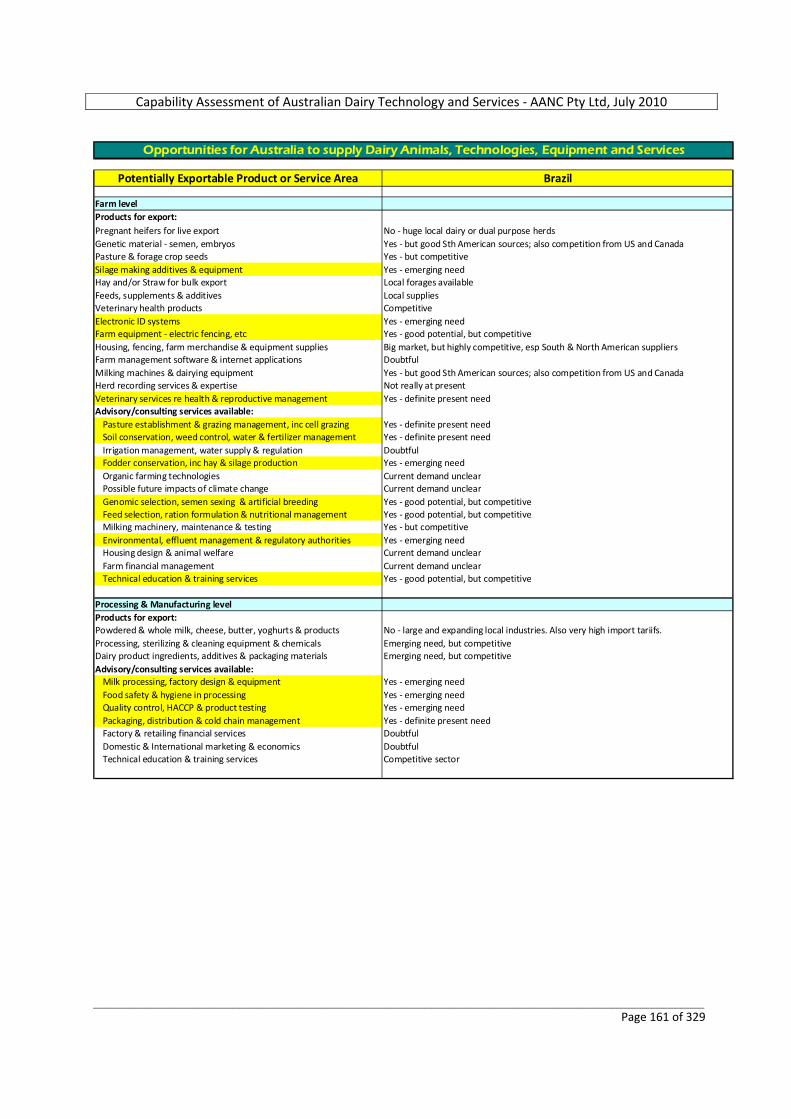
Capability Assessment of Australian Dairy Technology and Services ‐ AANC Pty Ltd, July 2010
_________________________________________________________________________________________________________ Page 161 of 329
Potentially Exportable Product or Service Area Brazil
Farm levelProducts for export:Pregnant heifers for live export No ‐ huge local dairy or dual purpose herdsGenetic material ‐ semen, embryos Yes ‐ but good Sth American sources; also competition from US and CanadaPasture & forage crop seeds Yes ‐ but competitiveSilage making additives & equipment Yes ‐ emerging needHay and/or Straw for bulk export Local forages availableFeeds, supplements & additives Local suppliesVeterinary health products CompetitiveElectronic ID systems Yes ‐ emerging needFarm equipment ‐ electric fencing, etc Yes ‐ good potential, but competitiveHousing, fencing, farm merchandise & equipment supplies Big market, but highly competitive, esp South & North American suppliersFarm management software & internet applications DoubtfulMilking machines & dairying equipment Yes ‐ but good Sth American sources; also competition from US and CanadaHerd recording services & expertise Not really at presentVeterinary services re health & reproductive management Yes ‐ definite present needAdvisory/consulting services available:
Pasture establishment & grazing management, inc cell grazing Yes ‐ definite present needSoil conservation, weed control, water & fertilizer management Yes ‐ definite present needIrrigation management, water supply & regulation DoubtfulFodder conservation, inc hay & silage production Yes ‐ emerging needOrganic farming technologies Current demand unclearPossible future impacts of climate change Current demand unclearGenomic selection, semen sexing & artificial breeding Yes ‐ good potential, but competitiveFeed selection, ration formulation & nutritional management Yes ‐ good potential, but competitiveMilking machinery, maintenance & testing Yes ‐ but competitiveEnvironmental, effluent management & regulatory authorities Yes ‐ emerging needHousing design & animal welfare Current demand unclearFarm financial management Current demand unclearTechnical education & training services Yes ‐ good potential, but competitive
Processing & Manufacturing levelProducts for export:Powdered & whole milk, cheese, butter, yoghurts & products No ‐ large and expanding local industries. Also very high import tariifs.Processing, sterilizing & cleaning equipment & chemicals Emerging need, but competitiveDairy product ingredients, additives & packaging materials Emerging need, but competitiveAdvisory/consulting services available:
Milk processing, factory design & equipment Yes ‐ emerging needFood safety & hygiene in processing Yes ‐ emerging needQuality control, HACCP & product testing Yes ‐ emerging needPackaging, distribution & cold chain management Yes ‐ definite present needFactory & retailing financial services DoubtfulDomestic & International marketing & economics DoubtfulTechnical education & training services Competitive sector
Opportunities for Australia to supply Dairy Animals, Technologies, Equipment and Services

Capability Assessment of Australian Dairy Technology and Services ‐ AANC Pty Ltd, July 2010
_________________________________________________________________________________________________________ Page 162 of 329
VALUE OF DAIRY INDUSTRY ‐ COMPARISON OF INTERNATIONAL TARGET MARKETS Figure 48. Retail value of Dairy Industries, with Brazil running a close 2nd to China amongst the 13 nominated overseas markets
0.0
5,000.0
10,000.0
15,000.0
20,000.0
25,000.0
US$ million
Brazil
China
Egypt
India
Indon
esia
Malays
ia
Mexico
Pakist
an
Philipp
ines
Russia
Saudi
Arabia
South
Africa
Vietna
m
Retail Value of Target Market Dairy Industries, 2009
Source: Euromonitor International, 2010 Figure 49. Retail value growth of Dairy Industries, CAGR % 2004‐2009, with Brazil running 8th amongst nominated markets
0.0
5.0
10.0
15.0
20.0
25.0
CAGR %
Brazil
China
Egypt
India
Indon
esia
Malays
ia
Mexico
Pakist
an
Philipp
ines
Russia
Saudi
Arabia
South
Africa
Vietna
m
Retail Value Growth of Target Market Dairy Industries, CAGR % 2004‐09
Source: Euromonitor International, 2010
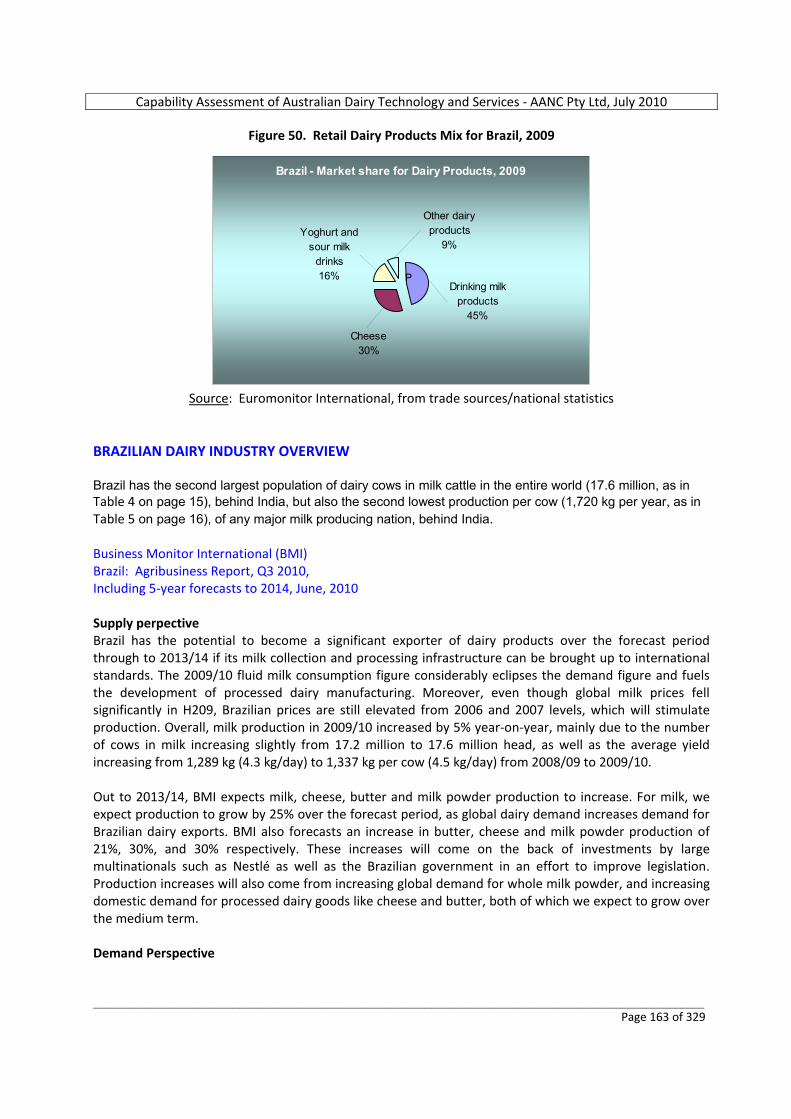
Capability Assessment of Australian Dairy Technology and Services ‐ AANC Pty Ltd, July 2010
_________________________________________________________________________________________________________ Page 163 of 329
Figure 50. Retail Dairy Products Mix for Brazil, 2009
Brazil - Market share for Dairy Products, 2009
Other dairy products
9%Yoghurt and
sour milk drinks16%
Cheese30%
Drinking milk products
45%
P
Source: Euromonitor International, from trade sources/national statistics
BRAZILIAN DAIRY INDUSTRY OVERVIEW Brazil has the second largest population of dairy cows in milk cattle in the entire world (17.6 million, as in Table 4 on page 15), behind India, but also the second lowest production per cow (1,720 kg per year, as in Table 5 on page 16), of any major milk producing nation, behind India. Business Monitor International (BMI) Brazil: Agribusiness Report, Q3 2010, Including 5‐year forecasts to 2014, June, 2010 Supply perpective Brazil has the potential to become a significant exporter of dairy products over the forecast period through to 2013/14 if its milk collection and processing infrastructure can be brought up to international standards. The 2009/10 fluid milk consumption figure considerably eclipses the demand figure and fuels the development of processed dairy manufacturing. Moreover, even though global milk prices fell significantly in H209, Brazilian prices are still elevated from 2006 and 2007 levels, which will stimulate production. Overall, milk production in 2009/10 increased by 5% year‐on‐year, mainly due to the number of cows in milk increasing slightly from 17.2 million to 17.6 million head, as well as the average yield increasing from 1,289 kg (4.3 kg/day) to 1,337 kg per cow (4.5 kg/day) from 2008/09 to 2009/10. Out to 2013/14, BMI expects milk, cheese, butter and milk powder production to increase. For milk, we expect production to grow by 25% over the forecast period, as global dairy demand increases demand for Brazilian dairy exports. BMI also forecasts an increase in butter, cheese and milk powder production of 21%, 30%, and 30% respectively. These increases will come on the back of investments by large multinationals such as Nestlé as well as the Brazilian government in an effort to improve legislation. Production increases will also come from increasing global demand for whole milk powder, and increasing domestic demand for processed dairy goods like cheese and butter, both of which we expect to grow over the medium term. Demand Perspective

Capability Assessment of Australian Dairy Technology and Services ‐ AANC Pty Ltd, July 2010
_________________________________________________________________________________________________________ Page 164 of 329
BMI forecasts fluid milk consumption to grow by 22.6% by 2014 to reach 13.36 million tonnes, with most of this drunk in the form of ultra‐heat treated (UHT) milk sold at supermarkets. (Large supermarket or hypermarket chains throughout Brazil include Carrefour, Wal‐Mart, Grupo Pao de Acucar and Lojas Americanas.) Consumption of fluid milk and processed dairy products will grow considerably in the coming years as rising incomes and improved infrastructure bring dairy products within reach of more of the population. The spread of modern retail out from the richer south into the north and north east will also boost the sale of dairy products. However, the remainder will likely be sold informally in independent shops or at the side of the road. Milk sold informally will often not have been pasteurised or been subject to government quality checks. In terms of processed goods, we forecast consumption of cheese to rise by 25.0% by 2014, with a large portion of this growth coming from the spread of fast food outlets. Despite this strong growth, we expect Brazil to remain a net exporter of cheese as production growth will be even stronger. Butter consumption will grow by 12.5% to 92,270 tonnes by 2014, with demand to be met by domestic production. However, towards the end of the forecast period, growth will be slowed by increased consumption of alternatives to butter such as margarine as Brazilian consumers increasingly look for healthier alternatives. Brazil the sleeping giant of milk trade Simone Smith, The Weekly Times (Victoria, Australia), 2 September 2009 Brazil and its emerging dairy industry has been labelled one of Australia's biggest threats. Dairy industry leaders have cited Brazil's low‐cost pasture‐based production, milk production growth and expansion on the global export market as reasons to keep an eye on the South American country when it came to the future of the world dairy commodity market. However, Dairy Australia's international industry analyst, Michael Harvey, said that while Brazil had been more active on the world market in the past 5 years, and now accounted for 5 % of world trade, ``they are not competition our industry cannot compete with. They are not significantly in any of our markets,'' he said. ``Little bits of trade are building up in Asia, but we are talking minuet amounts at this stage.'' Referring more to it as a “competitor'', Mr Harvey said Brazil had been described as the ``sleeping giant'' of the dairy sector. Brazil produced 30 billion litres of milk from 21 million cows last year. Of this, 150,000 tonnes of milk product hit the export market, worth an estimated US$544 million. Brazil's major markets are Venezuela, Argentina and the African region, and its major products are condensed milk and wholemilk powder. But Brazil still has a long way to catch up to the value of Australian exports, which tip the scales at US$2.1 billion. And, like the rest of the world, Brazil has not been immune from the rapid deterioration in global commodity market conditions. “There are emerging concerns about production levels in the second half of 2009 due to the high cost of production, combined with the recent decline in farmgate milk prices,'' Mr Harvey said. ``Already this year, a slowdown in production growth, coupled with rising local demand, has seen dairy exports fall. In the first half of 2009, Brazilian dairy exports were down by 40 %.'' Challenges for Brazilian dairy farmers include the high price of feed and fertiliser and some of the highest interest rates in the world. In terms of market expansion, Brazil's large domestic market could possibly swallow future production. “They have an enormous potential to grow and an enormous potential to consume that growth,'' Mr Harvey said.
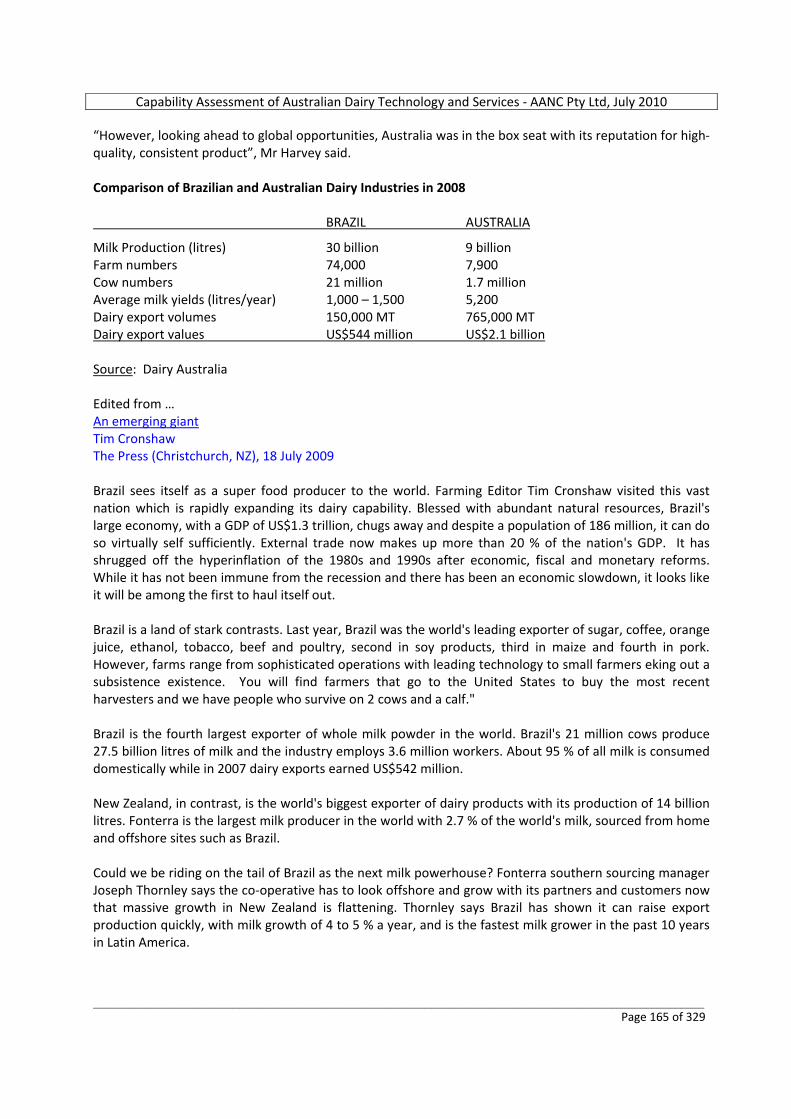
Capability Assessment of Australian Dairy Technology and Services ‐ AANC Pty Ltd, July 2010
_________________________________________________________________________________________________________ Page 165 of 329
“However, looking ahead to global opportunities, Australia was in the box seat with its reputation for high‐quality, consistent product”, Mr Harvey said. Comparison of Brazilian and Australian Dairy Industries in 2008 BRAZIL AUSTRALIA
Milk Production (litres) 30 billion 9 billion Farm numbers 74,000 7,900 Cow numbers 21 million 1.7 million Average milk yields (litres/year) 1,000 – 1,500 5,200 Dairy export volumes 150,000 MT 765,000 MT Dairy export values US$544 million US$2.1 billion Source: Dairy Australia Edited from … An emerging giant Tim Cronshaw The Press (Christchurch, NZ), 18 July 2009 Brazil sees itself as a super food producer to the world. Farming Editor Tim Cronshaw visited this vast nation which is rapidly expanding its dairy capability. Blessed with abundant natural resources, Brazil's large economy, with a GDP of US$1.3 trillion, chugs away and despite a population of 186 million, it can do so virtually self sufficiently. External trade now makes up more than 20 % of the nation's GDP. It has shrugged off the hyperinflation of the 1980s and 1990s after economic, fiscal and monetary reforms. While it has not been immune from the recession and there has been an economic slowdown, it looks like it will be among the first to haul itself out. Brazil is a land of stark contrasts. Last year, Brazil was the world's leading exporter of sugar, coffee, orange juice, ethanol, tobacco, beef and poultry, second in soy products, third in maize and fourth in pork. However, farms range from sophisticated operations with leading technology to small farmers eking out a subsistence existence. You will find farmers that go to the United States to buy the most recent harvesters and we have people who survive on 2 cows and a calf." Brazil is the fourth largest exporter of whole milk powder in the world. Brazil's 21 million cows produce 27.5 billion litres of milk and the industry employs 3.6 million workers. About 95 % of all milk is consumed domestically while in 2007 dairy exports earned US$542 million. New Zealand, in contrast, is the world's biggest exporter of dairy products with its production of 14 billion litres. Fonterra is the largest milk producer in the world with 2.7 % of the world's milk, sourced from home and offshore sites such as Brazil. Could we be riding on the tail of Brazil as the next milk powerhouse? Fonterra southern sourcing manager Joseph Thornley says the co‐operative has to look offshore and grow with its partners and customers now that massive growth in New Zealand is flattening. Thornley says Brazil has shown it can raise export production quickly, with milk growth of 4 to 5 % a year, and is the fastest milk grower in the past 10 years in Latin America.
Capability Assessment of Australian Dairy Technology and Services ‐ AANC Pty Ltd, July 2010
_________________________________________________________________________________________________________ Page 166 of 329
An indication of Brazil's incredible growth is that a decade ago it imported US$500 million of dairy products. Last year it exported about the same amount for a turnaround of US$1 bilion. Impacting on its competitiveness is the high exchange rate, but there is plenty of land which can be converted to dairying and room to reduce costs and increase farm production. However, the industry is also fragmented, and more consolidation of milk processing is needed. Brazilian farmers are probably in a better position than New Zealanders during the recession because they also grow corn and soyabeans. Brazilian cow breeds such as zebu are being mated with jersey genetics from New Zealand to produce more economical cows and more milk solids. Brazil, with its ample land and water, certainly appears a land of opportunity. Milk prices are currently US50c a litre (substantially higher than in Australia). Central Bank economist Alexandre Pundek is cautiously optimistic that the economy will improve and is in a better position than many other world economies. Pundek sees agriculture building in Brazil. "Brazil is the only place that has available land to feed the world. We have large areas of land like Australia, but two‐thirds of Australia is desert, Canada has two‐thirds of tundra and is too cold. China is a big desert, less than 10 % able to be cultivated, and India is the same because of mountains so the only place that can feed the Chinas and Indias is Brazil, so the potential to grow is enormous in the long term." Economics Professor Geraldo Barros of the University of Sao Paulo says Brazil is in good shape to grow. "I think Brazil is one of the most competitive countries in the agricultural sector. We have significant potential with a lot of land, relatively good supplies of water and the farmers and businesses to drive this." However the agriculture sector needs about $40 billion per year to develop land, farm machinery and industry for economic growth to continue at 4 to 5 per cent. Barros believes Brazil can become an agriculture superpower without intruding on the Amazon by developing 169 million hectares of degraded pasture. More than 60 % of that land is in the central western region and most likely will go under beef cattle, soyabeans and sugar cane. SWOT ANALYSIS Business Monitor International (BMI) Brazil: Agribusiness Report, Q3 2010, Including 5‐year forecasts to 2014, June, 2010 Brazil Agricultural Sector SWOT Strengths • With a vast land area and a range of climates, Brazil is naturally suited to large agricultural production
across a diversified range of products. • Brazil's large population provides a plentiful supply of labour with relatively low wages by developed
country standards and also a large market for goods. • Since the mid‐1980s, the government has substantially reduced its role in agriculture, freeing up
markets and privatising state enterprises. Weaknesses • The poor state of infrastructure outside of major population centres makes expansion of production
more difficult and hurts competitiveness due to increased costs. • There is a high level of debt among Brazilian farmers, restricting investment in improving production.
Capability Assessment of Australian Dairy Technology and Services ‐ AANC Pty Ltd, July 2010
_________________________________________________________________________________________________________ Page 167 of 329
• Poor hygiene and quality oversight leave Brazilian agriculture open to disease outbreaks and health scares such as the 'milk fraud' scandal in 2007.
Opportunities • Rising incomes will allow greater spending on food, ensuring strong domestic demand for the
country's agricultural output. • There are still plenty of opportunities for expanding agricultural production areas. • Yields in many sectors are still low by international standards, leaving plenty of room for sizeable
improvement. Threats • The world economic problems will cause demand for Brazil's agricultural exports and prices to fall. • The rapid expansion of agriculture into new areas threatens to bring the industry into conflict with
environmental and conservation groups. • High interest rates make borrowing expensive, restricting access to credit. The economic climate could
also threaten investment flows. Brazil Political SWOT Strengths • President Lula's administration remains committed to market‐friendly policies, and the president's
popularity remains at record highs. • Although corruption scandals continue to plague Lula's administration, a degree of accountability
continues to prevail, underpinning Brazil's democratic institutions. Weaknesses • Although the Partido dos Trabalhadores (PT) has long considered itself a major opponent of
corruption, the party has lost much of its legitimacy in this respect over the past few years. Opportunities • The recently passed 'barrier' electoral law, which restricts federal campaign financing for smaller
parties, may help improve Brazil's highly fragmented party environment by fostering coalition building.
• Brazil's growing political influence in the region may pave the way for the country to assume the role of regional leader, pioneering closer integration among Latin American countries.
Threats • The PT failed to secure enough state capitals during the October 2008 local elections to ensure a PT
victory in the 2010 presidential race. Brazil Economic SWOT Strengths • The government's commitment to primary fiscal surpluses has instilled confidence in the economy. • Confidence in the central bank and its response to shifting economic dynamics will help to keep long‐
term investors anchored. Weaknesses
Capability Assessment of Australian Dairy Technology and Services ‐ AANC Pty Ltd, July 2010
_________________________________________________________________________________________________________ Page 168 of 329
• Large‐scale social spending programmes have seen the government's fiscal balance deteriorate at an alarming rate. A growing sense of populism ahead of the 2010 election threatens to destabilise the public coffers for a prolonged period for a future administration.
• High levels of labour market rigidity and an enormous public sector threaten to jeopardise Brazil's economic recovery, as employers will be less keen to hire new workers.
Opportunities • Three investment grade upgrades for Brazil will maintain solid foreign investment levels into the
country, allowing a broader scope of foreign investors to become involved over the coming years. Combined with a competitive regional political outlook, this could stimulate large‐scale infrastructure development projects across the country once global risk appetite makes a decisive comeback.
Threats • The largest threat to Brazil's economy is the weak global macroeconomic outlook and only a very
weak recovery ahead. This would see demand for the country's commodities remain subdued over the medium term.
• The inability of President Lula's government to implement successful economic reforms, such as an overhaul of the tax system, which places a heavy burden on business and industry, while reforming the inflexible labour market, is a key threat to Brazil's economy. Should the government fail to make progress on these fronts, it would impede the modernisation and competitiveness of the Brazillian economy.
Brazil Business Environment SWOT Strengths • In complying with orthodox economic measures and encouraging financial intermediation, President
Lula has won the support of the IMF and much of the business community. This has contributed to a more stable and welcoming business climate.
• The Brazilian economy is one of the largest in the world, and benefits from a rich abundance of agricultural and mineral resources.
Weaknesses • Despite economic liberalisation, significant trade barriers and a complex customs system increase
business risk. Opportunities • Commitment to upgrade physical infrastructure is set to be boosted by the successful bid to host the
2016 Olympic Games in Rio de Janeiro, and the 2014 FIFA World Cup beforehand. • Recent onshore and offshore oil discoveries could help Brazil become a global oil giant. This will help
the country attract a wide range of investors and businesses over the long term. Threats • Tax reform and new labour legislation is needed to simplify the very complex, onerous tax system and
highly inflexible labour market. 1.) Historical data on the volume of dairy cattle and dairy equipment imports (from Australia and internationally) ‐ over past 5 years
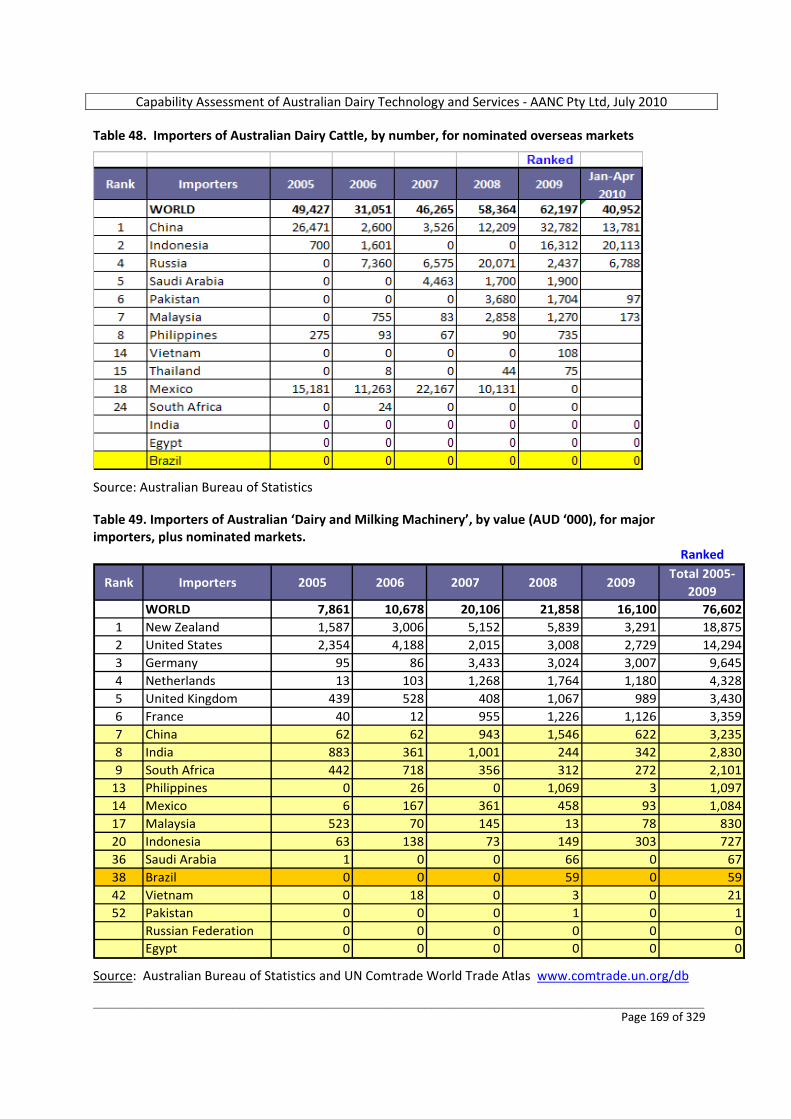
Capability Assessment of Australian Dairy Technology and Services ‐ AANC Pty Ltd, July 2010
_________________________________________________________________________________________________________ Page 169 of 329
Table 48. Importers of Australian Dairy Cattle, by number, for nominated overseas markets
Source: Australian Bureau of Statistics Table 49. Importers of Australian ‘Dairy and Milking Machinery’, by value (AUD ‘000), for major importers, plus nominated markets.
Ranked
Rank Importers 2005 2006 2007 2008 2009Total 2005‐
2009WORLD 7,861 10,678 20,106 21,858 16,100 76,602
1 New Zealand 1,587 3,006 5,152 5,839 3,291 18,8752 United States 2,354 4,188 2,015 3,008 2,729 14,2943 Germany 95 86 3,433 3,024 3,007 9,6454 Netherlands 13 103 1,268 1,764 1,180 4,3285 United Kingdom 439 528 408 1,067 989 3,4306 France 40 12 955 1,226 1,126 3,3597 China 62 62 943 1,546 622 3,2358 India 883 361 1,001 244 342 2,8309 South Africa 442 718 356 312 272 2,101
13 Philippines 0 26 0 1,069 3 1,09714 Mexico 6 167 361 458 93 1,08417 Malaysia 523 70 145 13 78 83020 Indonesia 63 138 73 149 303 72736 Saudi Arabia 1 0 0 66 0 6738 Brazil 0 0 0 59 0 5942 Vietnam 0 18 0 3 0 2152 Pakistan 0 0 0 1 0 1
Russian Federation 0 0 0 0 0 0Egypt 0 0 0 0 0 0
Source: Australian Bureau of Statistics and UN Comtrade World Trade Atlas www.comtrade.un.org/db
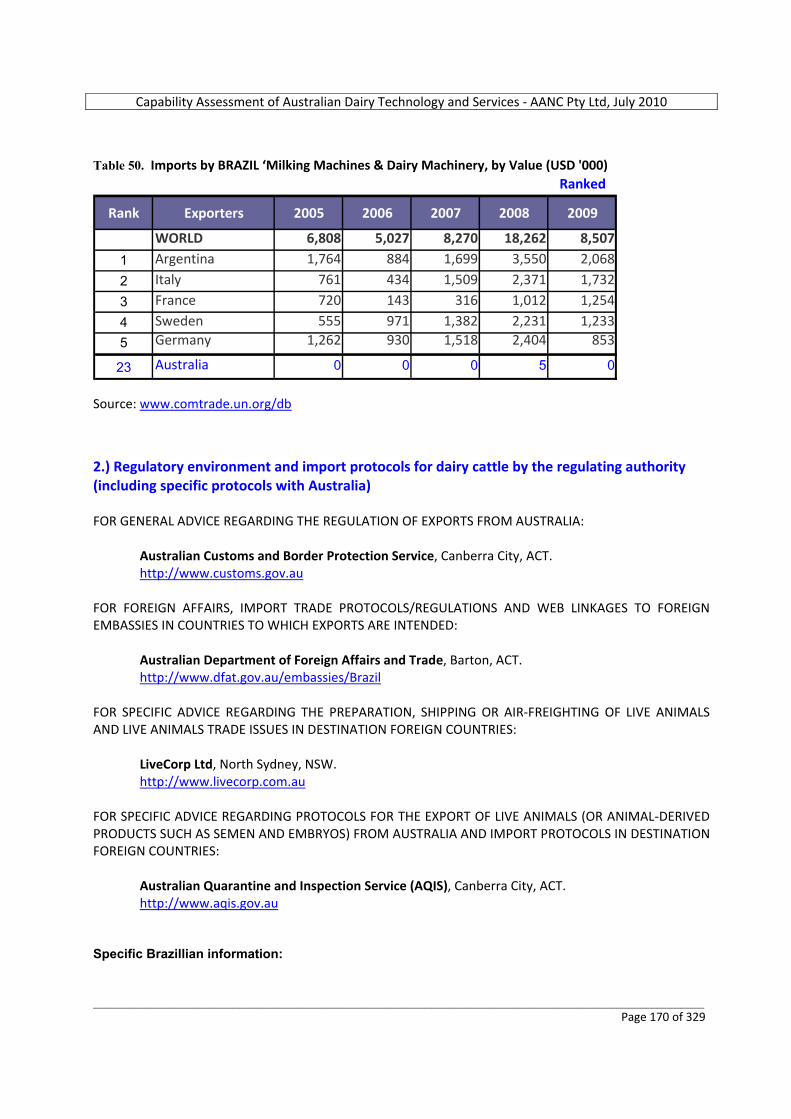
Capability Assessment of Australian Dairy Technology and Services ‐ AANC Pty Ltd, July 2010
_________________________________________________________________________________________________________ Page 170 of 329
Table 50. Imports by BRAZIL ‘Milking Machines & Dairy Machinery, by Value (USD '000)
Ranked
Rank Exporters 2005 2006 2007 2008 2009
WORLD 6,808 5,027 8,270 18,262 8,507
1 Argentina 1,764 884 1,699 3,550 2,068
2 Italy 761 434 1,509 2,371 1,732
3 France 720 143 316 1,012 1,254
4 Sweden 555 971 1,382 2,231 1,233
5 Germany 1,262 930 1,518 2,404 853
23 Australia 0 0 0 5 0
Source: www.comtrade.un.org/db 2.) Regulatory environment and import protocols for dairy cattle by the regulating authority (including specific protocols with Australia) FOR GENERAL ADVICE REGARDING THE REGULATION OF EXPORTS FROM AUSTRALIA:
Australian Customs and Border Protection Service, Canberra City, ACT. http://www.customs.gov.au
FOR FOREIGN AFFAIRS, IMPORT TRADE PROTOCOLS/REGULATIONS AND WEB LINKAGES TO FOREIGN EMBASSIES IN COUNTRIES TO WHICH EXPORTS ARE INTENDED:
Australian Department of Foreign Affairs and Trade, Barton, ACT. http://www.dfat.gov.au/embassies/Brazil
FOR SPECIFIC ADVICE REGARDING THE PREPARATION, SHIPPING OR AIR‐FREIGHTING OF LIVE ANIMALS AND LIVE ANIMALS TRADE ISSUES IN DESTINATION FOREIGN COUNTRIES:
LiveCorp Ltd, North Sydney, NSW. http://www.livecorp.com.au
FOR SPECIFIC ADVICE REGARDING PROTOCOLS FOR THE EXPORT OF LIVE ANIMALS (OR ANIMAL‐DERIVED PRODUCTS SUCH AS SEMEN AND EMBRYOS) FROM AUSTRALIA AND IMPORT PROTOCOLS IN DESTINATION FOREIGN COUNTRIES:
Australian Quarantine and Inspection Service (AQIS), Canberra City, ACT. http://www.aqis.gov.au
Specific Brazillian information:
Capability Assessment of Australian Dairy Technology and Services ‐ AANC Pty Ltd, July 2010
_________________________________________________________________________________________________________ Page 171 of 329
Despite economic liberalization in Brazil, significant trade barriers and a complex customs system increase business risk and impede industry development. Import duties in Brazil For countries outside MERCOSUR (South American Trade Agreement):
Live Bovine Animals – approx 27% Dairy Products in general – approx 55%
These import taxes are a serious impediment to potential dairy exporters from Australia and many other countries. 3.) Investment environment for dairy operations (domestic and foreign assistance, tax incentives, export zones, etc) and examples of FDI (from any country) Business Monitor International (BMI) Brazil: Agribusiness Report, Q3 2010, Including 5‐year forecasts to 2014, June, 2010 Despite the collapse in the world price of dairy products since mid‐2008, investment in the Brazilian dairy processing sector has continued. In August 2009, Nestlé announced that it would invest BRL120mn (US$64mn) expanding its factory in Araraquara, São Paulo, generating about 1,600 direct and indirect jobs. The new production plant opened in November 2009 and has an annual product capacity of 100mn litres of drinking milk. With transportation and refrigeration infrastructure often poor in Brazil, long‐life milk is popular as it is easier to transport and store. In November 2009, Nestlé was reported to be in talks to buy a plant that used to belong to Parmalat Brasil for US$59.3mn. Nestlé and its Dairy Partners Americas (DPA) subsidiary were the largest buyers of milk in 2008, accounting for 1.8bn litres. In August 2009, domestic dairy major Laticínios Bom Gosto purchased a disused dairy processing plant from Nestlé in Rio de Janeiro state. The company will invest BRL29mn in the purchase and refurbishment of the plant, local news reported. The company will be assisted by incentives such as tax breaks provided by the state government to encourage the development of dairy production. The new investment is a vote of confidence in the continuing growth of demand for dairy products in Brazil, particularly at a time when credit for expansion is hard to come by. Nestlé's investment comes at an opportune time for Brazil's dairy sector. Not only does it have much room for expansion, the sector also has numerous export opportunities. By 2014, we expect Brazil to be firmly established as an exporter of dairy products as production at home outpaces consumption growth and demand grows on the world market, particularly from other emerging markets. Brazil's 2009/10 Plano Agrícola e Pecuária (PAP) also lends support to the country's dairy producers in the form of subsidised interests rates at 6.75% and a 15% increase in the minimum price of milk. Milk producers in some states also qualify for exemption of the ICMS tax on goods and services on the sale of milk by producers and cooperatives. As stated previously, in the SWOT analysis, tax reform and new labour legislation is needed in Brazil to simplify the very complex, onerous tax system and highly inflexible labour market.
Capability Assessment of Australian Dairy Technology and Services ‐ AANC Pty Ltd, July 2010
_________________________________________________________________________________________________________ Page 172 of 329
Brazil: Danone invests in Ceara Valor Economico, 8 January 2010 SABI ‐ South American Business Information. Eleven years after stopping activities in the unit of Maracanau (Ceara), Danone is investing R$60 million in the expansion and modernisation of the plant that would be reopened as of July. The idea is to be producing 50.000 tons of yogurt per year. The re‐inauguration of the unit is part of Danone's regionalisation strategy, started 3 years ago and aimed to conquering space in the Northeast market, led by Nestle. The firm opted by staying in Ceara, attracted by tax incentives. Right now, Danone is selecting the milk suppliers in the region, following quality and sanitary standards. The partnership with the local dairy cattle farmers is suppose to be following the same lines adopted in Pocos de Caldas (Minas Gerais), with Danone supporting local producers with technology and quality training and seeking partnerships with banks to finance the production of milk. With the reopening of Maracanau unit, a total of 1,100 indirect and direct job positions will be created. The firm also plans the launching of regional fruits yogurts, in order to boost up sales that rose 30% in the region last year, in comparison with 2009. Danone has got 14% market share in the fresh dairy segment in Brazil, being present in almost 30% of the households. In the functional yogurt segment, Danone leads with 56% market share with Activia. The firm also leads the light yogurts segment with 34% of sales. Food Engineering, 1 March 2010 ISSN: 0193‐323X; Volume 82; Issue 3. 2010 Gale Group Inc. Nestle. (Plant Openings & Expansions) Nestle will build a new aseptic milk production plant in Ararquara, Brazil, which is expected to produce 100 million liters of drinking milk annually. With an investment of about $65 million, the facility is expected to generate more than 1,600 jobs in the region. Austrade Office, Brazil: There is no specific special treatment for dairy investment, but there is a great number of fiscal incentives in the preferred business areas, specially in the Brazilian north east, West Bahia State included, plus a great number of official Governments’ low interest loans for dairy development. Possibly some export zones for dairy. Need confirmation. FDI NZ is the most well know example of dairy production while Nestle is the main dairy processing company. Tim Cronshaw. The Press (Christchurch, NZ), 18 July 2009 NZ Trade and Enterprise regional manager Jessica Acherboim says “Agribusiness is important for Brazil, but it has (well) developed automotive, technology, laboratory, pharmaceutical and petro chemical industries. Brazil welcomes injections of capital by foreign companies”, she says. "We have a lot of land available. Previously, Brazil preferred to invest in land rather than technology, but this is changing, because they have to change for exporting. When we talk about processing and technology we are very sophisticated, but we see development in the primary sector for crops and cattle." Among NZ companies to enter Brazil are PGG Wrightson in pasture seeds and Rissington Breedlines, and of course, Fonterra.
Capability Assessment of Australian Dairy Technology and Services ‐ AANC Pty Ltd, July 2010
_________________________________________________________________________________________________________ Page 173 of 329
http://www.rabobank.com/content/news/news_archive/037_Asian_companies_on_the_rise_in_Global_Dairy_Top20.jsp Rabobank has just released its latest list of Top 20 global dairy companies and predicts that Brazil will have a spot in next year’s list if the proposed merger between Itambé, Centro Leche, Confepar, Mineiras Cemil and Mines Milk is successfully completed. 4.) National government programs to assist with the development of dairy operations Business Monitor International (BMI) Brazil: Agribusiness Report, Q3 2010, Including 5‐year forecasts to 2014, June, 2010 With milk yields in Brazil so low by international standards, there is plenty of room for improvement. The area under agriculture keeps expanding and dairy production may be able to realise growth without yield improvements, but as new land becomes more expensive, yields will have to be raised for the industry to keep growing. The government of Brazil, as well as large dairy processors with links to milk producers, are working to improve this by encouraging farmers to invest in pasture improvement and cattle stock. The government runs a number of programmes offering soft loans for farmers to be used in investment to increase production. CMN stimulates dairy cattle sector Gazeta Mercantil, 31 January 2009 © Copyright e Distribuição Online Brasil Mídia Digital Ltda ‐ Todos os Direitos Reservados BRASÍLIA, SÃO PAULO AND CURITIBA, 30 de janeiro de 2009 ‐ The National Monetary Council (CMN) increased the resources available to stimulate the raising of dairy cattle. It approved raising the limit of resources to be passed along to the sector from as Federal Government Loans (EGF) and Special Credit Lines (LEC). In EGFs, the loan ceiling jumped from R$10 million (US$4.4 million) to R$20 million (US$8.7 million). In LECs, it moved from R$15 million (US$6.5 million) to R$20 million. The CMN also approved shifting another R$700 million (US$305 million) from the Cooperatives Development Program to the Aggregation of Production Value for Farm and Ranch (Prodecoop) program, toward helping the cooperatives build up operating capital. 5.) Existing or proposed external assistance programs to develop the industry (foreign government and/or aid programs) Austrade Office, Brazil: “Not that I am aware of”. 6.) Overview of the typical dairy farming arrangements FAO Country Pasture/Forage Resource Profiles, Brazil Paulo César de Faccio Carvalho, 2002
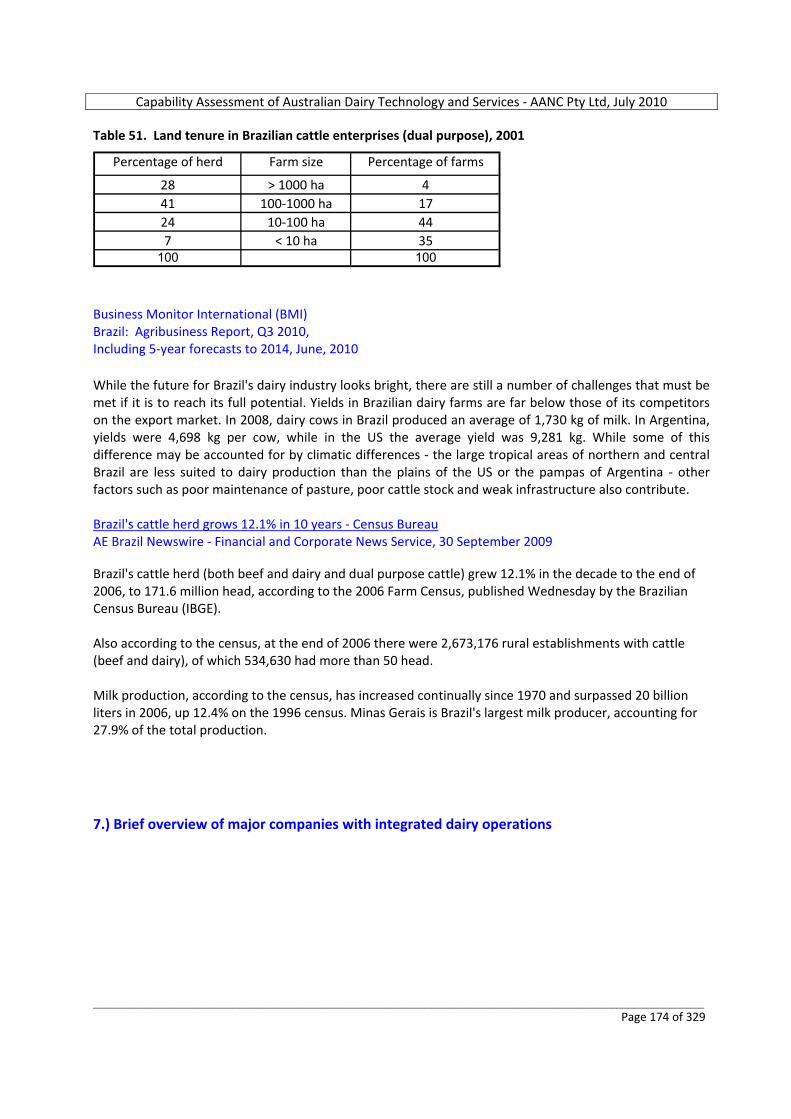
Capability Assessment of Australian Dairy Technology and Services ‐ AANC Pty Ltd, July 2010
_________________________________________________________________________________________________________ Page 174 of 329
Table 51. Land tenure in Brazilian cattle enterprises (dual purpose), 2001
Percentage of herd Farm size Percentage of farms
28 > 1000 ha 441 100‐1000 ha 1724 10‐100 ha 447 < 10 ha 35
100 100 Business Monitor International (BMI) Brazil: Agribusiness Report, Q3 2010, Including 5‐year forecasts to 2014, June, 2010 While the future for Brazil's dairy industry looks bright, there are still a number of challenges that must be met if it is to reach its full potential. Yields in Brazilian dairy farms are far below those of its competitors on the export market. In 2008, dairy cows in Brazil produced an average of 1,730 kg of milk. In Argentina, yields were 4,698 kg per cow, while in the US the average yield was 9,281 kg. While some of this difference may be accounted for by climatic differences ‐ the large tropical areas of northern and central Brazil are less suited to dairy production than the plains of the US or the pampas of Argentina ‐ other factors such as poor maintenance of pasture, poor cattle stock and weak infrastructure also contribute. Brazil's cattle herd grows 12.1% in 10 years ‐ Census Bureau AE Brazil Newswire ‐ Financial and Corporate News Service, 30 September 2009 Brazil's cattle herd (both beef and dairy and dual purpose cattle) grew 12.1% in the decade to the end of 2006, to 171.6 million head, according to the 2006 Farm Census, published Wednesday by the Brazilian Census Bureau (IBGE). Also according to the census, at the end of 2006 there were 2,673,176 rural establishments with cattle (beef and dairy), of which 534,630 had more than 50 head. Milk production, according to the census, has increased continually since 1970 and surpassed 20 billion liters in 2006, up 12.4% on the 1996 census. Minas Gerais is Brazil's largest milk producer, accounting for 27.9% of the total production. 7.) Brief overview of major companies with integrated dairy operations
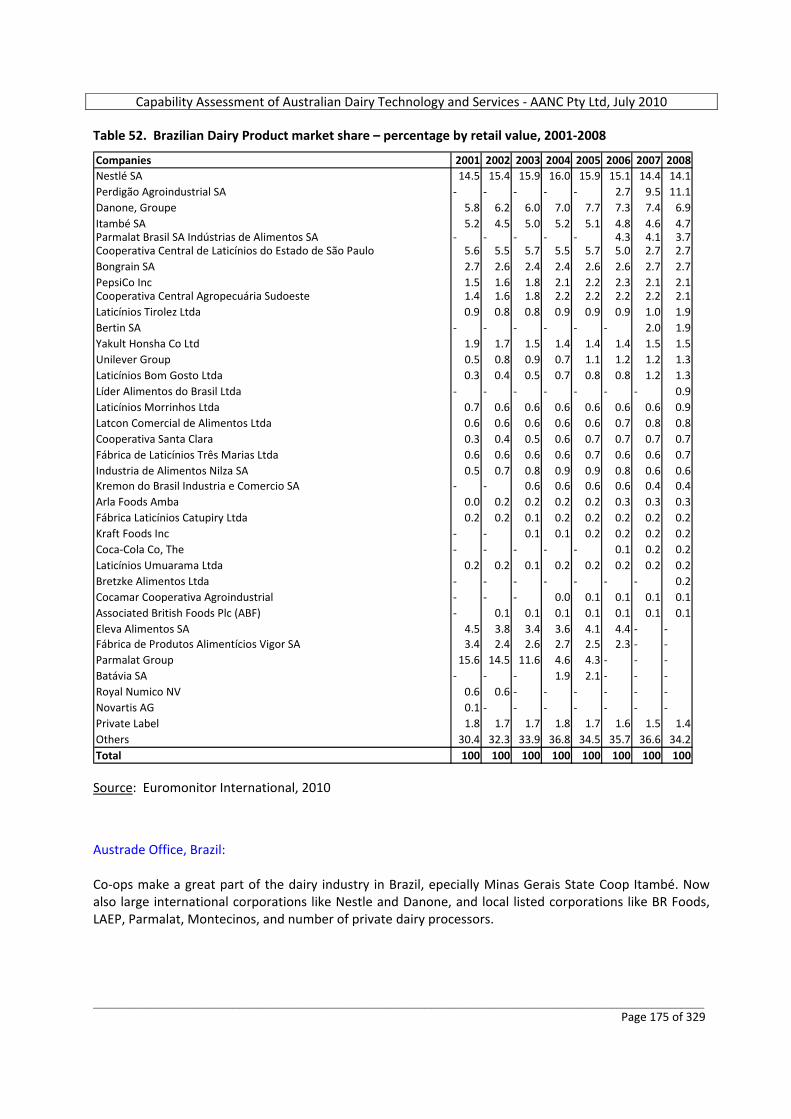
Capability Assessment of Australian Dairy Technology and Services ‐ AANC Pty Ltd, July 2010
_________________________________________________________________________________________________________ Page 175 of 329
Table 52. Brazilian Dairy Product market share – percentage by retail value, 2001‐2008
Companies 2001 2002 2003 2004 2005 2006 2007 2008Nestlé SA 14.5 15.4 15.9 16.0 15.9 15.1 14.4 14.1Perdigão Agroindustrial SA ‐ ‐ ‐ ‐ ‐ 2.7 9.5 11.1Danone, Groupe 5.8 6.2 6.0 7.0 7.7 7.3 7.4 6.9Itambé SA 5.2 4.5 5.0 5.2 5.1 4.8 4.6 4.7Parmalat Brasil SA Indústrias de Alimentos SA ‐ ‐ ‐ ‐ ‐ 4.3 4.1 3.7Cooperativa Central de Laticínios do Estado de São Paulo 5.6 5.5 5.7 5.5 5.7 5.0 2.7 2.7Bongrain SA 2.7 2.6 2.4 2.4 2.6 2.6 2.7 2.7PepsiCo Inc 1.5 1.6 1.8 2.1 2.2 2.3 2.1 2.1Cooperativa Central Agropecuária Sudoeste 1.4 1.6 1.8 2.2 2.2 2.2 2.2 2.1Laticínios Tirolez Ltda 0.9 0.8 0.8 0.9 0.9 0.9 1.0 1.9Bertin SA ‐ ‐ ‐ ‐ ‐ ‐ 2.0 1.9Yakult Honsha Co Ltd 1.9 1.7 1.5 1.4 1.4 1.4 1.5 1.5Unilever Group 0.5 0.8 0.9 0.7 1.1 1.2 1.2 1.3Laticínios Bom Gosto Ltda 0.3 0.4 0.5 0.7 0.8 0.8 1.2 1.3Líder Alimentos do Brasil Ltda ‐ ‐ ‐ ‐ ‐ ‐ ‐ 0.9Laticínios Morrinhos Ltda 0.7 0.6 0.6 0.6 0.6 0.6 0.6 0.9Latcon Comercial de Alimentos Ltda 0.6 0.6 0.6 0.6 0.6 0.7 0.8 0.8Cooperativa Santa Clara 0.3 0.4 0.5 0.6 0.7 0.7 0.7 0.7Fábrica de Laticínios Três Marias Ltda 0.6 0.6 0.6 0.6 0.7 0.6 0.6 0.7Industria de Alimentos Nilza SA 0.5 0.7 0.8 0.9 0.9 0.8 0.6 0.6Kremon do Brasil Industria e Comercio SA ‐ ‐ 0.6 0.6 0.6 0.6 0.4 0.4Arla Foods Amba 0.0 0.2 0.2 0.2 0.2 0.3 0.3 0.3Fábrica Laticínios Catupiry Ltda 0.2 0.2 0.1 0.2 0.2 0.2 0.2 0.2Kraft Foods Inc ‐ ‐ 0.1 0.1 0.2 0.2 0.2 0.2Coca‐Cola Co, The ‐ ‐ ‐ ‐ ‐ 0.1 0.2 0.2Laticínios Umuarama Ltda 0.2 0.2 0.1 0.2 0.2 0.2 0.2 0.2Bretzke Alimentos Ltda ‐ ‐ ‐ ‐ ‐ ‐ ‐ 0.2Cocamar Cooperativa Agroindustrial ‐ ‐ ‐ 0.0 0.1 0.1 0.1 0.1Associated British Foods Plc (ABF) ‐ 0.1 0.1 0.1 0.1 0.1 0.1 0.1Eleva Alimentos SA 4.5 3.8 3.4 3.6 4.1 4.4 ‐ ‐Fábrica de Produtos Alimentícios Vigor SA 3.4 2.4 2.6 2.7 2.5 2.3 ‐ ‐Parmalat Group 15.6 14.5 11.6 4.6 4.3 ‐ ‐ ‐Batávia SA ‐ ‐ ‐ 1.9 2.1 ‐ ‐ ‐Royal Numico NV 0.6 0.6 ‐ ‐ ‐ ‐ ‐ ‐Novartis AG 0.1 ‐ ‐ ‐ ‐ ‐ ‐ ‐Private Label 1.8 1.7 1.7 1.8 1.7 1.6 1.5 1.4Others 30.4 32.3 33.9 36.8 34.5 35.7 36.6 34.2Total 100 100 100 100 100 100 100 100 Source: Euromonitor International, 2010 Austrade Office, Brazil: Co‐ops make a great part of the dairy industry in Brazil, epecially Minas Gerais State Coop Itambé. Now also large international corporations like Nestle and Danone, and local listed corporations like BR Foods, LAEP, Parmalat, Montecinos, and number of private dairy processors.

Capability Assessment of Australian Dairy Technology and Services ‐ AANC Pty Ltd, July 2010
_________________________________________________________________________________________________________ Page 176 of 329
Cooperativa Central dos Produtores Rurais de Minas Gerais (CCPR/Itambé) The Itambé cooperative is the second largest dairy manufacturer in Brazil and the largest locally‐owned. It is a tier‐two, central cooperative formed by 27 tier‐one, local cooperatives and procures 100 million litres of milk per month from more than eight thousand milk producers. Itambé has eight plants, including milk powder and condensed milk processing plants both in its home state and also in the state of Goiás and two animal feed plants. 8.) Availability of forage and raw materials for feed & nutrition FAO Country Pasture/Forage Resource Profiles, Brazil Paulo César de Faccio Carvalho, 2002 The eastern portion of Brazil comprises only 12% of the country but is responsible for almost 50% of all milk produced and nearly 22.8% of the total Brazilian cattle herd of around 36 million (1997 figure), with dairy enterprises being predominant. This is Brazil’s richest region and the most important agricultural and industrial centre, containing 70% of the population. Most of the dairy production is based on pastures developed on cleared pasture‐land, where Melinis minutiflora predominated on the poorer soils of steep slopes, Pennisetum purpureum is another important forage in dairy areas. On some of the remaining fertile soils, Panicum maximum had thrived and is still the main beef pasture for the region. Cultivated pastures can provide conditions for high levels of animal productivity (25 to 30,000 kg milk/ha per year and 1,000 to 1,600 kg LWG/ha per year in well fertilized soils, producing more than 30,000 kg DM during the growing season. Digitaria decumbens, Brachiaria decumbens and Brachiaria humidicola are still important locally. Grazing animals are commonly fed supplements during the summer/autumn period. In dairy enterprises this strategy has been widely used, with an average response of around 1.4 kg of milk/kg of concentrate supplementation expected for lactating cows on temperate and tropical grasses. Animal production from tropical pasture‐based systems has high productivity potential when soil fertility is adequate (e.g., fertilizers are used) and more than 25,000 kg milk/ha/year and 900 kg liveweight gain/ha/year can be obtained. USDA Foreign Agricultural Service. Global Agricultural Information Network. GAIN Report Number: BR0605. Date 3/16/2010 Brazil – Grain and Feed Annual, 2010. USDA forecasts corn production in 2009/10 at 51 million metric tons (MMT) and trade year exports at 7.2 MMT, due to good yields. Corn production for 2010/11 is expected to drop slightly to 50 MMT and exports are expected to reach 8 MMT. In 2009/10, Brazil’s expected rice production is down 9 % to 7.85 MMT (milled), necessitating imports of 1 MMT of rice with possibly some U.S. imports. Exports for 2009/10 are estimated at 300,000 metric tons (MT). Rice production in 2010/11 is expected to rebound to 8.3 MMT as a result of normal weather conditions. As a result, 2010/11 rice imports are anticipated to return to a more typical level of 700,000 MT and exports to reach 500,000 MT. USDA’s estimate of wheat imports in 2009/10 at 6.5 MMT remains unchanged. Moreover, 2010/11 wheat production is expected to remain stable with quality improvements as a result of normalized weather conditions. Therefore, 2010/11 wheat imports are anticipated to decrease slightly to 6.2 MMT.
Capability Assessment of Australian Dairy Technology and Services ‐ AANC Pty Ltd, July 2010
_________________________________________________________________________________________________________ Page 177 of 329
9.) Availability of Artificial Insemination laboratories and testing facilities for cattle; also veterinary services Austrade Office, Brazil: Extensevely through out the country, including Holland Genetics‐CRV/CRI/ABS and others. 10.) Agribusiness educational facilities to support dairy production Austrade Office, Brazil: Extensively through out the country, including Government extension facilities, Universities, Technical Colleges and others. FAO Country Pasture/Forage Resource Profiles, Brazil Paulo César de Faccio Carvalho, 2002 Key agricultural institutions in Brazil include: o Empresa Brasileira de Pesquisa Agropecuária: www.embrapa.br o EMATER: www.emater.tche.br o Universidade Federal do Rio Grande do Sul: www.ufrgs.br o Universidade Federal de Viçosa: www.ufv.br o Universidade Federal de Lavras: www.ufla.br o Universidade Federal Rural do Rio de Janeiro: www.ufrrj.br o Universidade de Brasília: www.unb.br o Universidade de São Paulo: www.usp.br o Universidade Estadual Paulista: www.unesp.br o Universidade Estadual de Maringá: www.uem.br o Instituto de Zootecnia: www.iz.sp.gov.br o Fundação Estadual de Pesquisa Agropecuária: www.fepagro.rs.gov.br o Sociedade Brasileira de Zootecnia: www.sbz.org.br o Conselho Nacional de Pesquisa e Desenvolvimento Tecnológico: www.cnpq.br o Coordenadoria de Aperfeiçoamento de Pessoal de Nível Superior: www.capes.gov.br 11.) Dairy consumption trends (past 5 years)
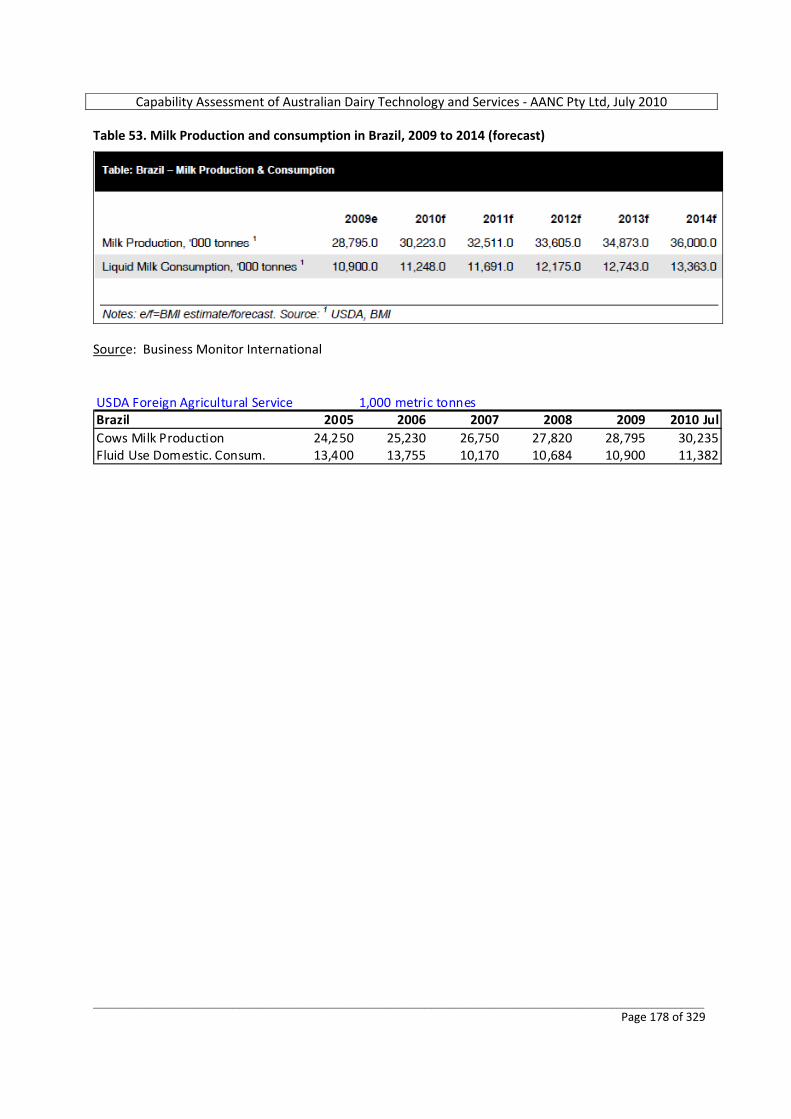
Capability Assessment of Australian Dairy Technology and Services ‐ AANC Pty Ltd, July 2010
_________________________________________________________________________________________________________ Page 178 of 329
Table 53. Milk Production and consumption in Brazil, 2009 to 2014 (forecast)
Source: Business Monitor International USDA Foreign Agricultural Service 1,000 metric tonnesBrazil 2005 2006 2007 2008 2009 2010 JulCows Milk Production 24,250 25,230 26,750 27,820 28,795 30,235Fluid Use Domestic. Consum. 13,400 13,755 10,170 10,684 10,900 11,382
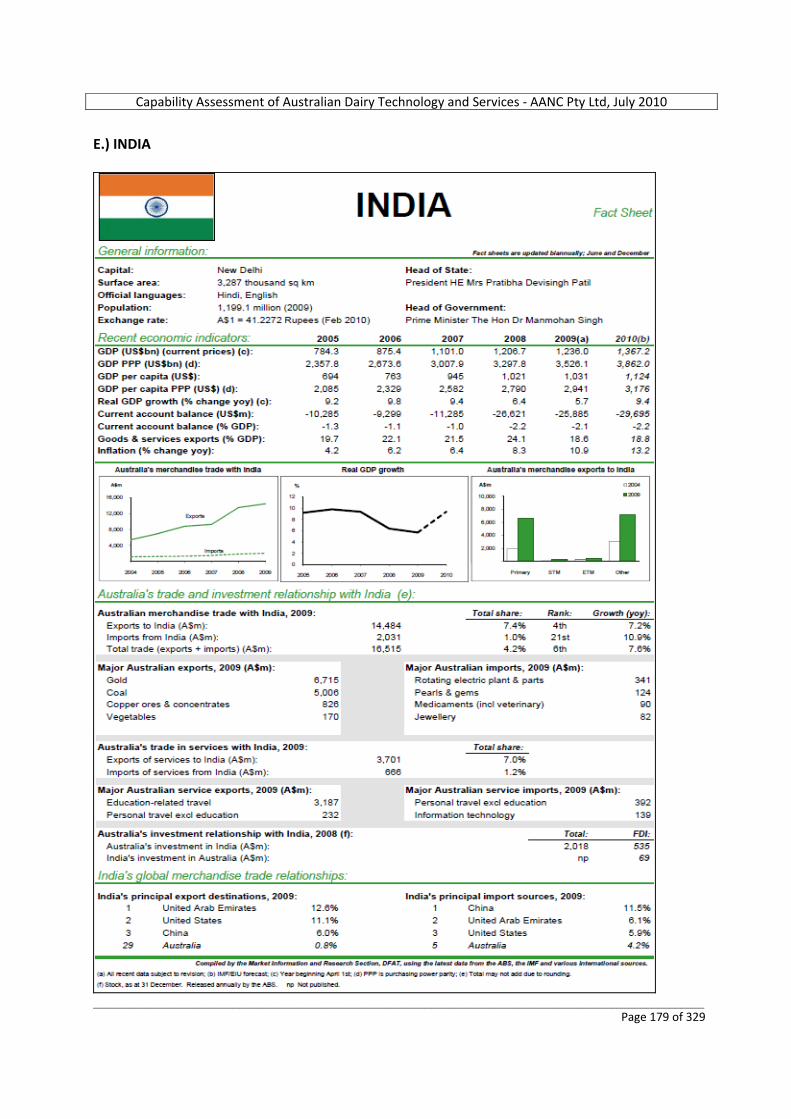
Capability Assessment of Australian Dairy Technology and Services ‐ AANC Pty Ltd, July 2010
_________________________________________________________________________________________________________ Page 179 of 329
E.) INDIA
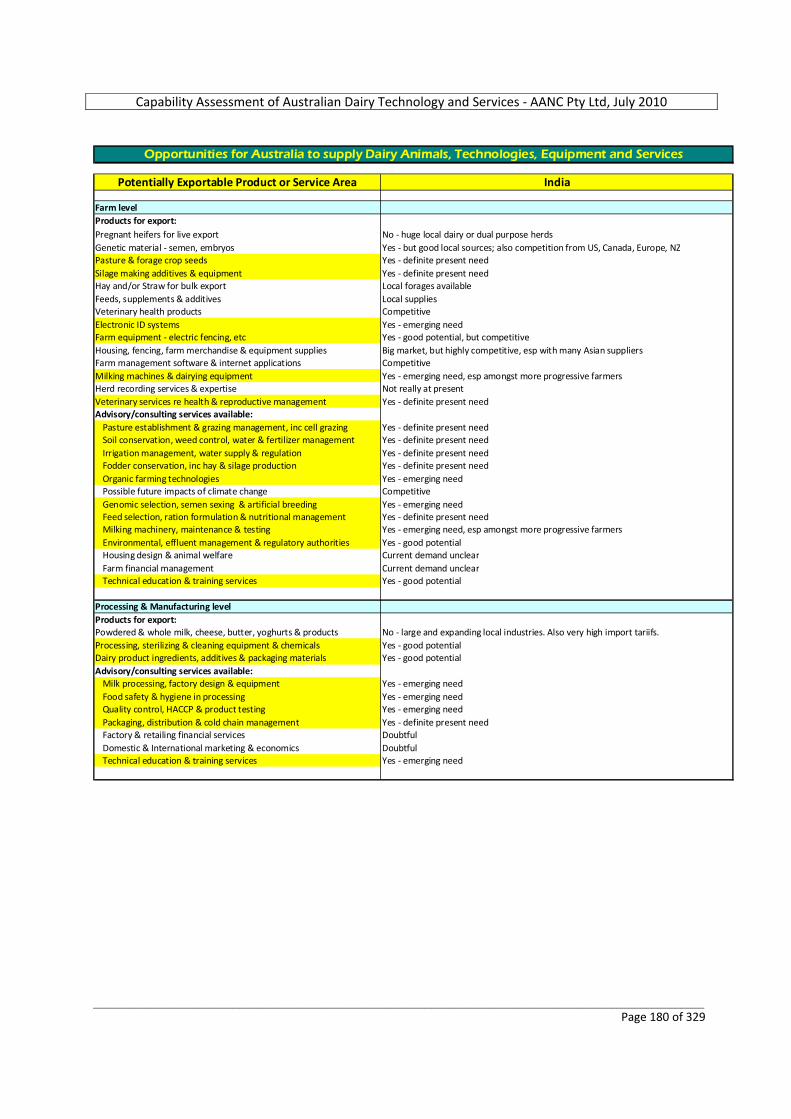
Capability Assessment of Australian Dairy Technology and Services ‐ AANC Pty Ltd, July 2010
_________________________________________________________________________________________________________ Page 180 of 329
Potentially Exportable Product or Service Area India
Farm levelProducts for export:Pregnant heifers for live export No ‐ huge local dairy or dual purpose herdsGenetic material ‐ semen, embryos Yes ‐ but good local sources; also competition from US, Canada, Europe, NZPasture & forage crop seeds Yes ‐ definite present needSilage making additives & equipment Yes ‐ definite present needHay and/or Straw for bulk export Local forages availableFeeds, supplements & additives Local suppliesVeterinary health products CompetitiveElectronic ID systems Yes ‐ emerging needFarm equipment ‐ electric fencing, etc Yes ‐ good potential, but competitiveHousing, fencing, farm merchandise & equipment supplies Big market, but highly competitive, esp with many Asian suppliersFarm management software & internet applications CompetitiveMilking machines & dairying equipment Yes ‐ emerging need, esp amongst more progressive farmersHerd recording services & expertise Not really at presentVeterinary services re health & reproductive management Yes ‐ definite present needAdvisory/consulting services available:
Pasture establishment & grazing management, inc cell grazing Yes ‐ definite present needSoil conservation, weed control, water & fertilizer management Yes ‐ definite present needIrrigation management, water supply & regulation Yes ‐ definite present needFodder conservation, inc hay & silage production Yes ‐ definite present needOrganic farming technologies Yes ‐ emerging needPossible future impacts of climate change CompetitiveGenomic selection, semen sexing & artificial breeding Yes ‐ emerging needFeed selection, ration formulation & nutritional management Yes ‐ definite present needMilking machinery, maintenance & testing Yes ‐ emerging need, esp amongst more progressive farmersEnvironmental, effluent management & regulatory authorities Yes ‐ good potentialHousing design & animal welfare Current demand unclearFarm financial management Current demand unclearTechnical education & training services Yes ‐ good potential
Processing & Manufacturing levelProducts for export:Powdered & whole milk, cheese, butter, yoghurts & products No ‐ large and expanding local industries. Also very high import tariifs.Processing, sterilizing & cleaning equipment & chemicals Yes ‐ good potentialDairy product ingredients, additives & packaging materials Yes ‐ good potentialAdvisory/consulting services available:
Milk processing, factory design & equipment Yes ‐ emerging needFood safety & hygiene in processing Yes ‐ emerging needQuality control, HACCP & product testing Yes ‐ emerging needPackaging, distribution & cold chain management Yes ‐ definite present needFactory & retailing financial services DoubtfulDomestic & International marketing & economics DoubtfulTechnical education & training services Yes ‐ emerging need
Opportunities for Australia to supply Dairy Animals, Technologies, Equipment and Services

Capability Assessment of Australian Dairy Technology and Services ‐ AANC Pty Ltd, July 2010
_________________________________________________________________________________________________________ Page 181 of 329
VALUE OF DAIRY INDUSTRY ‐ COMPARISON OF INTERNATIONAL TARGET MARKETS Figure 51. Retail value of Dairy Industries with India running 5th amongst 13 nominated overseas markets
0.0
5,000.0
10,000.0
15,000.0
20,000.0
25,000.0
US$ million
Brazil
China
Egypt
India
Indon
esia
Malays
ia
Mexico
Pakist
an
Philipp
ines
Russia
Saudi
Arabia
South
Africa
Vietna
m
Retail Value of Target Market Dairy Industries, 2009
Source: Euromonitor International, 2010 Figure 52. Retail value growth of Dairy Industries, CAGR % 2004‐2009, with India running 2nd to Russia amongst all nominated markets
0.0
5.0
10.0
15.0
20.0
25.0
CAGR %
Brazil
China
Egypt
India
Indon
esia
Malays
ia
Mexico
Pakist
an
Philipp
ines
Russia
Saudi
Arabia
South
Africa
Vietna
m
Retail Value Growth of Target Market Dairy Industries, CAGR % 2004‐09
Source: Euromonitor International, 2010
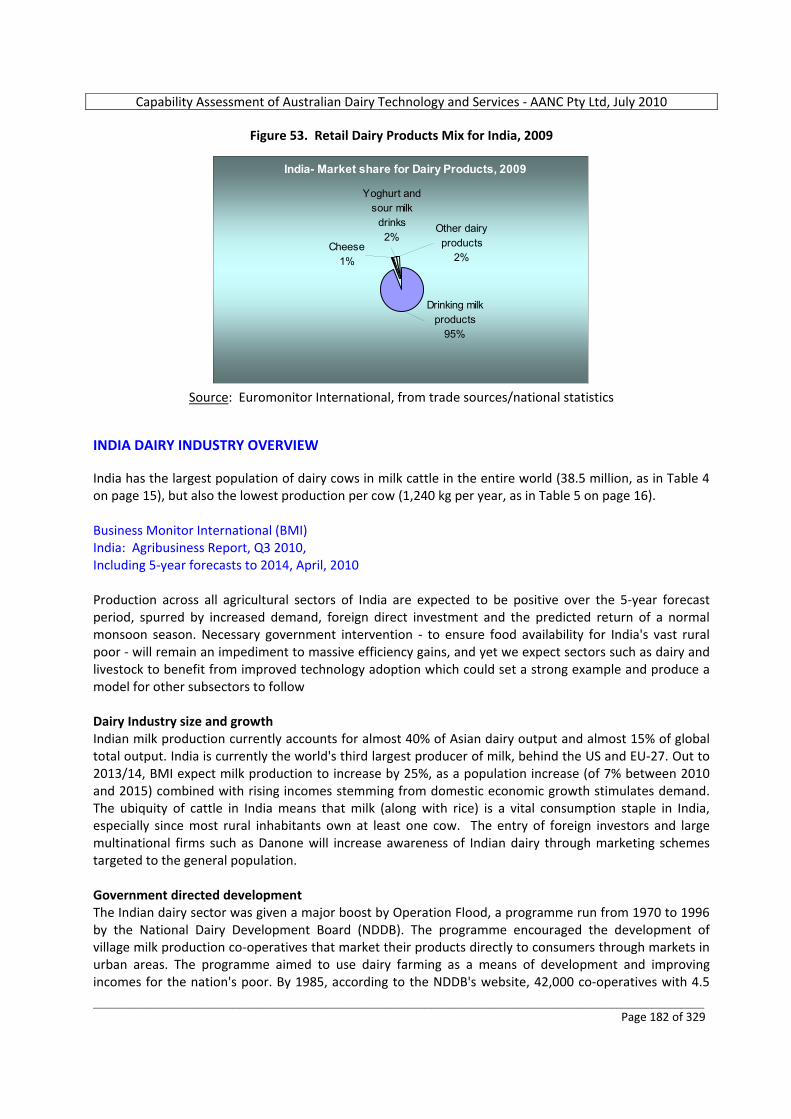
Capability Assessment of Australian Dairy Technology and Services ‐ AANC Pty Ltd, July 2010
_________________________________________________________________________________________________________ Page 182 of 329
Figure 53. Retail Dairy Products Mix for India, 2009
India- Market share for Dairy Products, 2009
Other dairy products
2%
Yoghurt and sour milk
drinks2%
Cheese1%
Drinking milk products
95%
Source: Euromonitor International, from trade sources/national statistics
INDIA DAIRY INDUSTRY OVERVIEW India has the largest population of dairy cows in milk cattle in the entire world (38.5 million, as in Table 4 on page 15), but also the lowest production per cow (1,240 kg per year, as in Table 5 on page 16). Business Monitor International (BMI) India: Agribusiness Report, Q3 2010, Including 5‐year forecasts to 2014, April, 2010 Production across all agricultural sectors of India are expected to be positive over the 5‐year forecast period, spurred by increased demand, foreign direct investment and the predicted return of a normal monsoon season. Necessary government intervention ‐ to ensure food availability for India's vast rural poor ‐ will remain an impediment to massive efficiency gains, and yet we expect sectors such as dairy and livestock to benefit from improved technology adoption which could set a strong example and produce a model for other subsectors to follow Dairy Industry size and growth Indian milk production currently accounts for almost 40% of Asian dairy output and almost 15% of global total output. India is currently the world's third largest producer of milk, behind the US and EU‐27. Out to 2013/14, BMI expect milk production to increase by 25%, as a population increase (of 7% between 2010 and 2015) combined with rising incomes stemming from domestic economic growth stimulates demand. The ubiquity of cattle in India means that milk (along with rice) is a vital consumption staple in India, especially since most rural inhabitants own at least one cow. The entry of foreign investors and large multinational firms such as Danone will increase awareness of Indian dairy through marketing schemes targeted to the general population. Government directed development The Indian dairy sector was given a major boost by Operation Flood, a programme run from 1970 to 1996 by the National Dairy Development Board (NDDB). The programme encouraged the development of village milk production co‐operatives that market their products directly to consumers through markets in urban areas. The programme aimed to use dairy farming as a means of development and improving incomes for the nation's poor. By 1985, according to the NDDB's website, 42,000 co‐operatives with 4.5
Capability Assessment of Australian Dairy Technology and Services ‐ AANC Pty Ltd, July 2010
_________________________________________________________________________________________________________ Page 183 of 329
million members had been formed, and in the next phase of the programme from 1985 to 1996, a further 30,000 co‐operatives were created. The programme is now being held up as a model for developing dairy industries in low‐income countries. Modern day potential India is now among the world's largest and fastest growing markets for milk and milk products, with market size in value terms, including the ‘organised’ and ‘unorganised’ sector, at US$47.6 billion, growing at nearly 7.5% annually. The demand for value added dairy products, such as cheese, dahi (Indian yoghurt) and probiotic drinks is increasing at a double digit rate. There is huge potential for processing and value addition in the organised sector, particularly in ethnic Indian sweets, which are largely sold in unbranded form at markets. Indeed, major industry players such as Reliance, DCM, Bharti, ITC and Yakult‐Danone, are already present in India. Concept note for Indian Dairy Industry (source and date unknown) The dairy sector contributes around 7% of the GDP and 19 million people are directly and indirectly involved in dairying for employment and livelihood. Dairying has become an important secondary source of income for millions of rural families and has assumed the most important role in providing employment and income generating opportunities. The ‘organized’ dairy sector in India is dominated by cooperatives, but the organized sector dairies produce only around 18% of total milk in the country, with the remaining 82% being from the ‘unorganized’ sector. Current opportunities for improvement of the Indian dairy sector In order to increase competitiveness of the Indian dairy sector, the Federal Government and dairy industry organizations need to concentrate efforts to reduce costs of production, by increasing productivity of animals, improving health care and breeding facilities. Governments need to play a vital role in this direction by: a.) Provision of veterinary services, feeds and fodders in a cost effective manner, which will assist in the
reduction of losses from endemic and epidemic diseases. b.) Promoting advanced breeding technologies to accelerate the development of high potential Indian
cattle and buffalo breeds. c.) Promoting development of improved production, processing and marketing infrastructure, which is
capable of meeting international quality requirements. A comprehensive strategy for producing quality and safe dairy products needs to be formulated with suitable legal backup.
d.) The dairy industry in India is unique with regard to availability of huge volumes of buffalo milk. India could focus on buffalo milk based speciality products, such as Mozzarella cheese, tailored to specialist customers.
e.) Past policies of the protection of ‘infant industries’ in India have lead to a continuous state of ‘infancy’ in certain industries. Dairy industry is one of them. High tariff barriers in the past have bred inefficiency, a high cost base, unprofitable sales, poor product quality, lack of technological excellence and a failure to meet food safety standards. Protection has also lead to price cartels and speculative profiteering. Now that dairy commodity prices internationally are highly competitive with India, the Government needs to allow import of milk products at tariff rates which should be much lower than the prohibitive rates currently prevailing.
f.) With regards to export potential for the industry, there appears phenomenal scope for innovations in product development and packaging. There are several issues like standardization of food safety regulations for milk products which are necessary to ensure a well accepted quality product for domestic consumers, but also especially for export markets.
Capability Assessment of Australian Dairy Technology and Services ‐ AANC Pty Ltd, July 2010
_________________________________________________________________________________________________________ Page 184 of 329
Agri‐Food Processing report ‐ Rabobank, Rabo India Finance Ltd, June 2007 Strengthening the India ‐ Australia Corridor in select Food & Agribusiness Sectors Present status of the Indian economy India is the largest democracy in the world with a stable political system. India is the third fastest growing economy in the world with the GDP growth rate peaking to 9.2% in the year 2006‐07. This USD 1 trillion economy with a wealthy middle class population of 300 million is an attractive destination for foreign investors due to its established and fair judicial system, the widespread use of English in business and commerce and highly skilled and relatively low cost work force. Also, India has probably the most open and liberal investment regimes among the emerging economies, with a conducive environment for Foreign Direct Investment (FDI). Though India is widely acknowledged as an Information Technology (IT) and Information Technology Enabled Services (ITES) superpower, the most recent development in the Indian economic landscape is the emergence of organised retail. Snapshot of the Indian dairy industry India is the largest milk producer in the world with production of around 100 million tonnes in 2007. India produces around 15% of the total milk produced in the world. However, the per capita availability of milk is 241 gm/day which is lower than the global average of 285 gm/day. Farm gate prices of milk produced in India are among the lowest in the world. The market for dairy products (cheese, ice cream, dahi, paneer, khoa, butter, etc), is increasing at double digit rates in India. There appears ample scope for establishing large scale dairy farms in India to help cater to the demand for relatively cheap milk. International Conference on Dairy Industry Public Private Partnership for Inclusive Growth New Delhi, India. 14 May 2010 Initiating White Revolution – II. The Indian Dairy Industry Background Paper prepared by Technopak for the Confederation of India Industry CII, May 2010 Industry characteristics in summary: o A huge base of around 11 million farmers, organized into about 100,000 village Dairy Cooperative
Societies. o In India, approx 55 % of the total milk is produced by buffalo. o Milk production is scattered across vast numbers of small and marginal farmers. 85 % of total milk is
produced and processed in the marginal sector. o Lack of proper cold chain facilities and logistics leads to revenue and milk production losses. o Huge gap in production standards opens opportunity for intervention to boost yields and milk
parameters. Real need for biotechnology to bridge the ‘Lean – Flush’ divide. (Lean = summer; Flush = winter.) Yield of ‘Lean’ season to ‘Flush’ season yield in buffalo is 0.7 (54% of milk is from Buffalo).
o An increasing number of advanced, large scale dairy farms. Driven by steady population growth and rising income, milk consumption and production continue to rise in India – the world’s largest dairy producer and consumer. In terms of milk consumption, India tops the charts, consuming 51.5 billion liters of milk and other liquid dairy products in 2008 – with a CAGR of 2.7% over the last four years. This is almost double the volume consumed by the number two milk consumer, China. Since 1999, the Index has found that India has produced more milk than any other country in the world and since 2006, milk production has increased by a CAGR of 4.3%. These high levels of consumption and

Capability Assessment of Australian Dairy Technology and Services ‐ AANC Pty Ltd, July 2010
_________________________________________________________________________________________________________ Page 185 of 329
production in the country are mainly driven by a population of 1.3 billion people, where milk is an integral part of their diet. Since the majority of Indian population is vegetarian, milk serves as an important source of protein. In India, milk or other liquid dairy products are the most preferred food preparations such as in brewing tea and coffee, in making yogurt or curd and in preparing Indian dishes such as curries. Milk is also a popular beverage for children in India due to its high nutritional value. India’s dairy industry is growing at a 4.5 % annual growth rate which is much ahead of the world average rate of 1.35 %. If the Government can roll out appropriate policy measures and create avenues, then the private players’ participation can be increased towards an inclusive growth of all the stake holders of the industry. FAO Corporate Document Repository (date ?) India: Increasing demand challenges the dairy sector. Meeta Punjabi, Dairy consultant, New Delhi. Over the span of three decades, India has transformed from a country of acute milk shortage to the world’s leading milk producer, with production exceeding 100 million tonnes in 2006. This phenomenal success is attributed to a Government initiative known as Operation Flood (1970–1996) and its intense focus on dairy development activities. In that initiative, rural milk shed areas were linked to urban markets through the development of a network of village cooperatives for procuring and marketing milk. And milk production and productivity were enhanced by ensuring the availability of veterinary services, artificial insemination (AI), feed and farmer education. The investment paid off, promoting production gains of 4–5 % per annum. However, that growth has slumped to less than 3 % in recent years, raising cause for concern. The slowdown is attributed to the decline in investment in the dairy sector since the end of the Operation Flood initiative. Central and state government allocation for dairy development has diminished in the past two five‐year plans. Emerging situation Dairy is currently the top‐ranking commodity in India, with the value of output in 2004 at 1.179 billion rupees (US$39 million), which is almost equal to the combined output value of rice and wheat. Despite the importance of the dairy sector in overall GDP, it receives less government budgeting than the agriculture sector. Further, there has been no concentrated investment in the development of value‐added or innovative products, nor any serious effort to support and modernize the informal sector. In light of the increasing demand driven by the growing population, higher incomes and more health consciousness, the slowdown in dairy industry growth is a serious concern. Based on estimates by the National Dairy Development Board (NDDB), the demand for milk is likely to reach 180 million tonnes by 2022. To supply the market, an average incremental increase of 5 million tonnes per annum over the next 15 years is required – a doubling of the average incremental rate achieved over the past 15 years. In the absence of sufficient increased production, India will need to rely on the world market for imports. And because of the huge volume required, it will affect global milk prices. Thus, focusing on areas for local dairy development is critical. Traditionally, the policy environment has favoured the expansion of cooperatives, which ultimately crowded out the private sector. However, liberalization of the sector in recent years has encouraged private investment in dairying. In 2002, the Milk and Milk Products Order (MMPO) ushered in major policy changes friendly to the private sector and a momentum of activity that is likely to increase dramatically in
Capability Assessment of Australian Dairy Technology and Services ‐ AANC Pty Ltd, July 2010
_________________________________________________________________________________________________________ Page 186 of 329
the coming years. Large Indian and multinational corporations, such as Reliance, Pepsi and Coca‐Cola, are planning significant investments. Nowadays, both the private sector and the cooperatives drive the value chains. Because of the many unsuccessful cooperatives in the country, other models of dairy farmer organizations are being explored, such as mutually aided cooperative societies (MACS) and producer companies. Millions of small and marginal farmers in dairying who own two to three animals and produce an average of 5 litres comprise a critical portion of India’s dairy industry. Livestock development in general and dairy development activities in particular are key components of pro‐poor development strategies because livestock distribution is much more equitable than land distribution. Thus, changes in the dairying environment have important implications for the smallholder farmers and for poverty reduction. SWOT ANALYSIS Business Monitor International (BMI) India: Agribusiness Report, Q3 2010, Including 5‐year forecasts to 2014, April, 2010 Indian Agricultural Sector SWOT Strengths • A large population and vast expanses of agricultural land provide the fundamentals for a strong
system of agricultural production. • India's agricultural potential and relatively stable climate make the country an attractive destination
for foreign investors and multinational companies. • Strong GDP growth has contributed to middle‐class expansion and an increasingly diverse appetite for
value added agricultural goods. Weaknesses • Despite strong domestic capacity for producing basic agricultural goods, the food processing industry
remains relatively poor and is perceived to have inadequate infrastructure. • Solid GDP growth has failed to benefit the poorer members of society and the massive income
disparities within India inhibits both the productive and consumptive capabilities that these individuals could contribute to the sector.
Opportunities • The Indian government has put agriculture at the forefront of its development goals, suggesting that
potential investors will be given the scope to operate without unnecessary bureaucracy or litigation. • A young urban population with rising disposable incomes, and increasingly exposed to Western
influences, are likely to encourage further consumption of products such as processed dairy foods. Threats • The current economic downturn may depress prices to such an extent that many agricultural
producers find production in the short term unprofitable. • A failure to implement infrastructural changes may hamper the growth of, among others, the high
potential value‐added milk industry. • A failure to address growing income disparities could significantly reduce or hamper the growth of the
domestic consumer base.
Capability Assessment of Australian Dairy Technology and Services ‐ AANC Pty Ltd, July 2010
_________________________________________________________________________________________________________ Page 187 of 329
Indian Political SWOT Strengths • India is the world's largest democracy. A secular constitution, framed in 1950, officially guarantees
justice, liberty and equality while aiming to promote fraternity among citizens. • Despite its multitude of problems, India has generally managed to avoid hard authoritarian rule or
military coups, which have happened in many other developing countries. Weaknesses • The competence of state government varies enormously across India's 35 states and union territories. • India's tense relationship with Pakistan still weighs on regional stability. The two countries have gone
to war three times since they were 'partitioned' on independence from British rule in 1947. Opportunities • India has in recent years edged closer to the US in foreign policy. This may be evidence of
Washington's increased interest in having New Delhi as a geopolitical partner in Asia. The fact that both the US and India are democracies, face threats from militant Islamists, and the presence of a 2 million‐strong affluent Indian diaspora in the US, are bringing the two countries closer together. This situation should have very similar benefits for Australian‐Indian trade relationships.
• Thawing relations with Pakistan, following a tentative peace process initiated in 2004. Threats • Hindu nationalism presents a growing threat to India's constitutionally enshrined secularism.
Communal tensions between the Hindu majority and minority Muslims, Christians, Sikhs and Buddhists have often erupted into deadly violence.
• India has experienced a series of serious terrorist attacks over the past 2 years, perpetrated by radical Islamist as well as rural Maoist groups. Further violence is possible.
Indian Economic SWOT Strengths • India has a very large domestic market, and rising domestic demand is a major driver of economic
growth. • A vast supply of inexpensive but skilled labour. Around half of the population is under the age of 25. • Booming exports of IT‐enabled services, from call centres to software developers, are a valuable
source of foreign exchange. Weaknesses • Despite rapid economic growth, India remains a very poor country. According to BMI estimates, India's
GDP per capita was roughly US$1,100 in 2009, a third of the size of China's. • Agriculture remains inefficient. Poor June‐September monsoon rains can slash rural incomes and
consumption. Two‐thirds of the population depend on farming for its livelihood. • India has chronic trade and fiscal deficits, the latter of which is ballooning due to fiscal stimulus
measures. The government spends a significant part of its revenue on interest payments, salaries and pensions. This limits the amount of money available on infrastructure improvements.
Opportunities • India's emerging middle class will continue to drive demand for new goods and services.
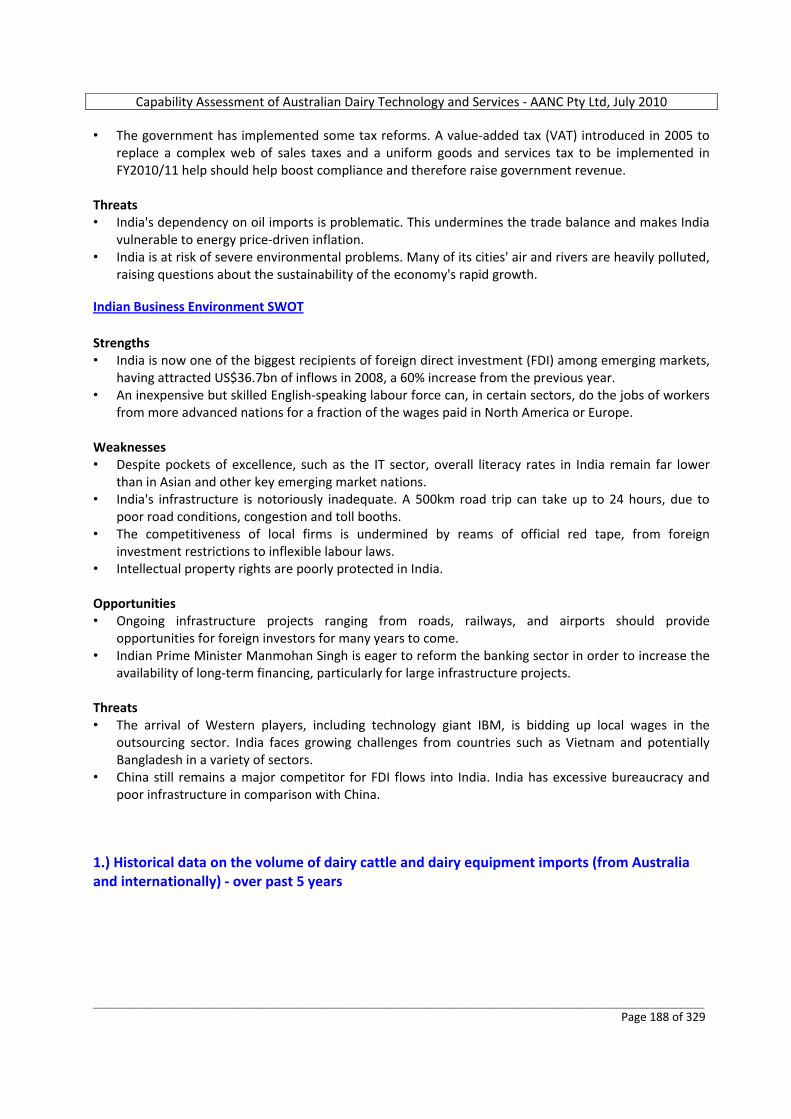
Capability Assessment of Australian Dairy Technology and Services ‐ AANC Pty Ltd, July 2010
_________________________________________________________________________________________________________ Page 188 of 329
• The government has implemented some tax reforms. A value‐added tax (VAT) introduced in 2005 to replace a complex web of sales taxes and a uniform goods and services tax to be implemented in FY2010/11 help should help boost compliance and therefore raise government revenue.
Threats • India's dependency on oil imports is problematic. This undermines the trade balance and makes India
vulnerable to energy price‐driven inflation. • India is at risk of severe environmental problems. Many of its cities' air and rivers are heavily polluted,
raising questions about the sustainability of the economy's rapid growth. Indian Business Environment SWOT Strengths • India is now one of the biggest recipients of foreign direct investment (FDI) among emerging markets,
having attracted US$36.7bn of inflows in 2008, a 60% increase from the previous year. • An inexpensive but skilled English‐speaking labour force can, in certain sectors, do the jobs of workers
from more advanced nations for a fraction of the wages paid in North America or Europe. Weaknesses • Despite pockets of excellence, such as the IT sector, overall literacy rates in India remain far lower
than in Asian and other key emerging market nations. • India's infrastructure is notoriously inadequate. A 500km road trip can take up to 24 hours, due to
poor road conditions, congestion and toll booths. • The competitiveness of local firms is undermined by reams of official red tape, from foreign
investment restrictions to inflexible labour laws. • Intellectual property rights are poorly protected in India. Opportunities • Ongoing infrastructure projects ranging from roads, railways, and airports should provide
opportunities for foreign investors for many years to come. • Indian Prime Minister Manmohan Singh is eager to reform the banking sector in order to increase the
availability of long‐term financing, particularly for large infrastructure projects. Threats • The arrival of Western players, including technology giant IBM, is bidding up local wages in the
outsourcing sector. India faces growing challenges from countries such as Vietnam and potentially Bangladesh in a variety of sectors.
• China still remains a major competitor for FDI flows into India. India has excessive bureaucracy and poor infrastructure in comparison with China.
1.) Historical data on the volume of dairy cattle and dairy equipment imports (from Australia and internationally) ‐ over past 5 years
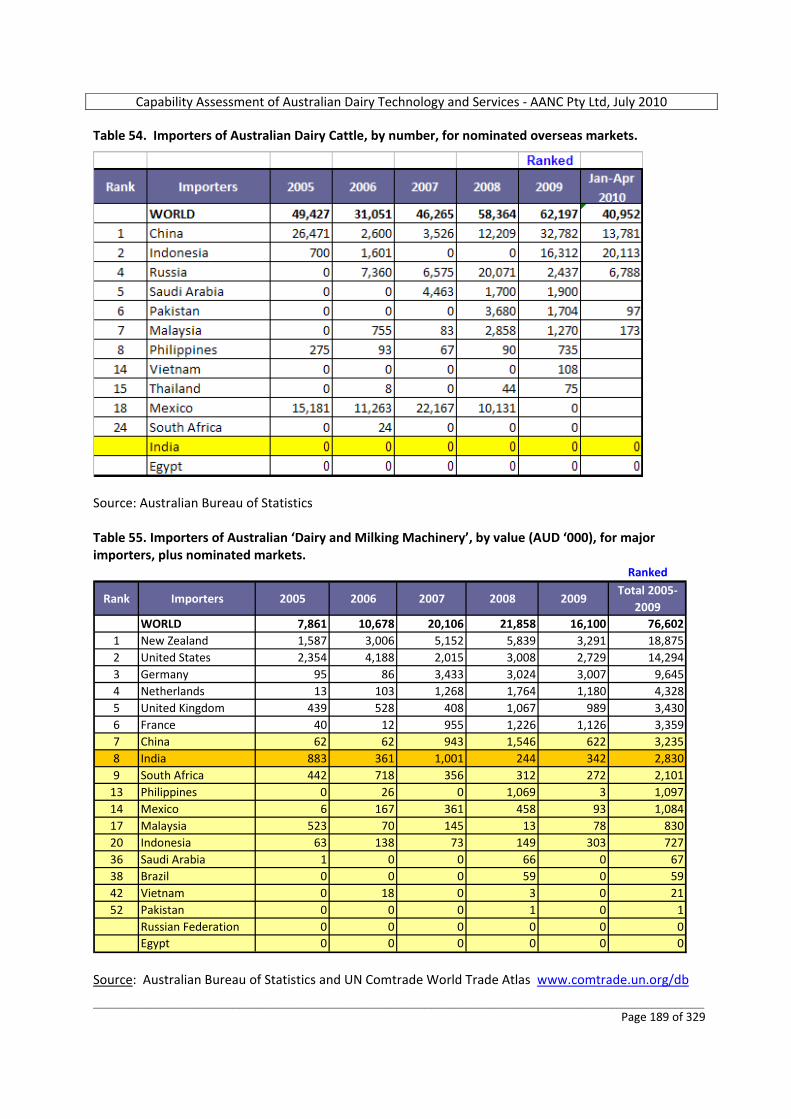
Capability Assessment of Australian Dairy Technology and Services ‐ AANC Pty Ltd, July 2010
_________________________________________________________________________________________________________ Page 189 of 329
Table 54. Importers of Australian Dairy Cattle, by number, for nominated overseas markets.
Source: Australian Bureau of Statistics Table 55. Importers of Australian ‘Dairy and Milking Machinery’, by value (AUD ‘000), for major importers, plus nominated markets.
Ranked
Rank Importers 2005 2006 2007 2008 2009Total 2005‐
2009WORLD 7,861 10,678 20,106 21,858 16,100 76,602
1 New Zealand 1,587 3,006 5,152 5,839 3,291 18,8752 United States 2,354 4,188 2,015 3,008 2,729 14,2943 Germany 95 86 3,433 3,024 3,007 9,6454 Netherlands 13 103 1,268 1,764 1,180 4,3285 United Kingdom 439 528 408 1,067 989 3,4306 France 40 12 955 1,226 1,126 3,3597 China 62 62 943 1,546 622 3,2358 India 883 361 1,001 244 342 2,8309 South Africa 442 718 356 312 272 2,101
13 Philippines 0 26 0 1,069 3 1,09714 Mexico 6 167 361 458 93 1,08417 Malaysia 523 70 145 13 78 83020 Indonesia 63 138 73 149 303 72736 Saudi Arabia 1 0 0 66 0 6738 Brazil 0 0 0 59 0 5942 Vietnam 0 18 0 3 0 2152 Pakistan 0 0 0 1 0 1
Russian Federation 0 0 0 0 0 0Egypt 0 0 0 0 0 0
Source: Australian Bureau of Statistics and UN Comtrade World Trade Atlas www.comtrade.un.org/db
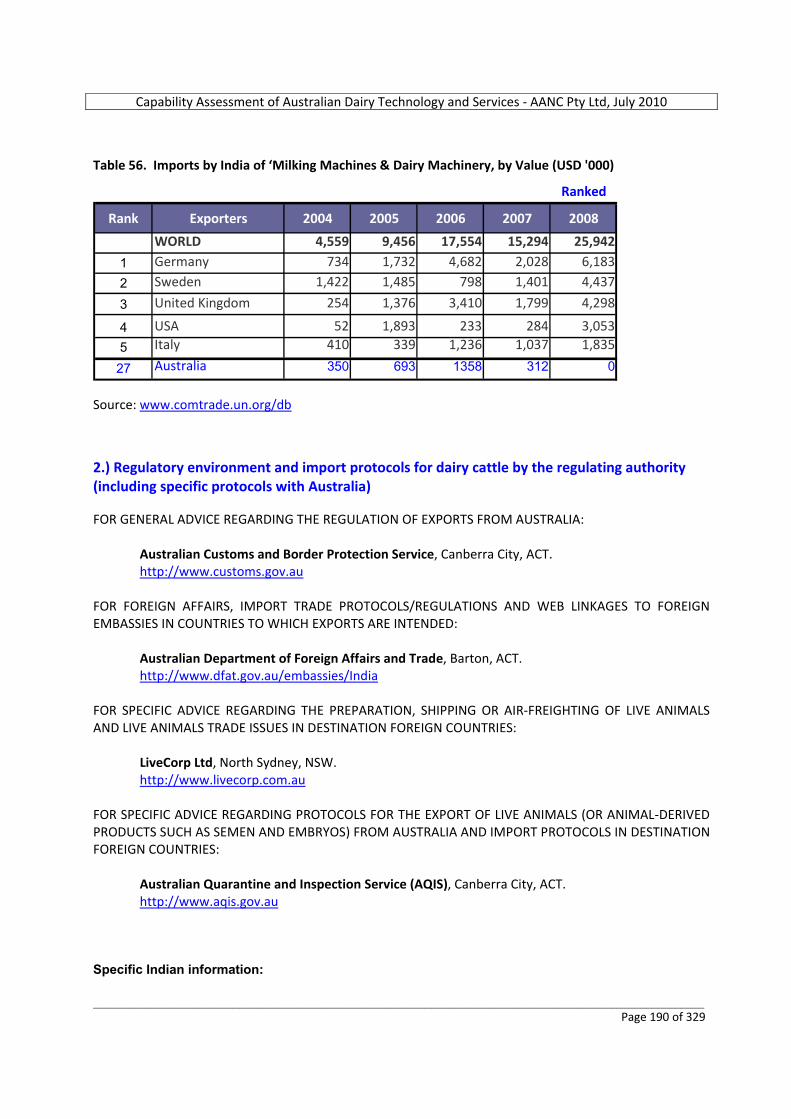
Capability Assessment of Australian Dairy Technology and Services ‐ AANC Pty Ltd, July 2010
_________________________________________________________________________________________________________ Page 190 of 329
Table 56. Imports by India of ‘Milking Machines & Dairy Machinery, by Value (USD '000)
Ranked
Rank Exporters 2004 2005 2006 2007 2008
WORLD 4,559 9,456 17,554 15,294 25,942
1 Germany 734 1,732 4,682 2,028 6,183
2 Sweden 1,422 1,485 798 1,401 4,437
3 United Kingdom 254 1,376 3,410 1,799 4,298
4 USA 52 1,893 233 284 3,053
5 Italy 410 339 1,236 1,037 1,835
27 Australia 350 693 1358 312 0
Source: www.comtrade.un.org/db 2.) Regulatory environment and import protocols for dairy cattle by the regulating authority (including specific protocols with Australia) FOR GENERAL ADVICE REGARDING THE REGULATION OF EXPORTS FROM AUSTRALIA:
Australian Customs and Border Protection Service, Canberra City, ACT. http://www.customs.gov.au
FOR FOREIGN AFFAIRS, IMPORT TRADE PROTOCOLS/REGULATIONS AND WEB LINKAGES TO FOREIGN EMBASSIES IN COUNTRIES TO WHICH EXPORTS ARE INTENDED:
Australian Department of Foreign Affairs and Trade, Barton, ACT. http://www.dfat.gov.au/embassies/India
FOR SPECIFIC ADVICE REGARDING THE PREPARATION, SHIPPING OR AIR‐FREIGHTING OF LIVE ANIMALS AND LIVE ANIMALS TRADE ISSUES IN DESTINATION FOREIGN COUNTRIES:
LiveCorp Ltd, North Sydney, NSW. http://www.livecorp.com.au
FOR SPECIFIC ADVICE REGARDING PROTOCOLS FOR THE EXPORT OF LIVE ANIMALS (OR ANIMAL‐DERIVED PRODUCTS SUCH AS SEMEN AND EMBRYOS) FROM AUSTRALIA AND IMPORT PROTOCOLS IN DESTINATION FOREIGN COUNTRIES:
Australian Quarantine and Inspection Service (AQIS), Canberra City, ACT. http://www.aqis.gov.au
Specific Indian information:
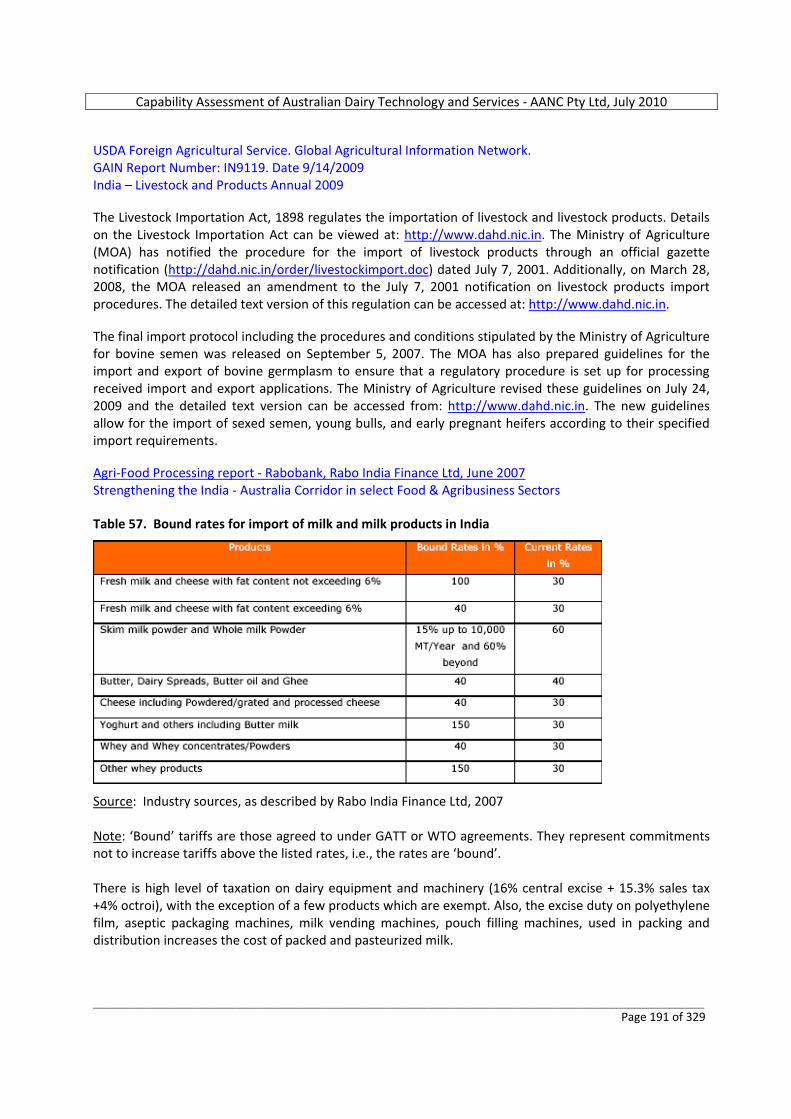
Capability Assessment of Australian Dairy Technology and Services ‐ AANC Pty Ltd, July 2010
_________________________________________________________________________________________________________ Page 191 of 329
USDA Foreign Agricultural Service. Global Agricultural Information Network. GAIN Report Number: IN9119. Date 9/14/2009 India – Livestock and Products Annual 2009 The Livestock Importation Act, 1898 regulates the importation of livestock and livestock products. Details on the Livestock Importation Act can be viewed at: http://www.dahd.nic.in. The Ministry of Agriculture (MOA) has notified the procedure for the import of livestock products through an official gazette notification (http://dahd.nic.in/order/livestockimport.doc) dated July 7, 2001. Additionally, on March 28, 2008, the MOA released an amendment to the July 7, 2001 notification on livestock products import procedures. The detailed text version of this regulation can be accessed at: http://www.dahd.nic.in. The final import protocol including the procedures and conditions stipulated by the Ministry of Agriculture for bovine semen was released on September 5, 2007. The MOA has also prepared guidelines for the import and export of bovine germplasm to ensure that a regulatory procedure is set up for processing received import and export applications. The Ministry of Agriculture revised these guidelines on July 24, 2009 and the detailed text version can be accessed from: http://www.dahd.nic.in. The new guidelines allow for the import of sexed semen, young bulls, and early pregnant heifers according to their specified import requirements. Agri‐Food Processing report ‐ Rabobank, Rabo India Finance Ltd, June 2007 Strengthening the India ‐ Australia Corridor in select Food & Agribusiness Sectors Table 57. Bound rates for import of milk and milk products in India
Source: Industry sources, as described by Rabo India Finance Ltd, 2007 Note: ‘Bound’ tariffs are those agreed to under GATT or WTO agreements. They represent commitments not to increase tariffs above the listed rates, i.e., the rates are ‘bound’. There is high level of taxation on dairy equipment and machinery (16% central excise + 15.3% sales tax +4% octroi), with the exception of a few products which are exempt. Also, the excise duty on polyethylene film, aseptic packaging machines, milk vending machines, pouch filling machines, used in packing and distribution increases the cost of packed and pasteurized milk.
Capability Assessment of Australian Dairy Technology and Services ‐ AANC Pty Ltd, July 2010
_________________________________________________________________________________________________________ Page 192 of 329
3.) Investment environment for dairy operations (domestic and foreign assistance, tax incentives, export zones, etc) and examples of FDI (from any country) Business Monitor International (BMI) India: Agribusiness Report, Q3 2010, Including 5‐year forecasts to 2014, April, 2010 India is currently attracting attention from private investors who are keen to utilise the country's vast agricultural potential by producing high‐value processed dairy goods. In July 2009 the State Government of Hyderabad approved a project by Israeli company Elbit Imaging to set up what will likely be the country's largest dairy farm. Elbit India, according to a report in the Times of India, is planning to build a 140 hectare (ha) dairy farm with 10,000 head of high yielding dairy cattle imported from New Zealand. The company is also planning two smaller farms in Gujarat and Tamil Nadu. The first, a 22ha venture in Gujarat, should be operational in 2011. The high interest in improving efficiency and modernising production techniques from both private and state ventures in India will see yields rise in the coming years. Improvement, however, will be slow given that the vast majority of the sector remains based on small‐scale production. Agri‐Food Processing report ‐ Rabobank, Rabo India Finance Ltd, June 2007 Strengthening the India ‐ Australia Corridor in select Food & Agribusiness Sectors FDI Policy in the Food Processing Sector India has one of the most liberal investment regimes among the emerging economies with a conducive FDI environment. The combination of macro economic stability, commitment to continued liberalization, a fair judicial system, expanding trade and economic linkages make India an attractive destination for foreign investor companies worldwide. India has an abundantly qualified, competent and relatively low cost human resources base, widespread use of English in business and commerce with technological training and managerial capabilities. India has untapped natural resources, agricultural surplus and a huge manufacturing capability spanning almost all sectors. The consumer market is large and expanding exponentially. Special investment and tax incentives are available for infrastructure development. India offers attractive returns to prospective investors. Given below are the key points for perspective Australian investors in the Indian food and agribusiness sectors: FDI up to 100% is permitted under the automatic route in food infrastructure (‘food park’, cold chain,
warehousing). Automatic approval for FDI up to 100% is available except for alcoholic drinks and products reserved
under ‘Small Scale Industries’ (SSI). A maximum of 24% foreign equity is allowed in the SSI sector. No industrial license is required for almost all of the food & agro processing industries except for some
items like beer, potable alcohol & wines, cane sugar, hydrogenated animal fats & oils, etc, and items reserved for exclusive manufacture in the small scale sector.
Use of foreign brand names is now freely permitted. MRTP (Monopolies & Restrictive Trade Practices Act) rules and FERA (Foreign Exchange Regulation
Act) regulations have been relaxed to encourage investment and expansion by large corporates. Most of the items can be freely imported and exported except for items in the negative lists for
imports & exports. Capital goods are also freely importable, including second hand goods in the food processing sector.
Food processing industries were included in the list of priority sector for bank lending in 1999. Also, the new trade policy places greater thrust on agro‐based industries.
Capability Assessment of Australian Dairy Technology and Services ‐ AANC Pty Ltd, July 2010
_________________________________________________________________________________________________________ Page 193 of 329
Automatic approval for foreign equity up to 100 % is available for most processed food items except alcohol, beer and those reserved for the small scale sector, subject to certain conditions.
Austrade, New Delhi: Details of financing options from the banks/NABARD ‐ National Bank for Agriculture & Rural Development. http://www.nabard.org/modelbankprojects/animalhusbandry.asp Examples of FDI: o Israeli company Elbit India Agri Ventures: http://www.elbitagri.in/ o Israeli dairy to come up in Amul's backyard:
http://timesofindia.indiatimes.com/India/Israeli_dairy_to_come_up_in_Amuls_backyard/articleshow/2848820.cms
o Israeli firm to setup dairy and pesticide units in AP: http://www.thehindubusinessline.com/2009/06/24/stories/2009062452641700.htm
o Israeli company Rs 600 crores gets nod: http://www.business‐standard.com/india/news/israeli‐cos‐rs‐600‐cr‐dairy‐project‐gets‐nod/21/16/362726/
4.) National government programs to assist with the development of dairy operations Business Monitor International (BMI) India: Agribusiness Report, Q3 2010, Including 5‐year forecasts to 2014, April, 2010 The National Dairy Development Board (NDDB) has projects underway to improve productivity in the sector and in the 2007‐2008 National Dairy Plan proposed spending INR 173 billion (AUD 4.5 billion) to improve it. International Conference on Dairy Industry Public Private Partnership for Inclusive Growth New Delhi, India. 14 May 2010 Initiating White Revolution – II. The Indian Dairy Industry Background Paper prepared by Technopak for the Confederation of India Industry CII, May 2010 Public private partnerships (PPPs) have become an important service delivery mechanism for the Government and public sector institutions to achieve substantial growth in an array of sectors like infrastructure, telecom, rail, road, transport, power, irrigation etc. PPP is any type of collaboration between the public and the private‐sector entities in which the partners jointly plan and execute various activities with an agenda of accomplishing certain common objectives while sharing the costs, risks, and benefi ts incurred in the process. Public‐private partnerships are being increasingly encouraged as part of the comprehensive development framework in India. The complexity of the dairy supply chain and still largely unorganized Indian dairy industry provide an ample potential for PPP implementation. Austrade, New Delhi: Schemes for Dairy Development, from Government of India Following Operation Flood, the Government of India had been implementing various dairy development schemes since 1993‐94 and is presently implementing Centrally Sponsored schemes “Intensive Dairy Development Programme”, “Strengthening Infrastructure of Quality & Clean Milk Production”, Central
Capability Assessment of Australian Dairy Technology and Services ‐ AANC Pty Ltd, July 2010
_________________________________________________________________________________________________________ Page 194 of 329
Sector schemes “Assistance to Cooperatives” and “Dairy/Poultry Venture Capital Fund” with focused objectives. Apart from these, Government is also envisaging implementing a scheme “National Project for Cattle and Buffalo Breeding” for genetic improvement of cattle and buffalo to increase productivity. Government is also examining the launching of a National Dairy Plan with an outlay of more than Rs 17,000 crores spread for over a period of 15 years to enhance average incremental production of milk from 2.5 million MT to 5 million MT annually. This is being envisaged through increasing productivity, expanding infrastructure for procurement, processing, marketing and quality assurance. Simultaneously the Government has launched a new scheme called Rashtriya Krishi Vikas Yojana (RKVY) with a massive investment of INR 250 billion (AUD 5.7 billion) for the next 4 to 5 years to promote agriculture and allied sectors. These activities are hoped to help India emerge as a major player in the world dairy sector. 5.) Existing or proposed external assistance programs to develop the industry (foreign government and/or aid programs) Austrade, New Delhi: The National Dairy Development Board (NDDB), under the Ministry of Agriculture, Government of India is in the final stages of preparing the 'National Dairy Plan ‐ NDP' with a funding from the World Bank. The NDP is to be implemented from 2011. US$3.8 billion World Bank loan to boost milk production in India http://www.fnbnews.com/article/detnews.asp?articleid=27930§ionid=1 The National Dairy Plan (NDP) prepared by the National Dairy Development Board, envisages financial allocation for increasing bovine productivity, expanding coverage of milk producers and procurement. The plan was finalised recently after holding a series of consultations with 14 key milk‐producing states. The World Bank supported NDP is aimed at increasing annual milk production to more than 166 million tonnes by 2021 from the current level of 108 million tonnes through production of high genetic merit bulls by coordinated efforts at an on‐farm level. The World Bank would provide a soft loan to the tune of Rs 17,000 crore (i.e., 17,000 x 10 million INR, equivalent to US$3.8 billion) to the NDP during the next 15 years. Earlier, in Feb 2010 at the 38th Dairy Industry Conference, Amrita Patel, chairman of the National Diary Development Board had explained the application. “Over the next 15 years, for doubling milk production under the National Dairy Plan, the NDDB is thinking of borrowing around Rs 17,000‐crore from World Bank, so as to improve the productivity of milking animals through genetic improvements and optimal use of feed. The amount will be used for various schemes of the National Diary Plan will guarantee that the country is able to meet the expected demand of 180‐million tonnes of milk demand by 2021”, Patel said. 6.) Overview of the typical dairy farming arrangements International Conference on Dairy Industry Public Private Partnership for Inclusive Growth New Delhi, India. 14 May 2010 Initiating White Revolution – II. The Indian Dairy Industry Background Paper prepared by Technopak for the Confederation of India Industry CII, May 2010 It is estimated that for every litre of milk produced in India the farmer has an expense of about INR 14 while the price he gets for every litre of milk sold is INR 16–18 which amounts to a margin of INR 2 ‐ 4
Capability Assessment of Australian Dairy Technology and Services ‐ AANC Pty Ltd, July 2010
_________________________________________________________________________________________________________ Page 195 of 329
which is quite less if we consider the labour cost of the farmer himself. (Exchange, October 2010: AUD:INR = 43.6.) FAO Corporate Document Repository (date ?) India: Increasing demand challenges the dairy sector. Meeta Punjabi, Dairy consultant, New Delhi. The following characterizes India’s dairy farming and its relevance to inclusive growth: o Small and marginal farmers own 33 % of land and about 60 % of female cattle and buffaloes. o Some 75 % of rural households own, on average, 2 to 4 animals. o Dairying is a part of the farming system, not a separate enterprise. Feed is mostly residual from crops,
whereas cow dung is important for manure. o Dairying provides a source of regular income, whereas income from agriculture is seasonal. This
regular source of income has a huge impact on minimizing risks to income. There is some indication that areas where dairy is well developed have less incidence of farmer suicide.
o About a third of rural incomes are dependent upon dairying. o Livestock is a security asset to be sold in times of crisis. Agri‐Food Processing report ‐ Rabobank, Rabo India Finance Ltd, June 2007 Strengthening the India ‐ Australia Corridor in select Food & Agribusiness Sectors The average productivity of dairy animals is among the lowest in the world (the average being less than 20% of Australia’s average). Dairying in India is mainly undertaken by farmers who on an average own only 2 to 3 milking animals. Improper cattle rearing methods, lack of feed input to the milch animals, tropical climate and low yielding indigenous breed are some of the major deterrents for increased productivity of dairy cows. India has a unique pattern of production and milk collection. It follows a three tier system with farmers producing milk as the first tier, dairy cooperative societies and the district milk union forming the second and third tiers. These cooperatives form part of a national milk grid that links milk producers throughout India with consumers in more than 700 towns and cities and bridges seasonal and regional variations in the availability of milk. However, quality of milk at the small farmer level is a major issue of concern in India. Nevertheless, most of the more sophisticated dairy plants in India (organized) have ISO HACCP certification. The organized sector handles only around 17‐18% of total milk production in India with the remainder being used for personal consumption. Problems in processing include supply imbalances during the lean (summer) and flush (winter) season, lack of large scale processing, limited commercialization, lack of packing technology and inefficient distribution infrastructure network. USDA Foreign Agricultural Service. Global Agricultural Information Network. GAIN Report Number: IN9119. Date 9/14/2009 India – Livestock and Products Annual 2009 Indian cattle disease status According to the Indian Ministry of Agriculture, the country is free from Rinderpest and Contagious Bovine Pleuro‐pneumonia but physical surveillance is undertaken to ensure disease free status. A Foot‐and‐Mouth Disease (FMD) control program is also being implemented in 54 districts in the country to control the disease with funding support from the central government, including the cost of vaccines.
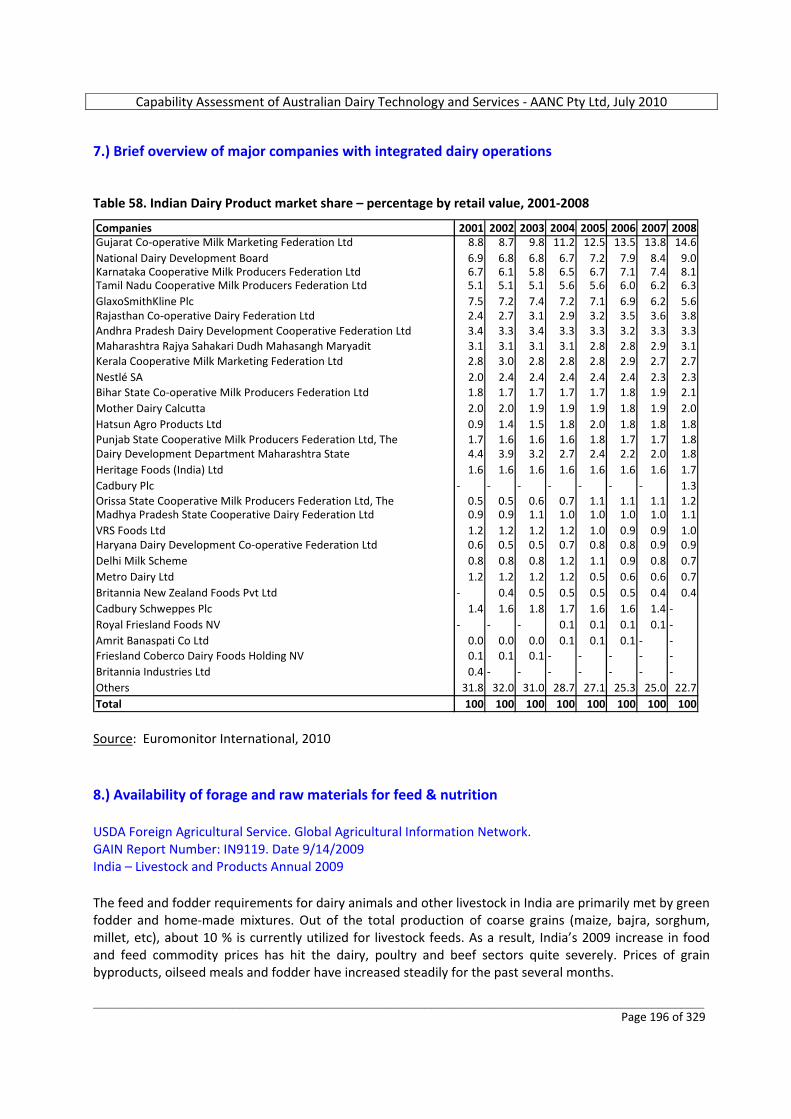
Capability Assessment of Australian Dairy Technology and Services ‐ AANC Pty Ltd, July 2010
_________________________________________________________________________________________________________ Page 196 of 329
7.) Brief overview of major companies with integrated dairy operations Table 58. Indian Dairy Product market share – percentage by retail value, 2001‐2008
Companies 2001 2002 2003 2004 2005 2006 2007 2008Gujarat Co‐operative Milk Marketing Federation Ltd 8.8 8.7 9.8 11.2 12.5 13.5 13.8 14.6National Dairy Development Board 6.9 6.8 6.8 6.7 7.2 7.9 8.4 9.0Karnataka Cooperative Milk Producers Federation Ltd 6.7 6.1 5.8 6.5 6.7 7.1 7.4 8.1Tamil Nadu Cooperative Milk Producers Federation Ltd 5.1 5.1 5.1 5.6 5.6 6.0 6.2 6.3GlaxoSmithKline Plc 7.5 7.2 7.4 7.2 7.1 6.9 6.2 5.6Rajasthan Co‐operative Dairy Federation Ltd 2.4 2.7 3.1 2.9 3.2 3.5 3.6 3.8Andhra Pradesh Dairy Development Cooperative Federation Ltd 3.4 3.3 3.4 3.3 3.3 3.2 3.3 3.3Maharashtra Rajya Sahakari Dudh Mahasangh Maryadit 3.1 3.1 3.1 3.1 2.8 2.8 2.9 3.1Kerala Cooperative Milk Marketing Federation Ltd 2.8 3.0 2.8 2.8 2.8 2.9 2.7 2.7Nestlé SA 2.0 2.4 2.4 2.4 2.4 2.4 2.3 2.3Bihar State Co‐operative Milk Producers Federation Ltd 1.8 1.7 1.7 1.7 1.7 1.8 1.9 2.1Mother Dairy Calcutta 2.0 2.0 1.9 1.9 1.9 1.8 1.9 2.0Hatsun Agro Products Ltd 0.9 1.4 1.5 1.8 2.0 1.8 1.8 1.8Punjab State Cooperative Milk Producers Federation Ltd, The 1.7 1.6 1.6 1.6 1.8 1.7 1.7 1.8Dairy Development Department Maharashtra State 4.4 3.9 3.2 2.7 2.4 2.2 2.0 1.8Heritage Foods (India) Ltd 1.6 1.6 1.6 1.6 1.6 1.6 1.6 1.7Cadbury Plc ‐ ‐ ‐ ‐ ‐ ‐ ‐ 1.3Orissa State Cooperative Milk Producers Federation Ltd, The 0.5 0.5 0.6 0.7 1.1 1.1 1.1 1.2Madhya Pradesh State Cooperative Dairy Federation Ltd 0.9 0.9 1.1 1.0 1.0 1.0 1.0 1.1VRS Foods Ltd 1.2 1.2 1.2 1.2 1.0 0.9 0.9 1.0Haryana Dairy Development Co‐operative Federation Ltd 0.6 0.5 0.5 0.7 0.8 0.8 0.9 0.9Delhi Milk Scheme 0.8 0.8 0.8 1.2 1.1 0.9 0.8 0.7Metro Dairy Ltd 1.2 1.2 1.2 1.2 0.5 0.6 0.6 0.7Britannia New Zealand Foods Pvt Ltd ‐ 0.4 0.5 0.5 0.5 0.5 0.4 0.4Cadbury Schweppes Plc 1.4 1.6 1.8 1.7 1.6 1.6 1.4 ‐Royal Friesland Foods NV ‐ ‐ ‐ 0.1 0.1 0.1 0.1 ‐Amrit Banaspati Co Ltd 0.0 0.0 0.0 0.1 0.1 0.1 ‐ ‐Friesland Coberco Dairy Foods Holding NV 0.1 0.1 0.1 ‐ ‐ ‐ ‐ ‐Britannia Industries Ltd 0.4 ‐ ‐ ‐ ‐ ‐ ‐ ‐Others 31.8 32.0 31.0 28.7 27.1 25.3 25.0 22.7Total 100 100 100 100 100 100 100 100 Source: Euromonitor International, 2010 8.) Availability of forage and raw materials for feed & nutrition USDA Foreign Agricultural Service. Global Agricultural Information Network. GAIN Report Number: IN9119. Date 9/14/2009 India – Livestock and Products Annual 2009 The feed and fodder requirements for dairy animals and other livestock in India are primarily met by green fodder and home‐made mixtures. Out of the total production of coarse grains (maize, bajra, sorghum, millet, etc), about 10 % is currently utilized for livestock feeds. As a result, India’s 2009 increase in food and feed commodity prices has hit the dairy, poultry and beef sectors quite severely. Prices of grain byproducts, oilseed meals and fodder have increased steadily for the past several months.
Capability Assessment of Australian Dairy Technology and Services ‐ AANC Pty Ltd, July 2010
_________________________________________________________________________________________________________ Page 197 of 329
FAO Country Pasture/Forage Resource Profiles – India. November, 2002 http://www.fao.org/ag/AGP/AGPC/doc/Counprof/india.htm There are different feeding systems for the various livestock rearing practices. In peri‐urban and urban systems, livestock are mostly tethered. Green fodder (Egyptian clover, rape, maize, pennisetums, sorghums, oats) is purchased from nearby rural areas and fed. This practice is heavily supplemented with crop residues mainly maize, pennisetum, rice and wheat straw. There is significant use of concentrates for milk animals. Premixed commercial stockfeeds are readily available from local markets. The rural system involves free grazing of community grazing lands and forests, supplemented with green fodder cultivated in the farmer`s fields. During lean periods, such as summer and autumn, tree leaf fodder is also used. Concentrates are fed only to lactating animals. The urban and peri‐urban systems comprise mostly milk animals. Average quantities of daily feed offered to milk animals are 6.3 kg dry fodder, 5.3 kg green fodder and 0.25 kg concentrates for cows, while a milking buffalo is offered 8.3 kg dry fodder, 2.25 kg green fodder and 0.1 kg of concentrates. Adapted from ‐ Agri‐Food Processing report ‐ Rabobank, Rabo India Finance Ltd, June 2007 Strengthening the India ‐ Australia Corridor in select Food & Agribusiness Sectors Reasons for the very poor milk yield of cattle in India are mostly related to nutritional factors. The feeding of concentrates is not commonly fed on a national, traditional level. Left over human food is often relied on to supplement grasses available. Mineral supplementation is rarely practiced. Cattle tend to be given the same feed throughout the year, irrespective of seasonal or animal physiological status. In general, nutritional management of new born heifers is poor, resulting in age at first calving being around 48 months, instead of closer to 24 months as achieved in more advanced countries. Improper care during pregnancy results in mortality rates of as high as 4‐5%. Poor nutritional management also plays a large role in the fact that only around 60% of artificial insemination cases are successful in India. Heat detection is also a key limitation for AI in India, particularly in buffaloes, which apparently have a high incidence of silent heats. 9.) Availability of Artificial Insemination laboratories and testing facilities for cattle; also veterinary services Austrade, New Delhi: Department of Animal Husbandry & Dairying, Ministry of Agriculture, Government of India: http://dahd.nic.in/ Central Cattle Development Organizations These organizations include the 7 Central Cattle Breeding Farms, the Central Frozen Semen Production and Training Institute, Hessarghatta and the 4 Central Herd Registration Units, which have been established by the Department in different regions of the country for production of genetically superior breeds of bull calves, good quality frozen semen and identification of location of superior germplasms of cattle and buffaloes, to meet the requirement of bulls and frozen semen doses in different parts of the country.
Capability Assessment of Australian Dairy Technology and Services ‐ AANC Pty Ltd, July 2010
_________________________________________________________________________________________________________ Page 198 of 329
Central Cattle Breeding Farms (CCBF) The Central Cattle Breeding Farms located at Suratgarh ( Rajasthan), Chiplima and Sunabeda (Orissa), Dhamrod (Gujarat), Hessarghatta (Karnataka), Alamadhi (Tamil Nadu) and Andeshnagar (U.P). are maintaining bull mothers of important cattle and buffalo breeds which include Tharparkar, Red Sindhi, Jersey, Holstein Friesian, Crossbred (HF x Tharparkar, Jersey x Red Sindhi), Surti and Murrah. The farms produce bull calves from these bull mothers and supply high pedigree bull calves and bulls to the State Governments and other breeding organisations for production of frozen semen. The farms located at Sunabeda, Suratgarh and Andeshnagar also have the facilities for production of frozen semen. The Central Cattle Breeding Farm, Alamadhi has been associated with Associated Herd Progeny Testing Programme of the Central Institute for Research on Buffaloes, Hissar. The buffaloes available at the farm are used for test mating of Murrah bulls and semen of proven/ high pedigree bulls is used for further genetic improvement. The Central Cattle Breeding farms follow the fodder cropping programme as recommended by Indian Grassland and Fodder Research Institute, Jhansi and also produce fodder seeds for distribution under Central Minikit Testing Programme under which free fodder seed minikits are provided to farmers. The farms provide breeding facilities to the cows and buffaloes of the nearby villages free of cost and also conduct training of farmers in dairy farming under Animal Husbandry Extension Programme. During 2004‐05, the farms have produced 297 bull calves (till Feb 2005) and trained 1,114 personnel in the management of bull mother farms. Central Frozen Semen Production and Training Institute, Hessarghatta This is a premier Institute producing frozen semen doses of indigenous exotic and cross breed cattle bulls and Murrah buffalo bulls for use in artificial insemination. The institute also provides training in frozen semen technology to technical officers of the State Governments and acts as a centre for testing the indigenously manufactured frozen semen and AI equipment. The institute has acquired proficiency in Embryo Transfer Technology sponsored by the Department of Biotechnology from 1987‐88 to 1991‐92. The Institute conducts the following four training programmes: 1.) Frozen Semen Processing technology (3 weeks), 2.) Management of field AI Programme and Infertility (2 weeks), 3.) Laboratory techniques for evaluation and quality control of frozen semen (2 weeks), 4.) Andrological aspects of bull breeding soundness (3 weeks). Semen Station agencies: Government/ SIA 37 stations NDDB, Dairy Co‐op, NGO and private 12 stations Total 49 stations FAO Country Pasture/Forage Resource Profiles – India. November, 2002 http://www.fao.org/ag/AGP/AGPC/doc/Counprof/india.htm In 1992/93, the country had 124 intensive cattle development projects, 75 frozen semen stations, 38,613 artificial insemination centres and 135 liquid nitrogen plants. 10.) Agribusiness educational facilities to support dairy production Austrade, New Delhi:
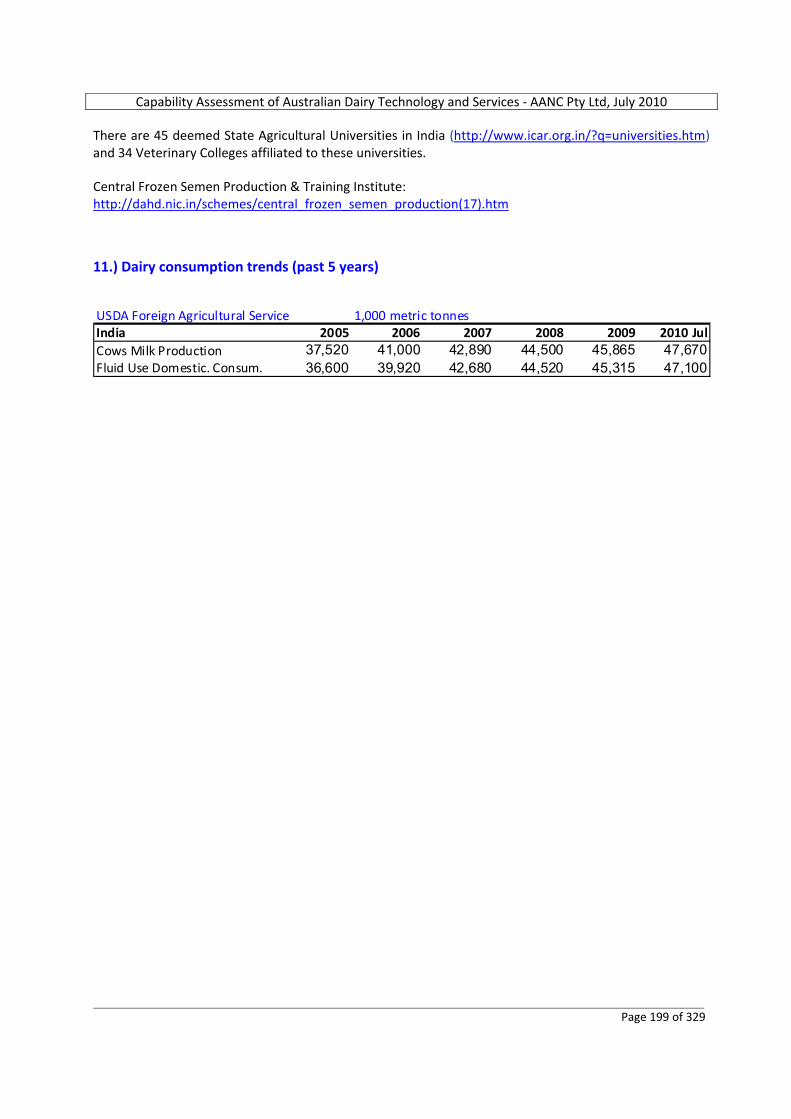
Capability Assessment of Australian Dairy Technology and Services ‐ AANC Pty Ltd, July 2010
_________________________________________________________________________________________________________ Page 199 of 329
There are 45 deemed State Agricultural Universities in India (http://www.icar.org.in/?q=universities.htm) and 34 Veterinary Colleges affiliated to these universities. Central Frozen Semen Production & Training Institute: http://dahd.nic.in/schemes/central_frozen_semen_production(17).htm 11.) Dairy consumption trends (past 5 years) USDA Foreign Agricultural Service 1,000 metric tonnesIndia 2005 2006 2007 2008 2009 2010 JulCows Milk Production 37,520 41,000 42,890 44,500 45,865 47,670Fluid Use Domestic. Consum. 36,600 39,920 42,680 44,520 45,315 47,100
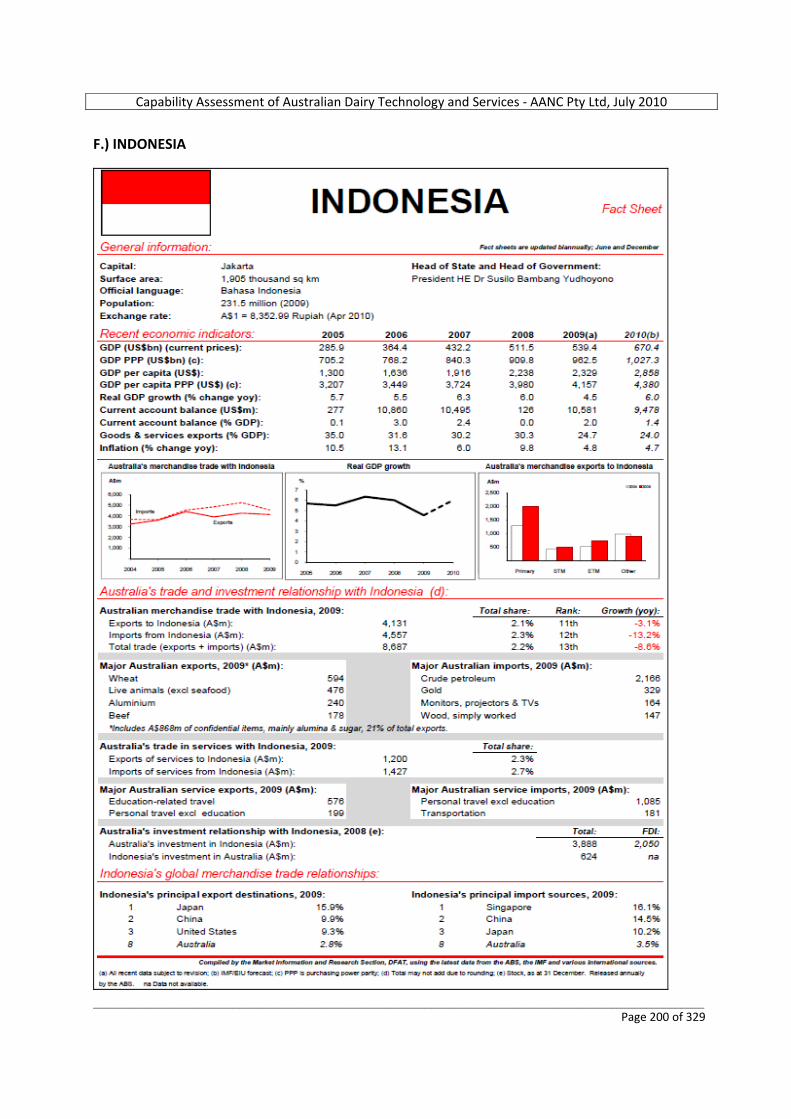
Capability Assessment of Australian Dairy Technology and Services ‐ AANC Pty Ltd, July 2010
_________________________________________________________________________________________________________ Page 200 of 329
F.) INDONESIA

Capability Assessment of Australian Dairy Technology and Services ‐ AANC Pty Ltd, July 2010
_________________________________________________________________________________________________________ Page 201 of 329
Potentially Exportable Product or Service Area Indonesia
Farm levelProducts for export:Pregnant heifers for live export STRONG DEMAND ‐ Tropically adapted Holsteins; Currently no 2 importerGenetic material ‐ semen, embryos Yes ‐ emerging need, but competition from US, Canada, Europe, NZPasture & forage crop seeds Yes ‐ definite present needSilage making additives & equipment Yes ‐ definite present needHay and/or Straw for bulk export Local forages availableFeeds, supplements & additives Local supplies, or obtained from Asian countriesVeterinary health products Yes ‐ emerging need, but is competitiveElectronic ID systems Yes ‐ emerging needFarm equipment ‐ electric fencing, etc Yes ‐ good potentialHousing, fencing, farm merchandise & equipment supplies Growing market, but highly competitive, esp with many Asian suppliersFarm management software & internet applications Current demand unclearMilking machines & dairying equipment Yes ‐ emerging need, esp amongst more progressive farmersHerd recording services & expertise Not really at presentVeterinary services re health & reproductive management Yes ‐ definite present needAdvisory/consulting services available:
Pasture establishment & grazing management, inc cell grazing Yes ‐ definite present needSoil conservation, weed control, water & fertilizer management Yes ‐ definite present needIrrigation management, water supply & regulation Yes ‐ definite present needFodder conservation, inc hay & silage production Yes ‐ definite present needOrganic farming technologies Current demand unclearPossible future impacts of climate change Current demand unclearGenomic selection, semen sexing & artificial breeding Yes ‐ emerging needFeed selection, ration formulation & nutritional management Yes ‐ definite present needMilking machinery, maintenance & testing Yes ‐ emerging need, esp amongst more progressive farmersEnvironmental, effluent management & regulatory authorities Yes ‐ good potentialHousing design & animal welfare Yes ‐ emerging needFarm financial management Limited opportunities at presentTechnical education & training services Yes ‐ good potential
Processing & Manufacturing levelProducts for export:Powdered & whole milk, cheese, butter, yoghurts & products Currently takes 6% of Aust's exports; ASEAN FTA commenced early 2010Processing, sterilizing & cleaning equipment & chemicals Yes ‐ good potentialDairy product ingredients, additives & packaging materials Yes ‐ good potentialAdvisory/consulting services available:
Milk processing, factory design & equipment Yes ‐ emerging needFood safety & hygiene in processing Yes ‐ emerging needQuality control, HACCP & product testing Yes ‐ emerging needPackaging, distribution & cold chain management Yes ‐ definite present needFactory & retailing financial services DoubtfulDomestic & International marketing & economics DoubtfulTechnical education & training services Yes ‐ emerging need
Opportunities for Australia to supply Dairy Animals, Technologies, Equipment and Services
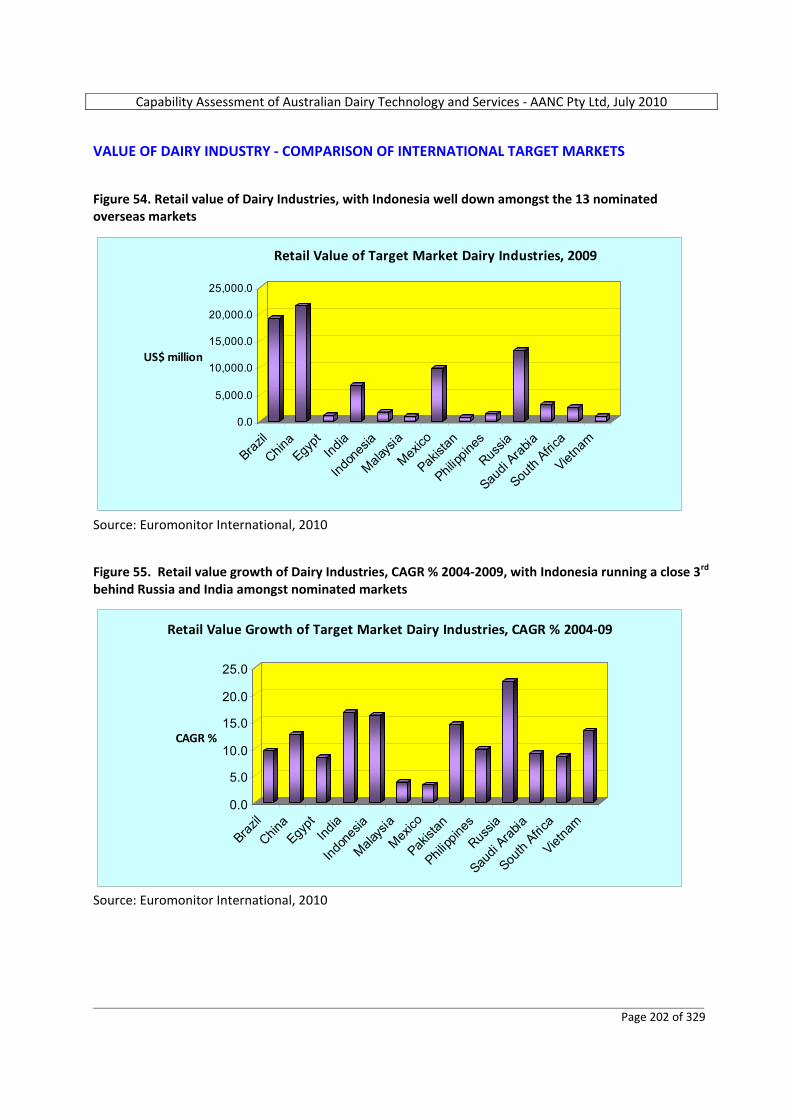
Capability Assessment of Australian Dairy Technology and Services ‐ AANC Pty Ltd, July 2010
_________________________________________________________________________________________________________ Page 202 of 329
VALUE OF DAIRY INDUSTRY ‐ COMPARISON OF INTERNATIONAL TARGET MARKETS Figure 54. Retail value of Dairy Industries, with Indonesia well down amongst the 13 nominated overseas markets
0.0
5,000.0
10,000.0
15,000.0
20,000.0
25,000.0
US$ million
Brazil
China
Egypt
India
Indon
esia
Malays
ia
Mexico
Pakist
an
Philipp
ines
Russia
Saudi
Arabia
South
Africa
Vietna
m
Retail Value of Target Market Dairy Industries, 2009
Source: Euromonitor International, 2010 Figure 55. Retail value growth of Dairy Industries, CAGR % 2004‐2009, with Indonesia running a close 3rd behind Russia and India amongst nominated markets
0.0
5.0
10.0
15.0
20.0
25.0
CAGR %
Brazil
China
Egypt
India
Indon
esia
Malays
ia
Mexico
Pakist
an
Philipp
ines
Russia
Saudi
Arabia
South
Africa
Vietna
m
Retail Value Growth of Target Market Dairy Industries, CAGR % 2004‐09
Source: Euromonitor International, 2010
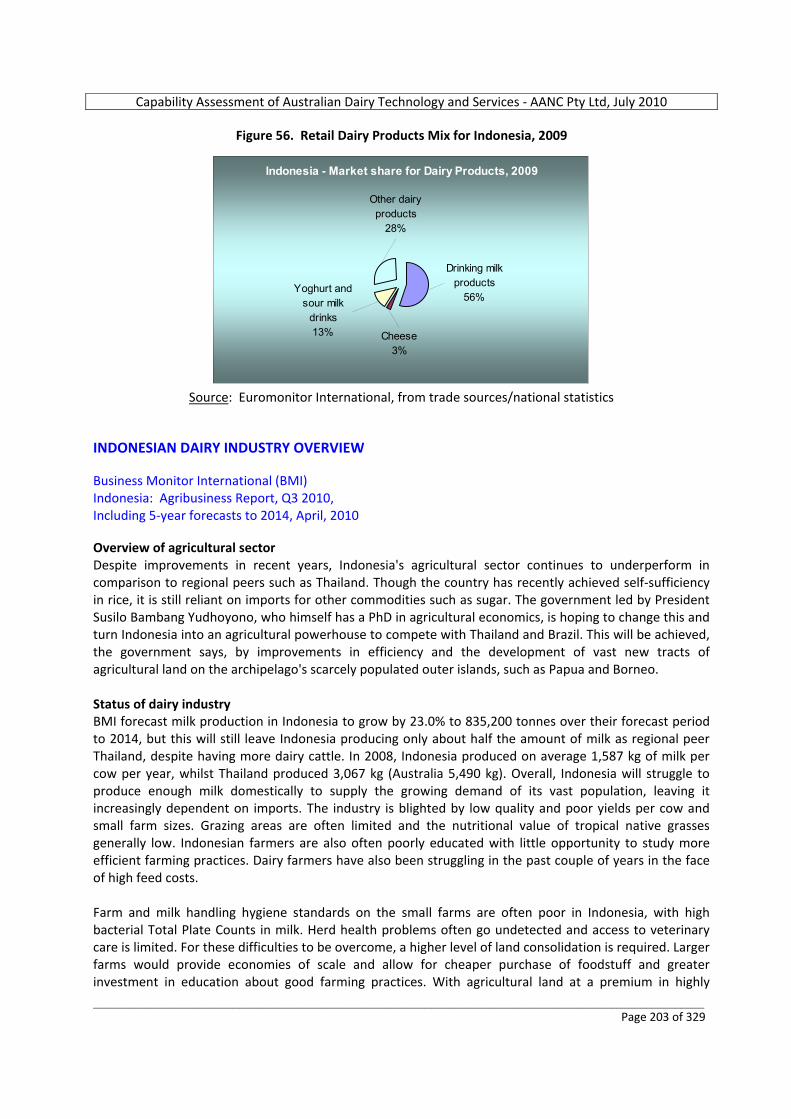
Capability Assessment of Australian Dairy Technology and Services ‐ AANC Pty Ltd, July 2010
_________________________________________________________________________________________________________ Page 203 of 329
Figure 56. Retail Dairy Products Mix for Indonesia, 2009
Indonesia - Market share for Dairy Products, 2009
Other dairy products
28%
Yoghurt and sour milk
drinks13% Cheese
3%
Drinking milk products
56%
Source: Euromonitor International, from trade sources/national statistics
INDONESIAN DAIRY INDUSTRY OVERVIEW Business Monitor International (BMI) Indonesia: Agribusiness Report, Q3 2010, Including 5‐year forecasts to 2014, April, 2010 Overview of agricultural sector Despite improvements in recent years, Indonesia's agricultural sector continues to underperform in comparison to regional peers such as Thailand. Though the country has recently achieved self‐sufficiency in rice, it is still reliant on imports for other commodities such as sugar. The government led by President Susilo Bambang Yudhoyono, who himself has a PhD in agricultural economics, is hoping to change this and turn Indonesia into an agricultural powerhouse to compete with Thailand and Brazil. This will be achieved, the government says, by improvements in efficiency and the development of vast new tracts of agricultural land on the archipelago's scarcely populated outer islands, such as Papua and Borneo. Status of dairy industry BMI forecast milk production in Indonesia to grow by 23.0% to 835,200 tonnes over their forecast period to 2014, but this will still leave Indonesia producing only about half the amount of milk as regional peer Thailand, despite having more dairy cattle. In 2008, Indonesia produced on average 1,587 kg of milk per cow per year, whilst Thailand produced 3,067 kg (Australia 5,490 kg). Overall, Indonesia will struggle to produce enough milk domestically to supply the growing demand of its vast population, leaving it increasingly dependent on imports. The industry is blighted by low quality and poor yields per cow and small farm sizes. Grazing areas are often limited and the nutritional value of tropical native grasses generally low. Indonesian farmers are also often poorly educated with little opportunity to study more efficient farming practices. Dairy farmers have also been struggling in the past couple of years in the face of high feed costs. Farm and milk handling hygiene standards on the small farms are often poor in Indonesia, with high bacterial Total Plate Counts in milk. Herd health problems often go undetected and access to veterinary care is limited. For these difficulties to be overcome, a higher level of land consolidation is required. Larger farms would provide economies of scale and allow for cheaper purchase of foodstuff and greater investment in education about good farming practices. With agricultural land at a premium in highly
Capability Assessment of Australian Dairy Technology and Services ‐ AANC Pty Ltd, July 2010
_________________________________________________________________________________________________________ Page 204 of 329
populated areas such as Java, and the less populated areas lacking the infrastructure for production of perishable products such as milk, if there is to be any dramatic rise in production, it will have to come through improved yields. [SEE AUTHOR’S NOTE BELOW.] In spite of this, Indonesia's vast population still offers plenty of opportunities for dairy producers, particularly in urban centres where most of the consumption growth is likely to be centred. Growth in demand on the outer islands outside major population centres will be limited by poor infrastructure and a lack of access to modern retail. Poor refrigeration infrastructure means that UHT treated, processed dairy products such as flavoured and condensed milk are often more popular than fresh milk in much of the archipelago. USDA Foreign Agricultural Service. Global Agricultural Information Network. GAIN Report Number: ID9032. Date 11/19/2009 Indonesia – Livestock and Products Annual 2009 The Government of Indonesia estimates that the Indonesian economy will grow by 5.5 % in 2010. This, combined with a stable political outlook, room for increased per capita consumption of milk, and a growing awareness of the health benefits from dairy products will continue to provide opportunities for the Indonesian milk processing industry. Several new producers are entering the industry and some of the major dairy manufacturers are expanding their capacity. However, per capita consumption of milk will remain below consumption rates of neighboring countries due to the increase of retail prices for dairy and dairy products. Growth in domestic fresh milk production will remain limited because of several fundamental factors. Whole fresh milk is mixed with imported milk powder, with Australia and New Zealand being the preferred supplier due to close proximity. During 2009, Indonesian fresh milk production reached an estimated 56,000 MT. These levels meet only 25 % of domestic requirements. In 2010, Indonesian fresh milk production is expected to increase to 62,000 MT. Price incentives will encourage better farm management, resulting in higher quality milk. Nonetheless, several fundamental problems hamper further improvements in Indonesian dairy cattle productivity. These problems include: limited farmer education; scarcity of forage; high price of dairy cattle feed; small farm size; scarcity of land with suitable elevation for dairy cattle farming; poor farm management practices; limited access to bank loans; lack of technology for milking and processing the fresh milk; and limited access to high‐quality genetics. [AUTHOR’S NOTE: Milk productivity increases in Indonesia are also well achievable through the further expansion of large feedlot dairy enterprises such as those established over recent years through foreign investment projects involving companies such as PT Friesian Flag Indonesia, PT Nestle Indonesia, the French based Danone Group, and the Australian‐Indonesian joint venture PT Greenfields Indonesia.] SWOT ANALYSIS Business Monitor International (BMI) Indonesia: Agribusiness Report, Q3 2010, Including 5‐year forecasts to 2014, April, 2010 Indonesian Agricultural Sector SWOT Strengths • The large population and rising incomes provide a vast market for agricultural products.
Capability Assessment of Australian Dairy Technology and Services ‐ AANC Pty Ltd, July 2010
_________________________________________________________________________________________________________ Page 205 of 329
• Rising incomes and urbanisation will increase demand for higher value food items such as dairy, confectionery and meat.
Opportunities • Indonesia has a low cost and large supply of available labour resources. Weaknesses • The Indonesian agricultural sector is tightly regulated, with imports and exports strictly controlled. • Farms in Indonesia are small with the majority less than one hectare in size, limiting economies of
scale and opportunities for mechanisation of production. • Infrastructure is poor outside of Java and the main population centres on some of the other large
islands. • Indonesian farmers are often poorly trained with little knowledge of modern farming practices. Threats • Demand for non‐essential foodstuff such as meat, dairy and wheat‐based products is highly elastic and
would likely suffer if income growth faltered. Indonesian Political SWOT Strengths • Indonesia managed a successful transition to democracy in 2004. In addition, the 2009 parliamentary
and presidential elections passed by peacefully, signaling the consolidation of the democratic process. • President Susilo Bambang Yudhoyono's Democratic Party had a strong showing in the 2009
parliamentary elections. Coupled with a strong mandate following his re‐election in the same year, the implementation of policies in the legislature should potentially become less problematic.
• The military's role in politics has gradually been reduced. The prospects of a military coup ‐ which seemed a real possibility in the late 1990s and early 2000s ‐ have diminished substantially.
Threats • Regional militant group Jemaah Islamiah (JI) poses a lingering threat to security in Indonesia. Despite
several of its top leaders having been arrested in recent years, the group blamed for the Bali bombings of October 2002 and the Jakarta bombings of July 2009, remains active.
Indonesian Business Environment SWOT Strengths • Indonesia is South East Asia's largest economy with a nominal GDP of US$500 billion, and is the
world's fourth‐most populous country with almost 240 million people. It thus offers investors a vast home market in which to do business.
• Indonesia is also a founding member of the Association of South East Asian Nations (ASEAN). As a member of ASEAN's Free Trade Area (AFTA), Indonesia is committed to lowering tariff and non‐tariff barriers to trade.
Weaknesses • Indonesia's excessive bureaucracy makes it a difficult place to do business. Among Asian economies,
Indonesia has the longest period to start a business. Labour laws are also considered excessive. • Recent high‐level business disputes between the government and foreign investors demonstrate that
even after investments become up‐and‐running, there is still scope for legal problems or obstacles posed by legal wrangling.
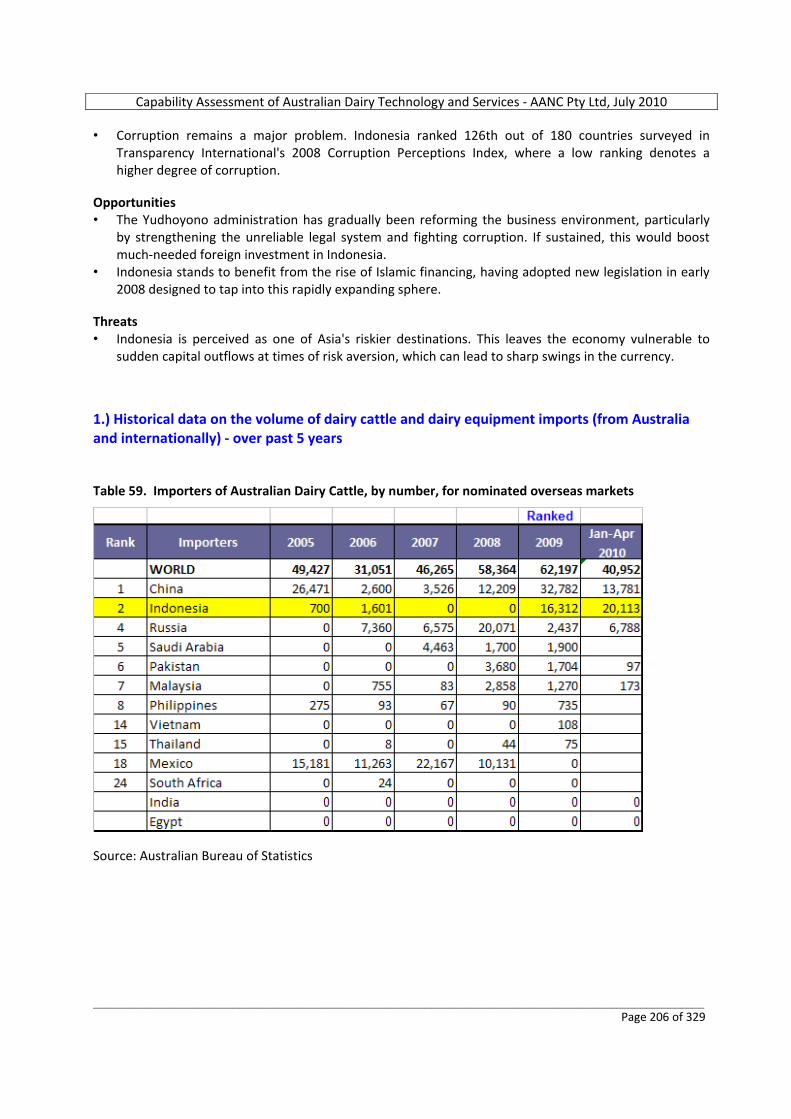
Capability Assessment of Australian Dairy Technology and Services ‐ AANC Pty Ltd, July 2010
_________________________________________________________________________________________________________ Page 206 of 329
• Corruption remains a major problem. Indonesia ranked 126th out of 180 countries surveyed in Transparency International's 2008 Corruption Perceptions Index, where a low ranking denotes a higher degree of corruption.
Opportunities • The Yudhoyono administration has gradually been reforming the business environment, particularly
by strengthening the unreliable legal system and fighting corruption. If sustained, this would boost much‐needed foreign investment in Indonesia.
• Indonesia stands to benefit from the rise of Islamic financing, having adopted new legislation in early 2008 designed to tap into this rapidly expanding sphere.
Threats • Indonesia is perceived as one of Asia's riskier destinations. This leaves the economy vulnerable to
sudden capital outflows at times of risk aversion, which can lead to sharp swings in the currency. 1.) Historical data on the volume of dairy cattle and dairy equipment imports (from Australia and internationally) ‐ over past 5 years Table 59. Importers of Australian Dairy Cattle, by number, for nominated overseas markets
Source: Australian Bureau of Statistics
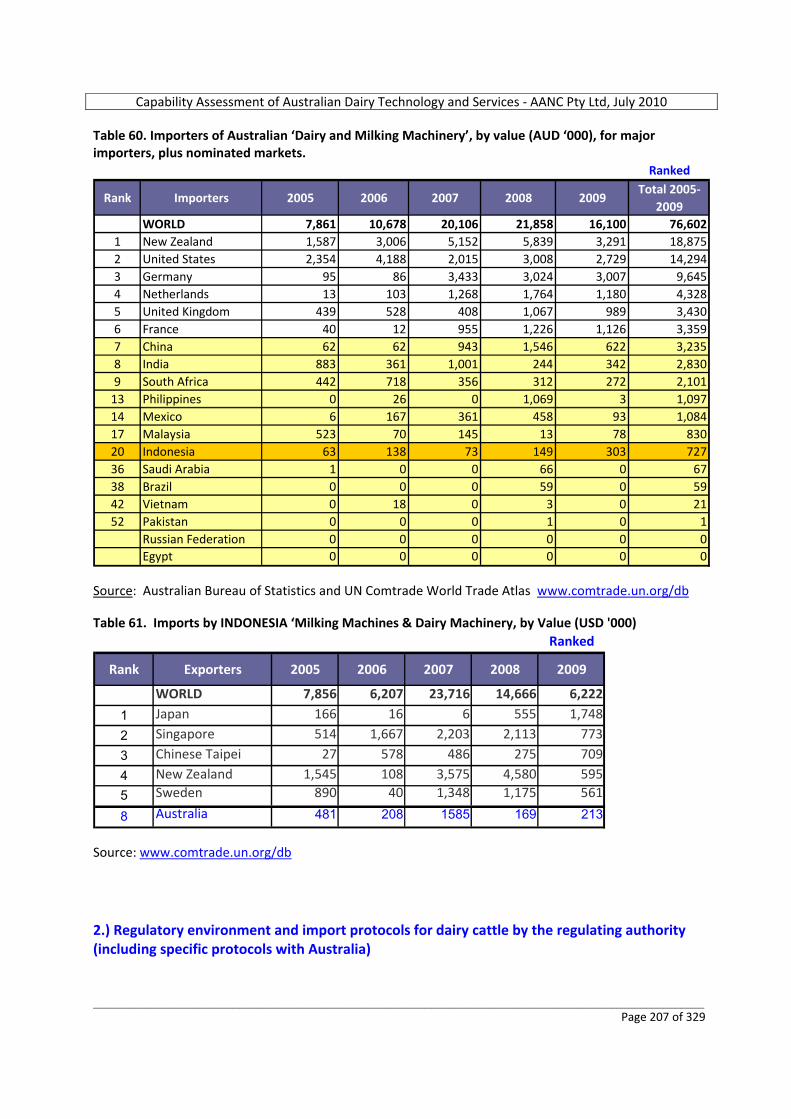
Capability Assessment of Australian Dairy Technology and Services ‐ AANC Pty Ltd, July 2010
_________________________________________________________________________________________________________ Page 207 of 329
Table 60. Importers of Australian ‘Dairy and Milking Machinery’, by value (AUD ‘000), for major importers, plus nominated markets.
Ranked
Rank Importers 2005 2006 2007 2008 2009Total 2005‐
2009WORLD 7,861 10,678 20,106 21,858 16,100 76,602
1 New Zealand 1,587 3,006 5,152 5,839 3,291 18,8752 United States 2,354 4,188 2,015 3,008 2,729 14,2943 Germany 95 86 3,433 3,024 3,007 9,6454 Netherlands 13 103 1,268 1,764 1,180 4,3285 United Kingdom 439 528 408 1,067 989 3,4306 France 40 12 955 1,226 1,126 3,3597 China 62 62 943 1,546 622 3,2358 India 883 361 1,001 244 342 2,8309 South Africa 442 718 356 312 272 2,101
13 Philippines 0 26 0 1,069 3 1,09714 Mexico 6 167 361 458 93 1,08417 Malaysia 523 70 145 13 78 83020 Indonesia 63 138 73 149 303 72736 Saudi Arabia 1 0 0 66 0 6738 Brazil 0 0 0 59 0 5942 Vietnam 0 18 0 3 0 2152 Pakistan 0 0 0 1 0 1
Russian Federation 0 0 0 0 0 0Egypt 0 0 0 0 0 0
Source: Australian Bureau of Statistics and UN Comtrade World Trade Atlas www.comtrade.un.org/db Table 61. Imports by INDONESIA ‘Milking Machines & Dairy Machinery, by Value (USD '000)
Ranked
Rank Exporters 2005 2006 2007 2008 2009
WORLD 7,856 6,207 23,716 14,666 6,222
1 Japan 166 16 6 555 1,748
2 Singapore 514 1,667 2,203 2,113 773
3 Chinese Taipei 27 578 486 275 709
4 New Zealand 1,545 108 3,575 4,580 595
5 Sweden 890 40 1,348 1,175 561
8 Australia 481 208 1585 169 213
Source: www.comtrade.un.org/db 2.) Regulatory environment and import protocols for dairy cattle by the regulating authority (including specific protocols with Australia)
Capability Assessment of Australian Dairy Technology and Services ‐ AANC Pty Ltd, July 2010
_________________________________________________________________________________________________________ Page 208 of 329
FOR GENERAL ADVICE REGARDING THE REGULATION OF EXPORTS FROM AUSTRALIA:
Australian Customs and Border Protection Service, Canberra City, ACT. http://www.customs.gov.au
FOR FOREIGN AFFAIRS, IMPORT TRADE PROTOCOLS/REGULATIONS AND WEB LINKAGES TO FOREIGN EMBASSIES IN COUNTRIES TO WHICH EXPORTS ARE INTENDED:
Australian Department of Foreign Affairs and Trade, Barton, ACT. http://www.dfat.gov.au/embassies/Indonesia
FOR SPECIFIC ADVICE REGARDING THE PREPARATION, SHIPPING OR AIR‐FREIGHTING OF LIVE ANIMALS AND LIVE ANIMALS TRADE ISSUES IN DESTINATION FOREIGN COUNTRIES:
LiveCorp Ltd, North Sydney, NSW. http://www.livecorp.com.au
FOR SPECIFIC ADVICE REGARDING PROTOCOLS FOR THE EXPORT OF LIVE ANIMALS (OR ANIMAL‐DERIVED PRODUCTS SUCH AS SEMEN AND EMBRYOS) FROM AUSTRALIA AND IMPORT PROTOCOLS IN DESTINATION FOREIGN COUNTRIES:
Australian Quarantine and Inspection Service (AQIS), Canberra City, ACT. http://www.aqis.gov.au
Specific Indonesian information: Business Monitor International (BMI) Indonesia: Agribusiness Report, Q3 2010, Including 5‐year forecasts to 2014, April, 2010 Over the long term, the free trade agreement recently commenced between ASEAN and Australia and New Zealand has the potential for opening up of the Indonesian market to dairy imports from these two countries. This could either force uncompetitive domestic farmers to switch to other products, or on the other hand, the increased competition could drive consolidation in the Indonesian dairy industry and therefore improve yields and efficiencies. USDA Foreign Agricultural Service. Global Agricultural Information Network. GAIN Report Number: ID9032. Date 11/19/2009 Indonesia – Livestock and Products Annual 2009 On June 4, 2009, Indonesia announced Law 18/2009, which requires that foreign companies which export animal derived products (including dairy products and eggs) to Indonesia prelist with the Indonesian
Important note re. Free Trade Agreement (FTA)
Indonesia is a member of the Association of South East Asian Nations (ASEAN). The ASEAN‐Australia‐New Zealand FTA came into effect at the beginning of 2010.
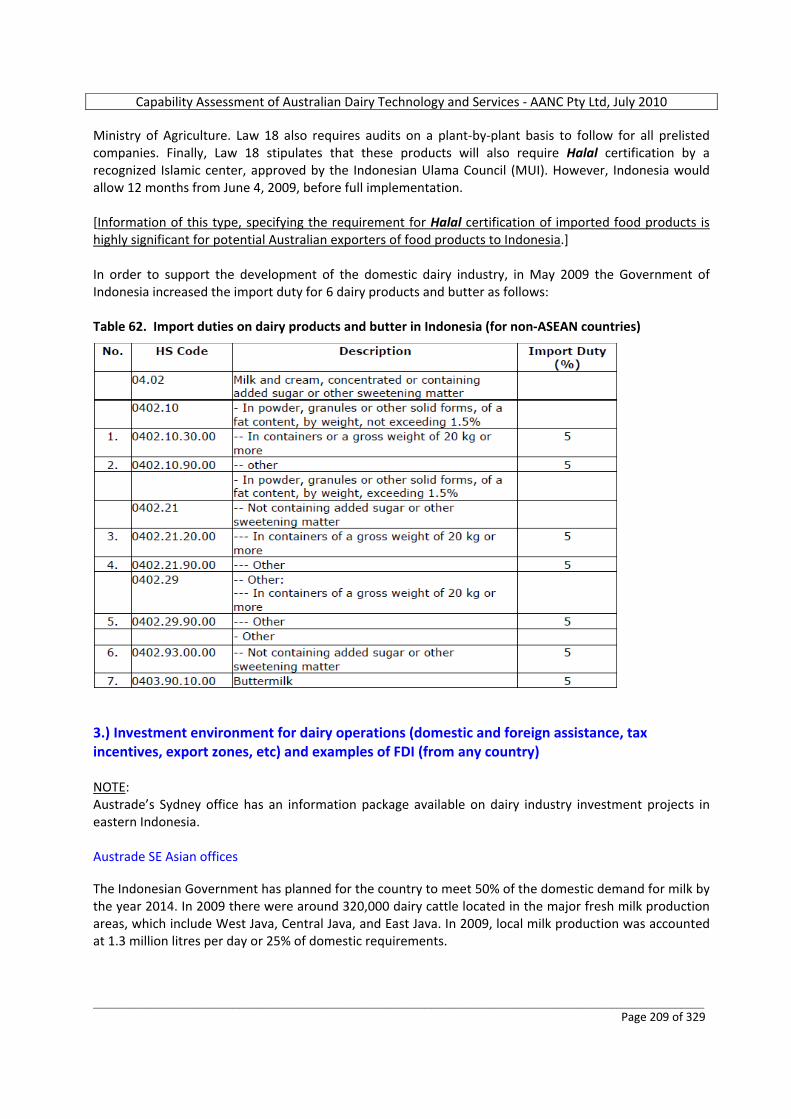
Capability Assessment of Australian Dairy Technology and Services ‐ AANC Pty Ltd, July 2010
_________________________________________________________________________________________________________ Page 209 of 329
Ministry of Agriculture. Law 18 also requires audits on a plant‐by‐plant basis to follow for all prelisted companies. Finally, Law 18 stipulates that these products will also require Halal certification by a recognized Islamic center, approved by the Indonesian Ulama Council (MUI). However, Indonesia would allow 12 months from June 4, 2009, before full implementation. [Information of this type, specifying the requirement for Halal certification of imported food products is highly significant for potential Australian exporters of food products to Indonesia.] In order to support the development of the domestic dairy industry, in May 2009 the Government of Indonesia increased the import duty for 6 dairy products and butter as follows: Table 62. Import duties on dairy products and butter in Indonesia (for non‐ASEAN countries)
3.) Investment environment for dairy operations (domestic and foreign assistance, tax incentives, export zones, etc) and examples of FDI (from any country) NOTE: Austrade’s Sydney office has an information package available on dairy industry investment projects in eastern Indonesia. Austrade SE Asian offices The Indonesian Government has planned for the country to meet 50% of the domestic demand for milk by the year 2014. In 2009 there were around 320,000 dairy cattle located in the major fresh milk production areas, which include West Java, Central Java, and East Java. In 2009, local milk production was accounted at 1.3 million litres per day or 25% of domestic requirements.
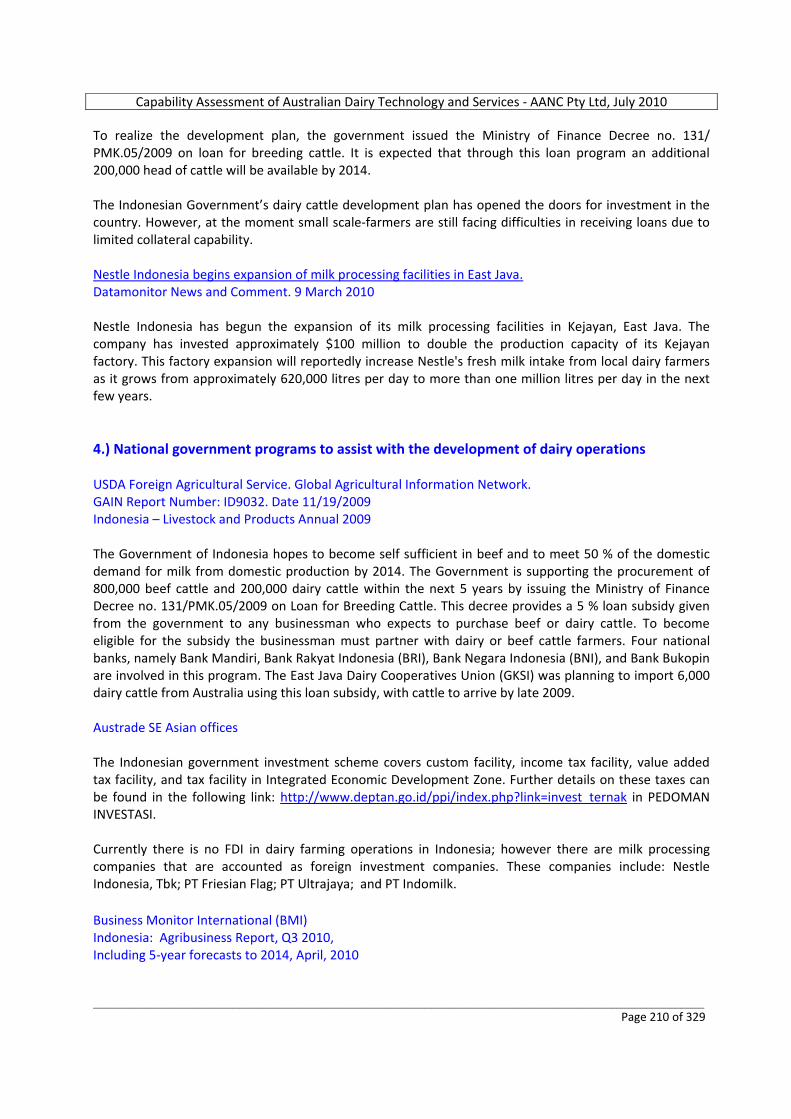
Capability Assessment of Australian Dairy Technology and Services ‐ AANC Pty Ltd, July 2010
_________________________________________________________________________________________________________ Page 210 of 329
To realize the development plan, the government issued the Ministry of Finance Decree no. 131/ PMK.05/2009 on loan for breeding cattle. It is expected that through this loan program an additional 200,000 head of cattle will be available by 2014. The Indonesian Government’s dairy cattle development plan has opened the doors for investment in the country. However, at the moment small scale‐farmers are still facing difficulties in receiving loans due to limited collateral capability. Nestle Indonesia begins expansion of milk processing facilities in East Java. Datamonitor News and Comment. 9 March 2010 Nestle Indonesia has begun the expansion of its milk processing facilities in Kejayan, East Java. The company has invested approximately $100 million to double the production capacity of its Kejayan factory. This factory expansion will reportedly increase Nestle's fresh milk intake from local dairy farmers as it grows from approximately 620,000 litres per day to more than one million litres per day in the next few years. 4.) National government programs to assist with the development of dairy operations USDA Foreign Agricultural Service. Global Agricultural Information Network. GAIN Report Number: ID9032. Date 11/19/2009 Indonesia – Livestock and Products Annual 2009 The Government of Indonesia hopes to become self sufficient in beef and to meet 50 % of the domestic demand for milk from domestic production by 2014. The Government is supporting the procurement of 800,000 beef cattle and 200,000 dairy cattle within the next 5 years by issuing the Ministry of Finance Decree no. 131/PMK.05/2009 on Loan for Breeding Cattle. This decree provides a 5 % loan subsidy given from the government to any businessman who expects to purchase beef or dairy cattle. To become eligible for the subsidy the businessman must partner with dairy or beef cattle farmers. Four national banks, namely Bank Mandiri, Bank Rakyat Indonesia (BRI), Bank Negara Indonesia (BNI), and Bank Bukopin are involved in this program. The East Java Dairy Cooperatives Union (GKSI) was planning to import 6,000 dairy cattle from Australia using this loan subsidy, with cattle to arrive by late 2009. Austrade SE Asian offices The Indonesian government investment scheme covers custom facility, income tax facility, value added tax facility, and tax facility in Integrated Economic Development Zone. Further details on these taxes can be found in the following link: http://www.deptan.go.id/ppi/index.php?link=invest_ternak in PEDOMAN INVESTASI. Currently there is no FDI in dairy farming operations in Indonesia; however there are milk processing companies that are accounted as foreign investment companies. These companies include: Nestle Indonesia, Tbk; PT Friesian Flag; PT Ultrajaya; and PT Indomilk. Business Monitor International (BMI) Indonesia: Agribusiness Report, Q3 2010, Including 5‐year forecasts to 2014, April, 2010
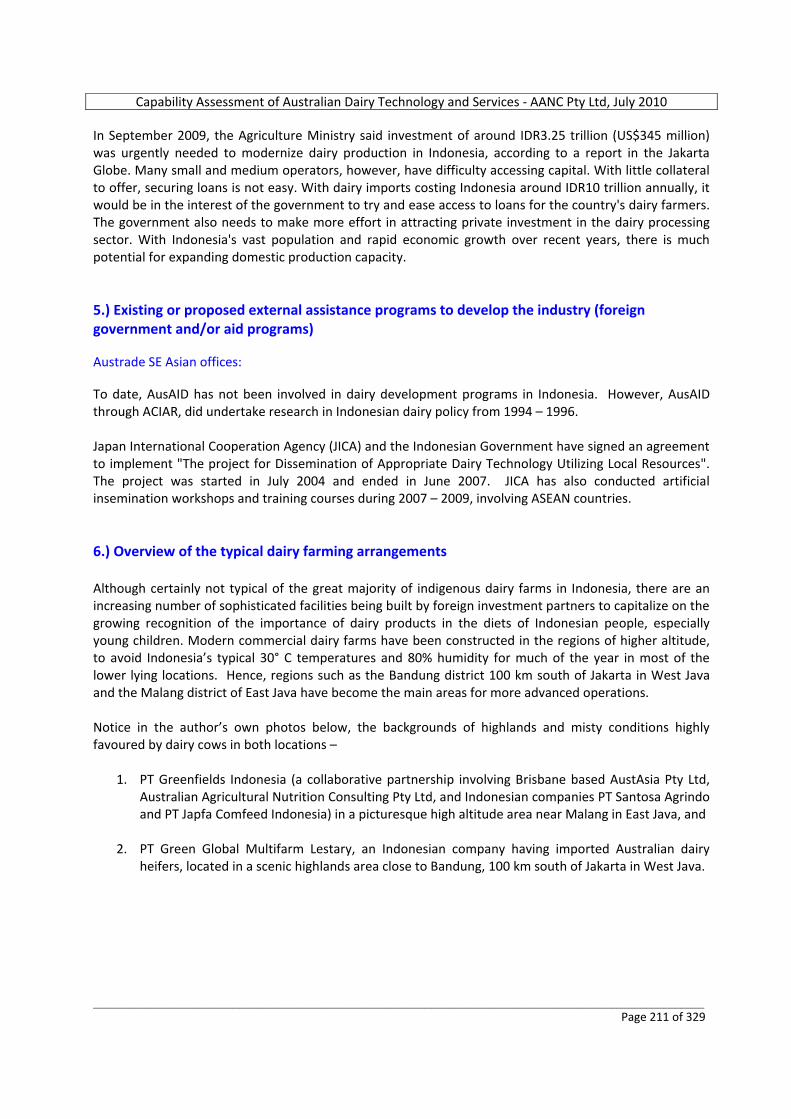
Capability Assessment of Australian Dairy Technology and Services ‐ AANC Pty Ltd, July 2010
_________________________________________________________________________________________________________ Page 211 of 329
In September 2009, the Agriculture Ministry said investment of around IDR3.25 trillion (US$345 million) was urgently needed to modernize dairy production in Indonesia, according to a report in the Jakarta Globe. Many small and medium operators, however, have difficulty accessing capital. With little collateral to offer, securing loans is not easy. With dairy imports costing Indonesia around IDR10 trillion annually, it would be in the interest of the government to try and ease access to loans for the country's dairy farmers. The government also needs to make more effort in attracting private investment in the dairy processing sector. With Indonesia's vast population and rapid economic growth over recent years, there is much potential for expanding domestic production capacity. 5.) Existing or proposed external assistance programs to develop the industry (foreign government and/or aid programs) Austrade SE Asian offices: To date, AusAID has not been involved in dairy development programs in Indonesia. However, AusAID through ACIAR, did undertake research in Indonesian dairy policy from 1994 – 1996. Japan International Cooperation Agency (JICA) and the Indonesian Government have signed an agreement to implement "The project for Dissemination of Appropriate Dairy Technology Utilizing Local Resources". The project was started in July 2004 and ended in June 2007. JICA has also conducted artificial insemination workshops and training courses during 2007 – 2009, involving ASEAN countries. 6.) Overview of the typical dairy farming arrangements Although certainly not typical of the great majority of indigenous dairy farms in Indonesia, there are an increasing number of sophisticated facilities being built by foreign investment partners to capitalize on the growing recognition of the importance of dairy products in the diets of Indonesian people, especially young children. Modern commercial dairy farms have been constructed in the regions of higher altitude, to avoid Indonesia’s typical 30° C temperatures and 80% humidity for much of the year in most of the lower lying locations. Hence, regions such as the Bandung district 100 km south of Jakarta in West Java and the Malang district of East Java have become the main areas for more advanced operations. Notice in the author’s own photos below, the backgrounds of highlands and misty conditions highly favoured by dairy cows in both locations –
1. PT Greenfields Indonesia (a collaborative partnership involving Brisbane based AustAsia Pty Ltd, Australian Agricultural Nutrition Consulting Pty Ltd, and Indonesian companies PT Santosa Agrindo and PT Japfa Comfeed Indonesia) in a picturesque high altitude area near Malang in East Java, and
2. PT Green Global Multifarm Lestary, an Indonesian company having imported Australian dairy
heifers, located in a scenic highlands area close to Bandung, 100 km south of Jakarta in West Java.
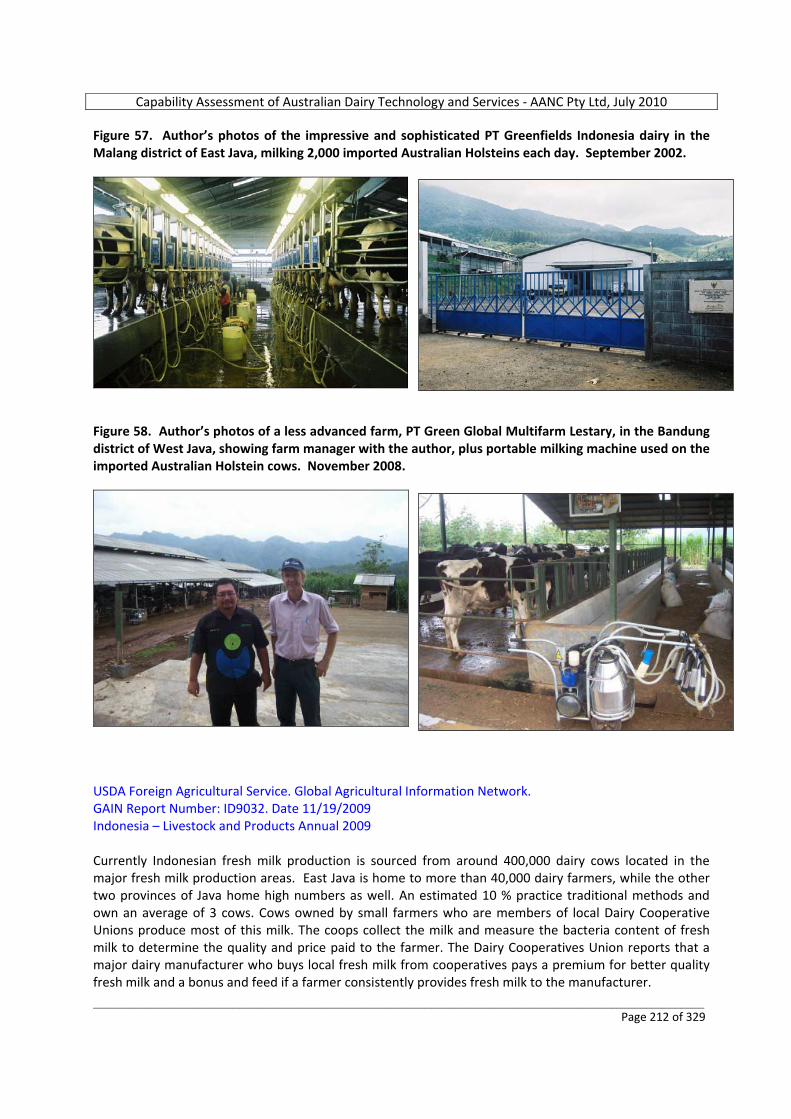
Capability Assessment of Australian Dairy Technology and Services ‐ AANC Pty Ltd, July 2010
_________________________________________________________________________________________________________ Page 212 of 329
Figure 57. Author’s photos of the impressive and sophisticated PT Greenfields Indonesia dairy in the Malang district of East Java, milking 2,000 imported Australian Holsteins each day. September 2002.
Figure 58. Author’s photos of a less advanced farm, PT Green Global Multifarm Lestary, in the Bandung district of West Java, showing farm manager with the author, plus portable milking machine used on the imported Australian Holstein cows. November 2008.
USDA Foreign Agricultural Service. Global Agricultural Information Network. GAIN Report Number: ID9032. Date 11/19/2009 Indonesia – Livestock and Products Annual 2009 Currently Indonesian fresh milk production is sourced from around 400,000 dairy cows located in the major fresh milk production areas. East Java is home to more than 40,000 dairy farmers, while the other two provinces of Java home high numbers as well. An estimated 10 % practice traditional methods and own an average of 3 cows. Cows owned by small farmers who are members of local Dairy Cooperative Unions produce most of this milk. The coops collect the milk and measure the bacteria content of fresh milk to determine the quality and price paid to the farmer. The Dairy Cooperatives Union reports that a major dairy manufacturer who buys local fresh milk from cooperatives pays a premium for better quality fresh milk and a bonus and feed if a farmer consistently provides fresh milk to the manufacturer.
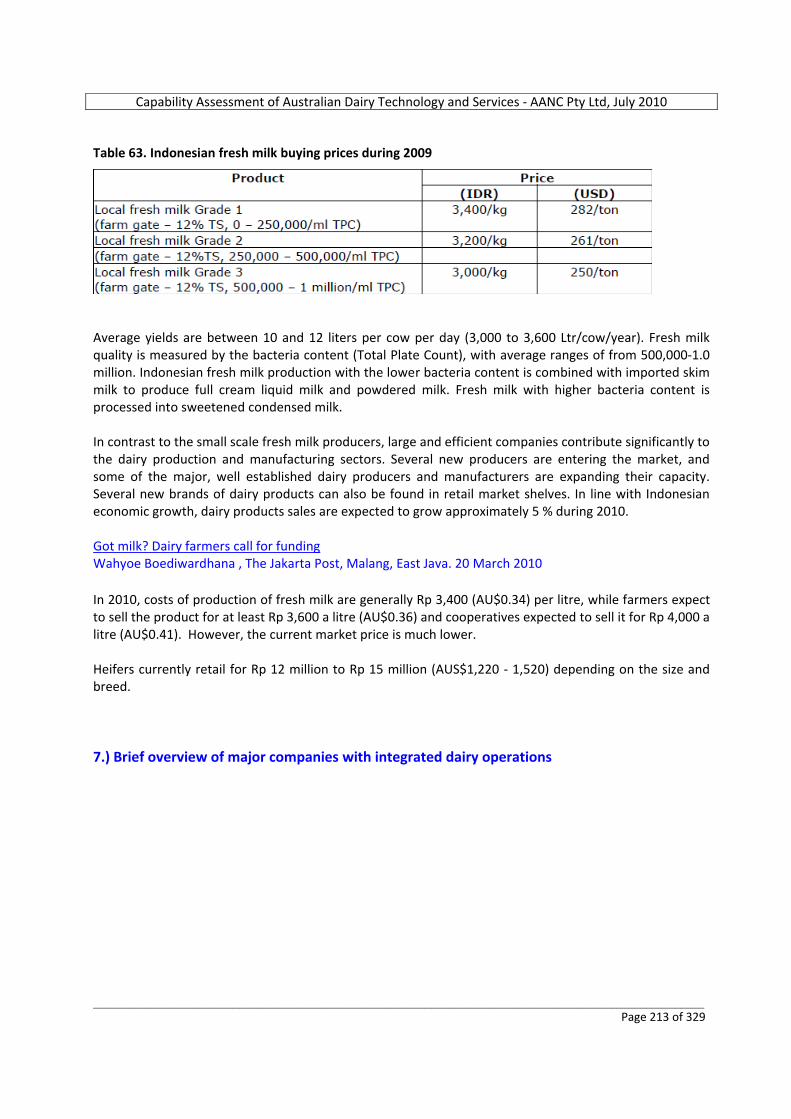
Capability Assessment of Australian Dairy Technology and Services ‐ AANC Pty Ltd, July 2010
_________________________________________________________________________________________________________ Page 213 of 329
Table 63. Indonesian fresh milk buying prices during 2009
Average yields are between 10 and 12 liters per cow per day (3,000 to 3,600 Ltr/cow/year). Fresh milk quality is measured by the bacteria content (Total Plate Count), with average ranges of from 500,000‐1.0 million. Indonesian fresh milk production with the lower bacteria content is combined with imported skim milk to produce full cream liquid milk and powdered milk. Fresh milk with higher bacteria content is processed into sweetened condensed milk. In contrast to the small scale fresh milk producers, large and efficient companies contribute significantly to the dairy production and manufacturing sectors. Several new producers are entering the market, and some of the major, well established dairy producers and manufacturers are expanding their capacity. Several new brands of dairy products can also be found in retail market shelves. In line with Indonesian economic growth, dairy products sales are expected to grow approximately 5 % during 2010. Got milk? Dairy farmers call for funding Wahyoe Boediwardhana , The Jakarta Post, Malang, East Java. 20 March 2010 In 2010, costs of production of fresh milk are generally Rp 3,400 (AU$0.34) per litre, while farmers expect to sell the product for at least Rp 3,600 a litre (AU$0.36) and cooperatives expected to sell it for Rp 4,000 a litre (AU$0.41). However, the current market price is much lower. Heifers currently retail for Rp 12 million to Rp 15 million (AUS$1,220 ‐ 1,520) depending on the size and breed. 7.) Brief overview of major companies with integrated dairy operations
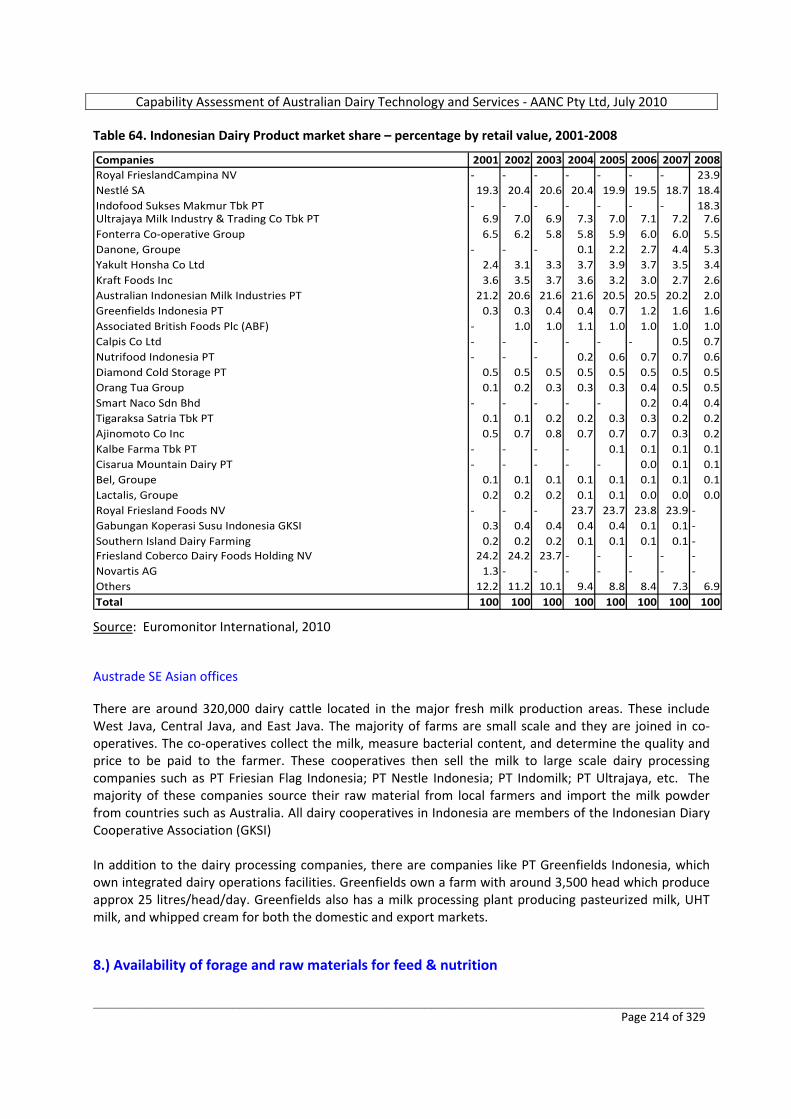
Capability Assessment of Australian Dairy Technology and Services ‐ AANC Pty Ltd, July 2010
_________________________________________________________________________________________________________ Page 214 of 329
Table 64. Indonesian Dairy Product market share – percentage by retail value, 2001‐2008
Companies 2001 2002 2003 2004 2005 2006 2007 2008Royal FrieslandCampina NV ‐ ‐ ‐ ‐ ‐ ‐ ‐ 23.9Nestlé SA 19.3 20.4 20.6 20.4 19.9 19.5 18.7 18.4Indofood Sukses Makmur Tbk PT ‐ ‐ ‐ ‐ ‐ ‐ ‐ 18.3Ultrajaya Milk Industry & Trading Co Tbk PT 6.9 7.0 6.9 7.3 7.0 7.1 7.2 7.6Fonterra Co‐operative Group 6.5 6.2 5.8 5.8 5.9 6.0 6.0 5.5Danone, Groupe ‐ ‐ ‐ 0.1 2.2 2.7 4.4 5.3Yakult Honsha Co Ltd 2.4 3.1 3.3 3.7 3.9 3.7 3.5 3.4Kraft Foods Inc 3.6 3.5 3.7 3.6 3.2 3.0 2.7 2.6Australian Indonesian Milk Industries PT 21.2 20.6 21.6 21.6 20.5 20.5 20.2 2.0Greenfields Indonesia PT 0.3 0.3 0.4 0.4 0.7 1.2 1.6 1.6Associated British Foods Plc (ABF) ‐ 1.0 1.0 1.1 1.0 1.0 1.0 1.0Calpis Co Ltd ‐ ‐ ‐ ‐ ‐ ‐ 0.5 0.7Nutrifood Indonesia PT ‐ ‐ ‐ 0.2 0.6 0.7 0.7 0.6Diamond Cold Storage PT 0.5 0.5 0.5 0.5 0.5 0.5 0.5 0.5Orang Tua Group 0.1 0.2 0.3 0.3 0.3 0.4 0.5 0.5Smart Naco Sdn Bhd ‐ ‐ ‐ ‐ ‐ 0.2 0.4 0.4Tigaraksa Satria Tbk PT 0.1 0.1 0.2 0.2 0.3 0.3 0.2 0.2Ajinomoto Co Inc 0.5 0.7 0.8 0.7 0.7 0.7 0.3 0.2Kalbe Farma Tbk PT ‐ ‐ ‐ ‐ 0.1 0.1 0.1 0.1Cisarua Mountain Dairy PT ‐ ‐ ‐ ‐ ‐ 0.0 0.1 0.1Bel, Groupe 0.1 0.1 0.1 0.1 0.1 0.1 0.1 0.1Lactalis, Groupe 0.2 0.2 0.2 0.1 0.1 0.0 0.0 0.0Royal Friesland Foods NV ‐ ‐ ‐ 23.7 23.7 23.8 23.9 ‐Gabungan Koperasi Susu Indonesia GKSI 0.3 0.4 0.4 0.4 0.4 0.1 0.1 ‐Southern Island Dairy Farming 0.2 0.2 0.2 0.1 0.1 0.1 0.1 ‐Friesland Coberco Dairy Foods Holding NV 24.2 24.2 23.7 ‐ ‐ ‐ ‐ ‐Novartis AG 1.3 ‐ ‐ ‐ ‐ ‐ ‐ ‐Others 12.2 11.2 10.1 9.4 8.8 8.4 7.3 6.9Total 100 100 100 100 100 100 100 100 Source: Euromonitor International, 2010 Austrade SE Asian offices There are around 320,000 dairy cattle located in the major fresh milk production areas. These include West Java, Central Java, and East Java. The majority of farms are small scale and they are joined in co‐operatives. The co‐operatives collect the milk, measure bacterial content, and determine the quality and price to be paid to the farmer. These cooperatives then sell the milk to large scale dairy processing companies such as PT Friesian Flag Indonesia; PT Nestle Indonesia; PT Indomilk; PT Ultrajaya, etc. The majority of these companies source their raw material from local farmers and import the milk powder from countries such as Australia. All dairy cooperatives in Indonesia are members of the Indonesian Diary Cooperative Association (GKSI) In addition to the dairy processing companies, there are companies like PT Greenfields Indonesia, which own integrated dairy operations facilities. Greenfields own a farm with around 3,500 head which produce approx 25 litres/head/day. Greenfields also has a milk processing plant producing pasteurized milk, UHT milk, and whipped cream for both the domestic and export markets. 8.) Availability of forage and raw materials for feed & nutrition
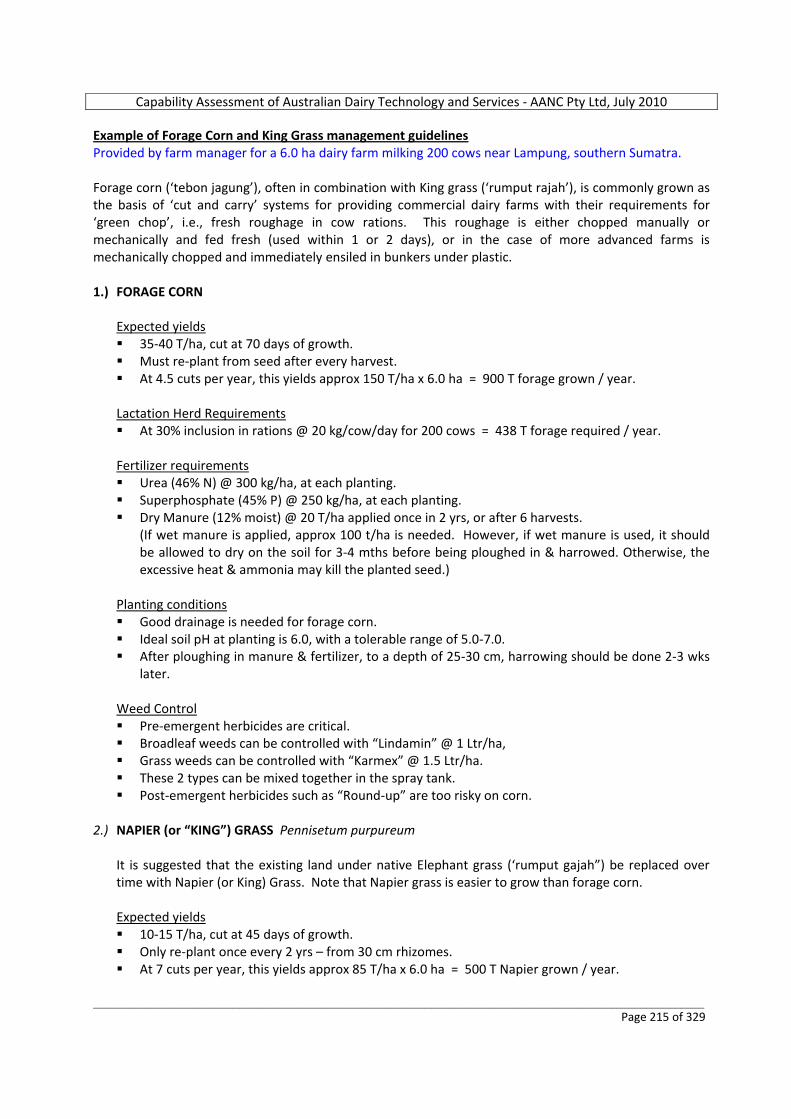
Capability Assessment of Australian Dairy Technology and Services ‐ AANC Pty Ltd, July 2010
_________________________________________________________________________________________________________ Page 215 of 329
Example of Forage Corn and King Grass management guidelines Provided by farm manager for a 6.0 ha dairy farm milking 200 cows near Lampung, southern Sumatra. Forage corn (‘tebon jagung’), often in combination with King grass (‘rumput rajah’), is commonly grown as the basis of ‘cut and carry’ systems for providing commercial dairy farms with their requirements for ‘green chop’, i.e., fresh roughage in cow rations. This roughage is either chopped manually or mechanically and fed fresh (used within 1 or 2 days), or in the case of more advanced farms is mechanically chopped and immediately ensiled in bunkers under plastic. 1.) FORAGE CORN
Expected yields 35‐40 T/ha, cut at 70 days of growth. Must re‐plant from seed after every harvest. At 4.5 cuts per year, this yields approx 150 T/ha x 6.0 ha = 900 T forage grown / year.
Lactation Herd Requirements At 30% inclusion in rations @ 20 kg/cow/day for 200 cows = 438 T forage required / year.
Fertilizer requirements Urea (46% N) @ 300 kg/ha, at each planting. Superphosphate (45% P) @ 250 kg/ha, at each planting. Dry Manure (12% moist) @ 20 T/ha applied once in 2 yrs, or after 6 harvests.
(If wet manure is applied, approx 100 t/ha is needed. However, if wet manure is used, it should be allowed to dry on the soil for 3‐4 mths before being ploughed in & harrowed. Otherwise, the excessive heat & ammonia may kill the planted seed.)
Planting conditions Good drainage is needed for forage corn. Ideal soil pH at planting is 6.0, with a tolerable range of 5.0‐7.0. After ploughing in manure & fertilizer, to a depth of 25‐30 cm, harrowing should be done 2‐3 wks
later.
Weed Control Pre‐emergent herbicides are critical. Broadleaf weeds can be controlled with “Lindamin” @ 1 Ltr/ha, Grass weeds can be controlled with “Karmex” @ 1.5 Ltr/ha. These 2 types can be mixed together in the spray tank. Post‐emergent herbicides such as “Round‐up” are too risky on corn.
2.) NAPIER (or “KING”) GRASS Pennisetum purpureum
It is suggested that the existing land under native Elephant grass (‘rumput gajah”) be replaced over time with Napier (or King) Grass. Note that Napier grass is easier to grow than forage corn. Expected yields 10‐15 T/ha, cut at 45 days of growth. Only re‐plant once every 2 yrs – from 30 cm rhizomes. At 7 cuts per year, this yields approx 85 T/ha x 6.0 ha = 500 T Napier grown / year.
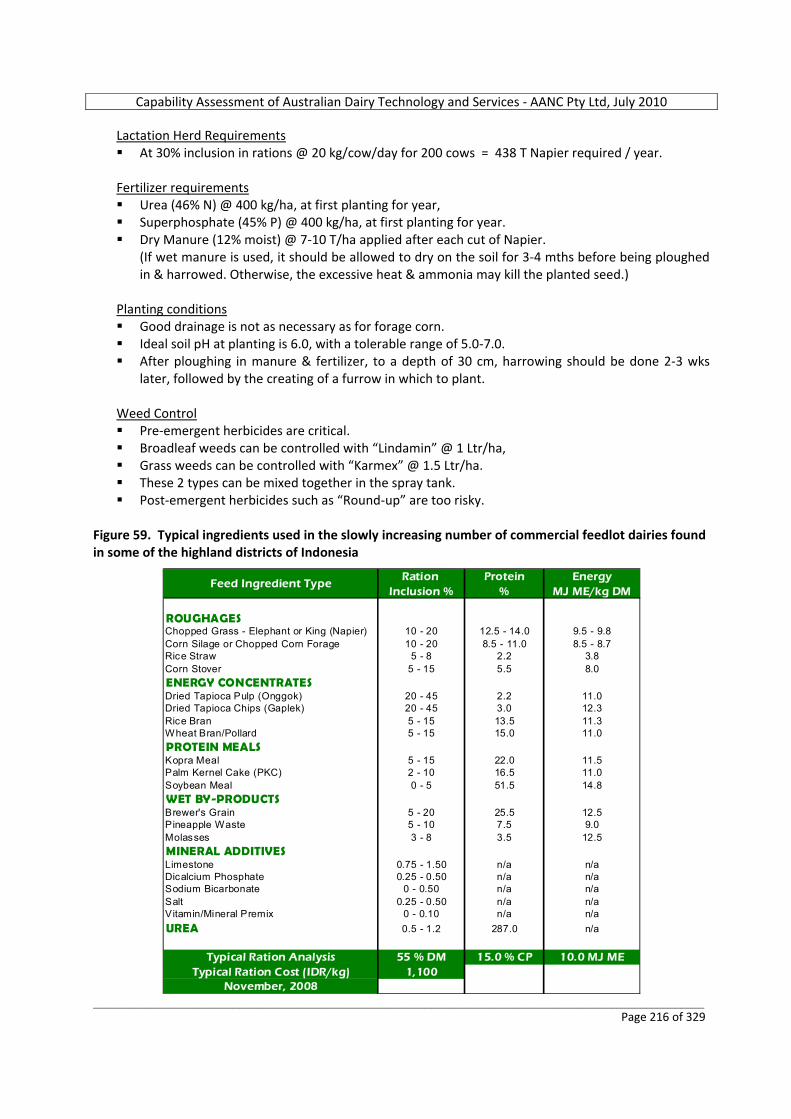
Capability Assessment of Australian Dairy Technology and Services ‐ AANC Pty Ltd, July 2010
_________________________________________________________________________________________________________ Page 216 of 329
Lactation Herd Requirements At 30% inclusion in rations @ 20 kg/cow/day for 200 cows = 438 T Napier required / year.
Fertilizer requirements Urea (46% N) @ 400 kg/ha, at first planting for year, Superphosphate (45% P) @ 400 kg/ha, at first planting for year. Dry Manure (12% moist) @ 7‐10 T/ha applied after each cut of Napier.
(If wet manure is used, it should be allowed to dry on the soil for 3‐4 mths before being ploughed in & harrowed. Otherwise, the excessive heat & ammonia may kill the planted seed.)
Planting conditions Good drainage is not as necessary as for forage corn. Ideal soil pH at planting is 6.0, with a tolerable range of 5.0‐7.0. After ploughing in manure & fertilizer, to a depth of 30 cm, harrowing should be done 2‐3 wks
later, followed by the creating of a furrow in which to plant. Weed Control Pre‐emergent herbicides are critical. Broadleaf weeds can be controlled with “Lindamin” @ 1 Ltr/ha, Grass weeds can be controlled with “Karmex” @ 1.5 Ltr/ha. These 2 types can be mixed together in the spray tank. Post‐emergent herbicides such as “Round‐up” are too risky.
Figure 59. Typical ingredients used in the slowly increasing number of commercial feedlot dairies found in some of the highland districts of Indonesia
Ration Protein EnergyInclusion % % MJ ME/kg DM
ROUGHAGESChopped Grass - Elephant or King (Napier) 10 - 20 12.5 - 14.0 9.5 - 9.8Corn Silage or Chopped Corn Forage 10 - 20 8.5 - 11.0 8.5 - 8.7Rice Straw 5 - 8 2.2 3.8Corn Stover 5 - 15 5.5 8.0ENERGY CONCENTRATESDried Tapioca Pulp (Onggok) 20 - 45 2.2 11.0Dried Tapioca Chips (Gaplek) 20 - 45 3.0 12.3Rice Bran 5 - 15 13.5 11.3Wheat Bran/Pollard 5 - 15 15.0 11.0PROTEIN MEALSKopra Meal 5 - 15 22.0 11.5Palm Kernel Cake (PKC) 2 - 10 16.5 11.0Soybean Meal 0 - 5 51.5 14.8WET BY-PRODUCTSBrewer's Grain 5 - 20 25.5 12.5Pineapple Waste 5 - 10 7.5 9.0Molasses 3 - 8 3.5 12.5MINERAL ADDITIVESLimestone 0.75 - 1.50 n/a n/aDicalcium Phosphate 0.25 - 0.50 n/a n/aSodium Bicarbonate 0 - 0.50 n/a n/aSalt 0.25 - 0.50 n/a n/aVitamin/Mineral Premix 0 - 0.10 n/a n/aUREA 0.5 - 1.2 287.0 n/a
Typical Ration Analysis 55 % DM 15.0 % CP 10.0 MJ METypical Ration Cost (IDR/kg) 1,100
November, 2008
Feed Ingredient Type
Capability Assessment of Australian Dairy Technology and Services ‐ AANC Pty Ltd, July 2010
_________________________________________________________________________________________________________ Page 217 of 329
An indication of the type of rations being fed by the more progressive, commercial dairy farms is shown above, sourced from the author’s original work, 2008 9.) Availability of Artificial Insemination laboratories and testing facilities for cattle; also veterinary services Austrade SE Asian offices: The Indonesian Government, through the Agriculture Research and Development Body is assigned to do research and development for poultry, dairy cows, fattened cattle, dairy goats, sheep, and other livestock. Semen for artificial insemination is domestically produced by an Artificial Insemination Body located in Malang, East Java and Lembang, West Java. USDA Foreign Agricultural Service. Global Agricultural Information Network. GAIN Report Number: ID9032. Date 11/19/2009 Indonesia – Livestock and Products Annual 2009 Semen for artificial insemination is domestically produced by two agencies located in Malang, East Java and Lembang, West Java. Reportedly the Directorate General for Livestock within the Ministry of Agriculture (DGLS) has been conducting progeny tests since 2003 to produce prime quality dairy cattle genetics suitable for the Indonesian climate. DGLS plans to use the results of the test to begin a dairy cattle record keeping system. There are 4 private companies providing 404 cows. Another government institution in Central Java is providing 51 cows, and small holder farmers are providing a total of 5,794 cows. Semen from 8 high quality bulls is used to artificially inseminate these cows. The quality of the bull genetics will be determined by milk production levels of the offspring. Indonesia is trying to meet the international standards for progeny testing that requires the use of 10 participating cows for each bull. The Dairy Cooperatives Union coordinates all its member farmers to buy semen from the local AI stations with the price of Rp. 6,000/straw (AUD 0.62/straw). Some of the major dairy producers would prefer higher quality, imported semen to increase yields, but the Indonesian government currently does not allow imports of semen, declaring there is sufficient supply from the local AI stations. 10.) Agribusiness educational facilities to support dairy production There are a good number of universities located throughout Indonesia in the larger cities and towns, many of which have faculties of Agricultural Science, and several of which offer Veterinary Science degrees. Although veterinary graduates generally receive training more directed at the huge Indonesian poultry and other small animal industries, there is increasing recognition of the prominence of the beef feedlot and dairy industries of the country, and as a result, more veterinarians are receiving more solid tuition in aspects of beef and dairy husbandry and health management. Austrade SE Asian offices Institut Pertanian Bogor (IPB) is one of the national universities in Indonesia with an educational facility for farming. In April 2010 the university signed a Memorandum of Understanding with the Indonesian Cattle Breeder Association (FKPI) to create an integrated education and training facility in Jonggol, West Java.
Capability Assessment of Australian Dairy Technology and Services ‐ AANC Pty Ltd, July 2010
_________________________________________________________________________________________________________ Page 218 of 329
From a dairy industry point of view, Cisarua Mountain Dairy, PT, a local company in West Java, has built a small model farm for people to learn about pasteurized milk processing. 11.) Dairy consumption trends (past 5 years) USDA Foreign Agricultural Service. Global Agricultural Information Network. GAIN Report Number: ID9032. Date 11/19/2009 Indonesia – Livestock and Products Annual 2009 Annual Indonesian per capita milk consumption currently stands at 10.3 kg per person, relatively lower than other ASEAN countries. However, the Government of Indonesia’s efforts to maintain economic and political stability, intensive advertising on printed and electronic media and in store promotions, and growing consumer awareness of the health benefits of drinking milk should increase overall Indonesian consumption of dairy and dairy products by 5 % in 2010. In line with the growing numbers of pizza outlets opening in almost all high‐end malls and shopping centres in Indonesia, the prospects to promote the use of mozzarella cheese for pizza in the country is also growing. The California Milk Advisory Board is currently trying to access the Indonesian market for US cheeses by conducting pizza and bakery workshops. [Similar opportunities exist for Australian cheese manufacturers.] Business Monitor International (BMI) Indonesia: Agribusiness Report, Q3 2010, Including 5‐year forecasts to 2014, April, 2010 As in much of South East Asia, dairy consumption in Indonesia is low by world standards. In 2009, fluid milk consumption in Indonesia was 341,600 tonnes and whole milk powder consumption was 100,000 tonnes. Rising incomes and increasing awareness of the health benefits of milk will drive demand over BMI’s forecast period and we expect growth to 2014 of 16.5% for fluid milk and 23.2% for whole milk powder. This lags behind other countries in the region such as China where BMI forecasts fluid milk consumption to grow by 45.5%. Demand for butter and cheese will remain minuscule considering the size of Indonesia's population. We forecast consumption of cheese to grow by 18.7% to 2014 to reach 10,900 tonnes, while butter consumption will rise 16.0% to 16,710 over the same period.
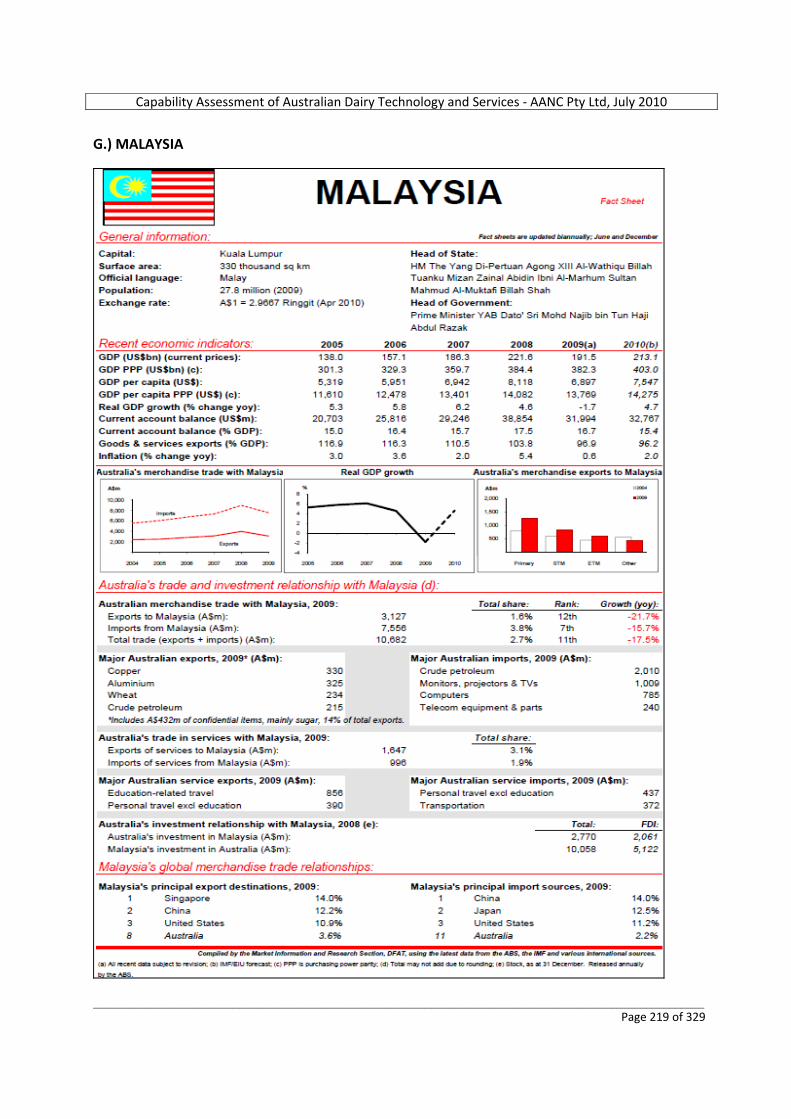
Capability Assessment of Australian Dairy Technology and Services ‐ AANC Pty Ltd, July 2010
_________________________________________________________________________________________________________ Page 219 of 329
G.) MALAYSIA
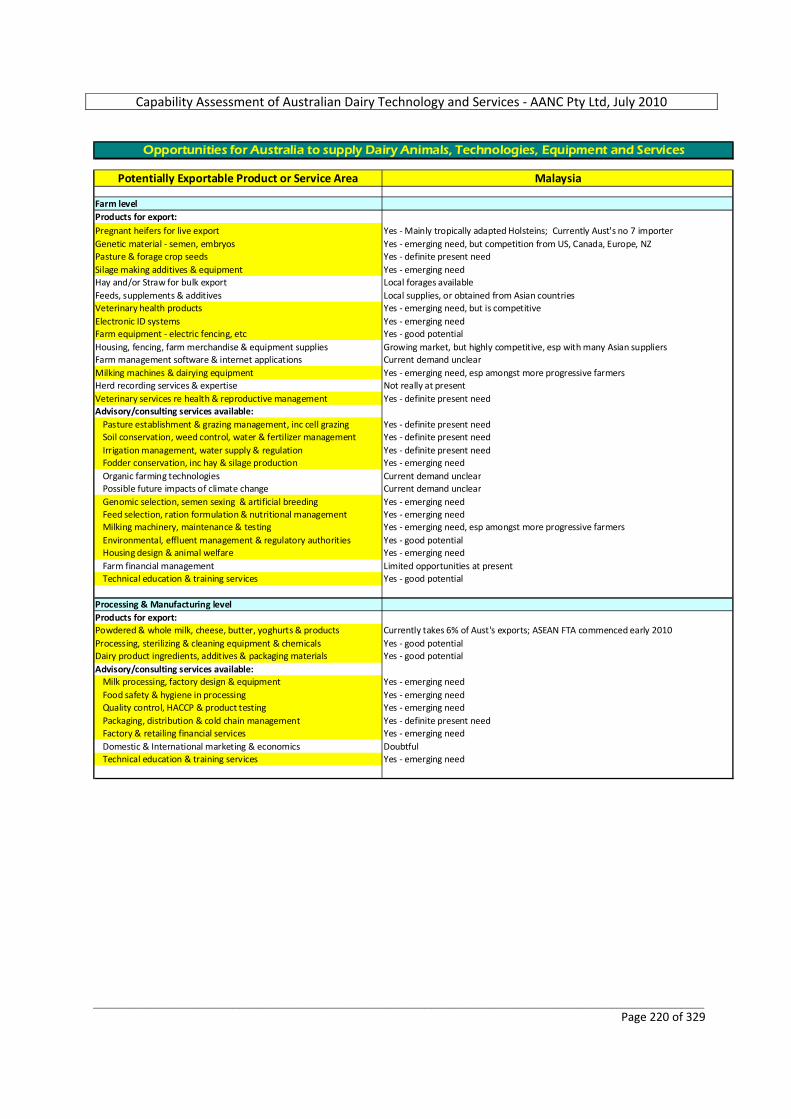
Capability Assessment of Australian Dairy Technology and Services ‐ AANC Pty Ltd, July 2010
_________________________________________________________________________________________________________ Page 220 of 329
Potentially Exportable Product or Service Area Malaysia
Farm levelProducts for export:Pregnant heifers for live export Yes ‐ Mainly tropically adapted Holsteins; Currently Aust's no 7 importerGenetic material ‐ semen, embryos Yes ‐ emerging need, but competition from US, Canada, Europe, NZPasture & forage crop seeds Yes ‐ definite present needSilage making additives & equipment Yes ‐ emerging needHay and/or Straw for bulk export Local forages availableFeeds, supplements & additives Local supplies, or obtained from Asian countriesVeterinary health products Yes ‐ emerging need, but is competitiveElectronic ID systems Yes ‐ emerging needFarm equipment ‐ electric fencing, etc Yes ‐ good potentialHousing, fencing, farm merchandise & equipment supplies Growing market, but highly competitive, esp with many Asian suppliersFarm management software & internet applications Current demand unclearMilking machines & dairying equipment Yes ‐ emerging need, esp amongst more progressive farmersHerd recording services & expertise Not really at presentVeterinary services re health & reproductive management Yes ‐ definite present needAdvisory/consulting services available:
Pasture establishment & grazing management, inc cell grazing Yes ‐ definite present needSoil conservation, weed control, water & fertilizer management Yes ‐ definite present needIrrigation management, water supply & regulation Yes ‐ definite present needFodder conservation, inc hay & silage production Yes ‐ emerging needOrganic farming technologies Current demand unclearPossible future impacts of climate change Current demand unclearGenomic selection, semen sexing & artificial breeding Yes ‐ emerging needFeed selection, ration formulation & nutritional management Yes ‐ emerging needMilking machinery, maintenance & testing Yes ‐ emerging need, esp amongst more progressive farmersEnvironmental, effluent management & regulatory authorities Yes ‐ good potentialHousing design & animal welfare Yes ‐ emerging needFarm financial management Limited opportunities at presentTechnical education & training services Yes ‐ good potential
Processing & Manufacturing levelProducts for export:Powdered & whole milk, cheese, butter, yoghurts & products Currently takes 6% of Aust's exports; ASEAN FTA commenced early 2010Processing, sterilizing & cleaning equipment & chemicals Yes ‐ good potentialDairy product ingredients, additives & packaging materials Yes ‐ good potentialAdvisory/consulting services available:
Milk processing, factory design & equipment Yes ‐ emerging needFood safety & hygiene in processing Yes ‐ emerging needQuality control, HACCP & product testing Yes ‐ emerging needPackaging, distribution & cold chain management Yes ‐ definite present needFactory & retailing financial services Yes ‐ emerging needDomestic & International marketing & economics DoubtfulTechnical education & training services Yes ‐ emerging need
Opportunities for Australia to supply Dairy Animals, Technologies, Equipment and Services
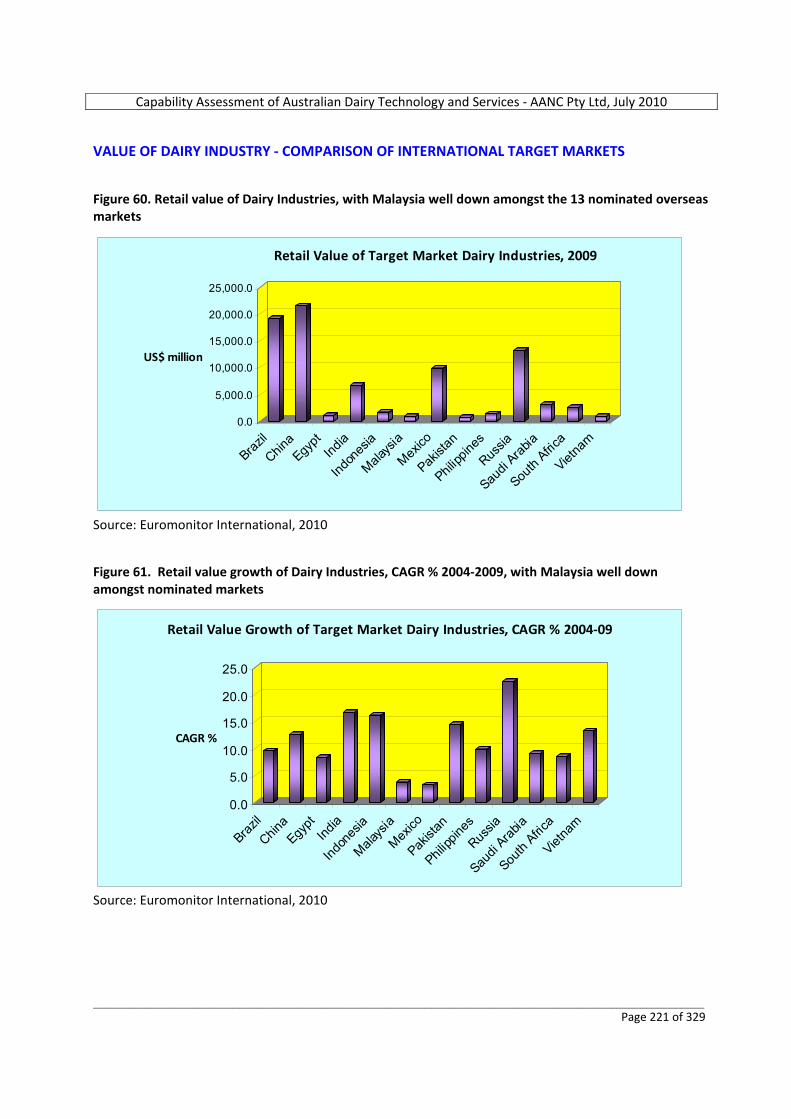
Capability Assessment of Australian Dairy Technology and Services ‐ AANC Pty Ltd, July 2010
_________________________________________________________________________________________________________ Page 221 of 329
VALUE OF DAIRY INDUSTRY ‐ COMPARISON OF INTERNATIONAL TARGET MARKETS Figure 60. Retail value of Dairy Industries, with Malaysia well down amongst the 13 nominated overseas markets
0.0
5,000.0
10,000.0
15,000.0
20,000.0
25,000.0
US$ million
Brazil
China
Egypt
India
Indon
esia
Malays
ia
Mexico
Pakist
an
Philipp
ines
Russia
Saudi
Arabia
South
Africa
Vietna
m
Retail Value of Target Market Dairy Industries, 2009
Source: Euromonitor International, 2010 Figure 61. Retail value growth of Dairy Industries, CAGR % 2004‐2009, with Malaysia well down amongst nominated markets
0.0
5.0
10.0
15.0
20.0
25.0
CAGR %
Brazil
China
Egypt
India
Indon
esia
Malays
ia
Mexico
Pakist
an
Philipp
ines
Russia
Saudi
Arabia
South
Africa
Vietna
m
Retail Value Growth of Target Market Dairy Industries, CAGR % 2004‐09
Source: Euromonitor International, 2010
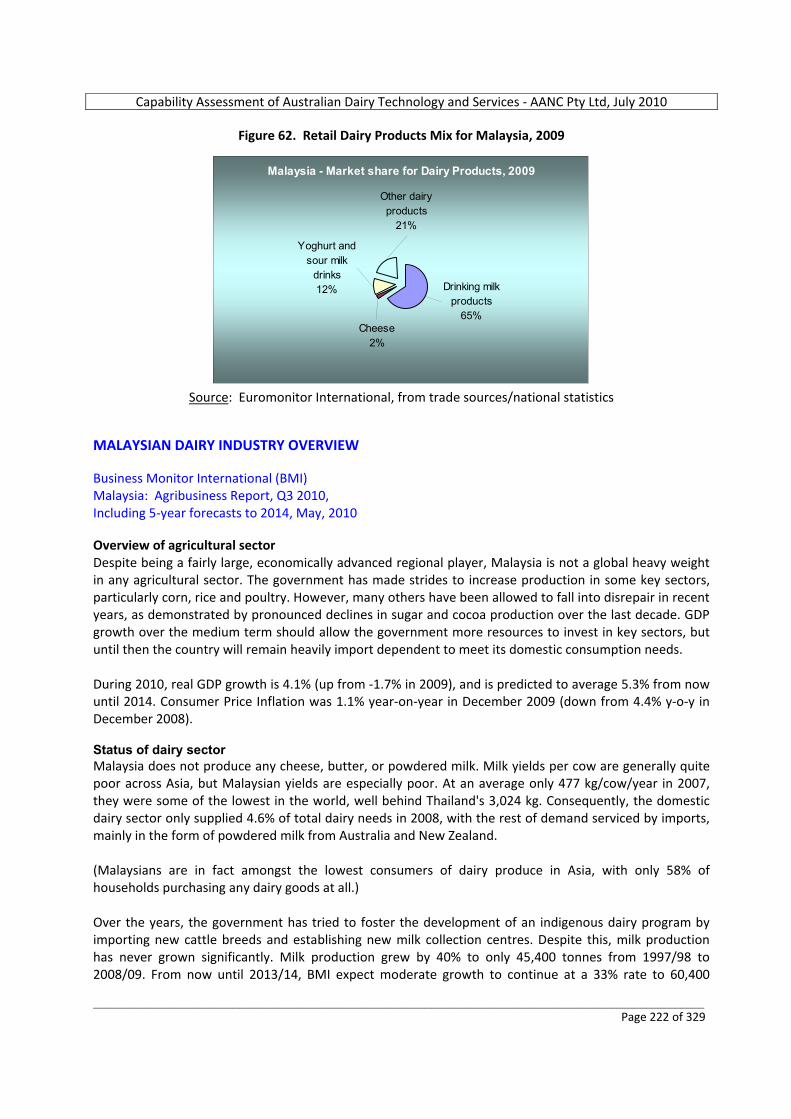
Capability Assessment of Australian Dairy Technology and Services ‐ AANC Pty Ltd, July 2010
_________________________________________________________________________________________________________ Page 222 of 329
Figure 62. Retail Dairy Products Mix for Malaysia, 2009
Malaysia - Market share for Dairy Products, 2009
Drinking milk products
65%Cheese
2%
Yoghurt and sour milk
drinks12%
Other dairy products
21%
Source: Euromonitor International, from trade sources/national statistics
MALAYSIAN DAIRY INDUSTRY OVERVIEW Business Monitor International (BMI) Malaysia: Agribusiness Report, Q3 2010, Including 5‐year forecasts to 2014, May, 2010 Overview of agricultural sector Despite being a fairly large, economically advanced regional player, Malaysia is not a global heavy weight in any agricultural sector. The government has made strides to increase production in some key sectors, particularly corn, rice and poultry. However, many others have been allowed to fall into disrepair in recent years, as demonstrated by pronounced declines in sugar and cocoa production over the last decade. GDP growth over the medium term should allow the government more resources to invest in key sectors, but until then the country will remain heavily import dependent to meet its domestic consumption needs. During 2010, real GDP growth is 4.1% (up from ‐1.7% in 2009), and is predicted to average 5.3% from now until 2014. Consumer Price Inflation was 1.1% year‐on‐year in December 2009 (down from 4.4% y‐o‐y in December 2008). Status of dairy sector Malaysia does not produce any cheese, butter, or powdered milk. Milk yields per cow are generally quite poor across Asia, but Malaysian yields are especially poor. At an average only 477 kg/cow/year in 2007, they were some of the lowest in the world, well behind Thailand's 3,024 kg. Consequently, the domestic dairy sector only supplied 4.6% of total dairy needs in 2008, with the rest of demand serviced by imports, mainly in the form of powdered milk from Australia and New Zealand. (Malaysians are in fact amongst the lowest consumers of dairy produce in Asia, with only 58% of households purchasing any dairy goods at all.) Over the years, the government has tried to foster the development of an indigenous dairy program by importing new cattle breeds and establishing new milk collection centres. Despite this, milk production has never grown significantly. Milk production grew by 40% to only 45,400 tonnes from 1997/98 to 2008/09. From now until 2013/14, BMI expect moderate growth to continue at a 33% rate to 60,400
Capability Assessment of Australian Dairy Technology and Services ‐ AANC Pty Ltd, July 2010
_________________________________________________________________________________________________________ Page 223 of 329
tonnes. This will be mainly a function of larger, specialist dairy farms which use higher yielding breeds. Nevertheless, on a further positive note, it is apparent that Malaysia is beginning to emerge as a centre for production of processed dairy goods for the South East Asian region. Investors are attracted by Malaysia's stability and relatively affluent consumers. See section ahead, part 3.) Investment environment and examples of FDI. SWOT ANALYSIS Business Monitor International (BMI) Malaysia: Agribusiness Report, Q3 2010, Including 5‐year forecasts to 2014, May, 2010 Malaysian Agribusiness Environment SWOT Strengths • Standards of corporate governance in Malaysia have greatly improved since the Asian financial crisis
at the end of the 1990s ‐ more so, in fact, than in many neighbouring countries. • Foreign companies, or at least foreign manufacturing companies, looking to do business in Malaysia
will continue to be encouraged ‐ with the government offering lavish tax breaks and concessions. • Malaysia is a successful example of a democratic Islamic state. Weaknesses • State subsidisation of prices will remain a peripheral but persistent part of daily economic life in
Malaysia. • Doing business in Malaysia will always, to some extent, mean dealing with the politically well‐
connected. • Big construction projects ‐ and big contracts for foreign construction firms – are unlikely to be as much
of a priority for Malaysia's government as they were under the administration of former Prime Minister Mahathir Mohamad.
Opportunities • The opportunity to invest in Malaysian state assets could improve. The government, if it keeps its
word, will conduct its biggest ever divestment of state shareholdings. • Malaysia's majority Muslim population and the government's ongoing efforts to boost Islamic finance
could see Malaysia become a major financial hub over the medium‐term horizon. Threats • Wages are higher in Malaysia than in a number of its competitors, such as China and Vietnam, which
could be a long‐term hindrance to economic expansion. • Malaysia's dependence on migrant labour, particularly for low‐skilled jobs, poses a threat to long‐term
economic stability. • Malaysia is at risk of losing out to China in the race for foreign investment. • The waterways and shipping lanes that surround Malaysia will continue to experience the threat of
piracy and terrorism. 1.) Historical data on the volume of dairy cattle and dairy equipment imports (from Australia and internationally) ‐ over 5 yrs
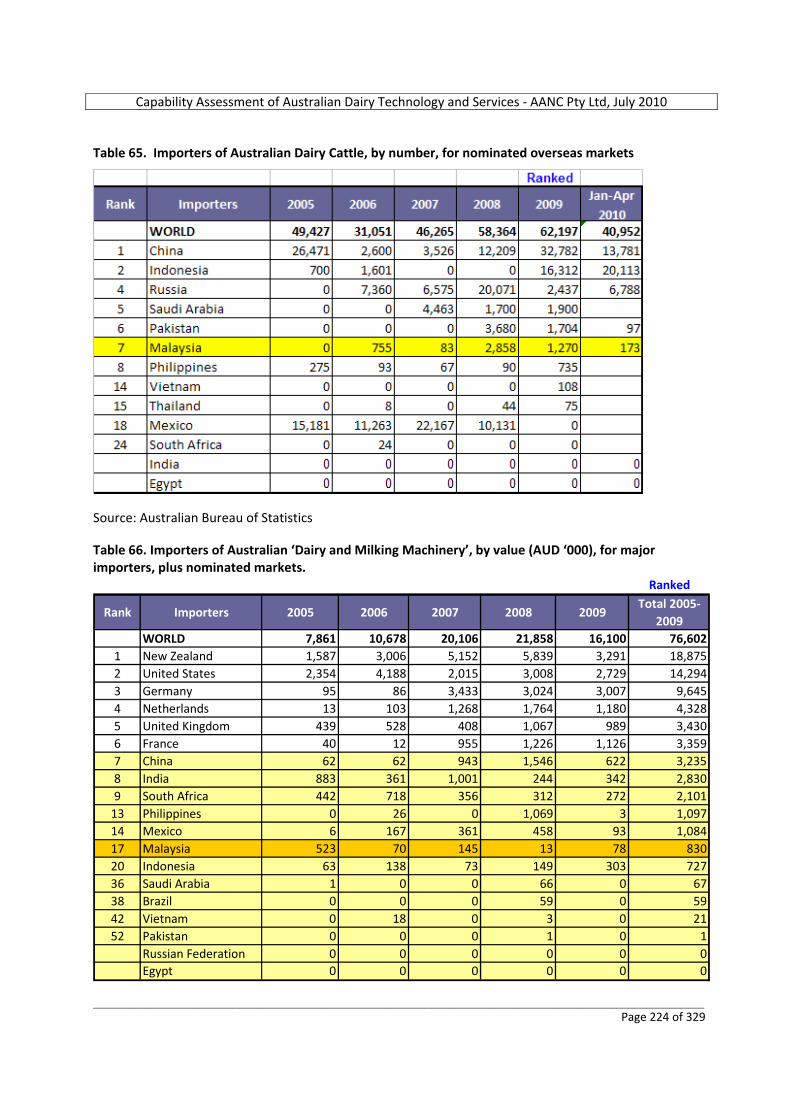
Capability Assessment of Australian Dairy Technology and Services ‐ AANC Pty Ltd, July 2010
_________________________________________________________________________________________________________ Page 224 of 329
Table 65. Importers of Australian Dairy Cattle, by number, for nominated overseas markets
Source: Australian Bureau of Statistics Table 66. Importers of Australian ‘Dairy and Milking Machinery’, by value (AUD ‘000), for major importers, plus nominated markets.
Ranked
Rank Importers 2005 2006 2007 2008 2009Total 2005‐
2009WORLD 7,861 10,678 20,106 21,858 16,100 76,602
1 New Zealand 1,587 3,006 5,152 5,839 3,291 18,8752 United States 2,354 4,188 2,015 3,008 2,729 14,2943 Germany 95 86 3,433 3,024 3,007 9,6454 Netherlands 13 103 1,268 1,764 1,180 4,3285 United Kingdom 439 528 408 1,067 989 3,4306 France 40 12 955 1,226 1,126 3,3597 China 62 62 943 1,546 622 3,2358 India 883 361 1,001 244 342 2,8309 South Africa 442 718 356 312 272 2,101
13 Philippines 0 26 0 1,069 3 1,09714 Mexico 6 167 361 458 93 1,08417 Malaysia 523 70 145 13 78 83020 Indonesia 63 138 73 149 303 72736 Saudi Arabia 1 0 0 66 0 6738 Brazil 0 0 0 59 0 5942 Vietnam 0 18 0 3 0 2152 Pakistan 0 0 0 1 0 1
Russian Federation 0 0 0 0 0 0Egypt 0 0 0 0 0 0
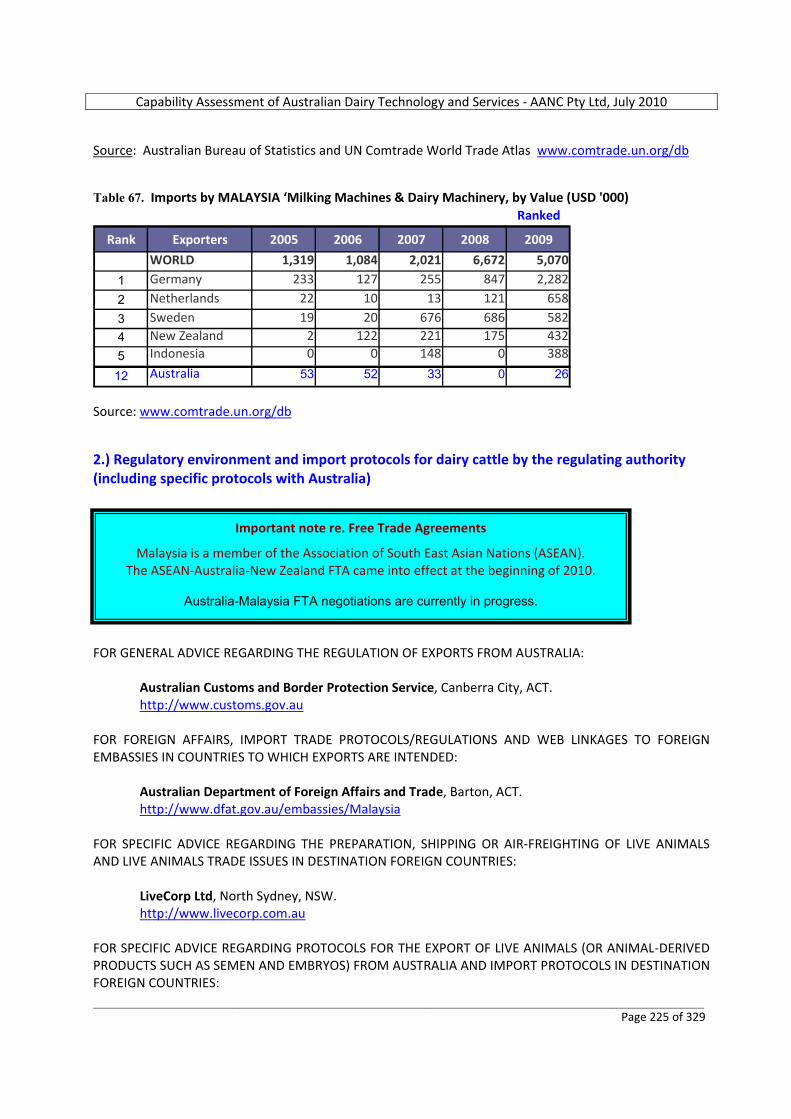
Capability Assessment of Australian Dairy Technology and Services ‐ AANC Pty Ltd, July 2010
_________________________________________________________________________________________________________ Page 225 of 329
Source: Australian Bureau of Statistics and UN Comtrade World Trade Atlas www.comtrade.un.org/db Table 67. Imports by MALAYSIA ‘Milking Machines & Dairy Machinery, by Value (USD '000)
Ranked
Rank Exporters 2005 2006 2007 2008 2009
WORLD 1,319 1,084 2,021 6,672 5,070
1 Germany 233 127 255 847 2,282
2 Netherlands 22 10 13 121 658
3 Sweden 19 20 676 686 5824 New Zealand 2 122 221 175 432
5 Indonesia 0 0 148 0 388
12 Australia 53 52 33 0 26
Source: www.comtrade.un.org/db 2.) Regulatory environment and import protocols for dairy cattle by the regulating authority (including specific protocols with Australia) FOR GENERAL ADVICE REGARDING THE REGULATION OF EXPORTS FROM AUSTRALIA:
Australian Customs and Border Protection Service, Canberra City, ACT. http://www.customs.gov.au
FOR FOREIGN AFFAIRS, IMPORT TRADE PROTOCOLS/REGULATIONS AND WEB LINKAGES TO FOREIGN EMBASSIES IN COUNTRIES TO WHICH EXPORTS ARE INTENDED:
Australian Department of Foreign Affairs and Trade, Barton, ACT. http://www.dfat.gov.au/embassies/Malaysia
FOR SPECIFIC ADVICE REGARDING THE PREPARATION, SHIPPING OR AIR‐FREIGHTING OF LIVE ANIMALS AND LIVE ANIMALS TRADE ISSUES IN DESTINATION FOREIGN COUNTRIES:
LiveCorp Ltd, North Sydney, NSW. http://www.livecorp.com.au
FOR SPECIFIC ADVICE REGARDING PROTOCOLS FOR THE EXPORT OF LIVE ANIMALS (OR ANIMAL‐DERIVED PRODUCTS SUCH AS SEMEN AND EMBRYOS) FROM AUSTRALIA AND IMPORT PROTOCOLS IN DESTINATION FOREIGN COUNTRIES:
Important note re. Free Trade Agreements
Malaysia is a member of the Association of South East Asian Nations (ASEAN). The ASEAN‐Australia‐New Zealand FTA came into effect at the beginning of 2010.
Australia-Malaysia FTA negotiations are currently in progress.
Capability Assessment of Australian Dairy Technology and Services ‐ AANC Pty Ltd, July 2010
_________________________________________________________________________________________________________ Page 226 of 329
Australian Quarantine and Inspection Service (AQIS), Canberra City, ACT. http://www.aqis.gov.au
Specific advice on Malaysia: According to the Ministry of Foreign Affairs and Trade (MFAT), although there is no import duty on milk powder, duties of between 5‐10% are levied on butter and cheese imports. Importers of these products also require an import licence. 3.) Investment environment for dairy operations (domestic and foreign assistance, tax incentives, export zones, etc) and examples of FDI (from any country) Business Monitor International (BMI) Malaysia: Agribusiness Report, Q3 2010, Including 5‐year forecasts to 2014, May, 2010 Malaysia is beginning to emerge as a centre for production of processed dairy goods for the South East Asian region. Investors are attracted by Malaysia's stability and relatively affluent consumers. In October 2009 New Zealand major Fonterra opened a MYR25 million (AU$8.2 million) expansion on its dairy plant in Kuala Lumpur. Fraser & Neave has also announced plans for new investments. The company will invest MYR350 million (AU$114 million) in a new plant in Pulau Indah, to start production in 2012 and with an annual capacity of 14 million cases of canned milk. Both companies are aiming to use Malaysia as a base for further expansion in the region. The new investments are an expression of confidence in continued strong demand for high‐value dairy goods in Malaysia. Austrade SE Asian offices: The Department of Veterinary Services (DVS) regulates the industry and oversees any dairy operations in Malaysia. The Malaysian Government promotes and encourages projects via public‐private partnership initiatives. 4.) Existing or proposed external assistance programs to develop the industry (foreign government and/or aid programs) Austrade SE Asian offices: Dutch Lady Malaysia (Friesland Campina group), with assistance from the Netherlands Government, has some collaboration work with the Malaysian Department of Veterinary Services. 5.) Overview of the typical dairy farming arrangements Although not typical of traditional dairy farms in Malaysia, there are an increasing number of more advanced farms being built by foreign investment partners to capitalize on the growing recognition of the importance of dairy products in the diets of Malaysian people, especially young children. Modern

Capability Assessment of Australian Dairy Technology and Services ‐ AANC Pty Ltd, July 2010
_________________________________________________________________________________________________________ Page 227 of 329
commercial dairy farms have been mostly constructed in the regions of higher altitude, to avoid Malaysia’s typical 33° C temperatures and 75% humidity for much of the year in most of the lower lying locations. Figure 63. Author’s photos of Australian live exported and local dairy heifers in free stall shed accommodation in the Kluang district of Peninsula Malaysia, June 2006.
Business Monitor International (BMI) Malaysia: Agribusiness Report, Q3 2010, Including 5‐year forecasts to 2014, May, 2010 Traditionally dairy farming in Malaysia has mainly been a side activity on small holder farms where a few cows are kept and the milk consumed locally. This has impeded the development of the industry by making a national programme of herd improvement and the spreading of knowledge of good practice among farmers more difficult. However, there is now increasing interest in commercial dairy farming to supply the growing desire for dairy products in the country. In April 2008, a new high‐tech dairy farm began operations in the east‐coast state of Pahang in an area set aside for dairy farming under a government economic development plan for the region. The 184 ha First Dairy Farm has airconditioned barns and modern milking machinery imported from New Zealand. In September 2008, the farm was reportedly producing 2,500 litres of milk a day from its herd imported from Australia. The company said that it aimed to be producing 19,000‐22,000 litres per day by the middle of 2009. The dairy industry in Malaysia is still considered a risky investment prospect. If the First Dairy Farm proves to be a success, it could lead the way for other large‐scale dairy operations in Malaysia. Any new operations would likely find support from the government, which is keen to reduce the country's dependence on dairy imports. In February 2009, the Agriculture and Agro‐Based Industry Minister said that in the coming years the ministry was aiming to increase fluid milk production to 1.1 billion litres, more than twice the current level. Sabah outpacing Peninsula Malaysia One area of Malaysia where milk production has been expanding rapidly is the East Malaysian state of Sabah. Milk production in the state grew by more than 60% from 2004 to 2008 to reach 9.57 million litres. This far outpaced production growth on Peninsula Malaysia. The Sabah state government has been
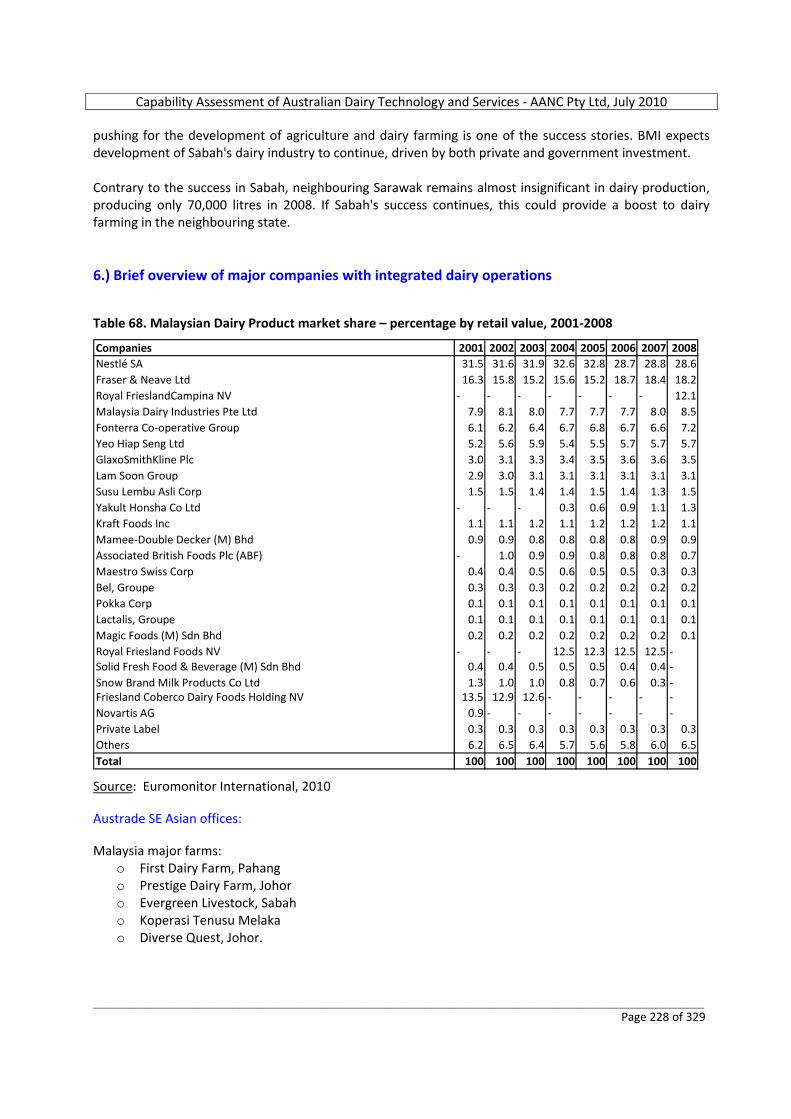
Capability Assessment of Australian Dairy Technology and Services ‐ AANC Pty Ltd, July 2010
_________________________________________________________________________________________________________ Page 228 of 329
pushing for the development of agriculture and dairy farming is one of the success stories. BMI expects development of Sabah's dairy industry to continue, driven by both private and government investment. Contrary to the success in Sabah, neighbouring Sarawak remains almost insignificant in dairy production, producing only 70,000 litres in 2008. If Sabah's success continues, this could provide a boost to dairy farming in the neighbouring state. 6.) Brief overview of major companies with integrated dairy operations Table 68. Malaysian Dairy Product market share – percentage by retail value, 2001‐2008
Companies 2001 2002 2003 2004 2005 2006 2007 2008Nestlé SA 31.5 31.6 31.9 32.6 32.8 28.7 28.8 28.6Fraser & Neave Ltd 16.3 15.8 15.2 15.6 15.2 18.7 18.4 18.2Royal FrieslandCampina NV ‐ ‐ ‐ ‐ ‐ ‐ ‐ 12.1Malaysia Dairy Industries Pte Ltd 7.9 8.1 8.0 7.7 7.7 7.7 8.0 8.5Fonterra Co‐operative Group 6.1 6.2 6.4 6.7 6.8 6.7 6.6 7.2Yeo Hiap Seng Ltd 5.2 5.6 5.9 5.4 5.5 5.7 5.7 5.7GlaxoSmithKline Plc 3.0 3.1 3.3 3.4 3.5 3.6 3.6 3.5Lam Soon Group 2.9 3.0 3.1 3.1 3.1 3.1 3.1 3.1Susu Lembu Asli Corp 1.5 1.5 1.4 1.4 1.5 1.4 1.3 1.5Yakult Honsha Co Ltd ‐ ‐ ‐ 0.3 0.6 0.9 1.1 1.3Kraft Foods Inc 1.1 1.1 1.2 1.1 1.2 1.2 1.2 1.1Mamee‐Double Decker (M) Bhd 0.9 0.9 0.8 0.8 0.8 0.8 0.9 0.9Associated British Foods Plc (ABF) ‐ 1.0 0.9 0.9 0.8 0.8 0.8 0.7Maestro Swiss Corp 0.4 0.4 0.5 0.6 0.5 0.5 0.3 0.3Bel, Groupe 0.3 0.3 0.3 0.2 0.2 0.2 0.2 0.2Pokka Corp 0.1 0.1 0.1 0.1 0.1 0.1 0.1 0.1Lactalis, Groupe 0.1 0.1 0.1 0.1 0.1 0.1 0.1 0.1Magic Foods (M) Sdn Bhd 0.2 0.2 0.2 0.2 0.2 0.2 0.2 0.1Royal Friesland Foods NV ‐ ‐ ‐ 12.5 12.3 12.5 12.5 ‐Solid Fresh Food & Beverage (M) Sdn Bhd 0.4 0.4 0.5 0.5 0.5 0.4 0.4 ‐Snow Brand Milk Products Co Ltd 1.3 1.0 1.0 0.8 0.7 0.6 0.3 ‐Friesland Coberco Dairy Foods Holding NV 13.5 12.9 12.6 ‐ ‐ ‐ ‐ ‐Novartis AG 0.9 ‐ ‐ ‐ ‐ ‐ ‐ ‐Private Label 0.3 0.3 0.3 0.3 0.3 0.3 0.3 0.3Others 6.2 6.5 6.4 5.7 5.6 5.8 6.0 6.5Total 100 100 100 100 100 100 100 100 Source: Euromonitor International, 2010 Austrade SE Asian offices: Malaysia major farms:
o First Dairy Farm, Pahang o Prestige Dairy Farm, Johor o Evergreen Livestock, Sabah o Koperasi Tenusu Melaka o Diverse Quest, Johor.
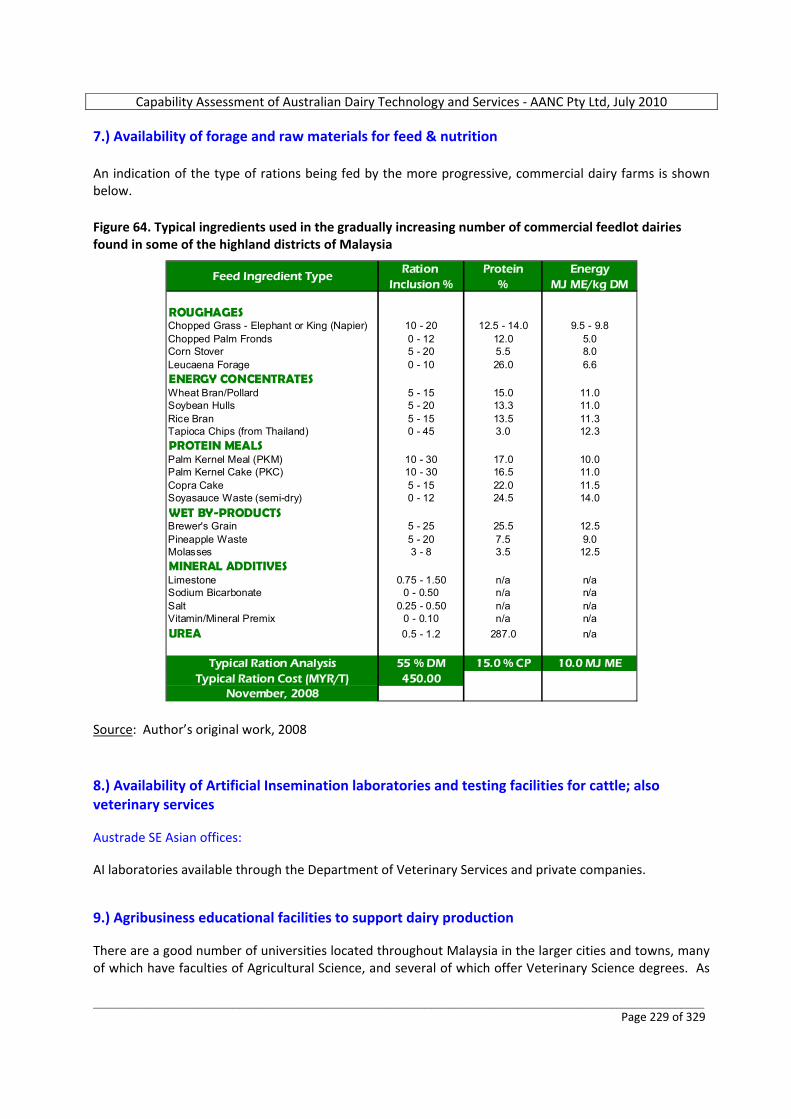
Capability Assessment of Australian Dairy Technology and Services ‐ AANC Pty Ltd, July 2010
_________________________________________________________________________________________________________ Page 229 of 329
7.) Availability of forage and raw materials for feed & nutrition An indication of the type of rations being fed by the more progressive, commercial dairy farms is shown below. Figure 64. Typical ingredients used in the gradually increasing number of commercial feedlot dairies found in some of the highland districts of Malaysia
Ration Protein EnergyInclusion % % MJ ME/kg DM
ROUGHAGESChopped Grass - Elephant or King (Napier) 10 - 20 12.5 - 14.0 9.5 - 9.8Chopped Palm Fronds 0 - 12 12.0 5.0Corn Stover 5 - 20 5.5 8.0Leucaena Forage 0 - 10 26.0 6.6ENERGY CONCENTRATESWheat Bran/Pollard 5 - 15 15.0 11.0Soybean Hulls 5 - 20 13.3 11.0Rice Bran 5 - 15 13.5 11.3Tapioca Chips (from Thailand) 0 - 45 3.0 12.3PROTEIN MEALSPalm Kernel Meal (PKM) 10 - 30 17.0 10.0Palm Kernel Cake (PKC) 10 - 30 16.5 11.0Copra Cake 5 - 15 22.0 11.5Soyasauce Waste (semi-dry) 0 - 12 24.5 14.0WET BY-PRODUCTSBrewer's Grain 5 - 25 25.5 12.5Pineapple Waste 5 - 20 7.5 9.0Molasses 3 - 8 3.5 12.5MINERAL ADDITIVESLimestone 0.75 - 1.50 n/a n/aSodium Bicarbonate 0 - 0.50 n/a n/aSalt 0.25 - 0.50 n/a n/aVitamin/Mineral Premix 0 - 0.10 n/a n/aUREA 0.5 - 1.2 287.0 n/a
Typical Ration Analysis 55 % DM 15.0 % CP 10.0 MJ METypical Ration Cost (MYR/T) 450.00
November, 2008
Feed Ingredient Type
Source: Author’s original work, 2008 8.) Availability of Artificial Insemination laboratories and testing facilities for cattle; also veterinary services Austrade SE Asian offices: AI laboratories available through the Department of Veterinary Services and private companies. 9.) Agribusiness educational facilities to support dairy production There are a good number of universities located throughout Malaysia in the larger cities and towns, many of which have faculties of Agricultural Science, and several of which offer Veterinary Science degrees. As
Capability Assessment of Australian Dairy Technology and Services ‐ AANC Pty Ltd, July 2010
_________________________________________________________________________________________________________ Page 230 of 329
there is increasing recognition of the beef feedlot and dairy industries of the country, more students are receiving a solid training in aspects of beef and dairy husbandry, nutrition and health management. Austrade SE Asian offices: Universiti Putra Malaysia. 10.) Dairy consumption trends (past 5 years) Business Monitor International (BMI) Malaysia: Agribusiness Report, Q3 2010, Including 5‐year forecasts to 2014, May, 2010 Although Malaysian dairy consumption is high by regional standards (which is expected given its relative economic wealth), it is still quite small by global standards. Taking powdered milk into account, per capita milk consumption was forecasted at 42kg by the agriculture ministry. Demand for dairy production has shown strong increases over the last decade with cheese and whole milk powder leading the way, growing by 109% and 63% respectively. Fluid milk and butter consumption grew as well, rising by 41% and 9% over the same period. From now until 2014, BMI expect fluid milk consumption to rise 21% to 69,200 tonnes, while demand for whole milk powder will grow 19% to 119,000 tonnes. We forecast butter and cheese consumption to grow by 16% to 12,610 tonnes and 24% to 10,370 tonnes respectively. This will mainly come from the spread of modern retail and fast food outlets.
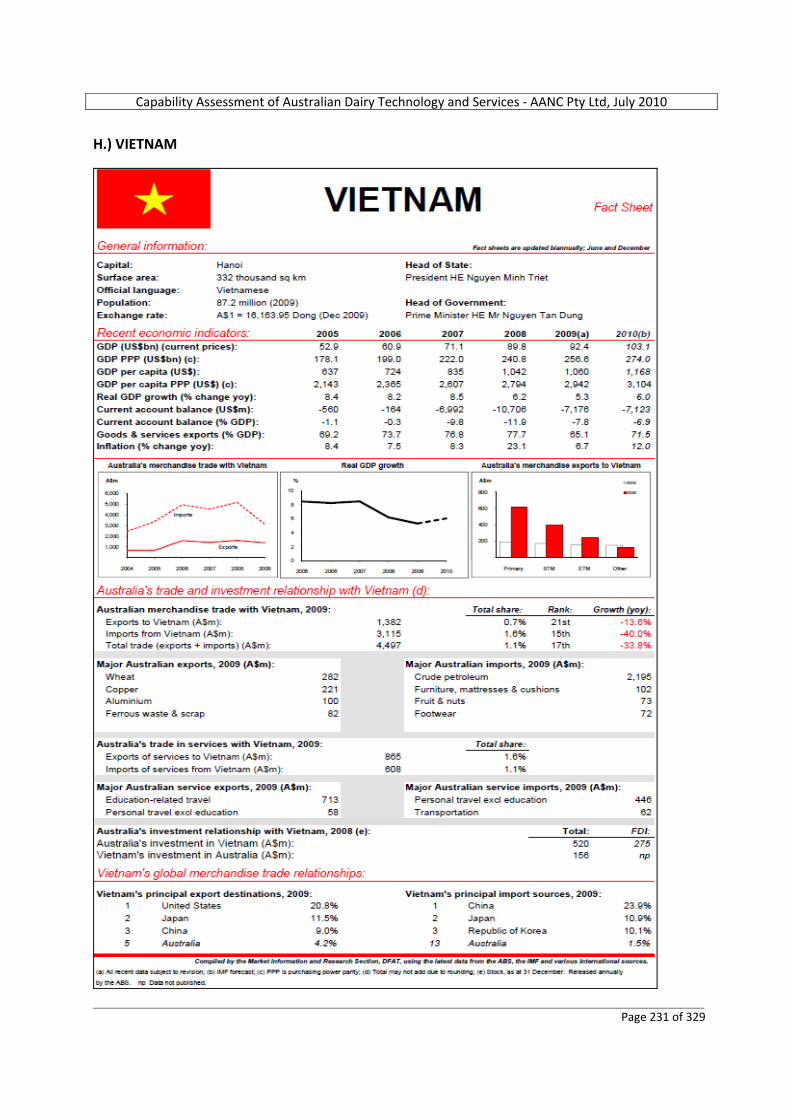
Capability Assessment of Australian Dairy Technology and Services ‐ AANC Pty Ltd, July 2010
_________________________________________________________________________________________________________ Page 231 of 329
H.) VIETNAM
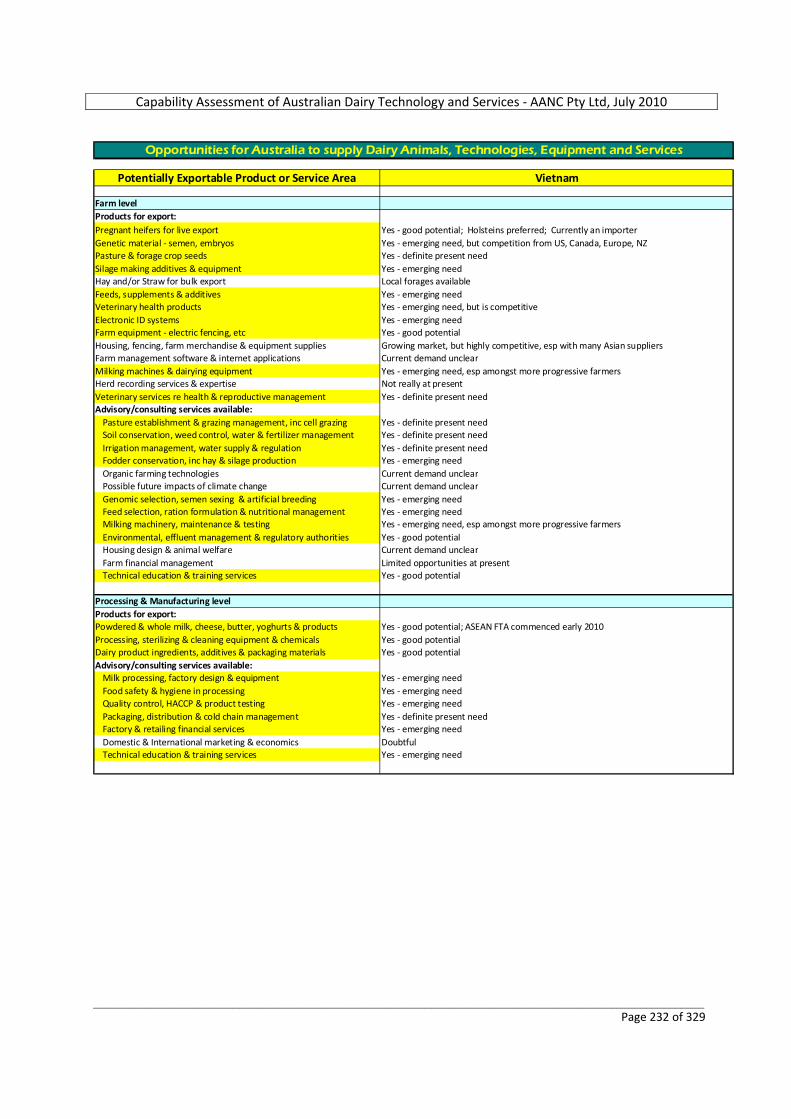
Capability Assessment of Australian Dairy Technology and Services ‐ AANC Pty Ltd, July 2010
_________________________________________________________________________________________________________ Page 232 of 329
Potentially Exportable Product or Service Area Vietnam
Farm levelProducts for export:Pregnant heifers for live export Yes ‐ good potential; Holsteins preferred; Currently an importerGenetic material ‐ semen, embryos Yes ‐ emerging need, but competition from US, Canada, Europe, NZPasture & forage crop seeds Yes ‐ definite present needSilage making additives & equipment Yes ‐ emerging needHay and/or Straw for bulk export Local forages availableFeeds, supplements & additives Yes ‐ emerging needVeterinary health products Yes ‐ emerging need, but is competitiveElectronic ID systems Yes ‐ emerging needFarm equipment ‐ electric fencing, etc Yes ‐ good potentialHousing, fencing, farm merchandise & equipment supplies Growing market, but highly competitive, esp with many Asian suppliersFarm management software & internet applications Current demand unclearMilking machines & dairying equipment Yes ‐ emerging need, esp amongst more progressive farmersHerd recording services & expertise Not really at presentVeterinary services re health & reproductive management Yes ‐ definite present needAdvisory/consulting services available:
Pasture establishment & grazing management, inc cell grazing Yes ‐ definite present needSoil conservation, weed control, water & fertilizer management Yes ‐ definite present needIrrigation management, water supply & regulation Yes ‐ definite present needFodder conservation, inc hay & silage production Yes ‐ emerging needOrganic farming technologies Current demand unclearPossible future impacts of climate change Current demand unclearGenomic selection, semen sexing & artificial breeding Yes ‐ emerging needFeed selection, ration formulation & nutritional management Yes ‐ emerging needMilking machinery, maintenance & testing Yes ‐ emerging need, esp amongst more progressive farmersEnvironmental, effluent management & regulatory authorities Yes ‐ good potentialHousing design & animal welfare Current demand unclearFarm financial management Limited opportunities at presentTechnical education & training services Yes ‐ good potential
Processing & Manufacturing levelProducts for export:Powdered & whole milk, cheese, butter, yoghurts & products Yes ‐ good potential; ASEAN FTA commenced early 2010Processing, sterilizing & cleaning equipment & chemicals Yes ‐ good potentialDairy product ingredients, additives & packaging materials Yes ‐ good potentialAdvisory/consulting services available:
Milk processing, factory design & equipment Yes ‐ emerging needFood safety & hygiene in processing Yes ‐ emerging needQuality control, HACCP & product testing Yes ‐ emerging needPackaging, distribution & cold chain management Yes ‐ definite present needFactory & retailing financial services Yes ‐ emerging needDomestic & International marketing & economics DoubtfulTechnical education & training services Yes ‐ emerging need
Opportunities for Australia to supply Dairy Animals, Technologies, Equipment and Services

Capability Assessment of Australian Dairy Technology and Services ‐ AANC Pty Ltd, July 2010
_________________________________________________________________________________________________________ Page 233 of 329
VALUE OF DAIRY INDUSTRY ‐ COMPARISON OF INTERNATIONAL TARGET MARKETS Figure 65. Retail value of Dairy Industries, with Vietnam well down amongst the 13 nominated overseas markets
0.0
5,000.0
10,000.0
15,000.0
20,000.0
25,000.0
US$ million
Brazil
China
Egypt
India
Indon
esia
Malays
ia
Mexico
Pakist
an
Philipp
ines
Russia
Saudi
Arabia
South
Africa
Vietna
m
Retail Value of Target Market Dairy Industries, 2009
Source: Euromonitor International, 2010 Figure 66. Retail value growth of Dairy Industries, CAGR % 2004‐2009, with Vietnam running 5th amongst nominated markets
0.0
5.0
10.0
15.0
20.0
25.0
CAGR %
Brazil
China
Egypt
India
Indon
esia
Malays
ia
Mexico
Pakist
an
Philipp
ines
Russia
Saudi
Arabia
South
Africa
Vietna
m
Retail Value Growth of Target Market Dairy Industries, CAGR % 2004‐09
Source: Euromonitor International, 2010
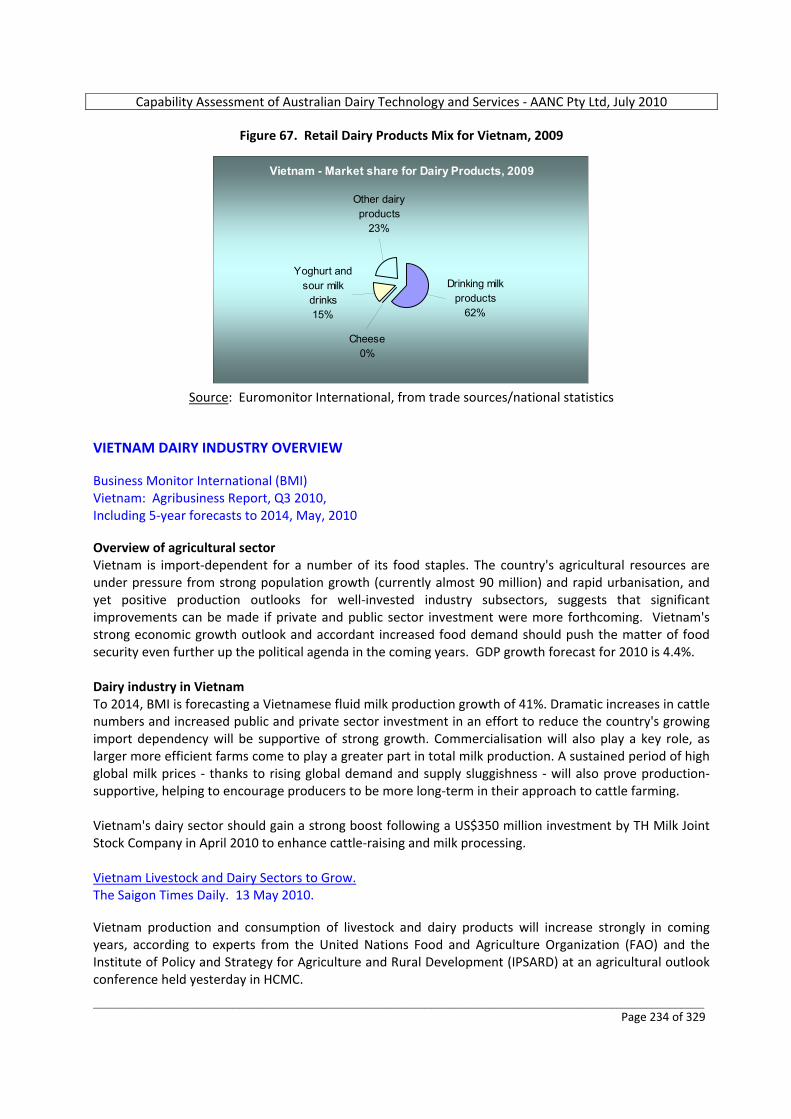
Capability Assessment of Australian Dairy Technology and Services ‐ AANC Pty Ltd, July 2010
_________________________________________________________________________________________________________ Page 234 of 329
Figure 67. Retail Dairy Products Mix for Vietnam, 2009
Vietnam - Market share for Dairy Products, 2009
Other dairy products
23%
Yoghurt and sour milk
drinks15%
Cheese0%
Drinking milk products
62%
Source: Euromonitor International, from trade sources/national statistics
VIETNAM DAIRY INDUSTRY OVERVIEW Business Monitor International (BMI) Vietnam: Agribusiness Report, Q3 2010, Including 5‐year forecasts to 2014, May, 2010 Overview of agricultural sector Vietnam is import‐dependent for a number of its food staples. The country's agricultural resources are under pressure from strong population growth (currently almost 90 million) and rapid urbanisation, and yet positive production outlooks for well‐invested industry subsectors, suggests that significant improvements can be made if private and public sector investment were more forthcoming. Vietnam's strong economic growth outlook and accordant increased food demand should push the matter of food security even further up the political agenda in the coming years. GDP growth forecast for 2010 is 4.4%. Dairy industry in Vietnam To 2014, BMI is forecasting a Vietnamese fluid milk production growth of 41%. Dramatic increases in cattle numbers and increased public and private sector investment in an effort to reduce the country's growing import dependency will be supportive of strong growth. Commercialisation will also play a key role, as larger more efficient farms come to play a greater part in total milk production. A sustained period of high global milk prices ‐ thanks to rising global demand and supply sluggishness ‐ will also prove production‐supportive, helping to encourage producers to be more long‐term in their approach to cattle farming. Vietnam's dairy sector should gain a strong boost following a US$350 million investment by TH Milk Joint Stock Company in April 2010 to enhance cattle‐raising and milk processing. Vietnam Livestock and Dairy Sectors to Grow. The Saigon Times Daily. 13 May 2010. Vietnam production and consumption of livestock and dairy products will increase strongly in coming years, according to experts from the United Nations Food and Agriculture Organization (FAO) and the Institute of Policy and Strategy for Agriculture and Rural Development (IPSARD) at an agricultural outlook conference held yesterday in HCMC.
Capability Assessment of Australian Dairy Technology and Services ‐ AANC Pty Ltd, July 2010
_________________________________________________________________________________________________________ Page 235 of 329
FAO’s representative in Vietnam said that consumption of meat, milk and eggs was increasing, particularly in South East Asia and in Vietnam. Speedy said that with Vietnam’s population expected to increase to 126 million by 2050, the demand for pork and milk would double from now until then. As a result, there is great potential for local farmers and livestock feed production. Vietnam still relies heavily on imported livestock feed. “Appropriate training on good dairy farming practices is essential right now”, it was claimed. An expert from IPSARD said Vietnam currently imports about 80% of its share of dairy consumption, which is second only to China in terms of growth in the region. However, 10% of the population consumed 78% of the dairy products and estimated consumption was only 9 kg per capita per year, lower than many countries. SWOT ANALYSIS Business Monitor International (BMI) Vietnam: Agribusiness Report, Q3 2010, Including 5‐year forecasts to 2014, May, 2010 Vietnam Agribusiness Environment SWOT Strengths • Vietnam has a large, skilled and low‐cost workforce that has made the country attractive to foreign
investors. • The natural fertility of Vietnam around the Red River Delta in the north and the Mekong River Delta in
the south provides the country with a strong agricultural base. • Vietnam is the world's second largest exporter of both rice and coffee. • Vietnam's location ‐ its proximity to China and South East Asia, and its good sea links ‐ makes it a good
base for foreign companies to export to the rest of Asia, and beyond. • Vietnam has been one of the fastest‐growing economies in Asia in recent years, with GDP growth
averaging 7.6% annually between 2000 and 2007. • The economic boom has lifted many Vietnamese out of poverty, with the official poverty rate in the
country falling from 58% in 1993 to 20% in 2004. • Politically, the Communist Party government appears committed to market‐oriented reforms. The
one‐party system is generally conducive to short‐term political stability. Weaknesses • Much of Vietnam's agriculture is based on small‐scale farms with poor yields in comparison to more
developed international competitors • Transportation and agricultural production infrastructure is often poor, making getting crops to
market difficult and negatively affecting quality. Roads, railways and ports are inadequate to cope with the country's economic growth and links with the outside world.
• Vietnam still suffers from substantial trade, current account and fiscal deficits, leaving the economy vulnerable as the global economy continues to suffer in 2010.
• Vietnam remains one of the world's most corrupt countries. Its score in Transparency International's 2008 Corruption Perceptions Index placed it in 20th place in the Asia‐Pacific region.
Opportunities
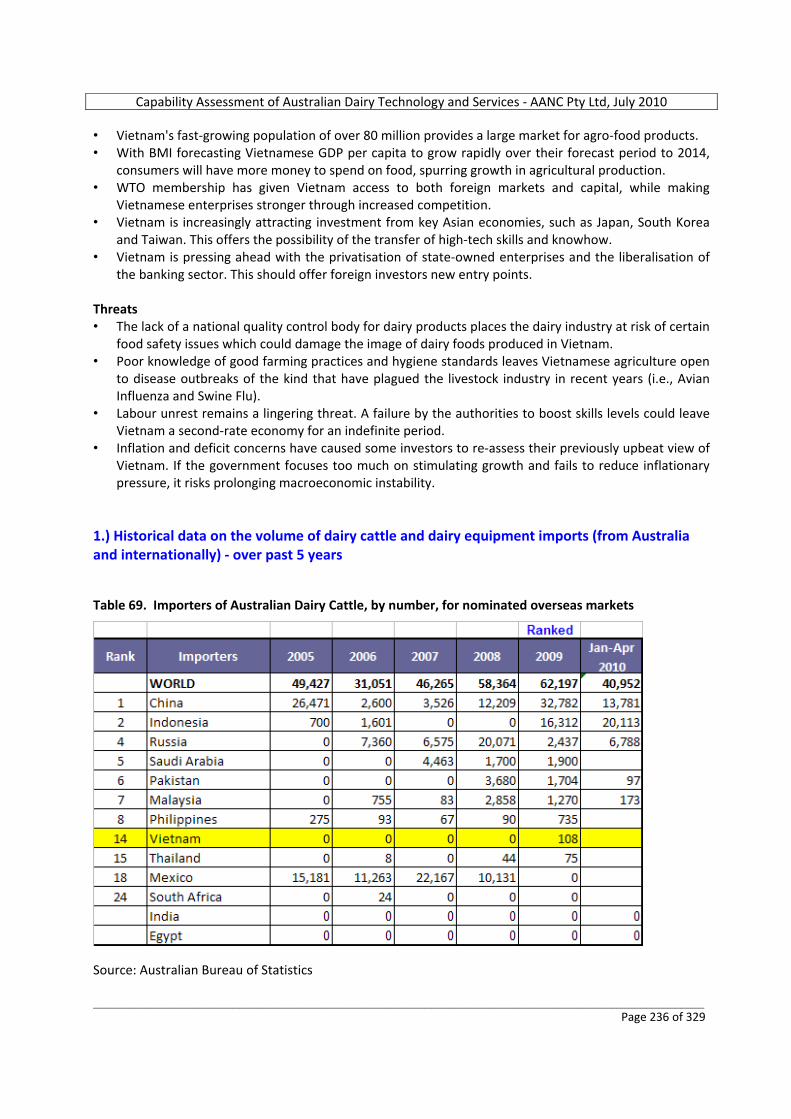
Capability Assessment of Australian Dairy Technology and Services ‐ AANC Pty Ltd, July 2010
_________________________________________________________________________________________________________ Page 236 of 329
• Vietnam's fast‐growing population of over 80 million provides a large market for agro‐food products. • With BMI forecasting Vietnamese GDP per capita to grow rapidly over their forecast period to 2014,
consumers will have more money to spend on food, spurring growth in agricultural production. • WTO membership has given Vietnam access to both foreign markets and capital, while making
Vietnamese enterprises stronger through increased competition. • Vietnam is increasingly attracting investment from key Asian economies, such as Japan, South Korea
and Taiwan. This offers the possibility of the transfer of high‐tech skills and knowhow. • Vietnam is pressing ahead with the privatisation of state‐owned enterprises and the liberalisation of
the banking sector. This should offer foreign investors new entry points. Threats • The lack of a national quality control body for dairy products places the dairy industry at risk of certain
food safety issues which could damage the image of dairy foods produced in Vietnam. • Poor knowledge of good farming practices and hygiene standards leaves Vietnamese agriculture open
to disease outbreaks of the kind that have plagued the livestock industry in recent years (i.e., Avian Influenza and Swine Flu).
• Labour unrest remains a lingering threat. A failure by the authorities to boost skills levels could leave Vietnam a second‐rate economy for an indefinite period.
• Inflation and deficit concerns have caused some investors to re‐assess their previously upbeat view of Vietnam. If the government focuses too much on stimulating growth and fails to reduce inflationary pressure, it risks prolonging macroeconomic instability.
1.) Historical data on the volume of dairy cattle and dairy equipment imports (from Australia and internationally) ‐ over past 5 years Table 69. Importers of Australian Dairy Cattle, by number, for nominated overseas markets
Source: Australian Bureau of Statistics
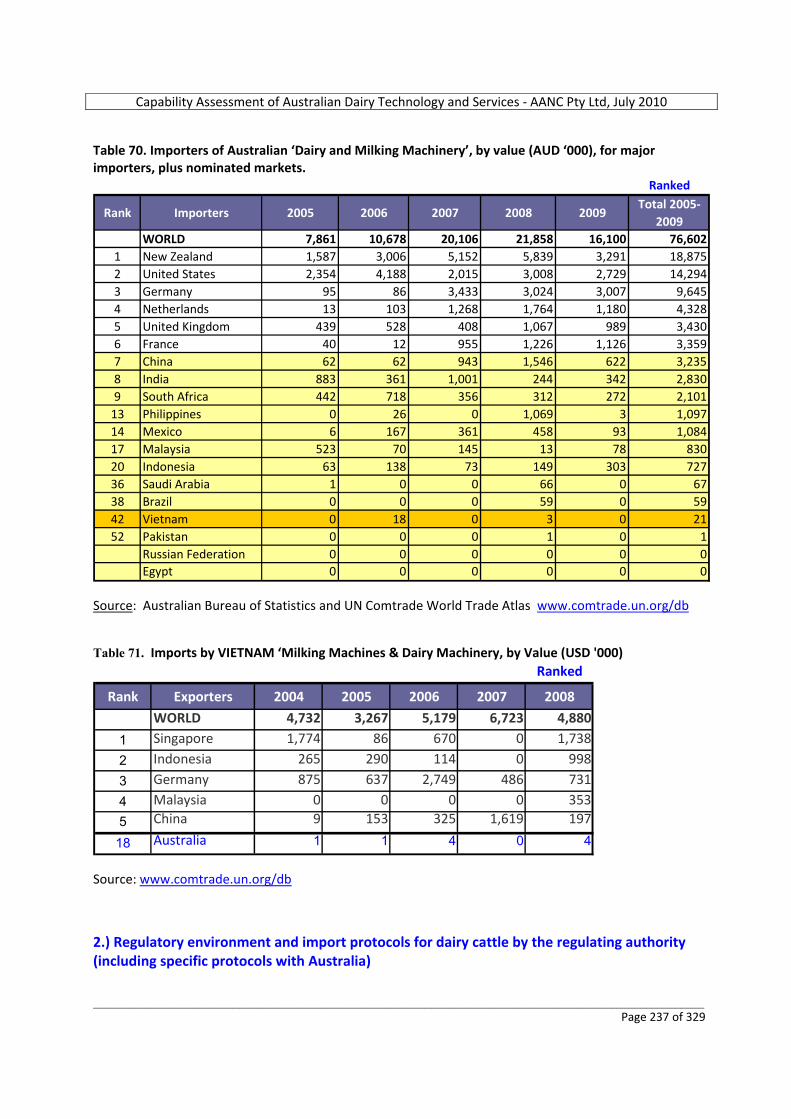
Capability Assessment of Australian Dairy Technology and Services ‐ AANC Pty Ltd, July 2010
_________________________________________________________________________________________________________ Page 237 of 329
Table 70. Importers of Australian ‘Dairy and Milking Machinery’, by value (AUD ‘000), for major importers, plus nominated markets.
Ranked
Rank Importers 2005 2006 2007 2008 2009Total 2005‐
2009WORLD 7,861 10,678 20,106 21,858 16,100 76,602
1 New Zealand 1,587 3,006 5,152 5,839 3,291 18,8752 United States 2,354 4,188 2,015 3,008 2,729 14,2943 Germany 95 86 3,433 3,024 3,007 9,6454 Netherlands 13 103 1,268 1,764 1,180 4,3285 United Kingdom 439 528 408 1,067 989 3,4306 France 40 12 955 1,226 1,126 3,3597 China 62 62 943 1,546 622 3,2358 India 883 361 1,001 244 342 2,8309 South Africa 442 718 356 312 272 2,101
13 Philippines 0 26 0 1,069 3 1,09714 Mexico 6 167 361 458 93 1,08417 Malaysia 523 70 145 13 78 83020 Indonesia 63 138 73 149 303 72736 Saudi Arabia 1 0 0 66 0 6738 Brazil 0 0 0 59 0 5942 Vietnam 0 18 0 3 0 2152 Pakistan 0 0 0 1 0 1
Russian Federation 0 0 0 0 0 0Egypt 0 0 0 0 0 0
Source: Australian Bureau of Statistics and UN Comtrade World Trade Atlas www.comtrade.un.org/db Table 71. Imports by VIETNAM ‘Milking Machines & Dairy Machinery, by Value (USD '000)
Ranked
Rank Exporters 2004 2005 2006 2007 2008
WORLD 4,732 3,267 5,179 6,723 4,880
1 Singapore 1,774 86 670 0 1,738
2 Indonesia 265 290 114 0 998
3 Germany 875 637 2,749 486 731
4 Malaysia 0 0 0 0 353
5 China 9 153 325 1,619 197
18 Australia 1 1 4 0 4
Source: www.comtrade.un.org/db 2.) Regulatory environment and import protocols for dairy cattle by the regulating authority (including specific protocols with Australia)
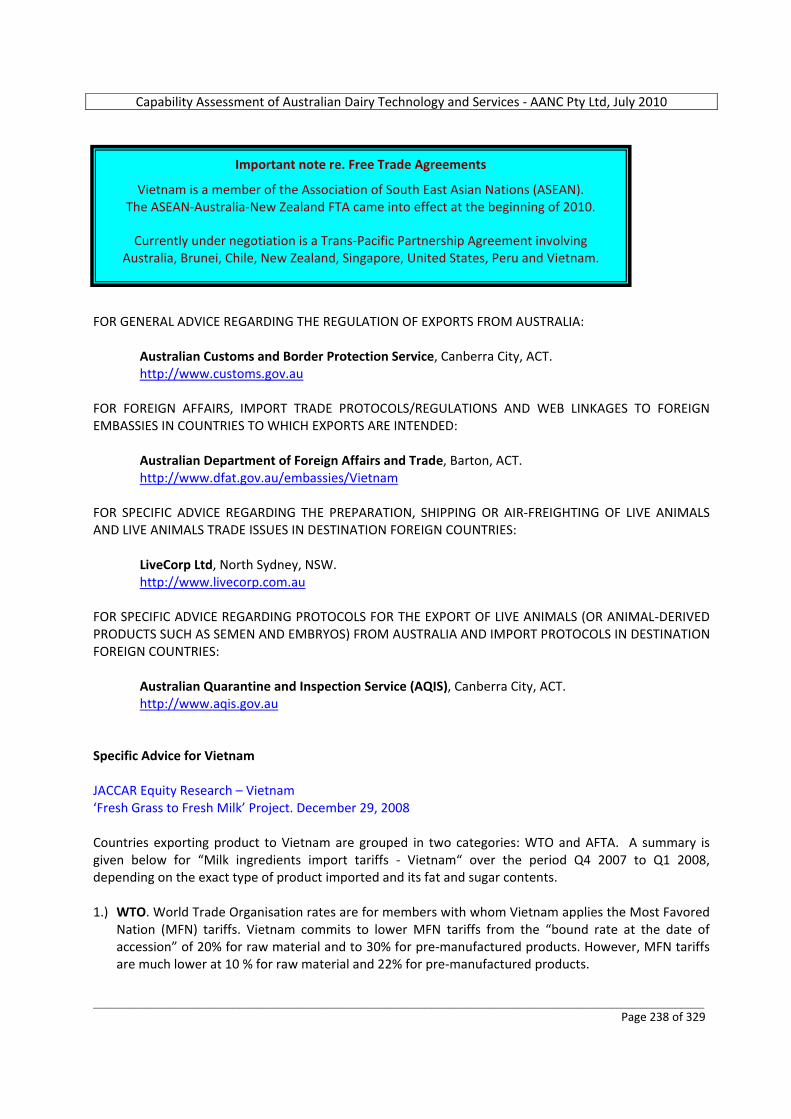
Capability Assessment of Australian Dairy Technology and Services ‐ AANC Pty Ltd, July 2010
_________________________________________________________________________________________________________ Page 238 of 329
FOR GENERAL ADVICE REGARDING THE REGULATION OF EXPORTS FROM AUSTRALIA:
Australian Customs and Border Protection Service, Canberra City, ACT. http://www.customs.gov.au
FOR FOREIGN AFFAIRS, IMPORT TRADE PROTOCOLS/REGULATIONS AND WEB LINKAGES TO FOREIGN EMBASSIES IN COUNTRIES TO WHICH EXPORTS ARE INTENDED:
Australian Department of Foreign Affairs and Trade, Barton, ACT. http://www.dfat.gov.au/embassies/Vietnam
FOR SPECIFIC ADVICE REGARDING THE PREPARATION, SHIPPING OR AIR‐FREIGHTING OF LIVE ANIMALS AND LIVE ANIMALS TRADE ISSUES IN DESTINATION FOREIGN COUNTRIES:
LiveCorp Ltd, North Sydney, NSW. http://www.livecorp.com.au
FOR SPECIFIC ADVICE REGARDING PROTOCOLS FOR THE EXPORT OF LIVE ANIMALS (OR ANIMAL‐DERIVED PRODUCTS SUCH AS SEMEN AND EMBRYOS) FROM AUSTRALIA AND IMPORT PROTOCOLS IN DESTINATION FOREIGN COUNTRIES:
Australian Quarantine and Inspection Service (AQIS), Canberra City, ACT. http://www.aqis.gov.au
Specific Advice for Vietnam JACCAR Equity Research – Vietnam ‘Fresh Grass to Fresh Milk’ Project. December 29, 2008 Countries exporting product to Vietnam are grouped in two categories: WTO and AFTA. A summary is given below for “Milk ingredients import tariffs ‐ Vietnam“ over the period Q4 2007 to Q1 2008, depending on the exact type of product imported and its fat and sugar contents. 1.) WTO. World Trade Organisation rates are for members with whom Vietnam applies the Most Favored
Nation (MFN) tariffs. Vietnam commits to lower MFN tariffs from the “bound rate at the date of accession” of 20% for raw material and to 30% for pre‐manufactured products. However, MFN tariffs are much lower at 10 % for raw material and 22% for pre‐manufactured products.
Important note re. Free Trade Agreements
Vietnam is a member of the Association of South East Asian Nations (ASEAN). The ASEAN‐Australia‐New Zealand FTA came into effect at the beginning of 2010.
Currently under negotiation is a Trans‐Pacific Partnership Agreement involving
Australia, Brunei, Chile, New Zealand, Singapore, United States, Peru and Vietnam.
Capability Assessment of Australian Dairy Technology and Services ‐ AANC Pty Ltd, July 2010
_________________________________________________________________________________________________________ Page 239 of 329
2.) AFTA. ASEAN Free Trade Area members, with whom Common Effective Preferential Tariffs (CEPT) apply. CEPT tariffs for dry skim and whole milk powder and all other ingredients for milk products are subject to a 5% tariff. MFN tariffs on manufactured dairy products are currently 15% compared to its commitment of 25% in 2012.
3.) Investment environment for dairy operations (domestic and foreign assistance, tax incentives, export zones, etc) and examples of FDI (from any country) Business Monitor International (BMI) Vietnam: Agribusiness Report, Q3 2010, Including 5‐year forecasts to 2014, May, 2010 BMI believes that Vietnam's dairy sector should gain a strong boost following a US$350 million investment by TH Milk Joint Stock Company in April 2010 to enhance cattle‐raising and milk processing in Nghe An province. The project includes the construction of a 10,000 hectare pasture farm for up to 45,000 head of cattle within two years, and US$100 million for a processing factory designed to produce up to 530 million litres of milk per year, which would make it the largest factory of its kind in Vietnam. The planning, construction, operational and logistics management of the project are the task of a specialist Israeli agribusiness team, Afikim. Fifty‐one buildings will be constructed in the initial phase, covering an estimated 80 hectares. Animals will be housed all year, with a total mixed ration fed down a central alleyway and concentrate adjustments allocated electronically via transponders in the milking parlour in response to lactational need. Manawatu Vets Secure Vietnam Dairy Deal. Manawatu Standard. 13 April 2010. ONE of the major veterinary companies in Manawatu has secured an 18‐month contract to provide veterinary services to a dairy project in Vietnam. ‘Totally Vets’ will provide services to a US$350 million project in the central northern region of Vietnam, funded by a consortium of Vietnamese businesses, TH Milk Joint Stock Company. The project has government support at the highest level. ‘Totally Vets' contract is to provide a comprehensive range of standard veterinary services. Recording of production and health data, referenced against performance targets, will form the basis of monthly reporting. Austrade SE Asian offices: Vietnam's fast‐growing population of over 80 million provides a large market for dairy products. With BMI forecasting Vietnamese GDP per capita to grow rapidly over the forecast period to 2014, consumers will have more money to spend on food, spurning growth in agricultural productions. Another advantage of Vietnam investment environment is that Vietnam has a large, skilled and low‐cost workforce that has made the country attractive to foreign investors. Vietnam also has a convenient location, wit its proximity to China and South East Asia, and its good sea links, making it a good base for foreign companies to export to the rest of Asia, and beyond. However, there are some disadvantages regarding the investment environment in Vietnam. Along with the rising population and increasing industrialisation of the economy will come increased competition for land use, curtailing the area available for expansion of agriculture. Vietnam's infrastructure is still weak.
Capability Assessment of Australian Dairy Technology and Services ‐ AANC Pty Ltd, July 2010
_________________________________________________________________________________________________________ Page 240 of 329
Roads, railways and ports are inadequate to cope with the country's economic growth and links with the outside world. However, there are some positive signs in the food market in general, as well as the dairy market specifically. BMI expects Vietnam's food, drink and tobacco trade balance to remain very healthy to 2014. Over the 5 years to 2014, exports are set to grow by 64.2%, while import growth is forecast to be 52.9% up to 2014. 4.) National government programs to assist with the development of dairy operations Agriculture: Vietnam‐Belgium Dairy Project Bears Fruit Vietnam News Brief Service. 26 February 2010 Vietnam now has 120,000 dairy cows, with their milk production meeting 28% of domestic demand. Vietnam has devised a national milk development program to rear a total of 500,000 domestic dairy cows by 2020, meeting 40% of consumer demand. Vietnam Dairy Association Established. Asia Pulse. 29 March 2010. The number of milk cows nationwide in 2009 stood at 114,461, a year‐on‐year increase of 6 % with dairy products reaching about 278,190 tonnes, a 6.1 % rise over 2008. Vietnam plans to develop industrial‐scale dairy cow farms equipped with modern technology to increase the number of milk cows to nearly 146,100 in 2010, over 293,500 by 2015 and nearly 706,000 by 2025, respectively. 5.) Existing or proposed external assistance programs to develop the industry (foreign government and/or aid programs) Agriculture: Vietnam‐Belgium Dairy Project Bears Fruit Vietnam News Brief Service. 26 February 2010 The Vietnam‐Belgium Dairy Project (VBDP), funded by the Belgium Government, has significantly helped increase the number of dairy cows and milk output after 5 years of implementation, said an official of the Ministry of Agriculture and Rural Development (MARD). The EUR2.8 million project was jointly carried out by MARD and the Belgian Technical Cooperation Agency from Feb 2005 to Feb 2010, with the aim to increase local milk output and reduce dependence on imports and employ more local workers. The Head of the ministry’s Animal Husbandry Department said that the number of dairy cows in Hanoi and the northern provinces of Ha Nam, Bac Ninh and Vinh Phuc participating in the project has increased by 54% and their milk production is up 42%. Each dairy cow brings an annual average income of VND15.7 million (AU$1,600). The project has cooperated with major local milk manufacturers including Vietnam Dairy Products Joint Stock Company (Vinamilk) to provide consultation on breeding techniques to dairy farmers, and help ensure stable milk prices. Under the project, encouragement was also given to the application of environmentally‐friendly breeding techniques such as using cattle waste to make biogas.
Capability Assessment of Australian Dairy Technology and Services ‐ AANC Pty Ltd, July 2010
_________________________________________________________________________________________________________ Page 241 of 329
6.) Overview of the typical dairy farming arrangements FAO, Country Pasture/Forage Resource Profiles ‐ Vietnam Dr. Nguyen Thi Mui, October, 2003 From 1990‐2001 dairy cattle numbers increased 3.8 times, and from 1999 to 2000 numbers rose from 30,000 to 40,000 and 42,000 in 2001, in which milking cows are around 18,000. At present 99% of dairy cattle are F1 and F2 Holstein Friesian (HF) in the structure of breeding (89% F1 HF and 10% HF) and a few crossbred of F1 Sindhi (1%). From 1994 to 2001, milk yield per lactation of F1, F2 HF increased from 2,330 to 3,300 kg. For pure breed HF, milk yield increased from 3,300 to 3,850 kg per lactation. Dairy cattle are kept in 3 main regions: (i) Ho Chi Minh City and peri‐urban areas (some 85% of dairy animals); (ii) Provinces in the North (13‐14%), and (iii) Provinces in the Central region (about 1%). About 94.5% of dairy cattle are kept by small households with 3‐5 head; there are some 0.5% of larger farms with 50‐100 head and another 5% are kept in large units to supply breeding stock for developing dairy cattle nationally. According to FAOSTAT (2005) milk production from cows tripled between 2000 and 2004 to nearly 150,000 tonnes. Main constraints to profitable dairy farming in Vietnam 1. There is poor focus on genetic improvement, low level knowledge of herd management and no
planning of breeding management from the government to the local level. 2. An insufficient number of high yielding genetically improved breeding stock. 3. Some areas with high potential for developing dairying such as Lamdong and Mocchau have no milk
processing or marketing facilities. 4. Lack of good quality feed and pasture, especially in the dry season or when drought occurs, because
most farmers neither grow forage nor use the available fodder trees to supplement poor quality roughage. Shortages in feed are experienced due to inefficient use of farm byproducts, and improper handling and processing of forage crops during peak supply periods or during harvesting of field crops.
5. Lack of appreciation of the value of improved pasture. Only a few stock owners with over 20 dairy
cows use improved pasture. Several have started introducing improved pastures on their properties but the forages are only in small patches that are generally left unattended or unprotected from free grazing animals. Expansion of improved pasture is very limited on land used for planting food crops or fruit trees. Improved pasture is mainly established on wastelands, home gardens, wild land, gravelly soil, low lying land or newly reclaimed land of low productivity.
6. The grazing system is not suitable for buffaloes and cattle since the size of the grazing areas is reduced
day by day due to the conflict between buffalo, cattle production and the expansion of cropping and forestry.
7. Unfavourable climate means a decline of 1 kg of milk for each degree of temperature above 27° C.
Milk yield of Holsteins begins to fall above 21 oC, Brown Swiss drops at 24° C and Jersey at 27° C. Humidity promotes the multiplication of disease‐causing organisms.
Capability Assessment of Australian Dairy Technology and Services ‐ AANC Pty Ltd, July 2010
_________________________________________________________________________________________________________ Page 242 of 329
8. Lack of credit for smallholders due to the large investment needed for financing milking cows, while farmers must borrow with long term loans. Lending procedures can be complicated and cumbersome.
Business Monitor International (BMI) Vietnam: Agribusiness Report, Q3 2010, Including 5‐year forecasts to 2014, May, 2010 Since the opening up of the economy in 1986, there has been considerable change in the structure of the Vietnamese dairy industry. The contribution of state farms, which were previously responsible for almost all milk production, has fallen to only around 5% with the other 95% of milk production coming mainly from small and medium‐sized private farms. Doi Moi, as the restructuring of the economy is known, has also led to the emergence of a highly consolidated private milk collection and processing sector, within which TH Milk plays a dominant role. Since the start of last decade, milk production in Vietnam has grown rapidly as small‐scale dairy production has expanded. Between 2000 and 2008, fluid milk production increased by more than 400% from 54,000 tonnes to 262,200 tonnes. This was achieved by a more than five‐fold increase in the size of the dairy herd from 35,000 head of cattle to just over 159,000 head over that period. This growth in the dairy herd came mainly on small‐scale farms which numbered 19,800 in 2006 with an average of just 5.3 cows per farm. Vietnam Dairy Association Established. Asia Pulse. 29 March 2010. A congress to set up the Vietnam Dairy Association (VDA) took place in Ho Chi Minh City on March 25. Accordingly, the VDA, a social‐occupational organisation, will include 67 official members and 6 collaborators, who are businesses, farmers, managers, scientists and technicians operating in all areas of milk production, processing and consumption. The association will help its members cooperate, support, exchange experiences and improve professional knowledge in line with protecting their legal rights. It will also provide suggestions and submit petitions to relevant state offices on standards and policies to promote milk production and business. It will work as a consultation and promotion office to raise peoples awareness of milk and dairy products, and will establish cooperative relations with other associations as well as with international organisations. Vietnam: Milch Cow invests in bovine industry. Thai News Service. 3 March 2010. Ho Chi Minh City Milch Cow Co is investing more than VND 45 billion (US$2.45 million) to build a network of breeding facilities and pastures for dairy cows and beef cattle in Lam Dong Province's Duc Trong District. The company aims to ensure the best conditions to develop 1,200 dairy and beef cattle by 2012. The company said Lam Dong has cool weather conducive to the development of cow breeding. The company plans to develop beef cattle on 250 ha, expanding to 500 ha, of which 100 ha will be used for sowing improved pastures. The company has a herd of 3,290 cows. Every year, the company provides more than 400 breeding dairy cows to Ho Chi Minh City and other provinces in the country, and sells 1,000 beef cattle to the market. The herd of cows are managed and raised according to the Quality Standard ISO‐9001, 2008.
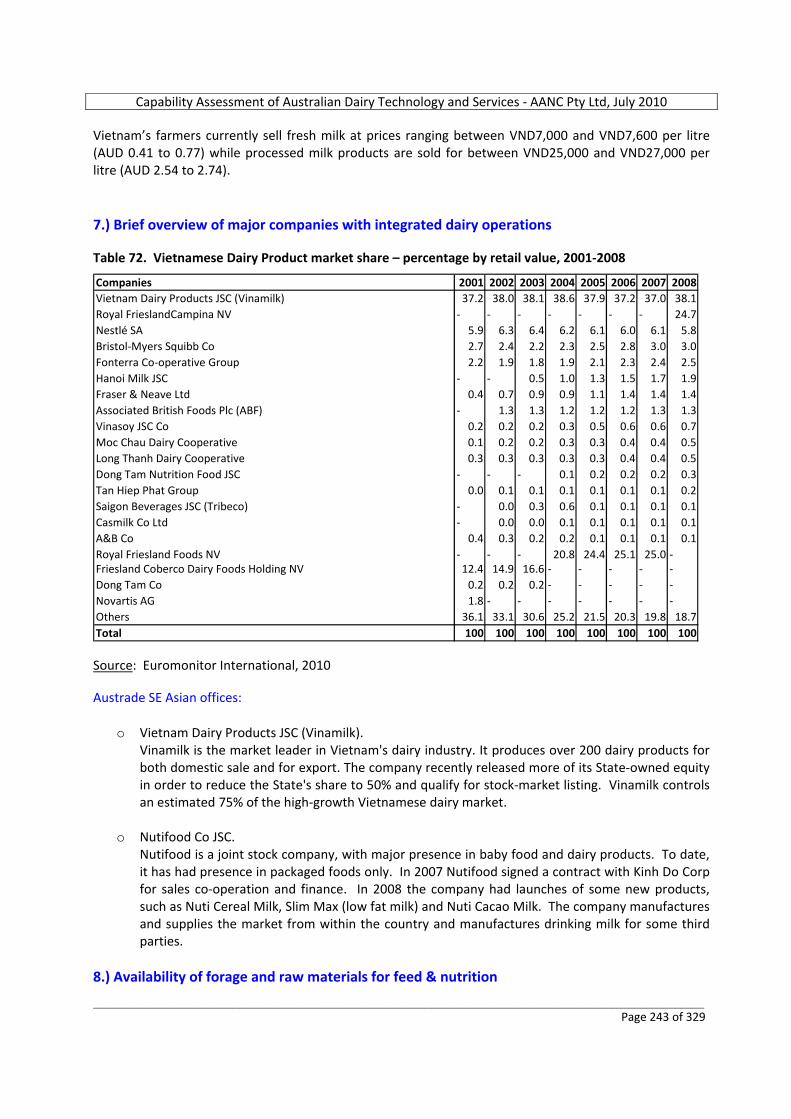
Capability Assessment of Australian Dairy Technology and Services ‐ AANC Pty Ltd, July 2010
_________________________________________________________________________________________________________ Page 243 of 329
Vietnam’s farmers currently sell fresh milk at prices ranging between VND7,000 and VND7,600 per litre (AUD 0.41 to 0.77) while processed milk products are sold for between VND25,000 and VND27,000 per litre (AUD 2.54 to 2.74). 7.) Brief overview of major companies with integrated dairy operations Table 72. Vietnamese Dairy Product market share – percentage by retail value, 2001‐2008
Companies 2001 2002 2003 2004 2005 2006 2007 2008Vietnam Dairy Products JSC (Vinamilk) 37.2 38.0 38.1 38.6 37.9 37.2 37.0 38.1Royal FrieslandCampina NV ‐ ‐ ‐ ‐ ‐ ‐ ‐ 24.7Nestlé SA 5.9 6.3 6.4 6.2 6.1 6.0 6.1 5.8Bristol‐Myers Squibb Co 2.7 2.4 2.2 2.3 2.5 2.8 3.0 3.0Fonterra Co‐operative Group 2.2 1.9 1.8 1.9 2.1 2.3 2.4 2.5Hanoi Milk JSC ‐ ‐ 0.5 1.0 1.3 1.5 1.7 1.9Fraser & Neave Ltd 0.4 0.7 0.9 0.9 1.1 1.4 1.4 1.4Associated British Foods Plc (ABF) ‐ 1.3 1.3 1.2 1.2 1.2 1.3 1.3Vinasoy JSC Co 0.2 0.2 0.2 0.3 0.5 0.6 0.6 0.7Moc Chau Dairy Cooperative 0.1 0.2 0.2 0.3 0.3 0.4 0.4 0.5Long Thanh Dairy Cooperative 0.3 0.3 0.3 0.3 0.3 0.4 0.4 0.5Dong Tam Nutrition Food JSC ‐ ‐ ‐ 0.1 0.2 0.2 0.2 0.3Tan Hiep Phat Group 0.0 0.1 0.1 0.1 0.1 0.1 0.1 0.2Saigon Beverages JSC (Tribeco) ‐ 0.0 0.3 0.6 0.1 0.1 0.1 0.1Casmilk Co Ltd ‐ 0.0 0.0 0.1 0.1 0.1 0.1 0.1A&B Co 0.4 0.3 0.2 0.2 0.1 0.1 0.1 0.1Royal Friesland Foods NV ‐ ‐ ‐ 20.8 24.4 25.1 25.0 ‐Friesland Coberco Dairy Foods Holding NV 12.4 14.9 16.6 ‐ ‐ ‐ ‐ ‐Dong Tam Co 0.2 0.2 0.2 ‐ ‐ ‐ ‐ ‐Novartis AG 1.8 ‐ ‐ ‐ ‐ ‐ ‐ ‐Others 36.1 33.1 30.6 25.2 21.5 20.3 19.8 18.7Total 100 100 100 100 100 100 100 100 Source: Euromonitor International, 2010 Austrade SE Asian offices:
o Vietnam Dairy Products JSC (Vinamilk). Vinamilk is the market leader in Vietnam's dairy industry. It produces over 200 dairy products for both domestic sale and for export. The company recently released more of its State‐owned equity in order to reduce the State's share to 50% and qualify for stock‐market listing. Vinamilk controls an estimated 75% of the high‐growth Vietnamese dairy market.
o Nutifood Co JSC. Nutifood is a joint stock company, with major presence in baby food and dairy products. To date, it has had presence in packaged foods only. In 2007 Nutifood signed a contract with Kinh Do Corp for sales co‐operation and finance. In 2008 the company had launches of some new products, such as Nuti Cereal Milk, Slim Max (low fat milk) and Nuti Cacao Milk. The company manufactures and supplies the market from within the country and manufactures drinking milk for some third parties.
8.) Availability of forage and raw materials for feed & nutrition
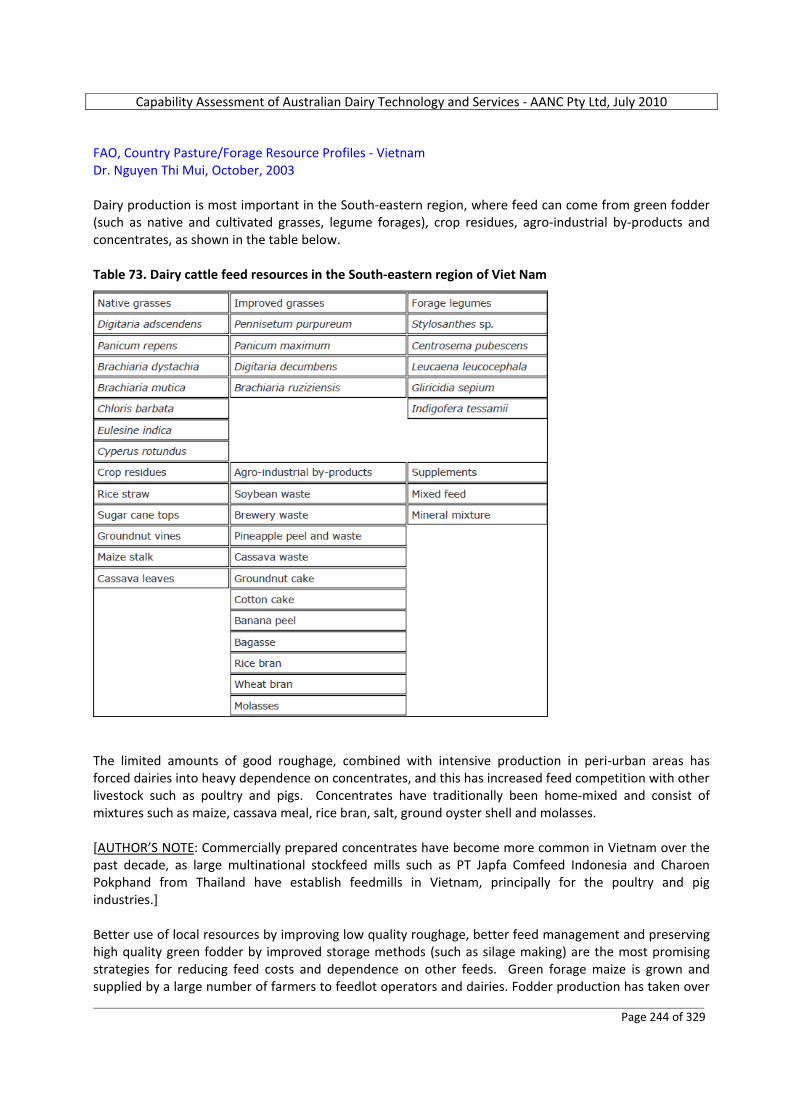
Capability Assessment of Australian Dairy Technology and Services ‐ AANC Pty Ltd, July 2010
_________________________________________________________________________________________________________ Page 244 of 329
FAO, Country Pasture/Forage Resource Profiles ‐ Vietnam Dr. Nguyen Thi Mui, October, 2003 Dairy production is most important in the South‐eastern region, where feed can come from green fodder (such as native and cultivated grasses, legume forages), crop residues, agro‐industrial by‐products and concentrates, as shown in the table below. Table 73. Dairy cattle feed resources in the South‐eastern region of Viet Nam
The limited amounts of good roughage, combined with intensive production in peri‐urban areas has forced dairies into heavy dependence on concentrates, and this has increased feed competition with other livestock such as poultry and pigs. Concentrates have traditionally been home‐mixed and consist of mixtures such as maize, cassava meal, rice bran, salt, ground oyster shell and molasses. [AUTHOR’S NOTE: Commercially prepared concentrates have become more common in Vietnam over the past decade, as large multinational stockfeed mills such as PT Japfa Comfeed Indonesia and Charoen Pokphand from Thailand have establish feedmills in Vietnam, principally for the poultry and pig industries.] Better use of local resources by improving low quality roughage, better feed management and preserving high quality green fodder by improved storage methods (such as silage making) are the most promising strategies for reducing feed costs and dependence on other feeds. Green forage maize is grown and supplied by a large number of farmers to feedlot operators and dairies. Fodder production has taken over
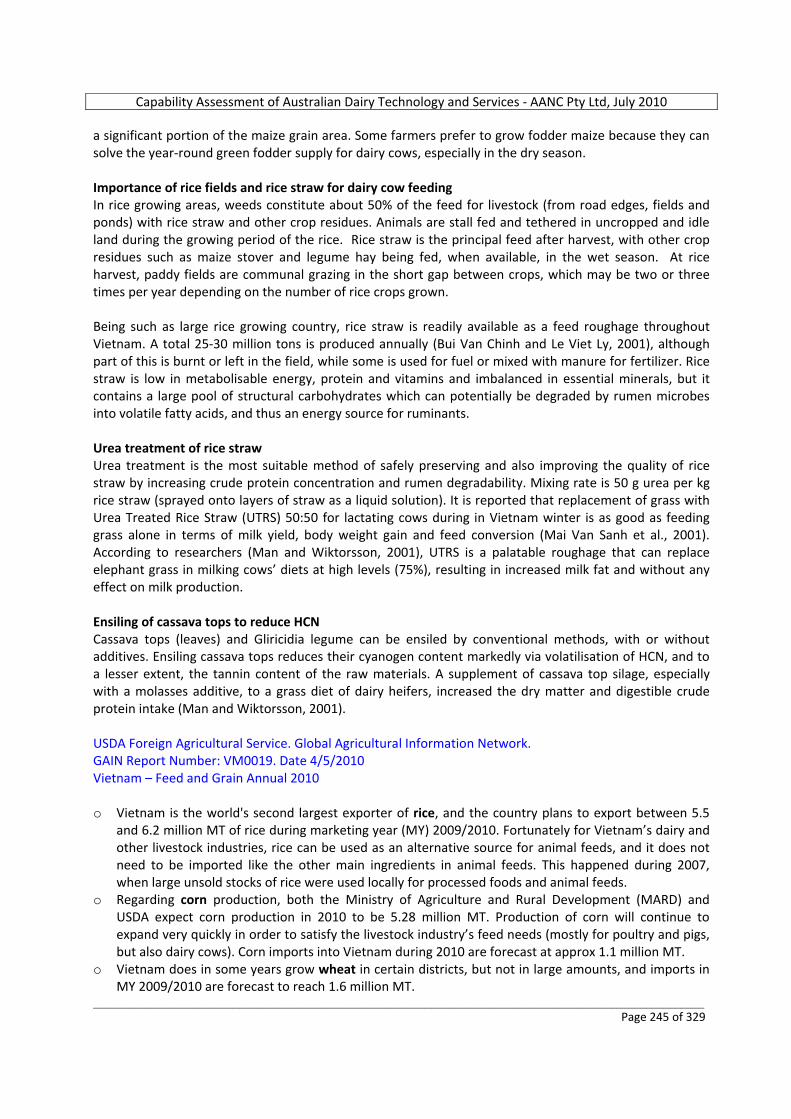
Capability Assessment of Australian Dairy Technology and Services ‐ AANC Pty Ltd, July 2010
_________________________________________________________________________________________________________ Page 245 of 329
a significant portion of the maize grain area. Some farmers prefer to grow fodder maize because they can solve the year‐round green fodder supply for dairy cows, especially in the dry season. Importance of rice fields and rice straw for dairy cow feeding In rice growing areas, weeds constitute about 50% of the feed for livestock (from road edges, fields and ponds) with rice straw and other crop residues. Animals are stall fed and tethered in uncropped and idle land during the growing period of the rice. Rice straw is the principal feed after harvest, with other crop residues such as maize stover and legume hay being fed, when available, in the wet season. At rice harvest, paddy fields are communal grazing in the short gap between crops, which may be two or three times per year depending on the number of rice crops grown. Being such as large rice growing country, rice straw is readily available as a feed roughage throughout Vietnam. A total 25‐30 million tons is produced annually (Bui Van Chinh and Le Viet Ly, 2001), although part of this is burnt or left in the field, while some is used for fuel or mixed with manure for fertilizer. Rice straw is low in metabolisable energy, protein and vitamins and imbalanced in essential minerals, but it contains a large pool of structural carbohydrates which can potentially be degraded by rumen microbes into volatile fatty acids, and thus an energy source for ruminants. Urea treatment of rice straw Urea treatment is the most suitable method of safely preserving and also improving the quality of rice straw by increasing crude protein concentration and rumen degradability. Mixing rate is 50 g urea per kg rice straw (sprayed onto layers of straw as a liquid solution). It is reported that replacement of grass with Urea Treated Rice Straw (UTRS) 50:50 for lactating cows during in Vietnam winter is as good as feeding grass alone in terms of milk yield, body weight gain and feed conversion (Mai Van Sanh et al., 2001). According to researchers (Man and Wiktorsson, 2001), UTRS is a palatable roughage that can replace elephant grass in milking cows’ diets at high levels (75%), resulting in increased milk fat and without any effect on milk production. Ensiling of cassava tops to reduce HCN Cassava tops (leaves) and Gliricidia legume can be ensiled by conventional methods, with or without additives. Ensiling cassava tops reduces their cyanogen content markedly via volatilisation of HCN, and to a lesser extent, the tannin content of the raw materials. A supplement of cassava top silage, especially with a molasses additive, to a grass diet of dairy heifers, increased the dry matter and digestible crude protein intake (Man and Wiktorsson, 2001). USDA Foreign Agricultural Service. Global Agricultural Information Network. GAIN Report Number: VM0019. Date 4/5/2010 Vietnam – Feed and Grain Annual 2010 o Vietnam is the world's second largest exporter of rice, and the country plans to export between 5.5
and 6.2 million MT of rice during marketing year (MY) 2009/2010. Fortunately for Vietnam’s dairy and other livestock industries, rice can be used as an alternative source for animal feeds, and it does not need to be imported like the other main ingredients in animal feeds. This happened during 2007, when large unsold stocks of rice were used locally for processed foods and animal feeds.
o Regarding corn production, both the Ministry of Agriculture and Rural Development (MARD) and USDA expect corn production in 2010 to be 5.28 million MT. Production of corn will continue to expand very quickly in order to satisfy the livestock industry’s feed needs (mostly for poultry and pigs, but also dairy cows). Corn imports into Vietnam during 2010 are forecast at approx 1.1 million MT.
o Vietnam does in some years grow wheat in certain districts, but not in large amounts, and imports in MY 2009/2010 are forecast to reach 1.6 million MT.
Capability Assessment of Australian Dairy Technology and Services ‐ AANC Pty Ltd, July 2010
_________________________________________________________________________________________________________ Page 246 of 329
JACCAR Equity Research – Vietnam ‘Fresh Grass to Fresh Milk’ Project. December 29, 2008 Commonly used feed ingredients for dairy cows in Vietnam include Cassava Waste (sun‐dried cassava root by‐product of tapioca starch production, with metabolisable energy approx 10.5 MJ/kg and crude protein of approx 2.5%), wet brewer’s grains, commercially prepared dairy pellets/meal and chopped tropical grasses such as Napier. Feed costs of production per litre of milk in recent years have been 1,200‐1,500 VND (AUD 0.10‐0.12) in 2006, increasing sharply up to 5,000‐5,500 VND (AUD 0.35‐0.40) in 2008. These costs of production compare poorly with global costs of generally only USD 0.20 per litre, maximum. The substantial rise of feed commodity prices over recent years is shown in the graph below. Figure 68. Illustration of substantial rise in prices of dairy feed commodities used in Vietnam, from March 2006 to September 2008 (VND per kg)
Sources: Dutch Lady Vietnam, and JACCAR Investment Managers (www.jaccar.net) 9.) Availability of Artificial Insemination laboratories and testing facilities for cattle; also veterinary services Austrade SE Asian offices: Research & Development facilities for the dairy industry in Vietnam Vietnam Ministry of Agriculture and Rural Development 2010 programs: 1.) Improving the ability of researching, selecting and breeding: From the period 2006‐2009, the Vietnamese Government has invested approximately 400 Billion VND for the project of selecting and researching breeding and seed production. Some of the programs related to breeding: o Improving the facilities of Research and Training Cattle Centre in Binh Duong,
Capability Assessment of Australian Dairy Technology and Services ‐ AANC Pty Ltd, July 2010
_________________________________________________________________________________________________________ Page 247 of 329
o Binh Minh – Dong Nai Breeding Centre, o Artificial Insemination labs specialized in Cow and Pig are operating widely. 2.) Increasing the capacity of the Cattle and Domestic Fouls Breeds Quality Testing System. Investing in improving Cattle Breeds Quality Testing Systems. The government has invested in building a new Central Analysing and Testing Cattle Breeds Centre, and a Foods Centre of the Middle and Southern Vietnam. Funding of the investment is over 30 billions VND. 3.) Improving the capacity of Veterinary Service. o Investing to improve the ability of testing veterinary medicine in two Veterinary Medicine Testing
Centres. One is the Central Veterinary Medicine Testing Centre in Hanoi, the other is in Ho Chi Minh. Total funding is 60 billions VND. These two centres have met international quality standards.
o Investing to improve the capacity of testing animals at Noi Bai airport, Lang Son, Lao Cai, Quang Binh. The funding for this investment is approximately 50 billions VND, until end of 2010.
o Investing to improve Veterinary Services, in order to enhance capabilities for disease forecast and control. Funding for this investment is approximately 40 billions VND, until end of 2010.
o Investing to improve capabilities for disease forecast and control, testing and analysing bacteria at the Central Veterinary Diseases Forecast Center, Central Veterinary Hygiene Testing Center 1. Funding for this investment is approximately 45 billions VND, until end of 2010.
o Investing to improve the ability of managing in veterinary systems, through programs of applying computer science, with funding of 4 billion VND.
10.) Agribusiness educational facilities to support dairy production Austrade SE Asian offices: There are currently several educational companies. IDP (Công ty cổ phần sữa quốc tế) is organizing an educational centre to train people in Ba Vi, Hanoi, in methods of feeding and breeding cows within their company control program. FAO, Country Pasture/Forage Resource Profiles ‐ Vietnam Dr. Nguyen Thi Mui, October, 2003 o Department of Pasture Research and Animal Feed Plant Resources, National Institute of Animal
Husbandry, Chem, Tu Liem, Hanoi, Vietnam. Dr. Nguyen Thi Mui and Le Hoa Binh. Eml: [email protected]
o Department of Pasture Research and Animal Feed Plant Resources, National Institute of Animal
Husbandry, Chem, Tu Liem, Hanoi, Vietnam. o Beef and Pasture Research Centre, Bavi, Hatay, Vietnam. o Mountainous Science‐Technology Development Centre, Thai Nguyen, Vietnam. o South Institute of Agriculture Science, Binh Duong, Song Be, Vietnam. 11.) Dairy consumption trends (past 5 years)
Capability Assessment of Australian Dairy Technology and Services ‐ AANC Pty Ltd, July 2010
_________________________________________________________________________________________________________ Page 248 of 329
Business Monitor International (BMI) Vietnam: Agribusiness Report, Q3 2010, Including 5‐year forecasts to 2014, May, 2010 Vietnamese dairy consumption growth will remain strong over BMI’s forecast period to 2014. Strong economic growth will filter through into rising disposable incomes which will push up demand for non‐essential foodstuffs. Through to 2014, BMI expect a fluid milk consumption growth of 39%, while demand for butter, cheese and whole milk powder will soar, albeit from a far lower base. Increased urbanisation, increased home ownership of white goods such as refrigerators and the ongoing expansion of a modern, organised retail sector will all prove supportive of strong dairy consumption growth. As stated in previously in the Vietnam industry overview section, IPSARD have stated that Vietnam currently imports about 80% of its share of dairy consumption, which is currently running second only to China in terms of growth in the region. However, 10% of the population consumed 78% of the dairy products, and estimated consumption was currently only 9 kg per capita per year, which is lower than many other countries.
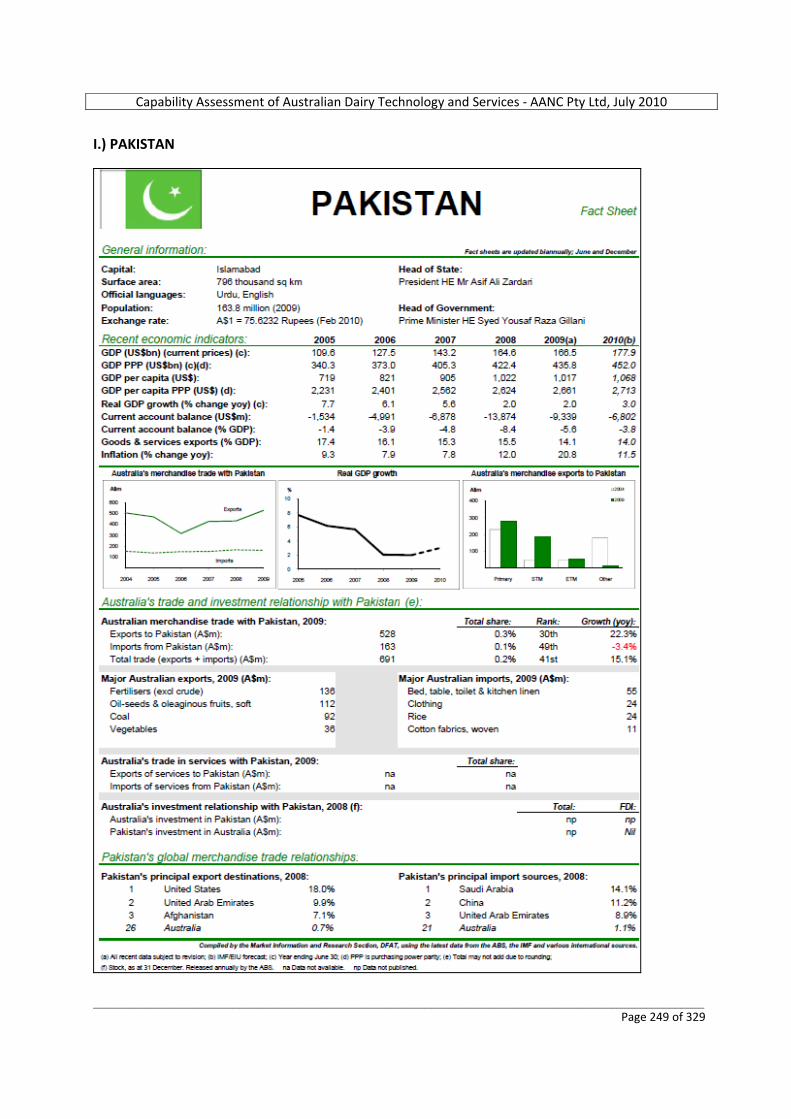
Capability Assessment of Australian Dairy Technology and Services ‐ AANC Pty Ltd, July 2010
_________________________________________________________________________________________________________ Page 249 of 329
I.) PAKISTAN
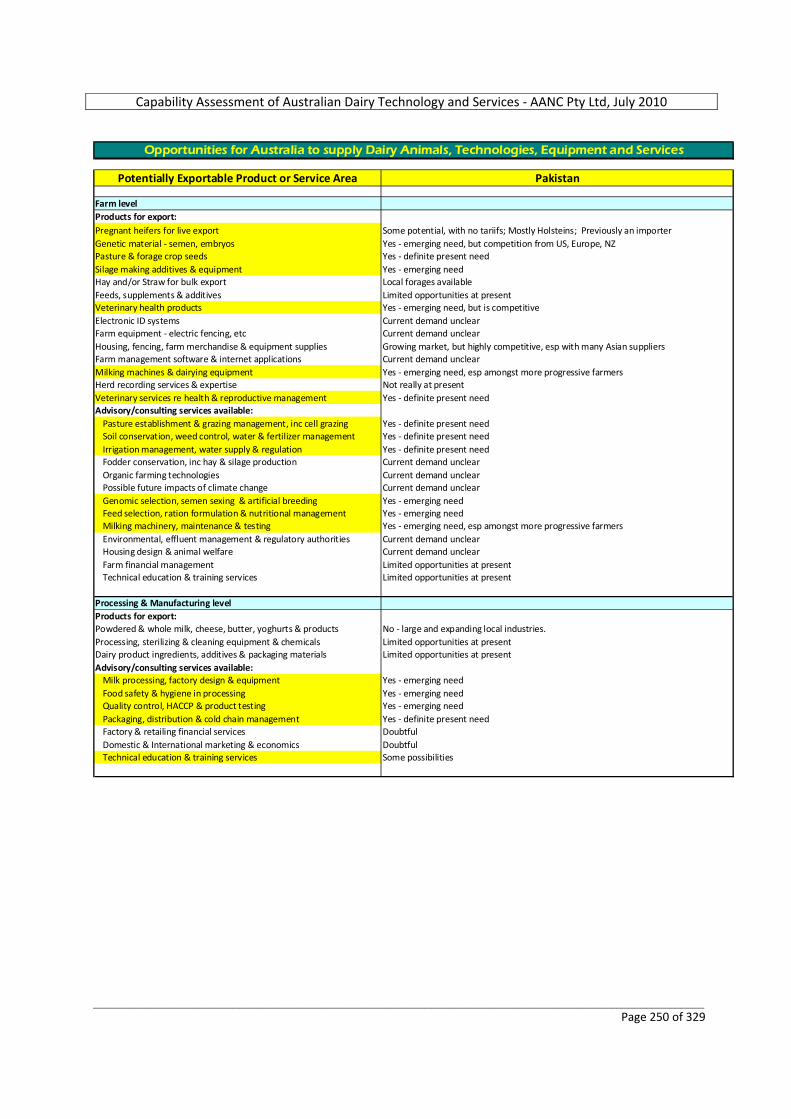
Capability Assessment of Australian Dairy Technology and Services ‐ AANC Pty Ltd, July 2010
_________________________________________________________________________________________________________ Page 250 of 329
Potentially Exportable Product or Service Area Pakistan
Farm levelProducts for export:Pregnant heifers for live export Some potential, with no tariifs; Mostly Holsteins; Previously an importerGenetic material ‐ semen, embryos Yes ‐ emerging need, but competition from US, Europe, NZPasture & forage crop seeds Yes ‐ definite present needSilage making additives & equipment Yes ‐ emerging needHay and/or Straw for bulk export Local forages availableFeeds, supplements & additives Limited opportunities at presentVeterinary health products Yes ‐ emerging need, but is competitiveElectronic ID systems Current demand unclearFarm equipment ‐ electric fencing, etc Current demand unclearHousing, fencing, farm merchandise & equipment supplies Growing market, but highly competitive, esp with many Asian suppliersFarm management software & internet applications Current demand unclearMilking machines & dairying equipment Yes ‐ emerging need, esp amongst more progressive farmersHerd recording services & expertise Not really at presentVeterinary services re health & reproductive management Yes ‐ definite present needAdvisory/consulting services available:
Pasture establishment & grazing management, inc cell grazing Yes ‐ definite present needSoil conservation, weed control, water & fertilizer management Yes ‐ definite present needIrrigation management, water supply & regulation Yes ‐ definite present needFodder conservation, inc hay & silage production Current demand unclearOrganic farming technologies Current demand unclearPossible future impacts of climate change Current demand unclearGenomic selection, semen sexing & artificial breeding Yes ‐ emerging needFeed selection, ration formulation & nutritional management Yes ‐ emerging needMilking machinery, maintenance & testing Yes ‐ emerging need, esp amongst more progressive farmersEnvironmental, effluent management & regulatory authorities Current demand unclearHousing design & animal welfare Current demand unclearFarm financial management Limited opportunities at presentTechnical education & training services Limited opportunities at present
Processing & Manufacturing levelProducts for export:Powdered & whole milk, cheese, butter, yoghurts & products No ‐ large and expanding local industries. Processing, sterilizing & cleaning equipment & chemicals Limited opportunities at presentDairy product ingredients, additives & packaging materials Limited opportunities at presentAdvisory/consulting services available:
Milk processing, factory design & equipment Yes ‐ emerging needFood safety & hygiene in processing Yes ‐ emerging needQuality control, HACCP & product testing Yes ‐ emerging needPackaging, distribution & cold chain management Yes ‐ definite present needFactory & retailing financial services DoubtfulDomestic & International marketing & economics DoubtfulTechnical education & training services Some possibilities
Opportunities for Australia to supply Dairy Animals, Technologies, Equipment and Services
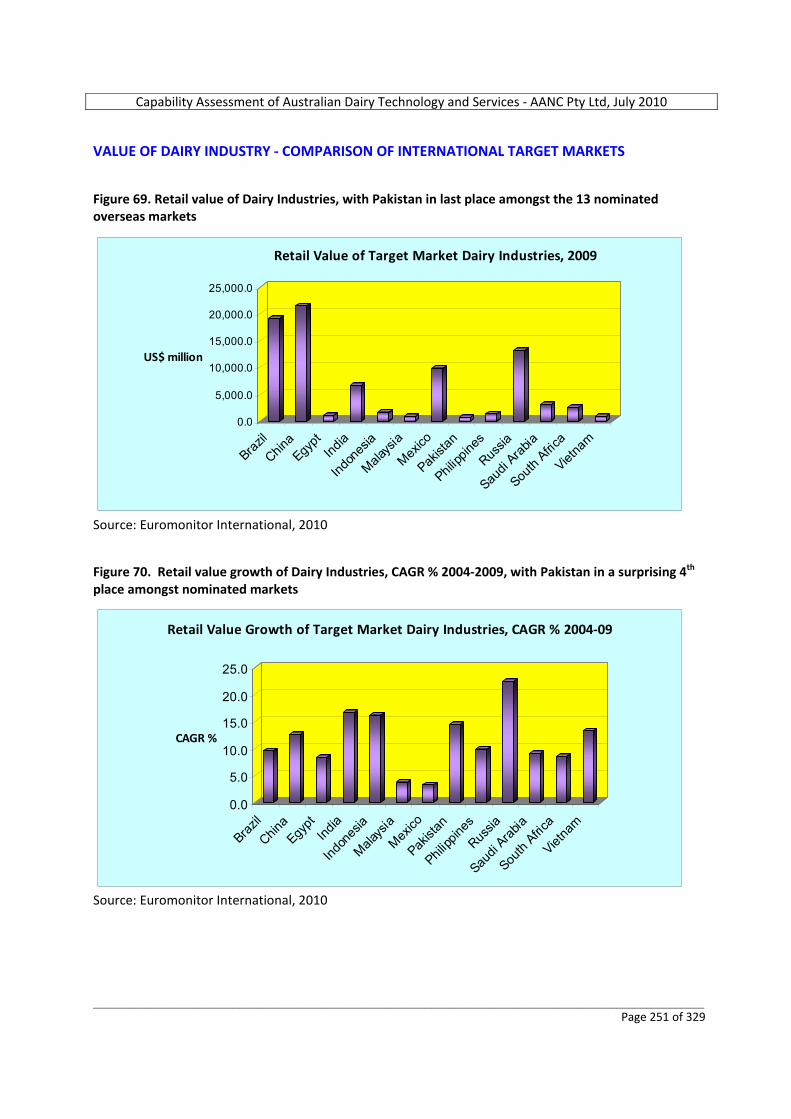
Capability Assessment of Australian Dairy Technology and Services ‐ AANC Pty Ltd, July 2010
_________________________________________________________________________________________________________ Page 251 of 329
VALUE OF DAIRY INDUSTRY ‐ COMPARISON OF INTERNATIONAL TARGET MARKETS Figure 69. Retail value of Dairy Industries, with Pakistan in last place amongst the 13 nominated overseas markets
0.0
5,000.0
10,000.0
15,000.0
20,000.0
25,000.0
US$ million
Brazil
China
Egypt
India
Indon
esia
Malays
ia
Mexico
Pakist
an
Philipp
ines
Russia
Saudi
Arabia
South
Africa
Vietna
m
Retail Value of Target Market Dairy Industries, 2009
Source: Euromonitor International, 2010 Figure 70. Retail value growth of Dairy Industries, CAGR % 2004‐2009, with Pakistan in a surprising 4th place amongst nominated markets
0.0
5.0
10.0
15.0
20.0
25.0
CAGR %
Brazil
China
Egypt
India
Indon
esia
Malays
ia
Mexico
Pakist
an
Philipp
ines
Russia
Saudi
Arabia
South
Africa
Vietna
m
Retail Value Growth of Target Market Dairy Industries, CAGR % 2004‐09
Source: Euromonitor International, 2010

Capability Assessment of Australian Dairy Technology and Services ‐ AANC Pty Ltd, July 2010
_________________________________________________________________________________________________________ Page 252 of 329
Figure 71. Retail Dairy Products Mix for Pakistan, 2009
Pakistan - Market share for Dairy Products, 2009
Other dairy products
1%
Yoghurt and sour milk
drinks0%
Cheese4%
Drinking milk products
95%
Source: Euromonitor International, from trade sources/national statistics PAKISTAN DAIRY INDUSTRY OVERVIEW Business Monitor International (BMI) Pakistan: Agribusiness Report, Q3 2010, Including 5‐year forecasts to 2014, April, 2010 Status of Agricultural Sector While Pakistan is a major producer of several key agricultural commodities, the sector continues to suffer from major inefficiencies. Although the government has taken some important steps towards investing in and modernising key sectors such as dairy, more investment is needed in the country's overburdened infrastructure. For example, expansions in rice production, which could potentially become a major export crop and foreign currency earner, is hindered by poor transport and power infrastructure, which are persistent concerns in Pakistan. Unreliable irrigation and water supply also leaves crops at the mercy of the weather. While growers can put pressure on the government to invest in infrastructure, the current volatile political climate and sagging economy means that such investments will not be a high priority. BMI forecasts real GDP growth to come in at a disappointing 2.4% in 2010 and 2.2% in 2011. Status of Dairy Sector With output of an estimated 35.16 million tonnes in 2009, Pakistan is one of the world's largest milk producers. Despite these high levels of production, the dairy sector is still very underdeveloped with the majority of milk consumed on site or sold informally in the village. However, things are slowly changing and from 2004 to 2009 production rose by 22.8%. Continued investment in the industry saw production rise again in 2009 by 5.1% to 36.96 million MT. The government has begun to pay more attention to the development of the industry over recent years and in 2005 founded the Pakistan Dairy Development Company, commonly known as Dairy Pakistan, a public‐private enterprise tasked with driving change in the country's dairy sector. Investors from the private sector, as well as from foreign countries (the Gulf States in particular) have also been illustrating interest in Pakistan's dairy sector, recognizing strong growth potential opportunities. BMI expects the growth seen over recent years to continue and are forecasting milk production to expand 14.4% from the 2009 level to 40.24 million MT in 2014. Pakistan also has a fairly significant butter production capacity. Output grew by an estimated 11.2% from 2004 to 2009 to reach 623,700 MT. Over our forecast period, BMI expects production to rise by a further 9.2% to 681,200 MT in 2014.
Capability Assessment of Australian Dairy Technology and Services ‐ AANC Pty Ltd, July 2010
_________________________________________________________________________________________________________ Page 253 of 329
Dairy products are an important and relatively affordable source of protein for Pakistanis, particularly in rural areas. From 2004 to 2009, consumption of fluid milk rose 9.8% to an estimated 14.91 million MT. However, about 95% of milk consumed is unpasteurised raw milk, with the associated health risks. Milk is unfortunately also often tampered with in the supply chain. The government is trying to rectify this to improve the quality of milk and reduce the risks associated with its consumption. In towns and cities, despite sufficient production, farms are unable to supply enough high‐quality milk for urban consumers due to poor infrastructure. Pakistan subsequently imports a significant amount of powdered milk, worth around US$500 million a year according to the US Department of Agriculture. SWOT ANALYSIS Business Monitor International (BMI) Pakistan: Agribusiness Report, Q3 2010, Including 5‐year forecasts to 2014, April, 2010 Pakistan Agribusiness Environment SWOT Strengths • Pakistan has one of the most liberal foreign investment regimes in South Asia. One‐hundred percent
foreign equity is permitted in the manufacturing and infrastructure sectors. • Ongoing reform of Pakistan's trade regime is reducing tariff barriers. Duty on capital goods, plant and
machinery not manufactured locally is now just 5%, having earlier been in a range of 5‐25%. • Ongoing structural reforms have strengthened Pakistan's economy, as have fairly buoyant foreign
investment inflows. Real GDP expanded by an average of 7.0% for FY2003/04‐2007/08, although this brisk pace of expansion is unlikely to be sustained over the next few years.
• Pakistan has been labelled a 'major non‐NATO ally' by the United States, thanks to its leading role in the US‐led war on terror. Pakistan's strategic importance ensures that the West maintains an active interest in safeguarding its stability, as reflected in continued pledges of financial support from the 'Friends of Pakistan' group of countries.
• With a large and fertile land area, Pakistan is self‐sufficient or close to in most key agricultural products such as wheat, rice and livestock.
• The government has launched a far‐reaching plan to improve Pakistan's vast but woefully under developed dairy industry.
Weaknesses • Agriculture is very undeveloped with most farms very small and yields low. The poor knowledge of
many of Pakistan's small farmers puts the country's agriculture at risk of disease outbreaks such as Avian Influenza which plagued the poultry sector through the first half of 2008.
• Infrastructure is poor and struggling to cope with the increases in production necessary to meet the needs of the country's growing population.
• Bureaucratic delays and widespread corruption are key concerns for investors looking to do business. • Intellectual property rights are poorly enforced. Pakistan, a leading producer of counterfeit goods,
remains on the Office of the US Trade Representative's Priority 301 Watch List. • Pakistan suffers from chronic trade and fiscal deficits, and has a low level of foreign currency reserves.
This leaves the economy vulnerable to external shocks and dependent on aid and loans from multilateral institutions and bilateral partners.
• Despite rapid economic growth in recent years, Pakistan's population remains poor. The IMF estimates per capita income at US$995 in 2008, or US$2,754 in purchasing power parity terms.
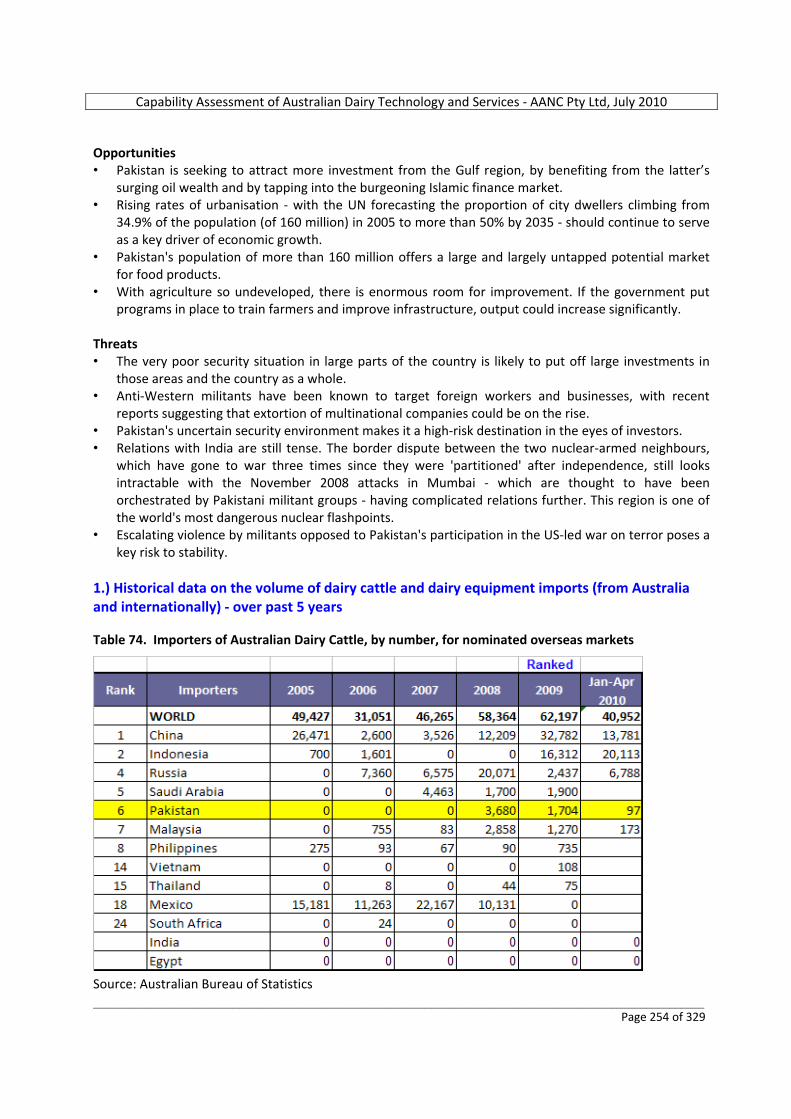
Capability Assessment of Australian Dairy Technology and Services ‐ AANC Pty Ltd, July 2010
_________________________________________________________________________________________________________ Page 254 of 329
Opportunities • Pakistan is seeking to attract more investment from the Gulf region, by benefiting from the latter’s
surging oil wealth and by tapping into the burgeoning Islamic finance market. • Rising rates of urbanisation ‐ with the UN forecasting the proportion of city dwellers climbing from
34.9% of the population (of 160 million) in 2005 to more than 50% by 2035 ‐ should continue to serve as a key driver of economic growth.
• Pakistan's population of more than 160 million offers a large and largely untapped potential market for food products.
• With agriculture so undeveloped, there is enormous room for improvement. If the government put programs in place to train farmers and improve infrastructure, output could increase significantly.
Threats • The very poor security situation in large parts of the country is likely to put off large investments in
those areas and the country as a whole. • Anti‐Western militants have been known to target foreign workers and businesses, with recent
reports suggesting that extortion of multinational companies could be on the rise. • Pakistan's uncertain security environment makes it a high‐risk destination in the eyes of investors. • Relations with India are still tense. The border dispute between the two nuclear‐armed neighbours,
which have gone to war three times since they were 'partitioned' after independence, still looks intractable with the November 2008 attacks in Mumbai ‐ which are thought to have been orchestrated by Pakistani militant groups ‐ having complicated relations further. This region is one of the world's most dangerous nuclear flashpoints.
• Escalating violence by militants opposed to Pakistan's participation in the US‐led war on terror poses a key risk to stability.
1.) Historical data on the volume of dairy cattle and dairy equipment imports (from Australia and internationally) ‐ over past 5 years Table 74. Importers of Australian Dairy Cattle, by number, for nominated overseas markets
Source: Australian Bureau of Statistics
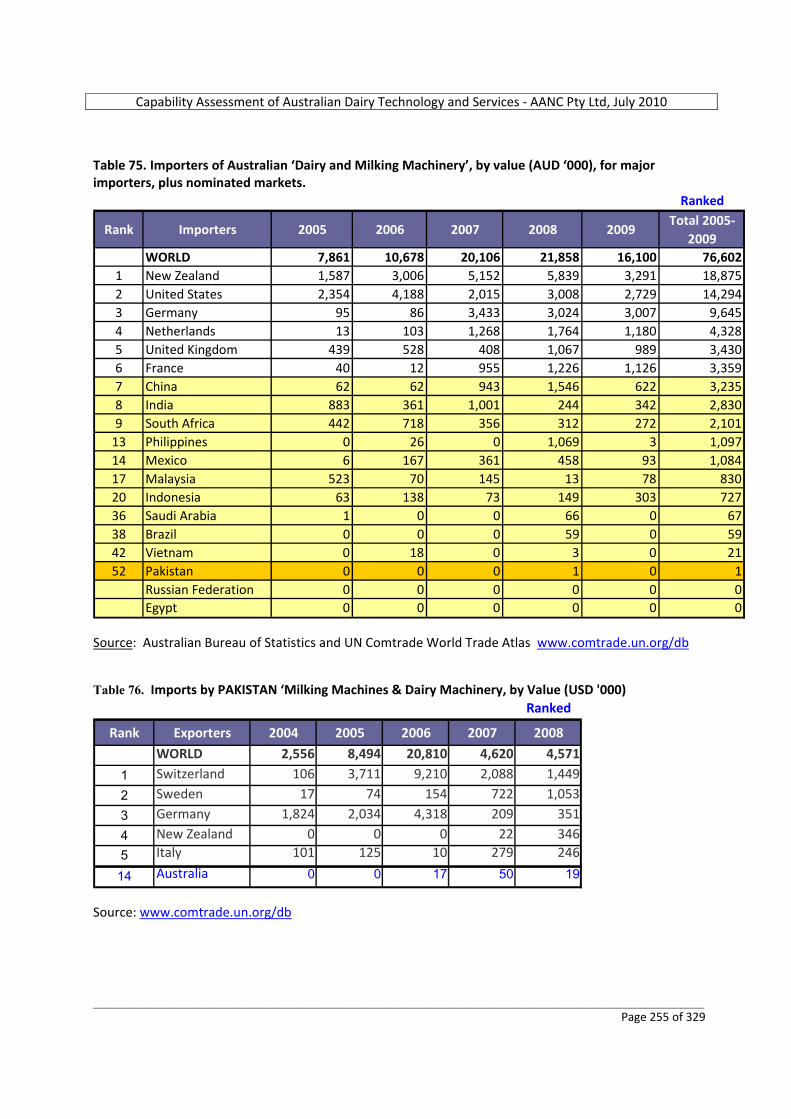
Capability Assessment of Australian Dairy Technology and Services ‐ AANC Pty Ltd, July 2010
_________________________________________________________________________________________________________ Page 255 of 329
Table 75. Importers of Australian ‘Dairy and Milking Machinery’, by value (AUD ‘000), for major importers, plus nominated markets.
Ranked
Rank Importers 2005 2006 2007 2008 2009Total 2005‐
2009WORLD 7,861 10,678 20,106 21,858 16,100 76,602
1 New Zealand 1,587 3,006 5,152 5,839 3,291 18,8752 United States 2,354 4,188 2,015 3,008 2,729 14,2943 Germany 95 86 3,433 3,024 3,007 9,6454 Netherlands 13 103 1,268 1,764 1,180 4,3285 United Kingdom 439 528 408 1,067 989 3,4306 France 40 12 955 1,226 1,126 3,3597 China 62 62 943 1,546 622 3,2358 India 883 361 1,001 244 342 2,8309 South Africa 442 718 356 312 272 2,101
13 Philippines 0 26 0 1,069 3 1,09714 Mexico 6 167 361 458 93 1,08417 Malaysia 523 70 145 13 78 83020 Indonesia 63 138 73 149 303 72736 Saudi Arabia 1 0 0 66 0 6738 Brazil 0 0 0 59 0 5942 Vietnam 0 18 0 3 0 2152 Pakistan 0 0 0 1 0 1
Russian Federation 0 0 0 0 0 0Egypt 0 0 0 0 0 0
Source: Australian Bureau of Statistics and UN Comtrade World Trade Atlas www.comtrade.un.org/db Table 76. Imports by PAKISTAN ‘Milking Machines & Dairy Machinery, by Value (USD '000)
Ranked
Rank Exporters 2004 2005 2006 2007 2008
WORLD 2,556 8,494 20,810 4,620 4,571
1 Switzerland 106 3,711 9,210 2,088 1,449
2 Sweden 17 74 154 722 1,053
3 Germany 1,824 2,034 4,318 209 351
4 New Zealand 0 0 0 22 346
5 Italy 101 125 10 279 246
14 Australia 0 0 17 50 19
Source: www.comtrade.un.org/db
Capability Assessment of Australian Dairy Technology and Services ‐ AANC Pty Ltd, July 2010
_________________________________________________________________________________________________________ Page 256 of 329
2.) Regulatory environment and import protocols for dairy cattle by the regulating authority (including specific protocols with Australia) FOR GENERAL ADVICE REGARDING THE REGULATION OF EXPORTS FROM AUSTRALIA:
Australian Customs and Border Protection Service, Canberra City, ACT. http://www.customs.gov.au
FOR FOREIGN AFFAIRS, IMPORT TRADE PROTOCOLS/REGULATIONS AND WEB LINKAGES TO FOREIGN EMBASSIES IN COUNTRIES TO WHICH EXPORTS ARE INTENDED:
Australian Department of Foreign Affairs and Trade, Barton, ACT. http://www.dfat.gov.au/embassies/Pakistan
FOR SPECIFIC ADVICE REGARDING THE PREPARATION, SHIPPING OR AIR‐FREIGHTING OF LIVE ANIMALS AND LIVE ANIMALS TRADE ISSUES IN DESTINATION FOREIGN COUNTRIES:
LiveCorp Ltd, North Sydney, NSW. http://www.livecorp.com.au
FOR SPECIFIC ADVICE REGARDING PROTOCOLS FOR THE EXPORT OF LIVE ANIMALS (OR ANIMAL‐DERIVED PRODUCTS SUCH AS SEMEN AND EMBRYOS) FROM AUSTRALIA AND IMPORT PROTOCOLS IN DESTINATION FOREIGN COUNTRIES:
Australian Quarantine and Inspection Service (AQIS), Canberra City, ACT. http://www.aqis.gov.au
Specific Pakistan information: Austrade Offshore Office: There is a dairy cattle export protocol in place between Australia and Pakistan. (AQIS Cattle Breeder protocol for Pakistan, updated 5 Feb 2004.) Currently, there is 0% Customs Duty on imports of dairy cattle and other livestock. Import duties on processing and laboratory equipment have also been reduced. 3.) Investment environment for dairy operations (domestic and foreign assistance, tax incentives, export zones, etc) and examples of FDI (from any country) Austrade Offshore Office: Currently there are no FDI examples in the dairy & livestock sector in Pakistan. The investments to date are from the Pakistani corporates. The Government of Pakistan had announced various incentives to establish dairy farms, organise milk collection for poverty allivation, etc. For more details, see: http://lddb.org.pk/index.php?link=lsp
Capability Assessment of Australian Dairy Technology and Services ‐ AANC Pty Ltd, July 2010
_________________________________________________________________________________________________________ Page 257 of 329
o The Government of Pakistan has announced tax incentives in the shape of imports of dairy cattle under H.S code 0102‐9010. There is 0% Customs Duty on imports of dairy cattle and other livestock. Import duty on processing and laboratory equipment had also been reduced. H.S code 8421‐1100 Cream separators. For more details, see: http://www.fbr.gov.pk/newcu/TARIFF/2010/CustTarChap1‐972011.pdf
o Nestle Pakistan had imported dairy cattle in 2007, but that too on behalf of 90 importers. They
distributed these to newly established dairy farmers. o In 2008, an Investment Conference for dairy livestock sector development was organised by MAP
services in Dubai and the following investment groups based in Middle East and UAE: Al Rabi, Abraaj, Ulker and Pinar. They visited several sites, milk processing units, dairy farms and also retailer operations. Abraaj, Pinar and Ulker showed interest in the dairy sector. Contact person for MAP is: Ms. Huma Fakhar, Managing Partner MAP Services Group, Partner Bridge Capital [email protected] (A Venture Capital Company) Geneva Lahore Dubai Bahrain Ph +92‐321‐4164000 (Pakistan); Ph +97‐3‐36432710 (Bahrain).
4.) National government programs to assist with the development of dairy operations Austrade Offshore Office: Pakistan Dairy Development Company (PDDC or, as it is commonly known, “Dairy Pakistan”) has been established to drive the development of the Pakistan dairy sector. Dairy Pakistan is a Public‐Private sector joint initiative to bring about structural long term change in the dairy industry in Pakistan. PDDC was established under the Ministry of Industries in 2005. http://www.pddc.com.pk/index.php One of the major contributions of PDDC is a research paper on the Pakistan dairy industry called “White revolution”. http://www.pddc.com.pk/DairyPakistan‐Publication.pdf Business Monitor International (BMI) Pakistan: Agribusiness Report, Q3 2010, Including 5‐year forecasts to 2014, April, 2010 White revolution The government has in recent years started to move on reforming the industry, both to improve the profitability of dairy production thereby helping to reduce rural poverty, and to bring safe, high‐quality milk to the 95% of the population who cannot access processed milk products. Plans for how this could be achieved were outlined in a White Paper named ‘White Revolution’ released in June 2006. The paper outlines plans for the sector to 2015, including increasing milk production to 40 billion litres a year, bringing 40% of milk production into the formal processing channel and bringing access to cheap pasteurised milk to 70% of the population. These developments should allow producers to rise above subsistence‐level farming and improve the quality of products so exports can begin. Stage One
Capability Assessment of Australian Dairy Technology and Services ‐ AANC Pty Ltd, July 2010
_________________________________________________________________________________________________________ Page 258 of 329
Dairy Pakistan has divided its projects to achieve these goals into three stages. In the first stage, now well underway, Dairy Pakistan is aiming to provide 6,330 cooling tanks to farmers and milk collectors to allow milk to be stored safely without having to resort to using ice or preservatives. The tanks will be sold to stakeholders who are given interest‐free loans for up to 90% of the cost. Also in the first stage of projects are the creation of 'model farms' from existing dairy farms to spread technology and expertise. In June 2009, Dairy Pakistan said that it had upgraded a total of 800 farms to model farms. Most farms approved will have less than 20 animals, reflecting the average size of Pakistani dairy farms. Some of the funding for the project will come from overseas investors. Stage Two The second stage includes plans to group poorer farmers together in community farms to allow better access to training and equipment, bulk vending of pasteurised milk (here milk is not packaged before distribution and sale but sold by retail outlets with refrigerated storage capacity to consumers who bring their own containers), and the creation of 'rural entrepreneurs' who will own equipment and contract it out to farms to avoid every small farm having to invest large sums in their own equipment. Stage Three Stage three, scheduled to begin next decade, outlines plans for the development of biogas, the introduction of small motorbike or auto‐rickshaw‐size milk collection units, and the protection of indigenous breeds of cattle. If all goes to plan, the White Revolution should be able to unlock the huge potential of Pakistan's dairy industry. Dairy companies stand to benefit greatly if the project's goals can be realised. With only 3‐4% of milk now being sold through formal channels, companies are missing out on the vast potential market of Pakistan's population of more than 160 million. Pakistan: 10 bln interest free loans for livestock, dairy sectors Plus News Pakistan. 24 April 2010 FAISALABAD: The federal government has evolved a comprehensive strategy for the development of the Dairy and Livestock sectors in the country to augment meat and milk production. A spokesman for the Food, Agriculture and Livestock Department told media that under this program, PKR 10 billion (US$110 million) have been earmarked for the project and a summery has been moved to the Ministry of Finance for the release of funds. He said that for promotion and boosting the livestock and dairy sectors in Pakistan, soft loans without any interest would be provided to the animal breeders. The government would encourage interested parties to setup livestock and dairy farms of at least 1,000 animals. He said the government would also encourage the private sector to import high quality cows for further breeding. The spokesman said that the country is in dire need of quality meat and milk and added that with the establishment of a chain of livestock and dairy farms, the trend of escalating prices of meat and milk would be checked. Austrade Offshore Office: The Ministry of Food, Agriculture & Livestock is mainly responsible for policy formulation, economic coordination and planning in respect of food grain, agriculture & livestock. It also includes procurement of food grains, fertilizer, import price stabilization of agriculture produce, international liaison, economic studies for framing agricultural policies, fishing and fisheries beyond territorial waters, animal quarantine, etc. http://minfal.gov.pk
Capability Assessment of Australian Dairy Technology and Services ‐ AANC Pty Ltd, July 2010
_________________________________________________________________________________________________________ Page 259 of 329
The Government of Punjab had recently announced farms of 500 acre size each in the Cholistan region of the Bhawalpur district to establish dairy farms. The Punjab Government is looking for FDI in this sector from Middle East based groups to establish dairy farms. For more details, see: www.pbit.gop.pk 5.) Existing or proposed external assistance programs to develop the industry (foreign government and/or aid programs) Austrade Offshore Office: o Currently there is a Government of Australia's Agriculture Sector Linkages Program (ASLP). Under this
program, Austrade have taken the lead to develop the dairy sector of Pakistan through successful buyer visits, and in 2007 organised a dairy mission to Pakistan. http://www.aciar.gov.au/web.nsf/doc/ACIA‐6TZ8CH
o USAID and other donor agencies have provided funding in Agri sector reforms projects and social
sectors development. USAID, with FAO as project partner, is working on a US$ 15 million project to “Improve agricultural practices in Baluchistan”. This project has a component for dairy & livestock breed improvement, animal husbandry and feed & rangeland management. http://www.adb.org/Pakistan/main.asp http://www.usaid.gov/pk/sectors/growth/ http://www.usaid.gov/pk/sectors/growth/iapb.html
6.) Overview of the typical dairy farming arrangements Business Monitor International (BMI) Pakistan: Agribusiness Report, Q3 2010, Including 5‐year forecasts to 2014, April, 2010 The Pakistani dairy industry is still extremely undeveloped. About 70% of all milk produced is consumed by the producers or sold informally in the village. Of the remaining 30%, only around 3‐4% is processed, with the remainder sold as raw milk through traditional marketing channels or used to make sweets or ghee. Production of milk is very fragmented. According to the 2006 Livestock Census: Farms with only one or two animals make up 43% of all dairy farms, and account for around 15% of
the nation's total cow and buffalo herd, Farms with 3 or 4 animals make up a further 28% of farms and 20% of animals, Large farms with a herd of 50 or more make up only around 0.2% of all farms and 9.9% of animals.
Pakistan's cities are supplied with milk from urban or peri‐urban farms which have sprung up around all of the country's major cities. Many of these are grouped together in 'colonies' with the largest, Landhi Dairy Colony outside Karachi, containing over 1,000 farms and 300,000 animals. Of the 3‐4% of total milk production that does enter the formal marketing channels, most is processed as UHT milk. However, because of the high price and limited supply outlets, the government estimates that only around 5% of the population are able to afford these products.
Capability Assessment of Australian Dairy Technology and Services ‐ AANC Pty Ltd, July 2010
_________________________________________________________________________________________________________ Page 260 of 329
7.) Brief overview of major companies with integrated dairy operations Austrade Offshore Office: The following are the major dairy companies in Pakistan with integrated dairy operations: o Nestle Pakistan: Is the largest milk processing company in Pakistan. They are the brand leaders with
“Nestle Milkpak”. http://www.nestle.pk/brands/nestle‐milkpak.aspx The company owns and operates its own dairy farm facility at “Sarsabaz dairy farm” in the Okara district of Punjab. Nestle provides training to dairy farmers at this facility to understand the dairy farm operations. The company has the largest supply chain for the milk collection and farmer services. http://www.nestle.pk/index/milk‐collection.aspx http://www.nestle.pk/index/agri‐services.aspx
o Engro Food Limited: This is the second largest milk processing and marketing company in Pakistan now. Its fairly young company with a strong branding of “Olper’s”. http://www.engro.com/our‐businesses/engro‐foods‐limited/ Engro food owns a dairy farm as well at its Sukkur Milk plant, Sindh.
o Haleeb Foods Limited: Is one of the major dairy processing company in Pakistan.
http://haleebfoods.com/haleeb/ Other players in the market are: o Nurpur Foods: www.nurpurfoods.com/home.htm o Millac Foods Pakistan: http://www.millacfoods.com/aboutus.html o At‐Tahur dairy: Its brand Prema is made from 100% pure Australian Cow's milk sourced from our own
state‐of‐the‐art dairy farms. http://www.at‐tahur.com o J.K Dairies: It is the first modern Dairy Farm in the private sector. At present the herd consists of 1500
Friesian, Jersey & AFS imported cows. It is principally engaged in production and supply of milk. The company market pasteurized milk in bottles. http://jdw‐group.com/AboutJDW.html
o Lahore Milk Plant: This is a farmer cooperative, with a milk pasteurization plant. The brand name is
“Halla”. The facility was funded by the German aid program GTZ. Other dairy companies looking for international partners are: o Sapphire Dairies Pty Limited Lahore: This is a project of the multi million dollar Sapphire group.
www.sapphire.com.pk They have a herd of over 1000 Australia cattle. They are looking for an integrated partner.
o Ever Fresh Farms Limited: This is a project of Shafi Tannery Group, the largest leather processing
company in Pakistan. The herd size is over 1000 Australian cattle. They are looking for an international milk processing company for processing. www.everfresh.com.pk
Capability Assessment of Australian Dairy Technology and Services ‐ AANC Pty Ltd, July 2010
_________________________________________________________________________________________________________ Page 261 of 329
Business Monitor International (BMI) Pakistan: Agribusiness Report, Q3 2010, Including 5‐year forecasts to 2014, April, 2010 In February and March 2009, Nestlé Pakistan working in collaboration with the government Agribusiness Support Fund held a training course in modern dairy farm management for 24 officers from the Livestock and Dairy Development Board. Since entering the market, the company has also invested in regional milk collection systems to cut down the distance farmers travel to deliver their milk, and has also trained farmers in modern techniques, providing technical assistance. Tetra Pak is the latest multinational to commit to the development of Pakistan's dairy sector. In June 2009, the company announced the signing of a memorandum of understanding with local company Engro Foods to create a dairy hub in the Sahiwal district of the Punjab. The hub will serve 15 villages in the district and aims to promote more efficient production and bring smallholders into the formal dairy market chain. The ongoing interest of private companies is vital if the sector is to fulfill its potential. BMI see both the increased government and private investments as very positive signs for Pakistan's dairy sector. 8.) Availability of forage and raw materials for feed & nutrition FAO, Country Pasture/Forage Resource Profiles ‐ Pakistan Dr. Dr. Dost Muhammad, November, 2002 The livestock population in Pakistan is supported by feed resources derived mainly from crops, fodder, rangelands and other grazing areas, and from agro‐industrial by‐products. It has been estimated that existing feed resources are severely deficient in total digestible nutrients and crude protein. The overall situation of feed resources available through various sources in Pakistan has been summarized as below: o 70–80 % of digestible protein comes from grazing, wheat straw, maize, and millet stalks. o Present feed resources permit animals to achieve only 40‐50 % of their inherent productive capacity. o Major feed resources in Pakistan are distributed as follows:
Grazing and crop residues 75 % (crop residues are largely comprised of wheat straw, dry maize, millet, and sorghum stalks),
Hay and haylage 22 %, Oil cakes, meals, animal protein < 1 %, After harvest grazing and food waste 2 %.
FAO researchers in 1987 suggested a critical stocking rate of 16 ha/animal unit for low potential rangeland areas of Pakistan. At present, many rangelands are producing only 10 to 15 % of their potential. There is a need for this low productivity to be improved by adopting management practices such as periodic closures, re‐seeding, and improved grazing management. Pastures in irrigated areas In irrigated areas, cut‐and‐carry feeding plays a vital role in ruminant production. Usually milking buffaloes and cows are stall‐fed with green fodder and concentrates. The non‐milking and draught animals are maintained on straws, maize stovers, and community grazing lands. During summer, most land is planted with sorghum, maize, cotton, rice, and sugarcane. Forage sorghum, millet, and maize provide the bulk of fodder for stall‐feeding. During winter, farmers plant mixtures of Egyptian clover and oats. Mixtures of berseem clover with rice and wheat straw also provide feed during winter. Other crop
Capability Assessment of Australian Dairy Technology and Services ‐ AANC Pty Ltd, July 2010
_________________________________________________________________________________________________________ Page 262 of 329
residues such as dry maize and sorghum stalks, sugar cane tops, and rice stubble are also a component of livestock diets. With the increased demand for milk, meat, and other dairy products, some farmers cultivate large areas with lucerne, berseem clover, oats, maize, and sorghum around the big cities and sell green fodder to farmers raising buffaloes and dairy cows. Urban cattle also graze on vegetable and fruit wastes. Pastures in rain‐fed areas Nearly 24 % of the vast rain‐fed tract of the country is unfit for agronomic or forestry crops due to unfavourable soil or climatic conditions. Livestock grazing is the only viable activity. However, natural grazing on these vast rangelands provides only around 20 % of the nutritional requirements of cattle and 60% of that of sheep and goats. They have been badly over‐grazed, and palatable species of grass have been largely replaced by weed species. The carrying capacity of rangelands has thus been greatly reduced to 10 to 50 % of their potential. In large parts of the Barani areas during winter, the wheat and barley crops have admixtures of rapeseed, chickpeas, and mustards. The summer crops have admixtures of maize, millets, sorghum, and guar. Some part of every crop is fed to livestock. USDA Foreign Agricultural Service. Global Agricultural Information Network. GAIN Report Number: N/A Date 4/16/2010 Pakistan – Feed and Grain Annual 2010 Wheat is Pakistan’s most important agricultural crop, grown by about 80 % of all farmers, on close to 40 % of the total cultivated area. Pakistan wheat production in 2010/11 is forecast to decrease about 6 % relative to last year’s record harvest of 24 million MT due to lower rainfall and less availability of irrigation water. While Pakistan’s wheat supply situation remained relatively stable throughout 2009/10, wheat and flour prices remained 30 % above international levels. The Government of Pakistan currently maintains a ban on wheat exports and imports. Rice is the third largest crop in Pakistan (after wheat and cotton), and is grown under diverse climatic conditions. Rice is not a staple food in Pakistan. Traditionally about 45 % of the crop is used for local consumption, with the balance exported. Rice is Pakistan’s second largest export revenue earner after textiles. Pakistan rice production in 2009/2010 is estimated at 6.5 million MT, slightly less then last year’s record production of 6.7 million MT. 9.) Availability of Artificial Insemination laboratories and testing facilities for cattle; also veterinary services Austrade Offshore Office: o The main player in Pakistan for artificial insemination is Profarm Pakistan Limited. This company is a
success story in a short span of time and is providing quality semen of proven dairy bulls at a reasonable price. http://www.profarm.com.pk/alliances.htm Profarm partners in the program are The Blue Link and CRV Holdings.
Capability Assessment of Australian Dairy Technology and Services ‐ AANC Pty Ltd, July 2010
_________________________________________________________________________________________________________ Page 263 of 329
o There are testing and AI facilities available from the Government of Punjab Livestock Department and the Federal government as well. However, the quality of semen has always been an issue. The semen imported by various importers in the private sector is sometimes of low quality and from un‐proven bulls. The Punjab Government has its own Veterinary Research Institute in Lahore. http://pportal.punjab.gov.pk/portal/portal/mediatype/html/group/357;jsessionid=0a00000230d78307c16db5884a82896283bad5bc0ebd.e34Ma3iPcheLci0LchyMaN4Pbi1ynknvrkLOlQzNp65In0/page/default.psml?nav=home http://aciar.gov.au/system/files/node/740/Vaccine+review+report+June+2008.pdf
10.) Agribusiness educational facilities to support dairy production Austrade Offshore Office: The main Agri education facilities in Pakistan to support dairy production activities are: o University of Agriculture Faisalabad. www.uaf.edu.pk o University of Veterinary & Animal Sciences, Lahore. www.uvas.edu.pk o NWFP University of Agriculture, Peshawar. www.aup.edu.pk o University of Arid Agriculture, Rawalpindi. www.uaar.edu.pk o Sindh Agriculture University, Tando Jam. www.sau.edu.pk o National Agriculture Research Centre, Islamabad. o Range Research Institute NARC, Islamabad. o Barani Agriculture Research Institute, (BARI), Chakwal, Punjab. o Fodder Research Institute, (FRI), Sargodha, Punjab. o Arid Zone Research Institute (AZRI) Quetta, Balochistan. 11.) Dairy consumption trends (past 5 years) Business Monitor International (BMI) Pakistan: Agribusiness Report, Q3 2010, Including 5‐year forecasts to 2014, April, 2010 Dairy products are quite important in Pakistanis, especially in rural areas. From 2004 to 2009, consumption of fluid milk rose 9.8% to an estimated 14.91 million MT. BMI expects this level of growth to continue to 2014 and are forecasting consumption to rise by 10.5% to 16.48 million MT. Consumption growth will be driven by rising incomes and population growth, as well as increased access to good‐quality milk. Demand for butter has also been increasing in recent years, and consumption grew 11.2% from 2004 to 2009 to an estimated 623,700 MT. BMI forecasts growth of 14.9% to 716,400 MT by 2014.
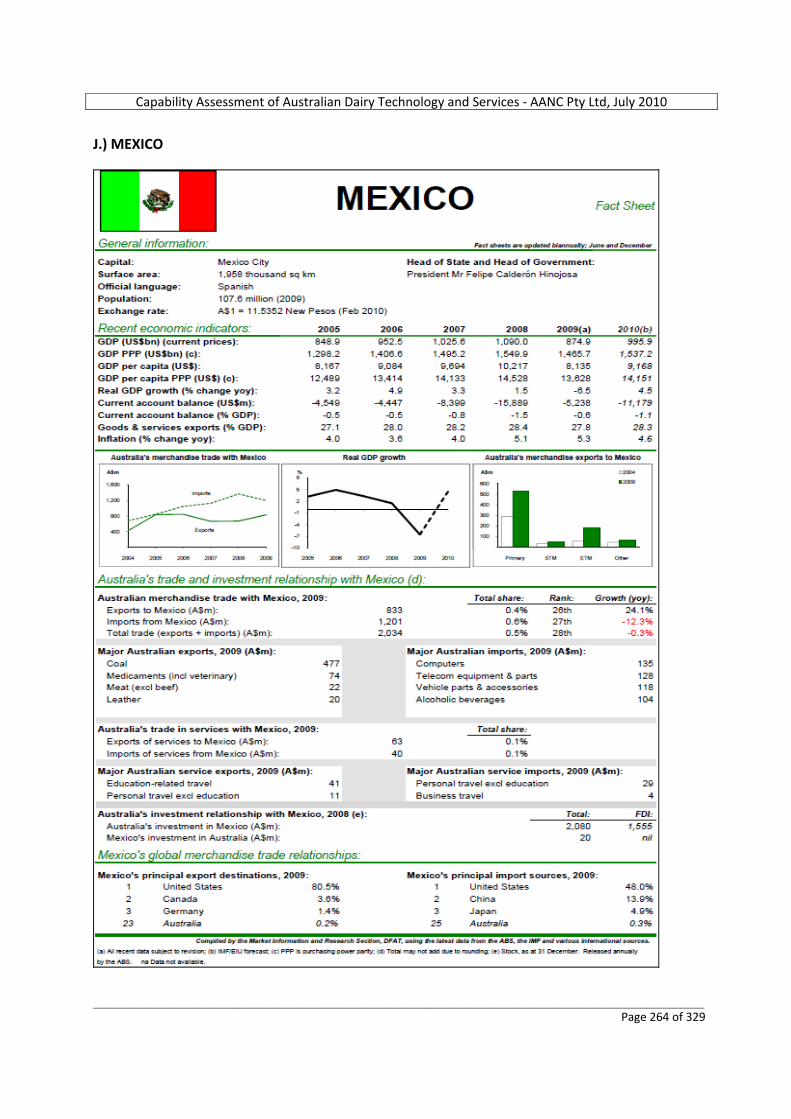
Capability Assessment of Australian Dairy Technology and Services ‐ AANC Pty Ltd, July 2010
_________________________________________________________________________________________________________ Page 264 of 329
J.) MEXICO
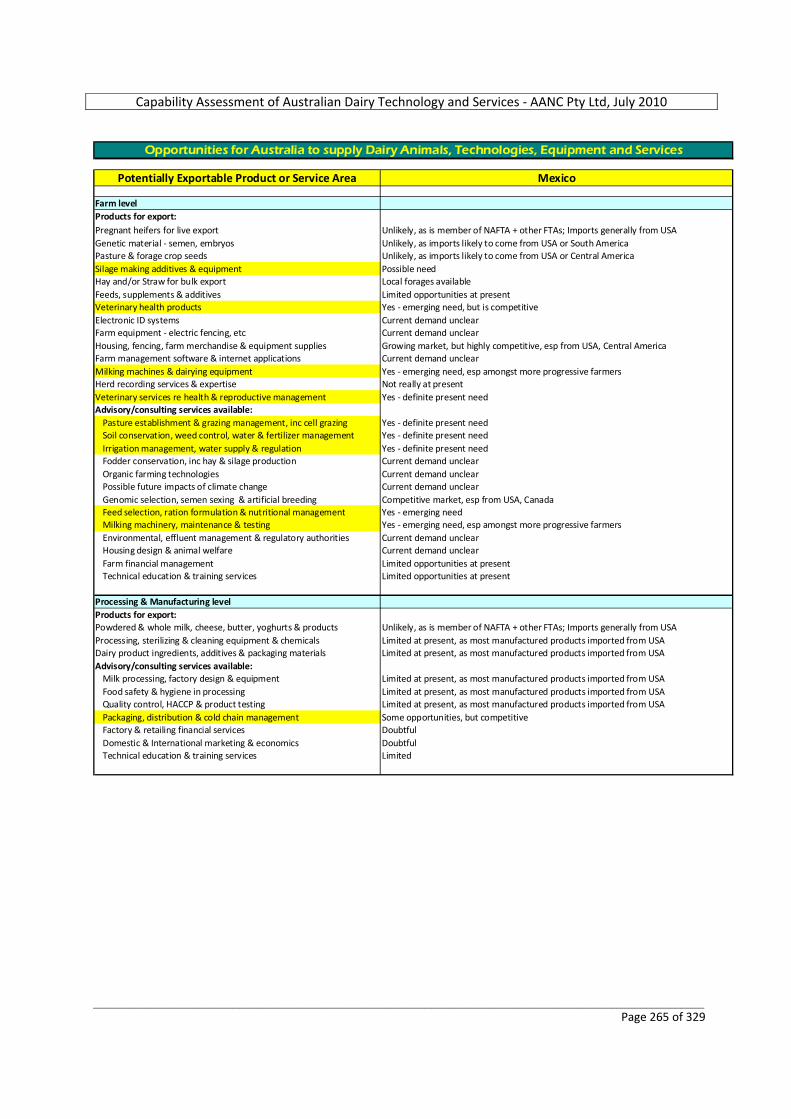
Capability Assessment of Australian Dairy Technology and Services ‐ AANC Pty Ltd, July 2010
_________________________________________________________________________________________________________ Page 265 of 329
Potentially Exportable Product or Service Area Mexico
Farm levelProducts for export:Pregnant heifers for live export Unlikely, as is member of NAFTA + other FTAs; Imports generally from USAGenetic material ‐ semen, embryos Unlikely, as imports likely to come from USA or South AmericaPasture & forage crop seeds Unlikely, as imports likely to come from USA or Central AmericaSilage making additives & equipment Possible needHay and/or Straw for bulk export Local forages availableFeeds, supplements & additives Limited opportunities at presentVeterinary health products Yes ‐ emerging need, but is competitiveElectronic ID systems Current demand unclearFarm equipment ‐ electric fencing, etc Current demand unclearHousing, fencing, farm merchandise & equipment supplies Growing market, but highly competitive, esp from USA, Central AmericaFarm management software & internet applications Current demand unclearMilking machines & dairying equipment Yes ‐ emerging need, esp amongst more progressive farmersHerd recording services & expertise Not really at presentVeterinary services re health & reproductive management Yes ‐ definite present needAdvisory/consulting services available:
Pasture establishment & grazing management, inc cell grazing Yes ‐ definite present needSoil conservation, weed control, water & fertilizer management Yes ‐ definite present needIrrigation management, water supply & regulation Yes ‐ definite present needFodder conservation, inc hay & silage production Current demand unclearOrganic farming technologies Current demand unclearPossible future impacts of climate change Current demand unclearGenomic selection, semen sexing & artificial breeding Competitive market, esp from USA, CanadaFeed selection, ration formulation & nutritional management Yes ‐ emerging needMilking machinery, maintenance & testing Yes ‐ emerging need, esp amongst more progressive farmersEnvironmental, effluent management & regulatory authorities Current demand unclearHousing design & animal welfare Current demand unclearFarm financial management Limited opportunities at presentTechnical education & training services Limited opportunities at present
Processing & Manufacturing levelProducts for export:Powdered & whole milk, cheese, butter, yoghurts & products Unlikely, as is member of NAFTA + other FTAs; Imports generally from USAProcessing, sterilizing & cleaning equipment & chemicals Limited at present, as most manufactured products imported from USADairy product ingredients, additives & packaging materials Limited at present, as most manufactured products imported from USAAdvisory/consulting services available:
Milk processing, factory design & equipment Limited at present, as most manufactured products imported from USAFood safety & hygiene in processing Limited at present, as most manufactured products imported from USAQuality control, HACCP & product testing Limited at present, as most manufactured products imported from USAPackaging, distribution & cold chain management Some opportunities, but competitiveFactory & retailing financial services DoubtfulDomestic & International marketing & economics DoubtfulTechnical education & training services Limited
Opportunities for Australia to supply Dairy Animals, Technologies, Equipment and Services

Capability Assessment of Australian Dairy Technology and Services ‐ AANC Pty Ltd, July 2010
_________________________________________________________________________________________________________ Page 266 of 329
VALUE OF DAIRY INDUSTRY ‐ COMPARISON OF INTERNATIONAL TARGET MARKETS Figure 72. Retail value of Dairy Industries, with Mexico running 4th amongst the 13 nominated overseas markets
0.0
5,000.0
10,000.0
15,000.0
20,000.0
25,000.0
US$ million
Brazil
China
Egypt
India
Indon
esia
Malays
ia
Mexico
Pakist
an
Philipp
ines
Russia
Saudi
Arabia
South
Africa
Vietna
m
Retail Value of Target Market Dairy Industries, 2009
Source: Euromonitor International, 2010 Figure 73. Retail value growth of Dairy Industries, CAGR % 2004‐2009, with Mexico in last place amongst nominated markets
0.0
5.0
10.0
15.0
20.0
25.0
CAGR %
Brazil
China
Egypt
India
Indon
esia
Malays
ia
Mexico
Pakist
an
Philipp
ines
Russia
Saudi
Arabia
South
Africa
Vietna
m
Retail Value Growth of Target Market Dairy Industries, CAGR % 2004‐09
Source: Euromonitor International, 2010
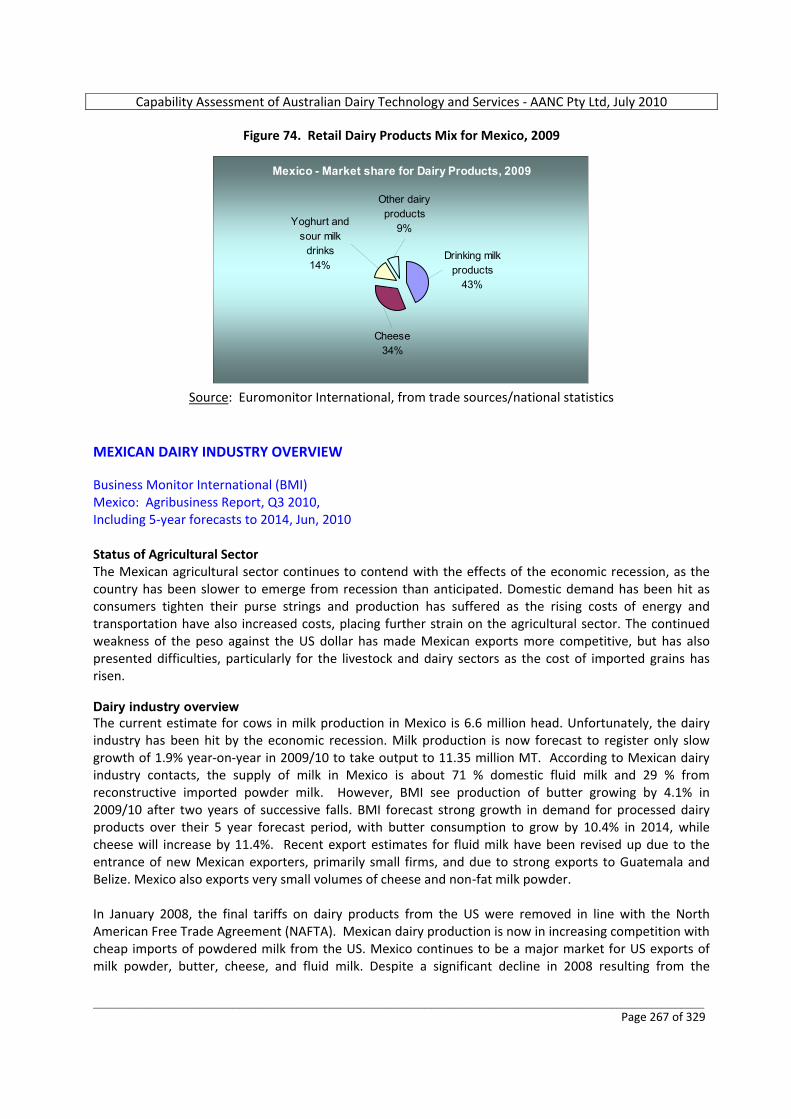
Capability Assessment of Australian Dairy Technology and Services ‐ AANC Pty Ltd, July 2010
_________________________________________________________________________________________________________ Page 267 of 329
Figure 74. Retail Dairy Products Mix for Mexico, 2009
Mexico - Market share for Dairy Products, 2009
Drinking milk products
43%
Cheese34%
Yoghurt and sour milk
drinks14%
Other dairy products
9%
Source: Euromonitor International, from trade sources/national statistics
MEXICAN DAIRY INDUSTRY OVERVIEW Business Monitor International (BMI) Mexico: Agribusiness Report, Q3 2010, Including 5‐year forecasts to 2014, Jun, 2010 Status of Agricultural Sector The Mexican agricultural sector continues to contend with the effects of the economic recession, as the country has been slower to emerge from recession than anticipated. Domestic demand has been hit as consumers tighten their purse strings and production has suffered as the rising costs of energy and transportation have also increased costs, placing further strain on the agricultural sector. The continued weakness of the peso against the US dollar has made Mexican exports more competitive, but has also presented difficulties, particularly for the livestock and dairy sectors as the cost of imported grains has risen. Dairy industry overview The current estimate for cows in milk production in Mexico is 6.6 million head. Unfortunately, the dairy industry has been hit by the economic recession. Milk production is now forecast to register only slow growth of 1.9% year‐on‐year in 2009/10 to take output to 11.35 million MT. According to Mexican dairy industry contacts, the supply of milk in Mexico is about 71 % domestic fluid milk and 29 % from reconstructive imported powder milk. However, BMI see production of butter growing by 4.1% in 2009/10 after two years of successive falls. BMI forecast strong growth in demand for processed dairy products over their 5 year forecast period, with butter consumption to grow by 10.4% in 2014, while cheese will increase by 11.4%. Recent export estimates for fluid milk have been revised up due to the entrance of new Mexican exporters, primarily small firms, and due to strong exports to Guatemala and Belize. Mexico also exports very small volumes of cheese and non‐fat milk powder. In January 2008, the final tariffs on dairy products from the US were removed in line with the North American Free Trade Agreement (NAFTA). Mexican dairy production is now in increasing competition with cheap imports of powdered milk from the US. Mexico continues to be a major market for US exports of milk powder, butter, cheese, and fluid milk. Despite a significant decline in 2008 resulting from the

Capability Assessment of Australian Dairy Technology and Services ‐ AANC Pty Ltd, July 2010
_________________________________________________________________________________________________________ Page 268 of 329
international economic crisis, the United States remains the principal supplier of dairy blends, lactose, and whey powder. With the abolition of all tariffs and quotas on cheap dairy imports from the US, worried farmers soon staged a protest in Mexico City, burning a tractor and parading dairy cows past the Mexican stock exchange, in protest over the FTA. It would appear that dairy farmers do have good reasons to fear. The yields of milk per cow in the US are on average around twice as high as in Mexico, making it difficult for Mexican producers to compete on price despite lower labour costs. If Mexican production is to become more competitive, further consolidation in the sector will be needed. Relatively poor cattle stock and fixed capital such as refrigeration limits the scope for improving yields on smaller farms, and investment capital is often hard to come by or prohibitively expensive. Even if the industry does consolidate further and investment in new breeds and infrastructure improves, Mexico's dairy sector will still be at somewhat of a comparative disadvantage to the US for climatic reasons. The Mexican state with the most significant dairy output, Jalisco, which in 2007 produced about 17% of Mexico's milk output, is down in the tropics, where the high temperatures and poorer fodder are not ideal for dairy farming. For these reasons, the fall in the value of the peso through the second half of 2008 will have been welcomed by Mexican dairy producers, as this increased the price of US imports and will help boost the competitiveness of local producers, although it also increased the price of imported feed. However, as the Mexican economy recovers from recession, there will be increasing investment in more modern, industrial farms and BMI anticipate that fluid milk production will rise over their forecast period out to 2014. Efficiency in Mexico's dairy sector has been improving over the past couple of decades. From 1998 to 2008, milk yields per head of dairy cattle rose from 3,800 kg/cow/lactation to 4,500 kg. This increase has been driven by the increase of modern confined dairy farms. Larger operators have imported high‐yielding dairy cattle stock from the US and Europe, increasing productivity. Farm management practices have also improved. Despite this, yields per cow are still far below US averages of 9,280 kg per cow (in 2008). Much of this can be explained by the small, back‐yard dairy producers and mixed use beef and dairy farms where milk yields are far lower than in specialised dairy farms. Greater investment is needed in large scale specialised dairy farms. Around 25% of fluid milk drunk in Mexico is still sold raw (untreated). This presents safety risks to consumers and could damage the image of dairy goods as healthy products. As was shown by the so called 'milk fraud' in Brazil at the end of 2007 and the melamine contamination in China at the end of 2008, lax oversight of food safety issues in the dairy sector can lead to health scares, from which demand for product can take a long time to recover. SWOT ANALYSIS Business Monitor International (BMI) Mexico: Agribusiness Report, Q3 2010, Including 5‐year forecasts to 2014, Jun, 2010 Mexican Agribusiness Environment SWOT Strengths • With a large land area and a range of climates, Mexico is naturally suited to large‐scale agricultural
production across a diversified range of products.
Capability Assessment of Australian Dairy Technology and Services ‐ AANC Pty Ltd, July 2010
_________________________________________________________________________________________________________ Page 269 of 329
• Mexico's large population of almost 110 million provides a plentiful supply of labour, with relatively low wages by developed country standards and also a large market for goods.
• Close proximity to the US and NAFTA membership gives Mexican exports tariff‐free access to the US. • The government's focus on improving infrastructure should help the overall business environment in
the longer term, making Mexico a more attractive location for future FDI inflows. • The country has signed a large number of free trade agreements (FTAs) in recent years, fostering rising
international trade and investment. This should help the economy diversify away from its dependence on the US.
• Democracy seems to have taken hold after the 71‐year tenure of the PRI ended in 2000, and there appear to be effective controls on executive power to prevent a return to one‐party rule.
Weaknesses • According to the University of Wisconsin’s Babcock Institute, Mexico has become a mature export
market for dairy products that attracts world class competitors, such that margins for commodity dairy exports to Mexico have become "razor thin."
• Corruption remains pervasive in Mexico, despite government efforts to reduce the problem. Transparency International's Corruption Perception Index places Mexico in the middle third countries.
• The poor state of infrastructure outside of major population centres makes expansion of production more difficult and hurts competitiveness, owing to increased costs.
• Mexican farms are often very small and have low yields in comparison with farms in the US. • The state with the highest dairy output is down in the tropics, where temperatures and poorer fodder
are not ideal for dairy farming. • Poor hygiene and quality standards leave Mexican dairy products open to accusations of health risks. • Significant levels of violence in the government's war against powerful drug cartels has highlighted
that much more work is necessary to reduce regional inequalities. Opportunities • Foreign direct investment is set to increase over our 10‐year forecast period, provided the
government maintains its business friendly policies. • Low yields and the highly fragmented state of Mexican farming leaves much room for consolidation
and output increases without having to expand the land area farmed. • Rising incomes among Mexico's population will allow greater spending on food, ensuring strong
domestic demand for the country's agricultural output. • The recent fall in the value of the peso against the US dollar will increase the competitiveness of
Mexican products against US imports. Threats • The removal of all tariffs and quotas for imports of agricultural goods from the US under the FTA
opens the Mexican market to competition from more efficient farms north of the border. • Tight credit markets and global deleveraging could continue to have a negative impact on FDI flows. 1.) Historical data on the volume of dairy cattle and dairy equipment imports (from Australia and internationally) ‐ over past 5 years
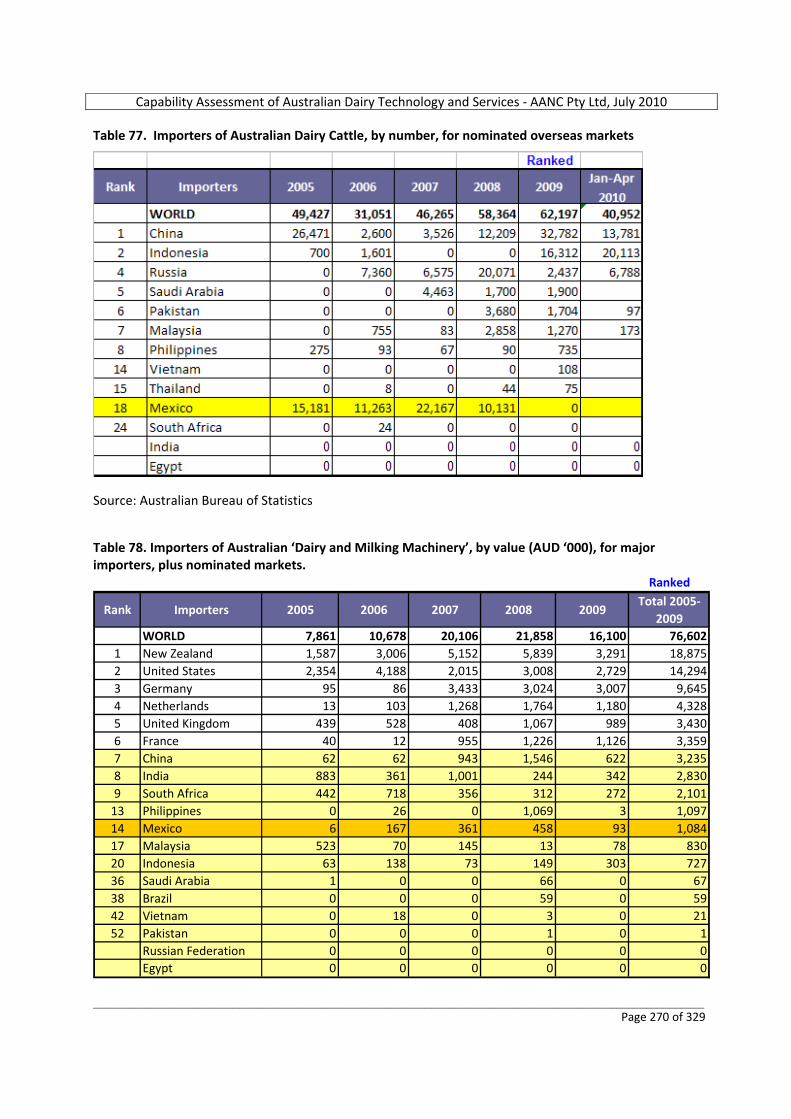
Capability Assessment of Australian Dairy Technology and Services ‐ AANC Pty Ltd, July 2010
_________________________________________________________________________________________________________ Page 270 of 329
Table 77. Importers of Australian Dairy Cattle, by number, for nominated overseas markets
Source: Australian Bureau of Statistics Table 78. Importers of Australian ‘Dairy and Milking Machinery’, by value (AUD ‘000), for major importers, plus nominated markets.
Ranked
Rank Importers 2005 2006 2007 2008 2009Total 2005‐
2009WORLD 7,861 10,678 20,106 21,858 16,100 76,602
1 New Zealand 1,587 3,006 5,152 5,839 3,291 18,8752 United States 2,354 4,188 2,015 3,008 2,729 14,2943 Germany 95 86 3,433 3,024 3,007 9,6454 Netherlands 13 103 1,268 1,764 1,180 4,3285 United Kingdom 439 528 408 1,067 989 3,4306 France 40 12 955 1,226 1,126 3,3597 China 62 62 943 1,546 622 3,2358 India 883 361 1,001 244 342 2,8309 South Africa 442 718 356 312 272 2,101
13 Philippines 0 26 0 1,069 3 1,09714 Mexico 6 167 361 458 93 1,08417 Malaysia 523 70 145 13 78 83020 Indonesia 63 138 73 149 303 72736 Saudi Arabia 1 0 0 66 0 6738 Brazil 0 0 0 59 0 5942 Vietnam 0 18 0 3 0 2152 Pakistan 0 0 0 1 0 1
Russian Federation 0 0 0 0 0 0Egypt 0 0 0 0 0 0
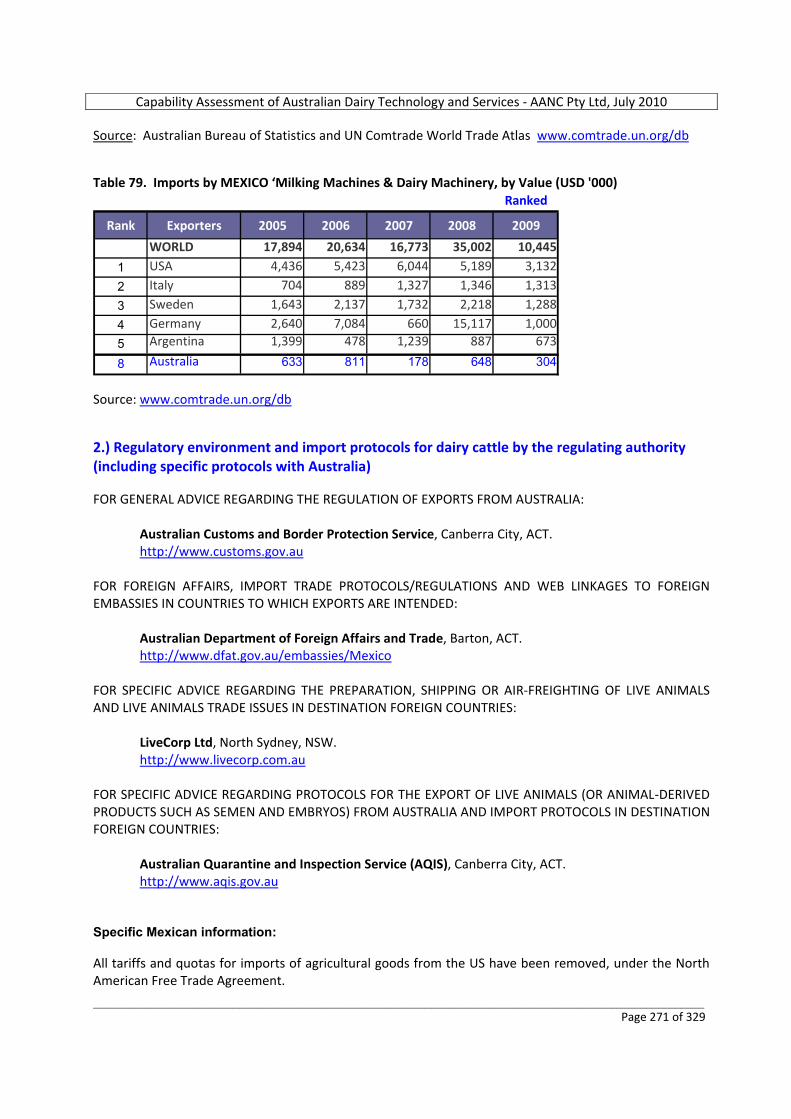
Capability Assessment of Australian Dairy Technology and Services ‐ AANC Pty Ltd, July 2010
_________________________________________________________________________________________________________ Page 271 of 329
Source: Australian Bureau of Statistics and UN Comtrade World Trade Atlas www.comtrade.un.org/db Table 79. Imports by MEXICO ‘Milking Machines & Dairy Machinery, by Value (USD '000)
Ranked
Rank Exporters 2005 2006 2007 2008 2009
WORLD 17,894 20,634 16,773 35,002 10,445
1 USA 4,436 5,423 6,044 5,189 3,132
2 Italy 704 889 1,327 1,346 1,313
3 Sweden 1,643 2,137 1,732 2,218 1,288
4 Germany 2,640 7,084 660 15,117 1,000
5 Argentina 1,399 478 1,239 887 673
8 Australia 633 811 178 648 304
Source: www.comtrade.un.org/db 2.) Regulatory environment and import protocols for dairy cattle by the regulating authority (including specific protocols with Australia) FOR GENERAL ADVICE REGARDING THE REGULATION OF EXPORTS FROM AUSTRALIA:
Australian Customs and Border Protection Service, Canberra City, ACT. http://www.customs.gov.au
FOR FOREIGN AFFAIRS, IMPORT TRADE PROTOCOLS/REGULATIONS AND WEB LINKAGES TO FOREIGN EMBASSIES IN COUNTRIES TO WHICH EXPORTS ARE INTENDED:
Australian Department of Foreign Affairs and Trade, Barton, ACT. http://www.dfat.gov.au/embassies/Mexico
FOR SPECIFIC ADVICE REGARDING THE PREPARATION, SHIPPING OR AIR‐FREIGHTING OF LIVE ANIMALS AND LIVE ANIMALS TRADE ISSUES IN DESTINATION FOREIGN COUNTRIES:
LiveCorp Ltd, North Sydney, NSW. http://www.livecorp.com.au
FOR SPECIFIC ADVICE REGARDING PROTOCOLS FOR THE EXPORT OF LIVE ANIMALS (OR ANIMAL‐DERIVED PRODUCTS SUCH AS SEMEN AND EMBRYOS) FROM AUSTRALIA AND IMPORT PROTOCOLS IN DESTINATION FOREIGN COUNTRIES:
Australian Quarantine and Inspection Service (AQIS), Canberra City, ACT. http://www.aqis.gov.au
Specific Mexican information: All tariffs and quotas for imports of agricultural goods from the US have been removed, under the North American Free Trade Agreement.
Capability Assessment of Australian Dairy Technology and Services ‐ AANC Pty Ltd, July 2010
_________________________________________________________________________________________________________ Page 272 of 329
Import protocols for live cattle from Australia are available on the Mexican Animal and Plant Health Inspection Department, website: http://148.245.191.4/zooweb/Funcion.aspx 3.) Investment environment for dairy operations (domestic and foreign assistance, tax incentives, export zones, etc) and examples of FDI (from any country) Babcock Institute discussion paper, No. 2002‐1 Babcock Institute for International Dairy Research and Development, University of Wisconsin, USA. How Mexico's Dairy Industry has evolved under the NAFTA. Implications for U.S. dairy exporters and U.S. investors in Mexico's dairy‐food businesses. Mexico has become a mature export market for dairy products that attracts world class competitors. Margins for commodity dairy exports to Mexico have become "razor thin." · The presence of "razor thin" margins on dairy commodities means that failure of a major dairy importer to pay for a shipment can wipe out profits on a large batch of exports. Exporters' problems with obtaining payments (or long payment delays) have created incentives for U.S. dairy exporters to focus on sales of differentiated products to "A" customers (e.g., Nestle, McDonald's) and to channel bulk dairy products to other foreign markets. ‘Challenges’ associated with doing business in Mexico's dairy food industries Corruption remains pervasive in Mexico, despite government efforts to reduce the problem. Transparency International's Corruption Perception Index places Mexico in the middle third countries. Corruption in Mexico manifests itself to dairy exporters in the form of occasional difficulties in getting paid for exports and problems associated with getting courts to settle payment disputes. A senior agricultural attaché referred to corruption in Mexico as a tax that large firms are most able to pay. This point has obvious implications for the size of firms that will be able to export dairy products to Mexico successfully or make profitable direct investments in the country's dairy‐food businesses. 4.) National government programs to assist with the development of dairy operations Business Monitor International (BMI) Mexico: Agribusiness Report, Q3 2010, Including 5‐year forecasts to 2014, Jun, 2010 The Government of Mexico still plays an important role in the Mexican dairy industry in the form of Liconsa, a state agency formed in 1965 that distributes subsidised milk to poorer Mexicans. In 2008 Liconsa distributed around 1.12 billion litres of milk. In the past, Liconsa relied on milk powder from the US, which it was able to import on a preferential basis. Now, with tariffs for all dairy imports from the US removed, Liconsa has begun to source more of its milk from the domestic market. While this increases demand for local production, the prices paid by Liconsa are set by the Government and can be slow to react to market prices. USDA Foreign Agricultural Service. Global Agricultural Information Network. GAIN Report Number: MX0034 Date 5/13/2010 Mexico – Dairy and Products Semi‐annual 2010 To encourage Mexican agriculture producers to improve efficiency and productivity, the Mexican government has established several improvement programs. One such program, entitled “Acquisition of Performing Assets” will focus on infrastructure, improving animal quality and integration. Congress has
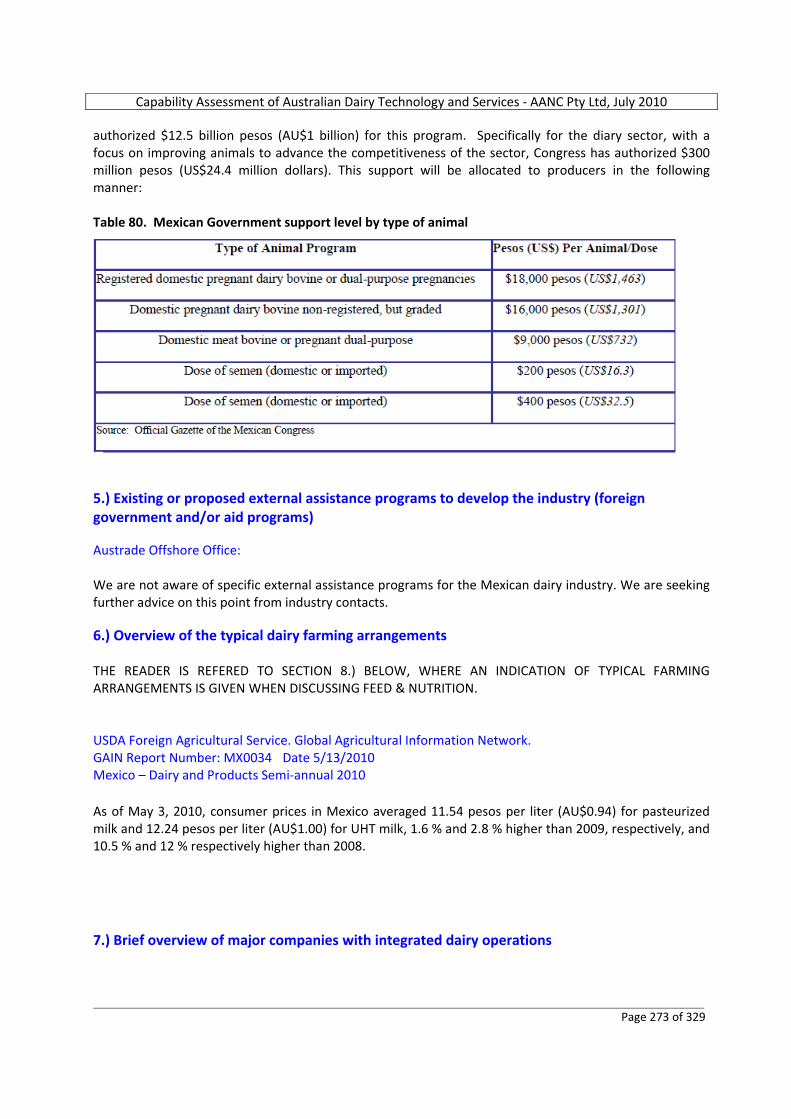
Capability Assessment of Australian Dairy Technology and Services ‐ AANC Pty Ltd, July 2010
_________________________________________________________________________________________________________ Page 273 of 329
authorized $12.5 billion pesos (AU$1 billion) for this program. Specifically for the diary sector, with a focus on improving animals to advance the competitiveness of the sector, Congress has authorized $300 million pesos (US$24.4 million dollars). This support will be allocated to producers in the following manner: Table 80. Mexican Government support level by type of animal
5.) Existing or proposed external assistance programs to develop the industry (foreign government and/or aid programs) Austrade Offshore Office: We are not aware of specific external assistance programs for the Mexican dairy industry. We are seeking further advice on this point from industry contacts. 6.) Overview of the typical dairy farming arrangements THE READER IS REFERED TO SECTION 8.) BELOW, WHERE AN INDICATION OF TYPICAL FARMING ARRANGEMENTS IS GIVEN WHEN DISCUSSING FEED & NUTRITION. USDA Foreign Agricultural Service. Global Agricultural Information Network. GAIN Report Number: MX0034 Date 5/13/2010 Mexico – Dairy and Products Semi‐annual 2010 As of May 3, 2010, consumer prices in Mexico averaged 11.54 pesos per liter (AU$0.94) for pasteurized milk and 12.24 pesos per liter (AU$1.00) for UHT milk, 1.6 % and 2.8 % higher than 2009, respectively, and 10.5 % and 12 % respectively higher than 2008. 7.) Brief overview of major companies with integrated dairy operations
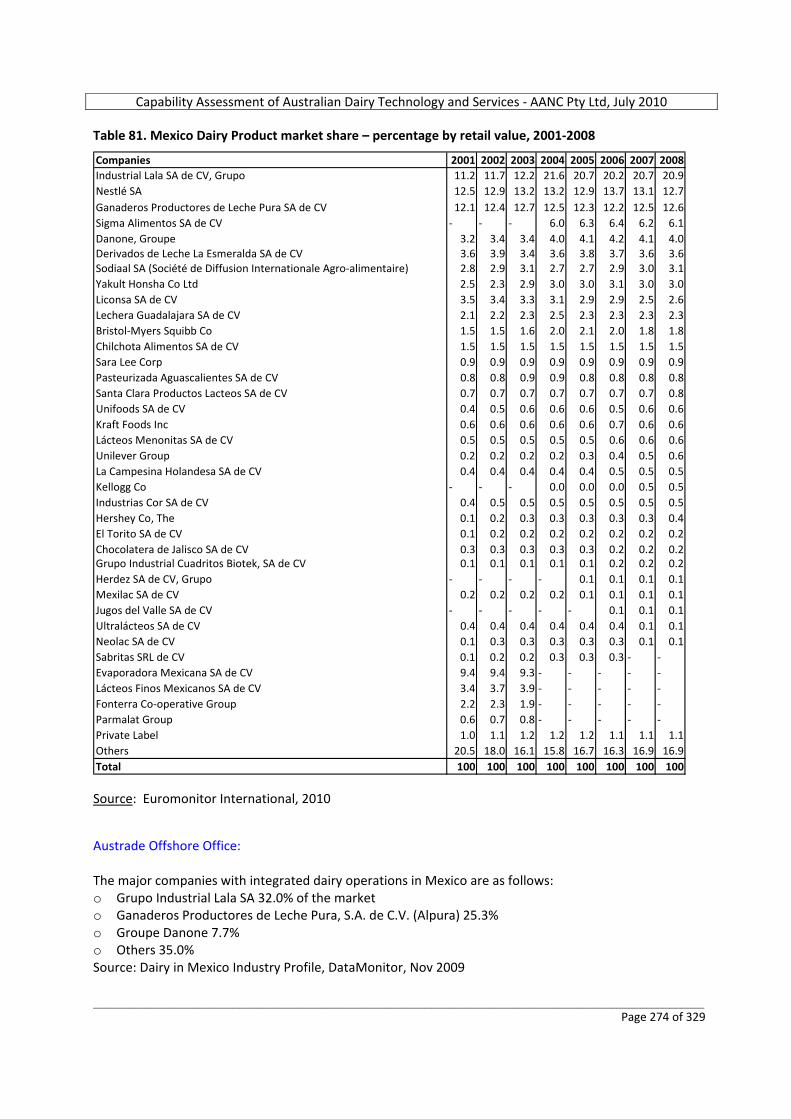
Capability Assessment of Australian Dairy Technology and Services ‐ AANC Pty Ltd, July 2010
_________________________________________________________________________________________________________ Page 274 of 329
Table 81. Mexico Dairy Product market share – percentage by retail value, 2001‐2008
Companies 2001 2002 2003 2004 2005 2006 2007 2008Industrial Lala SA de CV, Grupo 11.2 11.7 12.2 21.6 20.7 20.2 20.7 20.9Nestlé SA 12.5 12.9 13.2 13.2 12.9 13.7 13.1 12.7Ganaderos Productores de Leche Pura SA de CV 12.1 12.4 12.7 12.5 12.3 12.2 12.5 12.6Sigma Alimentos SA de CV ‐ ‐ ‐ 6.0 6.3 6.4 6.2 6.1Danone, Groupe 3.2 3.4 3.4 4.0 4.1 4.2 4.1 4.0Derivados de Leche La Esmeralda SA de CV 3.6 3.9 3.4 3.6 3.8 3.7 3.6 3.6Sodiaal SA (Société de Diffusion Internationale Agro‐alimentaire) 2.8 2.9 3.1 2.7 2.7 2.9 3.0 3.1Yakult Honsha Co Ltd 2.5 2.3 2.9 3.0 3.0 3.1 3.0 3.0Liconsa SA de CV 3.5 3.4 3.3 3.1 2.9 2.9 2.5 2.6Lechera Guadalajara SA de CV 2.1 2.2 2.3 2.5 2.3 2.3 2.3 2.3Bristol‐Myers Squibb Co 1.5 1.5 1.6 2.0 2.1 2.0 1.8 1.8Chilchota Alimentos SA de CV 1.5 1.5 1.5 1.5 1.5 1.5 1.5 1.5Sara Lee Corp 0.9 0.9 0.9 0.9 0.9 0.9 0.9 0.9Pasteurizada Aguascalientes SA de CV 0.8 0.8 0.9 0.9 0.8 0.8 0.8 0.8Santa Clara Productos Lacteos SA de CV 0.7 0.7 0.7 0.7 0.7 0.7 0.7 0.8Unifoods SA de CV 0.4 0.5 0.6 0.6 0.6 0.5 0.6 0.6Kraft Foods Inc 0.6 0.6 0.6 0.6 0.6 0.7 0.6 0.6Lácteos Menonitas SA de CV 0.5 0.5 0.5 0.5 0.5 0.6 0.6 0.6Unilever Group 0.2 0.2 0.2 0.2 0.3 0.4 0.5 0.6La Campesina Holandesa SA de CV 0.4 0.4 0.4 0.4 0.4 0.5 0.5 0.5Kellogg Co ‐ ‐ ‐ 0.0 0.0 0.0 0.5 0.5Industrias Cor SA de CV 0.4 0.5 0.5 0.5 0.5 0.5 0.5 0.5Hershey Co, The 0.1 0.2 0.3 0.3 0.3 0.3 0.3 0.4El Torito SA de CV 0.1 0.2 0.2 0.2 0.2 0.2 0.2 0.2Chocolatera de Jalisco SA de CV 0.3 0.3 0.3 0.3 0.3 0.2 0.2 0.2Grupo Industrial Cuadritos Biotek, SA de CV 0.1 0.1 0.1 0.1 0.1 0.2 0.2 0.2Herdez SA de CV, Grupo ‐ ‐ ‐ ‐ 0.1 0.1 0.1 0.1Mexilac SA de CV 0.2 0.2 0.2 0.2 0.1 0.1 0.1 0.1Jugos del Valle SA de CV ‐ ‐ ‐ ‐ ‐ 0.1 0.1 0.1Ultralácteos SA de CV 0.4 0.4 0.4 0.4 0.4 0.4 0.1 0.1Neolac SA de CV 0.1 0.3 0.3 0.3 0.3 0.3 0.1 0.1Sabritas SRL de CV 0.1 0.2 0.2 0.3 0.3 0.3 ‐ ‐Evaporadora Mexicana SA de CV 9.4 9.4 9.3 ‐ ‐ ‐ ‐ ‐Lácteos Finos Mexicanos SA de CV 3.4 3.7 3.9 ‐ ‐ ‐ ‐ ‐Fonterra Co‐operative Group 2.2 2.3 1.9 ‐ ‐ ‐ ‐ ‐Parmalat Group 0.6 0.7 0.8 ‐ ‐ ‐ ‐ ‐Private Label 1.0 1.1 1.2 1.2 1.2 1.1 1.1 1.1Others 20.5 18.0 16.1 15.8 16.7 16.3 16.9 16.9Total 100 100 100 100 100 100 100 100 Source: Euromonitor International, 2010 Austrade Offshore Office: The major companies with integrated dairy operations in Mexico are as follows: o Grupo Industrial Lala SA 32.0% of the market o Ganaderos Productores de Leche Pura, S.A. de C.V. (Alpura) 25.3% o Groupe Danone 7.7% o Others 35.0% Source: Dairy in Mexico Industry Profile, DataMonitor, Nov 2009

Capability Assessment of Australian Dairy Technology and Services ‐ AANC Pty Ltd, July 2010
_________________________________________________________________________________________________________ Page 275 of 329
The three major companies have integrated operations including multiple facilities specialising in differing aspects of production. Overall the level of technical sophistication of these companies is high, with capability to produce a wide range of products for the market. There is significant competition between the leading companies for market share. The advanced technology utilised by these companies includes artificial insemination, enriched feed for cattle, veterinary services, laboratories, and chemical and pharmaceutical materials. 8.) Availability of forage and raw materials for feed & nutrition FAO, Country Pasture/Forage Resource Profiles ‐ Pakistan Ricardo Améndola, Epigmenio Castillo & Pedro A. Martínez, May 2006. In 2004, there were reported to be 2.1 million dairy cattle of which 42, 48 and 10% were in Northern, Central and Southern Mexico, respectively. In Northern and Central Mexico Holstein is the dominant breed in specialised dairy farms and crosses of Holstein and “criollo” dominate in small farms. In Southern, tropical, Mexico crosses of Zebu with Holstein and Brown Swiss are the most common breeds for dairy production. ‘Specialised Dairy’ systems Dairy production systems fairly similar in efficiency to farms in the USA are found in 6 of the more northern dairy regions of Mexico. These farms comprise the ‘Specialised Dairy System’ in Mexico. Farms are large, cows (mainly Holstein) are of relatively high genetic merit and productivity is relatively high. Animals do not graze and nutrition is based on concentrates and cut‐and‐carry forages, silage and hay. Main forage crops are lucerne, maize, forage sorghum, oats and annual ryegrass. Forage production and animal management are highly mechanised. Farmers are well organised and highly integrated. A useful snap shot of these farms by region is given in Table 82 below. Dairy farms in La Laguna are the biggest in Mexico, and their size is increasing. Productivity in La Laguna is the highest in Mexico. However, the sustainability of the increase in production of La Laguna by increasing numbers of cattle might be questioned, as it depends on imports of replacement heifers and feed commodities for use in concentrates. ‘Tropical Dual Purpose’ systems This system aiming to produce milk and weaned calves simultaneously is dominant in the humid and sub‐humid tropics. Table 83 below summarises the characteristics of the system. Lactation yields per cow can be seen to contrast dramatically with those from the ‘Specialised Dairy’ farms. Mexican dual purpose farmers frequently have small farms, and dual‐purpose systems around the word are typically biologically and economically inefficient. Cow malnutrition is probably the major cause of low productivity and unsatisfactory reproductive performances. Average values of productive and reproductive parameters in Table 83 suggest that the Mexican dual‐purpose system is particularly inefficient. The system is based on grazing native and sown pastures. Low forage availability in the dry season is the main factor limiting milk production but very little is done about it, as only 30 % of farmers provide supplementary feeding – mainly molasses – in the dry season, and only 1 % of farmers grow forages for cattle during the dry season. Most cattle are zebu (Bos indicus) crosses with Brown Swiss, but the productivity of zebu ‐ Holstein crosses is higher. Most milk is marketed in the informal market as cheese made by small processors or as raw liquid milk, while the remainder is collected by commercial dairy processors, mainly Nestlé.
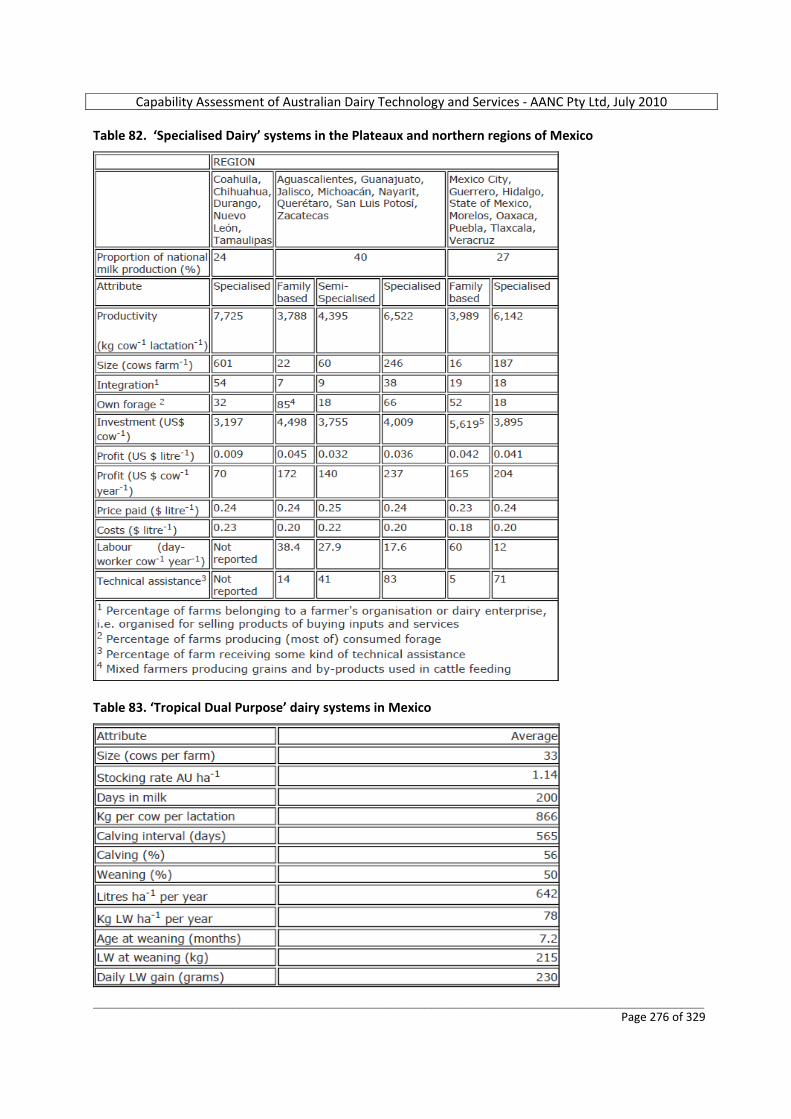
Capability Assessment of Australian Dairy Technology and Services ‐ AANC Pty Ltd, July 2010
_________________________________________________________________________________________________________ Page 276 of 329
Table 82. ‘Specialised Dairy’ systems in the Plateaux and northern regions of Mexico
Table 83. ‘Tropical Dual Purpose’ dairy systems in Mexico
Capability Assessment of Australian Dairy Technology and Services ‐ AANC Pty Ltd, July 2010
_________________________________________________________________________________________________________ Page 277 of 329
USDA Foreign Agricultural Service. Global Agricultural Information Network. GAIN Report Number: MX0017 Date 3/12/2010 Mexico – Grain and Feed Annual 2010 Mexico’s total grain production is estimated to increase, with only rice decreasing slightly. o Corn production estimate for 2009/10 is 21.3 million MT, although corn imports are forecast to
increase to 9.8 million MT. o Sorghum production is expected to increase during 2010/11 to 7.1 million MT, while imports are
expected to increase almost 22 % to 2.8 million MT for 2009/10 due to strong demand from stockfeed millers.
o Rice production for MY 2010/11 is forecast to decrease 9 percent to 160,000 MT (milled basis) due to a smaller‐than‐expected planted area. Rice imports for 2009/10 are forecast to reach 650,000 MT due to the domestic production’s inability to keep up with stronger consumer demand.
o Wheat production for MY 2010/11 (July/June) is forecast to increase slightly to 4.35 MMT compared to 4.3 MMT in MY 2009/10. Durum wheat will continue to drive Mexico’s wheat production, but imports should remain at 3.1 million MT.
o Dry bean production is forecast to rebound to 1.13 million MT, while imports are expected to drop to 80,000 MT due to increases in local production.
9.) Availability of Artificial Insemination laboratories and testing facilities for cattle; also veterinary services Austrade Offshore Office: Artificial insemination and careful genetic management are standard practice in Mexican dairy operations. Each of the major production companies has integrated facilities, including these services. 10.) Agribusiness educational facilities to support dairy production FAO, Country Pasture/Forage Resource Profiles ‐ Pakistan Ricardo Améndola, Epigmenio Castillo & Pedro A. Martínez, May 2006. o Research on pastures and forages is carried out by INIFAP (National Institute for Forestry Agricultural
and Animal Production Research) and public universities. Research of INIFAP, is organised into eight Regional Research Centres.
o Six universities in Northern Mexico have research and graduate studies programmes dealing with
animal production, pastures and forages: Universidad Autónoma de Chihuahua (UACH), Universidad Autónoma de Nuevo León (UANL), Universidad Autónoma de Tamaulipas (UAT), Universidad Autónoma Antonio Narro (UAAAN) in Coahuila, Universidad Juárez del Estado de Durango (UJED) and Universidad Autónoma de Baja California Sur (UABCS).
o In Central Mexico in the State of Mexico, two universities, Universidad Autónoma Chapingo (UACh)
and Universidad Autónoma del Estado de México (UAEM) and the Colegio de Postgraduados (an institution of agricultural sciences at postgraduate level), have research and graduate studies programs dealing with pastures and forages within ruminant production systems.
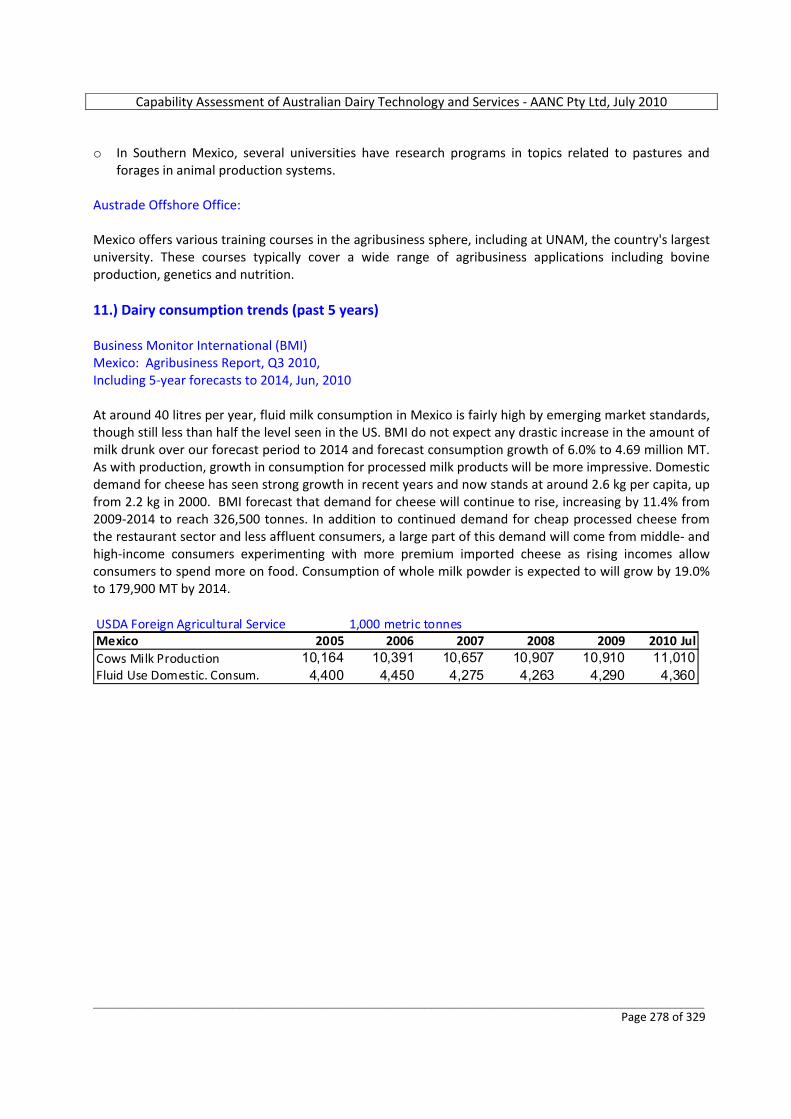
Capability Assessment of Australian Dairy Technology and Services ‐ AANC Pty Ltd, July 2010
_________________________________________________________________________________________________________ Page 278 of 329
o In Southern Mexico, several universities have research programs in topics related to pastures and
forages in animal production systems. Austrade Offshore Office: Mexico offers various training courses in the agribusiness sphere, including at UNAM, the country's largest university. These courses typically cover a wide range of agribusiness applications including bovine production, genetics and nutrition. 11.) Dairy consumption trends (past 5 years) Business Monitor International (BMI) Mexico: Agribusiness Report, Q3 2010, Including 5‐year forecasts to 2014, Jun, 2010 At around 40 litres per year, fluid milk consumption in Mexico is fairly high by emerging market standards, though still less than half the level seen in the US. BMI do not expect any drastic increase in the amount of milk drunk over our forecast period to 2014 and forecast consumption growth of 6.0% to 4.69 million MT. As with production, growth in consumption for processed milk products will be more impressive. Domestic demand for cheese has seen strong growth in recent years and now stands at around 2.6 kg per capita, up from 2.2 kg in 2000. BMI forecast that demand for cheese will continue to rise, increasing by 11.4% from 2009‐2014 to reach 326,500 tonnes. In addition to continued demand for cheap processed cheese from the restaurant sector and less affluent consumers, a large part of this demand will come from middle‐ and high‐income consumers experimenting with more premium imported cheese as rising incomes allow consumers to spend more on food. Consumption of whole milk powder is expected to will grow by 19.0% to 179,900 MT by 2014. USDA Foreign Agricultural Service 1,000 metric tonnesMexico 2005 2006 2007 2008 2009 2010 JulCows Milk Production 10,164 10,391 10,657 10,907 10,910 11,010Fluid Use Domestic. Consum. 4,400 4,450 4,275 4,263 4,290 4,360
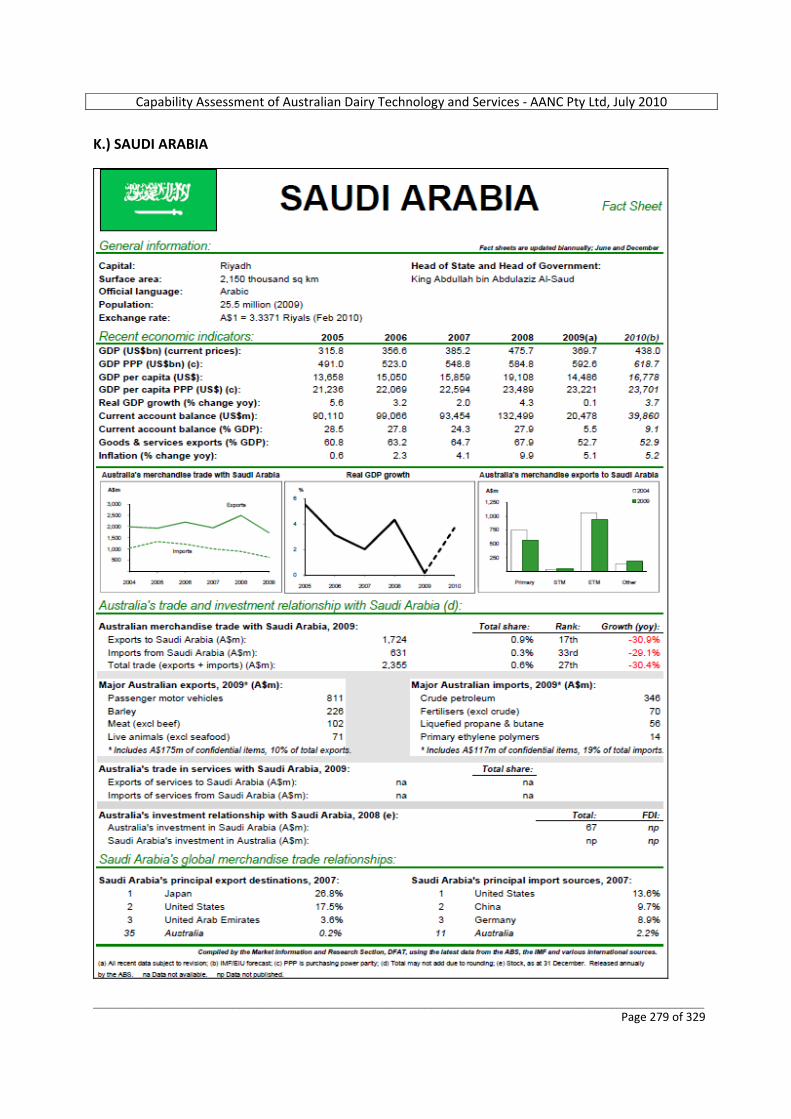
Capability Assessment of Australian Dairy Technology and Services ‐ AANC Pty Ltd, July 2010
_________________________________________________________________________________________________________ Page 279 of 329
K.) SAUDI ARABIA
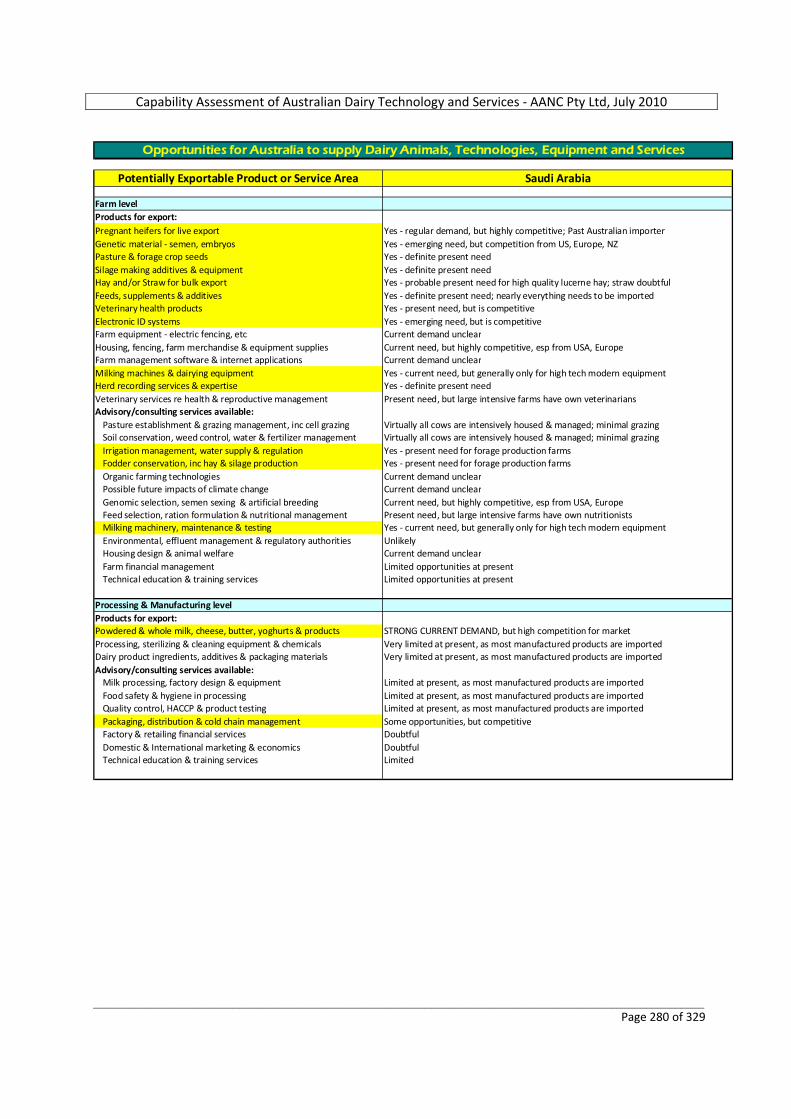
Capability Assessment of Australian Dairy Technology and Services ‐ AANC Pty Ltd, July 2010
_________________________________________________________________________________________________________ Page 280 of 329
Potentially Exportable Product or Service Area Saudi Arabia
Farm levelProducts for export:Pregnant heifers for live export Yes ‐ regular demand, but highly competitive; Past Australian importerGenetic material ‐ semen, embryos Yes ‐ emerging need, but competition from US, Europe, NZPasture & forage crop seeds Yes ‐ definite present needSilage making additives & equipment Yes ‐ definite present needHay and/or Straw for bulk export Yes ‐ probable present need for high quality lucerne hay; straw doubtfulFeeds, supplements & additives Yes ‐ definite present need; nearly everything needs to be importedVeterinary health products Yes ‐ present need, but is competitiveElectronic ID systems Yes ‐ emerging need, but is competitiveFarm equipment ‐ electric fencing, etc Current demand unclearHousing, fencing, farm merchandise & equipment supplies Current need, but highly competitive, esp from USA, EuropeFarm management software & internet applications Current demand unclearMilking machines & dairying equipment Yes ‐ current need, but generally only for high tech modern equipmentHerd recording services & expertise Yes ‐ definite present needVeterinary services re health & reproductive management Present need, but large intensive farms have own veterinariansAdvisory/consulting services available:
Pasture establishment & grazing management, inc cell grazing Virtually all cows are intensively housed & managed; minimal grazingSoil conservation, weed control, water & fertilizer management Virtually all cows are intensively housed & managed; minimal grazingIrrigation management, water supply & regulation Yes ‐ present need for forage production farmsFodder conservation, inc hay & silage production Yes ‐ present need for forage production farmsOrganic farming technologies Current demand unclearPossible future impacts of climate change Current demand unclearGenomic selection, semen sexing & artificial breeding Current need, but highly competitive, esp from USA, EuropeFeed selection, ration formulation & nutritional management Present need, but large intensive farms have own nutritionistsMilking machinery, maintenance & testing Yes ‐ current need, but generally only for high tech modern equipmentEnvironmental, effluent management & regulatory authorities UnlikelyHousing design & animal welfare Current demand unclearFarm financial management Limited opportunities at presentTechnical education & training services Limited opportunities at present
Processing & Manufacturing levelProducts for export:Powdered & whole milk, cheese, butter, yoghurts & products STRONG CURRENT DEMAND, but high competition for marketProcessing, sterilizing & cleaning equipment & chemicals Very limited at present, as most manufactured products are importedDairy product ingredients, additives & packaging materials Very limited at present, as most manufactured products are importedAdvisory/consulting services available:
Milk processing, factory design & equipment Limited at present, as most manufactured products are importedFood safety & hygiene in processing Limited at present, as most manufactured products are importedQuality control, HACCP & product testing Limited at present, as most manufactured products are importedPackaging, distribution & cold chain management Some opportunities, but competitiveFactory & retailing financial services DoubtfulDomestic & International marketing & economics DoubtfulTechnical education & training services Limited
Opportunities for Australia to supply Dairy Animals, Technologies, Equipment and Services

Capability Assessment of Australian Dairy Technology and Services ‐ AANC Pty Ltd, July 2010
_________________________________________________________________________________________________________ Page 281 of 329
VALUE OF DAIRY INDUSTRY ‐ COMPARISON OF INTERNATIONAL TARGET MARKETS Figure 75. Retail value of Dairy Industries, with Saudi Arabia in 6th place amongst the 13 nominated overseas markets, but well behind the industry leaders
0.0
5,000.0
10,000.0
15,000.0
20,000.0
25,000.0
US$ million
Brazil
China
Egypt
India
Indon
esia
Malays
ia
Mexico
Pakist
an
Philipp
ines
Russia
Saudi
Arabia
South
Africa
Vietna
m
Retail Value of Target Market Dairy Industries, 2009
Source: Euromonitor International, 2010 Figure 76. Retail value growth of Dairy Industries, CAGR % 2004‐2009, with Saudi Arabia in 10th place amongst nominated markets
0.0
5.0
10.0
15.0
20.0
25.0
CAGR %
Brazil
China
Egypt
India
Indon
esia
Malays
ia
Mexico
Pakist
an
Philipp
ines
Russia
Saudi
Arabia
South
Africa
Vietna
m
Retail Value Growth of Target Market Dairy Industries, CAGR % 2004‐09
Source: Euromonitor International, 2010
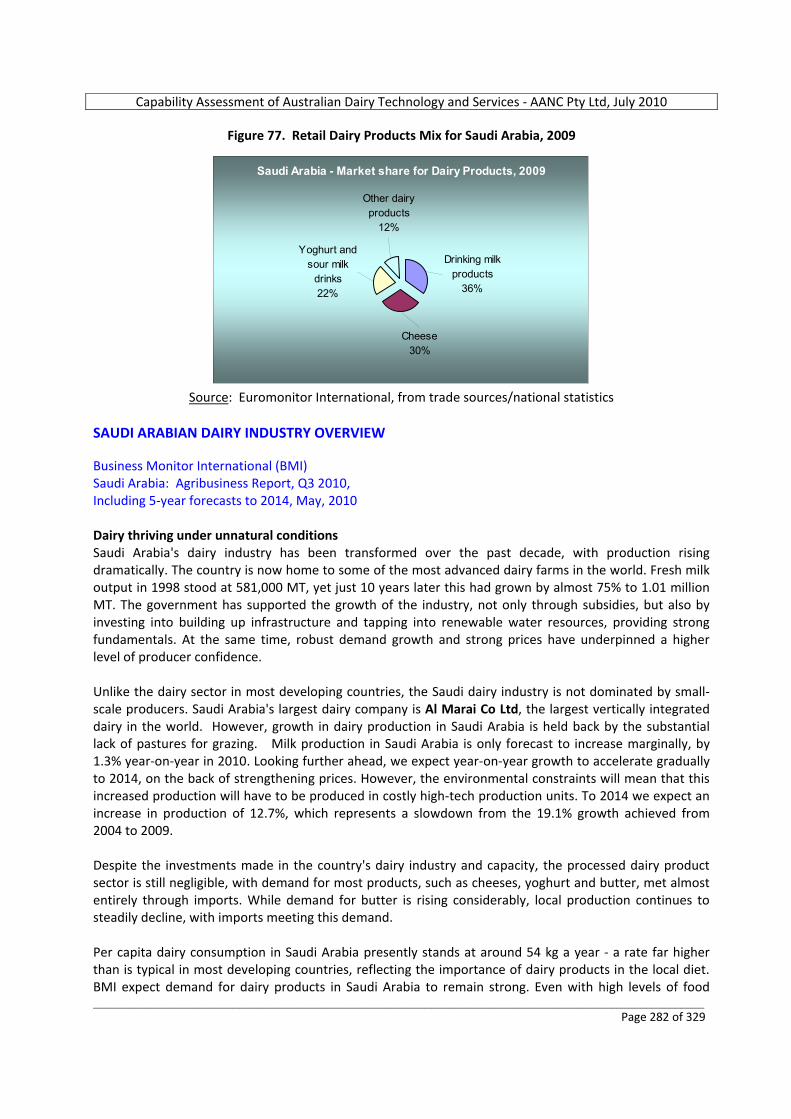
Capability Assessment of Australian Dairy Technology and Services ‐ AANC Pty Ltd, July 2010
_________________________________________________________________________________________________________ Page 282 of 329
Figure 77. Retail Dairy Products Mix for Saudi Arabia, 2009
Saudi Arabia - Market share for Dairy Products, 2009
Other dairy products
12%
Yoghurt and sour milk
drinks22%
Cheese30%
Drinking milk products
36%
Source: Euromonitor International, from trade sources/national statistics
SAUDI ARABIAN DAIRY INDUSTRY OVERVIEW Business Monitor International (BMI) Saudi Arabia: Agribusiness Report, Q3 2010, Including 5‐year forecasts to 2014, May, 2010 Dairy thriving under unnatural conditions Saudi Arabia's dairy industry has been transformed over the past decade, with production rising dramatically. The country is now home to some of the most advanced dairy farms in the world. Fresh milk output in 1998 stood at 581,000 MT, yet just 10 years later this had grown by almost 75% to 1.01 million MT. The government has supported the growth of the industry, not only through subsidies, but also by investing into building up infrastructure and tapping into renewable water resources, providing strong fundamentals. At the same time, robust demand growth and strong prices have underpinned a higher level of producer confidence. Unlike the dairy sector in most developing countries, the Saudi dairy industry is not dominated by small‐scale producers. Saudi Arabia's largest dairy company is Al Marai Co Ltd, the largest vertically integrated dairy in the world. However, growth in dairy production in Saudi Arabia is held back by the substantial lack of pastures for grazing. Milk production in Saudi Arabia is only forecast to increase marginally, by 1.3% year‐on‐year in 2010. Looking further ahead, we expect year‐on‐year growth to accelerate gradually to 2014, on the back of strengthening prices. However, the environmental constraints will mean that this increased production will have to be produced in costly high‐tech production units. To 2014 we expect an increase in production of 12.7%, which represents a slowdown from the 19.1% growth achieved from 2004 to 2009. Despite the investments made in the country's dairy industry and capacity, the processed dairy product sector is still negligible, with demand for most products, such as cheeses, yoghurt and butter, met almost entirely through imports. While demand for butter is rising considerably, local production continues to steadily decline, with imports meeting this demand. Per capita dairy consumption in Saudi Arabia presently stands at around 54 kg a year ‐ a rate far higher than is typical in most developing countries, reflecting the importance of dairy products in the local diet. BMI expect demand for dairy products in Saudi Arabia to remain strong. Even with high levels of food

Capability Assessment of Australian Dairy Technology and Services ‐ AANC Pty Ltd, July 2010
_________________________________________________________________________________________________________ Page 283 of 329
price inflation, consumers are not expected to drop dairy products from their daily diet. For years the country's intense heat remained a major obstacle to the expansion of the dairy industry. However, along with growing urbanisation and the increased prevalence of white goods in homes, the industry has boomed. At present the bulk of dairy consumed in Saudi Arabia is done so in primary forms. More profitable value added dairy products, such as cheese and yoghurt, remain emerging categories. Given the financial protection currently afforded to the dairy farming industry by government subsidies, this has not posed a problem for the industry in terms of its ability to remain competitive. A recent change in legislation now allows Saudi businesses to be fully owned by foreign firms, which could result in greater foreign investment in the agribusiness sector in generally, and certainly well applicable to dairy. SWOT ANALYSIS Business Monitor International (BMI) Saudi Arabia: Agribusiness Report, Q3 2010, Including 5‐year forecasts to 2014, May, 2010 Saudi Arabian Agribusiness Environment SWOT Strengths • The Kingdom's ample oil reserves underpin the al‐Sauds' regime. Because the country is the world's
largest oil exporter, international powers see its internal stability as being in their own interests. • As a leading OPEC nation, the Kingdom is in a strong position within the cartel. • The recent oil price boom has boosted growth in the non‐oil sector, and infrastructure is now much
improved. • The country's dairy industry is better developed than that in many neighbouring Gulf states, which has
allowed for strong export opportunities. • The government has made development of the agricultural sector a priority, ensuring continued levels
of investment. • The government's membership of the Gulf Co‐operation Council (GCC) and membership of the
Greater Arab Free Trade Area (GAFTA), means Saudi Arabia benefits from duty‐free access to markets in Bahrain, Oman, Kuwait, Qatar and the UAE.
• A large and growing local population means solid domestic demand for goods, services and infrastructure in spite of the global macroeconomic crisis. Rising disposable incomes and changing consumer habits have helped fuel domestic consumption growth.
Weaknesses • Only around 1% of Saudi Arabia's landmass qualifies as agricultural land, severely limiting output. • The country is fully dependant on imports across a range of key commodities to meet the needs of its
growing population. This includes a near 100% reliance on imports of the major food and feed grains – barley, corn, wheat and rice. The feeding of concentrates tor dairy cows is therefore expensive.
• A lack of renewable water resources undermines Saudi Arabia's already limited agricultural potential, particularly in grains and livestock.
• The Saudi Arabian dairy industry has benefitted tremendously from the government's support of the agricultural sector. However, as government subsidies are reduced in line with WTO standards, the local industry will lose this protection (although this could be viewed in a favourable light).
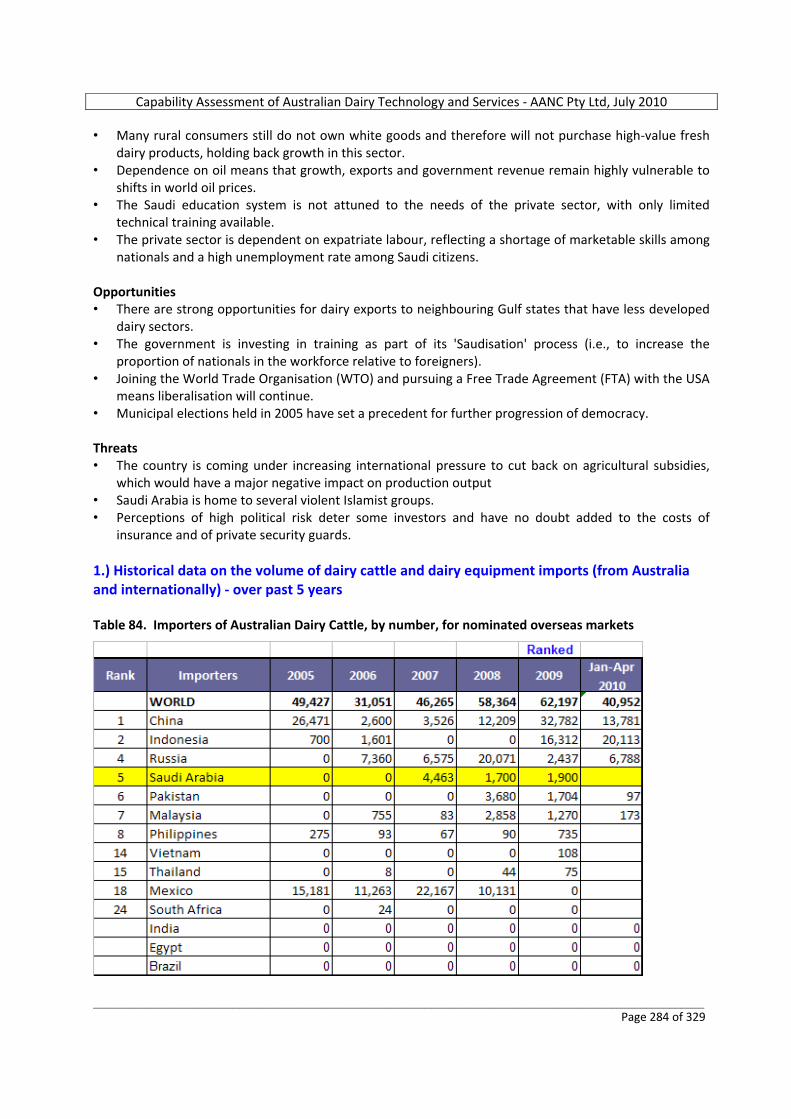
Capability Assessment of Australian Dairy Technology and Services ‐ AANC Pty Ltd, July 2010
_________________________________________________________________________________________________________ Page 284 of 329
• Many rural consumers still do not own white goods and therefore will not purchase high‐value fresh dairy products, holding back growth in this sector.
• Dependence on oil means that growth, exports and government revenue remain highly vulnerable to shifts in world oil prices.
• The Saudi education system is not attuned to the needs of the private sector, with only limited technical training available.
• The private sector is dependent on expatriate labour, reflecting a shortage of marketable skills among nationals and a high unemployment rate among Saudi citizens.
Opportunities • There are strong opportunities for dairy exports to neighbouring Gulf states that have less developed
dairy sectors. • The government is investing in training as part of its 'Saudisation' process (i.e., to increase the
proportion of nationals in the workforce relative to foreigners). • Joining the World Trade Organisation (WTO) and pursuing a Free Trade Agreement (FTA) with the USA
means liberalisation will continue. • Municipal elections held in 2005 have set a precedent for further progression of democracy. Threats • The country is coming under increasing international pressure to cut back on agricultural subsidies,
which would have a major negative impact on production output • Saudi Arabia is home to several violent Islamist groups. • Perceptions of high political risk deter some investors and have no doubt added to the costs of
insurance and of private security guards. 1.) Historical data on the volume of dairy cattle and dairy equipment imports (from Australia and internationally) ‐ over past 5 years Table 84. Importers of Australian Dairy Cattle, by number, for nominated overseas markets
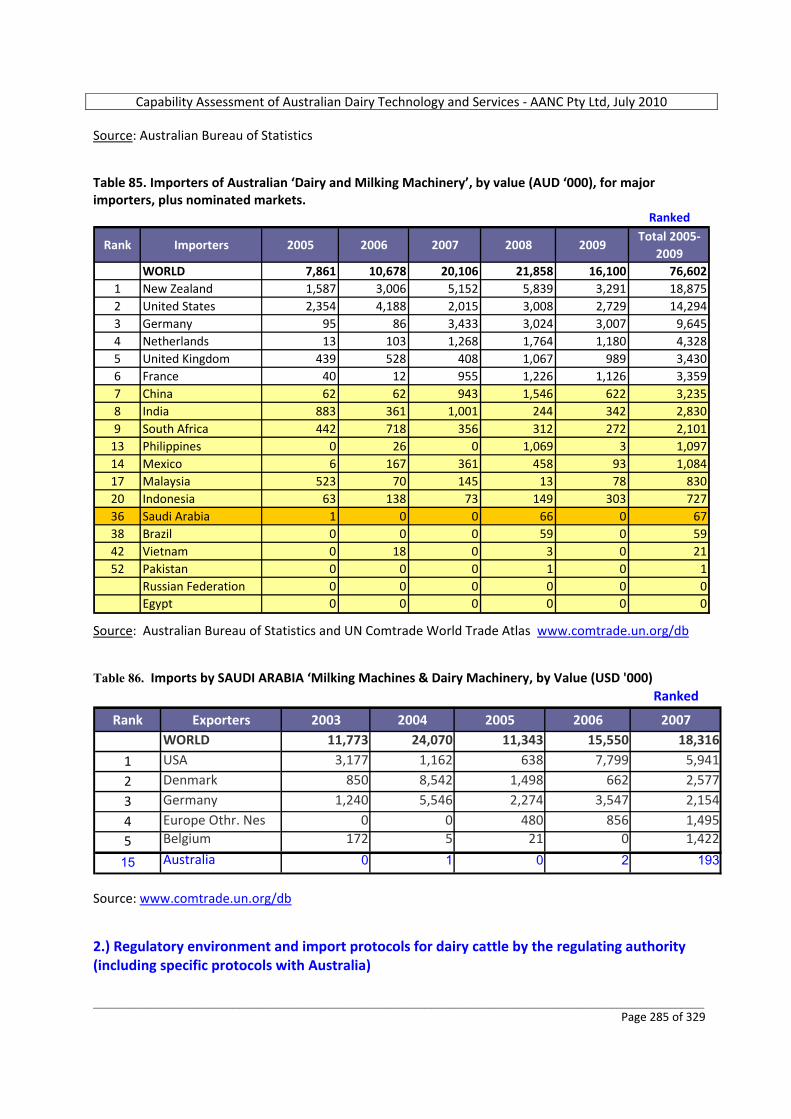
Capability Assessment of Australian Dairy Technology and Services ‐ AANC Pty Ltd, July 2010
_________________________________________________________________________________________________________ Page 285 of 329
Source: Australian Bureau of Statistics Table 85. Importers of Australian ‘Dairy and Milking Machinery’, by value (AUD ‘000), for major importers, plus nominated markets.
Ranked
Rank Importers 2005 2006 2007 2008 2009Total 2005‐
2009WORLD 7,861 10,678 20,106 21,858 16,100 76,602
1 New Zealand 1,587 3,006 5,152 5,839 3,291 18,8752 United States 2,354 4,188 2,015 3,008 2,729 14,2943 Germany 95 86 3,433 3,024 3,007 9,6454 Netherlands 13 103 1,268 1,764 1,180 4,3285 United Kingdom 439 528 408 1,067 989 3,4306 France 40 12 955 1,226 1,126 3,3597 China 62 62 943 1,546 622 3,2358 India 883 361 1,001 244 342 2,8309 South Africa 442 718 356 312 272 2,101
13 Philippines 0 26 0 1,069 3 1,09714 Mexico 6 167 361 458 93 1,08417 Malaysia 523 70 145 13 78 83020 Indonesia 63 138 73 149 303 72736 Saudi Arabia 1 0 0 66 0 6738 Brazil 0 0 0 59 0 5942 Vietnam 0 18 0 3 0 2152 Pakistan 0 0 0 1 0 1
Russian Federation 0 0 0 0 0 0Egypt 0 0 0 0 0 0
Source: Australian Bureau of Statistics and UN Comtrade World Trade Atlas www.comtrade.un.org/db Table 86. Imports by SAUDI ARABIA ‘Milking Machines & Dairy Machinery, by Value (USD '000)
Ranked
Rank Exporters 2003 2004 2005 2006 2007WORLD 11,773 24,070 11,343 15,550 18,316
1 USA 3,177 1,162 638 7,799 5,941
2 Denmark 850 8,542 1,498 662 2,577
3 Germany 1,240 5,546 2,274 3,547 2,154
4 Europe Othr. Nes 0 0 480 856 1,495
5 Belgium 172 5 21 0 1,422
15 Australia 0 1 0 2 193
Source: www.comtrade.un.org/db 2.) Regulatory environment and import protocols for dairy cattle by the regulating authority (including specific protocols with Australia)
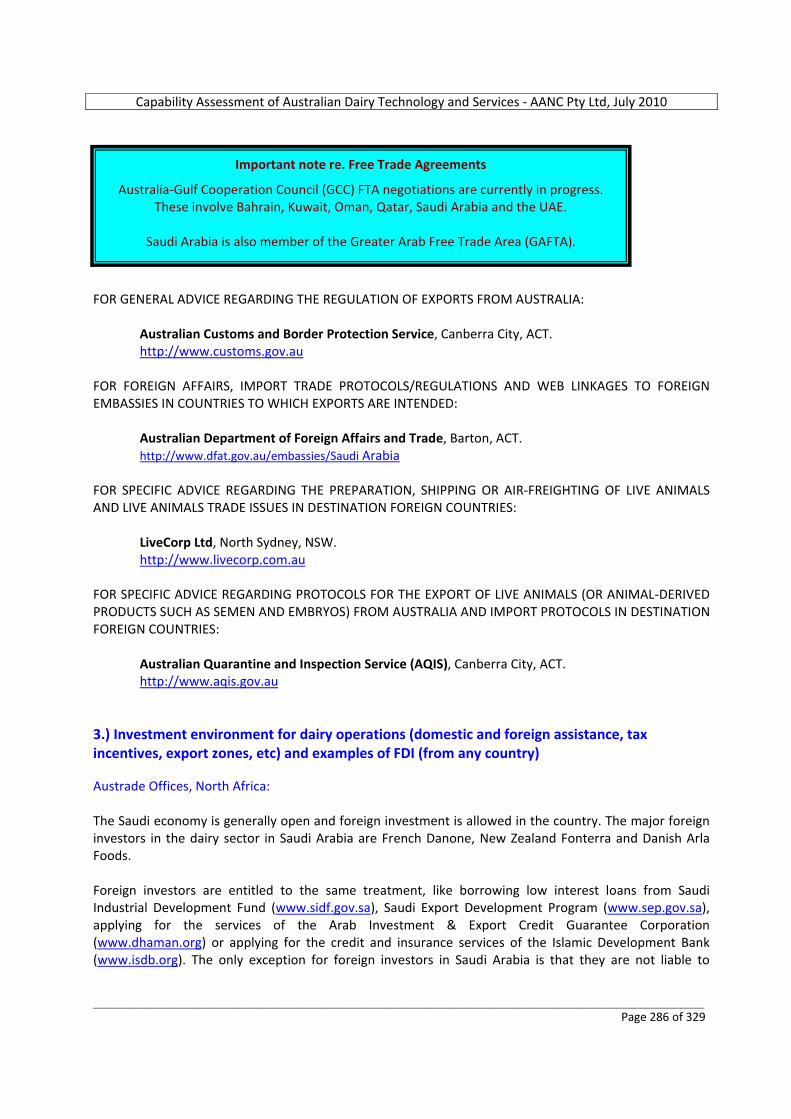
Capability Assessment of Australian Dairy Technology and Services ‐ AANC Pty Ltd, July 2010
_________________________________________________________________________________________________________ Page 286 of 329
FOR GENERAL ADVICE REGARDING THE REGULATION OF EXPORTS FROM AUSTRALIA:
Australian Customs and Border Protection Service, Canberra City, ACT. http://www.customs.gov.au
FOR FOREIGN AFFAIRS, IMPORT TRADE PROTOCOLS/REGULATIONS AND WEB LINKAGES TO FOREIGN EMBASSIES IN COUNTRIES TO WHICH EXPORTS ARE INTENDED:
Australian Department of Foreign Affairs and Trade, Barton, ACT. http://www.dfat.gov.au/embassies/Saudi Arabia
FOR SPECIFIC ADVICE REGARDING THE PREPARATION, SHIPPING OR AIR‐FREIGHTING OF LIVE ANIMALS AND LIVE ANIMALS TRADE ISSUES IN DESTINATION FOREIGN COUNTRIES:
LiveCorp Ltd, North Sydney, NSW. http://www.livecorp.com.au
FOR SPECIFIC ADVICE REGARDING PROTOCOLS FOR THE EXPORT OF LIVE ANIMALS (OR ANIMAL‐DERIVED PRODUCTS SUCH AS SEMEN AND EMBRYOS) FROM AUSTRALIA AND IMPORT PROTOCOLS IN DESTINATION FOREIGN COUNTRIES:
Australian Quarantine and Inspection Service (AQIS), Canberra City, ACT. http://www.aqis.gov.au
3.) Investment environment for dairy operations (domestic and foreign assistance, tax incentives, export zones, etc) and examples of FDI (from any country) Austrade Offices, North Africa: The Saudi economy is generally open and foreign investment is allowed in the country. The major foreign investors in the dairy sector in Saudi Arabia are French Danone, New Zealand Fonterra and Danish Arla Foods. Foreign investors are entitled to the same treatment, like borrowing low interest loans from Saudi Industrial Development Fund (www.sidf.gov.sa), Saudi Export Development Program (www.sep.gov.sa), applying for the services of the Arab Investment & Export Credit Guarantee Corporation (www.dhaman.org) or applying for the credit and insurance services of the Islamic Development Bank (www.isdb.org). The only exception for foreign investors in Saudi Arabia is that they are not liable to
Important note re. Free Trade Agreements
Australia‐Gulf Cooperation Council (GCC) FTA negotiations are currently in progress. These involve Bahrain, Kuwait, Oman, Qatar, Saudi Arabia and the UAE.
Saudi Arabia is also member of the Greater Arab Free Trade Area (GAFTA).
Capability Assessment of Australian Dairy Technology and Services ‐ AANC Pty Ltd, July 2010
_________________________________________________________________________________________________________ Page 287 of 329
around 20% corporate income tax which the local companies are liable to. Local companies are paying 2.5% Zakat (alms giving) tax. Saudi Arabia is also member of the Greater Arab Free Trade Area (GAFTA). For more information on Saudi Investment environment; please visit (www.sagia.gov.sa). Fonterra to take full control of Saudi manufacturing unit. Melody Song, The Edge Financial Daily. 17 December 2009. It is not only large Saudi firms such as Al Marai investing in the market. In December 2009, New Zealand's Fonterra, the world's largest dairy company, announced that it had bought out its partner Saudi New Zealand Milk Products (SNZMP) to support its Middle East expansion plans. The Bloomberg financial reporting group reported that Fonterra paid NZD45 million (US$31 million) for the 51% stake in the company it didn't already own, following a change in legislation which now allows Saudi businesses to be fully owned by foreign firms. The move shows confidence that demand for dairy goods in Saudi Arabia will continue to grow. In a statement recently released, Fonterra’s Asia/Africa and Middle East regional managing director said the acquisition was an important step in growing the company’s business in a growing dairy market. “We are building a sizeable business in 20 countries in this region which combined, account for 250 million people and a dairy market value of more than US$5 billion,” he said. With the full ownership of the factory, Fonterra would be able to secure its manufacturing capacity requirements for the Middle East and Africa (MEA) and the Commonwealth of Independent States (CIS) in addition to allowing for further expansion and investment. At present, SNZMP packs and processes 30,000 tonnes of milk for Fonterra and several other co‐packing customers. 4.) National government programs to assist with the development of dairy operations As mentioned in the introductory overview, Saudi Arabia's dairy industry has been transformed over the past decade, with production rising dramatically. The country is now home to some of the most advanced dairy farms in the world. Fresh milk output in 1998 stood at 581,000 MT, yet just 10 years later this had grown by almost 75% to 1.01 million MT. The government has supported the growth of the industry, not only through subsidies, but also by investing into building up infrastructure and tapping into renewable water resources, providing strong fundamentals. 5.) Existing or proposed external assistance programs to develop the industry (foreign government and/or aid programs) Austrade Offices, North Africa: None that we know of. 6.) Overview of the typical dairy farming arrangements As mentioned in the introduction, unlike the dairy sector in most developing countries, the Saudi dairy industry is not dominated by small‐scale producers. Saudi Arabia's largest dairy company is Al Marai Co Ltd, with a herd of 38,000 dairy cattle. However, growth in dairy production in Saudi Arabia is held back by the substantial lack of pastures for grazing. Limited water resources will mean that future increased production will have to emanate from costly atmosphere controlled, fully housed feedlot dairy units.
Capability Assessment of Australian Dairy Technology and Services ‐ AANC Pty Ltd, July 2010
_________________________________________________________________________________________________________ Page 288 of 329
7.) Availability of forage and raw materials for feed & nutrition As outlined below, Saudi Arabia is almost totally dependent on imports of the major food and feed grains – barley, corn, wheat and rice. The feeding of concentrates to dairy cows is therefore expensive, whilst roughages sources in feed rations (such as forage corn or grass or legume silage or hay) are costly to produce, considering the shortage of arable land available (only 1 % of land mass) and the severe shortage of water resources in Saudi Arabia. Business Monitor International (BMI) Saudi Arabia: Agribusiness Report, Q3 2010, Including 5‐year forecasts to 2014, May, 2010 Saudi Arabia once had a thriving grains sector, allowing the country to both meet local demand and export significant volumes. However, this dynamic was maintained through an array of support mechanisms, such as producer subsidies and the state buying out farmers, combined with massive petrodollar expenditure. In the late 1970s and 1980s, the government was reportedly paying farmers almost US$1,000 per tonne of wheat, far above the world price. The strategy became increasingly unsustainable due to the impact it was having on Saudi's precious water aquifers, a critical source of fresh water for the country. WTO entry and the related responsibilities, added further incentive to decrease government involvement in this sector. The drastic change in policy occurred in November 2007 when the Council of Ministers passed a resolution mandating that water be used more sustainably. To achieve this, the body responsible for procurement of wheat, was ordered to cut purchases of local wheat by 12.5% a year with all purchases to be stopped by 2016. BMI has long believed that the producer support system was inefficient and ultimately unsustainable for both economic and environmental reasons, and so therefore welcomes the change of policy. By the end of 2014, BMI expects Saudi Arabia to be overwhelmingly reliant on imported wheat with annual imports to be between 2.5 million and 3.0 million MT. Rice is the staple grain in Saudi Arabia, with consumption rising in line with population growth. However, due also to the high water reliance of this crop, no rice is now produced domestically, with imports accounting for 100% of consumption. Barley is by far the most popular domestically consumed grain, with consumption forecast to increase by a further 11.3%, fuelled by the expected growth in the livestock feed industry, including for dairy cattle. Again due to water concerns, the country is now one of the biggest barley importers in the world, buying 8 million tonnes from overseas in 2008. (Saudi Arabia currently relies heavily on Ukrainian and Australian farmers to feed its livestock.) With Saudi Arabia's grain import bill soaring, rising by an estimated 22% in 2010 alone, the government is looking for ways to cut costs. In recent years the Saudi government has been actively encouraging Saudi companies to invest in farmland and agribusiness in foreign countries. Turkey and Egypt, Sudan and other African countries have been the focus of much investment, as have Pakistan and the Ukraine. 8.) Brief overview of major companies with integrated dairy operations
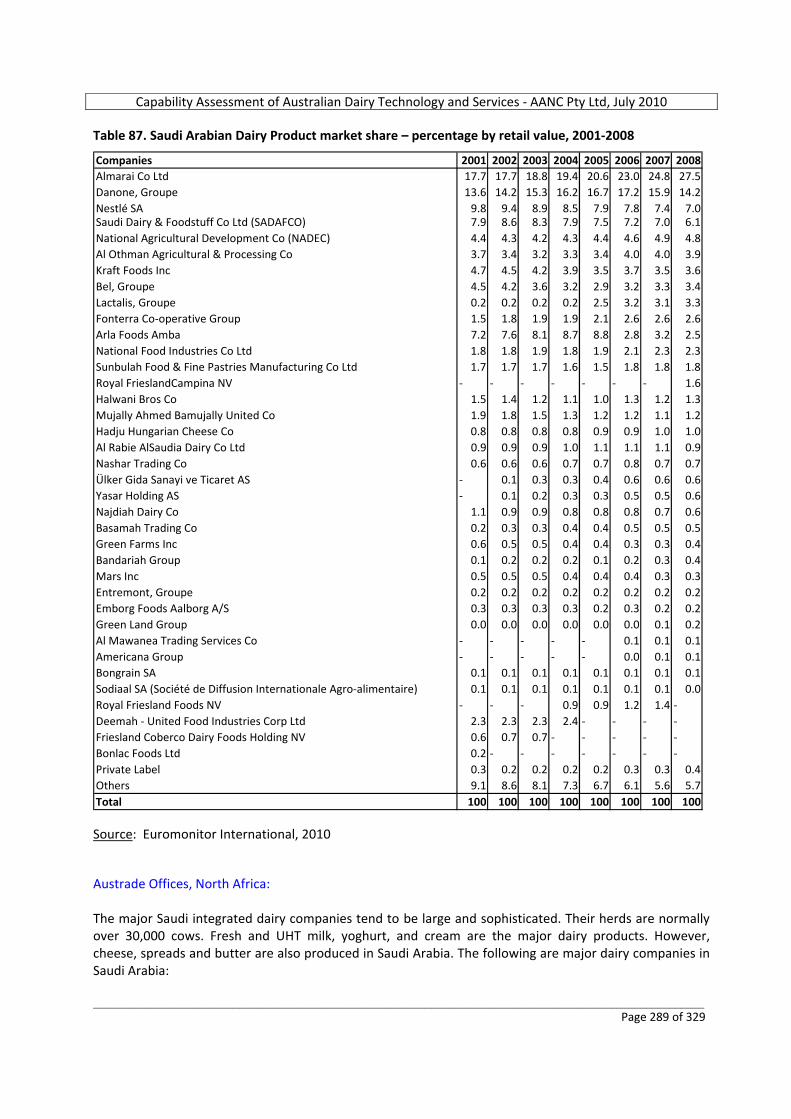
Capability Assessment of Australian Dairy Technology and Services ‐ AANC Pty Ltd, July 2010
_________________________________________________________________________________________________________ Page 289 of 329
Table 87. Saudi Arabian Dairy Product market share – percentage by retail value, 2001‐2008
Companies 2001 2002 2003 2004 2005 2006 2007 2008Almarai Co Ltd 17.7 17.7 18.8 19.4 20.6 23.0 24.8 27.5Danone, Groupe 13.6 14.2 15.3 16.2 16.7 17.2 15.9 14.2Nestlé SA 9.8 9.4 8.9 8.5 7.9 7.8 7.4 7.0Saudi Dairy & Foodstuff Co Ltd (SADAFCO) 7.9 8.6 8.3 7.9 7.5 7.2 7.0 6.1National Agricultural Development Co (NADEC) 4.4 4.3 4.2 4.3 4.4 4.6 4.9 4.8Al Othman Agricultural & Processing Co 3.7 3.4 3.2 3.3 3.4 4.0 4.0 3.9Kraft Foods Inc 4.7 4.5 4.2 3.9 3.5 3.7 3.5 3.6Bel, Groupe 4.5 4.2 3.6 3.2 2.9 3.2 3.3 3.4Lactalis, Groupe 0.2 0.2 0.2 0.2 2.5 3.2 3.1 3.3Fonterra Co‐operative Group 1.5 1.8 1.9 1.9 2.1 2.6 2.6 2.6Arla Foods Amba 7.2 7.6 8.1 8.7 8.8 2.8 3.2 2.5National Food Industries Co Ltd 1.8 1.8 1.9 1.8 1.9 2.1 2.3 2.3Sunbulah Food & Fine Pastries Manufacturing Co Ltd 1.7 1.7 1.7 1.6 1.5 1.8 1.8 1.8Royal FrieslandCampina NV ‐ ‐ ‐ ‐ ‐ ‐ ‐ 1.6Halwani Bros Co 1.5 1.4 1.2 1.1 1.0 1.3 1.2 1.3Mujally Ahmed Bamujally United Co 1.9 1.8 1.5 1.3 1.2 1.2 1.1 1.2Hadju Hungarian Cheese Co 0.8 0.8 0.8 0.8 0.9 0.9 1.0 1.0Al Rabie AlSaudia Dairy Co Ltd 0.9 0.9 0.9 1.0 1.1 1.1 1.1 0.9Nashar Trading Co 0.6 0.6 0.6 0.7 0.7 0.8 0.7 0.7Ülker Gida Sanayi ve Ticaret AS ‐ 0.1 0.3 0.3 0.4 0.6 0.6 0.6Yasar Holding AS ‐ 0.1 0.2 0.3 0.3 0.5 0.5 0.6Najdiah Dairy Co 1.1 0.9 0.9 0.8 0.8 0.8 0.7 0.6Basamah Trading Co 0.2 0.3 0.3 0.4 0.4 0.5 0.5 0.5Green Farms Inc 0.6 0.5 0.5 0.4 0.4 0.3 0.3 0.4Bandariah Group 0.1 0.2 0.2 0.2 0.1 0.2 0.3 0.4Mars Inc 0.5 0.5 0.5 0.4 0.4 0.4 0.3 0.3Entremont, Groupe 0.2 0.2 0.2 0.2 0.2 0.2 0.2 0.2Emborg Foods Aalborg A/S 0.3 0.3 0.3 0.3 0.2 0.3 0.2 0.2Green Land Group 0.0 0.0 0.0 0.0 0.0 0.0 0.1 0.2Al Mawanea Trading Services Co ‐ ‐ ‐ ‐ ‐ 0.1 0.1 0.1Americana Group ‐ ‐ ‐ ‐ ‐ 0.0 0.1 0.1Bongrain SA 0.1 0.1 0.1 0.1 0.1 0.1 0.1 0.1Sodiaal SA (Société de Diffusion Internationale Agro‐alimentaire) 0.1 0.1 0.1 0.1 0.1 0.1 0.1 0.0Royal Friesland Foods NV ‐ ‐ ‐ 0.9 0.9 1.2 1.4 ‐Deemah ‐ United Food Industries Corp Ltd 2.3 2.3 2.3 2.4 ‐ ‐ ‐ ‐Friesland Coberco Dairy Foods Holding NV 0.6 0.7 0.7 ‐ ‐ ‐ ‐ ‐Bonlac Foods Ltd 0.2 ‐ ‐ ‐ ‐ ‐ ‐ ‐Private Label 0.3 0.2 0.2 0.2 0.2 0.3 0.3 0.4Others 9.1 8.6 8.1 7.3 6.7 6.1 5.6 5.7Total 100 100 100 100 100 100 100 100 Source: Euromonitor International, 2010 Austrade Offices, North Africa: The major Saudi integrated dairy companies tend to be large and sophisticated. Their herds are normally over 30,000 cows. Fresh and UHT milk, yoghurt, and cream are the major dairy products. However, cheese, spreads and butter are also produced in Saudi Arabia. The following are major dairy companies in Saudi Arabia:
Capability Assessment of Australian Dairy Technology and Services ‐ AANC Pty Ltd, July 2010
_________________________________________________________________________________________________________ Page 290 of 329
o Al Marai (www.almarai.com) o National Agriculture Development Company – NADEC (www.nadec.com.sa) o Al Safi Danone (www.alsafidanone.com) Detailed information on AL MARAI Co ‐ Packaged Food ‐ Saudi Arabia Al Marai Co is the largest dairy company in the Middle East. It is an integrated organisation spanning the food supply chain from dairy farms through to retail stores. Its main activity is the production and marketing of fresh “laban”, milk and yoghurt among many other dairy products like cheese, cream, condensed/evaporated milk and chilled desserts throughout the Gulf Co‐operation Council (GCC) and other neighbouring countries. The company also produces a range of jams, tomato pastes, butter and ghee products. Al Marai has a herd of 38,000 livestock, yielding around 500,000 tonnes of milk. The company's processing capacity is 1,500,000 litres per day. It operates a fleet of 922 sales vans via 28 sales depots throughout the Gulf region. According to the company, it has one of the largest food processing facilities in the world, owning more than 40 production and filling/packaging lines. Al Marai expects to increase its revenue base through continual acquisitions of small dairy firms in the medium term (the most recent acquisitions occurred in December 2005 (Green Farms Dairy Co) and the first quarter of 2006 (Al Safwa Dairy Co). Al Marai is acknowledged as the largest exporter of dairy products in Saudi Arabia. It is the only fresh dairy company that operates in all six GCC countries. It is also the only GCC fresh dairy company with an extensive range of cheese and butter products. The company served more than 35,000 customers on a daily basis throughout Saudi Arabia, Kuwait, Bahrain, Qatar, the United Arab Emirates and Oman during 2007. Products are also exported to Yemen, Jordan and Lebanon. Al Marai was also the first dairy farm in the world to gain ISO 9002 accreditation. Recently Al Marai announced that it would invest SAR650 million (US$173 million) in a new infant formula plant, with construction due to be completed in 2011. 9.) Availability of Artificial Insemination laboratories and testing facilities for cattle; also veterinary services Austrade Offices, North Africa: Artificial Insemination laboratories and testing facilities for cattle are available and normally incorporated in the larger dairy farms, but there are also independent laboratories and veterinary clinics which serve smaller farms. Furthermore, there are laboratories and test facilities managed by the government, in particular the Ministry of Agriculture. 10.) Agribusiness educational facilities to support dairy production Austrade Offices, North Africa:
Capability Assessment of Australian Dairy Technology and Services ‐ AANC Pty Ltd, July 2010
_________________________________________________________________________________________________________ Page 291 of 329
Dairy companies normally recruit experienced and qualified expatriates for managerial positions on dairy enterprises. Education in agricultural and livestock management practices is restricted to university faculties, which are quite widespread throughout the main urban areas of Saudi Arabia. As mentioned previously, the Government is currently investing in training as part of its 'Saudisation' process, in order to increase the proportion of Saudi nationals in the workforce relative to foreigners. 11.) Dairy consumption trends (past 5 years) Business Monitor International (BMI) Saudi Arabia: Agribusiness Report, Q3 2010, Including 5‐year forecasts to 2014, May, 2010 Per capita dairy consumption in Saudi Arabia presently stands at around 54 kg a year ‐ a rate far higher than is typical in most developing countries. Demand for liquid milk is expected to climb in accordance with supply expansion by 1.5% year‐on‐year in 2010 and 12.6% from 2009 to 2014, a slowdown from the 19.1% growth rate experienced between 2004 and 2009. Meanwhile, demand for powdered milk is forecast to experience a far stronger growth rate of 28.3% to 2014, as this remains a more affordable and durable commodity, also reflecting the country’s weak cold chain distribution infrastructure in many regions. All of the demand for powdered milk is expected to be met by imports.
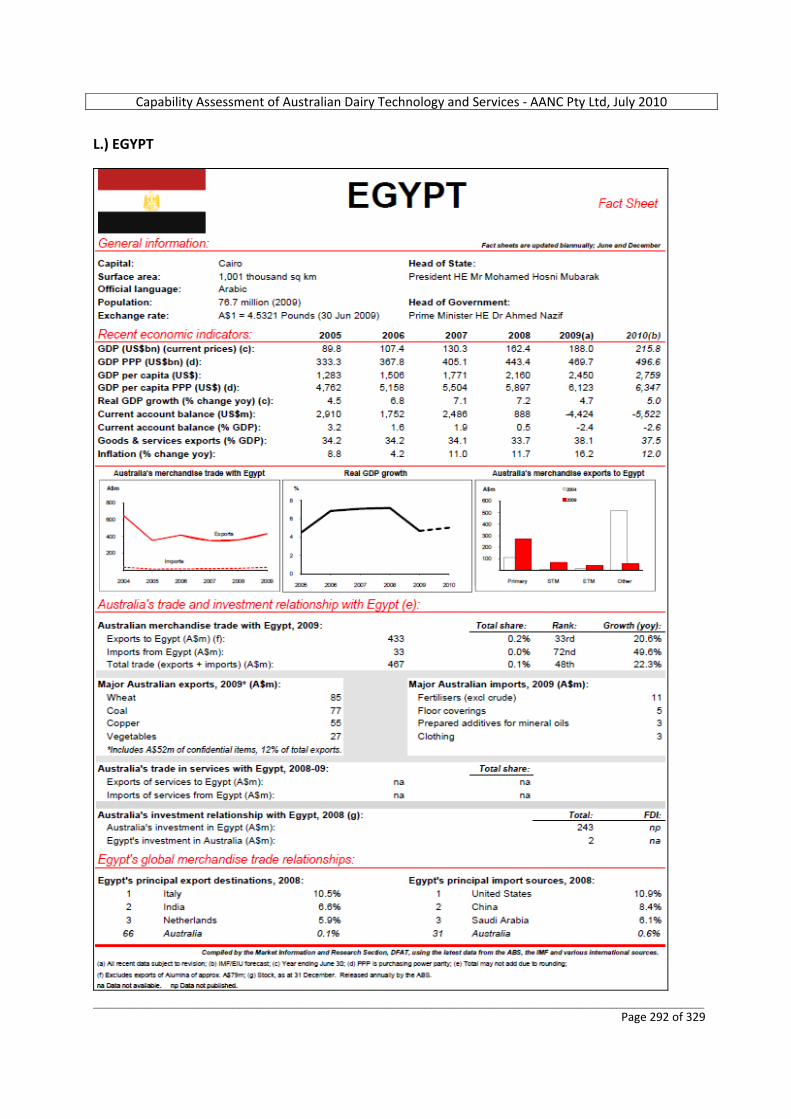
Capability Assessment of Australian Dairy Technology and Services ‐ AANC Pty Ltd, July 2010
_________________________________________________________________________________________________________ Page 292 of 329
L.) EGYPT
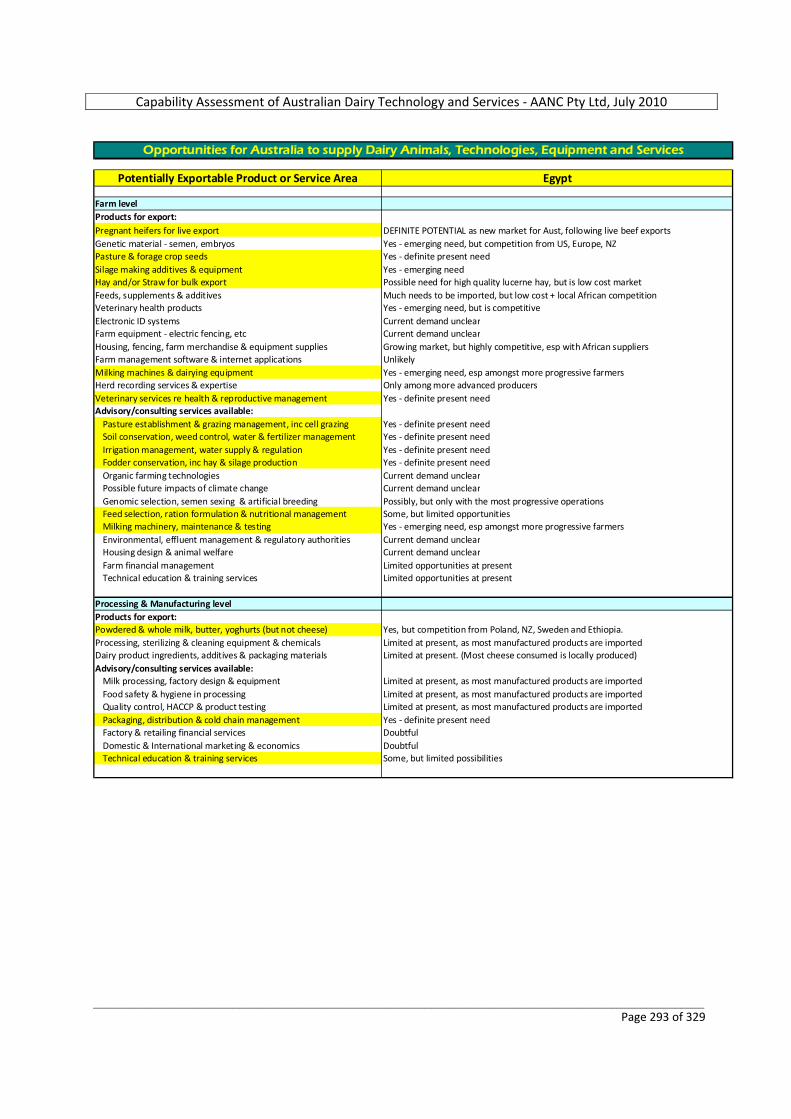
Capability Assessment of Australian Dairy Technology and Services ‐ AANC Pty Ltd, July 2010
_________________________________________________________________________________________________________ Page 293 of 329
Potentially Exportable Product or Service Area Egypt
Farm levelProducts for export:Pregnant heifers for live export DEFINITE POTENTIAL as new market for Aust, following live beef exportsGenetic material ‐ semen, embryos Yes ‐ emerging need, but competition from US, Europe, NZPasture & forage crop seeds Yes ‐ definite present needSilage making additives & equipment Yes ‐ emerging needHay and/or Straw for bulk export Possible need for high quality lucerne hay, but is low cost marketFeeds, supplements & additives Much needs to be imported, but low cost + local African competitionVeterinary health products Yes ‐ emerging need, but is competitiveElectronic ID systems Current demand unclearFarm equipment ‐ electric fencing, etc Current demand unclearHousing, fencing, farm merchandise & equipment supplies Growing market, but highly competitive, esp with African suppliersFarm management software & internet applications UnlikelyMilking machines & dairying equipment Yes ‐ emerging need, esp amongst more progressive farmersHerd recording services & expertise Only among more advanced producersVeterinary services re health & reproductive management Yes ‐ definite present needAdvisory/consulting services available:
Pasture establishment & grazing management, inc cell grazing Yes ‐ definite present needSoil conservation, weed control, water & fertilizer management Yes ‐ definite present needIrrigation management, water supply & regulation Yes ‐ definite present needFodder conservation, inc hay & silage production Yes ‐ definite present needOrganic farming technologies Current demand unclearPossible future impacts of climate change Current demand unclearGenomic selection, semen sexing & artificial breeding Possibly, but only with the most progressive operationsFeed selection, ration formulation & nutritional management Some, but limited opportunitiesMilking machinery, maintenance & testing Yes ‐ emerging need, esp amongst more progressive farmersEnvironmental, effluent management & regulatory authorities Current demand unclearHousing design & animal welfare Current demand unclearFarm financial management Limited opportunities at presentTechnical education & training services Limited opportunities at present
Processing & Manufacturing levelProducts for export:Powdered & whole milk, butter, yoghurts (but not cheese) Yes, but competition from Poland, NZ, Sweden and Ethiopia. Processing, sterilizing & cleaning equipment & chemicals Limited at present, as most manufactured products are importedDairy product ingredients, additives & packaging materials Limited at present. (Most cheese consumed is locally produced)Advisory/consulting services available:
Milk processing, factory design & equipment Limited at present, as most manufactured products are importedFood safety & hygiene in processing Limited at present, as most manufactured products are importedQuality control, HACCP & product testing Limited at present, as most manufactured products are importedPackaging, distribution & cold chain management Yes ‐ definite present needFactory & retailing financial services DoubtfulDomestic & International marketing & economics DoubtfulTechnical education & training services Some, but limited possibilities
Opportunities for Australia to supply Dairy Animals, Technologies, Equipment and Services
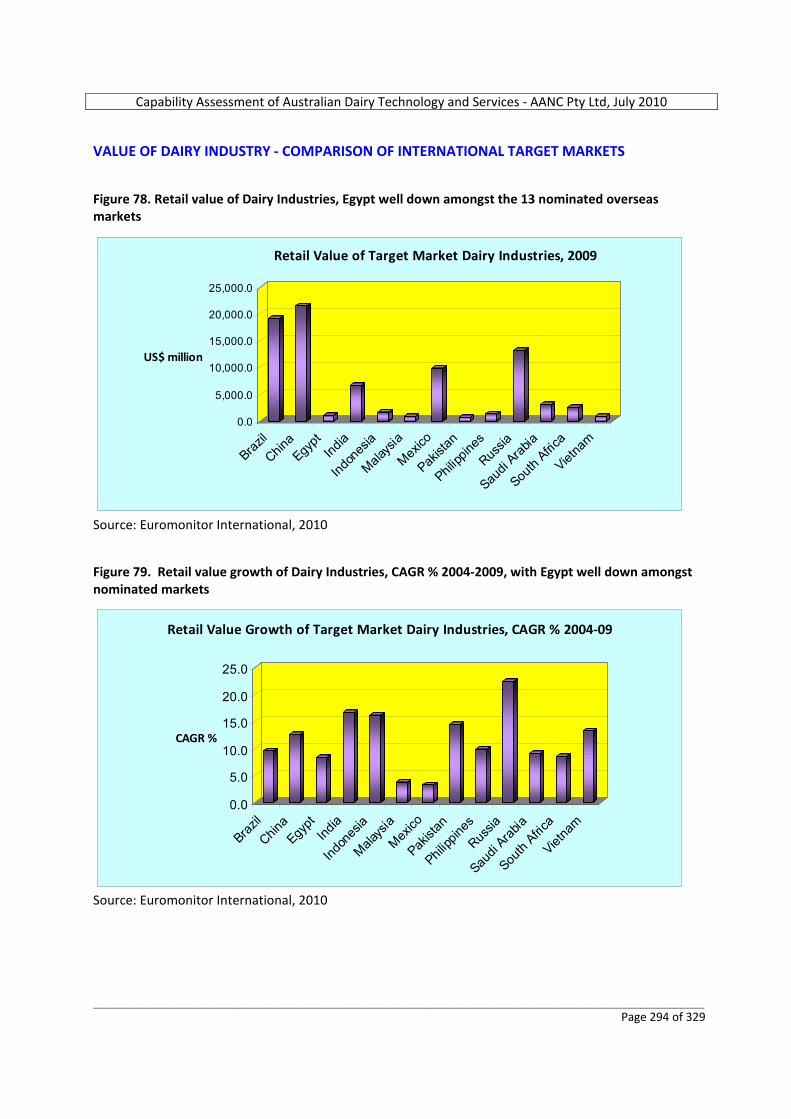
Capability Assessment of Australian Dairy Technology and Services ‐ AANC Pty Ltd, July 2010
_________________________________________________________________________________________________________ Page 294 of 329
VALUE OF DAIRY INDUSTRY ‐ COMPARISON OF INTERNATIONAL TARGET MARKETS Figure 78. Retail value of Dairy Industries, Egypt well down amongst the 13 nominated overseas markets
0.0
5,000.0
10,000.0
15,000.0
20,000.0
25,000.0
US$ million
Brazil
China
Egypt
India
Indon
esia
Malays
ia
Mexico
Pakist
an
Philipp
ines
Russia
Saudi
Arabia
South
Africa
Vietna
m
Retail Value of Target Market Dairy Industries, 2009
Source: Euromonitor International, 2010 Figure 79. Retail value growth of Dairy Industries, CAGR % 2004‐2009, with Egypt well down amongst nominated markets
0.0
5.0
10.0
15.0
20.0
25.0
CAGR %
Brazil
China
Egypt
India
Indon
esia
Malays
ia
Mexico
Pakist
an
Philipp
ines
Russia
Saudi
Arabia
South
Africa
Vietna
m
Retail Value Growth of Target Market Dairy Industries, CAGR % 2004‐09
Source: Euromonitor International, 2010
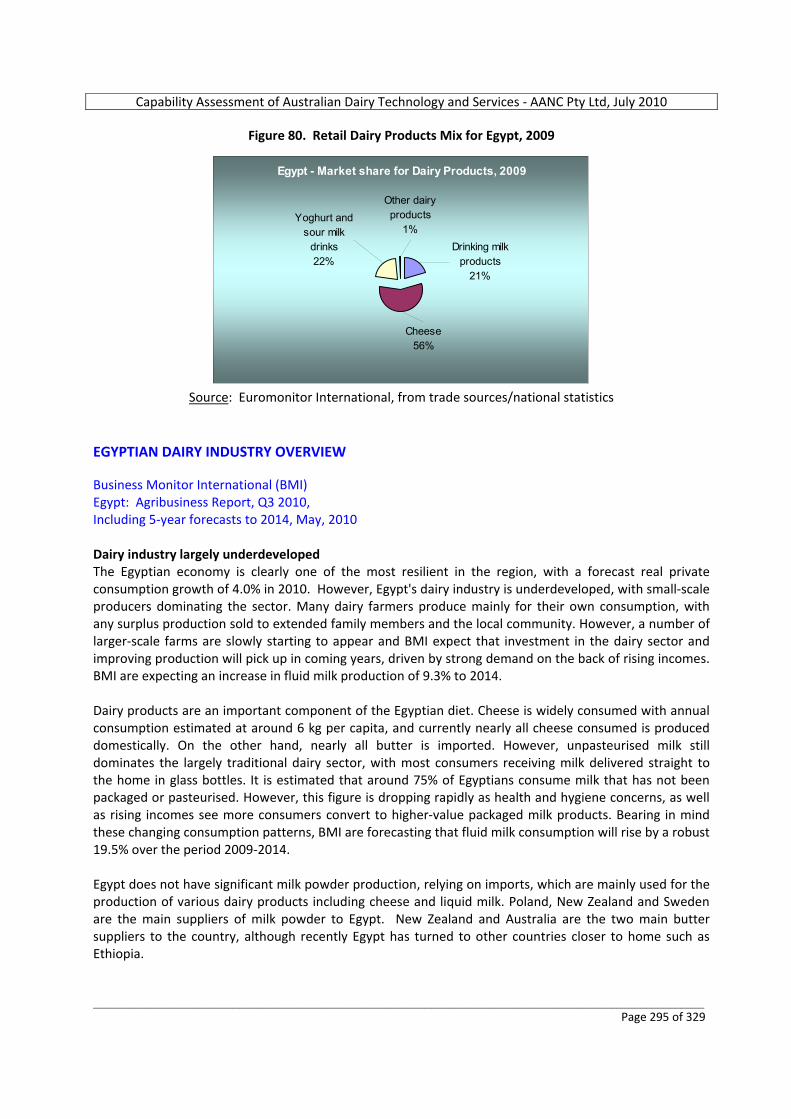
Capability Assessment of Australian Dairy Technology and Services ‐ AANC Pty Ltd, July 2010
_________________________________________________________________________________________________________ Page 295 of 329
Figure 80. Retail Dairy Products Mix for Egypt, 2009
Egypt - Market share for Dairy Products, 2009
Other dairy products
1%Yoghurt and
sour milk drinks22%
Cheese56%
Drinking milk products
21%
Source: Euromonitor International, from trade sources/national statistics
EGYPTIAN DAIRY INDUSTRY OVERVIEW Business Monitor International (BMI) Egypt: Agribusiness Report, Q3 2010, Including 5‐year forecasts to 2014, May, 2010 Dairy industry largely underdeveloped The Egyptian economy is clearly one of the most resilient in the region, with a forecast real private consumption growth of 4.0% in 2010. However, Egypt's dairy industry is underdeveloped, with small‐scale producers dominating the sector. Many dairy farmers produce mainly for their own consumption, with any surplus production sold to extended family members and the local community. However, a number of larger‐scale farms are slowly starting to appear and BMI expect that investment in the dairy sector and improving production will pick up in coming years, driven by strong demand on the back of rising incomes. BMI are expecting an increase in fluid milk production of 9.3% to 2014. Dairy products are an important component of the Egyptian diet. Cheese is widely consumed with annual consumption estimated at around 6 kg per capita, and currently nearly all cheese consumed is produced domestically. On the other hand, nearly all butter is imported. However, unpasteurised milk still dominates the largely traditional dairy sector, with most consumers receiving milk delivered straight to the home in glass bottles. It is estimated that around 75% of Egyptians consume milk that has not been packaged or pasteurised. However, this figure is dropping rapidly as health and hygiene concerns, as well as rising incomes see more consumers convert to higher‐value packaged milk products. Bearing in mind these changing consumption patterns, BMI are forecasting that fluid milk consumption will rise by a robust 19.5% over the period 2009‐2014. Egypt does not have significant milk powder production, relying on imports, which are mainly used for the production of various dairy products including cheese and liquid milk. Poland, New Zealand and Sweden are the main suppliers of milk powder to Egypt. New Zealand and Australia are the two main butter suppliers to the country, although recently Egypt has turned to other countries closer to home such as Ethiopia.
Capability Assessment of Australian Dairy Technology and Services ‐ AANC Pty Ltd, July 2010
_________________________________________________________________________________________________________ Page 296 of 329
Looking more generally across the agricultural landscape of the country, urban sprawl and limited water availability are both contributing to the loss of the little agricultural land there is in Egypt, with climate change also contributing to desertification. Egypt is considered a ‘water‐poor country’. Nevertheless, the Egyptian government has been pursuing a policy of expanding agricultural production in an effort to decrease import dependency. In order to secure its long‐term food security, Egypt has been increasingly looking abroad, thereby joining the worldwide trend of import dependant countries, such as Saudi Arabia, investing in farmland in foreign countries. Need for imported dairy cattle With the number of cattle in the country declining, this has, at times, resulted in a drop in production and a general increase in milk prices. Consequently, cattle farmers have been looking to import dairy cattle in order to expand local production. However, the government has imposed various bans on importing live cattle from most European countries due to disease concerns. Slowly a number of these bans have been lifted, including the ban on imports of pregnant heifers from Canada and the US, which underpins BMI’s positive milk outlook. [AUTHOR’S NOTE: Although there have not been live exports of dairy heifers from Australia to Egypt to date, there have been shipments of live beef cattle and sheep to Egypt and so there does appear real potential for Australia to compete for the dairy cattle supply market, especially in view of our country’s highly impressive animal health status.] SWOT ANALYSIS Business Monitor International (BMI) Egypt: Agribusiness Report, Q3 2010, Including 5‐year forecasts to 2014, May, 2010 Egyptian Agribusiness Environment SWOT Strengths • With a population of some 80 million and growing, Egypt is the largest market in the Arab world. • The government has made development of the agricultural sector a priority, ensuring continued levels
of investment. • Rising disposable incomes and consumer habits becoming more ‘westernised’, particularly with the
increasing prevalence of fast food restaurants, have helped fuel domestic consumption growth. • Geographical location is good for trade, as Egypt has access to both the Mediterranean and the Red
Sea, as well as the key Suez Canal route, which connects Europe, Black Sea countries, and Asia. • Relative political stability, and low wages in global terms, are advantages for foreign investors. • Egypt has no serious disputes with neighbouring states, although its relations with Syria and Iran are
relatively tense. Weaknesses • Currently only 3.5% of Egypt's landmass (centred mostly around the Nile River delta) qualifies as
agricultural land, severely limiting output growth. • Many consumers do not own white goods and therefore will not purchase high‐value fresh dairy
products, holding back growth in this sector.
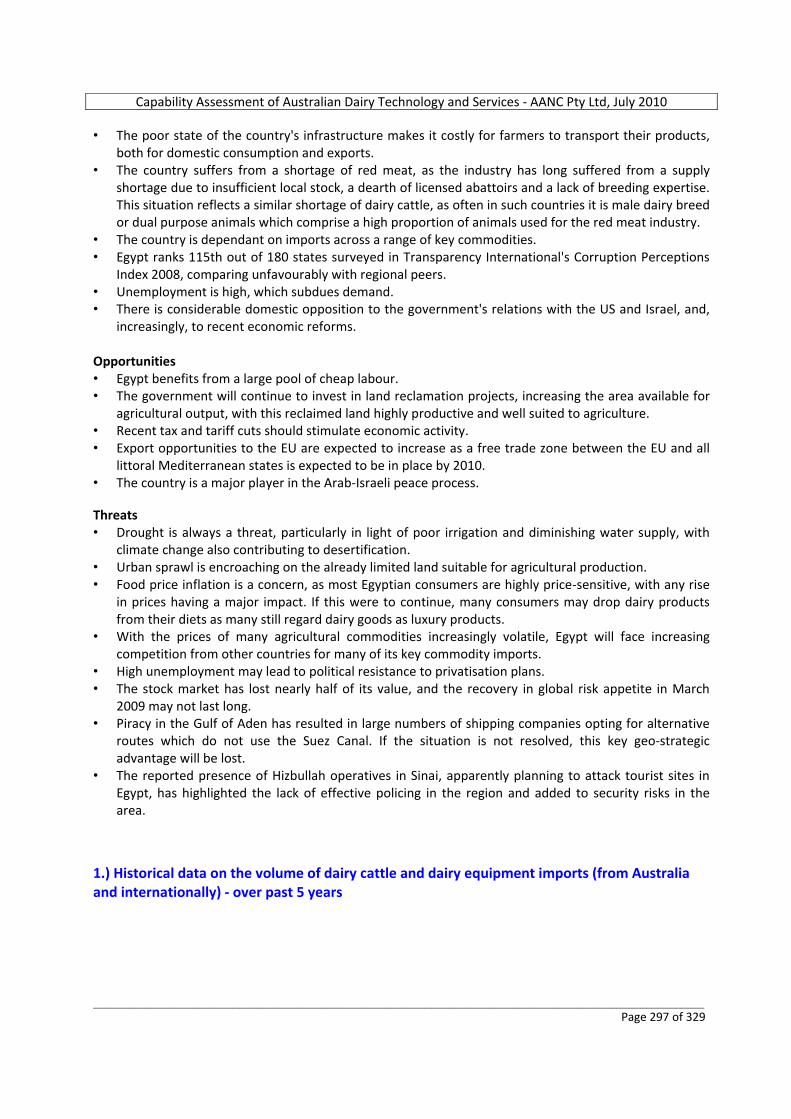
Capability Assessment of Australian Dairy Technology and Services ‐ AANC Pty Ltd, July 2010
_________________________________________________________________________________________________________ Page 297 of 329
• The poor state of the country's infrastructure makes it costly for farmers to transport their products, both for domestic consumption and exports.
• The country suffers from a shortage of red meat, as the industry has long suffered from a supply shortage due to insufficient local stock, a dearth of licensed abattoirs and a lack of breeding expertise. This situation reflects a similar shortage of dairy cattle, as often in such countries it is male dairy breed or dual purpose animals which comprise a high proportion of animals used for the red meat industry.
• The country is dependant on imports across a range of key commodities. • Egypt ranks 115th out of 180 states surveyed in Transparency International's Corruption Perceptions
Index 2008, comparing unfavourably with regional peers. • Unemployment is high, which subdues demand. • There is considerable domestic opposition to the government's relations with the US and Israel, and,
increasingly, to recent economic reforms. Opportunities • Egypt benefits from a large pool of cheap labour. • The government will continue to invest in land reclamation projects, increasing the area available for
agricultural output, with this reclaimed land highly productive and well suited to agriculture. • Recent tax and tariff cuts should stimulate economic activity. • Export opportunities to the EU are expected to increase as a free trade zone between the EU and all
littoral Mediterranean states is expected to be in place by 2010. • The country is a major player in the Arab‐Israeli peace process. Threats • Drought is always a threat, particularly in light of poor irrigation and diminishing water supply, with
climate change also contributing to desertification. • Urban sprawl is encroaching on the already limited land suitable for agricultural production. • Food price inflation is a concern, as most Egyptian consumers are highly price‐sensitive, with any rise
in prices having a major impact. If this were to continue, many consumers may drop dairy products from their diets as many still regard dairy goods as luxury products.
• With the prices of many agricultural commodities increasingly volatile, Egypt will face increasing competition from other countries for many of its key commodity imports.
• High unemployment may lead to political resistance to privatisation plans. • The stock market has lost nearly half of its value, and the recovery in global risk appetite in March
2009 may not last long. • Piracy in the Gulf of Aden has resulted in large numbers of shipping companies opting for alternative
routes which do not use the Suez Canal. If the situation is not resolved, this key geo‐strategic advantage will be lost.
• The reported presence of Hizbullah operatives in Sinai, apparently planning to attack tourist sites in Egypt, has highlighted the lack of effective policing in the region and added to security risks in the area.
1.) Historical data on the volume of dairy cattle and dairy equipment imports (from Australia and internationally) ‐ over past 5 years
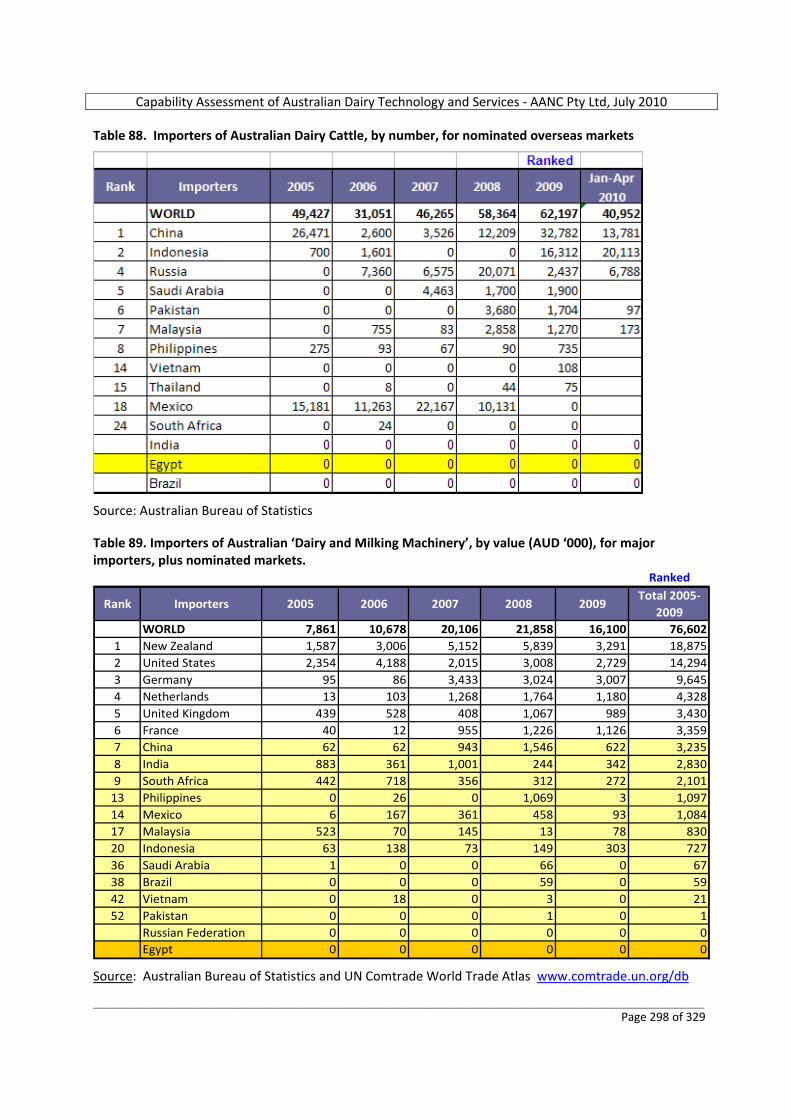
Capability Assessment of Australian Dairy Technology and Services ‐ AANC Pty Ltd, July 2010
_________________________________________________________________________________________________________ Page 298 of 329
Table 88. Importers of Australian Dairy Cattle, by number, for nominated overseas markets
Source: Australian Bureau of Statistics Table 89. Importers of Australian ‘Dairy and Milking Machinery’, by value (AUD ‘000), for major importers, plus nominated markets.
Ranked
Rank Importers 2005 2006 2007 2008 2009Total 2005‐
2009WORLD 7,861 10,678 20,106 21,858 16,100 76,602
1 New Zealand 1,587 3,006 5,152 5,839 3,291 18,8752 United States 2,354 4,188 2,015 3,008 2,729 14,2943 Germany 95 86 3,433 3,024 3,007 9,6454 Netherlands 13 103 1,268 1,764 1,180 4,3285 United Kingdom 439 528 408 1,067 989 3,4306 France 40 12 955 1,226 1,126 3,3597 China 62 62 943 1,546 622 3,2358 India 883 361 1,001 244 342 2,8309 South Africa 442 718 356 312 272 2,101
13 Philippines 0 26 0 1,069 3 1,09714 Mexico 6 167 361 458 93 1,08417 Malaysia 523 70 145 13 78 83020 Indonesia 63 138 73 149 303 72736 Saudi Arabia 1 0 0 66 0 6738 Brazil 0 0 0 59 0 5942 Vietnam 0 18 0 3 0 2152 Pakistan 0 0 0 1 0 1
Russian Federation 0 0 0 0 0 0Egypt 0 0 0 0 0 0
Source: Australian Bureau of Statistics and UN Comtrade World Trade Atlas www.comtrade.un.org/db
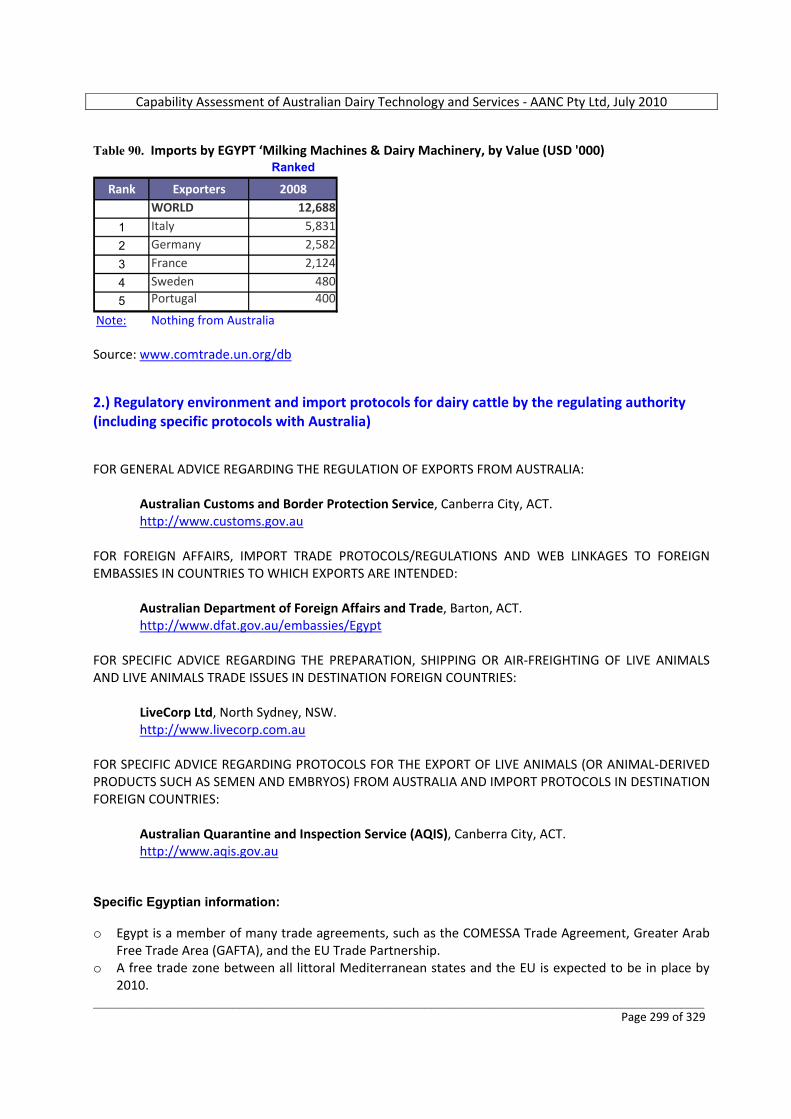
Capability Assessment of Australian Dairy Technology and Services ‐ AANC Pty Ltd, July 2010
_________________________________________________________________________________________________________ Page 299 of 329
Table 90. Imports by EGYPT ‘Milking Machines & Dairy Machinery, by Value (USD '000)
Ranked
Rank Exporters 2008WORLD 12,688
1 Italy 5,831
2 Germany 2,582
3 France 2,124
4 Sweden 480
5 Portugal 400
Note: Nothing from Australia Source: www.comtrade.un.org/db 2.) Regulatory environment and import protocols for dairy cattle by the regulating authority (including specific protocols with Australia) FOR GENERAL ADVICE REGARDING THE REGULATION OF EXPORTS FROM AUSTRALIA:
Australian Customs and Border Protection Service, Canberra City, ACT. http://www.customs.gov.au
FOR FOREIGN AFFAIRS, IMPORT TRADE PROTOCOLS/REGULATIONS AND WEB LINKAGES TO FOREIGN EMBASSIES IN COUNTRIES TO WHICH EXPORTS ARE INTENDED:
Australian Department of Foreign Affairs and Trade, Barton, ACT. http://www.dfat.gov.au/embassies/Egypt
FOR SPECIFIC ADVICE REGARDING THE PREPARATION, SHIPPING OR AIR‐FREIGHTING OF LIVE ANIMALS AND LIVE ANIMALS TRADE ISSUES IN DESTINATION FOREIGN COUNTRIES:
LiveCorp Ltd, North Sydney, NSW. http://www.livecorp.com.au
FOR SPECIFIC ADVICE REGARDING PROTOCOLS FOR THE EXPORT OF LIVE ANIMALS (OR ANIMAL‐DERIVED PRODUCTS SUCH AS SEMEN AND EMBRYOS) FROM AUSTRALIA AND IMPORT PROTOCOLS IN DESTINATION FOREIGN COUNTRIES:
Australian Quarantine and Inspection Service (AQIS), Canberra City, ACT. http://www.aqis.gov.au
Specific Egyptian information: o Egypt is a member of many trade agreements, such as the COMESSA Trade Agreement, Greater Arab
Free Trade Area (GAFTA), and the EU Trade Partnership. o A free trade zone between all littoral Mediterranean states and the EU is expected to be in place by
2010.
Capability Assessment of Australian Dairy Technology and Services ‐ AANC Pty Ltd, July 2010
_________________________________________________________________________________________________________ Page 300 of 329
2.) Investment environment for dairy operations (domestic and foreign assistance, tax incentives, export zones, etc) and examples of FDI (from any country) Austrade Offices, North Africa: FDI attraction is on the top of the Egyptian Government Agenda. Therefore, the Government is offering a lot of incentives to investors, such as tax concessions, subsidised energy rates, tax reductions, free zones, etc. Egypt is also a member of many trade agreements like COMESSA Trade Agreement, Greater Arab Free Trade Area (GAFTA), and EU Trade Partnership. These give competitive advantages to Egyptian made products in several export markets. Examples of FDI investments into Dairy Sector in Egypt include Danone, Arla Foods, Fonterra, Nestle, Al Marai (Saudi Arabia), and Americana (Kuwait). For more information on Investment environment, see www.gafinet.org Business Monitor International (BMI) Egypt: Agribusiness Report, Q3 2010, Including 5‐year forecasts to 2014, May, 2010 Dairy is among the better performing of Egypt's agribusiness subsectors with numerous investment and employment opportunities throughout the value chain and, increasingly, in the manufacture of processed dairy goods. In 1998 IGI Beyti, the agricultural arm of Egyptian private equity firm International Group for Investments, entered the dairy market and revolutionised the sector. Standardised production and trackable health and safety procedures were introduced, while pasteurisation allowed for longer shelf lives and removed the need for consumers to boil all fresh milk purchases. This served to drive up demand for locally produced dairy. As the landscape changed, the potential profits to be reaped from Egyptian dairy production began attracting investors. Arab interests, keen to diversify into regional markets, sought opportunities in dairy processing. Al Marai’s entry Saudi Arabia's largest dairy company Al Marai acquired Beyti for US$115 million in June 2009, as part of its plans to engage on a US$1.6 billion expansion plan outside of the Gulf States to 2013. Al Marai is reportedly aiming to capture half of Egypt's dairy market by that year and will invest EGP100 million (US$18.3 million) in upgrading Beyti's operations. It is thought that Al Marai will strive to introduce an array of fruit‐milk drinks into the Egyptian market through its joint venture with PepsiCo. In December 2009, ownership of Beyti was transferred to International Dairy and Juice, Al Marai's JV with Pepsi. Fonterra Al Marai isn't the only company eying opportunities in Egypt. In 2009, the world's largest dairy exporter, New Zealand's Fonterra, announced a partnership with Arab Dairy Products to market its products in Egypt. Apparently, Arab Dairy Products will manufacture and market Fonterra's Anchor cheese brand. Arab Dairy Products will invest EGP100 million (US$17.8 million) in upgrading their facilities to produce Fonterra products. BMI expects more international investment in Egypt's dairy sector in the coming years as companies seek to benefit from strong demand driven by a fast‐growing population and rising per capita incomes.

Capability Assessment of Australian Dairy Technology and Services ‐ AANC Pty Ltd, July 2010
_________________________________________________________________________________________________________ Page 301 of 329
3.) National government programs to assist with the development of dairy operations Business Monitor International (BMI) Egypt: Agribusiness Report, Q3 2010, Including 5‐year forecasts to 2014, May, 2010 The Egyptian government has been pursuing a policy of expanding agricultural production in an effort to decrease import dependency. Austrade Offices, North Africa: As stated above, FDI attraction is on the top of the Egyptian Government Agenda. Therefore, the Government is offering a lot of incentives to investors, such as tax concessions, subsidised energy rates, tax reductions, free zones, etc, and the dairy sector has benefitted by attracting several multinational dairy processing and marketing companies. 4.) Existing or proposed external assistance programs to develop the industry (foreign government and/or aid programs) Austrade Offices, North Africa: Egypt is generally a recipient of several forms of foreign aid and grants from different sources, such as USAID, EU, World Bank, Japanese Government, etc. For more information on aids and assistance schemes to Egypt, see (http://www.mic.gov.eg/en/). In May 2009, the International Centre for Agricultural Research in the Dry Areas (ICARDA) signed a memorandum of understanding with the Egyptian Government to initiate a 10 year wheat improvement programme. The programme will focus on targeting research and development (R&D) towards areas where innovations are desperately needed if the country is to reduce some of its massive reliance on imports. This programme may indirectly benefit the dairy industry by improving the viability of agricultural regions, and also through the increased availability for wheat millrun (bran and pollard) or lower grades of wheat grain to be used as components of dairy cow rations. 5.) Overview of the typical dairy farming arrangements USDA Foreign Agricultural Service. Global Agricultural Information Network. GAIN Report Number: N/A Date: 2/24/2010 Egypt – Livestock and Products Annual 2010 The vast majority of the livestock herd is used primarily for dairy production. Egypt’s total cattle herd (including domesticated buffalo) decreased in 2009 and is estimated at about 6.248 million head out of which 49 % are buffalo, compared to 6.256 million head in 2008. This reduction is mostly due to the outbreaks of foot and mouth disease (FMD), which is endemic in Egypt, lumpy skin disease (LSD) and Bovine Ephemeral Fever (Three Day Fever). Many dairy farms were forced to slaughter their dairy cows for beef as a result of Bovine Ephemeral Fever outbreak this past year. In addition, due to the continued ban on live cattle imports from major exporting countries such as Ireland and Ethiopia, inventories for 2010 are expected to decline from 2009 levels.
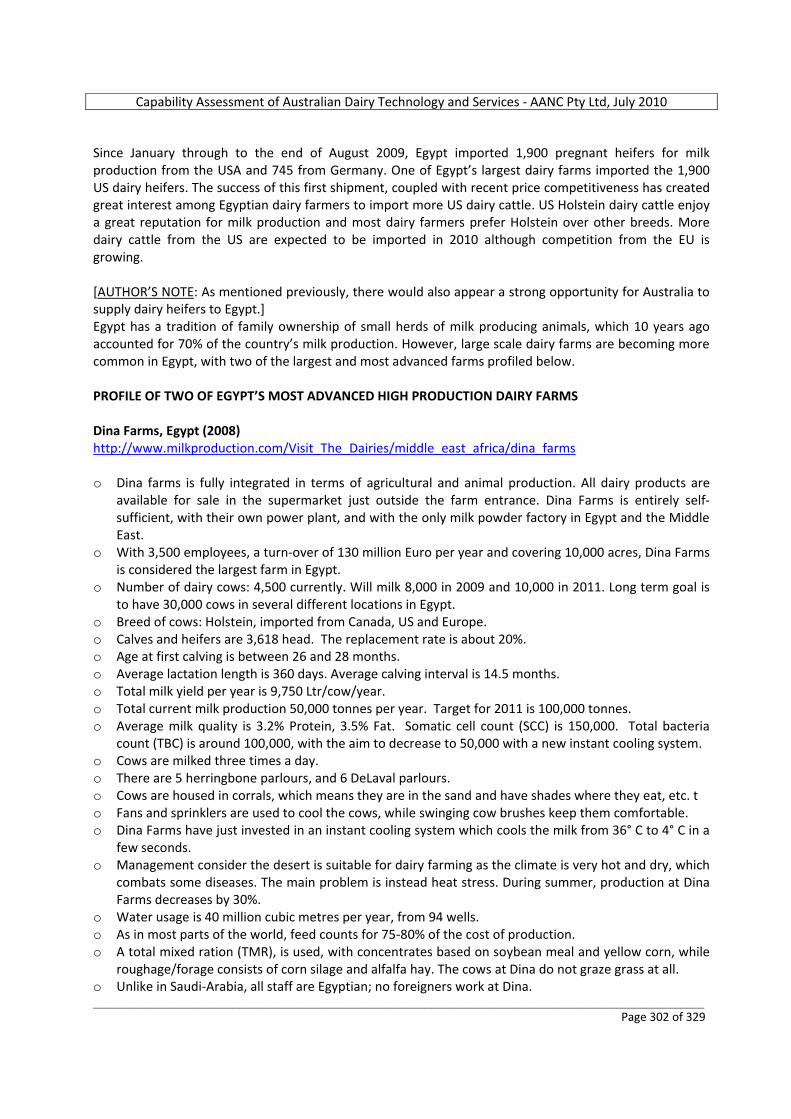
Capability Assessment of Australian Dairy Technology and Services ‐ AANC Pty Ltd, July 2010
_________________________________________________________________________________________________________ Page 302 of 329
Since January through to the end of August 2009, Egypt imported 1,900 pregnant heifers for milk production from the USA and 745 from Germany. One of Egypt’s largest dairy farms imported the 1,900 US dairy heifers. The success of this first shipment, coupled with recent price competitiveness has created great interest among Egyptian dairy farmers to import more US dairy cattle. US Holstein dairy cattle enjoy a great reputation for milk production and most dairy farmers prefer Holstein over other breeds. More dairy cattle from the US are expected to be imported in 2010 although competition from the EU is growing. [AUTHOR’S NOTE: As mentioned previously, there would also appear a strong opportunity for Australia to supply dairy heifers to Egypt.] Egypt has a tradition of family ownership of small herds of milk producing animals, which 10 years ago accounted for 70% of the country’s milk production. However, large scale dairy farms are becoming more common in Egypt, with two of the largest and most advanced farms profiled below. PROFILE OF TWO OF EGYPT’S MOST ADVANCED HIGH PRODUCTION DAIRY FARMS Dina Farms, Egypt (2008) http://www.milkproduction.com/Visit_The_Dairies/middle_east_africa/dina_farms o Dina farms is fully integrated in terms of agricultural and animal production. All dairy products are
available for sale in the supermarket just outside the farm entrance. Dina Farms is entirely self‐sufficient, with their own power plant, and with the only milk powder factory in Egypt and the Middle East.
o With 3,500 employees, a turn‐over of 130 million Euro per year and covering 10,000 acres, Dina Farms is considered the largest farm in Egypt.
o Number of dairy cows: 4,500 currently. Will milk 8,000 in 2009 and 10,000 in 2011. Long term goal is to have 30,000 cows in several different locations in Egypt.
o Breed of cows: Holstein, imported from Canada, US and Europe. o Calves and heifers are 3,618 head. The replacement rate is about 20%. o Age at first calving is between 26 and 28 months. o Average lactation length is 360 days. Average calving interval is 14.5 months. o Total milk yield per year is 9,750 Ltr/cow/year. o Total current milk production 50,000 tonnes per year. Target for 2011 is 100,000 tonnes. o Average milk quality is 3.2% Protein, 3.5% Fat. Somatic cell count (SCC) is 150,000. Total bacteria
count (TBC) is around 100,000, with the aim to decrease to 50,000 with a new instant cooling system. o Cows are milked three times a day. o There are 5 herringbone parlours, and 6 DeLaval parlours. o Cows are housed in corrals, which means they are in the sand and have shades where they eat, etc. t o Fans and sprinklers are used to cool the cows, while swinging cow brushes keep them comfortable. o Dina Farms have just invested in an instant cooling system which cools the milk from 36° C to 4° C in a
few seconds. o Management consider the desert is suitable for dairy farming as the climate is very hot and dry, which
combats some diseases. The main problem is instead heat stress. During summer, production at Dina Farms decreases by 30%.
o Water usage is 40 million cubic metres per year, from 94 wells. o As in most parts of the world, feed counts for 75‐80% of the cost of production. o A total mixed ration (TMR), is used, with concentrates based on soybean meal and yellow corn, while
roughage/forage consists of corn silage and alfalfa hay. The cows at Dina do not graze grass at all. o Unlike in Saudi‐Arabia, all staff are Egyptian; no foreigners work at Dina.
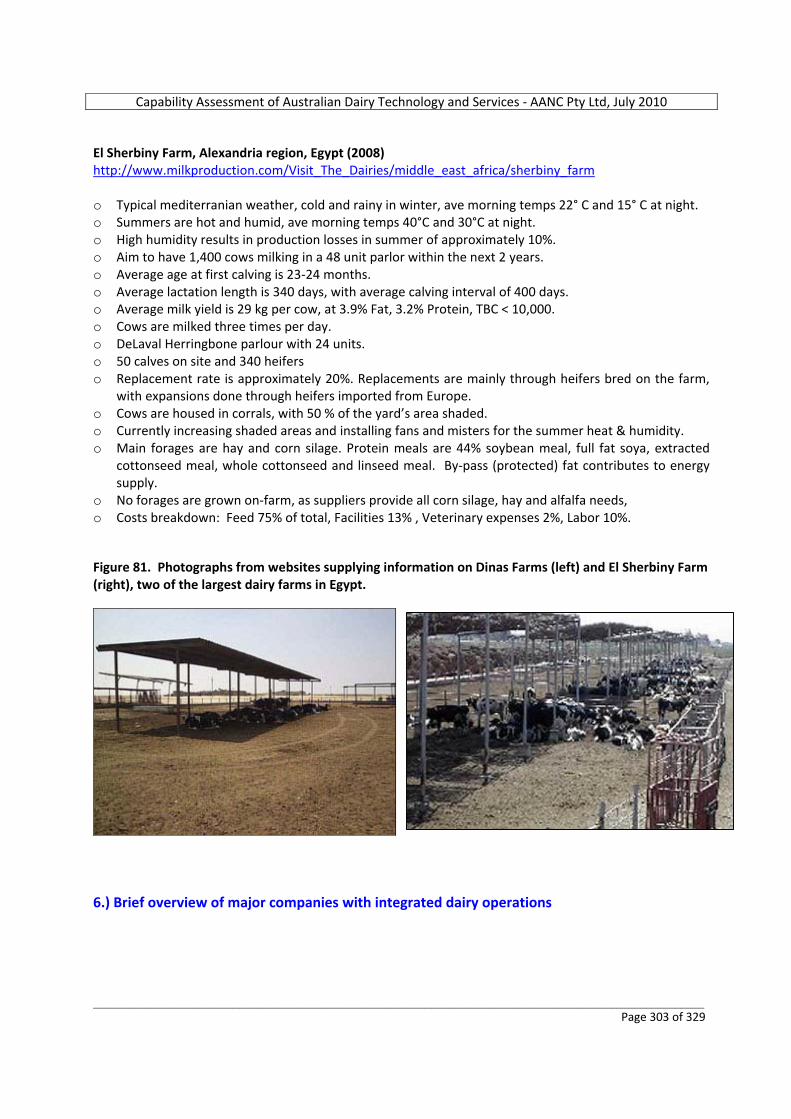
Capability Assessment of Australian Dairy Technology and Services ‐ AANC Pty Ltd, July 2010
_________________________________________________________________________________________________________ Page 303 of 329
El Sherbiny Farm, Alexandria region, Egypt (2008) http://www.milkproduction.com/Visit_The_Dairies/middle_east_africa/sherbiny_farm o Typical mediterranian weather, cold and rainy in winter, ave morning temps 22° C and 15° C at night. o Summers are hot and humid, ave morning temps 40°C and 30°C at night. o High humidity results in production losses in summer of approximately 10%. o Aim to have 1,400 cows milking in a 48 unit parlor within the next 2 years. o Average age at first calving is 23‐24 months. o Average lactation length is 340 days, with average calving interval of 400 days. o Average milk yield is 29 kg per cow, at 3.9% Fat, 3.2% Protein, TBC < 10,000. o Cows are milked three times per day. o DeLaval Herringbone parlour with 24 units. o 50 calves on site and 340 heifers o Replacement rate is approximately 20%. Replacements are mainly through heifers bred on the farm,
with expansions done through heifers imported from Europe. o Cows are housed in corrals, with 50 % of the yard’s area shaded. o Currently increasing shaded areas and installing fans and misters for the summer heat & humidity. o Main forages are hay and corn silage. Protein meals are 44% soybean meal, full fat soya, extracted
cottonseed meal, whole cottonseed and linseed meal. By‐pass (protected) fat contributes to energy supply.
o No forages are grown on‐farm, as suppliers provide all corn silage, hay and alfalfa needs, o Costs breakdown: Feed 75% of total, Facilities 13% , Veterinary expenses 2%, Labor 10%. Figure 81. Photographs from websites supplying information on Dinas Farms (left) and El Sherbiny Farm (right), two of the largest dairy farms in Egypt.
6.) Brief overview of major companies with integrated dairy operations
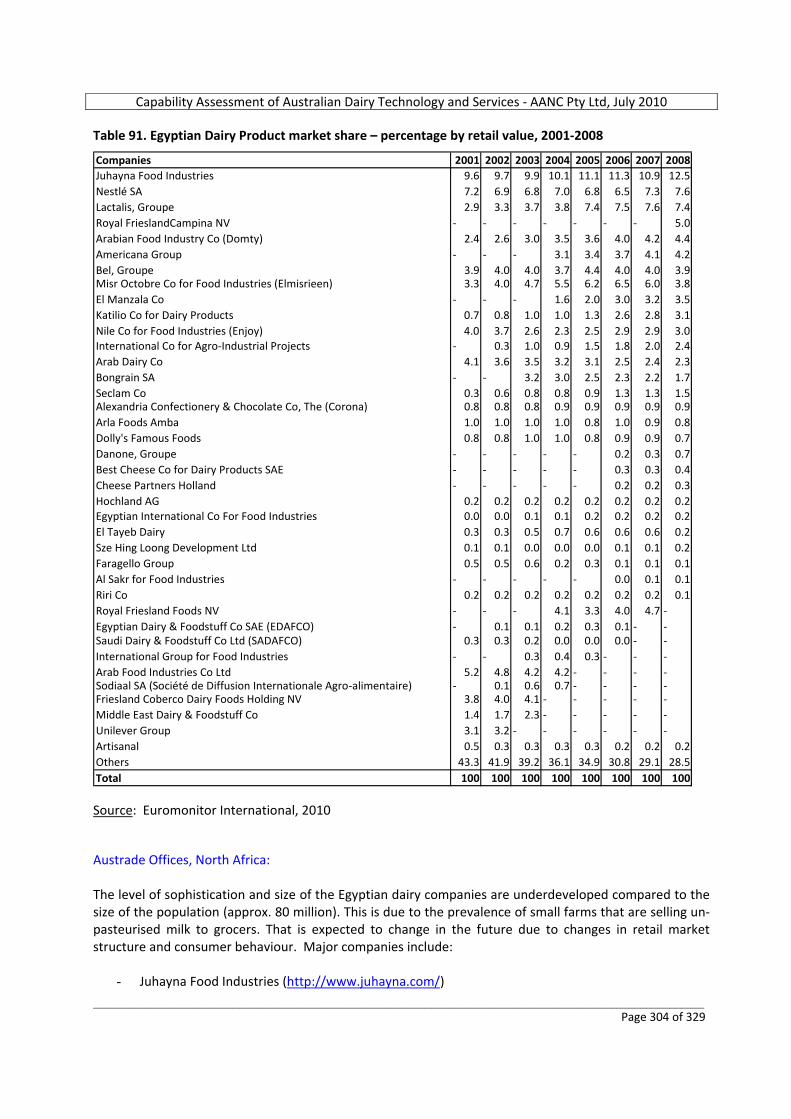
Capability Assessment of Australian Dairy Technology and Services ‐ AANC Pty Ltd, July 2010
_________________________________________________________________________________________________________ Page 304 of 329
Table 91. Egyptian Dairy Product market share – percentage by retail value, 2001‐2008
Companies 2001 2002 2003 2004 2005 2006 2007 2008Juhayna Food Industries 9.6 9.7 9.9 10.1 11.1 11.3 10.9 12.5Nestlé SA 7.2 6.9 6.8 7.0 6.8 6.5 7.3 7.6Lactalis, Groupe 2.9 3.3 3.7 3.8 7.4 7.5 7.6 7.4Royal FrieslandCampina NV ‐ ‐ ‐ ‐ ‐ ‐ ‐ 5.0Arabian Food Industry Co (Domty) 2.4 2.6 3.0 3.5 3.6 4.0 4.2 4.4Americana Group ‐ ‐ ‐ 3.1 3.4 3.7 4.1 4.2Bel, Groupe 3.9 4.0 4.0 3.7 4.4 4.0 4.0 3.9Misr Octobre Co for Food Industries (Elmisrieen) 3.3 4.0 4.7 5.5 6.2 6.5 6.0 3.8El Manzala Co ‐ ‐ ‐ 1.6 2.0 3.0 3.2 3.5Katilio Co for Dairy Products 0.7 0.8 1.0 1.0 1.3 2.6 2.8 3.1Nile Co for Food Industries (Enjoy) 4.0 3.7 2.6 2.3 2.5 2.9 2.9 3.0International Co for Agro‐Industrial Projects ‐ 0.3 1.0 0.9 1.5 1.8 2.0 2.4Arab Dairy Co 4.1 3.6 3.5 3.2 3.1 2.5 2.4 2.3Bongrain SA ‐ ‐ 3.2 3.0 2.5 2.3 2.2 1.7Seclam Co 0.3 0.6 0.8 0.8 0.9 1.3 1.3 1.5Alexandria Confectionery & Chocolate Co, The (Corona) 0.8 0.8 0.8 0.9 0.9 0.9 0.9 0.9Arla Foods Amba 1.0 1.0 1.0 1.0 0.8 1.0 0.9 0.8Dolly's Famous Foods 0.8 0.8 1.0 1.0 0.8 0.9 0.9 0.7Danone, Groupe ‐ ‐ ‐ ‐ ‐ 0.2 0.3 0.7Best Cheese Co for Dairy Products SAE ‐ ‐ ‐ ‐ ‐ 0.3 0.3 0.4Cheese Partners Holland ‐ ‐ ‐ ‐ ‐ 0.2 0.2 0.3Hochland AG 0.2 0.2 0.2 0.2 0.2 0.2 0.2 0.2Egyptian International Co For Food Industries 0.0 0.0 0.1 0.1 0.2 0.2 0.2 0.2El Tayeb Dairy 0.3 0.3 0.5 0.7 0.6 0.6 0.6 0.2Sze Hing Loong Development Ltd 0.1 0.1 0.0 0.0 0.0 0.1 0.1 0.2Faragello Group 0.5 0.5 0.6 0.2 0.3 0.1 0.1 0.1Al Sakr for Food Industries ‐ ‐ ‐ ‐ ‐ 0.0 0.1 0.1Riri Co 0.2 0.2 0.2 0.2 0.2 0.2 0.2 0.1Royal Friesland Foods NV ‐ ‐ ‐ 4.1 3.3 4.0 4.7 ‐Egyptian Dairy & Foodstuff Co SAE (EDAFCO) ‐ 0.1 0.1 0.2 0.3 0.1 ‐ ‐Saudi Dairy & Foodstuff Co Ltd (SADAFCO) 0.3 0.3 0.2 0.0 0.0 0.0 ‐ ‐International Group for Food Industries ‐ ‐ 0.3 0.4 0.3 ‐ ‐ ‐Arab Food Industries Co Ltd 5.2 4.8 4.2 4.2 ‐ ‐ ‐ ‐Sodiaal SA (Société de Diffusion Internationale Agro‐alimentaire) ‐ 0.1 0.6 0.7 ‐ ‐ ‐ ‐Friesland Coberco Dairy Foods Holding NV 3.8 4.0 4.1 ‐ ‐ ‐ ‐ ‐Middle East Dairy & Foodstuff Co 1.4 1.7 2.3 ‐ ‐ ‐ ‐ ‐Unilever Group 3.1 3.2 ‐ ‐ ‐ ‐ ‐ ‐Artisanal 0.5 0.3 0.3 0.3 0.3 0.2 0.2 0.2Others 43.3 41.9 39.2 36.1 34.9 30.8 29.1 28.5Total 100 100 100 100 100 100 100 100 Source: Euromonitor International, 2010 Austrade Offices, North Africa: The level of sophistication and size of the Egyptian dairy companies are underdeveloped compared to the size of the population (approx. 80 million). This is due to the prevalence of small farms that are selling un‐pasteurised milk to grocers. That is expected to change in the future due to changes in retail market structure and consumer behaviour. Major companies include:
- Juhayna Food Industries (http://www.juhayna.com/)
Capability Assessment of Australian Dairy Technology and Services ‐ AANC Pty Ltd, July 2010
_________________________________________________________________________________________________________ Page 305 of 329
- The Arab Dairy Products Company (http://www.arabdairy.com/) - Seclam Food Processing (http://www.seclamfood.com/) - IGI Beyti (http://beytidairy.com/) - Faragalla Group (http://www.faragalla.com/) - Americana (http://www.americana‐group.net/Default.aspx?Id=945)
7.) Availability of forage and raw materials for feed & nutrition USDA Foreign Agricultural Service. Global Agricultural Information Network. GAIN Report Number: N/A Date N/A Egypt – Grain and Feed Annual 2010 The Egyptian government has in recent years been pursuing a policy of expanding grain and general agricultural production in an effort to decrease import dependency. The country is generally a strong producer of corn, rice and wheat. However, wheat production has been low in 2009/10 due to poor weather and lower plantings (due to poor prices the year before), and the country will be importing large tonnages of wheat during the current year, mostly from Russia and other Black Sea countries. The country’s rice consumption will be able to rely largely on local production, while a moderate surplus will be exported. Despite good production levels of corn, Egypt will also be importing significant tonnages of corn. Over 75 % of the local corn crop is utilized for animal feed (mostly consumed on poultry farms) and the remainder used for food purposes (either milled or consumed fresh). Corn animal feed consumption is estimated to be 9.3 million MT in 2009/10 and 9.6 million MT in 2010/11 as the poultry industry recovers from an outbreak of Avian Influenza. Large commercial end‐users and feed mills rely on imported yellow corn to meet their requirements. 8.) Availability of Artificial Insemination laboratories and testing facilities for cattle; also veterinary services Austrade Offices, North Africa: AI services are widely available. 9.) Agribusiness educational facilities to support dairy production Austrade Offices, North Africa: Agricultural Education is quite common in Egypt. It is available at all levels of education including technical high schools (3‐5 years), graduate (4 years) and post graduate levels. Furthermore, Egypt possesses an Animal Research Centre that has several dairy related departments incorporated in it. For more information, see the links below.
- http://www.heepf.org.eg/pdf/research/Enhancing%20Agricultural%20Education%20in%20Egypt%20Through%20Competitive%20Mechanism.pdf
- www.scu.eun.eg - http://www.arc.sci.eg/InstsLabs/Default.aspx?OrgID=7&TabId=0&NavId=6&lang=en
Capability Assessment of Australian Dairy Technology and Services ‐ AANC Pty Ltd, July 2010
_________________________________________________________________________________________________________ Page 306 of 329
The Egyptian Agricultural Research Centre (ARC). 9 Gamaa Street, Orman Giza, Egypt.
- The ARC is working towards helping promote sustainable growth of agricultural industries through maximising the output of any given combination of land and water, and reducing costs through technological improvement.
10.) Dairy consumption trends (past 5 years) Business Monitor International (BMI) Egypt: Agribusiness Report, Q3 2010, Including 5‐year forecasts to 2014, May, 2010 Dairy products are an important component of the Egyptian diet. Cheese is widely consumed with annual consumption estimated at around 6 kg per capita, as many people eat cheese as part of at least one of their daily meals. As diets are slowly changing and becoming more ‘westernised’, particularly with the increasing prevalence of fast food restaurants, consumption of new cheese varieties is also on the rise. Rising incomes will see more consumers convert from unpasteurized whole milk to value‐added packaged milk products. Bearing in mind these changing consumption patterns, BMI are forecasting that fluid milk consumption will rise by a robust 19.5% over their forecast period of 2009‐2014, while it is expected that cheese consumption to rise by 8.4% over this period, following a dip in 2010. Local milk producers are working on improving consumer perceptions of long‐life UHT milk, as it is widely believed that UHT product is not as healthy as fresh milk and that it can be more dangerous when spoilt. However, this product also has far stronger growth potential in a country with a very hot climate and where many consumers still do not own white goods, which is why producers are working hard to change perceptions. Meanwhile, powdered milk, which is a more cost‐competitive product, is forecast to experience a 4.1% rise in consumption over 2009‐2014, with the full demand being met through imports.
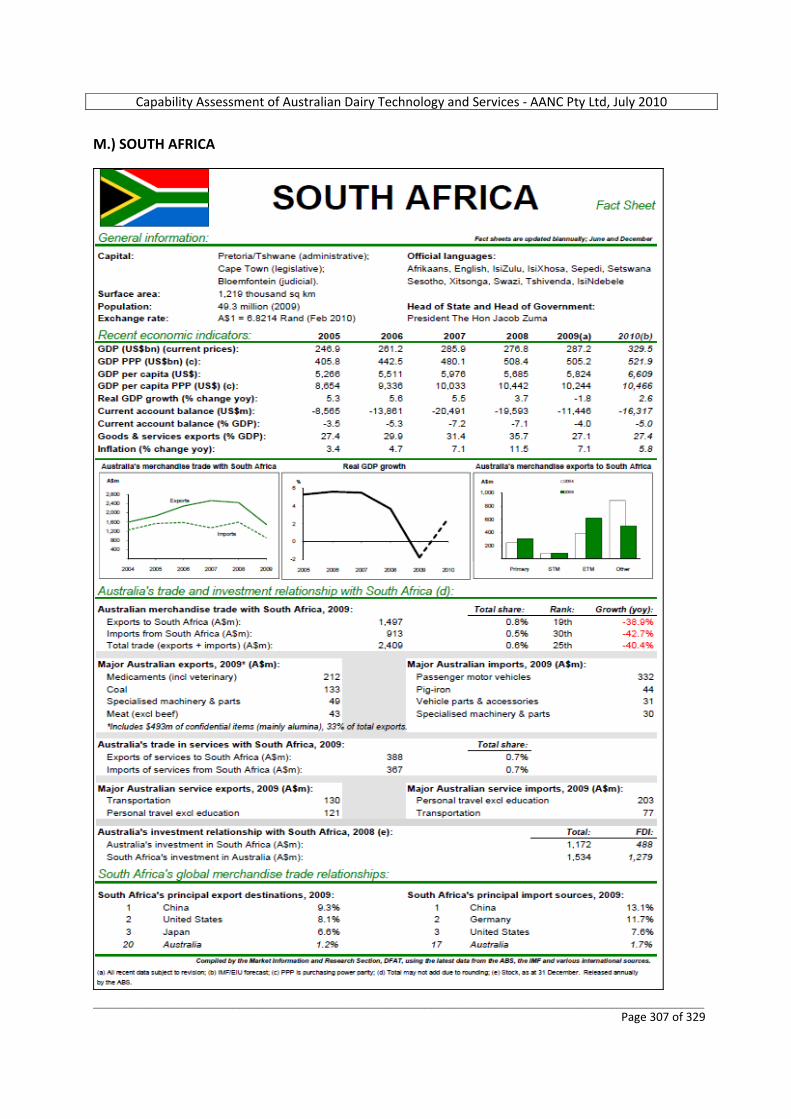
Capability Assessment of Australian Dairy Technology and Services ‐ AANC Pty Ltd, July 2010
_________________________________________________________________________________________________________ Page 307 of 329
M.) SOUTH AFRICA
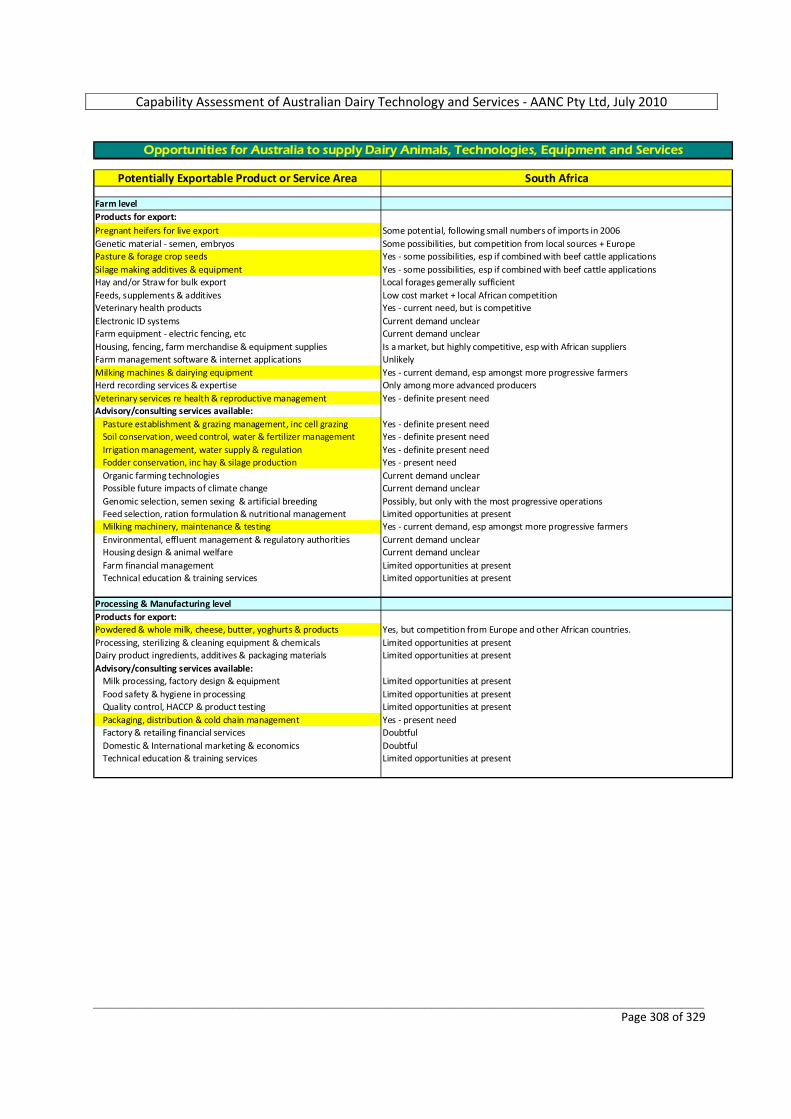
Capability Assessment of Australian Dairy Technology and Services ‐ AANC Pty Ltd, July 2010
_________________________________________________________________________________________________________ Page 308 of 329
Potentially Exportable Product or Service Area South Africa
Farm levelProducts for export:Pregnant heifers for live export Some potential, following small numbers of imports in 2006Genetic material ‐ semen, embryos Some possibilities, but competition from local sources + EuropePasture & forage crop seeds Yes ‐ some possibilities, esp if combined with beef cattle applicationsSilage making additives & equipment Yes ‐ some possibilities, esp if combined with beef cattle applicationsHay and/or Straw for bulk export Local forages gemerally sufficientFeeds, supplements & additives Low cost market + local African competitionVeterinary health products Yes ‐ current need, but is competitiveElectronic ID systems Current demand unclearFarm equipment ‐ electric fencing, etc Current demand unclearHousing, fencing, farm merchandise & equipment supplies Is a market, but highly competitive, esp with African suppliersFarm management software & internet applications UnlikelyMilking machines & dairying equipment Yes ‐ current demand, esp amongst more progressive farmersHerd recording services & expertise Only among more advanced producersVeterinary services re health & reproductive management Yes ‐ definite present needAdvisory/consulting services available:
Pasture establishment & grazing management, inc cell grazing Yes ‐ definite present needSoil conservation, weed control, water & fertilizer management Yes ‐ definite present needIrrigation management, water supply & regulation Yes ‐ definite present needFodder conservation, inc hay & silage production Yes ‐ present needOrganic farming technologies Current demand unclearPossible future impacts of climate change Current demand unclearGenomic selection, semen sexing & artificial breeding Possibly, but only with the most progressive operationsFeed selection, ration formulation & nutritional management Limited opportunities at presentMilking machinery, maintenance & testing Yes ‐ current demand, esp amongst more progressive farmersEnvironmental, effluent management & regulatory authorities Current demand unclearHousing design & animal welfare Current demand unclearFarm financial management Limited opportunities at presentTechnical education & training services Limited opportunities at present
Processing & Manufacturing levelProducts for export:Powdered & whole milk, cheese, butter, yoghurts & products Yes, but competition from Europe and other African countries. Processing, sterilizing & cleaning equipment & chemicals Limited opportunities at presentDairy product ingredients, additives & packaging materials Limited opportunities at presentAdvisory/consulting services available:
Milk processing, factory design & equipment Limited opportunities at presentFood safety & hygiene in processing Limited opportunities at presentQuality control, HACCP & product testing Limited opportunities at presentPackaging, distribution & cold chain management Yes ‐ present needFactory & retailing financial services DoubtfulDomestic & International marketing & economics DoubtfulTechnical education & training services Limited opportunities at present
Opportunities for Australia to supply Dairy Animals, Technologies, Equipment and Services

Capability Assessment of Australian Dairy Technology and Services ‐ AANC Pty Ltd, July 2010
_________________________________________________________________________________________________________ Page 309 of 329
VALUE OF DAIRY INDUSTRY ‐ COMPARISON OF INTERNATIONAL TARGET MARKETS Figure 82. Retail value of Dairy Industries, with South Africa well down amongst the 13 nominated overseas markets
0.0
5,000.0
10,000.0
15,000.0
20,000.0
25,000.0
US$ million
Brazil
China
Egypt
India
Indon
esia
Malays
ia
Mexico
Pakist
an
Philipp
ines
Russia
Saudi
Arabia
South
Africa
Vietna
m
Retail Value of Target Market Dairy Industries, 2009
Source: Euromonitor International, 2010 Figure 83. Retail value growth of Dairy Industries, CAGR % 2004‐2009, with South Africa well down amongst nominated markets
0.0
5.0
10.0
15.0
20.0
25.0
CAGR %
Brazil
China
Egypt
India
Indon
esia
Malays
ia
Mexico
Pakist
an
Philipp
ines
Russia
Saudi
Arabia
South
Africa
Vietna
m
Retail Value Growth of Target Market Dairy Industries, CAGR % 2004‐09
Source: Euromonitor International, 2010
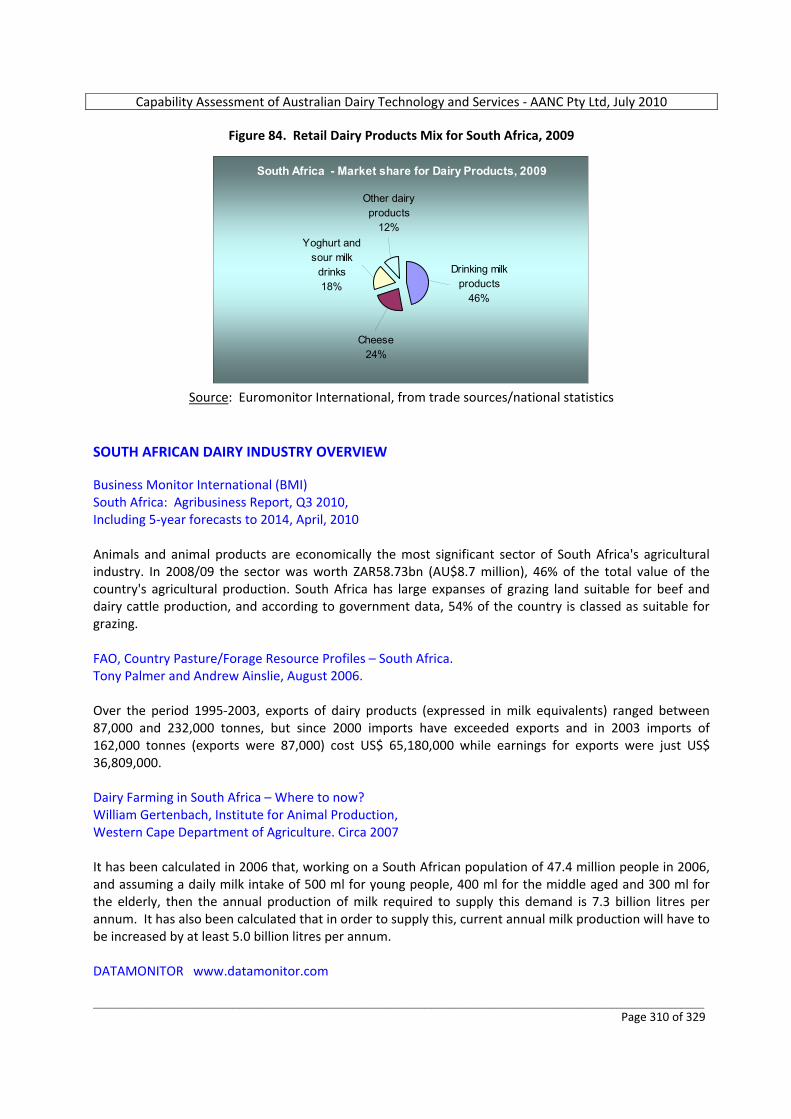
Capability Assessment of Australian Dairy Technology and Services ‐ AANC Pty Ltd, July 2010
_________________________________________________________________________________________________________ Page 310 of 329
Figure 84. Retail Dairy Products Mix for South Africa, 2009
South Africa - Market share for Dairy Products, 2009
Drinking milk products
46%
Cheese24%
Yoghurt and sour milk
drinks18%
Other dairy products
12%
Source: Euromonitor International, from trade sources/national statistics
SOUTH AFRICAN DAIRY INDUSTRY OVERVIEW Business Monitor International (BMI) South Africa: Agribusiness Report, Q3 2010, Including 5‐year forecasts to 2014, April, 2010 Animals and animal products are economically the most significant sector of South Africa's agricultural industry. In 2008/09 the sector was worth ZAR58.73bn (AU$8.7 million), 46% of the total value of the country's agricultural production. South Africa has large expanses of grazing land suitable for beef and dairy cattle production, and according to government data, 54% of the country is classed as suitable for grazing. FAO, Country Pasture/Forage Resource Profiles – South Africa. Tony Palmer and Andrew Ainslie, August 2006. Over the period 1995‐2003, exports of dairy products (expressed in milk equivalents) ranged between 87,000 and 232,000 tonnes, but since 2000 imports have exceeded exports and in 2003 imports of 162,000 tonnes (exports were 87,000) cost US$ 65,180,000 while earnings for exports were just US$ 36,809,000. Dairy Farming in South Africa – Where to now? William Gertenbach, Institute for Animal Production, Western Cape Department of Agriculture. Circa 2007 It has been calculated in 2006 that, working on a South African population of 47.4 million people in 2006, and assuming a daily milk intake of 500 ml for young people, 400 ml for the middle aged and 300 ml for the elderly, then the annual production of milk required to supply this demand is 7.3 billion litres per annum. It has also been calculated that in order to supply this, current annual milk production will have to be increased by at least 5.0 billion litres per annum. DATAMONITOR www.datamonitor.com
Capability Assessment of Australian Dairy Technology and Services ‐ AANC Pty Ltd, July 2010
_________________________________________________________________________________________________________ Page 311 of 329
Dairy in South Africa. Industry Profile. Reference Code: 0044‐0711. November 2009 The South African dairy market grew by 5.1% in 2008 to reach a value of US$3.2 billion. In 2013, the dairy market is forecast to have a value of US$4.1 billion, an increase of 26.1% since 2008. Fresh milk sales generated 46% of the South African dairy market's overall revenues. Groupe Danone accounts for 25.7% of the South African dairy market's value. Supermarkets and hypermarkets form a leading distribution channel in the South African dairy market, distributing 60.6% of the market's value. Business Monitor International (BMI) South Africa: Agribusiness Report, Q3 2010, Including 5‐year forecasts to 2014, April, 2010 The 2010 estimate for Real GDP Growth in South Africa is 3.0% (up from ‐1.8% in 2009), and predicted to average 3.1% from now until 2014. Consumer Price Inflation was 5.7% year‐on‐year in February 2010 (down from 7.1% for 2009). BMI is forecasting South Africa's GDP per capita to almost double by 2019, which will drive demand for milk products and provide a ready market for any growth in South Africa's dairy production. With regard to industry risks, the most obvious is the potential for disease outbreak, as was demonstrated by the recent Rift Valley disease outbreak in beef cattle, although the threat of Foot and Mouth Disease (FMD) also causes great concern among farmers in South Africa. SWOT ANALYSIS Business Monitor International (BMI) South Africa: Agribusiness Report, Q3 2010, Including 5‐year forecasts to 2014, April, 2010 South African Agribusiness Environment SWOT Strengths • Deregulating the market has enabled the rise of a strong, virtually self‐sufficient and globally
competitive agribusiness industry. • The agribusiness sector is vitally important to national well‐being, employing around 30% of the
working population. • Huge sums have been invested in the 'Proudly South African' food campaign, designed to encourage
consumers to purchase domestically grown and produced goods and to advertise their quality. • Rising disposable incomes and changing consumer habits have helped fuel domestic growth. • The state has rich mineral resources and is the continent's financial hub. • Broad political stability and broad policy continuity is likely to persist, due to the ANC's dominance at a
national and provincial level. • Despite decades of isolation under apartheid, the business infrastructure is modern, enabling South
Africa to serve as the financial and business hub of the continent. • Despite a decrease in profitability, South Africa's banking sector has remained stable amidst the global
recession. • The government has pursued a prudent fiscal policy since 1994, allowing it to increase public
expenditure at a time of economic downturn. Weaknesses
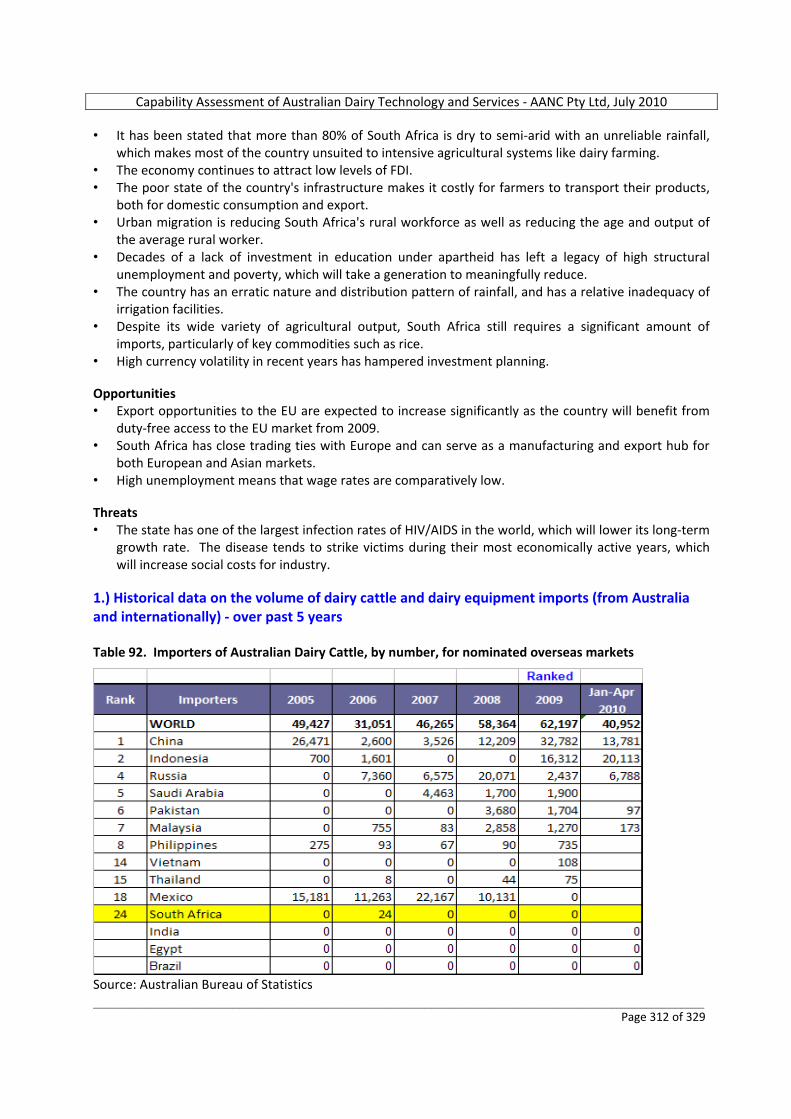
Capability Assessment of Australian Dairy Technology and Services ‐ AANC Pty Ltd, July 2010
_________________________________________________________________________________________________________ Page 312 of 329
• It has been stated that more than 80% of South Africa is dry to semi‐arid with an unreliable rainfall, which makes most of the country unsuited to intensive agricultural systems like dairy farming.
• The economy continues to attract low levels of FDI. • The poor state of the country's infrastructure makes it costly for farmers to transport their products,
both for domestic consumption and export. • Urban migration is reducing South Africa's rural workforce as well as reducing the age and output of
the average rural worker. • Decades of a lack of investment in education under apartheid has left a legacy of high structural
unemployment and poverty, which will take a generation to meaningfully reduce. • The country has an erratic nature and distribution pattern of rainfall, and has a relative inadequacy of
irrigation facilities. • Despite its wide variety of agricultural output, South Africa still requires a significant amount of
imports, particularly of key commodities such as rice. • High currency volatility in recent years has hampered investment planning. Opportunities • Export opportunities to the EU are expected to increase significantly as the country will benefit from
duty‐free access to the EU market from 2009. • South Africa has close trading ties with Europe and can serve as a manufacturing and export hub for
both European and Asian markets. • High unemployment means that wage rates are comparatively low. Threats • The state has one of the largest infection rates of HIV/AIDS in the world, which will lower its long‐term
growth rate. The disease tends to strike victims during their most economically active years, which will increase social costs for industry.
1.) Historical data on the volume of dairy cattle and dairy equipment imports (from Australia and internationally) ‐ over past 5 years Table 92. Importers of Australian Dairy Cattle, by number, for nominated overseas markets
Source: Australian Bureau of Statistics
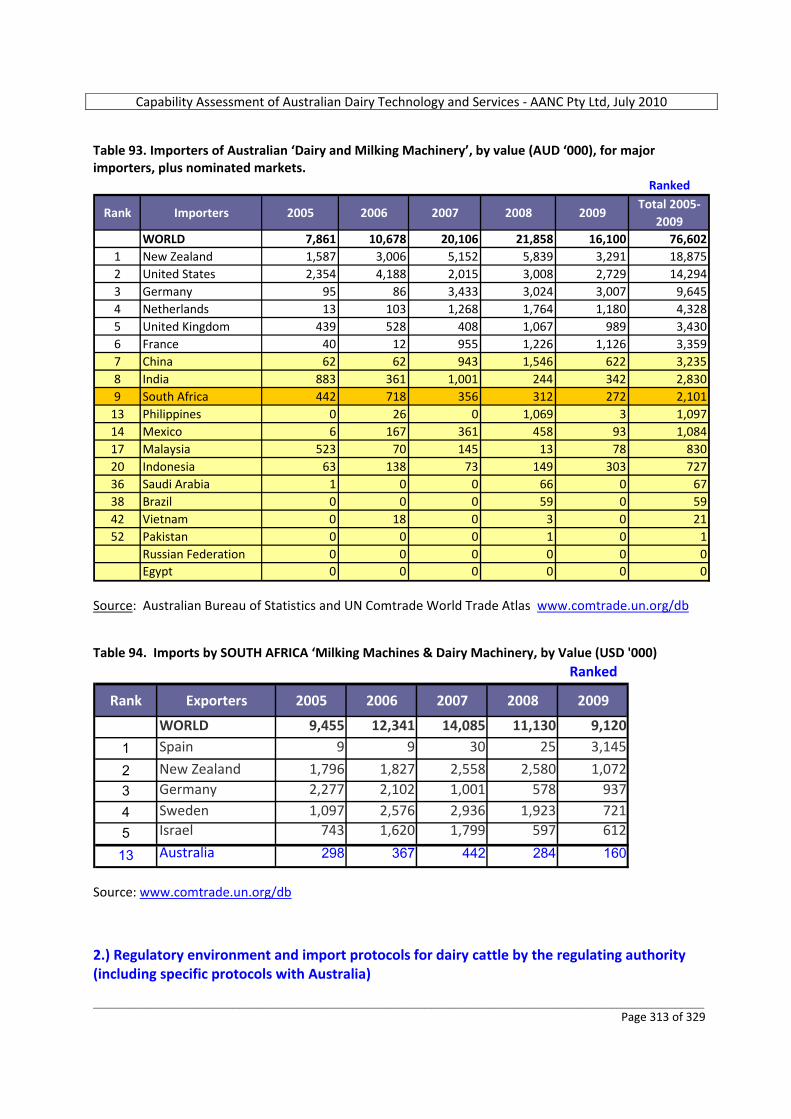
Capability Assessment of Australian Dairy Technology and Services ‐ AANC Pty Ltd, July 2010
_________________________________________________________________________________________________________ Page 313 of 329
Table 93. Importers of Australian ‘Dairy and Milking Machinery’, by value (AUD ‘000), for major importers, plus nominated markets.
Ranked
Rank Importers 2005 2006 2007 2008 2009Total 2005‐
2009WORLD 7,861 10,678 20,106 21,858 16,100 76,602
1 New Zealand 1,587 3,006 5,152 5,839 3,291 18,8752 United States 2,354 4,188 2,015 3,008 2,729 14,2943 Germany 95 86 3,433 3,024 3,007 9,6454 Netherlands 13 103 1,268 1,764 1,180 4,3285 United Kingdom 439 528 408 1,067 989 3,4306 France 40 12 955 1,226 1,126 3,3597 China 62 62 943 1,546 622 3,2358 India 883 361 1,001 244 342 2,8309 South Africa 442 718 356 312 272 2,101
13 Philippines 0 26 0 1,069 3 1,09714 Mexico 6 167 361 458 93 1,08417 Malaysia 523 70 145 13 78 83020 Indonesia 63 138 73 149 303 72736 Saudi Arabia 1 0 0 66 0 6738 Brazil 0 0 0 59 0 5942 Vietnam 0 18 0 3 0 2152 Pakistan 0 0 0 1 0 1
Russian Federation 0 0 0 0 0 0Egypt 0 0 0 0 0 0
Source: Australian Bureau of Statistics and UN Comtrade World Trade Atlas www.comtrade.un.org/db Table 94. Imports by SOUTH AFRICA ‘Milking Machines & Dairy Machinery, by Value (USD '000)
Ranked
Rank Exporters 2005 2006 2007 2008 2009
WORLD 9,455 12,341 14,085 11,130 9,120
1 Spain 9 9 30 25 3,145
2 New Zealand 1,796 1,827 2,558 2,580 1,0723 Germany 2,277 2,102 1,001 578 937
4 Sweden 1,097 2,576 2,936 1,923 721
5 Israel 743 1,620 1,799 597 612
13 Australia 298 367 442 284 160
Source: www.comtrade.un.org/db 2.) Regulatory environment and import protocols for dairy cattle by the regulating authority (including specific protocols with Australia)
Capability Assessment of Australian Dairy Technology and Services ‐ AANC Pty Ltd, July 2010
_________________________________________________________________________________________________________ Page 314 of 329
FOR GENERAL ADVICE REGARDING THE REGULATION OF EXPORTS FROM AUSTRALIA:
Australian Customs and Border Protection Service, Canberra City, ACT. http://www.customs.gov.au
FOR FOREIGN AFFAIRS, IMPORT TRADE PROTOCOLS/REGULATIONS AND WEB LINKAGES TO FOREIGN EMBASSIES IN COUNTRIES TO WHICH EXPORTS ARE INTENDED:
Australian Department of Foreign Affairs and Trade, Barton, ACT. http://www.dfat.gov.au/embassies/South Africa
FOR SPECIFIC ADVICE REGARDING THE PREPARATION, SHIPPING OR AIR‐FREIGHTING OF LIVE ANIMALS AND LIVE ANIMALS TRADE ISSUES IN DESTINATION FOREIGN COUNTRIES:
LiveCorp Ltd, North Sydney, NSW. http://www.livecorp.com.au
FOR SPECIFIC ADVICE REGARDING PROTOCOLS FOR THE EXPORT OF LIVE ANIMALS (OR ANIMAL‐DERIVED PRODUCTS SUCH AS SEMEN AND EMBRYOS) FROM AUSTRALIA AND IMPORT PROTOCOLS IN DESTINATION FOREIGN COUNTRIES:
Australian Quarantine and Inspection Service (AQIS), Canberra City, ACT. http://www.aqis.gov.au
Specific South African information: o Export opportunities to the EU are expected to increase significantly as South Africa will benefit from
duty‐free access to the EU market from 2009. 3.) Investment environment for dairy operations (domestic and foreign assistance, tax incentives, export zones, etc) and examples of FDI (from any country) • South Africa has close trading ties with Europe and can serve as a manufacturing and export hub for
both European and Asian markets. • Export opportunities to the EU are expected to increase significantly as the country will benefit from
duty‐free access to the EU market from 2009. • Deregulating the market has enabled the rise of a strong, virtually self‐sufficient and globally
competitive agribusiness industry. • The agribusiness sector is vitally important to national well‐being, employing around 30% of the
working population. • Huge sums have been invested in the 'Proudly South African' food campaign, designed to encourage
consumers to purchase domestically grown and produced goods and to advertise their quality. Examples of Foreign Direct Investment in South Africa DATAMONITOR www.datamonitor.com Dairy in South Africa. Industry Profile.
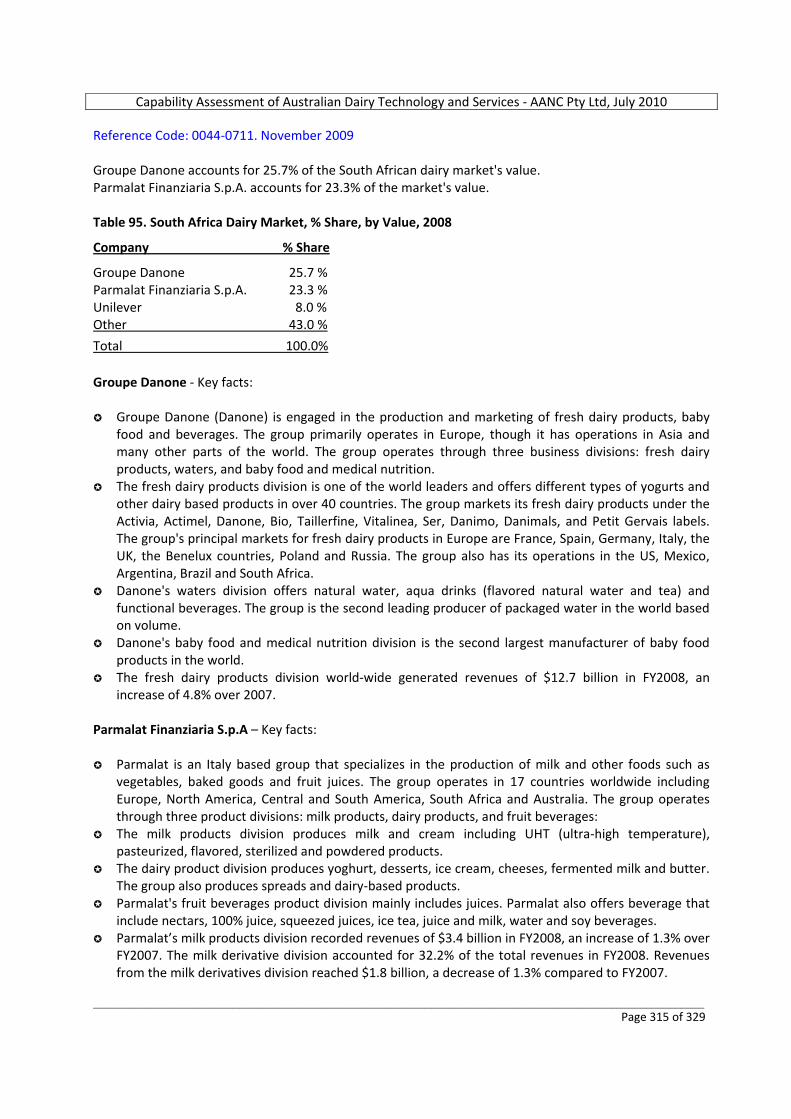
Capability Assessment of Australian Dairy Technology and Services ‐ AANC Pty Ltd, July 2010
_________________________________________________________________________________________________________ Page 315 of 329
Reference Code: 0044‐0711. November 2009 Groupe Danone accounts for 25.7% of the South African dairy market's value. Parmalat Finanziaria S.p.A. accounts for 23.3% of the market's value. Table 95. South Africa Dairy Market, % Share, by Value, 2008
Company % Share
Groupe Danone 25.7 % Parmalat Finanziaria S.p.A. 23.3 % Unilever 8.0 % Other 43.0 %
Total 100.0% Groupe Danone ‐ Key facts:
Groupe Danone (Danone) is engaged in the production and marketing of fresh dairy products, baby food and beverages. The group primarily operates in Europe, though it has operations in Asia and many other parts of the world. The group operates through three business divisions: fresh dairy products, waters, and baby food and medical nutrition.
The fresh dairy products division is one of the world leaders and offers different types of yogurts and other dairy based products in over 40 countries. The group markets its fresh dairy products under the Activia, Actimel, Danone, Bio, Taillerfine, Vitalinea, Ser, Danimo, Danimals, and Petit Gervais labels. The group's principal markets for fresh dairy products in Europe are France, Spain, Germany, Italy, the UK, the Benelux countries, Poland and Russia. The group also has its operations in the US, Mexico, Argentina, Brazil and South Africa.
Danone's waters division offers natural water, aqua drinks (flavored natural water and tea) and functional beverages. The group is the second leading producer of packaged water in the world based on volume.
Danone's baby food and medical nutrition division is the second largest manufacturer of baby food products in the world.
The fresh dairy products division world‐wide generated revenues of $12.7 billion in FY2008, an increase of 4.8% over 2007.
Parmalat Finanziaria S.p.A – Key facts:
Parmalat is an Italy based group that specializes in the production of milk and other foods such as vegetables, baked goods and fruit juices. The group operates in 17 countries worldwide including Europe, North America, Central and South America, South Africa and Australia. The group operates through three product divisions: milk products, dairy products, and fruit beverages:
The milk products division produces milk and cream including UHT (ultra‐high temperature), pasteurized, flavored, sterilized and powdered products.
The dairy product division produces yoghurt, desserts, ice cream, cheeses, fermented milk and butter. The group also produces spreads and dairy‐based products.
Parmalat's fruit beverages product division mainly includes juices. Parmalat also offers beverage that include nectars, 100% juice, squeezed juices, ice tea, juice and milk, water and soy beverages.
Parmalat’s milk products division recorded revenues of $3.4 billion in FY2008, an increase of 1.3% over FY2007. The milk derivative division accounted for 32.2% of the total revenues in FY2008. Revenues from the milk derivatives division reached $1.8 billion, a decrease of 1.3% compared to FY2007.
Capability Assessment of Australian Dairy Technology and Services ‐ AANC Pty Ltd, July 2010
_________________________________________________________________________________________________________ Page 316 of 329
4.) National government programs to assist with the development of dairy operations ‘MEC working on rescue plan for dairy industry: About 80% of farmers in trouble’ Cape Argus. 11 June 2009. Agriculture MEC Gerrit van Rensburg is working on a rescue plan for the province’s R2.2 billion (AU$325 million) dairy farming industry, which he says is struggling due to the economic downturn. Van Rensburg told a provincial parliamentary sitting that 80 % of the province’s dairy farmers were in “serious trouble”. He said he was considering launching a fund for emerging dairy farmers to enable them to more easily access credit from banks. The world’s recession and lowering of consumer buying power was pushing farmers out of business, with many on the brink of bankruptcy, said Van Rensburg. Dairy farmers’ profit margins were very small too, as they were selling at low prices to retailers. Dairy farmers get R2.95 (AU$0.43) per litre of milk they sell, a significant drop from the R3.40 (AU$0.50) they were getting last year. Mr Van Rensburg said that for farmers to be profitable at the R2.95 figure, each farmer would need to get 34 litres of milk per cow, every day. “If you produce less than 27 litres, you will go bankrupt. At the current price levels, farmers cannot farm profitably and sustainably,” he said. To ensure their survival, dairy farmers would have to look carefully at their production, practise better management, better breeding programmes, and work harder and smarter. Meanwhile, milk producers estimate that 15 % of the Western Cape’s 880 dairy farmers will go out of business this year. The chairman of the provincial Milk Producers’ Organisation, Dèan Kleynhans, claimed that the industry had already lost about half its dairy farmers in the past 18 months. He said that in December 2007 the Western Cape had 1 577 dairy farmers. This number had dropped to 795 by January this year. 5.) Existing or proposed external assistance programs to develop the industry (foreign government and/or aid programs) Austrade Office, Johannesburg: Austrade Johannesburg has launched a "South Africa Land Reform Program" to develop the Agribusiness Industry by assisting emerging farmers in becoming self‐sustainable. Austrade will assist these emerging farmers by launching "Project Farms'' where these farmers can be mentored. The Western Australian Department of Agriculture and Food’s international consulting arm ‐ AGWEST International ‐ is negotiating a proposal to the Australian High Commission in South Africa whereby they would like to support South Africa's Farmer Resettlement efforts. This is in alignment with Austrade's above‐mentioned project. 6.) Overview of the typical dairy farming arrangements Insights into the rather poor state of the South African dairy farming industry over the past 10 years or so are given by the paper presented by William Gertenbach in Western Cape in around 2007.
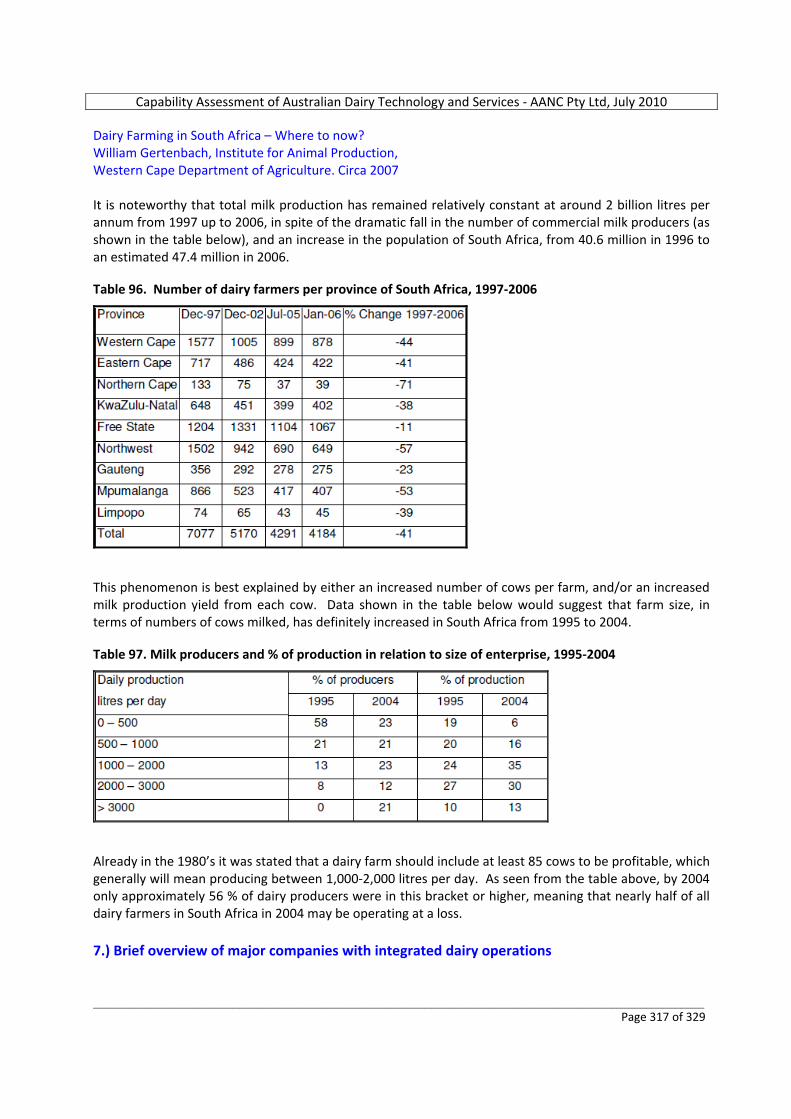
Capability Assessment of Australian Dairy Technology and Services ‐ AANC Pty Ltd, July 2010
_________________________________________________________________________________________________________ Page 317 of 329
Dairy Farming in South Africa – Where to now? William Gertenbach, Institute for Animal Production, Western Cape Department of Agriculture. Circa 2007 It is noteworthy that total milk production has remained relatively constant at around 2 billion litres per annum from 1997 up to 2006, in spite of the dramatic fall in the number of commercial milk producers (as shown in the table below), and an increase in the population of South Africa, from 40.6 million in 1996 to an estimated 47.4 million in 2006. Table 96. Number of dairy farmers per province of South Africa, 1997‐2006
This phenomenon is best explained by either an increased number of cows per farm, and/or an increased milk production yield from each cow. Data shown in the table below would suggest that farm size, in terms of numbers of cows milked, has definitely increased in South Africa from 1995 to 2004. Table 97. Milk producers and % of production in relation to size of enterprise, 1995‐2004
Already in the 1980’s it was stated that a dairy farm should include at least 85 cows to be profitable, which generally will mean producing between 1,000‐2,000 litres per day. As seen from the table above, by 2004 only approximately 56 % of dairy producers were in this bracket or higher, meaning that nearly half of all dairy farmers in South Africa in 2004 may be operating at a loss. 7.) Brief overview of major companies with integrated dairy operations
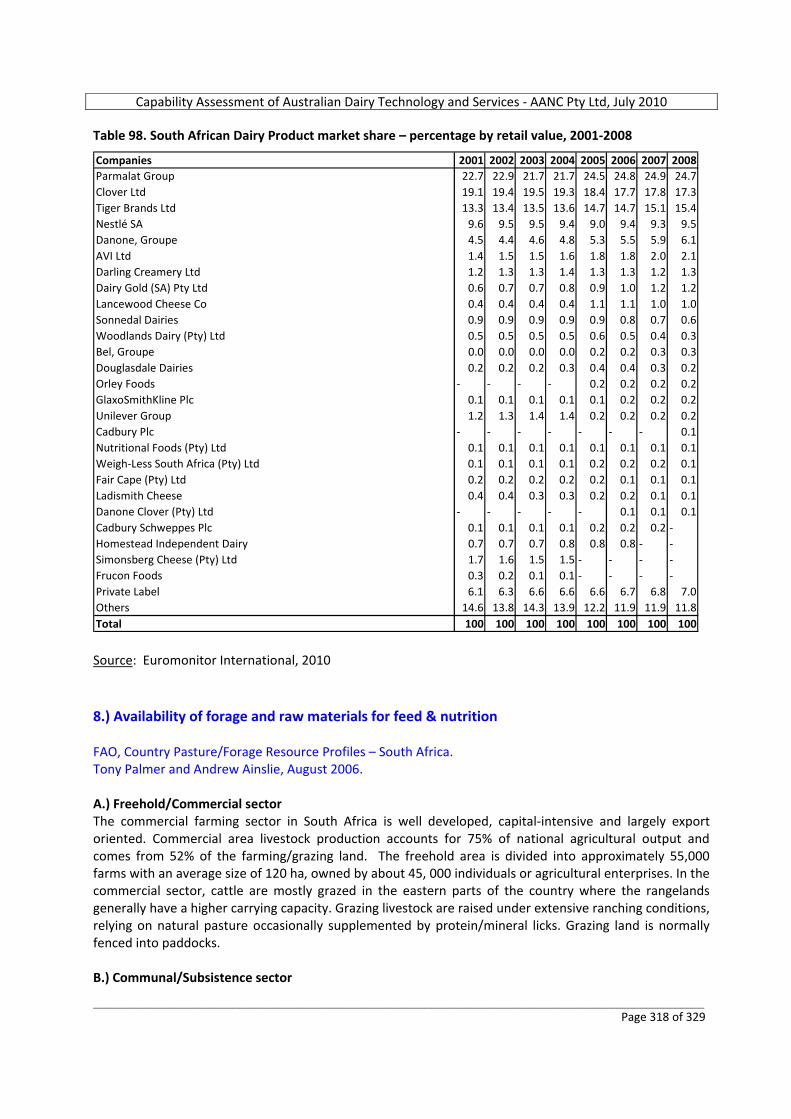
Capability Assessment of Australian Dairy Technology and Services ‐ AANC Pty Ltd, July 2010
_________________________________________________________________________________________________________ Page 318 of 329
Table 98. South African Dairy Product market share – percentage by retail value, 2001‐2008
Companies 2001 2002 2003 2004 2005 2006 2007 2008Parmalat Group 22.7 22.9 21.7 21.7 24.5 24.8 24.9 24.7Clover Ltd 19.1 19.4 19.5 19.3 18.4 17.7 17.8 17.3Tiger Brands Ltd 13.3 13.4 13.5 13.6 14.7 14.7 15.1 15.4Nestlé SA 9.6 9.5 9.5 9.4 9.0 9.4 9.3 9.5Danone, Groupe 4.5 4.4 4.6 4.8 5.3 5.5 5.9 6.1AVI Ltd 1.4 1.5 1.5 1.6 1.8 1.8 2.0 2.1Darling Creamery Ltd 1.2 1.3 1.3 1.4 1.3 1.3 1.2 1.3Dairy Gold (SA) Pty Ltd 0.6 0.7 0.7 0.8 0.9 1.0 1.2 1.2Lancewood Cheese Co 0.4 0.4 0.4 0.4 1.1 1.1 1.0 1.0Sonnedal Dairies 0.9 0.9 0.9 0.9 0.9 0.8 0.7 0.6Woodlands Dairy (Pty) Ltd 0.5 0.5 0.5 0.5 0.6 0.5 0.4 0.3Bel, Groupe 0.0 0.0 0.0 0.0 0.2 0.2 0.3 0.3Douglasdale Dairies 0.2 0.2 0.2 0.3 0.4 0.4 0.3 0.2Orley Foods ‐ ‐ ‐ ‐ 0.2 0.2 0.2 0.2GlaxoSmithKline Plc 0.1 0.1 0.1 0.1 0.1 0.2 0.2 0.2Unilever Group 1.2 1.3 1.4 1.4 0.2 0.2 0.2 0.2Cadbury Plc ‐ ‐ ‐ ‐ ‐ ‐ ‐ 0.1Nutritional Foods (Pty) Ltd 0.1 0.1 0.1 0.1 0.1 0.1 0.1 0.1Weigh‐Less South Africa (Pty) Ltd 0.1 0.1 0.1 0.1 0.2 0.2 0.2 0.1Fair Cape (Pty) Ltd 0.2 0.2 0.2 0.2 0.2 0.1 0.1 0.1Ladismith Cheese 0.4 0.4 0.3 0.3 0.2 0.2 0.1 0.1Danone Clover (Pty) Ltd ‐ ‐ ‐ ‐ ‐ 0.1 0.1 0.1Cadbury Schweppes Plc 0.1 0.1 0.1 0.1 0.2 0.2 0.2 ‐Homestead Independent Dairy 0.7 0.7 0.7 0.8 0.8 0.8 ‐ ‐Simonsberg Cheese (Pty) Ltd 1.7 1.6 1.5 1.5 ‐ ‐ ‐ ‐Frucon Foods 0.3 0.2 0.1 0.1 ‐ ‐ ‐ ‐Private Label 6.1 6.3 6.6 6.6 6.6 6.7 6.8 7.0Others 14.6 13.8 14.3 13.9 12.2 11.9 11.9 11.8Total 100 100 100 100 100 100 100 100 Source: Euromonitor International, 2010 8.) Availability of forage and raw materials for feed & nutrition FAO, Country Pasture/Forage Resource Profiles – South Africa. Tony Palmer and Andrew Ainslie, August 2006. A.) Freehold/Commercial sector The commercial farming sector in South Africa is well developed, capital‐intensive and largely export oriented. Commercial area livestock production accounts for 75% of national agricultural output and comes from 52% of the farming/grazing land. The freehold area is divided into approximately 55,000 farms with an average size of 120 ha, owned by about 45, 000 individuals or agricultural enterprises. In the commercial sector, cattle are mostly grazed in the eastern parts of the country where the rangelands generally have a higher carrying capacity. Grazing livestock are raised under extensive ranching conditions, relying on natural pasture occasionally supplemented by protein/mineral licks. Grazing land is normally fenced into paddocks. B.) Communal/Subsistence sector

Capability Assessment of Australian Dairy Technology and Services ‐ AANC Pty Ltd, July 2010
_________________________________________________________________________________________________________ Page 319 of 329
The communal areas occupy about 17% of the total farming area of South Africa and hold approximately 52% of the total cattle population, 72% of the goats and 17% of the sheep. They differ markedly from the freehold areas in their production systems, objectives and property rights. Only the cropping areas are normally allocated to individual households, while the grazing areas tend to be shared by members of a community. The communal sector has a substantially higher human population per unit area than the commercial sector, and has suffered from lower levels of state intervention. Investments in infra‐structure (access roads, fences, water provision, power supply, dipping facilities) has not kept up with the commercial rangeland. The majority of households are subsistence‐based and labour intensive, with limited use of technology and external inputs. Cattle, sheep and goats are herded during the cropping season in cropping areas, and where there are predator or theft risks in other areas, but herding tends to be relaxed during the dry season during which animals have access to crop residues. The main forage resource for livestock in South Africa is rangeland grazing. In the higher rainfall zones crop residues are a very important feed supplement in the communal areas during the dry season when range grazing is scarce, while in the commercial areas some farmers plant fodder species. Irrigated fodder production is very limited owing to the lack of suitable soils and water supplies in the commercial areas. In times of drought, South Africa imports fodder from neighbouring countries. Dryland grain production The cultivation of rainfed crops in South Africa is widespread, occurring in both commercial and communal land‐use systems. The most significant commercial grain producing areas are the "maize triangle" of the central Highveld, the wheat growing region of the south western Cape and the maize growing regions of central Kwa‐Zulu Natal. Maize is widely preferred as the staple food in the communal areas, but millet and sorghum are more reliable crops except in the highest rainfall zones. National cereal production (roughly 80% maize, 16% wheat and 4% other (including millet and sorghum) fluctuates considerably from year to year according to rainfall. As shown in the table below, production has varied from a low of 5 million MT in the drought year of 1991/92 to a record high of 16 million MT in 1993/94. Table 99. Commercial cereal crops grown in South Africa from 1992‐2000 (‘000 MT)
Irrigated forage production There are some 80 species of commercially available species and cultivars which are used in South Africa. Lucerne (Medicago sativa) is the main purpose grown irrigated fodder in South Africa, and is grown under irrigation throughout the country. Ryegrass (Lolium multiflorum and L. perenne) is cultivated on a large scale for pastures in the dairy industry.

Capability Assessment of Australian Dairy Technology and Services ‐ AANC Pty Ltd, July 2010
_________________________________________________________________________________________________________ Page 320 of 329
9.) Availability of Artificial Insemination laboratories and testing facilities for cattle; also veterinary services Austrade Office, Johannesburg: The three most active testing facilities are the: o Onderstepoort Veterinary Institute (http://web.up.ac.za/default.asp?ipkCategoryID=83), o Agricultural Research Council (http://www.arc.agric.za/home.asp?pid=1), and o The CSIR (http://www.csir.co.za/research_and_development/research_development.html). 10.) Agribusiness educational facilities to support dairy production Austrade Office, Johannesburg: All the major tertiary institutions in South Africa provide education in Agribusiness. The ''Milk Producers Organisation of South Africa'' (www.mposa.co.za) is the local organisation which assists the national and provincial governments. Dairy Connect (www.dairyconnect.co.za) assist producers with training in the market. Agricultural Colleges in South Africa include:
o Fort Cox Agricultural College, o Cedara Agricultural College, o Middelburg Agricultural College, o Glen Agricultural College, o Elsenburg Agricultural College, o Tsolo Agricultural College.
Graduate and post‐graduate level training in rangeland science and related disciplines is provided at the following Universities in South Africa:
o Potchefstroom University o Rand Afrikaans University o Rhodes University o Stellenbosch University o University of Cape Town (UCT) o University of Durban ‐ Westville (UDW) o University of Fort Hare o University of Natal (Durban) (UN) o University of Natal (Pietermaritzburg) o University of the North o University of the North West o University of the Orange Free State o University of Port Elizabeth o University of Pretoria (Tuks) o University of Transkei
Capability Assessment of Australian Dairy Technology and Services ‐ AANC Pty Ltd, July 2010
_________________________________________________________________________________________________________ Page 321 of 329
o University of Venda (UNIVEN) o University of the Western Cape o University of the Witwatersrand, Johannesburg (Wits) o University of Zululand
William Gertenbach, Institute for Animal Production, Western Cape Department of Agriculture. Circa 2007 Unfortunately dairy research in South Africa has declined significantly. It is sad to note that there are currently very few effective dairy research herds remaining. These include the two research herds of the Western Cape, situated at Outeniqua (George) and Elsenburg. 11.) Dairy consumption trends (past 5 years) DATAMONITOR www.datamonitor.com Dairy in South Africa. Industry Profile. Reference Code: 0044‐0711. November 2009 The South African dairy market generated total revenues of $3.2 billion in 2008, representing a compound annual growth rate (CAGR) of 5.2% for the period spanning 2004‐2008. Milk sales proved the most lucrative for the South African dairy market in 2008, generating total revenues of $1.3 billion, equivalent to 40.5% of the market's overall value. However, the performance of the market is forecast to decelerate, with an anticipated CAGR of 4.7% for the five‐year period 2008‐2013, which is expected to lead the market to a value of $4.1 billion by the end of 2013.
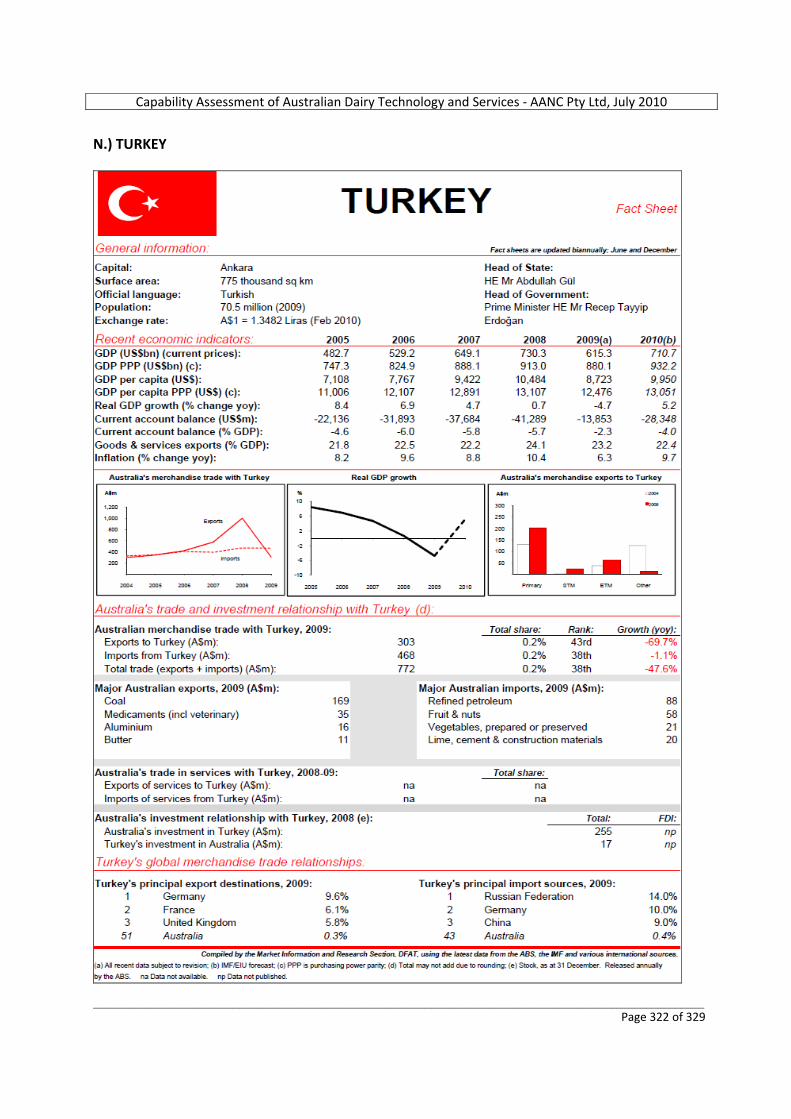
Capability Assessment of Australian Dairy Technology and Services ‐ AANC Pty Ltd, July 2010
_________________________________________________________________________________________________________ Page 322 of 329
N.) TURKEY
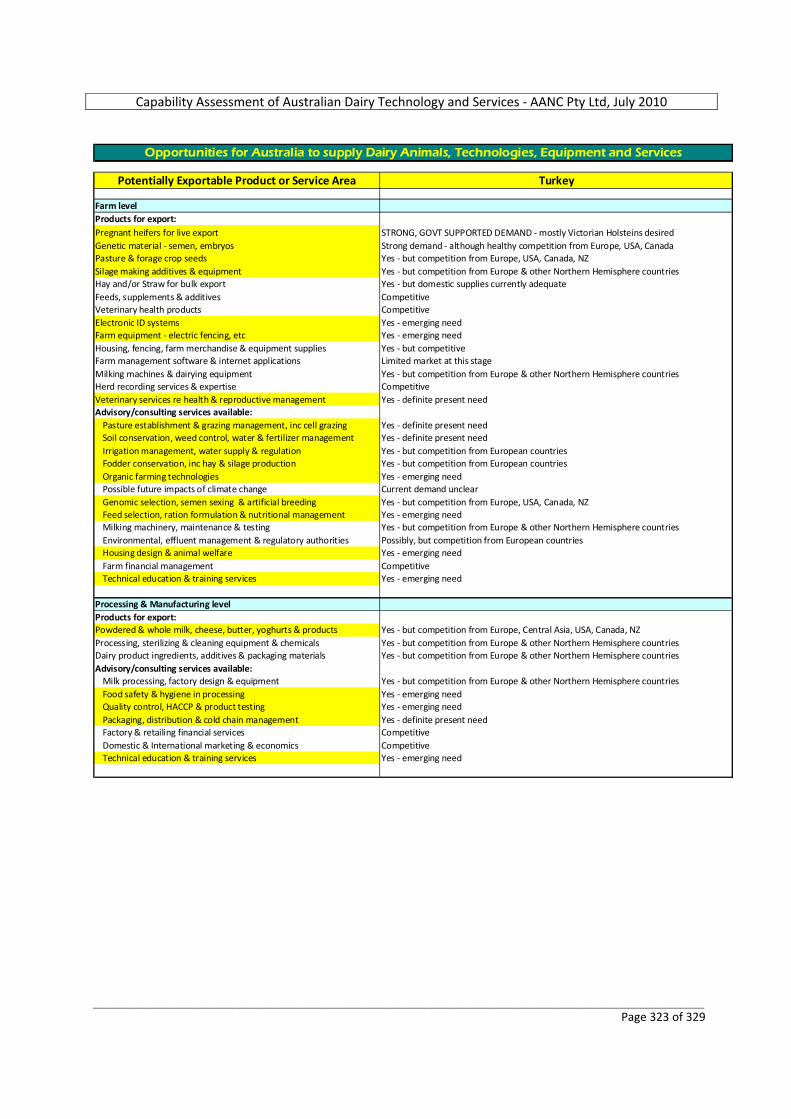
Capability Assessment of Australian Dairy Technology and Services ‐ AANC Pty Ltd, July 2010
_________________________________________________________________________________________________________ Page 323 of 329
Potentially Exportable Product or Service Area Turkey
Farm levelProducts for export:Pregnant heifers for live export STRONG, GOVT SUPPORTED DEMAND ‐ mostly Victorian Holsteins desiredGenetic material ‐ semen, embryos Strong demand ‐ although healthy competition from Europe, USA, CanadaPasture & forage crop seeds Yes ‐ but competition from Europe, USA, Canada, NZSilage making additives & equipment Yes ‐ but competition from Europe & other Northern Hemisphere countriesHay and/or Straw for bulk export Yes ‐ but domestic supplies currently adequateFeeds, supplements & additives CompetitiveVeterinary health products CompetitiveElectronic ID systems Yes ‐ emerging needFarm equipment ‐ electric fencing, etc Yes ‐ emerging needHousing, fencing, farm merchandise & equipment supplies Yes ‐ but competitiveFarm management software & internet applications Limited market at this stageMilking machines & dairying equipment Yes ‐ but competition from Europe & other Northern Hemisphere countriesHerd recording services & expertise CompetitiveVeterinary services re health & reproductive management Yes ‐ definite present needAdvisory/consulting services available:
Pasture establishment & grazing management, inc cell grazing Yes ‐ definite present needSoil conservation, weed control, water & fertilizer management Yes ‐ definite present needIrrigation management, water supply & regulation Yes ‐ but competition from European countriesFodder conservation, inc hay & silage production Yes ‐ but competition from European countriesOrganic farming technologies Yes ‐ emerging needPossible future impacts of climate change Current demand unclearGenomic selection, semen sexing & artificial breeding Yes ‐ but competition from Europe, USA, Canada, NZFeed selection, ration formulation & nutritional management Yes ‐ emerging needMilking machinery, maintenance & testing Yes ‐ but competition from Europe & other Northern Hemisphere countriesEnvironmental, effluent management & regulatory authorities Possibly, but competition from European countriesHousing design & animal welfare Yes ‐ emerging needFarm financial management CompetitiveTechnical education & training services Yes ‐ emerging need
Processing & Manufacturing levelProducts for export:Powdered & whole milk, cheese, butter, yoghurts & products Yes ‐ but competition from Europe, Central Asia, USA, Canada, NZProcessing, sterilizing & cleaning equipment & chemicals Yes ‐ but competition from Europe & other Northern Hemisphere countriesDairy product ingredients, additives & packaging materials Yes ‐ but competition from Europe & other Northern Hemisphere countriesAdvisory/consulting services available:
Milk processing, factory design & equipment Yes ‐ but competition from Europe & other Northern Hemisphere countriesFood safety & hygiene in processing Yes ‐ emerging needQuality control, HACCP & product testing Yes ‐ emerging needPackaging, distribution & cold chain management Yes ‐ definite present needFactory & retailing financial services CompetitiveDomestic & International marketing & economics CompetitiveTechnical education & training services Yes ‐ emerging need
Opportunities for Australia to supply Dairy Animals, Technologies, Equipment and Services
Capability Assessment of Australian Dairy Technology and Services ‐ AANC Pty Ltd, July 2010
_________________________________________________________________________________________________________ Page 324 of 329
TURKISH DAIRY INDUSTRY OVERVIEW Turkish Dairy Sector Summary Leyla Yuksel, Ankara, May 2009 Turkish agriculture has been a major employer and contributor to GDP over many years. According to the results of a General Agricultural Census in 2001, Turkey then had an estimated 35 % of its population living in rural areas. In 2001 there were 3.1 million farms, with 2.1 million of these raising cattle. One‐third of all agricultural activities related to livestock farming. The dairy sector is vital in Turkey, particularly for the creation of employment opportunities in rural and less developed areas. Turkey is among the 15 largest milk producing countries in the world, with annual output of approximately 12 billion litres in 2008. Of this output, 91.9% comes from cows, 6.1% from sheep, and 1.7% from goats. More than 50% of the milk is handled outside any formal quality control system, and is unpasteurized and unpacked. About 35% of fluid milk is processed by ‘mandras’, while the share of fluid milk processed in modern milk factories having food safety controls was only 19% in 2008. In general, dairy processors in Turkey find it difficult to obtain sufficient quantities of high quality raw milk. The consumption of drinking milk is comparatively low, utilising only about 18% of production and accounting for about 15% of the per capita consumption of dairy products in Turkey. In absolute terms, milk consumption per capita is 147 litres per annum, compared with, for example, Poland with a consumption of 321 litres per annum. Cheese and yoghurt are the preferred consumed products, as 73% of milk goes into the making of these products. Dairy products have long held a very important place In the Turkish diet. In the case of milk production from small subsistence or semi‐subsistence farms, 90% is consumed directly by the farm household as yoghurt and ayran (60% of total production), liquid milk (20%), and cheese (10%). The remaining 10% of total production from these farms is sold locally. Across the country, the most commonly consumed dairy products are yogurt and feta cheese followed by liquid milk and ayran (a salted yogurt drink). The price of milk is relatively high in comparison with the purchasing power of most consumers. This price is influenced by the high costs of the milk collection. Only the higher income groups can afford to buy industrially processed milk. The lower priced, non‐processed, low quality milk is that consumed by the lower income households. UPDATE Milking dairy cows and pregnant dairy heifers have adopted very high values in recent months, with current values (as at Sept, 2010) being in the order of 5.00–6.00 EUR/kg LW, which equates to approx AU$7.10‐8.52/kg LW. Cows at around 550 kg are being delivered to Turkish dairies for 3,000 EUR (AU$ 4,260) per head. Farm‐gate milk prices in Turkey (as at Sept, 2010) are approx 0.90‐1.00 TRY per litre, or AU$0.65‐0.72 per litre. The best herds attract a 30% premium on these prices.

Capability Assessment of Australian Dairy Technology and Services ‐ AANC Pty Ltd, July 2010
_________________________________________________________________________________________________________ Page 325 of 329
TURKEY SLASHES IMPORT TARIFFS ON LIVE CATTLE IMPORTS During recent years, the extraction rate of the dairy herd in Turkey has outpaced herd growth through traditional heifer replacement programmes, thereby resulting in a shortage of dairy animals.
It should be of interest to Australian live exporters that Turkey has recently dramatically reduced import tariffs on imported live cattle – from 138% to 40% ‐ taking effect from 9 August 2010.
The Turkish market for live exported Australian dairy cattle could be quite significant over the coming years.
AUSTRALIAN MEDIA REPORT (THIS ITEM RELATES TO BEEF BREEDS, BUT GIVES A USEFUL INSIGHT INTO POSSIBILITIES WITH DAIRY HEIFERS, ESPECIALLY AS THE BEEF AND DAIRY INDUSTRIES ARE VERY CLOSELY ALIGNED IN TURKEY. IN FACT THE ENTIRE BEEF INDUSTRY IS VERY MUCH A BY‐PRODUCT OF THE DAIRY INDUSTRY – WITH DAIRY BULLS FORMING THE BASIS OF THE BEEF INDUSTRY.) “Turkey's big beef breeder buy‐up” The Land Newspaper, NSW. http://www.theland.com.au Sally White and Brett Tindal, 18 March 2010. An export order of 1600 Angus heifers bound for Turkey next month could be just a taste of a much bigger feast to come for breeders. Austock Exports Turkey (AET) has spent the past 3 weeks helping select 1600 females – about half of them pregnancy tested in calf – from Angus herds in northern and southern NSW and northern Victoria to help kickstart a new chapter in Turkey’s beef industry. The stock will leave for Turkey next month, to be split among three private pastoral companies, and likely fill four 747 planes and a small vessel. AET general manager, Sinan Ogun, who splits his time between Istanbul and Sydney, said orders for another 3,000‐3,500 head would likely flow as soon as early next year and may even extend to some Angus bulls. “In the past 6 months, the gates have opened – our Turkish office is now getting 8 to 10 inquiries a week,” he said. This follows trials of about 110 head in 2008 that showed the breed to be a good fit for Turkish conditions. Mr Ogun said there was ongoing demand from Turkey for at least 6,000 females a year – and potentially up to 10,000 head a year. “Really they are going to need about 60,000 to 80,000 animals during the next 6 to 7 years to really expand but there’s no way they’re going to be able to do that through live imports alone. “It’s going to have to happen through ET (embryo transfer) as well.” And while the Turkish industry lacked experience in large‐scale ET, the current order included HBR females that would make good donors. Mr Ogun said most of the beef being eaten in Turkey currently was from two‐year‐old Holstein bulls. “And when I say that I mean bulls – not steers. It’s a credit to Turkish chefs that their cuisine is so good.” He said the Turkish beef herd was principally based on Holstein, Brown Swiss and Simmental genetics – and even the latter was bred principally for milk production. Beef imports by Turkey were almost nil, with a tariff of about 135 % making it price prohibitive. While meat prices were double what they were in Australia, so too were production costs with as much as 78 % of farm outgoings typically going to feed.
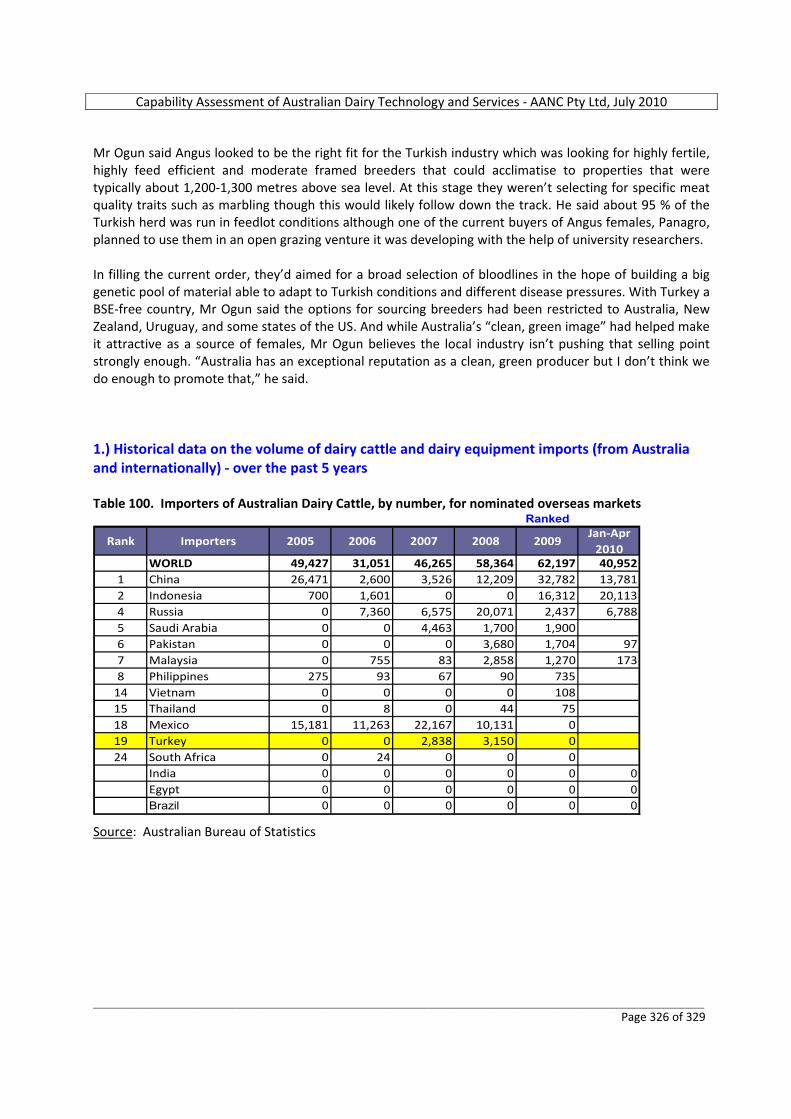
Capability Assessment of Australian Dairy Technology and Services ‐ AANC Pty Ltd, July 2010
_________________________________________________________________________________________________________ Page 326 of 329
Mr Ogun said Angus looked to be the right fit for the Turkish industry which was looking for highly fertile, highly feed efficient and moderate framed breeders that could acclimatise to properties that were typically about 1,200‐1,300 metres above sea level. At this stage they weren’t selecting for specific meat quality traits such as marbling though this would likely follow down the track. He said about 95 % of the Turkish herd was run in feedlot conditions although one of the current buyers of Angus females, Panagro, planned to use them in an open grazing venture it was developing with the help of university researchers. In filling the current order, they’d aimed for a broad selection of bloodlines in the hope of building a big genetic pool of material able to adapt to Turkish conditions and different disease pressures. With Turkey a BSE‐free country, Mr Ogun said the options for sourcing breeders had been restricted to Australia, New Zealand, Uruguay, and some states of the US. And while Australia’s “clean, green image” had helped make it attractive as a source of females, Mr Ogun believes the local industry isn’t pushing that selling point strongly enough. “Australia has an exceptional reputation as a clean, green producer but I don’t think we do enough to promote that,” he said. 1.) Historical data on the volume of dairy cattle and dairy equipment imports (from Australia and internationally) ‐ over the past 5 years Table 100. Importers of Australian Dairy Cattle, by number, for nominated overseas markets
Ranked
Rank Importers 2005 2006 2007 2008 2009Jan‐Apr
2010WORLD 49,427 31,051 46,265 58,364 62,197 40,952
1 China 26,471 2,600 3,526 12,209 32,782 13,7812 Indonesia 700 1,601 0 0 16,312 20,1134 Russia 0 7,360 6,575 20,071 2,437 6,7885 Saudi Arabia 0 0 4,463 1,700 1,9006 Pakistan 0 0 0 3,680 1,704 977 Malaysia 0 755 83 2,858 1,270 1738 Philippines 275 93 67 90 735
14 Vietnam 0 0 0 0 10815 Thailand 0 8 0 44 7518 Mexico 15,181 11,263 22,167 10,131 019 Turkey 0 0 2,838 3,150 024 South Africa 0 24 0 0 0
India 0 0 0 0 0 0Egypt 0 0 0 0 0 0Brazil 0 0 0 0 0 0
Source: Australian Bureau of Statistics
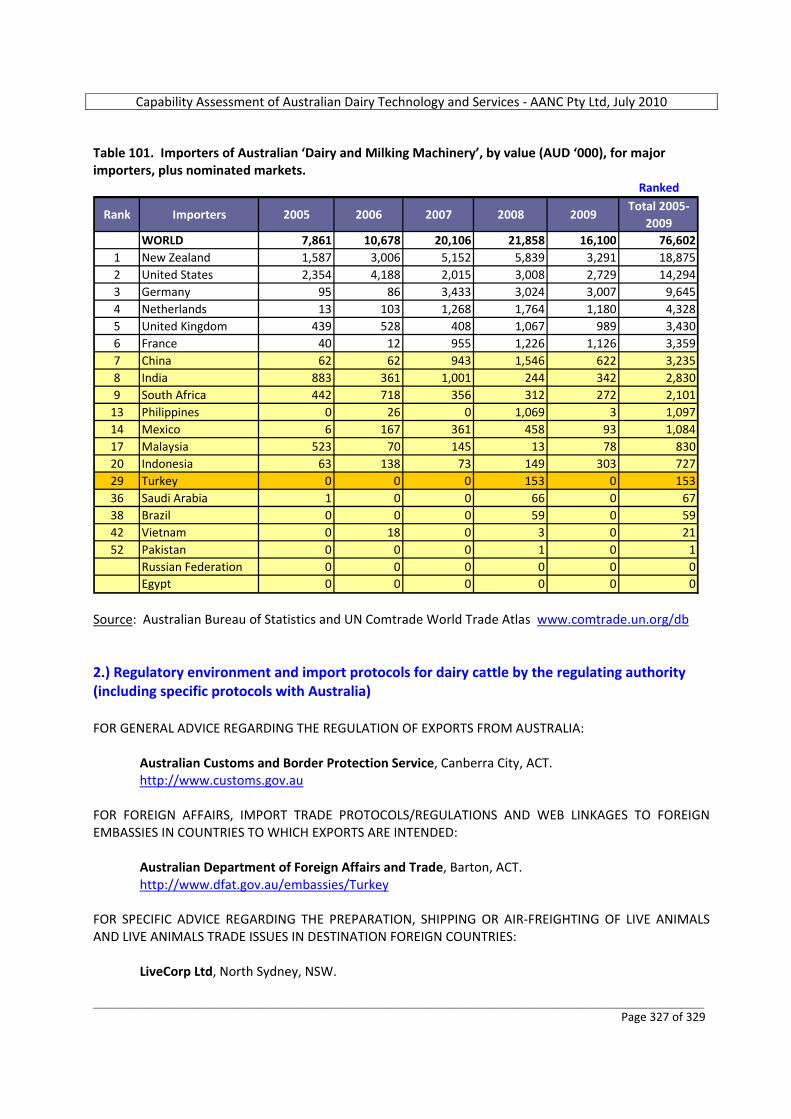
Capability Assessment of Australian Dairy Technology and Services ‐ AANC Pty Ltd, July 2010
_________________________________________________________________________________________________________ Page 327 of 329
Table 101. Importers of Australian ‘Dairy and Milking Machinery’, by value (AUD ‘000), for major importers, plus nominated markets.
Ranked
Rank Importers 2005 2006 2007 2008 2009Total 2005‐
2009WORLD 7,861 10,678 20,106 21,858 16,100 76,602
1 New Zealand 1,587 3,006 5,152 5,839 3,291 18,8752 United States 2,354 4,188 2,015 3,008 2,729 14,2943 Germany 95 86 3,433 3,024 3,007 9,6454 Netherlands 13 103 1,268 1,764 1,180 4,3285 United Kingdom 439 528 408 1,067 989 3,4306 France 40 12 955 1,226 1,126 3,3597 China 62 62 943 1,546 622 3,2358 India 883 361 1,001 244 342 2,8309 South Africa 442 718 356 312 272 2,101
13 Philippines 0 26 0 1,069 3 1,09714 Mexico 6 167 361 458 93 1,08417 Malaysia 523 70 145 13 78 83020 Indonesia 63 138 73 149 303 72729 Turkey 0 0 0 153 0 15336 Saudi Arabia 1 0 0 66 0 6738 Brazil 0 0 0 59 0 5942 Vietnam 0 18 0 3 0 2152 Pakistan 0 0 0 1 0 1
Russian Federation 0 0 0 0 0 0Egypt 0 0 0 0 0 0
Source: Australian Bureau of Statistics and UN Comtrade World Trade Atlas www.comtrade.un.org/db 2.) Regulatory environment and import protocols for dairy cattle by the regulating authority (including specific protocols with Australia) FOR GENERAL ADVICE REGARDING THE REGULATION OF EXPORTS FROM AUSTRALIA:
Australian Customs and Border Protection Service, Canberra City, ACT. http://www.customs.gov.au
FOR FOREIGN AFFAIRS, IMPORT TRADE PROTOCOLS/REGULATIONS AND WEB LINKAGES TO FOREIGN EMBASSIES IN COUNTRIES TO WHICH EXPORTS ARE INTENDED:
Australian Department of Foreign Affairs and Trade, Barton, ACT. http://www.dfat.gov.au/embassies/Turkey
FOR SPECIFIC ADVICE REGARDING THE PREPARATION, SHIPPING OR AIR‐FREIGHTING OF LIVE ANIMALS AND LIVE ANIMALS TRADE ISSUES IN DESTINATION FOREIGN COUNTRIES:
LiveCorp Ltd, North Sydney, NSW.
Capability Assessment of Australian Dairy Technology and Services ‐ AANC Pty Ltd, July 2010
_________________________________________________________________________________________________________ Page 328 of 329
http://www.livecorp.com.au FOR SPECIFIC ADVICE REGARDING PROTOCOLS FOR THE EXPORT OF LIVE ANIMALS (OR ANIMAL‐DERIVED PRODUCTS SUCH AS SEMEN AND EMBRYOS) FROM AUSTRALIA AND IMPORT PROTOCOLS IN DESTINATION FOREIGN COUNTRIES:
Australian Quarantine and Inspection Service (AQIS), Canberra City, ACT. http://www.aqis.gov.au
Specific advice on Turkey Turkey has very recently dramatically reduced import duties on imported live cattle – from 138 % to 40 %, taking effect from 9 August 2010. 3.) National government programs to assist with the development of dairy operations The Ministry of Agriculture and Rural Affairs in Turkey has recently announced a dairy industry support programme (applicable in regions of Eastern Turkey only), consisting of subsidies to the value of 10% of the value of newly established dairy farms, up to a maximum of TRY 1 million (AU$720,000) per farm. The object of the program is to boost the dairy industry, as well as assist in poverty alleviation in some of the poorer districts of the country. Turkish Dairy Sector Summary Leyla Yuksel, Ankara, May 2009 Milk producers who sell their milk to processing establishments with legal working permissions, licences and milk incentive codes, are included in a special subsidy support programme by the Government. In this way, the Government aims to register the milk produced as well as foster the processing of milk under hygienic conditions. Details of the national support schemes are as follows: o Milk Support: The aim of the scheme is to meet high quality milk requirements of the industry and to
register the milk production. The farmers who sell their milk to the processing enterprises having working licences and milk incentive codes are supported under this scheme.
Support is paid on per litre basis at different levels to achieve improvement and structural transformation of this sector, including encouragements by additional payments. Farmers who are registered members of a Producer Organisation (which registers the animals to the pedigree system, to contribute to the improvement activities of the Ministry of Agriculture and Rural Affairs) are supported by additional payments. Moreover the organized farmers who use advisory services (agricultural engineers or veterinarians) receive additional payments.
o Support for stable or mobile milking units and cooling tanks: Milk producers having a minimum of 10
cows registered to the pre‐pedigree or pedigree who invest for milking units and cooling tanks are supported to the extent of 40 % of their investment. Producers having a minimum 50 sheep and/or
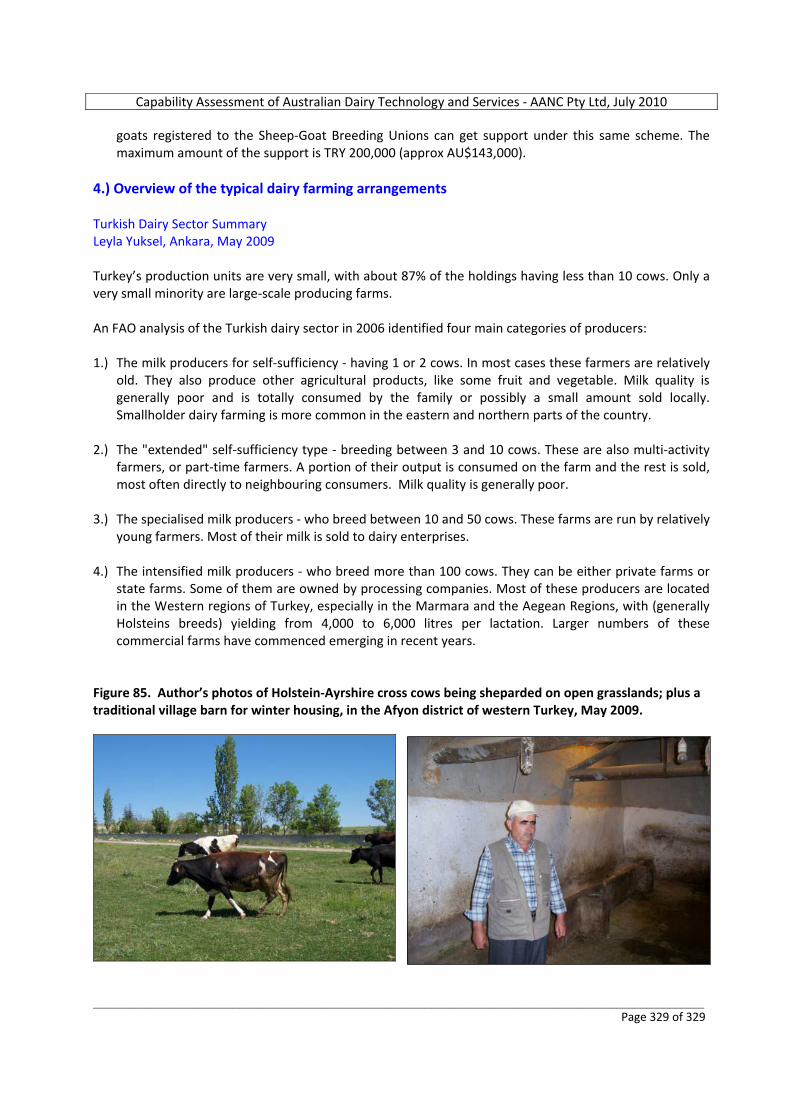
Capability Assessment of Australian Dairy Technology and Services ‐ AANC Pty Ltd, July 2010
_________________________________________________________________________________________________________ Page 329 of 329
goats registered to the Sheep‐Goat Breeding Unions can get support under this same scheme. The maximum amount of the support is TRY 200,000 (approx AU$143,000).
4.) Overview of the typical dairy farming arrangements Turkish Dairy Sector Summary Leyla Yuksel, Ankara, May 2009 Turkey’s production units are very small, with about 87% of the holdings having less than 10 cows. Only a very small minority are large‐scale producing farms. An FAO analysis of the Turkish dairy sector in 2006 identified four main categories of producers: 1.) The milk producers for self‐sufficiency ‐ having 1 or 2 cows. In most cases these farmers are relatively
old. They also produce other agricultural products, like some fruit and vegetable. Milk quality is generally poor and is totally consumed by the family or possibly a small amount sold locally. Smallholder dairy farming is more common in the eastern and northern parts of the country.
2.) The "extended" self‐sufficiency type ‐ breeding between 3 and 10 cows. These are also multi‐activity
farmers, or part‐time farmers. A portion of their output is consumed on the farm and the rest is sold, most often directly to neighbouring consumers. Milk quality is generally poor.
3.) The specialised milk producers ‐ who breed between 10 and 50 cows. These farms are run by relatively
young farmers. Most of their milk is sold to dairy enterprises. 4.) The intensified milk producers ‐ who breed more than 100 cows. They can be either private farms or
state farms. Some of them are owned by processing companies. Most of these producers are located in the Western regions of Turkey, especially in the Marmara and the Aegean Regions, with (generally Holsteins breeds) yielding from 4,000 to 6,000 litres per lactation. Larger numbers of these commercial farms have commenced emerging in recent years.
Figure 85. Author’s photos of Holstein‐Ayrshire cross cows being sheparded on open grasslands; plus a traditional village barn for winter housing, in the Afyon district of western Turkey, May 2009.