Regulation of acetylcholine receptor clustering by the tumor suppressor APC

Article
Cancer-Associated Protein Kinase C Mutations
Reveal Kinase’s Role as Tumor SuppressorGraphical Abstract
Highlights
d Cancer-associated PKC mutations are LOF and can act in a
dominant-negative manner
d Correcting a heterozygous PKCb LOF mutation reduces
tumor volume
d Hemizygous deletion shows PKC is haploinsufficient for
tumor suppression
d Therapeutic strategies should aim to restore PKC activity
instead of inhibiting it
Antal et al., 2015, Cell 160, 489–502January 29, 2015 ª2015 Elsevier Inc.http://dx.doi.org/10.1016/j.cell.2015.01.001
Authors
Corina E. Antal, Andrew M. Hudson, ...,
John Brognard, Alexandra C. Newton
[email protected](J.B.),[email protected] (A.C.N.)
In Brief
Cancer-associated kinase mutations
have generally been characterized as
oncogenic, but an analysis of PKC
mutations reveals that the majority are
loss of function, indicating a tumor-
suppressive role for this kinase and a shift
in therapeutic strategies targeting PKC.

Article
Cancer-Associated Protein Kinase CMutationsReveal Kinase’s Role as Tumor SuppressorCorina E. Antal,1,2 Andrew M. Hudson,3 Emily Kang,1 Ciro Zanca,4 Christopher Wirth,5 Natalie L. Stephenson,3
Eleanor W. Trotter,3 Lisa L. Gallegos,1,2,7 Crispin J. Miller,5 Frank B. Furnari,4 Tony Hunter,6 John Brognard,3,*and Alexandra C. Newton1,*1Department of Pharmacology, University of California at San Diego, La Jolla, CA 92093, USA2Biomedical Sciences Graduate Program, University of California at San Diego, La Jolla, CA 92093, USA3Signalling Networks in Cancer Group, Cancer Research UK Manchester Institute, University of Manchester, Manchester M20 4BX, UK4Ludwig Institute for Cancer Research, University of California at San Diego, La Jolla, CA 92093, USA5AppliedComputational Biology andBioinformaticsGroup, Cancer ResearchUKManchester Institute, University ofManchester, ManchesterM20 4BX, UK6The Salk Institute, La Jolla, CA 92037, USA7Present address: Department of Cell Biology, Harvard Medical School, Boston, MA 02115, USA
*Correspondence: [email protected] (J.B.), [email protected] (A.C.N.)http://dx.doi.org/10.1016/j.cell.2015.01.001
SUMMARY
Protein kinase C (PKC) isozymes have remainedelusive cancer targets despite the unambiguous tu-mor promoting function of their potent ligands, phor-bol esters, and the prevalence of their mutations. Weanalyzed 8% of PKC mutations identified in humancancers and found that, surprisingly, most were lossof function and none were activating. Loss-of-func-tion mutations occurred in all PKC subgroups andimpeded second-messenger binding, phosphory-lation, or catalysis. Correction of a loss-of-functionPKCbmutation by CRISPR-mediated genome editingin a patient-derived colon cancer cell line suppressedanchorage-independent growth and reduced tumorgrowth in a xenograft model. Hemizygous deletionpromoted anchorage-independent growth, revealingthat PKCb is haploinsufficient for tumor suppression.Severalmutationswere dominant negative, suppress-ing global PKC signaling output, and bioinformaticanalysis suggested that PKC mutations cooperatewith co-occurring mutations in cancer drivers. Thesedata establish that PKC isozymes generally fun-ction as tumor suppressors, indicating that therapiesshould focus on restoring, not inhibiting, PKC activity.
INTRODUCTION
The protein kinase C (PKC) family has been intensely investi-
gated in the context of cancer since the discovery that it is a re-
ceptor for the tumor-promoting phorbol esters (Castagna et al.,
1982). This led to the dogma that activation of PKC by phorbol
esters promotes carcinogen-induced tumorigenesis (Griner
and Kazanietz, 2007), yet targeting PKC in cancer has been
unsuccessful.
The PKC family contains nine genes that have many targets
and thus diverse cellular functions, including cell survival, prolif-
eration, apoptosis, and migration (Dempsey et al., 2000). PKC
isozymes comprise three classes: conventional (cPKC: a, b, g),
novel (nPKC: d, ε, h, q), and atypical (aPKC: z, i). cPKC and
nPKC isozymes are constitutively phosphorylated at three prim-
ing sites (activation loop, turn motif, and hydrophobic motif) to
structure PKC for catalysis (Newton, 2003). A pseudosubstrate
segment maintains PKC in an autoinhibited conformation that
is relieved by second-messenger binding. cPKC isozymes are
activated by binding to diacylglycerol (DAG) and Ca2+, whereas
nPKC isozymes are activated solely by DAG, events that engage
PKC at membranes. Thus, these PKC isozymes have two pre-
requisites for activation: constitutive processing phosphoryla-
tions and second-messenger-dependent relocalization to mem-
branes. Prolonged activation of cPKC and nPKC isozymes with
phorbol esters leads to their dephosphorylation and subsequent
degradation, a process referred to as downregulation (Hansra
et al., 1996; Young et al., 1987). aPKC isozymes bind neither
Ca2+ nor DAG.
PKC has proved an intractable target in cancer therapeutics
(Kang, 2014). PKCi was proposed to be an oncogene in lung
and ovarian cancers (Justilien et al., 2014; Regala et al., 2005;
Zhang et al., 2006), and PKCε was categorized as an oncogene
because of its ability to transform cells (Cacace et al., 1993).
However, for most PKC isozymes, there is conflicting evidence
as to whether they act as oncogenes or as tumor suppressors.
For example, PKCd is considered a tumor suppressor because
of its pro-apoptotic effects (Reyland, 2007). However, it pro-
motes tumor progression of lung and pancreatic cancers in
certain contexts (Mauro et al., 2010; Symonds et al., 2011). Simi-
larly, both overexpression and loss of PKCz in colon cancer cells
have been reported to decrease tumorigenicity in nude mice or
cell lines, respectively (Luna-Ulloa et al., 2011; Ma et al., 2013).
Likewise, PKCa was reported to both induce (Walsh et al.,
2004; Wu et al., 2013) and suppress colon cancer cell prolifera-
tion (Gwak et al., 2009) and to suppress colon tumor formation in
the APCMin/+ model (Oster and Leitges, 2006). Based on the
dogma that PKC isozymes contribute positively to cancer pro-
gression, many PKC inhibitors have entered clinical trials; how-
ever, they have been ineffective (Mackay and Twelves, 2007).
Cell 160, 489–502, January 29, 2015 ª2015 Elsevier Inc. 489

Figure 1. A Multitude of Cancer-Associated Mutations Have Been
Identified within the Nine PKC Genes
(Left) Domain structure of conventional (a, b, g), novel (d, ε, h, q), and atypical
(z, i) PKC members showing priming phosphorylation sites: activation loop
(pink), turn motif (orange), and hydrophobic motif (green). (Right) Number of
TCGA cases with cancer-associated mutations (missense, nonsense, in-
sertions, deletions, splice site, or translation start site) identified within each of
the PKC genes.
In fact, a recent meta-analysis of controlled trials of PKC inhibi-
tors combined with chemotherapy versus chemotherapy alone
revealed that PKC inhibitors significantly decreased response
rates and disease control rates in non-small cell lung cancer
(Zhang et al., 2014). Why has inhibiting PKC failed in the clinic?
It has been well established that prolonged or repetitive treat-
ment with phorbol esters depletes cPKC and nPKC isozymes
from cells (Blumberg, 1980; Nelson and Alkon, 2009), bringing
into question whether loss of PKC, rather than its activation, pro-
motes tumorigenesis.
PKC is frequently mutated in human cancers. To uncover
whether loss or gain of PKC function contributes to cancer pro-
gression, we selected mutations throughout the primary se-
quence and family membership and assessed their functional
impact. Specifically, we asked how these cancer-associated
mutations alter the signaling output of PKC using our genetically
encoded reporter, C kinase activity reporter (CKAR) (Violin et al.,
2003). Characterization of 46 of these mutations revealed that
most reduced or abolished PKC activity and none were acti-
vating. Bioinformatic analysis of all PKC mutations revealed
that they may cooperate with co-occurring mutations in onco-
genes and tumor suppressors known to be regulated by PKC.
Correction of one patient-identified, heterozygous, loss-of-func-
tion (LOF) PKCb mutation in a colon cancer cell line significantly
decreased tumor size inmouse xenografts, indicating that loss of
PKC function enhances tumor growth. Our data are consistent
with PKC isozymes functioning generally as tumor suppressors,
reversing the paradigm that their hyperactivation promotes tu-
mor growth.
RESULTS
A Multitude of Cancer-Associated Mutations Have BeenIdentified within the Nine PKC Genes554 mutations (as of October 2014), of which most are heterozy-
gous, have been identified in diverse cancers (Cerami et al.,
2012; Gao et al., 2013) within cPKC (242), nPKC (236), and
aPKC (76) isozymes (Figure 1). These mutations reside through-
out the entire coding region, with no apparent mutational hot-
spots. Therefore, we conducted a comprehensive study of
490 Cell 160, 489–502, January 29, 2015 ª2015 Elsevier Inc.
mutations within PKC domains and within interdomain regions
to determine how they affect PKC signaling to contribute to
cancer pathogenesis. 46 mutations of both conserved and
non-conserved residues were selected from all three classes
of PKC isozymes (Table 1 and Table S1).
PKC Mutations in the Regulatory C1 and C2 DomainsAre LOFTheC1 domains of cPKC and nPKC isozymes are critical for their
activation because they mediate PKC translocation to mem-
branes via binding to DAG. Thus, we investigated how C1
domain mutations alter PKC translocation and activation. To
measure agonist-dependent PKC activity, COS7 cells co-ex-
pressing the FRET-based PKC reporter (CKAR) and equal levels
of either wild-type (WT) or mutant mCherry-tagged PKC were
stimulated with the cell-permeable DAG, DiC8, or the phorbol
ester, phorbol 12,13-dibutyrate (PDBu), and phosphorylation-
dependent FRET ratio changes were recorded. Phorbol esters
serve as an effective although non-physiological tool to maxi-
mally activate PKC because they bind with 100-fold higher affin-
ity to C1 domains compared to DAG (Mosior and Newton, 1998).
A mutation identified in a colorectal cancer tumor altered a res-
idue (PKCa H75Q) required for coordination of Zn2+ and thus
for folding of the C1 domain (Figure 2A). This mutation ablated
agonist-stimulated activity, as evidenced by a lower FRET ratio
trace compared with that of cells containing only endogenous
PKC (Figure 2B). This lower activity suggests that the mutant is
dominant negative toward global PKC output. Within a head
and neck cancer patient, a mutation altered a critical residue
(PKCa W58L) required for controlling the affinity for DAG, but
not phorbol ester (Dries et al., 2007) (Figure 2A). This mutation
also abolished DiC8-induced and basal activity but retained
some PDBu-induced activity, consistent with this residue selec-
tively regulating DAG affinity (Figures 2B and S1A). Because
membrane translocation is a prerequisite for activation of
cPKC isozymes, we compared the translocation of YFP-tagged
WT and mutant PKC to membrane-targeted CFP using FRET
(Antal et al., 2014). Mutation of either residue impaired transloca-
tion upon stimulation with DiC8, phorbol ester (Figure 2C), or
the natural agonist UTP (Figure 2D), accounting for the inability
of these agonists to activate the mutants. Lastly, we asked
how these mutations affected the processing phosphorylations
of PKC. PKCa H75Q, but not W58L, was unphosphorylated,
likely because the misfolded C1A domain of the H75Q
mutant prevented its processing (Figure 2E). Three additional
mutations within the C1A domains of PKCa (G61W), PKCb
(G61W), and PKCg (Q62H) also exhibited reduced agonist-
induced PKC activity (Figures S1B–S1D). Our analysis of nine
C1 domain mutations revealed that five reduced or abolished
activity while none were hyperactivating (Tables 1 and S1). Inac-
tivation occurred by altering two key inputs required for
PKC function: disruption of binding to DAG or processing by
phosphorylations.
The C2 domain of cPKC isozymes is also critical for activation,
as it mediates Ca2+-dependent pre-targeting to plasma mem-
brane, where these isozymes bind DAG and become activated
(Newton, 2003). One mutation identified within the C2 domain
of PKCg (D193N) was present in colorectal and ovarian cancers

Table 1. Loss-of-Function PKC Mutations in Cancer
Mutationa Activity Domain Cancer(s) Residue Importance Allele Frequency Other Mutationsb
g G23E nonec PS colorectal adding negative charge to
pseudosubstrate
N/A g G23W
d G146R
i G128C
ε R162H low head and neck non-conserved 0.15
a W58L nonec C1A head and neck DAG binding; conserved in all
C1a domains
0.22 g W57splice
q W171*
a G61W low lung conserved in cPKC C1a domains 0.05 b G61W
b G61W low lung conserved in cPKC C1a domains 0.06 a G61W
g Q62H nonec lung conserved in all PKC isozymes 0.45 a Q63H
ε Q197P
a H75Q noned colorectal coordinates Zn2+; conserved in
all C1 domains
N/A h H284Y
i H179Y
g D193N nonec C2 colorectal/melanoma/
ovarian
Ca2+ binding site 0.28
g T218M nonec stomach non-conserved 0.42 g T218R
g D254N low endometrial/ovarian Ca2+ binding site 0.43
a G257V nonec lung conserved in cPKC isozymes 0.12
g F362L nonec Kinase endometrial conserved in cPKC and nPKC
isozymes
0.21 g F362fs
b F353L
b Y417H nonec liver conserved in cPKC isozymes 0.67 g Y431F
z E421K noned breast APE motif; conserved in most
protein kinases
N/A a E508K
i E423D
a F435C nonec endometrial conserved in cPKC and nPKC isozymes 0.31
a A444V low endometrial/breast conserved in cPKC and nPKC
isozymes
0.27 b A447T
g A461T
g A461V
d A454V
q A485T
i S359C
g G450C nonec endometrial/lung/liver conserved in cPKC isozymes 0.41 ε R502*
a D481E low colorectal DFG motif; conserved in most
protein kinases
N/A b D484N
g D498N
i D396E
b A509V noned breast APE motif; conserved in most
protein kinases
N/A a A506V
a A506T
b A509T
b A509T nonec colorectal APE motif; conserved in most
protein kinases
0.53 a A506V
a A506T
b A509V
g P524R noned pancreatic APE motif; conserved in most
protein kinases
N/A g P524L
d P517S
ε P576S
q P548S
d D530G noned colorectal anchors the conserved
regulatory spine; conserved in
all eukaryotic kinases
N/A b D523N
g D537G
g D537Y
d P568A nonec head and neck conserved in all PKC isozymes 0.16 d P568S
b P561H
g P575H
b G585S low lung conserved in all PKC isozymes N/A h G598V
h K591E low breast reversal of conserved charge N/A h K591N
q R616Q
h R596H noned colorectal conserved in all PKC isozymes 0.50
h G598V noned lung conserved in all PKC isozymes N/A b G585S
(Continued on next page)
Cell 160, 489–502, January 29, 2015 ª2015 Elsevier Inc. 491

Table 1. Continued
Mutationa Activity Domain Cancer(s) Residue Importance Allele Frequency Other Mutationsb
b P619Q noned C-tail endometrial PXXP motif; conserved in AGC kinases 0.48
PKCmutations showing no activity with any agonist, no activity with physiological stimuli, or reduced activity in response to physiological stimuli. Allele
frequencies were obtained from cBioPortal.aMutations examined in this study.bOther mutations present at the same/corresponding residue in the same/other PKC isozymes.cKinase-dead.dNo response to physiological stimuli.
and in melanoma. Another (D254N) was found in endometrial
and ovarian cancers. Because both of these Asp residues (Fig-
ure 2F) coordinate Ca2+ (Medkova andCho, 1998), wemonitored
their activation upon elevation of intracellular Ca2+ with thapsi-
gargin, a sarco/endoplasmic reticulum Ca2+-ATPase inhibitor
(Rogers et al., 1995). In contrast to WT PKCg, neither mutant
was activated (Figure 2G) nor translocated to the plasma mem-
brane (Figure 2H) following thapsigargin addition, consistent
with impaired Ca2+ binding. However, both mutants retained
full responses to phorbol esters, consistent with unimpaired C1
domains. To further substantiate the inability of the mutants to
bind Ca2+, we monitored PKC oscillatory translocation stimu-
lated by histamine-induced oscillatory Ca2+ release in HeLa cells
(Violin et al., 2003). Whereas WT PKCg exhibited oscillatory
translocation in some cells, the C2 domain mutants were unre-
sponsive to histamine (Figure 2I). Thus, these C2 domain muta-
tions dampen PKCg activity because they impede Ca2+ binding.
Mutation of two other C2 domain residues that are not directly
involved in Ca2+ binding (PKCg T218M and PKCa G257V) also
caused LOF (Figure S1D and S1E); PKCa G257V was LOF
because it was not processed by phosphorylation (Figure S1F),
whereas the remaining C2 domain mutants were (data not
shown). Our analysis of six C2 domain mutations revealed four
LOF mutations and no hyperactivating ones (Tables 1 and S1).
PKC Mutations in the Kinase Domain Are LOFWe next evaluated 21 kinase domain mutations, two of which
were within PKCd: D530G in colorectal cancer and P568A in
head and neck cancer (Figure 3A). Asp530 functions as an an-
chor for the kinase regulatory spine, a highly conserved struc-
tural element of eukaryotic kinases (Kornev et al., 2006; Kornev
et al., 2008); not surprisingly, the D530G mutant was kinase
dead and not primed by phosphorylation (Figures 3B and 3C).
Mutation of the conserved Pro568 to Ala also prevented a
response to natural agonist stimulation but maintained some
PDBu-stimulated activity, likely because a small pool of this
mutant was phosphorylated (Figures 3B and 3C).
Strikingly, all three PKChmutations examined (K591E, R596H,
and G598V) altered its subcellular localization by pre-localizing it
at the plasma membrane prior to stimulation (Figure 3D). How-
ever, despite constitutive membrane association, these mutants
had reduced basal and stimulated activity as read out by a phos-
pho-(Ser) PKC substrate antibody (Figure 3E) because they were
not processed by phosphorylation (Figure 3F). We have previ-
ously shown that unprocessed nPKC isozymes have exposed
C1 domains that induce constitutive membrane association
(Antal et al., 2014).
492 Cell 160, 489–502, January 29, 2015 ª2015 Elsevier Inc.
A number of mutations were present within the highly
conserved APE motif that is involved in substrate binding and
allosteric activation of kinases (Kornev et al., 2008). PKCg
P524R and PKCb A509V mutations ablated activity by prevent-
ing processing phosphorylations, and both exhibited domi-
nant-negative roles (Figures 3G–3J). PKCb A509T (colorectal
cancer) also showed loss of function in response to UTP but
was modestly activated by the potent ligand PDBu (Figure 3I),
likely because a small pool of it was phosphorylated (Figure 3J).
A LOF mutation that prevented processing of the atypical PKCz
was also found within the APE motif (E421K; Figure S1G).
Further analysis revealed that 16 out of 21 kinase domain mu-
tations that we analyzed (Tables 1 andS1) resulted in full or partial
LOF, with themajority preventing processing by phosphorylation.
For example, PKCa F435C, PKCa A444V, PKCbII Y417H, PKCbII
G585S, and PKCg G450C had impaired phosphorylation and
reduced activity (Figures S1C–S1F and S1H–S1J). However, par-
tial LOF mutations were also observed in cases in which phos-
phorylation was maintained—PKCa D481E (Figures S1B and
S1F) and PKCg F362L (Figures S1D and S1J), suggesting that
these mutations likely decrease PKC’s intrinsic catalytic activity.
The Majority of Cancer-Associated PKC MutationsAre LOFOur analysis of 46 mutations present within eight of the PKC
genes revealed that �61% (28) of them were LOF and none
were activating (Figure 4A). A lack of identification of activating
mutations is not an artifact of our assays, as activating PKC mu-
tations that increase PKC affinity for DAG or decrease autoinhibi-
tion are readily detectable (data not shown). LOF mutations were
identified within cPKC (a, b, g), nPKC (d, ε, h), and aPKC (z) iso-
zymes and occurred within the C1, C2, and kinase domains as
well as the pseudosubstrate and C-terminal tail (Figure 4B). For
example, the PKCg G23E pseudosubstrate mutation was not
processed by phosphorylation (Figure S1J) and thus lacked any
UTP-stimulated activity (Figure S1D), and the PKCε R162H pseu-
dosubstrate mutation showed reduced agonist-stimulated and
basal activity (Figures S1K and S1L). The PKCbP619QC-terminal
tail mutation, residing within a conserved PXXP motif required for
processing (Gould et al., 2009), was also LOF as it prevented PKC
phosphorylation (Figure S1H). Overall, PKC LOF occurred by
diverse mechanisms, most commonly by preventing processing
phosphorylations or ligand binding, and as such, there were no
mutational hotspots for loss of function. However, we identified
seven LOFmutation ‘‘warmspots’’ (Sun et al., 2007) that fell within
highly conserved regions of PKC—one within the pseudo-
substrate and six within the kinase domain (Figure 4C). Thus,

B
PKC -H75Q
PKC
PKC -W58L
BasalPost
PDBuC
D E
100
100
100
Phospho-PKC(activation loop)
Total PKC
PKC -YFP
Phospho-PKC(turn motif)
Trp 58
His 75
C1A domain
Zn2+
0.951
1.051.1
1.151.2
1.251.3
1.351.4
1.451.5
1.55
0 10 20 30
PK
C T
rans
loca
tion
Time (min)
PKC PKC -W58LPKC -H75Q
DiC8PDBu
1.01.11.2
1.41.3
1.5
0.991
1.011.021.031.041.051.06
0 6 12PK
C T
rans
loca
tion
Time (min)
PKCPKC -W58LPKC -H75Q
UTP
1.00
1.05
G
H
F
I
Asp 193
Asp 254
Ca2+
C2 domain
0.00
0.25
0.50
0.75
1.00
0 10 20 30
PK
C T
rans
loca
tion
Time (min)
PKC PKC -D193NPKC -D254N
ThapsigarginPDBu
0.9911.011.021.031.041.051.061.071.081.091.11.111.121.131.141.15
0 10 20 30
PK
C A
ctiv
ity
Time (min)
PKC PKC -D193NPKC -D254NEndogenous
Thapsigargin
PDBu
1.00
1.05
1.10
1.15
0.9911.011.021.031.041.051.061.071.081.091.11.111.121.131.141.15
0 10 20
PK
C A
ctiv
ity
Time (min)
PKCPKC -W58LPKC -H75QEndogenous
DiC8
PDBu
1.00
1.05
1.10
1.15A
0.980.9911.011.021.031.041.05
0 5 10
0.980.9911.011.021.031.041.05
0 5 10
PKC
PKC D193N
PKC D254N
Time (min)
1.00
1.05
1.001.05
0.980.9911.011.021.031.041.05
0 5 10 15
1.001.05
Histamine
PK
C T
rans
loca
tion
Figure 2. PKC Mutations in the Regulatory C1 and C2 Domains Are
LOF
(A) Solution structure of the C1A domain of PKCg (PDB 2E73) showing the
corresponding PKCa His75 residue that coordinates Zn2+ and PKCa Trp58.
(B) Normalized FRET ratio changes (mean ±SEM) representing DiC8- (10 mM)
followed by PDBu- (200 nM) induced PKC activity as read out by CKAR in
COS7 cells co-expressing CKAR and either mCherry-tagged WT, mutant
PKCa, or no exogenous PKC (endogenous).
(C) (Left) Representative YFP images of the indicated PKC isozymes under
basal and PDBu-treated conditions (200 nM; 15 min) showing relocalization of
inactivating mutations targeted conserved regulatory elements
and frequently hit the same residue, whereas mutations that
exhibited no difference from WT occurred more randomly
(Table S1).
Analysis of cancer typesmost frequently harboring PKCmuta-
tions revealed that, although PKC isozymes are mutated across
many cancers, PKC mutations are enriched in certain cancers
(Figure 4D). Namely, PKC isozymes are mutated in 20%–25%
of melanomas, colorectal cancers, or lung squamous cell carci-
nomas but aremutated in <5%of ovarian cancers, glioblastoma,
or breast cancers (Cerami et al., 2012; Gao et al., 2013). Addi-
tionally, nPKC isozymes are most commonly mutated in gastro-
intestinal cancers (pancreatic, stomach, and colorectal), which
have a lower mutation burden than melanomas and lung can-
cers, highlighting their importance in this type of cancer (Fig-
ure 4D). The majority of PKC mutations are heterozygous, with
an allele frequency varying from 0.05 to 0.67 for the mutations
characterized (Tables 1 and S1). This indicates that PKC muta-
tions can be truncal events in regards to tumor heterogeneity
and exist in a majority of the cells within a tumor or can be bran-
chal events acquired later in tumorigenesis as the tumor pro-
gresses to a more aggressive stage. This is consistent with
PKC mutations being co-driver events that enhance tumorigen-
esis mediated by primary drivers.
Dominant-Negative PKCb Mutation Confers a TumorGrowth AdvantageBecause the majority of PKC mutations examined were LOF,
we tested whether we could rescue HCT116 colon cancer cells
that have a heterozygous LOF frameshift mutation in the C2
domain of PKCb by overexpressing WT PKCbII. This resulted
in a dramatic reduction in anchorage-independent growth (Fig-
ure S2A), a hallmark of cellular transformation. Thus, we next
used CRISPR/Cas9-mediated genome editing to ask whether
WT, but not mutant PKCa, to membranes. (Right) Normalized FRET ratio
changes (mean ±SEM) quantifying translocation of YFP-tagged PKCa pro-
teins toward a membrane-targeted CFP upon stimulation with 10 mM DiC8,
followed by 200 nM PDBu.
(D) Normalized FRET ratio changes (mean ±SEM) showing PKC translocation
following UTP (100 mM) stimulation.
(E) Immunoblot showing the phosphorylation state of the indicated YFP-tag-
ged PKCa proteins.
(F) Crystal structure of the C2 domain of PKCg (PDB 2UZP) highlighting
Asp193 and Asp254 residues involved in Ca2+ binding.
(G) Normalized FRET ratio changes (mean ±SEM) showing PKC activity as
read out by CKAR upon elevation of intracellular Ca2+ stimulated by thapsi-
gargin (5 mM), followed by PDBu (200 nM).
(H) Normalized FRET ratio changes (mean ±SEM) showing translocation of
YFP-tagged PKCg constructs toward membrane-localized CFP upon stimu-
lation of COS7 cells with thapsigargin (5 mM) followed by PDBu (200 nM). Data
were normalized to the maximal amplitude of translocation for each cell and
then scaled from 0 to 1 using the equation: X = (Y � Ymin)/(Ymax � Ymin),
where Y = normalized FRET ratio, Ymin = minimum value of Y, and Ymax is
maximum value of Y.
(I) Normalized FRET ratio changes displaying oscillatory translocation of YFP-
tagged WT PKCg, but not PKCgmutants D193N and D254N, in HeLa cells co-
expressing membrane-targeted CFP and stimulated with 10 mM histamine.
Data are representative traces from individual cells of three independent
experiments.
See also Figure S1.
Cell 160, 489–502, January 29, 2015 ª2015 Elsevier Inc. 493

B C
D E
I
PKC
Basal Post PDBu
PKCK591E
PKCR596H
PKCG598V
G
0 10 20
PK
C A
ctiv
ity
Time (min)
PKC IIPKC II A509VPKC II A509TEndogenous
PDBu
UTP
1.00
1.05
1.10
1.15
1.20
1.25
0 10 20
PK
C A
ctiv
ity
Time (min)
PKC PKC -D530GPKC -P568AEndogenous
PDBu
UTP
PKC -mCherry
WT
R59
6HG
598V
Total PKC
Phospho-PKC(activation loop)
100
100
Phospho PKC(turn motif)
K59
1E
NT
100
F
J
PKC II-mCherry
100
100
100
WT
A50
9V
A50
9T
Total PKC
Phospho-PKC (activation loop)
Phospho-PKC (hydrophobic motif)
-*
P524
P568
D530
G598
Regulatoryspine
R596 K591
A509
A
Tubulin
100
150
250
100
50
WT
K59
1E
R59
6H
G59
8V
NT
PDBu - + + ++ +- - - -
PKC
pSer PKC
substrate75
PKC -mCherry
0
1
2
3
4
WT
K59
1ER
596H
G59
8V
nPK
C A
ctiv
ity
BasalStimulated
*
H
P52
4R
Phospho-PKC(activation loop)
Total PKC
PKC -RFP WT
-*
100
100
0.991
1.011.021.031.041.051.061.071.081.091.1
0 10 20
PK
C A
ctiv
ity
Time (min)
PKC PKC -P524REndogenous
PDBu
1.00
1.05
1.10
1.00
1.05
1.10
Kinase domain
WT
D53
0G
PKC -mCherry
Phospho-PKC(activation loop)
Total PKC
P56
8A
100
100
Figure 3. PKC Mutations in the Kinase
Domain Are LOF
(A) Crystal structure of the kinase domain of PKCbII
(PDB 2I0E) highlighting cancer-associated resi-
dues and the regulatory spine (yellow space filling).
(B) Normalized FRET ratio changes (mean ±SEM)
showing PKC activity of PKCd constructs in COS7
cells co-expressing the plasma membrane-tar-
geted, PKCd-specific reporter PM-dCKAR. Cells
were stimulated with UTP (100 mM) followed by
PDBu (200 nM).
(C) Immunoblot analysis of the phosphorylation
state of PKCd WT and mutants.
(D) Representative mCherry images of mCherry-
tagged PKCh WT or mutants showing localization
under basal conditions and 15 min post 200 nM
PDBu addition to COS7 cells.
(E) (Left) Immunoblot showing PKC substrate
phosphorylation. COS7 cells overexpressing the
indicated constructs were pre-treated with 4 mM
Go6976 for 10 min to inhibit cPKC isozymes and
were then stimulated or not with 200 nM PDBu to
activate nPKC isozymes. (Right) Immunoblots
were quantified and normalized to total PKCh
levels and tubulin. Data represent averages of
three independent experiments ±SEM. Compari-
sons for basal and stimulated activity were made
using a repeated-measures one-way ANOVA fol-
lowed by post hoc Dunnett’s multiple comparison
test. *p < 0.05 as compared with the WT group.
(F) Immunoblot analysis of the phosphorylation
state of mCherry-tagged PKCh WT and mutants.
(G) Normalized FRET ratio changes (mean ± SEM)
showing PKC activity from COS7 cells co-ex-
pressing CKAR and RFP-tagged PKCg mutants
stimulated with 200 nM PDBu.
(H) Immunoblot depicting PKCg WT and P524R
phosphorylation. The asterisk denotes phosphor-
ylated and the dash unphosphorylated PKCg.
(I) Normalized FRET ratio changes (mean ±SEM)
showing PKC activity of PKCbII constructs in COS7
cells co-expressing CKAR. Cells were stimulated
with UTP (100 mM) followed by PDBu (200 nM).
(J) Immunoblot depicting mCherry-tagged PKCbII
WT and mutant phosphorylation. The asterisk
denotes phosphorylated and the dash unphos-
phorylated PKCbII.
See also Figure S1.
reverting an endogenous LOF allele to WTwould also rescue cell
growth. We used DLD1 colon cancer cells because they harbor a
PKCb A509T LOF mutation (Figure 3I) to assess whether a het-
erozygous LOF PKCmutation could confer a survival advantage,
as most cancer-associated PKC mutations are heterozygous.
We reverted the mutation to WT in three isogenic clones (Figures
S2B and S2C) and confirmed that no sequence alterations ex-
isted within the top two most likely predicted off-targets (data
not shown). Correction of the A509Tmutation in the endogenous
PKCb (PRKCB) allele caused a slight but reproducible increase
494 Cell 160, 489–502, January 29, 2015 ª2015 Elsevier Inc.
in the PKCb levels and a >2-fold increase
in PKCa levels, although neither reached
statistical significance (Figure 5A). Immu-
noblot analysis with a phospho-(Ser) PKC substrate antibody re-
vealed significantly higher basal PKC activity in the corrected
cells (Figure 5B). This is consistent with the DLD1 parental cells
having reduced PKC activity because of the LOF PKCbmutation
and the lower PKCa levels. We next tested the ability of these
cells to grow in suspension. Consistent with having higher PKC
activity and amore tumor-suppressive phenotype, the corrected
cells were less viable in suspension (Figure 5C) because they
were less capable of forming the compact multicellular aggre-
gates formed by the DLD1 parental cells (Figure 5D). Moreover,

A B
C D
Figure 4. The Majority of PKC Mutations Are LOF
(A) Pie chart of the functional impact of the investigated PKC mutations, with bright red representing mutations that lack any activity, medium red representing
mutations that show no response to physiological stimuli (DAG or Ca2+ elevation) but some response to non-physiological phorbol esters, light red representing
mutations that display reduced activity to physiological stimuli compared to the corresponding WT isozyme, and blue representing no difference from the
corresponding WT PKC isozyme.
(B) Domain structure of cPKC, nPKC, and aPKC isozymes, overlaid with the LOF mutations color coded by isozyme.
(C) Crystal structure of the kinase domain of PKCbII (PDB 2I0E) highlighting ‘‘warmspot’’ residues mutated in at least four tumor samples within the various PKC
isozymes.
(D) Bar graph depicting the percentage of mutations distributed in the indicated cancers for each PKC isozyme.
the corrected clones had decreased anchorage-independent
growth potential (Figure 5E). These results corroborate those ob-
tained from the HCT116 cells overexpressing PKCbII, demon-
strating that partial loss of PKCb activity is necessary for growth
in soft agar. However, in a 2D proliferation assay, the DLD1-cor-
rected cells proliferated at similar rates to theDLD1 parental cells
(Figure S2D), indicating that it is not the proliferation rates that
differ between these cells but, rather, their ability to grow in the
absence of anchorage.
To determine whether PKC displays haploinsufficiency, we
knocked out the mutant PKCb allele in DLD1 cells by creating
a frameshift deletion using genome engineering (Figure S2E).
This hemizygous clone (WT/- 23), containing only one WT allele
and thus expressing lower PKCbII levels (Figure S2F), exhibited
significantly increased anchorage-independent growth potential
compared to cells containing two WT alleles, indicating that
PKCbII is haploinsufficient for tumor suppression (Figure 5E).
Additionally, the PKCb hemizygous cells did not grow as well
as the PKCb A509T mutated cells in soft agar, indicating that
this mutation had a dominant-negative effect.
To definitively establish whether a heterozygous LOF PKCb
mutation facilitates tumor growth in vivo, theDLD1parental or cor-
rected cells were subcutaneously injected into the flanks of nude
mice and tumor growth was monitored. Consistent with our
cellular data, the tumors derived from the corrected cells were
significantly smaller than those from the DLD1 parental cells (Fig-
ures 5F and S2G). This reduced growth correlated with increased
apoptosis as assessed by TUNEL staining of tumor sections (Fig-
ure 5G). These data demonstrate that a heterozygous, dominant-
negative PKCb mutation can significantly increase tumor growth,
thus establishing PKCb as a tumor suppressor.
DISCUSSION
Here we establish that clinical trials targeting PKC have been
based on the wrong assumption; it is not inactivation of PKC
Cell 160, 489–502, January 29, 2015 ª2015 Elsevier Inc. 495

C D
B
1mm
A509T/WT
DLD1 Corrected DLD1
WT/WT 26 WT/WT 31 WT/WT 53
20 m
75100150250
50
50
25
37pSer PKC substrate
Tubulin
G
0
500
1000
1500
2000
12 22 32 42
Tum
or v
olum
e (m
m3 )
Days post injection
A509T/WT
WT/WT
***
***
***
***
******
**
0
50
100
Rel
ativ
e V
iabl
e C
ell #
***
A509T/WT WT/WT 31 WT/WT 53WT/WT 26DLD1 Corrected DLD1
300 m
A
E
F
0
1
2
3
4
A50
9T/W
T
WT
/WT
26
WT
/WT
31
WT
/WT
53
PK
C A
ctiv
ity
*
0
10000
20000
30000C
olon
y A
rea
(m
2 )***
****A509T/WT WT/WT 53WT/WT 31WT/WT 26
300 m
WT/- 23
0
1
2
3
4
A50
9T/W
T
WT
/WT
26
WT
/WT
31
WT
/WT
53
PK
C le
vels
PKC IIPKC
WT
/WT
31
WT
/WT
53
WT
/WT
26
A50
9T/W
T
37GAPDH
75PKC II
PKC 75
0
0.5
1
1.5
Rel
ativ
e %
TU
NE
L po
sitiv
e nu
clei
****
(legend on next page)
496 Cell 160, 489–502, January 29, 2015 ª2015 Elsevier Inc.
but, rather, activation that suppresses tumor growth. Thus, we
propose that therapies should target mechanisms to restore the
PKC signaling output rather than reduce it. Our comprehensive
analysis revealed that 61% of the PKC mutations characterized
were LOF and none were activating. We did not account for
nonsense mutations or deletions, so an even higher proportion
of PKC mutations are LOF. Corroborating our data, three other
LOF PKC mutations have been previously described. A LOF
PKCa mutation (D294G in C2 domain) was identified in three
types of cancer (Alvaro et al., 1993; Prevostel et al., 1997; Zhu
et al., 2005) and a LOF PKCz mutation (S514F in the kinase
domain) was identified in colorectal cancer (Galvez et al., 2009).
A partial LOF mutation in PKCi (R471C), present in three distinct
cancers, disrupted substrate binding and induced abnormal
epithelial polarity (Linch et al., 2013). To our knowledge, no
gain-of-function PKC mutations have been observed in cancer.
The identification of LOF mutations throughout the PKC family
and in diverse cancers supports a general role for PKC isozymes
as tumor suppressors.
Strikingly, several LOF PKC mutations (e.g., PKCb A509V,
PKCg P524R, and PKCa W58L, H75Q, and G257V) acted in a
dominant-negative manner by decreasing global endogenous
PKC activity. Moreover, the presence of mutant PKCb A509T
protein in DLD1 cells reduced PKCa levels. One mechanism
for this cross-PKC dominant-negative effect is that the LOF
PKC impairs the priming phosphorylations of other PKCs, thus
reducing their steady-state levels. This is supported by a prior
study demonstrating that unprocessed kinase-dead PKC iso-
zymes prevent the phosphorylation of other PKC isozymes,
likely because their phosphorylation requires common titratable
components (Garcia-Paramio et al., 1998). This dominant-nega-
tive role of LOF mutations is corroborated by studies showing
that kinase-dead PKC isozymes function in a dominant-nega-
tive manner to exhibit tumorigenic effects on cells (Galvez
et al., 2009; Hirai et al., 1994; Kim et al., 2013; Lu et al.,
1997). Importantly, although some PKC mutations were domi-
nant negative, loss of PKC such as would occur from nonsense
mutations or gene deletions also conferred a growth advantage
(Figure 5E), indicating that PKC is haploinsufficient for tumor
suppression.
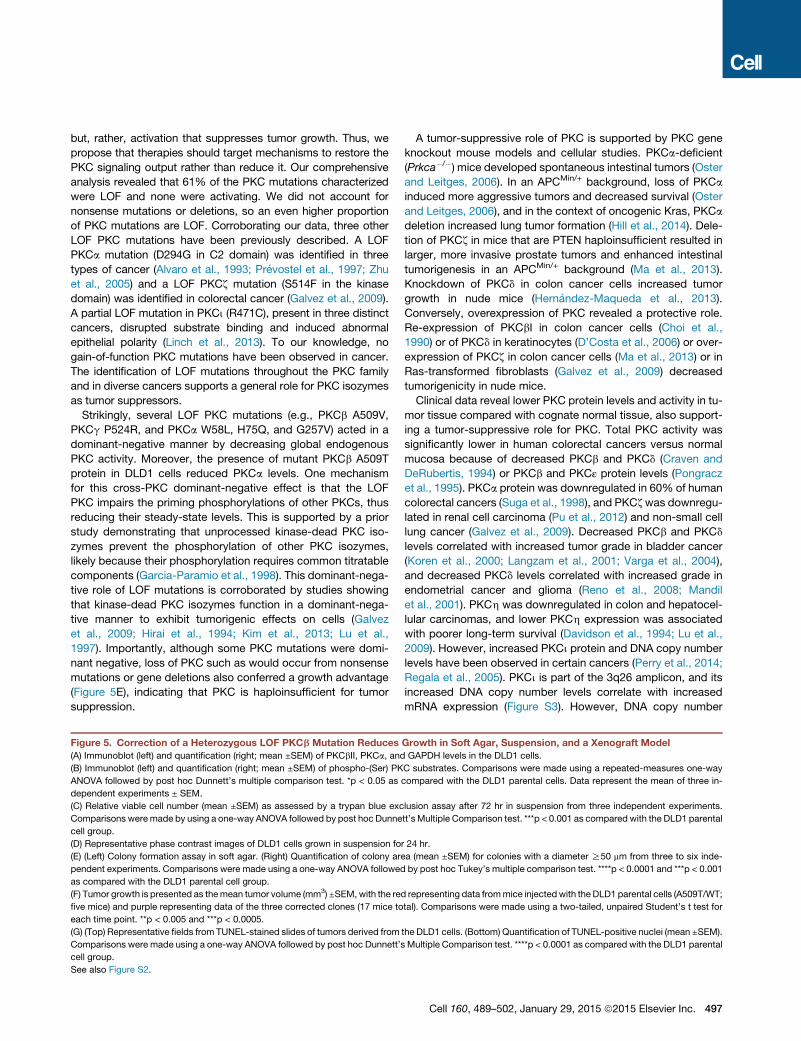
Figure 5. Correction of a Heterozygous LOF PKCb Mutation Reduces
(A) Immunoblot (left) and quantification (right; mean ±SEM) of PKCbII, PKCa, and
(B) Immunoblot (left) and quantification (right; mean ±SEM) of phospho-(Ser) PK
ANOVA followed by post hoc Dunnett’s multiple comparison test. *p < 0.05 as
dependent experiments ± SEM.
(C) Relative viable cell number (mean ±SEM) as assessed by a trypan blue exc
Comparisons weremade by using a one-way ANOVA followed by post hoc Dunne
cell group.
(D) Representative phase contrast images of DLD1 cells grown in suspension fo
(E) (Left) Colony formation assay in soft agar. (Right) Quantification of colony ar
pendent experiments. Comparisons were made using a one-way ANOVA followed
as compared with the DLD1 parental cell group.
(F) Tumor growth is presented as themean tumor volume (mm3) ±SEM, with the re
five mice) and purple representing data of the three corrected clones (17 mice to
each time point. **p < 0.005 and ***p < 0.0005.
(G) (Top) Representative fields from TUNEL-stained slides of tumors derived from
Comparisons were made using a one-way ANOVA followed by post hoc Dunnett’
cell group.
See also Figure S2.
A tumor-suppressive role of PKC is supported by PKC gene
knockout mouse models and cellular studies. PKCa-deficient
(Prkca�/�) mice developed spontaneous intestinal tumors (Oster
and Leitges, 2006). In an APCMin/+ background, loss of PKCa
induced more aggressive tumors and decreased survival (Oster
and Leitges, 2006), and in the context of oncogenic Kras, PKCa
deletion increased lung tumor formation (Hill et al., 2014). Dele-
tion of PKCz in mice that are PTEN haploinsufficient resulted in
larger, more invasive prostate tumors and enhanced intestinal
tumorigenesis in an APCMin/+ background (Ma et al., 2013).
Knockdown of PKCd in colon cancer cells increased tumor
growth in nude mice (Hernandez-Maqueda et al., 2013).
Conversely, overexpression of PKC revealed a protective role.
Re-expression of PKCbI in colon cancer cells (Choi et al.,
1990) or of PKCd in keratinocytes (D’Costa et al., 2006) or over-
expression of PKCz in colon cancer cells (Ma et al., 2013) or in
Ras-transformed fibroblasts (Galvez et al., 2009) decreased
tumorigenicity in nude mice.
Clinical data reveal lower PKC protein levels and activity in tu-
mor tissue compared with cognate normal tissue, also support-
ing a tumor-suppressive role for PKC. Total PKC activity was
significantly lower in human colorectal cancers versus normal
mucosa because of decreased PKCb and PKCd (Craven and
DeRubertis, 1994) or PKCb and PKCε protein levels (Pongracz
et al., 1995). PKCa protein was downregulated in 60% of human
colorectal cancers (Suga et al., 1998), and PKCzwas downregu-
lated in renal cell carcinoma (Pu et al., 2012) and non-small cell
lung cancer (Galvez et al., 2009). Decreased PKCb and PKCd
levels correlated with increased tumor grade in bladder cancer
(Koren et al., 2000; Langzam et al., 2001; Varga et al., 2004),
and decreased PKCd levels correlated with increased grade in
endometrial cancer and glioma (Reno et al., 2008; Mandil
et al., 2001). PKCh was downregulated in colon and hepatocel-
lular carcinomas, and lower PKCh expression was associated
with poorer long-term survival (Davidson et al., 1994; Lu et al.,
2009). However, increased PKCi protein and DNA copy number
levels have been observed in certain cancers (Perry et al., 2014;
Regala et al., 2005). PKCi is part of the 3q26 amplicon, and its
increased DNA copy number levels correlate with increased
mRNA expression (Figure S3). However, DNA copy number
Growth in Soft Agar, Suspension, and a Xenograft Model
GAPDH levels in the DLD1 cells.
C substrates. Comparisons were made using a repeated-measures one-way
compared with the DLD1 parental cells. Data represent the mean of three in-
lusion assay after 72 hr in suspension from three independent experiments.
tt’sMultiple Comparison test. ***p < 0.001 as compared with the DLD1 parental
r 24 hr.
ea (mean ±SEM) for colonies with a diameter R50 mm from three to six inde-
by post hoc Tukey’s multiple comparison test. ****p < 0.0001 and ***p < 0.001
d representing data frommice injectedwith the DLD1 parental cells (A509T/WT;
tal). Comparisons were made using a two-tailed, unpaired Student’s t test for
the DLD1 cells. (Bottom) Quantification of TUNEL-positive nuclei (mean ±SEM).
s Multiple Comparison test. ****p < 0.0001 as compared with the DLD1 parental
Cell 160, 489–502, January 29, 2015 ª2015 Elsevier Inc. 497

and mRNA levels do not correlate for cPKC genes (Figure S3). In
fact, for PKCa, copy number levels inversely correlate with pro-
tein levels in breast cancer (Myhre et al., 2013), the cancer in
which PKCa is most amplified (Cerami et al., 2012; Gao et al.,
2013). A number of studies reported increased mRNA expres-
sion of other PKC genes in cancer; however, mRNA expression
and protein levels often poorly correlate (Myhre et al., 2013).
Thus, clinical data of this sort are consistent with a tumor-sup-
pressive function of PKC isozymes, although there might be
context specific exceptions for PKCi.
The recent discovery that germline LOFmutations in PKCd are
causal drivers of autoimmune lymphoproliferative syndrome and
systemic lupus erythematosus, disorders associated with the
acquisition of cancer-associated phenotypes, supports a bona
fide tumor-suppressive role of PKC in humans (Belot et al.,
2013; Kuehn et al., 2013; Salzer et al., 2013). Both diseases
are characterized by increased proliferation and decreased
apoptosis of B cells (Belot et al., 2013; Kuehn et al., 2013), and
patients frequently develop lymphomas (Bernatsky et al., 2005;
Mellemkjaer et al., 1997). Moreover, we found that siblings ho-
mozygous for a LOF PKCd mutation have reduced levels of
PKCz (data not shown), supporting a dominant-negative role of
LOF mutations.
How could decreased PKC activity enhance tumorigenesis?
One possibility is that PKC isozymes suppress oncogenic sig-
naling by repressing signaling from oncogenes or stabilizing
tumor suppressors. Supporting this, unbiased bioinformatic
analysis of tumor samples harboring PKC LOF mutations re-
vealed that TP53 (p53) is one of most frequently mutated genes
in tumors harboring LOF mutations for each PKC isozyme (Ta-
ble 2). PKC might promote the tumor-suppressive function of
p53 by stabilizing the WT protein. Considerable evidence sug-
gests that phosphorylation by PKCd stabilizes p53, thus promot-
ing apoptosis (Abbas et al., 2004; Yoshida et al., 2006), but the
role of other PKC isozymes is less clear. KRAS was also among
the top ten genes mutated in cancers harboring PKC mutations
for seven of the PKC isozymes (Table 2), specifically with muta-
tion at Gly12 (Table S3). This argues that PKC might suppress
Kras signaling, such that loss of PKC would be required for
Kras to exert its full oncogenic potential. Consistent with this,
PKCmodulates both the activity and localization of Kras through
phosphorylation of Ser181 (Bivona et al., 2006). Although the
role of this phosphorylation site in tumors remains controversial
(Barcelo et al., 2014), our analysis is consistent with loss of PKC
enhancing its oncogenic potential. In fact, the DLD1 andHCT116
cells used in our assays contained an oncogenic Kras mutation
(G13D) that is necessary for the ability of these cells to grow in
soft agar (data not shown). This suggests that LOF PKC muta-
tions are not major cancer drivers but, rather, co-drivers that
contribute to cancer progression.
We also analyzedwhich kinase or cancer census genes (genes
implicated in cancer) are significantly more commonly mutated
(>15-fold) in tumors harboring PKC mutations versus tumors
lacking PKCmutations (Table S4). This allowed us to identify pro-
teins that might be important co-drivers or represent novel ge-
netic dependencies for PKC. The tumor suppressor LATS2,
which inhibits the Hippo pathway, and the kinases ROCK1 and
ROCK2, which are required for the anchorage independent
498 Cell 160, 489–502, January 29, 2015 ª2015 Elsevier Inc.
growth and invasion of non-small cell lung cancer cells, were
among the top 20 mutated proteins that were significantly en-
riched in tumors harboring PKC mutations (Table S4). Our anal-
ysis suggests that mutations in these genes provide a greater
proliferative advantage upon loss of PKC signaling. We also
performed an analysis of cancer-specific genes frequently co-
mutated with PKC in lung cancer, colorectal cancer, or mela-
noma. This revealed very little overlap in co-mutated genes
between the three cancers and also between the three classes
of PKC isozymes (Table S5), suggesting that the individual
PKC isozymes regulate distinct pathways in different cancers.
Interestingly, cancers with a high PKC mutation burden, such
as melanoma and colorectal cancers, show little PKC amplifica-
tion. Conversely, cancers that have higher PKC amplification
rates, such as breast and ovarian cancers, have few PKC muta-
tions (Cerami et al., 2012; Gao et al., 2013), consistent with PKC
mutations having a smaller or different role in breast and ovarian
cancers.
The foregoing data provide a mechanism for why inhibiting
PKC has proved unsuccessful and, in fact, detrimental in cancer
clinical trials: it is not gain of function but, rather, LOF that confers
a survival advantage. Therefore, therapeutic strategies should
target ways to restore PKC activity. Bryostatin-1, a PKC agonist,
also failed as a therapeutic and, in fact, exhibited counter-thera-
peutic effects in cervical cancer (Nezhat et al., 2004), likely
because it downregulates PKC (Szallasi et al., 1994). Therefore,
strategies to activate PKC without downregulating it hold signif-
icant clinical potential. An important ramification of this study is
that drugs that inhibit proteins involved in the processing of
PKC cause loss of PKC. Notably, both mTOR and HSP90 inhib-
itors, currently in use in the clinic (Don and Zheng, 2011; Neckers
and Workman, 2012), prevent processing of PKC (Gould et al.,
2009; Guertin et al., 2006) and would thus have the detrimental
effect of removing its tumor suppressive function. Restoring
PKC activity would have to accompany other chemotherapeu-
tics, given that PKC isozymes act as the brakes, not the primary
drivers, to oncogenic signaling. Our finding that decreased PKC
activity enhances tumor growth challenges the concept of inhib-
iting PKC isozymes in cancer and underscores the need for ther-
apies that restore or stabilize PKC activity in cells.
EXPERIMENTAL PROCEDURES
FRET Imaging and Analysis
Cells were imaged as described previously (Gallegos et al., 2006). For activity
measurements, cells were co-transfected with the indicated mCherry-tagged
PKC and CKAR or plasmamembrane-targeted CKAR, as indicated. For trans-
location experiments, cells were co-transfected with the indicated YFP-
tagged PKC and membrane-targeted CFP.
Generation of CRISPR Cell Lines
The CRISPR/Cas9 genome-editing system was employed to generate DLD1
cell lines in which the PKCb A509T mutation was reverted to WT or knocked
out. For the nuclease method, DLD1 cells were transiently transfected with
the hSpCas9 vector containing the gRNA PKCb-a, the PAGE-purified
70-mer ssODN (Figure S2B), and pMAX-GFP. For the double nickase method,
DLD1 cells were transfected with two hSpCas9n vectors containing either
gRNA PKCb-a or PKCb-b, the ssODN, and pMAX-GFP. GFP+ cells were
sorted 72 hr later. To reduce off-target mutagenesis, one of the clones (WT/
WT 53) was made using a double-nicking approach that requires the

Table 2. Top 20 Genes with Mutations that Co-Occur with PKC Mutations
PKCa (50) PKCb (90) PKCg (102) PKCd (47) PKCε (57) PKCh (51) PKCq (81) PKCi (48) PKCz (28)
BLID (7) TP53 (42) TP53 (52) KRAS (13) GNG4 (5) SPINK7 (5) TP53 (42) SPRR2G (6) TNP1 (3)
TP53 (23) KRTAP6-2 (6) CDKN2A (17) TP53 (22) KRAS (11) RPL39 (3) CDKN2A (13) TP53 (26) TP53 (15)
KRTAP19-5 (4) PCP4 (4) KRAS (16) CDKN2A (9) DEFB114 (4) KRAS (11) KRAS (14) CDKN2A (10) CNPY1 (3)
SPRR2E (4) KRAS (12) HTN1 (4) CD52 (3) CNPY1 (5) DEFB114 (4) SPANXN5 (5) BANF1 (5) SPATA8 (3)
REG3A (8) OR4A15 (21) SPRR2G (5) CNPY1 (4) SVIP (4) PLN (3) DEFB110 (4) LACRT (7) SPANXN3 (4)
H3F3C (6) POM121L12 (18) DEFB115 (6) SPINK13 (4) CXCL10 (5) DEFB115 (5) KRTAP15-1 (8) CXCL9 (6) KRTAP19-5 (2)
MLLT11 (4) REG1A (10) DNAJC5B (12) ATP5E (2) KRTAP19-3 (4) LELP1 (5) DEFB119 (5) KRAS (9) VPREB1 (4)
PI3 (5) NRAS (11) REG3G (10) RPL39 (2) COX7C (3) DEFB116 (5) PPIAL4G (9) RETNLB (5) GNG4 (2)
SNURF (3) PLN (3) SPATA8 (6) COX7B2 (3) KRTAP19-8 (3) KRTAP19-8 (3) DPPA5 (6) WFDC10B (4) ATP6V1G3 (3)
CDKN2A (7) GNG4 (4) REG1A (9) OR4K1 (11) SPINK7 (4) IAPP (4) CRYGB (9) DEFB110 (3) CDKN2A (4)
GNG3 (3) CDKN2A (9) POM121L12 (16) FDCSP (3) TP53 (18) NPS (4) SPANXN2 (9) TMSB15B (2) DEFB119 (2)
DAOA (6) DEFA4 (5) TRAT1 (10) CARTPT (4) BANF1 (4) WFDC10B (4) KRTAP19-3 (4) GNG7 (3) LGALS1 (3)
RPL39 (2) OR2L13 (16) HIST1H2AA (7) DUSP22 (7) TMSB15B (2) S100A7L2 (5) DYNLRB2 (6) CNPY1 (4) SCGB1D1 (2)
SVIP (3) LCE1B (6) SPINK13 (5) BANF1 (3) DEFA4 (4) CNPY1 (4) SPATA8 (5) LSM8 (4) NANOS2 (3)
PLN (2) SPANXN3 (7) CCK (6) DYNLL2 (3) POM121L12 (12) TP53 (17) KRTAP19-8 (3) KRTAP19-5 (3) CCL17 (2)
FAM19A2 (5) KRTAP19-3 (4) OR4K1 (16) LYRM5 (3) GYPA (6) DPPA5 (5) RIPPLY3 (9) SPANXN5 (3) NRAS (4)
CPLX4 (6) TRAT1 (9) OR4A5 (16) ATP6V1G3 (4) DYNLRB2 (5) DEFB131 (3) POM121L12 (14) CSTL1 (6) CCL1 (2)
SEC22B (8) IFNB1 (9) CCL7 (5) DEFB128 (3) HIST1H2BB (5) SPINK13 (4) OR4N2 (14) DEFA4 (4) PATE4 (2)
CTXN3 (3) KRTAP19-8 (3) B2M (6) MAP1LC3B2 (4) HIST1H2BI (5) RPL10L (9) DEFB115 (4) SPANXD (4) POM121L12 (6)
KRTAP19-3 (3) KRTAP8-1 (3) PCP4 (3) GPX5 (7) FGFR1OP2 (10) SPRR2A (3) OTOS (4) EDDM3A (6) CRIPT (2)
Data were normalized based on gene length, and the number of co-occurring cases is listed in parentheses. Two genes are highlighted: TP53 is underlined, and KRAS is in bold.
Cell1
60,489–502,January
29,2015ª2015ElsevierInc.
499

cooperation between two nickase Cas9 enzymes (Ran et al., 2013). CRISPR-
targeted clones were expanded and gDNAwas extracted using a Quick-gDNA
MiniPrep Kit (Zymo Research Corporation) and were screened for the pres-
ence of two wild-type alleles by PCR using primers spanning the A509 locus,
followed by restriction digest with BtgZI. This restriction site was only present
in the WT allele, and correction of the A509T mutation introduced this site into
the other allele. The presence aWT allele at both loci was confirmed by Sanger
sequencing (Eton Bioscience).
Xenograft Model
Athymic Nude-Foxn1nu mice (Harlan) were housed in compliance with the
University of California San Diego Institutional Animal Core and Use Commit-
tee. 3 3 106 DLD1 cells in 100 ml PBS were injected subcutaneously into the
right flank of each 4-week-old female mouse. Tumor dimensions were re-
corded twice weekly and tumor volume was calculated as 1/2 3 length 3
width2. Mice were euthanized 43 days after injection, and tumors were
excised. One tumor was excluded, as it did not engraft well (DLD1p), and
another was excluded, as it was not subcutaneous (WT/WT 31).
SUPPLEMENTAL INFORMATION
Supplemental Information includes Extended Experimental Procedures, three
figures, and five tables and can be found with this article online at http://dx.doi.
org/10.1016/j.cell.2015.01.001.
AUTHOR CONTRIBUTIONS
L.L.G., J.B., T.H., and A.C.N. initiated the study. C.E.A. and A.C.N. conceived
the experiments and wrote the manuscript. C.E.A. performed the experiments
with assistance from E.K. for imaging and immunoblots and from C.Z. for the
xenograft model. F.B.F. advised on the use of the xenograft model. A.M.H.,
C.W., C.J.M., and J.B. performed the bioinformatic analysis. N.L.S. and
E.W.T. made the tetracycline-inducible PKCbII HCT116 cells.
ACKNOWLEDGMENTS
We thank the lab for helpful comments, the Moores Cancer Center Histology
Core for the TUNEL staining, Meghdad Rahdar for cell sorting, and Jack Dixon
for equipment use. This work was supported by NIH GM43154 to A.C.N., NIH
NS080939 and the James S. McDonnell Foundation to F.B.F., and NIH
CA82683 to T.H. C.E.A. was supported by the UCSD Graduate Training Pro-
gram in Cellular and Molecular Pharmacology (T32 GM007752) and the NSF
Graduate Research Fellowship (DGE1144086). A.M.H., C.W., N.L.S., E.W.T.,
C.J.M., and J.B. were supported by Cancer Research UK. T.H. is a Frank
and Else Schilling American Cancer Society Professor and holds the Renato
Dulbecco Chair in Cancer Research.
Received: August 21, 2014
Revised: November 12, 2014
Accepted: December 24, 2014
Published: January 22, 2015
REFERENCES
Abbas, T., White, D., Hui, L., Yoshida, K., Foster, D.A., and Bargonetti, J.
(2004). Inhibition of human p53 basal transcription by down-regulation of pro-
tein kinase Cdelta. J. Biol. Chem. 279, 9970–9977.
Alvaro, V., Levy, L., Dubray, C., Roche, A., Peillon, F., Querat, B., and Joubert,
D. (1993). Invasive human pituitary tumors express a point-mutated alpha-pro-
tein kinase-C. J. Clin. Endocrinol. Metab. 77, 1125–1129.
Antal, C.E., Violin, J.D., Kunkel, M.T., Skovsø, S., and Newton, A.C. (2014). In-
tramolecular conformational changes optimize protein kinase C signaling.
Chem. Biol. 21, 459–469.
Barcelo, C., Paco, N., Morell, M., Alvarez-Moya, B., Bota-Rabassedas, N.,
Jaumot, M., Vilardell, F., Capella, G., and Agell, N. (2014). Phosphorylation
500 Cell 160, 489–502, January 29, 2015 ª2015 Elsevier Inc.
at Ser-181 of oncogenic KRAS is required for tumor growth. Cancer Res. 74,
1190–1199.
Belot, A., Kasher, P.R., Trotter, E.W., Foray, A.P., Debaud, A.L., Rice, G.I.,
Szynkiewicz, M., Zabot, M.T., Rouvet, I., Bhaskar, S.S., et al. (2013). Protein
kinase cd deficiency causes mendelian systemic lupus erythematosus with
B cell-defective apoptosis and hyperproliferation. Arthritis Rheum. 65, 2161–
2171.
Bernatsky, S., Boivin, J.F., Joseph, L., Rajan, R., Zoma, A., Manzi, S., Ginzler,
E., Urowitz, M., Gladman, D., Fortin, P.R., et al. (2005). An international cohort
study of cancer in systemic lupus erythematosus. Arthritis Rheum. 52, 1481–
1490.
Bivona, T.G., Quatela, S.E., Bodemann, B.O., Ahearn, I.M., Soskis, M.J., Mor,
A., Miura, J., Wiener, H.H., Wright, L., Saba, S.G., et al. (2006). PKC regulates a
farnesyl-electrostatic switch on K-Ras that promotes its association with Bcl-
XL on mitochondria and induces apoptosis. Mol. Cell 21, 481–493.
Blumberg, P.M. (1980). In vitro studies on the mode of action of the phorbol
esters, potent tumor promoters: part 1. Crit. Rev. Toxicol. 8, 153–197.
Cacace, A.M., Guadagno, S.N., Krauss, R.S., Fabbro, D., and Weinstein, I.B.
(1993). The epsilon isoform of protein kinase C is an oncogene when overex-
pressed in rat fibroblasts. Oncogene 8, 2095–2104.
Castagna, M., Takai, Y., Kaibuchi, K., Sano, K., Kikkawa, U., and Nishizuka, Y.
(1982). Direct activation of calcium-activated, phospholipid-dependent pro-
tein kinase by tumor-promoting phorbol esters. J. Biol. Chem. 257, 7847–
7851.
Cerami, E., Gao, J., Dogrusoz, U., Gross, B.E., Sumer, S.O., Aksoy, B.A., Ja-
cobsen, A., Byrne, C.J., Heuer, M.L., Larsson, E., et al. (2012). The cBiol cancer
genomics portal: an open platform for exploring multidimensional cancer ge-
nomics data. Cancer Discov. 2, 401–404.
Choi, P.M., Tchou-Wong, K.M., and Weinstein, I.B. (1990). Overexpression of
protein kinaseC in HT29 colon cancer cells causes growth inhibition and tumor
suppression. Mol. Cell. Biol. 10, 4650–4657.
Craven, P.A., and DeRubertis, F.R. (1994). Loss of protein kinase C delta
isozyme immunoreactivity in human adenocarcinomas. Dig. Dis. Sci. 39,
481–489.
D’Costa, A.M., Robinson, J.K., Maududi, T., Chaturvedi, V., Nickoloff, B.J.,
and Denning, M.F. (2006). The proapoptotic tumor suppressor protein kinase
C-delta is lost in human squamous cell carcinomas. Oncogene 25, 378–386.
Davidson, L.A., Jiang, Y.H., Derr, J.N., Aukema, H.M., Lupton, J.R., and Chap-
kin, R.S. (1994). Protein kinase C isoforms in human and rat colonic mucosa.
Arch. Biochem. Biophys. 312, 547–553.
Dempsey, E.C., Newton, A.C., Mochly-Rosen, D., Fields, A.P., Reyland, M.E.,
Insel, P.A., and Messing, R.O. (2000). Protein kinase C isozymes and the regu-
lation of diverse cell responses. Am. J. Physiol. Lung Cell. Mol. Physiol. 279,
L429–L438.
Don, A.S., and Zheng, X.F. (2011). Recent clinical trials of mTOR-targeted can-
cer therapies. Rev. Recent Clin. Trials 6, 24–35.
Dries, D.R., Gallegos, L.L., and Newton, A.C. (2007). A single residue in the C1
domain sensitizes novel protein kinase C isoforms to cellular diacylglycerol
production. J. Biol. Chem. 282, 826–830.
Gallegos, L.L., Kunkel, M.T., and Newton, A.C. (2006). Targeting protein kinase
C activity reporter to discrete intracellular regions reveals spatiotemporal dif-
ferences in agonist-dependent signaling. J. Biol. Chem. 281, 30947–30956.
Galvez, A.S., Duran, A., Linares, J.F., Pathrose, P., Castilla, E.A., Abu-Baker,
S., Leitges, M., Diaz-Meco, M.T., and Moscat, J. (2009). Protein kinase Czeta
represses the interleukin-6 promoter and impairs tumorigenesis in vivo. Mol.
Cell. Biol. 29, 104–115.
Gao, J., Aksoy, B.A., Dogrusoz, U., Dresdner, G., Gross, B., Sumer, S.O., Sun,
Y., Jacobsen, A., Sinha, R., Larsson, E., et al. (2013). Integrative analysis of
complex cancer genomics and clinical profiles using the cBioPortal. Sci.
Signal. 6, pl1.
Garcia-Paramio, P., Cabrerizo, Y., Bornancin, F., and Parker, P.J. (1998). The
broad specificity of dominant inhibitory protein kinase Cmutants infers a com-
mon step in phosphorylation. Biochem. J. 333, 631–636.

Gould, C.M., Kannan, N., Taylor, S.S., and Newton, A.C. (2009). The chaper-
ones Hsp90 and Cdc37 mediate the maturation and stabilization of protein ki-
nase C through a conserved PXXP motif in the C-terminal tail. J. Biol. Chem.
284, 4921–4935.
Griner, E.M., and Kazanietz, M.G. (2007). Protein kinase C and other diacylgly-
cerol effectors in cancer. Nat. Rev. Cancer 7, 281–294.
Guertin, D.A., Stevens, D.M., Thoreen, C.C., Burds, A.A., Kalaany, N.Y., Mof-
fat, J., Brown, M., Fitzgerald, K.J., and Sabatini, D.M. (2006). Ablation in mice
of the mTORC components raptor, rictor, or mLST8 reveals that mTORC2 is
required for signaling to Akt-FOXO and PKCalpha, but not S6K1. Dev. Cell
11, 859–871.
Gwak, J., Jung, S.J., Kang, D.I., Kim, E.Y., Kim, D.E., Chung, Y.H., Shin, J.G.,
and Oh, S. (2009). Stimulation of protein kinase C-alpha suppresses colon
cancer cell proliferation by down-regulation of beta-catenin. J. Cell. Mol.
Med. 13 (8B), 2171–2180.
Hansra, G., Bornancin, F., Whelan, R., Hemmings, B.A., and Parker, P.J.
(1996). 12-O-Tetradecanoylphorbol-13-acetate-induced dephosphorylation
of protein kinase Calpha correlates with the presence of a membrane-associ-
ated protein phosphatase 2A heterotrimer. J. Biol. Chem. 271, 32785–32788.
Hernandez-Maqueda, J.G., Luna-Ulloa, L.B., Santoyo-Ramos, P., Castaneda-
Patlan, M.C., and Robles-Flores, M. (2013). Protein kinase C delta negatively
modulates canonical Wnt pathway and cell proliferation in colon tumor cell
lines. PLoS ONE 8, e58540.
Hill, K.S., Erdogan, E., Khoor, A., Walsh, M.P., Leitges, M., Murray, N.R., and
Fields, A.P. (2014). Protein kinase Ca suppresses Kras-mediated lung tumor
formation through activation of a p38 MAPK-TGFb signaling axis. Oncogene
33, 2134–2144.
Hirai, S., Izumi, Y., Higa, K., Kaibuchi, K., Mizuno, K., Osada, S., Suzuki, K., and
Ohno, S. (1994). Ras-dependent signal transduction is indispensable but not
sufficient for the activation of AP1/Jun by PKC delta. EMBO J. 13, 2331–2340.
Justilien, V., Walsh, M.P., Ali, S.A., Thompson, E.A., Murray, N.R., and Fields,
A.P. (2014). The PRKCI and SOX2 oncogenes are coamplified and cooperate
to activate Hedgehog signaling in lung squamous cell carcinoma. Cancer Cell
25, 139–151.
Kang, J.-H. (2014). Protein kinase C (PKC) isozymes and cancer. New J. Sci.
2014, 231418.
Kim, J.Y., Valencia, T., Abu-Baker, S., Linares, J., Lee, S.J., Yajima, T., Chen,
J., Eroshkin, A., Castilla, E.A., Brill, L.M., et al. (2013). c-Myc phosphorylation
by PKCz represses prostate tumorigenesis. Proc. Natl. Acad. Sci. USA 110,
6418–6423.
Koren, R., Langzam, L., Paz, A., Livne, P.M., Gal, R., and Sampson, S.R.
(2000). Protein kinase C (PKC) isoenzymes immunohistochemistry in lymph
node revealing solution-fixed, paraffin-embedded bladder tumors. Appl. Im-
munohistochem. Mol. Morphol. 8, 166–171.
Kornev, A.P., Haste, N.M., Taylor, S.S., and Eyck, L.F. (2006). Surface compar-
ison of active and inactive protein kinases identifies a conserved activation
mechanism. Proc. Natl. Acad. Sci. USA 103, 17783–17788.
Kornev, A.P., Taylor, S.S., and Ten Eyck, L.F. (2008). A helix scaffold for the
assembly of active protein kinases. Proc. Natl. Acad. Sci. USA 105, 14377–
14382.
Kuehn, H.S., Niemela, J.E., Rangel-Santos, A., Zhang, M., Pittaluga, S., Stod-
dard, J.L., Hussey, A.A., Evbuomwan, M.O., Priel, D.A., Kuhns, D.B., et al.
(2013). Loss-of-function of the protein kinase C d (PKCd) causes a B-cell lym-
phoproliferative syndrome in humans. Blood 121, 3117–3125.
Langzam, L., Koren, R., Gal, R., Kugel, V., Paz, A., Farkas, A., and Sampson,
S.R. (2001). Patterns of protein kinase C isoenzyme expression in transitional
cell carcinoma of bladder. Relation to degree of malignancy. Am. J. Clin.
Pathol. 116, 377–385.
Linch, M., Sanz-Garcia, M., Soriano, E., Zhang, Y., Riou, P., Rosse, C., Ca-
meron, A., Knowles, P., Purkiss, A., Kjaer, S., et al. (2013). A cancer-associated
mutation in atypical protein kinase Ci occurs in a substrate-specific recruit-
ment motif. Sci. Signal. 6, ra82.
Lu, Z., Hornia, A., Jiang, Y.W., Zang, Q., Ohno, S., and Foster, D.A. (1997). Tu-
mor promotion by depleting cells of protein kinase C delta. Mol. Cell. Biol. 17,
3418–3428.
Lu, H.C., Chou, F.P., Yeh, K.T., Chang, Y.S., Hsu, N.C., and Chang, J.G.
(2009). Analysing the expression of protein kinase C eta in human hepatocel-
lular carcinoma. Pathology 41, 626–629.
Luna-Ulloa, L.B., Hernandez-Maqueda, J.G., Santoyo-Ramos, P., Castaneda-
Patlan, M.C., and Robles-Flores, M. (2011). Protein kinase C z is a positive
modulator of canonical Wnt signaling pathway in tumoral colon cell lines.
Carcinogenesis 32, 1615–1624.
Ma, L., Tao, Y., Duran, A., Llado, V., Galvez, A., Barger, J.F., Castilla, E.A.,
Chen, J., Yajima, T., Porollo, A., et al. (2013). Control of nutrient stress-induced
metabolic reprogramming by PKCz in tumorigenesis. Cell 152, 599–611.
Mackay, H.J., and Twelves, C.J. (2007). Targeting the protein kinase C family:
are we there yet? Nat. Rev. Cancer 7, 554–562.
Mandil, R., Ashkenazi, E., Blass, M., Kronfeld, I., Kazimirsky, G., Rosenthal, G.,
Umansky, F., Lorenzo, P.S., Blumberg, P.M., and Brodie, C. (2001). Protein ki-
nase Calpha and protein kinase Cdelta play opposite roles in the proliferation
and apoptosis of glioma cells. Cancer Res. 61, 4612–4619.
Mauro, L.V., Grossoni, V.C., Urtreger, A.J., Yang, C., Colombo, L.L., Morandi,
A., Pallotta, M.G., Kazanietz, M.G., Bal de Kier Joffe, E.D., and Puricelli, L.L.
(2010). PKC Delta (PKCdelta) promotes tumoral progression of human ductal
pancreatic cancer. Pancreas 39, e31–e41.
Medkova, M., and Cho, W. (1998). Mutagenesis of the C2 domain of protein
kinase C-alpha. Differential roles of Ca2+ ligands and membrane binding res-
idues. J. Biol. Chem. 273, 17544–17552.
Mellemkjaer, L., Andersen, V., Linet, M.S., Gridley, G., Hoover, R., and Olsen,
J.H. (1997). Non-Hodgkin’s lymphoma and other cancers among a cohort of
patients with systemic lupus erythematosus. Arthritis Rheum. 40, 761–768.
Mosior,M., and Newton, A.C. (1998). Mechanism of the apparent cooperativity
in the interaction of protein kinase Cwith phosphatidylserine. Biochemistry 37,
17271–17279.
Myhre, S., Lingjærde, O.C., Hennessy, B.T., Aure, M.R., Carey, M.S., Alsner,
J., Tramm, T., Overgaard, J., Mills, G.B., Børresen-Dale, A.L., and Sørlie, T.
(2013). Influence of DNA copy number and mRNA levels on the expression
of breast cancer related proteins. Mol. Oncol. 7, 704–718.
Neckers, L., and Workman, P. (2012). Hsp90 molecular chaperone inhibitors:
are we there yet? Clin. Cancer Res. 18, 64–76.
Nelson, T.J., and Alkon, D.L. (2009). Neuroprotective versus tumorigenic pro-
tein kinase C activators. Trends Biochem. Sci. 34, 136–145.
Newton, A.C. (2003). Regulation of the ABC kinases by phosphorylation: pro-
tein kinase C as a paradigm. Biochem. J. 370, 361–371.
Nezhat, F., Wadler, S., Muggia, F., Mandeli, J., Goldberg, G., Rahaman, J.,
Runowicz, C., Murgo, A.J., and Gardner, G.J. (2004). Phase II trial of the com-
bination of bryostatin-1 and cisplatin in advanced or recurrent carcinoma of
the cervix: a New York Gynecologic Oncology Group study. Gynecol. Oncol.
93, 144–148.
Oster, H., and Leitges, M. (2006). Protein kinase C alpha but not PKCzeta sup-
presses intestinal tumor formation in ApcMin/+ mice. Cancer Res. 66, 6955–
6963.
Perry, A.S., Furusato, B., Nagle, R.B., and Ghosh, S. (2014). Increased aPKC
Expression Correlates with Prostatic Adenocarcinoma Gleason Score and Tu-
mor Stage in the Japanese Population. Prostate Cancer 2014, 481697.
Pongracz, J., Clark, P., Neoptolemos, J.P., and Lord, J.M. (1995). Expression
of protein kinase C isoenzymes in colorectal cancer tissue and their differential
activation by different bile acids. Int. J. Cancer 61, 35–39.
Prevostel, C., Martin, A., Alvaro, V., Jaffiol, C., and Joubert, D. (1997). Protein
kinase C alpha and tumorigenesis of the endocrine gland. Horm. Res. 47,
140–144.
Pu, Y.S., Huang, C.Y., Chen, J.Y., Kang, W.Y., Lin, Y.C., Shiu, Y.S., Chuang,
S.J., Yu, H.J., Lai, M.K., Tsai, Y.C., et al. (2012). Down-regulation of PKCz in
renal cell carcinoma and its clinicopathological implications. J. Biomed. Sci.
19, 39.
Cell 160, 489–502, January 29, 2015 ª2015 Elsevier Inc. 501

Ran, F.A., Hsu, P.D., Lin, C.Y., Gootenberg, J.S., Konermann, S., Trevino, A.E.,
Scott, D.A., Inoue, A., Matoba, S., Zhang, Y., and Zhang, F. (2013). Double
nicking by RNA-guided CRISPR Cas9 for enhanced genome editing speci-
ficity. Cell 154, 1380–1389.
Regala, R.P.,Weems, C., Jamieson, L., Khoor, A., Edell, E.S., Lohse, C.M., and
Fields, A.P. (2005). Atypical protein kinase C iota is an oncogene in human non-
small cell lung cancer. Cancer Res. 65, 8905–8911.
Reno, E.M., Haughian, J.M., Dimitrova, I.K., Jackson, T.A., Shroyer, K.R., and
Bradford, A.P. (2008). Analysis of protein kinase C delta (PKC delta) expression
in endometrial tumors. Hum. Pathol. 39, 21–29.
Reyland, M.E. (2007). Protein kinase Cdelta and apoptosis. Biochem. Soc.
Trans. 35, 1001–1004.
Rogers, T.B., Inesi, G., Wade, R., and Lederer, W.J. (1995). Use of thapsigargin
to study Ca2+ homeostasis in cardiac cells. Biosci. Rep. 15, 341–349.
Salzer, E., Santos-Valente, E., Klaver, S., Ban, S.A., Emminger, W., Prenge-
mann, N.K., Garncarz, W., Mullauer, L., Kain, R., Boztug, H., et al. (2013).
B-cell deficiency and severe autoimmunity caused by deficiency of protein ki-
nase C d. Blood 121, 3112–3116.
Suga, K., Sugimoto, I., Ito, H., and Hashimoto, E. (1998). Down-regulation of
protein kinase C-alpha detected in human colorectal cancer. Biochem. Mol.
Biol. Int. 44, 523–528.
Sun, S., Schiller, J.H., and Gazdar, A.F. (2007). Lung cancer in never
smokers—a different disease. Nat. Rev. Cancer 7, 778–790.
Symonds, J.M., Ohm, A.M., Carter, C.J., Heasley, L.E., Boyle, T.A., Franklin,
W.A., and Reyland, M.E. (2011). Protein kinase C d is a downstream effector
of oncogenic K-ras in lung tumors. Cancer Res. 71, 2087–2097.
Szallasi, Z., Smith, C.B., Pettit, G.R., and Blumberg, P.M. (1994). Differential
regulation of protein kinase C isozymes by bryostatin 1 and phorbol 12-myris-
tate 13-acetate in NIH 3T3 fibroblasts. J. Biol. Chem. 269, 2118–2124.
502 Cell 160, 489–502, January 29, 2015 ª2015 Elsevier Inc.
Varga, A., Czifra, G., Tallai, B., Nemeth, T., Kovacs, I., Kovacs, L., and Bıro, T.
(2004). Tumor grade-dependent alterations in the protein kinase C isoform
pattern in urinary bladder carcinomas. Eur. Urol. 46, 462–465.
Violin, J.D., Zhang, J., Tsien, R.Y., and Newton, A.C. (2003). A genetically en-
coded fluorescent reporter reveals oscillatory phosphorylation by protein ki-
nase C. J. Cell Biol. 161, 899–909.
Walsh, M.F., Woo, R.K., Gomez, R., and Basson, M.D. (2004). Extracellular
pressure stimulates colon cancer cell proliferation via a mechanism requiring
PKC and tyrosine kinase signals. Cell Prolif. 37, 427–441.
Wu, B., Zhou, H., Hu, L., Mu, Y., and Wu, Y. (2013). Involvement of PKCalpha
activation in TF/VIIa/PAR2-induced proliferation, migration, and survival of co-
lon cancer cell SW620. Tumour Biol. 34, 837–846.
Yoshida, K., Liu, H., and Miki, Y. (2006). Protein kinase C delta regulates Ser46
phosphorylation of p53 tumor suppressor in the apoptotic response to DNA
damage. J. Biol. Chem. 281, 5734–5740.
Young, S., Parker, P.J., Ullrich, A., and Stabel, S. (1987). Down-regulation of
protein kinase C is due to an increased rate of degradation. Biochem. J.
244, 775–779.
Zhang, L., Huang, J., Yang, N., Liang, S., Barchetti, A., Giannakakis, A., Ca-
dungog, M.G., O’Brien-Jenkins, A., Massobrio, M., Roby, K.F., et al. (2006).
Integrative genomic analysis of protein kinase C (PKC) family identifies
PKCiota as a biomarker and potential oncogene in ovarian carcinoma. Cancer
Res. 66, 4627–4635.
Zhang, L.L., Cao, F.F., Wang, Y., Meng, F.L., Zhang, Y., Zhong, D.S., and
Zhou, Q.H. (2014). The protein kinase C (PKC) inhibitors combined with
chemotherapy in the treatment of advanced non-small cell lung cancer:
meta-analysis of randomized controlled trials. Clin. Trans. Oncol. Published
online October 29, 2014. http://dx.doi.org/10.1007/s12094-014-1241-3.
Zhu, Y., Dong, Q., Tan, B.J., Lim, W.G., Zhou, S., and Duan, W. (2005). The
PKCalpha-D294G mutant found in pituitary and thyroid tumors fails to trans-
duce extracellular signals. Cancer Res. 65, 4520–4524.
Copyright © 2022 FDOKUMEN