Computer animations of color markings reveal the function of ...
10
Article Computer animations of color markings reveal the function of visual threat signals in Neolamprologus pulcher Valentina BALZARINI*, Michael TABORSKY , Fabienne VILLA, and Joachim G. FROMMEN Institute of Ecology and Evolution, Behavioral Ecology Division, University of Bern, Wohlenstrasse 50a, 3032 Hinterkappelen, Switzerland *Address correspondence to Valentina Balzarini. E-mail: [email protected]. Received on 3 March 2016; accepted on 19 July 2016 Abstract Visual signals, including changes in coloration and color patterns, are frequently used by animals to convey information. During contests, body coloration and its changes can be used to assess an opponent’s state or motivation. Communication of aggressive propensity is particularly important in group-living animals with a stable dominance hierarchy, as the outcome of aggressive inter- actions determines the social rank of group members. Neolamprologus pulcher is a cooperatively breeding cichlid showing frequent within-group aggression. Both sexes exhibit two vertical black stripes on the operculum that vary naturally in shape and darkness. During frontal threat displays these patterns are actively exposed to the opponent, suggesting a signaling function. To investi- gate the role of operculum stripes during contests we manipulated their darkness in computer animated pictures of the fish. We recorded the responses in behavior and stripe darkness of test subjects to which these animated pictures were presented. Individuals with initially darker stripes were more aggressive against the animations and showed more operculum threat displays. Operculum stripes of test subjects became darker after exposure to an animation exhibiting a pale operculum than after exposure to a dark operculum animation, highlighting the role of the dark- ness of this color pattern in opponent assessment. We conclude that (i) the black stripes on the operculum of N. pulcher are a reliable signal of aggression and dominance, (ii) these markings play an important role in opponent assessment, and (iii) 2D computer animations are well suited to elicit biologically meaningful short-term aggressive responses in this widely used model system of social evolution. Key words: aggression, agonistic behavior, animated pictures, cichlid fish, communication, cooperation, social, threat display. Color patterns can be important for species recognition (Jiggins et al. 2001; Detto et al. 2006; Pauers et al. 2008), and for signaling individual quality and status, for example in a reproductive context (Houde 1987; Bakker and Milinski 1993; Seehausen and van Alphen 1998; Boughman 2001). During agonistic encounters, color patterns are typically used to convey threat (Dawkins and Guilford 1993). Aggressive interactions are often costly, due to increased in- jury risk and energy expenditure (Maynard Smith 1982; Neat et al. 1998, Kemp and Wiklund 2001). To avoid unnecessary costs of con- flict escalation, a variety of signals and matching response rules have evolved to enable assessment of the opponents’ aggressive state (O’Connor et al. 1999; Gerald 2001; Lehtonen et al. 2015). Animals V C The Author (2016). Published by Oxford University Press. 45 This is an Open Access article distributed under the terms of the Creative Commons Attribution Non-Commercial License (http://creativecommons.org/licenses/by-nc/4.0/), which permits non-commercial re-use, distribution, and reproduction in any medium, provided the original work is properly cited. For commercial re-use, please contact [email protected] Current Zoology, 2017, 63(1), 45–54 doi: 10.1093/cz/zow086 Advance Access Publication Date: 3 August 2016 Article Downloaded from https://academic.oup.com/cz/article/63/1/45/2962419 by guest on 11 March 2022
-
Upload
khangminh22 -
Category
Documents
-
view
1 -
download
0
Transcript of Computer animations of color markings reveal the function of ...
Article
Computer animations of color markings reveal
the function of visual threat signals in
Neolamprologus pulcher
Valentina BALZARINI*, Michael TABORSKY, Fabienne VILLA, and
Joachim G. FROMMEN
Institute of Ecology and Evolution, Behavioral Ecology Division, University of Bern, Wohlenstrasse 50a, 3032
Hinterkappelen, Switzerland
*Address correspondence to Valentina Balzarini. E-mail: [email protected].
Received on 3 March 2016; accepted on 19 July 2016
Abstract
Visual signals, including changes in coloration and color patterns, are frequently used by animals
to convey information. During contests, body coloration and its changes can be used to assess an
opponent’s state or motivation. Communication of aggressive propensity is particularly important
in group-living animals with a stable dominance hierarchy, as the outcome of aggressive inter-
actions determines the social rank of group members. Neolamprologus pulcher is a cooperatively
breeding cichlid showing frequent within-group aggression. Both sexes exhibit two vertical black
stripes on the operculum that vary naturally in shape and darkness. During frontal threat displays
these patterns are actively exposed to the opponent, suggesting a signaling function. To investi-
gate the role of operculum stripes during contests we manipulated their darkness in computer
animated pictures of the fish. We recorded the responses in behavior and stripe darkness of test
subjects to which these animated pictures were presented. Individuals with initially darker stripes
were more aggressive against the animations and showed more operculum threat displays.
Operculum stripes of test subjects became darker after exposure to an animation exhibiting a pale
operculum than after exposure to a dark operculum animation, highlighting the role of the dark-
ness of this color pattern in opponent assessment. We conclude that (i) the black stripes on the
operculum of N. pulcher are a reliable signal of aggression and dominance, (ii) these markings play
an important role in opponent assessment, and (iii) 2D computer animations are well suited to elicit
biologically meaningful short-term aggressive responses in this widely used model system of
social evolution.
Key words: aggression, agonistic behavior, animated pictures, cichlid fish, communication, cooperation, social, threat display.
Color patterns can be important for species recognition (Jiggins
et al. 2001; Detto et al. 2006; Pauers et al. 2008), and for signaling
individual quality and status, for example in a reproductive context
(Houde 1987; Bakker and Milinski 1993; Seehausen and van
Alphen 1998; Boughman 2001). During agonistic encounters, color
patterns are typically used to convey threat (Dawkins and Guilford
1993). Aggressive interactions are often costly, due to increased in-
jury risk and energy expenditure (Maynard Smith 1982; Neat et al.
1998, Kemp and Wiklund 2001). To avoid unnecessary costs of con-
flict escalation, a variety of signals and matching response rules have
evolved to enable assessment of the opponents’ aggressive state
(O’Connor et al. 1999; Gerald 2001; Lehtonen et al. 2015). Animals
VC The Author (2016). Published by Oxford University Press. 45This is an Open Access article distributed under the terms of the Creative Commons Attribution Non-Commercial License (http://creativecommons.org/licenses/by-nc/4.0/),
which permits non-commercial re-use, distribution, and reproduction in any medium, provided the original work is properly cited. For commercial re-use, please contact
Current Zoology, 2017, 63(1), 45–54
doi: 10.1093/cz/zow086
Advance Access Publication Date: 3 August 2016
Article
Dow
nloaded from https://academ
ic.oup.com/cz/article/63/1/45/2962419 by guest on 11 M
arch 2022

often use color signals to convey their fighting ability or motivation,
which can reduce the probability of costly escalation (Tibbetts
2008; Van Dyk and Evans 2008). These badges of status typically
convey information about an individual’s social and aggressive sta-
tus (Maynard Smith and Harper 2003). They are assumed to be hon-
est signals, as the receiver response would incur high costs to the
sender if cheating was detected (Tibbetts 2008). Badges of status can
change in accordance with status changes, although usually at a
slower rate than state-dependent signals (Laucht and Dale 2012;
Rhodes and Schlupp 2012). Badges of status are used for the mutual
assessment of contestants together with other signals of fighting
ability, most of which can change rapidly during contests in depend-
ence of individual state (Arnott and Elwood 2009; M€athger et al.
2009; Ligon and McGraw 2013).
Color patterns used in aggressive contexts frequently involve the
presence or modulation of melanin-based pigments. For example,
darker maned lions Panthera leo are more aggressive and sexually
more active (West 2002), and darker tawny owls Strix aluco show a
higher level of aggressiveness (Da Silva et al. 2013). Furthermore,
vertical stripe patterns are often associated with intraspecific aggres-
sion in various species (e.g., Bortolotti et al. 2006; Price et al. 2008).
In fish, quickly adjustable color patterns are frequently used in ag-
gressive contests, where they may signal either dominance or sub-
mission (Barlow 1963; De Boer 1980; Dawkins and Guilford 1993;
Beeching 1995; O’Connor et al. 1999).
Here, we report on an experimental study of the importance of
color markings in the cooperatively breeding cichlid fish
Neolamprologus pulcher. Groups of these fish consist of one domin-
ant breeding pair and up to 25 immature and mature, related and
unrelated helpers of both sexes (Groenewoud et al. 2016; Taborsky
2016). Group members often show aggressive behavior against each
other (Reddon et al. 2011; Riebli et al. 2011, 2012). The hierarchy
in N. pulcher groups is strongly size dependent (Balshine et al. 2001;
Heg et al. 2005; Stiver et al. 2008), with some additional influence
of the sex of group members (Mitchell et al. 2009). The highest level
of competition occurs among similar-sized individuals (Wong and
Balshine 2011; Ligocki et al. 2015b). In this situation, size-
independent signals of fighting propensity may be beneficial to avoid
costly escalation of fights (Arnott and Elwood 2009; Ligon 2014).
The majority of N. pulcher’s aggressive encounters are settled by dis-
playing of aggressive intent, which does not require physical contact
(restrained aggression; Taborsky 1984; Schurch and Heg 2010).
Neolamprologus pulcher exhibits two black stripes on the oper-
culum (Figure 1), which differ in size and shape between populations
along the coast of Lake Tanganyika (Duftner et al. 2007). This oper-
culum pattern is present already at the juvenile stage in both sexes.
It is involved in the recognition of familiar conspecifics (Kohda et al.
2015) and might function as a signal during aggressive interactions
(Duftner et al. 2007). Neolamprologus pulcher frequently uses fron-
tal displays during which they widely spread their opercula
(Taborsky 1984; Balzarini et al. 2014). This behavior increases the
visibility of the operculum stripes for the opponent, facilitating its
assessment. It is therefore likely that the operculum stripes convey
information about the aggressive state of an individual, or about
their rank or fighting ability (Duftner et al. 2007).
When studying the function of variable color signals, it is diffi-
cult to disentangle the effect each participant of an interaction has
on the other. To control for the opponent’s visual cues and behavior,
they can be standardized by using either mirror images (Earley et al.
2000; Balzarini et al. 2014), video playbacks (Ord et al. 2002;
Verbeek et al. 2007), or animated computer models of conspecifics
(Mehlis et al. 2008; Thunken et al. 2013; Qin et al. 2014).
Computer animated models are particularly helpful when studying
visual signals, as they can be easily modified according to the re-
spective research question (Baldauf et al. 2008; Woo and Rieucau
2011; Fischer et al. 2014; Chouinard-Thuly et al. 2017). While
three-dimensional (3D) animations can be programmed to express
complex series of behavior (Kunzler and Bakker 1998; Rosenthal
2000; Gierszewski et al. 2017), 2D animations can be used for sim-
pler phenotypic alterations. For instance, stationary pictures of ani-
mals can be modified with help of editing programs and then
animated in front of a background (Baldauf et al. 2009; Woo and
Rieucau 2011; Fischer et al. 2014). Individuals of different fish spe-
cies have been shown to discriminate between pictures of different
heterospecifics or generic shapes moving in a computer animation
(Baldauf et al. 2009; Gerlai et al. 2010). For example, N. pulcher
differs in behavior when confronted with moving fish images of dif-
ferent cichlid species, as well as with moving fish images and a mov-
ing rectangle (Fischer et al. 2014). Computer animations have been
used to study agonistic behavior in a range of fish species, for ex-
ample, fighting fish Betta splendens (Allen and Nicoletto 1997;
Verbeek et al. 2007), three-spined sticklebacks Gasterosteus aculea-
tus (Mehlis et al. 2009), and N. pulcher (Fischer et al. 2014). These
studies demonstrate the potential of animations and photo editing to
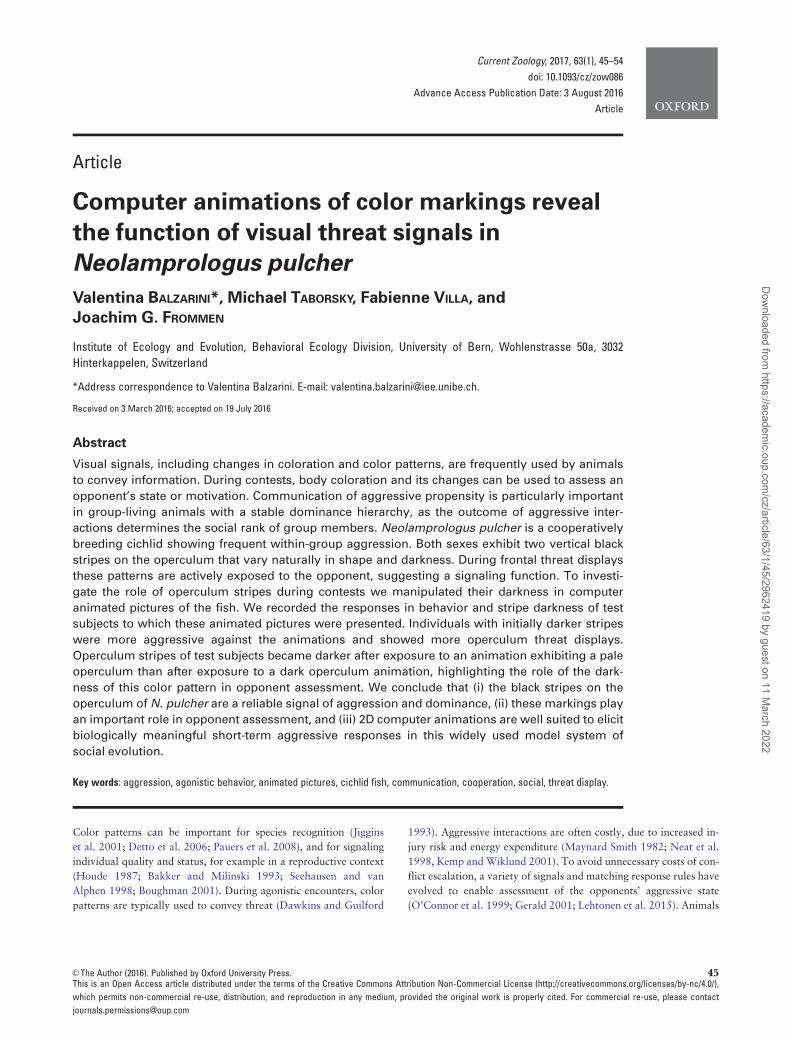
Figure 1. Examples of animation images. Each stimulus picture was manipulated in 4 different steps: (A) no stripes, (B) pale stripes, (C) mean stripes, and (D) dark
stripes. For better illustration of the differences, the overall brightness of the image presented here was modified to be 3% brighter than how it was used in the
experiment.
46 Current Zoology, 2017, Vol. 63, No. 1
Dow
nloaded from https://academ
ic.oup.com/cz/article/63/1/45/2962419 by guest on 11 M
arch 2022
study the function of visual color signals in a diverse range of
species.
In the present study we aimed at elucidating whether the dark-
ness of the black operculum stripes of N. pulcher functions as signal
of aggression and dominance using standardized 2D computer ani-
mations of virtual intruders (Fischer et al. 2014). The pictures were
obtained from photographs of conspecifics, in which we modified
the darkness of the operculum stripes in four steps (dark, mean,
pale, and no stripes). The hypothesis assuming that the operculum
stripes are used to signal aggressive propensity predicts a positive
correlation between the darkness of stripes and the amount of ag-
gression displayed by an individual. In terms of opponent assess-
ment, we expected a modifying effect of the experimentally varied
operculum patterns presented by our animations on the aggression
of focal test fish. Furthermore, we expected the stripe darkness of
focal test fish to change according to the darkness level of stripes of
the animated opponents.
Materials and Methods
Experiments were conducted in August 2013. The individuals used
in this study were F1 and F2 generation laboratory-reared offspring
of wild fish, caught at the Zambian coast of Lake Tanganyika close
to Kasakalawe point. They were kept in aggregations of 10–30 indi-
viduals in tanks of either 50 L, 200 L, or 400 L, depending on num-
bers of individuals. The water temperature was kept constant at
27 6 1�C and the light regime was set to a light:dark cycle of
13:11 h. Tanks were filtered and aerated with internal biological fil-
ters, and the bottom of each tank was covered with a 2-cm sand
layer. The tanks did not contain breeding shelters to prevent fish
from reproducing. Surface shelters were provided to minimize po-
tential negative effects of aggression in the tank. All fish were fed
with commercial flake food (5 days/week) and with defrosted food
(1 day/week).
Computer animationsFor preparing the animations, 10 fish (5 males and 5 females) be-
tween 40 and 45 mm standard length (SL) were haphazardly caught
from the holding tanks. To avoid effects of familiarity impairing our
results (Kohda et al. 2015), fish used to create the animations were
taken from different tanks than the test subjects. Lateral pictures
were taken in a small glass box with an Olympus SZ-11 camera
(Olympus Lens 4.5–90.0 mm 1:3.0–6.9). Fish in the pictures had a
neutral posture, with fins halfway between completely spread (an
aggressive display) and totally relaxed. The photo box was illumi-
nated with a 60 W 230 V light bulb. A Munsell color reference card
with standard white color was placed in each picture. All darkness
measurements were calculated in relation to this white standard, to
minimize variation caused by random illumination differences
(Frommen et al. 2008). The lateral pictures of the 10 fish were pro-
cessed in the CIE Lab color space (Hasting and Rubin 2012) with
the software “Adobe Photoshop CC”. We chose this color space be-
cause it transforms the image’s color data into device-independent
data, thus preventing camera-specific biases compromising the ana-
lyses (Hill et al. 1997; Sharma et al. 2005). In the CIE Lab color
space the “L” axis indicates the darkness (black¼0 to white¼100);
the “a” axis ranges from green to red (negative values indicate
green, positive red) and the “b” axis from blue to yellow (negative
values indicate blue, positive yellow; Stevens and Cuthill 2005;
Hasting and Rubin 2012). As our focus was on the darkness of the
facial stripes, we restrict our analysis to the “L” value. The L-value
of the bars was calculated as a percentage value of the white refer-
ence to correct for illumination differences.
From each original picture we obtained 4 manipulated copies, 3
with stripes of different darkness and 1 without stripes (see Figure 1
for examples). The pictures with stripes had L-values of 45 6 3 (pale
stripes), 25 6 5 (mean stripes), and 5 6 1 (dark stripes), respectively.
For the picture with no stripes, the operculum color was adjusted to
be of the same color as the surrounding head area. The values for
the “mean stripes” images were obtained by averaging the L-values
of the stripes of the 10 original pictures. After manipulation, the fish
in the picture was cut out from the background using “Adobe
Photoshop CC”. The cutouts were pasted into a 2D animation using
“Power Point 2010”, with the same olive-green background as used
in previous studies (Fischer et al. 2014; Hess et al. 2016). The size of
the cutout was standardized to 41 mm SL, which was the mean size
of the fish used for the animation images. The size of the animation
fish was kept constant, independently of the test fish size, to control
for distortion of general image characteristics, other than the oper-
culum stripes. An HP windows computer and a COMPAQ 1520
screen (32�23 cm2) were used to display the animations to the test
fish. The same screen model was successfully used by Fischer et al.
(2014) and Hess et al. (2016). During the animation, the fish image
entered the screen head first from one side and moved in a straight
line at a speed of 1.3 s/cm until exiting the frame on the opposing
side. Afterwards, the same movement was repeated in the opposite
direction. In this way, the animated fish moved back and forth on
the screen for 10 min.
Behavioral testsA total of 28 individuals (14 males and 14 females) between 40 and
45 mm SL were haphazardly caught from the holding tanks. After
capture, a lateral picture of their head was taken under the same
conditions and with the same material as for the animation pictures,
to get a baseline reference for their operculum stripe darkness. This
baseline measure was important because N. pulcher tend to darken
slightly during handling. After taking the baseline picture, the fish
were measured, and their sex was determined by checking their
genital papilla. Then, each fish was placed into a 25 L (l�w�h:
40�25�25 cm) experimental tank. The experiment was conducted
in 6 tanks in parallel, following the procedure described in Fischer
et al. (2014). The bottom of each experimental tank was covered
with sand and the water was aerated with an air stone. A flowerpot
half served as shelter. The tanks were visually isolated from each
other using opaque partitions. Test subjects were allowed 15 h of ac-
climation time in the experimental tank before the first test started
(Fischer et al. 2014). For each test, we placed the screen outside the
tank on the short wall opposite the shelter, and let the fish acclimate
to an empty background for 10 min. After this, the animation
started and continued for 10 min. During this time, we continuously
recorded the number of aggressive behaviors. Overt aggression
refers to behaviors aimed at physical contact with the opponent,
that is, biting and ramming attempts directed toward the animation
(Balzarini et al. 2014; Fischer et al. 2014). Restrained aggression
comprised aggressive displays, that is, fin spread, operculum spread,
and fast approach (Schurch and Heg 2010; Balzarini et al. 2014;
Fischer et al. 2014). All observations were recorded using the
“Observer5.0” software (Noldus).
Each test subject was confronted once with each of the four ani-
mation types (“pale” stripes, “mean” stripes, “dark” stripes, “no”
stripes) in a random order, resulting in 112 trials in total. To exclude
that variation between stimulus fish would influence the test
Balzarini et al. � Function of visual threat signals in Neolamprologus pulcher 47
Dow
nloaded from https://academ
ic.oup.com/cz/article/63/1/45/2962419 by guest on 11 M
arch 2022

subjects’ behavior, all animations shown to an individual test subject
used manipulated images of the same stimulus fish picture. These 4
animation presentations were spread over 2 consecutive days. On
each day, 1 animation was shown in the morning and 1 in the after-
noon, with a break of 4 hours in between. Half of the subjects were
randomly assigned to receiving same-sex animation pictures, the
other half to animation images from opposite sex fish. The 5 female
animation sets (1 set equals 4 modified images of the same stimulus
fish) were used in 7 male and 7 female trials, the same was the case
for the 5 male animation sets. Thus, each animation set was used be-
tween 2 and 4 times in total. Immediately after each trial, we took a
picture of the test fish’s operculum stripes, to record potential
changes in darkness depending on the kind of animation it had
received. The photographs were taken in the same way as those for
the baseline and the animation pictures. After the picture was taken,
the fish was returned to the experimental tank.
Statistical analysisFor all statistical analyses we used the software “R”, version 3.1.2
(R Core Team 2013). Mixed models were run with the package
“lme4” (Bates et al. 2015). Model selection was done by stepwise re-
moval of non-significant terms and interactions (Engqvist 2005). All
P-values were obtained with likelihood ratio tests, which follows a
v2 distribution (for all mixed models), or F-tests (for the parametric
linear model (LM); Lu and Zhang 2010). A likelihood ratio test is
needed for model simplification when the factors used in the model
have more than 2 levels, as it gives an overall P-value for the factor’s
effect by comparing the full model to one missing the specified fac-
tor (Dalgaard 2008; Zuur et al. 2009). This step is required as P-val-
ues from the lme4 package outcome do not reflect all possible data
comparisons (Crawley 2007; Zuur et al. 2009). When needed, we
ran Tukey post-hoc tests on the models with the package
“multcomp” (Hothorn et al. 2008), and the resulting P-values were
corrected for multiple testing. If Poisson-distributed models were
over-dispersed (Bolker et al. 2009), we included an additional indi-
vidual-based random effect (Elston et al. 2001).
Color analysesDarkness of the operculum stripes was calculated as the average L-
value of the 2 stripes’ area, with high values indicating lighter stripes
and low values darker ones. Baseline values were normally distrib-
uted, so we used parametric statistics. We analyzed differences in
baseline darkness among test fish with a LM, with sex and size of
the test fish as explanatory variables. The interaction between the
test fish’s sex and size was also included. P-values were obtained
with an F-test.
To analyze color change in response to the animations, we cre-
ated an “L difference” variable by subtracting the baseline L-values
from the L-values after the animation. On this variable, we fitted a
linear mixed model (LMM). The animation darkness level, the sex
of the test fish and that of the animation fish were set as fixed fac-
tors. Size of the test fish and order of testing (the order in which the
animations were presented within a set) were inserted as covariates.
Order of testing was not treated as a factor because we were not
interested in the differences between subsequent trials, but in the
overall time effect. The interaction between the sex of the animation
and of the test fish was also included. The identity of the test fish
and of the animation fish were set as random factors and never
excluded from the model. The use of post-animation to pre-
animation differences and the inclusion of the test fish’s identity as
random effect in the model account for different individual re-
sponses to handling. Because the residuals of the model on “L differ-
ence” values were not perfectly normally distributed according to
Q–Q plots and the dependent variable could not be transformed, we
confirmed the robustness of the P-values obtained from the model
with permutation tests with 10,000 repetitions. The permutation re-
sulted in an adjusted a-level of 0.0403. As animation type had a sig-
nificant effect on darkness change, and because we were interested
in the differences between animations, we ran Tukey post-hoc tests
on animation type to discern the differences between animations.
Finally, as the interaction between sex of the animation and of the
test fish was significant, we analyzed the results for each sex separ-
ately. For each sex, we ran 1 LMM on the difference in L-values be-
fore and after animation, with sex of the animation as fixed factor,
and identity of the test fish and of the animation fish as random
factors.
Behavioral observationCounts of aggressive behavior were combined into “overt aggres-
sion” and “restrained aggression”. Of the latter, operculum spread
was analyzed separately, as we hypothesized this behavior being the
aggressive display most related to the stripe darkness, resulting in
the variables “operculum spread” and “restrained aggression with-
out operculum spread”. We will refer to the second one as “re-
strained aggression” for brevity.
Generalized linear mixed effect models (GLMMs) assuming
Poisson distribution were conducted to analyze overt aggression,
operculum spreads, and restrained aggression. The animation type,
sex of the test fish and of the animation fish were set as fixed factors.
The L-value of each subject’s baseline pictures, the size of the test
fish, and trial order were inserted as covariates. We considered also
the interactions between the sex of the animation and the sex of the
test fish, and between animation type and baseline L-value. For each
model, the identities of the test fish and of the animation fish were
set as random factors. No post-hoc tests were required.
Results
Behavioral observationsSubjects with darker baseline operculum stripes showed significantly
more overt aggression and more operculum spreads (overt aggres-
sion, GLMM, v2 ¼ 6.840, P¼0.009; operculum spreads, GLMM,
v2 ¼ 4.488, P¼0.034, Figure 2, Table 1) than individuals with
lighter baseline stripes. There was no significant difference in re-
strained aggressive behavior (GLMM, v2 ¼ 0.061, P¼0.805, Table
1). Subjects did not differ significantly in aggression shown toward
the different animation types (overt aggression, GLMM, v2¼1.032,
P¼0.793; operculum spreads, GLMM, v2¼0.153, P¼0.985; re-
strained aggression, GLMM, v2¼1.943, P¼0.584, Table 1).
The size of focal subjects was significantly related to aggression,
with smaller subjects attacking the presented animation more often
(overt aggression, GLMM, v2¼10.058, P¼0.002), and showing
more operculum spreads (GLMM, v2¼6.463, P¼0.011). However,
they did not differ from bigger fish in restrained aggression
(GLMM, v2¼0.516, P¼0.473, Table 1).
There was a positive, non-significant trend for females to engage
in more overt aggression against the animated display than males
(GLMM, v2¼3.237, P¼0.072, Table 1), but not in operculum
spreads or other restrained aggressive behaviors (GLMM, P>0.37,
Table 1). Overall, restrained aggression showed a significant order
48 Current Zoology, 2017, Vol. 63, No. 1
Dow
nloaded from https://academ
ic.oup.com/cz/article/63/1/45/2962419 by guest on 11 M
arch 2022

effect, with subjects being more aggressive in the first test than in
the others (GLMM, v2¼9.939, P¼0.002). This effect was not sig-
nificant in overt aggression (GLMM, v2¼2.796, P¼0.095, Table
1) and operculum spreads (GLMM, v2¼2.373, P¼0.123, Table 1).
The other covariates did not have a significant effect on the subjects’
behavior (all P>0.12, Table 1).
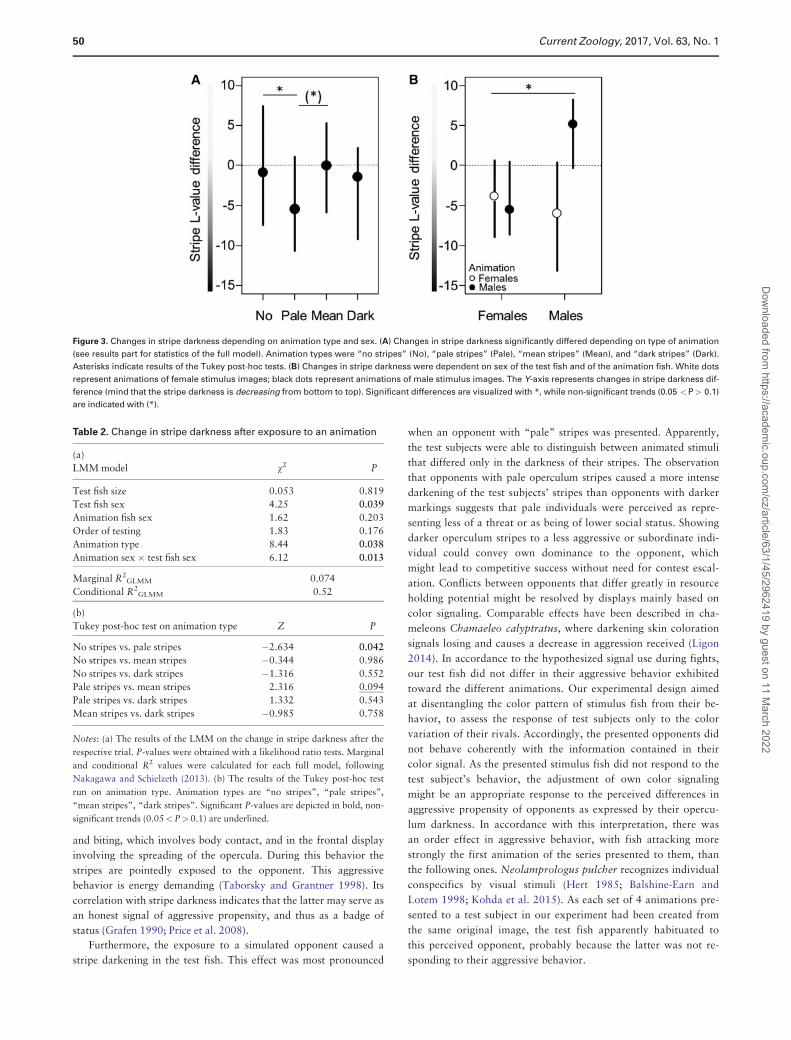
Stripe darknessThe darkness of operculum stripes in the presented animation
caused a significant response in the darkness of the test subjects’
stripes (LMM, v2¼8.44, P¼0.038, Figure 3A and Table 2 part a),
which was apparently due to the fish showing darker operculum
color after viewing the “pale” animation (Tukey post-hoc, no stripes
vs. pale stripes, Z¼�2.634, P¼0.042; pale stripes vs. mean stripes,
Z¼2.316, P¼0.094; Table 2 part b). Furthermore, there was a sig-
nificant interaction between the sex of the test fish and that of the
animation fish (LMM, v2¼6.12, P¼0.013, Figure 3B and Table 2).
While the animation’s sex did not elicit different responses in stripe
coloration of females (LMM, v2¼0.294, P¼0.588, Figure 3B),
males became darker when shown a female animation and paler
when shown a male animation (LMM, v2¼9.161, P¼0.003). The
other explanatory variables in the model did not have a significant
effect on stripe darkness, before or after the animation (all P>0.17,
Table 2).
We found a positive, though non-significant trend for males to
exhibit a darker stripe baseline than females (LM, F¼3.501,
P¼0.073, Figure 4, Table 3). The other explanatory variables in the
model did not have a significant effect on baseline stripe darkness
(all P>0.2, Table 3).
Discussion
Our results show that the darkness of the operculum stripes of
N. pulcher reflects an individual’s aggressiveness. In particular,
stripe darkness was strongly related to overt aggressive behaviors
and the amount of operculum displays shown against the ani-
mated opponent. Furthermore, test fish responded to the stripe
darkness of animated stimulus fish by changing their own opercu-
lum stripe darkness rather than by measurable changes in their
behavior.
The relationship between operculum color and aggressive pro-
pensity showed up in the most intense form of aggression, ramming
Table 1. Behavioral responses to the animations
Overt aggression Operculum spreads Restrained aggression
(excluding Op. spreads)
v2 P v2 P v2 P
Baseline stripe darkness 6.840 0.009 4.488 0.034 0.061 0.805
Test fish size 10.058 0.002 6.463 0.011 0.516 0.473
Test fish sex 3.237 0.072 0.026 0.871 0.530 0.467
Animation fish sex 1.515 0.218 0.129 0.720 0.268 0.605
Order of testing 2.796 0.095 2.373 0.123 9.939 0.002
Animation type 1.032 0.793 0.153 0.985 1.943 0.584
Animation type � baseline stripe darkness 4.209 0.240 1.351 0.717 2.510 0.474
Animation fish sex � test fish sex 0.146 0.703 0.448 0.503 1.790 0.181
Marginal R2GLMM 0.397 0.207 0.184
Conditional R2GLMM 0.604 0.409 0.182
Notes: Results of GLMMs for overt aggression, operculum spreads, and restrained aggression excluding operculum spreads. P-values were obtained with likeli-
hood ratio tests. Significant P-values are in bold, non-significant trends (0.05<P>0.1) are underlined. Marginal and conditional R2 values were calculated for
each full model, following Nakagawa and Schielzeth (2013).
Figure 2. Baseline stripe darkness and aggression. The frequencies of (A) overt
aggression and (B) operculum spreads and their relationship with stripe dark-
ness (L-values; mind that the stripe darkness is decreasing from left to right).
Balzarini et al. � Function of visual threat signals in Neolamprologus pulcher 49
Dow
nloaded from https://academ
ic.oup.com/cz/article/63/1/45/2962419 by guest on 11 M
arch 2022
and biting, which involves body contact, and in the frontal display
involving the spreading of the opercula. During this behavior the
stripes are pointedly exposed to the opponent. This aggressive
behavior is energy demanding (Taborsky and Grantner 1998). Its
correlation with stripe darkness indicates that the latter may serve as
an honest signal of aggressive propensity, and thus as a badge of
status (Grafen 1990; Price et al. 2008).
Furthermore, the exposure to a simulated opponent caused a
stripe darkening in the test fish. This effect was most pronounced
when an opponent with “pale” stripes was presented. Apparently,
the test subjects were able to distinguish between animated stimuli
that differed only in the darkness of their stripes. The observation
that opponents with pale operculum stripes caused a more intense
darkening of the test subjects’ stripes than opponents with darker
markings suggests that pale individuals were perceived as repre-
senting less of a threat or as being of lower social status. Showing
darker operculum stripes to a less aggressive or subordinate indi-
vidual could convey own dominance to the opponent, which
might lead to competitive success without need for contest escal-
ation. Conflicts between opponents that differ greatly in resource
holding potential might be resolved by displays mainly based on
color signaling. Comparable effects have been described in cha-
meleons Chamaeleo calyptratus, where darkening skin coloration
signals losing and causes a decrease in aggression received (Ligon
2014). In accordance to the hypothesized signal use during fights,
our test fish did not differ in their aggressive behavior exhibited
toward the different animations. Our experimental design aimed
at disentangling the color pattern of stimulus fish from their be-
havior, to assess the response of test subjects only to the color
variation of their rivals. Accordingly, the presented opponents did
not behave coherently with the information contained in their
color signal. As the presented stimulus fish did not respond to the
test subject’s behavior, the adjustment of own color signaling
might be an appropriate response to the perceived differences in
aggressive propensity of opponents as expressed by their opercu-
lum darkness. In accordance with this interpretation, there was
an order effect in aggressive behavior, with fish attacking more
strongly the first animation of the series presented to them, than
the following ones. Neolamprologus pulcher recognizes individual
conspecifics by visual stimuli (Hert 1985; Balshine-Earn and
Lotem 1998; Kohda et al. 2015). As each set of 4 animations pre-
sented to a test subject in our experiment had been created from
the same original image, the test fish apparently habituated to
this perceived opponent, probably because the latter was not re-
sponding to their aggressive behavior.
Figure 3. Changes in stripe darkness depending on animation type and sex. (A) Changes in stripe darkness significantly differed depending on type of animation
(see results part for statistics of the full model). Animation types were “no stripes” (No), “pale stripes” (Pale), “mean stripes” (Mean), and “dark stripes” (Dark).
Asterisks indicate results of the Tukey post-hoc tests. (B) Changes in stripe darkness were dependent on sex of the test fish and of the animation fish. White dots
represent animations of female stimulus images; black dots represent animations of male stimulus images. The Y-axis represents changes in stripe darkness dif-
ference (mind that the stripe darkness is decreasing from bottom to top). Significant differences are visualized with *, while non-significant trends (0.05 <P> 0.1)
are indicated with (*).
Table 2. Change in stripe darkness after exposure to an animation
(a)
LMM model v2 P
Test fish size 0.053 0.819
Test fish sex 4.25 0.039
Animation fish sex 1.62 0.203
Order of testing 1.83 0.176
Animation type 8.44 0.038
Animation sex � test fish sex 6.12 0.013
Marginal R2GLMM 0.074
Conditional R2GLMM 0.52
(b)
Tukey post-hoc test on animation type Z P
No stripes vs. pale stripes �2.634 0.042
No stripes vs. mean stripes �0.344 0.986
No stripes vs. dark stripes �1.316 0.552
Pale stripes vs. mean stripes 2.316 0.094
Pale stripes vs. dark stripes 1.332 0.543
Mean stripes vs. dark stripes �0.985 0.758
Notes: (a) The results of the LMM on the change in stripe darkness after the
respective trial. P-values were obtained with a likelihood ratio tests. Marginal
and conditional R2 values were calculated for each full model, following
Nakagawa and Schielzeth (2013). (b) The results of the Tukey post-hoc test
run on animation type. Animation types are “no stripes”, “pale stripes”,
“mean stripes”, “dark stripes”. Significant P-values are depicted in bold, non-
significant trends (0.05<P> 0.1) are underlined.
50 Current Zoology, 2017, Vol. 63, No. 1
Dow
nloaded from https://academ
ic.oup.com/cz/article/63/1/45/2962419 by guest on 11 M
arch 2022

At the beginning of our experiment, males tended to have darker
stripes than females. This might suggest that males are more aggres-
sive than females. However, our results suggest the opposite, with
females tending to engage more in overt aggressive interactions than
males. Further evidence on sex differences in aggression of N.
pulcher is, thus far, ambiguous. Within groups containing helpers of
both sexes, there were no sex effects in the aggression of dominants
against subordinates (Taborsky 1985), but in groups with helpers of
only one sex, dominants tended to be more aggressive toward same-
sex subordinates (Mitchell et al. 2009). No sex differences were
identified when analyzing the personality axis of aggression
(Schurch and Heg 2010) as well as territory defense behavior under
natural conditions (Groenewoud et al. 2016). Desjardins et al.
(2006) found that females were more aggressive than males toward
conspecific intruders, while no difference was described by Zottl et
al (2013), and Witsenburg et al. (2010) observed the opposite effect.
These divergent results point toward a strong context dependence
regarding the occurrence of sex-differences in N. pulcher aggression.
Another explanation for differences in baseline stripe darkness be-
tween sexes could be a difference in response to stress, as the stress
response is known to be connected with the sexual hormone regula-
tion axis (Handa et al. 1994; Tilbrook et al. 2000). However, hor-
monal studies on N. pulcher have so far highlighted differences in
glucocorticoid levels mainly between dominant and subordinate in-
dividuals (Ligocki et al. 2015a), rather than between sexes. Similar
differences between dominants and subordinates in stress hormone
levels have been found also in cooperatively breeding birds and
mammals, where they also appear to be independent of sex (Creel
2001). Nonetheless, we corrected for potential effects of handling
stress on the response of operculum color to the experiment by ana-
lyzing the difference in darkness before and after the experimental
trials.
It is interesting to note that in female test subjects, the operculum
stripes became darker independently of the animation’s sex, while in
males the sex of the animation influenced changes in darkness.
While males confronted with a female animation got darker stripes,
they became paler when confronted with a male animation. Thus,
N. pulcher appears to be able to differentiate between sexes based
on animated 2D pictures alone. The visual cues used to differentiate
between the sexes remain elusive, as we manipulated the darkness of
the stripes in a standardized way, not differentiating between male
and female stimuli. However, stripe darkness appears to indicate an
individual’s aggressive propensity, which is connected to its resource
holding potential (see Briffa et al. 2015). Thus, in a mating context
stripe darkness could signal individual quality, a topic which should
be investigated in future studies. Overall, the results show that the
operculum color pattern of N. pulcher carries information that
could be used in both competitive and mating contexts. This is in ac-
cordance with knowledge about other melanin-based signals (e.g.,
Barlow 1963; West 2002).
Smaller individuals showed more overt aggression and operculum
spreading than larger ones, independently of their stripe darkness.
Prima facie this seems surprising, as larger individuals are usually
more engaged in aggressive interactions and territory defense
(Taborsky and Limberger 1981; Bruintjes and Taborsky 2008; Heg
and Taborsky 2010; Groenewoud et al. 2016). However, field experi-
ments revealed context dependent defense behavior of differently sized
subordinates (Bruintjes and Taborsky 2011; Groenewoud et al.
2016), and differential responses to intruders in dependence of relative
size and rank (Ligocki et al. 2015b; Groenewoud et al. 2016), and of
resource value (O’Connor et al. 2015). In our study, smaller subjects
(overall range 40–45mm) were of similar size as the stimulus fish
image (41 mm). In the size-based hierarchy of N. pulcher groups, com-
petition is highest between similar sized individuals, and fights be-
tween similar sized individuals are more intense (Bruintjes and
Taborsky 2008; Wong and Balshine 2011).
A general problem of computer animated stimuli is that the used
visual devices are tailored to the human visual spectrum (Baldauf
et al. 2008, 2009; Chouinard-Tuly et al. 2017). However, several
fish species are tetrachromatic, being able to see in the ultraviolet
(Carleton et al. 2000; Rick et al. 2006; Baldauf et al. 2008; Nava
et al. 2011) or infrared range (Meuthen et al. 2012). Ambon damsel-
fish Pomacentrus amboinensis for example use UV facial patterns to
discern conspecifics from closely related species living in the same
habitat (Siebeck et al. 2010). It remains to be investigated whether
N. pulcher is able to perceive signals beyond the human sensitivity
range and if so, in which context this ability would be used.
However, in the present study we aimed to clarify the function of
the darkness of operculum stripes, which could hence be studied
without detailed knowledge of the color perception of this species.
In conclusion, our results reveal a clear relationship between
operculum stripe darkness and aggressiveness in N. pulcher.
Individuals with darker stripes showed more overt aggression and
operculum displays. Thus, operculum stripes function as honest
Figure 4. Sex differences in baseline stripe darkness. Baseline stripe darkness
of male and female focal individuals before presentation of the animations.
The Y-axis represents baseline stripe darkness (L-values; mind that the stripe
darkness is decreasing from bottom to top). A non-significant trend
(0.05<P>0.1) is indicated with (*).
Table 3. Baseline stripe darkness
F P
Test fish size 1.400 0.248
Test fish sex 3.501 0.073
Test fish size � test fish sex 0.669 0.421
Adjusted R2LM 0.118
Notes: Results of the LM on baseline stripe darkness. P-values were obtained
with an F-test. A non significant trend (0.05<P> 0.1) is underlined. The ad-
justed R2 value for the full model is reported.
Balzarini et al. � Function of visual threat signals in Neolamprologus pulcher 51
Dow
nloaded from https://academ
ic.oup.com/cz/article/63/1/45/2962419 by guest on 11 M
arch 2022
signal of aggressive propensity and badge of status. Accordingly,
focal fish’s stripe darkness changed in dependence of the stimulus’
experimentally manipulated operculum stripe darkness. Finally, our
study confirms that N. pulcher reacts predictably to 2D computer
animations, and that these fish are able to discriminate between
sexes and simulated differences in aggressive state using slightly
altered images.
Acknowledgments
We thank the members of the Behavioral Ecology Division of the University
of Bern for discussion of the results, and Leif Engqvist and Frank
Groenewoud for help with statistics. The manuscript benefitted from thought-
ful comments of Klaudia Witte and 3 anonymous referees. We are grateful to
the editors of the “Virtual Reality” special issue for encouraging us to submit
this manuscript.
Funding
The study was financed by the Swiss National Science Foundation. V.B. was
funded by Grant number 31003A_144191 to J.G.F.
References
Allen JM, Nicoletto PF, 1997. Response of Betta splendens to computer ani-
mations of males with fins of different length. Copeia 1997:195–199.
Arnott G, Elwood RW, 2009. Assessment of fighting ability in animal contests.
Anim Behav 77:991–1004.
Baldauf SA, Kullmann H, Bakker TCM, 2008. Technical restrictions of
computer-manipulated visual stimuli and display units for studying animal
behaviour. Ethology 114:737–751.
Baldauf SA, Kullmann H, Thunken T, Winter S, Bakker TCM, 2009.
Computer animation as a tool to study preferences in the cichlid
Pelvicachromis taeniatus. J Fish Biol 75:738–746.
Balshine S, Leach B, Neat FC, Reid H, Taborsky M et al., 2001. Correlates of
group size in a cooperatively breeding cichlid fish Neolamprologus pulcher.
Behav Ecol Sociobiol 50:134–140.
Balshine-Earn S, Lotem A, 1998. Individual recognition in a cooperatively
breeding cichlid: evidence from video playback experiments. Behaviour
135:369–386.
Balzarini V, Taborsky M, Wanner S, Koch F, Frommen JG, 2014. Mirror, mir-
ror on the wall: the predictive value of mirror tests for measuring aggression
in fish. Behav Ecol Sociobiol 68:871–878.
Bakker TCM, Milinski M, 1993. The advantages of being red: sexual selection
in the stickleback. Mar Fresh Behav Physiol 23:287–300.
Barlow G, 1963. Ethology of the Asian teleost Badis badis. II. Motivation and
signal value of the colour patterns. Anim Behav 11:97–102.
Bates D, M€achler M, Bolker B, Walker S, 2015. Fitting linear mixed-effects
models using lme4. J Statist Softw 67:1–48.
Beeching SC, 1995. Colour pattern and inhibition of aggression in the cichlid
fish Astronotus ocellatus. J Fish Biol 47:50–58.
Bolker BM, Brooks ME, Clark CJ, Geange SW, Poulsen JR et al., 2009.
Generalized linear mixed models: a practical guide for ecology and evolu-
tion. Trends Ecol Evol 24:127–135.
Bortolotti GR, Blas J, Negro JJ, Tella JL, 2006. A complex plumage pattern as
an honest social signal. Anim Behav 72:423–430.
Boughman JW, 2001. Divergent sexual selection enhances reproductive isola-
tion in sticklebacks. Nature 411:944–948.
Briffa M, Sneddon LU, Wilson AJ, 2015. Animal personality as a cause and
consequence of contest behaviour. Biol Lett 11:20141007.
Bruintjes R, Taborsky M, 2008. Helpers in a cooperative breeder pay a high
price to stay: effects of demand, helper size and sex. Anim Behav
75:1843–1850.
Bruintjes R, Taborsky M, 2011. Size-dependent task specialization in a co-
operative cichlid in response to experimental variation of demand. Anim
Behav 81:387–394.
Carleton KL, H�arosi FI, Kocher TD, 2000. Visual pigments of African cichlid
fishes: evidence for ultraviolet vision from microspectrophotometry and
DNA sequences. Vision Res 40:879–890.
Chouinard-Thuly L, Gierszewski S, Rosenthal GG, Reader SM, Rieucau G
et al., 2017. Technical and conceptual considerations for using animated
stimuli in studies of animal behavior. Curr Zool 63:5–19.
Crawley MJ, 2007. The R Book. Chichester: John Wiley & Sons Ltd.
Creel S, 2001. Social dominance and stress hormones. Trends Ecol Evol
16:491–497.
Dalgaard P, 2008. Introductory Statistics with R. New York: Springer-Verlag.
Da Silva A, van den Brink V, Emaresi G, Luzio E, Bize P et al., 2013. Melanin-
based colour polymorphism signals aggressive personality in nest and terri-
tory defence in the tawny owl Strix aluco. Behav Ecol Sociobiol
67:1041–1052.
Dawkins MS, Guilford T, 1993. Colour and pattern in relation to sexual and
aggressive behaviour in the bluehead wrasse Thalassoma bifasciatum.
Behav Process 30:245–251.
De Boer B, 1980. A causal analysis of the territorial and courtship behaviour
of Chromis cyanea (Pomacentridae, Pisces). Behaviour 73:1–50.
Desjardins JK, Hazelden MR, Van Der Kraak GJ, Balshine S, 2006. Male and
female cooperatively breeding fish provide support for the “Challenge hy-
pothesis”. Behav Ecol 17:149–154.
Detto T, Backwell PRY, Hemmi JM, Zeil J, 2006. Visually mediated species
and neighbour recognition in fiddler crabs (Uca mjoebergi and Uca capricor-
nis). Proc R Soc B 273:1661–1666.
Duftner N, Sefc KM, Koblmuller S, Salzburger W, Taborsky M et al., 2007.
Parallel evolution of facial stripe patterns in the Neolamprologus brichard/
pulcher species complex endemic to Lake Tanganyika. Mol Phylogenet Evol
45:706–715.
Earley RL, Hsu Y, Wolf LL, 2000. The use of standard aggression testing
methods to predict combat behaviour and contest outcome in Rivulus mar-
moratus dyads (Teleostei: Cyprinodontidae). Ethology 106:743–761.
Elston D, Moss R, Boulinier T, 2001. Analysis of aggregation, a worked ex-
ample: numbers of ticks on red grouse chicks. Parasitology 122:563–569.
Engqvist L, 2005. The mistreatment of covariate interaction terms in linear
model analyses of behavioural and evolutionary ecology studies. Anim
Behav 70:967–971.
Fischer S, Taborsky B, Burlaud R, Fernandez AA, Hess S et al., 2014.
Animated images as a tool to study visual communication: a case study in a
cooperatively breeding cichlid. Behaviour 151:1921–1942.
Frommen JG, Luz C, Mazzi D, Bakker TCM, 2008. Inbreeding depression af-
fects fertilization success and survival but not breeding coloration in threes-
pine sticklebacks. Behaviour 145:425–441.
Gerald MS, 2001. Primate colour predicts social status and aggressive out-
come. Anim Behav 61:559–566.
Gerlai R, Fernandes Y, Pereira T, 2010. Zebrafish Danio rerio responds to the
animated image of a predator: towards the development of an automated
aversive task. Behav Brain Res 201:318–324.
Gierszewski S, Muller K, Smielik I, Hutwohl J-M, Kuhnert K-D et al., 2016.
The virtual lover: variable and easy guided 3D fish as innovative tool in
mate–choice experiments with sailfin mollies. II. Validation. Curr Zool
63:65–74.
Grafen A, 1990. Biological signals as handicaps. J Theor Biol 144:517–546.
Groenewoud F, Frommen JG, Josi D, Tanaka H, Jungwirth A et al., 2016.
Predation risk drives social complexity in cooperative breeders. Proc Natl
Acad Sci USA 113:4104–4109.
Handa RJ, Burgess LH, Kerr JE, O’keefe JA, 1994. Gonadal steroid hormone
receptors and sex differences in the hypothalamo–pituitary–adrenal axis.
Horm Behav 28:464–476.
Hasting G, Rubin A, 2012. Colour spaces: a review of historic and modern col-
our models. S Afr Optom 71:133–143.
Heg D, Brouwer L, Bachar Z, Taborsky M, 2005. Large group size yields
group stability in the cooperatively breeding cichlid Neolamprologus
pulcher. Behaviour 142:1615–1641.
52 Current Zoology, 2017, Vol. 63, No. 1
Dow
nloaded from https://academ
ic.oup.com/cz/article/63/1/45/2962419 by guest on 11 M
arch 2022

Heg D, Taborsky M, 2010. Helper response to experimentally manipulated
predation risk in the cooperatively breeding cichlid Neolamprologus
pulcher. PLoS ONE 5:e10784.
Hert E, 1985. Individual recognition of helpers by the breeders in the cichlid
fish Lamprologus brichardi (Poll, 1974). Z Tierpsychol 68:313–325.
Hess S, Fischer S, Taborsky B, 2016. Territorial aggression reduces vigilance
but increases aggression towards predators in a cooperatively breeding fish.
Anim Behav 113:229–235.
Hill B, Roger T, Vorhagen FW, 1997. Comparative analysis of the quantiza-
tion of color spaces on the basis of the CIELAB color-difference formula.
A.C.M. T Graphic 16:109–154.
Hothorn T, Bretz F, Westfall P, 2008. Simultaneous inference in general para-
metric models. Biometr J 50:346–363.
Houde AE, 1987. Mate choice based upon naturally occurring color–pattern
variation in a guppy population. Evolution 41:1–10.
Jiggins CD, Naisbit RE, Coe RL, Mallet J, 2001. Reproductive isolation
caused by colour pattern mimicry. Nature 411:302–305.
Kemp DJ, Wiklund C, 2001. Fighting without weaponry: a review of male–
male contest competition in butterflies. Behav Ecol Sociobiol 49:429–442.
Kohda M, Jordan LA, Hotta T, Kosaka N, Karino K et al., 2015. Facial recog-
nition in a group-living cichlid fish. PLoS ONE 10:e0142552.
Kunzler R, Bakker TCM, 1998. Computer animations as a tool in the study of
mating preferences. Behaviour 135:1137–1159.
Laucht S, Dale J, 2012. Development of badges of status in captive male house
sparrows Passer domesticus in relation to the relative ornamentation of
flock-mates. Ethology 118:644–653.
Lehtonen T, Sowersby W, Gagnon K, Wong BB, 2015. Cichlid fish use color-
ation as a cue to assess the threat status of heterospecific intruders. Am Nat
186:547–552.
Ligocki IY, Earley RL, Hellmann JK, Hamilton IM, 2015a. Variation in gluco-
corticoid levels in relation to direct and third-party interactions in a social
cichlid fish. Physiol Behav 151:386–394.
Ligocki IY, Reddon AR, Hellmann JK, O’connor CM, Marsh-Rollo SE et al.,
2015b. Social status influences responses to unfamiliar conspecifics in a co-
operatively breeding fish. Behaviour 152:1821–1839.
Ligon RA, 2014. Defeated chameleons darken dynamically during dyadic dis-
putes to decrease danger from dominants. Behav Ecol Sociobiol
68:1007–1017.
Ligon RA, McGraw KJ, 2013. Chameleons communicate with complex colour
changes during contests: different body regions convey different informa-
tion. Biol Lett 9:20130892.
Lu Y, Zhang G, 2010. The equivalence between likelihood ratio test and F-test
for testing variance component in a balanced one-way random effects
model. J Stat Comput Sim 80:443–450.
M€athger LM, Shashar N, Hanlon RT, 2009. Do cephalopods communicate
using polarized light reflections from their skin? J Exp Biol 212:2133–2140.
Maynard Smith J, 1982. Evolution and the Theory of Games. Cambridge:
Cambridge University Press.
Maynard Smith J, Harper D, 2003. Animal Signals. Oxford: Oxford
University Press.
Mehlis M, Bakker TCM, Frommen JG, 2008. Smells like sib spirit: kin recog-
nition in three-spined sticklebacks Gasterosteus aculeatus is mediated by ol-
factory cues. Anim Cogn 11:643–650.
Mehlis M, Bakker TCM, Langen K, Frommen JG, 2009. Cain and Abel re-
loaded? Kin recognition and male–male aggression in three-spined stickle-
backs Gasterosteus aculeatus L. J Fish Biol 75:2154–2162.
Meuthen D, Rick IP, Thunken T, Baldauf SA, 2012. Visual prey detection by
near-infrared cues in a fish. Naturwissenschaften 99:1063–1066.
Mitchell JS, Jutzeler E, Heg D, Taborsky M, 2009. Dominant members of
cooperatively-breeding groups adjust their behaviour in response to the
sexes of their subordinates. Behaviour 146:1665–1686.
Nakagawa S, Schielzeth H, 2013. A general and simple method for obtaining
R2 from generalized linear mixed-effects models. Methods Ecol Evol
4:133–142.
Nava S, Stephen A, Hamil T, 2011. Visual detection of UV cues by adult zebra-
fish Danio rerio. J Vision 11:1–5.
Neat FC, Taylor AC, Huntingford FA, 1998. Proximate costs of fighting in
male cichlid fish: the role of injuries and energy metabolism. Anim Behav
55:875–882.
O’Connor CM, Reddon AR, Ligocki IY, Hellmann JK, Garvy KA et al., 2015.
Motivation but not body size influences territorial contest dynamics in a
wild cichlid fish. Anim Behav 107:19–29.
O’Connor K, Metcalfe N, Taylor A, 1999. Does darkening signal submission
in territorial contests between juvenile Atlantic salmon, Salmo salar? Anim
Behav 58:1269–1276.
Ord TJ, Peters RA, Evans CS, Taylor AJ, 2002. Digital video playback and vis-
ual communication in lizards. Anim Behav 63:879–890.
Pauers MJ, Kapfer JM, Fendos CE, Berg CS, 2008. Aggressive biases towards
similarly coloured males in Lake Malawi cichlid fishes. Biol Lett
4:156–159.
Price AC, Weadick CJ, Shim J, Rodd FH, 2008. Pigments, patterns, and fish
behavior. Zebrafish 5:297–307.
Qin M, Wong A, Seguin D, Gerlai R, 2014. Induction of social behavior in
zebrafish: live versus computer animated fish as stimuli. Zebrafish
11:185–197.
R Core Team. 2013. R: A Language and Environment for Statistical
Computing. Vienna: R Foundation for Statistical Computing. Available
from: http://www.R-project.org.
Reddon AR, Voisin MR, Menon N, Marsh-Rollo SE, Wong MYL et al., 2011.
Rules of engagement for resource contests in a social fish. Anim Behav
82:93–99.
Rhodes SB, Schlupp I, 2012. Rapid and socially induced change of a badge of
status. J Fish Biol 80:722–727.
Rick IP, Modarressie R, Bakker TCM, 2006. UV wavelengths affect female
mate choice in three-spined sticklebacks. Anim Behav 71:307–313.
Riebli T, Avgan B, Bottini A, Duc C, Taborsky M et al., 2011. Behavioural
type affects dominance and growth in staged encounters of cooperatively
breeding cichlids. Anim Behav 81:313–323.
Riebli T, Taborsky M, Chervet N, Apolloni N, Zurcher Y et al., 2012.
Behavioural type, status and social context affect behaviour and resource al-
location in cooperatively breeding cichlids. Anim Behav 84:925–936.
Rosenthal GG, 2000. Design considerations and techniques for constructing
video stimuli. Acta Ethol 3:49–54.
Schurch R, Heg D, 2010. Life history and behavioral type in the highly social
cichlid Neolamprologus pulcher. Behav Ecol 21:588–598.
Seehausen O, van Alphen J, 1998. The effect of male coloration on female
mate choice in closely related Lake Victoria cichlids (Haplochromis nyererei
complex). Behav Ecol Sociobiol 42:1–8.
Sharma G, Wu W, Dalal EN, 2005. The CIEDE2000 color-difference formula:
implementation notes, supplementary test data, and mathematical observa-
tions. Color Res Appl 30:21–30.
Siebeck UE, Parker AN, Sprenger D, M€athger LM, Wallis G, 2010. A species
of reef fish that uses ultraviolet patterns for covert face recognition. Curr
Biol 20:407–410.
Stevens M, Cuthill IC, 2005. The unsuitability of HTML-based colour charts
for estimating animal colours: a comment on Berggren and Meril€a (2004).
Front Zool 2:14.
Stiver KA, Fitzpatrick JL, Desjardins JK, Neff BD, Quinn JS et al., 2008. The
role of genetic relatedness among social mates in a cooperative breeder.
Behav Ecol 19:816–823.
Taborsky M, Limberger D, 1981. Helpers in fish. Behav Ecol Sociobiol
8:143–145.
Taborsky M, 1984. Broodcare helpers in the cichlid fish Lamprologus bri-
chardi: their costs and benefits. Anim Behav 32:1236–1252.
Taborsky M, 1985. Breeder-helper conflict in a cichlid fish with broodcare
helpers: an experimental analysis. Behaviour 95:45–75.
Taborsky M, Grantner A, 1998. Behavioural time-energy budgets of coopera-
tively breeding Neolamprologus pulcher (Pisces: Cichlidae). Anim Behav
56:1375–1382.
Taborsky M, 2016. Cichlid fishes: a model for the integrative study of social
behavior. In: Koenig WD, Dickinson JL, editors. Cooperative Breeding in
Vertebrates: Studies of Ecology, Evolution, and Behavior. Cambridge:
Cambridge University Press, 272–293.
Balzarini et al. � Function of visual threat signals in Neolamprologus pulcher 53
Dow
nloaded from https://academ
ic.oup.com/cz/article/63/1/45/2962419 by guest on 11 M
arch 2022
Thunken T, Bakker TCM, Baldauf SA, 2013. “Armpit effect” in an African
cichlid fish: self-referent kin recognition in mating decisions of male
Pelvicachromis taeniatus. Behav Ecol Sociobiol 68:99–104.
Tibbetts EA, 2008. Resource value and the context dependence of receiver be-
haviour. Proc R Soc B 275:2201–2206.
Tilbrook AJ, Turner AI, Clarke IJ, 2000. Effects of stress on reproduction in
non-rodent mammals: the role of glucocorticoids and sex differences. Rev
Reprod 5:105–113.
Van Dyk DA, Evans CS, 2008. Opponent assessment in lizards: examining the
effect of aggressive and submissive signals. Behav Ecol 19:895–901.
Verbeek P, Iwamoto T, Murakami N, 2007. Differences in aggression between
wild-type and domesticated fighting fish are context dependent. Anim
Behav 73:75–83.
West PM, 2002. Sexual selection, temperature, and the lion’s mane. Science
297:1339–1343.
Witsenburg F, Schurch R, Otti O, Heg D, 2010. Behavioural types and ecolo-
gical effects in a natural population of the cooperative cichlid
Neolamprologus pulcher. Anim Behav 80:757–767.
Wong M, Balshine S, 2011. Fight for your breeding right: hierarchy re-
establishment predicts aggression in a social queue. Biol Lett 7:190–193.
Woo KL, Rieucau G, 2011. From dummies to animations: a review of
computer-animated stimuli used in animal behavior studies. Behav Ecol
Sociobiol 65:1671–1685.
Zuur AF, Ieno EN, Walker N, Saveliev AA, Smith GM, 2009. Mixed
Effects Models and Extensions in Ecology with R. New York: Springer-
Verlag.
Zottl M, Frommen JG, Taborsky M, 2013. Group size adjustment to ecolo-
gical demand in a cooperative breeder. Proc R Soc B 280:20122772.
54 Current Zoology, 2017, Vol. 63, No. 1
Dow
nloaded from https://academ
ic.oup.com/cz/article/63/1/45/2962419 by guest on 11 M
arch 2022


![DATING AUSTRALIAN ROCK-MARKINGS: AN INTERDISCIPLINARY CHALLENGE [2000]](https://static.fdokumen.com/doc/165x107/634288e4bee265473d0fd447/dating-australian-rock-markings-an-interdisciplinary-challenge-2000.jpg)