The 'adaptive zone' – A concept for assessing discomfort glare throughout daylit spaces

1
Can virtual reality predict body part discomfort and performance
of people in realistic world for assembling tasks?
Bo HUa, Liang MA
b, Wei ZHANG
a, Gaverial. SALVENDY
a, Damien
CHABLATb, Fouad BENNIS
b
a: Department of Industrial Engineering, Tsinghua University, Beijing,100084, P.R. China
b: Institut de Recherche en Communications et en Cybernétique de Nantes,
CNRS UMR 6597
Ecole Centrale de Nantes, IRCCyN - 1, rue de la Noë - BP 92 101 - 44321
Abstract
This paper presents our work on relationship of evaluation results between
virtual environment (VE) and realistic environment (RE) for assembling tasks.
Evaluation results consist of subjective results (BPD and RPE) and objective
results (posture and physical performance). Same tasks were performed with same
experimental configurations and evaluation results were measured in RE and VE
respectively. Then these evaluation results were compared. Slight difference of
posture between VE and RE was found but not great difference of effect on people
according to conventional ergonomics posture assessment method. Correlation of
BPD and performance results between VE and RE are found by linear regression
method. Moreover, results of BPD, physical performance, and RPE in VE are
higher than that in RE with significant difference. Furthermore, these results
indicates that subjects feel more discomfort and fatigue in VE than RE because of
additional effort required in VE.
Relevance to industry
With digital mock-up and VR simulation, work design is evaluated to find
potential ergonomics problems at early design stage of works in industries. It
reduces cost as well as time consuming. The difference and correlation of
evaluation results between VE and RE provide a reference for this method in work
design.
Keywords: virtual reality simulation; digital human modeling; evaluation of work
design; ergonomics
1. Introduction
Musculoskeletal disorder (MSD) is one of serious occupational healthy

2
problems to manual handling workers in industrialized countries, and it affects a
significant proportion of workforce. In 2001, National Research Council and
Institute of Medicine reported that MSD represented 40% of compensated injuries
and cost between 45 and 54 billion dollars per year in United
States(NationalResearchCouncil/InstituteofMedicine, 2001). In European Union,
there was 40 millions workers suffering from MSD and the financial loss caused
by MSD was about between 0.2% and 5% GDP by some estimation(Buckle and
Devereux, 1999). Hence many researches focus on analyzing potential MSD
exposures and how to prevent MSD in work design.
It is believed that MSD is closely related to postures, physical overexertion,
duration and frequency of physical effort, discomfort, and physical fatigue
(Pheasant, 1999). In order to prevent MSD risks, many evaluation methods have
been developed to investigate ergonomics problems in design. These methods can
be mainly classified into subjective (e.g., RPE, BPD) and objective evaluation
methods (e.g., RULA, OWAS)(Li and Buckle, 1999). Borg’s scale, also called
Rated Perceiving Exertion (RPE) method, has been applied for evaluating effort of
subjects in variety of researches and it has been validated in consistence to several
psychological variables (e.g., heart rate) (Garcin, Vautier et al., 1998; Kim, Martin
et al., 2004). Body part discomfort (BPD) method was developed to evaluate
discomfort intensity of subjects. (Corlett and Bishop, 1976; Lowe, 2004; Yuan and
Kuo, 2006). Some posture-based observation methods have been developed to
assess physical exposures objectively. OWAS was designed to facilitate evaluation
process of the overall human body (Scott and Lambe, 1996). Posture targeting
method (Corlett, Madeley et al., 1979) and REBA (Hignett and McAtamney, 2000)
were designed to evaluate entire body postures, while RULA was specially
designed to evaluate upper body postures (McAtamney and Corlett, 1993; Bao,
Howard et al., 2007). However, in these conventional methods, evaluation has to
be carried out in field and it requires much effort and expensive physical mock-up.
Digital human modeling and virtual human simulation (e.g., 3DSSPP™, EAI

3
Jack®, RAMSIS) have been created to facilitate ergonomic evaluations. Using
these tools, visual scope and reach envelope of users representing specific
populations can be analyzed (e.g. EAI Jack®)(Chaffin, Nelson et al., 2001). Some
DHM tools can calculate out biomechanics attributes of manual handling
operations (e.g. Anybody®
Modeling System, 3DSSPP™) and give predictions of
fatigue and disorder. These analysis results can be used to find and fix ergonomics
problems of proposed designs and improve the work design.
Virtual human simulation provides a quick, virtual representation of human
being in simulated working environment. Physical mock-up is not any more
necessary in virtual human simulation, and different aspects can be assessed with
rapid computational efficiency. The main issue of using virtual human simulation
is that the movement or the motion is obtained via inverse kinematics, and the
virtual human has a robot-like behavior, but not natural or mimic enough (Chaffin
and Erig, 1991).
Using virtual reality (VR) technology is able to provide an immersive working
environment. Several peripheral devices have been invented to provide different
interaction ways between user and VR systems, such as: motion tracking systems,
haptic interfaces, etc. VR techniques, in combination with DHM tools, have been
used more and more to enable the participation of human being (Buck, 1998). VR
has also been used in ergonomic applications (Whitman, Jorgensen et al., 2004;
Jayaram, Jayaram et al., 2006; Wang, Liao et al., 2007).
The aim of integrating ergonomic evaluation methods into VR is to facilitate
work design process, enhance design efficiency, and lower the design cost.
Hypothetically, if a virtual environment could provide 100% fidelity, the workload
in virtual environment (VE) might be the same as in realistic environment (RE).
Our main concern is whether the evaluation result in VR with different presence
level is consistent to the evaluation in RE. Therefore, we proposed an
experimental approach to check the relation between the evaluation results in VR
and VE for same physical operations.

4
In this paper, we presented our preliminary experiment results in a VR system
only with visual feedback. The purpose of our research is to analyze evaluation
results in VE and RE for the same tasks. Subjective evaluation methods (BPD,
RPE) are used to evaluate discomfort and perceived exertion effort in both
environments, and objective methods (posture, fatigue) are used to evaluate
physical aspects of the task. The relationship of evaluation results in RE and VE is
analyzed with regression method.
2. Method
2.1. Subjects
30 male subjects participated in this experiment after giving their informed
consent. They were all recruited from a manufacturing enterprise. They were all
free from musculoskeletal disorders. Their mean age was 41.8 y (s.d.=11.5 y),
mean height was 172.0 cm (s.d.=5.5 cm), and the mean mass was 69.5 kg
(s.d.=12.2 kg). Twenty-two of them are all professional hand-tool operators and
their working experience varies from 3 to 20 years. The other subjects use
hand-tools occasionally.
2.2. Task description
The task in this experiment was designed by simplified from typical
assembling tasks (hand drilling operations). The task consisted of several
elementary operations in assembling tasks: holding and lifting a hand-tool,
reaching and hitting targets, and keeping alignment between the tool and the target
for assembly operations. Each subject was asked to perform the simulated drilling
operations while sitting or standing at a fixed working position and facing at a tool
work station and a work platform.
A 1.5 kg weighted hand-tool was used in this experiment for simulating the
external physical load. The hand-tool was made of a plastic cover with weighted
materials to replace a real powered pistol drill. It was placed on a fixed work

5
station, which had a height of 70 cm and was placed in front of the subject with a
horizontal distance 80 cm.
The working position of a subject was fixed in the workplace. Operation
targets were placed on two fixed platforms, for sitting posture and standing
posture, respectively. Both platforms were placed 80 cm ahead of the subject. The
heights of the platforms were 80 cm and 140 cm, for sitting posture and standing
posture, respectively.
All the operation targets were located in target models. The size of target
model for standing tasks was 550 mm (Height) by 400 mm (Width), and the size of
target model for sitting tasks was 400 mm (Height) by 600 mm (Width). There
were 9 numerated target points with different positions. Physical target models
were used in RE, while the same digital models were used in VE (Figure 1)
(a): physical model for standing task. (b): digital model for standing task
(c): physical model for sitting task. (d): digital model for sitting task
Figure 1 The target models in VE and RW
The following steps were necessary to complete simulated assembling tasks.
1. The subject reached and held the hand-tool at a fixed position and lifted it.

6
2. The subject placed the hand-tool in alignment with a target point of the
model and kept his posture for 4 seconds.
3. The subject had to finish all the 9 target points in ascending order as a
loop.
4. One task might include different number of loops.
2.3. Apparatus
The VR simulation system used in this experiment was developed in the
Virtual Reality and Human Interface Technology (VRHIT) laboratory of Tsinghua
University. This system provided immersive virtual scenarios for subjects based
on OpenGL®
. Virtual objects can be created with 3D modeling tools (e.g.
AutoDesk® 3ds MAX, PTC
® Pro/E) and imported into the system. Motion
tracking devices, digital head mounted display (HMD), data gloves, and
multimodal feedback devices can be linked to the system as peripherals.
Meanwhile, a manikin (digital human model) can be provided in this VR
simulation system, and it can be driven by captured data from motion tracking
devices. The manikin interacts with other virtual objects, and interactive virtual
scenes are displayed to subjects. The manikin is used to provide visual
representation of the subject in VE for better understanding the interactions
between subject and virtual scenarios.
The VR motion simulation system can be used for simulating assembling,
handling, and maintenance operations in industries. It has been used in projects
collaborated with industrial enterprises (Hu, Wang et al., 2008).
In this experiment, we used two sets of magnetic motion tracking devices
(totally six sensors) made by Pohemus Corp to track subject’s motion. These
sensors were mounted on the head and key joints of a subject for tracking working
posture. The acquisition rate is 30 Hz per sensor and the static accuracy of each
sensor is 1 mm.
7
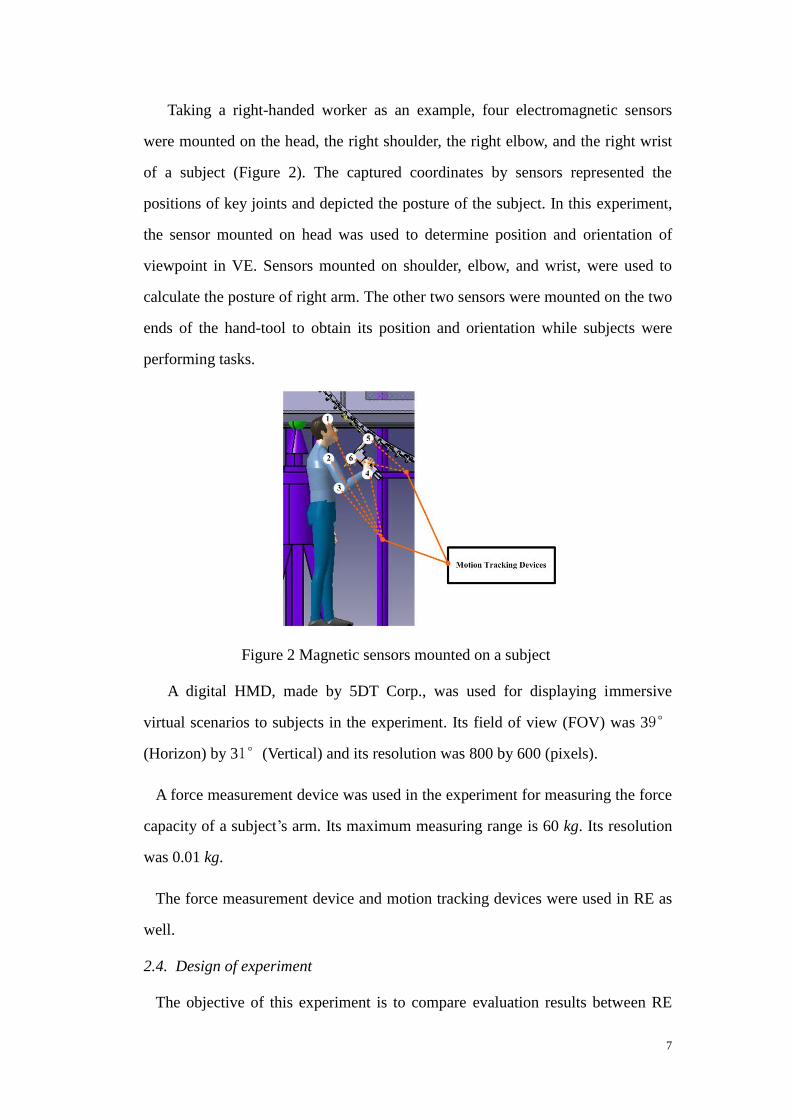
Taking a right-handed worker as an example, four electromagnetic sensors
were mounted on the head, the right shoulder, the right elbow, and the right wrist
of a subject (Figure 2). The captured coordinates by sensors represented the
positions of key joints and depicted the posture of the subject. In this experiment,
the sensor mounted on head was used to determine position and orientation of
viewpoint in VE. Sensors mounted on shoulder, elbow, and wrist, were used to
calculate the posture of right arm. The other two sensors were mounted on the two
ends of the hand-tool to obtain its position and orientation while subjects were
performing tasks.
Figure 2 Magnetic sensors mounted on a subject
A digital HMD, made by 5DT Corp., was used for displaying immersive
virtual scenarios to subjects in the experiment. Its field of view (FOV) was 39°
(Horizon) by 31°(Vertical) and its resolution was 800 by 600 (pixels).
A force measurement device was used in the experiment for measuring the force
capacity of a subject’s arm. Its maximum measuring range is 60 kg. Its resolution
was 0.01 kg.
The force measurement device and motion tracking devices were used in RE as
well.
2.4. Design of experiment
The objective of this experiment is to compare evaluation results between RE

8
and VE, then find out their relationship and difference. Considering possible
effects on experiments, three with-subjects factors were involved in this
experiment. Their levels and descriptions are demonstrated in Table 1.
All tasks were done both in RE and VE. Subjects were divided into two groups
for different sequences of sessions. Group 1 performed the RE session at first,
then the VE session. With an inverse sequence, Group 2 performed the VE session
at first, then the RE session. Tasks of RE sessions were the same as those in VE
sessions, and the relative position of a target model to a subject in the RE sessions
were the same as those in VE sessions.
Table 1 Factors and their levels in the experiment
Factors Levels Description
Working posture tasks ST Sitting task
SD Standing task
Duration of tasks L 4 loops in a task
S 2 loops in a task
Size of target point LG Diameter of a target point is 6 mm
SL Diameter of a target point is 18 mm
Working posture tasks, duration of tasks, and size of target points were
involved as within-subject factors in the experiment. Each factor has two levels.
Working posture tasks consist of sitting posture and standing posture. Two types
of target points with different sizes were designed initially to represent the
difficulty of an assembly task in this experiment: ø6 and ø18. The duration of
tasks has two levels: one level is two loops in a task and the other level is four
loops in a task.
These three factors make up of eight different treatments for a subject. A
performing sequence of these treatments was assigned randomly to each subject.
Each subject performs tasks with the same sequence of treatments in RE session
and VE session.
2.5. Experimental protocol

9
2.5.1. Objective evaluation results
Two objective indexes, working posture and physical performance (fatigue),
were measured for assessing operation tasks.
In our experiment, in most cases, right arm was mainly engaged in the operation,
and the angle between the forearm and the upper arm indicated the working
posture directly. This variable could be used to assess the posture.
The physical performance of each subject, indicated by the decrease of the
maximum force capacity, was measured to representing fatigue since the decrease
of the force capacity is the most direct measurement of fatigue (Vøllestad, 1997).
The maximum voluntary contraction of the right arm was measured by the force
measurement device and denoted as before
F before starting a task. After finishing a
task, the maximum voluntary contraction was measured again and it was denoted
asafter
F . The normalized decrease of force capacity, calculated
by before after beforeF F F , was used as physical performance in this experiment.
2.5.2. Subjective evaluation results
The subjective evaluation was carried out using two methods: BPD and RPE.
A self-reported questionnaire, consisting of BPD scale and RPE scale, was used
for collecting subjective sensation of subjects in RE and VE. In the questionnaire,
Borg’s scale with 6-20 point was used for RPE questions. The 11-point scale and
the original body part diagram of Corlett was used in BPD scale (Corlett and
Bishop, 1976). The original body part diagram of BPD divided entire body into
twelve regions: neck, shoulders, upper arms, forearms, upper back, middle back,
lower back, buttocks, left thigh, right thigh, left shank, right shank.
Subjects were asked to report their evaluation of BPD and RPE when they
finished a task as subjective evaluation result.
2.5.3. Presence of VE
A presence questionnaire was used for assessing presence of a subject in VE
10
session. The presence questionnaire of this experiment was created referring to
Witmer and Singer’s presence questionnaire (Witmer and Singer, 1998).
Seven-point scale was used in the presence questionnaire. Higher total score of
answers in scale of the questionnaire indicates higher presence.
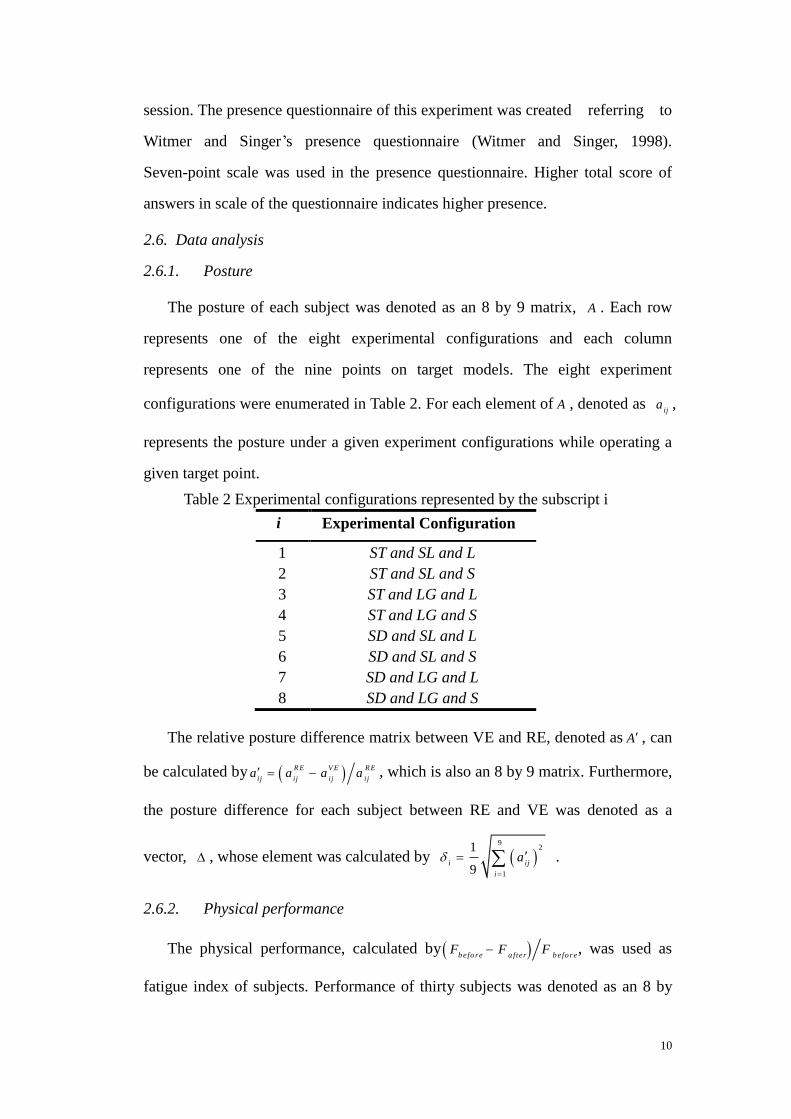
2.6. Data analysis
2.6.1. Posture
The posture of each subject was denoted as an 8 by 9 matrix, A . Each row
represents one of the eight experimental configurations and each column
represents one of the nine points on target models. The eight experiment
configurations were enumerated in Table 2. For each element of A , denoted as ij
a ,
represents the posture under a given experiment configurations while operating a
given target point.
Table 2 Experimental configurations represented by the subscript i
i Experimental Configuration
1 ST and SL and L
2 ST and SL and S
3 ST and LG and L
4 ST and LG and S
5 SD and SL and L
6 SD and SL and S
7 SD and LG and L
8 SD and LG and S
The relative posture difference matrix between VE and RE, denoted as A , can
be calculated by R E V E R E
ij ij i j i ja a a a , which is also an 8 by 9 matrix. Furthermore,
the posture difference for each subject between RE and VE was denoted as a
vector, , whose element was calculated by 9
2
1
1
9i ij
i
a
.
2.6.2. Physical performance
The physical performance, calculated by before a fter befo reF F F , was used as
fatigue index of subjects. Performance of thirty subjects was denoted as an 8 by

11
30 matrix P . Each row represents one of the eight experimental configurations
and each column represents one of the thirty subjects. For each element of P ,
denoted as ij
p , experimental configurations represented by the subscript i was
demonstrated in Table 2. Then some matrices of physical performance in a
working environment can be calculated out by categorized with different factors
(Table 3).
Table 3 The physical performance categorized with different factors
Term Calculation Description
P 8
1
1
8j ij
i
p p
The overall mean of a working
environment
SDP
4
1
1
4
SD
j ij
i
p p
The mean of standing posture tasks
STP
8
5
1
4
ST
j ij
i
p p
The mean of sitting posture tasks
LP 1 3 5 7
1
4
L
j j j j jp p p p p The mean of long duration tasks
SP 2 4 6 8
1
4
S
j j j j jp p p p p The mean of short duration tasks
LGP 3 4 7 8
1
4
LG
j j j j jp p p p p
The mean of tasks with large size
points of target model
SLP 1 2 5 6
1
4
SL
j j j j jp p p p p
The mean of tasks with small size
points of target model
Difference and relationship of physical performance were analyzed with these
results of RE and corresponding results of VE with paired t-test and linear
regression method respectively.
2.6.3. Body part discomfort
BPD method measures discomfort intensities of 12 body parts in the entire
body. For the kth
part of body, the BPD results were denoted as an 8 by 30 matrix
kB . The element of the
kB ,
ijb , represents the BPD result of the the j
th subject
under the ith
experimental configuration. Then some matrices of BPD result can be
obtained by categorized with different factors (Table 4).

12
Table 4 The BPD categorized with different factors
Term Calculation Description
kB
8
1
1
8j ij
i
b b
The overall mean of a working
environment
SD
kB
4
1
1
4
SD
j ij
i
b b
The mean of standing posture tasks
ST
kB
8
5
1
4
ST
j ij
i
b b
The mean of sitting posture tasks
L
kB 1 3 5 7
1
4
L
j j j j jb b b b b The mean of long duration tasks
S
kB 2 4 6 8
1
4
S
j j j j jb b b b b The mean of short duration tasks
LG
kB 3 4 7 8
1
4
LG
j j j j jb b b b b
The mean of tasks with large size
points of target model
SL
kB 1 2 5 6
1
4
SL
j j j j jb b b b b
The mean of tasks with small size
points of target model
For BPD data analysis, two rules were used for eliminating outlier data before
data analysis. The first rule was that the BPD scores of RE and VE less than
1-point were eliminated. 1-point is assigned as very little discomfort sensation and
0.5-point is assigned as just feel discomfort sensation in scale of BPD. Using
1-point as a threshold for filtering outlier data is helpful to decrease unstable data
of BPD. The second rule was that BPD data were eliminated when BPD scores for
a subject were all zero in RE and VE. 0-point is assigned as no discomfort
sensation in scale of BPD. Hence these kinds of data are eliminated as outlier data
is helpful to decrease interference of void data. After eliminating data, results of
27 subjects were used for analysis.
Difference and relationship of BPD were analyzed with these results of RE
and corresponding results of VE with paired t-test and linear regression method
respectively.
2.6.4. Rated perceived exertion(RPE)
RPE method was used to measure effort of subjects for performing tasks. RPE
result of thirty subjects was denoted as an 8 by 30 matrix R . The element of R ,
denoted asij
r , represented the RPE result of the jth
subject under the ith

13
experimental configuration. Then some matrices can be calculated out by
categorized with different factors in a working environment (Table 5).
Table 5 The RPE categorized with different factors
Term Calculation Description
R 8
1
1
8j ij
i
r b
The overall mean of a working
environment
SDR
4
1
1
4
SD
j ij
i
r r
The mean of standing posture tasks
STR
8
5
1
4
ST
j ij
i
r r
The mean of sitting posture tasks
LR 1 3 5 7
1
4
L
j j j j jr r r r r The mean of long duration tasks
SR 2 4 6 8
1
4
S
j j j j jr r r r r The mean of short duration tasks
LGR 3 4 7 8
1
4
LG
j j j j jr r r r r
The mean of tasks with large size
points of target model
SLR 1 2 5 6
1
4
SL
j j j j jr r r r r
The mean of tasks with small size
points of target model
Difference of RPE was analyzed with these results of RE and corresponding
results of VE with paired t-test.
Both objective and subjective evaluation results were analyzed with SPSS®
and analysis results were plotted with Sigmaplot®.
3. Results
3.1. Posture
Difference of a subject’s posture between RE and VE was denoted by an eight
by one vector , which represents posture difference under different
experimental configuration. Hence the overall posture difference of 30 subjects
was denoted as a 240 by 1 matrix 1 30
TT T
, representing all observed
value of thirty subjects. The histogram of the observed differences was plotted in
Figure 3, and an interval 5% is used to divide all the observed differences.

14
Relative d ifference of posture between R E and VE(% )
0 20 40 60 80 100
Nu
mb
er
of
ob
se
rve
d v
alu
e
0
20
40
60
80
100
120
Figure 3 Histogram of relative difference of posture between RE and VE
It was observed that 80.4% of 240 observed differences were in the interval
[0%, 5%], and 93.8% in the interval [0%,10%].
3.2. Physical performance (Fatigue)
The physical performance result of 30 subjects measured in RE was denoted
asRE
P , and that measured in VE was denoted asV E
P . The mean of RE
P , which was
calculated by 30
1
1
30 jRE RE
j
p p
, was 0.126 (s.d.=0.03795). The mean ofV E
P ,
which was calculated by30
1
1
30 jVE VE
j
p p
, was 0.147 (s.d.=0.0454). Difference
between RE
P and V E
P was tested with paired t-test, and significant difference
was found ( 3.838RE VE
t
, 0.05p ).
Furthermore RE
P and V E
P were regressed by a linear model, and result was
( 20.568R , 36.835F , 0.05p ):
ˆ ˆ0.03 0. 293 6RE VE
p p

15
The regression was shown in Figure 4.
Virtual Environment
0.00 .05 .10 .15 .20 .25 .30
Re
alistic E
nvir
on
me
nt
0.00
.05
.10
.15
.20
.25Observed
Regression
Figure 4 Regression result of the physical performance
Performance results were classified and analyzed under different experimental
configurations. All results were classified into different categories for analysis based
on three factors: working posture tasks, duration of tasks, and size of target points.
3.2.1. Working Postures Tasks: Sitting vs. Standing
In this experiment, working posture tasks consist of standing and sitting posture
tasks. Performance result of standing posture tasks, measured in RE, was denoted
as SD
REP , and that measured in VE was denoted as SD
VEP . Performance result of sitting
posture tasks, measured in RE, was denoted as was denoted as ST
REP , and that measured
in VE was denoted as ST
VEP . The descriptive information of SD
REP , SD
VEP , ST
REP , and ST
VEP was
demonstrated in Table 6.
Table 6 The descriptive information of SD
REP , SD
VEP , ST
REP , and ST
VEP
Working Posture Task Performance Mean Std Deviation
Standing Tasks SD
REP 0.123 0.03782
16
SD
VEP 0.151 0.05599
Sitting Tasks
ST
REP 0.129 0.04375
ST
VEP 0.144 0.04003
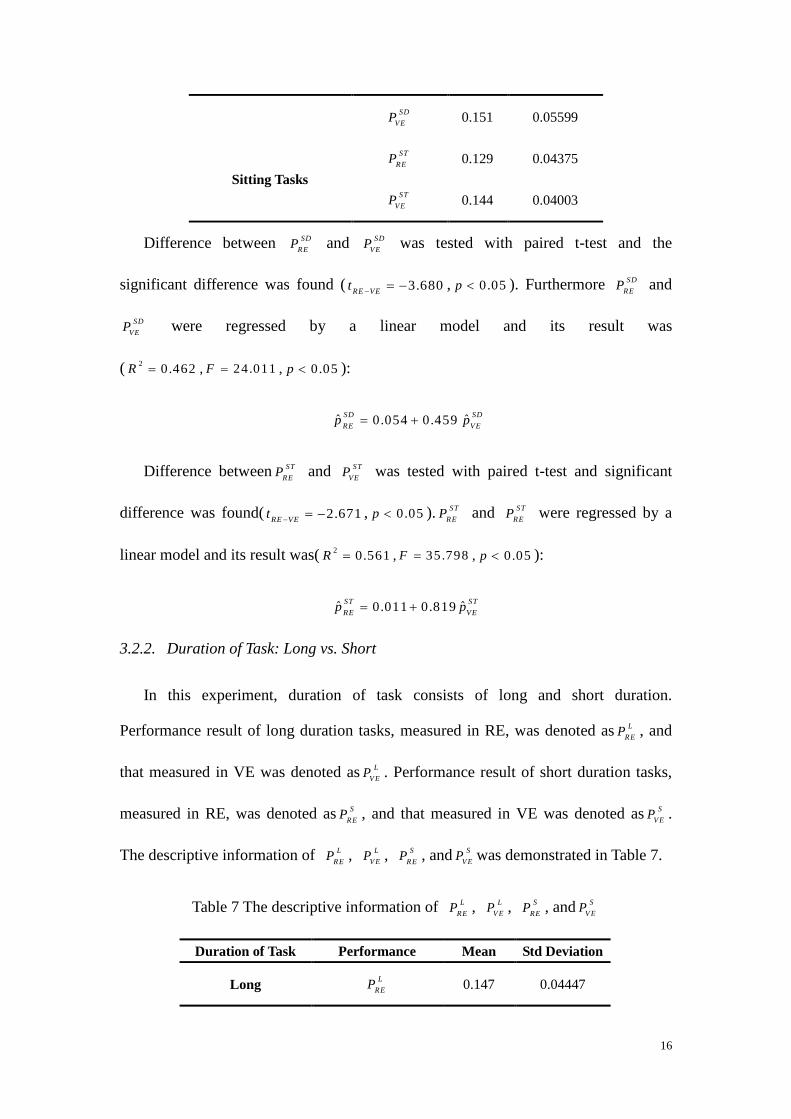
Difference between SD
REP and SD
VEP was tested with paired t-test and the
significant difference was found ( 3.680RE VE
t
, 0.05p ). Furthermore SD
REP and
SD
VEP were regressed by a linear model and its result was
( 20.462R , 24.011F , 0.05p ):
ˆ ˆ0.054 0.459 SD SD
RE VEp p
Difference between ST
REP and ST
VEP was tested with paired t-test and significant
difference was found( 2.671RE VE
t
, 0.05p ). ST
REP and ST
REP were regressed by a
linear model and its result was( 20.561R , 35.798F , 0.05p ):
0.011 0.8 ˆ19ˆST ST
RE VEp p
3.2.2. Duration of Task: Long vs. Short
In this experiment, duration of task consists of long and short duration.
Performance result of long duration tasks, measured in RE, was denoted as L
REP , and
that measured in VE was denoted as L
V EP . Performance result of short duration tasks,
measured in RE, was denoted as S
REP , and that measured in VE was denoted as S
V EP .
The descriptive information of L
REP , L
V EP , S
REP , and S
V EP was demonstrated in Table 7.
Table 7 The descriptive information of L
REP , L
V EP , S
REP , and S
V EP
Duration of Task Performance Mean Std Deviation
Long L
REP 0.147 0.04447

17
L
V EP 0.174 0.05697
Short
S
REP 0.105 0.03653
S
V EP 0.121 0.03947
Difference between L
REP and L
V EP was tested with paired t-test and the significant
difference was found ( 3.376RE VE
t
, 0.05p ). Furthermore L
REP and L
V EP were
regressed by a linear model and its result was ( 20.450R , 22.901F , 0.05p ):
ˆ ˆ0.056 0.524 L L
RE VEp p
Difference between S
REP and S
V EP was tested with paired t-test and significant was
found ( 2.665RE VE
t
, 0.05p ). S
REP and S
V EP were regressed by a linear model and
its result was( 20.404R , 18.965F , 0.05p ):
0.034 0.5 8 ˆ ˆ 8S S
RE VEp p
3.2.3. Size of the target points: Large vs. Small
In this experiment, size of target points consists of large and small target points.
The performance of large target points tasks measured in RE was denoted as LG
REP , and
that measured in VE was denoted as LG
VEP . The performance of small target points tasks
measured in RE was denoted as SL
R EP , and that measured in VE was denoted as SL
V EP .
The descriptive information of LG
REP , LG
VEP , SL
R EP , and SL
V EP was demonstrated in Table
8.
Table 8 The descriptive information of LG
REP , LG
VEP , SL
R EP , and SL
V EP
Size of target points Performance Mean Std Deviation
Large LG
REP 0.125 0.04543

18
LG
VEP 0.149 0.05140
Small
SL
R EP 0.127 0.03648
SL
V EP 0.145 0.04233
Difference of LG
REP and LG
VEP was tested with paired t-test and significant
difference was found ( 3.528RE VE
t
, 0.05p ). Furthermore LG
REP and LG
VEP
were regressed by a linear model and its result was
( 20.504R , 28.421F , 0.05p ):
0.032 0.62 ˆ7 ˆLG LG
RE VEp p
Difference of SL
R EP and SL
V EP was tested with paired t-test and significant
difference was found ( 3.197RE VE
t
, 0.05p ). SL
R EP and SL
V EP were regressed
by linear model and its result was( 20.465R , 24.367F , 0.05p ):
ˆ ˆ0.041 0.588 SL SL
RE VEp p
3.3. Body part discomfort
Discomfort of forearms, the upper arms, the shoulders, and neck was reported
by subjects in this experiment. However, only significant correlation of forearms
between RE and VE was found.
For forearms, BPD result of thirty subjects was denoted as B . These BPD
results of B were filtered according to eliminating rules mentioned above, and
remained 27 elements of B were used for analysis. The BPD result of forearms,
measured in RE, was denoted asRE
B , and that measured in VE was denoted asVE
B .
The mean of RE
B was 2.242 (s.d.=1.285), and the mean of VE
B was 3.290
(s.d.=1.070). Paired T-test was used for testing difference of RE
B andVE
B , and

19
their difference was significant ( 5.932RE VE
t
, 0.05p ). RE
B and VE
B were
regressed by a linear model, and the regression result was
( 20.506R , 25.561F , 0.05p ):
ˆ ˆ0.567 0.854 RE VE
b b
The result was shown in Figure 5.
Virtual Environment
0 1 2 3 4 5 6 7
Realistic E
nvir
on
men
t
0
1
2
3
4
5Observed
Regression
Figure 5 The regression result of RE
B and VE
B
BPD results of forearms were classified and analyzed by different experimental
configurations. All results were classified into different categories for analysis based
on three factors: working posture tasks, duration of tasks, and size of target points.
3.3.1. Working posture: Standing vs. Sitting
In factors of this experiment, working posture tasks consist of sitting and standing
posture tasks. For forearms, The BPD result of standing posture, measured in RE, was
denoted as SD
REB , and that measured in VE was denoted as SD
VEB . The BPD result of
sitting posture tasks, measured in RE, was denoted as ST
REB , and that measured in VE

20
was denoted as ST
VEB .
Observed value of SD
REB , SD
VEB , ST
REB ,and ST
VEB was filtered by two rules and 27
elements of each matrix was remained for analysis. The descriptive information of
SD
REB , SD
VEB , ST
REB ,and ST
VEB was demonstrated in Table 9.
Table 9 The descriptive information of SD
REB , SD
VEB , ST
REB ,and ST
VEB
Working Posture Tasks BPD Mean Std Deviation
Standing tasks
SD
REB 2.139 1.168
SD
VEB 3.301 1.339
Sitting tasks
ST
REB 2.353 1.621
ST
VEB 3.273 1.045
Paired T-test was performed for finding difference of SD
REB and SD
VEB . Significant
difference was found between them ( 5.266RE VE
t
, 0.05p ). Furthermore linear
regression method was used for SD
REB and SD
VEB with the linear model. The regression
result was ( 20.347R , 13.280F , 0.05p ):
ˆ ˆ0.442 0.514 SD SD
RE VEb b
Paired T-test was performed for testing difference of ST
REB and ST
VEB . Significant
difference was found for them ( 4.145RE VE
t
, 0.05p ). Furthermore regression
method was used for ST
REB and ST
VEB with linear model. The regression result was
( 20.485R , 23.529F , 0.05p ):
ˆ ˆ1.194 1.081ST ST
RE VEb b
3.3.2. Duration of Tasks: Long vs. Short

21
In factors of this experiment, task duration consist of long duration and short
duration. For right forearm, the BPD result of long duration tasks, measured in RE,
was denoted as L
R EB , and that measured in VE was denoted as L
VEB . The BPD result of
short duration tasks, measured in RE, was denoted as S
R EB , and that measured in VE
was denoted as S
VEB . Observed data of L
R EB , L
VEB , S
R EB , and S
VEB were filtered by two
eliminating rules mentioned above, and 27 data of each matrix were remained for
analysis. The descriptive information of L
R EB , L
VEB , S
R EB , and S
VEB was demonstrated
in Table 10.
Table 10 The descriptive information of L
R EB , L
VEB , S
R EB , and S
VEB
Duration of Tasks BPD Mean Std Deviation
Long
L
R EB 2.657 1.420
L
VEB 3.745 1.251
Short
S
R EB 1.798 1.264
S
VEB 2.889 1.012
Difference between L
R EB and L
VEB was tested with paired t-test. Their difference
was significant ( 5.071RE VE
t
, 0.05p ). Furthermore L
R EB and L
VEB were
regressed with linear model, and the result was ( 20.433R , 19.108F , 0.05p ):
ˆ ˆ1.39 0.747 L L
RE VEb b
In addition, difference between S
R EB and S
VEB was tested with paired t-test and its
result was significant ( 5.990RE VE
t
, 0.05p ). Furthermore S
R EB and S
VEB were
regressed with linear model and the result was ( 20.473R , 21.499F , 0.05p ):
ˆ ˆ0.683 0.859 S S
RE VEb b
3.3.3. Size of target points: Large vs. Small

22
In factors of this experiment, size of target points consists of large point and small
point. For right forearm, the BPD result of large point tasks, measured in RE, was
denoted as LG
REB , and that measured in VE was denoted as LG
VEB . The BPD result of
small point tasks, measured in RE, was denoted as SL
R EB , and that measured in VE was
denoted as SL
V EB . Observed data of LG
REB , LG
VEB , SL
R EB , and SL
V EB were filtered by two
eliminating rules mentioned above, and 27 data of each matrix were remained for
analysis. The descriptive information of LG
REB , LG
VEB , SL
R EB , and SL
V EB was demonstrated
in Table 11.
Table 11 The descriptive information of LG
REB , LG
VEB , SL
R EB , and SL
V EB
Size of target points BPD Mean Std Deviation
Large
LG
REB 2.066 1.238
LG
VEB 3.241 1.032
Small
SL
R EB 2.416 1.465
SL
V EB 3.333 1.218
Paired t-test was performed for difference between LG
REB and LG
VEB , and its result
was significant ( 6.103RE VE
t
, 0.05p ). Furthermore LG
REB and LG
VEB were
regressed with linear model and the result was ( 20.391R , 16.066F , 0.05p ):
ˆ ˆ0.364 0.750 LG LG
RE VEb b
In addition, difference between SL
R EB and SL
V EB was tested with paired t-test. The
result was significant ( 4.937RE VE
t
, 0.05p ). Furthermore SL
R EB and SL
V EB
were regressed with linear model. The result was ( 20.571R , 33.304F , 0.05p ):
ˆ ˆ0.614 0.909 SL SL
RE VEb b

23
3.4. Rated perceiving exertion(RPE)
The result of RPE measured in RE was denoted as RE
R , and that measured in VE
was denoted as VE
R . The mean of RE
R was 11.729 (s.d.=1.778), and the mean ofVE
R
was 14.375 (s.d.=1.580). The difference between RE
R and VE
R was tested and the
result was different significantly ( 6.345RE VE
t
, 0.05p ).
Significant difference of RPE between RE and VE were also found in different
experimental configurations based on three factors: working posture tasks, duration of
tasks, and size of target points (Table 12).
Table 12 Descriptive information of RPE
Factor Levels RE VE RE VEt
Working posture task SD 11.683(1.925) 14.575(1.674) -6.490
**
ST 11.775(1.890) 14.283(1.748) -6.088**
Duration of task L 12.375(2.037) 15.075(1.652) -7.140
**
S 11.083(1.780) 13.783(1.606) -5.648**
Size of target points LG 11.633(1.912) 14.258(1.568) -6.058
**
SL 11.818(1.848) 14.600(1.636) -6.728**
Note: () is standard deviation, ** represents p <0.05
In addition, experimental factor of duration tasks had effect on RPE. The mean of
RPE with long duration tasks, denoted as LR , was 13.680 (s.d.=1.599), and the mean
of RPE with short duration tasks, denoted as SR was 12.409 (s.d.=1.068). Their
difference was significant ( 5.871L S
t
, 0.05p ). However, for the factor of working
posture task, difference of RPE between STR and SD
R was not significant
( 0.268ST SD
t
, 0.791p ). For the factor of size of target points, difference of RPE
between LGR and SL
R was not significant ( 1.622LG SL
t
, 0.116p ).
4. Discussion
In our experiment, different aspects of the same manual handling operations were

24
evaluated using different evaluation methods both in RE and VE sessions. Posture and
physical fatigue were used to evaluate the physical tasks objectively, while RPE and
BPD were used to assess the tasks subjectively. Comparisons between these
evaluations were made to check the availability of those evaluation methods in VE.
Slight differences were found in postures under different working environment,
since 80.4% of the 240 observed differences were less than 5%. In this experiment,
there were no restrict to limiting posture of subjects while performing tasks. In
conventional ergonomics posture assessment methods, the flexible range of joints was
divided into several segments. For examples, the total flexible range (360°) of elbow
is divided into eight intervals in posture targeting method (Corlett, Madeley et al.,
1979) . RULA and REBA divide the movement range of the forearm into two
intervals: less than 60°and more than 100°, 60°- 100 ° (McAtamney and Nigel
Corlett, 1993; Hignett and McAtamney, 2000). According to conventional posture
assessment methods, postures of RE and VE can be treated as postures with same
effect to people. While integrating posture-based evaluation methods in VE, the slight
difference between VE and RE might not generate great differences while evaluating
the postures. We think that it is feasible to use conventional observation methods in
VE to evaluate physical tasks and almost the same evaluation results can be obtained
in VE as in RE.
Significant differences were found in physical performances, BPD, and RPE
evaluation results under difference environments. As shown in the all regression
results of BPD, results in VE were greater than that in RE. These results indicated that
subjects felt more discomfort in forearm in VE than in RE while performing the same
tasks. In addition, the regression results of performance also indicated that subjects
felt more fatigue in VE than RE. Moreover, RPE results give supports to the results of
BPD and performance. RPE results indicated that more effort was required in VE than
RE for same tasks. In addition, experimental factor of duration tasks had effect on
RPE. The mean of RPE with long duration tasks (four loops) was higher than that
with short duration tasks, and their difference was significant. This result indicates

25
that long duration tasks require more effort than short duration tasks given by
subjects.
In this experiment, subjects reported their sensation of presence in VE by presence
questionnaire. The C ronbach of the presence questionnaire was 0.815, and the mean
of presence was 4.01 (s.d.=0.62) in the experiment. The result indicated that the VE
could only provide an acceptable level of presence, but not immersive enough to
replace the RE. Under ideal conditions, VR should provide 100% fidelity to subjects
with immersive scenarios in VE as RE. However it is difficult to achieve 100%
fidelity because of technical limitations, and these differences might generate
influences on human’s performance in VE.
ACT-R theory is used to analyze difference of evaluation results between RE and
VE. An assembling task often consists of positioning, reaching, adjusting accurately,
and hitting operations and it requires perception and manual action. An assembling
task is processed by visual module and manual module of the mind according to
ACT-R theory. The cognitive model of ACT-R theory divides generally the cognitive
processing unit into three main parts: a visual module, a manual module, and a
processing unit (Anderson, Bothell et al., 2004). The visual module estimates the
position of the object and sends related information to processing unit of the mind.
The processing unit selects an appropriate way and sends it to the manual module.
Processing unit can select the most optimum way in RE because of practical
experiences. It spends less time and generates less workload of people to accomplish
operations. However, it is different when people recognize and estimate the position
of a virtual object in VE. Because the perspective of visual scenes and position of
viewpoint is different from that in RE, participant cannot determine the distance of
virtual objects in VE accurately based on their experience of RE. Some researches
indicated that subjects cannot determine the distance to them of an object accurately
in VE with their experience of the RE (Arthur, Hancock et al., 1997; Witmer and
Kline, 1998; Keyson, 2000; Armbrüster, Wolter et al., 2008). Then the procedure of
coming from visual module to processing unit, then to manual module is required to

26
repeat many times while subjects are performing their tasks in VE. The misestimation
of the distance results in that subjects have to try and trail during their reaching,
accurate adjusting, and hitting operations. Therefore, performing the same tasks
requires additional effort in VE because of cognitive limitation in VE, and
consequently causes more additional discomfort and fatigue. Furthermore, as
observed in the experiment, subjects spent more time to finish a task in VE than RE.
Although significant differences were found in evaluation methods, linear
regression method was used to assess the relationship between RE and VE as well,
since it is believed that great linear correlation might be found when 100% fidelity
could be provided in VE. After linear regression, R2 in BPD and physical performance
were 0.347 and 0.571, respectively. Based on the current technical specifications of
the VR system, only with limited visual feedback, the regressed result indicates that
evaluation in VE and RE was fairly related. Although the found linear regression
results were not good enough, we could also state that certain relationship could be
found if further technical improvements can be done in our future research work.
There are several technical limitations in this experiment. First, the presence
provided by the VR simulation system is not good enough, and only acceptable
presence was provided by the VR system. In addition, other feedbacks except visual
feedback have not been involved in VE. Second, only a specific task was tested in our
current research, and some other typical tasks have not been tested in our experiment.
Third, subjects were not trained to how to use the VR devices for long time in this
experiment, and their not enough acquaintance of VR devices might have effect on
the accuracy of results.
5. Conclusion and Perspectives
In this experiment, the relationship and difference of subjective and objective
evaluation results between RE and VE were analyzed for same tasks. Slight
difference in postures engaged in manual handling operations was found, but those
differences might not influence the evaluation results using posture-based

27
evaluation methods. Significant differences were found both in objective (physical
performance) and subjective evaluation methods (RPE and BPD). Results of BPD
and performance in VE are greater than in RE for performing the same tasks
partially due to extra cognitive efforts in VE. Furthermore, subjects felt more
discomfort and fatigue in VE than RE. In spite of these differences, relationships of
BPD and physical performance between VE and RE are analyzed with linear
regression method. Correlations of BPD between RE and VE were found, for BPD
and physical performance respectively, indicating that certain relationship might
exist in evaluation results between RE and VE.
In our future work, multimodal feedbacks (e.g. audio, tactile) will be involved in
the experiment to increase the presence in VE. Different evaluation methods will be
carried out for the same tasks in VE in order to find out the trend of the correlation
in evaluation results between VE and RE.
Acknowledge
The authors would like to acknowledge to the financial support form the National
Natural Science Foundation under grand number 5020514, and from European
Aeronautic Defense and Space (EADS). The project was carried out through
collaboration between Tsinghua University and ECN promoted by Région des Pays de
la Loire.

28
References
Anderson, J. R., D. Bothell, et al. (2004). "An integrated theory of Mind." Psychological Review III:
1036-1060.
Armbrüster, C., M. Wolter, et al. (2008). "Depth Perception in Virtual Reality: Distance Estimations in
Peri- and Extrapersonal Space." CyberPsychology & Behavior 11(1): 9-15.
Arthur, E. J., P. A. Hancock, et al. (1997). "The perception of spatial layout in real and virtual worlds."
Ergonomics 40(1): 69-77.
Bao, S., N. Howard, et al. (2007). "Two posture analysis approaches and their application in a modified
Rapid Upper Limb Assessment evaluation." Ergonomics 50(12): 2118 - 2136.
Buck, M. (1998). Immersive user Iinteraction within Industrial virtual environment. Virtual Reality for
Industrial Applications Berlin, Springer-Verlag: 39-60.
Buckle, P. and J. Devereux (1999). Work related neck and upper limb musculoskeletal disorders.
Luxembourg, European agency for safety and health at work.: 119.
Chaffin, D. B. and M. Erig (1991). "Three-dimensional biomechanical static strength prediction model
sensitivity to postural and anthropometric inaccuracies." IIE Transactions 22(3): 215-227.
Chaffin, D. B., C. Nelson, et al. (2001). Digital Human Modeling for Vehicle and Workplace Design,
SAE International
Corlett, E. N. and R. Bishop (1976). "A technique for assessing postural discomfort." Ergonomics 19(2):
175 -182.
Corlett, E. N., S. J. Madeley, et al. (1979). "Posture Targeting: A Technique for Recording Working
Postures." Ergonomics 22(3): 357-366.
Garcin, M., J.-F. Vautier, et al. (1998). "Ratings of perceived exertion (RPE) during cycling exercises at
constant power output." Ergonomics 41(10): 1500 - 1509.
Hignett, S. and L. McAtamney (2000). "Rapid Entire Body Assessment (REBA)." Applied Ergonomics
31(2): 201-205.
Hu, B., Y. Wang, et al. (2008). "Development and Implementation of a Human Scale Motion
Simulation System with Multimodal Feedback." Journal of system simulation 20(supplement 1):
280-284.
Jayaram, U., S. Jayaram, et al. (2006). "Introducing quantitative analysis methods into virtual

29
environments for real-time and continuous ergonomic evaluations." Computers in industry 57(3):
283-296.
Keyson, D. V. (2000). "Estimation of Virtually Perceived Length." Presence: Teleoperators & Virtual
Environments 9(4): 394-398.
Kim, K. H., B. J. Martin, et al. (2004). "Modelling of shoulder and torso perception of effort in manual
transfer tasks." Ergonomics 47(9): 927 - 944.
Li, G. and P. Buckle (1999). "Current techniques for assessing physical exposure to work-related
musculoskeletal risks, with emphasis on posture-based methods." Ergonomics 42(5): 674-695.
Lowe, B. D. (2004). "Accuracy and validity of observational estimates of shoulder and elbow posture."
Applied Ergonomics 35(2): 159-171.
McAtamney, L. and E. N. Corlett (1993). "RULA: A survey method for the investigation of
work-related upper limb disorders." Applied Ergonomics 24(2): 91-99.
McAtamney, L. and E. Nigel Corlett (1993). "RULA: a survey method for the investigation of
work-related upper limb disorders." Applied Ergonomics 24(2): 91-99.
NationalResearchCouncil/InstituteofMedicine (2001). Musculoskeletal Disorders and the
Workplace—Low Back and Upper Extremities Washington., National Research Council/Institute of
Medicine.
Pheasant, S. (1999). Body space: Anthropometry, Ergonomics and the Design of Work. Philadelphia,
Taylor & Francis
Scott, G. B. and N. R. Lambe (1996). "Working practices in a perchery system, using the OVAKO
Working posture Analysing System (OWAS)." Applied Ergonomics 27(4): 281-284.
Vøllestad, N. K. (1997). "Measurement of human muscle fatigue." Journal of Neuroscience Methods
74(2): 219-227.
Wang, Y., K.-b. Liao, et al. (2007). "Development and Application of Integrated Human Machine
Interaction Simulation System." Journal of system simulation 19(11): 2492-2495.
Whitman, L., M. Jorgensen, et al. (2004). Virtual reality: its usefulness for ergonomic analysis, Winter
Simulation Conference.
Witmer, B. G. and P. B. Kline (1998). "Judging Perceived and Traversed Distance in Virtual
Environments." Presence: Teleoperators & Virtual Environments 7(2): 144-167.
Witmer, B. G. and M. Singer (1998). "Measuring Presence in Virtual Environments: A Presence

30
Questionnaire." Presence: Teleoperators & Virtual Environments 7(3): 225-240.
Yuan, C.-K. and C.-L. Kuo (2006). "Influence of hand grenade weight, shape and diameter on
performance and subjective handling properties in relations to ergonomic design considerations."
Applied Ergonomics 37(2): 113-118.
Copyright © 2022 FDOKUMEN