Can fossil bones and teeth be dated using fission track analysis?
19
Can fossil bones and teeth be dated using fission track analysis? M. Jolivet a, ⁎ , A.-E. Lebatard b , J.-L. Reyss c , D. Bourlès d , H.T. Mackaye e , F. Lihoreau e , P. Vignaud b , M. Brunet b a Laboratoire Géosciences Montpellier, UMR CNRS 5573 Université Montpellier II, France b Laboratoire de Géobiologie, Biochronologie et Paléontologie Humaine, UMR CNRS 6046, Université de Poitiers, France c Laboratoire des Sciences du Climat et de l'Environnement, UMR CNRS-CEA 1572, Gif sur Yvette, France d C.E.R.E.G.E., UMR CNRS—Université Paul Sézanne, Aix en Provence, France e Département de Paléontologie, Université N'Djamena, N'Djamena, Chad Received 13 June 2007; received in revised form 5 September 2007; accepted 5 October 2007 Editor: B. Bourdon Abstract The high proportion of crystallized apatite forming the bones and teeth should theoretically allow the use of fission track analysis to date vertebrate fossils when burying of the fossiliferous series did not subject them to temperatures exceeding 60 °C. However several major obstacles arise such as the complexity of fossils' internal structures, diagenetic modifications and substitutions of the hydroxyapatite by other minerals, and massive U uptake or loss during diagenesis. In this work, those various problems are addressed combining optical microscope observation of the fossils, a systematic fission track analysis of the best samples, α and γ spectrometry and Secondary Ion Mass Spectrometry. Even if the problems caused by internal structures and mineral substitutions can be solved, U movements in and out of the fossils are generally too complex to allow fission track analysis dating of the fossils. © 2007 Elsevier B.V. All rights reserved. Keywords: Uranium series; Fission track analysis; Fossils; Diagenesis 1. Introduction Fission track analysis (FTA) is a low temperature thermochronology method largely used to study geo- logical processes such as relief building, erosion, sedimentation or tectonic movements (e.g. Gleadow and Brown, 2000; Jolivet et al., 2001, 2007; Sobel et al., 2006). Although minerals like zircon and titanite are sometimes analysed using FTA (e.g. Tagami et al., 1996; Tagami and Shimada, 1996; Dahl, 1997; Coyle and Wagner, 1998; Jolivet et al., 2001), the method is mostly applied on apatite. Fission tracks are intra-crystalline defects produced by radiation damages following the spontaneous nuclear fission of 238 U atoms. Through time those damages are progressively annealed with a rate depending upon the chemical composition of the mineral and the tempera- ture (e.g. Green et al., 1986; O'Sullivan and Parrish, 1995; Barbarand et al., 2003). In apatite, for tempera- tures lower than ca. 110 °C, annealing rates become sufficiently low so that fission tracks remain in the Available online at www.sciencedirect.com Chemical Geology 247 (2008) 81 – 99 www.elsevier.com/locate/chemgeo ⁎ Corresponding author. Tel.: +33 4 67 14 37 00; fax: +33 4 67 14 36 42. E-mail address: [email protected] (M. Jolivet). 0009-2541/$ - see front matter © 2007 Elsevier B.V. All rights reserved. doi:10.1016/j.chemgeo.2007.10.009
Transcript of Can fossil bones and teeth be dated using fission track analysis?

Available online at www.sciencedirect.com
7 (2008) 81–99www.elsevier.com/locate/chemgeo
Chemical Geology 24
Can fossil bones and teeth be dated using fission track analysis?
M. Jolivet a,⁎, A.-E. Lebatard b, J.-L. Reyss c, D. Bourlès d, H.T. Mackaye e,F. Lihoreau e, P. Vignaud b, M. Brunet b
a Laboratoire Géosciences Montpellier, UMR CNRS 5573 Université Montpellier II, Franceb Laboratoire de Géobiologie, Biochronologie et Paléontologie Humaine, UMR CNRS 6046, Université de Poitiers, France
c Laboratoire des Sciences du Climat et de l'Environnement, UMR CNRS-CEA 1572, Gif sur Yvette, Franced C.E.R.E.G.E., UMR CNRS—Université Paul Sézanne, Aix en Provence, France
e Département de Paléontologie, Université N'Djamena, N'Djamena, Chad
Received 13 June 2007; received in revised form 5 September 2007; accepted 5 October 2007
Editor: B. Bourdon
Abstract
The high proportion of crystallized apatite forming the bones and teeth should theoretically allow the use of fission trackanalysis to date vertebrate fossils when burying of the fossiliferous series did not subject them to temperatures exceeding 60 °C.However several major obstacles arise such as the complexity of fossils' internal structures, diagenetic modifications andsubstitutions of the hydroxyapatite by other minerals, and massive U uptake or loss during diagenesis. In this work, those variousproblems are addressed combining optical microscope observation of the fossils, a systematic fission track analysis of the bestsamples, α and γ spectrometry and Secondary Ion Mass Spectrometry. Even if the problems caused by internal structures andmineral substitutions can be solved, U movements in and out of the fossils are generally too complex to allow fission track analysisdating of the fossils.© 2007 Elsevier B.V. All rights reserved.
Keywords: Uranium series; Fission track analysis; Fossils; Diagenesis
1. Introduction
Fission track analysis (FTA) is a low temperaturethermochronology method largely used to study geo-logical processes such as relief building, erosion,sedimentation or tectonic movements (e.g. Gleadowand Brown, 2000; Jolivet et al., 2001, 2007; Sobel et al.,2006). Although minerals like zircon and titanite aresometimes analysed using FTA (e.g. Tagami et al.,
⁎ Corresponding author. Tel.: +33 4 67 14 37 00; fax: +33 4 67 14 36 42.E-mail address: [email protected] (M. Jolivet).
0009-2541/$ - see front matter © 2007 Elsevier B.V. All rights reserved.doi:10.1016/j.chemgeo.2007.10.009
1996; Tagami and Shimada, 1996; Dahl, 1997; Coyleand Wagner, 1998; Jolivet et al., 2001), the method ismostly applied on apatite.
Fission tracks are intra-crystalline defects producedby radiation damages following the spontaneous nuclearfission of 238U atoms. Through time those damages areprogressively annealed with a rate depending upon thechemical composition of the mineral and the tempera-ture (e.g. Green et al., 1986; O'Sullivan and Parrish,1995; Barbarand et al., 2003). In apatite, for tempera-tures lower than ca. 110 °C, annealing rates becomesufficiently low so that fission tracks remain in the

82 M. Jolivet et al. / Chemical Geology 247 (2008) 81–99
crystal during geologically significant periods. Below60 °C, annealing rates are so slow that they have noeffect on the fission tracks at geological time scales(Green et al., 1986).
Bones are formed by 70% of phosphatic mineralsassociated with organic material. The mineral fraction ismainly hydroxyapatite that forms sub-micrometriccrystals or fibres (Michel et al., 1997; Pfretzschner,2004). Teeth dentine presents an open porosity andchemical composition similar to those of the bones butgenerally the mineral fraction is slightly higher. Teethenamel is also composed of hydroxyapatite but with ahigher degree of crystallinity and only about 2% oforganic material (Michel et al., 1997 and referencestherein). This high proportion of crystallized apatiteshould allow the use of FTA to determine the age offossil bones and teeth when burying of the fossiliferous
Fig. 1. Fragment of Proboscidean tooth from Chad (sample KB3-10 fromdiagenetic oxides. Diagenetic minerals are present both in mechanical fractuallow the fluids present in the external environment to circulate inside the fo
series did not subject them to temperatures exceeding60 °C.
Sachs et al. (1980) applied FTA to conodont fossils.They concluded that the method could be relevant butbecause of the low U concentration in their fossils (lessthan 1 ppm), the results were not accurate. Modernbones and teeth usually contain a few ppb of U (Iyengaret al., 1978) which is too low to apply the FTA methodeven on very old (several 100 Ma) samples. But buriedbones and teeth have the ability to take up large amountsof U (up to several hundreds of ppm) from theirsurrounding environment (e.g. Millard and Hedges,1996; Pike et al., 2002; Van Calsteren and Thomas,2006). This process of U uptake through time can befurther complicated by periods of U loss caused byvariations in the environmental parameters (e.g. Raeet al., 1989; Hoffmann and Mangini, 2003).
Mio-Pliocene of Kossom Bougoudi), showing a high proportion ofres (Frac.) and within internal structures such as the Tomes canals thatssil.

Fig. 2. Examples of prismatic (A) and aprismatic (B) enamel. Prismatic enamel (Bovid tooth from the Late Miocene Toros-Menalla site (TM 266) inChad) is especially characterized by the occurrence of the Tomes canals (small black lines and dots on the expanded image) which haveapproximately the same size as the fission tracks and thus prevent any rigorous fission track analysis. Aprismatic enamel (Actinopterygian scale,Cenomanian, Morocco) appears to be a much better material for fission track analysis as it does not display any apparent internal structures.
83M. Jolivet et al. / Chemical Geology 247 (2008) 81–99
Millard and Hedges (1996) proposed a Diffusion–Adsorption model to describe the uptake of U in bones.Under oxic conditions, complexes of the uranyl ion(UO2
2+) diffuse into the bone porous structure and areadsorbed onto the internal surface area of the mineral
fraction. This leads to U concentration decreasing fromthe edge of the bone towards the inside creating a Èshaped “concentration profile”. When the bone reachesequilibrium, the concentration is similar all over thestructure. However, this model is only valid for a short

84 M. Jolivet et al. / Chemical Geology 247 (2008) 81–99
period of time after burial and certainly not over millionsof years (Millard and Hedges, 1996). It is widely usedfor TIMS, Laser ablation ICP-MS and ESR dating ofarcheological bones (e.g. Pike and Hedges, 2001; Pikeet al., 2002; Eggins et al., 2003; Hoffmann and Mangini,2003; Van Calsteren and Thomas, 2006 and referencestherein).
The application of FTA on fossils relies on the factthat all the U present within the fossils is incorporatedduring early diagenetic processes, i.e. within a period oftime negligible compared to the age of the sample. If thisis usually the case for young samples (Millard andHedges, 1996; Michel et al., 1999) or for samples with avery simple diagenetic history, fossils may alsoincorporate or lose U during late diagenetic events.Only in the first case the FTA age will be close to thestratigraphic age of the fossil.
In this paper we address the feasibility of FTA onbiogenic fossil apatite paying a particular attention tothree major obstacles:
– Occurrence of internal structures within the samples:minerals analysed by FTA must be etched to revealthe fission tracks (e.g. Hurford and Green, 1983). Inthe case of fossils, etching also reveals the micrograinboundaries and other internal structures, potentiallyblackening the sample and hiding the fission tracks(Sachs et al., 1980).
– During diagenesis, and especially during earlydiagenesis, new mineral phases such as quartz,calcite and oxide will develop inside the fossil (e.g.Sharma et al., 1981), either dramatically decreasingthe amount of apatite in the sample or, for the oxides,hiding the possible occurrence of fission tracks(Fig. 1).
– Finally, as said before U is usually massivelyincorporated (and sometimes lost) during diagenesis.It is thus important to understand the long termevolution (several Ma) of the U concentration in thefossil as well as its relations with the diageneticminerals.
2. Methodology
In order to select the best type of fossils to be used forFTA, a large range of samples such as fish, reptiles andmammal bones and teeth were tested. Those samplesrepresent a large range of deposition ages andfossilization environments. They were provided by theFrench National Museum of Natural History (MNHNF)and the Mission Paléontologique Franco-Tchadienne(MPFT).
Observation of spontaneous fission tracks withinapatite requires revealing the latent tracks by etchingusing a 6.5% HNO3 solution (Hurford and Green,1983). However other structures inside the crystal(cracks, inclusions, etc.) are also etched. Artificiallyenhanced internal structures of bones and teeth (e.g.Tomes canals, Haversian canals and microcrystallitejoints) may thus be a major problem for fission trackobservations (Sachs et al., 1980). To assess thisproblem, we compared bones, dentine, prismatic enamel(fibrous structure) and aprismatic enamel (no apparentstructure) (Fig. 2).
The effect of diagenesis on the occurrence of fissiontracks was tested using the largely diageneticallymodified Mio-Pliocene samples from the Chad basin(Brunet et al., 2005 and references therein). Thesesamples set includes teeth, bones osteodermis and scalesof fish (Siluriformes), reptiles (ex: Crocodylidae) andmammalians (Proboscidea, Anthracotheriidae, etc.).Most samples are black or dark brown due to a largeconcentration of diagenetic oxides and they have beenlargely silicified during diagenesis. Stratigraphic agesvary from ca.7 Ma in Toros-Ménalla (TM) to 5.5–4.5 Ma in Kossom Bougoudi (KB), 5–4 Ma in Kollé(KL) and 3.5–3 Ma in Koro Toro (KT) (Fig. 3). Apreliminary γ spectrometry study showed mean Uconcentration of more than 100 ppm for the Chadiansamples, much higher than the usual concentrationfound in modern bones and teeth (e.g. Iyengar et al.,1978). This, together with the large amount of oxidesand silica within the samples, implies strong diageneticprocesses (Fig. 1).
U concentrations within various discrete areas of thefossils were calculated from induced fission trackcounting. To allow an independent control on theresults, they were compared to U and Th meanconcentration obtained by α and γ spectrometry and toprecise maps of U and Th distribution obtained usingSecondary Ion Mass Spectrometry (SIMS). Further-more, Ca, P, K, Al, Si and Mn distribution mapsobtained by SIMS were used to evaluate the intensity ofthe diagenetic processes.
3. Sample preparation
3.1. Fission track analysis
Samples were cut along transverse and longitudinalsections to allow observation of the various internalstructures. For some of the fossils, small fragments withvarious orientations were also used. Polished thinsections, about 50 μm thick were made and analysed

Fig. 3. Schematic structural and geological map of Chad with localization of the Mio-Pliocene fossiliferous area (map modified from Kusnir andMoutaye, 1997).
85M. Jolivet et al. / Chemical Geology 247 (2008) 81–99
in transmitted, reflected and polarized light on a ZeissAxioplan II optical microscope.
Preparation of the samples for FTA mostly followsthe methodology described in Hurford and Green (1983)and Hurford (1990). Samples were etched in 6.5%HNO3 for 45 s at 20 °C to reveal the spontaneous fission
tracks. Etching also revealed the internal structures ofthe fossils which most of the time blacken the surface ofthe sample impeding microscopic observation (Fig. 4).To partially solve that problem without erasing thepotential fission tracks, 1 μm of material was removedfrom the surface using 0.03 μm grain size aluminium
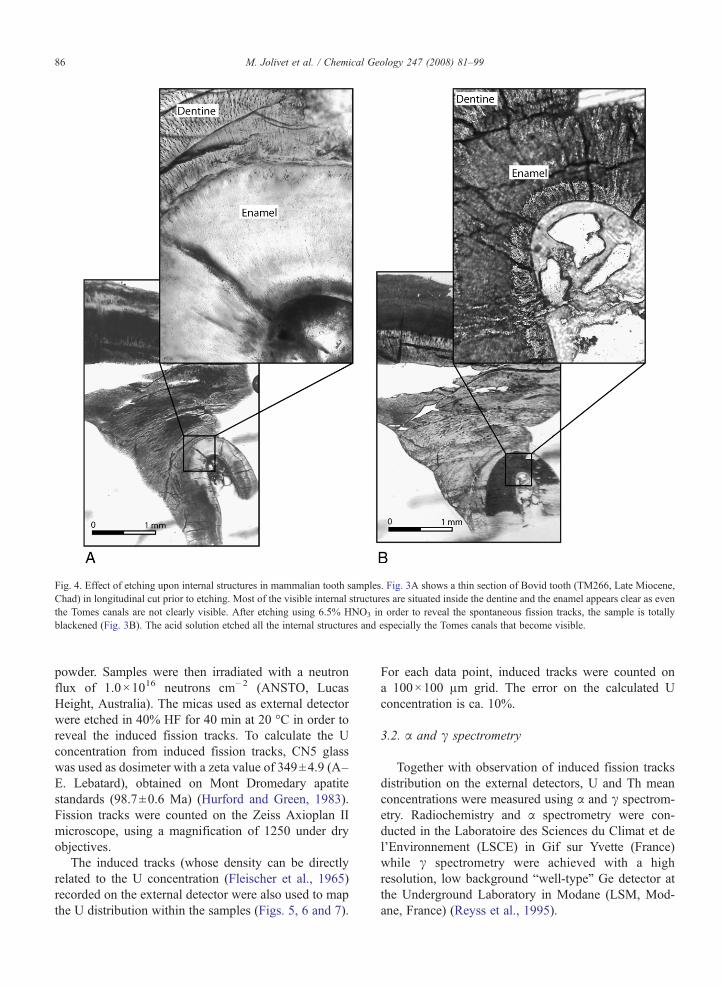
Fig. 4. Effect of etching upon internal structures in mammalian tooth samples. Fig. 3A shows a thin section of Bovid tooth (TM266, Late Miocene,Chad) in longitudinal cut prior to etching. Most of the visible internal structures are situated inside the dentine and the enamel appears clear as eventhe Tomes canals are not clearly visible. After etching using 6.5% HNO3 in order to reveal the spontaneous fission tracks, the sample is totallyblackened (Fig. 3B). The acid solution etched all the internal structures and especially the Tomes canals that become visible.
86 M. Jolivet et al. / Chemical Geology 247 (2008) 81–99
powder. Samples were then irradiated with a neutronflux of 1.0×10¹⁶ neutrons cm−2 (ANSTO, LucasHeight, Australia). The micas used as external detectorwere etched in 40% HF for 40 min at 20 °C in order toreveal the induced fission tracks. To calculate the Uconcentration from induced fission tracks, CN5 glasswas used as dosimeter with a zeta value of 349±4.9 (A–E. Lebatard), obtained on Mont Dromedary apatitestandards (98.7±0.6 Ma) (Hurford and Green, 1983).Fission tracks were counted on the Zeiss Axioplan IImicroscope, using a magnification of 1250 under dryobjectives.
The induced tracks (whose density can be directlyrelated to the U concentration (Fleischer et al., 1965)recorded on the external detector were also used to mapthe U distribution within the samples (Figs. 5, 6 and 7).
For each data point, induced tracks were counted ona 100×100 μm grid. The error on the calculated Uconcentration is ca. 10%.
3.2. α and γ spectrometry
Together with observation of induced fission tracksdistribution on the external detectors, U and Th meanconcentrations were measured using α and γ spectrom-etry. Radiochemistry and α spectrometry were con-ducted in the Laboratoire des Sciences du Climat et del'Environnement (LSCE) in Gif sur Yvette (France)while γ spectrometry were achieved with a highresolution, low background “well-type” Ge detector atthe Underground Laboratory in Modane (LSM, Mod-ane, France) (Reyss et al., 1995).

Fig. 5. Determination of the U concentration in Chadian samples using fission tracks. The induced fission tracks on the external detector (right)provide a map of the U content in the sample (left). The induced track density is directly related to the U concentration of the sample. EachU concentration value is given for a 100 μm×100 μm surface with a maximum uncertainty of 10%. KB3-10, Proboscidian's fossil tooth (KB3, Mio-Pliocene boundary). A, C and E: fragments of the same tooth. B, D and F: induced fission tracks images of these fragments on the external detectorafter irradiation.
87M. Jolivet et al. / Chemical Geology 247 (2008) 81–99

Fig. 6. Same as Fig. 5. TM266 24, Suid fossil tooth (TM266, Late Miocene). A, C, and E: fragments of the same tooth. B, D, and F: induced fissiontracks images of these fragments on the external detector after irradiation.
88 M. Jolivet et al. / Chemical Geology 247 (2008) 81–99
Seven different materials were analysed: enamel,dentine, bone, diagenetic oxides, the sand crust found onsome of the Chadian fossils, sand from fossil roottubules from Chad (Toros-Menalla, Fig. 3), and
underground and surface water also from Chad. Enamelwas mechanically separated from dentine for samplesthat presented identified fission tracks (3 from Chad and1 from France). Teeth and bones surfaces were cleaned
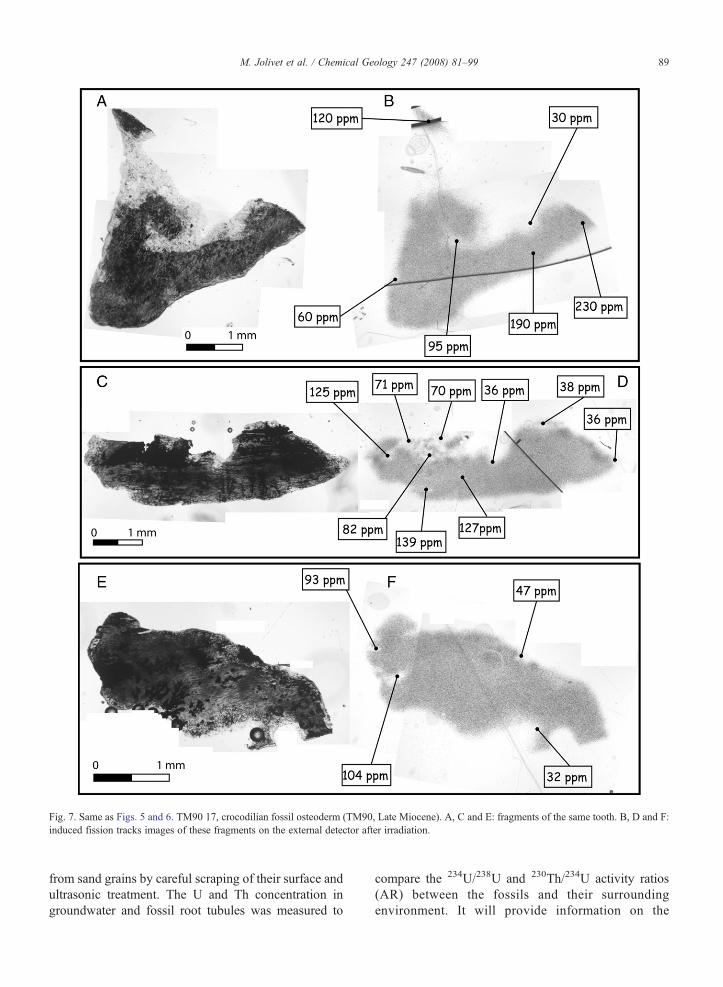
Fig. 7. Same as Figs. 5 and 6. TM90 17, crocodilian fossil osteoderm (TM90, Late Miocene). A, C and E: fragments of the same tooth. B, D and F:induced fission tracks images of these fragments on the external detector after irradiation.
89M. Jolivet et al. / Chemical Geology 247 (2008) 81–99
from sand grains by careful scraping of their surface andultrasonic treatment. The U and Th concentration ingroundwater and fossil root tubules was measured to
compare the 234U/238U and 230Th/234U activity ratios(AR) between the fossils and their surroundingenvironment. It will provide information on the

90 M. Jolivet et al. / Chemical Geology 247 (2008) 81–99
diagenetic processes and especially on incorporation ofU in the fossils through time. All samples were crushedand weighed. In most cases, the same powder was usedfor γ and α spectrometry analysis.
Total 238U (as 234Th) and 226Ra (as 214Bi and 214Pb)were measured non-destructively on 10–500 mg ofdried (at 110 °C) sample material for 1 day using twolow-backgrounds, high-efficiency well-type (215 and430 cm3) Ge γ detectors at the LSM. These detectors areshielded from cosmic radiation by 1700 m of rock andfrom the radioactivity of the room by 20 cm of old lead.230Th was measured at the γ peak energy of 67 keV.238U (as 234Th) was measured at the γ peak energy of63.3 keV, and 226Ra through the short-lived daughters214Pb and 214Bi at 295.2, 352 and 609.3 keV. Measure-ments were confirmed by summing 238U (as 234Thmeasured at 63.3 keV) and 226Ra contributions at185.9 keV. The detectors were calibrated with U and ThNIST standard at 1000 ppm and the standards NIST4350B, NIST 4353 and IAEA 135 (Turnewitsch et al.,2004).
After the γ analysis, samples were weighted againthen ashed at 800 °C for 12 h to remove organic matter.The ashed sample was dissolved in 8 N HNO3, and Alnitrate carrier and 232U and 228Th tracer solutions wereadded. Methods for separation of U and Th, using an ionexchange column, are fully described in Wild andSteffan (1991). Thorium and Uranium were plated onaluminium foil and counted by α-spectrometry with agrid-chamber. The ages were calculated, when possible,using an iterative computer program (e.g. Ivanovich andHarmon, 1992).
Finally, to separate the diagenetic oxides fromenamel and dentine, both materials were weighedindependently and leached following the methoddeveloped by Sharma and Somayajulu (1979). Leachingwith 10% hydroxylamine hydrochloric acid (NH2-
OHHCl) dissolved the authigeneous components ofthe sample. After 3 successive leachings, the residualsolid fraction was washed and dried before γ spectrom-etry analysis. The leached fraction containing authige-neous metals was then prepared for U measurementusing the α spectrometer in LSCE.
3.3. Secondary ion mass spectrometry
After fission track analysis, thin sections werepolished down to 30 μm to remove the superficialstructures revealed by etching. The samples were thencoated with carbon and gold. Measurements were doneat ISTEEM (Montpellier) on a Cameca IMS4F with anO− extraction flux. The gold and carbon coating was
first eliminated from the analysis area using a 10 nA/15 kV flux during 10 min. As no natural standardsamples with known concentrations were available, 30Simeasurements on standard silicate glass SRM610 wereused as internal reference. 250×250 μm greyscaleimages were obtained on key areas determined fromFTA. The colour scale of each image is normalized to30Si. The maximum relative concentration given foreach element in Figs. 8 and 9 corresponds to thebrightest point. As absolute concentrations are notcalculated, these images can only be used to localize thevarious elements within the sample and to provide arelative idea of their abundance.
Major elements (27Al, 31P, 30Si, 40Ca and 55Mn)were measured for 3.5 min and trace elements (232Thand 238U) for 30 min using a 1 nA/15 kV current.
4. Results
4.1. Fission tracks analysis
Only a small number of the studied samples (all sortsof material considered) showed few recognizablespontaneous fission tracks (a rhinoceros tooth (MH4),a Suidae tooth (TM266-24), a Proboscidian tooth (KB3-10) and a piece of crocodile osteodermis (TM90-17)).
The density of spontaneous fission tracks that shouldbe observed in a sample can be calculated from the ageof the sample and the U concentration (see Appendix Afor the detailed calculation method). For example, aChadian fossil from site TM266, with a biostratigraphicage of 7 Ma and a mean U concentration of 100 to200 ppm should contain between 70 and 130 fissiontracks on a 100×100 μm surface.
In mammalian teeth, the internal structures are thefirst major obstacle for fission track counting (Figs. 2and 4). Furthermore, in fossils largely affected bydiagenesis which contain a high proportion of oxidesboth within the fossil structure and in late mechanicalfractures, diagenetic minerals can also hide the fissiontracks (Fig. 1). From optical microscope observation, itappears that aprismatic enamel from reptile teeth is moreadequate for fission track observation. This materialdoes not contain visible internal structures and onlysecondary mechanical cracks occur.
The 4 samples that showed spontaneous fissiontracks have been irradiated to estimate their U concen-tration and distribution.
Figs. 5, 6 and 7 show Chadian teeth fragments andtheir corresponding images on the external detector.Areas where the fossil sample was very thin due topolishing have been excluded from the following

Fig. 8. Top: SIMS raw images of 30Si, 238U, 232Th, 40Ca, 55Mn, 27Al and 31P in a 250×250 μm area of a TM90-17 crocodilian osteoderm. In eachindividual image brighter colours represent higher relative concentration but the absolute concentration of each element was not calculated. Theseimages can only be used to localize the various elements within the sample. See text for complete discussion. Bottom: correlations between55Mn/40Ca, 27Al/40Ca, 238U/40Ca and 238U/30Si.
91M. Jolivet et al. / Chemical Geology 247 (2008) 81–99
interpretation because they might not be representativeof the samples. Induced fission tracks (and thus U) areobserved on the whole surface corresponding to the
fossil but their distribution is not homogeneous. In mostimages, areas of low induced tracks density correspondto high concentration of oxides within the samples (see

92 M. Jolivet et al. / Chemical Geology 247 (2008) 81–99

93M. Jolivet et al. / Chemical Geology 247 (2008) 81–99
for example on Fig. 6C and D). Calculated Uconcentrations vary from ca. 10 ppm to ca. 200 ppmwith no apparent differences between the species and thelocalities. Those results are consistent with the mean100 ppm U concentration obtained from preliminary γmass spectrometry analysis on some of the Chadianfossils.
Sample MH4 (Burdigalian rhinoceros tooth), whichcontains a lower amount of oxides compared to theChadian samples, has a mean U concentration of ca.60 ppm.
4.2. α and γ spectrometry
Results (2σ error) are presented in Table 1. SampleMH4 shows U concentration of ca. 64 ppm in dentineand ca. 36 ppm in enamel. As expected from FTAsamples from Chad have higher U concentrations thatrange from 90 to 280 ppm, the highest values beingattained in Kossom Bougoudi (KB3-10) and in one sitein Toros-Menalla (TM90-17) (Fig. 3). In all teethsamples (from Chad and from France), the U concen-tration in dentine is two times higher than in enamel.The 234U/238U activity ratio (AR) values in teeth appearconstant within a site (see site TM266 in Table 1, andFig. 10) but slightly higher in the oldest TM266 site thanin the KB3-10 site. Furthermore, the 234U/238U ARvalues are similar in dentine and enamel. The230Th/234U values are slightly higher in dentine thanin enamel. This also seems to correspond to an increasein 232Th in dentine (Table 1: samples MH4, BK3-10 andTM266-24). It probably reflects a stronger contamina-tion from diagenetic material in dentine than in enamel.
The diagenetic oxides from the Chadian fossils(separated by leaching following the method of Sharmaand Somayajulu (1979)) have very low U concentra-tions varying from 0.4 to 8.1 ppm (see KB3-10E, KB3-10D, TM266-Os2 and TM266-Os4 in Table 1). Theleaching method does not allow discriminating betweenoxides that were incorporated within the fossil structureand oxides that are deposited inside secondary fracturezones. However, the sandy crust coating the teeth andbones present relatively high U contents. This isespecially the case for the oldest site (TM266) whichgives U concentration for the sandy crust of 132 ppm,equivalent to the concentration in bones and teeth. Aroot concretion from site TM254 (equivalent in age to
Fig. 9. Top: SIMS images of 30Si, 238U, 232Th, 40Ca, 55Mn, 27Al and 31P in a 25in order to analyse both enamel and dentine at the same time (see locatiodiscussion. Bottom: correlations between 238U/40Ca, 55Mn/40Ca, 27Al/40Ca, 2
TM266) formed by a coating of diatomitic material andoxides around the plant roots gives U concentration of55 ppm. However, this sample contains a smallerproportion of oxides than the sandy crust of TM266.
Finally, U measurements have been made on waterfrom Chad. Groundwater from site TM274 (situated lessthan 10 km from site TM266, Fig. 2), sampled ca. 50 cmbelow the surface of the ground gives a U concentrationof 6.5±0. 3 ppb and a 234U/238U AR of 1.3±0.11. Thissite is situated within a dry desert area where it seldomrains. Similar values have been obtained in the EasternDesert of Egypt by Dabous et al. (2002). Water from theSalal well (Fig. 2) (collected at ca. 30 m deep) has amuch lower U concentration of 0.18±0.02 ppb but asimilar 234U/238U AR of 1.37±0.17. Finally the waterfrom the Cheddra semi-permanent lake (Fig. 2) has anintermediate U concentration of 1.3±0.1 ppb and aslightly lower 234U/238U AR of 1.23±0.11. Those twolocalities are subjected to periodic rain (the Cheddraarea being rainier than Salal which is on the edge of theDjurab Erg desert) that may periodically dilute theunderground water.
4.3. Secondary ion mass spectrometry
SIMS analysis was performed to correlate 238U and232Th with other elements and to understand the effectsof diagenesis on their distribution. Figs. 8 and 9 presentcharacteristic images obtained on bones or osteoderms(Fig. 8: TM90-17 crocodilian osteoderm) and teeth(Fig. 9: TM266-24 suid tooth). Those images do notprovide any quantitative information on the individualconcentrations but indicate the location and relativeabundance variation of each element (see the “Method-ology” section for discussion).
30Si is present in all fossils but in some samples 31Pand generally 40Ca are still preserved indicating thatdiagenesis did not completely erased the initial material.55Mn and 27Al which mostly correspond to the oxidesare present in areas with high 40Ca concentration (seeFig. 8). In TM266-24 tooth (Fig. 9), the 27Al distributionalso matches the 30Si distribution. On Fig. 8, the 238Udistribution and relative concentration match the 30Sidistribution. This is also probably the case on Fig. 9 butthe smaller amount of 238U does not allow a goodinterpretation of the image. In this case the 238Udistribution may also correlate with 40Ca, 27Al and 31P.
0×250 μm area of a TM266-24 suid tooth. The probed area was chosenn of the analysed zone on microphotograph). See text for complete38U/30Si, 238U/31P, 238U/27Al and 27Al/30Si.

Table 1Uranium and Thorium nuclide concentrations in fossil, sand, concretion and water measured using α and γ spectrometry
Lab. no. Statigraph.age
Description 232Th(ppm)
U (ppm) 234U/238U 230Th/234U Correspondingage Th (ka)
+/−(ka)α γ
MH4 E Up.Burdigalian
Rhinocerotidae, tooth – 36.2±0.5 – 2.45±0.03
1.34±0.03 ≫400 –
MH4 D Up.Burdigalian
Rhinocerotidae, tooth – 64.1±3.0 – 2.45±0.09
1.62±0.07 ≫400 –
KB3-10 E 4.5–5.5 My Proboscidea, tooth 0.11±0.19
177.9±4.7 155.3±5.7
1.45±0.02
0.91±0.01 205.8 16.6/14.4
KB3-10 E ox l 4.5–5.5 My Proboscidea, tooth – 1.04±0.1 – 1.35±0.14
– – –
KB3-10 E ox r 4.5–5.5 My Proboscidea, tooth – – 150.9±2.6
–
KB3-10 D 4.5–5.5 My Proboscidea, tooth 1.35±0.42
283.3±6.0 257.8±10.8
1.42±0.01
1.06±0.01 356.1 43.0/30.7
KB3-10 D ox l 4.5–5.5 My Proboscidea, tooth – 8.1±0.2 – 1.35±0.03
– – –
KB3-10 D ox r 4.5–5.5 My Proboscidea, tooth – – 201.4±1.5
– – – –
KB3-10 sable Sandy crust – – 33.0±1.8 – – – –TM266-24 E ca. 7 My Suidae, tooth 0.2±
0.491.1±2.8 – 1.50±
0.041.1±0.05 N260 –
TM266-24 D ca. 7 My Suidae, tooth 1.2±0.8
206.4±5.6 188.1±5.3
1.35±0.03
1.23±0.02 ≫400 –
TM266-13 t ca. 7 My Antracoteriidae, tooth – 73.2±1.7 – 1.57±0.03
1.14±0.02 ≫450 –
TM266-Bov E ca. 7 My Bovidae, tooth – 123.9±2.7 – 1.57±0.03
1.18±0.02 ≫450 –
TM266-Os2 ca. 7 My Mammalia, bones – 109.9±5.4 120.3±5.8
– – – –
TM266-Os2 ox l ca. 7 My Mammalia, bones – 1.7±0.1 – 1.26±0.09
– – –
TM266-Os2 ox r ca. 7 My Mammalia, bones – – 126.8±6.8
– – – –
TM266-Os4 ca. 7 My Mammalia, bones – – 158.9±12.4
– – – –
TM266-Os4 ox l ca. 7 My Mammalia, bones – 0.4±0.1 – 1.49±0.40
– – –
TM266-Os4 ox r ca. 7 My Mammalia, bones – – 162.0±7.0
– – – –
TM266-Os4 sand ca. 7 My Sandy crust – – 131.6±3.0
– – – –
TM90-17 ca. 7 My Crocodylidae,osteodermis
– – 265.7±3.8
– – – –
R2 TM254 ca. 7 My Diatomitic root conduit – 55.2±0.5 – 1.48±0.01
0.059±0.001
b6.5 0.10/0.10
TM274 Eau Mio-Pliocene Groundwater – 0.0065±0.0003⁎ – 1.30±0.11
– – –
Salal Eau Groundwater – 0.00018±0.00002⁎
– 1.37±0.17
– – –
Cheddra N Eau Actual Lake water – 0.0013±0.0001⁎ – 1.23±0.11
– – –
Errors are given at 2σ. MH stands for Baigneux in France, KB stands for Kossom Bougoudi (Chad), TM stands for Toros-Menalla (Chad). See Fig. 3for the localization of Kossom Bougoudi, Toros-Menalla, Salas and Cheddra. E: enamel; D: dentine; t: whole fossil tooth (enamel+dentine+oxides);ox l: leached oxides from sample; ox r: residual material after leaching of the diagenetic oxides; ⁎: concentration values expressed in μg/l.
94 M. Jolivet et al. / Chemical Geology 247 (2008) 81–99
Fig. 9 also shows a strong contrast between thedentine (left) and enamel (right), the concentration of themeasured elements being much higher in dentine. The
higher concentration of diagenetic elements such as Si indentine can be explained by the porous structure of thematerial that allows fluids to circulate more easily than

Fig. 10. 234U/238U and 230/234U ratio for the Chadian fossils obtained from α spectrometry (see text for methodological details). Kossom Bougoudi aresamples from site KB3-10 (Mio-Pliocene boundary) and Toros-Menalla from site TM266 (Late Miocene) (Table 1).
95M. Jolivet et al. / Chemical Geology 247 (2008) 81–99
in enamel (e.g. Michel et al., 1995; Millard and Hedges,1996).
5. Discussion
Using fission tracks analysis of biogenic apatite as afossil dating tool appears difficult. Two major difficul-ties that will be discussed further arise: a) the internalstructure of the fossils as well as the very small size ofthe individual apatite crystallites tend to hide thespontaneous fission tracks; b) biogenic apatite naturallycontains small amount of U (in the order of a few ppb)which imply that only fossils of several 100 Ma, oldenough to present few spontaneous fission tracks, maybe analysed (Sachs et al., 1980). More importantly,diagenetic processes tend to deeply modify the initialmaterial and especially to bring U from the surroundingenvironment.
5.1. Internal structure of the fossils
The difficulty linked to the complexity of teeth andbones internal structures can be partly solved. Teethwith aprismatic enamel or thick prismatic enamel willprovide surfaces large enough to observe fission tracks.A slight re-polishing (up to a maximum of 1 μm) of thesurface after etching allows to partially erase the “relief”due to etching of both the hydroxyapatite crystalliteboundaries and the numerous channels (Tomes canals,Haversian canals, etc). However, such a protocolpotentially erases fission tracks that are present onlyon the surface (either they were horizontal or theypenetrated less than 1 μm below the surface frommaterial situated “above” the section). This can slightly
increase the error on the calculated apatite fission trackage by underestimating it. Fission tracks analysis inbones is much more difficult than in teeth since internalstructures are more developed and larger. Nonethelessthick bones of large animals might provide adequatesurfaces.
5.2. Redistribution of uranium during diagenesis
Setting aside the observation difficulties, the abilityto apply FTA on fossils relies on several parameters: a)some of the initial hydroxyapatite must be preservedduring diagenesis; b) the U concentration acquired bythe hydroxyapatite during early diagenesis is highenough (several ppm); c) this U must have beenincorporated very shortly after deposition of the fossilin the sediment (i.e. in a period of time shorter than theuncertainty on the FTA age); d) no U must be added orsubtracted to the fossil after the initial incorporationevent. In this paragraph we discuss the potentiality of allthose conditions to be fulfilled.
The fact that potential spontaneous fission trackscould be hidden by internal structures in the samplesdoes not alone explain the small number of tracksobserved in our samples. Calculations reported inAppendix A show that for the Chadian fossils, thedensity of spontaneous fission tracks that should beobserved is much higher than what is actually seen in thefossils. Fossilization of bones or teeth is a complexprocess involving decomposition of organic matter (e.g.Hare, 1980; Rae and Ivanovich, 1986; Pfretzschner,2004), chemical exchanges with the surroundingenvironment (e.g. Toots and Parker, 1979; Williamsand Marlow, 1987; Millard, 1993; Millard and Hedges,

96 M. Jolivet et al. / Chemical Geology 247 (2008) 81–99
1996; Pike, 2000; Pike et al., 2002; Pfretzschner, 2004)and conversion of biogenic apatite into inorganic apatiteminerals (e.g. Bartsiokas and Middleton, 1992). Twohypotheses can then be tested using the Chadiansamples: a) the U concentrations measured in thesamples result from either a slow, continuous U uptakeduring diagenesis or a late (compared to the age of thesample), rapid uptake; b) the U is not associated with thehydroxyapatite phase.
5.3. Timing of U uptake
Many researchers have documented the strongaffinity of mineral apatite for U (e.g. Arey and Seaman,1999; Jerden and Sinha, 2003; Krestou et al., 2004).Krestou et al. (2004) showed that hydroxyapatiteefficiently (≈95%) removes U from solutions in thepH range of 3 to 11. The U concentrations measured inthe three water samples (Table 1) is low but compatiblewith values obtained in similar desert environments (e.g.Dabous and Osmond, 2001; Dabous, 2002). The234U/238U AR of the water samples is slightly lowerbut close to the one observed in the fossil samples (Table1) indicating that the fossils and the surroundingenvironment are mostly in equilibrium.
The 230Th/234U ratio measured in the fossils variesfrom 0.91 to 1.23 (Table 1 and Fig. 10). This indicates thateither significant 230Th has been produced within thefossils by 234U decay or that 234U has been lost throughleaching into the surrounding groundwater. A phase of Uuptake followed by a period of loss of some of that Uthrough leaching will leave an excess of the immobile230Th daughter product, leading to a 230Th/234U ratiogreater than the theoretical equilibrium value (e.g. Rae etal., 1989; Pike et al., 2002; Hoffmann andMangini, 2003).
SIMS images indicate that, when detected, 232Th islocated in discrete areas, generally associated with Mnoxides (Figs. 8 and 9). Williams and Marlow (1987)showed that Th is not incorporated in bones during earlydiagenesis, and that Th diffusion within fossil bones isvery slow. It implies that Th uptake in the samples is along term process and that 230Th has most likely beenproduced in situ, even if a small proportion may havebeen incorporated during diagenesis. Consequently, Umust also have been incorporated (and possibly partiallyleached) during several episodes corresponding tovariations in the redox condition of the surroundingenvironment (e.g. Millard and Hedges, 1996). All theChadian fossils are situated inside the lake Mega-Chadbasin. Regular flooding of the Chadian desert duringformation of mega-lake episode (e.g. Schneider, 1994;Schuster, 2002) followed by evaporation and a return to
dry conditions would be one way to modify the redoxconditions of the fossils' environment.
5.4. Uranium enrichment in diagenetic oxides
One potential process to artificially increase the Uconcentration within the fossils is the co-precipitation ofU with oxide minerals or other naturally occurringmineral phases such as carbonates and silicates (e.g.Reeder et al., 2000; Duff et al., 2002). U has a highaffinity for Fe-oxide minerals. In the geologic environ-ment, U may first sorb to Fe-oxides. Then, as Fe-oxidesundergo weathering and microbial interactions, theymay dissolve and re-precipitate. During these mineralformation processes, U could be incorporated in the Fe-oxides over long periods of time (e.g. Fredericksonet al., 2000; Duff et al., 2002).
The Fe-oxide rich sand crust that covers TM266 fossilshas a high U concentration of about 132 ppm (TM266-Os4-sand) whereas the oxide-poor sand that covers KB3fossils (KB3-10-sand) and the slightly more oxidized rootconduit from TM254 (R2 TM254) have a much lower Uconcentration of about 33 ppm and 55 ppm, respectively(Table 1). Sample KB3-10-sand is younger compared tothe other two, which could explain the difference in Uconcentration. On the contrary, samples R2-TM254 andTM266-Os4-sand have the same stratigraphic age andvery different U concentration. The amount of U in thesand immediately surrounding the fossil samples thusappears to be correlated with the oxides concentration andsupport the hypothesis of co-precipitation of U and Fe-oxides around the fossils.
However, the FTA shows a complete lack of inducedfission tracks in oxides-rich zones of the fossils,indicating a very low U concentration (Fig. 6). This isfurther attested by the very low U concentrationobtained by α spectrometry of the oxide fraction of thesamples (Table 1: KB3-10 Eox l, TM266-Os2-ox l andTM266-Os4-ox l).
It is thus obvious that contrarily to the situation in thesurrounding sand crust, diagenetic oxides are not themain U reservoirs in the fossil samples. Precipitation ofoxide phases inside the bone structure occurs during thevery early diagenetic phase (relatively to the age of thefossil) together with degradation of organic matter,especially collagen (e.g. Newesely, 1989; Pfretzschner,2004). Like already proposed by Millard and Hedges(1996), our results seem to indicate that this earlydiagenetic phase has only a negligible effect on the totalU uptake of the fossil. At least the oxides precipitatedduring this phase have no apparent effect on the increaseof the U concentration.

97M. Jolivet et al. / Chemical Geology 247 (2008) 81–99
5.5. Silicification of fossil material and U uptake
Chadian fossils are highly silicified indicating warmand dry, near surface fossilisation conditions (Pfretzsch-ner, 2004). Fig. 9 shows a higher 30Si concentrationwithin the dentine than in the enamel, correlated with thehigher U concentration in dentine (Table 1 and Fig. 9).Silicification of fossil material is a late diageneticprocess (Pfretzschner, 2004) and the clear associationbetween 238U and 30Si (Figs. 8 and 9) indicates that Uuptake certainly continued during the latest fossilisationstages. Access to the internal structure of the tooth iseasier in the porous dentine than in the enamel whichexplains the highest U and Si concentration in theformer one (Michel et al., 1997). The distribution of theinduced fission tracks on the external detectors (Figs. 5,6 and 7) indicates that U is not equally distributed in thesample. It appears that longterm diagenesis which leadsto mineral substitutions inside the fossils (replacementof hydroxyapatite by calcite and quartz) induces largeheterogeneities in the U distribution. This is a majordeviation from the Millard and Hedges (1996) DAmodel that predicts a homogeneous distribution of U inthe sample after a period of several 100 kyr.
6. Conclusion
Fission tracks analysis of hydroxyapatite fossils isvery difficult. As mentioned by Sachs et al. (1980)fossils are made of small apatite micro-crystals whosejoints are strongly attacked during the etching phase ofthe fission track samples preparation, partially or totallyblackening the sample. Furthermore, if the internalstructure of the conodonts used by Sachs et al. (1980)was relatively simple, bones and teeth from mammalsor reptiles contains numerous canals (e.g. Tomes andHaversian canals) which again are strongly attackedduring etching. These observation difficulties canbe partially solved by using aprismatic enamel orby slightly re-polishing the surface of the samplesafter etching. However, absolute dating of fossils usingthe U-series dating is also impeded by the diageneticprocesses.
If the early diagenetic stages do not play an importantrole in the uptake of U, this element seems to beincorporated and/or leached from the fossil over verylong periods of time. The “pulses” of U enrichment orleaching probably correspond to changes of redoxconditions in the environment. In the example of theChadian fossil these changes are linked to the numerousfluctuations of the water level within the extensive LakeChad basin.
Finally the longterm distribution of the U in fossilsamples mainly corresponds to diagenetic developmentof authigenic minerals such as calcite and quartz. In thisrespect it cannot be described by the DA model ofMillard and Hedges (1996). Because uptake and loss ofU in fossil bones and teeth is such a very complicatedmechanism it appears that FTA dating of Myrs oldfossils cannot be reasonably achieved unless fossiliza-tion conditions are very stable and known in great detail.
Acknowledgments
We thank the Chadian Ministère de l'EducationNationale (CNAR and Université de N'Djamena), theFrench Ministère des Affaires Etrangères (SCAC,N'Djamena and DCSUR, Paris) and Ministère del'Education Nationale et de la Recherche (ProgrammeEclipse, CNRS and Université de Poitiers). We aregrateful for financial support from the NSF programRevealing Hominid Origins Initiative and to the MissionPaléoanthropologique Franco-Tchadienne technicalteam for its help during field work. We also expressour consideration to Ch. Nevado (ISTEEM, UniversitéMontpellier) for the numerous thin sections and to S.Sen (Muséum National d'Histoire Naturelle, Paris) forproviding a large collection of samples. Finally we wantto acknowledge the help of two anonymous reviewers aswell as Pr. C. Göpel and Pr. B. Bourdon for theirconstructive review of the manuscript.
Appendix A. Calculation of the expected number offission tracks in a sample
The density of fission tracks that can be expected in asample of known age and U concentration can becalculated using:
PFT ¼ kFkT
238U ekTt � 1� � ð1Þ
where λF is the238U decay constant (8.46×10⁻¹⁷), λT=
λF+λ=8.46×10⁻¹⁷ +1.55125×10⁻¹⁰ with λ the alpha
decay constant. As λFbbλ it is generally consideredthat λT≈λ. t is the age of the sample and 238U is thenumber of 238U atoms per cm3 calculated from
238U ¼ U ppmð Þ � I � A� q
106 � 238ð2Þ
where U(ppm) is the measured U concentration in thesample, A is the Avogadro constant, ρ is the apatitedensity and I ¼ 137:88
138:88 :

98 M. Jolivet et al. / Chemical Geology 247 (2008) 81–99
The maximum number of fission tracks (NFT) to beexpected on a definite observation surface can then becalculated using:
NFT ¼ PFT � a� L ð3Þ
where a is the observation area and L is the maximumlength of the fission track.
As an example, samples from Toros-Menalla have anestimated age of 7 Ma and a U concentration of 100 to200 ppm (Table 1). Using an apatite density of 3.2, 238Uwill then vary between 8.0392×10¹⁷ and 1.6078×10¹⁸
atoms per cm3. The corresponding PFT will vary from476.34×106 to 952.68×10⁶ atoms for 1 cm3.
The number of fission tracks (NFT) to be expected ona typical counting surface of 100 μm×100 μm and usinga maximum track length of 14 μm will then varybetween 68 and 133 tracks.
References
Arey, J.S., Seaman, J.C., 1999. Immobilization of uranium incontaminated sediments by hydroxyapatite addition. Environmen-tal Science and Technology 33, 337–342.
Barbarand, J., Carter, A., Wood, I., Hurford, T., 2003. Compositionaland structural control of fission-track annealing in apatite.Chemical Geology 198, 107–137.
Bartsiokas, A., Middleton, A.P., 1992. Characterization and dating ofrecent and fossil bone by X-ray diffraction. Journal of Archaeo-logical Science 19 (1), 63–72.
Brunet, M., Guy, F., Pilbeam, D., Lieberman, D.E., Likius, A.,Mackaye, H.T., Ponce De Leon, M., Zollikofer, C., Vignaud, P.,2005. Newmaterial of earliest hominid from the Upper Miocene ofChad. Nature 434, 752–755.
Coyle, D.A., Wagner, G.A., 1998. Positioning the Titanite fission trackpartial annealing zone. Chemical Geology 149, 117–125.
Dabous, A.A., 2002. Uranium isotopic evidence for the origin of theBahariya iron deposits, Egypt. Ore Geology Reviews 19, 165–186.
Dabous, A.A., Osmond, J.K., 2001. Uranium isotopic study of artesianand pluvial contributions to the Nubian aquifer, western desert,Egypt. Journal of Hydrology 243, 242–253.
Dabous, A.A., Osmond, J.K., Dawood, Y.H., 2002. Uranium/Thoriumisotope evidence for ground-water history in the Eastern Desert ofEgypt. Journal of Arid Environments 50, 343–357.
Dahl, S.D., 1997. A crystal-chemical basis for Pb retention and fissiontrack annealing systematics in U-bearing minerals, with applica-tion for geochronology. Earth and Planetary Science Letters 150,277–290.
Duff, M.C., Urbanik Coughlin, J., Hunter, D.B., 2002. Uranium co-precipitation with iron oxide minerals. Geochimica CosmochimicaActa 66 (20), 3533–3547.
Eggins, S., Grün, R., Pike, A.W.G., Shelley, M., Taylor, L., 2003. 238U,232Th profiling and U-series isotope analysis of fossil teeth by laserablation-ICPMS. Quaternary Science Reviews 22, 1373–1382.
Fleischer, R.L., Price, P.B., Walker, R.M., 1965. Tracks of chargedparticles in solid. Science 149, 363–393.
Frederickson, J.K., Zachara, J.M., Kennedy, D.W., Duff, M.C., Gorby,Y.A., Li, S.W., Krupka, K.M., 2000. Reduction of U(VI) in
goethite (α-FeOOH) suspensions by a dissimilatory metal-reducing bacterium. Geochimica et Cosmochimica Acta 64,3085–3098.
Gleadow, A.J.W., Brown, W., 2000. Fission-track thermochronologyand the long-term denudational response to tectonics. In:Summerfield, M.A. (Ed.), Geomorphology and Global Tectonics.Wiley & Sons, Chichester, England.
Green, P.F., Duddy, I.R., Gleadow, A.J.W., Laslett, G.M., Tingate, P.R.,1986. Thermal annealing of fission tracks in apatite, 1-A qualitativedescription. Chemical Geology 59, 234–253.
Hare, P.E., 1980. Organic geochrmistry of bone and its relation tosurvival of bone in the natural environment. In: Behrensmeyer, A.K.,Hill, A.P. (Eds.), Fossils in theMaking. University of Chicago Press,Chicago, pp. 208–219.
Hoffmann, D., Mangini, A., 2003. A method for coupled ESR/U-seriesdating of teeth showing post-depositional U-loss. QuaternaryScience Reviews 22, 1367–1372.
Hurford, A.J., 1990. Standardization of fission track dating calibra-tion: Recommendation by the Fission track Working Group of theI.U.G.S. Subcomission on Geochronology. Chemical Geology 80,171–178.
Hurford, A.J., Green, P.F., 1983. The zeta age calibration of fission-track dating. Chemical Geology. Isotope Geoscience Section 1,285–317.
Ivanovich, M., Harmon, R.S., 1992. Appendix A. Derivation of theexpressions for the 234U/238U and 230Th/234U activity-ratio ageequations. Uranium-Series disequilibrium: applications to Earth,Marine, and Environmental sciences. Clarendon Press, Oxford,pp. 779–781.
Iyengar, G.V., Kollmer, W.E., Bowen, H.J.M., 1978. The ElementalComposition of Human Tissue and Body Fluids. Springer-Verlag,New York.
Jerden, J.L., Sinha, A.K., 2003. Phosphate based immobilization ofuranium in an oxidizing bedrock aquifer. Applied Geochemistry18, 823–843.
Jolivet, M., Brunel, M., Seward, D., Xu, Z.h., Yang, J., Roger, F.,Tapponnier, P., Malavieille, J., Arnaud, N.,Wu, C., 2001.Mesozoicand Cenozoic tectonics of the northern edge of the Tibetan plateau:fission-track constraints. Tectonophysics 343 (1–2), 111–134.
Jolivet, M., Ritz, J.-F., Vassallo, R., Larroque, C., Braucher, R.,Todbileg, M., Chauvet, A., Sue, C., Arnaud, N., De Vicente, R.,Arzhanikova, A., Arzhanikov, S., 2007. The Mongolian summits:An uplifted, flat, old but still preserved erosion surface. Geology35 (10), 871–874.
Krestou, A., Xenidis, A., Panias, D., 2004. Mechanism of aqueousuranium(VI) uptake by hydroxyapatite. Minerals Engineering 17,373–381.
Kusnir, I., Moutaye, H.A., 1997. Ressources minérales du Tchad: unerevue. Journal of African Earth Sciences 24 (4), 549–562.
Michel, V., Ildefonse, P., Morin, G., 1995. Chemical and structuralchanges in Cervus elaphus tooth enamels during fossilization(Lazaret cave): a combined IR and XRD Rietveld analysis.Applied Geochemistry 10, 145–159.
Michel, V., Falguères, C., Yokoyama, Y., 1997. Teneur en uranium etdatation U–Th destissus osseux et dentaires fossiles da la grotte deLazaret. Comptes Rendus Académie Sciences Paris (II) 325, 381–387.
Michel, V., Locht, J.-L., Antoine, P., Masaoudi, H., Falguères, C.,Yokoyama, Y., 1999. Datation ESR/U–Th combinée des restesfauniques du site moustérien de plein air de Beauvais. ComptesRendus Académie Sciences Paris (II) 329, 369–375.
Millard, A.R., 1993. Diagenesis of archeological bone: the case ofuranium uptake. D. Phil. thesis, University of Oxford. England.

99M. Jolivet et al. / Chemical Geology 247 (2008) 81–99
Millard, A.R., Hedges, R.E.M., 1996. A diffusion–absorption modelof uranium uptake by archaeological bone. Geochimica etCosmochimica Acta 60 (12), 2139–2152.
Newesely, H., 1989. Fossil bone apatite. Applied Geochemistry 4,233–245.
O'Sullivan, P.B., Parrish, R.R., 1995. The importance of apatitecomposition and single-grain ages when interpreting fission trackdata from plutonic rocks: a case study from the Coast Ranges,British Columbia. Earth and Planetary Science Letters 132,213–224.
Pfretzschner, H.-U., 2004. Fossilization of Haversian bone in aquaticenvironments. Comptes Rendus Palevol 3, 605–616.
Pike, A.W.G., 2000, U-series dating of archaeological bone usingTIMS. D. Phil. thesis, University of Oxford, U.K.
Pike, A.W.G., Hedges, R.E.M., 2001. Sample geometry and U uptakein archaeological teeth: implications for U-series and ESR dating.Quaternary Science Reviews 20, 1021–1025.
Pike, A.W.G., Hedges, R.E.M., Van Calsteren, P., 2002. U-seriesdating of bone using the diffusion–adsorption model. Geochimicaet Cosmochimica Acta 66 (24), 4273–4286.
Rae, A.M., Ivanovich, M., 1986. Successful application of uraniumseries dating of fossil bone. Applied Geochemistry 1, 419–426.
Rae, A., Hedges, R.E.M., Ivanovich, M., 1989. Further studies foruranium-series dating of fossil bones. Applied Geochemistry 4,331–337.
Reeder, R.J., Nugent, M., Lamble, G.M., Tait, C.D., Morris, D.E.,2000. Uranyl incorporation into calcite and aragonite: XAFS andluminescence studies. Environmental Science and Technology 34,638–644.
Reyss, J.L., Schmidt, S., Legeleux, F., Boute, P., 1995. Large, lowbackground well-type detectors for measurements of environmen-tal radioactivity. Nuclear Instruments and Methods in PhysicalResearch A357, 391–397.
Sachs, H.M., Denkinger, M., Bennett, C.L., Harris, A.G., 1980.Radiometric dating of sediments using fission tracks in conodonts.Nature 288, 359–361.
Schneider, J.-L., 1994. Le Tchad depuis 25 000 ans, Géologie,Archéologie, Hydrologie. Collection Préhistoire, Masson Ed.
Schuster, M., 2002. Sédimentologie et paléoécologie des séries àvertébrés du paléolac Tchad depuis le Miocène supérieur. PhD
Thesis unpublished, University Louis Pasteur, Strasbourg, France,152 pp.
Sharma, P., Somayajulu, B.L.K., 1979. Growth rates and compositionof two ferromanganese nodules from the central north Pacific.Coll. Int. du C.N.R.S., La genèse des nodules de Manganèse, ed.du C.N.R.S, Paris, No. 289, 281–289.
Sharma, K.K., Choubey, V.M., Sharma, O.P., Nagpaul, K.K., 1981.Uranium distribution in siwalik vertebrates using fission tracktechnique. Journal of the Geological Society of India 22, 92–97.
Sobel, E.R., Oskin, M., Burbank, D., Mikolaichuk, A., 2006.Exhumation of basement-cored uplifts: example of the KyrgyzRange quantified with apatite fission track thermochronology.Tectonics 25. doi:10.1029/2005TC001809.
Tagami, T., Shimada, C., 1996. Natural long-term annealing of thezircon fission track system around a granitic pluton. Journal ofGeophysical Research 101 (B4), 8245–8255.
Tagami, T., Carter, A., Hurford, A.J., 1996. Natural long-termannealing of the zircon fission-track system in Vienna Basindeep borehole samples: constraints upon the partial annealing zoneand closure temperature. Chemical Geology 130, 147–157.
Toots, H., Parker, R.B., 1979. Factors affecting fluorine content offossil bones and teeth. Contribution to Geology at the University ofWyoming 18, 69–70.
Turnewitsch, R., Reyss, J.-L., Chapman, D.C., Thomson, J., Lampitt,R.S., 2004. Evidence for a sedimentary fingerprint of anasymmetric flow field surrounding a short seamont. Earth andPlanetary Science Letters 222 (3–4), 1023–1036.
Van Calsteren, P., Thomas, L., 2006. Uranium-series dating applica-tions in natural environmental science. Earth-Science Reviews 75,155–175.
Wild, E., Steffan, I., 1991. Isolation of Uranium and Thorium for agedetermination of fossil bones by Uranium series method. Radio-chimica Acta 54, 85–89.
Williams, C.T., Marlow, C.A., 1987. Uranium and Thoriumdistribution in fossil bones from Olduvai gorge, Tanzania andKnam, Kenya. Journal of Archaeological Science 14, 297–309.