Can Dynamic Provisioning and Rejuvenation Systems Coexist in Peace
12
Can dynamic provisioning and rejuvenation systems coexist in peace? Raquel Lopes, Walfredo Cirne, Francisco Brasileiro, Eduardo Cola¸ co Universidade Federal de Campina Grande, Departamento de Sistemas e Computa¸c˜ao Laborat´orio de Sistemas Distribu´ ıdos Av. Apr´ ıgio Veloso, 882 - 58.109-970, Campina Grande, PB, Brazil Phone: +55 83 310 1365 {raquel,walfredo,fubica,eduardo}@dsc.ufcg.edu.br Abstract. Dynamic provisioning systems change application capacity in order to use enough resources to accommodate current load. Rejuve- nation systems detect/forecast software failures and temporarily remove one or more components of the application in order to bring them to a clean state. Up to now, these systems have been developed unaware of one another. However, many applications need to be controlled by both. In this paper we investigate whether these systems can actuate over the same application when they are not aware of each other, i.e., without co- ordination. We present and apply a model to study the performance of dynamic provisioning and rejuvenation systems when they actuate over the same application without coordination. Our results show that when both systems coexist application quality of service degrades in compari- son with the quality of service provided when each system is acting alone. This suggests that some level of coordination must be added to maximize the benefits gained from the simultaneous use of both systems. Keywords : interacting systems, dynamic provisioning, rejuvenation. 1 Introduction There are many systems that aim at automating management tasks and deci- sions. We are particularly interested in two of them: dynamic provisioning sys- tems (DPS) and Rejuvenation/Restart 1 systems (RRS). DPSs have been pro- posed to automatically adjust the application capacity to its demand [1,2,3]. RRSs have been proposed to tackle software failures by detecting such failures and bringing the system to a clean state [4,5,6,7]. These systems have been stud- ied separated from each other. For instance, DPSs do not take software failures nor restarts into account, while RRSs do not consider the dynamic capacity changing and the strict matching between capacity and demand provided by a DPS. Nevertheless, one would expect that some applications could benefit from the use of two or more automated management systems simultaneously. In fact, in [8] 1 Restart and rejuvenation are used here as synonyms.
-
Upload
independent -
Category
Documents
-
view
1 -
download
0
Transcript of Can Dynamic Provisioning and Rejuvenation Systems Coexist in Peace
Can dynamic provisioning and rejuvenation
systems coexist in peace?
Raquel Lopes, Walfredo Cirne, Francisco Brasileiro, Eduardo Colaco
Universidade Federal de Campina Grande,Departamento de Sistemas e Computacao
Laboratorio de Sistemas DistribuıdosAv. Aprıgio Veloso, 882 - 58.109-970, Campina Grande, PB, Brazil
Phone: +55 83 310 1365{raquel,walfredo,fubica,eduardo}@dsc.ufcg.edu.br
Abstract. Dynamic provisioning systems change application capacityin order to use enough resources to accommodate current load. Rejuve-nation systems detect/forecast software failures and temporarily removeone or more components of the application in order to bring them to aclean state. Up to now, these systems have been developed unaware ofone another. However, many applications need to be controlled by both.In this paper we investigate whether these systems can actuate over thesame application when they are not aware of each other, i.e., without co-ordination. We present and apply a model to study the performance ofdynamic provisioning and rejuvenation systems when they actuate overthe same application without coordination. Our results show that whenboth systems coexist application quality of service degrades in compari-son with the quality of service provided when each system is acting alone.This suggests that some level of coordination must be added to maximizethe benefits gained from the simultaneous use of both systems.Keywords: interacting systems, dynamic provisioning, rejuvenation.
1 Introduction
There are many systems that aim at automating management tasks and deci-sions. We are particularly interested in two of them: dynamic provisioning sys-tems (DPS) and Rejuvenation/Restart1 systems (RRS). DPSs have been pro-posed to automatically adjust the application capacity to its demand [1,2,3].RRSs have been proposed to tackle software failures by detecting such failuresand bringing the system to a clean state [4,5,6,7]. These systems have been stud-ied separated from each other. For instance, DPSs do not take software failuresnor restarts into account, while RRSs do not consider the dynamic capacitychanging and the strict matching between capacity and demand provided by aDPS.
Nevertheless, one would expect that some applications could benefit from theuse of two or more automated management systems simultaneously. In fact, in [8]
1 Restart and rejuvenation are used here as synonyms.

we have implemented a DPS with RRS features and have obtained good results.When both features coexist application quality of service (QoS) was better andresource savings were higher. Since we built that system from scratch, it wasnatural to introduce some coordination between the management systems. Bycoordination we mean that some information can be exchanged between the DPSand the RRS in order to improve their performance. Two coordination featureswere implemented: (i) whenever the capacity decreases the nodes more prone tofailure were selected to be removed. This information is provided for the DPScomponent by the RRS monitor; and (ii) instead of restarting a node, the RRScomponent asks the DPS component to add one more node, if possible, and thento remove the faulty one.
Ideally, instead of developing new systems, we would like to harness thepotential of legacy systems independently designed. Since these systems are de-signed independently, they do not assume the existence of the other and, there-fore, do not exchange any information. In orther words, there is no imposedcoordination between their actions; they do not interact directly, but the actionsof one system may interfere in the actions of the other and their actions togethermay influence the QoS of the managed application and its operational cost. Weargue it is crucial to identify whether some imposed coordination is really neededto make these systems harmoniously coexist. This work is a first step towardsbetter understanding the effects of having an application managed by both aDPS and an RRS that act independently.
Contributions of this paper are twofold. First, we propose a component basedmodel to study interactions between dynamic provisioning and restart systems.Instances of this model can consider different sets of components, allowing theevaluation of different situations. Second, we instantiate different model compo-sitions to qualitatively identify interactions between DPS and RRS that actuateindependently. Our results suggest that these systems do not provide good per-formance when they coexist without coordination.
The remaining of this paper is organized as follows. In the next section wepresent a model that can be used to study interactions between DPS and RRS.In Section 3 we present an instantiation of this model. In Section 4 we analyzethe results of simulations of several possible compositions of the instantiatedmodel. Then, in Section 5 we present some related work. Finally, in Section 6,we conclude the paper and point future directions.
2 A model to study interactions between dynamic
provisioning and rejuvenation systems
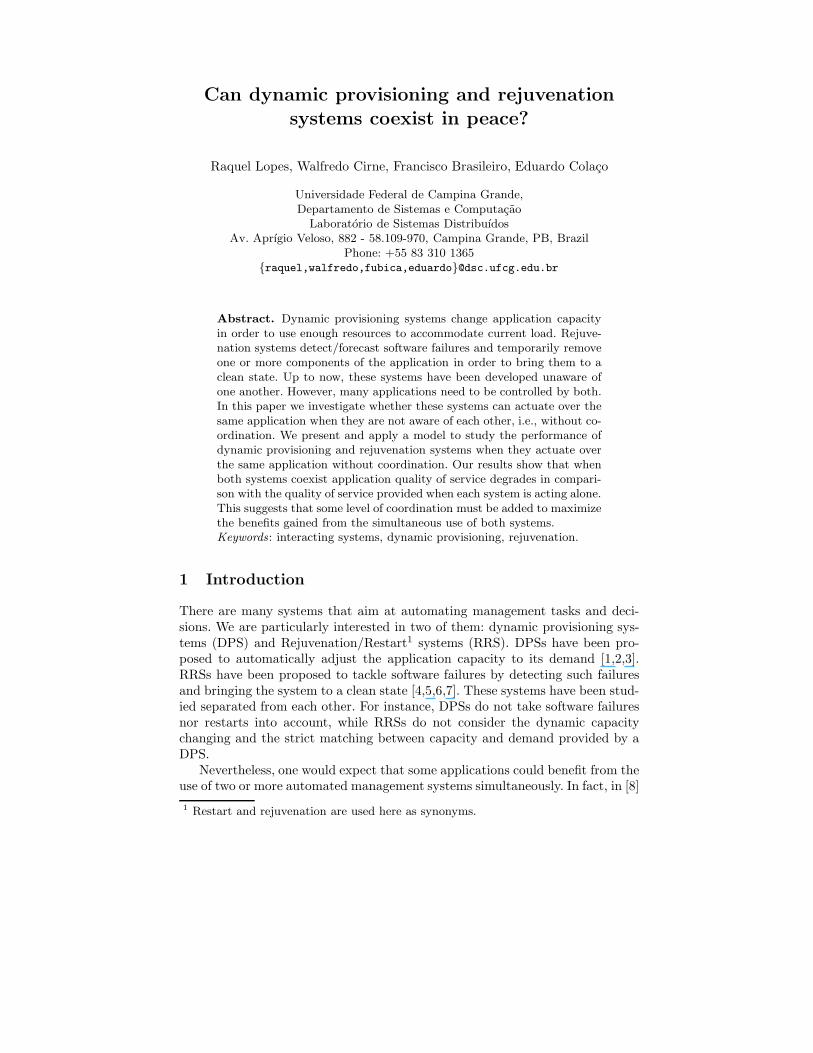
In order to qualitatively identify uncoordinated interactions between a DPS andan RRS, we developed a model that encompasses an application, a software errorinjection system (SEIS), a DPS, an RRS and a load generator system (LGS), asillustrated in Figure 1. We see this model as a component-based model, in whichthe application and the LGS are mandatory components.
The application is a service that runs on a cluster with load balancing suchas a Web based application. Both management systems (DPS and RRS) collectmonitoring information which serves as basis for management decisions. Whilethe DPS flexes the application capacity according to its demand, the RRS de-tects and restarts faulty components of the application. While a node is beingrejuvenated, it is not able to service requests. The SEIS changes the applicationbehavior in order to model the effects of software faults. Finally, the LGS sendsrequests to the application according to some trace. Each request comes withthe time required to service it (inherent service time).
Fig. 1. Complete model view
2.1 The application model
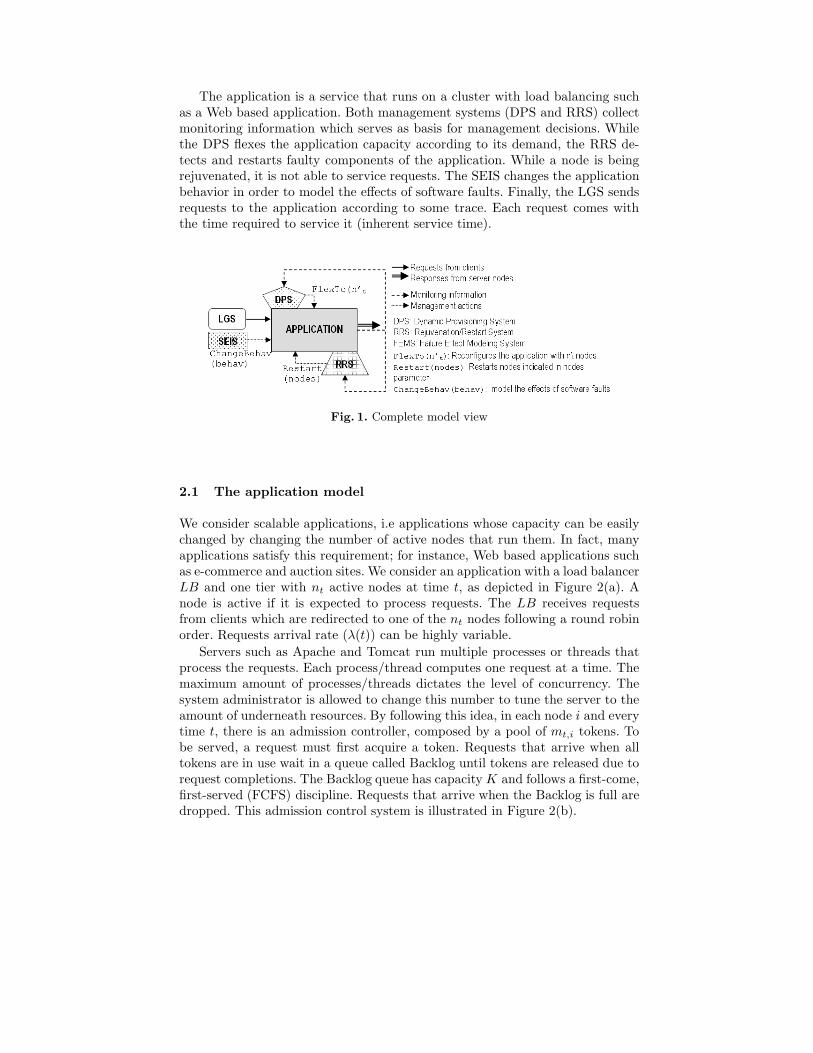
We consider scalable applications, i.e applications whose capacity can be easilychanged by changing the number of active nodes that run them. In fact, manyapplications satisfy this requirement; for instance, Web based applications suchas e-commerce and auction sites. We consider an application with a load balancerLB and one tier with nt active nodes at time t, as depicted in Figure 2(a). Anode is active if it is expected to process requests. The LB receives requestsfrom clients which are redirected to one of the nt nodes following a round robinorder. Requests arrival rate (λ(t)) can be highly variable.
Servers such as Apache and Tomcat run multiple processes or threads thatprocess the requests. Each process/thread computes one request at a time. Themaximum amount of processes/threads dictates the level of concurrency. Thesystem administrator is allowed to change this number to tune the server to theamount of underneath resources. By following this idea, in each node i and everytime t, there is an admission controller, composed by a pool of mt,i tokens. Tobe served, a request must first acquire a token. Requests that arrive when alltokens are in use wait in a queue called Backlog until tokens are released due torequest completions. The Backlog queue has capacity K and follows a first-come,first-served (FCFS) discipline. Requests that arrive when the Backlog is full aredropped. This admission control system is illustrated in Figure 2(b).

Fig. 2. Application model view
When a request gets a token it starts to be processed. In practice, this requestwould be served by a network of queues composed by hardware and softwareresources. We do not intend to find out what the bottlenecks of a system are,but to model the influence that the number of requests has in the system responsetime. Thus, we simplify the model by considering that all the admitted requestsenter into a processor sharing (PS) system called Server and get equal share ofsystem resources. If one request alone in the system is processed in t time units,when there are n requests each of them is processed in t × n time units. Thissystem is illustrated in Figure 2(c).
2.2 The software error injection system
The SEIS changes the application behavior to model the effects of software faults.We use Laprie’s dependability terminology defined in [9]. He considers faults asdefects that exist in the system. Faults may stay in a dormant state, or they canbe activated, leading to errors. Error conditions may lead the system to a failurewhen the expected behavior of the system is violated.
The SEIS introduces software errors into the managed application. Such er-rors can lead to performance degradation or to crash/hang failures. Softwareerrors are modeled by changing the inherent service demands that come withrequests based on a particular degradation function. Errors that lead to per-formance degradation failures occur when the application is available but doesnot accomplish its expected performance. They can be modeled by incrementinginherent service demands, as we exemplify in Section 3. When inherent servicedemands tend to infinite we consider the occurrence of a crash/hang failure.
2.3 The rejuvenation system
An RRS monitors each component of the application, detects/forecasts failuresand restart components in order to bring them to a clean state. The granularity ofthese components may change from system to system. Candea et al [6] considersJavaBeans components, while [8,7] consider a whole process. The output of anRRS determines which nodes or components must be restarted.
2.4 The dynamic provisioning system
A DPS changes application capacity to accommodate the current load. It en-compasses a feedback control loop. Monitoring information about the applicationand/or its environment is gathered and used to decide on the best number ofmachines to give to the application. DPSs differ from each other due to the mon-itoring information gathered and the objective function pursued. The output ofa DPS indicates the number of nodes that must be active. Actions are neededwhen this number differs from the current number of active nodes. When thisnew value is greater than the current one, nodes must migrate from a pool offree machines to the application. Otherwise, nodes must be released. In this case,the LB immediately stops sending requests to that node, but the node remainsactive until all requests already in place are processed [1].
2.5 Metrics of interest
Management systems (including the automated ones) typically aim at deliveringthe expected QoS at the lowest cost. Thus, an automated management systemcan be measured by two classes of metrics: (i) QoS metrics and (ii) cost metrics.
Two metrics related to the application QoS are going to be computed: averageresponse time (R) and average availability (A). For response times we consideronly the amount of time a request stayed in the server side. Moreover, we onlyconsider the response times of successful responses. Availability is computed asthe percentage of requests successfully processed during a measurement interval.
When a node of the data center is allocated to the application, it is in theactive state; otherwise, it is in the inactive state. In order to infer the operationalcost of an application we use the average number of active nodes that run theapplication. If we know the the amount of time the application ran and the costof an active node per time unit we can compute the application operational cost.
3 Instantiating the component-based model
In this section we present an instantiation of the generic model presented in thelast section. In Subsection 3.1 we define the behavior of some components ofthe model and in Subsection 3.2 we present the simulation parameters used toinstantiate the model compositions.

3.1 Components behavior
The DPS aims at maintaining nodes utilization around a target, as proposedin [1]. It periodically queries the application nodes for monitoring information.After each measurement interval the DPS queries nodes for the following mea-surements, computed for the previous interval: X , the number of request comple-tions; A, the number of request arrivals; and U , the average CPU utilization (overall nodes). Given N , the current number of nodes, and ρtarget, the target uti-lization, the DPS computes the required number of servers for the next intervalas follows: (i) it computes the average demand per completion as D = U/X ; (ii)it computes the normalized utilization as U ′ = max(A, X)×D; and (iii) it com-putes the number of servers needed to achieve ρtarget as dN ′ = N ×U ′/ρtargete.
The set of failures chosen to be modeled must be representative of the realworld, since we want to uncover plausible interactions. We only consider per-formance degradation failures seen by other researchers. We use results of ex-periments carried out by Li et al [5] with Apache Web server. By generating aconstant connection rate to the Web server they observed that response timesbecome longer over time, degrading around 0.03 ms per hour. Based on these re-sults we translated Li’s equation into one that relates service time to the amountof requests already serviced by a node. Let δi(t) be the number of requests servedby the node i since its last restart (or since it was activated). Each request rthat arrives into a node has its service demand changed according to the fol-lowing function: Sr,i(t) = S0,r + Saging(t); where Sr,i is the new service time;Saging(t) = 2.4 × 10⁻⁸δi(t) and represents the addition due to aging in servicetime; and S0,r is the inherent service time of the request.
The RRS works as follows. After each measurement interval, the RRS gathersthe current Saging of each node and their availabilities. It restarts a node when:(i) the node’s Saging value reaches a threshold; or (ii) the node’s availability issmaller than the minimum expected availability (Amin) for y consecutive mea-surement intervals. When a rejuvenation action is triggered, the RRS serves allrequests already in place before restarting the node process [10].
3.2 Simulation parameters
Both DPS and RRS are configured with 5 minutes measurement intervals. TheDPS target utilization may assume three values in different simulation experi-ments: 65%, 75% and 85%. The RRS’s Saging threshold is configured as 1 second.The minimum availability (Amin) and y are set to 99.99% and 6 respectively.
The application parameters are set as follows. The Server system timeslice is110 ms. The Backlog queue capacity is 1024. Both are in accordance with Linuxdefault. Migration time and effective restart time obey a normal distributionwith averages of 60 and 120 seconds, respectively. This is in accordance withsome experiments we conducted using JBoss [8]. The capacities of the nodescan assume different values in different simulation experiments: around 100, 300and 500 rps (requests per second). Nodes of low, medium and high capacityrespectively have a total number of tokens (mt,i) of 200, 500 and 1000. These
numbers were chosen to avoid a request to stay more than two seconds in theServer queue.
Our simulation experiments use a 17-hour workload generated by GEIST [11].This workload is variable and presents an average request rate of 670 rps.
The component based model allows us to build different compositions toreproduce different situations. The simplest composition is called AWoF (appli-cation without failure). The second one is called AWF (Application with fail-ures) and is composed by the application and the SEIS. The third model is theAWF+RRS, which encompasses the application, the SEIS and the RRS. Thesethree models use a static number of nodes calculated from results of simulationsof the AWoF model. The number allows an application without failures to han-dle the workload without violating the 99.99% of minimum availability and the2 seconds of maximum response times. The fourth and fifth model compositionsare called AWoF+DPS and AWF+DPS. Finally, the most complete model is theAWF+DPS+RRS, which encompasses the application, the SEIS, the DPS andthe RRS. In these models, DPS defines the amount of nodes to be operationalon the fly. All these compositions are necessary in order to allow us to compareresults of the most important model (the AWF+DPS+RRS) with results of theother intermediary models.
4 What happens when an application is controlled by a
dynamic provisioning and a rejuvenation system?
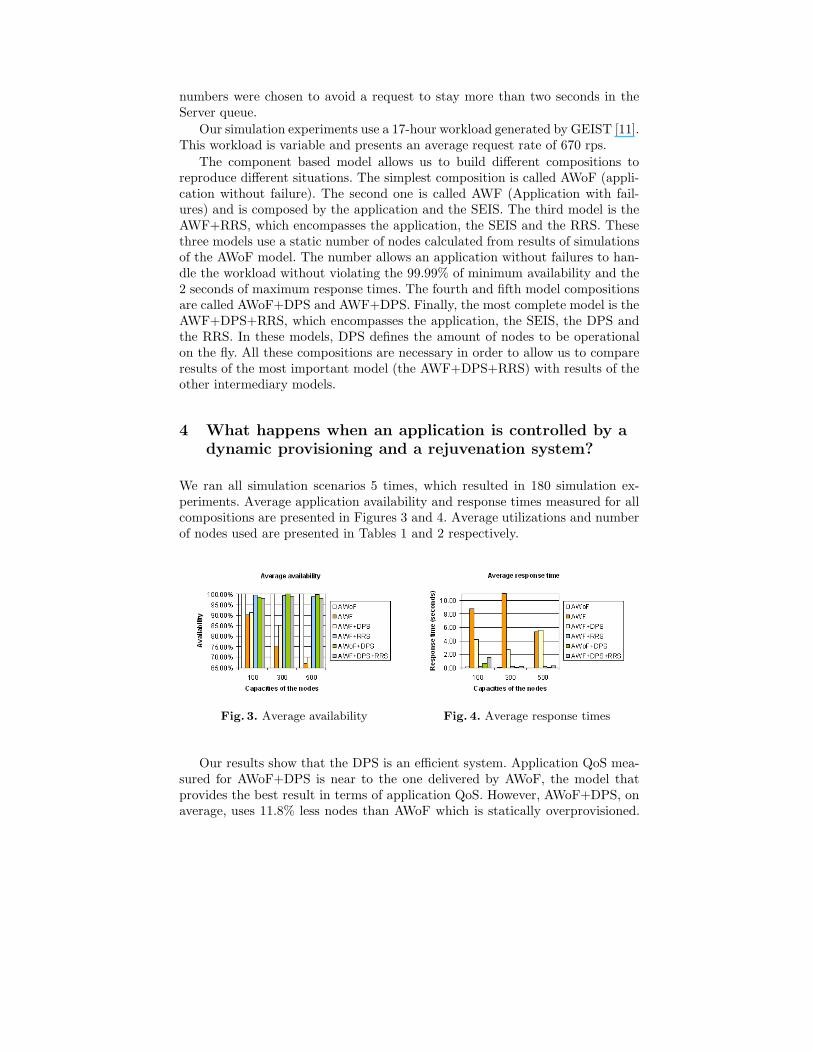
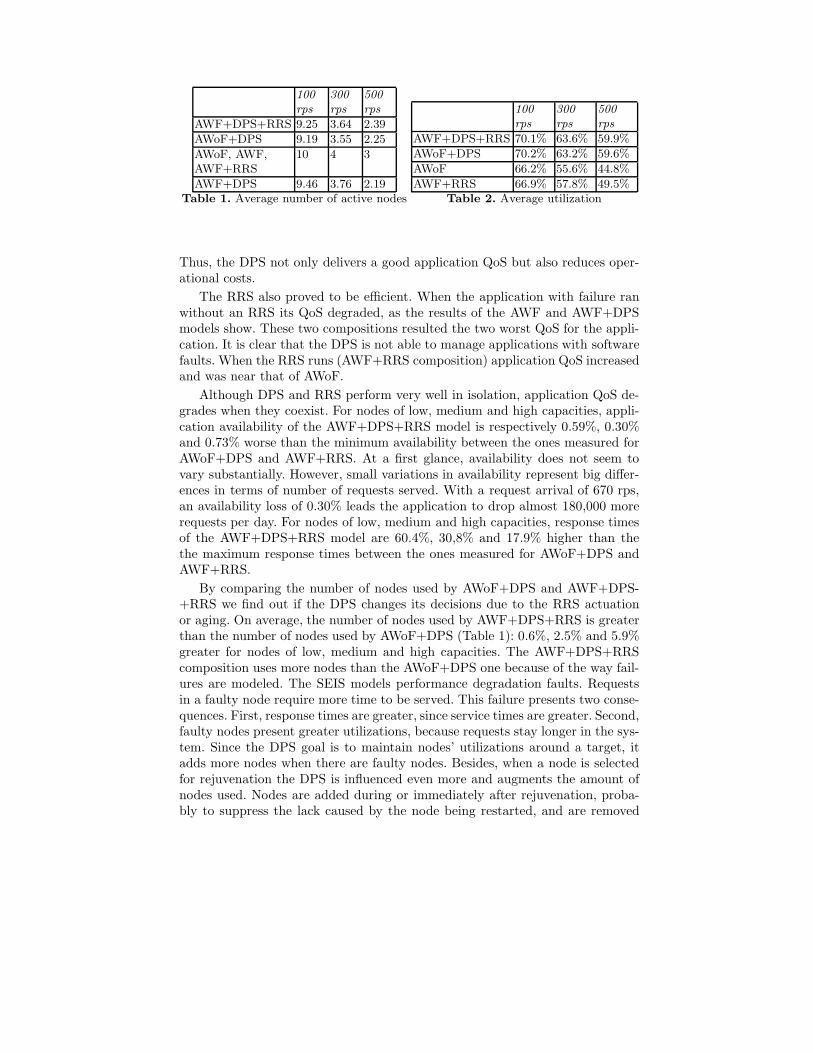
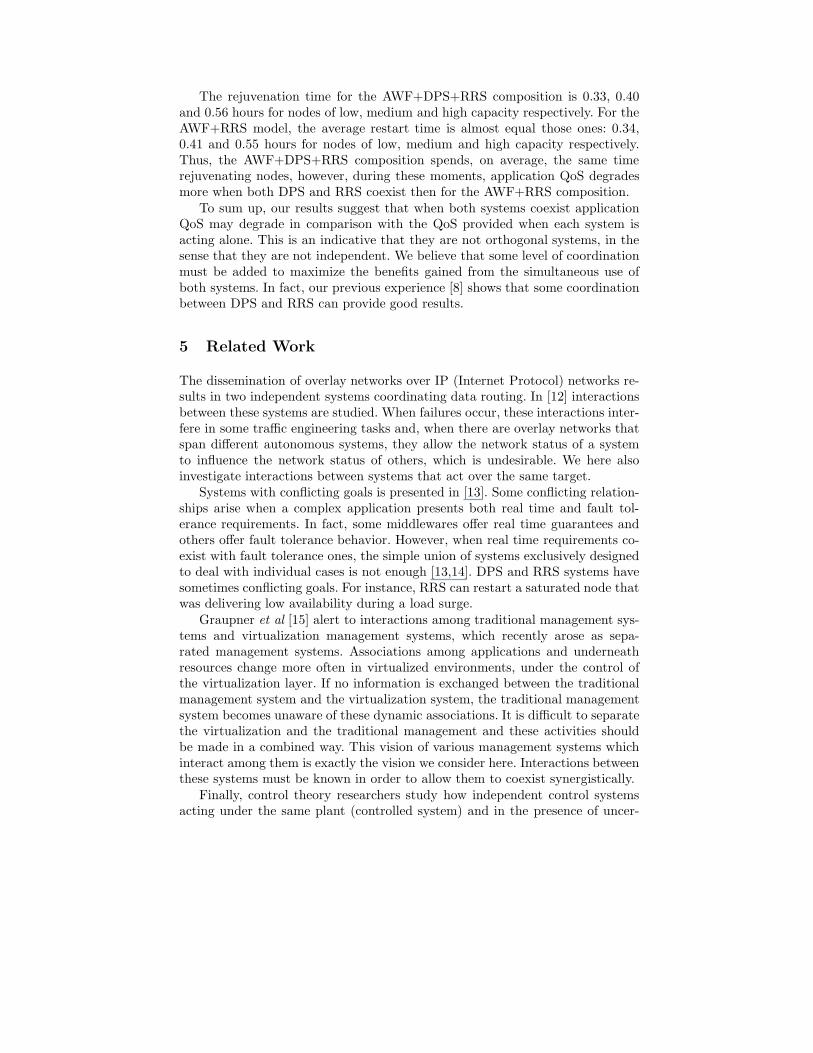
We ran all simulation scenarios 5 times, which resulted in 180 simulation ex-periments. Average application availability and response times measured for allcompositions are presented in Figures 3 and 4. Average utilizations and numberof nodes used are presented in Tables 1 and 2 respectively.
Fig. 3. Average availability Fig. 4. Average response times
Our results show that the DPS is an efficient system. Application QoS mea-sured for AWoF+DPS is near to the one delivered by AWoF, the model thatprovides the best result in terms of application QoS. However, AWoF+DPS, onaverage, uses 11.8% less nodes than AWoF which is statically overprovisioned.
100
rps
300
rps
500
rps
AWF+DPS+RRS 9.25 3.64 2.39
AWoF+DPS 9.19 3.55 2.25
AWoF, AWF,AWF+RRS
10 4 3
AWF+DPS 9.46 3.76 2.19Table 1. Average number of active nodes
100
rps
300
rps
500
rps
AWF+DPS+RRS 70.1% 63.6% 59.9%
AWoF+DPS 70.2% 63.2% 59.6%
AWoF 66.2% 55.6% 44.8%
AWF+RRS 66.9% 57.8% 49.5%Table 2. Average utilization
Thus, the DPS not only delivers a good application QoS but also reduces oper-ational costs.
The RRS also proved to be efficient. When the application with failure ranwithout an RRS its QoS degraded, as the results of the AWF and AWF+DPSmodels show. These two compositions resulted the two worst QoS for the appli-cation. It is clear that the DPS is not able to manage applications with softwarefaults. When the RRS runs (AWF+RRS composition) application QoS increasedand was near that of AWoF.
Although DPS and RRS perform very well in isolation, application QoS de-grades when they coexist. For nodes of low, medium and high capacities, appli-cation availability of the AWF+DPS+RRS model is respectively 0.59%, 0.30%and 0.73% worse than the minimum availability between the ones measured forAWoF+DPS and AWF+RRS. At a first glance, availability does not seem tovary substantially. However, small variations in availability represent big differ-ences in terms of number of requests served. With a request arrival of 670 rps,an availability loss of 0.30% leads the application to drop almost 180,000 morerequests per day. For nodes of low, medium and high capacities, response timesof the AWF+DPS+RRS model are 60.4%, 30,8% and 17.9% higher than thethe maximum response times between the ones measured for AWoF+DPS andAWF+RRS.
By comparing the number of nodes used by AWoF+DPS and AWF+DPS-+RRS we find out if the DPS changes its decisions due to the RRS actuationor aging. On average, the number of nodes used by AWF+DPS+RRS is greaterthan the number of nodes used by AWoF+DPS (Table 1): 0.6%, 2.5% and 5.9%greater for nodes of low, medium and high capacities. The AWF+DPS+RRScomposition uses more nodes than the AWoF+DPS one because of the way fail-ures are modeled. The SEIS models performance degradation faults. Requestsin a faulty node require more time to be served. This failure presents two conse-quences. First, response times are greater, since service times are greater. Second,faulty nodes present greater utilizations, because requests stay longer in the sys-tem. Since the DPS goal is to maintain nodes’ utilizations around a target, itadds more nodes when there are faulty nodes. Besides, when a node is selectedfor rejuvenation the DPS is influenced even more and augments the amount ofnodes used. Nodes are added during or immediately after rejuvenation, proba-bly to suppress the lack caused by the node being restarted, and are removed

shortly after being added. During a restart, the difference in terms of numberof nodes used by AWoF+DPS+RRS and AWoF+DPS increases to 1.6%, 12.5%and 27.7% for nodes of low, medium and high capacities respectively (Table 3).
Let us now discuss what happens with the application QoS during the restarts.We present average application availability and response time during restarts inFigures 5 and 6. The average number of nodes used and their utilizations duringrestarts are presented in Tables 3 and 4 respectively.
Fig. 5. Average availability (restart) Fig. 6. Average response times (restart)
100
rps
300
rps
500
rps
AWF+DPS+RRS 8.94 3.91 2.92
AWoF+DPS 8.80 3.42 2.11
AWF+RRS 10 4 3Table 3. Average number of activenodes during rejuvenation
100
rps
300
rps
500
rps
AWF+DPS+RRS 74.3% 77.2% 68.3
AWoF+DPS 71.8% 65.3% 60.2%
AWF+RRS 72.0% 72.7% 62.8%Table 4. Average utilization during re-juvenation
Overprovisioned applications cope better with rejuvenation than the appli-cations managed by a DPS. We found out that, during restarts, for low, mediumand high capacity nodes respectively, average application availability measuredfor the AWF+RRS is 0.25%, 0.56% and 1.16% better than the availability mea-sured for the AWF+DPS+RRS composition. The application response time dur-ing rejuvenation of nodes of low, medium and high capacities is 16.1%, 4.0% and19.3% better for the AWF+RRS model than for the AWF+DPS+RRS one.
When both systems coexist the average utilization of the nodes during restartis greater than the utilization of the nodes from the AWF+RRS (Table 4).The overprovisioned AWF+RRS composition always uses more nodes than theAWF+DPS+RRS one. The number of nodes used by the DPS during the restartof a node for the AWF+DPS+RRS model is not enough to suppress the lack ofthe node being restarted. As a result, the active nodes of the AWF+DPS+RRSmodel become more saturated during restarts, increasing the probability of re-quest rejection (when the Backlog is full) and increasing response times.
The rejuvenation time for the AWF+DPS+RRS composition is 0.33, 0.40and 0.56 hours for nodes of low, medium and high capacity respectively. For theAWF+RRS model, the average restart time is almost equal those ones: 0.34,0.41 and 0.55 hours for nodes of low, medium and high capacity respectively.Thus, the AWF+DPS+RRS composition spends, on average, the same timerejuvenating nodes, however, during these moments, application QoS degradesmore when both DPS and RRS coexist then for the AWF+RRS composition.
To sum up, our results suggest that when both systems coexist applicationQoS may degrade in comparison with the QoS provided when each system isacting alone. This is an indicative that they are not orthogonal systems, in thesense that they are not independent. We believe that some level of coordinationmust be added to maximize the benefits gained from the simultaneous use ofboth systems. In fact, our previous experience [8] shows that some coordinationbetween DPS and RRS can provide good results.
5 Related Work
The dissemination of overlay networks over IP (Internet Protocol) networks re-sults in two independent systems coordinating data routing. In [12] interactionsbetween these systems are studied. When failures occur, these interactions inter-fere in some traffic engineering tasks and, when there are overlay networks thatspan different autonomous systems, they allow the network status of a systemto influence the network status of others, which is undesirable. We here alsoinvestigate interactions between systems that act over the same target.
Systems with conflicting goals is presented in [13]. Some conflicting relation-ships arise when a complex application presents both real time and fault tol-erance requirements. In fact, some middlewares offer real time guarantees andothers offer fault tolerance behavior. However, when real time requirements co-exist with fault tolerance ones, the simple union of systems exclusively designedto deal with individual cases is not enough [13,14]. DPS and RRS systems havesometimes conflicting goals. For instance, RRS can restart a saturated node thatwas delivering low availability during a load surge.
Graupner et al [15] alert to interactions among traditional management sys-tems and virtualization management systems, which recently arose as sepa-rated management systems. Associations among applications and underneathresources change more often in virtualized environments, under the control ofthe virtualization layer. If no information is exchanged between the traditionalmanagement system and the virtualization system, the traditional managementsystem becomes unaware of these dynamic associations. It is difficult to separatethe virtualization and the traditional management and these activities shouldbe made in a combined way. This vision of various management systems whichinteract among them is exactly the vision we consider here. Interactions betweenthese systems must be known in order to allow them to coexist synergistically.
Finally, control theory researchers study how independent control systemsacting under the same plant (controlled system) and in the presence of uncer-

tainties actuate such as the desired global state of the system is reached. Thisproblem is known as the decentralized adaptive control problem [16]. Accordingto [16,17,18] distributed control systems need to exchange information in or-der to reduce the error of control actions. In [17], for instance, control systemsactuate in different and pre-scheduled moments and when one system makes adecision about a control action the others must be aware of that. In [18] thecontrol system which actuate over a subsystem must know the desired statusof all subsystems that compounds the plant. It is clear that an extra effort isneeded to coordinate the actions of control systems which actuate over the sameplant. In the future, similar techniques may be introduced into DPS and RRSbehavior in order to make their coexistence more efficient. This work providessome insights on how these systems coexist without these techniques.
6 Conclusions and future research
In this paper we propose a component based model used to better understand theinteractions between dynamic provisioning and restart systems that act withoutcoordination over the same application. We implemented the model and in-stantiated many different compositions. Then, we evaluated the model throughsimulation experiments.
Even in the very simple scenario studied, where only one node can be reju-venated at a time, we can see that DPS and RRS may interact in a way that ap-plication QoS is degraded when both systems run simultaneously if compared toperformance of systems that use each of the management services independently.Even worse, performance degrades when a slightly great number of resources areused. We believe that for more complex applications, with many tiers, and higherfailure rates these unwanted interactions will be even more present.
According to our results, it is inefficient to join a DPS and an RRS thatare not aware of each other. We believe they can exchange some informationto allow the coordination of their actions in a synergistic manner. The way theapplication fail and the moments when one or more nodes are restarted influencenot only the application QoS but also DPS actions. If DPS is aware of failureinformation and RRS actions it could act in a more efficient manner. One ofthese positive manners was presented in [8], where aged nodes were releasedwhen a capacity decreasing was performed.
Our next step is to propose an coordination module that makes the coexis-tence of these systems completely harmonic. This additional module is interest-ing because it allows us to harness mature dynamic provisioning and rejuvenationsystems. We plan to analyze and validate this coordination module by carryingout simulations and measurement experiments.
Acknowledgments. We would like to thank Dr. Alexander Keller and the anony-
mous reviewers for their helpful comments. This work was developed in collaboration
with HP Brazil R&D and funded by CNPq/Brazil grants 141655/2002-0, 302317/2003-
1 and 300646/1996-8.

References
1. Ranjan, S., Rolia, J., Fu, H., Knightly, E.: Qos-driven server migration for internetdata centers. In: Proceedings of the International Workshop on Quality of Service.(2002) 3 – 12
2. Lassettre, E., et al: Dynamic surge protection: An approach to handling unexpectedworkload surges with resource actions that have dead times. In: 14th IFIP/IEEEInternational Workshop on Distributed Systems: Operations and Management.Volume 2867 of Lecture Notes in Computer Science., Springer (2003) 82–92
3. Urgaonkar, B., Shenoy, P.: Cataclysm: Handling extreme overloads in internetapplications. In: Proceedings of the Fourteenth International World Wide WebConference (WWW 2005). (2005)
4. Garg, S., et al: Analysis of preventive maintenance in transactions based softwaresystems. IEEE Transactions on Computers 47 (1998)
5. Li, L., Vaidyanathan, K., Trivedi, K.S.: An approach for estimation of softwareaging in a web server. In: International Symposium on Empirical Software Engi-neering. (2002)
6. Candea, G., et al: Microreboot – a technique for cheap recovery. In: Proceedingsof the 6th Symposium on Operating Systems Design and Implementation. (2004)
7. Hong, Y., Chen, D., Li, L., Trivedi, K.: Closed loop design for software rejuvena-tion. In: Workshop on Self-Healing, Adaptive, and Self-Managed Systems. (2002)
8. Lopes, R., Cirne, W., Brasileiro, F.: Improving dynamic provisioning systems usingsoftware restarts. In: Fifteenth IFIP/IEEE International Workshop on DistributedSystems: Operations and Management. LNCS. Volume 3278., Springer (2004)
9. Anderson, T., ed.: Edpendability of Resilient Computers. Blackwell ScientificPublications, Oxford (1989)
10. Candea, G., Fox, A.: Recursive restartability: Turning the reboot sledgehammerinto a scalpel. In: Proceedings of the Eighth Workshop on Hot Topics in OperatingSystems. (2001) 125–132
11. Kant, K., Tewari, V., Iyer, R.: Geist: A generator of e-commerce and internet servertraffic. In: Proceedings of the 2001 IEEE International Symposium on PerformanceAnalysis of Systems and Software, IEEE Computer Society (2001) 49–56
12. Keralapura, R., Taft, N., Iannaccone, C.N.C.G.: Can isps take the heat fromoverlay networks? In: ACM SIGCOMM Workshop on Hot Topics in Networks.(2004)
13. Narasimhan, P.: Trade-offs between real-time and fault tolerance for middlewareapplications. In: Workshop on Foundations of Middleware Technologies. (2002)
14. Stankovic, J.A., F.Wang: The integration of scheduling and fault tolerance inreal-time systems. Technical report, UM-CS-1992-049, Department of ComputerScience, University of Massachusetts (1992)
15. Graupner, S., et al: Impact of virtualization on management systems. Technicalreport, Hewlett-Packard Laboratories (2003)
16. Mukhopadhyay, S.: Distributed control and distributed computing. SIGAPP Appl.Comput. Rev. 7 (1999) 23–24
17. Mukhopadhyay, S., Narendra, K.S.: Decentralized adaptive control using partialinformation. In: American Control Conference. Volume 1. (1999) 34 – 38
18. Narendra, K.S., Oleng, N.O.: Decentralized adaptive control. In: American ControlConference. Volume 5. (2002) 3407 – 3412