Cambios acústicos de la voz como signos de fatiga vocal en locutores de radio: resultados...
8
Acta Otorrinolaringol Esp. 2013;64(3):176---183 www.elsevier.es/otorrino ORIGINAL ARTICLE Acoustic Changes of the Voice as Signs of Vocal Fatigue in Radio Broadcasters: Preliminary Findings Marco Guzmán, a,∗ María Celina Malebrán, b Paulina Zavala, c Patricio Saldívar, d Daniel Mu˜ noz e a Escuela de Fonoaudiología, Universidad de Chile, Santiago, Chile b Escuela de Fonoaudiología, Universidad del Mar y Universidad de Valparaíso, Valparaíso, Chile c Escuela de Fonoaudiología, Universidad del Mar, Re˜ naca, Valparaíso, Chile d Departamento de Voz y Carrera de actuación teatral de la Universidad de Valparaíso, Valparaíso, Chile e Facultad de Medicina, Universidad de Chile, Santiago, Chile Received 4 September 2012; accepted 15 November 2012 KEYWORDS Vocal fatigue; Broadcasters; Acoustic analysis; Vocal loading; Cepstrum Abstract Introduction and objective: Vocal fatigue is one of the most common voice symptoms. It usually refers to the sensation of vocal tiredness after a long period of speaking or singing. The purpose of this study was to compare the acoustic characteristics of the voice before and after a long period of voice use in a group of radio broadcasters. Methods: Eight radio broadcasters with normal voices were assessed. We used cepstrum, energy ratio, noise to harmonic ratio and soft phonation index as acoustic variables to assess the possible pre---post vocal loading changes objectively. Results: There were no statistically significant pre---post differences in any of the acoustic parameters. Although cepstrum at high pitch did not show a significant difference, it obtained the greatest difference among the acoustic variables. Conclusions: The acoustic measurements used in the present study might not be sensitive enough or appropriate for detecting vocal changes after a long period of voice use, whether in reading (as reported in previous research) or speaking tasks. Moreover, a longer period of vocal loading would eventually reveal more evident and consistent acoustic voice changes. © 2012 Elsevier España, S.L. All rights reserved. PALABRAS CLAVE Fatiga vocal; Locutores; Análisis acústico; Cambios acústicos de la voz como signos de fatiga vocal en locutores de radio: resultados preliminares Resumen Introducción y objetivos: En la clínica de voz, unos de los síntomas más frecuentes es la fatiga vocal, la cual usualmente se refiere a la sensación de cansancio de la voz posterior al uso Please cite this article as: Guzmán M, et al. Cambios acústicos de la voz como signos de fatiga vocal en locutores de radio: resultados preliminares. Acta Otorrinolaringol Esp. 2013;64:176---83. ∗ Corresponding author. E-mail address: [email protected] (M. Guzmán). 2173-5735/$ – see front matter © 2012 Elsevier España, S.L. All rights reserved. Document downloaded from http://www.elsevier.es, day 29/06/2016. This copy is for personal use. Any transmission of this document by any media or format is strictly prohibited.
-
Upload
independent -
Category
Documents
-
view
1 -
download
0
Transcript of Cambios acústicos de la voz como signos de fatiga vocal en locutores de radio: resultados...

A
O
AB
MD
a
b
c
d
e
R
p
2
Document downloa
cta Otorrinolaringol Esp. 2013;64(3):176---183
www.elsevier.es/otorrino
RIGINAL ARTICLE
coustic Changes of the Voice as Signs of Vocal Fatigue in Radioroadcasters: Preliminary Findings�
arco Guzmán,a,∗ María Celina Malebrán,b Paulina Zavala,c Patricio Saldívar,d
aniel Munoze
Escuela de Fonoaudiología, Universidad de Chile, Santiago, ChileEscuela de Fonoaudiología, Universidad del Mar y Universidad de Valparaíso, Valparaíso, ChileEscuela de Fonoaudiología, Universidad del Mar, Renaca, Valparaíso, ChileDepartamento de Voz y Carrera de actuación teatral de la Universidad de Valparaíso, Valparaíso, ChileFacultad de Medicina, Universidad de Chile, Santiago, Chile
eceived 4 September 2012; accepted 15 November 2012
KEYWORDSVocal fatigue;Broadcasters;Acoustic analysis;Vocal loading;Cepstrum
AbstractIntroduction and objective: Vocal fatigue is one of the most common voice symptoms. It usuallyrefers to the sensation of vocal tiredness after a long period of speaking or singing. The purposeof this study was to compare the acoustic characteristics of the voice before and after a longperiod of voice use in a group of radio broadcasters.Methods: Eight radio broadcasters with normal voices were assessed. We used cepstrum, energyratio, noise to harmonic ratio and soft phonation index as acoustic variables to assess thepossible pre---post vocal loading changes objectively.Results: There were no statistically significant pre---post differences in any of the acousticparameters. Although cepstrum at high pitch did not show a significant difference, it obtainedthe greatest difference among the acoustic variables.Conclusions: The acoustic measurements used in the present study might not be sensitiveenough or appropriate for detecting vocal changes after a long period of voice use, whether inreading (as reported in previous research) or speaking tasks. Moreover, a longer period of vocalloading would eventually reveal more evident and consistent acoustic voice changes.© 2012 Elsevier España, S.L. All rights reserved.
ded from http://www.elsevier.es, day 29/06/2016. This copy is for personal use. Any transmission of this document by any media or format is strictly prohibited.
PALABRAS CLAVE
Fatiga vocal;Locutores;Análisis acústico;Cambios acústicos de la voz como signos de fatiga vocal en locutores de radio:resultados preliminares
ResumenIntroducción y objetivos: En la clínica de voz, unos de los síntomas más frecuentes es la fatigavocal, la cual usualmente se refiere a la sensación de cansancio de la voz posterior al uso
� Please cite this article as: Guzmán M, et al. Cambios acústicos de la voz como signos de fatiga vocal en locutores de radio: resultadosreliminares. Acta Otorrinolaringol Esp. 2013;64:176---83.∗ Corresponding author.
E-mail address: [email protected] (M. Guzmán).
173-5735/$ – see front matter © 2012 Elsevier España, S.L. All rights reserved.

Acoustic Changes of the Voice as Signs of Vocal Fatigue in Radio Broadcasters: Preliminary Findings 177
Carga vocal;Cepstrum
prolongado de esta durante tareas de habla o canto. El propósito de este estudio fue compararlas características acústicas de la voz antes y después de un periodo prolongado de uso de lavoz en una población de locutores radiales.Métodos: Ocho locutores radiales con voces normales, fueron evaluados. Cepstrum, energyratio, índice ruido-armónico e índice de fonación suave fueron los parámetros acústicos utiliza-dos para valorar objetivamente el posible cambio pre y post locución.Resultados: Ninguno de los parámetros evaluados mostró una diferencia estadísticamente sig-nificativa entre las muestras pre y post locución. A pesar de no ser significativo, el parámetroque obtuvo mayor diferencia fue el cepstrum durante la fonación de F0 aguda.Conclusiones: Posiblemente las medidas acústicas utilizadas no son lo suficientemente sensibleso adecuadas para detectar eventuales cambios vocales después de un periodo vocal prolongado,ya sea a través de tareas de lecturas como ha sido reportado por previos estudios, como tampocoen tareas de locución. Además, eventualmente un periodo de tiempo de carga vocal mayor alutilizado en esta investigación podría revelar cambios acústicos más evidentes y consistentes.
. Tod
sfmovt
tfoishvt
pdbncvmriotst
aoou
M
S
Document downloaded from http://www.elsevier.es, day 29/06/2016. This copy is for personal use. Any transmission of this document by any media or format is strictly prohibited.
© 2012 Elsevier España, S.L
Introduction
Vocal fatigue is one of the most common voice symptoms.1,2
It usually refers to a feeling of tiredness of the voice afterits prolonged use during speech tasks.3,4 Subjects presentingsuch symptoms usually require more effort to continue pro-ducing phonation5 and usually present changes in vocalquality (vocal timbre), intensity, fundamental frequency(F0)6 and a feeling of laryngeal discomfort, including pain,foreign body sensation, inflammation, muscle tension inthe cervical/pharyngeal area and laryngeal dryness.4 Somevoice professionals often report that vocal fatigue is associ-ated to a decrease in vocal projection, tonal range, dynamicrange, an increase in the effort required to produce voiceand a sensation of laryngeal and pharyngeal constriction.7---9
Several studies agree that the prevalence of vocal fatiguesymptoms among certain voice professionals is associatedwith high rates of vocal disease.6,10---13 From these obser-vations we can infer that vocal fatigue in certain groupsrepresents a potential for vocal fold lesions.
Precise methods for assessing vocal fatigue are difficultto implement because they require a series of neuromus-cular and biomechanical data that can be only obtainedthrough invasive explorations.14 Vocal fatigue has mostlybeen studied by directed induction of voice fatigue invoice professionals. These studies have employed prolongedperiods of reading aloud in order to cause fatigue in thevoice of subjects. In most studies, data collection was car-ried out by acoustic and aerodynamic measurements, beforeand after vocal loading.4,15---17
Acoustic measurements have been widely used as amethod for the assessment of vocal fatigue. However, theresults are not conclusive.4,5,15,18,19 For example, jitter andshimmer values have been observed to significantly increasein some subjects following vocal fatigue experimentation,whilst other subjects have not manifested such changes.4,5,18
Several studies have reported that F0 increases with vocalfatigue,4,15,20---22 whilst other studies have suggested theopposite.1
Stroboscopic and aerodynamic measurements have also
been used to document vocal fatigue in physiological terms.In general, an increase in the transglottic flow rate, adecrease in the maximum phonation time and incompleteglottal closure have all been associated with vocal fatigueT3pi
os los derechos reservados.
ymptoms.4,5,13,20 Netsell indicated that subjects with vocalatigue may present a breathy voice (also known as mur-ured voice, soughing or susurration) due to excessive loss
f air through the glottis during phonation, or else a tenseoice quality due to the compensatory effort made in ordero reduce excess transglottic flow.23,24
The pressure threshold of phonation (minimum subglot-ic pressure required to start the oscillation of the vocalolds) has been investigated as a possible objective markerf presumed changes in the viscosity of vocal tissue dur-ng vocal fatigue (biomechanical changes).25,26 Other relatedtudies27---30 have provided evidence suggesting that theydration state is important in regulating the viscosity ofocal tissues, and that this viscosity is directly proportionalo the pressure threshold of phonation.
Most studies of vocal fatigue have been conducted onopulations of teachers,2,6,10,31,32 with no studies being con-ucted among other professional voice users, such as radioroadcasters. Although the latter group of professionals isot among the top sufferers of vocal involvement, as is thease with teachers,6,11,33,34 clinical observations show thatocal fatigue after a day of work is one of the most com-on complaints among radio broadcasters. Vocal discomfort
eported by these subjects may have various origins, includ-ng vocal overuse, habits of vocal abuse and misuse and lackf proper vocal training.35 Malebrán and Saldivar reportedhat over half of a group of radio broadcasters examined pre-ented signs of vocal fatigue and a lack of adequate vocalechnique.36
The purpose of the present study is to compare the vocalcoustic characteristics before and after a prolonged periodf voice use among a population of radio broadcasters. Twof the acoustic markers used in this study have not beensed previously.
ethod
ubjects
he sample consisted of eight broadcasters aged between4 and 61 years, with a mean value of 44 years, who haderceptually normal voices. Two of the subjects includedn the study were female and six were male. This group of

1
phtpacagtv(
R
Tadcaedfw1ddIl
P
Pt
-
-
-
-
totatatt/teomt
A
TatipTtaa
PPCpo(t
S
DSCeSpt
R
TsotpsasaisuTahaaptsrwpeight subjects obtained an increase in the value of SPI.
Document downloaded from http://www.elsevier.es, day 29/06/2016. This copy is for personal use. Any transmission of this document by any media or format is strictly prohibited.
78
articipants corresponded to the total population of radioosts working at the radio station selected for data collec-ion in this research. None had a history of vocal treatmentrior to the completion of this study and none reportedny degree of hearing impairment. The evaluations werearried out with the understanding of all participants andfter signing informed consent documents. Importantly, thisroup of participants was selected taking into account thatheir vocal complaints were always related to signs ofocal abuse and fatigue after a working shift of speech1 h).
ecording
he voice of each subject was recorded before and after session of vocal loading through speech. The recor-ing was done using an AKG® Perception 120 modelondenser microphone. The microphone was placed on
pedestal and located 10 cm away from the mouth ofach subject. Subjects remained standing during recor-ing. We used an M-Audio® v.1.03 sound interface systemor preamplification and digitalisation. The recordingsere made with a sampling frequency of 44 kHz and6-bit quantisation, within a soundproofed recording stu-io. Capturing and recording of the voice signals wasone using the Praat® programme.37 We used a 8810 CE-EC 651 type II sonometer to control the sound pressureevel.
honatory Tasks
articipants were asked to perform the following phonatoryasks during the recording process:
The vowel /a/ sustained in a comfortable tone for eachsubject (medium range).
The vowel /a/ sustained using a F0 1 octave higher thanthe comfortable tone used previously.
The vowel /a/ sustained using a F0 1 major third belowthe comfortable tone used previously.
Reading a phonetically balanced text of 104 words for1 min using an average and comfortable intensity for eachsubject.
To control the fundamental frequency used during sus-ained phonation of the vowel /a/ (three different tones),ne of the authors matched the medium spoken tone ofhe first vowel /a/ for each subject (comfortable tone) to
tone in an electronic keyboard. Subsequently, based onhis tone, the experimenter presented a sound 1 octavebove the medium spoken tone and then a sound 1 majorhird below the original tone. Each participant was askedo reproduce each of the tones presented using the vowela/. The recording was started after subjects demonstratedhe ability to perform the phonatory task in the tone deliv-
red by the examiner. Although this was the intendedbjective for all subjects tested, in some cases a lack ofusical ear did not allow an exact match of the requestedones.
Awo(
M. Guzmán et al.
coustic Analysis
he acoustic analysis of all voice samples taken before andfter the speech task included: cepstrum (dual fast Fourierransform), noise-harmonic ratio (NHR), soft phonationndex (SPI) and energy ratio (difference between the highesteak at 0---2000 Hz and the highest peak at 2000---4000 Hz).he latter measurement was used to evaluate changes inhe spectral slope. Two of these measurements (cepstrumnd energy ratio) have not been used previously as potentialcoustic markers of vocal fatigue.
We used the software package Multi-Speech Mainrogramme®, model 3700, v.3.2.0 (Kay Elemetrics, Lincolnark, NJ, USA) for the analysis of cepstrum, SPI and NHR.epstrum analysis was performed with a 1024 window sam-le and a Hamming-type window. Energy ratio values werebtained with the software package Wavesurfer® v.1.8.5Jonas Beskow and Kåre Sjölander, Sweden) through long-erm average spectrum (LTAS) analysis window.
tatistical Analysis
ata were analysed using the statistical software packagetata® 12.1 (StataCorp 2011, College Station, TX: Stata-orp LP, USA). The acoustic parameters of the voice werexpressed as mean and standard deviation. We used thetudent t test for paired data when comparing pre- andost-loading values. A value of P<.05 was considered as sta-istically significant for all hypothesis contrasts.
esults
he results (mean values pre- and post-speech loading,tandard deviation and value of P) for the acoustic analysisf cepstrum parameters at different frequencies, long-erm average spectrum (LTAS) and noise measurements areresented in Table 1. None of the evaluated parametershowed a statistically significant difference between pre-nd post-speech loading values. However, despite not beingignificant, the parameter which obtained the greatest pre-nd post-speech loading difference was the cepstrum dur-ng phonation of acute F0 (7.77 ± 9.68) (P=.0574). Fig. 1hows the effect of the vocal load period on cepstrum val-es at the various F0 studied in each subject individually.his figure shows that the cepstrum value which obtained
more systematic decrease was in samples produced withigh F0. In total, seven of the eight participants presented
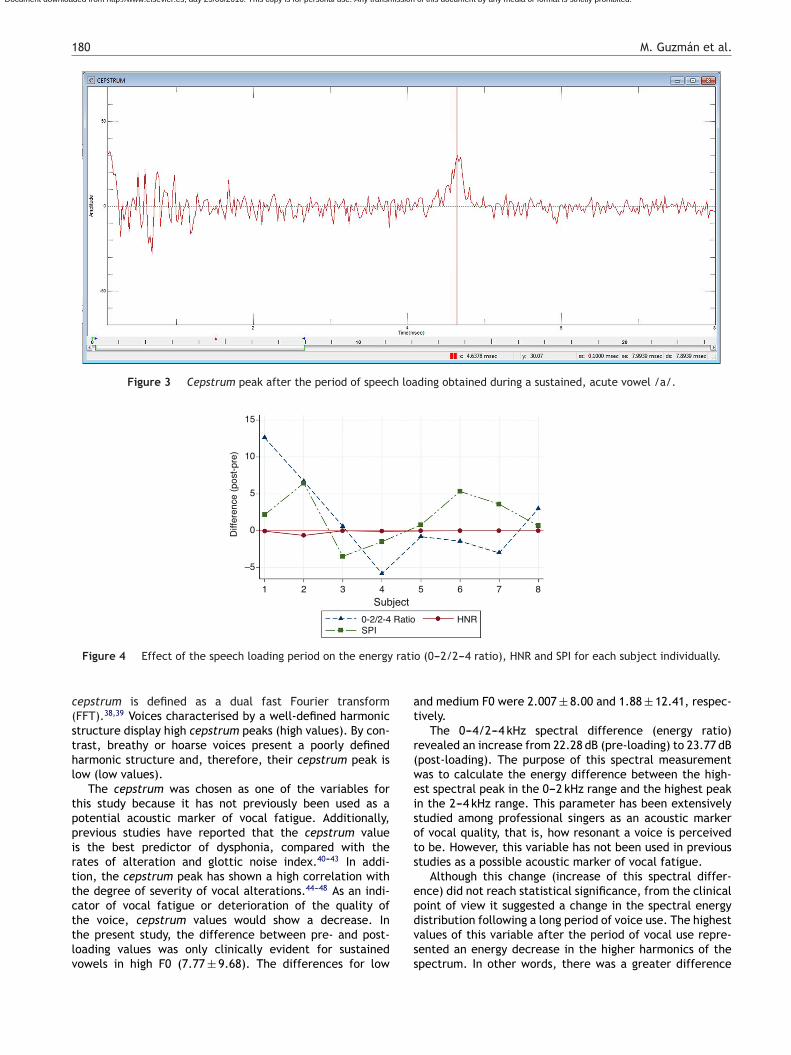
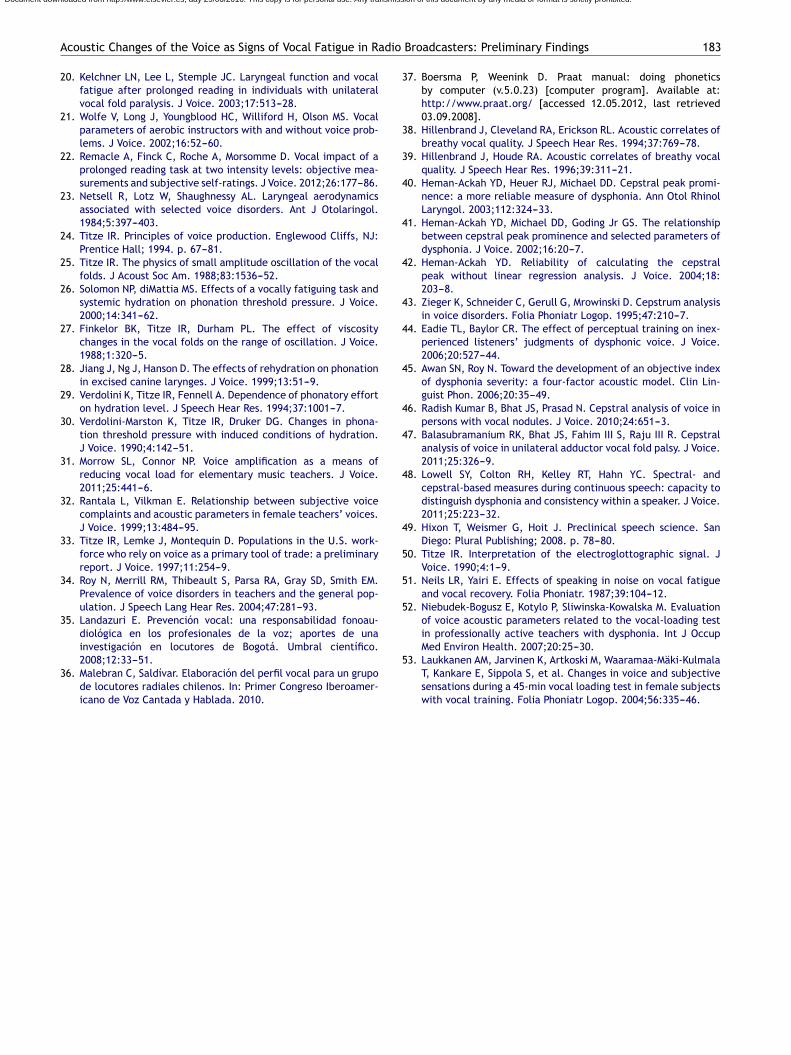
decrease in the cepstrum values when comparing pre-nd post-loading emissions. Figs. 2 and 3 show cepstrumeaks before and after loading, respectively, obtained forhe acute vowel /a/ steadily for subject number 3. Fig. 4hows the effect of treatment on the energy ratio (0---2/2---4atio), HNR and SPI for each subject individually. The SPIas the variable which most systematically showed there- and post-loading difference. Specifically, five of the
dditionally, it is important to note that although thereere no significant differences, the SPI showed the sec-nd lowest P-value in the analysis of statistical significanceP=.1787).
Acoustic Changes of the Voice as Signs of Vocal Fatigue in Radio Broadcasters: Preliminary Findings 179
Table 1 Pre- and Post-Loading Mean Values, Standard Deviation and Value of P for the Acoustic Analysis of the CepstrumParameters at Various Frequencies, LTAS and Noise Measurements.
Parameter Pre Post Difference Value of P
Cepstrum (acute) 36.32 ± 11.93 28.54 ± 4.70 7.77 ± 9.68 .0574Cepstrum (medium) 30.53 ± 13.85 32.41 ± 12.79 1.88 ± 12.41 .6807Cepstrum (low) 19.05 ± 7.24 21.05 ± 8.28 2.007 ± 8.00 .50090---2/2---4 ratio 22.28 ± 4.86 23.77 ± 4.56 1.48 ± 5.86 .4962NHR 0.22 ± 0.21 0.13 ± 0.02 0.09 ± 0.22 .2856SPI 8.91 ± 5.49 10.67 ± 5.23 1.76 ± 3.34 .1787
LTAS: long-term average spectrum; NHR: noise-harmonic ratio; SPI: soft phonation index.
20
10
0
–10
–20
1 2 3 4 5 6 7 8
Subject
Diff
eren
ce (
post
-pre
)
Cepstrum (medium)Cepstrum (low)
Cepstrum (acute)
validua
t
Document downloaded from http://www.elsevier.es, day 29/06/2016. This copy is for personal use. Any transmission of this document by any media or format is strictly prohibited.
Figure 1 Effect of the speech loading period on cepstrumindiv
Discussion
The results of this study reveal that none of the acousticparameters showed a statistically significant pre- and post-speech loading difference. Despite not being significant,
(mtb
Figure 2 Cepstrum peak prior to the period of speech lo
ues at the different F0 used for each subject in the studylly.
he difference in cepstrum values before (36.33) and after
28.55) the speech task for acute F0 production were theost notable among all the variables. In clinical terms,his decrease in the cepstrum value implies a more unsta-le voice, with less energy and less periodic signal. The
ading obtained during a sustained, acute vowel /a/.
180 M. Guzmán et al.
Figure 3 Cepstrum peak after the period of speech loading obtained during a sustained, acute vowel /a/.
15
10
5
0
–5
1 2 3 4 5
0-2/2-4 Ratio
Diff
eren
ce (
post
-pre
)
SPIHNR
Subject6 7 8
rati
c(sthl
tppirttcttlv
at
r(weisots
ep
Document downloaded from http://www.elsevier.es, day 29/06/2016. This copy is for personal use. Any transmission of this document by any media or format is strictly prohibited.
Figure 4 Effect of the speech loading period on the energy
epstrum is defined as a dual fast Fourier transformFFT).38,39 Voices characterised by a well-defined harmonictructure display high cepstrum peaks (high values). By con-rast, breathy or hoarse voices present a poorly definedarmonic structure and, therefore, their cepstrum peak isow (low values).
The cepstrum was chosen as one of the variables forhis study because it has not previously been used as aotential acoustic marker of vocal fatigue. Additionally,revious studies have reported that the cepstrum values the best predictor of dysphonia, compared with theates of alteration and glottic noise index.40---43 In addi-ion, the cepstrum peak has shown a high correlation withhe degree of severity of vocal alterations.44---48 As an indi-ator of vocal fatigue or deterioration of the quality of
he voice, cepstrum values would show a decrease. Inhe present study, the difference between pre- and post-oading values was only clinically evident for sustainedowels in high F0 (7.77 ± 9.68). The differences for lowdvss
o (0---2/2---4 ratio), HNR and SPI for each subject individually.
nd medium F0 were 2.007 ± 8.00 and 1.88 ± 12.41, respec-ively.
The 0---4/2---4 kHz spectral difference (energy ratio)evealed an increase from 22.28 dB (pre-loading) to 23.77 dBpost-loading). The purpose of this spectral measurementas to calculate the energy difference between the high-st spectral peak in the 0---2 kHz range and the highest peakn the 2---4 kHz range. This parameter has been extensivelytudied among professional singers as an acoustic markerf vocal quality, that is, how resonant a voice is perceivedo be. However, this variable has not been used in previoustudies as a possible acoustic marker of vocal fatigue.
Although this change (increase of this spectral differ-nce) did not reach statistical significance, from the clinicaloint of view it suggested a change in the spectral energy
istribution following a long period of voice use. The highestalues of this variable after the period of vocal use repre-ented an energy decrease in the higher harmonics of thepectrum. In other words, there was a greater difference
Acoustic Changes of the Voice as Signs of Vocal Fatigue in Radio Broadcasters: Preliminary Findings 181
dB
df: 1611
db: 20.9
–10
–20
–30
–40
–50
–60
–70
–80
–90
–100
0.2 0.4 0.6 0.8 1.0 1.2 1.4 1.6 1.8 2.0 2.2 2.4 2.6 2.8 3.0 3.2 3.4 3.6 3.8 4.0 4.2 4.4 4.6 4.8 5.0 5.2 5.4kHz
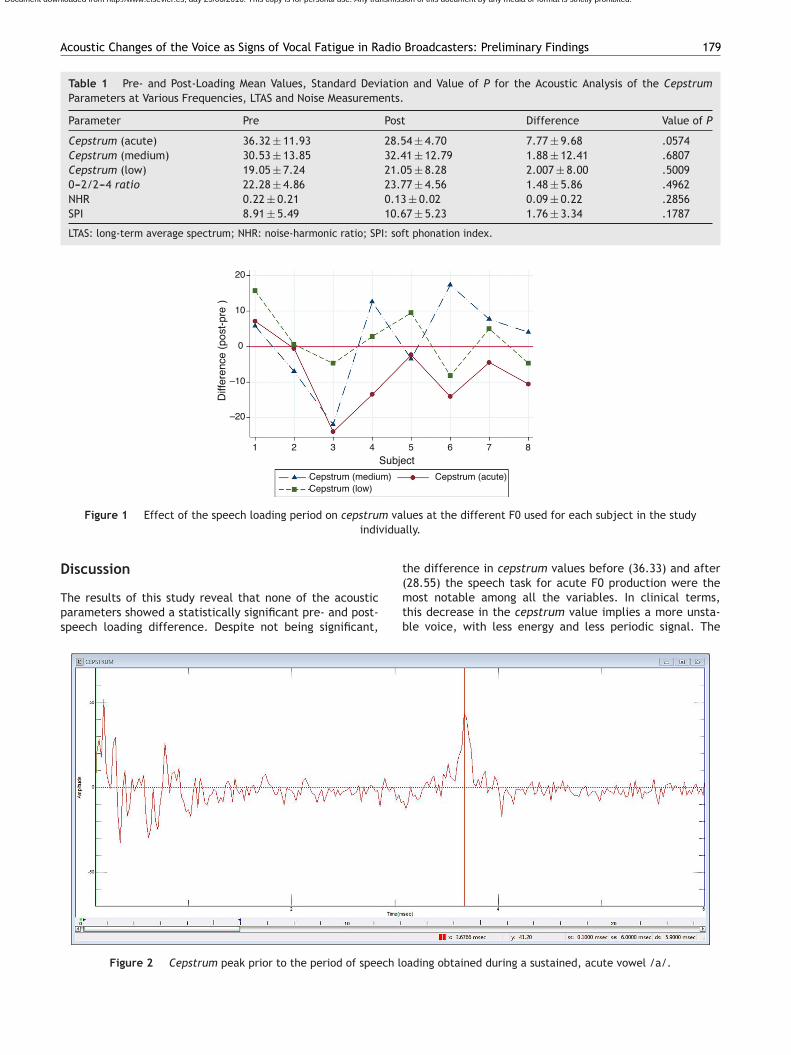
Figure 5 Spectral slope of the sample obtained before the locution of a phonetically balanced text.
dB
df: 1841
db: 26.7
–10
–20
–30
–40
–50
–60
–70
–80
–90
–100
0.2 0.4 0.6 0.8 1.0 1.2 1.4 1.6 1.8 2.0 2.2 2.4 2.6 2.8 3.0 3.2 3.4 3.6 3.8 4.0 4.2 4.4 4.6 4.8 5.0 5.2 5.4 kHz
d aft
rdfctthsauh
tc
Document downloaded from http://www.elsevier.es, day 29/06/2016. This copy is for personal use. Any transmission of this document by any media or format is strictly prohibited.
Figure 6 Spectral slope of the sample obtaine
between the energy of low harmonics and the energy of highharmonics (higher spectral slope).
In relation to this spectral change, it is also interestingto note that the SPI experienced an increase after the voiceload period (from 8.91 to 10.67). This parameter is alsoregarded as a measure of the spectral slope. The SPI valueis obtained from the ratio of the spectral harmonic energyat low frequencies (70---1600 Hz) and the harmonic energy athigh frequencies (1600---4500 Hz). Therefore, from the clin-ical point of view, an increase in the value of SPI meansthat the energy of higher harmonics has diminished. That is,higher SPI values are obtained for greater spectral slopes. Inour study, we observed an interesting relationship betweenSPI and energy ratio, as both experienced an increase after
the voice loading period, with both representing objectivemeasurements of the spectral slope.A possible physiological explanation for this decrease inthe spectral slope, reflected by increased SPI and energy
vtsb
er the locution of a phonetically balanced text.
atio values after a prolonged use of the voice, could beetermined by the vibratory characteristics of the vocalolds. There is a systematic relationship between the rate oflosure of the vocal folds and the spectral slope: the fasterhe closure of the vocal folds (faster return of the folds tohe midline), the lower the spectral slope (higher energy inigh harmonics).49 This can be seen in Figs. 5 and 6, whichhow the spectral slope of subject number 1 for the pre-nd post-speech loading samples, respectively. This partic-lar subject showed an increase of the spectral slope (lessarmonic energy in the high spectral area).
This change in spectral slope is not only associated withhe closing speed of the vocal folds, but also with theontact ratio, that is, the time period during which the
ocal folds are closed compared to the total glottic cycleime.49,50 From this fact, and remembering that, in ourtudy, the spectral slope showed a decrease, it is possi-le to speculate that perhaps, after the period of vocal use
1
ufc
ttolimfomiomb
patoptpwhSnomsfiova
cemosiaule
ovsma
C
Aeoii
omrosc
C
T
R
1
1
1
1
1
1
1
1
1
Document downloaded from http://www.elsevier.es, day 29/06/2016. This copy is for personal use. Any transmission of this document by any media or format is strictly prohibited.
82
ndergone by the broadcasters, the vibration of their vocalolds changed towards a decrease in contact ratio and inlosure speed.
From the clinical point of view, it is interesting to notehat the average NHR of the group showed a decrease, ratherhan the expected increase. Furthermore, individually, fivef the eight subjects presented a lower NHR after vocaloading. An increase in NHR should occur if there were anncrease in glottal noise energy and/or a reduction in har-onic energy. Both cases would be linked to a decrease in
old closure caused by vocal fatigue, as reported by previ-us studies where transglottic flow velocity increased andaximum phonation time decreased.4,5,20 Furthermore, it
s possible that the decrease in NHR values was the resultf increased fold closure, as a physiological compensationechanism following a long period of voice use, as has alsoeen reported by previous studies.23
The absence of significant differences between pre- andost-speech loading samples in the present study may bettributed to a number of reasons. The first is the period ofime of continuous vocal use. In our study, we used a periodf 1 h, as this was the duration of most of the programmesresented by the radio broadcasters in the study. Due tohe programming schedule of the radio station, it was notossible to extend these time periods. It is possible that,ith prolonged periods of vocal use, acoustic changes mayave been more evident. With respect to the time variable,cherer et al.18 showed that study subjects showed no sig-ificant changes in the jitter and shimmer values after 1 hf continuous reading. Similar results have been reported byore recent studies.51 However, contrary to these reports,
ome studies have shown that periods less than 1 h are suf-cient to cause acoustic changes. Niebudek-Bogusz et al.52
bserved changes in the acoustic parameters after 30 min ofocal practice, whilst Laukkanen et al.53 reported the samefter just 5 min.
Another possible explanation for the lack of signifi-ant pre- and post-loading differences is the type of taskmployed during the vocal load period. Vocal fatigue hasostly been studied through prolonged and constant periods
f reading out loud.4,15---17 However, it is possible that in ourtudy we used a task (speech) which was less fatiguing. Dur-ng the time period of radio speech work there are pausesnd moments when a radio broadcaster makes a less intensese of the voice. It is possible that the two elements haveed to a decrease in overall voice load, compared with anqual period of continuous reading.
It is also possible that the acoustic markers used as anbjective measurement of a possible change in voice due toocal fatigue were not suitable or sensitive enough to detectuch changes. Although various studies have used acousticeasurements,4,5,15,18---22 so far, the search for an objective
coustic marker of vocal fatigue has not been successful.
onclusion
coustic measurements are not adequate or sensitive
nough to detect vocal changes after a prolonged periodf voice use, either through reading, as in previous stud-es, or through speech tasks. For this reason, it would benteresting to replicate this study whilst taking into account1
M. Guzmán et al.
ther objective variables, such as aerodynamic measure-ents (transglottic flow, subglottic pressure and glottal
esistance) and electroglottographic measurements. More-ver, a longer period of voice loading than that used in thistudy would reveal more evident and consistent acoustichanges.
onflict of Interests
he authors have no conflict of interests to declare.
eferences
1. Koufman JA, Blalock PD. Vocal fatigue and dysphonia in theprofessional voice user: Bogart-Bacall syndrome. Laryngoscope.1988;98:493---8.
2. Smith E, Gray S, Dove H, Kirchner H, Heras H. Frequency andeffects of teachers with voice problems. J Voice. 1997;11:81---7.
3. Sander EK, Ripich DE. Vocal fatigue. Ann Otol Rhinol Laryngol.1983;9:141---5.
4. Stemple J, Stanley J, Lee L. Objective measures of voice pro-duction in normal subjects following prolonged voice use. JVoice. 1995;9:127---33.
5. Eustace CS, Stemple JC, Lee L. Objective measures of voiceproduction in patients complaining of laryngeal fatigue. J Voice.1996;10:146---54.
6. Gotaas C, Starr CD. Vocal fatigue among teachers. Folia Phoniatr(Basel). 1993;45:120---9.
7. Kitch JA, Oates J. The perceptual features of vocal fatigueas self-reported by a group of actors and singers. J Voice.1994;8:207---14.
8. Long J, Williford HN, Olson MS, Wolfe V. Voice problems and riskfactors among aerobics instructors. J Voice. 1998;12:197---207.
9. Welham NV, Maclagan MA. Vocal fatigue: current knowledge andfuture directions. J Voice. 2003;17:21---30.
0. Simberg S, Sala E, Vehmas K, Laine A. Changes in the prevalenceof vocal symptoms among teachers during a twelve-year period.J Voice. 2005;19:95---102.
1. Smith E, Lemke J, Taylor M, Kirchner H, Hoffman H. Frequencyof voice problems among teachers and other occupations. JVoice. 1998;12:480---8.
2. Russel A, Oates J, Greenwood K. Prevalence of voice problemsin teachers. J Voice. 1998;12:467---79.
3. Vilkman E. Voice problems at work: a challenge for occupa-tional safety and health arrangement. Folia Phoniatr Logop.2000;52:120---5.
4. Solomon N, Robin D, Mitchinson S, van Daele D, Luschei E. Senseof effort and the effects of fatigue in the tongue and hand. JSpeech Hear Res. 1996;39:114---25.
5. Gelfer MP, Andrews ML, Schmidt CP. Effects of prolonged loudreading on selected measures of vocal function in trained anduntrained singers. J Voice. 1991;5:158---67.
6. Gelfer MP, Andrews ML, Schmidt CP. Documenting laryngealchange following prolonged loud reading, a videostroboscopicstudy. J Voice. 1996;10:368---77.
7. Welham NV, Maclagan MA. Vocal fatigue: current knowledge andfuture directions. J Voice. 2003;17:21---30.
8. Scherer R, Titze IR, Raphael B, Wood R, Ramig L, Blager R. Vocalfatigue in a trained and an untrained voice user. In: Baer T,Sasaki C, Harris K, editors. Laryngeal function in phonation and
respiration. San Diego, CA: Singular; 1987.9. Vilkman E, Lauri ER, Alku P, Sala E, Sihvo M. Effects of prolongedoral reading on F0, SPL, subglottal pressure and amplitude char-acteristics of glottal flow waveforms. J Voice. 1999;13:303---15.
dio
3
3
3
4
4
4
4
4
4
4
4
4
4
5
5
5
Document downloaded from http://www.elsevier.es, day 29/06/2016. This copy is for personal use. Any transmission of this document by any media or format is strictly prohibited.
Acoustic Changes of the Voice as Signs of Vocal Fatigue in Ra
20. Kelchner LN, Lee L, Stemple JC. Laryngeal function and vocalfatigue after prolonged reading in individuals with unilateralvocal fold paralysis. J Voice. 2003;17:513---28.
21. Wolfe V, Long J, Youngblood HC, Williford H, Olson MS. Vocalparameters of aerobic instructors with and without voice prob-lems. J Voice. 2002;16:52---60.
22. Remacle A, Finck C, Roche A, Morsomme D. Vocal impact of aprolonged reading task at two intensity levels: objective mea-surements and subjective self-ratings. J Voice. 2012;26:177---86.
23. Netsell R, Lotz W, Shaughnessy AL. Laryngeal aerodynamicsassociated with selected voice disorders. Ant J Otolaringol.1984;5:397---403.
24. Titze IR. Principles of voice production. Englewood Cliffs, NJ:Prentice Hall; 1994. p. 67---81.
25. Titze IR. The physics of small amplitude oscillation of the vocalfolds. J Acoust Soc Am. 1988;83:1536---52.
26. Solomon NP, diMattia MS. Effects of a vocally fatiguing task andsystemic hydration on phonation threshold pressure. J Voice.2000;14:341---62.
27. Finkelor BK, Titze IR, Durham PL. The effect of viscositychanges in the vocal folds on the range of oscillation. J Voice.1988;1:320---5.
28. Jiang J, Ng J, Hanson D. The effects of rehydration on phonationin excised canine larynges. J Voice. 1999;13:51---9.
29. Verdolini K, Titze IR, Fennell A. Dependence of phonatory efforton hydration level. J Speech Hear Res. 1994;37:1001---7.
30. Verdolini-Marston K, Titze IR, Druker DG. Changes in phona-tion threshold pressure with induced conditions of hydration.J Voice. 1990;4:142---51.
31. Morrow SL, Connor NP. Voice amplification as a means ofreducing vocal load for elementary music teachers. J Voice.2011;25:441---6.
32. Rantala L, Vilkman E. Relationship between subjective voicecomplaints and acoustic parameters in female teachers’ voices.J Voice. 1999;13:484---95.
33. Titze IR, Lemke J, Montequin D. Populations in the U.S. work-force who rely on voice as a primary tool of trade: a preliminaryreport. J Voice. 1997;11:254---9.
34. Roy N, Merrill RM, Thibeault S, Parsa RA, Gray SD, Smith EM.Prevalence of voice disorders in teachers and the general pop-ulation. J Speech Lang Hear Res. 2004;47:281---93.
35. Landazuri E. Prevención vocal: una responsabilidad fonoau-diológica en los profesionales de la voz; aportes de unainvestigación en locutores de Bogotá. Umbral científico.
2008;12:33---51.36. Malebran C, Saldívar. Elaboración del perfil vocal para un grupode locutores radiales chilenos. In: Primer Congreso Iberoamer-icano de Voz Cantada y Hablada. 2010.
5
Broadcasters: Preliminary Findings 183
7. Boersma P, Weenink D. Praat manual: doing phoneticsby computer (v.5.0.23) [computer program]. Available at:http://www.praat.org/ [accessed 12.05.2012, last retrieved03.09.2008].
8. Hillenbrand J, Cleveland RA, Erickson RL. Acoustic correlates ofbreathy vocal quality. J Speech Hear Res. 1994;37:769---78.
9. Hillenbrand J, Houde RA. Acoustic correlates of breathy vocalquality. J Speech Hear Res. 1996;39:311---21.
0. Heman-Ackah YD, Heuer RJ, Michael DD. Cepstral peak promi-nence: a more reliable measure of dysphonia. Ann Otol RhinolLaryngol. 2003;112:324---33.
1. Heman-Ackah YD, Michael DD, Goding Jr GS. The relationshipbetween cepstral peak prominence and selected parameters ofdysphonia. J Voice. 2002;16:20---7.
2. Heman-Ackah YD. Reliability of calculating the cepstralpeak without linear regression analysis. J Voice. 2004;18:203---8.
3. Zieger K, Schneider C, Gerull G, Mrowinski D. Cepstrum analysisin voice disorders. Folia Phoniatr Logop. 1995;47:210---7.
4. Eadie TL, Baylor CR. The effect of perceptual training on inex-perienced listeners’ judgments of dysphonic voice. J Voice.2006;20:527---44.
5. Awan SN, Roy N. Toward the development of an objective indexof dysphonia severity: a four-factor acoustic model. Clin Lin-guist Phon. 2006;20:35---49.
6. Radish Kumar B, Bhat JS, Prasad N. Cepstral analysis of voice inpersons with vocal nodules. J Voice. 2010;24:651---3.
7. Balasubramanium RK, Bhat JS, Fahim III S, Raju III R. Cepstralanalysis of voice in unilateral adductor vocal fold palsy. J Voice.2011;25:326---9.
8. Lowell SY, Colton RH, Kelley RT, Hahn YC. Spectral- andcepstral-based measures during continuous speech: capacity todistinguish dysphonia and consistency within a speaker. J Voice.2011;25:223---32.
9. Hixon T, Weismer G, Hoit J. Preclinical speech science. SanDiego: Plural Publishing; 2008. p. 78---80.
0. Titze IR. Interpretation of the electroglottographic signal. JVoice. 1990;4:1---9.
1. Neils LR, Yairi E. Effects of speaking in noise on vocal fatigueand vocal recovery. Folia Phoniatr. 1987;39:104---12.
2. Niebudek-Bogusz E, Kotylo P, Sliwinska-Kowalska M. Evaluationof voice acoustic parameters related to the vocal-loading testin professionally active teachers with dysphonia. Int J OccupMed Environ Health. 2007;20:25---30.
3. Laukkanen AM, Jarvinen K, Artkoski M, Waaramaa-Mäki-KulmalaT, Kankare E, Sippola S, et al. Changes in voice and subjectivesensations during a 45-min vocal loading test in female subjectswith vocal training. Folia Phoniatr Logop. 2004;56:335---46.