California Winemaking Impact Assessment - CiteSeerX
144
UNIVERSITY OF CALIFORNIA Santa Barbara California Winemaking Impact Assessment A Thesis submitted in partial satisfaction of the requirements for the degree of Master of Environmental Science and Management by Adam T. Baughman Elizabeth Joy Brown Willie Brummett Joanne M. Dramko Jamie H. Goldstein Barry E. Hooper Advisors: Professor Magali Delmas Professor Arturo Keller June 2000
-
Upload
khangminh22 -
Category
Documents
-
view
2 -
download
0
Transcript of California Winemaking Impact Assessment - CiteSeerX

UNIVERSITY OF CALIFORNIA
Santa Barbara
California Winemaking Impact Assessment
A Thesis submitted in partial satisfaction
of the requirements for the degree of
Master of Environmental Science and Management
by
Adam T. Baughman
Elizabeth Joy Brown
Willie Brummett
Joanne M. Dramko
Jamie H. Goldstein
Barry E. Hooper
Advisors:
Professor Magali Delmas
Professor Arturo Keller
June 2000

ii
The Thesis of
Adam T. Baughman
Elizabeth Joy Brown
Willie Brummett
Joanne M. Dramko
Jamie H. Goldstein
Barry E. Hooper
is approved
____________________________________
____________________________________
____________________________________
May 2000

iii
April 14, 2000
Copyright by
Adam T. Baughman
Elizabeth Joy Brown
Willie Brummett
Joanne M. Dramko
Jamie H. Goldstein
Barry E. Hooper
2000
iv
We would like to thank our advisors,
Professor Arturo Keller and Professor Magali Delmas,
for their time, patience, and guidance.
v
California Winemaking Impact Assessment
Adam T. Baughman Elizabeth Joy Brown Willie Brummett
Joanne M. Dramko Jamie H. Goldstein Barry E. Hooper
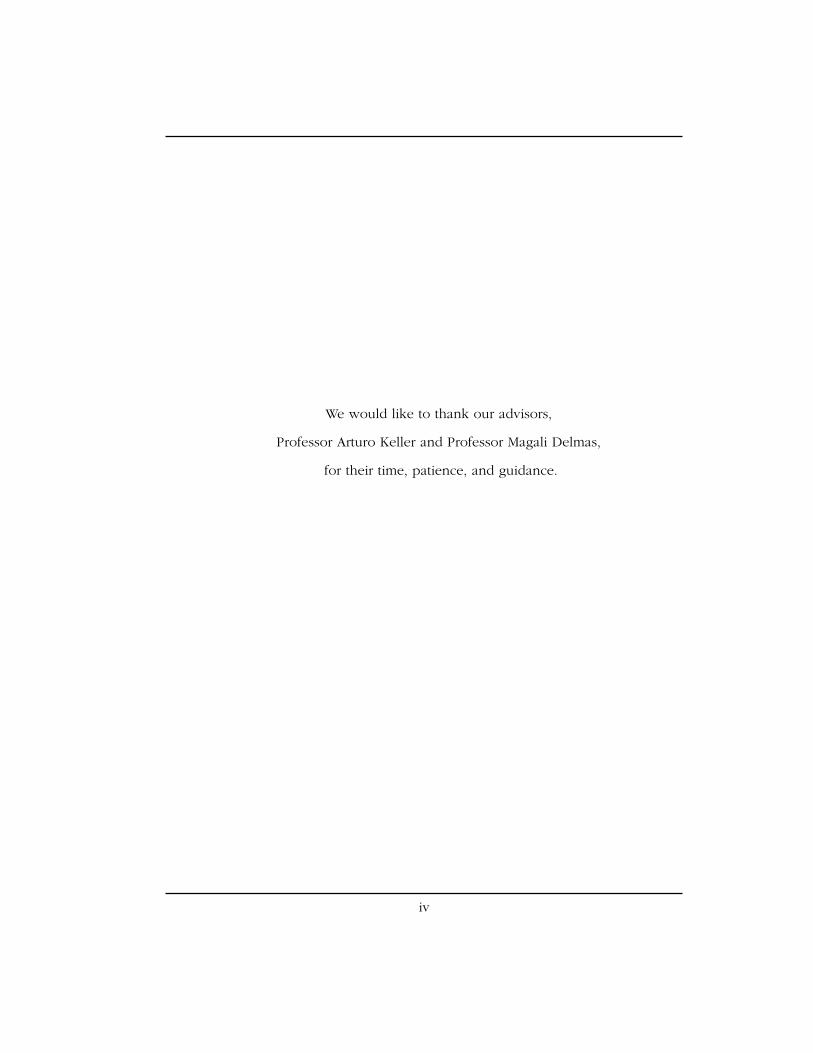
ABSTRACTIn 1998, winegrapes were cultivated on more than 400,000 acres in California, a 10year increase of more than 30%. The pace of wine industry expansion is causinggrowing concern. This report explores the environmental impacts and socioeconomicbenefits of winemaking and examines differences between organic and traditionalviticulture. Data were derived from direct mail surveys of wineries and vineyards inNapa, Sonoma, and Santa Barbara counties, and from a survey of wine consumers.Significant Results
• The economic impact of wine on the state economy totaled $33 billion in1998, representing 3% of California’s gross state product.
• In 1998, 34 million pounds of pesticides were applied to winegrapes, however86% of this mass was sulfur, which has a low toxicity (CDPR, 1999). Other ag-ricultural commodities use greater quantities of toxic pesticides per acre.
• Organic vineyards use less pesticide and synthetic fertilizer. Organic and con-ventional vineyards, however, reported applying the same mass of fertilizer, onaverage. Since organic fertilizers are less nutrient dense than synthetic, organicvineyards may have lower nutrient requirements.
• Average production costs for organic viticulture are on the high end of therange of viticulture costs. No significant difference was observed in the aver-age size of organic and traditional vineyards.
• The majority of surveyed consumers had never tried wine from organicallygrown grapes (WOGG) and do not consider the environment very importantin their wine purchasing decisions. However, those who tried WOGG rated itfavorably; a significant percentage of this group reported purchasing it regu-larly.
Recommendations• To capitalize upon a potential marketing benefit, WOGG should be labeled as
“wine made from organically grown grapes.”• To reduce costs and minimize environmental risks, vineyard managers should
increase the application of Integrated Pest Management.• The California legislature should regulate vineyard development on steep
slopes statewide, or winemakers should voluntarily cease steep slope develop-ment.
• A “Sustainable” wine label should be developed; requirements would includestandards for minimal fertilizer and pesticide application, erosion management,and water use.

vi
Contents
Abstract ............................................................................................. vAcronyms .......................................................................................... vii1. Introduction ................................................................................... 12. Background ................................................................................... 5
History of California Wine................................................................... 5The Grape Cultivation Process............................................................ 7The Winemaking Process .................................................................... 9Current Industry Standards of Organic Agriculture ......................... 11
3. State of the Industry .................................................................... 13Employment ....................................................................................... 13Sales .................................................................................................... 15Tax Revenue ...................................................................................... 17Tourism .............................................................................................. 17
4. Methods ....................................................................................... 18Source Review ................................................................................... 19Industry Surveys ................................................................................ 20Consumer Survey ............................................................................... 22
5. Survey Results ............................................................................... 236. Wine Grape Cultivation .............................................................. 45
Land use conversion .......................................................................... 45Material Inputs ................................................................................... 51Integrated Pest Management ............................................................. 66
7. Wine Production and Marketing ............................................... 73Wastewater Disposal .......................................................................... 74Distribution ........................................................................................ 78The Wine Consumer .......................................................................... 80
8. Fetzer Winery................................................................................ 83Organic Viticulture Program.............................................................. 84Challenges of Cultivating an Organic Vineyard ............................... 89Environmental Business Practices ..................................................... 91Future Efforts ..................................................................................... 94
9. Conclusion ................................................................................... 96Appendix A. References .............................................................. 107Appendix B. Industry Surveys ....................................................... 116Appendix C. Consumer Survey ................................................... 122Appendix D. Survey Responses ................................................... 123Appendix E. Current Organic Standards .................................... 130Appendix F. Fetzer’s Recent Environmental Achievements ..... 135

vii
Acronyms
AOC Appellation d’origine controleeARB Air Resources BoardAVA American Viticultural AreasBATF Bureau of Alcohol, Tobacco and FirearmsBIFS Biologically Integrated Farming SystemCASS California Agricultural Statistics ServiceCCOF California Certified Organic FarmersCCVT Central Coast Vineyard TeamCDFA California Department of Food and AgricultureCOFA California Organic Foods ActCWIA California Winemaking Impact AssessmentDPR Department of Pesticide RegulationE3 Economics, Equity, and EnvironmentEDD Employment Development DepartmentEPA Environmental Protection AgencyERI Eco-Rating InternationalETU EthylenethioreaIPM Integrated Pest ManagementLWWC Lodi-Woodbridge Winegrape CommissionNASS National Agricultural Statistics ServiceNGO Non Governmental OrganizationsNOSB National Organic Standards BoardOC OrganochlorineOFPA Organic Foods Production ActOGWA Organic Grapes into Wine AlliancePCA Pest Control AdvisorsPPS Positive Points SystemPUR Pesticide Use ReportingRUP Restricted Use PesticideRWQCB Regional Water Quality Control BoardSAREP Sustainable Agriculture Research and Education ProgramSI/NI Somewhat Important/Not ImportantTAC Toxic Air ContaminantsUCCE University of California Cooperative ExtensionUSDA United States Department of AgricultureVI/I Very Important/ImportantWOGG Wine from Organically Grown GrapesWRAP Waste Reduction Awards Program

viii

1
1. Introduction
The wine industry is a large and influential sector of the California economy. By virtueof sheer size, the industry substantially influences California’s environment. In 1998,wine generated $33 billion in economic activity within California, and $48 billion na-tionwide. To generate these economic benefits, wine grapes were cultivated on over400,000 acres. Presently, the wine industry is in a state of dramatic flux. Acreage underwine grape cultivation has grown by more than 30% over the last 10 years.
The state is home to thousands of individual wine grape growers and more than 800independent wineries (Wine Institute, 2000). These wineries vary in size with annualproduction ranging from tens to millions of cases. Within this diverse group, techniquesof viticulture and winemaking vary considerably, as does the perceived environmentalimpact of production and cultivation processes.
This report explores the extent of the environmental and socioeconomic effectswinemaking has upon the state of California. The industry has the potential for im-pacts on several fronts. Wine-related jobs and tax revenues enhance the state economyand help shape the social fabric of the state. Vineyards use land, water, pesticides, andfertilizers to produce wine grapes, affecting the state’s environment. In an effort toboth minimize the environmental burden of viticulture and continue to provide wine-related jobs, some California wineries are choosing to market wines that are made from“organic grapes”. However, few comparative studies have been undertaken to datewhich detail differences in both costs and environmental impacts of “organic” and tra-ditional viticulture.
This report addresses four key questions:
• What does the California economy gain from vineyards and winemaking?
• What is the effect of the wine industry on the state’s environment?
• What are the significant differences between organic and traditionalviticulture, if any?
• Do consumers care about environmental impacts related to wine, and wouldtheir choices be affected by additional information?
These four questions are examined through a quantitative analysis of the environmen-tal and socioeconomic effects of wine grape cultivation and wine production. Threecounties are singled out for intensive study: Napa, Sonoma, and Santa Barbara. Thesecounties represent three of California’s prime wine production districts, dominated bysmall-scale growers and winemakers who predominantly produce premium wines.

2
This California Wine Impact Assessment (CWIA) fills a gap in the body of publiclyavailable literature, between isolated analyses of individual aspects of the life cycle ofwine and broadly focused but unpublished or entirely qualitative works. Previous re-search programs with similar goals include a semi-quantitative assessment system de-veloped by the Swiss consulting company, Eco-Rating International (ERI) in 1995. ERI’ssystem involves compilation of a set of “ecologically relevant” statistics for individualCalifornia wineries into a single rating scale (Baum, 1997). Unfortunately, ERI haspublished few of its results; publications derived from the study are limited to confer-ence poster abstracts, and an aggregated qualitative summary available on their cor-porate website. The usefulness of their rating system is limited because it is propri-etary, preventing critical analysis of the weighting factors they employ to integrate ahost of environmentally related information into a single number. The Central CoastVineyard Team (CCVT), a non-profit consortium of local wine grape growers and tech-nical advisors from the University of California Sustainable Agriculture Research andEducation Program, has also developed a rating system for vineyard management (CCVT,1999). The CCVT Positive Points System (PPS) is a qualitative self-assessment whichallows vintners to determine for themselves how far they have gone in implementingreduced risk vineyard management practices. Though the organization collects PPSdata from CCVT members, the results are not available to individuals outside the Cen-tral Coast Vineyard Team.
The CWIA approach uses a set of indicators of environmental and socioeconomic con-ditions to analyze the differences in impacts of three classes of wine grape cultivation:organic viticulture, viticulture which relies upon Integrated Pest Management Tech-nology, and traditional viticulture.
This report is organized in the following manner. Chapter 2 provides an introductionto the history of winemaking in California and the processes of grape cultivation andwinemaking. Understanding these processes is useful in comparing variations on ba-sic techniques. Comparison of organic and traditional vineyard management techniquesrequires a clear definition of what it means to be “organic”. Organic standards are stillunder debate at the federal level. It was therefore necessary to review current stan-dards of organic agriculture proposed by California, the USDA, and non-governmentalorganizations. Questions of state and federal enforcement are addressed. From thisreview, a working definition of what it means to be organic is chosen for the remain-der of the project.
The socioeconomic effect of the winemaking industry on the state of California is ex-amined in Chapter 3. This examination of the contribution of the wine industry to thestate’s economy includes a thorough review of the direct and indirect employment re-sulting from the sale of wine, the value of wine as a commodity, and the contributionof the wine industry to state, local, and federal tax revenues. Since images of gently

3
rolling hills covered by vineyards and elegant wineries attract many visitors to the state,the contribution of the wine industry to California’s tourism industry is also consid-ered.
Chapter 4 explains the CWIA research approach in detail, revealing what the currentavailable literature is able to supply. It goes on to explain why a significant portion ofthe information required to address our research questions had to be gathered throughsurveys. Three questionnaires were developed in the process of compiling this report,targeting both people employed by the wine industry and wine consumers. Industrypractices were examined by a survey of vineyard managers and a survey of winerymanagers, referred to as the Vineyard Survey and the Winery Survey, respectively. Themarket survey is referred to as the Consumer Survey.
The results of the questionnaires are presented in Chapter 5. To address the questionof differences between organic and traditional vineyards, Vineyard Survey respondentsare divided between certified practitioners of organic viticulture, and vineyards man-aged with standard industry practices. The Winery Survey examines the role of envi-ronmental concerns in winery management. Consumer Survey results are examined todetermine whether wine buyers incorporate environmental concerns into their winepurchase decisions.
In isolation, the question of whether organic or traditional viticulture is environmen-tally preferable does yield a comprehensive picture of the environmental impact ofwine in California. In order to assess the impacts of the winemaking industry, grapecultivation and wine production are analyzed separately.
Chapter 6 explores the environmental impacts of wine grape cultivation. Impacts ad-dressed in Chapter 6 include conversion of land to vineyards, material inputs such aspesticides and fertilizers, and the demands irrigation places upon state water supplies.Through examination of these factors, risks to air, soil, and water quality are addressed.Though the focus of the analysis is the industry as a whole, differences between or-ganic and traditional agriculture are examined to gauge the effect of management prac-tices on relevant impacts. Production costs for organic methods are compared withmore traditional approaches. Recognizing the fact that vintners employ a wide spec-trum of cultivation practices, the chapter concludes with a discussion of IntegratedPest Management (IPM). In the debate over the sustainability of organic and traditionalagriculture, IPM has been proposed as a middle ground. Discussion of IPM focuses onthe activities of the Lodi-Woodbridge Wine Grape Commission, a group currently pro-moting intensive application of IPM techniques in San Joaquin County.

4
Wine production and marketing is explored in Chapter 7. The primary impact of wineproduction addressed by this report is wastewater generation and treatment. Our analysisfurther addresses the implications of the current debate regarding internet-based winesales for both traditional and organic wine producers. The chapter concludes with adiscussion of consumer interest in wines marketed as environmentally preferable.
To complete our examination of organic viticulture, a case study of a large scale winecompany that has gone organic is included in Chapter 8. The CWIA project was fortu-nate to gain the cooperation of Fetzer Winery in Hopland, California for this case study.Fetzer was an ideal choice because they own vineyards that are being cultivated usingboth organic and traditional methods. The case study examines what practices are beingemployed, whether or not they see themselves as successful, how they integrate envi-ronmental concerns into all of their operations, and whether the Fetzer approach canbe applied to other wineries.
The concluding chapter, Chapter 9, is a presentation of the overall impacts identifiedin this research. A summary of environmental and socioeconomic indicators is included;these indicators could be used by future researchers, winemakers, or governments totrack changes in the industry’s impact over time.

5
2. Background
The winemaking industry has a rich history in California; it has been integral to thedevelopment and character of the state. California continues to be a leader in the UnitedStates wine industry as well as having a reputation that holds its own next to the high-est quality wines of Europe. Identifying the impacts of winemaking requires a generalknowledge of the procedure of cultivating the grapes and fermentation process thatconverts grape juice into wine. Following this, a review of the current industry stan-dards of what it means to produce organic grapes and wine is discussed. From thisreview, a working definition of what it means to be organic is chosen for the remain-der of this report.
History of California Wine
No one knows how far back winemaking goes; wine was mentioned in many textsfrom ancient Mesopotamia, Egypt and Gaul. The Epic of Gilgamesh has many stanzassinging the praises of wine, as does the Song of Solomon. After the collapse of theRoman Empire, the craft of winemaking was preseved by the Christians who neededit for mass. Monastic Christian orders were among the first to set out vineyards in whatare now some of the most highly regarded wine-growing regions (Balzer, 1984).
The history of wine in California began in 1697 when Father Juan Ugarte planted vinesat Mission San Francisco Xavier in Baja California. Then in 1769, Spanish missionariesintroduced the art of viticulture to California. In keeping with the Christian tradition ofusing wine in religious ceremonies, Padre Junipero Serra planted the first vineyards atMission San Diego and missionaries continued to cultivate grapes at most of the twenty-one missions that were established. California’s first vintage is believed to have beenproduced in 1782; the wine was made from a variety of the European Vitis viniferanow called the Mission grape (Winkler 1974).
The first American viticulturalist in California was Joseph Chapman, who planted a4,000-acre vineyard of Mission grapevines in Los Angeles in 1824. In 1833, Jean LouisVignes recognized the inferiority of the Mission grapes and planted 35 acres of un-known varieties of Vitis vinifera, establishing the El Aliso Vineyard in Los Angeles.Vignes is often considered the father of the California wine industry (Pinney, 1989).
In the late 1800’s, California wines began to rival East Coast wines in quality. The com-petition between the two coasts became fierce and petty rivalries began to spring up.Eastern vintners began to accuse California wineries of selling their wines under coun-terfeit French and German labels, and started putting California labels on inferior wines

6
(Geraci, 1997). During and after the gold rush, immigrants from Germany, France, andItaly made a fortune in winemaking instead of gold. From 1861 to 1919 winemakerssuch as Jacob Schram, Charles Krug, Joseph Korbel, and Georges de Latour all plantedtheir first vines here. California led the nation in wine production when it became astate in 1850, ousting Ohio as the leading producer (Pinney, 1989).
In 1880 the Los Angeles wine industry was infected by insect-borne bacteria nicknamed“Anaheim disease.” The Mission grapes that dominated the area were especially vul-nerable to this disease, and as a result the vineyards were decimated. In 1891 therewere fourteen acres of grapes left in the Anaheim region. Premium grape varieties whichare more resistant to this disease flourish in cooler climes; consequently the wine in-dustry moved northward. With the success of the new wineries, California legislaturedid not want to hinder the industry and exempted vineyards from taxation in 1859(Geraci, 1997).
Funding for the development of agricultural experiment stations was provided by theHatch Act of 1887. Taking advantage of this, the University of California at Berkeleyplanted vineyards and established an enology and viticulture program. The programmoved to its present location at the University of California at Davis in 1938.
In 1873 grape agriculture was again victim to an infestation, this time by the phyllox-era insect. This insect was first discovered in Sonoma and observed to be slowly spread-ing. Growers ignored its presence until it became apparent that the problem was notgoing to disappear. The University of California offered a solution: the use of nativerootstocks, which are not affected by phylloxera. Unfortunately, vineyardists were slowto heed the University’s advice and by 1888 only 2,000 acres had been replanted withnative rootstock. About 10,000 acres were destroyed between 1889 and 1892, and by1900 there were only 2,000 bearing acres remaining in Napa (Pinney, 1989).
The industry was then dealt another blow in 1919 with the passing of Prohibition. Thepurchase of distilled liquors, including wine, was banned. Unable to purchase wine,consumers had to make it themselves. Home wine production went from 50 milliongallons a year to 76.5 million gallons during Prohibition. Home winemakers werepermitted to make 200 gallons per year for family use. Nationwide, per capita wineconsumption was at 0.47 gallons before Prohibition, and 0.64 gallons during Prohibi-tion.
“When Prohibition ended, most of the American industry had been shut down for twentyyears, and to a certain extent, they had forgotten how to make wine. The University ofCalifornia at Davis was instrumental in encouraging the industry to make sound, safewines through the meticulous application of the scientific method-primary chemistry,tightly controlled fermentation, meticulous sanitation, and heavy filtration,” claims JoshJensen of the Calera Winery (DeVilliers, 1994). After Prohibition was repealed, the wine

7
industry faced 48 different sets of regulations for sale, transport, taxation and distribu-tion of their products. Despite heavy regulation, over 380 wineries reopened after Pro-hibition across the United States. The California Wine Institute was founded in 1935 tocope with the different regulations (Pinney, 1989). The years following the repeal ofProhibition produced little wine of interest, though UC Davis was quietly continuingits research. The Gallo brothers were laying the foundation for their extraordinary domi-nance of American winemaking. It was not until the 1970’s that California noticed thatit was producing wines of great character and complexity in numerous small pocketsaround the state. In the late 1970’s the famous Paris Tasting pitted the best Americanwine against the finest European vintages; to Europe’s chagrin America triumphed, andthe enological world was at last forced to accept California as one of the premier wineregions (Balzer, 1984).
In the 1960’s and 70’s winemaking became a popular corporate investment and win-eries were purchased by companies with little or no experience in the wine business.There were several companies that bought into the industrry, for example Nestle ofSwitzerland invested $6 million dollars into Beringer, Coca-Cola bottling of New Yorkbought Franzia, and Pillsbury invested in Napa and Sonoma. This period of invest-ment was followed by drought, recession, and competition from imported wines inthe 1980’s. In the 1950's, imports only accounted for 5% of the American wine market.By 1984, imports reached a peak market share of 25%. In 1999, imported wine ac-counted for 19.2% of total U.S. wine sales, while California wines alone claimed 72%market share (Gomberg, Fredrikson & Associates, 2001).
The Grape Cultivation Process
Growing wine grapes is a complicated process. There are many factors to considerwhen initially planting vines such as vine density, type of irrigation, and which grapetype(s) is best suited to the soil and climate. Once the vine is established then thereare decisions to be made about the level of pruning, trellis type use of fertilizers and/or pesticides and vineyard water use.
Grapes need to be planted in soil that is favorable to root growth including good aera-tion and good internal and surface drainage. Soil conditions can affect the quality ofwine and are often considered the most important factor in planting a vineyard. TheFrench word, terroir, is used to describe all the ecological factors that make a particu-lar type of wine special to the region of its origin. For many French winemakers thesoil is considered the “soul” of a vineyard. French officials used terroir to justify the“appellation d’origine controlee” system (AOC) to protect French regional wines in1911 (Sawyer,1998). In the United States, American Viticultural Areas (AVAs) are desig-nations that try to protect particular growing regions and link flavor differences amongfine wines to biogeography instead of winemaking.

8
In addition to soil, rainfall and temperature also need to be considered when initiallyplanting a vineyard. Wine grapes are best grown in regions that have few or no sum-mer rains. Grapes need to be planted where the winters are mild, there is freedomfrom frost, and there is full sun exposure. Dormant bare-root grapevines should beplanted in the spring after the last hard freeze. Vines start producing grapes about threeyears after planting and a useable crop after five years. Although grapes can grow forhundreds of years, they reach their prime in terms of crop yield between ages ten andthirty. Production is reduced as the vines get older.
Even though there may be sufficient rainfall, growers use irrigation to control plantgrowth more efficiently. Many vineyards use drip irrigation to minimize excessive wateruse, and as competition for water in California increases, it is even more important.Agriculture will be under increasing pressure to reduce water consumption. Irrigationcan be used to maintain or increase vine vigor (rate of growth), prevent occasionalwater stress throughout the season or during drought years, attempt to stimulate fruitdevelopment (berry size), or attempting to alter fruit quality by influencing solublesolids, pH or titratable acidity. To irrigate properly factors such as soil type, depth,water-holding capacity and infiltration rate, and the effective rooting zone of the vinesmust be taken into consideration. Soils with low infiltration rates and with a significantslope also present runoff problems for overhead sprinkler systems with high deliveryrates. Drip irrigation can accommodate all of these situations but has a higher initialcapital-investment cost and is generally considered to require a higher level of man-agement (Wine Business Monthly, 2000).
Vines are pruned to a desired form to facilitate vineyard operations and to save labor.Pruning, which consists of removing living canes, shoot, leaves and other vegetativeparts of the vine, distributes the bearing wood over the vine to decrease the need forthinning as a means of controlling crops. Pruning determines the number and positionof the buds that develop.
Grapes cannot be grown successfully without structural support. The trellis system cangreatly affect the amount of yield of the vines and the amount of vegetative growth.Trellises can also impact the microclimate within the vine’s canopy by changing thedistribution of leaves. The type of trellis is chosen by the climatic conditions of thearea, pruning and harvesting methods, and soil characteristics. Trellises also must bedesigned to accommodate harvesting machinery if it is going to be used.
The density of the vines within and between rows affects growth of individual vinesand can affect the productivity of vineyard. In general, as vine density increases, yieldper vine decreases, but yield per acre increases. Most vines are planted with nine toten feet between rows and the spacing between vines is usually eight feet. However,if the grapes are going to be mechanically harvested, then the grapes have to be spacedto accommodate the machinery.

9
The Winemaking Process
In order to fully appreciate how wine is made, a detailed description of the entire pro-cess is needed. The technique of winemaking is complicated, yet delicate. There is ageneral methodology that is followed by most wineries, although each vintner mayfine tune the procedure to achieve a desired quality in the wine.
The winemaking process consists of four phases: grape cultivation and harvest, fer-mentation, clarification, and aging. Jackish (1985) characterizes the phases of wine pro-duction according to the process which dominates each segment of the operation; cul-tivation is macrobiological, fermentation is microbiological, clarification is largely physi-cal, and successful aging is a chemical process. There is a degree of overlap betweenthe processes.
Harvest
Wine grapes are considered ripe when there is an optimal balance between sugar con-tent and acidity. The optimal balance is selected by individual growers and will varyacross vineyards, and varieties. Ripe grapes are harvested either by hand or by me-chanical harvesters. While grapes that are harvested by hand are typically shipped wholeto wineries, mechanically harvested grapes may be crushed in the field or shippedwhole, depending upon the equipment employed. Immediate crushing is sometimesemployed by high-volume operations to reduce the potential for oxidization of grapetissues damaged by the harvester (Skofis, 1981).
Within a few hours of harvest, all grapes are delivered to the winery, whether it is on-site or the grower is selling the grapes to another vintner. Harvested grapes are in-spected for soluble solids, defects, and non-grape materials such as leaves (Skofis, 1981).In commercial winemaking, incoming grapes are weighed, inspected, and unloadedinto a stainless steel hopper, a conveyor carries the grapes to the crusher. The crusherseparates the berries from the stems and pumps the juice, skins, pulp, and seeds intoa fermenting tank. Stems are discarded or retained for the vineyard soil, except in thecase of a few grape varieties, such as Pinot noir, where some of the stems are retainedto enhance the flavor of the wine by increasing extraction of tannins during fermenta-tion. The slurry of crushed grapes is called “must”, though the term can also be ap-plied to the juice or “meat” of the berry prior to crushing.
Sulfur dioxide (SO2) is added immediately after crushing, primarily to control enzy-
matic oxidation of the juice. SO2 is a gas; it’s partial pressure within the must is gener-
ally augmented by addition of potassium metabisulfite or (in large operations) it maybe bubbled into the must as gaseous SO
2. The amount of SO
2 required is a function of
the variety of grapes employed and their condition at harvest. Grapes which are bruised,

10
broken, moldy, hot, low in titrable acid, or possess excessively high pH require moreSO
2. Grapes from California’s North Coast are generally treated with 70-100 mg/L SO
2
(Long,1981; Martini, 1981).
Fermentation
Ethanol fermentation is the process by which sugars in the must are respired anaero-bically, producing ethanol. The process commences as soon as the grapes are crushed;grape skins naturally harbor wild yeasts capable of producing ethanol. The enologistmay allow the natural yeast to ferment the wine, or add a specific yeast culture, gen-erally a strain of Saccharomyces cerevisiae. Wineries applying a specific strain in fer-mentation may wash the uncrushed grapes with a SO
2 enriched solution prior to crushing
and addition of the yeast culture.
This is the point where red, white, and rose wine production diverge. The followingdescription will apply to red wines. Red wines are fermented with the skins for 3-7days; this process gives the wine its color as pigments and tannins are extracted fromthe grape skins. During fermentation on the skins, the skins float to the top and forma cap at the top of the fermenting chamber. The cap must be periodically submerged,or “punched down” into the juice in order to keep the it from overheating, which canresult in spoilage or bad flavor. In large scale fermentations, physically pushing thecap into the juice is too labor intensive; the vintner must instead pump juice from thebottom of the fermenter to wash over the cap. A key step in making a red wine isfermentation of the must with the skins; this period largely determines the ultimatecolor, flavor, astringency, texture, and longevity of the wine (Martini, 1981). The juiceis then drawn from the skins and may be transferred to a vented chamber for contin-ued fermentation. Pomace, the material remaining after draining the original fermenter,is pressed to extract any additional must held within the skins and seeds. The productof this pressing is typically very astringent; it may either be blended into the free runjuice or it may be vinified separately and mixed at a later stage.
By contrast, the free run, or unpressed juice, from a white wine is drawn off througha screen either immediately after pressing or within about two hours.
Malolactic fermentation is a process whereby bacteria convert malic acid to lactic acid,which begins while yeasts are still fermenting sugars in the must to ethanol. Since lac-tic acid has fewer carboxyl groups than malic acid, this process reduces total acidityand raises pH. The process may occur without manipulation by the winemaker if thefermenting tanks harbor natural flora capable of such a decomposition. Somewinemakers choose to inhibit malolactic fermentation by adding SO
2 (Martini,1981).
This is not entirely uncommon in California, because increased pH can reduce stabil-

11
ity in the wine. As a result of the state’s climatic stability, California’s grapes are typi-cally higher in sugar and lower in acidity than grapes cultivated in the East or in Eu-rope.
Clarification
Once fermentation is complete, the bulk of suspended solids is removed from winethrough either racking, centrifugation, or filtration. Racking is the slowest process, work-ing best in small containers such as barrels and potentially requiring several months.After solids naturally settle out of the wine, the wine is siphoned off the lees (settledsolids) and stored in a new container. This process is generally repeated several times.
Centrifugation and filtration are considerably faster and often used in combination;centrifugation is employed first to remove the bulk of solids which might otherwiseclog a filter, while a diatomaceous earth filter does a better job removing low densitysolids. Using filtration alone, the wine may be excessively exposed to oxygen, reduc-ing quality (Amerine, 1981).
Stabilization
To be classified as stable, a wine must not develop a haze or precipitate when ex-posed to normal shelf conditions. When a wine is heated, protein precipitation maycause the wine to become cloudy, while cold conditions can induce the precipitationof potassium bitartrate crystals. To reduce the protein content of the wine, one of sev-eral flocculants can be added: bentonite clay, milk powder, egg whites, or even blood.Excess bitartrate is removed from white wines by chilling to induce precipitation. Thesematerials are removed by further racking, centrifugation, or filtration (Amerine, 1981).
Aging
During the aging process, wine quality is generally improved through slow oxidation.The optimal conditions for aging occur in barrels; barrels as small as 50-60 gal. areoptimal (but expensive) in producing a full bodied wine (red and white) because oftheir high surface area to volume ratio. The duration of aging varies considerably withgrape variety and the goal of the enologist.
Current Industry Standards of Organic Agriculture
In order to assess the environmental impact of organic and conventional methods ofwine grape growing and winemaking, we must first define what the term “organic”means. The pertinent regulations with respect to organic agriculture are the federalOrganic Foods Production Act of 1990 (OFPA) and the California Organic Foods Act of1990 (COFA). These regulations are explained in greater detail in Appendix E. Theseacts encompass all organic crop, livestock, and dairy production. Currently, these stan-dards for organic farming and food processing are still undergoing revision and re-

12
view as regulators, farmers, and the public debate about what should become law (SeeAppendix E for latest developments). The most active debates concern the inclusionor exclusion of genetically modified foods, certain ingredients in processed foods, andbovine growth hormone usage.
There are also definitions from third-party certifiers such as the California Certified Or-ganic Farmers (CCOF) that seek to codify the various definitions of organic into onecertifiable meaning. The 120-page CCOF list of standards provides detailed restrictions,which include prohibiting any synthetic additions to plants or soil. In addition, all fer-tilization and pest management agents must originate from 100% naturally occurringsubstances that can break down organically in the vineyard. CCOF requires that theCOFA standards be met and will certify all, crop and livestock-based farms that meetthe CCOF standards on an annual basis. When the CCOF standards are applied to vine-yards, “organic” means that there has been no application of synthetic pesticides, her-bicides, and fungicides to the plants for at least three years prior to harvesting. Sincethe CCOF is the largest third-party certifier in California and most farmers agree to itsdefinition of organic, the CWIA has chosen to use the CCOF terminology when refer-ring to organically grown grapes.
Organic, as it applies to wine, is much more difficult to determine. The main contro-versy surrounding organic wine is the inclusion of sulfites in the winemaking processas a preservative. In France, Italy, and Germany, an organic wine must first come fromorganic grapes and be made according to regulations governing filtering and fining,but can contain up to 100 parts per million of sulfur dioxide and still receive an or-ganic distinction. In the United States, this is not the case and is the focus of an ongo-ing debate. The current National Organic Standards Board (NOSB) proposed rule al-lows processed foods, including wine, to be labeled as organically grown and pro-cessed if permitted inorganic substances comprise no more than 5% of the product byweight (excluding salt and water from the weight limit). If the current proposed rulewent into effect, wines that are 95% organic by weight and use only sulfur dioxide gas(not potassium metabisulfite) bubbled through the wine as a sulfite stabilizing agentwould be given an organic distinction.
Producers of wine made with no added sulfites argue that the proposed standards aretoo lax and that wine with a total sulfur content of 10ppm or less should be grantedorganic wine status. The reason for allowing the 10ppm is because sulfites do occurnaturally in wine grapes. There are still others that argue wine should not be labeledorganic if any inorganic substances are added to the wine. Currently, the Bureau ofAlcohol, Tobacco and Firearms (BATF) requires that all wine containing more than10ppm sulfites be labeled with “Contains Sulfites.” Since the definition of organic wineis still under contention and consequently ‘Organic Wine’ does not exist under US law,the CWIA has chosen to refer to it as ‘Wine from Organically Grown Grapes’ or WOGG.
13
3. State of the Industry
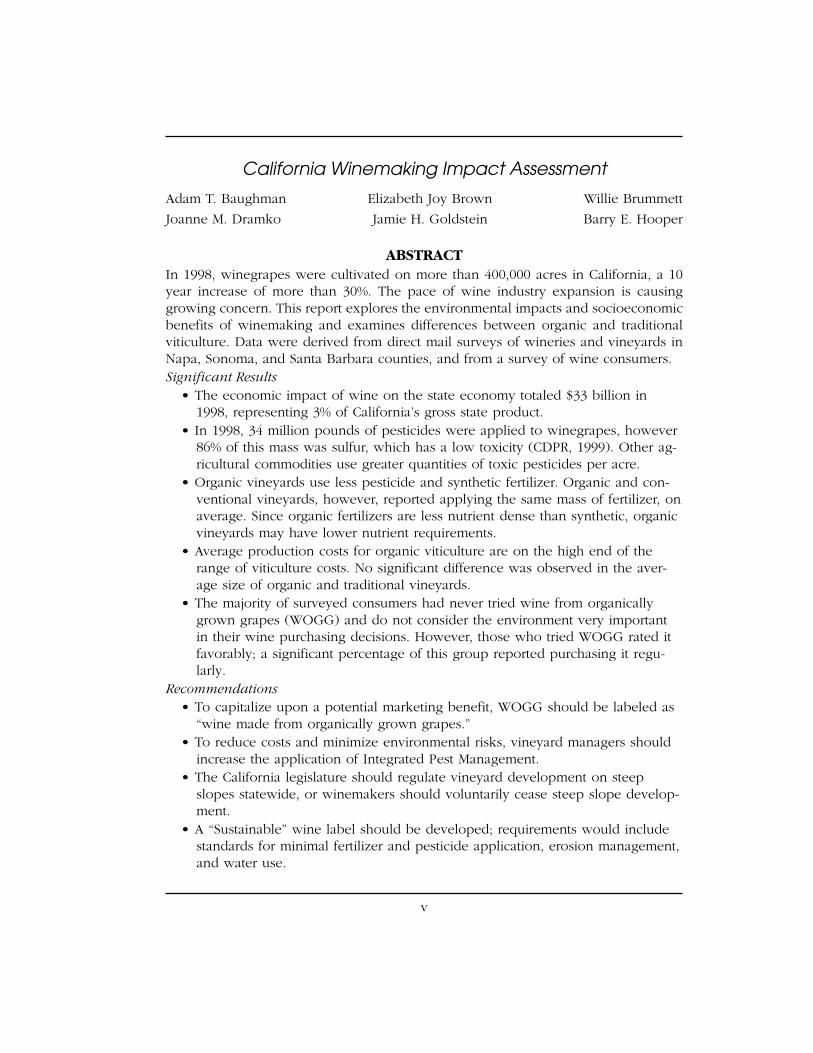
Though grown in over 40 states, California produces almost 90% of the nation’s grapes.In the last decade the U.S. grape crop has more than doubled from $1.35 billion in1987 to $3.1 billion in 1997. In addition, the crop yield has increased almost ten fold,and it is the highest value fruit crop in the nation and the sixth most valuable cropoverall. Grapes processed for wine and juice now make up 67% of the entire nationalcrop compared with about 30% in 1969 (American Vintner’s Association, 1999). Prof-itability and increased demand for wine grapes has driven the rapid expansion of thewine industry (MKF, 2000). California continues to be a leader in both grape cultiva-tion and wine production. The coupled industries have significant impacts on the stateeconomy, as shown in Table 3.1.
Employment
The California wine industry currently provides 145,000 full-time jobs to Californians,and an additional 40,000 to 50,000 jobs during the fall harvest (MKF, 2000). In SantaBarbara County, 600 people work full-time in the wine industry and more than 2,600are employed part-time or seasonally. The county’s total wine-related payroll exceeds$30 million per year (Gomberg, 1999). Studies conducted by Wine Business Monthlyin 1997 and 1999 of 300 wineries show significant salary increases for wine workers inthe last two years. California is at the top of the pay scale for winery employment.
Employees of larger vineyards are typically paid much more than their counterparts atsmaller vineyards. In 1997, vineyard managers made an average of $33,300 per year;by 1999 the mean salary of vineyard managers had increased to $41,572, a gain ofnearly 25 percent. Vineyards over 200 acres offer the highest income for most posi-tions; vice presidents of vineyard operations and directors of vineyard operations hold
Table 3.1 Major economic impacts of the California wine industry in 1998 (MKF,2000).
Number of grape growers 4,400Full-time equivalent jobs 145,000Wages paid $4.3 billionRetail value of all wine produced $12.3 billionTourism expenditures $1.2 billionTaxes paid in California $1 billionTaxes paid nationwide $3.1 billion

14
the highly remunerated vineyard management positions, earning nearly twice as muchas their counterparts at smaller vineyards, as shown in Table 3.2. A breakdown of in-dustry aggregate wages is shown in Table 3.3.
Though they are generally not as well paid as their counterparts at large wineries, smallwinery employees are responsible for a wider array of duties, saving the winery orvineyard the cost of hiring additional personnel. With growth in vineyard productionand California’s wine industry, the rise in vineyard employee salaries may continue aslong as the economy is booming. Since the practice of making wine begins in the vine-yard, filling these positions with quality employees is vital to a winery’s success (WineBusiness Monthly, 1999).
Table 3.2 Mean 1998 salaries for selected vineyard and winery positions (WineBusiness Monthly, 1999).
Position Vineyard size Mean salaryDirectors of vineyard operations >200 acres $78,385
40-200 acres $40,000
Viticulturalist >200 acres $56,39840-200 acres $33,000
Average of all full time workers >200 acres $21,70540-200 acres $18,310
Table 3.3 Sum of wages earned by California winery employees in 1998, in millionsof dollars (MKF, 2000).
On-site labor Total wagesWinery employees $641Vineyard employees $597Vineyard development, contracted services $397Vineyard development, vineyard employees $283
Off-site/indirect laborTourism employees $218Distributor employees (wine only) $100Glass manufacturing $70Label design and printing $56Box and bag-in-a-box production $46Grapevine nurseries $27Trucking $26Liquor store (wine specific estimate) $20Cooperage $12Corks, capsules, and screwtops $7Stainless steel tank manufacture and installation $5Education $4Wine analysis laboratories $2

15
Sales
The California wine industry has a total economic impact of $48 billion nationwide.Although the actual volume of wine sold has not significantly grown in recent years,California wineries have been seeing a definite increase in their profits. This is due tothe fact that American consumers have shifted towards higher quality wines. Table winesaccount for 88% of total wine volume in the U.S., with the remaining 12% divided roughlyequally between dessert and sparkling wines. Over the past year, the segment thatshowed the largest percentage increase was the “super-premium” wines in the $7-$14range (Wine Institute, 1999). California wines account for roughly three out of everyfour bottles sold in the U.S. The demand for U.S. wines abroad is steadily increasing,with California wines contributing 98% of U.S. wine exports. In 1998 wine exports grewto $506 million. From 1989 to 1998, wine exports grew at of 20% per annum. The larg-est export markets for U.S. wine are the United Kingdom, Japan and Canada. In 1998,California wine industry sales were $13 billion. To put that into perspective, Hewlett-Packard had a net revenue of $47 billion (Rachman, 1999) In Table 3.4 the total salesof the largest wine producing companies are presented.
In June of 1999, Gomberg, Fredrickson & Associates a winery consulting firm pub-lished the results of a survey of Santa Barbara County growers, vintners, and profes-sional vineyard managers. Eighty-one percent of the wineries participated in the sur-
Table 3.4 Wine related revenue for California in 1998 (in millions of dollars).
Total winery sales revenue $7,900Retail and restaurant wine sales in California $4,425Distributors sales in California $3,000Wine grapes $1,600Tourism $1,200Glass $1,150Tax revenues $1,002Financing revenues–Debt $886Vineyard development $643Vineyard development materials, excluding vines $373Corks, capsules, and screwtops $175Box and bag-in-a-box sales $170Wine labels $106Grapevines $81Trucking $63Charitable contributions $62Cooperage $56Financing revenues–Equity $20Stainless steel tanks $11Wine analysis laboratories $4Grapevine assessments $2Research $2

16
vey, and 58% of the growers participated. This survey demonstrated that the wine in-dustry in Santa Barbara County has become the largest and most important agricul-tural business. The value of the grapes alone is $59 million, the third highest valuecrop after broccoli ($74 million) and strawberries ($71 million). Since 1996, plantedgrape acreage has increased by 5,500 acres to 16,500 acres, and it is estimated thatcounty vineyards will exceed 20,000 acres by the year 2000. Santa Barbara County wineindustry’s direct revenues increased by 35% to $136 million. In 1992 there were 34wineries, while today there are over 56. The number of cases of wine has doubledsince 1992 surpassing one million cases. Santa Barbara County grapes are the thirdhighest in price just behind Napa and Sonoma. The ten largest wineries in Santa Bar-bara County produce 80% of the county’s total wine volume (Gomberg, 1999). In Cali-fornia the ten largest wineries produce approximately 70 million cases while the ma-jority of the wineries produce less than 25 thousand cases which can be seen in Figure3.1.
Figure 3.1 Number of wineries producing different volumes of wine. Total numberof wineries equals 850 (MKF, 2000).
Classification of Wineries According to Production in Cases per Year
60%
9%
23%
4% 1% 1%2%
under 25 thousand
25 to 50 thousand
50 to 100 thousand
100 to 500 thousand
500 thousand to 1 million
1 to 10 million
over 10 million

17
Table 3.5 Total Value of California agricultural commodities (County AgriculturalCommissioners Data, 1998).
Wine Grapes $1,848,398,600.00Table & Raisin Grapes $1,299,324,400.00Oranges $980,582,100.00Almonds $912,983,900.00Cotton Lint $627,105,300.00Lettuce(head) $601,544,200.00Rice $409,499,300.00Strawberries $368,605,400.00Lemons $333,616,000.00Broccoli $326,805,800.00Walnuts $288,616,800.00Tomatoes $269,781,000.00Garlic $120,257,600.00Carrots $55,604,300.00
Tax Revenue
State and local governments receive more than $1 billion annually from wine-relatedsales, excise, income and property tax revenues. The federal government and otherstates collect an additional $2.1 billion in taxes. In Santa Barbara, the economic contri-bution of the wine industry is important, contributing $1.1 million per year in Califor-nia sales taxes and about $3.9 million in county property taxes (Gomberg, 1999). Since1977, the annual revenues from wine taxes in California have increased 244.2% (MKF,2000).
Tourism
Almost 11 million people visit California’s vineyard areas annually, generating morethan $1.2 billion in tourism dollars. Tourism is the third largest employer in thestate(California Tourism Research, 2000). Napa County alone has nearly 5 million tour-ists visiting each year (MKF, 2000). In 1997, winery tourists spent an estimated$25,300,000 within Santa Barbara County (Gomberg, 1999).
In summary, the California wine industry has a significant impact on the State’s economy.Grapes are the second most valuable commodity in California, behind milk and cream(NASS, 1999). In 1998 wine grapes had a value of approximately $1.8 billion, far sur-passing the value of other crops as seen in Table 3.5. The California wine industryprovides jobs, tax revenue, and is a major tourist attraction. With the rapid growth ofthe industry it is likely that its economic contribution will continue to grow.

18
4. Methods
Analysis of the impacts of the California wine industry began with the assembly of arepresentative suite of categories of the environmental and socioeconomic effects ofwine grape cultivation, wine production, and distribution. The final list, shown in Table4.1, was designed to enable CWIA to answer four key questions:
A. What does the California economy gain from vineyards and winemaking?
B. What is the effect of the wine industry on the state’s environment?
C. What are the significant differences between organic and conventionalviticulture, if any?
D. Do consumers care about environmental impacts related to wine, and wouldtheir choices be affected by additional information?
For each category, we sought information necessary to address the four questions ofinterest. The California wine industry is large, complex, and diverse. A comprehensivestudy of all information relevant to each category of environmental and socioeconomicimpacts listed in Table 4.1 would arguably be impossible, and certainly was beyondthe manpower and budgetary resources at our disposal. In an effort to develop a rea-
Table 4.1 Impact Criteria.
Winegrape CultivationLand use conversionAlteration of air, soil and water qualityHealth impactsDifferences in water/nutrient demandGrape yield and quality
Wine ProductionDifferences in fermentation techniquesMaterial inputsWastewater treatment
Socioeconomic FactorsEmploymentProduction costTourismSalesMarketingDistribution channels

19
soned assessment of the industry as a whole, key criteria were selected as indicatorsand used to evaluate selected impacts relevant to the four questions of interest. Foreach indicator, information was collected through at least one of five avenues:
• Source Review: Assembly of available data, including information collected bystate and local government agencies, university extension services, wine in-dustry groups, and literature of the sciences and social sciences.
• Vineyard Survey: A direct mail Vineyard Survey targeting vineyard managersin Santa Barbara, Napa, and Sonoma counties and all vineyards certified or-ganic by the California Certified Organic Farmers.
• Winery Survey: A direct mail Winery Survey targeting winemakers in SantaBarbara, Napa, and Sonoma counties and all wineries operating vineyards cer-tified organic by the California Certified Organic Farmers.
• Consumer Survey: A survey of consumer opinions about conventional winesand wines from organically grown grapes.
Source Review
The first step in information assembly was the identification of stakeholders and agen-cies likely to possess data about the wine industry’s performance for each categorylisted in Table 4.1. Targeted groups included state and local governmental agencies,non-governmental organic certification agencies, the University of California Agricul-tural Extension Service, the University of California Sustainable Agriculture Researchand Education Program, academic researchers, industry associations, and chambers ofcommerce. Through an extensive literature search, relevant publicly available infor-mation was gathered. Significant sources of data included the California Departmentof Pesticide Regulation (DPR) (PUR, 1998; Ross and Kaplan, 1998), the Wine Institute(Wine Institute, 1999), University of California Cooperative Extension Service (UCCE,1992a and b; UCCE, 1994; UCCE 1996a,b, and c; UCCE 1997; UCCE 1998), wine indus-try consultants (Gomberg et al., 1998), the California Employment Development De-partment, and primary research literature (Huske & Levson, 1997, etc.).
It was confirmed that comprehensive analysis of differences in impact between seg-ments of the wine industry cannot be accomplished solely on the basis of publishedliterature. Published sources provide extensive context for the results of the project’squestionnaires and experiments. However, in many cases the data of interest are notcollected on a regular basis, limiting potential for comparisons of factors of interests,or are not available in a format that differentiates between the management practicesof interest. We therefore found it necessary to develop surveys that filled gaps in ex-tant literature regarding current industry practices and consumer preferences.

20
Industry Surveys
It was determined that two types of survey were required to obtain information be-yond the materials currently collected and published regarding the wine industry. Thesequestionnaires include a survey of viticultural practices (Vineyard Survey), and a sur-vey of winery management practices (Winery Survey).
The methodology employed for each survey varies with the scale of the populationsampled. Questionnaires for the Vineyard Survey and the Winery Survey were designedfor direct mailings targeting every winery and/or vineyard that could be identified inNapa, Sonoma, and Santa Barbara counties, along with all vineyards certified by theCalifornia Certified Organic Farmers (CCOF) statewide.
Contact information for certified organic farmers was provided by CCOF. Compiling acomprehensive list of California vineyards was problematic; agricultural agencies donot maintain a complete list of vineyards in the state. In addition, requests for mem-bership listings were denied as a matter of policy by the California Association ofWinegrape Growers and the Wine Institute. The mailing list for vineyards not certifiedas organic was therefore compiled from the next best available source: advertising. Anextensive list of wineries in Napa, Sonoma, and Santa Barbara counties was assembledthrough an internet-based search. Numerous lists of wineries, regional advertisingwebsites, and individual winery home pages were compiled into a single database.
Surveys were addressed to winemakers whenever possible; names of survey recipi-ents for each operation were compiled from individual winery home pages, whichyielded a contact name for approximately 90% of wineries. The final database included73 certified organic vineyards and 470 non-certified vineyards and/or wineries in threekey wine producing counties: Napa, Sonoma, and Santa Barbara. The Vineyard andWinery questionnaires were distributed via U.S. post in November 1999. Companiesthat did not respond to the surveys within six weeks were contacted by telephone andprovided with an additional copy of the questionnaires, if necessary.
A sampling methodology based upon advertising is not comprehensive, even in thetargeted counties. This approach works best with companies that have a retail productthat needs to be brought to the general public’s attention, i.e. wineries. As a result, thelist of wineries surveyed is more likely to be exhaustive than for vineyards that selltheir grapes directly to wineries or to wholesale wine grape buyers (“growers”). Growershave little incentive to advertise to the public; as a result, only 16 growers completedthe Vineyard Survey. It is uncertain what proportion of the total grower population inthe surveyed counties is represented.

21
Vineyard Survey
The Vineyard Survey questionnaire was designed both to gauge general industry trendsand to illuminate differences between certified organic and conventional vineyards.The questionnaire was limited to factors that are too site-specific to be determined byexamination of aggregated data in published literature. To maximize survey responserate, the questionnaire was brief rather than comprehensive, probing for key indica-tors which were selected to illuminate the effect of viticulture on the environment, thedistribution of wage rates among vineyards, and the significant differences betweenorganic and conventional viticulture, if any.
The survey, included in Appendix B, consisted of five types of questions:
• Productivity: Four questions determined cultivated acreage, grape yield, andthe selling price for grapes sold.
• Material inputs and outputs: Seven questions determined quantity and typesof fertilizer applied; sulfur application rate; non-sulfur pesticide cost; and thequantity of water required, its source, and irrigation methodology.
• Integrated Pest Management: One question quantified the degree of imple-mentation of five common IPM techniques for vineyards, identified by theCentral Coast Vineyard Team (CCVT, 1999).
• Organic certification: Three questions identified total certified organic acre-age, organic but non-certified acreage, and reason for not obtaining organiccertification, if applicable.
• Labor input: Two questions determined the labor intensity of harvesting andthe number of temporary and permanent personnel employed at low, modest,and professional wage rates.
Winery Survey
Like the Vineyard Survey, the Winery Survey questionnaire was designed to examineindustry trends; its further intent was to determine the fate of organically grown grapesfrom the point of view of the winery. The questionnaire was brief; its scope was lim-ited to factors that are too site-specific to be determined by examination of aggregateddata in published literature. The survey, included in Appendix B, consisted of five typesof questions:
• Productivity: Five questions determined winery age, average annual produc-tion, production during the previous year, projected output for the currentyear, and percentage of wines produced from organically grown grapes.
22
• Material inputs and outputs: Six questions identified water source and usagerate; wastewater flows and treatment; percentage of grapes purchased ratherthan grown on winery-owned vineyards and percentage of purchased grapesgrown organically.
• Grape purchase criteria: One question probed the criteria for grape purchasedecision making.
• Labor input: One question addressed the number of temporary and perma-nent personnel employed at low, modest, and professional wage rates.
• Distribution and marketing: Four questions determined retail price of winesproduced, distribution channels employed by the winery, whether wines fromorganically grown grapes require alternative distribution channels and whetherwines made from organically grown grapes are labeled as such.
In contrast to the Vineyard Survey, analysis of the Winery Survey did not focus uponorganic certification. Though the California Organic Foods Act prescribes standardsfor the processing of organic foods, “organic wine” was not a term with an approvedregulatory definition at the time the survey was conducted. Additionally, processingstandards for organic products do not appear to impose any substantive limitations onorganic winemakers that would significantly alter winery environmental impacts, asdiscussed in Chapter 2.
Consumer Survey
The Consumer Survey, included as Appendix C, was designed to determine whetherconsumers take environmental impact into consideration when deciding which bottleof wine to buy, and whether the importance of environmental impacts in wine pur-chase decisions would be affected if a greater quantity of relevant information wasavailable.
Consumers were interviewed by project team members at a variety of locations in SantaBarbara, including a local wine specialty shop, two grocery stores known for their wineselection, a local graphic design firm, and at a University of California Santa Barbaraclass. At each sampling point, interviewees consisted of all individuals entering or ex-iting the study site who agreed to participate in the study. In order to exclude personswho are not part of the current wine market, individuals who purchased wine infre-quently (less than once per month) were asked no further questions and were notincluded in the analysis. Eighty-four wine consumers participated in the survey.
23
5. Survey Results
Response Rate
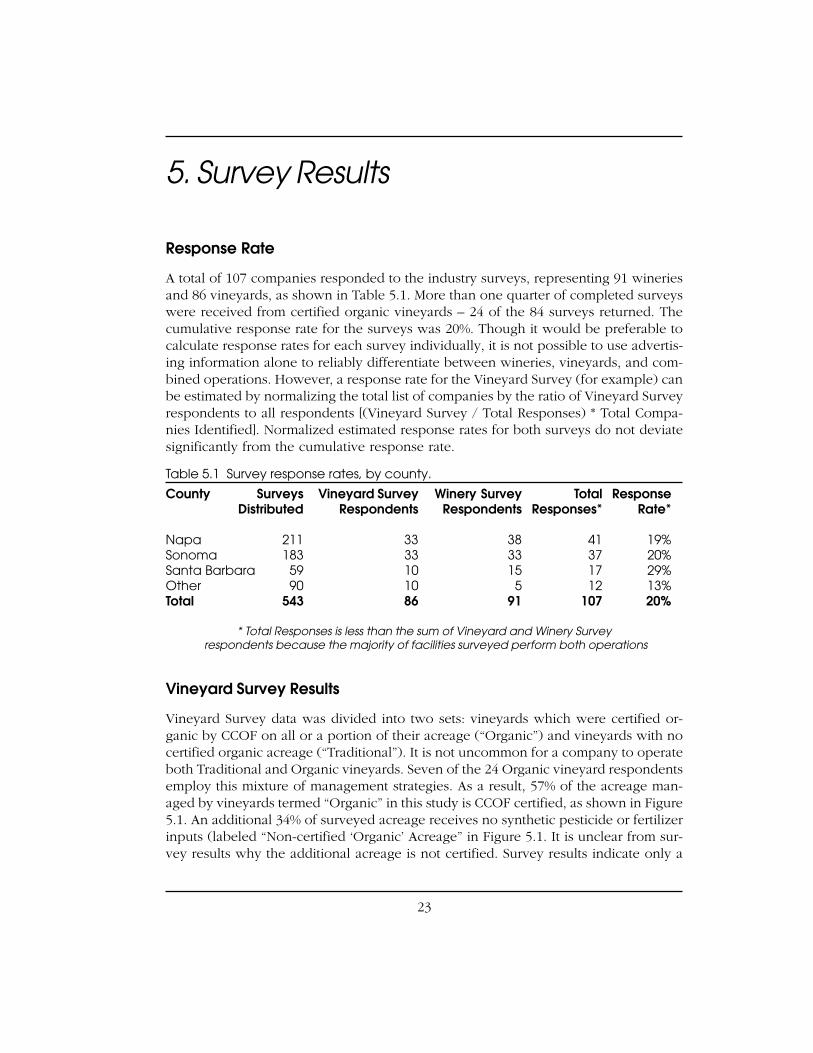
A total of 107 companies responded to the industry surveys, representing 91 wineriesand 86 vineyards, as shown in Table 5.1. More than one quarter of completed surveyswere received from certified organic vineyards – 24 of the 84 surveys returned. Thecumulative response rate for the surveys was 20%. Though it would be preferable tocalculate response rates for each survey individually, it is not possible to use advertis-ing information alone to reliably differentiate between wineries, vineyards, and com-bined operations. However, a response rate for the Vineyard Survey (for example) canbe estimated by normalizing the total list of companies by the ratio of Vineyard Surveyrespondents to all respondents [(Vineyard Survey / Total Responses) * Total Compa-nies Identified]. Normalized estimated response rates for both surveys do not deviatesignificantly from the cumulative response rate.
Table 5.1 Survey response rates, by county.
County Surveys Vineyard Survey Winery Survey Total ResponseDistributed Respondents Respondents Responses* Rate*
Napa 211 33 38 41 19%Sonoma 183 33 33 37 20%Santa Barbara 59 10 15 17 29%Other 90 10 5 12 13%Total 543 86 91 107 20%
* Total Responses is less than the sum of Vineyard and Winery Survey respondents because the majority of facilities surveyed perform both operations
Vineyard Survey Results
Vineyard Survey data was divided into two sets: vineyards which were certified or-ganic by CCOF on all or a portion of their acreage (“Organic”) and vineyards with nocertified organic acreage (“Traditional”). It is not uncommon for a company to operateboth Traditional and Organic vineyards. Seven of the 24 Organic vineyard respondentsemploy this mixture of management strategies. As a result, 57% of the acreage man-aged by vineyards termed “Organic” in this study is CCOF certified, as shown in Figure5.1. An additional 34% of surveyed acreage receives no synthetic pesticide or fertilizerinputs (labeled “Non-certified ‘Organic’ Acreage” in Figure 5.1. It is unclear from sur-vey results why the additional acreage is not certified. Survey results indicate only a

24
small fraction of the uncertified acreage is undergoing the waiting period prior to cer-tification. However, the survey design did not allow complete segregation of data toreflect differences in management techniques applied by individual companies man-aging more than one vineyard. The mixture of management strategies among the setof Organic vineyards surveyed is therefore likely to result in somewhat conservativeestimates of differences between Organic and Traditional vineyards.
The rate of use of pesticides and synthetic fertilizers is of course the most substantialdifference between Organic and Traditional vineyards. Organic vineyards must abideby strict limitations on the type and quantity of pesticides they apply, and sulfur istheir primary chemical tool for pest control. Sulfur is the most commonly applied pes-ticide on all vineyards, accounting for 86.5% of the mass of pesticide applied to winegrapes statewide in 1998 (PUR, 1999). Pesticide data was therefore broken into twocategories: sulfur and pesticides other than sulfur.
Respondents could reasonably be expected to be reticent to detail the mass of non-sulfur pesticides they apply, so the survey was designed to gauge the impact of thesepesticides on vineyard finances by asking for an estimate of annual non-sulfur pesti-cide expenditures. Traditional vineyards reported spending $55.12 per acre per yearon non-sulfur pesticides. Not surprisingly, Organic vineyards spent far less, an averageof $1.70. The estimate is slightly inflated by two vineyards with a mixture of organic
Figure 5.1 Total Surveyed Acreage for Organic and Traditional Vineyards
Acreage Surveyed
0
2000
4000
6000
8000
10000
12000
14000
Traditional
Vineyards
Organic
Vineyards
Ac
res
Traditional Acreage
Non-Certified "Organic"Acreage
Certified Organic Acreage

25
and traditional management strategies, presumably indicating pesticide use on theirnon-certified acreage. Excluding these two mixed farms, the remaining Organic vine-yards spent less than $0.25 per acre per year on non-sulfur pesticides. The fact thatOrganic vineyard non-sulfur pesticide expenditures were greater than zero does notnecessarily indicate a violation of organic cultivation standards. CCOF standards alloworganic growers to use a number of products on their vineyards for pest control pur-poses – acetic acid, ascorbic acid, and certain plant-derived oils, for example.
The distinction between sulfur application rates for Organic and Traditional vineyardsis not as clear cut. Survey results appear to indicate that Organic vineyards use lesssulfur per acre than Traditional Vineyards, as shown in Table 5.2, a counterintuitiveresult. Since the set of chemical pest control tools at the disposal of Organic vineyardsis limited, one would expect they would compensate somewhat by using sulfur moreheavily than Traditional vineyards. Unfortunately, the logarithmic binning applied tothe question could conceivably mask differences in mean sulfur usage.1 Table 5.2 shouldtherefore be conservatively interpreted to indicate the distribution of sulfur applica-tion rates is similar for both vineyard types within the sensitivity of the test.
Table 5.2 Comparison of annual sulfur application rates. Values are percentages oftotal respondents.
Pounds of Sulfur per Acre0-10 10-100 >100
Traditional 24% 70% 6%Organic 39% 57% 4%
When asked about the source of fertilizer for their vineyard, Traditional Vineyards re-ported that the bulk of their fertilizer needs are met with synthetic fertilizers, followedby compost, and other materials such as grape pomace and bone meal, as shown inFigure 5.2. As one would expect, Organic vineyards reported that they did not usesynthetic fertilizers, with one exception. One of the companies that manages both acertified Organic vineyard and a Traditional vineyard uses synthetic fertilizers to meet80% of its fertilizer needs.
The two key differences between synthetic fertilizer products and compost are energyuse and the potential for water quality impacts. As discussed in Chapter 6, syntheticfertilizers require substantial energy to produce, and the chemical species of essentialnutrients can be more mobile, increasing the likelihood of nitrate leaching into groundor surface waters. However, farmers are rational business people; synthetic fertilizers
1 Future researchers applying the indicator list contained in this report are encouraged to avoid this problemby discarding the binning approach in favor of direct answers when collecting non-ordinal numericaldata. This limitation was unique to the sulfur question.

26
have their advantages. Nutrients in compost are entrained in a matrix of organic mat-ter, meaning that compost has a significantly greater mass and volume than syntheticfertilizer per unit of nitrogen, phosphorous, and potassium applied. Looking at thefarm system in isolation, application of synthetic fertilizer is therefore presumably lesslabor intensive, and requires less on-farm fuel use per unit of nutrient applied. How-ever, though the average mass of fertilizer applied per acre per year to Organic vine-yards was larger than the mass applied to Traditional vineyards, the difference was notsignificant, implying that the difference in fuel use for fertilizer application is probablyalso not significant. It should be remembered that vineyards take pains not to over-fertilize, which can result in reduced grape quality and can even damage the roots ofyoung vines. Large applications of synthetic fertilizer are therefore unlikely to be ben-eficial, and are probably quite rare for both vineyard types.
Integrated Pest Management (IPM) has been proposed as a “third way” (after tradi-tional and organic techniques) of reducing vineyard fertilizer and pesticide inputs. IPMis the practice of using an intensive pest monitoring program in conjunction with bio-logical and cultural manipulation of the vineyard ecosystem to reduce pest popula-tions. The use of pesticides in IPM is not entirely abrogated, as in organic viticulture,
Figure 5.2 Breakdown of Fertilizer Sources. Percentages shown illustrate theproportion of each group’s fertilizer needs met by the indicated fertilizertype.
Breakdown of Fertilizer Sources
61%
29%
6%4%
49%
34%
0%
10%
20%
30%
40%
50%
60%
70%
Synthetic fertilizer Compost Other fertilizers
Traditional
Organic

27
but IPM practitioners attempt to limit pesticide use to applications which are economi-cally rational. Pre-emptive applications of broad-spectrum pesticides throughout theentire vineyard are discouraged in favor of targeted and carefully timed pesticide usewhenever possible. A key characteristic of integrated pest management strategies ishabitat manipulation. Vegetation is cultivated to minimize habitat for problematic in-sects that would otherwise need to be chemically controlled, to maximizing availablehabitat for species that prey upon pests, and to exclude weeds from the vineyard.Multiple strategies are often employed simultaneously. Such vegetation, grown betweenthe rows of vines, is termed cover crops. IPM is discussed in greater detail in Chapter6.
To gauge the prevalence of Integrated Pest Management in vineyards, surveyed vine-yards were asked to estimate the percentage of their acreage on which they employedfive common IPM management practices. None of the techniques are exclusive; ambi-tious IPM adherents could apply all five techniques to the same plot. As shown in Fig-ure 5.3, the rates of application for four of the five IPM techniques included in thesurvey are very similar for Organic and Traditional vineyards. However, the one cleardifference is telling: Organic vineyards use cover crops to provide habitat for benefi-cial insects on nearly twice as much of their acreage as Traditional vineyards, on aver-age. This phenomenon emphasizes the limitations imposed on Organic vineyards by
Integrated Pest Management Techniques
69% 71%
36%42%
72%70%74%
62%
33%
63%
0%
10%
20%
30%
40%
50%
60%
70%
80%
A B C D E
Traditional
Certified Organic
Encouragecover crops inrow middles?
Use winter covercrops for erosion
control?
Use cover cropsthat are habitat
for beneficialinsects?
Deter growth ofplants which are
host to pests?
Remove leavesto reduce
disease, pests,or improve wine
quality?
Figure 5.3 Mean Percentage of Vineyard Area Managed with SelectedIntegrated Pest Management Techniques
28
organic standards; lacking the ability to use pesticides to control problem insect, Or-ganic vineyards must rely more heavily upon beneficial insects to control their pestproblems.
Increased usage of IPM techniques by Organic vineyards is to be expected; many IPMtechniques are adaptations of the biological control techniques that had to be devel-oped for Organic vineyards to be successful. In fact, the observation that Organic andTraditional vineyards differed little in their application of 4 out of 5 selected IPM tech-niques is evidence of widespread adoption of Integrated Pest Management principlesby vineyards with little or no interest in “going organic”. Though the survey resultscannot be construed to indicate the relative importance of reducing environmentalimpacts versus the possible financial benefit of reduced reliance upon pesticides, thedifference is moot. IPM techniques have clearly become a part of mainstream winegrape viticulture.
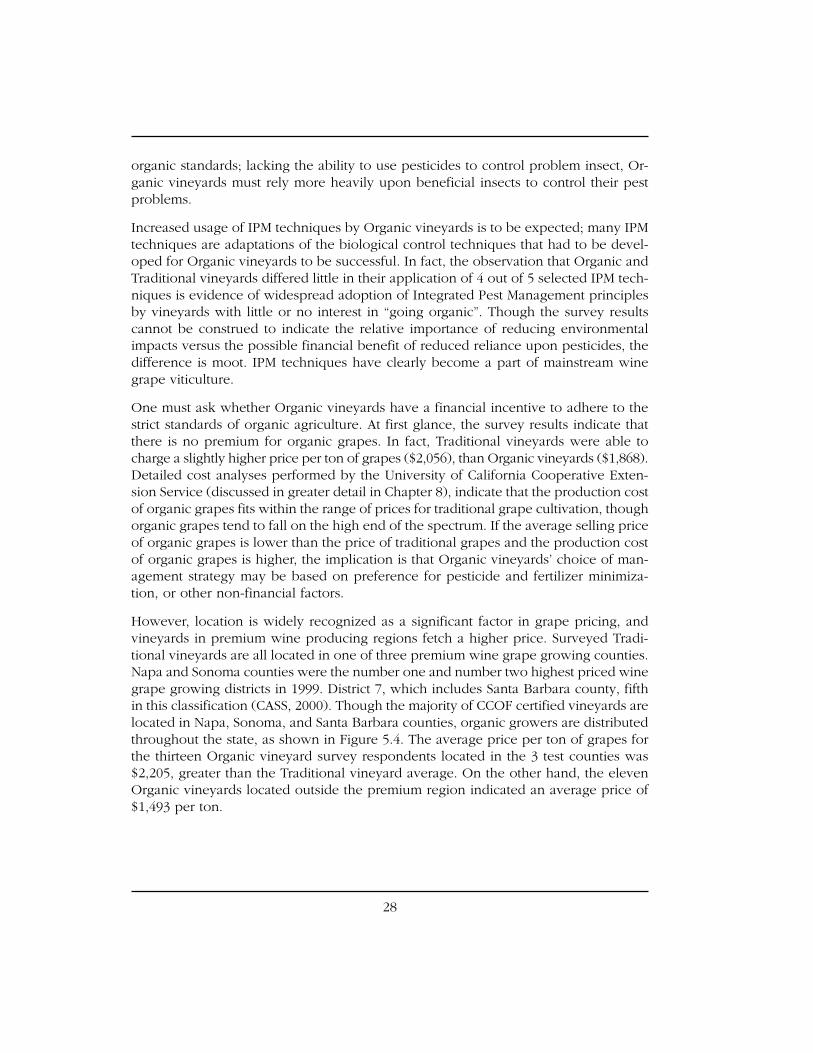
One must ask whether Organic vineyards have a financial incentive to adhere to thestrict standards of organic agriculture. At first glance, the survey results indicate thatthere is no premium for organic grapes. In fact, Traditional vineyards were able tocharge a slightly higher price per ton of grapes ($2,056), than Organic vineyards ($1,868).Detailed cost analyses performed by the University of California Cooperative Exten-sion Service (discussed in greater detail in Chapter 8), indicate that the production costof organic grapes fits within the range of prices for traditional grape cultivation, thoughorganic grapes tend to fall on the high end of the spectrum. If the average selling priceof organic grapes is lower than the price of traditional grapes and the production costof organic grapes is higher, the implication is that Organic vineyards’ choice of man-agement strategy may be based on preference for pesticide and fertilizer minimiza-tion, or other non-financial factors.
However, location is widely recognized as a significant factor in grape pricing, andvineyards in premium wine producing regions fetch a higher price. Surveyed Tradi-tional vineyards are all located in one of three premium wine grape growing counties.Napa and Sonoma counties were the number one and number two highest priced winegrape growing districts in 1999. District 7, which includes Santa Barbara county, fifthin this classification (CASS, 2000). Though the majority of CCOF certified vineyards arelocated in Napa, Sonoma, and Santa Barbara counties, organic growers are distributedthroughout the state, as shown in Figure 5.4. The average price per ton of grapes forthe thirteen Organic vineyard survey respondents located in the 3 test counties was$2,205, greater than the Traditional vineyard average. On the other hand, the elevenOrganic vineyards located outside the premium region indicated an average price of$1,493 per ton.

29
These results underline the importance of location in grape pricing, and suggest thatOrganic Vineyards located in premium wine producing regions may enjoy the highestoverall prices. The reader is cautioned to remember that grape variety is also a signifi-cant factor that is not accounted for in this analysis. For example, the average sellingprice of Cabernet Sauvignon grapes grown in the three Districts is $2,029, while Zinfandelgrapes yield average returns of $1,341 per ton (CASS, 2000). In the absence of infor-mation about the mixture of grape varieties grown by surveyed vineyards, the surveyresults may be conservatively interpreted to indicate grape prices for Organic growersare in line with those earned by Traditional vineyards, and may actually be higher.
If the material costs are similar for traditional and organic wine grapes, but outlays forpesticide and fertilizer inputs are less for Organic vineyards, other factors contributingto production costs must be more expensive. One possible factor is labor cost; severalaspects of organic viticulture appear likely to result in a greater need for laborers rela-tive to traditional techniques. Examples include intensive monitoring of pests, climate,and invasive weeds, along with mechanical weed management techniques. To exam-ine potential differences in labor costs, vineyards were queried regarding the numberand pay rate of their employees. As shown in Table 5.3, the total number of seasonalemployees per 100 planted acres of Organic and Traditional vineyard is very similar,implying that there is actually no significant increase in the on-farm labor pool of Or-ganic vineyards. If one assumes that the annual employment period for seasonal em-ployees is similar for Organic and Traditional vineyards, the cost of seasonal labor may
Distribution of CCOF Vineyards
77%
23%
Napa, Sonoma,and Santa BarbaraCounties
Other Counties
Figure 5.4 Distribution of All CCOF Certified Vineyards in California. Source: CWIAVineyard Survey. Total number equals 70 vineyards.
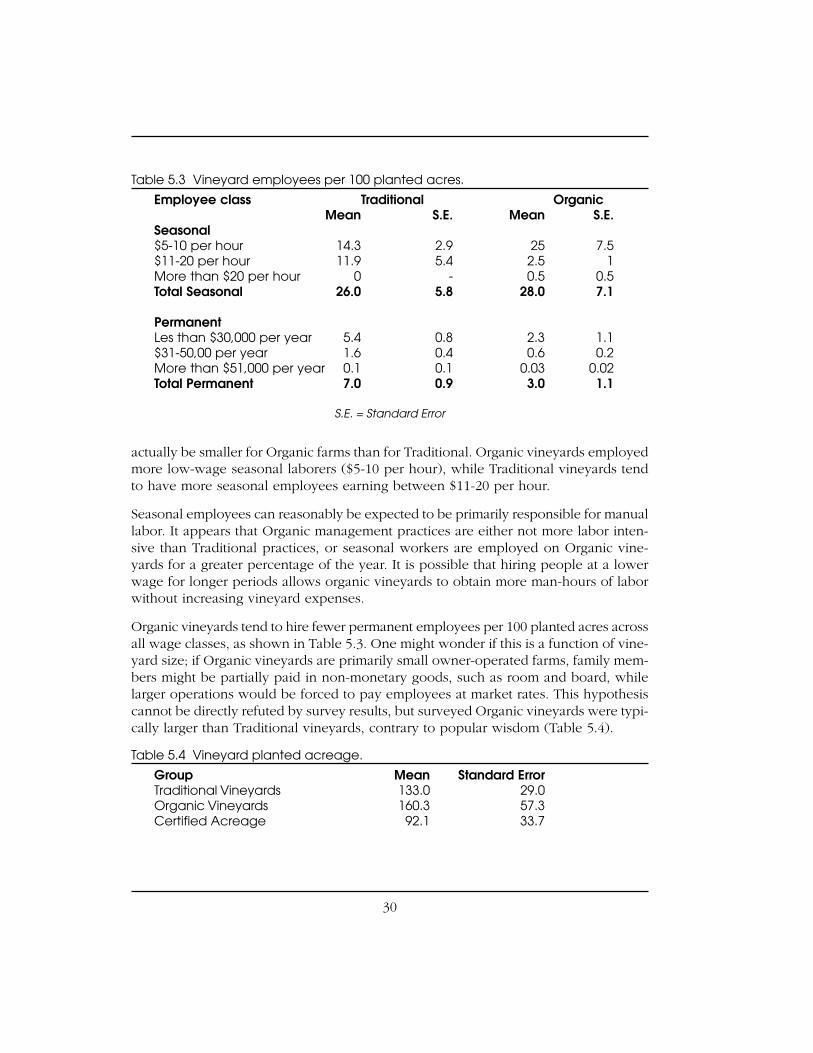
30
actually be smaller for Organic farms than for Traditional. Organic vineyards employedmore low-wage seasonal laborers ($5-10 per hour), while Traditional vineyards tendto have more seasonal employees earning between $11-20 per hour.
Seasonal employees can reasonably be expected to be primarily responsible for manuallabor. It appears that Organic management practices are either not more labor inten-sive than Traditional practices, or seasonal workers are employed on Organic vine-yards for a greater percentage of the year. It is possible that hiring people at a lowerwage for longer periods allows organic vineyards to obtain more man-hours of laborwithout increasing vineyard expenses.
Organic vineyards tend to hire fewer permanent employees per 100 planted acres acrossall wage classes, as shown in Table 5.3. One might wonder if this is a function of vine-yard size; if Organic vineyards are primarily small owner-operated farms, family mem-bers might be partially paid in non-monetary goods, such as room and board, whilelarger operations would be forced to pay employees at market rates. This hypothesiscannot be directly refuted by survey results, but surveyed Organic vineyards were typi-cally larger than Traditional vineyards, contrary to popular wisdom (Table 5.4).
Table 5.4 Vineyard planted acreage.
Group Mean Standard ErrorTraditional Vineyards 133.0 29.0Organic Vineyards 160.3 57.3Certified Acreage 92.1 33.7
Table 5.3 Vineyard employees per 100 planted acres.
Employee class Traditional OrganicMean S.E. Mean S.E.
Seasonal$5-10 per hour 14.3 2.9 25 7.5$11-20 per hour 11.9 5.4 2.5 1More than $20 per hour 0 - 0.5 0.5Total Seasonal 26.0 5.8 28.0 7.1
PermanentLes than $30,000 per year 5.4 0.8 2.3 1.1$31-50,00 per year 1.6 0.4 0.6 0.2More than $51,000 per year 0.1 0.1 0.03 0.02Total Permanent 7.0 0.9 3.0 1.1
S.E. = Standard Error

31
Vineyard age is another possible explanation; older vineyards with mature vines couldconceivably require less active management. However, the average year of first com-mercial grape production was not different for Organic and Traditional vineyards, thoughFigure 5.5 suggests that Traditional vineyards were established in a bimodal pattern.Most Traditional vineyards were developed during or after the 1970’s, though severalwere established before 1930. Vineyards that are now Organic were established at afairly constant rate prior to a spike in the 1980’s, but Organic vineyards comprise adeclining share of vineyards established in the 1990’s. Establishment dates only reflectthe initial development of the vineyard; the questionnaire did not address the datewhen organic management practices were first implemented or the expansion of ex-isting vineyards. Interestingly, the year of first commercial grape production rangedfrom a venerable plot first planted in 1870, to a winery that intends to harvest its firstcrop of grapes in 2001.
Though CCOF standards place stringent limitations on chemical inputs to the vine-yard, adherence to organic standards is not necessarily indicative of overall sustainability.Water use is a key environmental concern in agriculture that is not covered by organicstandards. As shown in Table 5.5, on average, Organic vineyards indicated they useless water per acre then Traditional Vineyards, but the difference is not statistically
Distribution of Vineyard Establishment Date
0
2
4
6
8
10
12
14
1900's 1910's 1920's 1930's 1940's 1950's 1960's 1970's 1980's 1990's 2000's
Traditional
Organic
Figure 5.5 Distribution of Vineyard Establishment Dates.
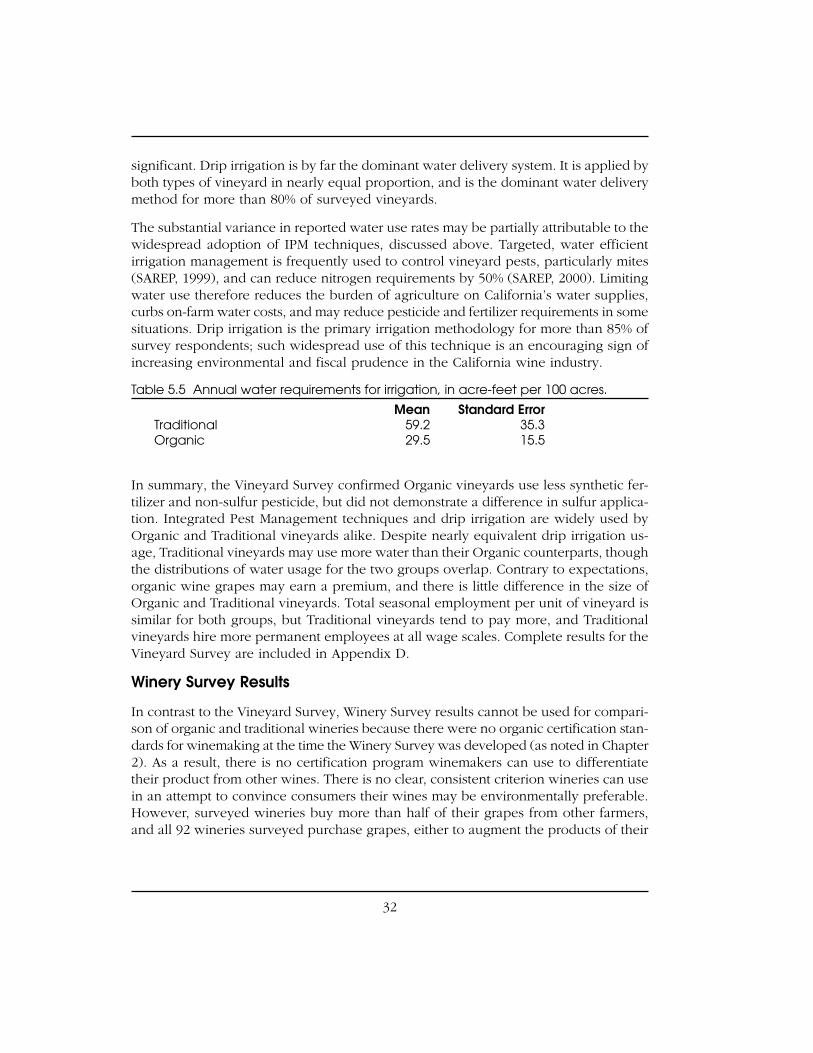
32
significant. Drip irrigation is by far the dominant water delivery system. It is applied byboth types of vineyard in nearly equal proportion, and is the dominant water deliverymethod for more than 80% of surveyed vineyards.
The substantial variance in reported water use rates may be partially attributable to thewidespread adoption of IPM techniques, discussed above. Targeted, water efficientirrigation management is frequently used to control vineyard pests, particularly mites(SAREP, 1999), and can reduce nitrogen requirements by 50% (SAREP, 2000). Limitingwater use therefore reduces the burden of agriculture on California’s water supplies,curbs on-farm water costs, and may reduce pesticide and fertilizer requirements in somesituations. Drip irrigation is the primary irrigation methodology for more than 85% ofsurvey respondents; such widespread use of this technique is an encouraging sign ofincreasing environmental and fiscal prudence in the California wine industry.
Table 5.5 Annual water requirements for irrigation, in acre-feet per 100 acres.
Mean Standard ErrorTraditional 59.2 35.3Organic 29.5 15.5
In summary, the Vineyard Survey confirmed Organic vineyards use less synthetic fer-tilizer and non-sulfur pesticide, but did not demonstrate a difference in sulfur applica-tion. Integrated Pest Management techniques and drip irrigation are widely used byOrganic and Traditional vineyards alike. Despite nearly equivalent drip irrigation us-age, Traditional vineyards may use more water than their Organic counterparts, thoughthe distributions of water usage for the two groups overlap. Contrary to expectations,organic wine grapes may earn a premium, and there is little difference in the size ofOrganic and Traditional vineyards. Total seasonal employment per unit of vineyard issimilar for both groups, but Traditional vineyards tend to pay more, and Traditionalvineyards hire more permanent employees at all wage scales. Complete results for theVineyard Survey are included in Appendix D.
Winery Survey Results
In contrast to the Vineyard Survey, Winery Survey results cannot be used for compari-son of organic and traditional wineries because there were no organic certification stan-dards for winemaking at the time the Winery Survey was developed (as noted in Chapter2). As a result, there is no certification program winemakers can use to differentiatetheir product from other wines. There is no clear, consistent criterion wineries can usein an attempt to convince consumers their wines may be environmentally preferable.However, surveyed wineries buy more than half of their grapes from other farmers,and all 92 wineries surveyed purchase grapes, either to augment the products of their

33
own vineyards, or because they do not operate a vineyard at all. Consideration of en-vironmental impacts in the grape supply chain was therefore used as a criterion foranalysis.
Grape quality and variety, followed by growing region, were clearly shown by thesurvey to be the most important factors in grape purchasing, as shown in Figure 5.6.However, the influence of environmental impacts on grape buying varied consider-ably. Of the 78 wineries who completed the purchase decision question, 53% (includ-ing all 10 CCOF certified Vineyard Survey respondents that operate wineries) ratedenvironmental impact in grape cultivation “Very Important” or “Important”, while 47%rated environmental concerns “Somewhat Important” or “Not Important”.
Based on this result, two approaches were used to analyze the Winery Survey dataset.First, aggregate survey responses were used to examine the entire group of winemakers.Second, two groups of wineries were compared: one included all wineries who rated
Figure 5.6 Importance of selected factors in wine grape purchasing decisions.
Importance of Purchasing Factors
0
10
20
30
40
50
60
70
80
Grape Quality Grape Variety Growing
Region
Price Environmental
impact
Nu
mb
er
of
resp
on
de
nts
Very Important
Important
Somewhat important
Not important

34
environmental impacts “Very Important” or “Important”, while the second group wascomprised of wineries who rated environmental impacts “Somewhat Important”, or“Not Important”. The groups are referred to as “More Sensitive” (MS), and “Less Sensi-
tive” (LS). The reader is cautioned to avoid value judgements based upon the term“More Sensitive”. In practice, the winery management strategies employed by MSwinemakers may not necessarily be environmentally preferable to those used by their“Less Sensitive” counterparts.
Though survey respondents in both groups bought grapes from other growers in roughlyequal proportion, MS wineries bought significantly more organic grapes, as shown inTable 5.6. This result confirmed that environmental concerns strongly influence grapepurchasing for MS winemakers. MS wineries further reported they produce 12.6% oftheir wines exclusively from organically grown grapes, while 0.3% of LS winemakeroutput is WOGG. It is therefore clear that organic grapes are frequently segregatedfrom other grapes, and used to produce WOGG.
However, only 31% of wineries who produce WOGG choose to note the organic ori-gin of the grapes on their wine labels. This result is surprising. With the exception ofpremium “Estate Bottled” vintages, wines are generally produced from blends of morethan one grape variety, often coming from several different vineyards. If wine proces-sors are in fact paying a premium for organic grapes (as discussed in the previoussection), and they are maintaining separate fermentations for organic grapes, there wouldappear to be some value added to the grapes because of their organic origin. It is there-fore curious that only a third of WOGG producing winemakers would attempt to usethe organic origin of their wine grapes as a selling point.
Compounding this apparent oddity, 60% of wines sold by MS wineries have retail pricesover $20 per bottle, compared with less than fifty percent of LS wines. In fact, MS win-eries appear to be sold for significantly greater retail prices overall; as shown in Figure5.7, wines priced in the $7-14 range account for an average of 20% of LS wine sales,while they only represent 9% of sales for surveyed MS wineries. This difference wasobserved despite the effect of location; the MS group included all of the surveyed win-eries outside the premium wine grape growing counties. The implication is that MS
Table 5.6 Wine grape purchase rate, and proportion of grapes bought fromorganic growers.
Percentage More Sensitive Less SensitiveMean S.E. Mean S.E.
Grapes bought from other growers 69% 5% 59% 6%Grapes purchased that are organic 14% 4% 1% 1%
S.E. = Standard Error

35
Retail Price of Wine
0%
10%
20%
30%
40%
50%
60%
70%
$3-7 $7-14 $14-20 More than $20
Price per Bottle
Tota
l Sa
les
More Sensitive
Less Sensitive
Sales Breakdown by Distribution Channel
39%
21%
23%
11%
2% 4%
Wine-exclusive distributors
Liquor distributors
Winery sales
Local merchants
Internet sales
Other
Figure 5.8 Sales Breakdown by Distribution Channel
Figure 5.7 Breakdown of Retail Price Per Bottle of Wine

36
wineries may be paying a small premium for organic grapes and charging their con-sumers higher prices, but they are successfully charging consumers more for their winessolely on the basis of quality, or a priori knowledge of the environmental sensitivity ofindividual brands. A specific price breakdown for wines from organically grown grapescannot be extracted from the Winery Survey dataset, so this inference cannot be testeddirectly.
Surveyed wineries generally do not inform consumers via labeling or advertising whena given wine is made from organically grown grapes, yet 82% of WOGG producersreported their wines from organic grapes require different distribution channels thantheir other wines. It is unclear why alternative distribution channels would be neces-
sary if the wines do not advertise the organic origin of their grapes. Additionally, therewas no significant difference between the percentage of sales MS and LS wineries at-tributed to each distribution channel. Values for MS wineries are shown in Figure 5.8.In the absence of a visible difference across major categories of distribution channels,one must conclude WOGG is primarily distributed by different distributors (i.e. spe-cialty wine and/or liquor dealers), rather than different distribution channels.
Since MS wineries tend to earn more per bottle of wine than surveyed LS wineries, itis interesting to note that they may actually have fewer employees for a given level ofproduction. When winery employees are broken down into the six classifications listedin Table 5.7, LS wineries appear to hire more seasonal workers at both the $5-10 perhour and $11-20 per hour wage classes. However, since the difference is mostly foundin the employment of seasonal workers, the total contribution of winery employeesfrom the two groups to local employment is probably similar.
Table 5.7. Number of employees per 10,000 cases produced.
Employee class More Sensitive Less SensitiveMean S.E. Mean S.E.
Seasonal$5-10 per hour 2.6 1.5 4.9 2.5$11-20 per hour 1.5 1.5 4.5 0.9More than $20 per hour 0.005 - 0.02 0.1Total Seasonal 4.2 1.3 9.4 4.2
PermanentLess than $30,000 per year 1.2 1.1 2.6 1.5$31-50,000 per year 1.7 1.1 1.3 3.3More than $51,000 per year 1 0.5 0.7 2.5Total Permanent 3.9 0.9 4.5 1.0
S.E. = standard error

37
A more important variable for local economies is winery size. Average annual wineproduction for surveyed wineries varied over four orders of magnitude. Four surveyedwineries produce less than a thousand cases per year, while at the other end of thespectrum there were four wineries which each produce more than one million casesof wine per year. The wide distribution of winery sizes indicates the industry is di-verse, and competitive pressure may be intense. However, total wine production isdominated by just a few large wineries, as shown in Figure 5.9 (b).
Winery Production Scale
48
29
11
510,000 Cases orless
10,000 to 50,000Cases
50,000 to 500,000Cases
More than 500,000Cases
Total Sales Volume
1% 5%9%
85%
Figure 5.9 a) Distribution of winery production scale, and b) Sum of each wineproduced by each winery size class for survey respondents.

38
Regardless of annual case production, water is a key input for all wineries. All of thematerials wine is exposed to, from grape to bottle, must be meticulously kept clean toavoid contamination and spoilage. Though sulfite additions do inhibit the growth ofundesirable bacteria, molds, and fungi, every tank, pipe, hose, and barrel must be thor-oughly cleaned after use, and often cleaned again before re-use. Not only is wateressential to the production process, it is a key input for landscaping and sanitation.The Winery Survey attempted to gauge the source of water used in winery operationsand the fate of wastewater generated.
Approximately 70% of surveyed wineries obtain their water from the same source, pri-vate wells. This result is probably indicative of the distribution of wineries within thethree counties, rather than a statewide trend. All the three counties surveyed are out-side of the range of the bulk of state water projects, and wineries that also managevineyards are typically located close to some section of their vineyards, resulting in adiffuse distribution which would generally make municipal water delivery difficult andexpensive. The distribution of winery wastewater treatment mechanisms supports thishypothesis. MS and LS wineries overwhelmingly rely upon on-site treatment techniques.Taken together, only 13% of MS and LS wineries send their wastewater to a municipaltreatment plant. There was no appreciable difference between the two groups in termsof water source or treatment technology.
Rates of water usage and wastewater generation per case of wine produced are thetwo factors that characterize winery water use. Since the size of surveyed wineries variesover a wide range, and total water use is largely a function of scale, reported valuesfor total annual fresh water influx and for annualized wastewater efflux cannot be mean-ingfully compared. By normalizing total flows by the number of cases each wineryproduces per year, variance attributable to differences in winery size was removed fromthe distribution, yielding a statistic that was expected to be reasonably comparableacross most wineries.
However, the calculated quantity of water required to produce a single case of winevaried over three orders of magnitude; the values for both variables ranged from lessthan 1/10 of a gallon per case to more than 50 gallons per case. As shown in Figure5.10 (a) and (b), there are no clear outliers within the distributions of either water useper case or wastewater production per case. Wineries who make more than 250,000cases per year did appear to use somewhat less water per case than smaller wineries,presumably due to economies of scale inherent in larger scale production processes,but no further conclusions can be drawn from the aggregate distribution. Distributionsof each variable for MS and LS wineries were similar to the aggregate distribution (notshown).

39
Water Used per Case
0
2
4
6
8
10
12
14
16
0 5 10 15 20 25 30 35 40 45 50 55 60
Gallons
Fre
qu
en
cy
Wastewater Generated per Case
0
2
4
6
8
10
12
14
16
0 5 10 15 20 25 30 35 40 45 50 55 60
Gallons
Fre
qu
en
cy
Figure 5.10 Histograms depict the distribution of a) water used per case, and b)wastewater produced per case of wine produced. Calculated valuesincorporate all applications, including cleaning, landscaping, andsanitation.

40
The wide range of reported water usage rates may be partly attributable to the relianceof wineries upon private wells for their water supply, and upon on-site wastewatertreatment technologies. Wineries that get their water from private wells are more likelyto be aware of the electricity cost associated with operating their wells than the totalwater influx to the winery. Likewise, though all wineries are presumably aware of thecapacity of their wastewater treatment facilities, septic tank users do not necessarilyhave gauges to monitor the flux of effluent to their tanks and leach fields. Fifty-fivepercent of surveyed wineries rely upon septic systems, 12% send their effluent tomunicipal treatment plants, and the remaining 33% employ other treatment technolo-gies such as evaporation ponds, aerated ponds, activated carbon, or a combination oftreatments.
Users of municipal water supplies and wastewater treatment plants must pay for theseservices by volume of water disposed of or consumed. They can therefore be reason-ably expected to have a better idea than private well or septic tank users about howmuch water they take in and send out. Table 5.8 shows the results of analysis of thefew surveyed wineries that rely solely upon public water supplies and municipal waste-water treatment plants. Though the sample size is small, 3 to 7 gallons probably rep-resents a reasonable range for the water required per case of wine.
Table 5.8 Water used and wastewater generated per case of wine produced.
Water use per case Wastewater per caseNumber of respondents 6 5Mean 4.78 7.12Standard Deviation 1.55 6.13Minimum 3.21 1.18Maximum 7.14 14
Inflow of water should be nearly equivalent to water outflow, since no water is actu-ally incorporated into the product. Some winery water is presumably lost to diffusiveuses, such as landscape irrigation, so one would expect wastewater flows to be con-sistently less than fresh water inflows, implying values in Table 5.8 should be consid-ered rough estimates only. The primary message to be gained from the water use es-timates provided by survey respondents is that many wineries simply do not knowhow much water they use or how much wastewater they generate.
In summary, the survey results indicate MS wineries buy significantly more organicgrapes, and make more of their wines exclusively from organically grown grapes.Though the majority of MS wineries do not note that their wine is WOGG on theirlabels, MS wines generally earned higher retail prices, perhaps implying greater over-all grape quality. MS wineries report that their wines from organic grapes require dif-ferent distribution channels than other wines, but there is no apparent difference in

41
distribution channels employed by MS and LS wineries. Total wine production is domi-nated by a few wineries, but the vast majority of wineries are relatively small. Mostwineries obtain their water from private wells and dispose of their wastewater in sep-tic tanks. Neither MS nor LS wineries consistently reported realistic estimates for totalwater use or wastewater flow, implying that they may rely on outdated or erroneousestimates of parameters in their production processes.
Summary tables of Winery Survey results are included in Appendix D.
Consumer Survey Results
Eighty-four wine consumers participated in the survey. Non-numerical responses arereported as relative frequencies, but due to the relatively small number of consumersinterviewed, absolute counts of responses are included in Appendix D. To minimizesurvey duration and intrusiveness, simplified demographic information was collected.As shown in Table 5.9, the group of respondents had an approximately even sex ratio,and were fairly evenly divided between persons estimated to be over or under 40 yearsof age.
Table 5.9 Demographics of consumers surveyed.
Sex Male 46%Female 54%
Estimated age 39 or under 56%40 or over 43%
Table 5.10 Rate of wine purchase for consumers surveyed.
Bottles purchased Wine (in general) Organic wine*per month
Percent Frequency Percent Frequency1-2 per month 36% 30 7% 63-4 per month 31% 26 4% 35-9 per month 20% 1710-15 per month 11% 9More than 15 per month 1% 1Total 100% 84 11% 9
* Organic wine and wine from organically grown grapes, combined.
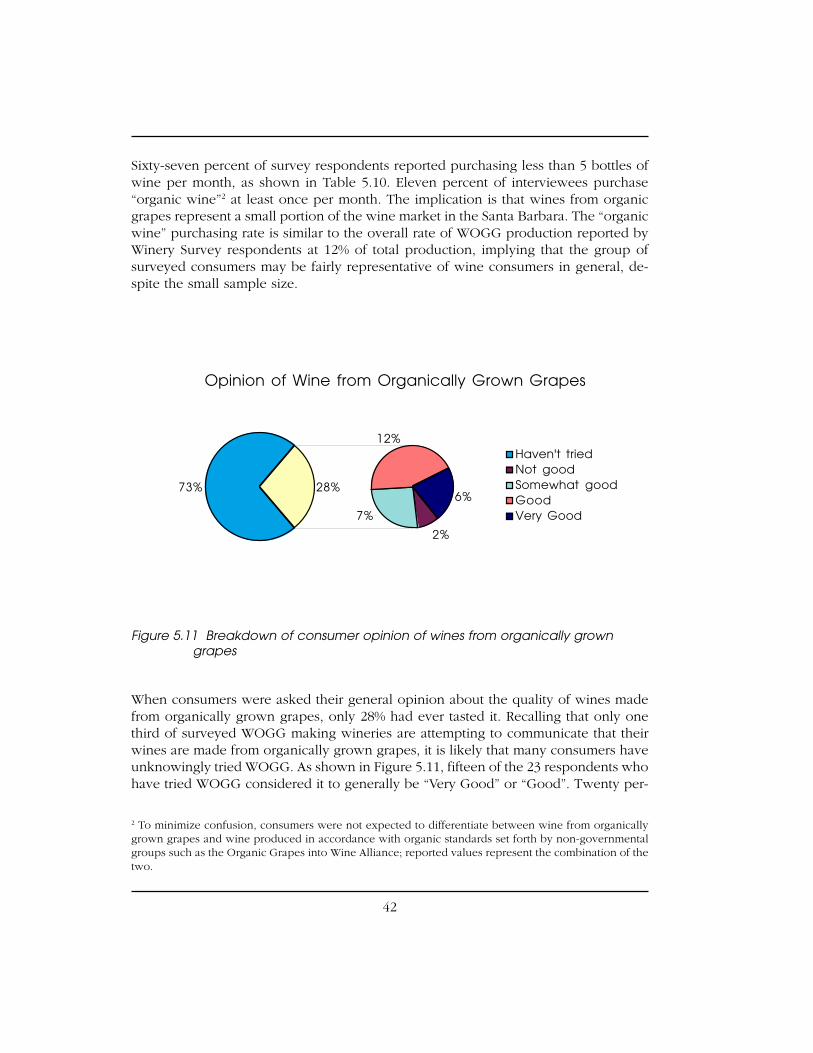
42
Sixty-seven percent of survey respondents reported purchasing less than 5 bottles ofwine per month, as shown in Table 5.10. Eleven percent of interviewees purchase“organic wine”2 at least once per month. The implication is that wines from organicgrapes represent a small portion of the wine market in the Santa Barbara. The “organicwine” purchasing rate is similar to the overall rate of WOGG production reported byWinery Survey respondents at 12% of total production, implying that the group ofsurveyed consumers may be fairly representative of wine consumers in general, de-spite the small sample size.
When consumers were asked their general opinion about the quality of wines madefrom organically grown grapes, only 28% had ever tasted it. Recalling that only onethird of surveyed WOGG making wineries are attempting to communicate that theirwines are made from organically grown grapes, it is likely that many consumers haveunknowingly tried WOGG. As shown in Figure 5.11, fifteen of the 23 respondents whohave tried WOGG considered it to generally be “Very Good” or “Good”. Twenty per-
2 To minimize confusion, consumers were not expected to differentiate between wine from organicallygrown grapes and wine produced in accordance with organic standards set forth by non-governmentalgroups such as the Organic Grapes into Wine Alliance; reported values represent the combination of thetwo.
Opinion of Wine from Organically Grown Grapes
73%
2%
12%
6%28%
7%
Haven't triedNot goodSomewhat goodGoodVery Good
Figure 5.11 Breakdown of consumer opinion of wines from organically growngrapes

43
cent of survey respondents had bought WOGG at least once solely because it wasmade from organic grapes. Sulfite-free wines yielded similar results (Not shown). Thesimilarity in the size of the groups of consumers who have tried WOGG and thosewho have bought it appears to imply that the organic label has significant potential asa selling point.
Consider: nearly one third of the consumers who have tried WOGG reported that theybuy at least one bottle of it per month. It appears that WOGG makers who decide notto advertise that their wines are “made from 100% organically grown grapes” may bemissing a chance to lock-in repeat customers. When asked to indicate the single mostimportant factor in their wine purchasing decisions, surveyed consumers indicatedsatisfaction in tasting prior to purchase by a clear majority, as shown in Table 5.11.Wine tasting rooms are not uncommon in the Santa Barbara area, allowing easy sam-pling of local wines. However, repeat purchases of a given vintage represent anotherway consumers can demonstrate their preference for wines they have previously en-joyed. Factors that give a winery an edge in getting its product to the consumer mayamount to a significant competitive advantage.
Though a minority of consumers surveyed did buy WOGG, the “environmental sensi-tivity” of wineries was not a particularly important consideration in wine purchases, asshown in Table 5.11. Additionally, only four consumers surveyed indicated label de-sign was a “Very Important” factor. The issue could be semantic; the label design is notnecessarily the same thing as label content. However, it is quite possible that the con-sumers who were interested in WOGG did not try it solely because of a perceptionthat it was environmentally benign; their interest may have sprung from the popularperception that organic products are in some way healthier.
Table 5.11 Importance of selected factors in wine purchase decisions.
Factors affecting purchase Very Somewhat NotImportant Important Important Important
Tasting before buying 42 26 4 11Grape variety 41 30 9 3More information 20 22 19 19Price 18 33 24 9Name brand 13 20 19 31Environmental sensitivity 11 13 13 46Wine critic ratings 5 14 21 43Label design 4 19 19 42

44
Consumer Survey results offer additional context for the distribution of retail wine pricesreported by Winery Survey respondents. A total of 69% of Consumer Survey respon-dents reported that they most frequently buy wines with retail prices less than $14 perbottle, as shown in Table 5.12. However, 84% of the wines produced by surveyed win-eries retail for $14 per bottle or more. The retailers who hosted the winery survey caterto upper-middle class wine and grocery customers, yet survey respondents typicallyreported that they most frequently drink moderately priced wines. Consumers surveyedmay not represent the market targeted by winemakers in California’s premium wineproducing counties.
Table 5.12 Retail price of wines purchased by surveyed consumers.
Price Percentage Respondents
0 – $7 per bottle 23% 19$8 – 13 per bottle 46% 38$14 – 20 per bottle 17% 14More than $20 per bottle 14% 12
In summary, the results of the Consumer Survey show that WOGG may be a small partof the Santa Barbara wine market, but the rate of WOGG purchase among surveyedconsumers is similar to the rate of WOGG production for surveyed wineries. Addition-ally, tasting was most frequently cited as the most important factor in wine buying,and the majority of wine consumers who have tried WOGG rated it favorably. Nearlyone third of the people surveyed who have tried WOGG buy it regularly, so WOGGproducers who do not label their wine as “wine from organically grown grapes” maybe failing to capitalize on an opportunity to expand their sales and lock-in repeat cus-tomers. However, the cohort of respondents was quite small, and the retail price ofwines bought by surveyed consumers does not overlap well with the price range atwhich winery survey respondents sell their wines. Survey results must therefore beviewed with caution.

45
6. Wine Grape Cultivation
Winegrape cultivation is an integrated process involving numerous inputs of land, la-bor and capital. The input of land, or conversion of property from either a pristinestate or traditional agriculture to vineyards and is an issue that has particular impor-tance in the Santa Barbara area. In recent years, both the pace and pattern of vineyardland use conversion has sparked an outpouring of public concern.
Material inputs and their impact to air, soil and water quality plays an important role inthe integrated impact evaluation. Generally, inputs to the winemaking process can beclassified as either pesticides, fertilizers or irrigation. While pesticide use has incitedthe greatest public concern, the use of water and fertilizers can play an important rolein healthy ecosystem processes. The use of pesticides, however, generates the largestsource of acrimony and legislation, ultimately spelling the difference between organicand traditional cultivation practices.
Finally, there is an examination of the spectrum of cultivation practices that are in-cluded in growing wine grapes. In general, the section will outline a comparison ofthe overall differences in traditional cultivation, organic farming and sustainable agri-cultural practices. As a viable alternative to the strict requirements of organic farmingan approach known as Integrated Pest Management will be explored and included inthe cultivation spectrum analysis.
Land use conversion
How Californians uses their land is an issue of growing significance. With statewidepopulation forecasted to grow to more than 58 million by the year 2040 (County Popu-lation Projections with Age, Sex and Race-Ethnic Detail-California, 2000), land alloca-tion will be increasingly important. Presently, along the Central Coast this issue is par-ticularly sensitive. The conversion of land from traditional agriculture uses, such ascattle grazing, to vineyards, is a topic that the community, regional leaders, and themedia have all recently investigated. In fact, Santa Barbara County Planning and De-velopment office is currently drafting regulations regarding vineyard land use conver-sion and its impacts on the environment. Throughout the state, and particularly on theCentral Coast, the acreage of winegrape cultivation has increased rapidly in the lastten years (Table 6.1). For example, in San Luis Obispo County vineyard acreage morethan doubled between 1988 and 1998.

46
Table 6.1 California Grape Acreage per County (total cultivated acreage). Counties withno acreage devoted to wine grape cultivation have been omitted (MKF, 2000).
County 1978 Acreage 1988 Acreage 1998 AcreageAlameda 1,916 1,795 1,605Amador 929 1,631 2,502Butte 547 139 122Calaveras 63 176 500Colusa 69 547 1,339Contra Costa 952 735 1,059El Dorado 190 496 1,011Fresno 37,007 35,175 45,529Glenn 685 1,258 1,433Humboldt - 4 10Kern 37,217 29,481 31,910King 1,135 1,238 2,418Lake 2,449 2,644 4,723Los Angeles - 1 32Madera 27,975 38,085 43,413Marin 13 11 94Mariposa - 42 61Menocino 9,984 11,829 14,263Merced 12,774 14,472 15,494Monterey 33,442 27,863 36,378Napa 24,460 32,165 37,486Nevada 60 180 187Orange 86 - -Placer 295 109 94Riverside 2,633 2,650 2,229Sacramento 3,168 3,385 13,177San Benito 4,582 1,591 3,262San Bernadino 8,140 1,642 1,126San Diego 223 108 91San Joaquin 35,214 34,661 57,430San Luis Obispo 4,551 7,280 14,846San Mateo 4 53 52Santa Barbara 5,836 9,289 11,800Santa Clara 1,729 1,088 1,245Santa Cruz 94 145 233Shasta 36 36 36Solano 1,307 1,221 2,096Sonoma 26,581 31,555 43,314Stanislaus 20,489 15,117 14,217Sutter 362 - 80Tehama 269 142 130Trinity - 5 44Tulare 18,261 11,999 13,255Ventura 21 1 10Yolo 688 1,658 6,635Yuba 697 352 312Total Acreage 327,133 324,054 427,283Percent Change -1% 31%

47
On the Central Coast, most land suitable for vineyards has historically been Valley Oakhabitat. The Valley Oak Restoration Suitability Assessment study performed by a pre-vious group project at the Bren School suggested that the extent of the California’s oakwoodlands has decreased in both viability and area. (Oaks Group Project, 1999). Spe-cifically, they indicate that the State’s original 10-12 million acres of oak woodland hastoday been reduced to less than 7 million acres. The Oaks project indicates that thisdecline continues a pattern that began with the arrival of immigrants. Moreover, theOaks Project suggests that land use decisions such as agricultural conversion and everexpanding suburban development are directly responsible for the continued degrada-tion of the Valley Oak Habitat. The group pointed out that here in Santa Barbara theconversion of oak woodland to commercial vineyards creates additional urgency forquantitative resource inventories and effective mitigation of losses.
Compounding the already dramatic effect of land-use conversion, new vineyards areincreasingly being constructed on steeper slopes and further up the watershed. In Sep-tember 1999, the University of California Davis released the Sonoma County GIS De-velopment Model. Among other things, the model attempted to quantify the spatialextent of vineyard expansion. The figures and graphics that we will present in thischapter indicate that vineyards constructed during the 1990’s in Sonoma County werebuilt both topographically higher and on steeper slopes than vineyards constructedprior to 1990.
In general, soil can be eroded by wind or water. In California, water erosion plays amore important role in net soil loss. The rate of sediment transport in sheetwash de-pends on the discharge per unit width to the power of roughly 2 and the slope to thepower of between 1.2 and 1.9 (Dunne, 2000). Consequently, as slope increases,sheetwash sediment transport can be expected to rise to a power of something be-tween 1.2 and 1.9 depending on surface soil conditions.
Table 6.2 Comparison of pre-1990 and post-1990 vineyard development inSonoma County.
Vineyard Factor Pre–1990 Post–1990Slopes steeper than 10% 6% 25%Above 100 m in elevation 18% 42%
Source: Merenlender, 1999
Data from the California Winemaking Impact Assessment (CWIA) Vineyard Survey wereanalyzed and compared to vineyards established before and after 1990. The followingdiscussion summarizes the results of the Pre / Post 1990 Vineyard Survey analysis.

48
Differences Between New and Old Vineyards
Results from the Vineyard survey suggested that vineyards entering production in the1990’s differ from older vineyards in several ways. Specifically, the Vineyard Surveysuggested that Older Vineyards (pre–1990) are more likely to be certified as organicby the California Foods Act.
Table 6.3 Comparison of vineyards that are either certified or not certified by theCalifornia Foods Act.
Vineyard Factor Pre–1990 Post–1990Certified 36% 8%Not certified 64% 92%
Approximate significance, 0.046. Source: CWIA Vineyard Survey
Several possible explanations exist. The certification process could be sufficiently timeconsuming as to limit certification to pre-1990 vineyards. Further, it is plausible, thatolder vineyards, less concerned with recent financing costs, could risk additional capi-tal for the certification process. Finally, the limited sample of recent vineyards couldhave altered the results.
An additional statistically significant difference suggests that pre-1990 vineyards gen-erally produced more grapes than vineyards entering production in the 1990’s. Basedon the Survey, pre-1990 vineyards produced, on average, slightly less than 400 tons ofgrapes in 1999, while vineyards established in the 1990’s produced an average of 54tons of grapes in 1999. While it is possible that the smaller sample size of post-1990vineyards (Post-1990 vineyards, N=10; Pre-1990 vineyards, N=65) could explain someof the variation, it is also plausible that recently developed vineyards have not yetreached maximum capacity. Alternatively, it is possible that newer vineyards are beingdeveloped in less prime grape production regions. In fact, a study at the University ofCalifornia Davis, as seen in Table 6.2 also observed that vineyards in Sonoma Countydeveloped after 1990 were located on steeper slopes and higher elevation than oldervineyards (Merenlender, 1999). Theoretically, it could be proposed that vineyards onsteeper slopes are declining in yield because they are occupying increasingly marginalregions.
While it is compelling to propose that newer vineyards are occupying more marginalland, the results from the CWIA Vineyard Survey nor UC Davis studies conclusivelyprove this. Evidence would have to be compiled that examined yield per acre basedon vineyard age class and topography.

49
Further Results
The following results were not statistically significant (P values were less then 0.05);however, the data do suggest several possible trends.
1. New vineyards may be more likely to grow winter cover crops to prevent erosioncontrol
Table 6.4 Percentage of vineyards that use cover crops to prevent erosion.
Vineyard Factor Pre–1990 Post–1990Use cover crops 82% 92%Do not use cover crops 18% 8%
Approximate significance, 0.367. Source: CWIA Vineyard Survey.
It is possible that recent water quality standard requirements implemented by the Stateand the individual counties could influence recently established vineyards, encourag-ing them to utilize cover crops. Alternatively it is possible, as the UC Davis study byMerelender suggests, that new vineyards built on steeper slopes require greater ero-sion control efforts.
2. Older vineyards may be more likely to be third party organic certified.
Table 6.5 Percentage of vineyards that are certified organic by non-governmentalorganizations.
Vineyard Factor Pre–1990 Post–1990Third party organic certified 55% 25%Not certified 45% 75%
Approximate significance, 0. 262. Source: CWIA Vineyard Survey.
The results could be attributed to the time and effort required for certification or asimply a difference in vineyard managing policies.
Existing Regulations Regarding Vineyard Expansion
The Press Democrat, an online newspaper from Santa Rosa, California, has recentlypublished several articles regarding land use conversion. In the autumn of 1999 thePress Democrat published a four part series that examined the environmental and so-cioeconomic aspects of vineyard growth. The study included a summary of currentgovernment vineyard regulations, a survey of public perception about vineyards, andother pertinent data about vineyard practices (Press Democrat, 1999). The followingare a few highlights from these articles on how different counties are trying to mini-mize environmental impacts of vineyards.

50
Sonoma County
• Vineyards prohibited on slopes greater than 50 percent.
• Erosion control plans required for slopes greater than 10 percent.
• All new vineyards must be registered with agricultural commissioner.
• No vines within 50 feet of streams.
Napa County
• Vineyards prohibited on slopes greater than 50 percent.
• Erosion control plans required for slopes greater than 5 percent.
• Planning Department has regulatory oversight.
• Well drilling regulated in some water-scarce areas.
Santa Barbara County (proposed)
• Growers must submit plans before removing oaks.
• Full-scale environmental analysis for large projects.
Source: The Press Democrat “Spreading Vines - A Changing Landscape,” (10/99).
Public Opinions of Vineyards and Vineyard Expansion
The Press Democrat conducted a survey of general community opinions regarding thewine industry. The poll was conducted by Richard Hertz Consulting among 700 regis-tered voters Sept. 7-16, 1999.
In general, the survey focused on Sonoma County resident’s opinion of the benefitsand costs of the wine industry. Overall the respondents suggested they had a positiveopinion of the wine industry, with some concern for the environmental impacts. Forexample, people indicated that wine industry was, good for the economy (18.7%),created jobs (18.2%), and brought tourists to the region (17.5%). Future land conver-sion, however, was a source of concern. When asked about the amount of land inSonoma County currently in grape production 54% indicated they felt the amount ofland was ‘just right’ while 35% suggested it was ‘too much’. On the other had, 54%indicated that they felt that there could be too much land planted with grapes in thefuture, while 42% did not think that would be a problem. This suggests possible con-cern about the rate and sheer quantity of land in winegrape production in the threecounties examined in this report.

51
The plans and policies governing how we use our land shape the future of California.Today, issues of urban sprawl and vineyard expansion rank high among resident con-cerns along the Central Coast. The above examination of vineyards suggest that, tosome degree, these concerns could be warranted. In Sonoma County, new vineyardsare built on steeper slopes than older vineyards. Also, throughout California newervineyards are less likely to be certified organic. These facts do not suggest a trend towardmore sustainable agriculture practices. The rate of vineyard expansion, however, hastriggered civic concern, and today, local leaders seem to be attempting to address theseissues through law. Sonoma, Napa, and Santa Barbara County regulations seek to mini-mize new vineyard development on steep slopes.
Increased public scrutiny and progressive development regulations could lead to a sus-tainable future for wine production. The results, however, would be contingent uponreceptive involvement from business leaders. Should wine-growing regions continueto use unsustainable agricultural practices and expand at the present rampant rate, theindustry is certain to face severe public reprisal.
Material Inputs
When considering synthetic inputs that are often applied during the winegrape culti-vation process, three factors deserve attention: pesticides, fertilizers and irrigation. Thissection of the report discusses the need for these inputs and highlights the differencesbetween traditional methods of cultivation and organically grown grapes. The infor-mation for this section is derived from an extensive source review of government agen-cies as well as the results of the CWIA industry survey. The most significant differencebetween organic and traditional grape cultivation is the application of pesticides; thisaspect is addressed first. Following this discussion is an analysis of the differences infertilizer application and irrigation practices.
Pesticides
To fully appreciate the difference between traditionally cultivated grapes and grapesgrown using other methods, the magnitude of pesticide use needs to be examined.This requires an understanding of the impacts on the environment of agricultural pes-ticides. The following is a brief overview of pesticide toxicity, categories and potentialeffects. The specific pesticides that are most commonly used on wine grapes are iden-tified, and the most abundant or harmful chemicals are described. Finally, the environ-mental impacts these pesticides have on the environment are investigated.
Pesticides can have a range of adverse effects. Some of these effects are immediate;for example, contact with a particular chemical can result in immediate death. Othereffects are more subtle; damage can occur from long term exposure to small doses of

52
a chemical. Therefore pesticides are classified in terms of the severity and type of ad-verse effect that it has on a particular species. The following terminology is used todescribe the effects:
Acute toxicity refers to the short-term exposure to a chemical. The LD50, or dose ofthe pesticide that is lethal to 50% of a set of test organisms, is most often used to quan-tify toxicity.
Chronic toxicity results from long-term or repeated exposure to a chemical. This typeof poisoning is of particular concern for pesticides that are applied frequently or breakdown very slowly in the environment.
Endocrine disruption refers to the hormone-altering effects of certain chemical sub-stances on animal endocrine systems that impair reproduction or development. Endo-crine-disrupting chemicals alter the messages sent through hormones, impair repro-duction and can increase susceptibility to cancer in adult animals. Many commonlyused pesticides are suspected endocrine disrupters (Kegley et al., 1999).
The term “pesticide” is used as a general term to represent any chemical substanceused to control pests. The major classes of pesticides include: insecticides, used to killinsects; herbicides, used to kill plants; and fungicides, used to prevent molds andmildews. The properties of these major classes of pesticides are discussed briefly.
One of the most potentially harmful class of pesticides are the chemicals used to de-stroy insects. Insecticides constitute nearly 25% of the total reported pesticide use inCalifornia (Pesticide Use Report, 1998). There are three major categories of insecti-cides that have detrimental effects in the environment: organochlorines, organophos-phates and carbamates, and synthetic pyrethoids.
Organochlorine (OC) pesticides such as DDT, dieldrin, chlordane, and others werewidely used in the 1960s and 1970s. They were not only highly toxic, but they wereespecially slow to break down chemically and therefore had significant chronic ef-fects. These insecticides work by acting as contact and stomach poisons to insects.Although most of the more persistent OC pesticides were banned from use in the U.S.in the 1970s, the effects of these substances are still being experienced today (Kegleyet al., 1999).
In response to the outlawing of many organochlorine pesticides, the agrochemical in-dustry turned to the less persistent, but more acutely toxic organophosphate (OP) andcarbamate compounds to control insects. OPs are very similar to the chemical warfareagents originally produced during World War II (Kegley et al., 1999). They work byinterfering with the nervous system of insects, as well as mammals, birds, and fish.Organophosphates and carbamates block production of an enzyme called cholinest-erase (ChE), which ensures that the chemical signal that causes a nerve impulse is halted
53
at the appropriate time. Birds and mammals that have been poisoned by these pesti-cides respond with uncontrolled nerve impulses. The OPs and carbamates are amongthe most acutely toxic pesticides, with most formulations classified by the U.S. Envi-ronmental Protection Agency as toxicity class I (highly toxic) or II (moderately toxic).A common organophosphate insecticide is the widely used product Diazinon.
Pyrethins are a type of pesticide that can be naturally occurring in chrysanthemumflowers. Synthetic pyrethins, called pyrethroids, mimic the effects of this compound.They are very similar to organochlorine insecticides in their effects on insects. Whilethese compounds may have only moderate acute toxicity to mammals and birds, theycan decimate populations of beneficial insects and aquatic organisms (Kegley et al.,1999).
Another important class of pesticides are chemicals that are used to destroy unwantedplants, or “weeds.” These chemicals are collectively known as herbicides. There areseveral major types of herbicides used in California. Glyphosate, the active ingredientin Monsanto’s Roundup®, is unique in its structure and mode of action. As it is ap-plied to the leaves of emergent plants, glyphosate inhibits an enzyme essential for plantsurvival, causing the death of the plant (Kegley et al., 1999). Glyphosate has the high-est reported use of any herbicide in California.
Other classes of herbicides include triazines and acetanilides. Some of these herbi-cides work by inhibiting photosynthesis in the plant, others by inhibiting protein syn-thesis and therefore affect plant growth. While not as acutely toxic to animals as theinsecticides, the primary environmental impact of widespread herbicide use is thedestruction of habitat for beneficial insects, birds and aquatic life.
The last group of pesticides, fungicides, are those used to control molds and mildewson crops and in the soil. Fungicides of particular concern for the environment includecopper salts and synthetic compounds with high toxicity to some species. Many fun-gicides are highly toxic to aquatic life, including copper salts, ziram, maneb,chlorothanlonil, captan and mancozeb (Kegley et al., 1999). There is very little data onthe effects of fungicides; the extent of their potential effects is not fully known.
Pesticides Used on Wine Grapes
All pesticides that are used in agriculture in California must be reported to the StateEnvironmental Protection Agency, Department of Pesticide Regulation.
Under full use reporting, which began in 1990, California became the first state to re-quire reporting of agricultural pesticide use, including amounts applied and types ofcrops or places treated (Pesticide Use Report, 1998).

54
Table 6.7 Toxicity ratings for top ten pesticides in California in 1998 (EPA, 2000).
Chemical Toxicity Category LD50 Primary Use
1. Sulfur 4 >5000mg/kg Fungicide2. Cryolite 3 2100mg/kg Insecticide3. Sodium Tetrathiocarbonate* N/A N/A Nematicide4. Methyl Bromide 1 214mg/kg Nematicide5. Glyphosate 2 5600mg/kg Herbicide6. Copper Hydroxide* N/A N/A Fungicide7. Oryzalin 4 >5000mg/kg Herbicide8. 1,3-Dichloropropene* 2 N/A Nematicide9. Simazine 4 >5000mg/kg Herbicide10. Mancozeb 4 >5000mg/kg Fungicide
* Currently under review by the EPA.
Table 6.6 Top ten pesticides used on wine grapes in California in 1998 (PesticideUse Report, 1998). The total amount includes all pesticides used on wine grapes inthat year.
Pounds Lb/Acre 1. Sulfur 29,781,899 69.7 2. Cryolite 579,667 1.36 3. Sodium Tetrathiocarbonate 546,592 1.28 4. Methyl Bromide 477,976 1.12 5. Glyphosate 355,070 0.83 6. Copper Hydroxide 253,658 0.59 7. Oryzalin 156,535 0.37 8. 1,3-Dichloropropene 149,359 0.35 9. Simazine 133,356 0.3110. Mancozeb 120,196 0.28Total 34,436,026 80.6
According to the 1998 Annual Pesticide Use Report, there were over 34 million poundsof pesticides applied to wine grapes, using 298 different chemicals. These chemicalsinclude insecticides, herbicides and fungicides. By far the most abundant of these chemi-cals is sulfur, which accounts for 86.5% of the total (by weight). Table 6.6 contains theten most abundant pesticides used on wine grapes in the state of California. However,not all pesticides are applied in all vineyards. Data is presented in terms of total poundsapplied and total pounds applied per acre of wine grape cultivated (source for acre-age data is Table 6.1).
Although pesticide loading (pounds/acre) is an important consideration, a pesticide’stoxicity must also be examined; small loading of highly toxic chemicals can have greaterdetrimental effects than large loading of a mostly benign product. Table 6.7 contains

55
toxicity information for the most abundant pesticides. The source for this informationcomes from the U.S. Environmental Protection Agency’s Pesticide Fact Sheets (EPA,2000).The EPA Toxicity Category is given, which ranges from I (highly toxic) to IV (leasttoxic). The toxicity rating is quantified using the LD50 value for rats and mice. Alsoincluded is the use for which the chemical is generally applied to wine grapes. Themajority of pesticides used on wine grapes are considered benign by human standards,although the highly toxic methyl bromide is still widely employed as a fumigant. Inaddition, there are other chemicals that did not appear on the top ten list in terms ofabundance, which are even more toxic than methyl bromide. For example, the chemi-cal fenamiphos, of which “only” 35,000 pounds were applied in 1998, is extremelytoxic. Fenamiphos has an EPA Toxicity Class I, and an LD50 range of 2 to 19 mg/kg!
The data in Table 6.8 contains the pesticides most used on wine grapes in Sonoma,Napa and Santa Barbara Counties in 1998. Not surprisingly, sulfur is at the top of thelist, representing over 80% of all chemicals used in each county. Other chemicals thatare commonly used in these counties include methyl bromide and glyphosate. It is
Table 6.8 Top five pesticides used in Sonoma, Napa and Santa Barbara in 1998(PUR, 1998).
Sonoma Pounds Lb/Acre1. Sulfur 3,031,285 70.02. Methyl bromide 193,667 4.473. Mancozeb 41,019 0.954. Glyphosate, isopoylamine salt 36,686 0.855. Copper hydroxide 24,038 0.55All other 186,227 4.30Total 3,512,922 81.10
Napa Pounds Lb/Acre1. Sulfur 2,361,987 63.02. Glyphosate, iso. salt 57,814 1.543. Methyl bromide 19,702 0.534. Mancozeb 14,714 0.395. Simazine 12,719 0.34All other 113,406 3.03Total 2,580,341 68.83
Santa Barbara Pounds Lb/Acre1. Sulfur 910,776 77.22. Sodium Tetrathiocarbonate 44,878 3.803. Glyphosate 19,176 1.634. Copper Oxychloride Sulfate 17,092 1.455. Methyl Bromide 12,283 1.04All other 107,884 9.14Total 1,112,090 94.24

56
interesting to note that the second most abundantly used pesticide in California, theinsecticide cryolite, does not appear to be used very widely in these counties. SonomaCounty has by far the most concentrated use of methyl bromide, with a value of 4.47pounds per acre.
A brief description of some of the most abundant or harmful chemicals used onwinegrapes follows. All information is from the Extension Toxicology Network’s Pes-ticide Information Profiles (PIP, 2000) unless otherwise noted.
Sulfur is a naturally occurring element widely used as a fungicide in both conven-tional and organic farming. It is most often used to control brown rot on grapes andother fruits. Sulfur controls powdery mildew on wine, raisin and table grapes (Kidd etal., 1991). Sulfur is a general use pesticide; it has been placed in Toxicity Category IV,the least toxic category. Sulfur has been known and used as a pesticide for many yearsand has been registered for pesticidal use since the 1920s. Currently, sulfur is regis-tered in the U.S. by EPA for use as an insecticide, fungicide and rodenticide. It is ap-plied in dust, granular or liquid form, and is an active ingredient in nearly 300 regis-tered pesticide products.
Toxicity. Sulfur is known to be of low acute toxicity, and poses very little if any risk tohuman and animal health. Short-term studies show that sulfur is of very low acute oraltoxicity and does not irritate the skin (EPA, 1991). However, some studies have shownthat it can act as a skin and eye irritant (EPA, 1991). Acute exposure inhalation of largeamounts of sulfur dust may cause atarrhal inflammation of the nasal mucosa whichmay lead to hyperplasia with abundant nasal secretions (Meister, 1994). Chronic expo-sure to elemental sulfur at low levels is generally regarded as safe. There are no knownrisks of reproductive, teragenic, mutagenic or carcinogenic hazards.
Environmental Fate. Sulfur is a component of the environment, and there is a naturalcycle of biotic and abiotic oxidation and reduction reactions which transforms sulfurinto both organic and inorganic products. The half-life of elemental sulfur depends onsoil and meteorological conditions.
The California Winemaking Impact Assessment (CWIA) Vineyard survey conducted inthe fall of 1999, asked managers to report their approximate use of elemental sulfur.The three ranges were less than 10 pounds per acre, 10-100 pounds per acre, and morethan 100 pounds per acre. It is interesting to compare the results from the CWIA sur-vey to the amount of sulfur that was reported to the California Department of PesticideRegulation(DPR). Figure 6.1 displays the range of surveyed use of sulfur on vineyardscompared to the amount of sulfur that was reported by each county in California in1998. The results were similar, although the DPR results show that there is a greateroccurrence of application of over 100 pounds of sulfur applied per acre than was re-ported in the survey. Also, more survey respondents claimed to have applied less than

57
Figure 6.1 Pounds of Sulfur applied per acre. Vineyard data comes from CWIAVineyard Survey, 2000. County data comes from 1998 Pesticide UseReport (DPR). Percentage of vineyards reported, 75%. Percentage ofcounties reported, 84%.
Sulfur Applied per Acre
0%
10%
20%
30%
40%
50%
60%
70%
>100 lbs 10-100 lbs <10 lbs
Counties
Vineyards
10 pounds per acre than was reported to the DPR. One aspect to keep in mind, how-ever, is that surveyed respondents originated for the most part in Sonoma, Napa andSanta Barbara counties, whereas the DPR data encompasses the entire state of Califor-nia.
Methyl bromide is chiefly used as a soil and structural fumigant against insects, ter-mites, rodents, weeds, nematodes, and soil-borne diseases. About 70% of methyl bro-mide produced in the U.S. goes into pesticidal formulations (PIP, 2000). The chemicalis a colorless, odorless gas at room temperature. Methyl bromide is a Restricted UsePesticide (RUP); it may be purchased and used only by certified applicators.
Grape growers routinely fumigate soil with methyl bromide before planting to improveplant growth in the early years. Soil fumigation with methyl bromide at replanting com-monly returns the cost of the treatment, usually with 10 to 50 percent greater initialplant growth, leading to larger, more productive plants when they begin to bear threeto seven years after planting (Wilhoit et al., 1998).

58
Methyl bromide has the potential for depleting stratospheric ozone. It has been esti-mated that Methyl bromide is responsible for 5-10% of worldwide stratospheric ozonedepletion (Ross, Zev and J. Kaplan, 1998).
Toxicity. Methyl bromide is a highly toxic compound; it is classified in EPA ToxicityClass I (most toxic). The most significant route of exposure is inhalation. Inhalation of6 mg/L for 10 to 20 hours, or 30 mg/L for 1.5 hours is lethal to humans. Methyl bro-mide can be highly irritating to the mucous membranes of the eyes, airways, and skinwith contact. Chronic exposure to methyl bromide can cause extensive damage toneurons in involved in cognitive processes and physical coordination or muscularcontrol. There are no known reproductive or teratogenic hazards. Methyl bromide isconsidered to be weakly mutagenic. Data on carcinogenic effects are inconclusive(Wauchope et al., 1992).
Environmental Fate. Methyl bromide quickly evaporates at temperatures ordinarily en-countered in fumigating, some product may be trapped in soil micropores followingapplication. Methyl bromide is moderately persistent in the environment, it has a fieldhalf-life of about 55 days (Wauchope et al., 1992).
Under new federal regulations, methyl bromide will be phased out of use by 2005(Santa Rosa Press Democrat, 1999). The University of California Sustainable Agricul-ture Research and Education Program (SAREP) is sponsoring several new studies thatare researching the use of alternatives to methyl bromide (SAREP, 1999). One of thesestudies, a three year study titled “Development of Grape Rootstocks with MultipleNematode Resistance,” is specifically targeted for California grape growers. This re-search will accelerate the development of grape rootstocks with resistance to a broadrange of nematode species (SAREP, 1999).
Simazine is a selective triazine herbicide. It is used to control broad-leaved weedsand annual grasses in field, berry fruit, nuts, orchards and vineyards. Simizine is avail-able in wettable powder, water dispersible granule, liquid and granular formulations.It is a General Use Pesticide (PIP, 2000).
Plants absorb simazine mainly through the roots, with little or no foliar penetration.From the roots, it is translocated upward to the stems, leaves and growing shoots ofthe plant. It acts to inhibit photosynthesis (Kidd et al,, 1991).
Toxicity. Simazine is slightly to practically non-toxic. It is in EPA toxicity class IV. Thereported LD50 in rats and mice is >5000 mg/kg. Tests on humans have shown thatsimazine is not a skin irritant, fatiguing agent or sensitizer. However, rashes and der-matitis from occupational exposure to simazine have occurred. There are no knownreproductive, teratogenic or mutagenic hazards. Carcinogenic effects are undetermined(Kidd et al,, 1991).

59
Environmental Fate. Simazine is moderately persistent with an average field half-lifeof 60 days. It has low water solubility and loss from volatilization is insignificant. Si-mazine is moderately to poorly bound to soils.
Mancozeb is used to protect many crops against fungal diseases. It is of the chemicalclass dithiocarbamate and is in the EPA toxicity class IV. It is registered as a general usepesticide. Mancozeb is available as dusts, liquids, water dispersible granules, and aswettable powders. It is commonly found in combination with zineb and maneb (PIP,2000).
Toxicity. Mancozeb is practically non-toxic to mammals. It is a mild skin irritant andsensitizer, and a mild to moderate eye irritant. A major toxicological concern in situa-tions of chronic exposure is the generation of ethylenethiorea (ETU) in the course ofmancozeb metabolism, which can affect thyroid function. Reproductive effects in hu-mans are unlikely. Teratogenicity and carcinogenic effects are unknown. Data regard-ing the mutagenicity are inconclusive (Edwards et al., 1991).
Mancozeb is highly toxic to birds, and moderately to highly toxic to fish and aquaticorganisms. It is not poisonous to plants.
Environmental fate. Mancozeb degrades to ETU within 1 to 7 days. It is practicallyinsoluble in water. Studies indicate that ETU has the potential to be mobile in soils(Edwards et al., 1991).
The chemicals that vineyards use to control pests have been identified, and the fol-lowing section examines the potential impacts that these chemicals may have on air,water and soil quality. Once a pesticide is released into the environment, it can betransported to different environmental media through various processes. Droplets ofpesticide sprays and small particles from pesticide dusts rarely stay within the confinesof the field on which they are applied. There is always potential for contamination ofair, water and soil.
Air quality
Ambient air quality can be affected by pesticide use in different ways. The amount ofdamage to the atmosphere can depend on the type of chemical used as well as themethod of application. For example, methyl bromide is used to fumigate the soil be-fore vineyards are planted, usually under highly controlled conditions. Exposure islimited to the amount of volatilized methyl bromide that may leak to the atmosphereat the time of application. Alternatively, the widely used sulfur is usually applied as apowder, and although it is a benign product, it may affect air quality by increasingparticulate matter into the air. Workers that directly handle the vines are usually di-rectly exposed to the sulfur, and may be experience minor dermatitis and bronchialirritation.

60
Pesticides can become airborne in several ways; on droplets of water, as volatilizedvapors, adhered to dust particles or some combination of the three. Once airborne,these toxic chemicals can travel great distances. Many pesticides commonly used inCalifornia have been detected far from the site of application, some as far as 25 to 50miles, and at high elevations in the Sierra Nevada Mountains (Zabik and Seiber, 1993).
Often, the majority of the applied pesticides do not even reach the target pest. A re-cent review of studies on spray drift from aerial and ground applications indicates thatan average of 50% of the applied pesticide typically does not hit the target applicationsite, and as much as 80% drifts away from the site (Stein and White, 1993).
Spray drift is not the only source of pollutant release into the air; contamination cancontinue to occur even after the chemical has been applied. Many pesticides evapo-rate readily, particularly at warmer temperatures. In some cases as much as 90% of apesticide can volatilize from soil surfaces or plants within days of an application (Huskesand Levson, 1997).
California passed the Toxic Air Contaminant Act in 1983, which created the frameworkfor the evaluation and control of chemicals as toxic air contaminants (TACs). The stat-ute defines TACs as air pollutants that “may cause or contribute to increases in seriousillness or death, or that may pose a present or potential hazard to human health.” Thesebills require that the California Department of Pesticide Regulation (DPR) and Califor-nia Air Resources Board (ARB) work together towards the evaluation and control ofpollutants in the air. In general, the law requires DPR to follow a process to list a pes-ticide as a TAC. First, DPR must rank each chemical for its potential to contaminate theair and its risk to human health. DPR is then required to create a public health effectsreport for each high priority pesticide based on extensive air monitoring and literaturereview. Based on the results of the evaluation of this report, DPR determines whetherthe candidate pesticide is a TAC. Finally, the agency is required to officially list andstringently regulate those pesticides found to pose significant risk.
The success of this program has been limited. A critical aspect of the program requiresair monitoring to determine the extent of a pesticide’s presence in the atmosphere.However, only 16 of California’s 58 counties have ever been monitored as part of theTAC program (Ross and Kaplan, 1998).
The overall hazard that the wine grape industry poses for the entire state of Californiacan be demonstrated by inspecting which wine grape pesticides are also included inthe DPR’s list of Toxic Air Contaminants. The list, seen in Table 6.9, was created bycross-checking the pesticides that are listed as being used on wine grapes from thePesticide Use Report (1998) with the substances identified as Toxic Air Contaminants

61
by the Air Resources Board from 1996. The list of TACs was reviewed again in 1998-1999, but the final results have not yet been released. There are a total of nine chemi-cals that are listed as known air contaminants.
Table 6.9 List of pesticides designated as California Toxic Air Contaminants.
CaptanCarbarylChlorine1,3-Dichloropropene (trade name Telone)MancozebMethoxychlorMethyl bromideTrifluralinXylene
Three of these pesticides, 1,3-dichloropropene (1,3-D), mancozeb, and methyl bro-mide, are listed in the top ten most abundantly used pesticides on wine grapes (Table6.4). Methyl bromide ranked fourth, 1,3-D was eighth and mancozeb was tenth. Asmethyl bromide is phased out, the use of 1,3-D is expected to increase as it is oftenused as an alternative for controlling nematodes. Methyl bromide and mancozeb arealso listed in the most abundant pesticides used in Sonoma, Napa and Santa Barbaracounties (Table 6.8). In addition, one of the breakdown products of the herbicideglyphosate is formaldehyde, which is a highly toxic air contaminant (Lund, 1986). Clearly,the cultivation of wine grapes can have a significant impact on local ambient air qual-ity.
Soil and Water Quality
Pesticides may contaminate water by leaching through the soil profile or by runningoff the field surface into nearby water bodies. Many of the same factors affect leachingand runoff potential, and some areas have high potential for both pathways. But dis-tinctions are also apparent. In rainy months, storms wash pesticides off fields and intonearby surface waters. The amount of pesticides that washes into the receiving waterdepends on a number of factors, including the amount and identity of pesticide ap-plied, water solubility of the pesticide, and type of soil and vegetation present in theapplication area. While some pesticides bind tightly to soils and are transported onlyvia sediments, others dissolve readily in water and travel with the overland flow intostreams, agricultural drains and rivers (Kegley et al., 1999). Of the pesticides used onwine grapes, the chemicals that have a high potential for contaminating water qualityare simazine, oryzalin, oxyfluorfen, demethoate, benomyl and glyphosate (CAT Re-port, 1998). Damage to soil quality can result from repeated applications of soil fumi-gants such as methyl bromide that can destroy many beneficial organisms as well asharmful ones.

62
How does wine grape cultivation compare to other agricultural products in its use ofpesticides? This is an important question to ask as it puts the impact of wine grapes inperspective to other commodities. Table 6.10 (following page) lists fourteen importantagricultural commodities to California. Wine grapes, as well as table grapes, are com-pared to other products in harvested acreage, pounds of pesticides applied in totalamounts and as pounds per acre. Amounts of pesticides are given with and withoutsulfur included. As can be seen in Table 6.10, even when sulfur is included, wine grapesare not ranked as high as some other products, notably strawberries, carrots and or-anges in terms of their environmental impact. Strawberries use by far more pesticidesper acre than any other product.
In summary, pesticides have a significant impact on air, water and soil quality. Winegrapes used over 34 million pounds of pesticides in 1998. Sulfur is the most used chemi-cal, comprising 86% of the total. Sulfur is used a fungicide and is generally consideredan environmentally benign product. Smaller percentages of highly toxic chemicals, in-cluding methyl bromide, are still widely used in the industry. These toxic chemicalshave the most severe health and environmental impacts. Although the pesticides usedin the wine industry pose a serious risk to the environment, other agricultural com-modities, such as strawberries, use considerably more pesticides per acre and maypresent a greater overall hazard.
Table 6.10 Pesticide use and acreage of major agricultural commodities inCalifornia in 1998. Source data for acreage originates from the County AgriculturalCommissioner and pesticide data is from the DPR.
Total Total Per Sulfur PerAcres Pesticides Acre Not included Acre
1. Strawberries 23,158 7,234,565 312.4 6,973,234 301.1 2. Carrots 34,343 7,690,466 223.9 7,368,748 214.6 3. Lemons 50,466 3,997,388 79.2 3,776,306 74.8 4. Oranges 202,315 10,226,523 50.5 10,134,808 50.0 5. Almonds 477,567 16,045,079 33.6 15,606,432 32.7 6. Tomatoes 41,610 1,627,096 39.1 939,821 22.6 7. Walnuts 207,126 3,915,289 18.9 3,909,249 18.9 8. Lettuce(head) 130,329 1,937,169 14.9 1,929,793 14.8 9. Table Grapes 278,490 35,011,973 70.5 6,053,096 12.210. Cotton Lint 837,269 9,537,317 11.4 9,360,171 11.211. Wine Grapes 427,283 34,436,026 80.6 4,654,127 10.912. Rice 505,609 4,979,981 9.8 4,979,632 9.813. Garlic 37,412 472,423 12.6 256,891 6.914. Broccoli 117,219 767,728 6.5 767,032 6.5

63
Fertilizer
The two primary areas of fertilizer environmental impact are water quality and energyuse. Fertilizers are commonly used in agriculture to promote plant growth by provid-ing nutrients that may be of limited availability in the soil. Nitrogen, phosphorous andpotassium are the main nutrients applied. These nutrients can be supplemented in thesoil by the addition of organic fertilizers, such as compost and pomace from wine pro-duction, or in the more concentrated form of synthetic fertilizers.
In conventional viticulture, synthetic fertilizers are commonly applied through irriga-tion systems to supplement soil nitrogen, phosphorous, and potassium (Mayse andStriegler, 1997). As noted in chapters 2 and 5, one of the primary distinctions betweenconventional viticulture and organic methods is synthetic fertilizer application. Winegrapes, unlike many other perennial crops, do not require large amounts of nutrientinputs. In fact, over-fertilization can lead to excessive vine productivity, ultimately re-ducing wine grape quality. It is for this reason that many vineyards grow vines undernutrient and water deficit conditions. However, Vineyard Survey results in Chapter 5clearly indicated that many vineyards, both traditional and organic, apply significantquantities of fertilizer to enhance soil conditions.
Applied inappropriately or in excessive amounts, these otherwise beneficial materialscan threaten nearby water resources. The potential for these and other chemicals tomove from land to water is governed by a variety of factors, such as soil type, climate,and tillage practices. Fixed inorganic nitrogen, particularly in the form of nitrate, ishighly mobile. Nitrate has a high potential to leach below the root zone into ground-water or be carried overland to nearby surface waters, while excess ammonia can volatizeinto the atmosphere. Phosphate is not as mobile as nitrate, and tends to be carried onsoil particles that move off the field due to erosion. Compost represents an organicnitrogen source; its nitrogen must ultimately be mineralized prior to plant uptake, butthe proportion of nitrogen lost to surrounding water resources is generally greater fromsynthetic (primarily inorganic) nitrogen than compost.
Perhaps the largest difference between the environmental impact of fertilizer inputs toorganic and conventional agriculture is energy use. Synthetic nitrogen fertilizer, themost common agricultural input by mass, is fixed through the Haber-Bosch process,where hydrogen and nitrogen are reacted at high temperature and pressure in thepresence of iron catalysts to produce ammonia. Approximately 60 gigajoules are re-quired for each ton of ammonia produced, along with substantial quantities of hydro-gen (Fluck, 1992). Ammonia is then converted to a variety of forms of nitrogen, in-cluding urea, ammonium nitrate, ammonium phosphates, and ammonium sulfate, andcombined with other materials to create a complete N:P:K fertilizer product (Lauriente,1998).

64
Fluck (1992) estimated that the energy required to produce one pound of syntheticnitrogen fertilizer to be on the order of 34,000 BTU, while the energy required to pro-duce an equivalent quantity of nitrogen in compost derived from crop residue is lessthan 500 BTU. Both estimates are exclusive of the energy requirements in handling,transportation, and application and should therefore be only taken as rough estimatesof total energy use for each fertilizer type. However, surveyed Organic and Traditionalvineyards applied approximately the same mass of fertilizer per acre, as noted in Chapter5. The nutrients provided by synthetic fertilizer are at much higher concentrations thancompost. Synthetic fertilizers often contain around 15% Nitrogen by mass whereascompost contains 0.9% Nitrogen by mass. Organic vineyards have to spend signifi-cantly more time and money to ensure that the vines are receiving sufficient nutrients.It should also be noted that soil nitrogen levels can be augmented in many viticulturalsystems by cultivation of leguminous cover crops. However, cover crops can increasevineyard water demand (Miller et al., 1989), and no estimates of the energy input re-quired for mowing and/or tillage were found.
Comparison of Production Costs
Comparing the costs of producing organic and traditional wine grapes is not easilydone. The price of growing wine grapes is a function of a myriad of factors that varywith location. At a minimum, the vintner must consider grape variety, production scale,fertilizer and water requirements, land value, vine density (per acre), the historicalintensity of pests in the area, and the price of labor. Though a definitive analysis wouldbe cost-prohibitive, requiring a controlled study over a long period in several regions,some general conclusions can be drawn from a collection of cost comparison studiesperformed by the University of California Cooperative Extension Service (UCCE) overthe past decade examining the cost of establishing a vineyard and producing winegrapes.
The UCCE studies offer snapshots of the cost of growing different grape varieties indifferent regions in different years; they are most valuable in demonstrating how theprice of growing wine grapes can vary profoundly. For example, estimated develop-ment costs ranged from $10,000 to $80,000 per acre (Klonsky, 1999). The studies indi-cate that the cost of establishing a traditional vineyard is comparable to that of estab-lishing an organic vineyard. Initial costs include purchasing vineyard site, land prepa-ration (including vine layout, planting, and trellising), purchase of common vineyardmanagement equipment, irrigation of crops, utilities, property taxes, administrativeoverhead, and vineyard employment.
The major cost differences occur once a vineyard is established. The labor and mate-rials input are the biggest differences between organic and traditional agriculture, alongwith the cost of registration and certification as an organic vineyard. The registrationcost includes an initial $500 non-refundable fee, fees-for-service, travel charges, and

65
per diem charges. CCOF certification costs a $200 membership fee, the cost of aninspector’s time, and an assessment on organic sales. Yields of organically grown andtraditional wine grapes are similar and usually range from three to nine tons per acre.Yields depend on grape variety, vineyard age, county of production, yearly growingconditions, and vineyard design. While the organic vineyards spent significantly lesson fungicides, herbicides, and insecticides, they had much more substantial costs toprovide nutrients to the soil. Organic vineyards add soil amendments including minedlimestone, sulfate of potash, and compost, and their costs of material inputs are muchhigher than conventional practices.
Table 6.11 Comparison of wine grape production costs in organic andconventional vineyards in 1998-adjusted dollars (U.C. Cooperative Extension, 1992-98).
Location Grape Variety Yield Total Cost Total Costper acre per ton
Conventional viticulture1997 San Joaquin Valley N/A 7 $2,503 $3581994 Lodi Cabernet sauvignon N/A $2,447 $4081996 Santa Maria Valley Chardonnay 6 $4,661 $7771998 Lake County Sauvignon blanc 6 $4,536 $7561996 Sierra Foothills N/A 5.5 $5,302 $9641996 Paso Robles Cabernet sauvignon 6 $4,860 $8101996 Sierra Foothills N/A N/A $4,253 $709Average cost of wine grape production $3,919 $647
Organic viticulture1992 Resident Vegetation N/A 6.25 $5,178 $8281992 Annually Sown Cover crop N/A 6.25 $5,262 $842Average cost of organic wine grape production $5,220 $835
Table 6.12 Average cost per acre in 1998, given in dollars (U.C. CooperativeExtension, 1992-98).
Conventional OrganicFungicide 64.83 7.49Fertilizer 31.62 353.95Insecticide 30.80 12.86Herbicide 26.12 0.00Average Total Cost per Acre 153.37 374.30

66
Cover crops represent another substantial difference in startup costs between organicand traditional vineyards. Annually sown cover crops require seed, labor, additionalfarm machinery, and may increase a vineyard’s total water demand. By having covercrops, the need for insecticides may diminish as cover crops often provide habitat forbeneficial insects. In 1992, UCCE performed two studies that specifically examined thecosts of producing organic wine grapes; one study assumed an annually sown covercrop and the other factored in the cost of nurturing resident vegetation between vinerows (Klonsky, 1999). The studies implied that it is more expensive to grow wine grapeswith annual cover crops at $725 per ton than resident vegetation, which cost $713 perton.
Comparison of the two organic cost studies with seven available traditional viticulturestudies indicates that production costs for organic grapes may tend to fall on the highend of the range, after adjusting for inflation. However, organic grape production costsdo not appear to be substantially higher than traditional grape cultivation, as shown inTable 6.11 and Table 6.12. Organic vineyards may have higher costs by maintainingcover crops and having more expensive fertilizers, but the entire costs of grape culti-vation needs to be looked at to reach an accurate comparison.
Integrated Pest Management
Conventional vineyard management often relies upon the use of sulfur along withsynthetic insecticides, fungicides, and herbicides to control pests, while organic grow-ers depend on the use of sulfur and biologically intensive methods. Integrated PestManagement (IPM) has been developed as a compromise. Farmers practicing IPM useboth the biologically intensive methods of organic farmers and pesticides, using which-ever method they see as the most effective or profitable to deal with a given pestoutbreak, or to reduce the risk of an outbreak occurring. Integrated pest managementis a long-term approach to managing pests by combining biological, cultural, and chemi-cal tools in a way that minimizes economic, health and environmental risks (Lodi-Woodbridge Winegrape Commission, 1998).
IPM is generally implemented using “volunteer” plants in the vineyards, grown be-tween the rows of vines, to suppress the growth of undesirable “weeds”, which maycompete with the vines for water, nutrients, and sunlight. The volunteer plant is alsochosen to act as a host for predators of potential insect pests. The volunteer plants arechosen depending on location, soil type, and other variables. If chosen properly thevolunteer plants, with a little maintenance, will decrease pests and help retain mois-ture and nutrients in the soil. The result can be not only reduced pesticide application,but also reduced water and fertilizer application.

67
The following is a description of the ways in which both conventional and IPM meth-ods handle the most common pests found in a vineyard. It should be noted that pestsand the mechanism of treatment varies greatly with location, soil type, climate, andpreference of the farmer. The two recommended treatments for each pest are takenfrom the UC Pest Management Guidelines (UC IPM Project, 2000).
Insects
The list of potential insect pests in a vineyard is extensive. However there one speciesis particularly common in California vineyards. This insect, the leafhopper, feeds onthe nutrient rich juices in the leaves of the vine. Symptoms of leafhopper predationinclude damaged, white-spotted leaves, resulting in reduced photosynthetic capacityand an overall weakening of the vine.
Leafhoppers are commonly controlled through the application of the pesticides En-dosulfan, Sevin, or Guthion. These pesticides are generally quite effective, significantlyreducing leafhopper populations, though Endosulfan-resistant leafhoppers are foundin some areas. Pesticide use is generally not recommended until after a season in whichdamage is noticed as the vines can tolerate fairly high populations without harm.
Integrated Pest Management techniques attempt to use biological and cultural controlbefore resorting to pesticide use. Biological controls consist predominantly of plantinghosts to natural leafhopper predators, such as blackberry bushes, between rows andaround vineyards. Unfortunately, these plants can in some cases be an alternate hostto leafhoppers as well.
Cultural techniques remove weeds in vineyards and surrounding areas before vinesstart to grow in spring can reduce leafhopper populations that might disperse to newgrape foliage. The use of a flail mower before budbreak can be particularly effectivein controlling overwintering adults if mowing occurs during early morning hours be-fore temperatures warm up to above the flight threshold. Removing basal leaves dur-ing berry set and the 2-week period following (before adult leafhoppers emerge) canreduce peak leafhopper populations during the season by 30 to 50%. Maintaining alow growing, summer cover crop to encourage populations of beneficial insects canalso help reduce leafhopper populations. Preventing overly vigorous vine growth canalso help suppress leafhoppers (UC IPM Project, 2000).
As a last resort, organic farmers can use insecticidal soaps on the underside of theaffected leaves. This must be done at a particularly small window of time during larvaldevelopment.

68
Diseases
A major fungal disease problem in grape growing is powdery mildew. The diseaseappears as a sticky, greyish-white, spore material. The fungus can attack both the vineand the fruit. If fully developed bunches are attacked, they will fail to ripen properly,and the fungus will inevitably end up in the wine, where it creates “off” flavors (HainleVineyards, 1995).
The disease can be controlled by canopy management. Bright sunlight and good aircirculation prevent spores from spreading, while shade pockets provide a favorableenvironment for the fungus. By controlling nutrition and irrigation, as well as trim-ming dense areas, powdery mildew is less likely to become a problem.
Another option, which is approved for use in organic vineyards, is the spraying of sulfurand water. Sulfur is sprayed at budbreak to 2-inch shoot growth. Conventional grow-ers use either sulfur or a synthetic equivalent to deal with powdery mildew. Syntheticequivalents include Rally, Rubigan, Bayleton, and Procure.
Weeds
Weed management practices vary considerably. Location in the state, climatic condi-tions, grape varieties, soils, irrigation practices, topography, and grower preferencessignificantly influence vineyard floor management decisions and the tools used. Weedsare commonly controlled either mechanically or chemically in a 2- to 5-foot-wide stripin the vine row. The area between vine rows can be mechanically mowed, tilled, orsometimes, chemically treated.
IPM is generally implemented using “volunteer” plants in the vineyards, between therows of vines, to suppress the growth of undesirable weeds which may compete withthe vines for water, nutrients, and sunlight. Examples of volunteer plants in Californiainclude cereals, such as oat and barley, or subterranean clovers. Alternatively, weedscan be removed physically, though this is labor intensive and must be frequently re-peated.
Herbicides can also be used to control most weed species. In most conventional vine-yards, combinations and/or sequential applications of herbicides are required to pro-vide effective, economical control.
Nutrition
As an alternative to synthetic fertilizer application, IPM techniques call for the tilling ofvolunteer plants into the soil prior to bud break. The plants can be tilled prior to growthin the spring. This not only provides nutrients to the soil, but controls the volunteerplant (which can compete with the vine) and leafhopper populations as well. Conven-tional vineyards might apply nitrogen fertilizers as necessary.

69
It should be noted that “organic” does not imply the use of a single set of viticulturemethods, just as there is no single “conventional” grape-growing method. The rangeof practices could be described as more of a continuum than a set of contrasting meth-ods. For instance, a certified organic viticulturalist may not utilize all methods that couldbe included in the term “organic,” while conventional growers can apply biologicallyintensive methods. Although organic methods may be assumed by many to embraceall environmental “best management practices,” this is not necessarily the case. Simi-larly, conventional vineyards may, or may not, utilize IPM techniques minimize pesti-cide use.
Biologically Integrated Farming System: Lodi-Woodbridge WinegrapeCommission
In 1994, Governor Wilson signed into law AB 3383, which mandated increased re-search and implementation of Integrated Pest Management. This assembly bill requestedthat the Regents of the University of California establish a pilot demonstration pro-gram for farmers who want to voluntarily reduce their use of agricultural chemicals.The goal of AB 3383 was “…to expand the use of integrated farming systems that havebeen proven to decrease the use of farm chemicals,” by integrating these elements(Section 591):
• Relying on biological and cultural control to protect crops from pest out-breaks.
• Creating on-farm habitats that harbor populations of beneficial insects andmites.
• Using cover crops to provide some or all of the nitrogen needed by the cropplants.
• Directing overall attention to soil building practices.
• Reducing reliance upon chemicals.
The resulting program became known as the Biologically Integrated Farming System(BIFS) under the direction of the University of California Sustainable Agriculture Re-search and Education Program (UC SAREP). In 1995 the Lodi-Woodbridge WinegrapeCommission received a grant for three years of funding to help transform the IPM pro-gram which began in 1992 into an integrated farming program (IFP).
LWWC’s definition of BIFS is: “BIFS (of wine grapes) is a long term approach to man-aging wine grapes using a combination of farming techniques (biological, cultural andchemical) that optimizes the production of quality wine grapes and minimizes eco-nomic, environmental, and health risks” (SAREP, 1999).

70
In 1996, the Lodi-Woodbridge BIFS program began with 30 BIFS grower cooperatorsand 37 vineyards. By 1998, the third year of the program 43 BIFS growers were work-ing with 60 demonstration vineyards totaling 2370 acres. The LWWC’s BIFS programconsists of three components: grower outreach, field implementation, and evaluation.
Grower Outreach
Grower outreach addresses the entire membership of 650 growers in the LWWC dis-trict. It involves providing information on integrated farming strategies to growers, pestcontrol advisors (PCA’s), and winery personnel. Grower outreach was accomplishedthrough breakfast meetings, workshops/field days, an IPM newsletter, half-day researchseminars, and neighborhood grower meetings.
Field Implementation
The field implementation component requires working with individual LWWC grow-ers and PCA’s in a one-on-one situation. This work occurs in specific vineyards toimplement one or more of the integrated farming strategies. Types of strategies to beimplemented include: weekly monitoring for pests, establishment of economic thresh-olds, use of cover crops, and the spraying of contact herbicides instead of pre-emer-gent herbicides. BIFS encourages the weekly monitoring of vineyards in order to fa-miliarize the grower with the vineyard pest situation. This results in the vineyard onlybeing treated during actual pest encroachments (not perceived threats), and only treatingthe affected sections. In addition, it is possible to establish economic thresholds, whichare the levels at which the concentrations of pests will result in economic damage. Itis important to recognize that the mere presence of pests is not always cause for con-cern. LWWC recognizes that “…individual vineyards will periodically suffer pest prob-lems requiring control actions to avoid significant economic losses. It is important foreveryone to realize that BIFS (and other sustainable agricultural systems) do not elimi-nate pest problems” (LWWC, 1998).
Table 6.13 presents some of the BIFS techniques used and their frequency in the LWWCprogram. From this data, some initial trends can be seen. The cover crop numbers areskewed due to the addition of 13 vineyards to the program that did not have covercrops. However, 100% of the vineyards conducted weekly vineyard monitoring in allthree years, reflecting the emphasis on this monitoring by the LWWC BIFS. Also, thespraying of pre-emergent herbicides decreased from 54% in 1996 to 28% in 1998, whilethe spraying of contact herbicides (preferred by the LWWC BIFS) increased from 19%to 39% during that same period. In addition, those vineyards spraying for mites or leaf-hoppers decreased from 54% in 1996 to 28% in 1998.

71
Evaluation
What are the benefits of using IPM and/or the BIFS? Does this technique of farmingresults in the use of smaller amounts of synthetic pesticides and fertilizers? The Lodi-Woodbridge Winegrape Commission’s Biologically Integrated Farming System forWinegrapes Final Report dated December 31, 1998 presented the results from the threeyears worth of implementation (SAREP, 1999). The participating growers were surveyedto determine the levels of BIFS implementation in the vineyards, however the termIPM was used to reduce confusion. The use of various BIFS/IPM strategies increasedoverall. Of the survey respondents, 76% reduced the per acre load of insecticides, 66%use lower herbicide load, and 58% use lower miticide load. Ninety percent of the re-spondents “somewhat agreed to strongly agreed that IPM is effective, minimizes envi-ronmental risks, reduces use of broad –spectrum chemicals, reduces health risks, andreduces pesticide use” (SAREP, 1999).
The LWWC BIFS project has been successful in the following ways:
• 70% of the BIFS vineyards use cover crops.
• 100% of the BIFS vineyards monitor intensively for in-season pest and benefi-cial.
• A computer database was developed to manage all grower, crop, pest andpesticide information.
• 28% of the BIFS vineyards sprayed for mites or leafhoppers in 1998 downfrom 54 percent in 1996.
Table 6.13 LWWC techniques and frequency.
BIFS Management Practice % of vineyards using practice1996 1997 1998
Weekly Monitoring 100% 100% 100%Cover Crops: Annual 38% 34% 28%Cover Crops: Perennial 53% 46% 44%Strip sprays: Pre-emergent herbicides 70% 57% 59%Strip sprays: Contact herbicides 19% 35% 39%Mechanical weed control under vine 10% 8% 7%Not sprayed for mites or leafhoppers 46% 50% 72%Leaf Pulling 51% 55% 50%Manure Addition 17% 14% 13%Compost Addition 31% 26% 25%Drip Irrigation 57% 60% 73%Owl Boxes 0% 24% 24%

72
• 73% of the BIFS acreage has been converted to drip irrigation, up from 57percent in the first year of the program. This technology can reduce nitrogenuse by 50 percent.
“In 1998, a comprehensive grower survey was sent to more than 600 LWWC growers,managers and PCAs. Among other things, survey results show that 94 percent of thegrowers have read the BIFS newsletter, 65 percent had attended a BIFS neighborhoodgrower meeting, and 66 percent reported monitoring their vineyards more frequentlysince 1992. This suggests that the Lodi-Woodbridge BIFS program has had a significantimpact on the entire districts’ implementation of biologically integrated farming prac-tices”. (SAREP, 2000)
The LWWC believes that the use of many kinds of pesticides is “gradually decliningover time in LWWC vineyards due to better monitoring and development of realisticeconomic thresholds by individual growers” (LWWC 1998). The results of the LWWC’sefforts could be an overall indication of the usefulness of IPM as an environmentallysensitive tool in farming. Evaluation of the program is ongoing, and IFP program de-velopment is continuing. The LWWC Integrated Farming Program is planning to ex-pand to the entire district, which includes 650 growers and about 70,000 acres. SinceIPM is already used extensively, it is likely that if LWWC is successful, many other growersthroughout the state will begin to adopt integrated farming practices as well.

73
7. Wine Production and Marketing
As with all commercial production activities, wineries affect the social and environ-mental landscapes in which they are located. Wine is, however, a simple product. Grapesare crushed and given time and care, they are fermented. A few materials, such asfining and stabilizing agents, may be added during processing, but they are not usedin large quantities or present in the finished product. After grapes, sulfites are the pri-mary material added, albeit in trace quantities; they inhibit oxidation and stem theproliferation of undesirable microbes. In general, wineries are faced with limited op-tions for minimizing their environmental impact: reduce water usage, improve watertreatment, minimize wastewater, improve energy efficiency, or increase the use of re-cycled materials. This study was primarily concerned with impacts to water supplies.
Despite the apparent simplicity of the winemaker’s ingredient list, organic wine is sur-prisingly an undefined quantity in the United States. Processing standards for organicwine are well established in France and Germany. The United States Department ofAgriculture has yet to approve regulatory standards for organic wine processing. Lack-ing processing standards from the USDA, the Bureau of Alcohol Tobacco and Firearms(BATF) does not recognize any wine as organic. Wine therefore cannot be labeled“organic wine”, regardless of the processing standards employed. In effect, there is nosuch thing as American organic wine.
Clearly there is no domestic consensus regarding organic wine production. A few win-eries, such as Frey Vineyards, process their wine completely without the use of sulfites,yeasts other than those present on the grape skins at harvest, gases such as carbondioxide or nitrogen, stabilizing agents, or fining agents derived from animal products.Such strict limitations constrain the winemaker, limiting flexibility to take correctiveaction when a batch begins to go awry. On the other hand, the standards set by theOrganic Grapes into Wine Alliance (OGWA), for members of the organization includelimited sulfite addition, provided that the sulfite is not added as potassium metabisulfite,and most practices associated with high quality wine production are either allowed or“tolerated”. The reason for the distinction between potassium metabisulfite and othersulfite compounds is unclear; OGWA standards do not offer a rationale for the divi-sion.
In the absence of accepted organic wine processing standards, there is little with whichconventional wine processing may be compared. Chapter 5 examined wine produc-tion volume, winery water source, winery wastewater treatment technology, employ-ment and distribution for wineries that indicated that they consider environmentalimpacts when they buy grapes and those that do not.

74
This chapter examines some of the water sources available to wineries, and exploreswastewater flow rates. In the following section, current wastewater treatment standardsare evaluated and standard winery self-monitoring reports are studied. Winery distri-bution options are then evaluated, including differences between distribution optionsfor traditional wine and wine from organic grapes. Finally, consumer preferences andenvironmental sensitivity are examined.
Wastewater Disposal
Wineries are faced with several options to treat their wastewater. Unless the winery islocated within the public infrastructure network and they are given the option of usinga municipal treatment plant, wineries generally use treatment ponds or a septic sys-tems. Of the 83 wineries that answered the question, 46 used septic systems and leachfields. This represents 55% of all wineries, as shown in Figure 7.1.
Septic systems are a sewage treatment and disposal system buried in the ground. Gen-erally a septic system is composed of a septic tank and a leach field or trench. Waste-water is gravity fed, from the disposal site to the septic tank where heavier particlessettle out. Bacteria in the tanks break down some of the solids. While the sludge andscum remain in the tank, the effluent flows out of the tank into the leach field, whereit is distributed over crushed gravel or absorbent soil.
Figure 7.1 Winery Wastewater Treatment Mechanisms.
Winery Wastewater Treatment Mechanisms
56%
12%
11%
8%
8%5% Septic system & leach
field
Municipal treatment plant
Aerated pond
Evaporation ponds
Combination of treatments
Other

75
The effluent typically includes organic matter, nitrates, and phosphorus. The septic tankand leach field provide minimal treatment for these contaminants. Generally phosphorusand dissolved metals are bound by the soil - although sandy and gravelly soil may notremove these compounds. Nitrate, however, is much more mobile and usually travelswith the groundwater. Biological Oxygen Demand (BOD) is also an issue with nutri-ent loading. BOD is the amount of oxygen consumed if bacteria and protozoa oxi-dized all the organics in one liter of water.
The State Coastal Commission is the only agency to implement septic tank regulationsstate-wide. According to the Coastal Commission, new septic tanks, referred to as on-site disposal systems (OSDS), should not be place in ‘unsuitable areas’. Unsuitable sitesinclude:
(a) with poorly or excessively drained soils;
(b) with shallow water tables or high seasonal water tables;
(c) within floodplains; or
(d) where nutrient and/or pathogen concentrations in the effluent cannot be suf-ficiently treated or reduced before the effluent reaches sensitive water bodies.
Further, the Coastal Commission prohibits the installation of OSDS where conditionsindicate that surface waters may be adversely affected by excess nitrogen from groundwater, or require the installation of OSDS that reduce total nitrogen loadings to meetwater quality objectives (California Coastal Commission–Urban Management Measures.2000). These requirements point to the impact of septic systems on the environment.As a result, it appears that many wineries are loading nitrogen, phosphorus and patho-gens into the environment.
Winery Waste Discharge Requirements
The State of California through the Regional Water Quality Control Boards (RWQCB)regulates the discharge of wastewater into the environment. Locally, the Central Cali-fornia RWQCB issues Waste Discharge Permits and the County of Santa Barbara sharewaste permitting responsibilities. Staff with the Central California RWQCB indicatedthat their requirements and practices closely match those of the RWQCBs in the Napa/Sonoma and Central Valley winemaking regions. Wastewater from wineries usuallycomes in two forms, domestic wastewater from employee activities and wastewaterfrom the winemaking process.
Domestic wastewater is either input to a local sewer system or it is treated on-site usinga septic system. A cursory review of Waste Discharge permits, and initial research ef-forts, suggests that most wineries are located outside of public utility sewer service.Consequently, most wineries in the Santa Barbara Region use septic systems to treatdomestic wastewater.

76
Septic systems for disposal of domestic wastewater most often consist of undergroundseptic tanks that discharge to subsurface leachfield systems. In some cases, permitsrequirements indicated that the winery must construct dual leachfields–with capacityfor 200% of the calculated disposal flow-with diversion valves to allow wastewater tobe periodically allocated to separate leachfields. Septic systems can be permitted ei-ther locally–through county or city governments–or through the State of CaliforniaRWQCB.
Wastewater from wineries is usually either added to the domestic sewer system or treatedthrough a series of wastewater treatment ponds. Winery wastewater is most often gen-erated during the crush period, August through October. When designing wastewatertreatment options for winemaking operations, most wineries chose from a limited setof options. Essentially, wineries decide if they should use lined or unlined ponds andwhether they should aerated or not aerated those ponds. Further, they must decide ifthey will employ mechanical or other pretreatment options such as screening devisesor pH adjustments and acquire a permit from the RWQCB.
According to the Central Coast RWQCB, larger winemakers frequently employ aeratedponds, while smaller wineries rely on non-aerated evaporation ponds (Higgens, 1999).Winery survey results agree with RWQCB experience for large wineries, as shown inFigure 7.2. However, survey results indicate small wineries use septic systems far moreoften than evaporation ponds.
Figure 7.2 Wastewater treatment technologies applied by small and largewineries.
Less Than 50,000 Cases per Year
13%
25%
37%
13%
0%
6%6%
More Than 50,000 Cases per Year
7%
64%
4%
12%
1%
9%3%
Evaporationponds
Septic system &leach field
Aerated pond
Municipaltreatment plant
Filtration andactivated carbon
Other
Combination

77
Table 7.1 Results from a sample winery monitoring report.
Date Pond Analyte Result Units Det. Limit Method11/25/97 Upper COD 4900 mg/l 5 EPA 410.411/25/97 Upper DO 1.2 mg/l 1 SM 4500-OG11/25/97 Upper TDS 3900 mg/l 10 EPA 160.111/25/97 Upper pH 6.1 Units 0.1 EPA 160.111/25/97 Middle COD 4,500 mg/l 5 EPA 410.411/25/97 Middle DO 1.1 mg/l 1 SM 4500O–OG11/25/97 Middle TDS 2,400 mg/l 10 EPA 160.111/25/97 Middle pH 6.6 Units 0.1 EPA 150.110/01/98 Upper COD 2,200 mg/l 5 EPA 410.410/01/98 Upper DO ND mg/l 1 SM 4500–OG10/01/98 Upper TDS 1,400 mg/l 10 EPA 160.110/01/98 Upper pH 6.6 Units 0.1 EPA 160.110/01/98 Middle COD 780 mg/l 6 EPA 410.410/01/98 Middle DO >10 mg/l 1 SM 4500–OG10/01/98 Middle TDS 960 mg/l 10 EPA 160.110/01/98 Middle pH 9.2 Units 0.1 EPA 150.1
COD=Chemical Oxygen Demand, DO= Dissolved Oxygen , TDS=Total Dissolved Solids
The additional oxygen input in aerated ponds allows for the more complete and fasterremoval of BOD and other components, reducing the area required to treat a givenflow rate. Wineries are usually directed to line or not line the ponds by the RWQCBand consulting engineers based on local conditions such as depth to ground waterand soil permeability.
After the water has passed through the treatment ponds it is usually used for vineyardirrigation. Reviewed permits contained conditions limiting wastewater to pH between6.5 and 8.4 for disposal to either the leachfield or as irrigation. Permits also requireminimal impact to groundwater nitrate concentrations, usually not to exceed 10 mg/las N in discharge. Further, permits require that wineries demonstrate water balancecalculations that provide adequate disposal/irrigation capacity for the peak crush flowso as to eliminate ponding or surface runoff.
Solid waste from the winemaking process includes pomace and stems. Stems can beused as a farm animal feed supplement, and both pomace and stems can be discedback into a vineyard as a fertilizer.
Waste discharge permits usually contain monitoring and reporting requirements. Moni-toring and reporting requirements can include weekly measurements of flow and pondfreeboard and annual measurements of total dissolved solids, dissolved oxygen, chemicaloxygen demand, and pH. Finally an annual summary of volumes and disposal/uselocations of stems, pomace, and sludge must be reported. Table 7.1 displays the re-sults from a sample winery monitoring report.

78
Distribution
One of the most contentious issues the California wine industry faces is the distribu-tion of wine. The issue is more socioeconomic than environmental, but the implica-tions for the structure of the wine industry are significant. The 21st Amendment to theU.S. Constitution gives each state the right to regulate, control, and tax the sale of al-coholic beverages. Under California law, wineries can sell wine to consumers directlyfrom the winery, via mailing lists, and through distributors.
Since the major distributors of wine are privately held, available information about theirsales is somewhat limited. There are ten major wine distributors in California; it is es-timated that they directly employ 2,200 people with total wages of $100 million andtotal revenues of $3 billion (MKF, 2000). According to Hoovers Business Profiles, thetwo main distributors in California are Southern Wine and Spirits and Young’s Market,who collectively employ 1,600 people to support their wine sales and generate annualrevenues on the order of $2.2 billion (Hoovers, 1999).
As discussed in Chapter 5, wine sold to distributors is clearly the dominant distributionchannel for Winery Survey respondents, accounting for nearly 60% of total sales. Win-eries reported that direct sales through winery web sites comprised only 2% of totalvolume. Recent independent estimates suggest direct phone and internet sales com-bined account for approximately 3% of industry sales, a comparable figure (Couzin,2000). Though they represent a small portion of total sales, direct sales through theinternet are a major point of contention between small winemakers and wine distribu-tors. Small winemakers believe they stand to benefit greatly from unfettered direct salesthrough the open medium of the internet, while it is in the interest of wine distributorsto maintain their position as a conduit for the bulk of wine sales to retailers.
The substance of wine distributors’ case for federal legislation limiting interstate winesales through the internet is not couched purely in terms of self-interest. Distributorssuggest that their mastery of extant state and local alcohol shipping regulations is es-sential for compliance with the Byzantine array of laws surviving from the Prohibitionera. Individual wineries shipping small amounts directly may neglect to pay the ap-propriate state-mandated excise and sales taxes. Conflict between the two groups issufficiently venomous to engender direct accusations of winery malfeasance by theirdistributor lobbyist groups. For example, Barry McCahill, executive director of Ameri-cans for Responsible Alcohol Access accused California wineries of “shipping withimpunity.” He went on to state, “We advocate felony laws because it’s the only thingthat will stop these California wineries.” (Woody, 1999).
The August 3, 1999 passage of the 21st Amendment Enforcement Act marked a signifi-cant victory for the distributor lobby and groups concerned about the possibility ofillegal wine purchasing by minors. With the passage of the 21st Amendment, the U. S.

79
Congress delegated to the states a portion of its constitutional authority to regulateinterstate commerce. The amendment specifically allows states to regulate interstateshipments of alcohol; many states have exercised this right by imposing excise taxeson alcohol shipments. However, the 21st Amendment did not specifically delegate tothe states the right to enforce state alcohol regulations on companies in other states.Until the passage of the 21st Amendment Enforcement Act, only the federal govern-ment was empowered to engage in interstate enforcement of alcohol regulations, andstate excise tax fraud generally did not command significant attention from federalprosecutors.
Though it‘s an open question whether or not children were really buying significantquantities of ultra-premium wine (i.e. wines costing more than $14/bottle) over theinternet, the 21st Amendment Enforcement Act may have a substantial impact on howthe internet distribution channel develops. Interstate alcohol shipments are regulatedby 30 states, limiting the legal market for direct sales by California wineries. When anestimated 80% of wine drinkers have internet access , limitations on direct sales mayfavor the growth of online alcohol clearinghouses modeled after Amazon.com whowill work through arrangements with local distributors to comply with the maze oflocal regulations (Woody, 1999).
It is unclear whether regulation of internet wine sales, or the rise of web-based wineclearinghouses will affect WOGG producers differently than Traditional winemakers.Of the 91 responses received for the Winery Survey, 12 wineries surveyed produce atleast 5% of their wines exclusively from organically grown grapes. It is not possible todetermine whether there is a statistical difference between these 12 and the remaining79 in terms of distribution channels employed. However, it is interesting to note that10 of the 12 wineries reported that their wines from organically grown grapes requiredifferent distribution channels from their wines from conventionally grown grapes, andthe company with the single highest rate of internet sales (45%) is among the ten. Winesfrom organically grown grapes make up a small section of the total wine market, andthe Consumer Survey results indicate that people who have bought wines from or-ganically grown grapes because the grapes are organically grown represent a minorityof wine consumers (20%).
Since there are on the order of 4,000 individual wine labels currently on the market,physical wine retailers can only display a limited number of wines, and they presum-ably base their stocking rates in large part upon sales patterns, it’s probably difficultfor interested consumers to find wine from organically grown grapes. The lack of anindustry accepted labeling scheme to communicate to consumers that the wines are infact made from organic grapes is also likely to limit the ability of organic wine produc-ers to expand their market with retail buyers. It may therefore be exceptionally benefi-

80
cial for small labels and WOGG producers to advertise and sell over the internet, wherethey can more readily differentiate their products. On the other hand, the total size ofthe potential market for WOGG is dependent upon consumer interest.
The Wine Consumer
When asked to indicate the most important factor in deciding which bottle of wine tobuy, people interviewed for the Consumer Survey overwhelmingly cited satisfactionin tasting wine before it is purchased, as shown in Figure 7.3. Grape variety was thenext most frequently cited factor, and the variable of primary interest to this report,winery environmental sensitivity, was a distant third.
Most Important Factor in Wine Purchasing
0% 10% 20% 30% 40% 50%
Other
Label design
Wine critic ratings
Brand name
Price
Winery environmental
sensitivity
Grape variety
Prior satisfaction
Relative Frequency
Figure 7.3 Most important factor in retail wine purchase decisions. Numbersrepresent the proportion of consumers surveyed who selected thevariable as the most important.
Previous Tasting

81
Table 7.2 Consumer Survey respondent rate of wine purchase.
Bottles/month Wine WOGGYes No Yes No
1-2 36% 30 7% 63-4 31% 26 4% 35-9 20% 1710-15 11% 9>15 1% 1Total 100% 84 11% 9
WOGG=Wine from organically grown grapes.
Surveyed consumers were polarized on the issue of winery environmental sensitivity.More than 50% of the group indicated the factor was “Not Important,” and an addi-tional 20% rated it only “Somewhat Important.” However, winery environmental sen-sitivity was rated most important more often than price, brand, label design, or winecritic ratings. Taken together, the results indicate that there is a group of concernedconsumers that places considerable importance upon environmental issues, but manyconsumers may not consider a winery’s environmental reputation at all when buyinga bottle of wine.
Twenty-seven percent of the people surveyed had tasted wine that was either organi-cally grown and produced or made from organically grown grapes, and 20% had boughta bottle of wine specifically because it was organic. Of the 23 respondents who had
tasted wine that was “organic” in some sense, fifteen thought favorably of its quality ingeneral (i.e. rated it as “good” or “very good”.) However, only nine people, or 11% ofthe people surveyed, bought wine made from organically grown grapes regularly, asshown in Table 7.2.
Consumers were also asked if they have or have not bought wine because it was or-ganic or made from organically grown grapes. A substantial difference is evident inthe potential importance in purchase decisions of more information about winery en-vironmental sensitivity. It must be noted that the precise meaning of the terms “moreinformation” and “environmental sensitivity” was left to the consumer. It is also un-likely that a significant proportion of wine consumers have detailed knowledge of theenvironmental impacts of winemaking; the absence of comprehensive analyses likethis report is evidence for this conclusion.
Nonetheless, a difference was observed between the two groups, as shown below inFigure 7.4. Consumers who have already shown interest in wines from organically growngrapes clearly indicate that they would respond to additional information about differ-
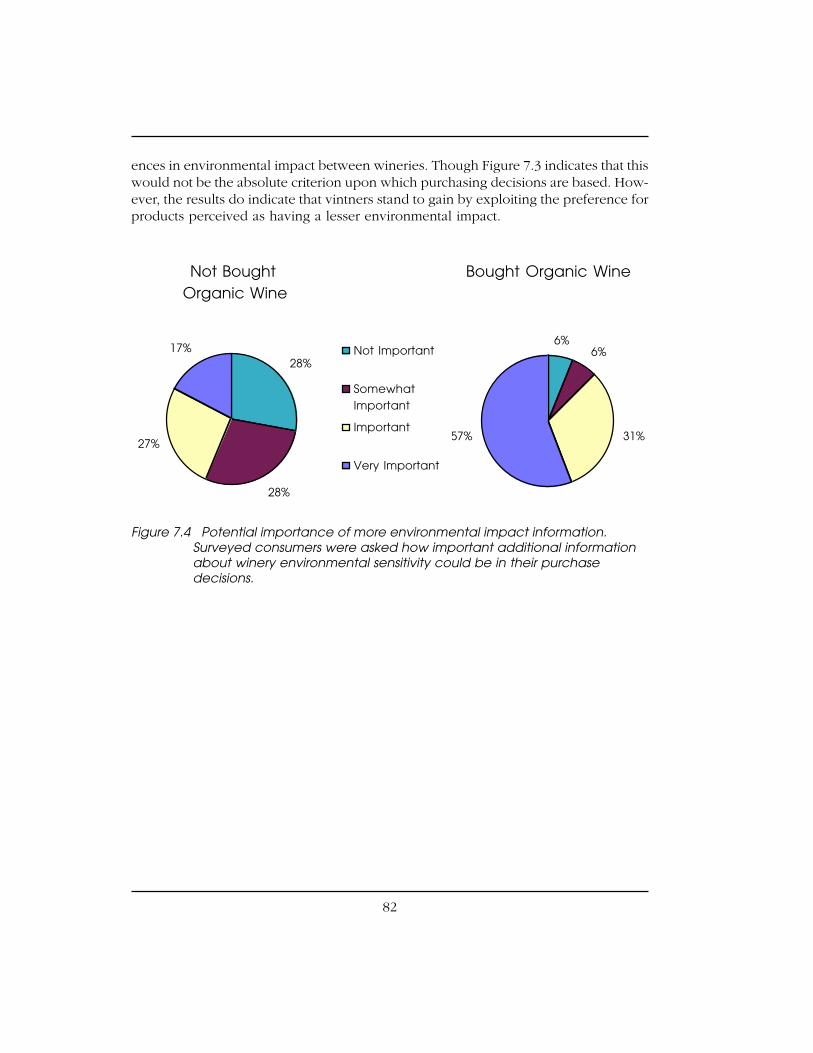
82
Bought Organic Wine
6%6%
31%57%
Not Bought Organic Wine
28%
28%
27%
17% Not Important
SomewhatImportant
Important
Very Important
Figure 7.4 Potential importance of more environmental impact information.Surveyed consumers were asked how important additional informationabout winery environmental sensitivity could be in their purchasedecisions.
ences in environmental impact between wineries. Though Figure 7.3 indicates that thiswould not be the absolute criterion upon which purchasing decisions are based. How-ever, the results do indicate that vintners stand to gain by exploiting the preference forproducts perceived as having a lesser environmental impact.
83
8. Fetzer Winery
Fetzer Vineyards and Winery of Hopland, California was selected as a case study forseveral reasons. First, Fetzer vineyards were initially established using traditional tech-niques; about ten years ago they converted to organic production. Second, they are amedium sized operation allowing for a more representative study of a typical vineyardand winery. Third, the management team is willing to share information and actuallyconsider it part of their job to offer information to those interested in their company.Fourth, Fetzer is well established in the industry. Finally, Fetzer is leading the develop-ment of “sustainable business” practices, and is regarded as a leader among environ-mentally sensitive companies.
Information for this study was gathered both from the literature concerning Fetzer aswell as person-to-person interviews with company management. More specifically, Man-aging Director Paul Dolan, Director of Vineyard Operations Tom Piper, E3 team leaderJill Jepson, and Environmental Issues Director Patrick Healy offered several hours oftheir time on February 1, 2000 to answer our questions.
History
In 1958, the lumber merchant Barney Fetzer and his family purchased a run-down ranchin rural Mendocino along with a 100-year-old vineyard. Ten years later, Jim and John,the eldest Fetzer brothers converted an old barn into a small winery and producedtheir first 2,500 cases of wines. Since then, Fetzer has continuously marketed theirmodestly priced wine throughout the state, nation, and today, the entire world. In 1976,sales at Fetzer were booming, allowing Barney to retire from the lumber business anda year later, hire Paul Dolan as head winemaker.
In 1981, just before Barney’s death, the family purchased the 1130-acre Sundial Ranchnear Hopland, 25 miles south of Redwood Valley, mainly to produce its white winevarietals. In 1984, the family purchased the Valley Oaks ranch near the Sundial ranchand began production at a new winery.
Fetzer’s Sundial Chardonnay and Eagle Peak Merlot are America’s best sellers in theircategories. Today, the company is the sixth largest premium wine producer in the UnitedStates. In 1992 Fetzer was sold to the Brown-Forman Corporation of Louisville, Ken-tucky and Paul Dolan was named president. Since the acquisition Fetzer has earnednumerous awards, including Wine and Spirits Magazine’s prestigious “Winery of theYear” award nine out of the past twelve years. Through its organic viticultural prac-tices, Fetzer has also developed a reputation as an environmental leader in the wine

84
industry. In the words of Fetzer’s president Paul Dolan: “Fetzer will continue to berecognized as the environmentally and socially conscious winery, committed to mak-ing the highest quality, best valued wines in the world.” This environmentally con-scious approach is apparent in many aspects of Fetzer as a vineyard, winery, and abusiness. Today, Fetzer maintains roughly 770 acres of vineyards, all CCOF certifiedorganic, near the Russian River in the southern end of Mendocino County.
Organic Viticulture Program
Fetzer’s suggests their main reasons for adhering to the California Organic Foods Actof 1990 are as follows:
• Improve soil health and fertility to achieve improved tilth, water retention, nu-trient availability and ultimately a stronger vine.
• Minimize the impact on the surrounding environment to foster a diverse com-munity of plants, insects, and animals.
• Reduce the use of fuel and of farm inputs.
• Reduce tractor trips through the vineyard.
The Director of Vineyard Operations, Tom Piper, has chosen to focus on four key ar-eas of essential farming practices in pursuit of the goals listed above. These areas areSoil Building, Insect Control, Weed Control, and Disease Control.
Soil Building
Fetzer employs the techniques of cover cropping, composting and appropriate tillageto enhance the vitality and sustainability of the vineyard soils. They report that theirsoils are characterized by sufficient amounts of micronutrients, varying amounts oforganic matter, and slightly acidic pH levels. The belief is that, by increasing the soilorganic content and the number of soil microorganisms, they will improve soil healthand grow a stronger vine with a longer economical life span. Fetzer performs a soilanalysis every 2-3 years to monitor these changes (See Table 8.1).
Composting and Cover Crops
Approximately 1 ton of compost per acre is applied to 100 acres of the vineyard eachyear that they are able to produce mostly from vineyard clippings and winery pom-ace. They primarily target replacement of nutrients that grapes remove and the addi-tion of microorganisms. The use of cover crops helps Fetzer to build up the soil or-ganic matter. They predominantly use three types of cover crop mixes: a rapid-growthmix, a sub-clover mix, and a grass mix. The rapid-growth mix is a mixture of 50%Cayuse Oat, 20% Bell Bean, 20% Austrian Winter Pea and 10% Daikon Radish that iscultivated into the soil in the spring to substantially add to the amount of soil organic

85
Table 8.1 Soil analysis of Fetzer organic vineyards.
Location: SundialDate 1991 1992 1993 1994 1997% Organic Matter 1.6 1.5 2.1 2.2 2.9Phosphorus P1 30 32 24.2 32.2 N/A P2 98 32 18.6 17.2 32.6Potassium 148 146 147 186 273Magnesium 646 519 663 597 571Calcium 1630 1490 2193 2270 2015pH 6.3 6.6 6.5 6.4 6.3C.E.C. (meq/100g) 15.7 13 16.5 16.9 16.1Nitrate 12 12 0.8 7.7 4.6Zinc 1.2 1.3 1.62 0.96 1.92Boron 0.8 1 0.8 0.9 0.49Sulfur 12 6 N/A N/A N/A
Location: Valley OaksDate 1991 1992 1993 1994 1996% Organic Matter 1.9 1.1 1.2 1.3 1.2Phosphorus P1 77 7 8.1 9.7 N/A P2 121 6 1.1 3.3 N/APotassium 123 33 47 63 *191Magnesium 313 197 178 194 *739Calcium 1090 620 765 780 *2615pH 6 5.7 5.7 5.8 6.4C.E.C. (meq/100g) 10 6.3 6.8 6.8 N/ANitrate 14 3 1 3.7 N/AZinc 4 0.2 0.82 0.6 4.3Boron 0.8 0.6 0.6 0.6 1.16Sulfur 11 6 N/A N/A N/A
Source: Tom Piper, Director of Vineyard Operations, Fetzer Vineyards. February 2000.
Note & AssumptionsAll values are expressed as parts per million unless otherwise noted.* = lbs./acreC.E.C. = cation exchange capacityN/A = not availableThe Sundial tests are from the same location.The Valley Oaks test location changed in 1992.The 1996 results from Valley Oaks were an analysis from a different lab than the others.
86
matter. Typically, they plant every other row with a permanent mixture of sub-clovercomprised of 25% Koala, 25% Karridale, 25% Mt. Barker and 25% Trikala. They mayalso plant a permanent grass mix comprised of roughly 27% Delaware Dwarf Rye,27% Chewings Fescue and 27% Creeping Red Fescue along with a 19% mixture ofNew Zealand White Clover and Broadleaf Trefoil. This grass mix is used for locationswhere they need increased competition to help control vine vigor. The cover cropsare selected for their rapid growth, ability to choke out weeds, and their ability totolerate wet winters. The temporary cover crops are periodically tilled back into the
soil to serve as organic matter for the vines. About every 3 years, the row middles areripped to break up the compacted solids.
The cover crops are selected for their rapid growth, ability to choke out weeds, andtheir ability to tolerate wet winters. The temporary cover crops are periodically tilledback into the soil to serve as organic matter for the vines. About every 3 years, the rowmiddles are ripped to break up the compacted solids.
The soil analysis presented in Table 8.1 suggests some interesting results. The Sundiallocation is considered by Piper to be a very good soil - as far as grapes are concerned- while the Valley Oaks soil is not as good. In both soils, there seems to be a trendtoward greater potassium, calcium, boron, and zinc concentrations. At the same time,there is a downward trend in nitrate levels, at least since the first samples in 1991.Piper notes that these nitrate figures illuminate the problem that can be found in stan-dard soil analysis; many times, the lab values do not make sense. He explains thatfrom year to year, lab values will fluctuate in anomalous ways that avoid interpreta-tion.
The key for Fetzer is to look at the larger view and observe identifiable trends, both inthe vineyard and in the analysis. This particular soil analysis shows a steady increasein the critical nutrients - calcium, phosphorous, potassium, as well as total organic matterand Cation Exchange Capacity. Piper states that they literally pay no attention to thenitrate levels because grapevines have a very low nitrogen requirement and that nitro-gen only manifests itself when it is in excess. If that is the case, they will try to con-sume the surplus nitrogen by cropping more heavily in that area or by planting a covercrop that will effectively consume the nitrogen. It is with these reservations that Piperpresents his soil analysis results to others in the industry as an example of how organicpractices may help improve soil health.
Insect control
As any organic vineyard, Fetzer seeks to maintain populations of pests through thedevelopment of a strong vine and a balancing of the predators within the vineyard.

87
Cover Crops and Native Vegetation
Fetzer has chosen cover crops that provide an alternative food source for pests whileencouraging the propagation of beneficial, predator insects - primarily spiders, lacew-ings, and ladybugs. They also seek to maintain the natural balance of insect life bypreserving the native vegetation outside the vineyard. Blackberries, native bunch grassesand flowering weed species all provide beneficial predator habitat.
Cultural Practices
Dust mites have a potentially large negative impact on Fetzer’s grapevines. Steps havebeen taken in the vineyard to minimize dust using river gravel as the main controlmeasure on vineyard roads. They have also purchased a liquid timber industry by-product to spray on the roads; however, this method is expensive and rarely used.Fetzer has also experimented with re-using their own by-products, mainly, stems fromgrapes and wood chips that were initially used to add oak character to tank wines.The stems and chips are applied using a compost spreader on the dirt roads aroundand near the vineyard. Within the vineyard itself, the permanent cover crops do anexcellent job of controlling dust.
Leaf removal helps to reduce young pest populations while maintaining the vigor ofthe vine and discourages leafhoppers. Ultimately, Piper feels that unnatural techniques,such as spraying pesticide, lead to greater problems in years to come (e.g., pesticideskill all things, including beneficial predators which could lead to infestations of pestsin future years.)
Weed Control
Since Fetzer uses no synthetic herbicides, physical removal techniques are employedto control weed populations. Techniques include:
• Use of a Clemens under-the-vine cultivator that covers two rows at once andcan clear 25 acres a day.
• Use of a Kimco machine, mounted on the side of a tractor which covers onerow at a time and can clear 10 acres a day. This machine is typically used inheavy soils and dense weeds.
• Hand hoeing in younger fields to maintain the vines that are not well estab-lished.
• Ridging up the dirt - essentially discing the dirt and smothering the weeds.

88
In addition to the machinery, the Clemens weeder requires a tractor operator and anassistant to remove the accumulations of weeds when used in heavy weeds such asbur clover or vetch. A Kimco machine, on the other hand, only requires one operator.In terms of hand hoeing, a good rule of thumb is that one worker can hoe one halfacre a day.
Disease Control
The techniques listed below are used primarily to address Powdery Mildew and Botrytis.Other fungal manifestations such as Eutypa and Measles are difficult to remedy. Tocontrol Mildew and Botrytis, Fetzer:
• Reduces the humidity at bud break by low mowing and cultivation.
• Increases air circulation through trellising and leaf removal in the fruit zone.
• Uses drip irrigation as opposed to sprinklers.
• Applies sulfur at regular intervals.
Wastewater Outputs from Winery
Fetzer produces 3.8 million cases of wine annually from 50,000 tons of grapes. Thisproduction requires 28 million gallons per year of water input to the winery alone andproduces approximately 18 million gallons of wastewater that must be treated. Thiseffluent is split between their traditional method of evaporation ponds and newlyconstructed reed-bed ponds.
The reed-bed ponds were built in 1998 as the result of a three-year study by a UCDavis doctoral candidate. The reed beds are a natural filtration technique for dealingwith wastewater effluent from winery facilities. This technique includes diverting thewastewater from the winery into a series of three ponds covering two acres. Theseponds include different biological and mechanical components such as reed beds, graveland sand filters to purify the waste. In fact, the systems is effective enough to returnrecycled water to the vineyards as a water source. Also, low energy aeration takes placewith sprinklers instead of more energy-intensive equipment.
Input Costs/Yields of Organic Vineyards
Tom Piper believes that the total cost to maintain and operate an organic vineyard isroughly the same as that of a conventional vineyard; it is just the cost allocations thatdiffer. For example, Fetzer’s only fungicide cost is sulfur. Sulfur is inexpensive but Fetzermust purchase more of it than a vineyard that uses other fungicides. Fetzer applies upto 100 lbs. of sulfur per acre annually. Additionally, they must dust with the sulfur ona 10-day cycle while other vineyards can go for 14 days or more between dustings ofsynthetic fungicides. Compost is another input that is greater on an organic farm. Ul-
89
timately, Piper believes that these costs are offset by the costs incurred by other vine-yards for synthetic herbicides, pesticides, and fertilizers. Our vineyard survey of ap-proximately 107 vineyards in the Napa, Sonoma, and Santa Barbara wine grape-grow-ing regions yielded an average annual budget of non-sulfur pesticides to be about $4000.This translates roughly into $36 an acre for the average-size vineyard in these winegrape-growing regions. Also, the survey noted an average annual pounds per acre useof fertilizer is 350 for these same vineyards. These are costs that a purely organic farmdoes not incur.
An additional example is the case of John Williams, part owner of Frog’s Leap Wineryin Napa Valley, who admits that there are drawbacks to organic farming but believesin the long run they are outweighed by the benefits. First there is the so-called “ramp-up” period of three to five years before a farmer gains the full benefit of organic farm-ing. During that period, the farmer must recognize the particular needs of the vineyardand quickly adapt, initially, the costs may be greater. After two or three years of highercosts, maintenance drops, and the lack of any need for chemicals (some of which areexpensive) keeps costs low.
There are other costs associated with Organic Certification. A farm seeking to convertfrom conventional methods to organic methods must consider the cost of farm equip-ment acquisition, fees for certification, and the added costs of self-monitoring. Pipersuggests that when compared to conventional methods, organic farmers must spendmuch more time in the vineyard, looking for potential problems. Most farmers willhave to purchase machinery such as a compost spreader that can be expensive butcosts will vary widely depending on the size of the machinery. Additionally, the farmermust pay fees for certification by a third-party certifier such as the California CertifiedOrganic Farmers (CCOF). Fetzer pays approximately $2,500 to certify its 770 acresannually. Piper argues that this cost is probably offset by the cost a conventional farmermust pay for chemical certification, training, and disposal.
Fetzer is in a somewhat unique position because they do not sell their grapes but usethem all for wine production. They also buy additional grapes if necessary so any lossfrom their respective vineyard is more easily absorbed than if they relied solely on thesale of their grapes as some vineyards do. However, Fetzer has not experienced a lossof grape yield as a result of becoming organic.
Challenges of Cultivating an Organic Vineyard
The greatest challenges about being organic for Fetzer are control of Spider Mites, Pierce’sDisease, and Powdery Mildew. Piper says that Spider Mites tend to be attracted to vinesthat are under stress, such as in exceedingly hot summers. Spider Mites are very smallinsects that attack the leaves of the vine. Pierce’s Disease is a bacterium that affects thewhole vine and the fruit, usually killing the plant one year after symptoms can be ob-
90
served. The disease can be spread via xylem feeding insects such as leafhoppers andspittlebugs. Powdery Mildew attacks the leaf surface, absorbing nutrients. Wind, leaf-wetness, relative humidity, light, and temperature all affect the mildew’s ability to de-stroy the plant.
Fetzer has not had a devastating infestation of any of the pests mentioned above sinceconverting to organic practices over ten years ago. Their organic techniques have beensuccessful at combating these and other problems in the vineyard. Fetzer’s manage-ment does not feel they have suffered a greater loss of fruit than a conventionally farmedvineyard in the region. It is worth noting that these problems are very location specificand differ from vineyard to vineyard.
A final challenge that plagues the organic farmer is control of under-the-vine weeds.Since they do not use herbicides and mechanical weed abatement is dangerous to thevines, organic farmers must often manually hoe the weeds nearest the roots and baseof the vine. Piper estimates that this costs Fetzer about $150/acre added to a $15-20/acre under vine cultivation cost (tilling the rows between vines).
Lifespan of Organic Vineyards
One of the physical benefits of an organic vineyard that farmers, including Tom Piper,tout is an extended lifespan of the vines. While there are no definitive studies to sup-port it, most organic farmers agree that vines treated with chemicals are weakenedand don’t build up their internal defense mechanisms to fight pests and viruses. Pipersuggests that 25 years is a very good economic lifespan for a vine. After the lifespanhas run out, vineyards must be replanted with new, certified virus-free vines, from thetraditional varieties developed in Europe.
Both Fetzer president Paul Dolan and Frog’s Leap owner John Williams say that or-ganic farming may lengthen the life of vineyards infected with the tiny root lousephylloxera, which is destroying thousands of acres of northern California vineyard3.There appears to be some validity to this theory as evidenced by Williams’ purchase ofa 30-acre block of land that had phylloxera and is now doing very well.
A study conducted by Don Lotter and his colleagues, Professor Jeffrey Granett and Dr.Amir Omer in the Department of Entomology at UC Davis, have found that organicfarming techniques might actually protect vineyards against phylloxera and eventualroot-rot (Lotter et al. 1998).
3 In 1996, about 10 percent of Napa Valley’s 36,000 acres of vines were torn out and replaced because ofthe tiny root louse.

91
Lotter and his colleagues studied several organic and conventionally farmed, phyllox-era-infested vineyards in the California wine country for two years. The scientists com-pared the two farming practices for various measures such as amounts of organic matterand nitrogen in the soil, presence and extent of root-rot, and levels of phylloxera in-festation in the roots. Earlier experiments in controlled vineyards demonstrated thatroots grown in soils of organically managed vineyards have significantly less root rot(30.3%) than that of conventionally managed soils (54.5%). Although phylloxera popu-lations in organic soils tended to be greater, they were inversely correlated with rootrot.
Field experiments sampled phylloxera-resistant roots in nine conventional and fourorganic vineyards to assess phylloxera populations and root damage. The study showedsimilar trends, root-rot in organically managed vineyards was 9.0% compared to 30.1%for the conventionally managed vineyards. But unlike the greenhouse experiment, phyl-loxera numbers were similar in the soil of the organically managed vineyards. Pestpopulations did not differ between the vineyards and there were no striking or consis-tent differences in soil quality, organic content, or levels of fungi, harmful or benefi-cial. All of the vineyards showing favorable results were using compost in combina-tion with winter cover crops. This could suggest that organic methods somehow alle-viate the side effects of phylloxera feeding and subsequent root-rot. Lotter and hiscolleagues also suggest that organic methods might trigger in the vines a sort of immu-nity to infection known as “induced resistance”. In other plants, such as cucumbers,compost can have this effect. Conversely, the herbicide, Roundup, commonly used inconventional farming, has been shown to suppress induced resistance.
Organic Perception
When asked about the perception of Fetzer’s organic conversion among other vine-yards, Piper confessed that early in the 1990’s there was a belief in the industry thatFetzer was being critical of other vineyards. That is generally not the case today. Thissentiment could resurface, however, if Fetzer begins to aggressively market the organicaspect of their wines. Perhaps more importantly, marketing some of their wines asmade from organically grown grapes may raise an issue with wine products that arenot organic.
Environmental Business Practices
In 1992, Fetzer created the Bonterra wine label for their wine produced from 100%organically grown grapes. In 1997, Bonterra accounted for 4% of Fetzer’s wine saleswith 120,000 cases. Managing Director Paul Dolan states that Fetzer is not an organiccompany. They engage in these sustainable business practices because they simplyfeel that it is “the right thing to do”. They do not actively market their organic aspectbecause they believe that there is little market incentive to do so. Dolan notes that

92
Bonterra wines are made from 100% certified organically grown grapes. These wineshave seen a 25% increase domestically and 100% increase in export sales in the lastyear, despite the fact that the better-known Fetzer name does not appear on its label.Dolan attributes this increase specifically to the quality of the Bonterra wines and notso much to the environmental sensitivity of the wine. Dolan also says that the productawareness of Fetzer wines among the general public is only about 30%. Ultimately,Dolan feels that the organic side of their wines is not a beneficial point of differentia-tion. He does believe, however, that there is a trend in the industry toward organic orat least “sustainable” types of farming.
Recycling
Environmental sensitivity extends beyond the vineyards at Fetzer and into virtually ev-ery aspect of the company. They have established a company-wide recycling centerthat recycles bottles, plastic, aluminum, fax and computer paper, antifreeze, 70 tons ofcardboard, 740 gallons of waste oil, 392 cubic yards of wooden pallets, and 10,000cases of glass per year. These items are then sold to local recyclers. By doing so, theyhave been able to save thousands of dollars in disposal fees and have reduced theamount of material hauled to landfills by 93% since 1991 eliminating the dumping of1,580 cubic yards of landfill.
Wine Barrels
Fetzer has engaged in a rigorous maintenance program for its wine barrels and hasbecome the first winery in the United States to operate an in-house barrel restorationprogram. This helps extend the life of their wine barrels resulting in decreased costs toreplace barrels, minimizing the impact of barrel making on oak forests in America andFrance, and reducing the amount of landfill waste from worn-out wine barrels.
Energy Consumption
Working with Pacific Gas & Electric, Fetzer has designed and built a simple, insulatedconcrete wall to separate cold stabilizing wine from warm-fermenting wine resultingin an electric bill reduction of $5,000 per month. Additionally, the barrel room, whichstores 47,000 wine barrels, was built into a hillside and the walls were covered with adirt berm. This keeps the room at a constant 65º F without the use of air conditioners.Fetzer is also a member of the ClimateWise program under the US Environmental Pro-tection Agency. This program, similar to the EPA’s WasteWise program, is a collabora-tion between the federal government and industry to turn energy efficiency and in-creased environmental performance into a company asset. This is done by establish-ing energy-reduction goals in the form of an “Action Plan” developed in conjunctionwith the technical assistance from the ClimateWise program. The program does offer

93
some financial assistance to meet goals, tracking software for monitoring environmen-tal performance, as well as case studies of companies who have successfully reducedtheir energy consumption.
Club Bonterra
Fetzer also began a program called Club Bonterra designed to show other interestedvineyards how to become organic; but, the program became too burdensome on thecompany. The original intent of the club was to serve as an example or a template ofhow Fetzer became organic; however, it became too proprietary for Fetzer and wascancelled.
Administration Building
In 1996, Fetzer built a 10,000-ft2 administration building on the grounds at Hopland.The innovative building design incorporates 18” thick walls constructed out of rammedearth mined from the building site. The roof is made from recycled steel and woodand the interior doors and wooden beams are from a recycled 1920’s PG&E buildingformerly located in San Francisco. The building is cooled not by a conventional airconditioning unit but by water-cooled air from the winery. When this is not sufficient,the system is backed up by a glycol-cooled system from the winery. Additionally, acomputer automatically controls vents in the roof that open at night to allow cool, freshair in, while motion sensors in the rooms turn lights on and off. The Green BuildingCouncil concluded that the new building is up to 46% more energy efficient than acomparably sized building. This is based on the percentage the new building exceedscurrent building codes for energy consumption. The building cost approximately $148/ft2, which falls within the range of $110-250/ft2 that a comparably sized building withconventional materials might cost.
Business Program - E3 Team
In 1998, Fetzer initiated a company-wide business program that established a triplebottom line for all projects and processes at Fetzer. Known as the E3 program, thisanalysis technique requires that the Economic, Equity, and Environmental impact ofexisting and future programs and proposals be evaluated and included in final busi-ness decisions. To do this, Fetzer has established an E3 Team with subcommitteesappointed to assess various aspects of the company such as energy consumption, waterusage, and waste reduction with respect to the 3 E’s. After their evaluation, the com-mittees make recommendations concerning what courses of action should be pursued.

94
Future Efforts
Fetzer is currently undertaking tests in conjunction with researchers from the Univer-sity of California to evaluate mowing, mulching, organic herbicides, and other tech-niques to control under-the-vine weed control. They are also attempting different cul-tural practices and alternative insecticide materials to control mite populations, espe-cially in the hot, dry years. Finally, alternatives to elemental sulfur application in thevineyard are sought in an attempt to establish a better rapport with Fetzer’s non-farmoriented neighbors.
In other areas of the company, Fetzer is actively looking to reduce its energy con-sumption, water usage, and waste production. Through the E3 Team, they hope toachieve a 25% reduction in energy usage, a 30% reduction in water usage, and zerowaste production by 2009. Patrick Healy, responsible for Fetzer’s recycling, packag-ing, and other environmental programs, believes that this last goal of zero waste mightbe overly ambitious as it has become more difficult to achieve reductions in wasteproduction in the past few years. Additionally, the company is currently pursuing ISO14001 certification, the environmental component of the ISO standards.
Conclusion
Fetzer has been able to successfully employ organic techniques in its vineyards andwinery. They have been maintained as organic for more than ten years and have postedprofits every year. They believe that Fetzer serves as an example of a profitable, mid-sized business that has converted from conventional farming methods to organic meth-ods and been just as competitive in the wine industry as conventional vineyards.
President Paul Dolan explains that Fetzer has had some support from their parent cor-poration, Brown-Forman. Ultimately, however, Dolan feels that if he was not able tomake Fetzer profitable during their conversion and adoption of organic practices, theparent company may not have been as supportive.
Fetzer has gone beyond organic practices in its attempt to become more environmen-tally sensitive. It has invested time and capital into other areas of its business, such assolar-energy cells, the company-wide recycling program, and the wastewater effluentreed-bed technology, in order to enhance Fetzer’s environmental aspects. At the sametime, they have not actively market their environmental sensitivity because they donot believe that it is beneficial to do so in the wine industry. Moreover, Fetzer feelsthere might be a negative backlash from other, conventional vineyards if they were todifferentiate themselves within the industry in this manner. It is for this reason thatFetzer created the Bonterra label to produce its wine from organically grown grapesand does not place the Fetzer name on its label.

95
It should be noted that Fetzer’s corporate culture is very conducive to the implemen-tation of environmentally sensitive business practices. Essentially, the environmentalpush is from “top-down” within the company and is spearheaded by individuals witha strong influence such as Fetzer’s president, Paul Dolan. While it is not impossible toalter a company’s environmental aspect from a “bottom-up” perspective, Paul Dolan,Tom Piper, Jill Jepson and Patrick Healy all agree that it is significantly more difficultand would definitely influence the degree of success in achieving environmental goals.
The Fetzer Case Study is just one example of a vineyard and winery that has been ableto convert from conventional practices to organic practices while maintaining marketshare and profits. There are other success stories (such as Frog’s Leap Winery, ButowVineyards, and Hainle Vineyards) that have also been profitable as organic vineyardsand wineries. They all share a common ideal that companies in the wine industry canbe prosperous while minimizing their impact on the environment and creating a moresustainable business.

96
9. Conclusion
This California Winemaking Impact Assessment explored the environmental and so-cioeconomic effects of winemaking in California. Winemakers and vineyard managerswere surveyed in three counties: Napa, Sonoma, and Santa Barbara; these three coun-ties represent a significant portion of California’s prime wine production districts. Pre-viously published literature and data from these test counties was compiled and ana-lyzed in order to determine the effect of the wine industry on the state’s economy andenvironment, to detail differences between organic and traditional viticulture, and toassess the effect of information about environmental impacts upon consumers’ winepurchasing decisions. These assessments were made through the use of indicators ofsocioeconomic and environmental impact, which are summarized in Table 9.1. Tosummarize the results of this Assessment, the questions this project addressed are dis-cussed as follows.
A) What does the California economy gain from vineyards and winemaking?
The wine industry is an important contributor to the state’s economy, and it is an inte-gral piece of California’s agriculture industry. Grapes are the second most valuablecommodity in California, and in 1998 wine grapes had a value of approximately $1.8billion dollars (NASS 1999). The full economic impact of wine on the state economytotaled $33 billion in 1998 (MKF, 2000) representing about 3% of California’s gross stateproduct (EDD, 1999). Wine grapes are now cultivated on more than 400,000 acres andemploy more than 145,000 people. In the last ten years, the number of acres underwine grape cultivation has grown by more than 30%. In light of the rapid growth ofthe industry, it is likely that its contribution to the state economy will continue to in-crease.
B) What is the effect of the wine industry on the state’s environment?
While residents around the state clearly recognize benefits the wine industry brings totheir communities, there is growing concern regarding the environmental impacts ofthe industry. As the number and area of vineyards continues to expand, communities,agency staff, and elected officials have increasingly expressed concern regarding theuse of agricultural pesticides. The overuse of agricultural pesticides impacts air, waterand soil quality. The wine grape cultivation industry used over 34 million pounds ofpesticides in 1998. Sulfur was the most widely used chemical, comprising 86% of totalpesticide use. Sulfur is utilized as a fungicide, and its use in 1998 was 69.7 pounds peracre (CDPR, NASS). However, sulfur is generally considered a low impact chemical.However, highly toxic materials, including methyl bromide, are still widely used by

97
Table 9.1. Summary table of indicator statistics.
FACTOR 1999 Source
Land useAcres under winegrape cultivation 427,282* Wine InstituteAcres certified organic 5,139 CCOF 2000Total Acres using at least one IPM technique 83% CWIA
Water QualityPercentage of vineyards using cover crops for erosion control 73% CWIAPercent of vineyards on >10% slopes (Sonoma County) 25% MerenlenderPercent of vineyards using drip irrigation 81% CWIAAir QualityNumber of pesticides listed as TACs 9* DPR
InputsGross pesticide application rate without Sulfur 10.9 lbs/A* CDPR, NASSSulfur per acre 69.7 lbs/A* CDPR, NASS
SocioeconomicTotal industry employment 145,000* MKF 2000Tourist visits 11million *
Marketing/Consumer perceptionConsumers who have bought organic wine 20% CWIAConsumers vineyard’s environmental record would influence purchasing decision 53% CWIA
Wine productionNumber of wineries 847* MKF 2000Wine distributed on the internet 2% CWIAWine distributed through liquor distributors 22% CWIAWine distributed through direct winery sales 24% CWIAWineries that purchase at least 5% organic grapes 12% CWIABonded Wineries 1,185* Wine Institute
*1998

98
the industry. These toxic chemicals have been shown to have severe health and envi-ronmental impacts. Although pesticides used on wine grapes pose serious environ-mental risks, other agricultural commodities, such as strawberries, use greater quanti-ties of toxic pesticides per acre and likely present a greater environmental and humanhealth hazard.
Fertilizer inputs are another aspect of grape cultivation that may affect environmentalquality. Numerous studies have shown that the heavy use of inorganic fertilizers canlead to surface and groundwater contamination. However, fertilizer is generally notoverused in premium wine grape cultivation, as there is an inverse relationship be-tween yield and grape quality. In actuality, most vineyards grow wine grapes underwater and nutrient deficient conditions.
Organic agriculture relies on nutrients applied through use of non-synthetic fertilizerssuch as compost or pomace, while non-organic farmers have the additional option ofutilizing synthetic fertilizers. Production of synthetic nitrogen fertilizer is a very en-ergy-intensive process, but it is a relatively inexpensive input since it is produced inmassive quantities. Conversely, compost prepared locally or on-site uses less energyand more labor per unit of nitrogen delivered to the plant. However, survey resultsindicate that CCOF certified and traditional vineyards use about the same mass of fer-tilizer per year, implying organic vineyards receive less nutrient input than their tradi-tional counterparts. Survey results further revealed that 61% of non-organically certi-fied vineyards’ fertilizer needs come from synthetic fertilizers, while only 4% of thevineyards with certified organic acreage use synthetic fertilizers. Alternatively, 83% ofthe organically certified vineyards’ fertilizer needs come from compost or other organicfertilizers, while only 29% of the conventional vineyards’ fertilizer budget is suppliedby compost. However, the impact of fertilizers used by the wine industry upon waterresources is a topic in need of further study.
In some counties, such as Sonoma, new vineyards are being built on steeper slopesthan they were in the past. Cultivating grapes on steeper slopes is likely to increasesoil erosion. Recently, several counties have established regulations regarding futurevineyard development. Sonoma, Napa, and Santa Barbara County regulations seek torestrict new vineyard development on steep slopes to diminish these impacts. It is likelythat more regulations regarding vineyard development will be enacted due to increasedpublic awareness of this issue.
C) What are the significant differences between organic and conventional viticulture,if any?
While in 1988 there were no certified organic vineyards in California, today there aremore than 5,000 acres of certified organic vineyards (CCOF 2000). As this trend sug-gests, growing concern with pesticide usage has produced an expanding market for

99
organic products. The exact definition of organic wine is, however, complicated. On afederal level, the term “organic” refers to food produced according to the Federal Or-ganic Foods Production Act of 1990 (OFPA), while California has the California Or-ganic Foods Act of 1990 (COFA). Since federal standards for organic farming and foodprocessing are currently undergoing revision and review, COFA remains the applicablelegislation in California.
COFA delegates the power of organic certification to third parties, who often have theirown regulations in addition to the COFA and OFPA. The state’s largest third-party or-ganic certification organization, California Certified Organic Farmers (CCOF), providesa series of detailed restrictions for organic growers, which include prohibition of anysynthetic additions to plants or soil. In addition, all fertilization and pest managementagents must originate from 100% naturally occurring substances. When the CCOF stan-dards are applied to vineyards, “organic” means that there has been no application ofsynthetic pesticides, herbicides, and fungicides to the plants for at least three yearsprior to harvesting. Since CCOF is the primary third party certification organization forwine grapes in California, the CWIA has chosen to use CCOF terminology when refer-ring to organically grown grapes.
To evaluate the differences between the Organic and Traditional Vineyards the CWIAdeveloped a Vineyard Survey. The Survey targeted vineyard managers in Santa Bar-bara, Napa, and Sonoma counties and all vineyards certified organic by the CaliforniaCertified Organic Farmers. The Vineyard Survey confirmed Organic vineyards use lesssynthetic fertilizer and non-sulfur pesticide, but did not demonstrate a difference insulfur application. Despite nearly equivalent drip irrigation usage, Traditional vineyardsmay use more water than their Organic counterparts, though the distributions of waterusage for the two groups overlap. Contrary to expectations, organic wine grapes mayfetch a small premium, and there is little difference in the size of Organic and Tradi-tional vineyards. Total seasonal employment per unit of vineyard is similar for bothgroups, but Traditional vineyards tend to pay more, and Traditional vineyards hire morepermanent employees at all wage scales.
An alternative to organic growing methods is integrated pest management (IPM). IPMis an agricultural pest management system that encourages the monitoring and controlof pests – weeds, fungi, and insects – with minimal use of pesticides. Examples ofspecific techniques employed by IPM practitioners include removal of vine leaves toreduce disease, and the use of cover crops that are hosts to beneficial insects. Manygrowers around the state use IPM techniques; in fact, more than 83% of surveyed vine-yards used one or more IPM techniques. Integrated Pest Management techniques anddrip irrigation are widely used by Organic and Traditional vineyards alike. IPM doesnot abrogate the use of pesticides, but the goal is minimization of its use through tar-geted application. Organic growers, on the other hand, depend almost entirely uponcareful monitoring, sulfur application, and IPM techniques to control pests, though there

100
are a small number of “organic” pesticides allowed by CCOF/COFA standards. Whilestrict definitions exist for organic grape cultivation, there is currently no certificationsystem for IPM implementation and there are no caps on the quantity of non-sulfurpesticide that an IPM adherent can apply.
The Lodi-Woodbridge Winegrape Commission (LWWC) is a large scale example of IPMimplementation. In conjunction with the University of California Sustainable Agricul-ture Research and Education Program, LWWC growers are encouraged to implementnot only IPM practices, but a more complete management system known as the Bio-logically Integrated Farming System (BIFS). The LWWC’s BIFS program consists of threecomponents: grower outreach, field implementation, and evaluation. The LWWC Inte-grated Farming Program is planning to expand to the entire district, which includes650 growers and about 70,000 acres. If successful, the BIFS program could ultimatelyimpact the entire industry. As IPM techniques are already extensively employed, it islikely that many other growers throughout the state will begin to adopt integrated farmingpractices as well.
Though the term organic has a strict regulatory definition, the meaning of the term“organic wine” is more difficult to determine. Current National Organic Standards Board(NOSB) rules state that organic products can contain no added sulfites. As thewinemaking process is very difficult in the absence of sulfite additions, very little winemeets proposed NOSB standards for organic production. Currently, the NOSB is con-sidering modification to its rules, which would allow winemakers to use some formsof sulfites in the bottling process. However, as the definition of organic wine is stillunder contention and “Organic Wine” per se does not exist under U.S. law, we choseto limit our examination to wine made entirely from grapes that are organically grownor “Wine from Organically Grown Grapes” (WOGG).
To evaluate industry trends in employment, water use, and wastewater generation, andto follow organically grown grapes to the next stage in the life cycle of wine, the CWIAdeveloped the Winery Survey. The Survey was a direct mail survey sent to winemakersin Santa Barbara, Napa, and Sonoma counties and all wineries operating vineyardscertified organic by the California Certified Organic Farmers. The results from the WinerySurvey were divided into two groups: one included all wineries who rated environ-mental impacts “Very Important” or “Important”, while the second group was com-prised of wineries who rated environmental impacts “Somewhat Important”, or “NotImportant”. The groups were referred to as “More Sensitive”, and “Less Sensitive”.
The Survey indicated most wineries obtain their water from private wells and disposeof their wastewater in septic tanks. Neither More Sensitive nor Less Sensitive wineriesconsistently reported realistic estimates for total water use or wastewater flow, imply-ing that they may rely on outdated estimates of these parameters in their productionprocesses.

101
The Survey further suggested that More Sensitive wineries buy significantly more or-ganic grapes, and they also make more of their wines exclusively from organically growngrapes. However, the majority of More Sensitive wineries who make WOGG do nothighlight the use of organic grapes on their labels. Wines produced by More Sensitivewineries generally earned higher retail prices, perhaps implying greater overall grapequality. Though the survey data do not indicate any overall difference in the distribu-tion channels employed by More Sensitive and Less Sensitive wineries, More Sensitivewineries did report that their WOGG requires different distribution channels than otherwines. Total wine production is dominated by a few wineries, but the majority of win-eries are relatively small, suggesting the market has room for many niche wine mak-ers.
Fetzer Vineyard is an example of a business that utilizes both traditional and organictechniques. It grows certified organic grapes, and produces several varietals of winemade exclusively from organic grapes. As an example of a business that utilizes bothtraditional and organic techniques, Fetzer demonstrates that organic viticulture can besuccessfully practiced at a large scale. The company has managed organic vineyardssuccessfully for more than 10 years. Although their management is committed to envi-ronmental sensitivity, if Fetzer had not been profitable during their conversion andadoption of organic practices, their corporate parent probably would not have allowedthem to continue cultivating the majority of their vineyards organically.
Fetzer is one example of a vineyard and winery that has converted from traditional toorganic practices while maintaining market share and profits. There are other successstories of profitable organic vineyards and wineries. Their success proves that winer-ies can be profitable while actively striving to minimize their impact on the environ-ment and attempting to create a sustainable business.
D) Do consumers care about environmental impacts related to wine, and would theirchoices be affected by additional information?
As part of the consumer analysis, the CWIA undertook a survey of consumer opinions.The Consumer Survey was designed to determine whether consumers take environ-mental impact into consideration when deciding which bottle of wine to buy, andwhether the importance of environmental impacts in wine purchase decisions wouldbe affected if a greater quantity of relevant information was available. Consumers wereinterviewed at a variety of locations in Santa Barbara County.
The results of the Consumer Survey show that WOGG probably represents a smallpart of the Santa Barbara wine market. The rate of WOGG purchase among surveyedconsumers is however, similar to the rate of WOGG production among surveyed win-eries. Previous tasting of a wine was most frequently cited as the most important factorin wine buying. Moreover, the majority of wine consumers who have tried WOGG

102
rated it favorably, and nearly one third of the people surveyed who have tried WOGGbuy it regularly. Consequently, WOGG producers who do not label their wine as “winefrom organically grown grapes” may be failing to capitalize on an opportunity to ex-pand their sales and lock-in repeat customers.
Recommendations
This section details specific recommendations for research and action, to better de-velop our understanding of the impacts identified in the previous section, and, in somecases, to attempt to mitigate them.
Industry
• To facilitate conscientious resource use, wineries should initiate a voluntaryprogram of monitoring water use and wastewater generation. Quantification ofwater flows is the first step in developing effective water conservation strate-gies and a set of Best Management Practices for management of winery waterrequirements.
• In order to both reduce costs associated with non-sulfur pesticides and mini-mize environmental risks associated with handling and application of toxicmaterials, vineyard managers should increase the application of IntegratedPest Management techniques. Intensification of monitoring of pest and benefi-cial insect populations is desirable, along with monitoring for conditions fa-vorable to undesirable biota. Monitoring is the cornerstone of adaptive man-agement, allowing targeted application of pesticides and appropriate manipu-lation of cover crops and the physical environment to enhance habitat for de-sired biota and diminish pest habitat.
• Winemakers who produce wines from organically grown grapes should in-form customers that they are selling WOGG, preferably by including the infor-mation on wine labels. Survey results indicate that clearly identifying winemade from organic grapes as WOGG would confer an advantage in marketingwines to environmentally conscious consumers.
Consumers
• At present, concerned consumers should examine wine labels for one or moreof three indicators of environmental sensitivity: the term “wine made from or-ganically grown grapes”, direct claims of environmental awareness, and theCalifornia Certified Organic Farmers symbol. However, consumers should alsobe aware that these indicators are far from perfect. Many wines made from or-ganic grapes do not include the CCOF logo or other indications they are or-ganic on their labels. Further, though adherence to organic standards doesprovide some assurance of reduced impacts due to pesticide and fertilizer use,

103
organic standards do not mandate minimization of other inputs such as water,energy, and land use, which also affect the environment. Thus, organic certifi-cation is not necessarily an indicator of overall sustainability, since organicstandards only affect a limited set of winery environmental impacts. Lastly,consumers should be aware that labels claiming environmental awareness donot necessarily have a significant connection to actual vineyard and winerymanagement practices.
Regulators
• The USDA should finalize and implement federal organic standards authorizedunder the Federal Organic Foods Act of 1990. Interested vineyard managersmay not pursue organic certification due to uncertainty about the details offederal organic standards or their implementation.
• Congress and the USDA should work together to send consumers a simple,clear message about whether wine is “organic” or not. There are currently twoterms which apply to wine, “wine from organic grapes”, and “organic wine”,which have slightly different meanings. For the sake of clarity, a single termshould be selected. Since the process of wine production, from fermentationto bottling, involves very few inputs other than grapes, the term “organicwine” is essentially equivalent to “wine from organic grapes, with minimaladded sulfites.” Since the use of sulfur as a fungicide is unrestricted in or-ganic viticulture, and sulfur applied prior to harvest is one of the sources of“natural” sulfites in wine, there is no clear rationale for imposing restrictionson sulfite additions in organic winemaking (Grapes are not washed prior tocrushing).
Sulfite allergies do pose a health risk for some consumers, but organic standards arean attempt to minimize the use of “synthetic” materials, and they do not purport tocompletely address health risks. If organic standards were in fact based upon healthrisks, it would be arguable whether a product whose active ingredient is ethyl alcoholshould be considered “organic.” Rather than incorporating the sulfite issue into organicproduction standards for wine, Congress and the USDA should address sulfite contentseparately. One relatively simple solution would be to mandate the inclusion of sulfitecontent on wine labels. Since consumers are unlikely to know the precise relationshipbetween sulfite content and health risk, labels should include a simplified scale basedupon assessments of sulfite risk. Rather than including potentially misleading quanti-tative data (such as “This wine contains 32 ppm sulfites”), a simple, qualitative mes-sage should be developed. Much as other food products denote their fat content withterms such as “lowfat”, and “nonfat”, sulfite contents below the threshold for allergicreaction in sensitive individuals should be labeled “Low sulfite wine”. Wines with sulfitelevels at or near the limits of inexpensive analytical techniques could be labeled “sulfitefree”. Wines with sulfite contents that fall within the range of negligible risk to indi-

104
viduals who are do not have sulfite allergies should be labeled “Moderate sulfite wine”.This information could be included in an unobtrusive space on wine labels, replacingthe nearly meaningless phrase, “contains sulfites”.
In the absence of the sulfite issue, it would be relatively easy to select a single term forwine that is organic. Since the term “organic wine” currently implies low sulfite con-tent to many consumers, we suggest the adoption of the label “wine from organicgrapes”. This single term should minimize confusion on the part of the consumer whiledistancing wines from organic grapes from the question of sulfite content. USDA shouldtherefore approve the continued use of the term “wine from organic grapes”.
• The California legislature should consider regulating vineyard development onsteep slopes statewide, using Sonoma County as a model. New vineyardsplaced on a slope greater than a specific threshold, such as 10%, should re-quire erosion management plans, protecting topsoil and reducing stress onCalifornia’s waterways caused by heavy sediment loading due to soil erosion.To avoid such regulation, the wine industry could and should discontinue thepractice of planting vineyards on steep slopes.
• The California Air Resources Board should increase its efforts to monitor airquality impacts due to application of pesticides that are known to be toxic.Air quality monitoring data is crucial to determining whether a given pesticideshould be listed as a Toxic Air Contaminant and identifying whether stepsmust be taken to minimize its impacts. However, as of 1998, only 16 ofCalifornia’s 58 counties had initiated monitoring programs (Ross and Kaplan,1998.)
• The state legislature, in partnership with concerned winemakers and Univer-sity of California enologists and agricultural extension researchers, should de-velop an “Environmentally Sensitive” or “Sustainable” label for wine by creat-ing a certification program that includes requirements for grape growing andwine processing which encompass a wider array of factors than current or-ganic standards, while simultaneously setting more readily achievable certifica-tion standards for fertilizer and pesticide use. Reductions in application of syn-thetic fertilizer and non-sulfur pesticides should be encouraged, particularlythrough the promotion of Biologically Integrated Farming Systems. However,the per-acre use of these materials on wine grapes is relatively modest incomparison with other crops, implying that reduction of other impacts mayyield greater environmental benefits, at the margin. The Environmentally Sen-sitive label could based upon Biologically Intensive Farming System vineyardmanagement techniques, with standards for agrochemical usage that could beattained by a wider array of vineyards than current organic standards. Envi-

105
ronmentally Preferable standards should include monitoring of a wide varietyof factors, including pests, beneficial insect populations, soil water and nutri-ent levels, and vineyard and winery water use. Such standards should furtherinclude erosion management by excluding vineyards developed on steepslopes and requiring the use of cover crops and they should place reasonable,achievable caps on application of non-sulfur pesticides and synthetic fertiliz-ers.
Recommendations for Future Research
• Methyl bromide is currently being phased out, forcing growers are switchingto alternative chemicals for their nematacide requirements. Some of these al-ternatives may be as harmful as methyl bromide (Telone, for example). Addi-tional research should be initiated immediately to ensure that the environmen-tal impacts of these substitutes are actually less than the impact of methyl bro-mide itself.
• Quantify the difference in nutrient input between traditional and organic vine-yards. Determine whether the difference is a result of nitrogen input from le-guminous cover crops, loss due to phenomena such as denitrification andsorption onto clays or organic matter, or due to undesirable processes such aserosion and groundwater leeching.
• Develop a comprehensive set of Life-Cycle Assessments to quantitatively com-pare the difference between traditional methods and other management prac-tices such as organic viticulture and Biologically Integrated Farming.
• Our Consumer Survey yielded a number of interesting results which could po-tentially be valuable to winemakers. However, the number of people surveyedwas relatively small, limiting the assurance we can have that our results are infact representative of consumers in general. Our Consumer Survey could beused by other researchers as a pilot study. Additional surveys are necessary todefinitively prove that people who have tasted wines made from organicgrapes generally like them and many of them purchase it regularly, or thatmost consumers do not consider environmental impacts very important whenthey buy a bottle of wine, but the majority would place greater emphasis onenvironmental considerations if more information was readily available. Fur-ther research examining how consumers value the “wine made from organicgrapes” label in other states and in international markets could also be benefi-cial.
• Further research should determine whether long term application of elementalsulfur to vineyards has any significant environmental effects (other than reduc-tions in pest populations.)

106
• A key limitation of this study was that available data did not provide sufficientevidence for the endorsement of a management strategy as both environmen-tally preferable and cost-effective. Perhaps the most valuable research thatcould be done would be a long-term controlled study of the differences incost and environmental impact of organic, traditional, and IPM vineyard man-agement strategies. In fact, researchers from Fresno State University are cur-rently conducting just such a study (Mayse and Striegler, 1997). Conventional,biologically-intensive, and organic vineyard practices have been applied tocarefully monitored plots for the past three years. This research team seeks tocomparatively evaluate the relative strengths and limitations of these three sys-tems of viticulture. Though the study has been underway for several years, noresults have been released to date.

107
Appendix A. References
American Journal of Enology and Viticulture (1997), Vol 48, No. 2., 1997.
American Vintners Association, The National Association of American Wineries,www.americanwineries.org.
Ash, John (1999), “Some thoughts about organic farming,” The Washington Times, June 9,1999.
Associated Press (2000), “Winery sues New York over ban on Internet wine sales,”www.cnn.com/2000/food/news/02/04/internet.wine.ap/index.html, 2000.
Balzer, Lawrence (1984), The Los Angeles Times Book of California Wines, New York: HarryN. Abrams, Inc. 1984.
Baum, M. M. a. M. C. C.-V. (1997), “Developing and testing an international environmentalrating system for vineyards and wineries,” American Journal of Enology andViticulture, 48(2): 249, 1997.
Bay Area First! (2000), Tourism and Wineries Page, www.bayareafirst.org/infra/tourism.cfmlast visited 2/25/2000.
Benitez, J. F., J. Beltran-Heredia, J. L. Acero, and M. L. Pinilla (1997), “Simultaneousphotodegradation and ozonation plus UV radiation of phenolic acids — Major pollut-ants in agro-industrial wastewaters,” Journal of Chemical Technology and Biotechnol-ogy, 70: 253-260, 1997.
Berger, Dan (1996), “Wineries turn to growing techniques that allow them to reduce use ofchemicals,” Minneapolis Star Tribune, July 24, 1996.
Bertani, Elizabeth (1996), “California leads in organic wines,” Natural Food MerchandiserOnline, www.nfm-online.com/nfm_backs/Apr_96/food_focus.html, last visited 2/23/2000, April 1996.
Bugg, R. L., G. McGourty, M. Sarrantonio, W. T. Lanini, and R. Bartolucci (1996), “Compari-son of 32 cover crops in an organic vineyard on the north coast of California,” Biologi-cal Agriculture and Horticulture, 13: 63-81, 1996.
Butzke, C. (1999), University of California Extension Enologist, UC Davis, personal commu-nication, November 8, 1999.
Cabras, P., A. Angioni, V. L. Garau, E. V. Minelli, M. Melis, and F. M. Pirisi (1997), “Pesticidesin the distilled spirits of wine and its byproducts,” Journal of Agricultural Food Chemi-cals, 45: 2248-2251, 1997.

108
California Air Toxics Program (1999), www.arb.ca.gov/toxics/toxics.htm, last visited 12/8/1999.
California Air Toxics Program (1999), www.arb.ca.gov/toxics/id.htm, last visited 12/8/1999.
California Coastal Commission (2000), “Urban Management Measures” ceres.ca.gov/coastalcomm/nps/npsmmr/cammprur.pdf. 2000.
California Department of Pesticide Regulation Home Page (1999), www.cdpr.ca.gov/ lastvisited 12/8/1999.
California Tourism Research, California Division of Tourism, www.gocalif.ca.gov/research/tlkngpts.html.
Californians for Alternatives to Toxics (2000), “Wine Grape Report,” www.reninet.com, lastvisited 02/21/2000.
Californians for Pesticide Reform (CPR) (1999), www.igc.org/cpr/ last visited 12/6/1999.
CDFA (1999), “California grape acreage increases to highest level since 1984,” California De-partment of Agriculture, 1999.
CASS (2000), “Final Grape Crush Report 1999 Crop,” California Agricultural Statistics Service,105 pages, 2000.
Climate Wise Homepage (2000), United States Environmental Protection Agency,www.epa.gov/climatewise last visited 3/7/2000.
Community Indicators Handbook (1997), Tyler Norris Associates, Redefining Progress, Sus-tainable Seattle, 1997.
“County Population Projections with Age, Sex and Race-Ethnic Detail, California” (2000),California Department of Finance Homepage, www.dof.ca.gov/html/Demograp/projca.pdf last visited 2/28/2000.
Couzin, J. (2000), “Uncorking the electronic wine business,” Cable News Network,www.cnn.com/2000/TECH/computing/03/03/electronic.wines.idg/index.html March 3,2000.
Cox, Billy, and Susan McAvoy (2000), “Glickman announces new proposal for national or-ganic standards,” National Organic Standards Board Online, News Release No.0074.00, Mar 7, 2000 www.usda.gov/news/releases/2000/03/0074.
Davis Enterprise, The, February 14, 1999.
Department of Pesticide Regulation, “Pesticide use report, annual 1998, indexed by com-modity (preliminary data)” (1999), State of California Environmental ProtectionAgency, 1999.

109
De Villers, Marc (1994), “The heartbreak grape: a California winemakers search for the per-fect pinot noir,” HarperCollins West, 1994.
Dolan, Paul (2000), Managing Director, Fetzer Vineyards, personal interview, February 1,2000.
Dunne, Thomas (2000), Professor of Geomorphology & Hydrology, University of California,Santa Barbara, personal communication, March 2000.
Edwards, I. R., Ferry, D. G. and Temple, W. A. (1991), “Fungicides & related compounds,”Handbook of Pesticide Toxicology, Hayes, W. J. and Laws, E. R., Eds. Academic Press,New York, NY, 1991.
Employment Development Department, www.edd.cahwnet.gov.
Figiel, Richard (1994), “Vintners take the pledge,” Sierra, November 1, 1994.
Fluck, R.C. (1992), “Energy in Farm Production,” Energy in World Agriculture, Elsevier, NewYork, Vol. 6, pp.177-201. 1992.
Frey Vineyards (1999), Frey Vineyards Home Page, Frey Vineyards, www.freywine.com,last visited 11/8/1999.
Fried, Rona (1999), “Fetzer does it all,” Sustainable Business Online, December 1999.www.sustainablebusiness.com/html/insider/dec99/fetzer.cfm, last visited 2/28/2000.
Fulmer, M. (2000), “USDA sets new rules for organic foods,” Los Angeles Times, p. C1, March8, 2000.
Geraci, Victor (1997), “Grape Growing to Vintibusiness: A History of the Santa Barbara, Cali-fornia, Regional Wine Industry 1965 to 1995,” Dissertation at UCSB, 1997.
Gomberg, Fredrickson & Associates (1999), “The Wine Industry’s Economic Contribution toSanta Barbara County: 1998 Survey Update,” June 1999.
Gomberg, Fredrickson & Associates (2001), “2000 Annual Wine Industry Review,” Volume20, Number12, February 28, 2001.
Hainle Vineyards(1995), “Organic Viticulture,” www.hainle.com/soft.html, last visited 1/12/00.
Healy, Patrick (2000), Environmental Issues, Fetzer Vineyards, personal interview, February1, 2000.
Higgens, Michael (1999), Central Coast Regional Water Quality Control Board, State of Cali-fornia personal communication, December 5, 1999.
Hill, Nathon; DiDomenico, Nicole (1998), “Fruit of the vine, a surging organic industry deliv-ers natural wine,” Organic Wine E., V9 a5, 1998.

110
Hirschfelt, D., W. Peacock, and P. Christensen (1992), “The effects of cover crops on grape-vine nutrition and growth,” www.sarep.ucdavis.edu/ccrop/ccres/22.HTM, last modi-fied, 12/28/1998.
Hofmann, U. J. (1997), “Comparative studies on organic and conventional/integrated crop-ping systems,” American Journal of Enology and Viticulture, 48(2): 249, 1997.
Hoover’s Online (1999) “The Business Network, Beverages - Bottlers & Wholesale Distribu-tors,” 1999, www.hoovers.com/industry/description/0,2205,3375,00.html.
Huskes, R. and K. Levson (1997), “Pesticides in rain,” Chemosphere 35(12): 3013-3024,1997.
Jackish, P. (1985), Modern Winemaking, Cornell University Press, 1985.
Jackson, D. I., and P. B. Lombard (1993), “Environmental and management practices affect-ing grape composition and wine quality — A review.” American Journal of Enologyand Viticulture, 44(4): 409-430, 1993.
Jepson, Jill (2000), E3 Team Director, Fetzer Vineyards, personal interview, February 1, 2000.
Kegley, Susan, L. Neumeister, and T. Martin (1999), “Disrupting the Balance: Ecological Im-pacts of Pesticides in California,” Californians for Pesticide Reform, Pesticide ActionNetwork, 1999.
Kidd, H. and James, D. R., Eds (1991), The Agrochemicals Handbook, Third Edition. RoyalSociety of Chemistry Information Services, Cambridge, UK, 1991.
Klonsky, K., L. Tourte, et al. (1999), “Sample costs to produce organic wine grapes in thenorth coast with resident vegetation,” Davis, CA, University of California SustainableAgriculture Research and Education Program: 21 pp. 1999.
Lauriente, D.H. (1998), Nitrogen Industry Overview, SRI Consulting, Inc. 353 pages.
Long, Z. R. (1981), “White table wine production in California’s North Coast Region,” 1981.
Lotter, Don, Granett, J., A. D. Omer, P. Pesserau, and M. A. Walker (1998), “Fungal infec-tions of grapevine roots in phylloxera-infested vineyards,” UC Davis Dept. of Entomol-ogy, 1998. www.dcn.davis.ca.us:/~dwlotter/research.html, last visited 2/10/2000,entomology.ucdavis.edu/faculty/granett/lotter.htm, last visited 2/10/ 2000.
Lund-Hoie,K., and H.O. Friestad. (1986), “Photodegradation of the herbicide glyphosate inwater,” Bulletin of Environmental Contaminants and Toxicology, 36:723-729, 1986.
Martini, L. P. (1981), “Red Wine Production the Coastal Counties of California 1960-1980,Wine Production Technology in the United States,” a symposium sponsored by the Di-vision of Industrial and Engineering Chemistry at the Second Chemical Congress of theNorth American Continent, 180th ACS National Meeting, Las Vegas, Nevada, August 26,1980, Maynard A. Amerine, editor, Washington, D.C., American Chemical Society, 145:59-84, 1981.

111
May, Thomas Garvey (1999), “Time is ripe for organic wine,” Natural Foods MerchandiserOnline, October 1999.
Mayse, M.A., and R. K. Striegler (1997), “Optimal viticulture systems comparison,”Viticulture and Enology Research Center Research Note, www.atinet.org/cati/verc/rese/97/970402/, March 14, 2000.
Meister, R.T. (1994), Farm Chemicals Handbook 1994. Meister Publishing Company.Willoughby, OH.
Merenlender, Adina (1999), “A spatially explicit vineyard expansion model: addressing cropproduction, public policy, and environmental concerns,” University of California Sus-tainable Agriculture Research and Education Program, Final Report, September 1999.www.sarep.ucdavis.edu/grants/Reports/Merenlender/merenlender96-47.htm.
Merrick, Jennifer, Joshua Phillips, and Cathryn Wild (1999), Valley Oak Restoration Site Suit-ability in the Los Alamos Valley, Santa Barbara County, California, Donald Bren Schoolof Environmental Science and Management, Unpublished, June, 1999.
Miller, P.R., Graves, W.L., Williams, W.A., and Madson, B.A. (1989), “Covercrops for Califor-nia Agriculture,” University of California Division of Agriculture and Natural Resources,Oakland, California, Leaflet 21471, 24 pp. 1989.
Motto, Kryla & Fisher (2000), “Economic Impact of California Wine,” St. Helena, CA, January2000.
Mullins, Michael (1992), Biology of the Grapevine, Cambridge University Press, Cambridge,1992.
National Agricultural Statistics Service (1998), County Agricultural Commissioner’s Data,1998. www.nass.usda.gov/ca/bul/agcom/indexcm.htm.
Natural Resources Conservation Service Home Page, United States Department of Agricul-ture, www.nhq.nrcs.usda.gov last visited 2/2/2000.
Newlands, B. (2000), “Internet may turn wine stores into Web masters,” Cable News Net-work, 2000.
Norberg, Bob (1999), “Fetzer goes solar: winery unveils largest solar-electric system on thenorth coast,” The Press Democrat, June 25, 1999.
OGWA (1999), “Standards for wines produced from organically grown grapes,”www.isgnet.com/ogwa/standards.htm, last visited 10/5/1999.
Organic Wine Company Home Page (2000), ecowine.com/organic.htm last visited 1/20/2000.
Pesticide Action Network North America (PANNA) (1999), www.panna.org/ last visited 12/2/1999.

112
Pesticide Information Profiles (1999), ace.ace.orst.edu/info/extoxnet/pips/ghindex.html lastvisited 12/3/1999.
“Pesticide Use Report, Annual 1998” (1999), www.cdpr.ca.gov/docs/pur/pur98rep/98_pur.htm last visited 12/5/1999.
Pinney, Thomas (1989), A History of Wine in America: From the Beginnings to Prohibition,Los Angeles: University of California Press, 1989.
Piper, Tom (2000), Director of Vineyard Operations, Fetzer Vineyards, personal interview,February 1, 2000.
Porter, Christy (1999), “California wineries take major steps to improve vineyards” BioCycle,January 1999.
Press Democrat (1999), Spreading Vines, - A Changing Landscape, “Growers, regulators saychemical risks low,” www.pressdemo.com/vineyards/2chemicals.html, last visited 12/1/1999.
—. (1999), Spreading Vines, - A Changing Landscape, “Staking Out Regulations,”www.pressdemo.com/vineyards/3laws.html, last visited 12/10/1999.
—. (1999), Spreading Vines, - A Changing Landscape, ‘The Press Democrat Poll on the WineIndustry,” www.pressdemo.com/vineyards/poll/poll.html, last visited 12/10/1999.
Programs, U. O. O. P. (1999), “Assessing health risks from pesticides,” US EPA, 1999.
Proposed Update to the Toxic Air Contaminant List (1999), www.arb.ca.gov/toxics/tac/up-date98/update98.htm, last visited 12/8/1999.
Rachman, Gideon (1999), “The Globe in a Glass,” The Economist, Dec. 18, 1999.
Reuters (2000), “Internet may turn wine stores into Web masters,” Cable News Network,2000.
Reregistration Eligibility Decision (RED) document (1998), “1,3-Dichloropropene,” Environ-mental Protection Agency, Fact Sheet #EPA-738-F-98-014, December, 1998.
Reregistration Eligibility Decision (RED) document (1996), “Cryolite,” Environmental Protec-tion Agency, Fact Sheet #EPA-738-F-96-016, August, 1996.
Revised Proposed Rule (2000), National Organic Standards Board, National Organic Stan-dards Revised Proposed Rule, Mar 7, 2000. www.ams.usda.gov/nop/.
Ross, Zev and J. Kaplan (1998), “Poisoning the Air: Airborne Pesticides in California,” Cali-fornians for Pesticide Reform, Pesticide Action Network, 1998.
Santa Barbara News Press, The, May 19, 1999.

113
SAREP (2000), Highlights of BIFS Projects: Lodi-Woodbridge Winegrape Commission’s“Winegrape BIFS,” Sustainable Agriculture Research and Education Program, 2000.www.sarep.ucdavis.edu/bifs/highlights.htm.
SAREP (1999), “Progress Report on the Biologically Integrated Farming System (BIFS) Pro-gram: January 1997 - December 1998,” Sustainable Agriculture Research and EducationProgram, Division of Agriculture and Natural Resources, University of California. Janu-ary 1999.
Sawyer, Abby (1997), “Whether red, white or rose, wine is going green,” Wine BusinessMonthly, October 1997.
Sawyer, Abby, and Jim Hammett (1998), “American Appellations Earn Distinction as a Mar-keting Tool: Growers and Vintners Weigh Merits of Tying Appellation to Varietal,”Wine Business Monthly, June 1998. www.smartwine.com.
Skofis, E. (1981), “Production of Table Wines in the Interior Valley. Wine Production Tech-nology in the United States,” a symposium sponsored by the Division of Industrial andEngineering Chemistry at the Second Chemical Congress of the North American Conti-nent, 180th ACS National Meeting, Las Vegas, Nevada, August 26, 1980, Maynard A.Amerine, editor, Washington, D.C, American Chemical Society, 145: 123-142, 1981.
SPSS for Windows 9.0 (1998), “Online Help Reference: Definition of Standard Error of theMean,” Statistical Package for Social Sciences, Inc. 1998.
Stein, R.G. and J.H. White (1993), “Aerial movement and deposition of diazinon,chlorpyrifos and ethyl parathion,” Department of Pesticide Regulation, Sacramento,CA, 1993.
Steindorf, Sara (1999), “Leaders in ethical business” The Christian Science Monitor, Novem-ber 29, 1999.
Sustainable Agriculture Research and Education Program (SAREP), University of California,www.sarep.ucdavis.edu, last visited 03/05/2000.
Toxic Air Contaminant Evaluations (1999), www.cdpr.ca.gov/docs/empm/pubs/tacmenu.htm, last visited 12/8/1999.
U.C. Cooperative Extension (1992), “Sample Costs to Produce Organic Wine Grapes in theNorth Coast with Annually Sown Cover Crops,” 1992. www.sarep.ucdavis.edu/pubs/costs/92/grape1.htm.
—. (1992), “Sample Costs to Produce Organic Wine Grapes in the North Coast with Resi-dent Vegetation,” 1992. www.sarep.ucdavis.edu/pubs/costs/92/grape2.htm.
—. (1994), “Sample Costs to Establish a Vineyard and Produce Wine Grapes: CabernetSauvignon Variety and Drip Irrigated in the Lodi Appellation of Sacramento and SanJoaquin Counties,” 1994.

114
—. (1996), “Sample Costs to Establish a Vineyard and Produce Wine Grapes: Zinfandel Va-riety on a 5 acre planting in the Sierra Nevada Foothills,” 1996.
—. (1996), “Sample Costs to Establish a Vineyard and Produce Wine Grapes: Zinfandel Va-riety on a 28 acre planting in the Sierra Nevada Foothills,” 1996.
—. (1996), “Sample Costs to Establish a Vineyard and Produce Wine Grapes: Drip IrrigatedChardonnay Variety Santa Maria Valley, Santa Barbara County,” 1996.
—. (1996), “Sample Costs to Establish a Vineyard and Produce Wine Grapes: Drip IrrigatedCabernet Sauvignon Variety Paso Robles Region San Luis Obispo County,” 1996.
—. (1997), “Sample Costs to Establish a Vineyard and Produce Wine Grapes: San JoaquinValley,” 1997.
—. (1998), “Sample Costs to Establish a Vineyard and Produce Wine Grapes: SauvignonBlanc: Lake County,” 1998.
University of California, Davis, Pest Managements Guidelines, IPM Online Page (2000),www.ipm.ucdavis.edu.
Unknown (1999), “Grapes Aren’t the Only Thing Growing in the Vineyard: Salaries on theRise,” Wine Business Monthly, October 1999, www.smartwine.com.
—. (1999), “Green Harvest: Fetzer vineyards becomes world’s first wine producer to pur-chase 100% renewable-source power mix,” Business Wire, September 13, 1999.
—. (1991), “Harvest of Change,” National Geographic. NA: 52-73, 1999.
USDA (1999), “National Organic Program proposed rule,” United States Department of Agri-culture, 1999.
USDA (1997), California Agricultural Statistic Service, California Grape Acreage Report,1997.
USDA (1998), California Agricultural Statistic Service, Final Crush Report, 1998.
“USDA plans organic food standards”(2000), The Associated Press, New York Times APOnline, March 8, 2000. www.nytimes.com/aponline/w/AP-Organic-Food.html.
U.S. Environmental Protection Agency (1991), “Reregistration Eligibility Document Facts:Sulfur,” US EPA, Pesticides and Toxic Substances, Washington, DC. May 1991.
U.S. Environmental Protection Agency (2000), Pesticide Fact Sheets, www.epa.gov/pesti-cides/factsheets, last updated 2/15/2000.
Vergari, D., and R. B. Boulton (1993), “A survey and analysis of the factors affecting produc-tion costs, pricing, and sales in small California wineries,” American Journal of Enol-ogy and Viticulture, 44(3): 342, 1998.

115
Wagner, P. M. (1976), Grapes into Wine, New York, Alfred Knopf, 1976.
Wahl, K. a. K. P. H. (1997), “Effects of different pruning lengths, fruit-thinning, and soil man-agement on the vegetative and generative production as well as on wine quality,”American Journal of Enology and Viticulture, 48(2): 254, 1997.
Wample, Robert et al. (2000), “Grapevine Irrigation Management: Considerations for WaterUsage” Wine Business Monthly, February 2000, www.smartwine.com.
Wauchope, R. D., Buttler, T. M., Hornsby, A. G., Augustijn Beckers, P. W. M. and Burt, J. P.,(1992), SCS/ARS/CES Pesticide properties database for environmental decisionmaking.Rev. Environ. Contam. Toxicol. 123: 1-157, 1992.
Wert, Mark (1994), “Organic Wines” Gannett News Service. June 7, 1994.
Wilhoit, Larry, D. Supkoff, J. Steggall, A. Braun, C. Goodman, B. Hobza, B. Todd, M. Lee(1998), “An Analysis of Pesticide Use in California, 1991 - 1995,” Department of Pesti-cide Regulation and California Department of Food and Agriculture, Sacramento, Cali-fornia, 1998. www.cdpr.ca.gov/docs/dprdocs/puranal.htm, last visited 11/23/1999.
Wine Institute (1999), “U. S. House passes 21st Amendment Enforcement Act: Federal actiondoes not deter Wine Institute work at state level,” August 5, 1999,www.wineinstitute.org/shipwine/current_events/hr2031_update.htm.
“Wine Production Technology in the United States,” a symposium sponsored by the Divisionof Industrial and Engineering Chemistry at the Second Chemical Congress of the NorthAmerican Continent, 180th ACS National Meeting, Las Vegas, Nevada, August 26, 1980,Maynard A. Amerine, editor, Washington, D.C., American Chemical Society, 145: 29-58.
Winkler, A.J. (1974), General Viticulture, University of California Press, Berkeley, CA, 1974.
Woese, K., D. Lange, C. Boess, and K. W. Bogl (1997), “A comparison of organically andconventionally grown foods — Results of a review of the relevant literature,” Journalof Science, Food, and Agriculture, 74: 281-293, 1997.
Woody, T. (1999), Online Wine Sales Turn to Grapes of Wrath. Industry Standard http://www.idg.net. April 9, 1999.
Zabik, J.M. and J.N. Seiber (1993), “Atmospheric transport of organophosphate pesticidesfrom California’s Central Valley to the Sierra Valley to the Sierra Nevada Mountains,”Journal of Environmental Quality, 22: 80-90, 1993.

116
Dear X:
You are invited to participate in a study examining the innovative methods ofviticulture and winemaking practiced by California vintners. This research is beingconducted by the California Wine Project (CWP) team from the Donald Bren Schoolof Environmental Science & Management at the University of California, Santa Bar-bara. Please complete the enclosed survey; the most valuable information we gatherwill come directly from experienced members of the wine community.
The CWP survey is designed to collect information relating to traditional and or-ganic grape growing and winemaking practices in California. The survey is dividedinto two separate questionnaires: a Vineyard Survey, which applies to grape cultiva-tion, and a Winemaking Survey, which is directed at the wine production process.Please fill out both sections of the survey if your operation includes both a vineyardand a winery.
The information you provide is confidential; the results of the survey will be re-ported only as aggregate statistics. While it may not be necessary to answer all ofthe questions within a section, please provide as much information as possible andreturn the survey using the enclosed self-addressed, stamped envelope by Decem-ber 10, 1999.
We appreciate your participation. Your responses will ensure that the winemakingcommunity is accurately represented in our report, which will be completed inApril, 2000. If your winery is interested in further information about our researchand its results, please contact Adam Baughman at (805) 983-7198 or via email,[email protected]. We would be delighted to provide you with a copy ofour report; if you are interested, please check the box at the end of the survey.Thank you for your time and expertise.
Sincerely,
Adam Baughman
Survey Coordinator
California Wine Project
Appendix B. Industry SurveysCover Letter
117
Vineyard Survey
(If your company does not manage a vineyard, please skip this section.)Company: County:Name: Title:
1) What is the total planted acreage of the vineyards you manage?_________________________ acres
2) When did the vineyard first commercially produce grapes?_________________________
3) How many tons of grapes did the vineyard yield for 1998?_________________________ tons
4) How many tons of grapes did the vineyard yield for 1999?_________________________ tons
5) What is your average selling price per ton of grapes?_________________________ $/ton (If you do not sell any grapes, please skip)
6) On what percentage of the vineyard do you use the following integrated pestmanagement techniques?______ % Cover crop encouraged or planted in vine row middles______ % Winter cover crop maintained for erosion control______ % Cover crop chosen as an effective habitat for beneficial insects______ % Deterring growth of plants which are host to problematic insects______ % Removing leaves in the fruit zone to reduce disease, pests, or improvewine quality
7) On average, how many pounds of sulfur do you annually apply per acre?______ 0-10 lbs/acre ______ 10-100 lbs/acre ______ >100 lbs/acre
8) Approximately how much fertilizer is applied annually?_________________________ lbs/acre
9) What is your annual budget for pesticides other than sulfur?_________________________ $/year

118
10) What percentage of the vineyard’s fertilizer needs come from each of thesources listed at the right?______ % Synthetic fertilizer______ % Compost or direct application of winery waste (leaves, pomace, etc.)______ % Other(Please specify)
11) What methods do you employ to harvest your grapes?______ % Harvested by hand______ % By mechanical harvester
12) How many acres of your vineyards are organic, as specified by the 1990 Cali-fornia Organic Foods Act?______ acres (If the answer is zero, skip to Question 15)
13) How many acres of the vineyards you manage have been certified organic byan independent certification agency, such as the California Certified Organic Farm-ers?
__ ___ acres (If the answer is not zero, skip to Question 15)
14) If you use organic viticultural practices, but have not been certified by an inde-pendent certification agency such as California Certified Organic Farmers, pleaserate the following criteria in terms of their importance in the decision not to pursuecertification. For each factor, place a check in the box which best signifies its im-portance in making the decision.Deciding factors against certification Very important Important Somewhat important Not impor-tantRestrictions are too tightExpense of certificationLittle financial benefitLocal conditions require pesticide useSlow certification processOther: (Please specify)
15) What is the source of water for the vineyard?______ Private well ______ Private reservoir ______ Municipal water supply______ State water project
16) How much water is required annually for irrigation? _______ acre-feet
17) What type of irrigation system do you use?

119
______ Sprinklers ______ Drip Irrigation ______ Other
18) How many people does the vineyard employ in each of the following catego-ries?Seasonal:______ $5-10/hour ______ $11-20/hour ______ More than $20/hr.Permanent: ______ Less than $30 k/year ______ $31-$50 k/year ______ More than $51k/year
If you are interested in receiving a copy of the project results, please note youremail address (or fax/phone number if you do not have email):______________________________________________________________________________________If you are interested in further contact or participation in the study, please checkhere:
Winery Survey
(If your company does not operate a winery, please skip this section.)
Company: County: ____________________Name: Title: _____________________
1) When did your winery first commercially produce wine?_________________________
2) What is the average annual case production of the winery?_________________________ cases
3) What was the winery’s case production for 1998?_________________________ cases
How many tons of grapes did this require?_________________________ tons
4) What is your projected output, in cases, for 1999?_________________________ cases
5) What percentage of your wines fall into each of the following retail priceranges?______ % Less than $3 per bottle______ % $3-$7 per bottle______ % $7-$14 per bottle

120
______ % $14-20 per bottle______ % More than $20 per bottle
6) What percentage of the grapes used in 1998 did you purchase from offsitegrowers? _________________________ %
7) What percentage of the grapes purchased in 1998 were organically grown?_________________________ %
8) Please rate the importance of the following factors in your grape purchasingdecisions. For each factor, place a check in the box which best signifies its impor-tance in making the decision. Very important Important Somewhat important Not importantGrape qualityPriceGrowing regionVarietyEnvironmental impactOther: (Please specify)
10) What is the source of water for the winery?________ Private well ________ Private reservoir ________ Municipal water supply________ California Water Project
11) Approximately how much water do you require per year to operate the win-ery? (Please include all uses.) _____________________ gallons/year
12) What is your average wastewater flow (in gallons) per month? _______ Avg. gal./month
What is your peak flow (in gallons per day)?________ Peak gallons/day
13) How is your winery wastewater treated? ________ Evaporation ponds ________ Septic system & leach field ________ Aerated pond ________ Municipal treatment plant ________ Filtration and activated carbon ________ Other: ___________________

121
14) How many people does the winery employ in each of the following categories?Seasonal:______ $5-10/hour ______ $11-20/hour ______ More than $20/hr.
Permanent:______ Less than $30 k/year ______ $31-$50 k/year ______ More than $51 k/year
15) What percentage of your wine is distributed through each of the followingchannels?______ % Wine-exclusive distributors ______ % Liquor distributors ______ % Direct sales at winery ______ % Direct sales to local merchants ______ % Internet sales ______ % Other (Please specify)
16) What percentage of your wines are produced exclusively from organicallygrown grapes? _________________________ % (If zero, please skip the next twoquestions)
17) Do your wines from organically grown grapes require different distributionchannels than other wines? ________ Yes ________ No
18) Are your wines from organically grown grapes labeled as wine crafted from or-ganically grown grapes? If not, why?________ Yes ________ No Why?
If you are interested in receiving a copy of the project results, please note youremail address (or fax/phone number if you do not have email):__________________________________________________________________If you are interested in further contact or participation in the study, please checkhere:

122
Appendix C. Consumer SurveyHow many bottles of wine do you buy in an average month?1 – 2 3 – 5 5 – 10 10-15 >15
How much, on average, do you usually spend on a bottle of wine?0 - $7 $8 – 13 $14 – 20 >$20
How important are the following factors in your decision to purchase abottle of wine?
Factors affecting purchaseVery important Important Somewhat important Not important
PriceSatisfaction in tasting(s) prior to purchaseRating by wine criticsVarietal (Merlot, Cabernet, Zinfandel)Name brandLabel designEnvironmental sensitivity of the winery
If more information easily available about the environmental sensitivity ofwinemakers, how important would that be in your purchasing decision?
More information, easily available:
Which of these factors is most important in your purchasing decision?
Please rate your opinion of the quality following types of wine, if you havetried them:
Very good Good Somewhat good Not good Haven’t triedSulfite-free wineWine from organically grown grapesBiodynamic wine
Have you ever bought a bottle of wine because it was organic? YesNo
(If yes) How many bottles of organic wine do you buy per month?0 1 – 2 3 – 5 5 – 10 10-15 >15
Is the respondent Male or Female? (Circle) Estimated age: <39 >40

123
Appendix D. Survey Responses
Vineyard SurveyVineyard Planted Acreage
Group Mean Standard ErrorAll Vineyards 141.7 24.8Vineyards without CCOF certified organic acreage 133.0 29.0Vineyards with some CCOF certified organic acreage 160.3 57.3Certified Acreage 92.1 33.7
First Year of Commercial Production
Group Mean Standard ErrorAll Vineyards 1965 3.5Vineyards without CCOF certified organic acreage 1966 4.6Vineyards with some CCOF certified organic acreage 1962 6.2
Yield Per Acre, 1998
Group Mean Standard ErrorAll Vineyards 2.5 0.2Vineyards without CCOF certified organic acreage 2.4 0.2Vineyards with some CCOF certified organic acreage 2.9 0.5
Yield Per Acre, 1999
Group Mean Standard ErrorAll Vineyards 2.4 0.1Vineyards without CCOF certified organic acreage 2.4 0.2Vineyards with some CCOF certified organic acreage 2.4 0.3
Average Selling Price Per Ton of Wine Grapes
Group Mean Standard ErrorAll Vineyards $1,975 $85Vineyards without CCOF certified organic acreage $2,056 $112Vineyards with some CCOF certified organic acreage $1,868 $136
Cover Crops: Vine Row Middles
Group Mean Standard ErrorAll Vineyards 69% 4%Vineyards without CCOF certified organic acreage 69% 5%Vineyards with some CCOF certified organic acreage 70% 9%

124
Cover Crops: Winter Erosion Control
Group Mean Standard ErrorAll Vineyards 73% 4%Vineyards without CCOF certified organic acreage 71% 6%Vineyards with some CCOF certified organic acreage 74% 9%
Cover Crops: Promoting Beneficial Insects
Group Mean Standard ErrorAll Vineyards 44% 5%Vineyards without CCOF certified organic acreage 36% 6%Vineyards with some CCOF certified organic acreage 62% 10%
Deterrence of Problematic Insect Hosting Plants
Group Mean Standard ErrorAll Vineyards 38% 5%Vineyards without CCOF certified organic acreage 42% 6%Vineyards with some CCOF certified organic acreage 33% 9%
Leaf Removal
Group Mean Standard ErrorAll Vineyards 69% 4%Vineyards without CCOF certified organic acreage 72% 5%Vineyards with some CCOF certified organic acreage 63% 9%
Mass of Sulfur Applied Per Acre Per Year, in Pounds
The number of vineyards in each group whose annual sulfur application rate fitsinto the indicated categories.
0-10 lbs 10-100 lbs >100 lbsAll Vineyards 22 51 4No CCOF certified acreage 13 38 3Some CCOF certified acreage 9 13 1
Annual Non-Sulfur Pesticide Budget (per acre)
Group Mean Standard ErrorAll Vineyards $36 $9.7Vineyards without CCOF certified organic acreage $55.1 $14.5Vineyards with some CCOF certified organic acreage $1.7 $1.5
Mass of Fertilizer Applied Per Acre Per Year, in Pounds
Group Mean Standard ErrorAll Vineyards 350 120Vineyards without CCOF certified organic acreage 337 155Vineyards with some CCOF certified organic acreage 399 215

125
Percentage of Fertilizer Needs Met by Synthetic Fertilizer
Group Mean Standard ErrorAll Vineyards 43% 5%Vineyards without CCOF certified organic acreage 61% 6%Vineyards with some CCOF certified organic acreage 4% 4%
Percentage of Fertilizer Needs Met by Compost
Group Mean Standard ErrorAll Vineyards 36% 4%Vineyards without CCOF certified organic acreage 29% 5%Vineyards with some CCOF certified organic acreage 49% 9%
Percentage of Fertilizer Needs Met by Other Fertilizers
Group Mean Standard ErrorAll Vineyards 14% 3%Vineyards without CCOF certified organic acreage 6% 2%Vineyards with some CCOF certified organic acreage 34% 8%
Prevalence of Manual Grape Harvesting
Group Mean Standard ErrorAll Vineyards 96% 1%Vineyards without CCOF certified organic acreage 95% 2%Vineyards with some CCOF certified organic acreage 97% 3%
Prevalence of Mechanical Grape Harvesting
Group Mean Standard ErrorAll Vineyards 4% 1%Vineyards without CCOF certified organic acreage 5% 2%Vineyards with some CCOF certified organic acreage 3% 3%
Mean Acreage Cultivated in Accord with 1990 California Organic Foods Act.
Group Mean Standard ErrorVineyards without CCOF certified organic acreage 1 -Vineyards with some CCOF certified organic acreage 101 34
Acres Certified Organic By California Certified Organic Farmers
Group Mean Standard ErrorVineyards without CCOF certified organic acreage 0 -Vineyards with some CCOF certified organic acreage 92 34
Frequency of Use of Selected Water Sources
Group Private Private Municipal Other, orWell Reservoir Water Supply combination
All Vineyards 53 3 5 23No CCOF certified acres 39 1 2 15Some CCOF cert. acres 10 2 3 6

126
Annual water requirements for irrigation, in acre-feet per acre
Group Mean Standard ErrorAll Vineyards 0.5 0.2Vineyards without CCOF certified organic acreage 0.6 0.4Vineyards with some CCOF certified organic acreage 0.3 0.2
Frequency of Use of Selected Irrigation Systems
Group Sprinklers Drip Irrigation CombinationAll Vineyards 1 62 12No CCOF certified acreage 0 47 9Some CCOF certified acreage 1 15 3
Vineyard Employees Per 100 Acres of Planted Acreage
Employee class Traditional OrganicMean Standard Error Mean Standard Error
Seasonal$5-10/hour 14.3 2.9 25.0 7.5$11-20/hour 11.9 5.4 2.5 1.0>$20/hour 0 - 0.5 0.5
Permanent<$30 k/year 5.4 0.8 2.3 1.1$31-50 k/year 1.6 0.4 0.6 0.2>$51k/year 0.1 0.1 0.03 0.02

127
Winery SurveySurvey Response Rates, by County
County SurveysVineyard Survey Winery Survey Total ResponseDistributed Respondents Respondents Respondents Rate
Napa 211 33 38 41 19%Sonoma 183 33 33 37 20%Santa Barbara 59 10 15 17 29%Other 90 10 5 12 13%Total 543 86 91 107 20%
Wine production volume, in thousands of cases
Group Average 1999 (Projected) 1998Mean S.E. Mean S.E. Mean S.E.
All wineries 165 79 184 89 182 95More Sensitive 137 94 147 99 138 93Less Sensitive 280 183 321 211 313 225
First year of commercial production
Group Mean Standard ErrorAll wineries 1977 3Very important/ Important 1983 3Somewhat important/ Not important 1967 7
Cases per ton of grapes fermented, 1998
Group Mean Standard ErrorAll wineries 62.6 1.2Very important/ Important 63.6 2.4Somewhat important/ Not important 63.0 1.2
Breakdown of retail price of wine produced (All wineries)
Retail Price All Very Important Somewhat orWineries Important Not important
Mean S.E. Mean S.E. Mean S.E.$3-7/bottle 2% 1% 3% 2% 2% 2%$7-14/bottle 14% 3% 9% 3% 20% 5%$14-20/bottle 30% 3% 29% 5% 30% 6%>$20 55% 4% 61% 6% 48% 7%
Rated importance grape purchasing factors
Factor Very Somewhat NotImportant Important Important Important
Grape quality 76 2Variety of grape 71 7Growing region 56 21Price 16 30 22 9Environmental impact 13 28 25 9
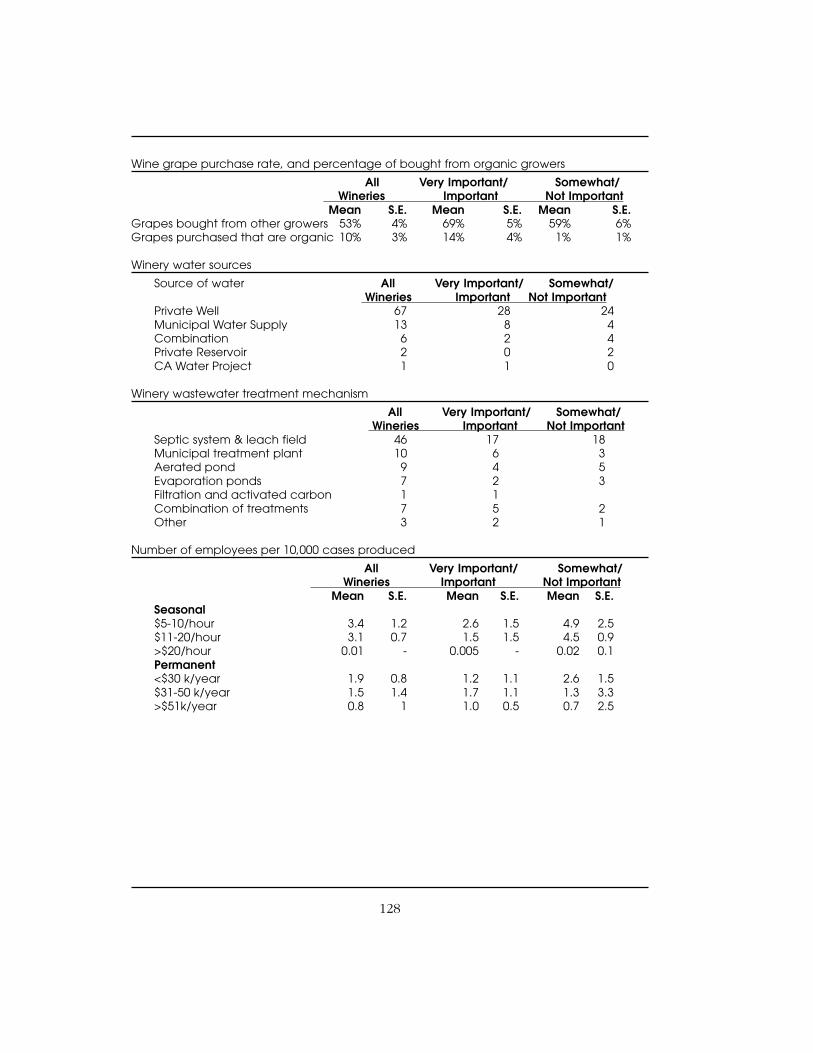
128
Wine grape purchase rate, and percentage of bought from organic growers
All Very Important/ Somewhat/ Wineries Important Not Important
Mean S.E. Mean S.E. Mean S.E.Grapes bought from other growers 53% 4% 69% 5% 59% 6%Grapes purchased that are organic 10% 3% 14% 4% 1% 1%
Winery water sources
Source of water All Very Important/ Somewhat/ Wineries Important Not ImportantPrivate Well 67 28 24Municipal Water Supply 13 8 4Combination 6 2 4Private Reservoir 2 0 2CA Water Project 1 1 0
Winery wastewater treatment mechanism
All Very Important/ Somewhat/ Wineries Important Not ImportantSeptic system & leach field 46 17 18Municipal treatment plant 10 6 3Aerated pond 9 4 5Evaporation ponds 7 2 3Filtration and activated carbon 1 1Combination of treatments 7 5 2Other 3 2 1
Number of employees per 10,000 cases produced
All Very Important/ Somewhat/ Wineries Important Not Important
Mean S.E. Mean S.E. Mean S.E.Seasonal$5-10/hour 3.4 1.2 2.6 1.5 4.9 2.5$11-20/hour 3.1 0.7 1.5 1.5 4.5 0.9>$20/hour 0.01 - 0.005 - 0.02 0.1Permanent<$30 k/year 1.9 0.8 1.2 1.1 2.6 1.5$31-50 k/year 1.5 1.4 1.7 1.1 1.3 3.3>$51k/year 0.8 1 1.0 0.5 0.7 2.5

129
Breakdown of distribution channels
All Very Important/ Somewhat/ Wineries Important Not Important
Mean S.E. Mean S.E. Mean S.E.Wine-exclusive distributors 41% 4% 45% 6% 41% 6%Liquor distributors 22% 4% 20% 5% 24% 7%Winery sales 24% 3% 22% 4% 21% 5%Local merchants 12% 5% 19% 11% 6% 2%Internet sales 2% 1% 2% 1% 1% 1%Other 4% 2% 2% 1% 8% 4%
Do your wines from organically grown grapes require different distribution channels?
Response FrequencyYes 14No 3
When you make wine exclusively from organically grown grapes, do you note it on thelabel?
Response FrequencyYes 11No 5
Percentage of wine produced solely from organically grown grapes
Group Mean Standard ErrorTotal 12.6% 3.5%Very Important/ Important 12.2% 4.6%Somewhat or Not Important 0.3% 0.2%

130
Appendix E. Current OrganicStandards
Summary of the federal Organic Foods Production Act of1990
To be sold and labeled as a organically produced agricultural product, the Act
• prohibits the use of synthetic chemicals in the production and handling of theagricultural product.
• requires that the land on which it is produced has had no application of pro-hibited substances including synthetic chemicals during the three years priorto the harvest of the product.
• requires that the product be handled in compliance with an organic planagreed upon by the producer, handler and the certifying body.
• requires that all organic agricultural product be produced on certified organicfarms using organically certified handling techniques.
• these farms must be certified annually with an on-site inspection.
Farms must meet both the Federal Act criteria as well as the California Organic FoodAct of 1990 criteria. Compliance with the following criteria, in addition to the require-ments set forth in the Federal and State organic acts, allows the producer to utilizethe CCOF seal for advertisement of their product.
California Certified Organic Farmers
Organic Production:
The CCOF requires a long-term program of ecological soil management that includes:
• a goal of healthy, fertile, biologically active soil.
• special attention to reaching optimum levels of organic matter and cation ex-change capacity for the particular soil type in order to minimize the use ofsoluble nutrients.
• that the land be certified under the California Department of Food and Agri-culture.

131
• a minimum buffer zone of 25 feet is required from the dripline of the crop inthe program to potentially contaminated adjacent area.
The CCOF recommends:
• agricultural practices include the incorporation of composted organic materi-als, mineral powders, microorganisms, green manures (especially legumes)and crop residues.
• crop rotation and the use of cover crops.
• soil building programs must make a reasonable effort to control soil erosion.
Processing, Handling, and Storage
The CCOF requires:
• all product labeled as “Made with Organic” must contain at least 50% organicingredients, by weight, excluding water and salt.
• processing and handling lines used for both organic and non-organic productmust be thoroughly cleaned immediately before organic product is processedor handled.
• there must be no mixing of organic and non-organic product between con-tainers, and no addition or removal of product from containers.
The CCOF also has specific recommendations regarding nitrogen, phosphorous, dis-ease management, insect management, micronutrients, etc. The CCOF bases criteriafor generic materials designations on the California Organic Foods Act of 1990, andthe California Department of Food and Agriculture Preliminary Materials List. CCOFmaintains its own lists of allowed, regulated, and prohibited substances in a compre-hensive array of categories: crop materials, additives, ingredients, processing aids,cleansers, disinfectants, sanitizers, and pest controllers.
Organic Grapes into Wine Alliance
The Organic Grapes into Wine Alliance presents its standards more succinctly thanthe three above mentioned standards. The OGWA standards outline 14 sections;within these sections are practices that are listed as recommended, tolerated, andprohibited. Unlike the three other standards, the OGWA standard is specifically de-signed for wine production. Membership in OGWA requires compliance with thefederal Organic Foods Production Act and additionally in California, the CaliforniaOrganic Food Act.

132
The OGWA standards are comprised of 14 sections. They include grape origin, har-vest crushing, yeasts, sulfur treatment, stabilizing agents, clarification/fining, color-ing/decoloring, volatile acidity, acidification/deacidification, storage vessels, trans-portation of bulk juice in wine, bottling/packaging, corking, and cleaning agents. Thefollowing includes sections that can be compared directly with the federal and statelegislation.
Grape Origin
The Standard:
• recommends third-party certification.
• tolerates wine grapes grown according to COFA, but not third party certified.
• prohibits the use of synthetic herbicides, pesticides, fungicides, or fertilizers.
Sulfur Treatments:
The Federal and State Acts require that there be no added sulfites. Incidentally, theCalifornia legislation requires levels of no more than 10ppm but the COFA does notcontain similar language. Nonetheless, the BATF requires that wines containing morethan 10ppm be labeled with “Contains Sulfites.” The OGWA standards recommend:
• sulfite levels shall be no more than 100ppm and 30ppm free sulfite at thetime the wine is released.
• Solutions of greater than 5% sulfite, up to saturation, prepared on-premise bybubbling gas through water.
The use of sulfur dioxide as a preservative is one of the most controversial points indetermining a definition of organic. Most of the literature concerning organic winehas been opposed to the introduction of any sulfites into the winemaking process(excepting for sulfur applied to the grapes on the vine to prevent mold). The Federaland State Acts also support this sentiment. This is definitely an area that deservesmore research.
The Status of the Organic Foods Production Act
The National Organic Standards Board has been given the responsibility of designinga national organic program that may be used to comply with the Federal Act. In April1995, NOSB at their meeting in Orlando, Florida gave a general definition of whatthey mean by organic agriculture. It states that, “Organic agriculture is an ecologicalproduction management system that promotes and enhances biodiversity, biologicalcycles and soil biological activity. It is based on minimal use of off-farm inputs and

133
on management practices that restore, maintain and enhance ecological harmony”(NOSB News Release).
All processors, growers and handlers of products that are labeled as organic must beregistered with the state of California under the 1990 California Organic Foods Act(COFA). Processors register with the Department of Health Services while growersand handlers register with the California Department of Food and Agriculture. Regis-tration is mandatory and regulated by state law unlike certification, which is volun-tary and controlled through private organizations. Since 1990, the federal OrganicFoods Production Act (OFPA) has been “in process” which when finalized willchange the certification requirements. In December of 1997, the United States Depart-ment of Agriculture developed a proposed rule of the National Organic Program,which would set national standards and regulations for organically produced agricul-tural products. The proposed rule states annual sales of $5,000 or more must becertified by and accredited certification agency. In a survey of growers in 1994 and1995, all organic growers who grossed above $500,000 were certified whereas half ofthe growers with sales of $25,000 or less were certified. Only one-fifth of the growerswith sales of $10,000 or less were certified. The new federal requirements under theproposed rule could be a significant deterrent (Statistical Review of California’s Or-ganic Agriculture: 1992-1995, UC Agricultural Issues Center, July 1998).
As mentioned above, the Federal Organic Foods Production Act (OFPA) is currentlyin review at the Office of Budget and Management (OMB). The OBM reviews allproposed Federal rules, evaluating compliance with the existing administration’sgoals, the Paperwork Reduction Act, and relevant Executive Orders.
It is expected that the OFPA will be released by the OMB in the near future. It is,however, unclear just how great the impact of the revised federal rule will be onCalifornia organic agriculture. Keith Jones, the director of the National Organic Pro-gram, for example, at an Ecological Farming Conference in January discussed theproposed rule and its status in the approval process. Jones suggested that the pro-posed rule is nearing approval and has cleared USDA requirements. The rule wasscheduled for publication in the Federal Register on February 8th, clearly it has beendelayed. It should be noted that, the proposed rule is not just a revision of the origi-nal rule. The OFPA was drafted from as a new rule, not a revision to existing Federalregulations.
In January 2000, Ray Green the Organic Program Manager at California Departmentof Food and Agriculture elaborated on why the current California law does not func-tion as intended. The 1990 California Organic Act identifies chemicals that cannot beused in organic farming, but in no way does it ensure that a farm is employing sus-tainable farming practices. Green suggested that farmers can be “organic by neglect”;that is, a farmer could find himself in compliance with the 1990 California Organic act

134
simply by not applying chemicals. Moreover, there is no requirement that the farmersutilize sustainable practices. Farmers are only required to have a certification plan,which the CDFA has no legal ability to deny.
Further, the California law does not mandate any type of training for an organic in-spector. In fact, according to Green, the legal framework for the certification planlacks explicit data requirements. The materials list in California is ten years old andmay require updating.
Finally, enforcement of the 1990 California Organic Act currently only utilizes randomspot inspections by local county agriculture offices. According to Mark Lipson of theOrganic Farming Research Foundation, these spot checks have demonstrated morenoncompliance among certified organic farmers than among farmers who are merelyregistered organic. The combination of the above factors, a lack of a sustainable agri-culture focus, limited inspector requirements, outdated pesticide lists, and poor en-forcement reflect a clear need for changes to the California organic certification pro-cess.
The latest development in the formulation of national organic standards comes fromthe US Secretary of Agriculture, Dan Glickman. On March 7, 2000, Glickman pre-sented a new proposal for a uniform and consistent national standard for all organicfood. It essentially offers a national definition for the term “organic” and delineatesmethods, practices, and substances that can be used in the production and handlingof organic crops, livestock and processed foods. The most notable aspects of theproposal are the prohibition of genetic engineering, sewage sludge, irradiation andantibiotics in organic livestock. This proposal comes in response to the more than275,000 comments the NOSB received to its December 1997 organic proposal. Theproposal states that products containing at least 95% organic ingredients will be al-lowed to carry the seal of “USDA Certified Organic.” Foods that are comprised of atleast 50% organic ingredients can be labeled “made with” organic ingredients. As itapplies to wine grape growing, the proposal mimics the CCOF standard of no appli-cation of prohibited materials for three years prior to certification. It does state thatsome synthetic materials may be allowed in fertilizers and pesticides in certain in-stances. The USDA will take public comment on the rules from March 13 throughJune 14 before putting them into effect. Farmers and processors will then be given 18months to get into compliance.

135
Appendix F. Fetzer’s RecentEnvironmental Achievements
June 24, 1999. Fetzer unveils the largest solar-electric system on the North Coast. The$250,000 photovoltaic system, built by Real Goods Trading Co., Fetzer’s neighbor inHopland, provides up to 32 kilowatts of electricity, enough to provide 80 percent ofthe power for Fetzer’s administration building. Photovoltaic systems use rooftop pan-els that turn sunlight into direct electric current, which flows to transformers and istransformed into alternating current, powering electric lights, fans and computers. AtFetzer, there are 360 photovoltaic panels covering the south, east and west roof ofthe administration building, which houses the business functions of the sprawlingwinery, where the bulk of Fetzer’s wine is made, stored and bottled. The 360 panelstogether produce 500 kilowatt hours of power a day. In contrast, a typical homewould need 16 panels.
Sept 14, 1999 - Clean Choice 100. Fetzer announced that it has become the first wineproducer in the world to purchase, for all its operations, a power generation supplyportfolio comprised of 100% renewable resources. The power mix Fetzer is buying -also known as PG&E Energy Services’ Clean Choice 100™ - is a supply portfoliocomprised entirely of renewable energy sources, including wind, biomass, hydro andgeothermal plants. A portion of the negotiated purchase price also supports thecompletion of “new renewable” sources - wind, biomass, geothermal and other re-newable generation plants scheduled to be built in the future - thereby helping toexpand the development of environmentally-preferred energy sources. None of theClean Choice 100™ portfolio includes plants fueled by coal, oil, natural gas, nuclearresources, wood or wood waste from old growth forests, tire-burning or solid mu-nicipal waste. PG&E Energy Services’ contract with Fetzer is its first green poweragreement with a major commercial business.
Nov 2, 1999 - Climate Wise Partner Achievement Award. Given to Fetzer for “signifi-cant accomplishments in improving energy efficiency and reducing pollution” givenby the US Environmental Protection Agency. Fetzer has made a serious commitmentto harvest and produce wine in an environmentally responsible way. With over 700acres farmed organically, Fetzer is one of the largest growers of organic wine grapesin the world. Each year the winery recycles tons of waste paper, surplus cardboard,cans, glassware, wooden pallets and metals, and composts 10,000 tons of grape pom-ace. As a result, it has cut its trash by 93% between 1990 and 1998, eliminating thedumping of 1,580 cubic yards of landfill.

136
Nov 12, 1999 - ISO 9000 certification. First North American Winery to receive certifi-cation. Received certification that their Quality Management System meets the QualityManagement System Standards of ISO 9001:1994. The certification was granted byLloyd’s Register Quality Assurance Limited of Houston, Texas for the Fetzer, Bonterra,Mariah, and Bel Arbor wines in North America, Japan and the United Kingdom.
Nov 16, 1999 - 1999 Business Ethics Award for Environmental Excellence. Honorscorporate responsibility in a wide range of areas including stakeholder relations, em-ployee ownership, and environmental concerns. Business Ethics magazine com-mended Fetzer for its “broad-based approach to environmental sustainability, com-bined with financial excellence.” Judges for the awards included Jonathan Hickman,co-author of Corporate Report Card and research associate at the Council on Eco-nomic Priorities; Marjorie Kelly, co-founder and editor of Business Ethics; StevenLydenberg, principal with Kinder, Lydenberg and Domini social research firm inCambridge, MA; Joel Makower, Editor, The GreenBusiness Letter in Oakland, CA; andSally Power, Professor of business ethics at the University of St. Thomas in Minneapo-lis.
1997. Named one of the Top Ten Recycling Companies in the state by the State ofCalifornia Waste Reduction Awards Program (WRAP). This program is run under theauspices of the California Integrated Waste Management Board.