Calibration of a capacitance probe for measurement and mapping of dry matter yield in Mediterranean...
16
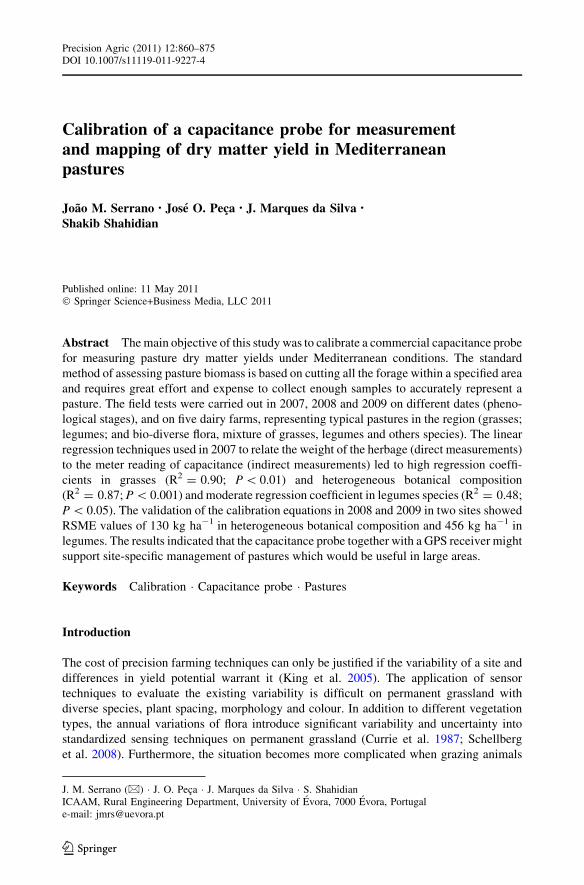
Calibration of a capacitance probe for measurement and mapping of dry matter yield in Mediterranean pastures Joa ˜o M. Serrano • Jose ´ O. Pec ¸a • J. Marques da Silva • Shakib Shahidian Published online: 11 May 2011 Ó Springer Science+Business Media, LLC 2011 Abstract The main objective of this study was to calibrate a commercial capacitance probe for measuring pasture dry matter yields under Mediterranean conditions. The standard method of assessing pasture biomass is based on cutting all the forage within a specified area and requires great effort and expense to collect enough samples to accurately represent a pasture. The field tests were carried out in 2007, 2008 and 2009 on different dates (pheno- logical stages), and on five dairy farms, representing typical pastures in the region (grasses; legumes; and bio-diverse flora, mixture of grasses, legumes and others species). The linear regression techniques used in 2007 to relate the weight of the herbage (direct measurements) to the meter reading of capacitance (indirect measurements) led to high regression coeffi- cients in grasses (R 2 = 0.90; P \ 0.01) and heterogeneous botanical composition (R 2 = 0.87; P \ 0.001) and moderate regression coefficient in legumes species (R 2 = 0.48; P \ 0.05). The validation of the calibration equations in 2008 and 2009 in two sites showed RSME values of 130 kg ha -1 in heterogeneous botanical composition and 456 kg ha -1 in legumes. The results indicated that the capacitance probe together with a GPS receiver might support site-specific management of pastures which would be useful in large areas. Keywords Calibration Capacitance probe Pastures Introduction The cost of precision farming techniques can only be justified if the variability of a site and differences in yield potential warrant it (King et al. 2005). The application of sensor techniques to evaluate the existing variability is difficult on permanent grassland with diverse species, plant spacing, morphology and colour. In addition to different vegetation types, the annual variations of flora introduce significant variability and uncertainty into standardized sensing techniques on permanent grassland (Currie et al. 1987; Schellberg et al. 2008). Furthermore, the situation becomes more complicated when grazing animals J. M. Serrano (&) J. O. Pec ¸a J. Marques da Silva S. Shahidian ICAAM, Rural Engineering Department, University of E ´ vora, 7000 E ´ vora, Portugal e-mail: [email protected] 123 Precision Agric (2011) 12:860–875 DOI 10.1007/s11119-011-9227-4
-
Upload
independent -
Category
Documents
-
view
0 -
download
0
Transcript of Calibration of a capacitance probe for measurement and mapping of dry matter yield in Mediterranean...
Calibration of a capacitance probe for measurementand mapping of dry matter yield in Mediterraneanpastures
Joao M. Serrano • Jose O. Peca • J. Marques da Silva •
Shakib Shahidian
Published online: 11 May 2011� Springer Science+Business Media, LLC 2011
Abstract The main objective of this study was to calibrate a commercial capacitance probe
for measuring pasture dry matter yields under Mediterranean conditions. The standard
method of assessing pasture biomass is based on cutting all the forage within a specified area
and requires great effort and expense to collect enough samples to accurately represent a
pasture. The field tests were carried out in 2007, 2008 and 2009 on different dates (pheno-
logical stages), and on five dairy farms, representing typical pastures in the region (grasses;
legumes; and bio-diverse flora, mixture of grasses, legumes and others species). The linear
regression techniques used in 2007 to relate the weight of the herbage (direct measurements)
to the meter reading of capacitance (indirect measurements) led to high regression coeffi-
cients in grasses (R2 = 0.90; P \ 0.01) and heterogeneous botanical composition
(R2 = 0.87; P \ 0.001) and moderate regression coefficient in legumes species (R2 = 0.48;
P \ 0.05). The validation of the calibration equations in 2008 and 2009 in two sites showed
RSME values of 130 kg ha-1 in heterogeneous botanical composition and 456 kg ha-1 in
legumes. The results indicated that the capacitance probe together with a GPS receiver might
support site-specific management of pastures which would be useful in large areas.
Keywords Calibration � Capacitance probe � Pastures
Introduction
The cost of precision farming techniques can only be justified if the variability of a site and
differences in yield potential warrant it (King et al. 2005). The application of sensor
techniques to evaluate the existing variability is difficult on permanent grassland with
diverse species, plant spacing, morphology and colour. In addition to different vegetation
types, the annual variations of flora introduce significant variability and uncertainty into
standardized sensing techniques on permanent grassland (Currie et al. 1987; Schellberg
et al. 2008). Furthermore, the situation becomes more complicated when grazing animals
J. M. Serrano (&) � J. O. Peca � J. Marques da Silva � S. ShahidianICAAM, Rural Engineering Department, University of Evora, 7000 Evora, Portugale-mail: [email protected]
123
Precision Agric (2011) 12:860–875DOI 10.1007/s11119-011-9227-4
are involved, due to dynamic interactions between plants and animals (Ogura and Hirata
2001). In contrast to equal defoliation of the sward for silage and hay, grazing animals
create specific spatial patterns of sward biomass, which change throughout utilization, and
have a considerable effect on the spatial heterogeneity of the grassland field (Rook et al.
2004). To deepen an understanding of such interactions, it is necessary to know the
determinants of choice of grazing locations and intensities of selective grazing by animals
(Ogura and Hirata 2001). Understanding how spatial and temporal variability of animal,
forage, soil and landscape features affect grazing behaviour and forage utilization provides
potential to modify pasture management, improve efficiency of utilization, and maximize
profits (Turner et al. 2000). Recent advances in global positioning system (GPS) tech-
nology have allowed the development of lightweight GPS collar receivers suitable for
monitoring animal position, to assess animal behaviour characteristics and pasture utili-
zation. In the 1990s, the University of Kentucky began using GPS collars on cattle to track
their position with the goal of incorporating this information into cattle management
practices (Agouridis et al. 2004). Barbari et al. (2006) showed that research methodologies
which combine global position system information with geographical information system
analyses have an effective potential to support studies on livestock behaviour in pastures.
Grazing management and planning of animal production systems from pastures
are essentially based on estimated herbage mass, production and accumulation rates
(Virkajarvi 1999). The methods mentioned in the literature for evaluating the forage in a
pasture are mainly grouped in direct methods, such as cutting the forage in a sample area of
the pasture, and indirect methods, which do not harm the pasture and are faster, requiring
less man power. The standard method of assessing pasture and forage mass is based on
cutting all the forage in an area of the pasture that is being sampled (Cauduro et al. 2006).
Systematic manual plant sampling has been used to analyse spatial distribution of dry
matter yield and plant nutrient concentration and to predict its variability on grassland
(Bailey et al. 2001). This method requires great effort and expense to collect enough
samples to accurately represent a pasture (Sharrow 1984; Hanna et al. 1999; Ganguli et al.
2000). Similar problems occur during the evaluation of large-size pasture yields, which
require a high number of destructive samples to obtain sufficient accuracy of the estimate
(Franca et al. 2003). Farmers are not willing to make this effort for day-to-day management
of pastures (Virkajarvi 1999; Sanderson et al. 2001). Therefore, other techniques, useful
over large areas, are required to clarify yield variability and implement more contemporary
production strategies such as precision farming or site-specific management.
During the past 70 years, many indirect methods have been evaluated, from simple
rulers to sophisticated electronic meters. Any of these methods is expected to provide a
good representation of the conditions or state of the pasture, with low operating costs and
good precision (Zanine et al. 2006). Other indirect sensing techniques, such as optical
(Hanna et al. 1999) and ultrasound (Hutchings 1991) in situ and on-the-go pasture meters
and even remote sensing are an actual possibility. Active optical plant radiometric sensors,
that measure the visible and near-infrared (NIR) radiation reflected from the vegetation
canopy, offer the potential of quantifying biomass over large areas with high spatial
resolution by remote-sensing techniques at ground level (Hanna et al. 1999).
Some methods, including the electronic capacitance meter, have been adapted for
commercial use. The interest in this evaluation process remains current as each pasture is a
different ecosystem, with specific characteristics, which vary with different vegetative
states of plants, according to type of grazing management. This interest has been dem-
onstrated in different studies such as those by Stockdale and Kelly (1984), Hirata (2000),
Silva and Cunha (2003), Zanine et al. (2006) and Cauduro et al. (2006).
Precision Agric (2011) 12:860–875 861
123

Commercially available meters come with factory calibrations; however, accuracy and
precision of these equations have not been evaluated for Mediterranean pasture conditions.
Several previous studies of double-sampling techniques have shown that these techniques
require frequent calibration and that universal equations for estimating pasture mass have
not been useful because of variations in pastures, management and climate (Virkajarvi
1999; Sanderson et al. 2001; Zanine et al. 2006). Since the relationship between herbage
mass and corrected meter reading of an electronic capacitance probe is known to vary
with such factors as sward type, growth season (developmental stage), herbage moisture
content and ratio of green to dead material and is also expected to vary with grazing,
calibration equations must be developed separately for individual measurement occasions
(Hirata 2000). Calibration equations between capacitance and dry matter yield are known
to vary between sites due to differences between plant species, plant water content,
grazing, trampling of vegetation, phenological stage and accuracy of dry matter regression
(Reese et al. 1980; Karl and Nicholson 1987; Aiken and Bransby 1992).
The main objective of this study was to calibrate a commercial capacitance probe for
measuring pasture dry matter yields under Mediterranean conditions.
Materials and methods
Equipment
The following equipment was used in the field experiments:
– Cutting shears and plastic bags for storing the pasture samples;
– Enclosure cages, with a 1 m2 area, to protect the pasture from grazing, and allow
evaluation of pasture productivity;
– Metallic rim with a 1 m2 area to clearly mark the field and the reference area of the
samples;
– Trimble RTK/PP 4700 survey grade GPS (global positioning system) receiver,
manufactured by TRIMBLE Navigation Limited, USA;
– Grassmaster II—electronic capacitance probe, manufactured by Novel Ways Electronic,
Hamilton, New Zealand.
Co-ordinates measurement
The Trimble RTK 4700 survey grade receiver works under differential mode (dGPS):
uses two receivers, one as a fixed base station placed on known locations on the ground,
in the boundary of the experimental field, and the other as a moving receiver, designated
as rover. Correction data is transmitted from the base station to the rover in real-time
using a radio. The dGPS survey grade receiver was used to carry out all the topo-
graphical surveys. The horizontal and vertical errors of this system were less than 0.02
and 0.04 m, respectively.
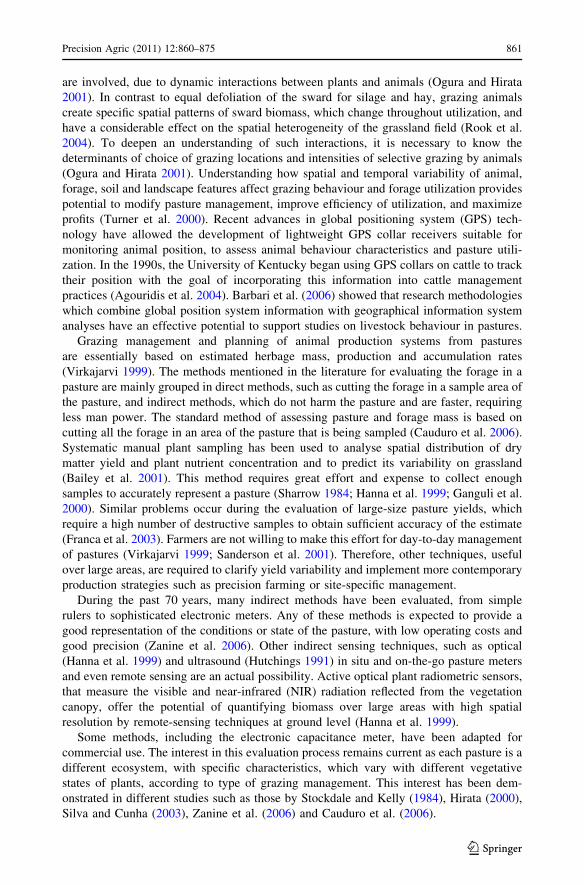
Capacitance instrument
Capacitance instruments are generally composed of an electronic circuit which generates a
signal of a certain frequency, and then carries out a measurement of the capacitance of the
air-herbage mixture (Currie et al. 1987).
862 Precision Agric (2011) 12:860–875
123
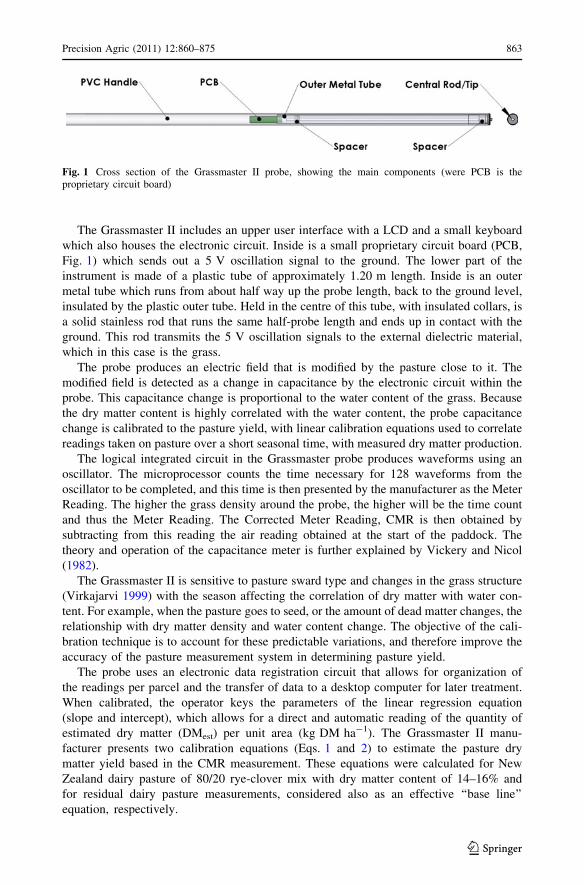
The Grassmaster II includes an upper user interface with a LCD and a small keyboard
which also houses the electronic circuit. Inside is a small proprietary circuit board (PCB,
Fig. 1) which sends out a 5 V oscillation signal to the ground. The lower part of the
instrument is made of a plastic tube of approximately 1.20 m length. Inside is an outer
metal tube which runs from about half way up the probe length, back to the ground level,
insulated by the plastic outer tube. Held in the centre of this tube, with insulated collars, is
a solid stainless rod that runs the same half-probe length and ends up in contact with the
ground. This rod transmits the 5 V oscillation signals to the external dielectric material,
which in this case is the grass.
The probe produces an electric field that is modified by the pasture close to it. The
modified field is detected as a change in capacitance by the electronic circuit within the
probe. This capacitance change is proportional to the water content of the grass. Because
the dry matter content is highly correlated with the water content, the probe capacitance
change is calibrated to the pasture yield, with linear calibration equations used to correlate
readings taken on pasture over a short seasonal time, with measured dry matter production.
The logical integrated circuit in the Grassmaster probe produces waveforms using an
oscillator. The microprocessor counts the time necessary for 128 waveforms from the
oscillator to be completed, and this time is then presented by the manufacturer as the Meter
Reading. The higher the grass density around the probe, the higher will be the time count
and thus the Meter Reading. The Corrected Meter Reading, CMR is then obtained by
subtracting from this reading the air reading obtained at the start of the paddock. The
theory and operation of the capacitance meter is further explained by Vickery and Nicol
(1982).
The Grassmaster II is sensitive to pasture sward type and changes in the grass structure
(Virkajarvi 1999) with the season affecting the correlation of dry matter with water con-
tent. For example, when the pasture goes to seed, or the amount of dead matter changes, the
relationship with dry matter density and water content change. The objective of the cali-
bration technique is to account for these predictable variations, and therefore improve the
accuracy of the pasture measurement system in determining pasture yield.
The probe uses an electronic data registration circuit that allows for organization of
the readings per parcel and the transfer of data to a desktop computer for later treatment.
When calibrated, the operator keys the parameters of the linear regression equation
(slope and intercept), which allows for a direct and automatic reading of the quantity of
estimated dry matter (DMest) per unit area (kg DM ha-1). The Grassmaster II manu-
facturer presents two calibration equations (Eqs. 1 and 2) to estimate the pasture dry
matter yield based in the CMR measurement. These equations were calculated for New
Zealand dairy pasture of 80/20 rye-clover mix with dry matter content of 14–16% and
for residual dairy pasture measurements, considered also as an effective ‘‘base line’’
equation, respectively.
Fig. 1 Cross section of the Grassmaster II probe, showing the main components (were PCB is theproprietary circuit board)
Precision Agric (2011) 12:860–875 863
123
DMest1 ¼ 0:72CMR-2200 ð1Þ
DMest2 ¼ 0:48CMR-300 ð2Þ
were DMest is the pasture dry matter yield (kg ha-1) and the CMR is the Corrected Meter
Reading.
Pasture dry matter yield measurement
Measuring pasture dry matter yield (DMmeas) was carried out using the following standard
procedure:
– In areas subject to animal grazing, 1 m2 enclosure cages were installed at the beginning
of the vegetative cycle of the crop (September), in different geo-referenced locations of
the parcel; the 1 m2 metal rim was used in areas that were not subject to grazing;
– Manual cutting (to 20–30 mm above ground level) of the pasture as required; about
2–4 cuttings (between January and May), depending on the agricultural year with
regard to temperature and precipitation; the samples were stored in marked plastic
bags;
– These samples were weighed, in the laboratory, to determine the green matter
production per hectare (GM). Sub-samples in small paper bags were placed in a 65�C
oven for 72 h to determine the moisture content. The moisture content value was then
used to calculate pasture dry matter yield (DM).
Experimental procedure
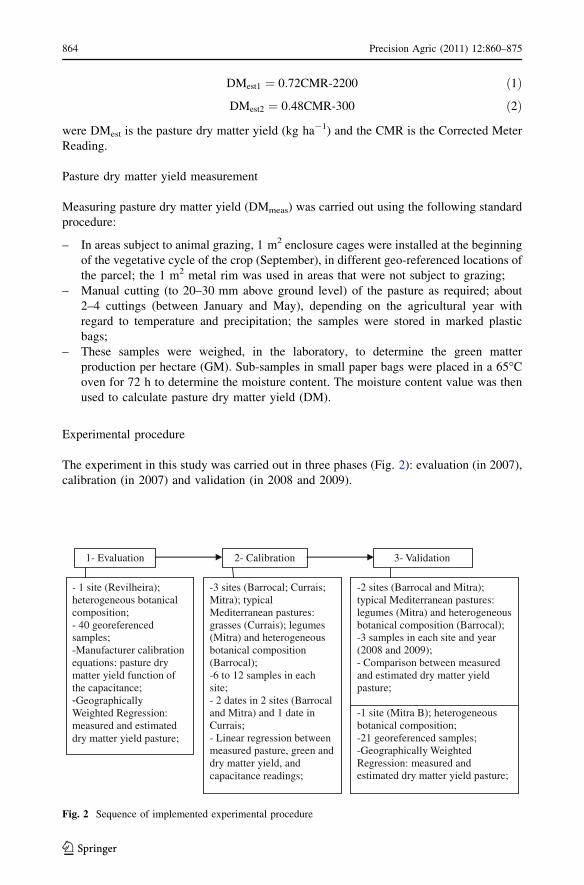
The experiment in this study was carried out in three phases (Fig. 2): evaluation (in 2007),
calibration (in 2007) and validation (in 2008 and 2009).
1- Evaluation 2- Calibration 3- Validation
- 1 site (Revilheira); heterogeneous botanical composition; - 40 georeferenced samples; -Manufacturer calibration equations: pasture dry matter yield function of the capacitance; -Geographically Weighted Regression: measured and estimated dry matter yield pasture;
-3 sites (Barrocal; Currais; Mitra); typical Mediterranean pastures: grasses (Currais); legumes (Mitra) and heterogeneous botanical composition (Barrocal); -6 to 12 samples in each site; - 2 dates in 2 sites (Barrocal and Mitra) and 1 date in Currais; - Linear regression between measured pasture, green and dry matter yield, and capacitance readings;
-2 sites (Barrocal and Mitra); typical Mediterranean pastures: legumes (Mitra) and heterogeneous botanical composition (Barrocal); -3 samples in each site and year (2008 and 2009); - Comparison between measured and estimated dry matter yield pasture;
-1 site (Mitra B); heterogeneous botanical composition; -21 georeferenced samples; -Geographically Weighted Regression: measured and estimated dry matter yield pasture;
Fig. 2 Sequence of implemented experimental procedure
864 Precision Agric (2011) 12:860–875
123
Evaluation phase
The evaluation phase was carried out in March 2007, in the Revilheira farm (co-ordinates
38�27.90N and 7�25.70W), a 6 ha heterogeneous botanical composition pasture (grasses,
mainly Dactilis glomerato, legumes, mainly Trifolium subterraneum, and others species),
in a pre-flowering phenological stage. The Grassmaster probe was used to measure the
capacitance in 40 enclosure cages, geo-referenced using a Trimble 4700, RTK survey
grade receiver. Each measurement was preceded by an air humidity level correction, before
any data were collected by the probe. The capacitance readings were registered after the
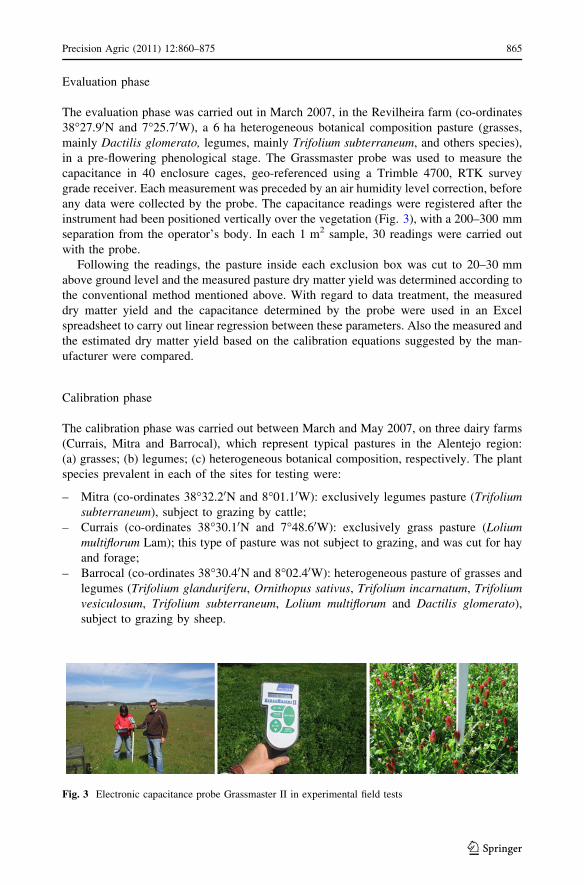
instrument had been positioned vertically over the vegetation (Fig. 3), with a 200–300 mm
separation from the operator’s body. In each 1 m2 sample, 30 readings were carried out
with the probe.
Following the readings, the pasture inside each exclusion box was cut to 20–30 mm
above ground level and the measured pasture dry matter yield was determined according to
the conventional method mentioned above. With regard to data treatment, the measured
dry matter yield and the capacitance determined by the probe were used in an Excel
spreadsheet to carry out linear regression between these parameters. Also the measured and
the estimated dry matter yield based on the calibration equations suggested by the man-
ufacturer were compared.
Calibration phase
The calibration phase was carried out between March and May 2007, on three dairy farms
(Currais, Mitra and Barrocal), which represent typical pastures in the Alentejo region:
(a) grasses; (b) legumes; (c) heterogeneous botanical composition, respectively. The plant
species prevalent in each of the sites for testing were:
– Mitra (co-ordinates 38�32.20N and 8�01.10W): exclusively legumes pasture (Trifoliumsubterraneum), subject to grazing by cattle;
– Currais (co-ordinates 38�30.10N and 7�48.60W): exclusively grass pasture (Loliummultiflorum Lam); this type of pasture was not subject to grazing, and was cut for hay
and forage;
– Barrocal (co-ordinates 38�30.40N and 8�02.40W): heterogeneous pasture of grasses and
legumes (Trifolium glanduriferu, Ornithopus sativus, Trifolium incarnatum, Trifoliumvesiculosum, Trifolium subterraneum, Lolium multiflorum and Dactilis glomerato),
subject to grazing by sheep.
Fig. 3 Electronic capacitance probe Grassmaster II in experimental field tests
Precision Agric (2011) 12:860–875 865
123
In Currais, the field tests were conducted only in March 2007 (in pre-flowering phe-
nological stage), because this field was integrated in a crop rotation scheme and the farmer
had cut the forage in April and had cultivated the soil for planting a spring-summer crop. In
Barrocal, the field tests were carried out on two dates (March and April 2007), at the same
phenological stage (pre-flowering). In Mitra, the field tests were carried out on two dates
(March and May 2007), at different phenological stages, pre-flowering and flowering,
respectively.
The 1 m2 metal rim was used to isolate the pasture area of each sample in the calibration
processes carried out in these three locations. In each field, six randomly distributed
pasture samples were collected. For each sample, thirty readings were carried out with the
Grassmaster and averaged. Then the pasture within the metal rim was cut to 20–30 mm
above ground level and the actual pasture dry matter yield was measured using the tra-
ditional method, mentioned above.
The capacitance meter was calibrated, using a spreadsheet to establish the linear
regression equations between the weight of the herbage, green and dry matter (direct
measurements) and the capacitance meter reading (indirect measurements). This technique
requires a relatively small amount of labour. Usually two people are needed, one to operate
the capacitance probe and the other to cut the pasture. In this way, six vegetation samples
for developing a calibration equation can be collected in approximately 0.5 h.
Validation phase
The validation phase was carried out in April and May 2008 and April 2009, on three dairy
farms: Barrocal, Mitra and Mitra B. In Barrocal and Mitra sites, the validation was carried
out 1 and 2 years after the second period of calibration, with the above mentioned pro-
cedure having been used in the calibration phase, except with regard to the number of
samples. In this case, only three randomly distributed samples were collected from each
locality in each year. With regard to data treatment, the measured and the estimated dry
matter yield, estimated by the probe based on the equation established in the calibration
phase for each location, were compared. In Mitra B (co-ordinates 38�31.90N and
8�00.40W), a 14 ha heterogeneous pasture area, the capacitance probe, programmed with
the calibration equation obtained in 2007 in Barrocal (heterogeneous botanical composi-
tion) and validated in 2008, was used to estimate the pasture dry matter yield in 21
enclosure cages on the pasture, geo-referenced using a Trimble 4700 RTK survey grade
receiver. In each 1 m2 sample, thirty readings were carried out with the probe and the mean
value of pasture dry matter yield, obtained automatically by the probe and shown on the
monitor was registered. Then the pasture within each enclosure cage was cut and the actual
pasture dry matter yield was determined using the conventional method, mentioned above.
With regard to data treatment, the measured dry matter yield and the capacitance
determined by the probe were used in a spreadsheet to establish the linear regression
between these parameters. Also, the measured and the estimated dry matter yield were
compared, as determined by the probe based on the established equation from experiments
carried out in a parcel of pasture with similar characteristics (Barrocal—heterogeneous
botanical composition).
Statistical treatment
In the different phases of this research (evaluation, calibration and validation) correlations
were established, respectively: (1) between the measured dry matter and the capacitance
866 Precision Agric (2011) 12:860–875
123

registered by the probe (evaluation phase); (2) between the measured green matter and
the capacitance and between the dry matter and the capacitance (calibration phase);
(3) between the measured dry matter and the dry matter estimated by the probe, previously
programmed (evaluation and validation phases).
The statistical treatment of the results with regard to calibration of the capacitance probe
consisted in analysing the regression with a 5% probability level (statistical P \ 0.05
significance level, basis of all declared significant differences between comparisons of
means), using a spreadsheet of the Excel program.
After obtaining pasture properties, a set of map layers in raster format, with a 5 m
resolution, was generated. All maps were produced with the ArcMap/Spatial Analyst
module of the ArcGIS (version 9.3.1, ESRI Inc, Redlands, CA, USA), considering an
ordinary kriging interpolator, with a spherical semi-variogram and a variable search radius
(five neighbours with a minimum of two neighbours).
Results and discussion
Table 1 shows the mean ± standard deviation of CMR, measured and estimated pasture
dry matter yield in kg ha-1, and the corresponding root mean square error (RMSE) using
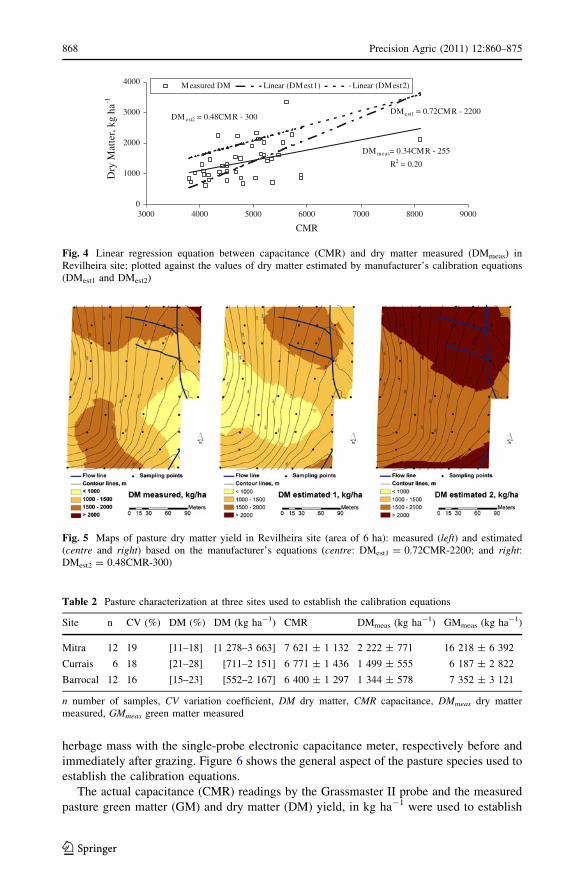
the manufacturer’s calibration equations (1 and 2). Figure 4 shows the poor correlation
(R2 = 0.20; P \ 0.01) between the measured pasture dry matter yield (DMmeas) and the
capacitance (CMR) at Revilheira site. These results are based on the calibration equations
proposed by the manufacturer (Eqs. 1 and 2).
Figure 5 presents the maps of the geo-referenced information of the measured pasture
dry matter yield at Revilheira site and the estimated pasture dry matter yield for the same
site based on the two equations proposed by the manufacturer. The great variability of
pasture at the Revilheira site (dry matter content of 12–44%; dry matter yield of
1 398 ± 605 kg ha-1, range between 613 and 3 341 kg ha-1), might justify this poor
correlation. Another contributing factor might be related to the fact that Eq. 1 was
developed in paddocks with a good cover and an average minimum production of
2 500 kg ha-1. On the other hand, Eq. 2 was calibrated for low or residual paddocks, with
high dead material content, which was not the case of the pasture at the Revilheira site.
The results of the evaluation tests carried out at Revilheira site justify the need for
calibration of the probe as a function of pasture characteristics, which is referred to by the
manufacturer as well as by other authors (Hirata 2000; Sanderson et al. 2001).
Table 2 shows the pasture characterization at three sites used for the establishment of
the calibration equations. The coefficients of variation in calibration tests ranged between
15 and 19%. These values were similar to those (CV = 21%) presented by Donovan et al.
(2002) and the 13.3 and 15.4% reported by Stockdale and Kelly (1984) to estimate the
Table 1 Mean ± standard deviation of CMR, measured and estimated pasture dry matter yield, and thecorresponding RMSE using the manufacturer’s calibration equations (1 and 2)
Site CMR DMmeas
(kg ha-1)DMest1
(kg ha-1)RMSEest1
(kg ha-1)DMest2
(kg ha-1)RMSEest2
(kg ha-1)
Revilheira 4 851 ± 785 1 398 ± 605 1 293 ± 565 620 2 029 ± 377 835
CMR capacitance, DMmeas dry matter measured, DMest1 and DMest2 dry matter estimated using thecalibrated manufacturer equations, RMSE root mean square errors
Precision Agric (2011) 12:860–875 867
123
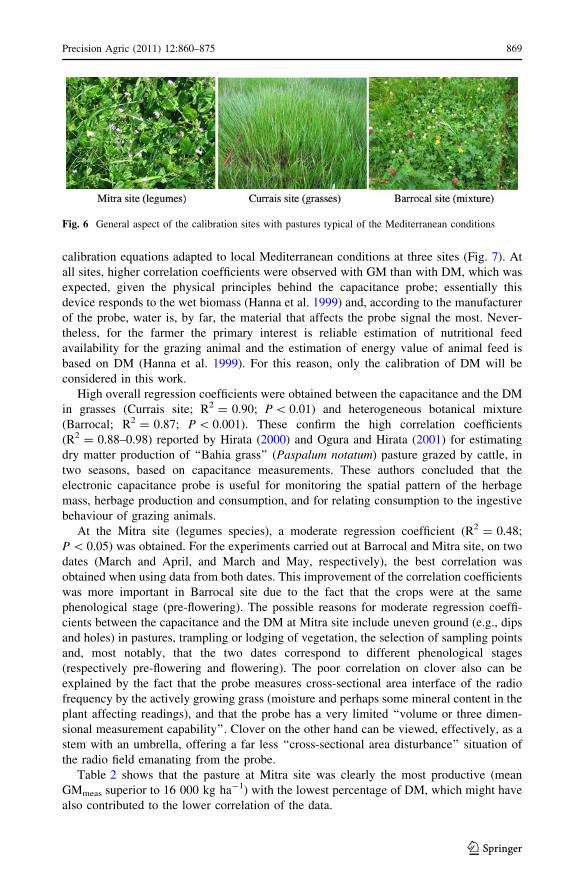
herbage mass with the single-probe electronic capacitance meter, respectively before and
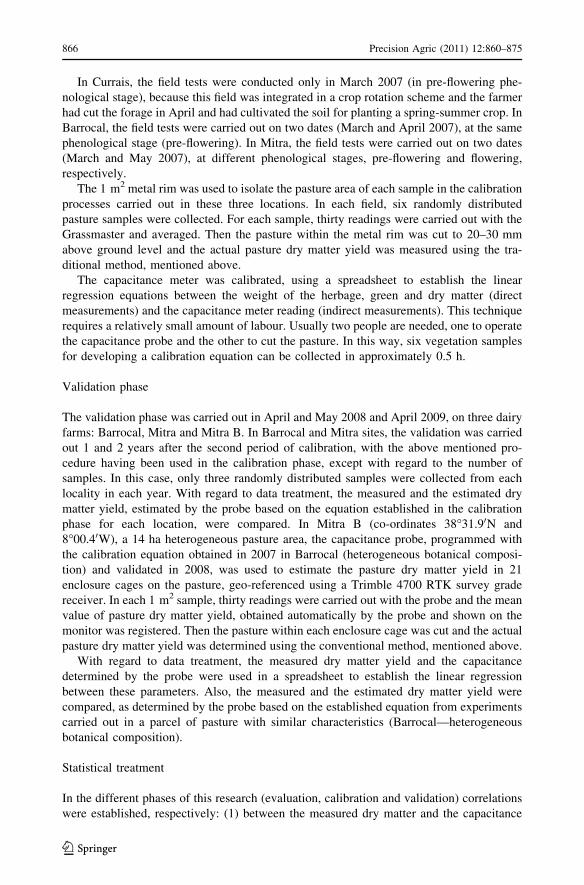
immediately after grazing. Figure 6 shows the general aspect of the pasture species used to
establish the calibration equations.
The actual capacitance (CMR) readings by the Grassmaster II probe and the measured
pasture green matter (GM) and dry matter (DM) yield, in kg ha-1 were used to establish
DM meas= 0.34CMR - 255
R2 = 0.20
DM est1 = 0.72CMR - 2200DM est2 = 0.48CMR - 300
0
1000
2000
3000
4000
3000 4000 5000 6000 7000 8000 9000
CMR
Dry
Mat
ter,
kg h
a-1
Measured DM Linear (DMest1) Linear (DMest2)
Fig. 4 Linear regression equation between capacitance (CMR) and dry matter measured (DMmeas) inRevilheira site; plotted against the values of dry matter estimated by manufacturer’s calibration equations(DMest1 and DMest2)
Fig. 5 Maps of pasture dry matter yield in Revilheira site (area of 6 ha): measured (left) and estimated(centre and right) based on the manufacturer’s equations (centre: DMest1 = 0.72CMR-2200; and right:DMest2 = 0.48CMR-300)
Table 2 Pasture characterization at three sites used to establish the calibration equations
Site n CV (%) DM (%) DM (kg ha-1) CMR DMmeas (kg ha-1) GMmeas (kg ha-1)
Mitra 12 19 [11–18] [1 278–3 663] 7 621 ± 1 132 2 222 ± 771 16 218 ± 6 392
Currais 6 18 [21–28] [711–2 151] 6 771 ± 1 436 1 499 ± 555 6 187 ± 2 822
Barrocal 12 16 [15–23] [552–2 167] 6 400 ± 1 297 1 344 ± 578 7 352 ± 3 121
n number of samples, CV variation coefficient, DM dry matter, CMR capacitance, DMmeas dry mattermeasured, GMmeas green matter measured
868 Precision Agric (2011) 12:860–875
123
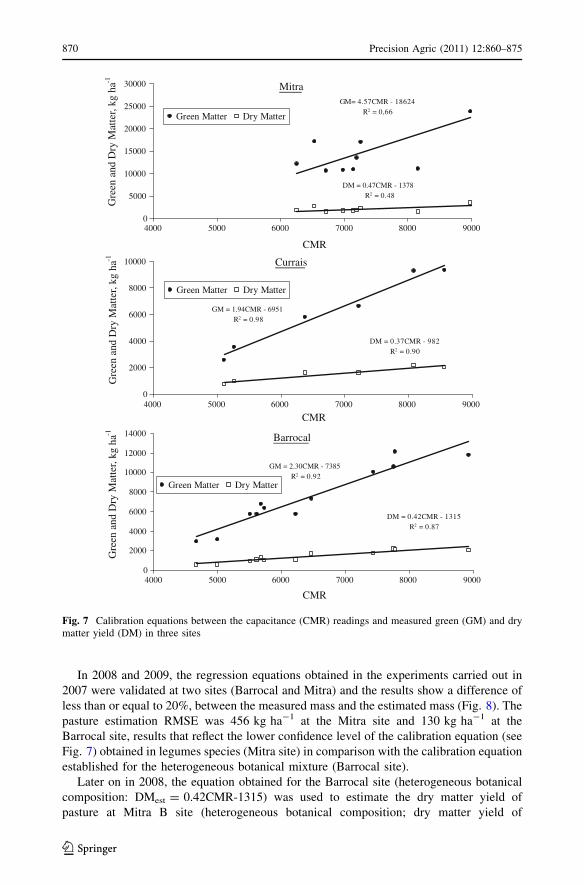
calibration equations adapted to local Mediterranean conditions at three sites (Fig. 7). At
all sites, higher correlation coefficients were observed with GM than with DM, which was
expected, given the physical principles behind the capacitance probe; essentially this
device responds to the wet biomass (Hanna et al. 1999) and, according to the manufacturer
of the probe, water is, by far, the material that affects the probe signal the most. Never-
theless, for the farmer the primary interest is reliable estimation of nutritional feed
availability for the grazing animal and the estimation of energy value of animal feed is
based on DM (Hanna et al. 1999). For this reason, only the calibration of DM will be
considered in this work.
High overall regression coefficients were obtained between the capacitance and the DM
in grasses (Currais site; R2 = 0.90; P \ 0.01) and heterogeneous botanical mixture
(Barrocal; R2 = 0.87; P \ 0.001). These confirm the high correlation coefficients
(R2 = 0.88–0.98) reported by Hirata (2000) and Ogura and Hirata (2001) for estimating
dry matter production of ‘‘Bahia grass’’ (Paspalum notatum) pasture grazed by cattle, in
two seasons, based on capacitance measurements. These authors concluded that the
electronic capacitance probe is useful for monitoring the spatial pattern of the herbage
mass, herbage production and consumption, and for relating consumption to the ingestive
behaviour of grazing animals.
At the Mitra site (legumes species), a moderate regression coefficient (R2 = 0.48;
P \ 0.05) was obtained. For the experiments carried out at Barrocal and Mitra site, on two
dates (March and April, and March and May, respectively), the best correlation was
obtained when using data from both dates. This improvement of the correlation coefficients
was more important in Barrocal site due to the fact that the crops were at the same
phenological stage (pre-flowering). The possible reasons for moderate regression coeffi-
cients between the capacitance and the DM at Mitra site include uneven ground (e.g., dips
and holes) in pastures, trampling or lodging of vegetation, the selection of sampling points
and, most notably, that the two dates correspond to different phenological stages
(respectively pre-flowering and flowering). The poor correlation on clover also can be
explained by the fact that the probe measures cross-sectional area interface of the radio
frequency by the actively growing grass (moisture and perhaps some mineral content in the
plant affecting readings), and that the probe has a very limited ‘‘volume or three dimen-
sional measurement capability’’. Clover on the other hand can be viewed, effectively, as a
stem with an umbrella, offering a far less ‘‘cross-sectional area disturbance’’ situation of
the radio field emanating from the probe.
Table 2 shows that the pasture at Mitra site was clearly the most productive (mean
GMmeas superior to 16 000 kg ha-1) with the lowest percentage of DM, which might have
also contributed to the lower correlation of the data.
Fig. 6 General aspect of the calibration sites with pastures typical of the Mediterranean conditions
Precision Agric (2011) 12:860–875 869
123
In 2008 and 2009, the regression equations obtained in the experiments carried out in
2007 were validated at two sites (Barrocal and Mitra) and the results show a difference of
less than or equal to 20%, between the measured mass and the estimated mass (Fig. 8). The
pasture estimation RMSE was 456 kg ha-1 at the Mitra site and 130 kg ha-1 at the
Barrocal site, results that reflect the lower confidence level of the calibration equation (see
Fig. 7) obtained in legumes species (Mitra site) in comparison with the calibration equation
established for the heterogeneous botanical mixture (Barrocal site).
Later on in 2008, the equation obtained for the Barrocal site (heterogeneous botanical
composition: DMest = 0.42CMR-1315) was used to estimate the dry matter yield of
pasture at Mitra B site (heterogeneous botanical composition; dry matter yield of
MitraGM= 4.57CMR - 18624
R2 = 0,66
DM = 0.47CMR - 1378R2 = 0.48
0
5000
10000
15000
20000
25000
30000
4000 5000 6000 7000 8000 9000
CMR
Gre
en a
nd D
ry M
atte
r, kg
ha-1
Green Matter Dry Matter
Currais
GM = 1.94CMR - 6951R2 = 0.98
DM = 0.37CMR - 982R2 = 0.90
0
2000
4000
6000
8000
10000
Gre
en a
nd D
ry M
atte
r, kg
ha-1
Green Matter Dry Matter
Barrocal
DM = 0.42CMR - 1315R2 = 0.87
GM = 2.30CMR - 7385R2 = 0.92
0
2000
4000
6000
8000
10000
12000
14000
Gre
en a
nd D
ry M
atte
r, kg
ha-1
Green Matter Dry Matter
4000 5000 6000 7000 8000 9000
4000 5000 6000 7000 8000 9000
CMR
CMR
Fig. 7 Calibration equations between the capacitance (CMR) readings and measured green (GM) and drymatter yield (DM) in three sites
870 Precision Agric (2011) 12:860–875
123
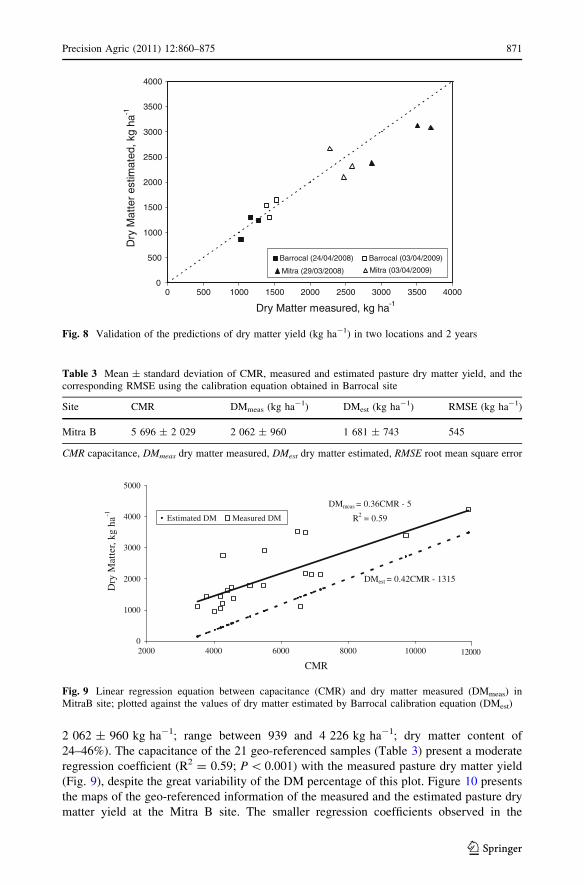
2 062 ± 960 kg ha-1; range between 939 and 4 226 kg ha-1; dry matter content of
24–46%). The capacitance of the 21 geo-referenced samples (Table 3) present a moderate
regression coefficient (R2 = 0.59; P \ 0.001) with the measured pasture dry matter yield
(Fig. 9), despite the great variability of the DM percentage of this plot. Figure 10 presents
the maps of the geo-referenced information of the measured and the estimated pasture dry
matter yield at the Mitra B site. The smaller regression coefficients observed in the
0
500
1000
1500
2000
2500
3000
3500
4000
0 500 1000 1500 2000 2500 3000 3500 4000
Dry Matter measured, kg ha-1
Dry
Mat
ter
estim
ated
, kg
ha-1
Barrocal (24/04/2008)
Mitra (29/03/2008)
Barrocal (03/04/2009)
Mitra (03/04/2009)
Fig. 8 Validation of the predictions of dry matter yield (kg ha-1) in two locations and 2 years
Table 3 Mean ± standard deviation of CMR, measured and estimated pasture dry matter yield, and thecorresponding RMSE using the calibration equation obtained in Barrocal site
Site CMR DMmeas (kg ha-1) DMest (kg ha-1) RMSE (kg ha-1)
Mitra B 5 696 ± 2 029 2 062 ± 960 1 681 ± 743 545
CMR capacitance, DMmeas dry matter measured, DMest dry matter estimated, RMSE root mean square error
DMest = 0.42CMR - 1315
DMmeas = 0.36CMR - 5
R2 = 0.59
0
1000
2000
3000
4000
5000
2000 4000 6000 8000 10000
CMR
Dry
Mat
ter,
kg h
a-1 Estimated DM Measured DM
12000
Fig. 9 Linear regression equation between capacitance (CMR) and dry matter measured (DMmeas) inMitraB site; plotted against the values of dry matter estimated by Barrocal calibration equation (DMest)
Precision Agric (2011) 12:860–875 871
123
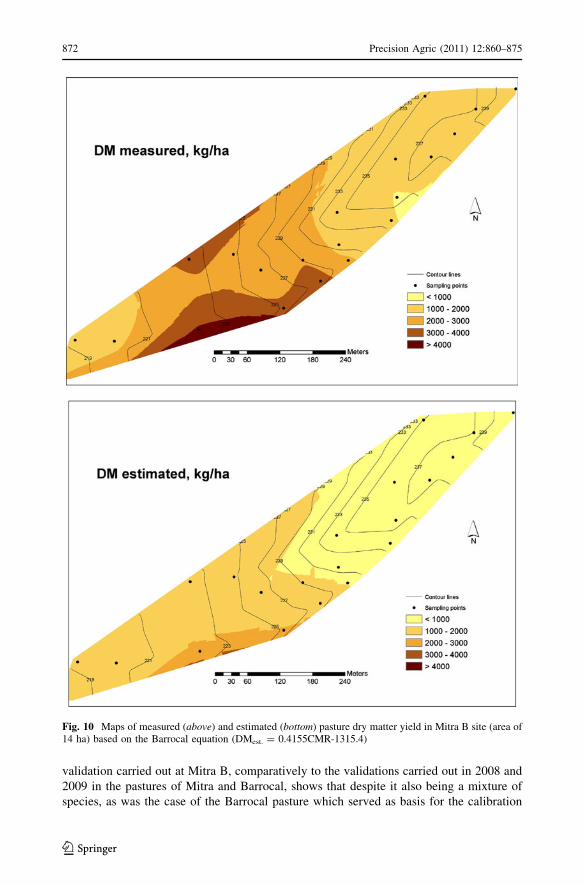
validation carried out at Mitra B, comparatively to the validations carried out in 2008 and
2009 in the pastures of Mitra and Barrocal, shows that despite it also being a mixture of
species, as was the case of the Barrocal pasture which served as basis for the calibration
Fig. 10 Maps of measured (above) and estimated (bottom) pasture dry matter yield in Mitra B site (area of14 ha) based on the Barrocal equation (DMest. = 0.4155CMR-1315.4)
872 Precision Agric (2011) 12:860–875
123
equation, it will be necessary to carry out a study of the different mixtures of botanical
species that are more widely used in the region.
Due to the degree of uncertainty associated with calibration and validation of this
capacitance probe, specially in legumes species (Mitra site), its general application should
be approached with some reservation, with regard to estimation of pasture dry matter yield
in Mediterranean conditions; a fact quoted by other authors. Cauduro et al. (2006) obtained
poor regression coefficients (R2 = 0.149) and have acknowledged susceptible error fac-
tors, such as the existence of a high quantity of dead vegetation in the form of hay at the
soil surface. Murphy et al. (1995) and Virkajarvi (1999) reported moderate mean regres-
sion coefficients (R2 = 0.42 and R2 = 0.44, respectively). Currie et al. (1987) have reg-
istered a moderate overall regression coefficient (R2 = 0.50) with the linear calibration
equation being statistically significant between the probe readings and green and dry
weight of forage for all regressions. The proportion of variance (R2) accounted for by the
model presented by Donovan et al. (2002) was 72%.
The results obtained in this work demonstrate the need for calibration of the probe not
only in relation to the different botanical species found in the Mediterranean flora, but also,
within each species, to the different vegetative development stages. This characteristic has
already been reported by other research teams, such as Virkajarvi (1999), Sanderson et al.
(2001) and Zanine et al. (2006). Also the Grassmaster manufacturer, although providing
reference equations for estimating pasture mass (Eqs. 1 and 2), emphasizes the need for
adjusting the calibration equations according to the characteristics of the pasture. Thus, it is
important that in future capacity probe calibrations, the botanical issues be studied in more
detail, in order to clarify whether the specific characteristics of the legumes morphology,
usually with higher water content than the grasses or other species, and with a creeping
growth habit, require a different procedure for the readings with the capacitance probe.
According to Hanna et al. (1999), seasonal adjustments to calibration equations were found
to be necessary as the moisture content of pasture vegetation varies with season and live/
dead material ratio.
The fact that the validation of regression equations in 2008 and 2009 shows a difference
of less than or equal to 20%, between the measured and the estimated dry matter per
hectare (Fig. 8) is very positive and, in practice, these deviations from the regression line
are not an obstacle for the pastureland managers to quantify the dry matter available for
animal grazing and for application of precision management techniques.
It is foreseen that the data obtained in this work, together with other data obtained by the
Grassmaster II manufacturer be used to review the existing equations and produce more
robust and consistent ones. On the other hand, the manufacturer is presently working on
developing another instrument to quickly advise the percentage of DM of material on the
day in question (day of readings) and to input that data to the LCD interface. Measuring
the soil itself (with a cropped grass cover) might also be very informative, and replace the
‘‘air’’ readings. For Hanna et al. (1999), future devices should be insensitive to plant
moisture, thus permitting the remote dry weighing of pasture.
Conclusions
Regression equations were used to relate the directly measured dry matter mass with the
indirect estimates obtained using a Grassmaster II capacitance probe. In two of the three
locations of the experiment in typical Mediterranean pastures, the regression coefficients
were high (R2 = 0.90, P \ 0.01 in grasses; and R2 = 0.87, P \ 0.001 in heterogeneous
Precision Agric (2011) 12:860–875 873
123

botanical mixture). In legumes, the regression coefficient was moderate (R2 = 0.48;
P \ 0.05).
In 2008 and 2009, the prediction equations were validated in two of the locations, with a
deviation equal to or less than 20% between the estimated and the measured pasture dry
matter yield and RSME values of 130 kg ha-1 in heterogeneous botanical composition and
456 kg ha-1 in legumes. Also, one of the calibration equations at real scale was validated,
with geo-referenced samples, leading to a moderate correlation (R2 = 0.59; P \ 0.001) in
a heterogeneous botanical mixture. The results indicate that the capacitance probe together
with a GPS receiver might support site-specific management of pastures which would be
useful in large areas.
These results also reinforce the recommendations of other works and of the Grassmaster
manufacturer in regards to the need for adjustment of the calibration equations in function
of pasture characteristics (species, live/dead material ratio) and of seasonal changes of the
moisture content of pasture vegetation.
This work is the starting point for a broader study, involving the manufacturer of the
Grassmaster probe, which will aim at covering a wider range of botanical species, in order
to test the applicability of the probe for estimating dry matter yield in pastures with mixed
species which are typical of the great biodiversity that characterize the Mediterranean flora.
Acknowledgments This project was sponsored by the AGRO Programme of the Ministry of Agricultureof Portugal. The authors would like to thank the availability and contribution of Novel Ways Electronic,manufacturer of the Grassmaster II probe, to the discussion of the results.
References
Agouridis, C., Stombaugh, T., Workman, S., Koostra, B., Edwards, D., & Vanzan, E. (2004). Suitability of aGPS collar for grazing studies. Transactions of the ASAE, 47, 1321–1329.
Aiken, G. E., & Bransby, D. I. (1992). Observer variability for disk meter measurements of forage mass.Agronomy Journal, 84, 603–605.
Bailey, J. S., Wang, K., Jordan, C., & Higgins, A. (2001). Use of precision agriculture technology toinvestigate spatial variability in nitrogen yields in cut grassland. Chemosphere, 42, 131–140.
Barbari, M., Conti, L., Koostra, B., Masi, G., Sorbetti Guerri, F., & Workman, S. (2006). The use of globalpositioning and geographical information systems in the management of extensive cattle grazing.Biosystems Engineering, 95, 271–280.
Cauduro, G. F., Carvalho, P., Barbosa, C., Lunardi, R., Pilau, A., Freitas, F., & Silva, J. (2006). Comparacaode metodos de medida indirecta de massa de forragem em pasto de azevem anual (Lolium MultiflorumLam.). (Comparision of indirect methods for measuring forage mass under annual ryegrass ((LoliumMultiflorum Lam.)). Ciencia Rural, 36, 1617–1623 (in Portuguese).
Currie, P. O., Hilken, T. O., & White, R. S. (1987). Evaluation of a single probe capacitance meter forestimating herbage yield. Journal of Range Management, 40, 537–541.
Donovan, M., Dillon, P., Rath, M., & Stakelum, G. (2002). A comparison of four methods of pasture massestimation. Irish Journal of Agricultural and Food Research, 41, 17–29.
Franca, A., Roggero, P., Porqueddu, C., & Caredda, S. (2003). The use of the Grassmaster as a simplifiedmethod to estimate dry matter yield on annual self-reseeding medics and clovers. Italian Journal ofAgronomy, 7, 103–110.
Ganguli, A., Vermeire, L., Mitchell, R., & Wallace, M. (2000). Comparison of four nondestructive tech-niques for estimating standing crop in shortgrass plains. Agronomy Journal, 92, 1211–1215.
Hanna, M., Steyn-Ross, D., & Steyn-Ross, M. (1999). Estimating biomass for New Zealand pasture usingoptical remote sensing techniques. Geocarto International, 14, 89–94.
Hirata, M. (2000). Quantifying spatial heterogeneity in herbage mass and consumption in pastures. Journalof Range Management, 53, 315–321.
Hutchings, N. (1991). Spatial heterogeneity and other sources of variance in sward height as measured bythe sonic and HFRO sward stick. Grass Forage Science, 46, 277–282.
874 Precision Agric (2011) 12:860–875
123
Karl, M. G., & Nicholson, R. A. (1987). Evaluation of the forage disk method in mixed grass rangeland inKansas. Journal of Range Management, 40, 467–471.
King, J., Dampney, P., Lark, R., Wheeler, H., Bradley, R., & Mayr, T. (2005). Mapping potential cropmanagement zones within fields: Use of yield-map series and patterns of soil physical propertiesidentified by electromagnetic induction sensing. Precision Agriculture, 6, 167–181.
Murphy, W. M., Silman, J. P., & Mena Barreto, A. D. (1995). A comparison of quadrat, capacitance meter,HFRO sward stick, and rising plate meter for estimating herbage mass in a smooth-stalked mead-owgrass-dominant white clover sward. Grass Forage Science, 50, 452–455.
Ogura, S., & Hirata, M. (2001). Two-dimensional monitoring of spatial distribution of herbage mass in abahia grass (Paspalum notatum Flugge) pasture grazed with cattle. Grassland Science, 47, 453–459.
Reese, G., Bayn, R., & West, N. (1980). Evaluation of double-sampling estimators of subalpine herbageproduction. Journal of Range Management, 33, 300–306.
Rook, A. J., Dumont, B., Isselstein, J., Osoro, K., Wallis, D., Parente, G., et al. (2004). Matching type oflivestock to desired biodiversity outcomes in pastures—a review. Biology Conservation, 119, 137–150.
Sanderson, M. A., Rotz, C. A., Fultz, S. W., & Rayburn, E. B. (2001). Estimating forage ass with a commercialcapacitance meter, rising plate meter, and pasture ruler. Agronomy Journal, 93, 1281–1286.
Schellberg, J., Hill, M. J., Gerhards, R., Rothmund, M., & Braun, M. (2008). Precision agricultureon grassland: Applications, perspectives and constraints. European Journal of Agronomy, 29, 59–71.doi:10.1016/j.eja.2008.05.005.
Sharrow, S. (1984). A simple disc meter for measurement of pasture height and forage bulk. Journal ofRange Management, 37, 94–95.
Silva, S. C., & Cunha, W. F. (2003). Metodos indiretos para estimar a massa de forragem em pastos deCynodon spp. (Indirect methods for estimating herbage mass in Cynodon spp. swards). PesquisaAgropecuaria Brasileira, 38, 981–989 (in Portuguese).
Stockdale, C., & Kelly, K. (1984). A comparison of a rising-plate meter and an electronic capacitance meterfor estimating the yield of pastures grazed by dairy cows. Grass and Forage Science, 39, 391–394.
Turner, L., Udal, M., Larson, B., & Shearer, S. (2000). Monitoring cattle behavior and pasture use with GPSand GIS. Canadian Journal of Animal Science, 80, 405–413.
Vickery, P. J., & Nicol, G. R. (1982). An improved electronic capacitance meter for estimating pastureyield: Construction details and performance tests (pp. 1–22). Australian Animal Research Laboratoriestechnical paper no. 9. Armidale: CSIRO.
Virkajarvi, P. (1999). Comparison of three indirect methods for prediction of herbage mass on timothy-meadow fescue pastures. Soil and Plant Science, 49, 75–81.
Zanine, A. M., Santos, E. M., & Ferreira (2006). Principales metodos de evaluacion de pasturas (Mainmethodologies for evaluation of pastures). Revista Electronica de Veterinaria REDVET, Espana,VII(11), 1–13 (in Spanish).
Precision Agric (2011) 12:860–875 875
123