
Calibrating whole building energy models: An evidence-based methodology
9
Energy and Buildings 43 (2011) 2356–2364 Contents lists available at ScienceDirect Energy and Buildings j our na l ho me p age: www.elsevier.com/locate/enbuild Calibrating whole building energy models: An evidence-based methodology Paul Raftery a,∗ , Marcus Keane a , James O’Donnell b a Informatics Research Unit for Sustainable Engineering, National University of Ireland, Galway, Ireland b Building Technologies Divisions, Lawrence Berkeley National Laboratory, CA, USA a r t i c l e i n f o Article history: Received 13 March 2011 Received in revised form 23 May 2011 Accepted 28 May 2011 Keywords: Methodology Calibration Simulation Whole building energy model Version control Retrofit a b s t r a c t This paper reviews existing case studies and methods for calibrating whole building energy models to measured data. This research describes a systematic, evidence-based methodology for the calibration of these models. Under this methodology, parameter values in the final calibrated model reference the source of information used to make changes to the initial model. Thus, the final model is based solely on evidence. Version control software stores a complete record of the calibration process, and the evidence on which the final model is based. Future users can review the changes made throughout the calibration process along with the supporting evidence. In addition to the evidence-based methodology, this paper also describes a new zoning process that represents the real building more closely than the typical core and four perimeter zone approach. Though the methodology is intended to apply to detailed calibration studies with high resolution measured data, the primary aspects of the methodology (evidence-based approach, version control, and zone-typing) are independent of the available measured data. © 2011 Elsevier B.V. All rights reserved. 1. Introduction Buildings account for approximately 24% of total energy con- sumption globally and up to 40% in developed countries [1]. However, buildings are widely reported to operate inefficiently [2,3], and thus, improving the performance of buildings is a key area on which to focus when reducing energy consumption. Simulation is commonly held to be the best practice approach to performance analysis in the building industry [4]. However, there are significant discrepancies between simulation results and the actual measured consumption of real buildings. In a large study of 121 buildings, correlations between measured and simulated design consump- tion ranged between 0.25 and 2.5 [5]. This study, and many others [6–10], show that significant improvement is required if whole building energy simulation is to become a more reliable tool in the design process. Calibrating these models to measured data presents many ben- efits: • The calibrated models themselves can be used to identify and estimate savings as well as support investment grade Energy Con- servation Measures (ECM) by analysing retrofit options in detail. ∗ Corresponding author. Tel.: +353 91 49 3086. E-mail addresses: [email protected], [email protected] (P. Raftery), [email protected] (M. Keane), [email protected] (J. O’Donnell). • In a research context, the knowledge gained during the calibra- tion process can be used to guide the development of simulation tools and identify areas which require further research. • Also in a research context, the calibration process can provide feedback to improve the quality of future design stage models by identifying common mistaken assumptions in these models and by developing best-practice modelling procedures. However, there are issues with calibrated simulation today. A thorough literature review [11] of calibrated whole building energy simulation case studies discussed these issues in detail. The sheer number of parameters involved in whole building energy modelling and a general lack of sufficient information about buildings yields a vast, under-determined parameter space [12]. Although there are standard criteria for determining when a model can be considered calibrated [13–15], these criteria focus on determining how well the model matches utility level annual data measured at monthly (or hourly) intervals and do not explicitly describe a method by which to calibrate a model. This lack of a formal methodology yield results that are “highly dependent on the personal judgment of the analyst doing the calibration” [11]. The methodology used is often not discussed in detail in many case studies and an approach in which the analyst tunes, or “fudges” [16], some of the myr- iad parameters until the model meets the acceptance criteria is commonly used. These ad-hoc, subjective approaches are not sys- tematic and not explicitly evidence-based. Aside from these issues, there is a general lack of sufficient mea- sured data in calibrated simulation studies. Most studies analyse 0378-7788/$ – see front matter © 2011 Elsevier B.V. All rights reserved. doi:10.1016/j.enbuild.2011.05.020
Transcript of Calibrating whole building energy models: An evidence-based methodology
Journal Identification = ENB Article Identification = 3228 Date: July 19, 2011 Time: 7:43 pm
C
Pa
b
a
ARRA
KMCSWVR
1
sH[oiadcct[bd
e
•
m
0d
Energy and Buildings 43 (2011) 2356–2364
Contents lists available at ScienceDirect
Energy and Buildings
j our na l ho me p age: www.elsev ier .com/ locate /enbui ld
alibrating whole building energy models: An evidence-based methodology
aul Rafterya,∗, Marcus Keanea, James O’Donnellb
Informatics Research Unit for Sustainable Engineering, National University of Ireland, Galway, IrelandBuilding Technologies Divisions, Lawrence Berkeley National Laboratory, CA, USA
r t i c l e i n f o
rticle history:eceived 13 March 2011eceived in revised form 23 May 2011ccepted 28 May 2011
eywords:
a b s t r a c t
This paper reviews existing case studies and methods for calibrating whole building energy models tomeasured data. This research describes a systematic, evidence-based methodology for the calibrationof these models. Under this methodology, parameter values in the final calibrated model reference thesource of information used to make changes to the initial model. Thus, the final model is based solely onevidence. Version control software stores a complete record of the calibration process, and the evidence
ethodologyalibrationimulationhole building energy model
ersion controletrofit
on which the final model is based. Future users can review the changes made throughout the calibrationprocess along with the supporting evidence. In addition to the evidence-based methodology, this paperalso describes a new zoning process that represents the real building more closely than the typical coreand four perimeter zone approach. Though the methodology is intended to apply to detailed calibrationstudies with high resolution measured data, the primary aspects of the methodology (evidence-basedapproach, version control, and zone-typing) are independent of the available measured data.
© 2011 Elsevier B.V. All rights reserved.
. Introduction
Buildings account for approximately 24% of total energy con-umption globally and up to 40% in developed countries [1].owever, buildings are widely reported to operate inefficiently
2,3], and thus, improving the performance of buildings is a key arean which to focus when reducing energy consumption. Simulations commonly held to be the best practice approach to performancenalysis in the building industry [4]. However, there are significantiscrepancies between simulation results and the actual measuredonsumption of real buildings. In a large study of 121 buildings,orrelations between measured and simulated design consump-ion ranged between 0.25 and 2.5 [5]. This study, and many others6–10], show that significant improvement is required if wholeuilding energy simulation is to become a more reliable tool in theesign process.
Calibrating these models to measured data presents many ben-fits:
The calibrated models themselves can be used to identify andestimate savings as well as support investment grade Energy Con-servation Measures (ECM) by analysing retrofit options in detail.
∗ Corresponding author. Tel.: +353 91 49 3086.E-mail addresses: [email protected], [email protected] (P. Raftery),
[email protected] (M. Keane), [email protected] (J. O’Donnell).
378-7788/$ – see front matter © 2011 Elsevier B.V. All rights reserved.oi:10.1016/j.enbuild.2011.05.020
• In a research context, the knowledge gained during the calibra-tion process can be used to guide the development of simulationtools and identify areas which require further research.
• Also in a research context, the calibration process can providefeedback to improve the quality of future design stage models byidentifying common mistaken assumptions in these models andby developing best-practice modelling procedures.
However, there are issues with calibrated simulation today. Athorough literature review [11] of calibrated whole building energysimulation case studies discussed these issues in detail. The sheernumber of parameters involved in whole building energy modellingand a general lack of sufficient information about buildings yields avast, under-determined parameter space [12]. Although there arestandard criteria for determining when a model can be consideredcalibrated [13–15], these criteria focus on determining how wellthe model matches utility level annual data measured at monthly(or hourly) intervals and do not explicitly describe a method bywhich to calibrate a model. This lack of a formal methodology yieldresults that are “highly dependent on the personal judgment ofthe analyst doing the calibration” [11]. The methodology used isoften not discussed in detail in many case studies and an approachin which the analyst tunes, or “fudges” [16], some of the myr-iad parameters until the model meets the acceptance criteria is
commonly used. These ad-hoc, subjective approaches are not sys-tematic and not explicitly evidence-based.Aside from these issues, there is a general lack of sufficient mea-sured data in calibrated simulation studies. Most studies analyse

Journal Identification = ENB Article Identification = 3228 Date: July 19, 2011 Time: 7:43 pm
Build
mwsnwptcowsat[ost
sti3sib
woisdsp
asmito
P. Raftery et al. / Energy and
odel error using monthly data [11], or combine monthly dataith further daily [17], or hourly [18,19] spot measurement over
hort periods. However, monthly data analyses can easily miss sig-ificant errors at a daily or hourly resolution. Only one case studyas found that analyses error using hourly data for a significanteriod of time (9 months) [20]. In addition to errors missed dueo a lack of hourly measured data, there can be significant inac-uracies in a model at a sub-utilities level. These inaccuracies canffset each other to yield results that match the measured data at ahole building level, but in reality, the model may be a poor repre-
entation of the actual building. Few studies report results for errornalysis on a sub-utilities (or end-use) basis despite suggestionshat this would aid significantly in improving simulation accuracy21,22]. The methodology outlined in this paper focuses primarilyn applications where hourly, sub-utilities measured energy con-umption data, however, aspects of the methodology can be appliedo any calibration effort.
Furthermore, many case studies do not describe the zoningtrategy used in the model. There is a need to explicitly describehis as it can have a significant effect on the results. Typical zon-ng strategies use a core and four perimeter zone approach. Section.3.1 discusses issues related to this approach and presents a newtrategy that yields a more accurate representation of the build-ng, while stopping short of representing each thermal zone in theuilding by a zone in model.
Reddy et al. [23] proposed an new formal method for calibratinghole building energy models to monthly measured data. An audit
f the building is performed and a first stage model of the buildings created using input templates for the specific building and HVACystem type. A parametric optimisation analysis is then used toetermine a number of calibrated models for the building. A mea-ure of the uncertainty in the results is obtained by investigatingroposed ECMs on the solution set.
Despite the numerous published case studies, there is still noccepted standard method for calibrating a model. Many publishedtudies do not explicitly describe the methods used to calibrate the
odel, or the zoning strategy that was used. Based on the exist-ng literature review [11] and other case studies since that date,he current approach to calibrating a model is at best based on anptimisation process used to identify multiple solutions within a
Fig. 1. Contrasting the properties of current and pr
ings 43 (2011) 2356–2364 2357
parameter space identified from a knowledge-base of templatesof influential parameters [23]. At worst, it is based on an ad hocapproach in which the analyst manually tunes the myriad parame-ters until a solution is obtained. The former approach is very usefulin the majority of cases in which only monthly utility bill dataand limited resources for further measurement are available. It candraw accurate conclusions for ECMs that yield savings of more than10% of total energy consumption [24]. However, the methodologyuses building and HVAC templates, and thus, does not account forthe fact that each building is unique. The process works well forcoarse models, with a limited number of parameters in the optimi-sation process (24 were used in the paper [24]). However, it doesnot provide the analyst with a comparison between measured andsimulated building performance at a detailed level (e.g., energy con-sumption at a sub-utilities level). For example, when examiningthe performance of a HVAC system using an optimisation calibra-tion technique and utility bill measured data, parameters related tointernal loads can easily overwhelm the results of the calibrationeffort. Thus, it is not an acceptable approach if the aim is to obtaindetailed results to drive the development of simulation tools andbest practice modelling techniques.
This paper presents a systematic, evidence-based approach tocalibrated simulation. This approach yields a calibrated model thatis based solely on referenced sources of information about thebuilding. Although the process produces a single, deterministicmodel for an inherently stochastic process (building operation),such an approach can produce meaningful conclusions where sub-utilities hourly measured data and significant resources for furtherinvestigation and measurement are available.
2. Concepts behind the methodology
There have been numerous excellent case studies [24–30]involving calibrated models since the date of publication of theliterature review discussed in Section 1. However, each of the
methods and case studies in all of the reviewed literature haveat least one (and sometimes several) of the properties on the leftof Fig. 1. The proposed methodology builds on some of the besttechniques from the reviewed literature and combines these withoposed approaches to calibrated simulation.
Journal Identification = ENB Article Identification = 3228 Date: July 19, 2011 Time: 7:43 pm
2 Build
at
2
mcbpaussbtass
itcmTiaaswbasIci
2
bAWseraamroatcibitctaEttdo
358 P. Raftery et al. / Energy and
n evidence-based approach that uses version control software torack the calibration process.
.1. Evidence-based calibration
It is necessary to bring the principle of evidence based decision-aking to the calibration process. To improve the reliability of
alibrated models, changes to the input parameters should onlye made according to available evidence under clearly definedriorities. For example, information obtained by measurement isssumed to be a more reliable source of evidence than as-built doc-mentation. Thus, a hierarchy of sources (hereafter referred to asource hierarchy) must be defined for each project. The order of theources in the source hierarchy is indicative of the (assumed) relia-ility of the source of evidence. Changes should not be made unlesshe evidence comes from a more reliable source in the source hier-rchy. Though the quality and availability of data and informationources will vary on a project by project basis, Section 3.1.4 gives auggested list of categories of evidence for the source hierarchy.
In order to improve the reproducibility of the calibration processt is necessary to keep a history of the decisions made along withhe evidence on which these decisions were based. The entire pro-ess should be available for review by future users of the calibratedodel. This can be accomplished using version control software.
his software issues a new version of the model whenever a mod-fication is made and automatically stores all previous versions in
repository, allowing any user to review the calibration process at later date. A description of the change is also stored with eachuccessive version along with the evidence on which the changeas based. This ensures that changes are not made on an ad hoc
asis and that the supporting evidence will be available to multiplenalysts and future users. The use of version control software alsoerves to organise an analyst’s approach to the calibration process.n addition, the software can automatically and reliably identifyhanges between revisions or revert to a previous revision if theres an unexpected problem with the new model.
.2. Detailed models
Simulation tools represent continuous, stochastic processes inuildings by discrete time-step, deterministic model estimations.ll models make assumptions when representing real buildings.hen using detailed high-resolution measured data (i.e., hourly,
ub-utilities), and significant levels of building information, it isssential to use detailed models to represent the building as accu-ately as possible. Simplifications and approximations should bevoided where possible. For example, cancelling errors caused byggregate zoning strategies should be minimised. The zone-typingethod (described later in Section 3.3.1) provides a means of
educing these errors. Detailed models more closely represent theperation of the real building and allow ECMs to be investigatedt finer resolution, using fewer assumptions. For example, an ECMhat only affects a specific zone or group of zones (e.g. communi-ations rooms, or bathrooms) can be evaluated quickly and easilyn a detailed model without many of the assumptions that woulde necessary when using a model with a core and 4 perimeter zon-
ng strategy. Furthermore, in order to represent the operation ofhe building as accurately as possible, the simulation tool that isurrently most capable of simulating the building and HVAC sys-ems should be chosen. In other words, the more capable, advanced,nd well-documented simulation tools, such as EnergyPlus [31] orsp-r [32], should be used to create the model intended for calibra-
ion. Also, to ensure that feedback from the research can be usedo further improve upon the tool, a simulation tool actively underevelopment should be chosen regardless of user-friendliness ofther available tools.ings 43 (2011) 2356–2364
3. Methodology
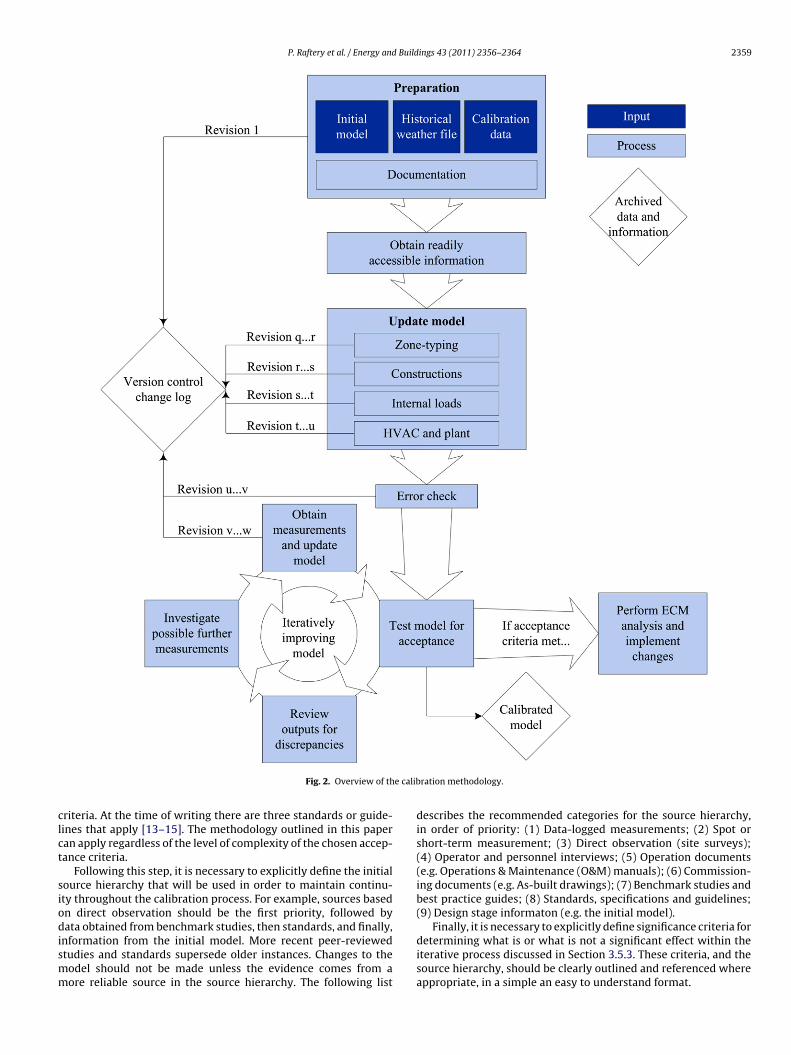
Fig. 2 illustrates an overview of the methodology for calibrat-ing a model to measured data under the evidence-based methoddiscussed in Section 2.1.
3.1. Preparation
The first step is to set up the version control software to trackthe revision history of the calibration project. Virtually any versioncontrol software can be used, however, there are several essentialcapabilities: (a) maintain a change log or revision history of theentire project; (b) force users to make an entry to the change logwith each revision; (c) prohibit retro-active changes to revisions;(d) no limitations on file sizes or file types; (e) no limitation on totalproject size; (f) allow nested folders (to facilitate evidence storage);(g) remote access (to allow multiple analysts to work on the sameproject).
Once the version control software has been installed, the prepa-ration stage becomes the first model revision. The first revisionincludes: the initial model; the historical weather file used for thesimulation period; the measured energy consumption data used totest the model for acceptance; and documentation templates.
3.1.1. Initial modelThis methodology assumes that an initial whole building energy
model was created at the design stage and is available as a start-ing point for the calibration process. However, the quality andcomplexity of this model may not match with detailed modelrequirements, and significant portions of this model, particularlythose related to zoning strategy, may need to be recreated accord-ing to the zone-typing method (described in Section 3.3.1).
Whole building energy simulation is becoming more commonwith the increasing focus on energy efficient building design, andmodelling requirements such as those driven by the LEED ratingsystem [33] and California Title 24 [34]. However, it is still commonthat no initial model is available. In this case, one can be createdaccording to design information, standards and best-practice mod-els [35].
3.1.2. Historical weather dataIt is absolutely essential to use a historical weather-file when
running the model in order to assess whether or not it is calibratedto the acceptance criteria. This weather-file should include all ofthe variables which have a significant effect on the building andshould be measured at the building itself where possible. How-ever, in many cases this data is not available on-site, and othersources, such as national meteorological services and environmen-tal agencies, local universities and research laboratories, must bepursued.
3.1.3. Calibration dataThe calibration data used to evaluate whether the model meets
the acceptance criteria should be collected and stored in the prepa-ration stage. For the majority of guidelines and standards availableat the time of writing, this data is monthly energy consump-tion. However, for research applications, it is preferable that moredetailed measured data are used which contain hourly, sub-utilitiesmeasured data.
3.1.4. DocumentationThis section describes the required documentation for the cali-
bration process: the acceptance criteria; the source hierarchy; andthe significance criteria.
The analyst defines which criteria to use in order to determinewhen the model is considered calibrated. These are the acceptance
Journal Identification = ENB Article Identification = 3228 Date: July 19, 2011 Time: 7:43 pm
P. Raftery et al. / Energy and Buildings 43 (2011) 2356–2364 2359
e calib
clct
siodismm
Fig. 2. Overview of th
riteria. At the time of writing there are three standards or guide-ines that apply [13–15]. The methodology outlined in this paperan apply regardless of the level of complexity of the chosen accep-ance criteria.
Following this step, it is necessary to explicitly define the initialource hierarchy that will be used in order to maintain continu-ty throughout the calibration process. For example, sources basedn direct observation should be the first priority, followed byata obtained from benchmark studies, then standards, and finally,
nformation from the initial model. More recent peer-reviewedtudies and standards supersede older instances. Changes to theodel should not be made unless the evidence comes from aore reliable source in the source hierarchy. The following list
ration methodology.
describes the recommended categories for the source hierarchy,in order of priority: (1) Data-logged measurements; (2) Spot orshort-term measurement; (3) Direct observation (site surveys);(4) Operator and personnel interviews; (5) Operation documents(e.g. Operations & Maintenance (O&M) manuals); (6) Commission-ing documents (e.g. As-built drawings); (7) Benchmark studies andbest practice guides; (8) Standards, specifications and guidelines;(9) Design stage informaton (e.g. the initial model).
Finally, it is necessary to explicitly define significance criteria for
determining what is or what is not a significant effect within theiterative process discussed in Section 3.5.3. These criteria, and thesource hierarchy, should be clearly outlined and referenced whereappropriate, in a simple an easy to understand format.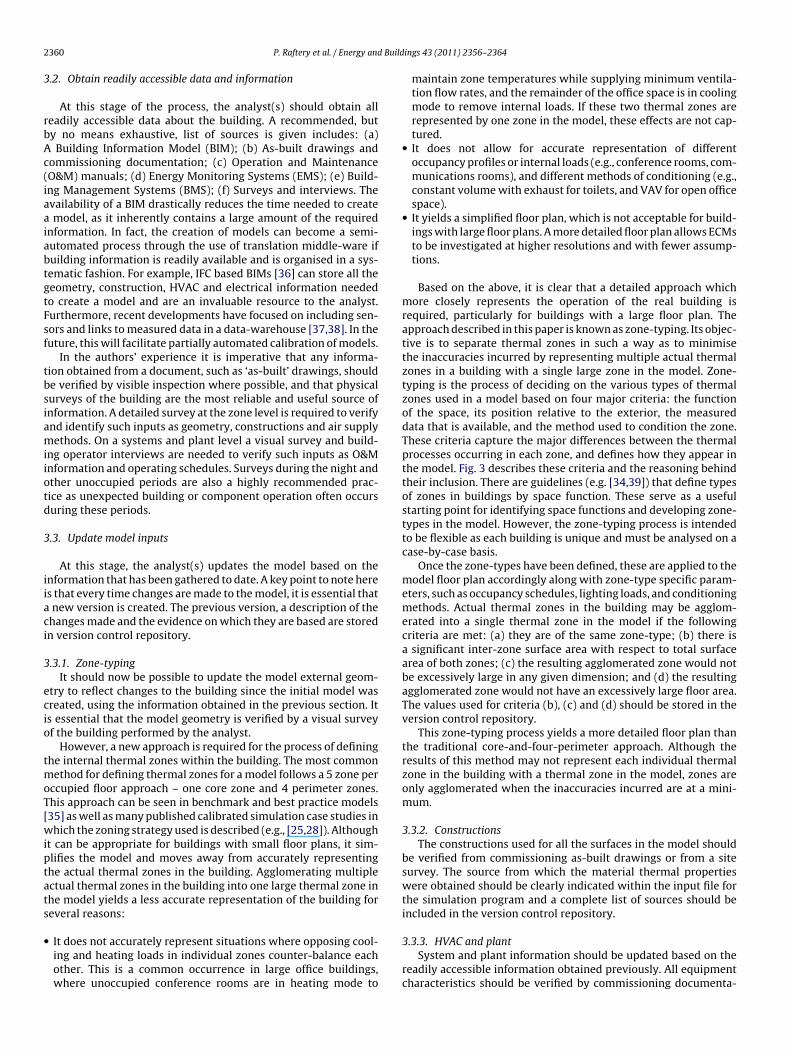
Journal Identification = ENB Article Identification = 3228 Date: July 19, 2011 Time: 7:43 pm
2 Build
3
rbAc(iaaiabtgtFsf
tbsiamiiotd
3
iiaci
3
ecio
tmoT[wiptats
•
360 P. Raftery et al. / Energy and
.2. Obtain readily accessible data and information
At this stage of the process, the analyst(s) should obtain alleadily accessible data about the building. A recommended, buty no means exhaustive, list of sources is given includes: (a)
Building Information Model (BIM); (b) As-built drawings andommissioning documentation; (c) Operation and MaintenanceO&M) manuals; (d) Energy Monitoring Systems (EMS); (e) Build-ng Management Systems (BMS); (f) Surveys and interviews. Thevailability of a BIM drastically reduces the time needed to create
model, as it inherently contains a large amount of the requirednformation. In fact, the creation of models can become a semi-utomated process through the use of translation middle-ware ifuilding information is readily available and is organised in a sys-ematic fashion. For example, IFC based BIMs [36] can store all theeometry, construction, HVAC and electrical information neededo create a model and are an invaluable resource to the analyst.urthermore, recent developments have focused on including sen-ors and links to measured data in a data-warehouse [37,38]. In theuture, this will facilitate partially automated calibration of models.
In the authors’ experience it is imperative that any informa-ion obtained from a document, such as ‘as-built’ drawings, shoulde verified by visible inspection where possible, and that physicalurveys of the building are the most reliable and useful source ofnformation. A detailed survey at the zone level is required to verifynd identify such inputs as geometry, constructions and air supplyethods. On a systems and plant level a visual survey and build-
ng operator interviews are needed to verify such inputs as O&Mnformation and operating schedules. Surveys during the night andther unoccupied periods are also a highly recommended prac-ice as unexpected building or component operation often occursuring these periods.
.3. Update model inputs
At this stage, the analyst(s) updates the model based on thenformation that has been gathered to date. A key point to note heres that every time changes are made to the model, it is essential that
new version is created. The previous version, a description of thehanges made and the evidence on which they are based are storedn version control repository.
.3.1. Zone-typingIt should now be possible to update the model external geom-
try to reflect changes to the building since the initial model wasreated, using the information obtained in the previous section. Its essential that the model geometry is verified by a visual surveyf the building performed by the analyst.
However, a new approach is required for the process of defininghe internal thermal zones within the building. The most common
ethod for defining thermal zones for a model follows a 5 zone perccupied floor approach – one core zone and 4 perimeter zones.his approach can be seen in benchmark and best practice models35] as well as many published calibrated simulation case studies inhich the zoning strategy used is described (e.g., [25,28]). Although
t can be appropriate for buildings with small floor plans, it sim-lifies the model and moves away from accurately representinghe actual thermal zones in the building. Agglomerating multiplectual thermal zones in the building into one large thermal zone inhe model yields a less accurate representation of the building foreveral reasons:
It does not accurately represent situations where opposing cool-ing and heating loads in individual zones counter-balance eachother. This is a common occurrence in large office buildings,where unoccupied conference rooms are in heating mode to
ings 43 (2011) 2356–2364
maintain zone temperatures while supplying minimum ventila-tion flow rates, and the remainder of the office space is in coolingmode to remove internal loads. If these two thermal zones arerepresented by one zone in the model, these effects are not cap-tured.
• It does not allow for accurate representation of differentoccupancy profiles or internal loads (e.g., conference rooms, com-munications rooms), and different methods of conditioning (e.g.,constant volume with exhaust for toilets, and VAV for open officespace).
• It yields a simplified floor plan, which is not acceptable for build-ings with large floor plans. A more detailed floor plan allows ECMsto be investigated at higher resolutions and with fewer assump-tions.
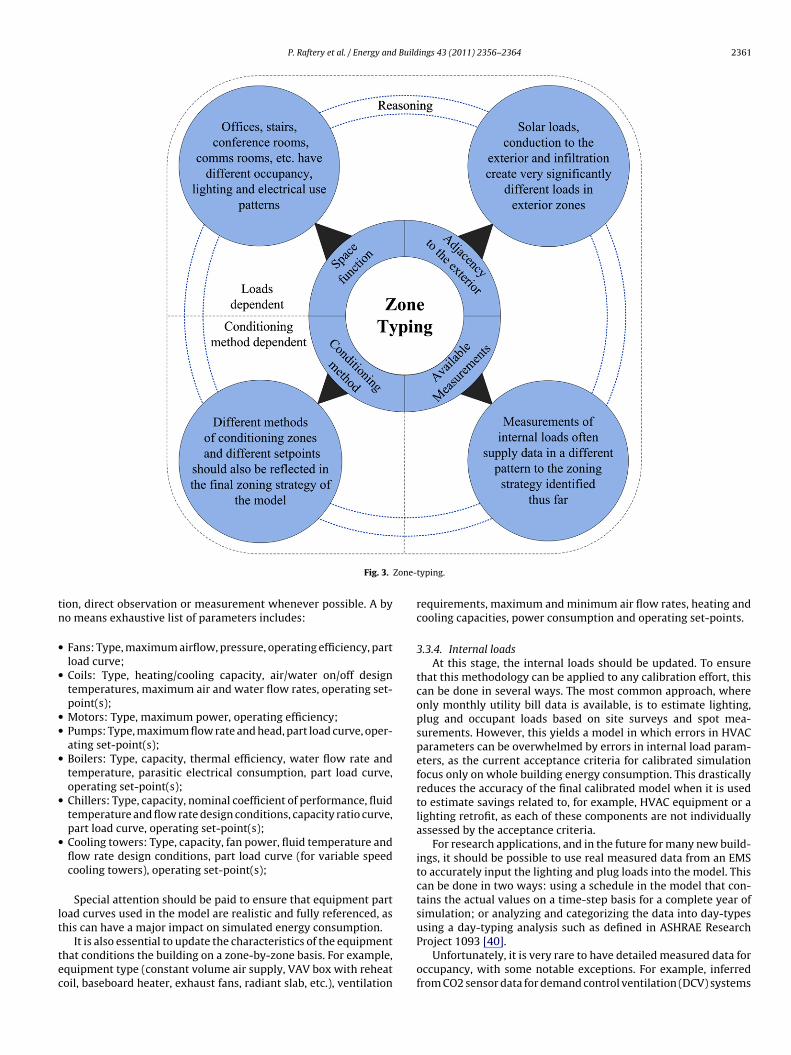
Based on the above, it is clear that a detailed approach whichmore closely represents the operation of the real building isrequired, particularly for buildings with a large floor plan. Theapproach described in this paper is known as zone-typing. Its objec-tive is to separate thermal zones in such a way as to minimisethe inaccuracies incurred by representing multiple actual thermalzones in a building with a single large zone in the model. Zone-typing is the process of deciding on the various types of thermalzones used in a model based on four major criteria: the functionof the space, its position relative to the exterior, the measureddata that is available, and the method used to condition the zone.These criteria capture the major differences between the thermalprocesses occurring in each zone, and defines how they appear inthe model. Fig. 3 describes these criteria and the reasoning behindtheir inclusion. There are guidelines (e.g. [34,39]) that define typesof zones in buildings by space function. These serve as a usefulstarting point for identifying space functions and developing zone-types in the model. However, the zone-typing process is intendedto be flexible as each building is unique and must be analysed on acase-by-case basis.
Once the zone-types have been defined, these are applied to themodel floor plan accordingly along with zone-type specific param-eters, such as occupancy schedules, lighting loads, and conditioningmethods. Actual thermal zones in the building may be agglom-erated into a single thermal zone in the model if the followingcriteria are met: (a) they are of the same zone-type; (b) there isa significant inter-zone surface area with respect to total surfacearea of both zones; (c) the resulting agglomerated zone would notbe excessively large in any given dimension; and (d) the resultingagglomerated zone would not have an excessively large floor area.The values used for criteria (b), (c) and (d) should be stored in theversion control repository.
This zone-typing process yields a more detailed floor plan thanthe traditional core-and-four-perimeter approach. Although theresults of this method may not represent each individual thermalzone in the building with a thermal zone in the model, zones areonly agglomerated when the inaccuracies incurred are at a mini-mum.
3.3.2. ConstructionsThe constructions used for all the surfaces in the model should
be verified from commissioning as-built drawings or from a sitesurvey. The source from which the material thermal propertieswere obtained should be clearly indicated within the input file forthe simulation program and a complete list of sources should beincluded in the version control repository.
3.3.3. HVAC and plantSystem and plant information should be updated based on the
readily accessible information obtained previously. All equipmentcharacteristics should be verified by commissioning documenta-
Journal Identification = ENB Article Identification = 3228 Date: July 19, 2011 Time: 7:43 pm
P. Raftery et al. / Energy and Buildings 43 (2011) 2356–2364 2361
Zone-
tn
•
•
••
•
•
•
lt
tec
Fig. 3.
ion, direct observation or measurement whenever possible. A byo means exhaustive list of parameters includes:
Fans: Type, maximum airflow, pressure, operating efficiency, partload curve;Coils: Type, heating/cooling capacity, air/water on/off designtemperatures, maximum air and water flow rates, operating set-point(s);Motors: Type, maximum power, operating efficiency;Pumps: Type, maximum flow rate and head, part load curve, oper-ating set-point(s);Boilers: Type, capacity, thermal efficiency, water flow rate andtemperature, parasitic electrical consumption, part load curve,operating set-point(s);Chillers: Type, capacity, nominal coefficient of performance, fluidtemperature and flow rate design conditions, capacity ratio curve,part load curve, operating set-point(s);Cooling towers: Type, capacity, fan power, fluid temperature andflow rate design conditions, part load curve (for variable speedcooling towers), operating set-point(s);
Special attention should be paid to ensure that equipment partoad curves used in the model are realistic and fully referenced, ashis can have a major impact on simulated energy consumption.
It is also essential to update the characteristics of the equipmenthat conditions the building on a zone-by-zone basis. For example,quipment type (constant volume air supply, VAV box with reheatoil, baseboard heater, exhaust fans, radiant slab, etc.), ventilation
typing.
requirements, maximum and minimum air flow rates, heating andcooling capacities, power consumption and operating set-points.
3.3.4. Internal loadsAt this stage, the internal loads should be updated. To ensure
that this methodology can be applied to any calibration effort, thiscan be done in several ways. The most common approach, whereonly monthly utility bill data is available, is to estimate lighting,plug and occupant loads based on site surveys and spot mea-surements. However, this yields a model in which errors in HVACparameters can be overwhelmed by errors in internal load param-eters, as the current acceptance criteria for calibrated simulationfocus only on whole building energy consumption. This drasticallyreduces the accuracy of the final calibrated model when it is usedto estimate savings related to, for example, HVAC equipment or alighting retrofit, as each of these components are not individuallyassessed by the acceptance criteria.
For research applications, and in the future for many new build-ings, it should be possible to use real measured data from an EMSto accurately input the lighting and plug loads into the model. Thiscan be done in two ways: using a schedule in the model that con-tains the actual values on a time-step basis for a complete year ofsimulation; or analyzing and categorizing the data into day-typesusing a day-typing analysis such as defined in ASHRAE Research
Project 1093 [40].Unfortunately, it is very rare to have detailed measured data foroccupancy, with some notable exceptions. For example, inferredfrom CO2 sensor data for demand control ventilation (DCV) systems
Journal Identification = ENB Article Identification = 3228 Date: July 19, 2011 Time: 7:43 pm
2 Build
ahoRdcpd
rb
3
rttistriaaoaccw
3
3
toEsutrwaliito
mttu
3
iimtampb
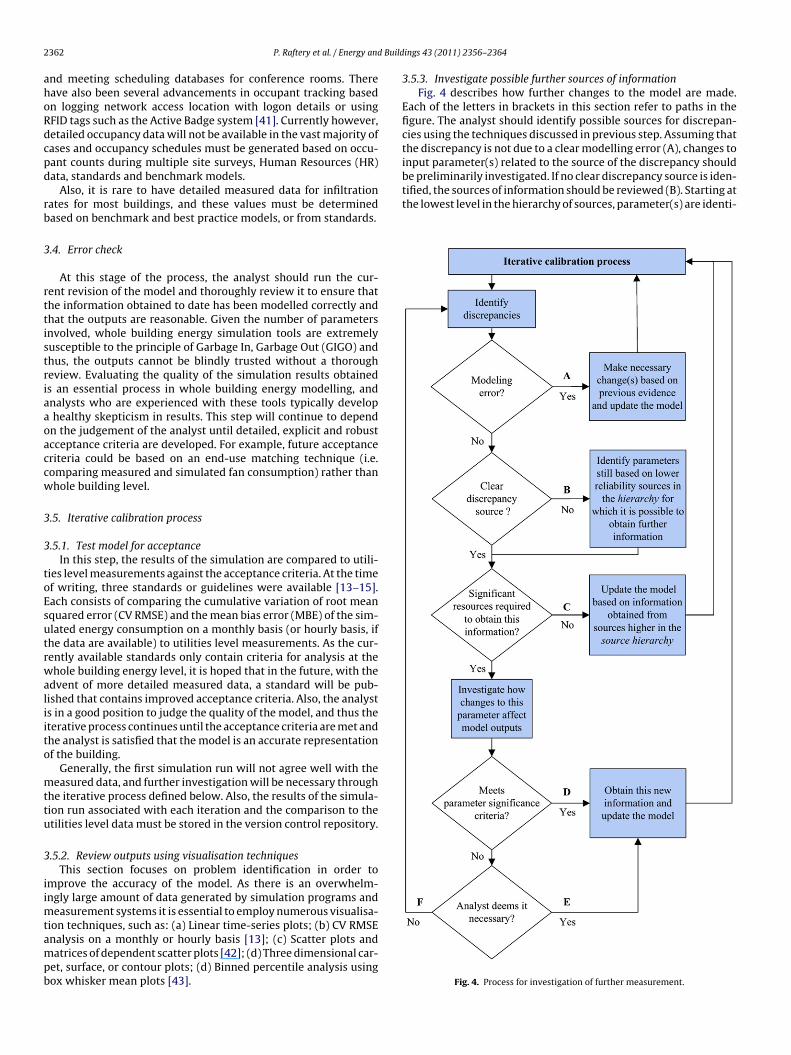
be preliminarily investigated. If no clear discrepancy source is iden-tified, the sources of information should be reviewed (B). Starting atthe lowest level in the hierarchy of sources, parameter(s) are identi-
362 P. Raftery et al. / Energy and
nd meeting scheduling databases for conference rooms. Thereave also been several advancements in occupant tracking basedn logging network access location with logon details or usingFID tags such as the Active Badge system [41]. Currently however,etailed occupancy data will not be available in the vast majority ofases and occupancy schedules must be generated based on occu-ant counts during multiple site surveys, Human Resources (HR)ata, standards and benchmark models.
Also, it is rare to have detailed measured data for infiltrationates for most buildings, and these values must be determinedased on benchmark and best practice models, or from standards.
.4. Error check
At this stage of the process, the analyst should run the cur-ent revision of the model and thoroughly review it to ensure thathe information obtained to date has been modelled correctly andhat the outputs are reasonable. Given the number of parametersnvolved, whole building energy simulation tools are extremelyusceptible to the principle of Garbage In, Garbage Out (GIGO) andhus, the outputs cannot be blindly trusted without a thorougheview. Evaluating the quality of the simulation results obtaineds an essential process in whole building energy modelling, andnalysts who are experienced with these tools typically develop
healthy skepticism in results. This step will continue to dependn the judgement of the analyst until detailed, explicit and robustcceptance criteria are developed. For example, future acceptanceriteria could be based on an end-use matching technique (i.e.omparing measured and simulated fan consumption) rather thanhole building level.
.5. Iterative calibration process
.5.1. Test model for acceptanceIn this step, the results of the simulation are compared to utili-
ies level measurements against the acceptance criteria. At the timef writing, three standards or guidelines were available [13–15].ach consists of comparing the cumulative variation of root meanquared error (CV RMSE) and the mean bias error (MBE) of the sim-lated energy consumption on a monthly basis (or hourly basis, ifhe data are available) to utilities level measurements. As the cur-ently available standards only contain criteria for analysis at thehole building energy level, it is hoped that in the future, with the
dvent of more detailed measured data, a standard will be pub-ished that contains improved acceptance criteria. Also, the analysts in a good position to judge the quality of the model, and thus theterative process continues until the acceptance criteria are met andhe analyst is satisfied that the model is an accurate representationf the building.
Generally, the first simulation run will not agree well with theeasured data, and further investigation will be necessary through
he iterative process defined below. Also, the results of the simula-ion run associated with each iteration and the comparison to thetilities level data must be stored in the version control repository.
.5.2. Review outputs using visualisation techniquesThis section focuses on problem identification in order to
mprove the accuracy of the model. As there is an overwhelm-ngly large amount of data generated by simulation programs and
easurement systems it is essential to employ numerous visualisa-ion techniques, such as: (a) Linear time-series plots; (b) CV RMSE
nalysis on a monthly or hourly basis [13]; (c) Scatter plots andatrices of dependent scatter plots [42]; (d) Three dimensional car-et, surface, or contour plots; (d) Binned percentile analysis usingox whisker mean plots [43].
ings 43 (2011) 2356–2364
3.5.3. Investigate possible further sources of informationFig. 4 describes how further changes to the model are made.
Each of the letters in brackets in this section refer to paths in thefigure. The analyst should identify possible sources for discrepan-cies using the techniques discussed in previous step. Assuming thatthe discrepancy is not due to a clear modelling error (A), changes toinput parameter(s) related to the source of the discrepancy should
Fig. 4. Process for investigation of further measurement.
Journal Identification = ENB Article Identification = 3228 Date: July 19, 2011 Time: 7:43 pm
Build
fipbmfhet
iiutFm
(pwpomietiomrac
3
hcabsuevc
3
iltaooi
ttI
ceriaip
P. Raftery et al. / Energy and
ed for which more reliable information or further measurement isossible. By this stage of the calibration process there will typicallye a small number of parameters for which further information oreasurement is possible. However, if there are many opportunities
or further measurement or sources of information higher up theierarchy are available, a sensitivity analysis applicable to buildingnergy simulation could be performed on the parameters in ordero identify the most significant.
The analyst then moves through the remaining steps assum-ng that the identified parameter(s) are the cause of discrepancyn the model. Where there is a source of information higherp in the hierarchy which requires little effort and is relatedo the parameter(s), a change can be made immediately (C).or example, replacing an parameter value from the initialodel with one from a standard.However, changes that require significant further resources
such as spot measurement, or additional site visits) should bereliminarily investigated. Parameter values should be modifiedithin reasonable limits and the sensitivity of the model to thisarameter is investigated. This identifies which changes are minorr trivial and thus reduces the total number of measurements thatust be obtained. If the significance criteria are met (D), the further
nformation must be obtained and the model updated. If a param-ter does not meet the significance criteria, the analyst decides atheir discretion whether it is necessary (E) or not (F) to obtain thenformation. In order to maintain reproducibility and the principlef evidence-based decision-making the significance criteria usedust be consistent throughout the calibration effort and for this
eason, it is defined in the documentation in the first revision. Also, synopsis of the results of each simulation run during the signifi-ance investigation are also stored in the version control repository.
.5.4. Update modelAt this stage, information from sources higher up the source
ierarchy, or measurements which have been identified as signifi-ant in the previous stage, are obtained and the model is updatedccordingly. The overall process of the previous four steps shoulde repeated in order to iteratively improve the model until theimulation reaches the desired level of accuracy. Above all, the doc-mentation of changes to the model must be kept updated and thevidence upon which decisions were made must be stored in theersion control repository. Without working in this manner, thealibration process is not reproducible by other users.
.6. Perform energy conservation measure analysis
The nature of the calibration process implies that the analyst willdentify numerous areas for improvement. This is because the ana-yst can only include in the model what is explicitly known abouthe building. Discrepancies between simulated and measured datare often due to problems with the real building and may offerpportunities to improve energy performance. Furthermore, it isften the case that the building will never before have been studiedn such detail at the operational stage of the building life cycle.
Once the model has been calibrated to a chosen standard usinghe methodology outlined in this paper it can be used to investigatehe viability of ECMs according to a recognised protocol, such as thePMVP [14].
Each individual ECM should be simulated and compared to thealibrated model for feasibility and cost effectiveness. However,nergy savings from ECMs often overlap. For example, a lightingetrofit generally has significant secondary effects on winter heat-
ng and reheat energy consumption. For this reason, the ECMs thatre identified as cost effective should also be analysed as a groupn order to comprehensively evaluate their overall feasibility. Sim-le payback periods and net present value should be calculated forings 43 (2011) 2356–2364 2363
each ECM scenario and presented to the personnel responsible fordecision-making in the organisation that operates the building.
4. Case study
This section briefly describes the application of this methodol-ogy to a case study of a recently constructed large industrial officebuilding on Intel’s campus in Ireland. The four-floor building hasa floor area of 30,000 m2 and an aspect ratio of 2.1:1. The HVACsystems are typically single duct variable air volume (VAV) cen-tralised systems with outside air economisers. There are also somelarge dedicated outdoor air systems present in the building.
EnergyPlus was used as the whole building energy simulationsoftware in the case study. A version control software tool (Tor-toiseSVN) was used to track the calibration process and store theevidence based on which changes to the model were made. Thefinal calibrated model represents the building to a high level ofdetail using a large number of zones (more than 100). The modelalso uses measured lighting and plug load data in the simulation athourly intervals over the complete annual simulation period.
The results show excellent correlation with the measured HVACconsumption data for the analysed year (2007), demonstratingthe effectiveness of the methodology. Mean Bias Error (MBE) andCumulative Variation of Root Mean Squared Error (CVRMSE(hourly))for HVAC electrical consumption were -4.2% and 7.8% respectivelyfor the final model. This model was then used to investigate EnergyConservation Measures (ECMs) for feasibility.
An in-depth discussion of the case study is outside the scope ofthis methodology paper, however, the case study and its conclu-sions will be described in detail in a companion paper.
5. Conclusion
This paper proposes a new methodology for the detailed cal-ibration of whole building energy models based on a systematic,evidence-based approach. This will improve the accuracy of thefinal model by ensuring that only verifiable information aboutthe building is used in the calibration process. Furthermore, thismethodology improves the reproducibility of calibrated modellingby storing a complete history of the calibration process in a ver-sion control repository. Future users will be able to review thedecisions made throughout the calibration process, both improv-ing their understanding of assumptions made and reducing thelikelihood of analysts tuning input parameters without support-ing evidence. The use of version control software in the calibrationprocess organizes and structures an analysts approach to the cal-ibration process. It also facilitates reviewing the changes betweenrevisions and enables an analyst to quickly and reliably revert toprevious versions of the model if an error is discovered.
This methodology also describes a new zoning process that moreclosely represents the real building in the model. The zone-typingstrategy models effects that are not captured by the typical core and4 perimeter zone strategy, and is particularly applicable to deepfloor plan buildings.
Though the methodology is intended to apply to detailed cal-ibration studies with high resolution measured data, the primaryaspects of the methodology (the evidence-based approach, versioncontrol software, and zone-typing) are independent of the availablemeasured data. Overall, the end result of this research is that modelscalibrated using this methodology will contain only verified infor-mation about a building, allowing researchers to draw conclusions
related to the capabilities of current simulation tools (dependingon the level and quality of information available). Knowledge ofmistaken design-stage assumptions gained during the process ofdetailed calibration can inform design stage modellers through the
Journal Identification = ENB Article Identification = 3228 Date: July 19, 2011 Time: 7:43 pm
2 Build
dcC
A
EF
R
[
[
[
[
[
[
[
[
[
[
[
[
[
[
[
[
[
[
[
[
[
[
[
[
[
[
[
[
[
[
[
[
364 P. Raftery et al. / Energy and
evelopment of best practice procedures. Furthermore, the detailedalibrated models themselves can be used to investigate Energyonservation Measures (ECMs) for feasibility.
cknowledgements
This work was funded by the Irish Research Council for Science,ngineering and Technology (IRCSET) Embark Initiative and theulbright Commission in Ireland.
eferences
[1] L. Perez-Lombard, J. Ortiz, C. Pout, A review on buildings energy consumptioninformation, Energy and Buildings 40 (2008) 394–398.
[2] M.A. Piette, S.K. Kinney, P. Haves, Analysis of an information monitoring anddiagnostic system to improve building operations, Energy and Buildings 33(2001) 783–791.
[3] M. Ardehali, T. Smith, J. House, C. Klassen, Building energy use and controlproblems: an assessment of case studies, ASHRAE Transactions 109 (2003)111–121.
[4] J. Clarke, Energy Simulation in Building Design, 2nd ed., Butterworth Heine-mann, 2001.
[5] G.R. Newsham, S. Mancini, B.J. Birt, Do LEED-certified buildings save energy?Yes, but. . ., Energy and Buildings 41 (2009) 897–905.
[6] L.K. Norford, R.H. Socolow, E.S. Hsieh, G.V. Spadaro, Two-to-one discrepancybetween measured and predicted performance of a ‘low-energy’ office build-ing: insights from a reconciliation based on the DOE-2 model, Energy andBuildings 21 (1994) 121–131.
[7] J.H. Scofield, Early energy-performance for a green academic building, ASHRAETransactions 108 (2002) 1214–1230.
[8] P. Torcellini, M. Deru, N. Long, B.T. Griffith, S. Pless, R. Judkoff, et al., Lessonslearned from field evaluation of six high-performance buildings, TechnicalReport: NREL/CP-550-36290, National Renewable Energy Laboratory (2004).
[9] R. Diamond, M. Opitz, T. Hicks, B. Vonneida, S. Herrara, Evaluating the energyperformance of the first generation of LEED-certified commercial buildings, in:Proceedings of the 2006 American Council for an Energy-Efficient EconomySummer Study on Energy Efficiency in Buildings, Washington DC, USA, 2006.
10] C. Turner, M. Frankel, Energy Performance of LEED for New Construction Build-ings, WA, USA, Technical Report, New Buildings Institute (2008).
11] T. Reddy, Literature review on calibration of building energy simulationprograms: uses, problems, procedures, uncertainty and tools, ASHRAE Trans-actions 112 (2006) 226–240.
12] W.L. Carroll, R.J. Hitchcock, Tuning simulated building description to matchactual utility data: methods and implementation, ASHRAE Transactions 99(1993) 928–934.
13] ASHRAE, ASHRAE Guideline 14-2002: Measurement of Energy and DemandSavings (2002).
14] Efficiency Valuation Organisation, International Performance Measurementand Verification Protocol (2007).
15] US Department Of Energy, M&V Guidelines: Measurement and Verificationfor Federal Energy Projects Version 3.0. http://mnv.lbl.gov/keyMnVDocs/femp(2008).
16] R. Troncoso, A hybrid monitoring-modelling procedure for analyzing theperformance of large central chilling plants, in: Proceedings of the 5th Interna-tional Building Performance Simulation Association Conference, Prague, CzechRepublic, 1997.
17] J. Yoon, E.J. Lee, D.E. Claridge, Calibration procedure for energy performancesimulation of a commercial building, Journal of Solar Energy Engineering 125
(2003) 251–257.18] V.I. Soebarto, Calibration of hourly energy simulations using hourly monitoreddata and monthly utility records for two case study buildings, in: Proceedings ofthe 5th International Building Performance Simulation Association Conference,Madison, WI, USA, 1997.
[
[
ings 43 (2011) 2356–2364
19] A. Pedrini, F.S. Westphal, R. Lamberts, A methodology for building energy mod-elling and calibration in warm climates, Building and Environment 37 (2002)903–912.
20] J.S. Haberl, T.E. Bou-Sada, Procedures for calibrating hourly simulation modelsto measured building energy and environmental data, ASME Journal of SolarEnergy Engineering 120 (1998) 193–234.
21] M. Kaplan, J. McFerran, J. Jansen, R. Pratt, Reconciliation of a DOE2.1C Modelwith monitored end-use data for a small office building, ASHRAE Transactions96 (1990) 981–992.
22] T.A. Lunneberg, Improving simulation accuracy through the use of short-termelectrical end-use monitoring, in: Proceedings of the 6th International BuildingPerformance Simulation Association Conference, Kyoto, Japan, 1999.
23] T. Reddy, I. Maor, C. Panjapornpon, Calibrating detailed building energy simu-lation programs with measured data—Part 1: general methodology, HVAC&RResearch 13 (2007) 221–241.
24] T. Reddy, I. Maor, C. Panjapornpon, Calibrating detailed building energy sim-ulation programs with measured data—Part 2: application to three case studyoffice buildings, HVAC&R Research 13 (2007) 243–265.
25] Y. Pan, Z. Huang, G. Wu, Calibrated building energy simulation and its applica-tion in a high-rise commercial building in Shanghai, Energy and Buildings 39(2007) 651–657.
26] I. Iqbal, M.S. Al-Homoud, Parametric analysis of alternative energy conserva-tion measures in an office building in hot and humid climate, Building andEnvironment 42 (2007) 2166–2177.
27] N. Eskin, H. Turkmen, Analysis of annual heating and cooling energy require-ments for office buildings in different climates in Turkey, Energy and Buildings40 (2008) 763–773.
28] Z. Tian, J. Love, Energy performance optimization of radiant slab cooling usingbuilding simulation and field measurements, Energy and Buildings 41 (2009)320–330.
29] T.N. Aynur, Y. Hwang, R. Radermacher, Simulation of a VAV air conditioningsystem in an existing building for the cooling mode, Energy and Buildings 41(2009) 922–929.
30] M. Rahman, M. Rasul, M. Khan, Energy conservation measures in an institu-tional building in sub-tropical climate in Australia, Applied Energy 87 (2010)2994–3004.
31] US Department Of Energy, EnergyPlus v6.0. http://apps1.eere.energy.gov/buildings/energyplus/ (2011).
32] Energy Systems Research Unit, ESP-r. http://www.esru.strath.ac.uk/Programs/ESP-r.htm (2010).
33] US Green Building Council, LEED for New Construction & Major Renovationsv3.0. http://www.usgbc.org/ (2010).
34] California Energy Commission, California Title 24-2008.http://www.energy.ca.gov/ (2008).
35] US Department Of Energy, Commercial Building Reference Mod-els http://www1.eere.energy.gov/buildings/commercial initiative/newconstruction.html (2010).
36] Building Smart International, IFC2×3. http://www.buildingsmart-tech.org/(2006).
37] R.J. Hitchcock, Standardized Building Performance Metrics, Technical ReportLBNL 53072, Lawrence Berkeley National Laboratory (2003).
38] J. O’Donnell, Specification of Optimum Holistic Building Environmental andEnergy Performance Information to Support Informed Decision Making, Doc-torate: University College Cork, Ireland, University College Cork, Ireland (2009).
39] ASHRAE, ASHRAE Standard 90.1-2007 Energy Standard for Buildings ExceptLow-Rise Residential Buildings (2007).
40] B. Abushakra, A. Sreshthaputra, J.S. Haberl, D. Claridge, Compilation of diversityfactors and schedules for energy and cooling load calculations, Energy SystemsLaboratory, Texas A&M (2001).
41] AT&T Laboratories Cambridge, The Active Badge System.http://www.cl.cam.ac.uk/research/dtg/attarchive/ab.html (2002).
42] O. Baumann, Operation diagnostics – use of operation patterns to verify andoptimize building and system operation, in: Proceedings of International Con-ference for Enhanced Building Operations 2004 Conference, Paris, France, 2004.
43] J.S. Haberl, M. Abbas, Development of graphical indices for viewing buildingenergy data: Part 2, Journal of Solar Energy Engineering 120 (1998) 162–167.