CADR Report on
171
CADR Report on Sample Checking of Data of District Information System for Education (DISE) in Jhansi and Aligarh Districts of U.P. 2010-11 Sponsored by State Project Directorate Sarva Shiksha Abhiyan (Uttar Pradesh) CENTRE OF ADVANCED DEVELOPMENT RESEARCH 56-A, CHANDGANJ GARDEN, LUCKNOW - 226 024
-
Upload
khangminh22 -
Category
Documents
-
view
1 -
download
0
Transcript of CADR Report on

CADR
Report on Sample Checking of Data
of District Information System for Education (DISE)
in Jhansi and Aligarh Districts of U.P.
2010-11
Sponsored by
State Project Directorate
Sarva Shiksha Abhiyan
(Uttar Pradesh)
CENTRE OF ADVANCED DEVELOPMENT RESEARCH 56-A, CHANDGANJ GARDEN,
LUCKNOW - 226 024

CONTENTEMIS2011 iii
C O N T E N T S Page No.
Preface i List of Tables v
Chapter-1 : Introduction 1-3
1.1 Background 1 1.2 District Information System for Education (DISE) 2 1.3 Sample Checking of DISE Data 2 1.4 The present report 3
Chapter-2 : Objectives and Sampling Plan 4-5
2.1 Objectives 4 2.2 The sample 4
2.3 Instrument used 5 2.4 Method of analysis 5
Chapter-3 : Extent of variation in sample and DISE Data 6-11
3.1 Comparison of data of school particulars 6
3.2 Enrollment of children in primary and upper primary schools 8 3.3 Number of disabled children in primary and upper primary schools 10
3.4 Number of repeaters 10 3.5 Number of classrooms in schools 11
Chapter-4 : School records and other facilities 12-13
4.1 Ability of head teachers who could provide required information 12 4.2 Mid-day meals in schools 13
4.3 Quality of meals 13
Chapter-5 : Presence of teachers and students on the day of visit 14-15
5.1 Number of teachers in position and present 14 5.2 Enrollment and attendance of children in schools 14
Chapter-6 : Basic facilities in schools 16-18
6.1 Boundary wall 16
6.2 Other facilities 16 6.2.1 Playground 16
6.2.2 Toilets for girls 17 6.2.3 Electricity in schools 17
6.2.4 Availability of drinking water facilities 18

CONTENTEMIS2011 iv
6.2.5 Tat Patties and furniture for seating of children 18
Chapter-7 : Training for filling of the DISE format 19
7.1 Beneficiaries of training 19 7.2 Place of training 19
7.3 Content of training 19 7.4 Infrastructure available for filling of the DISE format 19
7.5 Some shortcomings observed 19
Chapter-8 : Major findings and recommendations 20-21
8.1 School particulars 20 8.2 Need for sample checking 21
Annexure Annexure-1 DISE data format Annexure-2 Block-wise number of total schools and sampled schools
Annexure-3 Block-wise list of sampled schools Annexure-4 Instrument used

CONTENTEMIS2011 v
L I S T O F T A B L E S Table No. Page No.
2.1 Number of Sampled Schools 4 2.2 Sampled schools under various management 4 3.1 Number of Schools where DISE data matched with Survey data 7 3.2 Enrollment in primary classes 8 3.3 Enrollment in upper primary classes 9 3.4 Number of disabled children enrolled in primary and upper primary schools 10 3.5 Number of repeaters in primary and upper primary schools 10 3.6 Classrooms in sampled schools 11 4.1 Percentages of head teachers who could provide required information 12 4.2 Details of MDM in PS and UPS of schools under education deptt. 13 5.1 Number of teachers in position and present on day of visit 14 5.2 Number of children enrolled and present in primary and upper primary classes
in primary, upper primary and primary with upper primary schools 15
6.1 Percentage of Schools having boundary walls during 2010-11 16 6.2 Percentage of Schools having play ground 16 6.3 Percentage of Schools having toilet facilities during 2010-11 17 6.4 Percentage of Schools where electric facility was available 17 6.5 Percentage of Schools having various drinking water facilities 18 6.6 Percentage of Schools having furniture and tat patties for seating 18

PERFECEMIS2011 i
Preface
For the last several decades, particularly after the adoption of our Constitution in
1950, universalisation of elementary education has attracted the attention of the
educational planners and administrators. The National Policy on Education 1986 and
1992 gave very high priority to the achievement of goal of universal elementary
education (UEE). Education of children in 6-14 years age group has been made the
fundamental right through the 86th constitutional Amendment Act. In consequence of
these developments, and based on the lessons learnt from the implementation of various
programmes in the area of elementary education, Government launched the programme
of Sarva Shiksha Abhiyan (SSA) in the year 2000-01. The main goals of SSA are (i) to
keep all children in the age group of 6-14 years in schools, (ii) to ensure that all children
in the age group of 6-11 years complete primary education and (iii) to ensure universal
retention of children in the age group of 6-14 years in schools.
The goals of SSA are really very high and call for gigantic efforts from
governments, educational planners, and administrators at various levels and people in
general. In order to ensure proper planning and implementation of this programme, need
for collecting basic information on a comprehensive scale has been recognised and
consequently educational statistics are being collected by the states. In order to ensure
such statistics acceptable by the planners and agencies responsible for implementation of
educational programmes, enough safeguard of checking these statistics at various level of
NPRC/BRC/BSA and even at the regional and at the state level have been provided.
Notwithstanding of these safeguards, these statistics were found with high degree of
errors in aggregation and other types of errors. It was, therefore, felt that the educational
statistics being collected through District Information System for Education (DISE) as
available at the school level should be compared with those available at the State level by
conducting sample surveys in some districts through external reputed organisations.

PERFECEMIS2011 ii
Accordingly, Centre of Advanced Development Research, Lucknow was entrusted to
conduct this analysis in Jhansi and Aligrah districts of Uttar Pradesh.
We are grateful to the State Project Director (SSA) Uttar Pradesh who had taken
great deal of interest in providing help to us for carrying out this analysis in these two
districts of the state. We gratefully acknowledge the support of Sri D.B. Sharma,
Additional Project Director of SSA and their other professionals, particularly Sri Abhinav
Sinha, who have been very helpful to us for providing lot of information available at the
project office in this endeavour.
I am obliged to my senior colleague, Sri M.L Sharma, Officer On Special Duty,
who has been associated with this analysis right from beginning to end.
Sarvashri S.P.S. Chauhan, Research Officer, Sandeep Tewari, Manoj Kumar Srivastava,
S.K. Shukla, Vijay Kumar, and D.K. Pandey Junior Research Associates also deserve our
thanks. Sri Ram Shanker who has processed the whole matter on computer also deserves
our thanks.
B. N. Tyagi May, 2011 Executive Director, Lucknow. Centre of Advanced Development Research

FINAL REPORT 1
Chapter-1
Introduction 1.1 Background:
1.1 According to census of India, total population of the country was 361 million
during 1951 which increased to 1210 million during 2011. The country has been
characterized by a very low rate of literacy. Only 18.33 percent persons (27.16 percent
males and 8.86 percent females) were literate during 1951. Even during 2011, i.e. after 60
years of independence the literacy rate was only 74.04 percent (82.14 percent for male and
65.46 percent for female). Thus at this rate, it may take another 40 years or so to attain
100 percent literacy. This is too long a period to wait for. Accordingly, massive efforts
have been undertaken to achieve the target of 100 percent literacy in as short period as
possible. Kerala has achieved about 94 percent literacy rate (96.02 percent for male and
91.98 percent for female) but literacy rates of U.P. as well as that of JK, Rajasthan and
Bihar have not crossed the level of 70 percent even during 2011. Not only this, literacy
rate of females in U.P. during 2011 was only 59.26. Several programmes for improving
the level of people had been undertaken. Sarva Shiksha Abhiyan was launched in the
country during 2001 for bringing all the children in schools and ensuring universal
retention. Thus the goal of Sarva Shiksha Abhiyan is to ensure that all the children get a
minimum of eight years schooling.
1.2 The role of education in improving the choice and quality of lives, enhancing
social and economic productivity and initiating the process of empowerment and
redistribution of resources has been well recognized. India is committed to provide "free
and compulsory education for all children until they complete the age of 14 year and
achieve Universalization of Elementary Education (UEE) and Millennium Development
Goal (MDG) with substantial improvement in the quality of the lives of its citizens.
1.3 As Sarva Shiksha Abhiyan is a significant step towards achieving the long
cherished goal of Universalization of Elementary Education (UEE) through a time bound
integrated approach, effective and efficient information system is essential for its
successful implementation. As a matter of fact, at the inception of the first District
Primary Education Programme (DPEP) in 1994 (which was later subsumed into SSA), it
was realized that a sound information base for planning and monitoring of various
interventions was a non-negotiable requirement of such a programme.

FINAL REPORT 2
1.4 The educational statistics collected by the states were found not only inadequate to
meet the growing needs of the decentralized planning but were also characterized by
inordinate delays, full of aggregative errors and were not amenable to validation and
reliability tests. Since school statistics formed the core of educational statistics, it was
rightly recognized that major reforms in school statistics both in terms of their scope and
coverage as well as availability and use have to be carried out. Accordingly, National
Institute of Educational Planning and Administration (NIEPA) took up this issue and
accepted the responsibility for designing and implementing such a system for elementary
education and thus the district information system for education came into operation.
1.2 District Information System for Education (DISE): 1.5 The task of developing a school based statistical system was initiated by NIEPA
during 1995. The district was selected as a nodal point for collection and computerization
of school level data. Accordingly, a software named as District Information System for
Education (DISE) was developed and released during the middle of 1995.
1.6 The first major review of DISE was undertaken during 1997-98 and was further
followed by an extensive review during 2000-01 resulting in DISE-2001. The scope of
this version (DISE-2001) was also extended to cover the information upto elementary
level covering eight years of schooling.
1.7 The flow of data plays very important role in information system. Under DISE-
2001, the basic data is collected at the school level in the prescribed format (Annexure-1).
It is to be verified by the Block Education officer/Block Resource Coordinator for its
completeness and accuracy and delivered to the Education Management Information
System (EMIS) in-charge in the District Project office where it is entered into computer.
The responsibility for checking the consistency of data vests with the District Project
office. The validated data is stored at the district level and made available to the State
Project office where it is aggregated at the State Level.
1.3 Sample Checking of DISE Data:
1.8 In order to verify the accuracy of DISE data, it was considered desirable to get the
DISE data checked on sample basis by an external agency every year. Accordingly, Centre
of Advanced Development Research (CADR) was commissioned by the State Project
Office, Sarva Shiksha Abhiyan to undertake the five percent sample checking of DISE
data for the year 2010-11 in two districts of Jhansi and Aligarh.

FINAL REPORT 3
1.4 The present report:
1.9 The present report relates to the districts Jhansi and Aligarh. This is divided into 8
Chapters. Chapter 1 gives brief introduction and methodology. Sampling plan is given in
Chapter 2, Chapter 3 presents extent of variation in sampled and DISE data. Chapter 4
presents the results relating to various school records and Chapters 5 gives the presence of
teachers and students on the day of visit. Chapter 6 presents basic facilities in sampled
schools. Chapter 7 presents the training for filling the DISE format and last Chapter 8
presents major findings and recommendations.

FINAL REPORT 4
Chapter-2
Objectives and Sampling Plan
2.1 Objectives 2.1 The two main objectives for undertaking sample-checking of DISE data were
1. To verify the accuracy of the DISE data being collected and
2. To identify the gaps/weaknesses and suggest appropriate remedial measures
for strengthening the system.
2.2 The Sample 2.2 For selecting the sample for checking the data collected under DISE, a simple random
sample of about 5 percent schools from each block/urban area in these districts was selected
as given in Table 2.1
Table 2.1 Number of sampled schools
Districts Sl.No. Particulars
Jhansi Aligarh Both the districts
1. Total number of schools 2329 3031 5360
Number of sampled schools 116 152 268
(i) PS only 67 105 172
(ii) UPS only 43 42 85
2.
(iii) PS+UPS 6 5 11
Source:- State Project Directorate, Lucknow
2.3 Out of these 268 schools 216 (80.6 percent) schools were under the education
department and the remaining 52 schools (19.4 percent) were under private management.
(Table 2.2)
Table 2.2 Sampled schools under various management.
Districts Sl.No. Particulars
Jhansi Aligarh Both the districts
1. Education Department 93 123 216
2. Private 23 29 52
Total 116 152 268

FINAL REPORT 5
2.4 Block-wise total number of schools and number of sampled schools are given in
Annexure -2. The names of the sampled schools in these two districts are given in
Annexure-3.
2.5 Having selected the sample of 268 schools, basic data of these schools was collected
by our research investigators and then compared with the data already available with the
SPD under DISE formats.
2.3 Instrument Used: 2.6 For purpose of sample checking, a data collection format (Annexure-4) was
developed. With the help of this format, all information relating to sampled 268 schools was
collected by the research investigators of the Centre of Advanced Development Research.
2.7 Besides collecting the key information for verifying the accuracy of DISE school level
data, the sample checking format also contained a qualitative assessment of the
implementation of various aspects of imparting education in schools viz. quality of training
provided, receipt of School Summary Report, supervision by the CRC Coordinator, etc. In
addition, it also captured the actual attendance of students and teachers on the day of visit as
well as working of Mid-Day Meal (MDM) programme. All these information have also been
collected and analysed.
2.4 Method of Analysis: 2.8 A comparison of DISE and sample data pertaining to various aspects (variables) has
been done and discussed in Chapter 3. Apart from comparative analysis of sample and DISE
data, other aspects of working of schools have also been studied and presented in this report.
FINAL REPORT 6
Chapter-3
Extent of variation in sample and DISE data 3.1 DISE formats for all the 268 sampled schools as given in annexure-1 were available
and these formats were provided by SPD to the Centre for comparison. Data available in the
DISE formats and collected by our research investigators pertain to the following aspects:
(a) School particulars relating to type, category, school management, lowest and
highest class and year of establishment.
(b) Enrolment of children,
(c) Number of Disabled children,
(d) Number of repeaters, and
(e) Number of classrooms in schools.
3.2 Besides the above aspects, as already stated in para 2.6 of Chapter 2, some vital
information about the working of sampled schools like response of Head teachers in providing
the requisite information to the investigators, maintenance of various registers and records,
report cards, punctuality of teachers, availability of photo copy of the DISE/DCF, display
board, mid-day meal etc. as specified in the format at Annexure 4 was also collected and
analysed.
3.1 Comparison of data of school particulars: 3.3 DISE formats were available in respect of all the 268 sampled schools. The data given
in these formats have been matched with survey data in respect of following particulars in
these two districts:-
(i) Schools type, i.e. only for boys, only for girls or coeducational,
(ii) School category i.e. only primary (1), primary with upper primary (2), primary
with upper primary and secondary or higher secondary (3), upper primary only
(4), upper primary with secondary or higher secondary (5)
(iii) Lowest class,
(iv) Highest class,
(v) Year of establishment of school,
(vi) School Management Government departments i.e. education department, tribal
welfare department, local body, private aided, private unaided, other, Central
school, unrecognized, recognized madarsa, unrecognized madarsa.

FINAL REPORT 7
3.4 The result of matching the survey data with DISE data relating to school particulars
are given in Table 3.1
Table 3.1 Number of schools where DISE data matched with survey data
Jhansi Aligarh Both the districts
Available in DISE format
Available in DISE format
Available in DISE format
Particulars and matched
with survey data
did not match with
survey data
and matched
with survey data
did not match with
survey data
and matched
with survey data
did not match with
survey data
1 2 3 4 5 6 7
(i) School Type 116 0 151 1 267 1
(ii) School Category 116 0 149 3 265 3
(iii) Lowest Class 116 0 152 0 268 0
(iv) Highest Class 116 0 151 1 267 1
(v) Establishment Year 111 5 127 25 238 30
(vi) School Management 115 1 145 7 260 8
3.5 The following main conclusions emerge from the data presented in Table 3.1:-
(a) Schools Type: - This information collected by our research team tallied with
that given in DISE papers in respect of 267 schools out of 268 schools. In the case of one
school- in Aligarh district, DISE papers instead of denoting this to be coeducational denoted
as girls school on account of the schools being named as basis kanya pathsala no.-21 although
both boys and girls were enrolled in the school.
(b) School Category: - As given in para 3.3 (ii), DISE papers should have
recorded only one out of the five categories. But three schools in Aligarh district have shown
that these were primary schools with higher secondary classes, although they had given class
VI to VIII enrolment. This is due to lack of understanding or carelessness of the teachers of
these schools. Of these three schools two were private unaided schools and one under
education department. Such schools need much thorough scrutiny of their DISE papers.

FINAL REPORT 8
(c) Highest Class:- The information about the highest class was available in
respect of all the 268 sampled schools and there was complete matching of the survey data
with the DISE data except one school.
(d) Establishment year: - The sampled and DISE data did not match in respect of
5 schools in Jhansi district and 25 schools of Aligarh district. The reason was that these
schools were first started in a private building and their own building was constructed later
on. Sample data gave the year in which the classes started even in private building and that
year was taken to be the year of establishment. But the DISE format gave the year of
construction of its own building.
(e) Management of Schools:- This information did not tally with the survey data
in respect of one school in Jhansi district and 7 schools in Aligarh district. These were private
unaided schools. But in DISE format these were classed as under privateaided/other.
3.2 Enrollment of Children in Primary and upper primary schools
(a) Primary Schools:
3.6 In these 268 sampled schools, there were 172 primary schools only, and 85 upper
primary schools with only classes VI, VII and VIII. There were another 11 schools in the
sample having classes VI, VII and VIII along with primary classes. Thus for primary schools,
the sampled schools were 183 (172+11) and for upper primary schools there were 96 upper
primary schools.
3.7 The DISE and survey data gave the following status of enrollment in 183 schools
which had primary classes (Table 3.2)
Table 3.2: Enrollment in Primary Classes(183 Schools) Jhansi Aligarh Both the districts
Particulars As per sample survey
As per DISE data
As per sample survey
As per DISE data
As per sample survey
As per DISE data
1 2 3 4 5 6 7
Boys 4827 4838 6418 6387 11245 11225
Girls 4461 4456 6669 6649 11130 11105
Total 9288 9294 13087 13036 22375 22330

FINAL REPORT 9
3.8 In these sampled 183 primary schools, there was a very nominal difference in the
number of boys and girls as per sampled data and DISE data. The difference is too small to
merit any comment. In these two districts, the variation was 16 (11 boys and 5 girls) in Jhansi
district and 51 (31 boys and 20 girls) in Aligarh district. In percentage term, these variations
are negligible.
(b) Upper Primary Schools
3.9 In these districts, there were 96 upper primary schools. In these 96 schools, there were
69 schools under the management of government and remaining 27 schools were under
private management. Of these 96 upper primary schools 85 UPS were such as had class VI to
VIII only and the remaining 11 had classes of primary level also. The number of boys and
girls enrolled in these 96 schools as per sample survey and DISE data are presented in
Table 3.3.
Table 3.3: Enrollment in Upper Primary Classes (96 Schools) Jhansi Aligarh Both the districts
Particulars As per sample survey
As per DISE data
As per sample survey
As per DISE data
As per sample survey
As per DISE data
1 2 3 4 5 6 7
Boys 2907 2917 2428 2428 5335 5345
Girls 2669 2689 2104 2101 4773 4790
Total 5576 5606 4532 4529 10108 10135
3.10 It is evident from the data presented in Table 3.3 that there is variation of 30 children in
enrolment in the schools of Jhansi district. In the case of Aligarh district, the variation is of
thrsee children only.
3.3 Number of disabled children in primary and upper primary schools 3.11 Along with the data relating to total number of children enrolled, information
regarding the number of disabled children is also being collected through DISE. Accordingly
the information was also collected through sampled checking for 183 schools of primary
classes and 96 schools of upper primary classes. It is evident from Table 3.4 that there was
small variation in the enrollment of disabled children in primary schools. No variation was
observed in case of upper primary schools in both the districts.

FINAL REPORT 10
Table 3.4: Number of disabled children enrolled in primary and upper primary schools Jhansi Aligarh Both the districts
Particulars As per sample data
As per DISE data
As per sample data
As per DISE data
As per sample data
As per DISE data
1 2 3 4 5 6 7
Primary schools (183)
Boys 32 32 40 40 72 72
Girls 19 18 27 25 46 43
Total 51 50 67 65 118 115
Upper primary schools (96)
Boys 17 17 4 4 21 21
Girls 10 10 8 8 18 18
Total 27 27 12 12 39 39
3.4 Number of Repeaters 3.12 The information regarding repeater children was collected through sample survey and
compared with DISE data. The number of children who retained in the same class as per
sample checking was 206 for primary classes and 54 for upper primary classes. The
corresponding data of DISE was 203 for primary classes and 56 for upper primary classes.
The difference is very small and does not deserve any comment.
Table 3.5: Number of repeaters in primary and upper primary schools Jhansi Aligarh Both the districts
Particulars As per sample data
As per DISE data
As per sample data
As per DISE data
As per sample data
As per DISE data
1 2 3 4 5 6 7
Primary schools (183)
Boys 30 30 72 71 102 101
Girls 33 33 71 69 104 102
Total 63 63 143 140 206 203
Upper primary schools (96)
Boys 17 17 2 6 19 23
Girls 22 22 13 11 35 33
Total 39 39 15 17 54 56

FINAL REPORT 11
3.5 Number of Classrooms in schools
3.13 Information relating to number of classrooms in respect of each of the sampled
primary and upper primary schools was collected through sample survey and matched with
the corresponding DISE data. For this purpose, primary schools with only primary classes (I
to V) and upper primary schools with only upper primary classes (VI to VIII) and primary
with upper primary Classes (I to VIII) were considered. The number of such primary schools
was 172, for upper primary schools this number was 85 and for primary with upper primary
schools the number was 11.
3.14 The results of matching the sample data with DISE data are given in Table 3.6
Table:3.6 Classrooms in sampled schools
Districts
Jhansi Aligarh Both the districts
Only primary
schools
(67)
Only upper
primary
schools
(43)
Primary
with upper
primary
school
(6)
Only
primary
schools
(105)
Only upper
primary
schools
(42)
Primary
with upper
primary
school
(5)
Only
primary
schools
(172)
Only upper
primary
schools
(85)
Primary
with upper
primary
school
(11)
1. Number of classrooms as per survey
267 161 46 462 161 28 729 322 74
2. Number of classrooms as per DISE Format
272 158 45 392 156 28 664 314 73
3. Variation
5 3 1 70 5 0 65 8 1
3.15 It would be seen from the data presented in Table 3.6 that there was variation of 65
classrooms in case of primary schools, 8 classrooms in the case of upper primary schools and
one classrooms in the case of primary with upper primary schools in these two districts taken
together.

FINAL REPORT 12
Chapter-4
School Records and other facilities
4.1 Ability of head teachers who could provide required information
4.1 As indicated in Chapter 2, some vital information about the working of schools were
also collected. Almost all the head teachers responded very well in providing these basic
information. The percentages of head teachers of the sampled schools who provided basic
information relating to various aspects of schools is given in Table 4.1.
Table 4.1 Percentages of Head teachers who could provide required information:
Percentage of Head teachers
Primary schools Upper primary schools PS+UPS Sl. No. Type of information provided
Jhansi Aligarh Jhansi Aligarh Jhansi Aligarh
1 Enrollment and pass percentage
100.0 100.0 100.0 100.0 100.0 100.0
2 Ability to give information of enrollment & other details from a single register
31.3 7.7 41.9 4.8 16.7 0.0
3 Proper filling up of attendance register
100.0 100.0 100.0 100.0 100.0 100.0
4 Head master keeping year end summary details of children
97.0 100.0 100.0 100.0 100.0 100.0
5 Key information on display boards
29.9 18.1 37.2 23.8 33.3 0.0
6 Availability of schools report card
79.1 0.0 62.8 0.0 33.3 0.0
7 Availability of photo copy of DISE data
58.2 21.0 62.8 26.2 50.0 60.0
4.2 It would be evident from Table 4.1 that information relating to enrolment was
provided to our research team by all the head teachers. Similarly situation relating to the
attendance register was also extremely good:
4.3 However, situation relating to keeping a single register containing all information was
far from satisfactory, particularly in Aligarh district. No school report card was available in
Aligarh district.

FINAL REPORT 13
4.2 Mid-day meals in schools
4.4 Each and every primary and upper primary school under the management of education
department, local bodies or any other government department is required to provide mid-day
meal to the students. However, on the day of visit, out of 216 schools under education
department, sampled in these two districts, MDM was served in the 215 schools. However
MDM was not served according to menu in 6 schools. (Table 4.2)
Table 4.2 Details of MDM in PS and UPS of Schools Under Education deptt.
Number of Schools
Jhanshi Aligarh Both the districts Sl. No. Particulars
PS UPS Total PS UPS Total PS UPS Total
1 Number of sampled schools under education deptt.
56 37 93 91 32 123 147 69 216
2 Number of schools in which MDM surved on the day of visit
56
(100.0)
37
(100.0)
93
(100.0)
90
(98.9)
32
(100.0)
122
(99.2)
146
(99.3)
69
(100.0)
215
(99.5)
3 Number of schools in which MDM served as per menu.
55
(98.2)
37
(100.0)
92
(98.9)
86
(95.5)
31
(96.9)
117
(95.9)
141
(96.7)
68
(98.5)
209
(97.2)
4 Number of schools in which students were satisfied with quality of MDM
53
(94.6)
37
(100.0)
90
(96.8)
89
(98.9)
31
(96.9)
120
(98.4)
142
(97.3)
68
(98.5)
210
(97.7)
5 Schools with kitchen 46
(82.1)
27
(73.0)
73
(78.5)
71
(78.0)
17
(53.0)
88
(71.5)
117
(79.6)
44
(63.8)
161
(74.5)
Note:-Figures within parenthesis denote percentage
4.5 It would also be evident that out of 216 sampled schools, Kitchens were available only
in 161 (74.5) schools
4.3 Quality of Meals
4.6 Quality of meals was reported by students to be satisfactory in 97.7 percent schools of
these two districts.

FINAL REPORT 14
Chapter-5
Presence of teachers and students on the day of visit 5.1 Number of teachers in position and present:-
5.1 In addition to collecting information which were comparable with the DISE data,
information relating to the number of teachers and children present in each of 268 sampled
schools was also collected. Number of teachers in position and present in these 268 schools
sampled for the present study are presented in Table 5.1
Table 5.1 Number of teachers in position and present on the day of visit
Jhansi Aligarh Both the districts
Sl.
No.
Categary of
schools Total
number of teachers
in position
Total number of teachers
present on day of visit
Total number of teachers
in position
Total number of teachers
present on day of visit
Total number of teachers
in position
Total number of teachers
present on day of visit
1 PS Only 244* 227 (93.0) 371* 294 (79.2) 615* 521 (84.7)
2 UPS Only 117 107 (91.5) 167 140 (83.8) 284 247 (87.0)
3 PS + UPS 56 55 (98.2) 39 35 (89.7) 95 90 (94.7)
Note:-1.*Teachers denote regular teachers and para teachers
2. Figures within parenthesis denote percentage
5.2 It would be evident from Table 5.1 that the percentages of teachers including para
teachers who were present on the date of visit in primary schools only in Jhansi and Aligarh
districts were 93.0 and 79.2 respectively. Taking two districts together, the percentage of
teachers present in primary schools only was 84.7. In the case of upper primary schools only,
the percentages of teachers present were 91.5 in Jhansi, and 83.8 in Aligarh.
5.2 Enrollment and attendance of children in schools:
5.3 Total number of children enrolled in the primary schools only in these two districts
was 20231 – 10017 boys and 10214 girls. The children present on the day of visit was 11217
(55.4 percent) – 5604 boys (55.90 percent) and 5613 (55.0 percent) girls. In the case of upper
primary schools 9021 children were enrolled but the number of children present was 5637
(62.5 percent)

FINAL REPORT 15
Table 5.2: N umber of children enrolled and present in primary and upper primary classes in
primary, upper primary and primary with upper primary schools Jhansi Aligarh Both the districts
Category of schools Gender Total no. of
children enrolled
Total no. of
Children present on the day of
visit
Total no of
children enrolled
Total no. of
Children present on the day of
visit
Total no of children enrolled
Total no. of Children
present on the day of
visit
Boys 4084 2107 (51.6)
5933 3797 (58.9)
10017 5604 (55.9)
Girls 3936 2000 (50.8)
6278 3613 (57.6)
10214 5613 (55.0)
PS Only
Total 8020 4107 (51.2)
12211 7110 (58.2)
20231 11217 (55.4)
Boys 2468 1323 (53.6)
2213 1573 (71.1)
4681 2896 (61.9)
Girls 2431 1402 (57.7)
1909 1339 (70.1)
4340 2741 (63.2)
UPS Only
Total 4899 2725 (55.6)
4122 2912 (70.6)
9021 5637 (62.5)
Boys 1183 961
(81.2) 648
536 (82.7)
1831 1497 (81.8)
Girls 726 590
(81.3) 517
416 (80.5)
1243 1006 (80.9)
PS+UPS
Total 1909 1551 (81.2)
1165 952
(81.7) 3074
2503 (81.4)
Note: - Figures within parenthesis denote percentage.

FINAL REPORT 16
Chapter-6
Basic facilities in schools 6.1 In addition to adequate space for teaching, a school needs a boundary wall for safety
of children and school property, a playground, toilets and electricity. Position of the 268
sampled schools (172 primary schools only, 85 upper primary schools only and 11 PS+UPS)
in regard to these facilities is discussed in the subsequent paragraphs.
6.1 Boundary wall:
6.2 To ensure safety of children from outside elements, a boundary wall has been
considered desirable. However, even during 2010-11, all the schools did not have the
boundary walls-even of barbed wire or hedges. The percentage of schools having boundary
walls of various types are given in Table 6.1
Table 6.1 Percentage of schools having boundary walls during 2010-11 Districts
Jhansi Aligarh Both the district Sl. No. Particulars Primary
Schools
Upper primary schools
PS + UPS
Primary Schools
Upper primary schools
PS + UPS
Primary Schools
Upper primary schools
PS + UPS
1 No boundary wall 38.8 41.9 33.3 34.3 45.2 0.0 36.1 43.5 18.2
2 Pucca boundary wall
59.7 41.9 66.7 57.1 47.6 100.0 58.1 44.7 81.8
3 Pucca but broken 0.0 9.3 0.0 6.7 2.4 0.0 4.1 5.9 0.0
4 Partialy built boundary wall
1.5 2.3 0.0 1.9 4.8 0.0 1.7 3.5 0.0
5 Barbed wire fencing
0.0 4.6 0.0 0.0 0.0 0.0 0.0 2.4 0.0
6.3 It would be seen from Table 6.1 that 36.1 percent primary schools and 43.5 percent
upper primary schools in these two districts did not have a boundary wall. The percentage of
schools having pucca boundary was 58.1 in primary and 44.7 in upper primary schools.
6.2 Other facilities: 6.2.1 Playground: 6.4 Percentage of schools having playground is presented in Table 6.2 from which it is
seen that about 65.1 percent primary schools and 74.1 percent upper primary schools had
play-ground.
Table 6.2 Percentage of schools having playground: Districts Category of Schools Jhansi Aligarh Both the districts
Primary Schools only 53.7 72.4 65.1 Upper Primary School only 69.8 78.6 74.1 PS +UPS 50.0 100.0 72.7

FINAL REPORT 17
6.2.2 Toilets facilities:
6.5 All the primary schools are coeducational and boys and girls get education together.
All these schools should have separate toilet facilities for girls. Separate toilet facilities are
required in each of upper primary school also. However, few schools did not have this
facility. The percentage of schools having separate toilets for girls and boys and common
toilets and percentage of in use toilets among them is presented in Table 6.3.
Table 6.3 Percentage of schools having toilet facilities during 2010-11 Districts
Jhansi Aligarh Both the districts Sl. No. Particulars
PS Only UPS Only
PS +UPS PS Only UPS
Only PS
+UPS PS Only UPS Only
PS +UPS
Percentage of schools in which toilets were available
(i) Separate toilets
for girls 86.6 90.7 83.3 92.4 95.2 80.0 90.1 92.9 81.8
(ii) Separate toilets
for boys 83.6 88.4 83.3 91.4 97.6 80.0 88.4 92.9 81.8
1
(iii) Common
toilests 29.9 30.2 50.0 24.8 21.4 40.0 43.8 25.9 45.4
Percentage of schools in which toilets were in use
(i) Separate toilets
for girls 93.1 82.1 100.0 89.7 97.6 80.0 91.0 91.1 100.0
(ii) Separate toilets
for boys 83.9 81.6 100.0 87.5 97.5 80.0 86.2 88.6 100.0
2
(iii) Common
toilests 85.0 92.3 100.0 80.8 21.4 40.0 82.6 94.4 100.0
6.2.3 Electricity in schools
6.6 Electric facility was not available in most of the schools (Table 6.4). Schools in Jhansi
were a little better as about 58.2 percent primary schools and 53.5 percent upper primary
schools had this facility.
Table 6.4 Percentage of schools where electric facility was available Districts Category of Schools Jhansi Aligarh Both the districts
Primary Schools only 58.2 27.6 39.5 Upper Primary School only 53.5 35.7 44.7 PS +UPS 100.0 60.0 81.8
FINAL REPORT 18
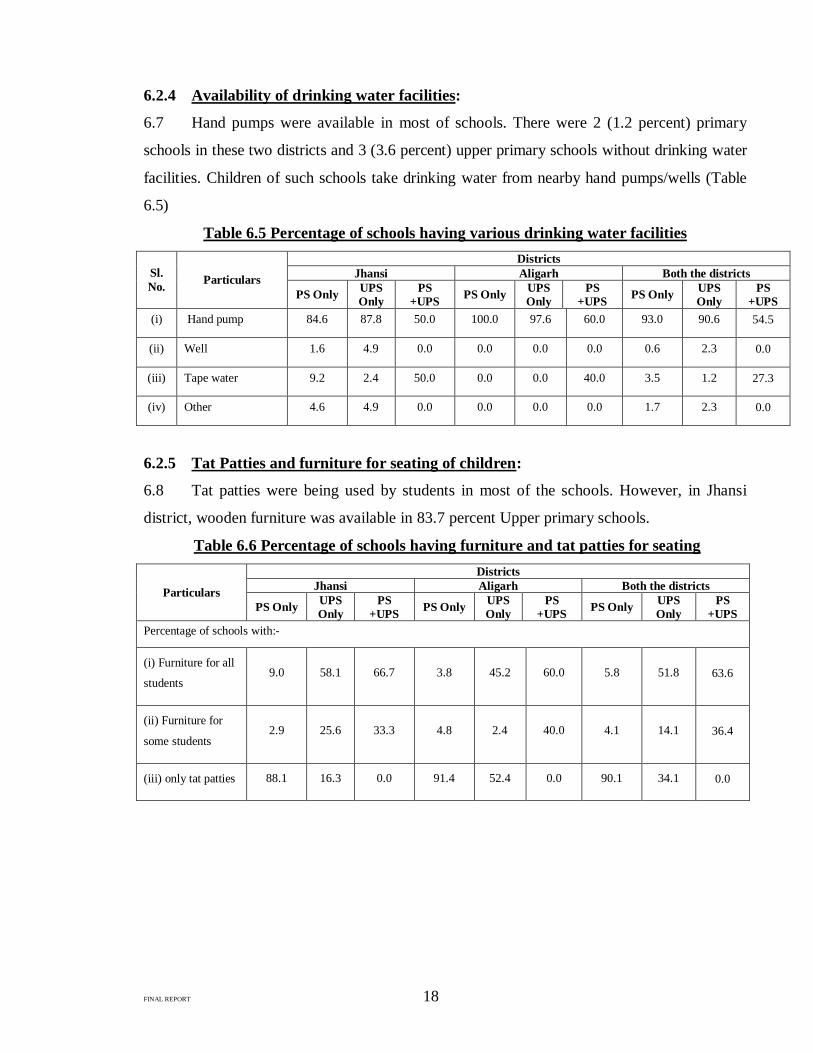
6.2.4 Availability of drinking water facilities:
6.7 Hand pumps were available in most of schools. There were 2 (1.2 percent) primary
schools in these two districts and 3 (3.6 percent) upper primary schools without drinking water
facilities. Children of such schools take drinking water from nearby hand pumps/wells (Table
6.5)
Table 6.5 Percentage of schools having various drinking water facilities Districts
Jhansi Aligarh Both the districts Sl. No. Particulars
PS Only UPS Only
PS +UPS PS Only UPS
Only PS
+UPS PS Only UPS Only
PS +UPS
(i) Hand pump 84.6 87.8 50.0 100.0 97.6 60.0 93.0 90.6 54.5
(ii) Well 1.6 4.9 0.0 0.0 0.0 0.0 0.6 2.3 0.0
(iii) Tape water 9.2 2.4 50.0 0.0 0.0 40.0 3.5 1.2 27.3
(iv) Other 4.6 4.9 0.0 0.0 0.0 0.0 1.7 2.3 0.0
6.2.5 Tat Patties and furniture for seating of children:
6.8 Tat patties were being used by students in most of the schools. However, in Jhansi
district, wooden furniture was available in 83.7 percent Upper primary schools.
Table 6.6 Percentage of schools having furniture and tat patties for seating Districts
Jhansi Aligarh Both the districts Particulars PS Only UPS
Only PS
+UPS PS Only UPS Only
PS +UPS PS Only UPS
Only PS
+UPS Percentage of schools with:-
(i) Furniture for all
students 9.0 58.1 66.7 3.8 45.2 60.0 5.8 51.8 63.6
(ii) Furniture for
some students 2.9 25.6 33.3 4.8 2.4 40.0 4.1 14.1 36.4
(iii) only tat patties 88.1 16.3 0.0 91.4 52.4 0.0 90.1 34.1 0.0

FINAL REPORT 19
Chapter-7
Training for filling the DISE format
7.1 Beneficiaries of training:
7.1 All coordinators of BRC/NPRC were imparted training in these two districts for filling
the DISE format. This training was organised at UERC in Jhansi and in Aligarh at Lodha
BRC by the district level MIS incharge / computer operators.
7.2 Place of training:
7.2 In these two districts, training to the headmasters/principals of the schools was
imparted at the Block Resource Centre (BRC) by the coordinators of NPRC/BRC/EMIS
incharge/computer operator.
7.3 Content of training:
7.3 During these trainings, DISE formats were given to all the coordinators/
headmasters/principals and all the participants were directed to fill these formats carefully.
7.4 Infrastructure available for filling of the DISE format:
7.4 Three computers were available at the district level in Jhansi and two in Aligarh. One
EMIS incharge along with one computer operator were in position in Jhansi and Aligarh
district.
7.5 Some shortcomings observed:
7.5 During the sample checking survey, our research investigators observed the following
shortcomings in the training:-
Most of the teachers found DISE format too large and complicated and most of them
emphasized the need for simplifying the present format.
Blocks provided against various items should be a little bigger so that code number
can be written very legibly.
Only original data should be sought through DISE. All cross-tabulation data can easily
be obtained at the district level through computer.

FINAL REPORT 20
Chapter-8
Major findings and Recommendations 8.1 For purposes of checking the information being supplied to the State Project Director
(SPD) through DISE, two districts viz Jhansi and Aligarh were selected and entrusted to the
Centre of Advanced Development Research, Lucknow. In these two districts, there were 5360
schools (2329 schools in Jhansi and 3031 schools in Aligarh district). A random sample of
about 5% schools (116 in Jhansi, and 152 in Aligarh district) was selected and basic data
relating to these schools in a format given by SPD was collected and then compared with the
data already available with SPD in the DISE format. Besides collecting comparable data,
some additional information relating to functioning of these schools was also collected. Based
on the analysis of the sample data and DISE data made available to the Centre after our field
work was over, the major findings of five percent checking and auxiliary information
collected in respect of these 268 schools are given below:
8.1 School particulars: (i) Type of schools
8.2 Out of 268 sampled schools, there was complete matching in respect of 267 sample
schools as regards type of schools was concerned. Even in the case one school where school
type differed, there appears to be slight negligence on the part of the headmaster, NPRC and
BRC officials and even at the BSA level. The head teachers of this school categorised the
schools for girls only whereas this was coeducational. Had any official at NPRC/BRC or even
BSA level taken a little more care, such mistake could have been detected and corrected. This
needs thorough scrutiny at NPRC/BRC level.
(ii) Establishment year
8.3 Establishment year is a little bit more complicated. Some head-teachers had taken it to
be the year of starting the lowest class in any building. Some had understood it to be the year
of starting construction of their own building and some had assumed this to be the year when
classes started running in their own building. This needs classification and elaboration in the
DISE format itself and scrutiny at the NPRC/BRC level. This also indicate that the training
programme conducted at various level is not of desirable standard.

FINAL REPORT 21
(iii) Enrolment of children
8.4 There is very close matching in the enrolment figures given in the DISE format and
collected through sample survey.
8.2 Need for sample checking:
8.5 Sample checking has established that although DISE data of schools have matched
very closely with sample data, this should not cause a sense of complacency. May be this is
due to sample checking that school officials are now a little more vigilant and careful in
providing information in DISE format. A system like DISE needs regular inbuilt sub-system
of checking by an external agency.

By S. K. Pant
Submitted to State Project Directorate Vidya Bhawan, Nishatganj
Lucknow
G. B. Pant Social Science Institute Allahabad – 211 019
Phone: (0532) 2569214, 2569206, Fax: (0532) 2569207 E-mail: [email protected]
URL : www.gbpssi.nic.in
RE P O R T
May 2011

i
Contents
Particulars Page Nos. List of Tables ii – iii List of Figures iv Research Team v Acknowledgement vi Executive Summary vii – x Chapter-1 Introduction 1 – 4 Chapter-2 Methodology 5 – 7 Chapter-3 Validation Analysis 8 – 17 Chapter-4 Availability and Conditions of School Records 18 – 24 Chapter-5 Training of Programme Functionaries 25 – 28 Chapter-6 Composition of VEC and Pattern of Supervision of
schools 29 – 34
Chapter-7 Availability of Teachers and Students on Validation Day 35 – 44 Chapter-8 Major Findings & Recommendations 45 – 50 Annexure I Block-wise list of Sample Schools 51 – 58 Annexure II Instruments used 59 – 66

ii
List of Tables
Particulars Page Nos. Table-2.1 Distribution of Schools on the basis of Category of the School
and School Management 6
Table-3.1 District wise availability of DISE Data for sample Schools 8 Table-3.2 Comparative Analysis of Data Regarding Information on
School Particulars 9
Table-3.3 Comparative Analysis of Data Regarding Information on
Ownership and Type of Building 11
Table-3.4 Macro Level Variation in the Primary Level Enrolment figures
generated through the DISE and Sample Checking Data 12
Table-3.5 Macro Level Variation in the Upper Primary Level Enrolment
figures generated through the DISE and Sample Checking Data 13
Table-3.6 Macro Level Variation in the Disabled Student Enrolment
figures generated through the DISE and Sample Checking Data 15
Table-3.7 Macro Level Variation in the ‘Repeaters’ Enrolment figures
generated through the DISE and Sample Checking Data 16
Table-3.8 Comparative analysis of number of Teachers in Position 17 Table-4.1 District wise Initial Reaction of Principals / Head Teachers 18 Table-4.2 Principal/Head Teachers response in Providing the information 20 Table-4.3 District wise Ready availability of Records 21 Table-4.4 District wise Physical Condition of School records 22 Table-4.5 Up – to - date Maintenance of school Records 24 Table-5.1 School where Principal / Head Teacher had received Training
on DISE 25
Table-5.2 School who had Received the previous years School Summary
Report 27
Contd...

iii
Particulars Page Nos. Table-6.1 Details of VEC Members in Sample Schools 30 Table-6.2 Details of Female VEC Members in Sample Schools 31 Table-6.3 Details of SC VEC Members in Sample Schools 32 Table-6.4 Details of VEC Meetings Held in Sample Schools in Last Three
Months 33
Table-6.5 School Visited at least Once in Last three Months by their
NPRC Coordinator 34
Table-7.1 School category wise (based on teachers strength) analysis of
no. of teacher absent on day of our visits 35
Table-7.2 Comparative analysis of Teachers Absenteeism in Government
and Private Schools 36
Table-7.3 Category wise analysis of Attendance in Primary Classes on the
day of our visit 37
Table-7.4 District/School Category-wise Analysis of attendance in
primary classes 39
Table-7.5 District wise proportion of schools where attendance in primary
classes was observed to be 75% or more 40
Table-7.6 Category-wise Analysis of attendance in Upper Primary classes
on the day of our visit 41
Table-7.7 District wise Analysis of attendance in upper primary classes on
the day of our visit 42
Table-7.8 District wise proportion of schools where attendance in upper
primary classes was observed to be 75% or more 43

iv
List of Figures
Particulars Page Nos. Figure-3.1 Proportion of schools where DISE data regarding school
particulars matches with the survey data 10
Figure-3.2 Comparison of primary level enrollment figures generated through the DISE and sample survey data
12
Figure-3.3 Comparison of upper primary level enrollment figures
generated through the DISE and sample survey data 14
Figure- 6.1 Percentage of total VEC members in Sample Schools 30 Figure- 7.1 Category-wise analysis of attendance in primary classes on the
day of our visit 38
Figure- 7.2 Category-wise analysis of attendance in upper primary classes
on the day of our visit 41

v
RESEARCH TEAM
Project Director
Prof. S. K. Pant
Sr. Research Assistant
D. N. Mishra
Sr. Research Assistant
Devanuj Tripathi
Research Investigators
P. K. Malviya
vi
Acknowledgement
Planning, in the modern time, has assumed a far more significance than it used to have earlier. In an effort to speed up the growth, no nation, howsoever small or big, can afford to commit mistake in planning and get away with it because a single mistake, no matter how trivial by nature, could not only push back the nation back on the development path but may also herald unforeseen disastrous consequences which may take unprecedented amount of time and resources to put back the derailed economy once again into the higher trajectory of growth.
The success of planning, these days, not only depends upon the availability of infrastructure and its efficiency in executing the plans but also on the latest up-date and current status of data on resources. Obsolete, out dated and irrelevant data on resources not only make the planning highly superficial and ritualistic but also an unrealistic one. Hence, there is a need for accurate, updated and precise set of data to make the planning relevant, appealing and useful.
Thus, realising the need, relevance and importance of data, the government created District Information System for Education (DISE) at the district level in 1995. DISE, since its inception, has undergone extensive reviews and modifications that has not only enlarged its coverage and scope but has also made it more competible to the needs and requirements of the situations. DISE now collects a comprehensive set of information from elementary schooling upto the upper primary levels.
Likewise, validation is no longer seen as a fault finding apparatus of criticism, but an effective and useful ploy or a safeguard device that helps in updating the data and also in identifying the gaps and loopholes in the planning process. Acknowledging its importance and potential, the government has now made it mandatory to get all the records periodically validated on sample basis before finalising them.
The ensuing exercise is a validation of DISE data for Mirzapur, Chandauli and Kaushambi districts. The analysis has been made on the basis of five percent sample check of schools selected on random basis.
I take this opportunity to thank the state Project Director, Lucknow for assigning the study to us. I also take this opportunity to thank Mr. D. B. Sharma, Additional State Project Director, all other personnels from State Project Office, Lucknow for providing necessary and relevant statistics. Likewise thanks are due to Mr. Dinesh Kumar Yadav, the BSA, Mirzapur, Mr. Arshad Ali, EMIS Incharge, Mirzapur, Mr. O.P. Tripathi, the BSA, Chandauli, Mr. Rama Shankar Yadav, EMIS Incharge, Chandauli and Raja Bhanu Pratap Singh, the BSA, Kaushambi, Mr. Arvind Kumar, EMIS Incharge, Kaushambi and all personnels from Mirzapur, Chandauli and Kaushambi districts for extending their help time and again and also sharing their experiences with the validating team. Let me also acknowledge that without their support, it would not have been possible for me to complete this daunting task.
I would like to thank Professor Pradeep Bhargava, the Director of the Institute for extending all facilities of the Institute and encouraging me all through the course of the study. Finally I also thank my project staff consisting of Mr. Diva Nath Mishra, Mr. Devanuj Tewari and Mr. Padma Kant Malviya for their dedication and hard work.
S. K. Pant

vii
Executive Summary
The sample checking of DISE data was carried out on the basis of five percent school, randomly selected from Mirzapur, Chandauli and Kaushambi districts. The hard copy of the list was provided to G. B. Pant Social Science Institute, Allahabad by the State Project Office, Lucknow. However, adequate care has been taken to include all types of schools, that are operational, in these three districts in the sample.
(A) The Sample
The sample consists of a total of 298 schools of which 130, accounting to about 44 percent were located in Mirzapur district, another 85, accounting to over 28 percent were located in Chandauli district and remaining 83, accounting to about 28 percent were located in Kaushambi district respectively.
The sample contained an over-whelming proportion of primary schools (about 67 percent), while the proportion of upper primary schools was reported to be about 33 percent.
Similarly an overwhelmingly proportion of schools (about 82 percent) were being managed by the education department, while the proportion of private schools was reported to be over 18 percent respectively.
(B) The DISE Data
It has been found that, in the majority of cases, the DISE data matched with sample survey data on a large number of parameters pertaining to school information, nature and pattern of ownership of building etc.
However, in the few indicators like the establishment year of the school, number of class room, the variation between DISE and sample survey data has also been observed.
However, where ever the variation was observed, it was not found to be large or significant.
(C) The Enrolment Data High level of compatibility between DISE data with sample survey data
was observed, however, in a fewer cases, where variation existed between the two sets of data, it was found to be quite marginal, both at the primary as well as at the upper primary levels.

viii
(D) The Data on Disability of children High level of compatibility of DISE data with sample survey data was
observed in case of disable students both at the primary and upper primary level.
However, in a fewer cases, where variation existed between the two sets of information, it was not found to be quite insignificant.
(E) The Repeaters Data
High level of consistency and compatibility was observed between DISE and sample survey data on repeaters, at the primary level.
In the smaller proportion of cases where the variation between the two sets of information was found at the upper primary level, the variation was highly insignificant.
(F) The Teacher’s Position The compatibility level between the DISE and sample survey data was not
observed to be of a high order, however it was also found that the level of variation between the two sets of data was quite marginal.
(G) The Initial Reaction Data
Overwhelming proportion of Principal/Head Teacher’s response was quite positive and the teacher’s of schools managed by education department appreciated most closely followed by the teachers of the schools run by private institutions.
(H) The Records Available Data The performance of schools managed by education department in the
matter of availability of records was one of the best, followed by school managed by privately.
(I) The Physical Conditions of Records
The physical condition of the records, in a sizeable proportion of school, was observed to be good however in quite a small proportion of them, the condition cannot be stated to be good.
The performance of the schools managed by education department was the best.

ix
(J) The Up to Date Maintenance Data Similarly, the performance of schools in maintaining up to date school
records could be called to be high. Likewise, it can also be stated that the best performance in maintaining up
to date records came from the schools managed by education department followed by privately managed schools.
(K) The Training of Functionaries Data
The overall proportion of schools where the Principal/Head Teachers had received training at DISE could be called to be high.
There were quite a substantial proportion of schools where the training of Principal and Associated Staff has not taken up.
While the best performance came from the schools managed by education department, the schools run by private institutions performed very poorly.
(L) The Supervision & monitoring Data
The overall level of schools being supervised or monitored could be called to be high. The level of supervision is also less due to the fact that a significant proportion of private schools have remained un-supervised.
The best performance came from the schools managed by education department while those managed by private institutions performed very disappointingly.
(M) The Awareness Regarding Composition of VEC
The composition of VECs shows an over-whelming proportion of VECs of five members.
Almost all of the sampled government schools, the VECs were reported to be having one or more female members.
In a large proportion of the schools, the VECs had one or more member belonging to the Scheduled Castes.
The level of the frequency of VEC meeting in the schools could be called to be high as in about 64 percent of the schools; the meeting was either held once or more during the last three month.

x
(N) The Availability of teachers and students Data or Validation Day Quite a sizeable proportion of schools have appropriate number of
teachers, however the functioning suffered on account of incidence of absenteeism.
The overall level of student presence was not very high as hardly 52 percent of the students were present on the validation day at the primary level, however, its proportion is also about 52 percent at upper primary level.

1
Chapter - 1 Introduction
1.1 Education & Relevance of DISE Data
Among all the modern variables of development, education is, perhaps, one of the most uniformly acceptable inputs for triggering off social engineering. Education, on account of its highly pervasive nature, transgresses influences and moulds the human capabilities from very low levels to unprecedented heights, from being an unknown unproductive class to becoming a highly competitive unit and from being a raw and uncultivated piece to transforming into a highly refined value added product. However, the tryst with education has been a mixed one. It could be summarized to be a saga of success and failures, triumphs and disappointments and integration and marginalization. Success, triumphs and integration being achieved largely in the field of enhancement in the number of schools, number of teachers, physical infrastructure, enrolment levels, and above all the overall literacy levels, while the disappointments, failures and marginalisations being experienced in the form of high drop-out rates both at the primary and secondary levels, dilution in the quality of education, increasing marginalisation of the disadvantaged section and females. The decades of planning has also succeeded in erecting/ creating the basic infrastructure from the grass root levels to the national levels which not only facilitates the flow and dissemination of information from top to down and vice-versa, on one hand, but also helps in the execution and monitoring of the programme, on the other. In the modern era of planning, the success of any plan depends, to a large extent, not only on the availability of information about the resources but also on their accuracy and current status. Obsolete, out dated and irrelevant data or information not only thwarts the growth prospects but also makes the planning irrelevant and highly superficial which, if allowed to continue, perpetuates and promotes complacency, frustration and failure, which no government affords to withstand. Validation of the data, therefore, holds an important and crucial place in the overall modern planning set up. It, thus, provides an opportunity for critically scrutinizing, modifying and up-dating the records thereby ensuring a solid base for making a realistic and feasible plan.

2
1.2 Data Collection Pattern
Realising the need for qualitative and reliable data and accepting the fact that prevailing system of information gathering about education had completely lost its credibility, earnest efforts were made to revamp the system with the launch of first District Primary Education Programme (DPEP) in 1994. The data produced by the States under the ageises of Ministry of Human Resource Development (MHRD), New Delhi where highly aggregative in nature and were not amenable to validation and reliability tests. Besides this they also suffered from time lag. All these inconsistencies made the educational planning not only difficult but highly un-realistic. Concerned over the poor quality of data, the government initiated measures to introduce major reforms in school statistics so as to improve its scope and coverage. Accordingly, National Institute for Educational Planning and Administration (NIEPA) New Delhi was requested to accept this challenging and daunting task. Thus, NIEPA, in 1995, developed a statistical software system that was in tune with the spirit of DPEP which subsequently underwent extensive reviews and upgradation to encompass the features of SSA in 2001. 1.3 District Information System for Education (DISE)
The District Information System for Education (DISE) is basically a statistical software developed by the National Institute for Educational Planning and Administration (NIEPA), New Delhi in the year 1995. It is a comprehensive package that facilitates collection of school level information/data and its subsequent computerisation. The nodal point for collection of data is done at the level of district. The DISE, since its inception, has undergone extensive reviews and modified accordingly. With the advent of Sarva Siksha Abhiyan (SSA) in 2001, the scope of its latest version named as DISE 2001 has further been extended to cover the information up to the elementary level of education. Thus, DISE now collects the information from elementary schools up to upper-primary level in a very concrete and comprehensive way. In DISE, the flow of information/data plays a very crucial and significant role. The basic data is collected at the school level in the prescribed formats. It is then subsequently verified and whetted by the Block Education Officer or Block Resource coordinator for its accuracy and completeness and passed on to the Educational Management Information System (EMIS) In charge at the District Project Office

3
where it is fed into the computer. However, the responsibility for checking the consistency of data ultimately rests with the District Project Office.
The validated data, thus collected, is subsequently stored at the district level
and is made available to the State Project Office where it is aggregated and collated with the help of another software called DISE which has been specifically designed for not only the analysis at the state level but also monitoring and tracking the progress of key performance indicators. The basic mechanism of the working of DISE could be summarised in the following flow diagram:
District Information System for Education
National Level
State Project Office
District Project Office
Block / Taluk
Village School
Reports
School Report Card Filled DCF
Filled DCF Blank DCF
District Reports DISE Database
State/District Reports
Cluster Reports

4
1.4 Sample Checking of DISE Data
Though adequate precaution and care is taken for preserving the consistency and accuracy of DISE data, however, provision has also been made to verify the accuracy of it on sample basis to be selected by some external agency, with requisite competency, every year. Further, it has also been resolved by the central government that no DISE data would receive attention at the national level without undergoing a sample check. In compliance to the above mandate, the State Project Office (SPO), Education for All, Lucknow invited project proposals from different organizations on September 06, 2010. Accordingly, a proposal was submitted on September 28, 2010. After scrutiny, the SPO office sent the terms of references (TOR) to all selected agencies and after signing of TOR on January 06, 2011, the Institute received the first installment of grant on January 15, 2010.

5
Chapter - 2 Methodology
2.1 The Design
The validation exercise has been carried out on the basis of guideline proposed in the joint meeting held at Lucknow between the officials of the State Project Directorate, Lucknow and the officials of the monitoring institutions. The salient features of the proposed meeting could be summarised as:
(a) It was decided that the sample would contain five per cent of the EMIS school data.
(b) Care would be taken to select all kinds of schools viz. education department, board office, aided, unaided, etc.
(c) The sample selection of the schools would be based on the block-wise list provided by the State Project office in advance to the monitoring institutions.
(d) The selection of the sample school would be made on the basis of random selection that includes both urban and rural areas.
(e) The State Project office, would also provide data capturing form (DCF) to the monitoring institution identical to the one used by the teachers of the sample schools so that comparison could be made on similar parameter, and
(e) The school data would pertain to the year 2010-11.
Further, it was resolved that the validation exercise would focus on the following points:
(a) What type of training has been imparted to the Principal of the schools regarding filling of the school statistical forms.
(b) Strengthening up of Management of Information System (Infrastructure).
(c) Appropriate use of EMIS data at every level.
(d) Availability of DISE data/ Block Report Card at the Block Resource Centres.
(e) Whether DISE data is being used for AWP & B planning or not?
(f) Organisation of workshops regarding EMIS data.
(g) Availablity of computer hardware and software personnel at the district level, and
(h) To suggest measures to improve and enhance the quality of data collection, data entry and accuracy of data.

6
2.2 Methodology
The study, therefore, follows the guidelines for selecting the sample schools on the basis of the list provided by the State Project Office, Lucknow. It could be seen that the district of Mirzapur had a total of 2591 schools of which 130 schools have been selected, district Chandauli had a total of 1693 schools of which 85 schools have been selected and district Kaushambi had a total of 1652 schools of which 83 schools (constituting about 5 per cent of the each total) were randomly selected for the validation study. The perusal of the list of schools shows that, on the basis of management, education department overwhelmingly dominated the show with over 81 percent share followed by private institutions with over 18 percent share respectively. The other details of the methodology has been summarised below:
Table 2.1 Distribution of Schools on the basis of Category of the School and School Management
Primary School Upper Primary School Total Districts Govt. Private Total Govt. Private Total Govt. Private Total
Mirzapur 1431 (74)
388 (17)
1819 (91)
495 (27)
277 (12)
772 (39)
1926 (101)
665 (29)
2591 (130)
Chandauli 981 (51)
150 (05)
1131 (56)
468 (24)
94 (05)
562 (29)
1449 (75)
244 (10)
1693 (85)
Kaushambi 884 (44)
153 (08)
1037 (52)
465 (23)
150 (08)
615 (31)
1349 (67)
303 (16)
1652 (83)
Grand Total 3296 (169)
691 (30)
3987 (199)
1428 (74)
521 (25)
1949 (99)
4724 (243)
1212 (55)
5936 (298)
Note : Figures in the bracket denote the number of sample schools. Source : List of schools provided by the State Project Office, Lucknow. Highlights
Over 77 percent of the total sample schools in Mirzapur and over 88 percent of the total sample schools in Chandauli district were being managed by the education department while its share was worked out to be about 81 percent in Kaushambi district.
Over 22 percent of the remaining schools in Mirzapur and about 12 percent of the schools in Chandauli district were being managed by private management while its share was worked out to be over 19 percent in Kaushambi district.
About 67 percent of the total schools in the sample were primary with the share of Mirzapur, Chandauli and Kaushambi being about 70 percent, 66 percent and 63 percent respectively.
About 33 percent of the schools in the sample were upper primary with Mirzapur contributing 30 percent, Chandauli contributing over 34 percent and Kaushambi over 37 percent.
7
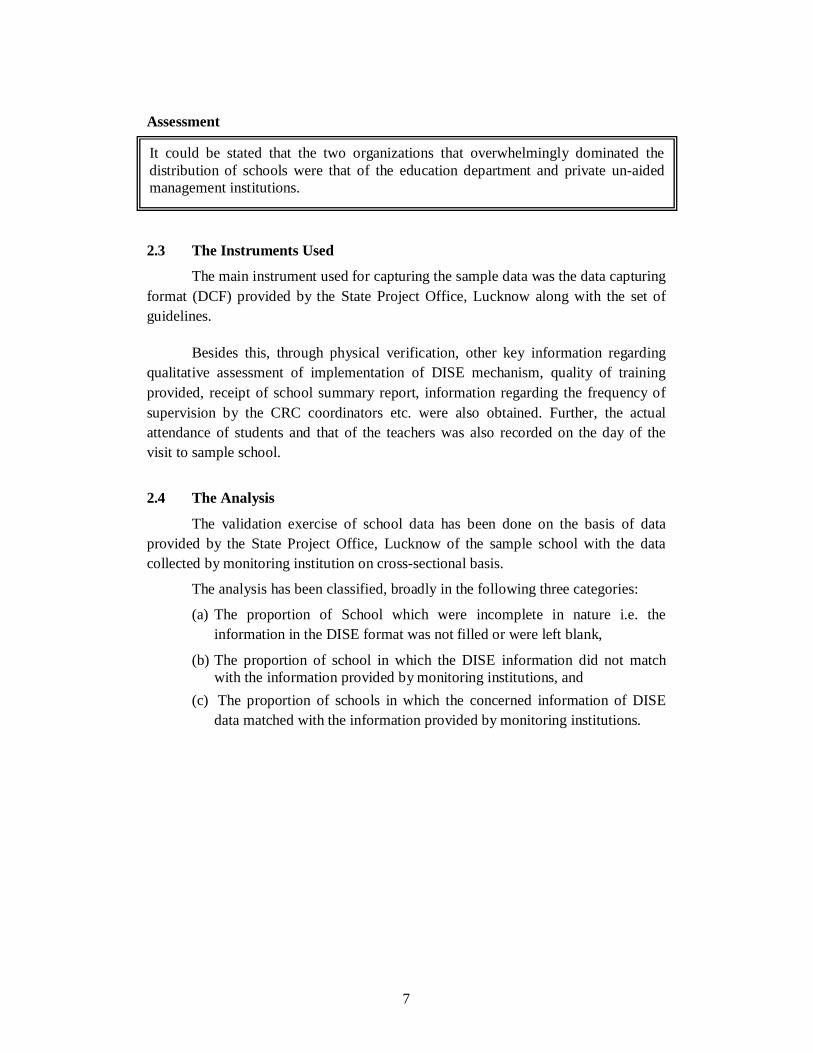
Assessment 2.3 The Instruments Used
The main instrument used for capturing the sample data was the data capturing format (DCF) provided by the State Project Office, Lucknow along with the set of guidelines. Besides this, through physical verification, other key information regarding qualitative assessment of implementation of DISE mechanism, quality of training provided, receipt of school summary report, information regarding the frequency of supervision by the CRC coordinators etc. were also obtained. Further, the actual attendance of students and that of the teachers was also recorded on the day of the visit to sample school.
2.4 The Analysis
The validation exercise of school data has been done on the basis of data provided by the State Project Office, Lucknow of the sample school with the data collected by monitoring institution on cross-sectional basis.
The analysis has been classified, broadly in the following three categories:
(a) The proportion of School which were incomplete in nature i.e. the information in the DISE format was not filled or were left blank,
(b) The proportion of school in which the DISE information did not match with the information provided by monitoring institutions, and
(c) The proportion of schools in which the concerned information of DISE data matched with the information provided by monitoring institutions.
It could be stated that the two organizations that overwhelmingly dominated the distribution of schools were that of the education department and private un-aided management institutions.

8
Chapter - 3 Validation Analysis
3.1 Availability Pattern of DISE Data in Sample Schools
The analysis of DISE data was attempted by the monitoring institution (MI) on the basis of selection of sample schools. Prior to the commencement of field work, the State Project Office, Lucknow had called a meeting of all monitoring institutions to discuss the modalities and other logistics besides allocating the sample districts. The monitoring institutions were provided the hard copy of the document containing the following information: (i) District's name (ii) Block's name (iii) Village's name (iv) School's name, and (v) Location of School
Further, it was found that information on the aforesaid mentioned heads had been cent percent processed. The detail information of DISE data has been summarised below :
Table 3.1 District-wise availability of DISE Data for sample Schools
School for which data was found available in the DISE Data
Sl.No. Name of District
No. of Sampled Schools
Schools Percentage 1 2 3 4 1 Mirzapur 130 130 100.0 2 Chandauli 85 85 100.0 3 Kaushambi 83 83 100.0
Total 298 298 100.0 Source : Data provided by SPO Lucknow.
The study of distribution of sample schools in the district shows that DISE data was available in all the 298 schools. Highlights
Assessment
Cent percent record of the sample schools was found available in the DISE data.
Availability of school data in cent percent of the schools is a positive sign that helps in making a fair assessment and also helps in making the planning effective.

9
3.2 Information on school particulars
According to the guideline the schools should contain all necessary information as maintained in the manuals, in the records which should be made available for validation. Thus, the validation exercise was carried on the following parameters viz. school type, school category, lowest classes, highest classes, school management, school location and their year of establishment. It could be seen that except for the year of establishment, the availability of data for other parameters was consistently high. The details of the analysis have been summarized below :
Table 3.2
Comparative Analysis of Data Regarding Information on School Particulars
Not filled/ Not available in DISE Data
Available in DISE Data but does not
match with Survey
Available in DISE Data and
match with Survey
Information Collected
Sample Size (N)
No. % No. % No. %
1 2 3 4 5 6 7 8
School Type 298 - - 01 0.3 297 99.7
School Category 298 - - - - 298 100.0
Lowest Classes 298 02 0.7 - - 296 99.3
Highest Classes 298 02 0.7 - - 296 99.3
School Management 298 - - 01 0.3 297 99.7
School Location 298 02 0.7 03 1.0 293 98.3
Establishment Year 298 04 1.3 40 13.4 254 85.2 Source : Field Survey 2011, Mirzapur, Chandauli & Kaushambi and Data provided by SPO, Lucknow.

10
Figure-3.1 Proportion of Schools where DISE Data regarding School Particulars Matches with the
Survey Data
85.2%
98.3%99.7%99.3%99.3%100%99.7%
75
80
85
90
95
100
School Type SchoolCategory
LowestClasses
HighestClasses
SchoolManagement
SchoolLocation
EstablishmentYear
Highlights Assessment
3.3 Nature & Pattern of Ownership & Building
In over 99 percent of the schools, the DISE data matched with sample survey data in providing school type information.
In cent percent of the cases, the DISE data matched with sample survey data in providing information on school category.
In over 99 percent cases, the DISE data matched with sample survey data on information regarding both of the lowest classes and highest classes.
In over 99 percent cases, the DISE data matched with sample survey data on information regarding school management.
In over 98 percent cases, the DISE data matched with sample survey data on information regarding school location.
In about 85 percent cases, the DISE data matched with sample survey data on information regarding establishment year.
It could be said that except for information on establishment year, the level of matching of DISE data with sample survey data on other educational parameters was of a very high order, which is a welcome and encouraging sign.

11
The guidelines classifies the nature of ownership into three distinct classes viz. as private, or rented or Government while the type of school buildings have been identified as Pucca, Partially Pucca and Kuccha. The study of sample schools shows that the information on the ownership head, type of building and on the number of class rooms were available in cent percent of the school records. The detail analysis has been presented below :
Table 3.3 Comparative Analysis of Data Regarding Information on Ownership and Type
of Building
Not filled/ Not available in DISE Data
Available in DISE Data but does not
match with Survey
Available in DISE Data and match
with Survey
Information Collected
Sample Size (N)
No. % No. % No. %
1 2 3 4 5 6 7 8
Ownership 298 - - - - 298 100.0
Type of Building 298 - - 15 5.0 283 95.0
No. of Class Room 298 04 1.3 14 4.7 280 94.0 Source : Field Survey 2011, Mirzapur, Chandauli & Kaushambi and Data provided by SPO, Lucknow. Highlights
Assessment
In cent percent cases, the DISE data matched with sample survey data regarding information on ownership of the building.
In 95 percent cases, the DISE data matched with sample survey data on information regarding type of buildings of the schools.
In about 94 percent cases, the DISE data matched with sample survey data on information regarding number of class rooms in the schools.
It could be said that information for nature of ownership, type of school building and number of class rooms in the school, the level of DISE data matching with sample survey data was observed to be of a very high order, which is a positive sign of development.

12
3.4 Pattern of Enrolment level at Primary Level
According to the guidelines, the enrolment should contain the enrolment figure of all types of students viz. SC, ST and also children with disabilities. The study of enrollment pattern shows that though the variation level at overall level was quite marginal. The detail category wise analysis has been summarised below :
Table 3.4 Macro Level Variation in the Primary Level Enrolment figures generated
through the DISE and Sample Checking Data
For the 199 sample schools having Primary classes showing Complete and consistent DISE Data
Category
As generated through the DISE
As found during sample checking Survey
Variation
(%)
1 2 3 4
Boys (Overall) 17786 17741 0.3
Girls (Overall) 18101 18046 0.3
Boys (SC/ST) 6992 6919 1.0
Girls (SC/ST) 6711 6660 0.8
Source : Column 2 : Data provided by SPO, Lucknow. Column 3 : Field Survey 2011, Mirzapur, Chandauli & Kaushambi.
Fig. 3.2 Comparison of Primary Level Enrollment figures generated through the DISE
and Sample Survey Data
67116992
1810117786
66606919
17741 18046
Boys (Overall) Girls (Overall) Boys (SC/ST) Girls (SC/ST)
Through the DISE Sample Checking Survey

13
Highlights Assessment
3.5 Pattern of Enrolment levels at Upper Primary Schools
The study of enrolment pattern of students at sample schools shows that at the overall levels, the variation in the DISE and sample data was between 1 percent and 2 percent. The detail analysis of the consistency of DISE with sample data has been summarized below :
Table 3.5 Macro Level Variation in the Upper Primary Level Enrolment figures generated
through the DISE and Sample Checking Data
For the 99 sample schools having Upper Primary classes showing Complete and consistent DISE Data
Category
As generated through the DISE
As found during sample checking Survey
Variation
(%)
1 2 3 4
Boys (Overall) 7115 7166 0.7
Girls (Overall) 6399 6427 0.4
Boys (SC/ST) 2306 2280 1.1
Girls (SC/ST) 2028 2057 1.4
Source : Column 2 : Data provided by SPO, Lucknow. Column 3 : Field Survey 2011, Mirzapur, Chandauli & Kaushambi.
Variation of less than one percent was found between the DISE data and sample survey data on information regarding boys (overall variation).
Variation of less than one percent was observed between the DISE data and sample survey data on girl's overall enrollment.
Variation of one percent was observed between DISE and sample survey data on boys (SC) enrollment.
Variation of less than one percent was found between DISE and sample survey data on girls (SC) enrollment.
The variation between DISE and sample survey data at the primary level enrollment figures was found to be quite marginal and insignificant.

14
Fig. 3.3 Comparison of Upper Primary Level Enrollment figures generated through the
DISE and Sample Survey Data Highlights Assessment
Less than one percent of variation was found between DISE data and sample survey data on boys (overall) enrollment.
Less than one percent of variation was found between DISE data and sample survey data on girls (overall) enrollment.
About one percent of variation was found between DISE data and sample survey data on boys (SC) enrollment.
Less than 2 percent of variation was found between DISE data and sample survey data on girls (SC) enrollment.
The variation between DISE and sample survey data at the upper primary level enrollment figures was found to be quite marginal.
7166
6427
2280 205720282306
6399
7115
Boys (Overall) Girls (Overall) Boys (SC/ST) Girls (SC/ST)
Through the DISE Sample Checking Survey

15
3.6 Pattern of children with Disability
According to the guidelines, the school should have records of the children with any form of disability. The study of disability pattern among the children in sample school has also been attempted, at both the Primary and Upper Primary levels. The analysis shows that the variation was quite marginal at both the Primary and Upper Primary levels. The detailed analysis has been summarized below :
Table 3.6
Macro Level Variation in the Disabled Student Enrolment figures generated through the DISE and Sample Checking Data
Category
No. of Schools having Primary or
Upper Primary Classes (N)
As generated through the
DISE
As found during sample
checking Survey
Variation
(%)
1 2 3 4 Primary Level Disabled Boys 199 70 73 4.1
Disabled Girls 199 60 57 5.0
Upper Primary Level Disabled Boys 99 30 31 3.2
Disabled Girls 99 21 23 8.7 Source : Column 2 : Data provided by SPO, Lucknow. Column 3 : Field Survey 2011, Mirzapur, Chandauli & Kaushambi. Highlights Assessment
About 4 percent of variation was found between DISE data and sample survey data on boy's disability at primary level.
About 5 percent of variation was found between DISE data and sample survey data on girl's child disability at primary level.
Less than 4 percent of variation was found between DISE data and sample survey data on disability of boys at the upper primary level.
Less than 9 percent of variation was found between DISE data and sample survey data on disability of girls at the upper primary level.
It could be said that except for the disabled girls at the upper primary level, the variation between DISE and sample survey data at both the primary and upper primary level was quite marginal.

16
3.9 Repeaters Pattern
The guidelines clearly states that repeaters has been identified as one who has been enrolled in the same class for more than one year on account of unsatisfactory performance. Thus, a student readmitted to the same class on account of not attending classes for a major part of the year should not be treated as a repeater. The study of repeaters in the sample schools shows that the data for repeating students had a higher variation at Upper Primary level as compared to the ones at Primary level. The detail analysis of data on repeaters has been given below :
Table 3.7
Macro Level Variation in the ‘Repeaters’ Enrolment figures generated through the DISE and Sample Checking Data
Category
No. of Schools having Primary or
Upper Primary Classes (N)
As generated through the
DISE
As found during sample
checking Survey
Variation
(%)
1 2 3 4 Primary Level Repeaters Boys 199 38 41 7.3
Repeaters Girls 199 41 43 4.7
Upper Primary Level Repeaters Boys 99 18 27 33.3
Repeaters Girls 99 15 21 28.6 Source : Column 2 : Data provided by SPO, Lucknow. Column 3 : Field Survey 2011, Mirzapur, Chandauli & Kaushambi.
Highlights
Assessment
About 7 percent of variation was found between DISE data and sample survey data on boys who are repeaters at the primary level.
Less than 5 percent of variation was found between DISE data and sample survey data on girls who are repeaters at the primary level.
About 33 percent of variation was found between DISE data and sample survey data on boys who are repeaters at the upper primary level.
Over 28 percent of variation was found between DISE data and sample survey data on girls who are repeaters at the upper primary level.
It could be stated that, in quite a few proportion of schools, at the upper primary level, the variation between DISE and sample survey data was not significant which cannot be taken to be a good thing. Thus, there is a need to address the issue of inconsistency through appropriate strategies, like strengthening the supervision and monitoring, periodically updating the records etc.

17
3.10 Data Regarding Teachers in Position:
The role of teachers in school management and planning holds a crucial and significant place. The Sarva Siksha Abhiyan has also highlighted the pivotal role of teachers in the school level activities. The study of teacher’s position, thus, has a significant bearing in accessing the performance of schools. A detail analysis of teacher’s position in various types of sample schools has been presented below :
Table 3.8
Comparative analysis of number of Teachers in Position
No. of Sample Schools having primary/upper
primary classes for which DISE Data was found consistant (n)
Schools where the number of Teacher was found to be matching in the DISE and
Sample Survey Data
School Category
No. No. %
1 2 3 4
All School Combined 298 171 57.4
Government Schools 243 155 63.8
Private Schools 55 16 29.1 Source : Field Survey 2011, Mirzapur, Chandauli & Kaushambi & Data provided by SPO,
Lucknow. Highlights Assessment
In about 64 percent of government schools, data regarding the number of teachers in position was found to be matching with the survey data.
In case of private schools, for over 29 percent of the schools, the two sets of data matched with each other.
The overall proportion of schools where the DISE data was found to be matching with the survey data was over 57 percent.
It could be stated that though the compatibility level of DISE data and sample survey data was not of a high order, however, it was also found that, where ever mismatch in the records occurred, the level of variation was not quite significant. These inconsistences needs to be addressed through appropriate intervention strategies.

18
Chapter - 4 Availability and Conditions of School Records
4.1 Pattern of Initial Reaction of Principal/Head Teachers
Validation exercise may not be taken as a fault finding exercise, or a ploy or measure to criticise the school management for performing poorly. On the other hand, it provides an opportunity to look into the areas that are vulnerable or that require special attention. Validation, in other words, is to be taken as a teachers/management gesture that also looks into the problems that the teacher’s encounter in the course of performing their duties. How this has been perceived by school management has also studied? The analysis of response of Principal/Head Teachers shows that data on response was found to be quite positive in a sizeable section of sample schools. The district-wise detail of the responses has been summerised below :
Table 4.1 District wise Initial Reaction of Principals / Head Teachers
Total No. of Schools Covered
Schools where the initial reaction was found to be quite positive
District / Category
No. No. % 1 2 3 4
Over all School 298 290 97.3
District wise analysis
Mirzapur 130 128 98.5
Chandauli 85 82 96.5
Kaushambi 83 80 96.4
School Management wise analysis
Run by Education Department 243 242 99.6
Private School 55 48 87.3
Source : Field Survey 2011, Mirzapur, Chandauli & Kaushambi.

19
Highlights Assessment 4.2 Response Providing Information Pattern
The availability of data regarding their Principal/Head teacher's response with the schools is perceived to be an indicator of efficient management. It is interesting to see how the sample schools have managed the data on responses. The study shows that the overall data on responses was quite high. The detail district-wise analysis of the record keeping by sample schools has been summarised below :
In over 97 percent of the sample schools, the initial reaction of the teachers was found to be quite positive.
In over 98 percent of the schools in Mirzapur district, the initial reaction of principal or head teachers was found to be quite positive, while in Chandauli and Kaushambi districts, the initial reaction of principal or head teachers found to be quite positive was observed both in over 96 percent schools.
In over 99 percent of the schools run by education department, the initial reaction of principal/head teachers was found to be quite positive, while this ratio in the privately managed schools was also about 87 percent.
The initial positive response shown by an overwhelmingly large proportion of teachers of the sample schools demonstrates that the move has made a positive impact. However, there were quite a few schools that have failed to understand the spirit of more and therefore they need to be sensitized and motivated through appropriate intervention strategies.

20
Table 4.2 Principal / Head Teachers response in Providing the information
Total No. of Schools Covered
Schools where the Response found to be quite positive
District / Category
No. No. % 1 2 3 4
Over all School 298 288 96.6
District wise analysis
Mirzapur 130 125 96.2
Chandauli 85 82 96.5
Kaushambi 83 81 97.6
School Management wise analysis
Run by Education Department 243 243 100.0
Private School 55 45 81.8
Source : Field Survey 2011, Mirzapur, Chandauli & Kaushambi.
Highlights Assessment
In over 96 percent of the sample schools, the response of the Principal/Head Teachers was found to be quite positive.
In about 96 percent of the schools in Mirzapur district, the response of the Principal/Head Teachers was found to be quite positive.
In over 96 percent of the schools in Chandauli district, the response of the Principal/Head Teachers was found to be quite positive.
In over 97 percent of the schools in Kaushambi district, the response of the Principal/Head Teachers was found to be quite positive.
In cent percent of the schools run by education department, the response of the Principal/Head Teachers was found to be quite positive.
In about 82 percent of the schools run by private management, the response of the Principal/Head Teachers was found to be quite positive.
The overall level of the response in the sample schools has been quite high, which spells good for the programme. However, there were still quite a few schools run by private management who have yet not understood the spirit of such endeavours and therefore, needs to be sensitized and motivated.

21
4.3 Records Availability Pattern
The study of record keeping pattern also reflects the status of efficient management. If the records are easily available then it should be identified as a sign of efficient management and if they are not, then it may be termed as poorly managed. The study of availability of records in the sample schools shows that by and large a sizeable proportion of schools have records available with them and this trend was more pronounced among the schools run by government department followed by schools managed by private management. The detailed district-wise analysis of records by sample schools has been summarised below :
Table 4.3 District wise Ready availability of Records
Total No. of Schools Covered
Schools where the records where made readily available
District / Category
No. No. % 1 2 3 4
Over all School 298 280 94.0
District wise analysis
Mirzapur 130 122 93.8
Chandauli 85 80 94.1
Kaushambi 83 78 94.0
School Management wise analysis
Run by Education Department 243 236 97.1
Private School 55 44 80.0
Source : Field Survey 2011, Mirzapur, Chandauli & Kaushambi.
Highlights
In 94 percent of the sample schools, the school records were readily available.
In about 94 percent of the schools in Mirzapur district, the school records were readily available.
In over 94 percent of the schools in Chandauli district, the school records were readily available.
In 94 percent of the schools in Kaushambi district, the school records were readily available.
In over 97 percent of the schools run by government department, the records were readily made available.
In 80 percent of the schools run by private institutions, the records were made readily available.

22
Assessment
4.4 Physical Conditions of School Records
In the upkeep of records, the physical condition assumes an important dimension. If the records are kept in poor or torn conditions, the chances of their loosing pages or missing vital information looms large while if the records are kept in a good shape or conditions, their chances of lasting are exceptionally high. Moreover, they provide vital statistics which facilitates planning related activities. The study of records maintained by sample schools shows that in a majority of schools, the records were kept in good conditions however in remaining praportion of schools, they were not kept in good conditions. The over all level of records maintained by Education department could be called to be of a high order.
Table 4.4 District wise Physical Condition of School records
Total No. of Schools Covered
Schools where Physical condition of school records was observed to be good
District / Category
No. No. % 1 2 3 4
Over all School 298 260 87.2
District wise analysis
Mirzapur 130 124 95.4
Chandauli 85 67 78.8
Kaushambi 83 69 83.1
School Management wise analysis
Run by Education Department 243 220 90.5
Private School 55 40 72.7
Source : Field Survey 2011, Mirzapur, Chandauli & Kaushambi.
The proportion of schools where information was readily provided by Principals/Head Teachers, was noted to be lowest among those run by private institutions and highest among those run by government department. However, it was found that in some schools run by private institutions, the records were provided by simply counting verbally and not communicated through written documents, a practice that needs to be curbed. Hence, there is a need for documenting the records.
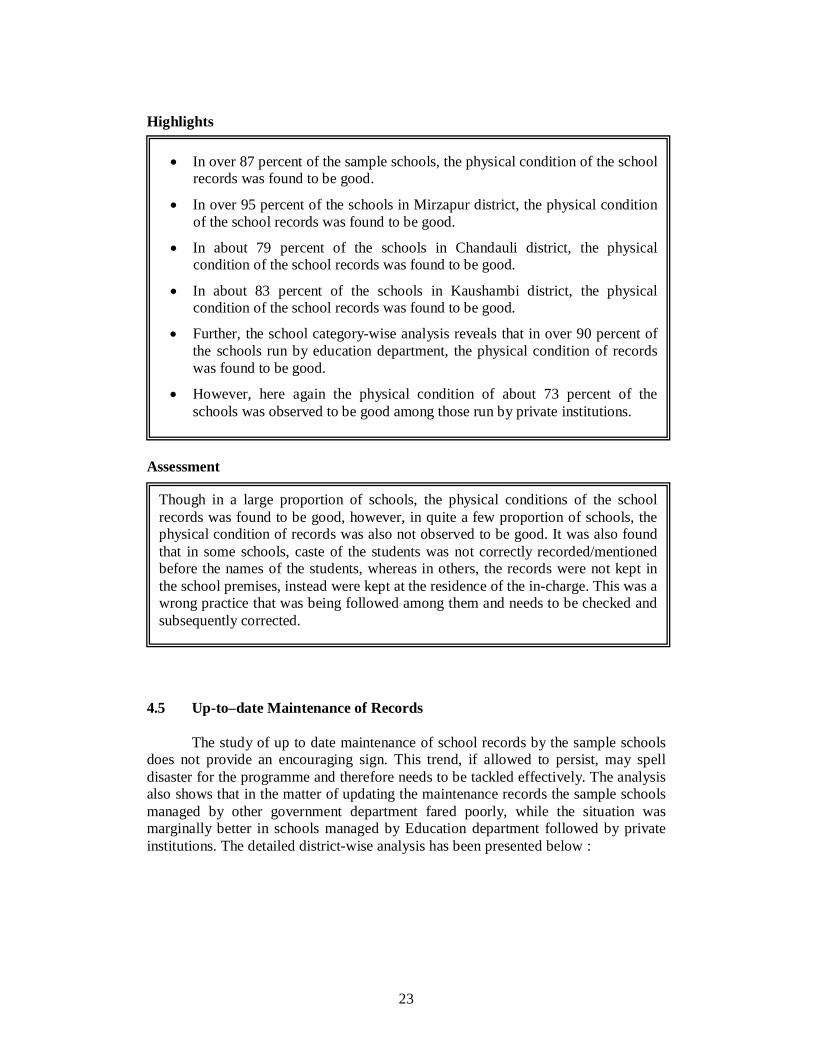
23
Highlights Assessment
4.5 Up-to–date Maintenance of Records
The study of up to date maintenance of school records by the sample schools does not provide an encouraging sign. This trend, if allowed to persist, may spell disaster for the programme and therefore needs to be tackled effectively. The analysis also shows that in the matter of updating the maintenance records the sample schools managed by other government department fared poorly, while the situation was marginally better in schools managed by Education department followed by private institutions. The detailed district-wise analysis has been presented below :
In over 87 percent of the sample schools, the physical condition of the school records was found to be good.
In over 95 percent of the schools in Mirzapur district, the physical condition of the school records was found to be good.
In about 79 percent of the schools in Chandauli district, the physical condition of the school records was found to be good.
In about 83 percent of the schools in Kaushambi district, the physical condition of the school records was found to be good.
Further, the school category-wise analysis reveals that in over 90 percent of the schools run by education department, the physical condition of records was found to be good.
However, here again the physical condition of about 73 percent of the schools was observed to be good among those run by private institutions.
Though in a large proportion of schools, the physical conditions of the school records was found to be good, however, in quite a few proportion of schools, the physical condition of records was also not observed to be good. It was also found that in some schools, caste of the students was not correctly recorded/mentioned before the names of the students, whereas in others, the records were not kept in the school premises, instead were kept at the residence of the in-charge. This was a wrong practice that was being followed among them and needs to be checked and subsequently corrected.

24
Table 4.5 Up – to - date Maintenance of school Records
Total No. of Schools Covered
Schools where records were found to be up to date
District / Category
No. No. % 1 2 3 4
Over all School 298 225 75.5
District wise analysis
Mirzapur 130 108 83.1
Chandauli 85 61 71.8
Kaushambi 83 56 67.5
School Management wise analysis
Run by Education Department 243 191 78.6
Private School 55 34 61.8
Source : Field Survey 2011, Mirzapur, Chandauli & Kaushambi.
Highlights
Assessment
In over 75 percent of the sample schools, the school records were found to be updated.
In over 83 percent of the schools in Mirzapur district, the records were found to be updated.
In about 72 percent of the schools in Chandauli district, the records were found to be updated.
In over 67 percent of the schools in Kaushambi district, the records were found to be updated.
The school management analysis shows that in over 78 percent of schools run by Education department, the records were found to be maintained up-to-date.
The percentage of schools where the records were maintained up-to-date was about 62 percent in case of schools run by private institutions.
The study shows that in an overwhelmingly large proportion of schools, the records were found to be updated, however, in quite a few proportion of schools, the updation of records was not observed to be good. This was not a correct practice that was being followed among them and thus needs to be checked.

25
Chapter - 5 Training of Programme Functionaries
5.1 Training of Principal/ Head teacher on DISE
The training of programme functionaries for filling up the DISE format is an integral and important aspect of DISE data collection process. In the absence of training not only the quality of data suffers but many a times wrongful and inappropriate information is collected which jeopardises the entire process of planning. The study of training of Principals/Head teachers of the sample schools shows that though a sizeable proportion of school Principals/Head teachers have received training however there still are quite a few proportion of Principal/Head teacher, who have not been trained for filling up of DISE format. Further, it was also observed that the Principal/ Head teacher of Private schools were in shred in training and according to the BSA sources, the Private school’s teachers do not respond to their training notices. It was also revealed to the survey team that the training lacks orientation and quality as such is being performed on perfunctory basis which neither the trainee understand nor appreciate. Hence, there is an urgent need to strengthen the training module so that the quality of teachers and data also enhances. One way could be to invite experienced personnel both from Government, Private or NGO sectors, who have requisite experience. The other detail of training has been presented below :
Table 5.1 School where Principal / Head Teacher had received Training on DISE
Total No. of Schools Covered
Schools where the Principal/Head teacher had received training on DISE
District / Category
No. No. % 1 2 3 4
Over all School 298 224 75.2
District wise analysis
Mirzapur 130 98 75.4
Chandauli 85 60 70.6
Kaushambi 83 66 79.5
School Management wise analysis
Run by Education Department 243 220 90.5
Private School 55 04 7.3
Source : Field Survey 2011, Mirzapur, Chandauli & Kaushambi.

26
Highlights Assessment 5.2 Pattern of Receipt of School Summary Report
School summary report holds an important place in the overall evaluation of schools. On the basis of summary report the NPRC grades the schools. The grading is done on the basis of assessing the level of infrastructural facilities of the schools as well as their teacher’s assessment. These reports are then sent back to the respective schools that helps them to identify their weakness and take necessary remedial measures. The study of receipt pattern of school report cards shows that its overall level has been quite low in case of school managed by private institutions which does not spells good for the overall development of schools. Further, the analysis shows that quite a few schools managed by private institutions had received the summary reports while its level in schools managed by education department was reported to be high.
In over 75 percent of the sample schools, the Principals/Head Teachers has received the training on DISE.
District wise analysis
In over 75 percent of the schools in Mirzapur district, the Principal or Head Teachers has received the training on DISE.
In over 70 percent of the schools in Chandauli, the Principals or Head Teachers has received the training on DISE.
In over 79 percent of the schools in Kaushambi district, the Principals or Head Teachers has received the training on DISE.
School Management wise analysis
In over 90 percent of the schools run by Education department, the Principals/Head Teacher had received the training on DISE.
In only about 7 percent of the schools run by private institutions, the Principals/Head Teacher had received the training on DISE.
It could be stated that the level of trained Principal or Head Teacher of the schools run by Education department was high. However, the quality of DISE data can only be enhanced if all the teachers are provided training both of the schools run by Education department and private management. Hence, there is a need for providing training to the teachers of all management.

27
Table 5.2 School who had Received the previous years School Summary Report
Total No. of Schools Covered
Schools who reported having received this report
District / Category
No. No. % 1 2 3 4
Over all School 298 228 76.5
District wise analysis
Mirzapur 130 101 77.7
Chandauli 85 74 87.1
Kaushambi 83 53 63.9
School Management wise analysis
Run by Education Department 243 220 90.5
Private School 55 08 14.5
Source : Field Survey 2011, Mirzapur, Chandauli & Kaushambi.
Highlights
Assessment
The overall proportion of schools who have received school summary report was over 76 percent.
District wise Analysis
In Mirzapur district, about 78 percent of the schools have received the school summary report of previous year.
Over 87 percent of the schools in Chandauli have received the school summary report of the previous year.
About 64 percent of the schools in Kaushambi district have received the school summary report of the previous year.
School Management wise Analysis
In over 90 percent of the schools run by Education Department, the summary was reported to have been received.
On the other hand, in hardly about 15 percent of the schools run by Private Management, the summary was reported to have been received.
The analysis provides a higher proportion of schools managed by Education department who have received previous year’s school report card. However, quite a few proportion of schools managed by private institution have received school report card of the previous year. Hence, there is a need for providing school report card to all the schools managed by private institutions.

28
5.3 Suggestions for Improving the Quality of Reporting
In the course of conducting the validation exercise, the survey team also solicited views from the Principal/Head Teachers on improving and enhancing the quality of reporting. Some of them have been presented below.
(a) The coverage of training has so for excluded the Principal/Head Teachers
of the sample private schools. The subsequent talks with the concerned parties reported contradictions from both side and both blaming each other. Hence, there was a need to follow a transparent policy that encourages participation of teachers from all types of schools.
(b) It was also observed that the DISE format has been too long and a bit
complicated which teachers of non-training stature found difficult to follow. Hence it was suggested that there was an urgent need to simplify the present form's format there by making it user friendly.
(c) The study also brought to the fore that a sizeable proportion of sample
schools managed by private institutions had not received feed back on the filled in formats submitted by them. This obstructed the to and fro flow of information which spelt well for neither the teachers nor the government. Hence there is a need for strengthening of feed back mechanism which would enhance the quality of DISE data and also help the teachers to identify the weakness and work on them.

29
Chapter - 6
Composition of VEC and Pattern of Supervision of schools 6.1 Composition of Village Education Committees
The role of village education committees (VECs) in the Sarva Siksha Abhiyan (SSA) framework has been of utmost importance. They are supposed to be grass root institutions assigned with the task of ensuring community level participation. They are also assigned with the task of planning and supervision of government schools located in their villages. The VECs have been constituted throughout the state to facilitate smooth and transparent functioning of schools. An attempt has also been made to study the nature of composition of VECs and also study the frequency of meetings held by them during the last three months prior to the validation exercise. Accordingly, the data with respect to VECs was obtained from sample schools which has subsequently been analysed. The results have been summarised below. According to the instruction manuals, the composition of VEC should be as follows:
President (Gram Sabha Pradhan)
Member Secretary - Head Master of the School/Senior most Head Master of the Gram Sabha Schools, in case if there are more than one school in the Gram Sabha.
Members - Three guardians of the students (with atleast one female member) of the school to be nominated by ABSA.
Further, there is also a provision of accommodating some more members in the VEC subject to fulfillment of the above criteria.
6.2 Composition of VEC by Schools
VEC has an important role to play in the working of schools and they could also be held accountable in case of schools non performance. The composition of VECs shows an over-whelming proportion of VECs of five members. The details have been summarised below:

30
Table 6.1 Details of VEC Members in Sample Schools
No. of Members Number of Schools %
5 Members 203 68.1
6 to 7 Members 22 7.4
More than 7 Members 07 2.3
Not Know* 66 22.1
Total Sample School 298 100.0 Source : Field Survey 2011, Mirzapur, Chandauli & Kaushambi. Note* : Include all the private schools.
Figure-6.1 Percent of Total VEC Members in Sample Schools
Highlights
Assessment
In over 68 percent of the schools, the number of members in their VEC was 5.
About 22 percent of the schools, which were mostly the private one, the teachers had no idea of the size of VEC.
Another in about 10 percent of the schools, the teachers reported the total number of members in their VEC to be 6 or more.
It could be stated that a large proportion of schools managed by Government department were reported to be having 5 members in their VEC, and in a few proportion of schools, the VEC members was more than 6.
5 Members 68.1%
6 to 7 Members
7.4%
More than 7 Members
2.3%
Not Know 22.1%

31
6.3 Composition of Female VEC Members
One the question of gender-wise composition of VEC's, the guidelines stipulates that all the VECs have a minimum of one female member. The study shows that in about 30 percent of the schools, at least one member is female while in another 48 percent of the schools, VEC have more than one female member:
Table 6.2
Details of Female VEC Members in Sample Schools
No. of Members Number of Schools %
Only 1 Member 89 29.9
More than 1 Member 143 48.0
Not Know* 66 22.1
Total Sample School 298 100.0 Source : Field Survey 2011, Mirzapur, Chandauli & Kaushambi. Note* : Include all the private schools.
Highlights Assessment
6.4 Composition of SC VEC Members
Likewise, on the caste wise configuration, the guidelines also gives preference to members of Scheduled Castes and accordingly should have atleast one member belonging to the Scheduled Castes. The analysis shows that in over 75 percent of the schools, VECs have one or more SC member's representation.
In about 30 percent of the schools, the VECs were reported to be having only one female member.
In 48 percent of the schools, the VECs were reported to be having more than one female member.
It could be stated that in majority of the schools managed by Government department, the composition of atleast one female member was performed which is a positive sign that helps in making the planning effective.

32
Table 6.3 Details of SC VEC Members in Sample Schools
No. of Members Number of Schools %
Only 1 Member 115 38.6
More than 1 Member 109 36.6
No any SC Member 08 2.7
Not Know* 66 22.1
Total Sample School 298 100.0 Source : Field Survey 2011, Mirzapur, Chandauli & Kaushambi. Note* : Include all the private schools. Highlights Assessment
6.5 Frequency of VEC Meetings held in the last three months
The analysis of the frequency of VEC meetings does not show an encouraging sign as in about fourteen percent of cases, no meetings had been held while in over thirty six percent cases, the VEC had met about once or twice and in another about twenty eight percent cases, it had also met three times or more.
In over 38 percent of the schools, the VECs had only one member belonging to the Scheduled Castes.
In another over 36 percent of the schools, the VECs had more than one member belonging to the Scheduled Castes.
In only about 3 percent of the schools, the VECs had no member belonging to the Scheduled Castes.
Though, a majority of schools favoured representation of SC’s in VEC, however there were also a few proportion of schools were ignorant of such provision, which could be a cause for concern and needs to be addressed on priority basis.

33
Table 6.4 Details of VEC Meetings Held in Sample Schools in Last Three Months
Meetings Held Number %
1 to 2 108 36.2
3 & above 83 27.9
None 41 13.8
Not Know* 66 22.1
Total Sample School 298 100.0 Source : Field Survey 2011, Mirzapur, Chandauli & Kaushambi. Note* : Include all the private schools. Highlights Assessment
6.6 NPRC Coordinators' visit during the last three months
The NPRC Coordinator has a significant and vital role to play in the overall supervision and monitoring mechanism set up. He is supposed to be a vital link that conjoins the upper strata or district/block level mechanism with grass root functionaries, facilitates to and fro flow of reformation and helps in identifying the weaker links. The higher visits of NPRC spell better and efficient management of schools. The profile of NPRCs visit to sample schools shows that over seventy eight percent of them had been visited by NPRCs. It was also observed that the frequency of NPRC visit in schools run by Private management was quite low. The other details are summarised below :
In about 28 percent of the school, the VECs were reported to have held three and above meetings during the last three months prior to the survey.
However, in about 14 percent of the schools, the teachers asserted that it had not met even once during the last 3 months.
In over 36 percent of the total schools, the VECs were reported to have held one or two meetings during the last three months prior to the survey.
Though the VEC meetings have been convened in a sizeable proportion (over 64 percent) of sample schools, however, in a few proportion (about 14 percent) of the schools, it has not been convened even once, which is a major cause of concern and needs to be addressed on priority.

34
Table 6.5 School Visited at least Once in Last three Months by their NPRC Coordinator
Total No. of Schools Covered
Schools who reported to have been visited at least once
District / Category
No. No. % 1 2 3 4
Over all School 298 233 78.2
District wise analysis
Mirzapur 130 95 73.1
Chandauli 85 68 80.0
Kaushambi 83 70 84.3
School Management wise analysis
Run by Education Department 243 221 90.9
Private School 55 12 21.8
Source : Field Survey 2011, Mirzapur, Chandauli & Kaushambi. Highlights
Assessment
Over 78 percent of the schools had been visited by the NPRCs during the last three months.
District wise Analysis
Over 73 percent of the schools of Mirzapur district have been visited by NPRCs during the last three months.
80 percent of the schools of Chandauli district have been visited by NPRCs during the last three months.
Another over 84 percent of the schools of Kaushambi have been visited by NPRCs during the last three months.
School Management wise Analysis
About 91 percent of the schools, run by the Education department have been visited by NPRC.
Only about 22 percent of the schools, run by private management have been visited by NPRC.
It could be seen that though NPRC has been visiting in majority of the schools, however, it was also found that quite a sizeable proportion of the schools have also remained un-visited so far. It was also observed that the frequency of visits by NPRC Coordinators at the schools run by education department were reported to higher than the ones run by private managements. Hence, efforts needs to be made to enhance the frequency of supervision in the schools, through appropriate intervention strategies.

35
Chapter -7
Availability of Teachers and Students on Validation Day 7.1 Number of Teachers: Present Vs. In Position Teachers' strength holds an important place in projecting the performance of schools. The schools that have adequate number of teachers and who visit them regularly put up better performance than those schools who suffer from under staffing and with high rate of absenteeism. An attempt has also been made to study this aspect also and accordingly by asking about the total strength of teachers posted in the sample school and also observing and recording their presence, an attempt was made to study the presence of teachers on the validation day. The study shows that about thirty nine percent of the sample schools suffered from the incidence of absentees on of one kind or the other and this incidence was more conspicuous in those schools having 3 teachers or more.
Table 7.1
School category wise (based on teachers strength) analysis of no. of teacher absent on day of our visits
Classification of schools according to the no. of teachers found absent on the day of
our visits
School category according to the no. of teachers
in position
Total no. such school visited
No absent Only one > 1 1 2 3 4 5
School having 1-2 teachers 58 44 14 -
School having 3-5 teachers 210 119 66 25
School having >= 6 teachers 30 19 06 05
Total Sample 298 182 86 30
Source : Field Survey 2011, Mirzapur, Chandauli & Kaushambi.

36
Highlights
Assessment
7.2 Comparative Analysis of Teachers' Attendance in Private Vs.
Government Schools It is generally presumed that the schools managed by private institutions are, by and large, better managed than the government managed schools. Largely, because of their relative smaller size which they manage efficiently. The study of pattern of absenteeism in both kinds of schools viz. government and private shows that rate of absenteeism has been quite substantial in government schools than the one observed in private schools.
Table 7.2
Comparative analysis of Teachers Absenteeism in Government and Private Schools
School where all the teacher reported to be in position where found present
School Category
Total no. of school visited
No. % 1 2 3 4
Government Schools 243 140 57.6
Private Schools 55 42 76.4
Total Sample 298 182 61.1 Source : Field Survey 2011, Mirzapur, Chandauli & Kaushambi.
Over 19 percent of the sample schools have one to two teachers.
Over 70 percent of the schools were having 3 to 5 teachers.
About 10 percent of the schools were having 6 teachers or more.
In about 61 percent of the schools, no incidence of absenteesm has been found on the day of visit by validating team.
In about 29 percent of the schools, one teacher was found to be absent on the day of visit by validating team.
In about 10 percent of the schools, more than one teacher have been found to be absent on the day of visit by validating team.
Though in a major proportion of schools have appropriate number of teachers, however, incidence of absenteesm on part of teachers also needs to be checked as it affects the overall performance level of the schools.

37
Highlights Assessment
7.3 Attendance Pattern Observed at the Primary Levels
Another factor that has a strong bearing on the performance of schools is the level of regular attendance of students. It is presumed that higher the level of attendance, the better will be the performance of schools and vice-versa. The analysis of level of attendance shows that these schools also suffered from high rate of absenteeism from the students side as well. The detail caste and gender wise analysis of the attendance of students in the sample schools has been summarised below :
Table 7.3 Category wise analysis of Attendance in Primary Classes on the day of our visit
Attendance on the day of visit Category Number Enrolled No. %
1 2 3 4 All children taken together 35262 18255 51.8
All Boys taken together 17500 8933 51.0
All Girls taken together 17762 9322 52.5
Boys belonging to SC Caste 6830 3410 49.9
Girls belonging to SC Caste 6565 3404 51.9
Source : Field Survey 2011, Mirzapur, Chandauli & Kaushambi.
In over 61 percent of the sample schools, all the teachers were found to be present on the day of validation.
The percentage of government schools where all the teachers in position were found present on the day of visit was reported to be over 57 percent.
The percentage of private schools where all the teachers were found to be present on the day of visit was over 76 percent.
Though, the proportion of schools, where all the teachers in position were found to be present on the day of visit was high, however, in the remaining proportion of which, whose volume was also significantly large, incidence of teacher's being absent was also found. Moreover, the absentiesm was more pronounced in private schools. Hence, there is a need to motivate and sensitize teachers through appropriate interventions to maintain their regularity in schools and curtail the habit of remaining absent from school.

38
Figure-7.1 Category-wise Analysis of Attendance in Primary Classes on the Day of our Visit Highlights Assessment
The percentage of children (taken together) in primary classes present on the day of visit was found to be about 52 percent.
The percentage of boys (overall) present on the day of visit was found to be 51
percent and in case of girls it was over 52 percent. The attendance level of children (boys and girls) belonging to SC was reported
to about 50 and about 52 percent respectively on the day of visit.
The sample schools have also been affected by the high incidence of absenteism from children and that cuts various across various caste and gender groups. Hence, efforts needs to be made to motivate the parents and children about the importance of maintaining regular attendance in schools, through appropriate intervention strategies.
51.9%
49.9%
52.5%
51.0%
51.8%
All childrentaken
together
All Boystaken
together
All Girlstaken
together
Boysbelonging to
SC Caste
Girlsbelonging to
SC Caste

39
7.4 District and School wise Attendance Pattern
The inter district and school management wise analysis of attendance of students in the sample schools shows that there has been a marked variation at the district levels. The other details have been presented below :
Table-7.4 District / School Category-wise Analysis of attendance in Primary Classes
Total Number Enrolled
Attendance on the day of Visit District / Category
No. No. % 1 2 3 4
Over all School 35262 18255 51.8
District wise analysis
Mirzapur 15981 8099 50.7
Chandauli 9961 5487 55.1
Kaushambi 9320 4669 50.1
School Management wise analysis
Government Schools 29284 15174 51.8
Private Schools 5978 3081 51.5
Source : Field Survey 2011, Mirzapur, Chandauli & Kaushambi. Highlights
Assessment
The overall level of attendance in the school was reported to be about 52 percent.
In Mirzapur district, the overall level of attendance of students in the school was reported to be over 50 percent.
In Chandauli district, the overall level of attendance of students in the school was reported to be over 55 percent.
In Kaushambi district, the overall level of attendance of students in the school was reported to be over 50 percent.
The overall level of attendance of students in privately managed schools was over 51 percent, while in government schools, it was also about 52 percent.
It could be said that the average level of attendance of students in the sample schools was not of a high level. Hence, efforts need to be made to encourage, motivate and sensitize the parents and children about the importance of attending the schools on regular basis through appropriate intervention strategies.

40
7.5 Schools Having Higher Attendance in Primary Level
In the course of studying the level and pattern of students in the sample schools, attempt has also been made to identify schools that have recorded attendance of over seventy five per cent at the primary schools. The study shows that only nine percent of the sample schools had this attendance level. The details have been presented below :
Table-7.5 District wise proportion of schools where attendance in primary classes was
observed to be 75% or more Total Schools
(n) Schools where attendance was >75%
on survey day District / Category
No. No. %
1 2 3 4 Over all School 199 18 9.0
District wise analysis
Mirzapur 91 11 12.1
Chandauli 56 06 10.7
Kaushambi 52 01 1.9
Source : Field Survey 2011, Mirzapur, Chandauli & Kaushambi. Highlights Assessment
In 9 percent of the sample schools, the level of attendance of students was observed to be 75 percent or over.
In over 12 percent of the schools in Mirzapur, the student's attendance level was reported to be 75 percent or over.
In over 10 percent of the schools in Chandauli, the student's attendance level was reported to be 75 percent or over.
In only about 2 percent of the schools in Kaushambi, the student's attendance level was reported to be 75 percent or over.
The study shows that the proportion of schools recording attendance level of 75 percent or over was not high. Hence, there is a need to motivate the parents, students, teachers and all associated with school activities to regularly come to school. If needed, professional help should also be sought.

41
7.6 Attendance Pattern at Upper Primary Level To study the attendance pattern at the upper primary level similar exercise was carried out. It was observed that these sample schools also suffered from incidence of absenteeism, though with wide ranging variations between and within the groups. The other details have been given below :
Table-7.6 Category-wise Analysis of attendance in Upper Primary classes on the day of our
visit Attendance on the day of Visit Category Number
Enrolled No. %
1 2 3 4 All Children taken together 13270 6923 52.2
All Boys taken together 6949 3440 49.5
All Girls taken together 6321 3483 55.1
Boys belonging to Sch. Castes 2251 874 38.8
Girls belonging to Sch. Castes 2043 899 44.0
Source : Field Survey 2011, Mirzapur, Chandauli & Kaushambi.
Figure-7.2 Category-wise Analysis of Attendance in Upper Primary Classes on the Day of
our Visit
52.2%49.5%
55.1%
38.8%44.0%
All Childrentaken
together
All Boystaken
together
All Girlstaken
together
Boysbelonging toSch. Castes
Girlsbelonging toSch. Castes

42
Highlights Assessment
7.7 Attendance Pattern at Inter-District Levels
The variation in attendance was not only confined at the inter-gender or inter class levels but also with in the district. The analysis shows that there has been variation in the level of upper primary classes. The details of attendance have been summarised below :
Table-7.7 District-wise Analysis of attendance in upper primary classes on the day of our
visit Total Number
Enrolled Attendance on the day of Visit District / Category
No. No. %
1 2 3 4 Over all School 13270 6923 52.2
District wise analysis
Mirzapur 6967 4012 57.6
Chandauli 3456 1949 56.4
Kaushambi 2847 962 33.8
School Management wise analysis
Government Schools 7728 4061 52.5
Private Schools 5542 2862 51.6
Source : Field Survey 2011, Mirzapur, Chandauli & Kaushambi.
The percentage of children (taken together) in Upper Primary classes present on the day of visit was found to be over 52 percent.
The percentage of boys (overall) present on the day of visit was found to be only over 49 percent and in case of girls it was over 55 percent.
The attendance level of children (boys and girls) belonging to SC was
reported to about 39 and 44 percent respectively on the day of visit.
The profile of attendance of students does not provide an encouraging sight. Hence, there is a need to motivate them, through suitable and appropriate social intervention strategies that encourage them to regular attend the classes in the school.

43
Highlights
Assessment
7.8 Schools Having Higher Attendance in Upper Primary Level
The validation exercise also identified schools that recorded attendance level of over seventy five percent. The study shows that only over ten percent of sample schools had recorded higher attendance. The other details have been presented below :
Table-7.8 District wise proportion of schools where attendance in upper primary classes
was observed to be 75% or more Total Schools
(n) Schools where attendance was >75% on
survey day District / Category
No. No. %
1 2 3 4 Over all School 99 10 10.1
District wise analysis
Mirzapur 39 05 12.8
Chandauli 29 02 6.9
Kaushambi 31 03 9.7
Source : Field Survey 2011, Mirzapur, Chandauli & Kaushambi.
The overall level of attendance of students at the sample schools was found to be over 52 percent.
Over 57 percent of the students were found to be present in the school in Mirzapur on the day of visit.
Over 56 percent of the students in the schools were found to be present in Chandauli on the day of visit.
Only about 34 percent of the students in the schools were found to be present in Kaushambi district on the day of visit.
The overall level of attendance of students in the government management schools was found to be over 52 percent.
Over 51 percent of the students in private schools were found to be present on the day of visit.
It could be stated that the schools were suffering from incidence of absenteesm in both the schools managed by Government and Private institutions. Further, of the three districts, the attendance level in Kaushambi district was abysmally low. It is therefore suggested that there was a need to sensitize and motivate the students, teachers and parents to attend the school on regular and sustained basis.

44
Highlights Assessment
In over 10 percent of the sample schools, the attendance of the students was 75 percent or more on the date of survey.
In about 13 percent of the schools in Mirzapur, the attendance level of the students was found to 75 percent or more on the date of survey.
In only about 7 percent of the schools in Chandauli, the attendance level of the students was found to be 75 percent or more on the date of survey.
In about 10 percent of the schools in Kaushambi, the attendance level of the students was found to be 75 percent or more on the date of survey.
The study shows that the proportion of schools recording attendance level of 75 percent or over was not high. Hence, there is a need to motivate the parents, students, teachers and all associated with school activities to regularly come to school. It is further argued that if needed, the help of some professional organization with requisite experience may also be taken.

45
Chapter - 8 Major Findings & Recommendations
The validation of DISE data has clearly shown that it suffers from many inconsistence and in majority of the cases, they were not of any significance. It is felt that there was need to address them, on priority basis, so as to make them consistent and relevant. In the ensuring chapter an attempt has been made to summaries the major findings and also present the suggestions that strengthens and relivenates system. 8.1 About Universe
The three districts assigned to the institute were Mirzapur, Chandauli and Kaushambi districts respectively.
The total number of schools were 5936 of which about 44 percent were located in Mirzapur district, over 28 percent were located in Chandauli district and the remaining about 28 percent were located in Kaushambi district.
About 67 percent of the school in the universe were up to the Primary level and about 33 percent were up to the level of Upper Primary level. respectively.
8.2 About Sample
The study follows the guideline stipulated by the sponsoring agency and selects only 5 percent of the total number of school.
Thus, the total number of schools that were subjected to validation were 298 of which about 44 percent (130) were located in Mirzapur, about 28 percent (85) were located in Chandauli and remaining about 28 percent (83) were in Kaushambi.
8.3 About DISE data
The DISE data was provided for all the 298 sample schools selected for validation exercise.
In the majority of the schools, the sample data matched with DISE data on parameters pertaining to information on school particulars, however in the remaining schools where the two sets of data differed, the level of variation generally, was not found to be significant.
This discrepency was found to be more pronounced in parameter like the establishment year of the school.

46
8.4 On Nature & Pattern of Ownership of Building
On parameters like the ownership of buildings, the compatibility of DISE data and sample survey data was found to be of a very high order.
However, on information regarding type of building and number of class rooms in the sample schools, the level of compatibility between the two sets of Data was found to be also of a high order.
However, it could be stated that the level of variation between DISE and sample survey data was quite marginal.
8.5 On Enrolment Data
The enrolment data of students has been analyesed at Primary schools level as well as Upper Primary levels.
It could be seen that DISE data matched with sample survey data in majority of parameters and the variation, thus observed in a very smaller proportion of schools, was of quite marginal nature.
8.6 Data on Disability
The data on disability of children has been analysed at primary as well as upper primary levels shows that there has been a high level of compatibility between the DISE and sample survey data on the overall situation of disabled student.
However, where ever the mismatched accured, it was found to be quite marginal.
8.7 Data on Repeaters
In the large proportion of upper primary schools where the DISE Data did not match with sample survey data, though the level of variation between the two was quite marginal.
8.8 On Teachers Position
Though the proportion of schools where DISE data matched with sample survey data on teacher’s position was not of a very high order, however it was also found that government schools were relatively better placed than private schools.
In the remaining schools, the DISE data mismatched with sample survey data, the level of variation was quite marginal.

47
8.9 On Initial Reactions of Principal/Head teachers
The overall level of schools, the initial reaction of Principal/Head Teachers was found to be quite positive and of a high order (over 97 percent).
The performance of schools managed by education departments was by far better than of privately managed schools.
8.10 On Records Availability Pattern
The overall performance of schools found to be quite positive and of a very high order (94 percent), where the records were made readily available.
The performance of schools managed by education departments was by far much better than of privately managed one.
8.11 On Physical conditions of Records
In a majority of the sample schools (over 87 percent), the physical condition of school records was found to be good.
The schools of Mirzapur district were marginally better placed than the schools of Chandauli and Kaushambi districts.
The record keeping was much better in the schools managed by education department than the one managed by private institutions.
8.12 On up to date maintenance of Records.
The overall performance of schools found to be quite positive in over 75 percent of the sample schools, where the records were found updated.
The performance of the schools of Mirzapur district was better than the schools of Chandauli and Kaushambi districts.
The performance of schools managed by education department was much better than private schools.
8.13 On Training of Principal / Head Teachers
In a majority of the sample schools (over 75 percent), the Principal / Head teachers received training at DISE.
The performance of the schools of Kaushambi was relatively better than the schools of Mirzapur and Chandauli districts.
Likewise the performance of schools managed by education department was quite high, while the performance of schools managed by private management was highly disappointing.

48
8.14 On Receipt of School Report Card
In a majority of the sample schools (over 76 percent), the Principal / Head teachers received the school report card.
The performance of schools in Chandauli district was relatively better than the schools of Mirzapur and Kaushambi districts.
The availability of School Report Cards of schools managed by education department was quite high, while the performance of schools managed by private was highly dis-satisfactory.
8.15 Awareness on composition of VECs
Though a majority of the schools reported to have composition of VECs, however, about 22 percent of the schools, which were mostly the private one, the teachers had no idea of the composition of VEC.
8.16 Views on SC/ST Membership in VEC
In a majority of schools, the members reported to have composition of SC members in VECs, further in over 36 percent of the schools, the VECs had more than one member belonging to the Scheduled Castes.
8.17 Frequency of VEC Meetings in the last three month
In about fourteen percent of the sample schools, the teachers asserted that VECs had not met even once during the last 3 months. However, in the remaining schools it was being regularly held. A situation that needs to addressed on priority.
8.18 Supervision Mechanism
The supervision mechanism also needs to be tuned up as quite a substantial proportion of schools managed by private institutions have remained un-supervised by NPRC coordinators.
8.19 Absenteeism Pattern
About Teachers
Though in about 61 percent of the schools, no incidence of absenteeism has been reported, however in the remaining about 39 percent schools, incidence of absenteeism have been found though the magnitude of absenteeism have varied according to the type of schools.
The incidence of absenteeism was found to be more pronounced in private schools.

49
About Students
About half of the students were found to be absent on the day of validation.
The incidence of absenteeism was more pronounced among the boy students at the upper primary level.
The incidence of absenteeism among the students appeared to be more in the schools of Kaushambi district.
8.20 Suggestions
On the basis of the analysis of DISE data, supplemented with the interactions and observations of the survey team it is being increasingly realised that in order to tackle the problem of this magnitude, a multi-pronged strategy needs to be devised that addresses the problems at multiple-levels.
The study also shows that the quality of data suffers from many accounts. Further, it also shows that the variation in DISE data and sample survey data has accured not because of the flaw in the system but largely on account of channels or mode through which it is being gathered. Thus, on the basis of analysis, the analysis comes up with the following suggestion :
(A) Strengthening of the training aspect
Training forms a crucial and important segment of any programme. Repeated and periodic training, on sustained basis not only helps channelising the routes but also motivates the programme functionaries that ultimately helps in improving the quality of data. The study also shows that many of the problems with regards to filling up of the DCF form could have been taken care off by toning up the training mechanism. The study shows that quite a substantial proportion of Principal/Head Teachers have not received training for filling up of DISE format and this is true for teachers of the schools managed by private institutions. It has strongly been felt that many of the inconsistencies that have arisen have largely been on account of teacher’s untrained status, therefore it is recommended that.
The training of teachers needs to be organised periodically and on sustained basis so as to equip and acquaint the teachers about the latest happening in their field.
There is also a need for taking the training on a more serious mode. So far, the interraction with teachers revealed that the training has been of a perfunctory nature which invariably fails to capture the attention of teachers. Hence, it has been strongly felt that help of some professional body, with requisite experience, be taken to perform the task at least for some initial stages.

50
(B) Strengthening of the Supervision Monitoring mechanism
Supervision and monitoring mechanism has been an important and significant part of SSA. It not only helps in identifying the weaker aspects or areas but also provides vital information about the status of on going programme to the higher up concern authorities. The study clearly shows that monitoring and supervision aspect for the schools managed by private intitutions has been one of the weaker links and needs to be strengthened.
Many of the irregularities, in-consistencies and other related issues could be effectively tackled if the monitoring and supervision aspect is adequately strengthened. The study also shows that the pattern of supervision for different types of schools has not been uniform and the schools managed by privately were least monitored. Hence, efforts need to be made to evolve a policy that gives adequate weightage to the monitoring and supervision of all types of schools. This will go a long way to improve, enhance and make relevant quality DISE data with exceptionally high level of compatibility with sample survey data.
(C) Other observations
The study shows that the schools also suffered on account of incidence of understaffing, this loads the teachers with more multiple assignments which ultimately affects their performance and likewise, the quality of data. Many a times, it was also observed that teachers of the schools were attached to BRC and that really accentuated the problem of teachers shortage. Hence efforts need to be made to fill up vacant position in the school on priority basis.
It has also been found that the teachers who have been made the BRC or NPRC, their frequency of visit was quite low because of their pre occupation with their nascent job responsibilities.
It has also been realised that there is an urgent need to simplify the DISE format as it was too long and complicated that the teachers were not able to pursue. Regular training to the teachers helps in overcoming the problem.
Similarly, the monitoring and supervision aspect of the schools by NPRC’s also need to be strengthened and streamlined. It has been observed that mostly the instructions were given orally and were not properly recorded that also affected the quality of data.
For assessing the performance of the repeaters, the Ministry has categorically classified them in their guidelines. However, the DISE data do not make any such distinction thereby invariably fails to capture genuine cases and that affects the quality of data. It is therefore suggested that in the filling up DISE format, due care be taken to identify such cases very clearly.

51
Annexure - I
Block-wise List of Sample Schools
Block wise List of Sample Schools : District - Mirzapur
S.No. School code Block Name : School Name School Category 1 500301 CHHANBAY P.S. DANGHAR Primary 2 502101 CHHANBAY P.S. DERAWA-1 Primary 3 502301 CHHANBAY P.S. GAJI PUR Primary 4 504601 CHHANBAY P.S. MOHAN PUR Primary 5 507102 CHHANBAY P.S. HARGHAR-2 Primary 6 509501 CHHANBAY P.S. CHADAICHA Primary 7 511704 CHHANBAY P.S. PANDEY BASTI Primary 8 505902 CHHANBAY M.P.BHUVNAISHWARI VIDHYAPEETH Primary 9 516301 CHHANBAY DEEP N. BIND H S MURAJPUR Primary
10 503002 CHHANBAY U.P.S. GODSAR Upper Primary only 11 510302 CHHANBAY U.P.S. NIFARA Upper Primary only 12 507106 CHHANBAY PD. CHINTAMANI DUBEY U.P.S. Upper Primary only 13 512903 CHHANBAY B.D. U.P.S. Upper Primary only 14 200101 HALIA P.S.AHUGEE KALA Primary 15 201601 HALIA P.S.TEETA Primary 16 203201 HALIA P.S.RATAIH Primary 17 204801 HALIA P.S.MAHESH PUR Primary 18 206203 HALIA P.S. DHEDHI Primary 19 208101 HALIA P.S.KOTHI DHAUKAL SINGH Primary 20 210201 HALIA P.S.BAILAHEE Primary 21 211803 HALIA P.S. BAKULA JOR Primary 22 213502 HALIA P.S. DEVARI Primary 23 204202 HALIA M.P.JAIDURGA SIKCHHAN SANSTHAN Primary 24 207502 HALIA U P S KANOKHAR Upper Primary only 25 212302 HALIA U P S DIGHIA Upper Primary only 26 206304 HALIA G K HS BARAUNDHA Upper Primary only 27 801601 JAMALPUR P.S.RAIRU PUR Primary 28 803401 JAMALPUR P.S.SEMRA Primary 29 805001 JAMALPUR P.S.DAWAK Primary 30 806901 JAMALPUR P.S.DHALVAS PUR Primary 31 808601 JAMALPUR P.S.DAULTA BAD Primary 32 810401 JAMALPUR P.S.MADAR PUR Primary 33 812101 JAMALPUR P.S. HUSEN PUR Primary 34 816701 JAMALPUR P.S. MANIKPUR Primary 35 803402 JAMALPUR SHISHU SHIXA NIKETAN SEMARA Primary 36 800703 JAMALPUR U.P.S. SARASA Upper Primary only 37 805702 JAMALPUR U P S SAHIJANI KALA Upper Primary only
Contd...
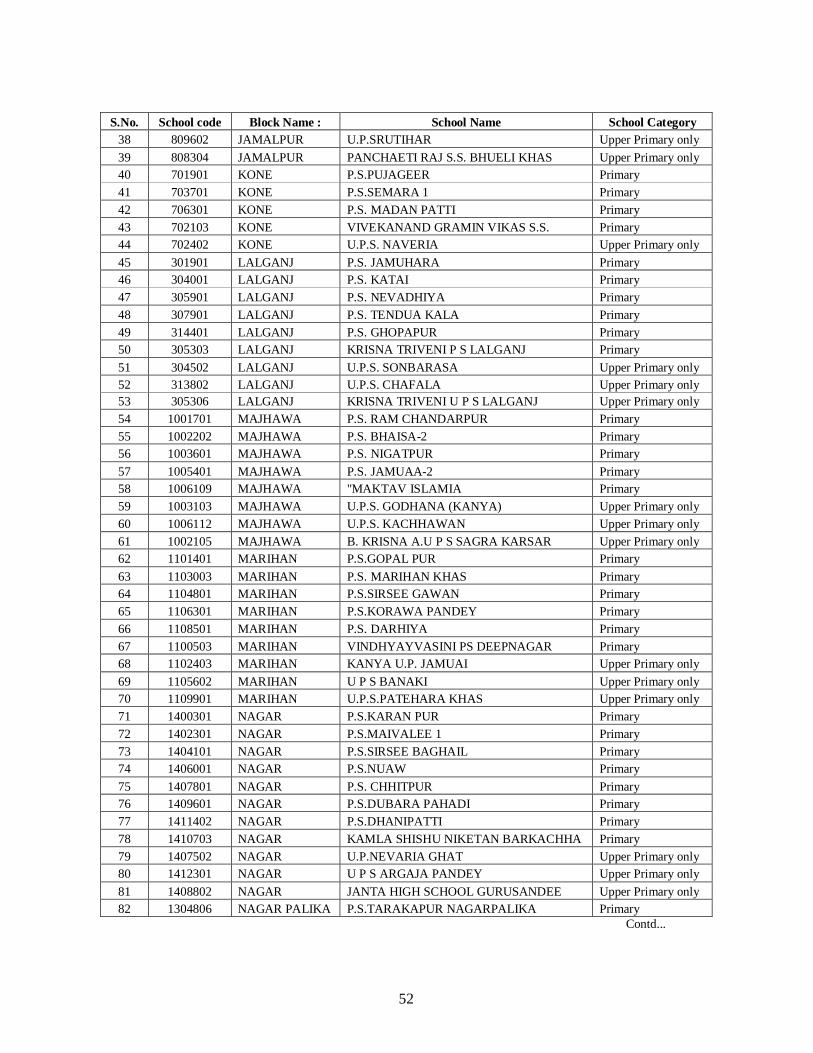
52
S.No. School code Block Name : School Name School Category 38 809602 JAMALPUR U.P.SRUTIHAR Upper Primary only 39 808304 JAMALPUR PANCHAETI RAJ S.S. BHUELI KHAS Upper Primary only 40 701901 KONE P.S.PUJAGEER Primary 41 703701 KONE P.S.SEMARA 1 Primary 42 706301 KONE P.S. MADAN PATTI Primary 43 702103 KONE VIVEKANAND GRAMIN VIKAS S.S. Primary 44 702402 KONE U.P.S. NAVERIA Upper Primary only 45 301901 LALGANJ P.S. JAMUHARA Primary 46 304001 LALGANJ P.S. KATAI Primary 47 305901 LALGANJ P.S. NEVADHIYA Primary 48 307901 LALGANJ P.S. TENDUA KALA Primary 49 314401 LALGANJ P.S. GHOPAPUR Primary 50 305303 LALGANJ KRISNA TRIVENI P S LALGANJ Primary 51 304502 LALGANJ U.P.S. SONBARASA Upper Primary only 52 313802 LALGANJ U.P.S. CHAFALA Upper Primary only 53 305306 LALGANJ KRISNA TRIVENI U P S LALGANJ Upper Primary only 54 1001701 MAJHAWA P.S. RAM CHANDARPUR Primary 55 1002202 MAJHAWA P.S. BHAISA-2 Primary 56 1003601 MAJHAWA P.S. NIGATPUR Primary 57 1005401 MAJHAWA P.S. JAMUAA-2 Primary 58 1006109 MAJHAWA "MAKTAV ISLAMIA Primary 59 1003103 MAJHAWA U.P.S. GODHANA (KANYA) Upper Primary only 60 1006112 MAJHAWA U.P.S. KACHHAWAN Upper Primary only 61 1002105 MAJHAWA B. KRISNA A.U P S SAGRA KARSAR Upper Primary only 62 1101401 MARIHAN P.S.GOPAL PUR Primary 63 1103003 MARIHAN P.S. MARIHAN KHAS Primary 64 1104801 MARIHAN P.S.SIRSEE GAWAN Primary 65 1106301 MARIHAN P.S.KORAWA PANDEY Primary 66 1108501 MARIHAN P.S. DARHIYA Primary 67 1100503 MARIHAN VINDHYAYVASINI PS DEEPNAGAR Primary 68 1102403 MARIHAN KANYA U.P. JAMUAI Upper Primary only 69 1105602 MARIHAN U P S BANAKI Upper Primary only 70 1109901 MARIHAN U.P.S.PATEHARA KHAS Upper Primary only 71 1400301 NAGAR P.S.KARAN PUR Primary 72 1402301 NAGAR P.S.MAIVALEE 1 Primary 73 1404101 NAGAR P.S.SIRSEE BAGHAIL Primary 74 1406001 NAGAR P.S.NUAW Primary 75 1407801 NAGAR P.S. CHHITPUR Primary 76 1409601 NAGAR P.S.DUBARA PAHADI Primary 77 1411402 NAGAR P.S.DHANIPATTI Primary 78 1410703 NAGAR KAMLA SHISHU NIKETAN BARKACHHA Primary 79 1407502 NAGAR U.P.NEVARIA GHAT Upper Primary only 80 1412301 NAGAR U P S ARGAJA PANDEY Upper Primary only 81 1408802 NAGAR JANTA HIGH SCHOOL GURUSANDEE Upper Primary only 82 1304806 NAGAR PALIKA P.S.TARAKAPUR NAGARPALIKA Primary
Contd...

53
S.No. School code Block Name : School Name School Category 83 1301002 NAGAR PALIKA M.P.AADARSH VIDHYA MANDIR Primary 84 1301901 NAGAR PALIKA P.S.MAHAVEER SWAMY PRA.PATH. Primary 85 1302801 NAGAR PALIKA P.S.PANDIT MADAN MOHAN MALVIYA Primary 86 1303603 NAGAR PALIKA "GULAB DAIE Primary 87 1304805 NAGAR PALIKA SARASWATI VIDYA MANDIR TARKAPU Primary 88 1306001 NAGAR PALIKA "SWAMI VIVEKA NAND Primary 89 1307702 NAGAR PALIKA SUN RISE P.S.V. TAKAUR Primary 90 1310001 NAGAR PALIKA SHARADA VIDHYA MANDIR CHUNAR Primary 91 1301807 NAGAR PALIKA U.P.RATANGANJ Upper Primary only 92 1300209 NAGAR PALIKA SHRI VINDHYAVASHINI SANSAKRIT Upper Primary only 93 1302503 NAGAR PALIKA BAGESHWARI VIKAS BAL NIKETAN Upper Primary only 94 1304703 NAGAR PALIKA AMAR BVM UPS DANGAHAR Upper Primary only 95 1307601 NAGAR PALIKA KANYA J.H.S. NAGAR POLIKA CHUN Upper Primary only 96 900102 NARAYANPUR P.S. KHAIRUDDINPUR Primary 97 901701 NARAYANPUR P.S. MEERPUR Primary 98 903501 NARAYANPUR P.S. RAMRAIPUR Primary 99 905401 NARAYANPUR P.S. JAGNNATH PUR Primary
100 907301 NARAYANPUR P.S. GAURA Primary 101 909201 NARAYANPUR P.S. BARJEEVAN PUR Primary 102 911101 NARAYANPUR P.S. NEEBEE DEWARIYA Primary 103 913301 NARAYANPUR P.S. BAHRAM GANJ Primary 104 907903 NARAYANPUR SARDAR BALLABH B PATEL PS Primary 105 907602 NARAYANPUR U.P.S. KADWAN Upper Primary only 106 913503 NARAYANPUR U.P.S. CHUNAR Upper Primary only 107 907104 NARAYANPUR R.K.U.M. COLLAGE KOLANA Upper Primary only 108 402101 PAHARI P.S.CHANDLEVA Primary 109 403702 PAHARI P.S.SHIV GHAR 2 Primary 110 405801 PAHARI P.S.SIKREE Primary 111 409101 PAHARI P.S. USRAHWA Primary 112 401002 PAHARI U P S VIROHIYA Upper Primary only 113 405502 PAHARI U.P.S. KANAURA Upper Primary only 114 404405 PAHARI SMT DURGAWATI RSP JHS Upper Primary only 115 603801 RAJGARH P.S.BARGAWAN Primary 116 604201 RAJGARH P.S. LAHAURA Primary 117 605301 RAJGARH P.S. JAUGHAR Primary 118 607101 RAJGARH P.S. CHHILAHIYA Primary 119 608701 RAJGARH P.S. KHORA DEEH Primary 120 610701 RAJGARH P.S. BHITI Primary 121 612701 RAJGARH P.S. DHANAWAL Primary 122 614201 RAJGARH P.S. KUNDRUF Primary 123 614503 RAJGARH GURUKUL ASHRAM PRAGYAKUNJ Primary 124 607002 RAJGARH U.P.S.NUAOV Upper Primary only 125 614402 RAJGARH U.P.S. DARHIYA Upper Primary only 126 610502 RAJGARH SRI BRIJRAJ A I C CHAUKHARA Upper Primary only 127 100101 SEEKHAR P.S. AA LA SULTANPUR Primary 128 102101 SEEKHAR P.S. MISIRPUR Primary 129 104101 SEEKHAR P.S. POORANPATTI Primary 130 102802 SEEKHAR U.P.S. SHILPI Upper Primary only

54
Block wise list of sample Schools : District - Chandauli
S.N. Blocks School Code School Name Village Name 1 Barahani 0706701 PS TELAHARA TELAHRA 2 Barahani 0700301 PS BARANGA BARANGA 3 Barahani 0702801 PS JEWARI JEWARI 4 Barahani 0712701 PS GORAKHA GORKHA 5 Barahani 0707401 PS MOHANBHITTI MOHAN BHITTI 6 Barahani 0700802 GAYATRI PS SAIYADRAJA SAYADRAJA 7 Barahani 702402 UPS NEWADA NEWADA 8 Barahani 708002 UPS DERHAGAWA DEDHGAWA 9 Barahani 707102 UPS KASAWAD KASAWAD 10 Barahani 700803 RAM KRISNA I.C.
SAIYADRAJA SAYADRAJA
11 Chahaniya 0313201 PS SARFUDEENPUR SARFUDEENPUR 12 Chahaniya 0306201 PS KANVAR KAWAR 13 Chahaniya 0310101 PS BHUPAULI BHUPOLI 14 Chahaniya 0312101 PS BADAGAWA BADGAWA 15 Chahaniya 0301401 PS HUDHUDIPUR HUBHUDIPUR 16 Chahaniya 0306801 PS SADHAN - I SADHAN 17 Chahaniya 0315702 M.P.S.N.A.M JHS DARIYAPUR DARIYAPUR 18 Chahaniya 307702 UPS SAMOODPUR SAMUDPUR 19 Chahaniya 302102 UPS SHERPUR SARAIYA SARPUR SARYA 20 Chahaniya 315601 MPUS PARSURAMPUR PARASU RAM PUR 21 Chakiya 0200301 PS BIYASAD BIYASAD 22 Chakiya 0225901 P.S. DADHAUNA DADHONA 23 Chakiya 0203301 PS GAYGHAT GAYGHAT 24 Chakiya 0205301 PS CHITODI CHITODI 25 Chakiya 0223601 P.S.RAGHUNATH RAGHUNATHPUR 26 Chakiya 0201901 PS. SITAPUR SITAPUR 27 Chakiya 210201 UPS.GAYGHAT GAYGHAT 28 Chakiya 206502 UPS DOREHOO DIREHOO 29 Chakiya 206802 UPS GARALA GARLA 1 30 Chandauli 0106401 PS NAUGARAHA NOGARHA 31 Chandauli 0107201 PS MUSTAFAPUR MUSTHAFAPUR 32 Chandauli 0101001 PS PARASI KHURD PARASI KHURDA 33 Chandauli 0102701 PS SULTANIPUR - I SULTANPUR 1 34 Chandauli 0103901 PS SOHADVAR SOHADVAR 35 Chandauli 0118801 SRIY.C.P.V. HARUPUR HARUPUR 36 Chandauli 105102 UPS HALUAA HALUAA 37 Chandauli 103902 UPS SOHADVAR SOHADVAR 38 Dhanapur 0509501 PS.BAYANPUR BAYANPUR 39 Dhanapur 0506701 PS.MADHOPUR MADHOPUR 40 Dhanapur 0504701 PS AMADPUR 2 AMADAPUR 2 41 Dhanapur 0508801 PS.ASHOKNAGAR ASHOKNAGAR 42 Dhanapur 0517301 P.S. KHARKHOLI KHARKHOLI
Contd...

55
S.N. Blocks School Code School Name Village Name
43 Dhanapur 0504001 PS GAJENDARPUR GAJENDARPUR 44 Dhanapur 0506003 KISAN PV.AHIKORA AHIKORA 45 Dhanapur 504502 U.P.S. NAGAWA NAGAWA 46 Dhanapur 511202 UPS JAMURKHA JAMURKHA 47 Dhanapur 501401 UPS. JANOLI JANOLI 48 Mughalsarai
(Nagar Chhetra) 1000401 PS KALI MAHAL KALI MAHAL
V.NO.11 49 Mughalsarai
(Nagar Chhetra) 1001201 R M PS M SARAYAN RELVE SETELMENT
(MUGAL SARAY) 50 Mughalsarai
(Nagar Chhetra) 1000101 KUS PURBI BAJAR V.NO.23 PURBI BAJAR
VARD NO. 23 51 Nawgrah 0907401 P.S HORILA HORILA 52 Nawgrah 0902501 PS HARIYABADH HARIYABADH 53 Nawgrah 0902902 P.S. VISHESARPUR
MUSAHAR BASTI VISHESARPUR
54 Nawgrah 0904401 PS JANAKPUR JANAKPUR 55 Nawgrah 0901301 PS NAWGRH 1 NAWGRAH 56 Nawgrah 907101 UPS KESAR KESAR 57 Nawgrah 907301 UPS.GANGAPUR GANGAPUR 58 Niyamatabad 0813401 P.S.NATHUPUR NATHUPUR 59 Niyamatabad 0808901 PS.CHHITAMPUR CHHITAMPUR 60 Niyamatabad 0805601 PS. REMAA REMAA 61 Niyamatabad 0810101 PS.KATESAR 2 KATESAR 2 62 Niyamatabad 0802601 P.S. SAHAJOR SAHAJOR 63 Niyamatabad 0809704 P.V.M.E.MADARSA
ULUM.DIHAVA DIHWA
64 Niyamatabad 0805702 MAHA M.VIDYA MANDIR LAKHAPUR
PACHOKHAR 1
65 Niyamatabad 807201 UPS.DULAHIPUR 2 DULAHIPUR 2 66 Niyamatabad 804803 KUPS. ALI NAGAR ALI NAGAR 4 67 Niyamatabad 809601 UPS.LEDUWA LEDUWA 68 Niyamatabad 810809 N.J.J.H.S.DHARNA MANAS NAGAR 69 Sakaldiha 0404601 PS BHATHAWAR BATHAVAR 70 Sakaldiha 0403401 PSRANEPUR RANEPUR 71 Sakaldiha 0406201 PS.SARESAR SARESAR 72 Sakaldiha 0402801 PS SAREHUA SAREHUA 73 Sakaldiha 0413901 P.S. HARIHARPUR HARIHARPUR 74 Sakaldiha 0409402 S.RADHA KRISHNA
P.S. FESUDA FESUDA
75 Sakaldiha 411405 U.P.S.SARAI PAKAWAN ALAHIYA (NEW KOT) 76 Sakaldiha 407702 U.P.S. REVSA KHAS REVSA KANLA 77 Sakaldiha 415401 UPS REVASA MATIGAW REVASA MATIGAW 78 Sakaldiha 400402 T.S.H.S.S.NONAR
TULASI ASHARM NONAR
79 Shahabganj 0604401 PS.DEHARI KANLA DEHARI KANLA 80 Shahabganj 0601201 PS.BARAGAW BARAGAW 81 Shahabganj 0606701 PS.BEN BEN 82 Shahabganj 0607101 PS.GANDHI NAGAR GANDHINAGAR 83 Shahabganj 0600201 PS.LATAW LATAW 84 Shahabganj 602302 UPS GHODSARI GHODSARI 85 Shahabganj 606802 UPS. SULTANPUR SULTANPUR

56
Block wise List of Sample Schools : District – Kaushambi SN Block School Code School Name School Management 1 CHAYAL 701201 P.S. FARIDPUR SULEM Department of Education 2 CHAYAL 701901 PS. HARDUA Department of Education 3 CHAYAL 701003 AMER DEEP P.S. NAWAPUR Pvt. Unaided 4 CHAYAL 701417 U.P.S. PIPARHAI Department of Education 5 CHAYAL 703506 SRI R.J. PATEL U.P.S.
GUNGWA KA BAG Pvt. Aided
6 KADA 802801 P.S. DEVI GANJ I Department of Education 7 KADA 802901 P.S. MARDANPUR VERJEE Department of Education 8 KADA 804701 P.S. UCHARWAN Department of Education 9 KADA 810601 P.S. CHAKK KORIO
PANCH HAJARI Department of Education
10 KADA 802601 P.S. NONMAY Department of Education 11 KADA 808801 P.S.RASHID MAI Department of Education 12 KADA 800402 U. P.S. SAYARA MITHEPUR Department of Education 13 KADA 804902 U. P.S. GAUSH PUR NAWAWA Department of Education 14 KADA 802903 U.P.S. JAFARPUR Department of Education 15 KADA 803003 U.P.S. SULTANPUR
KHAWAJA KADAK Department of Education
16 KUSHAMBI 207801 P.S. CHA PURAWA Department of Education 17 KUSHAMBI 209501 P.S. KOSAMA KHIRAJ Department of Education 18 KUSHAMBI 207901 P.S. SODHIYA Department of Education 19 KUSHAMBI 208103 P.S. BHIKHA GARG KA PURA Department of Education 20 KUSHAMBI 202701 P.S. JUGARAJ PUR I Department of Education 21 KUSHAMBI 215801 P.S. NOHAI Department of Education 22 KUSHAMBI 215601 P.S.MULAYAM PUR Department of Education 23 KUSHAMBI 206103 JANTA P.S.
RAMPUR RUKSWARA Pvt. Unaided
24 KUSHAMBI 216702 U.P.S. AHIRAN KI DADI Department of Education 25 KUSHAMBI 215702 U.P.S. ICHHU KA PURA Department of Education 26 KUSHAMBI 208402 U.P.S. RASULPUR BADHNAWA Department of Education 27 KUSHAMBI 217002 U.PS. BADA TALAB Department of Education 28 KUSHAMBI 205401 RADHEY SHYAM SINGH JHS Pvt. Unaided 29 MANJHANPUR 101301 P.S. DEVARA I Department of Education 30 MANJHANPUR 102101 P.S. NEWARI Department of Education 31 MANJHANPUR 103001 P.S. VANDHAVA RAJVAR Department of Education 32 MANJHANPUR 102901 P.S. GOBAR SHAHAI Department of Education 33 MANJHANPUR 106403 P.S. SAHABANPUR Department of Education 34 MANJHANPUR 108001 P.S.SIRCHAN PUR Department of Education 35 MANJHANPUR 108605 MADARSA AJIJIA CHUK HINGUI Others 36 MANJHANPUR 106302 KASTURBA P.S.
AMINPUR SAVARO Pvt. Unaided
37 MANJHANPUR 106702 U. P.S. KOTARI PASCHIM Department of Education Contd...

57
SN Block School Code School Name School Management 38 MANJHANPUR 105802 U.P.S. JAMDUHA Department of Education 39 MANJHANPUR 109001 U.P.S.BHAILA MAKHDOOMPUR Department of Education 40 MANJHANPUR 105403 J.SINGH U.P.S. FAIZIPUR ASADAHA Pvt. Unaided 41 MURATGANJ 602701 P.S. CHUCKMAHPUR PANDEY MAU Department of Education 42 MURATGANJ 606901 P.S. PANNOI Department of Education 43 MURATGANJ 602001 P.S. BADA GAWAN Department of Education 44 MURATGANJ 601501 P.S. PAKSARAI Department of Education 45 MURATGANJ 608501 P.S.UMAR PUR Department of Education 46 MURATGANJ 605903 SARSAWATI SHIKHSHA NIKITEN P.S. Pvt. Aided 47 MURATGANJ 604602 U. P.S. PARSARA Department of Education 48 MURATGANJ 606002 U.P.S.UJIHINI KHALSA Department of Education 49 MURATGANJ 607601 CHATRAPATI SHIVAJEE M.PMS. Pvt. Unaided 50 NEWADA 403701 P.S. BASUHAR Department of Education 51 NEWADA 400602 P.S. HASIMPUR KINAR Department of Education 52 NEWADA 405501 P.S. MISHRAPUR DAHIYA Department of Education 53 NEWADA 405101 P.S. SIKANDARPUR AIMA Department of Education 54 NEWADA 409401 P.S.RUSAHAI Department of Education 55 NEWADA 403005 MADARSA ANWAROOL ULUM Pvt. Unaided 56 NEWADA 402701 U.P.S. HASANPUR Department of Education 57 NEWADA 408202 U.P.S. SARAY YUSUF Department of Education 58 NEWADA 402602 U.P.S.VIRNER Department of Education 59 NEWADA 401505 SRI BRABHMCHARI I C
TILHAPURMOD Pvt. Aided
60 NEWADA 409201 URMILA JHS BENIRAM KATARA Pvt. Unaided 61 SARSAWAN 507301 P.S. POTNIHA KA PURA Department of Education 62 SARSAWAN 504902 P.S. PURAB SHARIRA II Department of Education 63 SARSAWAN 508701 P.S. BHAGWAT PUR Department of Education 64 SARSAWAN 510301 P.S. KULOULI Department of Education 65 SARSAWAN 509201 P.S.DANPUR Department of Education 66 SARSAWAN 506002 R.S.R.B.SINGH P.S. AMINA Pvt. Unaided 67 SARSAWAN 511401 U.P.S. BAIRAGIPUR Department of Education 68 SARSAWAN 508202 U.P.S. MAHEWAGHAT Department of Education 69 SARSAWAN 509502 U.P.S.UMRAWA Department of Education 70 SARSAWAN 504904 L.NAYAK J.P.U.P.S. P.SHARIRA Pvt. Unaided 71 SIRATHU 308901 P.S. BHADAWAN Department of Education 72 SIRATHU 309401 P.S. JHANDA PUR Department of Education 73 SIRATHU 304201 P.S. MALAK PINIARI Department of Education 74 SIRATHU 309802 P.S. SIRATHU II Department of Education 75 SIRATHU 302801 P.S. ANETHA Department of Education 76 SIRATHU 300203 P.S. KODAR Department of Education
Contd...

58
SN Block School Code School Name School Management 77 SIRATHU 304701 P.S. TENGAI Department of Education 78 SIRATHU 311201 P.S.NAUDHIA KARENTHI Department of Education 79 SIRATHU 311002 NAVEEN ADERSH SHIK.NI. SIRATHU Pvt. Unaided 80 SIRATHU 307703 U.P.S. KASIYA Department of Education 81 SIRATHU 303102 U.P.S. RAGHUNATHPUR Department of Education 82 SIRATHU 305702 U.P.S.TULSIPUR Department of Education 83 SIRATHU 307602 J. PHULE J.H.S.FAKIRBUX KA PUR Pvt. Unaided

Report on 5% Sample Checking of DISE Data
In Sitapur and Moradabad Districts
Submitted to:
Sarva Shiksha Abhiyaan
State Project Directorate Uttar Pradesh
By
B.K. Bajpai Fahimuddin
Giri Institute of Development Studies
Aliganj, Lucknow 226 024
May 2011

PREFACE
Development of a sound information system is critical for successful monitoring and implementation of any program particularly in social sector. Therefore, design of a School Information System was accorded priority from the very beginning of the District Primary Education Programme (DPEP) in 1994. As a result of this, the District Information System for Education (DISE) was developed by the National University of Education Planning and Administration (NUEPA), New Delhi.
DISE has completely eliminated the time lag in educational statistics. At the national level, time lag in educational data reduced to less than one year from the earlier 7-8 years. Gap between collection and dissemination of data stands reduced dramatically. Time lag with in the state is reduced to a few months.
In order to maintain the accuracy in DISE data, states have to engage the independent agencies such as monitoring institutions identified for the sample checking of data. It is to be ensured by agency that schools located both in rural and urban areas are selected as well as sample drawn includes all type of schools across different school management.
The institute has prepared the present report with all necessary requirements to make this a useful document for related government departments. The report has verified the accuracy of DISE data collected from the two districts namely Sitapur and Moradabad of Uttar Pradesh and also identified the gaps and shortcomings to adopt corrective measures for strengthening the system.
We are immensely grateful to Shri K. Ram Mohan Rao, IAS, SPD, Uttar Pradesh for assigning this task to our institute. We are thankful to Shri D. B. Sharma, Additional Project Director, SPD office and Shri Abhinav Shinha Senior Professional for providing all co-operation and help for the successful completion of the study. We are also thankful to Shri. Sanjay Singh of the SPD office for providing all cooperation and help in procuring the required information and documents used for conducting the study.
The credit of successful accomplishment of the task goes to the director of the institute, Prof. A.K. Singh who has provided the research insight and support during the conduct of the study. We express our sincere and deep sense of gratitude to him.
Our thanks are due to the members of research team consisting of Sachin Mohan Verma, Sandeep Singh, D.D. Mishra, Ajmat Ali Khan, Surendra Yadav, Deeni Ram Verma and Nitin for the arduous task of data collection. Ms. Shivi Rai handled the computerization and tabulation of the data. .
Last but not the least; we are also thankful to Mr. K.K. Verma for efficient handling of typing work and to Mr. R.S. Bisht for maintaining the official records.
Dr. B.K. Bajapi Dr. Fahimuddin
May, 2011

CONTENT
Preface i. List of Content ii - iii List of table iv - vi CHAPTER- I - SAMPLE CHECKING OF DISE DATA
1.1 Introduction 1 1.2 Main Features of DISE: 3 1.3 Major Outcomes of DISE Efforts 4 1.4 DISE: Coverage & Type of Data 5 1.5 Sample Checking of DISE Data 7
1.6(A) Methodology 8 1.6.1 Sample Selection 8
1.6(B) Tools for Sample checking 9 1.6(C) Analysis of Data 10
CHAPTER –II - LOCATION OF SCHOOLS AND OTHER DETAILS 2.1 DISE Data of Sample Schools 11 2.2 Type of Schools 12 2.3 Category of Schools 12 2.4 Management-wise Number of Schools 12 2.5 Residential Schools 13 2.6 Status of School Building 13 2.7 ICDS Centers in Schools 14 2.8 Teaching Staff in Primary Schools 15 2.9 Teaching Staff in Upper Primary Schools 16
2.10 Work Experience of Primary Head Teachers, Assistant Teachers and Shiksha Mitras
17
2.11 Work Experience of Head Teachers/Assistant Teachers of Upper Primary Schools
19
2.12 Qualification of Head, Assistant Teachers and Shikha Mitras in Primary Schools
20
2.13 Qualification of Head and Assistant Teachers in Upper Primary Schools
21
2.14 Teachers Training 23 2.15 Education of Teachers in main Subjects 25 2.16 Inspection of Schools 29 2.17 Schools Covered under NPEGEL 30

ii
2.18 Right to Education and Trainings 30 2.19 Implementation of CCE 31 2.20 Utilization of Grants in Primary Schools 31
CHAPTER -III - STATUS AND UTLIZATION OF INFRASTRUCTURAL FACILITIES IN SAMPLE SCHOOLS OF SITAPUR AND MORADABAD DISTRICTS
3.1 Availability of Electricity, Toilet and Boundary Walls 36 3.2 Use of Electricity and Toilets in Sample Schools 37 3.3 Availability of Furniture, Drinking Water and Almirahs 38 3.4 Use of Furniture for Teachers and Students and Drinking Water 38 3.5 Availability of Black Board, Computer, Library and Play Ground 39 3.6 Use of Black Board, Computer, Library and Play Ground 39 3.7 Status of Health Facilities for Students and coverage under NPEGEL,
Ramp and TLM 40
3.8 Status of Mid-Day Meal (MDM) in the Schools 40 3.9 Status of Kitchen Sheds in the Schools 41
3.10 Status of Kitchen Sheds in the Schools 41 3.11 One Time Grant for Purchase of Utensils under MDM 42
CHAPTER- IV - ENROLLMENT, ATTENDENCE AND EXAMINATION OF CHILDREN IN SAMPLE SCHOOLS OF SITAPUR AND MORADABAD DISTRICTS
4.1 Enrollment in Primary Schools of Sitapur District (2009-10) 43 4.2 Enrollment in Primary Classes of Moradabad District: 2010-11 45 4.3 Enrollment in Upper Primary Schools of Sitapur District (2010-11) 47 4.4 Enrollment in Upper Primary Schools of Moradabad District (2009-10) 50 4.5 Scholarship to Students in Primary Schools of Sitapur and Moradabad
Districts 52
4.6 Scholarship to Students in Upper Primary Schools of Sitapur and Moradabad Districts
53
4.7 Free Uniform to Students in Primary Schools of Sitapur and Moradabad Districts
54
4.8 Incentive of Free Bags to Girl Students in Primary Schools of Sitapur and Moradabad Districts
54
4.9 Incentive of Free Text Books in Primary Schools of Sitapur and Moradabad Districts
55
4.10 Incentive of Free Text Books in Upper Primary Schools 56 4.11 Number of Disabled Children in Primary Schools of Sitapur District 56
4.12(A) Number of Disabled Children in Primary Schools of Moradabad District
57
4.12(B) Number of Disabled Children in Upper Primary Schools of Sitapur District
58

iii
4.13 Number of Disabled Children in Upper Primary Schools of Moradabad
District 58
CHAPTER V - INVESTIGATOR’S OBSERVATIONS ABOUT VARIOUS ASPECTS OF SCHOOLS
5.1 Information regarding School Visits 60 5.2 Reaction of Principals/ Head Teachers towards the Investigation 60 5.3 Response of the Principals/Head teachers in providing the Information 61 5.4 Availability of Records 61 5.5 Enrollment Details 62 5.6 Information Regarding Attendance Register 62 5.7 Year End Summary and Report Card 62 5.8 Teachers Presence in the Schools 63 5.9 Problems Faced by the Investigators 63 5.10 Provision of Mid-day Meal in the Schools 64 5.11 Seating Arrangement for the Children 64 5.12 EMIS Data Processing, Infrastructure and Training 65

iv
LIST OF TABLES
Sl. No. Titles Page No.
1.1 District/ Category wise Sample Schools in Rural Area 9 1.2 District/ Category wise Sample Schools in Urban Area 9 1.3 District-wise Sample Schools 9 2.1 District-wise availability of DISE data for Sample Schools 11 2.2 School Location and Establishment Year 11 2.3 Type of Schools in Sample Districts 12 2.4 Category of Sample Schools According to Classes 12 2.5 Management-wise Schools in Sample Districts 13 2.6 Information about Residential/Day Schools 13 2.7 Status of School Building 13
2.8 ICDS Centers Running in Sample Schools 14
2.9 Teachers and their Attendance in Primary Schools: Sitapur District 15
2.10 Teachers and their Attendance in Primary Schools: Moradabad District
16
2.11 Teachers and their Attendance in Upper Primary Schools: Sitapur 16
2.12 Teachers and their Attendance in Upper Primary Schools: Moradabad District
17
2.13 Work Experience of Head / In Charge Teachers: Primary Schools 17
2.14 Work Experience of Assistant Teachers: Primary Schools 18
2.15 Work Experience of Shikha Mitra: Primary Schools 18
2.16 Work Experience of Head/In Charge Teachers: Upper Primary School
19
2.17 Work Experience of Assistant Teachers: Upper Primary Schools 20
2.18 Qualification of Head / In Charge Teachers: Primary Schools 20
2.19 Highest Qualification of Assistant Teachers: Primary Schools 21
2.20 Highest Qualification of Shiksha Mitra: Primary Schools 21
2.21 Highest Qualification of Head / In Charge Teachers: Upper Primary Schools
22
2.22 Highest Qualification of Assistant Teachers: Upper Primary Schools 22 2.23 Average Days of in-Service Trainings Received by Head/In charge
Teachers in Last Academic Year: Primary Schools 23
2.24 Average Days of in-Service Trainings Received by Assistant Teachers in Last Academic Year: Primary Schools
23
2.25 Average Days in Service Trainings Received by Shiksha Mitras in Last Academic Year: Primary Schools
24

v
2.26 Average Days of in-Service Trainings Received by Head/Teachers
in Last Academic Year: Upper Primary Schools 24
2.27 Average Days of in-Service Trainings Received by Assistant Teachers Last Academic Year: Upper Primary Schools
25
2.28 Education of Head Teachers in Main Subjects in Primary Schools of District Moradabad
25
2.29 Education of Assistant Teachers in Primary Schools of District Moradabad
26
2.30 Education of Shiksha Mitras in Main Subjects in Primary Schools of District Moradabad
26
2.31 Education of Head/In Charge Teachers in Main Subjects in Upper Primary Schools of District Moradabad
27
2.32 Education of Assistant Teachers in Main Subjects of Upper Primary Schools in District Moradabad
27
2.33 Education of Head/In Charge Teachers in Main Subjects of Primary Schools of District Sitapur
27
2.34 Education of Assistant Teachers in Main Subjects of Primary Schools of District Sitapur
28
2.35 Education of Shiksha Mitras in Main Subjects of Primary Schools of District Sitapur
28
2.36 Education of Head/In Charge Teachers in Main Subjects of Upper Primary Schools of District Sitapur
28
2.37 Education of Assistant Teachers in Main Subjects of Upper Primary Schools of District Sitapur
29
2.38 Inspection of Schools in Last Academic Year 29 2.39 Schools Covered under NPEGEL Program 30 2.40 Right to Education and Detail of Trainings in District Sitapur 31 2.41 Right to Education and Detail of Training in District Moradabad 31 2.42 Continuous and comprehensive Evaluation (CCE) Method
Implemented in the Schools 31
2.43 Utilization of Grants in Primary Schools of Moradabad District: 2009-10
32
2.44 Utilization of Grants in Upper Primary Schools of Moradabad District: 2008-09
33
2.45 Utilization of Grants in Primary Schools of Sitapur District:2008-09 34 2.46 Utilization of Grants in Upper Primary Schools of Sitapur District:
2008-09 35
3.1 Electricity, Toilet and Condition of Boundary Wall in Sample Schools
37
3.2 Use of Electricity and Toilets in Sample Schools 37 3.3 Availability of Furniture for Teachers and Students and Drinking
Water in the Schools 38
3.4 Use of Furniture for Teachers and Students and Drinking Water 38 3.5 Availability of Black Board, Computer, Library and Play Ground 39 3.6 Status of Use of Black Board, Computer, Library and Play Ground 39 3.7 Status of Health Facilities for Students and covered under NPEGEL, 40

vi
Ramp and TLM
3.8 Status of Mid- Day Meal (MDM) Facility in the Schools 41 3.9 Status of Kitchen Sheds in the Schools 41
3.10 Arrangement of Food Availability under MDM in the Schools 42 3.11 One Time Grant for Purchase of Utensils under MDM 42 4.1 Children Enrolled in the Academic Year 2010-11 in Primary
Schools of Sitapur District 44
4.2 Children Enrolled in the Academic Year 2010-11 in Primary Schools of Moradabad District
47
4.3 Children Enrolled in the Academic Year 2009-10 in Upper Primary Schools of Sitapur District
49
4.4 Children Enrolled in the Academic Year 2010-11 in Upper Primary School of Moradabad District
51
4.5 Incentives of Scholarship in the Academic Year 2009-10: Primary Schools of Sitapur and Moradabad Districts
52
4.6 Incentive of Scholarship in the Academic Year 2009-10 in Upper Primary Schools of Sitapur and Moradabad Districts
53
4.7 Incentive of Free Uniform for Girls in the Academic Year 2009-10 in Primary Schools of Sitapur and Moradabad Districts
54
4.8 Incentive of Free Bags for Girls in the Academic Year 2009-10 in Upper Primary Schools of Sitapur and Moradabad Districts
55
4.9 Incentive of Free Text Books in the Academic Year 2009-10 in Primary Schools of Sitapur and Moradabad Districts
55
4.10 Incentive of Free Text Books in the Academic Year 2008-09 in Upper Primary Schools of Sitapur and Moradabad Districts
56
4.11 Details of Disabled Children in Primary Schools of Sitapur District 56 4.12 Details of Disabled Children in Primary Schools of Moradabad
District 57
4.13 Details of Disabled Children in Upper Primary School of Sitapur District
58
4.14 Details of Disabled Children in Upper Primary Schools of Moradabad District
59
5.1 Information regarding the Visit to the Sample Schools 60 5.2 Attitude of the Principals/Head Teachers toward the Investigation 61 5.3 Information regarding Enrollment 62 5.4 Information regarding Attendance Register 62 5.5 Information regarding year end summery 63 5.6 Teachers Presence in the Schools and Problems faced by the
Investigators 63
5.7 Information regarding Mid-day Meal 64 5.8 Information Regarding Seating Arrangement in Schools 65

1
CHAPTER- I
SAMPLE CHECKING OF DISE DATA
1.1 Introduction : For successful implementation of any educational programme, effective monitoring
and management information system is essential. While monitoring framework under SSA
is developed separately, concerted efforts have been made towards strengthening of
Educational Management Information System (EMIS) in India.
Indian education system is one of the largest education systems in the World. It
caters to the needs of more than 1,028 million people. Keeping in view its size, the
information system has the following limitations: (i) multiple data collection agencies; (ii)
multiple directorates involved in data collection and lack of coordination among them; (iii)
lack of understanding of the concepts and definitions of educational statistics; (iv) lack of
adequate staff at different levels; (v) lack of qualified and trained staff especially at the
lower levels; (vi) problems in distribution and collection of data-capture formats; (vii) lack
of district-specific time series data; (viii) time-lag in data; (ix) reliability of education data;
(x) data gaps; (xi) lack of equipments (computers) at lower levels; (xii) creation of new
districts and changes in boundaries of the existing districts; (xiii) poor dissemination and
utilization of data; and (xiv) lack of accountability at all levels.
Notwithstanding the above limitations, the school statistics form basis of planning,
monitoring and evaluation of various aspects of education, in general, and primary and
elementary education, in particular.
At the time of initiating District Primary Education Programme (DPEP) in 1994, it
was felt that a sound information system is essential for successful monitoring and
implementation of the programme. It was expressed that DPEP, with a focus on
decentralized planning, required up-to-date and reliable school level information. The
MHRD in 1994, as a part of the DPEP national endeavor, decided to design and develop a
school based computerized information system, the main responsibility for which was
entrusted to National University of Educational Planning and Administration (NUEPA),
New Delhi.

2
In this background, a pilot project for revitalization of educational statistics in India
was initiated at NUEPA during 1995 with financial assistance from UNICEF. The project
was to examine issues related to identification of data needs, processes and procedures for
data collection, developing a framework for data flows and computerization, and
facilitating the use of educational indicators in planning, management, monitoring and
evaluation.
In tune with the spirit of the DPEP, district was selected as a nodal point for
collection, computerization, analysis and use of school level data. The first version (dbase)
of the software, named as ‘District Information System for Education’ (DISE) was
released by NUEPA during the middle of 1995. The district level professionals were
assisted and trained in the establishment of EMIS units. The first major review of the
DISE software was undertaken during 1997-98 (Power Builder/SQL Anywhere). The
software was later redesigned in 2001 in the light of requirements of the SSA
(PowerBuilder/Oracle). Not only the coverage of DISE was extended to non-DPEP states
but it was also extended from primary to the entire elementary level of education. DISE is
under revision and the revised version has the following additional variables:
Schools by Type of Boundary Wall.
Schools by Source of Drinking Water.
Furniture for Teachers and Students and Availability of Kitchen Sheds in the
Schools.
Enrolment by Minority students.
Distribution of Children by Multiple Disabilities.
Examination Results of SC and ST Students etc.
Efforts are being made to develop DISE as complete user friendly menu-driven
software. Some of the features that are being incorporated in the modified software
are:
Complete flexibility will be provided to users to add ‘n’ number of state and
district-specific supplementary variables in the Data-Capture Format and generate
reports at all desired levels.
To improve the consistency of data, efforts are being made to highlight schools
that reported inconsistent data.

3
Export data to popular formats such as Excel, Text etc. will be made available.
Users will be able to make data entry at Block level and then merge the data into
single district level database by using the new improved DISE 2001 Export Utility
Software etc.
1.2 Main Features of DISE:
The main features of DISE 2001 are briefly presented below:
The system covers eight years of schooling in all primary, upper primary and
primary/upper primary sections of the secondary and higher secondary schools.
The concepts and definitions of educational variables involved therein have been
standardized at the national level and are uniformly followed by all districts and
states.
Manual aggregation of data at different levels is completely replaced by
computerized data entry and report generation system.
It provides time-series data at school, village, cluster, block and district levels.
The system defines core data on school location, management, rural urban,
enrolment, buildings, equipment, teachers, incentives, medium of instruction,
children with disabilities, examination results and student flows.
Detailed data on individual teachers, para-teachers and community teachers and
their profile, including data on in- service training received is collected and made
available.
It eliminates the chances of data manipulation at various levels. The school
remains responsible for correctness of the data supplied. States need to ensure
correctness of the data supplied on five per cent sample basis.
The states/districts have flexibility of adding supplementary variables depending
upon their specific requirements on year-to-year basis. No additional software for
computerization and analysis of state/district specific data is required.
The states/districts can develop their own large database using ‘designer’ module
and integrate a variety of school/cluster/block level data with it. The software

4
handles multiple databases at various levels and provides tools of data analysis and
presentation.
A large number of standardized reports on school related variables and
performance indicators aggregated at the cluster, block and district levels are
generated by the software.
DISE ensures two-way flow of information. School summary report for each
school is generated for sharing with the school and members of Village Education
Committee.
It provides an easy-to-use dynamic graphic facility to enhance the presentation of
various types of graphs and data.
DISE presents multi-user and modular system of software design for better
management and security of databases.
It responds to pre-defined queries on standard aspects, like school list, list of
villages without primary and upper primary schools, single-teacher schools,
schools without buildings, schools with high PTR, etc.
It helps user defined dynamic query on hundreds of variables.
It provides facilities for basic statistical analysis, including generation of new
variables and their analysis.
The reports can be shared across a large number of users without full software
installation.
Data can be exported to many other formats for statistical and other analyses by
users.
1.3 Major Outcomes of DISE Efforts: Through the concerted efforts, MIS Unit is now operational both at the district and
state levels and is equipped with necessary hardware and software.
The DISE software is now operational in 581 districts of 29 States & UTs of the
country and is providing vital information for policy formulation and preparation
of district elementary education plans.
DISE has completely eliminated time-lag in educational statistics. At the national
level, time-lag in educational data is reduced to less than one year from the earlier

5
7-8 years. Gap between collection and dissemination of data stands reduced
dramatically. Time-lag within the state is reduced to few months.
DISE has also eliminated data gaps as comprehensive information is now available
on all aspects of universal elementary education across the country.
It is for the first time that a time-series data is made available at the school level.
The trend analysis of DISE data helps in identifying major block and district
specific issues for being used in developing perspective and annual plans.
For the first time, a District Report Card on elementary education is being released
annually as part of DISE dissemination activities, which contains time-series and
cross-sectional data on more than four hundred variables at the district level. State
Report Cards have also been developed and are being disseminated for the last four
years. The Analytical report containing detailed analysis of DISE data is also being
published annually. Efforts will be made to develop Country Report Card once all
the States & UTs get covered under DISE.
Official website of DISE (http://dpepmis.org) has been developed and is being
updated frequently. District Report Cards and raw data in case of each of the
district covered under DISE are uploaded. Data-Capture Formats, software patches
etc. are also made available to users. Analytical reports are also made available on
the Internet. Efforts are being made to make available School Report Cards in case
of all one million plus schools through the internet.
As an online help to users, DISE group of users is formed on the Internet, which is
very active. Users post problems of common interest to group for their solutions.
UNICEF has decided to support studies based on the DISE data. At the
international level, to create awareness about DISE and type of data it generates,
presentations were recently made at the Oxford and Cambridge Universities (UK).
Through concerted efforts, it is hoped that demand for DISE data will be generated
in years that follow.
1.4 DISE: Coverage & Type of Data : Total 604 districts across 35 States and UTs have been covered under DISE during
2005-06. Information on the following key variables has been made available over a
period of time at school, cluster, block, district, state and National levels.

6
a. Data on number of blocks, CRC’s, villages and schools in case of all the States.
b. Key data on elementary education in terms of the number of schools, enrolment,
and teachers, classified by school category and school management (also in respect
of a few variables in case of rural/urban areas).
c. Grade-wise and level-wise enrolment in each State.
d. Examination results for the previous academic session for the terminal classes at
primary and upper primary levels of education.
e. Classrooms, categorized into good condition, requiring minor and major repairs by
school category.
f. Number of schools by category and by type of buildings.
g. Sex-wise enrolment of children with disabilities at primary and upper primary
levels.
h. Gender and caste distribution of regular and para-teachers and the proportion of
teachers undergoing in-service teachers training during the previous year.
i. Distribution of regular and para-teachers by educational and professional
qualifications and by school category.
j. Enrolment by medium of instruction and by school category.
k. Sex-wise number of students benefited by various incentive schemes at primary
and upper primary levels.
l. Performance indicators in terms of school category; ratio of primary to upper
primary schools/sections; enrolment distribution: total, Scheduled Castes and
Scheduled Tribes, percentage of female enrolment; gender-parity index;
classrooms; single-teacher schools; schools with attached pre-primary classes;
percentage of under-age & over-age children in primary and upper primary classes;
apparent survival rate (up to Grade V), dropout rate, retention rate, and transition
rate from primary to upper primary level.
m. Quality indicators according to category of schools, teacher-pupil ratio; availability
of female teachers; schools without female teachers; blackboard and building;
percentage of schools received and utilized school development and TLM grant;

7
students classroom ratio; availability of drinking water, common toilet and girl’s
toilet in school etc.
1.5 Sample Checking of DISE Data:
It is mandatory for all the States and UTs to check the DISE data on sample basis.
The previous scheme of drawing sample for checking of DISE data is now slightly revised
and the same will be applicable from the year 2006-07 onwards. Each state has to draw a
sample of 10 per cent of districts with a minimum of at least 2 districts for random
checking of data. Within each sample district schools from 5 per cent from each block is
required to be selected. The State Project Director will draw a sample of districts. The
districts may be selected in such a fashion so that they represent the entire population i.e.
the State. Special Focus Districts, district having literacy rate below and above the state
level etc. may be the possible criteria to draw sample.
It is mandatory for states to engage independent agencies such as monitoring
institutions identified for state in sample checking of data. Actual sample of schools will
be drawn by the agency entrusted the task of data checking. While drawing school sample,
it should be ensured that schools located both in rural and urban areas are selected as well
as the sample drawn should also include all types of schools across school managements.
Due consideration should also be given to schools pre-dominantly located in SC, ST and
minority areas.
It is advisable that filled-in school formats should be provided to agency only after
completion of field work. The district and states are not required to modify the filled-in
formats on the basis of outcome of the sample checking of the data. The office of the SPD will
make all necessary arrangement for smooth conduct of the sample checking of data. The
agency entrusted the task of sample checking of data would be required to submit detailed
report which should be discussed with the state authorities. They should also comment on
coverage of schools in the district.
The agency entrusted the task of sample checking of data is also required to summarize
their filed observations regarding training of Head Master in filling up of DISE formats,
infrastructure in the district MIS Unit, feedback to schools in terms of School Report Cards,
display of key information on the school display board, availability of DISE data at all levels,
dissemination and awareness about DISE data, use of DISE data in planning, evidence of
sharing workshops at all levels, data feeding arrangements at the district level, availability of

8
HW and SW and computer professionals for the MIS Unit, etc. They may also provide their
suggestions for improving the quality of DISE data. It is mandatory for state to submit the
final report of the sample checking of data to the national level authorities. It is suggested that
the sample checking of data be undertaken sometime in the month of October or immediately
after completion of data collection.
For the sample checking of DISE data from sample districts, Giri Institute of
Development Studies was commissioned by the State Project Office, Sarva Shiksha Abhiyaan,
U.P to undertake the sample checking of DISE data (2010-11) for two districts namely
Sitapur and Moradabad of Uttar Pradesh. Giri Institute of Development Studies is an
autonomous body of ICSSR. It undertakes high level research and evaluation studies of
different International, National and State level government and independent organizations.
The Institute is also a nodal agency to undertake Evaluation Study of SSA in Uttar Pradesh,
selected by Ministry of Human Resource Development, Government of India, New Delhi.
1.6 (A) Methodology :
The objective of sample checking exercise has been to verify the accuracy of the DISE
data which has been collected from the related districts of the State and also to identify the
gaps and shortcomings to adopt corrective measures for strengthening the system.
1.6.1 Sample Selection:
The study covers two districts of Uttar Pradesh for the DISE data checking. Within each
sample district, five per cent schools from each block have been selected as has been
suggested by the Government of India/NUEPA.
As per revised guidelines of Government of India, the sampling is to be done from each
block of the sample districts. In view of this, from the complete list of schools of each block of
each district, 5 per cent schools were chosen through the systematic random sampling
technique. The location of blocks was spread over Rural and Urban areas in each of two
districts.
The selection of sample Primary and Upper Primary schools was further made according
to their existing proportion in a particular block of each district. These sample schools were
further divided according to the type of schools like schools of education department, private
unaided, private aided. This division for sample selection was further based on proportionate
sampling. The district-wise number of schools along with the sample schools in each category
is presented in Tables- 1.1, 1.2 and 1.3.

9
Table-1.1 District/ Category wise Sample Schools in Rural Area
Education Deptt. Manyata Prapt Total District Name No. of Blocks PS UPS PS UPS PS UPS
Sitapur Total No of Schools % Sample No of schools %
15
2480 (87.94) 124 (87.94)
760 (71.69) 38 (71.69)
340 (12.05) 17 (12.05)
300 (28.3) 15 (28.3)
2820 (100.0) 141 (100.0)
1060 (100.0) 53 (100.0)
Moradabad Total No of Schools % Sample No of schools %
13
1680 (68.29) 84 (68.29)
760 (58.46) 38 (58.46)
800 (32.52) 40 (32.52)
520 (40.0) 26 (40.0)
2480 (100.0) 124 (100.0)
1280 (100.0) 64 (100.0)
Table-1.2 District/ Category wise Sample Schools in Urban Area
Education Deptt. Manyata Prapt Total District Name No. of Blocks PS UPS PS UPS PS UPS
Sitapur Total No of Schools % Sample No of schools %
4
80
(40.0) 4
(40.0)
40 (33.33) 2 (33.33)
120 (60.0) 6 (60.0)
80
(66.66) 4
(66.66)
200
(100.0) 10
(100.0)
120
(100.0) 6
(100.0)
Moradabad Total No of Schools % Sample No of schools %
2
160
(33.33) 8
(33.33)
20 (12.5) 1 (12.5)
320 (66.66) 16 (66.66)
140
(87.5) 7
(87.5)
480
(100.0) 24
(100.0)
160 (100.0) 8
(100.0)
Table-1.3 District-wise Sample Schools
District Name Rural Urban Total PS UPS TOTAL PS UPS TOTAL PS UPS TOTAL Sitapur Total No of Schools % Sample No of schools %
2820
(100.0) 141
(5.00)
1060
(100.0) 53
(5.00)
3880
(100.0) 194
(5.00)
200
(100.0) 10
(5.00)
120
(100.0) 6
(5.00)
320
(100.0) 16
(5.00)
3020
(100.0) 151
(5.00)
1180
(100.0) 59
(5.00)
4200
(100.0) 210
(5.00) Moradabad Total No of Schools % Sample No of schools %
2480
(100.0) 124
(5.00)
1280
(100.0) 64
(5.00)
3760
(100.0) 188
(5.00)
480
(100.0) 24
(5.00)
160
(100.0) 8
(5.00)
640
(100.0) 32
(5.00)
2960
(100.0) 148
(5.00)
1440
(100.0) 72
(5.00)
4400
(100.0) 220
(5.00)
1.6(B) Tools for Sample checking:
The task of sample schools checking was undertaken on data collection format
which was prepared in consultation and subsequent approval from State Project Office,
SSA, Uttar Pradesh. The information collected for the project is based on the same. The
copy of format is presented in Annexure-I. Apart from collecting the key information for
ascertaining the accuracy of DISE school level data, the format also contained a
qualitative assessment of the whole system engaged for disseminating the primary

10
education including the actual attendance of students as well as teachers during the year
and on the day of the team visit.
1.6(C) Analysis of Data:
The data available through DISE and sample checking format on different aspects
was put for comparative analysis in a tabular format. The variations were measured in
absolute as well as percentage terms. The variation in collected data has been relating to
the non-availability of data, non existing data, wrong information i.e. mismatch with the
sample checking data.
Apart for this, some more data has been analyzed to take care of Quality aspect of
the school teachers’ performance.

11
CHAPTER –II
LOCATION OF SCHOOLS AND OTHER DETAILS
2.1 DISE Data of Sample Schools:
Following the norms of sampling for filling up the prescribed data collection
formats in two districts of Uttar Pradesh, we have visited 430 sample schools in the
districts of Sitapur and Moradabad. The subsequent comparison with the DISE data
provided by State Project Office revealed that schools for which survey was conducted,
the DISE data was also made available. Table 2.1 showed that all the 430 sample schools
located in two districts, i.e., Sitapur and Moradabad were matching with the DISE
schedule.
Table-2.1 District-wise availability of DISE data for Sample Schools
Schools for which data was found available in the DISE schedule
District
No. of sample
schools Number Percentage Sitapur 210 210 100 Moradabad 220 220 100 Total 430 430 100
Source: Field Survey and DISE data. . The verification of information relating to schools in rural and urban locations and
year of establishment indicated small variation between two sets of information only in
case of year of establishment of schools. In Table-2.2, negligible variation is evident in
Sitapur district as compared with the Moradabad district. Though in case of Moradabad
district, variation between DISE and survey data is around 3 per cent.
Table-2.2 School Location and Establishment Year
School location
Establishment Year District
Particular Rural Urban Less than 2 year (2008-09 to
2006-07)
2Years to5 years (2005-
06 to 2003-04)
5Years to 10 years (2002-
03 to1998-99)
10 Years + (Before1997-08)
Total
Survey 194 16 18 17 21 154 210 DISE 194 16 18 16 22 154 210
Sitapur
Variation - - - -1 (-6.25) 1 (4.54)
- -
Survey 188 32 37 32 42 109 220 DISE 188 32 37 31 43 109 220
Moradabad
Variation - - - -1 (3.23) 1 ( 2.33) - - Source: Field Survey and DISE data

12
2.2 Type of Schools:
There are three categories of Primary schools i.e., schools for boys, girls and schools
with co-education. There was no variation between the DISE data and survey data with regard
to the number of schools for boys and for girls and also in case of co-education schools in
sample districts as evident in Table-2.3.
Table-2.3: Type of Schools in Sample Districts
District Particular School For Boys School For Girls Co-education Total Survey 2 1 207 210 DISE 2 1 207 210
Sitapur
Variation - - - - Survey 1 6 213 220 DISE 1 6 213 220
Moradabad
Variation - - - - Source: Field Survey and DISE data
2.3 Category of Schools:
The information relating to the number of sample schools according to classes in
three categories as primary, primary with upper primary and upper primary has been
shown in Table- 2.4. In both the districts of Sitapur and Moradabad there is no variation
in survey data from the DISE data in case of different classes of primary and upper
primary schools.
Table-2.4 Category of Sample Schools According to Classes
Class District Particular 1- 3 1 – 4 1 -5 1-8 6-7 6-8 Total
Survey - - 153 6 - 51 210 DISE - - 153 6 - 51 210
Sitapur
Variation - - - - - - - Survey - - 147 11 - 60 220 DISE - - 147 11 - 60 220
Moradabad
Variation - - - - - - -
Source: Field Survey and DISE data
2.4 Management-wise Number of Schools :
The management wise classification of primary schools as presented in DISE data
has not shown any variation in numbers in each category while comparing it with our
survey data in both the sample districts of the study as presented in Table-2.5.
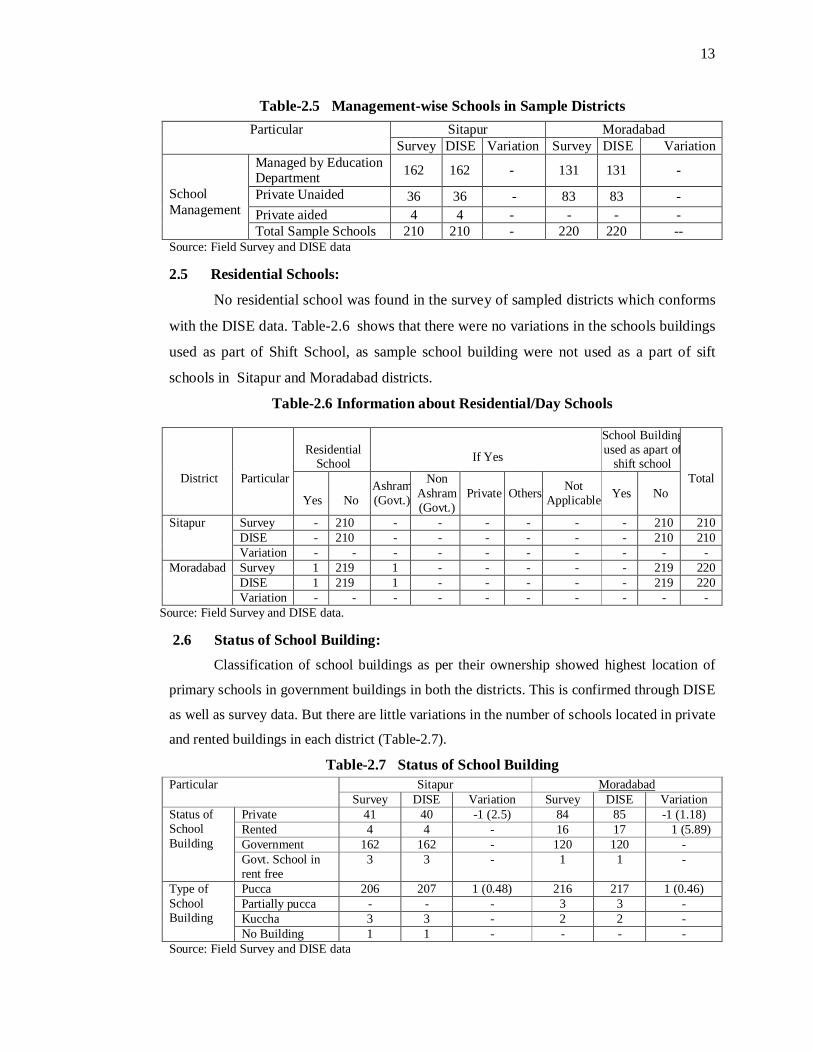
13
Table-2.5 Management-wise Schools in Sample Districts
Sitapur Moradabad Particular Survey DISE Variation Survey DISE Variation
Managed by Education Department 162 162 - 131 131 -
Private Unaided 36 36 - 83 83 - Private aided 4 4 - - - -
School Management Total Sample Schools 210 210 - 220 220 -- Source: Field Survey and DISE data
2.5 Residential Schools:
No residential school was found in the survey of sampled districts which conforms
with the DISE data. Table-2.6 shows that there were no variations in the schools buildings
used as part of Shift School, as sample school building were not used as a part of sift
schools in Sitapur and Moradabad districts.
Table-2.6 Information about Residential/Day Schools
Residential
School
If Yes
School Building used as apart of
shift school
District
Particular Yes
No
Ashram (Govt.)
Non Ashram (Govt.)
Private Others Not Applicable Yes No
Total
Survey - 210 - - - - - - 210 210 DISE - 210 - - - - - - 210 210
Sitapur
Variation - - - - - - - - - - Survey 1 219 1 - - - - - 219 220 DISE 1 219 1 - - - - - 219 220
Moradabad
Variation - - - - - - - - - - Source: Field Survey and DISE data.
2.6 Status of School Building: Classification of school buildings as per their ownership showed highest location of
primary schools in government buildings in both the districts. This is confirmed through DISE
as well as survey data. But there are little variations in the number of schools located in private
and rented buildings in each district (Table-2.7).
Table-2.7 Status of School Building Sitapur Moradabad Particular
Survey DISE Variation Survey DISE Variation Private 41 40 -1 (2.5) 84 85 -1 (1.18) Rented 4 4 - 16 17 1 (5.89) Government 162 162 - 120 120 -
Status of School Building
Govt. School in rent free
3 3 - 1 1 -
Pucca 206 207 1 (0.48) 216 217 1 (0.46) Partially pucca - - - 3 3 - Kuccha 3 3 - 2 2 -
Type of School Building
No Building 1 1 - - - - Source: Field Survey and DISE data

14
The information on number of schools having pucca, partially pucca or kutcha
buildings presented in above table showed nominal variation between the DISE and
survey data. Such variation is of 0.48 percent is case of partially pucca school buildings in
Sitapur district and a variation of 0.46 percent is found in Moradabad district. No variation
was recorded in case of number of pucca schools buildings in both the districts. There was
one primary school found running without building in village Laliyaput, block of
Khairabd in Sitapur district.
2.7 ICDS Centers in Schools:
The field survey of the sample primary schools revealed that ICDS Centers were
running in more than 51 percent primary schools in Sitapur and 43 percent in the primary
schools of Moradabad district as per DISE data. A variation in the number of schools
running ICDS Centers was also found between DISE and Survey data to the tune of
around 3 per cent in Sitapur district and around 21 per cent in Moradabad district. In both
the districts, average number of schools running ICDS Centers was found to be lesser in
the survey data as against what has been reported in the DISE data.
Similar variation was found between DISE and Survey data on enrolled children in
ICDS Centers as evident in Table-2.8. The survey data found around than 3 per cent more
children enrolled than the DISE data in Sitapur district while 5 per cent less enrollment of
children was found in survey data as against the DISE data in Moradabad district. The
DISE data did not report the presence of enrolled children in ICDS centers in both the
district but our survey found that only 30 per cent of the enrolled children in Sitapur as
well as in Moradabad districts were found to be present on the day of visit of our research
team to the sample schools.
Table-2.8 ICDS Centers Running in Sample Schools
District
Particular
No. of ICDS Center
Total no. of Enrolled Students
Total no. of Students Present
Survey (Average / School ) 75 72 21 (30%) DISE(Average / School ) 77 70 NA
Sitapur (No.)
Variation(Average / School ) 2 (+2.59) -2 (-2.85) - Survey(Average / School ) 50 76 23 (30%) DISE(Average / School ) 63 80 NA
Moradabad (No.)
Variation(Average / School ) 13 (+20.64) 4 (+5.00) - Source: Field Survey and DISE data

15
2.8 Teaching Staff in Primary Schools:
Information regarding number of teachers and their classification in different
categories i.e. headmasters, in-charge teachers, assistant teachers, shiksha mitras and
males or females did not show any variation between the survey data and the information
provided in DISE in the primary schools of both the districts (Table-2.9). It became
evident that around 3 per cent of male head teachers, 8 per cent of male assistant teachers
and 6 per cent of male shiksha mitras were found to be absent on the day of visit of our
research team. No female teacher was absent except 8 per cent of them in Sitapur district.
The table also presents sanctioned and working number of non teaching staff and Cooks
for MDM.
Table-2.9 Teachers and their Attendance in Primary Schools: Sitapur District
No. of Teachers
Working in the Schools
No. of Teachers found present on the Day of Visit
Percentage of Absentees
Particulars No. of
Sanctioned Teachers
M F M F M F Survey 145 91 22 88 22 3.30 - DISE 145 91 22 - - - - Head Master/ In
charge Teacher Variation - - - - - - - Survey 435 163 108 150 100 7.97 7.40 DISE 435 163 108 - - - -
Assistant Teacher
Variation - - - - - - - Survey 161 82 73 77 73 6.10 - DISE 161 82 73 - - -
Shiksha Mitra
Variation - - - - - - - Non Teaching Staff 4 4 - 4 - - - Cooks for MDM 215 3 210 3 210 - -
Source: Field Survey and DISE data
The above information in this respect has been presented in Table-2.10 for the
district of Moradabad. As in earlier case, there is no variation between the survey and
DISE data for number of sanctioned teachers (Headmaster/ in charge teacher), assistant
teacher and Shiksha Mitras. For non teaching staff, DISE data was not available. However
there was a gap between sanctioned number of MDM cooks and persons for lavatories
and the actual number of these workers in sample primary schools of Moradabad. The
absentee teachers were higher in the district. Around 20 per cent of male head teachers and
17 per cent of female head teachers were absent on the day of our visit. It also became

16
evident that 3 to 5 per cent of assistant teachers who included males and females were
absent. 2 per cent of female shiksha mitras were also absent.
Table 2.10 Teachers and their Attendance in Primary Schools: Moradabad District
No. of Teachers
Working in the Schools
No. of Teachers found present on the Day of Visit
Percentage of Absentees
Particulars No. of
Sanctioned Teachers
M F M F M F Survey 145 60 41 48 34 20.00 17.08 DISE 145 60 41 48 34 - - Head Master/ In
charge Teacher Variation - - - - - - - Survey 411 163 152 158 145 3.06 4.60 DISE 411 163 152 158 100 - -
Assistant Teacher
Variation - - - - - - - Survey 211 89 107 89 105 - 2 DISE 211 89 107 89 105 - 1.87
Shiksha Mitra
Variation - - - - - - - Non Teaching Staff 113 91 18 91 18 - - Cooks for MDM 327 51 270 51 270 - - Person for Lavatories - - - - - - -
Source: Field Survey and DISE data.
2.9 Teaching Staff in Upper Primary Schools:
In case of upper primary schools of Sitapur district, the number of head master/ in
charge teachers and assistant teachers was available in DISE data. Negligible variation
was found in case of number of sanctioned teachers, number of teachers working in
schools, teachers found present on the day of survey and absentee teachers (Table-2.11).
In upper primary schools, 3 per cent of male assistant teachers and 9 per cent of non-
teaching staff were absent in the district on the day of our visit.
Table 2.11 Teachers and their Attendance in Upper Primary Schools: Sitapur No. of Teachers Working in the
Schools
No. of Teachers found present on the Day of
Visit
Percentage of Absentees
Particulars No. of
Sanctioned Teachers M F M F M F
Survey 71 55 7 55 7 - - DISE 72 56 7 - - - - Head Master/ In
charge Teacher Variation 1(1.38) 1(1.78) - - - - - Survey 238 125 62 122 61 3.20 - DISE 240 127 62 - - -
Assistant Teacher
Variation 2(0.83) 2(1.57) - 2(1.61) - - - Non Teaching Staff 12 11 - 11 - 9.09 - Cooks for MDM 76 2 63 2 63 - -
Source: Field Survey and DISE data.

17
In case of upper primary schools of Moradabad district, the number of head
master/in charge teachers and assistant teachers was available in DISE data. Negligible
variation was found in case of number of sanctioned teachers and number of teachers
working in schools. 10 per cent of male head teachers and 5 per cent of male and female
MDM cooks were absent.
Table 2.12 Teachers and their Attendance in Upper Primary Schools: Moradabad District
No. of Teachers Working in the
Schools
No. of Teachers found present on the Day of
Visit
Percentage of Absentees
Particulars
No. of Sanctioned Teachers
M F M F M F
Survey 61 50 6 45 6 10.00 - DISE 62 49 6 - - - - Head Master/ In
charge Teacher Variation 1 (1.6) -1
(2.04) - - - -
Survey 166 90 29 86 29 4.45 - DISE 165 89 30
Assistant Teacher
Variation -1(0.61) -1 (1.12) 1(3.33) - - - -
Non Teaching Staff 5 5 - 5 - - - Cooks for MDM 105 21 74 20 70 4.77 5.41 Person for Lavatories 20 16 4 16 4 - -
Source: Field Survey and DISE data
2.10 Work Experience of Primary Head Teachers, Assistant Teachers and Shiksha Mitras:
The most important factor is the work experience of head teacher and principal of a
school from the point of view of its standard and performance. The data regarding it for
the primary schools of Sitapur and Moradabad districts has been presented in Table 2.13.
The information on this aspect available through DISE showed no variation from
information collected through our survey.
Table-2.13 Work Experience of Head / In Charge Teachers: Primary Schools Total Teaching Experience Experience in Present school
District Particular 0-5
year 6-10 Year
11-15 Year
16-20 Year
Above 20Year
0-5 Year
6-10 Year
11-15 Year
16-20 Year
Above 20Year
Total
Survey 56 20 22 5 10 57 27 20 3 6 113
DISE 56 20 20 5 10 57 27 20 3 6 113
Sitapur Variation - - - - - - - - - - -
Survey 30 24 11 14 22 50 35 5 4 7 101
DISE 30 24 11 14 22 50 35 5 4 7 101
Moradabad Variation - - - - - - - - - - -
Source: Field Survey and DISE data

18
The DISE data on work experience of assistant teachers in the primary schools of
Sitapur and Moradabad districts showed smaller variation from survey data as evident in
Table-2.14. The nominal variation between Survey and DISE data relating to the
experience of assistant teachers in the same school as well as in total number of working
years was there in both the districts.
Table-2.14 Work Experience of Assistant Teachers: Primary Schools
Total Teaching Experience Experience in Present School District
Particular 0-5 year 6-10
Year 11-15 Year
16-20 Year
Above 20Year
0-5 Year
6-10 Year
11-15 Year
16-20 Year
Above 20Year
Total
Survey 150 46 18 5 5 139 45 12 7 5 224
DISE 150 45 18 5 5 138 46 12 7 5 224
Sitapur Variation 1 (0.66) -1 (2.22) - - - -1 (0.91)1(2.17) - - - -
Survey 211 74 17 9 4 222 66 16 8 1 315
DISE 212 74 16 9 4 222 65 17 8 1 315 Moradabad
Variation 1 (0.48) - -1(6.25) - - - -1 (1.54) 1(5.89) - - -
Source: Field Survey and DISE data
The work experience of Shikha Mitras in primary schools of both the districts is
presented in Table 2.15. Most of them had experience in the range of 6 to 10 years in these
districts. A variation of around 3 per cent between DISE and survey data was evident in
case of Shiksha Mitras of Sitapur district which has work experience of less than two
years. However, the same variation was of around -5 per cent between survey and DISE
data in Moradabad district. Those Shiksha Mitras who showed more teaching experience
also indicated some variation in their experience as evident between DISE and survey
data.
Table-2.15 Work Experience of Shikha Mitra: Primary Schools Total Teaching Experience Experience in Present School
District
Particular 0-2 Year
3-5 Year
6-10 Year
0-2 year
3-5 Year
6-10 Year
Total
Survey 30 30 95 25 40 90 155 DISE 31 30 94 25 39 91 155
Sitapur
Variation 1(3.22) - -1(1.06)
- -1(2.56) 1(1.09) -
Survey 23 81 92 21 85 90 196 DISE 22 82 92 22 84 90 196
Moradabad
Variation -1(4.54)
1(1.21) - 1(4.54) -1(1.19) - -
Source: Field Survey and DISE data

19
2.11 Work Experience of Head Teachers/Assistant Teachers of Upper Primary
Schools:
In upper primary schools, majority of head teachers have long teaching experience
but in the present schools where they are posted, number of service years is not longer.
This is true in case of both the districts. As far the variation between the survey and DISE
data is concerned, there are variations in absolute numbers in few years. In Sitapur district,
positive variation is evident between the DISE and survey data pertaining to the teachers
who have total teaching experience and total experience in the present school of 6-10
years. In Moradabad district, negative variation between DISE and survey data is reflected
in case of number of teachers who have total teaching experience and teaching experience
in their present schools.
Table-2.16 Work Experience of Head/In Charge Teachers: Upper Primary School Total Teaching Experience Experience in Present School
District
Particular
0-5 year
6-10 Year
11-15 Year
16-20 Year
Above 20Year
0-5 Year
6-10 Year
11-15 Year
16-20 Year
Above 20Year
Total
Survey 26 5 2 3 26 36 11 4 5 6 62
DISE 26 6 2 3 25 36 12 3 5 6 62
Sitapur Variation - 1(16.67) - - -1(4.00) - 1(8.33)))-1(33.33) - - -
Survey 16 7 4 7 22 36 9 3 1 7 56
DISE 16 7 3 8 22 36 9 2 1 8 56
MoradabadVariation - - -1(33.34))1(12.5) - - - -1(50) - 1(6.67) -
Source: Field Survey and DISE data
About 20 per cent of total assistant teachers in upper primary schools of Sitapur
district have total teaching experience of less than 5 years while percentage of such
teachers is higher in Moradabad district. No doubt, variations between survey and DISE
data are there. A positive variation of around 3 per cent and negative variation 4 per cent is
reflected in case of teachers who have total teaching experience of 6-10 years and 11-15
years in Sitapur district respectively between the survey and DISE data. In Moradabad
district, a negative variation of 4 per cent between the survey data and DISE data and
there is a variation of 6 per cent in case of teaching experience of 11-15 years. Some
minor variations in number are reflected in the teaching experience of assistant teachers in
their present upper primary schools, having experience in present schools ranging from
11-15 and 16-20 years (Table 2.17).

20
Table-2.17 Work Experience of Assistant Teachers: Upper Primary Schools
Total Teaching Experience Experience in Present School District Particula
r 0-5 year
6-10 Year
11-15 Year
16-20 Year
Above 20Year
0-5 Year
6-10 Year
11-15 Year
16-20 Year
Above 20Year
Total
Survey 50 35 24 12 66 72 48 30 5 32 187 DISE 50 36 23 12 66 71 49 30 5 32 187
Sitapur
Variation - 1(2.77) -1(4.34) - - -1(2.5) 1(2.04) - - - - Survey 52 25 14 9 19 72 21 9 5 12 119 DISE 52 24 15 9 19 72 21 10 4 12 119
Moradabad
Variation - -1(4.16) 1 (6.66) - - - - 1(10.00) -1 (25.00))
- -
Source: Field Survey and DISE data.
2.12 Qualification of Head, Assistant Teachers and Shikha Mitras in Primary Schools:
The educational qualification of head teachers of primary schools ranged from high
school to M.Phil and Ph.D levels in Sitapur and Moradabad districts (Table-2.18). All of
them have some sort of professional qualifications in both the district. As far the variations
between the survey and DISE data is concerned nominal variations are evident in both the
districts.
Table-2.18 Qualification of Head / In Charge Teachers: Primary Schools
Educational Qualification Professional Qualification Total
Dis
trict
Parti-cular
UPS
H.S. Inter mediate
Gradu-ation
Post Gradua
tion
M. phl./ Ph.D
BTC OR
equivalent
LT, B.Ed OR equivale
nt
M.Ed OR
equivalent
Non-Trained
Survey 3 5 25 40 38 2 51 38 3 21 113 DISE 3 5 24 41 38 2 52 37 3 21 113
Sita
pur
Variation - - -1 (4.16)
1 (2.43)
- - 1(1.92) -1(2.71)
- - -
Survey - 8 16 28 48 1 46 35 4 17 101 DISE - 8 17 27 48 1 45 36 4 17 101
Mor
adab
ad
Variation -
- 1 (5.88)
-1 (3.70)
- - -1 (2.22) 1(2.77) - - -
Source: Field Survey and DISE data About 40 percent of assistant teachers at primary schools are found to be graduate
and 43 percent post graduate in the sample schools of Sitapur district. Rest of the assistant
teachers had their education up to intermediate and high school. Around 1 percent
variation between Survey and DISE data was recorded in this respect in Sitapur district.
Regarding professional qualifications, more than 42 percent assistant teachers in Sitapur
district are found to be untrained. Around 45 percent are LT or B.Ed and less than 11
percent were BTC or equivalent. The variation between survey and DISE data in this
respect is around 1 per cent (Table 2.19).

21
Table-2.19 Highest Qualification of Assistant Teachers: Primary Schools
Educational Qualification Professional Qualification
Dis
trict
Particular
UPS H.S. Inter mediate
Gradat ion
Post Gradua
tion M. phl./
Ph.D BTC OR
equivalent
LT, B.Ed OR
equivalentM.Ed OR equivalent
Non-Trained
Total
Survey - 15 30 98 79 2 31 97 4 92 224 DISE - 15 30 99 78 2 30 98 4 92 224 Si
tapu
r
Variation - - - 1(1.01) -1(1.28) - -1(3.33) 1(1.02) - - - Survey 5 9 80 137 82 2 120 80 7 108 315 DISE 5 9 81 136 82 2 119 81 7 108 315
Mor
adab
ad
Variation - - 1(1.23) -1(0.74) - - -1 (0.84) 1(1.23) - - - Source: Field Survey and DISE data
In Moradabad district, variation in Survey and DISE data regarding
educational qualification of assistant teachers of primary school ranged from more than 3
percent to 8 percent which was higher than of Sitapur district. The variation in data
relating to professional qualification of teachers in Moradabad ranged for 1 percent to 4
percent.
The educational qualification of Shiksha Mitra’s ranged from high school to PG
level in both districts. The variation in Survey and DISE data on their education
qualification ranged 1.5 percent to less than 4 percent in both districts (Table 2.20). But in
absolute number, such variation is nominal.
Table-2.20 Highest Qualification of Shiksha Mitra: Primary Schools Educational Qualification Professional Qualification Total
Dis
trict
Particular UPS H.S. Inter
mediate Gradat
ion Post
Gradua tion
M. phl./ Ph.D
BTC OR
Equivalent
LT, B.Ed OR
equivalent M.Ed OR equivalent
Non-Trained
Survey 1 3 20 76 48 7 8 15 5 127 155 DISE 1 3 20 75 49 7 8 16 5 126 155
Sita
pur
Variation - - - -1 (0.33)
1(2.04) - - 1(6.25) - -1(0.79) -
Survey - - 67 98 29 2 40 30 2 124 196 DISE - - 67 99 28 2 40 29 2 125 196
Mor
adab
ad
Variation - - - 1(1.01) -1 (3.57)
- - -1(3.44)
- 1(0.80) -
Source: Field Survey and DISE data. 2.13 Qualification of Head and Assistant Teachers in Upper Primary Schools:
The head teachers with graduate and post graduate qualifications were in majority in
both the district. Around 15 per cent of them have no professional qualification in Sitapur
district. In Moradabad district, all the head teachers were professionally qualified. As far
variations between the DISE and survey data is concerned, negative variation of 7 per cent
and positive variation of 5 per cent is evident in Sitapur district in intermediate and

22
graduate qualifications of head teachers. In Moradabad district, percentage variation
ranged between 4 to 11 in intermediate and post graduate qualifications. No variation was
evident in professional qualifications of head teachers in Moradabad district (Table 2.21).
Table-2.21 Highest Qualification of Head / In Charge Teachers: Upper Primary Schools
Educational Qualification Professional Qualification
Dis
trict
Particular
UPS H.S.
Inter mediate
Graduat ion
Post Gradua
tion
M. phl./ Ph.D
BTC OR
equivalent
LT, B.Ed OR
equivalent
M.Ed OR Equivalent
Non-Train
ed
Total
Survey - 5 16 20 21 - 40 13 - 9 62 DISE - 5 15 21 21 - 40 13 - 9 62
Sita
pur
Variation - - -1 (6.66)
1(4.76) - - - - - - -
Survey - 5 8 15 28 - 24 29 3 - 56 DISE - 5 9 15 27 - 24 29 3 - 56
Mor
adab
ad
Variation - - 1 (11.11)
- -1 (3.70)
- - - - - -
Source: Field Survey and DISE data The educational and professional qualifications of assistant teachers of upper
primary schools presented in Table-2.22 showed about 49 percent of them are graduate
and 20 per cent are post graduate in Sitapur district. 23 Per cent of all assistant teachers
have no professional qualification in the district. In Moradabad district, 43 per cent
assistant teachers are graduate and 39 per cent are post graduate. Around 16 per cent of
them are untrained in the district. In both the district, variations in educational and
professional qualifications on the basis of DISE and survey data are nominal up to 2 per
cent only.
Table-2.22 Highest Qualification of Assistant Teachers: Upper Primary Schools
Educational Qualification Professional Qualification
Dist
rict
Particular
UPS H.S. Inter mediate
Gradat ion
Post Gradua
Tion
M. phl./ Ph.D
BTC OR
equivalent
LT, B.Ed OR
equivalent
M.Ed OR Equivalen
t
Non-Trained
Total
Survey 3 - 53 90 37 4 84 58 2 43 187 DISE 3 - 52 91 37 4 83 59 2 43 187
Sita
pur
Variation - - -1 (1.92)
1 (1.09)
- - -1 (1.20) 1 (1.69) - - -
Survey - 4 17 52 45 1 56 39 5 19 119 DISE - 4 17 51 46 1 55 40 5 19 119
Mor
adab
ad
Variation - - - -1 (1.96)
1( 2.17)
- -1 (1.81) 1 (1.25) - - -
Source: Field Survey and DISE data

23
2.14 Teachers Training:
Head teachers of primary schools are reported to have received in-service training
from 7 to 10 days in the sample schools of Sitapur district. In Moradabad district such
days were 2 to 9. The BRC has been the main venue of training. The variation between
survey and DISE data ranged from 10 per cent in Sitapur district to 50 percent in
Moradabad district. Though variation in absolute number was negligible. The head
teachers were reported to be engaged in non-academic work for about 15 days in Sitapur
district and 19 days in Moradabad district. The variation was nominal between the survey
and DISE data (Table-2.23).
Table-2.23 Average Days of in-Service Trainings Received by Head/In charge Teachers in Last Academic Year: Primary Schools
Venue / Average No. of days District Particular BRC DIET N.P.R.C. Other Average No. of days
Spent in Non Academic Work
Survey 11 7 9 3 14 DISE 10 7 9 3 15
Sitapur
Variation -1(10.0) - - - 1(6.66) Survey 9 3 - - 18 DISE 9 2 - - 19
Moradabad
Variation - -1(50.00) - - 1(5.27) Source: Field Survey and DISE data The average number of Days of in-service trainings for assistant teachers in
primary schools ranged from 3 to 5 days in Sitapur district during last academic year. No
variation was evident. In Moradabad district, such days were 3 to 8 and here also no
variation was found. The average number of days spent by the assistant teachers was 8 in
Sitapur district and 16 in Moradabad district as per DISE data. When compared with the
survey data, variation was nominal.
Table-2.24 Average Days of in-Service Trainings Received by Assistant Teachers in
Last Academic Year: Primary Schools
Venue / Average No. of days District Particular BRC DIET N.P.R.C Other No. of days Spent in Non
Academic Work Survey 5 3 3 3 9 DISE 5 3 3 3 8
Sitapur
Variation - - - - -1(12.50) Survey 8 - - 3 15 DISE 8 - - 3 16
Moradabad
Variation - - - - 1(6.25) Source: Field Survey and DISE data

24
As far in-service training of Shiksha Mitras is concerned, training was imparted to
them from 4 to 9 days in Sitapur district and from 3 to 5 days in Moradabad district.
There was no variation in this data from our survey data in both the districts (Table 2.25).
Table-2.25 Average Days in Service Trainings Received by Shiksha Mitras in Last Academic Year: Primary Schools
Venue / Average No. of days District Particular BRC DIET N.P.R.C. Other No. of days Spent in Non
Academic Work Survey 8 5 4 6 9 DISE 8 5 4 6 10
Sitapur
Variation - - - - 1(10.00) Survey 5 3 - - 15 DISE 5 3 - - 16
Moradabad
Variation - - - - 1(6.25) Source: Field Survey and DISE data Data for in-service training of head teachers at upper primary level which was
given to them for 3 to 8 days during the last academic year showed no variation in Sitapur
district as well as Moradabad district (Table-2.26). A higher number of days were found to
spend by the head teachers in Moradabad district as compared to Sitapur district for non
academic activities (16 days versus 13 days).
Table-2.26 Average Days of in-Service Trainings Received by Head/Teachers in
Last Academic Year: Upper Primary Schools
Venue / Average No. of days District Particular BRC DIET N.P.R.C. Other No. of days Spent in Non
Academic Work Survey 8 4 3 6 13 DISE 8 4 3 6 13
Sitapur
Variation - - - - - Survey 10 1 - - 16 DISE 10 1 - - 16
Moradabad
Variation - - - - - Source: Field Survey and DISE data
The average days of in-service trainings for assistant teachers at upper primary
schools was imparted at BRC, DIET and NPRC in Sitapur district and at BRC and DIET
in Moradabad district. It ranged from 5 to 7 days in Sitapur district and 4 to 9 days in
Moradabad district. The involvement of assistant teachers in non-academic work was of 9
days in Sitapur district and of 13 days in Moradabad district (Table-2.27). No variation
was found between DISE and survey data in this regard.

25
Table-2.27 Average Days of in-Service Trainings Received by Assistant Teachers
Last Academic Year: Upper Primary Schools
Venue / Average No. of days District Particular BRC DIET N.P.R.C. Other No. of days Spent in
Non Academic Work Survey 7 7 5 5 9 DISE 7 7 5 5 9
Sitapur
Variation - - - - Survey 9 4 - - 13 DISE 9 4 - - 13
Moradabad
Variation - - - - - Source: Field Survey and DISE data
2.15 Education of Teachers in main Subjects:
In the primary schools of Moradabad district, 72 per cent of head teachers have
education in the main subject of Mathematics, 54 per cent in English and 85 per cent in
Science. But most of them were having only high school level of education in these main
subjects. No variation was evident between the survey and the DISE data (Table 2.28).
Table-2.28 Education of Head Teachers in Main Subjects in Primary Schools of
District Moradabad
Subjects
Particular
UPS High School
Intermediate Graduation Post Graduation
Survey 20 64 15 2 -
DISE 19 64 15 2 - Math
Variation - - - - -
Survey 11 36 10 10 6
DISE 11 36 10 10 6 English
Variation - - - - -
Survey 5 70 9 9 8
DISE 5 70 9 9 8 Science Variation - - - - -
Source: Field Survey and DISE data
The majority of assistant teachers in primary schools of Moradabad district have
high school qualification in the mathematics which was their main subject. It was the
same case in science subject while in English as a main subject, majority of primary
school teachers has intermediate qualification (Table 2.29).

26
Table-2.29 Education of Assistant Teachers in Primary Schools of District
Moradabad Subjects
Particular UPS High
School Intermediate Graduation Post
Graduation Survey 56 193 38 23 5 DISE 56 193 38 23 5
Math
Variation - - - - - Survey 19 92 148 48 8
DISE 19 92 148 48 8 English
Variation - - - - Survey 11 258 13 24 9
DISE 11 258 13 24 9 Science Variation - - - - -
Source: Field Survey and DISE data.
In case of Shiksha Mitras, qualification in main subjects ranged from upper
primary school level up to post graduate level. But most of them have education up to
intermediate in main subjects of Mathematics, English and Science. There was no
variation between survey and DISE data in Moradabad district (Table-2.30).
Table-2.30 Education of Shiksha Mitras in Main Subjects in Primary Schools of
District Moradabad
Subjects Particular
UPS High School
Intermediate Graduation Post Graduation
Survey 60 115 16 5 - DISE 60 115 16 5 -
Math
Variation - - - - - Survey 13 76 90 11 6
DISE 13 76 90 11 6 English
Variation - - - - - Survey 11 144 16 22 3
DISE 11 144 16 22 3 Science Variation - - - - -
Source: Field Survey and DISE data
The data on the education of head teachers of upper primary schools of Moradabad
district is presented in Table-2.31. Most of them are up to intermediate in main subjects
and no variation was found in survey and DISE data in this regard.

27
Table-2.31 Education of Head/In Charge Teachers in Main Subjects in Upper
Primary Schools of District Moradabad
Subjects Particular
UPS High School
Intermediate Graduation Post Graduation
Survey 11 35 4 6 - DISE 11 35 4 6 -
Mathematic
Variation - - - - - Survey 8 18 18 7 -
DISE 8 19 18 7 - English
Variation - - - - - Survey 6 43 1 5 1 DISE 6 43 1 5 1 Science Variation - - - -
Source: Field Survey and DISE data
Table-2.32 Education of Assistant Teachers in Main Subjects of Upper Primary Schools in District Moradabad
Subjects Particular UPS High School
Intermediate Graduation Post Graduation
Survey 29 68 14 3 5 DISE 29 68 14 3 5
Mathematics
Variation - - - - - Survey 14 45 41 17 2 DISE 14 45 41 17 2
English
Variation - - - - - Survey 2 102 10 4 1 DISE 2 102 10 4 1 Science Variation - - - - -
Source: Field Survey and DISE data
The data relating to education of teachers in main subjects in Sitapur district has been
presented in Tables-2.33, 2.34, 2.35, 2.36 and 2.37. A perusal of these tables indicates that
there is no variation between the Survey and DISE data in all the categories of teaching in
primary and upper primary schools of Sitapur and Moradabad districts.
Table-2.33 Education of Head/In Charge Teachers in Main Subjects of Primary Schools of District Sitapur
Subjects Particular UPS High School Intermediate Graduation Post Graduation
Survey 24 62 13 8 6 DISE 24 62 13 8 6
Math
Variation - - - - - Survey 23 28 43 11 6 DISE 23 28 43 11 6
English
Variation - - - - - Survey 10 16 25 52 10 DISE 10 16 25 52 10 Science Variation - - - - -
Source: Field Survey and DISE data

28
Table-2.34 Education of Assistant Teachers in Main Subjects of Primary Schools of
District Sitapur
Subjects Particular
UPS High School
Intermediate Graduation Post Graduation
Survey 63 101 25 20 15
DISE 63 100 25 20 15 Math
Variation - -1 (0.99) - - -
Survey 49 62 70 32 11
DISE 49 62 70 32 11 English
Variation - - - - -
Survey 37 45 67 55 20
DISE 37 45 67 55 20 Science Variation - - - - -
Source: Field Survey and DISE data
Table-2.35 Education of Shiksha Mitras in Main Subjects of Primary Schools of District Sitapur
Subjects
Particular UPS High
School Intermediate Graduation Post
Graduation Survey 66 67 14 8 - DISE 66 67 14- 8 -
Math
Variation - - - - - Survey 60 35 37 20 3 DISE 60 35 37 20 3
English
Variation - - - - - Survey 12 66 25 33 19
DISE 12 66 25 33 19 Science Variation 66 67 14 8 -
Source: Field Survey and DISE data
Table-2.36 Education of Head/In Charge Teachers in Main Subjects of Upper Primary Schools of District Sitapur
Subjects
Particular UPS High
School Intermediate Graduation Post
Graduation Survey 4 35 21 1 1 DISE 4 35 21 1 1
Math
Variation - - - -
Survey 4 29 21 7 1 DISE 4 29 21 7 1
English
Variation - - - - -
Survey 15 13 21 7 4 DISE 15 13 21 7 4 Science Variation - - - - -
Source: Field Survey and DISE data

29
Table-2.37 Education of Assistant Teachers in Main Subjects of Upper Primary
Schools of District Sitapur
Subjects Particular
UPS High School
Intermediate Graduation Post Graduation
Survey 45 80 42 20 -
DISE 45 80 42 20 - Math
Variation - - - - -
Survey 31 50 84 21 1
DISE 31 50 84 21 1 English
Variation - - - - -
Survey 43 36 52 54 2 DISE 43 36 52 54 2 Science Variation - - - - -
Source: Field Survey and DISE data 2.16 Inspection of Schools: Several officers and other make continuous inspection of the schools as evident
from Table-2.42. It is evident that maximum number of times village pradhans/sabhasads
went to schools for the inspection. It seems that the official inspection was also very
recurrent. No variation between the survey data and DISE data was evident in case of
number of inspections made by different persons.
Table 2.38 Inspection of Schools in Last Academic Year
Number of Visits Sitapur District Moradabad District
Inspections
Survey DISE Variation Survey DISE Variation
Autonomous Agencies 14 14 - 15 15 -
District Co-ordinators 27 27 - 29 29 -
Pradhan/Sabhasad 210 210 - 240 240 - Resource teacher for CWSN
75 75 - 80 80 -
Block Resource co-ordinators (BRC)
145 145 - 151 151 -
NPRCs 191 191 - 200 200 - DIET Officials 46 46 - 42 42 - Basic Shiksha Adhikars (BSA)
60 60 - 65 65 -
Assistant Basic Shiksha Adhikars (ABSA)
162 162 - 170 170 -

30
2.17 Schools Covered under NPEGEL:
The National Programme for Education of Girls at Elementary Level (NPEGEL)
has been run only in 6 per cent schools in Sitapur district and in 3 per cent schools in
Moradabad district. The facilities available are mainly the Meena Munch, jhoola, Meena
classes and bicycles. No variation between the survey and DISE data is evident here
(Table 2.43).
Table 2.39 Schools Covered under NPEGEL Program
Facilities Available Meena Munch
Meena Radio
Swing (jhoola)
Bicycles Meena classroom
District Particulars
Yes No
Yes No Yes No Yes No Yes No Yes No Survey 12 198 13 - 1 12 12 1 11 2 13 -
DISE 12 198 13 - 1 12 12 1 11 2 13 -
Sitapur
Variation - - - - - - - - - - - -
Survey 6 214 5 - 1 12 4 1 5 - 5 -
DISE 6 214 5 - 1 12 4 1 5 - 5 -
Moradabad
Variation - - - - - - - - - - - -
2.18 Right to Education and Trainings:
During the last academic year, average 225 and 216 days primary and upper
primary schools remained open in Sitapur district respectively. The timings of the schools
were 7 AM to 12 Noon and 10 AM to 4 PM in case of primary as well as upper primary
schools. No variation between the survey and DISE data was found in primary and upper
primary schools relating to these variables. In Moradabad district, the primary schools
remained opened for 222 days and upper primary schools remained opened for 216 days.
The school timings in primary and upper primary schools were the same as has been
noticed in Sitapur district (Tables-2.40 & 2.41).

31
Table 2.40 Right to Education and Detail of Trainings in District Sitapur
Primary level Upper Primary level Duration of Teaching Survey DISE Variation Survey DISE Variation Average number of Academic days during last year
225 225 - 216 216 -
School Timing for students (daily)
(7:00-12:00) P.M./(10:00-4:00) P.M.
(7:00-12:00) P.M./(10:00-4:00) P.M.
- (7:00-12:00) P.M./(10:00-4:00) P.M.
(7:00-12:00) P.M./(10:00-4:00) P.M.
-
Table 2.41 Right to Education and Detail of Training in District Moradabad Primary level Upper Primary level Duration of
Teaching Survey DISE Variation Survey DISE Variation
Average number of Academic days during last year
222 222 - 219 219 -
School Timing for students (daily)
(7:00-12:00) P.M./(10:00-4:00) P.M.
(7:00-12:00) P.M./(10:00-4:00) P.M.
- (7:00-12:00) P.M./(10:00-4:00) P.M.
(7:00-12:00) P.M./(10:00-4:00) P.M.
-
2.19 Implementation of CCE:
It is evident from Table 2.42 that continuous and comprehensive Evaluation
Method (CCE) has been implemented in all the primary and upper primary schools in
Sitapur and Moradabad districts. No variation in survey and DISE data is also evident.
Table 2.42 Continuous and comprehensive Evaluation (CCE) Method Implemented in the Schools
Primary Schools Upper Primary Schools District Particulars Yes No Yes No Survey 151 - 59 - DISE 151 - 59 -
Sitapur
Variation - - - - Survey 148 - 72 - DISE 148 - 72 -
Moradabad
Variation - - - - 2.20 Utilization of Grants in Primary Schools:
Head wise utilization of grants for primary and upper primary sample schools of
Moradabad and Sitapur districts during the year 2008-09 is presented inTable-2.38 to
Table-2.41. There is no variation in the figures of grant received and its expenditure in

32
either of school categories in both the districts. The received amount is found to be fully
utilized.
Table 2.43 Utilization of Grants in Primary Schools of Moradabad District: 2009-10
Survey DISE Variation Survey DISE Variation Items Received Expenditure
School maintenance aid Average per school
480250 5220.00
480250 5220.00
- 480250 5220.00
480250 5220.00
-
School development Average per School
574000 6239.13
574000 6239.13
- 574000 6239.13
574000 6239.13
-
TLM Average per School
139500 1516.30
139500 1516.30
- 139500 1516.30
139500 1516.30
-
Payment of Shikshamitra Average per School
4165214 45,274
4165214 45,274
- 4165214 45,274
4165214 45,274
-
Uniform Average per School
318420 3461.08
318420 3461.08
- 318420 3461.08
318420 3461.08
-
N.P.E.G.E.L.(other than uniform) Average per School
- - - - - -
Construction of School Building Average per School
- - - - - -
Construction of Extra Class Rooms Average per School
21,00,900
140060
21,00,900
140060
- 21,00,900
140060
21,00,900
140060
-
Installation of Hand pumps Average per School
- - - - - -
Construction of Toilets Average per School
4,40,000 44,000
4,40,000 44,000
- 4,40,000 44,000
4,40,000 44,000
-
Construction of Boundary wall Average per School
14,,30,000 1,30,000
14,,30,000 1,30,000
- 14,,30,000 1,30,000
14,,30,000 1,30,000
-
Construction of Ramp Average per School
- - - - - -
For special Training Average per School
- - - - - -
Fund of Collection through students Average per School
439500
2970
439500
2970
- 439500
2970
439500
2970
-
Other sources Average per School
20,980 142
20,980 142
- 20,980 142
20,980 142
-
Total
10108764 12764
10108764 12764
- 10108764 12764
10108764 12764
-
Source: Field Survey and DISE data

33
Table 2.44 Utilization of Grants in Upper Primary Schools of Moradabad District: 2008-09
Survey DISE Variation Survey DISE Variation
Items Received Expenditure
School maintenance aid Average per school
2,76,500 6744.00
2,76,500 6744.00
- 2,76,500 6744.00
2,76,500 6744.00
-
School development Average per School
2,53,000 6325.00
2,53,000 6325.00
- 2,52,800 6320.00
2,52,800 6320.00
-
TLM Average per School
38,000 1085.77
38,000 1085.77
- 38,000 1085.77
38,000 1085.77
-
Uniform Average per School
5,3100 2655.00
5,3100 2655.00
- 5,3100 2655.00
5,3100 2655.00
-
N.P.E.G.E.L (Other than uniform) Average per School
1,03,00 5150.00
1,03,00 5150.00
- 1,03,00 5150.00
1,03,00 5150.00
-
Construction of School Building Average per School
- - - - - -
Construction of Extra Class Rooms Average per School
9,82,000
1,40,285
9,82,000
1,40,285
- 9,82,000
1,40,285
9,82,000
1,40,285
-
Intallation of Handpumps Average per School
- - - - - -
Construction of Toilets Average per School
2,60,000 52,000
2,60,000 52,000
- 2,60,000 52,000
2,60,000 52,000
-
Construction of Boundary Wall Average per School
1,65,880
41,470
1,65,880
41,470
- 1,65,880
41,470
1,65,880
41,470
-
Construction of Ramp Average per School
- - - - - -
For special Training Average per School
- - - - - -
Fund of Collection through students Average per School
317730
4413
317730
4413
- 317730
4413
317730
4413
-
Other sources Average per School
12,880 179
12,880 179
- 12,880 179
12,880 179
-
Total
2321600 8291
2321600 8291
- 2321600 8291
2321600 8291
-
Source: Field Survey and DISE data

34
Table 2.45 Utilization of Grants in Primary Schools of Sitapur District: 2008-09
Survey DISE Variation Survey DISE Variation Items
Received Expenditure
School maintenance aid Average per school
702109 5572.29
702109 5572.29
- 700609 5560.38
700609 5560.38
-
School development Average per School
802050 6365.48
802050 6365.48
- 800050 6439.60
800050 6439.60
-
TLM Average per School
175000 1422.76
175000 1422.76
- 175000 1422.76
175000 1422.76
-
Uniform Average per School
477622 8379.33
477622 8379.33
- 428537 7518.19
428537 7518.19
Honorium for shikshamitra Average per School
4486015 62305.764
4486015 62305.764
- 4486015 62305.764
4486015 62305.764
-
N.P.E.G.E.L.(other than uniform) Average per School
- - - - - -
Construction of School Building Average per School
- - - - - -
Construction of Extra Class Rooms Average per School
15,40,000
1,40,000
15,40,000
1,40,000
- 15,40,000
1,40,000
15,40,000
1,40,000
-
Intallation of Handpumps Average per School
- - - - - -
Construction of Toilets Average per School
3,00,000 50,000
3,00,000 50,000
- 3,00,000 50,000
3,00,000 50,000
-
Construction of Boundary wall Average per School
10,80,000 154428.57
10,80,000 154428.57
- 10,80,000 154428.57
10,80,000 154428.57
-
Construction of Ramp Average per School
- - - - - -
For Special Training Average per School
- - - - - -
Fund of Collection through Students Average per School
195840 1297
195840 1297
- 195840 1297
195840 1297
-
Other sources Average per School
20,790 162
20,790 162
- 20,790 162
20,790 162
-
Total
9779426 14173
9779426 14173
- 9779426 14173
9779426 14173
-
Source: Field Survey and DISE data

35
Table 2.46 Utilization of Grants in Upper Primary Schools of Sitapur District: 2008-09
Survey DISE Variation Survey DISE Variation
Items Received Expenditure
School maintenance aid Average per school
258000 6450
258000 6450
- 254100 6352.50
254100 6352.50
-
School development Average per School
288060 7201.50
288060 7201.50
- 288060 7201.50
288060 7201.50
-
TLM Average per School
40000 1142.86
40000 1142.86
- 39000 1142.29
39000 1142.29
-
Uniform Average per School
73295 6107.92
73295 6107.92
- 72305 6025.42
72305 6025.42
-
N.P.E.G.E.L.(other than uniform) Average per School
1200 1200 - 1200 1200 -
Construction of School Building Average per School
- - - - - -
Construction of Extra Class Rooms Average per School
5,60,000
1,40,000
5,60,000
1,40,000
- 5,60,000
1,40,000
5,60,000
1,40,000
-
Installation of Hand pumps Average per School
- - - - - -
Construction of Toilets Average per School
2,25,000 50,000
2,25,000 50,000
- 2,25,000 50,000
2,25,000 50,000
-
Construction of Boundary wall Average per School
6,00,000
1,50,000
6,00,000
1,50,000
- 6,00,000
1,50,000
6,00,000
1,50,000
-
Construction of Ramp Average per School
- - - - - -
For Special Training Average per School
- - - - - -
Fund Collection through Students Average per School
179450
3042
179450
3042
- 179450
3042
179450
3042
-
Other Sources Average per School
13,000 181
13,000 181
- 13,000 181
13,000 181
-
Total 22,38,005 8674
22,38,005 8674
- 22,38,005 8674
22,38,005 8674
-
Source: Field Survey and DISE data.

36
CHAPTER- III
STATUS AND UTLIZATION OF INFRASTRUCTURAL FACILITIES IN SAMPLE SCHOOLS OF SITAPUR AND
MORADABAD DISTRICTS
This chapter examines the availability and utilization of important infrastructural
facilities in two sample districts of Sitapur and Moradabad in comparative framework
between the DISE data and the data collected through our filed survey. The key facilities
examined here are the electricity, toilet, furniture, drinking water, black board, library,
computer, health care facilities and mid-day meal.
3.1 Availability of Electricity, Toilet and Boundary Walls:
The DISE data has reported that the facility of electricity was available in 76 schools in
Sitapur district while it was revealed through our survey that this facility was available in
77 schools in the district. Thus, there was under reporting to the extent of 1.32 per cent. In
case of Moradabad district also, the DISE data showed that the electricity was available in
92 schools while our survey found it in 91 schools, showing a variation of 1.10 per cent. In
case of availability of toilets in schools, it was found that DISE data reported its
availability in 195 schools in Sitapur district and 196 schools in Moradabad district while
the survey showed that the toilets were available in 197 schools in Sitapur district and 195
schools in Moradabad district, showing a negligible gap between DISE data and our
survey data. The DISE data showed the availability of toilets exclusively for the girls in
199 schools in Sitapur district and in 212 schools in Moradabad district but the survey
found that it in 197 schools in Sitapur district and in 214 schools in Moradabad district,
showing under reporting to the extent of 1.01 per cent in Sitapur district and 0.94 per cent
in Moradabad district. No variation between the DISE data and survey data in case of
condition of boundary wall was found both the districts. On the whole, major variations
are not evident between the DISE data and survey data in case of availability of electricity,
toilets and boundary walls in both the sample districts of Sitapur and Moradabad as
evident from following Table-3.1.

37
Table -3.1: Electricity, Toilet and Condition of Boundary Wall in
Sample Schools
Electricity Facility Toilet for boys Toilet for girls Condition of Boundary wall
District
Particular Yes No Yes No Yes No PuccaPucca
but broken
Barbed wire
facing Hedges
No Boundary
wall
Total
Sample
Survey 77 133 197 13 199 11 66 16 - 1 127 210 DISE 76 134 195 15 197 13 66 16 - 1 127 210
Sitapur Variation -1 (1.32)
1 (0.74)
-2 (1.02)
2 (13.33)
-2 (1.01)
2 (15.38) - - - - -
Survey 92 128 195 25 214 6 113 23 - - 85 220 DISE 91 129 196 24 212 8 113 23 - - 85 220 Moradabad
Variation -1 (1.10)
1 (0.78)
1 (0.51)
-1 (4.17)
-2 (0.94)
2 (25.00) - - - - - -
Source: - DISE Data and field survey. 3.2 Use of Electricity and Toilets in Sample Schools It is evident from Table 3.2 that the use of electricity, toilets by the boys, girls and staff
is quite low in both the sample districts. There is variation also in the use of these
facilities across the districts. The survey result showed that only 18 per cent of all schools
use electricity in Sitapur district while such schools are 31 per cent in Moradabad district.
In case of toilets of boys, 56 per cent schools reported its use in Sitapur district while 70
per cent schools were found to be using it in Moradabad district. The use of toilets by the
girls was found in 39 per cent in Sitapur district as against 19 per cent in Moradabad
district. Thus, the survey has shown that the use of electricity and toilets is very limited
which needs to be increased in view of the substantial investment made on these items
under the Sarva Shiksha Abhiyan in the state.
Table 3.2: Use of Electricity and Toilets in Sample Schools
Use of Electricity Facility Use of Toilet for boys Use of Toilet for girls
District
Particular Yes No Yes No Yes No
Sitapur Survey 37 (17.62)
173 (82.38)
117 (55.71)
93 (44.29)
128 (60.95)
82 (39.05)
Moradabad Survey 68 (30.91)
152 (69.09)
154 (70.00)
66 (30.00)
178 (80.91)
42 (19.09)
Source: - DISE Data and field survey.

38
3.3 Availability of Furniture, Drinking Water and Almirahs: In case of availability of furniture for teachers and students, drinking water and
almirahs in the schools, no noticeable variation is evident between the DISE data and
survey data in the both the districts as revealed through the following Table 3.3. The
availability of furniture for teachers was reported in 208 schools in DISE data while it was
found in 209 schools through our survey in Sitapur district. In Moradabad district,
availability of furniture was found in 21 schools in DISE data versus 217 schools through
our survey in Moradabad district. No variation in the availability of furniture for students
and drinking water was evident between the survey and DISE data in Sitapur as well as in
Moradabad district.
Table 3.3: Availability of Furniture for Teachers and Students and Drinking Water in the Schools
Furniture for
Teachers Furniture for Students Drinking Water District Particular Yes No Yes No Yes No
Survey 209 2 159 51 197 13 DISE 208 2 159 51 197 13
Sitapur Variation -1 (0.48) - - - - - Survey 217 5 178 42 42 10 DISE 215 5 178 42 42 10
Moradabad Variation -2 (0.93) - - - - - Source: - DISE Data and field survey
3.4 Use of Furniture for Teachers and Students and Drinking Water:
It is evident from the following Table 3.4 that that the use of furniture for teachers,
drinking water facility and almirahs has been found in substantial number of schools while
the use of furniture by students was found in 74 per cent of schools in Sitapur district and
81 per cent schools in Moradabad district. Therefore, furniture needs to be provided in
more schools for the use of students in both the districts. The drinking water is also needed
to be provided in all the schools.
Table 3.4: Use of Furniture for Teachers and Students and Drinking Water
Furniture for Teachers
Furniture for All Students Drinking Water Facility District Particular
Yes No Yes No Yes No Sitapur Survey 206
(98.10) 4
(1.90) 156
(74.29) 54
(25.71) 183
(87.14) 27
(18.86) Moradabad Survey 217
(98.64) 3
(1.36) 179
(81.36) 41
(18.64) 205
(93.18) 15
(6.82) Source: - DISE Data and field survey

39
3.5 Availability of Black Board, Computer, Library and Play Ground: No variation was found between the survey data and DISE data in case of availability
of black board and computers in the schools of both the districts. Negligible difference
was evident in the availability of library in the schools of Sitapur and Moradabad districts
as reported in DISE and survey data. The variation in the availability of play ground as
reported in DISE and survey data was evident in both the districts. It was marginal over
reporting in both the districts as reflects from the Table 3.5.
Table 3.5: Availability of Black Board, Computer, Library and Play Ground
Black Boards Computer Library Play Ground
District
Particular Yes No Yes No Yes No Yes No Survey 210 - 10 200 113 97 141 69 DISE 210 - 10 200 112 98 143 67
Sitapur Variation - - - - -1 (0.89) 1 (1.02) 2 (1.40) -2 (2.98)
Survey 220 - 3 217 113 107 149 71 DISE 220 - 3 217 112 108 150 70
MoradabadVariation - - - - -1 (0.89) 1 (0.93) 1 (0.67) -1
(1.43) Source: - DISE Data and field survey 3.6 Use of Black Board, Computer, Library and Play Ground: The use of facilities of black board, computer, library and play ground has been in the
schools of Sitapur and Moradabad districts which has been presented in Table 3.6. The
black board is used in all the schools in Sitapur district while it was being used in 95 per
cent of schools in Moradabad district. The non use of black boards was observed to be in
private schools. The computer was used in 90 per cent of schools in Sitapur district while
it was used in all schools where it was available in Moradabad district. The use of library
was found in 95 per cent of schools in Sitapur district while its use was reported in 88 per
cent of schools in Moradabad district where the libraries were available.
3.6: Status of Use of Black Board, Computer, Library and Play Ground
Black Boards Computer Library Play Ground District Particular Yes No Yes No Yes No Yes No
Sitapur Survey 210 - 9 201 106 104 144 66
Moradabad Survey 210 - 3 217 98 122 143 77 Source: - DISE Data and field survey.

40
3.7 Status of Health Facilities for Students and coverage under NPEGEL, Ramp and TLM: The DISE data has reported that health facilities were available in 52 schools while
the survey has found that health facilities were available in 54 schools in Sitapur district.
The health facilities was reported to be available in 12 schools covered under the
NPEGEL in Sitapur district while our survey has found it in 13 schools. The ramps and
TLM have been reported in 148 and 160 schools in Sitapur district under the DISE our
survey has found these in 147 and 158 schools in the district. In Moradabad district, the
DISE reported the availability of health facilities in 31 schools as against 32 schools
found in our survey. Similarly the schools covered under NPEGEL were reported to be 4
in DISE in Moradabad district as against 5 found in our survey. There was marginal over
reporting in case of ramps and under reporting of TLM in DISE data as against our survey
results. What transpires from table 3.7 is the fact that all these facilities are largely lacking
excluding ramps and TLM in majority of schools which need to be increased.
Table 3.7: Status of Health Facilities for Students and covered under NPEGEL,
Ramp and TLM
Health FacilitiesCovered under NPEGEL Ramps TLM District Particular
Yes No Yes No Yes No Yes No Survey 54 156 13 197 147 63 158 52 DISE 52 158 12 198 148 62 160 50
Sitapur Variation -2
(3.84) 2 (1.26) -1 (8.33) 1 (1.02) 1 (0.67)
-1 (1.61)
-2 (1.25) 2 (4.00)
Survey 32 188 5 215 122 98 125 95 DISE 31 189 4 216 124 96 123 97
MoradabadVariation -1
(3.23) 1 -1(25.00) 1 (0.46) 2 (1.61)
-2 (2.08)
-2 (1.63) 2 (2.06)
Source: - DISE Data and field survey 3.8 Status of Mid-Day Meal (MDM) in the Schools: The Mid-day Meal was reported to be available in 139 schools of Sitapur district as per
DISE data. The survey result indicated that the MDM was available in 140 schools in
Sitapur district. While in Moradabad district, DISE reported the availability of MDM in
106 schools while through the survey it was found in 105 schools. The MDM facility was
available but the food was not cooked in school premise in 22 schools in Sitapur district
and in 19 schools in Moradabad district as per DISE as well as survey data. Thus,

41
variation between the two data sets was of 5 to 6 per cent in both the districts in the
schools where such facility was not available. A nominal variation between the survey and
DISE data was evident in case of schools where MDM facility was available and the food
was cooked in school premises (Table-3.8).
Table 3.8: Status of Mid- Day Meal (MDM) Facility in the Schools
District Particular No Facility Facility available & Cooked in School
Premise
Facility available but not Cooked in School
Premise Survey 20 140 22 DISE 21 139 22
Sitapur Variation 1 (4.76) -1 (0.71) - Survey 18 105 19 DISE 17 106 19
Moradabad Variation -1 (5.88) 1 (0.94) - Source: - DISE Data and field survey 3.9 Status of Kitchen Sheds in the Schools: There was under reporting of availability of kitchen sheds in the schools in DISE data
in Sitapur as well as in Moradabad district as evident from the following Table 3.9. There
was marginal over reporting in case of not availability kitchen sheds in both the district.
Table 3.9: Status of Kitchen Sheds in the Schools
District Particular Available Not Available Under Construction
Class room used as Kitchen
Survey 148 32 - - DISE 146 34 - -
Sitapur Variation -2 (1.36) 2 (5.88) - - Survey 108 23 - - DISE 106 24 - -
Moradabad Variation -2 (1.89) 1 (4.17) - - Source: - DISE Data and field survey 3.10 Status of Kitchen Sheds in the Schools: The arrangement to provide MDM by the school cooks was reported in case of 136
schools in Sitapur district in DISE data and 137 in survey data. Similarly in 107 schools
were reported the availability of food by school cook in DISE data and 109 in survey data.
The variation was in the range of less than one per cent to around 2 per cent in both the
districts. There was no difference in the data of NGOs providing food in Sitapur and
Moradabad districts (Table-3.10).

42
Table 3.10: Arrangement of Food Availability under MDM in the Schools
District Particular By the School Cook N.G.O. S.H.G. Parents Teachers
Association Survey 137 27 1 7 DISE 136 27 1 7
Sitapur Variation -1 (0.74) 1 (3.7) - - Survey 109 16 - 4 DISE 107 16 - 4
Moradabad Variation -2 (1.87) - - - Source: - DISE Data and field survey 3.11 One Time Grant for Purchase of Utensils under MDM: The one time grant is provided to schools for purchase of utensils for mid-day
meal. The DISE data has reported that such grant was given to 166 schools in Sitapur
district and our survey has found that the same number of schools received this grant in
the district. In case of Moradabad district, DISE data has shown that 121 schools did
receive one time grant and the survey has also shown 121 received the grant in Moradabad
district as the following Table 3.11 shows.
Table 3.11: One Time Grant for Purchase of Utensils under MDM
Grants Provided
District
Particular Yes No Survey 166 44 DISE 166 44 Sitapur
Variation - - Survey 121 99 DISE 121 99
Moradabad Variation - - Source: - DISE Data and field survey
Summarizing the above, it can be concluded that no major variations were found
between the DISE data and our survey data as far the status of different infrastructural
facilities in the schools of two sample districts of Sitapur and Moradabad are concerned.

43
CHAPTER- IV
ENROLLMENT, ATTENDENCE AND EXAMINATION OF CHILDREN IN SAMPLE SCHOOLS OF SITAPUR AND
MORADABAD DISTRICTS
The variation between DISE data and the data collected through our survey in regard
to enrollment of children of different social groups, their attendance in the schools and
achievements in examination in primary and upper primary schools have been examined in
this chapter.
4.1 Enrollment in Primary Schools of Sitapur District (2009-10):
A nominal variation between DISE and survey data is noticed in Class-I. In this class,
there is over reporting in DISE data as compared to survey data in case of boys and under
reporting of enrolled girls. In class-II DISE data is under reported both in case of boys and
girls. While in class-III, enrollment number of boys and girls are more in DISE data as against
survey data. In class IV the number of boys is lower in survey data than DISE data while the
girls’ number are higher in survey data as compared to DISE data. In class-V, the number of
boys and girls both are found to be high in survey data as compared to the DISE data. The
variation between the survey and the DISE data ranged from a lowest of 0.04 per cent to a
maximum of 0.84 per cent under this category of enrolled children
While taking into consideration the enrollment of general category students, it is found
that boys have been over reported in DISE data as compared to survey data and the enrollment
of general category girls has been under reported in DISE data as compared to survey data of
class-I. In class-II, there is over reporting in the number of general category boys and girls in
survey data as compared to DISE data. An opposite trend is found in general category of class-
III. In class-IV the number of general category boys is found to be marginally under reported
and number of general category girls is found to be marginally over reported in DISE data as
compared to survey data. In class-V, an opposite trend is found.
In case of enrollment of SC children, there is little over reporting in case of boys and
girls in DISE data as compared to survey data in class-I. In class-II and class-III, we observed
an opposite trend. In class-IV the number of boys is lower in survey data than DISE data while
the girls’ number is higher in survey data as compared to DISE data. In class-V, the number of
boys is higher in survey data than DISE data while the girls’ numbers are lower in survey data
as compared to DISE data.

44
The number of enrollment of boys and girls in OBC children has been on the higher
side in survey data as compared to DISE data in case of girls and boys of class-I. The opposite
trend is found in case of girls and boys of class-II. Again in class-III, the number of boys and
girls turned out to be higher in survey data as against DISE data. In class-IV and class-V, the
number of boys and girls are found to be over reported in DISE data as compared to survey
data.
The enrollment of Muslim children as reported in DISE data is higher as compared to
survey data in case of boys and lower in case of girls in class-I. In class-II, the number of boys
and girls enrolled are found to be lower in DISE data as compared to survey data. The same
trend is found in class-III, class-IV and class-V as well.
In case of those children who are termed as repeaters, no variation is found to be
present between DISE data and survey data. However, repeaters girl students are reported only
in class-II. No children are found to be working.
Children who got transferred to other schools, their number showed little variation
between DISE and survey data. Table 4.1 presents the enrollment of children in the academic
year 2010-11 in Sitapur district.
Table 4.1: Children Enrolled in the Aademic Year 2010-11 in Primary Schools of Sitapur District
Class-1 Class-2 Class-3 Class-4 Class-5 Enrolment Boys Girls Boys Girls Boys Girls Boys Girls Boys Girls
Survey 2574 2293 2266 1903 2145 1878 2153 2007 2108 2041 DISE 2593 2274 2258 1902 2146 1885 2159 1994 2093 2037
Total Enrolment (a+b+c+d) Variation 19 (0.73) -19 (0.84)-8 (0.35) -1((0.05) 1 (0.047) 7 (0.37) 6 (0.28) -13 (0.65) -15 (0.72) -4 (0.196)
Survey 314 310 250 280 321 255 300 260 350 280 DISE 319 303 241 270 328 262 303 256 344 285
General (a)
Variation 5 (1.56) -7 (2.31)-9 (3.73)-10 (3.7)7 (2.13)7 (2.67)3 (0.99) -4 (1.56) -6 (1.74) 5 (1.75) Survey 851 791 768 723 629 601 752 742 776 751 DISE 860 790 770 728 630 609 755 735 770 745
SC Children Enrolled (b)
Variation -9 (1.05)-1 (0.13)2 (0.26) 5 (0.69)1 (0.158)8 (1.31)3 (0.40)-7 (0.96) -6 (0.78) 6 (0.81) Survey 1029 865 891 652 866 790 830 765 719 770 DISE 1021 861 897 659 863 783 836 768 721 775
OBC Children Enrolled (c) Variation -8 (0.78)-4 (0.46)6 (0.67)7 (1.06) -3 (0.35)-7 (0.90)6 (0.72)3 (0.39) 2 (0.28) 5 (0.65)
Survey 380 327 357 248 329 232 271 240 263 240 DISE 385 320 350 245 325 231 265 235 258 232
Muslim Children Enrolled (d) Variation 5 (1.30)-7(2.12)-7(2.00)-3(1.22)-4(1.23)-1(0.43)-6(2.26)-5(2.13) -5 (1.94) -8 (3.45)
Survey 2900 2982 492 451 350 320 150 160 220 212 DISE 2912 2985 490 455 345 316 144 158 212 215
Children Who Transfer to Other School Variation 8 (0.27)3 (0.10)-2(0.40)4 (0.87)-5 (1.44) -4( 1.26) -6 (4.16) -2( 1.26) -8 (3.77) 3 (1.39)
Survey - - - - - - - - - - DISE - - - - - - - - - -
Working Children
Variation - - - - - - - - - - Survey - - - 4 - - - - - - DISE - - - 4 - - - - - -
Repeaters
Variation - - - - - - - - - - Source: - DISE Data and field survey

45
4.2 Enrollment in Primary Classes of Moradabad District: 2010-11 The total enrollment in primary schools of Moradabad district from class I to
Class-V in respect of boys and girls has been shown marginally lower in DISE data as
compared to survey data. However, the pattern has changed among girls of class-I, boys
and girls of class-IV and boys of class V where DISE data has been over reported as
compared to survey data as presented in Table 4.2. A very low variation of .04 to .65 per
cent variation was recorded between the survey and the DISE data in the total enrollment
of the students.
In case of enrollment of general category children, there is under reporting of boys
in DISE data as compared to survey data in class-I. An opposite trend is found in case of
girls of class-I. In class-II, the number of boys and girls turned out to be higher in DISE
data as against survey data. An opposite trend is found in general category of class-III. In
class-IV, the number of boys is lower in survey data than DISE data while the girls’
number is higher in survey data as compared to DISE data. Finally, the number of general
category boys and girls of class-V is lower in survey data than DISE data. The variation
between the survey and the DISE data ranged from .23 per cent to a maximum of 1.29 per
cent.
While taking into consideration the enrollment of SC category students, it is found
that the enrollment of boys have been under reported in DISE data as compared to survey
data and the enrollment of SC category girls has been over reported in DISE data as
compared to survey data in class-I. In class-II, boys and girls of SC category are found to
be under reported in DISE data as compared to survey data. The number of boys of SC
category is found to be over reported in DISE data as compared to survey data and the
number of girls of SC category is found to be under reported in DISE data as compared to
survey data in class- III. In class-IV, the number of boys and girls turned out to be higher
in DISE data as against survey data. In class-V, the enrollment of boys is higher in DISE
data as compared to survey data and the number of girls’ is lower in DISE data as
compared to survey data. The enrollment of SC children in the district was found as
reported in DISE data similar to what we have found in through our survey. The variation
between the survey and the DISE data ranged from a lowest of .37 per cent to a maximum
of 1.42 per cent under this category of enrolled children.

46
In case of OBC category children, the enrollment of boys has been under reported
in DISE data as compared to survey data in class-I. An opposite trend is found in case of
girls of class-I. In class-II and class-III, there is under reporting in DISE data as compared
to survey data in the number of OBC boys and girls’. In class-IV, the number of boys is
turned out to be lower in DISE data as compared to survey data. Reverse case is observed
with girls of class-IV. However, in class-V, the number of boys and girls of OBC category
are reported in the higher side in DISE data as against the survey data. The variation
between the survey and the DISE data ranged from a lowest of 0.12 per cent to a
maximum of 1.65 per cent under this category of enrolled children. The data also revealed
that the number of the enrolled girls students has been comparatively lower than boys up
to class-II. The girls enrollment has been higher than boys in class III on wards.
A review of enrollment of Muslim boys and girls from class-I to class-V shows
that the DISE data has over reported their numbers than what has been found through the
survey. The variation between the survey and the DISE data ranged from 0.34 per cent to a
maximum of 1.55 per cent. The girls enrollment has been found to be marginally lower
than boys, except in class I, among Muslim children.
The reporting in case of children who were transferred to other schools showed a
little variation in DISE data as against the survey data. The number of boys and girls of
class-I and class-II are higher in DISE data as compared to survey data. A reverse trend is
found in boys and girls’ of class-III. In class-IV, the number of boys and girls are under
reported in DISE data as compared to survey data. In class-V, the number of boys is found
to be over reported in DISE data as compared to survey data while the number of girls’ is
found to be under reported in DISE data as compared to survey data. The variation
between the survey and the DISE data ranged from a lowest of 0.06 per cent to a
maximum of 2.71 per cent under this category of children who were transferred to other
schools.
The children falling in the category of repeaters were very low in number but
existed in all the classes (from I to V), the variation between DISE data and survey data
relating to repeaters children has been found to be nominal. Table 4.2 presents the
enrollment of children in the academic year 2010-11 in Moradabad district.

47
Table 4.2: Children Enrolled in the Academic Year 2010-11 in Primary Schools of Moradabad District
Class-1 Class-2 Class-3 Class-4 Class-5 Enrolment Boys Girls Boys Girls Boys Girls Boys Girls Boys Girls
Survey 5029 4610 4146 3827 3101 3370 2438 2871 2516 2408 DISE 5012 4622 4139 3823 3089 3352 2454 2876 2525 2407
Total Enrolment (a+b+c+d) Variation -17
(0.34) 12
(0.26) -7
(0.17) -4
(0.10) -12
(0.39) -18
(0.54) 16
(0.65) 5
(0.17) 9
(0.36) -1
(0.04) Survey 949 868 1119 899 849 747 700 608 560 519 DISE 940 870 1124 905 842 740 709 602 566 522
General (a)
Variation -9 (0.96)
2 (0.23)
5 (0.44)
6 (0.66)
-7 (0.83)
-7 (0.95)
9 (1.27)
-6 (0.99)
6 (1.06)
3 (0.57)
Survey 820 612 645 575 581 504 518 485 512 439 DISE 817 615 640 570 586 500 525 492 514 437
SC Children Enrolled (b)
Variation -3 (0.37)
3 (0.49)
-5 (0.78)
-5 (0.88)
5 (0.85)
-4 (0.8)
7 (1.33)
7 (1.42)
2 (0.39)
-2 (0.46)
Survey 1911 1677 1654 1523 1311 1317 493 1095 1003 1007 DISE 1900 1679 1650 1517 1300 1312 485 1100 1009 1015
OBC Children Enrolled (c)
Variation -11 (0.58)
2 (0.12)
-4 (0.24)
-6 (0.40)
-11 (0.85)
-5 (0.38)
-8 (1.65)
5 (0.45)
6 (0.59)
8 (0.79)
Survey 1349 1453 1100 1087 944 936 860 784 571 556 DISE 1355 1458 1104 1092 948 940 865 790 580 562
Muslim Children Enrolled (d)
Variation 6 (0.44)
5 (0.34)
4 (0.36)
5 (0.46)
4 (0.42)
4 (0.43)
5 (0.58)
6 (0.76)
9 (1.55)
6 (1.06)
Survey 3557 3273 592 434 368 324 183 179 272 224 DISE 3562 3275 595 440 363 320 186 184 275 220
Children Who Transfer to Other School
Variation 5 (0.14)
2 (0.06)
3 (0.50)
6 (1.36)
-5 (1.37)
-4 (1.25)
3 (1.61)
5 (2.71)
3 (1.09)
-4 (1.82)
Survey - - - - - - - - 9 7 DISE - - - - - - - - 8 7
Working Children
Variation - - - - - - - - -1 (12.5)
-
Survey 14 17 8 2 6 5 6 3 11 6 DISE 16 18 6 2 8 5 6 3 12 6
Repeaters
Variation 2 (12.5)
1 (5.55)
-2 (33.33)
- 2 (25.0)
- - - 1 (8.33)
-
Source: - DISE Data and field survey 4.3 Enrollment in Upper Primary Schools of Sitapur District (2010-11):
In the sample data of Upper primary schools, DISE data has over reported the
number of boys and girls enrollment in class-VI as against the survey data. In class-VII,
the DISE data is over reported in case of enrollment of boys while it is under reported in
case of girls’ enrollment. The number of girls enrolled is marginally lower than enrolled
boys in class-VII and class-VIII except in class-VI. The variation between the survey and
the DISE data ranged from 0.08 per cent to a maximum of 0.87 per cent.
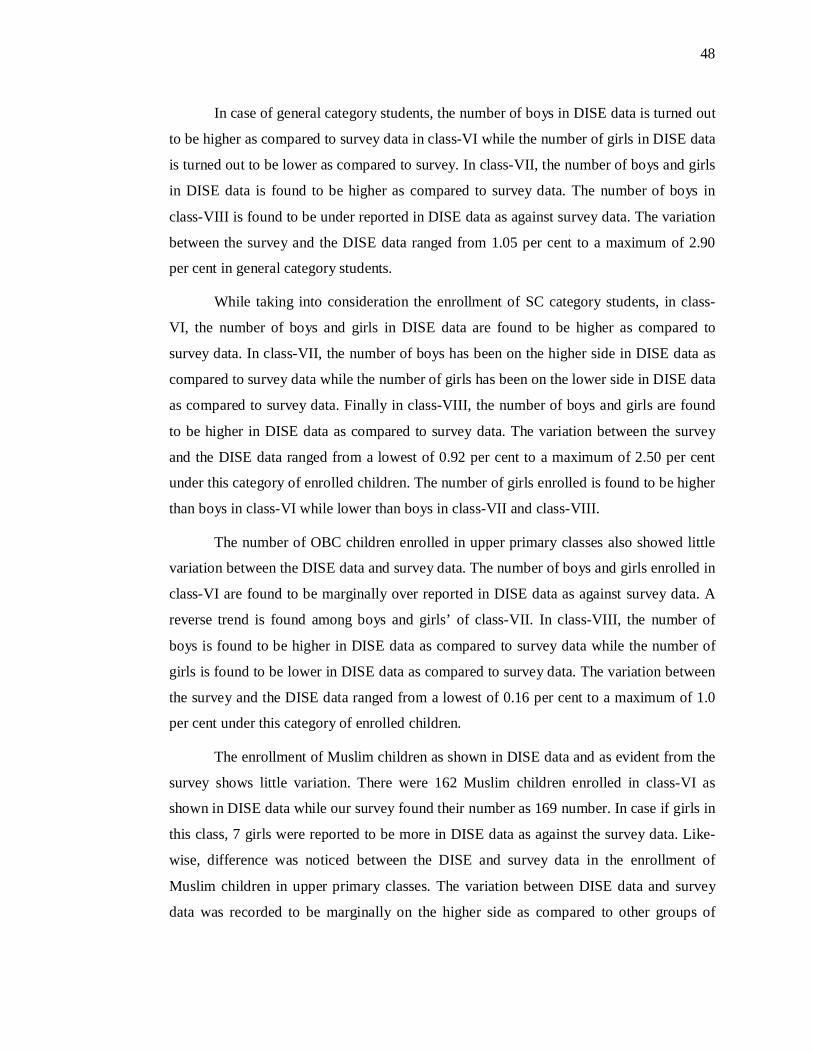
48
In case of general category students, the number of boys in DISE data is turned out
to be higher as compared to survey data in class-VI while the number of girls in DISE data
is turned out to be lower as compared to survey. In class-VII, the number of boys and girls
in DISE data is found to be higher as compared to survey data. The number of boys in
class-VIII is found to be under reported in DISE data as against survey data. The variation
between the survey and the DISE data ranged from 1.05 per cent to a maximum of 2.90
per cent in general category students.
While taking into consideration the enrollment of SC category students, in class-
VI, the number of boys and girls in DISE data are found to be higher as compared to
survey data. In class-VII, the number of boys has been on the higher side in DISE data as
compared to survey data while the number of girls has been on the lower side in DISE data
as compared to survey data. Finally in class-VIII, the number of boys and girls are found
to be higher in DISE data as compared to survey data. The variation between the survey
and the DISE data ranged from a lowest of 0.92 per cent to a maximum of 2.50 per cent
under this category of enrolled children. The number of girls enrolled is found to be higher
than boys in class-VI while lower than boys in class-VII and class-VIII.
The number of OBC children enrolled in upper primary classes also showed little
variation between the DISE data and survey data. The number of boys and girls enrolled in
class-VI are found to be marginally over reported in DISE data as against survey data. A
reverse trend is found among boys and girls’ of class-VII. In class-VIII, the number of
boys is found to be higher in DISE data as compared to survey data while the number of
girls is found to be lower in DISE data as compared to survey data. The variation between
the survey and the DISE data ranged from a lowest of 0.16 per cent to a maximum of 1.0
per cent under this category of enrolled children.
The enrollment of Muslim children as shown in DISE data and as evident from the
survey shows little variation. There were 162 Muslim children enrolled in class-VI as
shown in DISE data while our survey found their number as 169 number. In case if girls in
this class, 7 girls were reported to be more in DISE data as against the survey data. Like-
wise, difference was noticed between the DISE and survey data in the enrollment of
Muslim children in upper primary classes. The variation between DISE data and survey
data was recorded to be marginally on the higher side as compared to other groups of

49
enrolled students. The variation in this category of students ranged from a lowest of 3.10
per cent to a maximum 4.55 per cent.
The difference between DISE and survey data in regard to children who were
transferred to other schools was nominal and the number of working children is found
only in boys of class-VII.
The number of repeaters boys and girls has been found only in class-VII and boys of class-
VIII. When compared between DISE and survey data, no variation is found. Table 4.3
presents the enrollment of children in the academic year 2010-11 in Sitapur district.
Table 4.3: Children Enrolled in the Academic Year 2009-10 in Upper Primary Schools of Sitapur District
Class-6 Class-7 Class-8 Enrolment
Boys Girls Boys Girls Boys Girls Survey 1489 1502 1395 1273 1421 1330 DISE 1484 1489 1407 1272 1418 1339
Total Enrolment (a+b+c+d)
Variation 5 (0.336)
13 (0.87)
12 (0.85)
-1 (0.08)
-3 (0.21)
9 (0.67)
Survey 240 192 233 160 257 201 DISE 246 190 238 163 252 207
General (a)
Variation 6 (2.44)
-2 (1.05)
5 (2.10)
3 (1.84)
-5 (1.98)
6 (2.90)
Survey 430 475 448 350 436 388 DISE 435 479 443 359 432 384
SC Children Enrolled (b)
Variation 5 (1.14)
4 (0.84)
-5 (1.12)
9 (2.5)
-4 (0.92)
-4 (1.04)
Survey 640 655 600 585 582 560 DISE 641 659 594 580 587 555
OBC Children Enrolled (c)
Variation 1 (0.16)
4 (0.62)
-6 (1.0)
-5 (0.86)
5 (0.85)
-5 (0.90)
Survey 169 154 138 176 140 199
DISE 162 161 132 170 147 193 Muslim Children Enrolled (d) Variation -7
(4.32) 7
(4.34) -6
(4.55) -6
(3.52) 7
(4.76) -6
(3.10) Survey 560 433 111 88 19 32 DISE 566 428 116 84 16 35
Children Who Transfer to Other School Variation 6
(1.06) -5
(1.16) 5
(4.31) -4
(4.76) -3
(19.92) 3
(8.57) Survey - - 2 - - - DISE - - 2 - - -
Working Children
Variation - - - - - - Survey - - 4 5 3 - DISE - - 4 5 3 -
Repeaters
Variation - - - - - - Source: - DISE Data and field survey

50
4.4 Enrollment in Upper Primary Schools of Moradabad District (2009-10):
In sample Upper primary schools of Moradabad, DISE data has under reported the
number of boys’ enrollment and over reported the number of girls’ enrollment in class-VI
as compared to the survey data. DISE data is turned out to be lower than survey data in
case of enrollment of girls and boys of class-VII. In class-VIII, the DISE data is over
reported in case of enrollment of boys and no variation is found between DISE data and
survey data in case of enrollment of girls. When we examined the variation between the
DISE and survey data, it is found to be ranging from a lowest of 0.15 per cent to a
maximum of 1.58 per cent as evident from Table 4.4.
In the general category of students, the DISE data is found to be under reported in
case of boys and over reported in case of girls as compared to survey data of class-VI. In
class VII, the DISE data is found to be higher than survey data in both the cases of
enrolled boys and girls students. Lastly, in class VIII, the DISE data is found to be higher
than survey data in case of boys and vice-versa is found in case of girls. The variation
between the DISE data and the survey data ranged from a minimum 0.52 percent to
maximum 2.19 percent.
The DISE data has shown little variation from our survey data in case of
enrollment of SC children in class-VI, class-VII and class-VIII. The DISE data has shown
under reporting in case of boys and over reporting in case of girls as compared to survey
data of class-VI. In class-VII, the number of boys and girls is found to be under reported in
DISE data as compared to survey data. In class-VIII, the number of boys enrolled is higher
in DISE data as compared to survey data while the number of girls’ enrolled is lower in
DISE data as compared to survey data. The variation between the DISE data and the
survey data ranged from a lowest of 1.16 percent to maximum 3.91 percent. The variation
is found to be higher in case of girls of class-VIII as compared to rest of all.
The number of OBC children enrolled in upper primary classes also had little
variation between the DISE data and the survey data. The DISE data has over reported the
numbers as compared to survey data of boys and girls of all the classes. The variation is to
the extent of around 0.5 percent except in girls of class-VII & boys and girls of class-VIII
where DISE data has over reported than the survey data with the variation of around one
per cent.

51
The variation between the enrollment of Muslim children as shown in DISE data and
the survey data was found to be negligible. There were 618 Muslim boys and 530 Muslim
girls each enrolled in class-VI according to the survey while DISE data has shown number as
609 Muslim boys and 523 Muslim girls. In the same way, difference was negligible between
the DISE and survey data relating to the enrollment of Muslim children in other upper primary
classes. The variation between the DISE data and the survey data ranged from a minimum
0.62 percent to maximum 1.48 percent.
The children who were transferred to other schools had shown a variation between the
DISE data and the survey data ranging from a lowest of 0.90 percent to a maximum of 5.21
percent. As far reporting the number of working children was concerned, the variation
between the DISE data and the survey data was quite high, which ranged from a lowest of 7.0
percent to maximum 17.6 percent.
The number of boys’ and girls repeaters has been found in class-VI, class-VII and also
among the girls of class-VIII. When compared between DISE and survey data, negligible
under reporting in DISE data as against the survey data is evident in girls of class-VII. Table
4.4 presents the enrollment of children in the academic year 2010-11 in Moradabad district.
Table 4.4: Children Enrolled in the Academic Year 2010-11 in Upper Primary School of Moradabad District
Class-6 Class-7 Class-8 Enrolment Boys Girls Boys Girls Boys Girls
Survey 1966 1931 1939 1773 1744 1688 DISE 1963 1944 1924 1954 1772 1688
Total Enrolment (a+b+c+d)
Variation -3 (0.15)
13 (0.66)
-15 (0.78)
-19 (1.08)
28 (1.58)
-
Survey 346 346 308 327 333 388 DISE 343 349 305 320 338 386
General (a)
Variation -3 (0.88)
3 (0.86)
-3 (0.98)
-7 (2.19)
5 (1.49)
-2 (0.52)
Survey 370 350 387 294 424 239 DISE 365 355 380 290 429 230
SC Children Enrolled (b)
Variation -5 (1.37)
5 (1.41)
-7 (1.84)
-4 (1.37)
5 (1.16)
-9 (3.91)
Survey 600 701 746 550 583 550 DISE 632 705 751 557 589 558
OBC Children Enrolled (c)
Variation 2 (0.316)
4 (0.57)
5 (0.67)
7 (1.26)
6 (1.02)
8 (1.43)
Survey 618 530 493 569 398 495
DISE 609 523 490 562 395 499 Muslim Children Enrolled (d) Variation 9
(1.48) -7
(1.39) -3
(0.62) -7
(1.25) -3
(0.76) 4
(0.80) Survey 1009 805 192 121 201 118 Children Who
Transfer to Other DISE 1000 810 190 115 210 120

52
School Variation -9
(0.90) 5
(2.63) -2
(1.05) -6
(5.21) 9
(4.28) 2
(1.67) Survey 40 35 40 20 50 20 DISE 43 38 35 17 56 17
Working Children
Variation 3 (7.0)
3 (7.9)
-5 (14.3)
-3 (17.6)
6 (10.7)
-3 (17.6)
Survey 1 11 1 26 - 8 DISE 1 11 1 27 - 8
Repeaters
Variation - - - 1 (3.70) - - Source: - DISE Data and field survey
4.5. Scholarship to Students in Primary Schools of Sitapur and Moradabad Districts:
There is found to be a small variation between DISE and survey data of scholarship
given to boys’ students of primary schools of Sitapur district. In Moradabad district, there
has been over reporting in DISE data as compared to the survey data. In case of girls’
students of Sitapur district, the DISE data has been marginal over reported as compared to
the survey data while in Moradabad district, there has been under reporting in DISE data
in case of girls students of primary level. More or less similar variation is evident in the
data of scholarship incentives availed by the students of different social groups in both the
districts (Table 4.5). The variation between the DISE data and the survey data ranging
from 0.10 percent to 0.18 percent in case of boys of primary schools of Sitapur and
Moradabad districts. While in case of girls, the variation between the DISE data and the
survey data is found to be very negligible ranging from 0.02 percent to 0.06 percent in
Sitapur and Moradabad districts.
The following Table 4.5, shows the scholarship availed by the students of primary
schools belonging to different social groups in Sitapur and Moradabad district.
Table 4.5: Incentives of Scholarship in the Academic Year 2009-10: Primary Schools of Sitapur and Moradabad Districts
Survey DISE Variation Caste Sitapur Moradabad Sitapur Moradabad Sitapur Moradabad
Boys 996 2587 990 2580 -6 (0.60) -7 (0.27) General Girls 1018 2696 1024 2699 6 (0.59) 3 (0.11)
Boys 3585 2963 3580 2972 -5 (0.14) 9 (0.30) SC Girls 3704 2694 3700 2699 -4 (0.12) 5 (0.12)
Boys 24 26 23 26 -1 (4.35) 1 (3.84) ST Girls 25 16 15 16 - -
Boys 4188 6100 4180 6110 -8 (0.19) 10 (0.16) OBC Girls 3969 6895 3958 9885 -11 (0.025) -10 (0.15)
Boys 938 3620 928 3635 10 (1.07) 15 (0.41) Muslim Girls 931 3508 920 3500 11 (1.12) -8 (0.22)
Boys 9731 15295 9701 15323 -10 (0.10) 28 (0.18) Total Students Girls 9631 15809 9617 15799 2 (0.02) -10 (0.06) Source: - DISE Data and field survey.

53
4.6 Scholarship to Students in Upper Primary Schools of Sitapur and Moradabad Districts:
The number of students who availed scholarship in upper primary classes of Sitapur
district has been under reported in DISE data as compared to survey data. While in
Moradabad district, the DISE data has over reported the number of such students. This is
found in case of boys in both the districts. In case of girls students the DISE data has over
reported the figures as compared to the survey data in Sitapur district. An opposite trend is
found to be present in Moradabad district. The variation in case of boys and girls comes
out to be around 0.07 per cent and 0.54 percent in Sitapur district. The under reporting is
found to the extent of 0.02 per cent in case of boys and over reporting to the extent of 0.36
per cent in case of girls in Moradabad district.
Among boys and girl students of general category, the DISE data is found to be
under reported in Sitapur district while over reported in Moradabad district. There is over
reporting of number of SC boys and girls to the extent of 1.71 per cent and 1.40 percent in
Sitapur district. While there is under reporting to the extent of 1.08 per cent and 1.55
percent in case of boys and girls students of Sitapur and Moradabad districts. Among boys
and girl students of ST category, the DISE data is found to be over reported in Sitapur
district while under reported in Moradabad district. A nominal under reporting is evident
in case of OBC boys of Sitapur Districts while over reporting in Moradabad district.
Among girl students of OBC category, there has been a slight over reporting in the DISE
data as compared to the survey data in both the districts of Sitapur and Moradabad. The
DISE data has under reported the number of Muslim boys who received scholarship
incentive in both the districts of Sitapur and Moradabad. Among girls, the DISE data has
over reported the figures than survey data in Sitapur districts and under reported than
survey data in Moradabad district. Table 4.6 presents the scholarship availed by the
students of upper primary schools belonging to different social groups in Sitapur and
Moradabad district.
Table 4.6: Incentive of Scholarship in the Academic Year 2009-10 in Upper Primary Schools of Sitapur and Moradabad Districts
Survey DISE Variation Caste Sitapur Moradabad Sitapur Moradabad Sitapur Moradabad
Boys 383 975 375 985 -8 (2.13) 10 (1.01) General Girls 314 830 300 836 -14 (4.66) 6 (0.71)
Boys 800 652 814 645 14 (1.71) -7(1.08) SC Girls 630 457 639 450 9 (1.40) -7 (1.55)
Boys - - - - - - ST Girls - 52 - 52 - -

54
Boys 1291 1888 1285 1895 -6 (0.46) 7 (0.37)
OBC Girls 1067 1839 1080 1845 13 (1.20) 6 (0.33) Boys 322 1244 320 1235 -2 (0.63) -9 (0.73)
Muslim Girls 204 769 208 760 4 (1.92) -9 (1.18) Boys 2796 4759 2794 4760 -2 (0.07) 1 (0.02) Total
Students Girls 2215 2227 2227 3933 12 (0.54) -14 (0.36) Source: - DISE Data and field survey.
4.7 Free Uniform to Students in Primary Schools of Sitapur and Moradabad Districts:
The free uniform is provided to girl students in primary schools of the state. The DISE
and our survey data have provided the number of those girl students belonging to different
social groups who have obtained free uniform. Table 4.7 shows that there is more or less
similarity between the number of girl students reported in DISE data and our survey data.
While considering total number of students, the DISE data has over reported as compared
to the survey data in Sitapur district and under reported in Moradabad district. The
variations across the DISE data as compared to the survey data of total number of students
are also nominal ranging from 0.03 percent to 0.22 percent.
Table 4.7: Incentive of Free Uniform for Girls in the Academic Year 2009-10 in Primary Schools of Sitapur and Moradabad Districts
Survey DISE Variation Caste Sitapur Moradabad Sitapur Moradabad Sitapur Moradabad
General 1033 2715 1040 2700 7 (0.68) -15 (0.56) SC 3699 3144 3709 3150 10 (0.27) 6 (0.19) ST 7 7 7 7 - - OBC 3824 6281 3835 6295 11 (0.29) 14 (0.23) Muslim 1067 4009 1060 4000 -7 (0.66) -9 (0.23) Total Students 9630 16156 9651 16152 21 (0.22) -4 (0.03) Source: - DISE Data and field survey.
4.8 Incentive of Free Bags to Girl Students in Primary Schools of Sitapur and
Moradabad Districts:
The incentive of free bags is provided to the girl students of upper primary school in the
state. The DISE data has reported the number of girl students who obtained bags in Sitapur
and Moradabad district. Our survey also enumerated the number of such girls who obtained
free bags in these districts. On the whole, the DISE data has over reported the number of such
girls than what was found in our survey to the extent 0.12 percent in Sitapur district and under
reported to the extent 0.36 percent in Moradabad district. In case of General category girls, the
DISE data is found to be under reporting in Sitapur district while over reported in Moradabad
district. While considering girls of SC category, the DISE data is found to be over reporting
the number of such girls as compared to the survey data in both the districts of Sitapur and
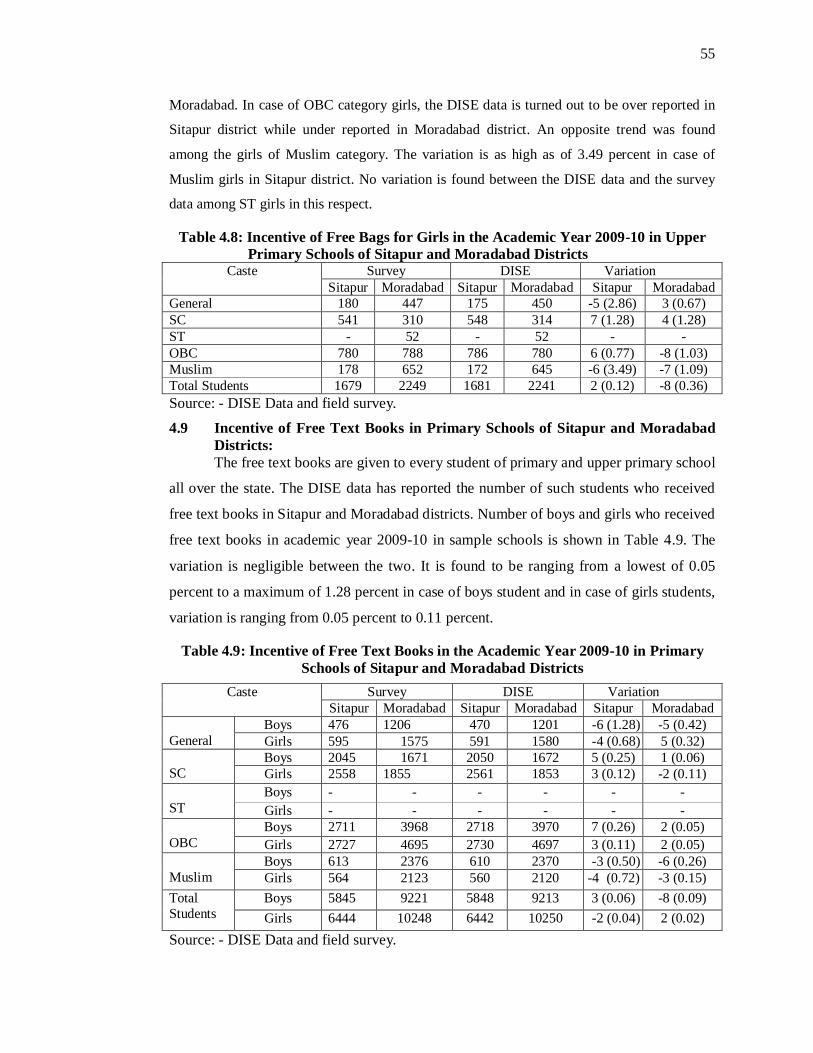
55
Moradabad. In case of OBC category girls, the DISE data is turned out to be over reported in
Sitapur district while under reported in Moradabad district. An opposite trend was found
among the girls of Muslim category. The variation is as high as of 3.49 percent in case of
Muslim girls in Sitapur district. No variation is found between the DISE data and the survey
data among ST girls in this respect.
Table 4.8: Incentive of Free Bags for Girls in the Academic Year 2009-10 in Upper Primary Schools of Sitapur and Moradabad Districts
Survey DISE Variation Caste Sitapur Moradabad Sitapur Moradabad Sitapur Moradabad
General 180 447 175 450 -5 (2.86) 3 (0.67) SC 541 310 548 314 7 (1.28) 4 (1.28) ST - 52 - 52 - - OBC 780 788 786 780 6 (0.77) -8 (1.03) Muslim 178 652 172 645 -6 (3.49) -7 (1.09) Total Students 1679 2249 1681 2241 2 (0.12) -8 (0.36) Source: - DISE Data and field survey.
4.9 Incentive of Free Text Books in Primary Schools of Sitapur and Moradabad Districts:
The free text books are given to every student of primary and upper primary school
all over the state. The DISE data has reported the number of such students who received
free text books in Sitapur and Moradabad districts. Number of boys and girls who received
free text books in academic year 2009-10 in sample schools is shown in Table 4.9. The
variation is negligible between the two. It is found to be ranging from a lowest of 0.05
percent to a maximum of 1.28 percent in case of boys student and in case of girls students,
variation is ranging from 0.05 percent to 0.11 percent.
Table 4.9: Incentive of Free Text Books in the Academic Year 2009-10 in Primary Schools of Sitapur and Moradabad Districts
Survey DISE Variation Caste Sitapur Moradabad Sitapur Moradabad Sitapur Moradabad
Boys 476 1206 470 1201 -6 (1.28) -5 (0.42) General Girls 595 1575 591 1580 -4 (0.68) 5 (0.32)
Boys 2045 1671 2050 1672 5 (0.25) 1 (0.06) SC Girls 2558 1855 2561 1853 3 (0.12) -2 (0.11)
Boys - - - - - - ST Girls - - - - - -
Boys 2711 3968 2718 3970 7 (0.26) 2 (0.05) OBC Girls 2727 4695 2730 4697 3 (0.11) 2 (0.05)
Boys 613 2376 610 2370 -3 (0.50) -6 (0.26) Muslim Girls 564 2123 560 2120 -4 (0.72) -3 (0.15)
Boys 5845 9221 5848 9213 3 (0.06) -8 (0.09) Total Students Girls 6444 10248 6442 10250 -2 (0.04) 2 (0.02) Source: - DISE Data and field survey.

56
4.10 Incentive of Free Text Books in Upper Primary Schools: The number of students who received free text books in upper primary schools as
reported in DISE data and collected through our survey is shown in Table 4.10. Table also
shows the number of boys and girls belonging to different social groups who received free
text books in both the districts. In this regard, in case of boys the variation between the
DISE data and the survey data is negligible, about 0.71 percent, in Sitapur district and no
variation in case of girls. While in Moradabad district, the variation is about 0.09 percent
among boys and 0.15 percent among girls. However, in case of boys belonging to Muslim
category and general category boys and girls the variation is glaring.
Table 4.10: Incentive of Free Text Books in the Academic Year 2008-09 in Upper Primary Schools of Sitapur and Moradabad Districts
Survey DISE Variation Caste Sitapur Moradabad Sitapur Moradabad Sitapur Moradabad Boys 155 393 150 390 -5 (3.34) -3 (0.77) General
Girls 230 609 235 605 5 (2.13) -4 (0.67) Boys 547 446 542 450 -5 (0.93) 4 (0.89)
SC Girls 648 437 641 440 -7 (1.10) 3 (0.69) Boys 563 824 560 820 -3 (0.54) -4 (0.49)
OBC Girls 509 877 507 870 -2 (0.40) -7 (0.81) Boys 156 603 159 608 3 (1.89) 5 (0.83)
Muslim Girls 215 811 219 815 4 (1.83) 4 (0.49) Boys 1421 2266 1411 2268 -10 (0.71) 2 (0.09) Total
Students Girls 1602 2734 1602 2730 - -4 (0.15) Source: - DISE Data and field survey.
4.11 Number of Disabled Children in Primary Schools of Sitapur District: The number of disabled children is reported in DISE data. The survey has also
found out the number of disabled children in order to assess the variation between the
DISE and survey data. Number of such children is presented in Table 4.11. It is reflected
from table that there is no difference between the DISE and survey data as far the number
of disabled children in sample schools of Sitapur district is concerned.
Table 4.11: Details of Disabled Children in Primary Schools of Sitapur District
Class-1 Class-2 Class-3 Class-4 Class-5 Particulars Boys Girls Boys Girls Boys Girls Boys Girls Boys Girls
Survey 2 5 3 - 1 1 - - 1 - DISE 2 5 3 - 1 1 - - 1 -
Blind
Variation - - - - 1 - - - - - Survey - 1 3 - - 1 - 1 - - DISE - 1 3 - 2 1 - 1 - -
Deaf
Variation - - - - 2 - - - - - Survey - - 1 2 - - 1 1 - 1 DISE - - 1 2 - - 1 1 - 1
Dumb
Variation - - - - - - - - - -

57
Survey 3 4 2 1 - 3 4 1 3 2 DISE 3 4 2 1 1 3 4 1 3 2
Bone Disabled
Variation - - - - 1 - - - - - Survey 1 - - - - - - - - 1 DISE 1 - - - - - - - - 1
Mental Disabled
Variation - - - - - - - - - - Survey - - 2 1 - - - 1 - - DISE - - 2 1 - - - 1 - -
Many type of Disabilities Variation - - - - - - - - - -
Survey 6 10 10 4 4 6 6 3 4 4 DISE 6 10 10 4 4 6 6 3 4 4
Total
Variation - - - - - - - - - - Source: - DISE Data and field survey.
4. 12.(A) Number of Disabled Children in Primary Schools of Moradabad District: The DISE and survey data of disabled children in the district of Moradabad has been
compared to know the variation between the two. Number of such children is shown in
Table 4.12. It is reflected from table that there is no difference between the DISE and
survey data as far the number of disabled children in sample schools of Moradabad district
is concerned.
Table 4.12: Details of Disabled Children in Primary Schools of Moradabad District
Class-1 Class-2 Class-3 Class-4 Class-5 Particulars
Boys Girls Boys Girls Boys Girls Boys Girls Boys Girls Survey - - - - 1 2 - - 1 1 DISE - - - - 1 2 - - 1 1
Blind
Variation - - - - - - - - - - Survey - 1 - 2 2 - 2 - - - DISE - 1 - 2 2 - 2 - - -
Deaf
Variation - - - - - - - - - - Survey - - - - 1 1 - 2 - 1 DISE - - - - 1 1 - 2 - 1
Dumb
Variation - - - - - - - - - - Survey - 1 2 - 1 - - 1 4 3 DISE - 1 2 - 1 - - 1 4 3
Bone Disabled
Variation - - - - - - - - - Survey - - 1 - - 1 2 - 1 - DISE - - 1 - - 1 2 - 1 -
Mental Disabled
Variation - - - - - - - - - - Survey - - - 1 - - 1 - - - DISE - - - 1 - - 1 - - -
Many type of Disabilities Variation - - - - - - - - - -
Survey - 2 3 3 5 4 5 3 6 5 DISE - 2 3 3 5 4 5 3 6 5
Total
Variation - - - - - - - - - - Source: - DISE Data and field survey.

58
4. 12.(B) Number of Disabled Children in Upper Primary Schools of Sitapur District: The number of disabled children has been reported in DISE data in case of upper
primary schools of Sitapur district. The survey has found out the number of disabled
children in order to assess the variation between the DISE and survey data in sample upper
primary schools of the district. Number of such children is shown in Table 4.13. It is
reflected from the data that there is no difference between the DISE and survey data as far
the number of disabled children in sample schools of Sitapur district is concerned.
Table 4.13: Details of Disabled Children in Upper Primary School of Sitapur District
Class-6 Class-7 Class-8 Particulars Boys Girls Boys Girls Boys Girls
Survey - - - - 1 - DISE - - - - 1 -
Blind
Variation - - - - - - Survey - 1 2 - 3 - DISE - 1 2 - 3 -
Deaf
Variation - - - - - - Survey 1 - - - 2 - DISE 1 - - - 2 -
Dumb
Variation - - - - - - Survey 1 - 2 1 - 2 DISE 1 - 2 1 - 2
Bone Disabled
Variation - - - - - - Survey - - 1 - - 1 DISE - - 1 - - 1
Mental Disabled
Variation - - - - - - Survey - - 1 - - - DISE - - 1 - - -
Many type of Disabilities
Variation - - - - - - Survey 2 1 6 1 6 3 DISE 2 1 6 1 6 3
Total
Variation - - - - - - Source: - DISE Data and field survey.
4.13 Number of Disabled Children in Upper Primary Schools of Moradabad
District:
The number of disabled children is reported in DISE data in case of upper primary
schools of Moradabad district. The number of disabled children has been collected in the
sample schools through our survey in order to assess the variation between the DISE and
survey data in sample upper primary schools of the district. Number of such children is
shown in Table 4.14. It is reflected from table that there is no difference between the DISE

59
and survey data as far the number of disabled children in sample schools of Moradabad
district is concerned.
Table 4.14: Details of Disabled Children in Upper Primary Schools of
Moradabad District
Class-6 Class-7 Class-8 Particulars Boys Girls Boys Girls Boys Girls
Survey - - - - 1 - DISE - - - - 1 -
Blind
Variation - - - - - - Survey 1 - - 1 - - DISE 1 - - 1 - -
Deaf
Variation - - - - - - Survey - 1 1 - - 1 DISE - 1 1 - - 1
Dumb
Variation - - - - - - Survey 1 - - 1 - - DISE 1 - - 1 - -
Bone Disabled
Variation - - - - - - Survey - - 1 - - DISE - - - 1 - -
Mental Disabled
Variation - - - - - - Survey - - - - 1 - DISE - - - - 1 -
Many type of Disabilities
Variation - - - - - - Survey 2 1 1 3 1 1 DISE 2 1 1 3 1 1
Total
Variation - - - - - - Source: - DISE Data and field survey.
To conclude the above, inference can be drawn that the DISE data have, by and
large, been nearest to the survey data. This has been verified by our survey data. However,
in some places there are glaring variations between the DISE and survey data which need to
be looked into.

60
CHAPTER V
INVESTIGATOR’S OBSERVATIONS ABOUT VARIOUS ASPECTS OF SCHOOLS
5.1 Information regarding School Visits:
As per information obtained from the sample schools of the two districts Sitapur,
and Moradabad, there were 210 sample schools in Sitapur district, out of which 200
schools (95.24 per cent) were found open when our research team visited on the first day
of its visit to these schools. Ten schools were found open on the second day of our visit of
our research team. The details have been placed in Table 5.1. In Moradabad district there
were 220 sample schools, out of which 212 schools (96.37 per cent) were found open
when our research team visited on the first day of its visit to these schools. Eight schools
were found open on the second day of our visit of our research team.
Table 5.1 Information regarding the Visit to the Sample Schools
Was the School open on the first day
of visits
Was the School open on the
Second day of visits
Number of visits made to the School to get Information
District
Yes No Yes No Once Twice More than two
Total Sample
Sitapur 200 (95.24)
10 (4.76)
10 (4.76)
- 200 (95.24)
10 (4.76)
- 210 (100.00)
Moradabad 212 (96.37)
8 (3.63)
8 (3.63)
- 212 (96.37)
10 (3.63)
- 220 (100.00)
Source: Field Survey 5.2 Reaction of Principals/ Head Teachers towards the Investigation:
The initial reaction of the Principal/ Head teachers has been found to be good in
more than 16 percent of the total sample schools in Sitapur district whereas in more than 5
percent of the total sample schools it is reported to be very good. In more than 14 percent
of the total sample schools, Principals/Head teacher’s initial reaction has been found poor
when our research team visited to the sample primary and upper primary schools of the
Sitapur district. In more than 60 percent of the total sample schools, Principals/Head
teacher’s initial reaction has been found average in sample primary and upper primary

61
schools of the Sitapur district. In Moradabad District, the reaction of principals/Head
teachers has been recorded as very good in around 6 percent of the total sample schools
while in more than 11 percent of the sample schools the initial reaction of the
principals/Head teachers has been reported to be good except those 13 to 37 percent of the
schools where the reaction of teacher has been found to be very poor or poor as reported
by our research team and average in 60.0 percent of the schools as evident from the table
following table-5.2.
5.3 Response of the Principals/Head teachers in providing the Information: The response of principals/head teachers in 5.24 percent of sample schools in
Sitapur district and 6.37 per cent in Moradabad district, in providing information to our
research team, has been recorded as good. In around 70 to 73 per cent of the total sample
schools of both the districts, it is reported that the response of the teachers in providing the
information was average. The research team has also found the response of the teachers in
providing the information as poor in case of a low percentage of combined sample schools
of Sitapur and Moradabad districts.
5.4 Availability of Records:
The availability of records was found to be good in 19.53 per cent sample schools
of Sitapur district and nearly 15.91 per cent of sample schools of Moradabad district. In
case of the Sitapur district in 58.58 per cent of the schools records have been found to be
average while in more than 59 per cent of the schools, the availability of school records
have been recorded as average in the Moradabad district.
Table 5.2 Attitude of the Principals/Head Teachers toward the Investigation District Sitapur Moradabad
Very Good 12 (5.72) 13 (5.91) Good 34 (16.19) 25 (11.37)
Average 133 (63.33) 132 (60.0) Poor 31 (14.76) 37 (16.82)
Initial reaction of the Principal/Head Teacher Very Poor - 13 (5.90)
Very Good 12 (5.72) 16 (7.28) Good 11 (5.24) 14 (6.37)
Average 151 (71.91) 160 (72.73) Poor 28 (13.34) 20 (9.09)
Response of the Principal/Head Teacher to
provide information Very Poor 8 (3.80) 10 (4.55) Very Good 14 (6.67) 19 (8.64)
Good 41 (19.53) 35 (15.91) Average 123 (58.58) 131 (59.55)
Poor 21 (10.0) 29 (13.19)
Availability of Records Very Poor 11 (5.24) 6 (2.73) Total Sample Schools 210 (100.00) 220 (100.00)
Source: Field Survey

62
5.5 Enrollment Details:
The information relating to enrollment and pass percentage of the students in
sample schools of the Sitapur and Moradabad districts is contained in the Table 5.3. It is
found that in 82.86 percent of the total sample schools of Sitapur district information
relating to enrollment and pass percentage of the students was obtained easily, also in
more than 76 percent sample schools of district Moradabad. The information relating to
enrollment and other details has been obtained from a single register in more than 86
percent of the total sample schools in the district Sitapur and 80 percent of the total sample
schools in Moradabad districts.
Table 5.3 Information regarding Enrollment
Availability of enrolment and pass percentage
Availability of enrollment and other details from a single register
District
Yes No Yes No Sitapur 174 (82.86) 36 (17.14) 181 (86.19) 29 (13.81)
Moradabad 169 (76.82) 51 (23.18)
176 (80.0) 44 (20.0)
Source: Field Survey
5.6 Information Regarding Attendance Register: As evident from the Table- 5.4, in 91.43 percent of Sitapur and 90.0 per cent in
Moradabad districts of total sample schools attendance register have been found to be
filled by schools properly. In 88.10 percent of the schools in Sitapur the attendance
registers were kept in Elmira. The attendance registers were kept in Elmira in 85.0 per
cent of sample schools in the district of Moradabad
Table 5.4 Information regarding Attendance Register
Attendance register filled properly Attendance register maintained and kept in Elmira’s
District
Yes No Yes No Sitapur 192 (91.43) 18 (8.58) 185 (88.10) 25 (11.90) Moradabad 198 (90.0) 22 (10.0) 187 (85.0) 33 (15.0) Source: Field Survey 5.7 Year End Summary and Report Card:
The information relating to year-end summery and availability of reports cards
with the schools has been placed in Table 5.5. Out of the total 210 sample schools of
Sitapur district, 90.96 percent have reported the availability of the year end summery
details relating to the enrolled students whereas in Moradabad district this information has

63
been obtained from 91.37 percent of total sample schools. The availability of report cards
in the sample schools has not been satisfactory in both the districts.
Table 5.5 Information regarding year end summery
Availability of year end summery grade wise
Availability of report cards
District
Yes No Yes No
Sitapur 191 (90.96) 19 (9.04) 26 (12.38) 184 (87.62)
Moradabad 201 (91.37) 19 (8.63) 28 (12.73) 192 (87.27)
Source: Field Survey 5.8 Teachers Presence in the Schools:
When our research team visited the sample schools of Sitapur district it was found
that teachers come to schools well in time in more than 85 percent schools. In Moradabad
district as well, teachers were found coming to the schools in time in case of 85 percent of
schools as in case of Sitapur district as evident from the Table 5.6.
Table 5.6 Teachers Presence in the Schools and Problems faced by the Investigators
Do the Teachers in the Schools come on time?
Was the School having a
photocopy of filled in DISE
DCF
Did the Investigator face any problem in
getting Information
Does the School have a display
board
District
Yes No Yes No Yes No Yes No
Total Sample
Sitapur 179 (85.24)
31 (14.76)
21 (10.0)
189 (90.0)
163 (77.62)
47 (22.38)
186 (88.57)
24 (11.43)
210 (100.0)
Moradabad 189 (85.90)
31 (14.10)
27 (12.27)
193 (87.73)
190 (86.36)
30 (13.64)
197 (89.50)
23 (10.5)
220 (100.0)
Source: Field Survey 5.9 Problems Faced by the Investigators:
As reported by our research team that about 77.62 percent and 86.36 percent have
faced problem while getting the information from the respective sample schools of the
district Sitapur and Moradabad as shown in Table 5.6. The 88.57 percent of the schools in
the Sitapur district and 89.50 per cent schools in Moradabad district have reported that
they were having display boards.

64
5.10 Provision of Mid-day Meal in the Schools:
The information regarding the provision of MDM was obtained from the sample
schools in Sitapur and Moradabad districts. The quality of food being served was also
enquired from the respective schools. This information is shown in Table 5.7. It is known
that MDM is being implemented in all the primary and upper primary schools of the state.
The information given in Table 5.7 is the combined information of the primary as well as
the upper primary schools of the respective districts.
It is evident from the table that the provision of mid-day meal is there in 100.00 per cent of
the total sample schools of Sitapur and Moradabad district respectively. The good quality
food is being served in 54.17 percent and 57.25 percent sampled schools in both districts.
The serving of food not according to menu and food not containing green vegetables is
found to be in 24.40 percent and 35.12 percent in Sitapur district and 36.69 percent and
37.40 percent in Moradabad district.
Table 5.7 Information regarding Mid-day Meal
Sitapur Moradabad District
Particular Survey Survey
Yes 168 (100.0) 131 (100.0) Is there provision of MDM in the Govt. School* No 0 0
Good Quality 91 (54.17) 75 (57.25) 1 Bad Quality 75 (44.64) 61 (46.56)
2
Food not given according to menu
41 (24.40) 52 (36.69)
Quality of MDM being served to the children
3
Green vegetables are not used in food
59 (35.12) 49 (37.40)
Total Govt. Sample School 168 131 *Note: Provision of MDM shows both the primary as well as upper primary Schools. MDM not provided in any private sample schools. 5.11 Seating Arrangement for the Children:
The information relating to the seating arrangement for the children in schools is
presented in Table 5.8. It is evident from the table that in Sitapur District 43.34 percent of
the total schools have benches/stools for the children. In 54.29 percent of the schools,
children use mats for sitting in the classrooms. In 2.38 percent of the schools, children use
bora/bori or make their own arrangement for sitting in the classrooms while in around
60.96 percent of the schools chaukies are available for the student of class 1st and 2nd.
Lack of proper place is found in 11.43 percent of schools in Sitapur district. It has been

65
found that in around 51.82 percent schools students use benches/stools for sitting in
Moradabad district. In 45 percent of the schools, children use mats for sitting in the
classrooms. In 3.19 percent of the schools, children use bora/bori or make their own
arrangement for sitting in the classrooms while in around 63.19 percent of the schools
chaukies are available for the student of class 1st and 2nd. Lack of proper place is found in
12.28 percent of schools in Moradabad district.
Table 5.8 Information Regarding Seating Arrangement in Schools
Sitapur Moradabad District
Particular
Survey Survey Benches/Stools 91 (43.34) 114 (51.82)
Mats arrangement by school 114 (54.29) 99 (45.0) Bora/Bori/Own arrangement
by student 5 (2.38) 7 (3.19)
Chaukies for the Students of class 1&2
128 (60.96) 139 (63.19)
Seating arrangement
Lack of proper place/space 24 (11.43) 27 (12.28) Total Sample 210 210
Source: Field Survey
5.12 EMIS Data Processing, Infrastructure and Training:
1. For filling up EMIS format by the head teachers, the training is implemented by
the EMIS In-charge of Sitapur and Moradabad district. A batch of 40-45 head
teachers is formed to train them through a participatory approach. The problems
faced in this regard during the last academic year are exemplified in course of
training. The trainers make them aware about the weaknesses of the format and
through examples train them to fill format accurately.
2. A well established Educational Management Information System (EMIS) is found
in the both districts. The system at the district level is found functional with the
availability of computer operators and other related infrastructure.
3. More than 12 per cent schools are found to have school report card in Sitapur
district and Moradabad district. However, display boards are found in 88.57 to
89.50 per cent sample schools in all the districts i.e. Sitapur and Moradabad.
4. After EMIS data feeding at the district level data is provided at all the three levels
i.e. Block, NPRC and School. This data is used for analyzing student’s enrollment
for household survey of students in age groups of 6 to 11 years and 11 to 14 years.
This data is also used for the identification of student’s dropout and retention. This

66
procedure has been found to be adopted in all the two districts covered in our
evaluation study.
5. The information relating to DISE data is known at all BRC level. However, only
60 to 70 per cent Block Resource Centers (BRC’s) were found to have Block
Report Card in the districts.
6. District Information System for Education (DISE) is used for preparing Annual
Work Plan and Budget Plan for the next year in the districts.
7. For the awareness of DISE data separate workshops are not organized but training
is imparted at the block level in districts.
8. There is a full fledged system and arrangement for DISE data feeding was found
existing in the both districts. This task is accomplished with the help of three
computer operators and requires software and hardware in the districts.
9. Regarding suggestions on EMIS data collection its entry and accuracy, we hold the
view that –
(i) EMIS data should be compiled at BRC level also for better quality of data.
(ii) As there were no workshops on EMIS data at the district level, these should
be organized frequently at the district level.
(iii) BRC/NPRC Coordinators should be imparted computer training regarding
the EMIS data.
(iv) Photocopy DCF must be available at school level.