C-Reactive Protein Polymorphism and Serum Levels as an ...
114
University of Tennessee Health Science Center University of Tennessee Health Science Center UTHSC Digital Commons UTHSC Digital Commons Theses and Dissertations (ETD) College of Graduate Health Sciences 12-2008 C-Reactive Protein Polymorphism and Serum Levels as an C-Reactive Protein Polymorphism and Serum Levels as an Independent Risk Factor in Sickle Cell Disease Independent Risk Factor in Sickle Cell Disease Elizabeth A. Chismark University of Tennessee Health Science Center Follow this and additional works at: https://dc.uthsc.edu/dissertations Part of the Amino Acids, Peptides, and Proteins Commons, and the Hemic and Lymphatic Diseases Commons Recommended Citation Recommended Citation Chismark, Elizabeth A. , "C-Reactive Protein Polymorphism and Serum Levels as an Independent Risk Factor in Sickle Cell Disease" (2008). Theses and Dissertations (ETD). Paper 338. http://dx.doi.org/ 10.21007/etd.cghs.2008.0052. This Dissertation is brought to you for free and open access by the College of Graduate Health Sciences at UTHSC Digital Commons. It has been accepted for inclusion in Theses and Dissertations (ETD) by an authorized administrator of UTHSC Digital Commons. For more information, please contact [email protected].
-
Upload
khangminh22 -
Category
Documents
-
view
1 -
download
0
Transcript of C-Reactive Protein Polymorphism and Serum Levels as an ...
University of Tennessee Health Science Center University of Tennessee Health Science Center
UTHSC Digital Commons UTHSC Digital Commons
Theses and Dissertations (ETD) College of Graduate Health Sciences
12-2008
C-Reactive Protein Polymorphism and Serum Levels as an C-Reactive Protein Polymorphism and Serum Levels as an
Independent Risk Factor in Sickle Cell Disease Independent Risk Factor in Sickle Cell Disease
Elizabeth A. Chismark University of Tennessee Health Science Center
Follow this and additional works at: https://dc.uthsc.edu/dissertations
Part of the Amino Acids, Peptides, and Proteins Commons, and the Hemic and Lymphatic Diseases
Commons
Recommended Citation Recommended Citation Chismark, Elizabeth A. , "C-Reactive Protein Polymorphism and Serum Levels as an Independent Risk Factor in Sickle Cell Disease" (2008). Theses and Dissertations (ETD). Paper 338. http://dx.doi.org/10.21007/etd.cghs.2008.0052.
This Dissertation is brought to you for free and open access by the College of Graduate Health Sciences at UTHSC Digital Commons. It has been accepted for inclusion in Theses and Dissertations (ETD) by an authorized administrator of UTHSC Digital Commons. For more information, please contact [email protected].
C-Reactive Protein Polymorphism and Serum Levels as an Independent Risk C-Reactive Protein Polymorphism and Serum Levels as an Independent Risk Factor in Sickle Cell Disease Factor in Sickle Cell Disease
Abstract Abstract This study explored the relationship of a dinucleotide repeat polymorphism in the intron of the CRP gene and serum CRP levels as independent risk factors for end-organ dysfunction (mild vs. severe) in adults with sickle cell disease. The pathogenesis of secondary complications of sickle cell disease is complex and poorly understood. Predicting the severity of these complications could assist in therapeutic decision-making.
The study measured serum CRP levels and the number of CA intron repeats located on the CRP gene in 29 adults (31.74 ± 11.54 years) with sickle cell disease The hemoglobin genotypes were distributed as
Hgb SS 48.6% (17 of n = 29), Hgb SC 20.0% (7 of n = 29), Sβ° 10.3% (3 of n = 29), and Sβ+ 6.9% (2 of n = 29). The sample was categorized as mild (n = 9) no end-organ dysfunction vs. severe (n = 21) documented end-organ dysfunction. The severe group was sub-categorized by specific organ dysfunctions, 9 with pulmonary hypertension, 6 with renal dysfunction and 6 with cerebral vascular accident. Examination of serum CRP levels found no significant association with severe end-stage organ dysfunction. There was no significant association between serum CRP level and the polymorphism. However, a significant negative correlation (rho = -0.401, p = 0.031) was found between glomerular
filtration rates and CAhigh repeats (≥17).
Previous studies have found an association of genetic variations in the CRP gene polymorphism to serum CRP levels. While this pilot study found no evidence of this association, the findings provide some rationale for further investigation of the repeat polymorphism in the CRP gene and its association with renal end-organ dysfunction.
Document Type Document Type Dissertation
Degree Name Degree Name Doctor of Philosophy (PhD)
Program Program Nursing
Research Advisor Research Advisor Ann K. Cashion, PhD
Keywords Keywords Sickle cell disease, end-organ dysfunction, C-reactive protein, polymorphism, disease severity
Subject Categories Subject Categories Amino Acids, Peptides, and Proteins | Chemicals and Drugs | Diseases | Hemic and Lymphatic Diseases | Medicine and Health Sciences
This dissertation is available at UTHSC Digital Commons: https://dc.uthsc.edu/dissertations/338

C-REACTIVE PROTEIN POLYMORPHISM AND SERUM LEVELS AS AN INDEPENDENT RISK FACTOR IN SICKLE
CELL DISEASE
A Dissertation Presented for
The Graduate Studies Council The University of Tennessee
Health Science Center
In Partial Fulfillment Of the Requirements for the Degree
Doctor of Philosophy From The University of Tennessee
By Elisabeth A. Chismark
December 2008

Copyright © Elisabeth A. Chismark, 2008 All rights reserved
ii

DEDICATION
This dissertation is dedicated to my loving husband, Mike and to the men and women who live everyday with
Sickle Cell Disease.
iii
ACKNOWLEDGMENTS The author wishes to convey her deepest gratitude to Dr. Ann Cashion for the introduction to the world of nursing genetics, for her continuing valuable advice, motivation and professional guidance during this learning process. The author also acknowledges the suggestions and support through out this endeavor from the committee members, Dr. Patricia Cowan, Dr. Carolyn Driscoll, Dr. Carolyn Graff and Dr. Jane Hankins. The author expresses a special thanks to Dr. Raymond Osarogiagbon and Laura McHughes, RN from the University of Tennessee Cancer Institute; they were instrumental to this project and allowed the author access to this special group of patients. The author wishes to thank Dr. Ron Atkins and Jeanette Peeples for welcoming a novice bench scientist into their lab. Also, thank you to Dr. Tom Cunningham and the Molecular Research Center for their support. Additionally, this opportunity would not be available without the financial support of University of Tennessee Health Science Center and the School of Nursing. The author wishes to express appreciation to Dr. John Cunningham and his group for giving the author the opportunity to do basic work and establish her lab skills under his guidance and encouragement.
Finally, words cannot express the author’s deepest appreciation and gratitude to my loving husband, Mike, my children, Meghan and Dan and to my parents, Dr. J.W. and Karla Daubenspeck, for their love and encouragement.
iv
ABSTRACT
This study explored the relationship of a dinucleotide repeat polymorphism in the intron of the CRP gene and serum CRP levels as independent risk factors for end-organ dysfunction (mild vs. severe) in adults with sickle cell disease. The pathogenesis of secondary complications of sickle cell disease is complex and poorly understood. Predicting the severity of these complications could assist in therapeutic decision-making.
The study measured serum CRP levels and the number of CA intron repeats
located on the CRP gene in 29 adults (31.74 ± 11.54 years) with sickle cell disease The hemoglobin genotypes were distributed as Hgb SS 48.6% (17 of n = 29), Hgb SC 20.0% (7 of n = 29), Sβ° 10.3% (3 of n = 29), and Sβ+ 6.9% (2 of n = 29). The sample was categorized as mild (n = 9) no end-organ dysfunction vs. severe (n = 21) documented end-organ dysfunction. The severe group was sub-categorized by specific organ dysfunctions, 9 with pulmonary hypertension, 6 with renal dysfunction and 6 with cerebral vascular accident. Examination of serum CRP levels found no significant association with severe end-stage organ dysfunction. There was no significant association between serum CRP level and the polymorphism. However, a significant negative correlation (rho = -0.401, p = 0.031) was found between glomerular filtration rates and CAhigh repeats (≥17).
Previous studies have found an association of genetic variations in the CRP gene
polymorphism to serum CRP levels. While this pilot study found no evidence of this association, the findings provide some rationale for further investigation of the repeat polymorphism in the CRP gene and its association with renal end-organ dysfunction.
v
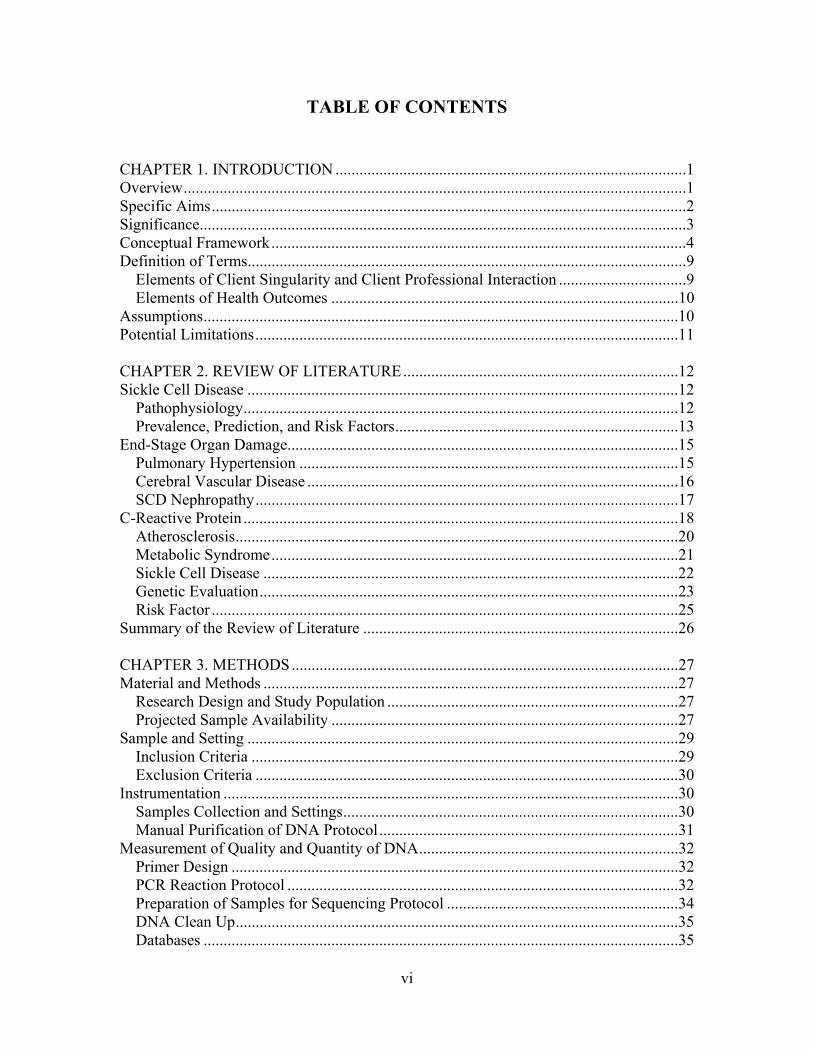
TABLE OF CONTENTS
CHAPTER 1. INTRODUCTION ........................................................................................1 Overview..............................................................................................................................1 Specific Aims.......................................................................................................................2 Significance..........................................................................................................................3 Conceptual Framework........................................................................................................4 Definition of Terms..............................................................................................................9
Elements of Client Singularity and Client Professional Interaction ................................9 Elements of Health Outcomes .......................................................................................10
Assumptions.......................................................................................................................10 Potential Limitations..........................................................................................................11 CHAPTER 2. REVIEW OF LITERATURE.....................................................................12 Sickle Cell Disease ............................................................................................................12
Pathophysiology.............................................................................................................12 Prevalence, Prediction, and Risk Factors.......................................................................13
End-Stage Organ Damage..................................................................................................15 Pulmonary Hypertension ...............................................................................................15 Cerebral Vascular Disease .............................................................................................16 SCD Nephropathy..........................................................................................................17
C-Reactive Protein .............................................................................................................18 Atherosclerosis...............................................................................................................20 Metabolic Syndrome......................................................................................................21 Sickle Cell Disease ........................................................................................................22 Genetic Evaluation.........................................................................................................23 Risk Factor .....................................................................................................................25
Summary of the Review of Literature ...............................................................................26 CHAPTER 3. METHODS.................................................................................................27 Material and Methods ........................................................................................................27
Research Design and Study Population .........................................................................27 Projected Sample Availability .......................................................................................27
Sample and Setting ............................................................................................................29 Inclusion Criteria ...........................................................................................................29 Exclusion Criteria ..........................................................................................................30
Instrumentation ..................................................................................................................30 Samples Collection and Settings....................................................................................30 Manual Purification of DNA Protocol...........................................................................31
Measurement of Quality and Quantity of DNA.................................................................32 Primer Design ................................................................................................................32 PCR Reaction Protocol ..................................................................................................32 Preparation of Samples for Sequencing Protocol ..........................................................34 DNA Clean Up...............................................................................................................35 Databases .......................................................................................................................35
vi
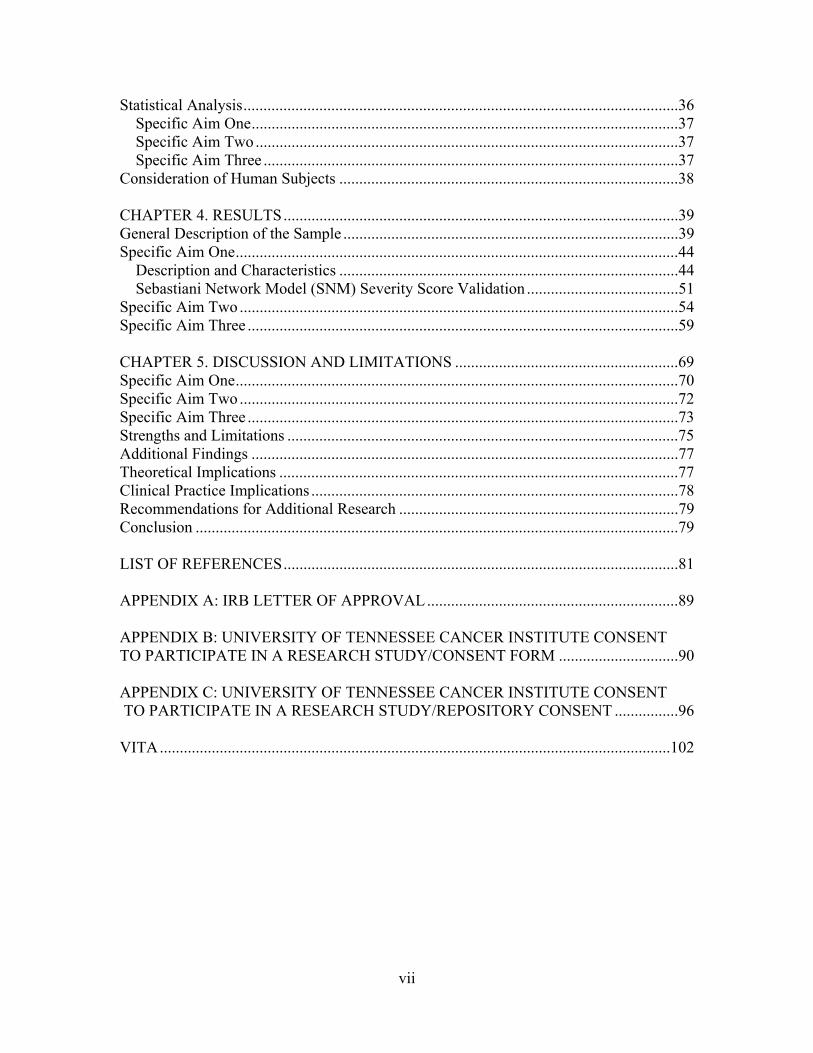
Statistical Analysis.............................................................................................................36 Specific Aim One...........................................................................................................37 Specific Aim Two..........................................................................................................37 Specific Aim Three ........................................................................................................37
Consideration of Human Subjects .....................................................................................38 CHAPTER 4. RESULTS...................................................................................................39 General Description of the Sample ....................................................................................39 Specific Aim One...............................................................................................................44
Description and Characteristics .....................................................................................44 Sebastiani Network Model (SNM) Severity Score Validation ......................................51
Specific Aim Two..............................................................................................................54 Specific Aim Three ............................................................................................................59 CHAPTER 5. DISCUSSION AND LIMITATIONS ........................................................69 Specific Aim One...............................................................................................................70 Specific Aim Two..............................................................................................................72 Specific Aim Three ............................................................................................................73 Strengths and Limitations ..................................................................................................75 Additional Findings ...........................................................................................................77 Theoretical Implications ....................................................................................................77 Clinical Practice Implications ............................................................................................78 Recommendations for Additional Research ......................................................................79 Conclusion .........................................................................................................................79 LIST OF REFERENCES...................................................................................................81 APPENDIX A: IRB LETTER OF APPROVAL...............................................................89 APPENDIX B: UNIVERSITY OF TENNESSEE CANCER INSTITUTE CONSENT TO PARTICIPATE IN A RESEARCH STUDY/CONSENT FORM ..............................90 APPENDIX C: UNIVERSITY OF TENNESSEE CANCER INSTITUTE CONSENT TO PARTICIPATE IN A RESEARCH STUDY/REPOSITORY CONSENT ................96 VITA................................................................................................................................102
vii
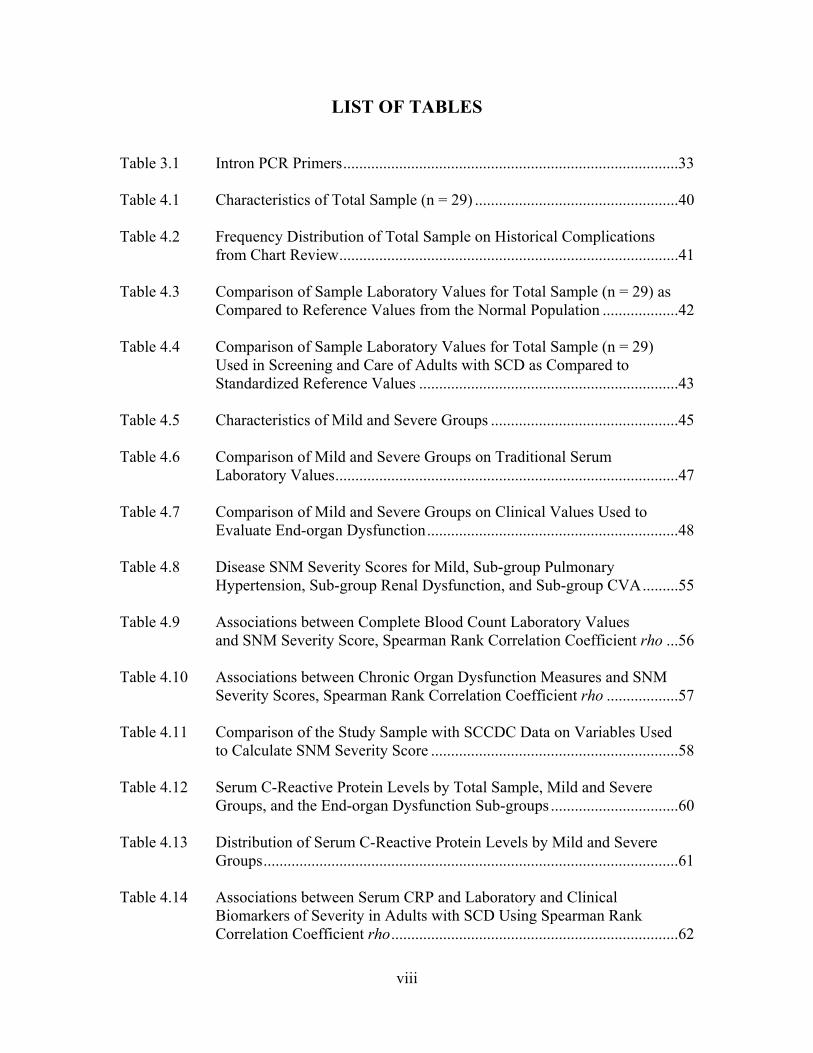
LIST OF TABLES Table 3.1 Intron PCR Primers....................................................................................33 Table 4.1 Characteristics of Total Sample (n = 29) ...................................................40 Table 4.2 Frequency Distribution of Total Sample on Historical Complications from Chart Review.....................................................................................41 Table 4.3 Comparison of Sample Laboratory Values for Total Sample (n = 29) as
Compared to Reference Values from the Normal Population ...................42 Table 4.4 Comparison of Sample Laboratory Values for Total Sample (n = 29) Used in Screening and Care of Adults with SCD as Compared to Standardized Reference Values .................................................................43 Table 4.5 Characteristics of Mild and Severe Groups ...............................................45 Table 4.6 Comparison of Mild and Severe Groups on Traditional Serum Laboratory Values......................................................................................47 Table 4.7 Comparison of Mild and Severe Groups on Clinical Values Used to
Evaluate End-organ Dysfunction...............................................................48 Table 4.8 Disease SNM Severity Scores for Mild, Sub-group Pulmonary Hypertension, Sub-group Renal Dysfunction, and Sub-group CVA.........55 Table 4.9 Associations between Complete Blood Count Laboratory Values and SNM Severity Score, Spearman Rank Correlation Coefficient rho ...56 Table 4.10 Associations between Chronic Organ Dysfunction Measures and SNM
Severity Scores, Spearman Rank Correlation Coefficient rho ..................57 Table 4.11 Comparison of the Study Sample with SCCDC Data on Variables Used to Calculate SNM Severity Score ..............................................................58 Table 4.12 Serum C-Reactive Protein Levels by Total Sample, Mild and Severe
Groups, and the End-organ Dysfunction Sub-groups ................................60 Table 4.13 Distribution of Serum C-Reactive Protein Levels by Mild and Severe
Groups........................................................................................................61 Table 4.14 Associations between Serum CRP and Laboratory and Clinical Biomarkers of Severity in Adults with SCD Using Spearman Rank Correlation Coefficient rho........................................................................62
viii

Table 4.15 Distribution of CRP Polymorphism CA Repeat for Total Sample ............63 Table 4.16 Associations between Clinical Laboratory Markers and CRP Allele Groups, Spearman Rank Correlation Coefficient rho................................66
ix

x
LIST OF FIGURES Figure 1.1 Interaction Model of Client Health Behavior ..............................................6 Figure 1.2 Interaction Model of Client Health Behavior with Variables and Model Areas Highlighted ........................................................................................8 Figure 3.1 Study Design..............................................................................................28 Figure 3.2 CRP Gene Intron........................................................................................33 Figure 4.1 Frequency of Historical Evidence of ACS, Sepsis, and Nephropathy by End-organ Dysfunction Sub-groups within the Severe Group........................................................................................49 Figure 4.2 Frequency of Treatment Options by End-organ Dysfunction Severity Sub-groups...................................................................................50 Figure 4.3 SNM Severity Scores for Sample Population............................................52 Figure 4.4 Boxplot of SNM Severity Score by Mild and Severity Sub-groups..........53 Figure 4.5 Distribution and Frequency of CRP Gene Microsatellite CA Repeats by Mild and Severe Groups..........................................................64 Figure 4.6 Boxplot of Glomerular Filtration Rate by CAlow and CAhigh Repeat Groups........................................................................................................67 Figure 4.7 Sample Sequences with Defined Start and Problem Area Identified ........68
CHAPTER 1. INTRODUCTION
Overview
One in 400 African-Americans and millions of people worldwide are affected by the single gene autosomal recessive hemoglobinapathy of Sickle Cell Disease (SCD) [1]. Advances in childhood treatments have increased the life expectancy of patients with this disease into the 4th and 5th decade of life [2]. Despite these advances, an elevated morbidity and early mortality risk remain through adulthood, in large part because of secondary complications resulting in cumulative end-organ damage. Development of chronic organ dysfunction is a more powerful predictor of early mortality than frequency of acute painful episodes [3-5]. Secondary complications and damage can be found in the cerebral, pulmonary, renal, and retinal vascular territories in these patients [2]. The high mortality and morbidity rates are due to the underlying sickle disease process resulting in micro-vascular occlusions caused by interactions between sickle red blood cells, white blood cells, humoral factors and vascular endothelial cells. Identification of risk factors associated with organ damage would facilitate earlier identification of SCD patients at risk for dysfunction and complications, and justify earlier and more aggressive therapy. Any organ with a blood supply is susceptible to damage. However, the most common target organs for SCD are the brain (ischemic and hemorrhagic stroke), lungs (pulmonary hypertension), kidneys (protein-losing nephropathy and end-stage renal disease), and retina (proliferative retinopathy) [2, 4, 6]. The full extent of organ dysfunction in patients with SCD is only now being recognized from recent studies of adult populations [4, 7, 8]. A new severity score has been developed to evaluate the complexity of problems in SCD patients [9] but has not been independently validated. Consequently, there is a need to identify risk factors to improve SCD risk prediction. The etiology of end-organ damage is probably multi-factorial, likely to include pro-inflammatory pathways and genetic factors that mediate the inflammatory phenotype [4, 5, 10, 11] . A serum laboratory test of C-Reactive Protein (CRP) elevation is routinely measured in a variety of disease processes as a marker for inflammation [12] and may be a marker for end-organ damage in SCD. In addition, a polymorphism in the C-reactive protein (CRP) gene, that may regulate the expression levels of serum CRP may be one factor in the etiology of end-organ damage [13, 14] and has been explored in atherosclerosis, diabetes, and systemic lupus [13-18], but not in SCD.
Recent data suggest that the elevated biomarker of high sensitivity (hs)-CRP may provide predictive information for risk of cardiovascular disease and other inflammatory diseases in the general population [19, 20]. One of these risk factors may be an abnormal response of hs-CRP to sub-clinical vascular inflammation from micro-occlusions that is seen in other inflammatory diseases [20]. One study showed CRP levels were more
1
frequently elevated in baseline SCD patients and the alteration might be provoked by a low-grade inflammatory process [21].
This elevated serum biomarker does have a genetic component that may mediate
the serum blood levels [12]. To date, few studies have looked at the CRP gene as a biomarker of severity of end-stage organ disease in the adult with SCD. Findings demonstrate that adults with homozygous, (Hgb SS) and heterozygous (Hgb SC) sickle hemoglobinapathy may have an abnormal elevation of serum hs-CRP levels associated with a polymorphism such as a microsatellite repeat in the intron of the CRP gene that exacerbates the natural function of the gene, compounding their underlying hemoglobinopathy [1, 22]. This biomarker and polymorphism may be useful in the definition of severity levels of end-stage organ dysfunction. They may also enhance risk assessment and offer new insights.
Specific Aims
The purpose of this study is to access the utility of CRP polymorphism and serum levels as an independent risk factor for end-organ dysfunction in SCD. The study will describe and characterize two groups of adults with SCD (mild and severe) according to historical and clinical markers. Additionally, the data will be used to explore the use of the newly developed Sebastiani Network Model (SNM) Severity Score [9].
The primary aims were to: 1. Describe and characterize two groups of sickle cell disease (SCD) patients with
(severe cases) and without (mild cases) the development of chronic organ dysfunction. Then use the data to validate the predictive value of the SNM Severity Score.
2. Assess whether serum CRP levels differ between two groups of SCD patients, with (severe cases) and without (mild cases) the development of chronic organ dysfunction.
3. Assess whether genotype profiles for a microsatellite repeat in the intron of the CRP gene differ between two groups of SCD patients, with (severe cases) and without (mild cases) the development of chronic organ dysfunction.
a. Identify the microsatellite repeats in the intron of the CRP gene for severe cases. b. Identify the microsatellite repeats in the intron of the CRP gene for mild cases. c. Assess whether the microsatellite repeat in the intron of the CRP gene is
associated with serum CRP levels in the two groups of SCD patient with (severe cases) and without (mild cases) the development of chronic organ dysfunction.
2

Significance
In the United States, one in 600 people have SCD with the genotype of hemoglobin SS (Hgb SS). Other common genotypes are hemoglobin C (Hgb SC) and β-thalassemia (Hgb Sβ+/0), which together are as common as Hgb SS. Additionally, one in 10 African Americans (AA) are heterozygous carriers of Hgb SS and recent literature suggests that this trait may not be as benign a condition as once thought [23]. Advances in the treatment of SCD have led to expanding survival rates into the 4th decade of life for SCD patients [5]. With increased survival rates, patients are experiencing more secondary complications of chronic organ dysfunction. The exact etiology is unknown; but inflammation may play an important role.
Inflammation and abnormal adhesion of sickled cells are thought to contribute to vascular occlusions that lead to chronic organ dysfunction [5, 10, 21, 24]. CRP induced inflammation is an acute phase response to vascular damage. Serum CRP levels are a newly recognized serum biomarker for vascular damage [19, 25, 26] but little literature addresses the utilization of CRP levels in assessing potential end-organ dysfunction in SCD patients [21].
Reliable and accurate screening and preventive therapies are needed to identify
patients at the greatest risk for secondary complications. Traditional screening with serum biomarkers and radiological technology are being explored as tools in risk assessment of adult SCD patients; however, there is no consensus on which tools yield the most accurate risk assessment.
Another emerging tool will be the exploration of genetic mutations and common
polymorphisms, which may alter expression profiles. The advancement of genotyping technology has made progress as a screening tool in the identification of patients at risk for complex disorders [13, 15, 27]. This study will utilize the candidate gene approach to explore a common microsatellite in the intron of the CRP gene and its association to serum CRP levels. Exploration of a common polymorphism found to be more prevalent in the AA population [12] may advance the understanding of its clinical significance.
Treatment of multi-factorial diseases such as nephropathy, pulmonary
hypertension, and cerebral vascular accidents and SCD by conventional means requires identification of the roles each factor contributes to the disease process and understanding the pathophysiology of the disease. Assessment of risk factors involved in multi-factorial disease impacts treatment and the patient’s personal assessment of how they view of health.
All possible avenues for identification of this at risk SCD population need to be
verified and explored. These patient’s risks need to have a quantifying score to assist in healthcare utilization and maintenance. Promoting self-care and healthy life style choices will be crucial to patients with a chronic illness to maximize their quality of life. Understanding all complex interacting factors will be valuable to promote an improved healthy life-style.
3
It is imperative for health care providers to establish a multidisciplinary approach
for effective and efficient health care. Nurses are poised to play a pivotal role in the delivery of care through their skills in research, patient-provider interaction and interpretation of bench to bedside care. One nursing role is to bridge the existing gaps between the geneticists, primary care providers, and the patient population. Another role will be the ability to identify and develop genetically based educational materials addressing the complex issues of SCD.
This research may supply the clinical providers with vital screening information.
This assessment information could identify individuals with the greatest risk for end-organ dysfunction. Healthcare providers could determine which individuals may benefit from dietary restrictions, nutritional or vitamin supplementation and drug therapy which could impact the care of this vulnerable population. The long term goal of clinical providers is to promote the health of patients with SCD and that nursing research would be part of accomplishing that goal. Such research will integrate genetics, and risk assessment of end-stage organ damage, in SCD, leading to programs for more efficient health care utilization, and improved morbidity and mortality rates in this vulnerable population.
Conceptual Framework
Healthcare providers believe risk assessment involves the physical body and the physical environment. They judge the amount of risk and attempt to adjust the environment to decrease risk [28]. Analyzing data depends on prior knowledge and is necessary to process any given information such as physical conditions, environment and risk factors. Healthcare providers likely have knowledge the patient has not acquired. Patient knowledge and understanding of facts as presented influences patient decisions and health care choices. Healthcare providers and patients view the impact of risk assessment differently. Within healthcare, risk is the notion that extends the clinical view beyond the physical body and into the domain of the environment. Healthcare providers identify the scope of risk and attempt to regulate the patient’s environment to decrease risk [28]. By analysis of the concept of risk, it has been determined that to acknowledge risk is necessary to process the concept.
According to Huber, et al. (1997), risk research reveals that many aspects are
relevant to patients. Subjective patient perception and patient evaluation of risk influences the understanding of negative outcomes and subjective probability. This concept may explain why patients continue to choose behaviors that healthcare providers identify as risk inducing. These chosen behaviors are not perceived as a risk to the decision maker. Prior knowledge, personal experience, education, and environment are influencing factors in the decision making process. Presenting risk information enables patients to understand choices and empowers them in the decision making process [29, 30].
4
The patient must have the cognitive ability to distinguish between two or more choices and the consequences of the choices. Patient cognitive ability, evaluation, and education will be necessary to enhance the patient’s decision-making process. Information overload and patient request for information should not be confused with their decision-making process or their assessment of risk/benefit ratios.
There are accepted terms used to define risk that focus on judgment and decision-
making [28]. Risk is a measurable uncertainty and is usually related in statistical percentages. When patients recognize and accept that understanding of risk, information then becomes more meaningful in their judgment and decisions in relation to risk-taking [31]. According to Kraemer, et al (1997), “a risk factor is a measurable characteristic of each subject in a specific population that precedes the outcome of interest” (p.337) [32]. Society now associates risk with negative outcomes, especially in healthcare. “The concept of risk is the uncertainty surrounding the translation of scientific knowledge into clinical practice” (p.5), [31]. Risk precedes the threat of a negative outcome. Jacobs identifies three epidemiological conceptions of risk, absolute risk, relative risk and attributable risk [31]. Patients assessing risk must view the impact of risk as important and meaningful enough to influence judgments. Decisions need to be made in relation to recognizing the outcome of risks taken.
Risk estimation is another term used generically for risk factors [32]. Weight of
evidence, is also a term often used in the discussion of risk assessment [33]. Decision research is the amount and accuracy of information gained to assess the risk of decisions [34]. Non-adherence is another related term pertaining to risk. Chater (1999) states “the notion of non-adherence has been classified as risk-taking behavior, which can be modified if the individual adheres to medical advice” (p.136) [28]. Clearly defined risk concepts include but are not limited to risk relationship to health outcomes, one model that uses the construct is the Interaction Model of Client Behavior. This model, see Figure 1.1, will provide the framework for this proposal and future research [35].
The Interaction Model of Client Health Behavior is abstract in nature and is defined by three major elements: client singularity, client-professional interaction, and client health outcomes. First, the client singularity element includes background variables of demographic characteristics, social influence, previous health care experience, and environmental resources. Within this abstract element there are variables of intrinsic motivation, cognitive appraisal, and affective response. These constructs are defined as independent of each other but having temporal order and mutual interactions. All are well defined but still abstract in definition. They can be operationally developed into measurable variables. This element emphasizes the holism and uniqueness of the individual.
Second, the client-professional element accentuates numerous factors that define nursing interventions. The broad concepts are affective support, health information, decisional control, and professional/technical competencies. Affective support includes supplying emotional support, assessment of motivation, and specificity of health information given to the patient. Health information includes both giving and receiving
5
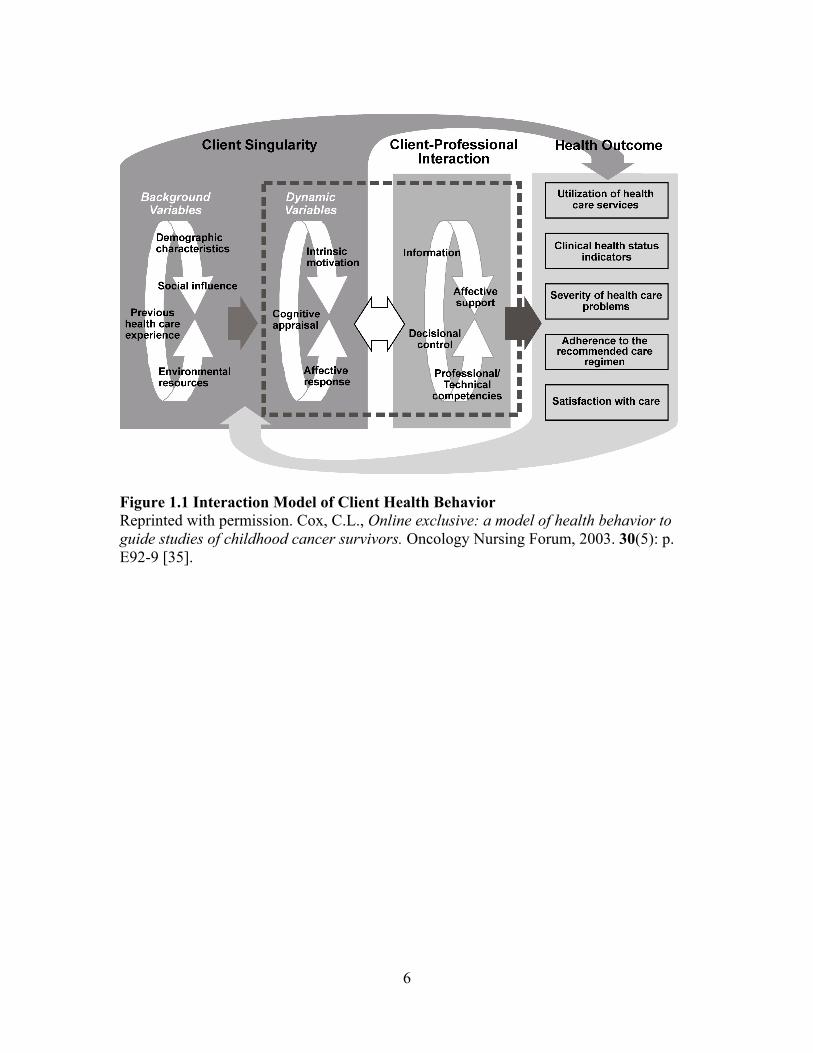
Figure 1.1 Interaction Model of Client Health Behavior Reprinted with permission. Cox, C.L., Online exclusive: a model of health behavior to guide studies of childhood cancer survivors. Oncology Nursing Forum, 2003. 30(5): p. E92-9 [35].
6
information. Health care providers must persistently review current research and improve methods of providing appropriate patient education. Nursing and other health care providers can take research from bench to bedside to facilitate desired health outcomes. Healthcare providers can direct decisional control, but patients must or should take ownership of risk taking decisions, based on informed consent, when there are 2 or more choices. Patient perceived professional/technical competencies of healthcare providers are crucial to their decision making process.
The third element, client health outcomes include utilization of health care
services, health indicator status, severity of health problems, adherence to treatment plans and satisfaction with current care [35-37]. Health outcome elements are very broad and allow maximum flexibility in efforts to facilitate nursing research by operationally defining outcomes to care received [35, 36].
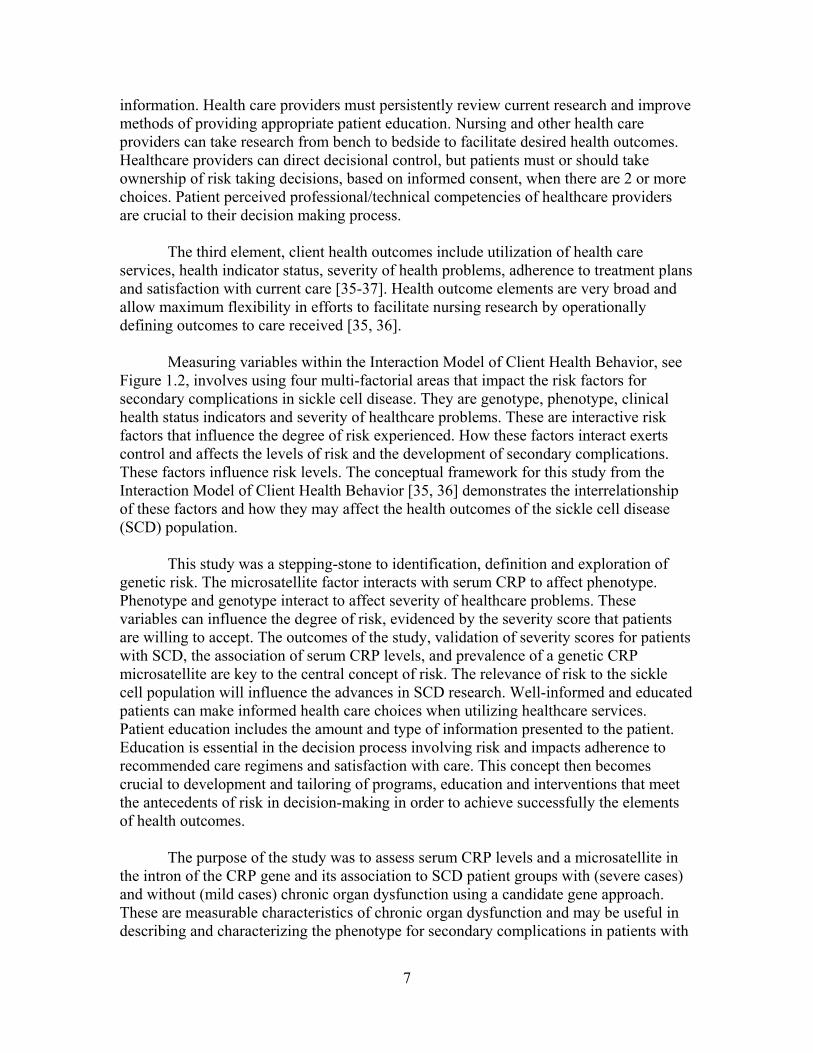
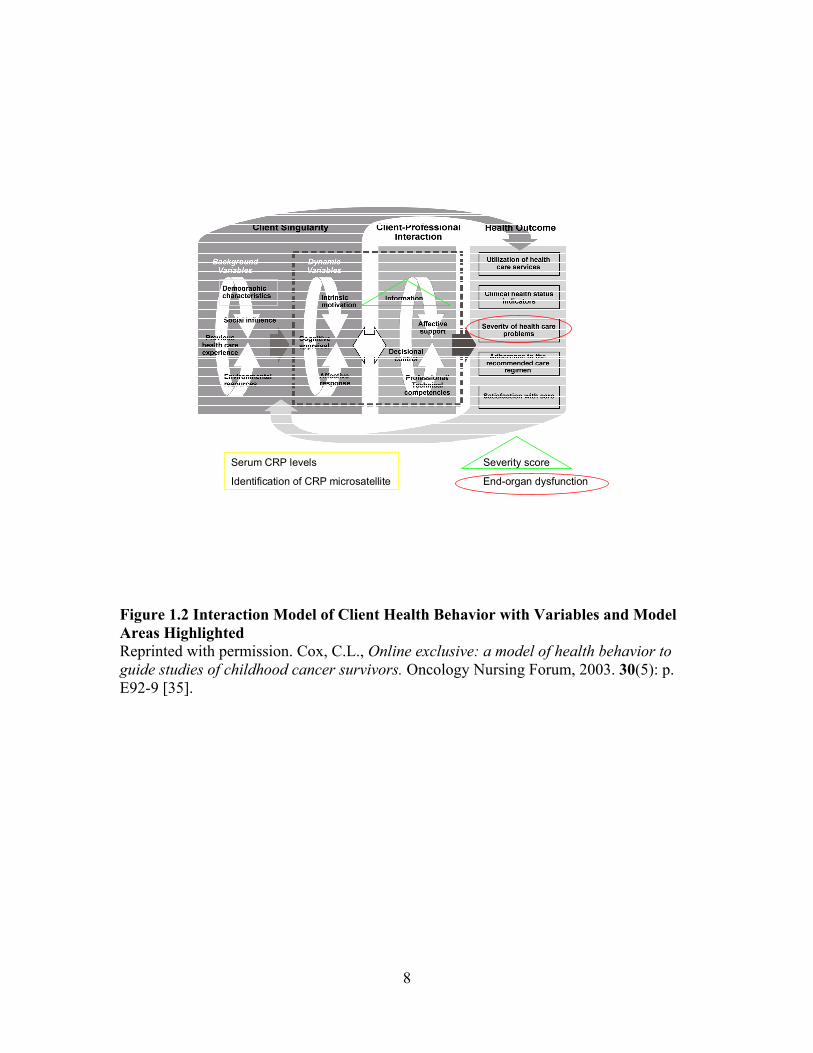
Measuring variables within the Interaction Model of Client Health Behavior, see Figure 1.2, involves using four multi-factorial areas that impact the risk factors for secondary complications in sickle cell disease. They are genotype, phenotype, clinical health status indicators and severity of healthcare problems. These are interactive risk factors that influence the degree of risk experienced. How these factors interact exerts control and affects the levels of risk and the development of secondary complications. These factors influence risk levels. The conceptual framework for this study from the Interaction Model of Client Health Behavior [35, 36] demonstrates the interrelationship of these factors and how they may affect the health outcomes of the sickle cell disease (SCD) population. This study was a stepping-stone to identification, definition and exploration of genetic risk. The microsatellite factor interacts with serum CRP to affect phenotype. Phenotype and genotype interact to affect severity of healthcare problems. These variables can influence the degree of risk, evidenced by the severity score that patients are willing to accept. The outcomes of the study, validation of severity scores for patients with SCD, the association of serum CRP levels, and prevalence of a genetic CRP microsatellite are key to the central concept of risk. The relevance of risk to the sickle cell population will influence the advances in SCD research. Well-informed and educated patients can make informed health care choices when utilizing healthcare services. Patient education includes the amount and type of information presented to the patient. Education is essential in the decision process involving risk and impacts adherence to recommended care regimens and satisfaction with care. This concept then becomes crucial to development and tailoring of programs, education and interventions that meet the antecedents of risk in decision-making in order to achieve successfully the elements of health outcomes.
The purpose of the study was to assess serum CRP levels and a microsatellite in the intron of the CRP gene and its association to SCD patient groups with (severe cases) and without (mild cases) chronic organ dysfunction using a candidate gene approach. These are measurable characteristics of chronic organ dysfunction and may be useful in describing and characterizing the phenotype for secondary complications in patients with
7
Serum CRP levels Severity score
Identification of CRP microsatellite End-organ dysfunction
Figure 1.2 Interaction Model of Client Health Behavior with Variables and Model Areas Highlighted Reprinted with permission. Cox, C.L., Online exclusive: a model of health behavior to guide studies of childhood cancer survivors. Oncology Nursing Forum, 2003. 30(5): p. E92-9 [35].
8
sickle cell disease (SCD) and may be useful in determining a severity score. A severity score could compliment a physical assessment of underlying secondary complications. Healthcare providers could use this information to direct and guide therapeutic decision-making. This study was a stepping-stone to identification, definition and exploration of this genotype and was used to build on a thorough understanding of the dynamic relationship between genotype, phenotype and severity of health problems.
Definition of Terms Theoretical definitions for the major concepts within the conceptual model are presented. In addition, because there are a variety of published definitions available for the terms used in this study, the following theoretical and operational definitions for the variables are provided and used in this study. Elements of Client Singularity and Client Professional Interaction C-Reactive Protein (CRP): C-reactive protein (CRP) is a genetically controlled and highly conserved plasma protein, which participates and is active in the process of inflammatory response to any injury or foreign substance. CRP functions by recognizing damaged cells and foreign pathogens and initiating an acute phase reaction. This reaction has an important role in the innate immunity response the body initiates when invaded by pathogenic organisms. This activates the classical complement pathway for the defense system against infections and injury and stimulates phagocytosis. Genotype: The genetic make-up of an organism or groups of organisms with reference to a single trait, a set of traits, or an entire complex of traits [38]. Genotype is characterized by an individualized genetic code made of base pair nucleotides [38]. It is typically studied collectively or with respect to one or a few genes of interest. Phenotype: The observable and measurable characteristics or properties of an organism. These properties are a result of interactions between genes and environment. Polymerase Chain Reactions (PCR): The process of repeated cycles using DNA to denaturation, and renaturation with primer oligonucleotide sequencing in order to grow copies of a specific DNA sequence identified by the primers. Polymorphism: A variation of alleles that is so common that it is found in more than 1% of the general population. It may represent a change in the sequence of the DNA affecting the functioning expression within the gene or result in the manufacturing of a different protein. Sickle Cell Disease (SCD): SCD is a single gene, autosomal recessive mutation. This group of genetic disorders share a common feature: hemoglobin S (HGB S), alone or in combination with other abnormal hemoglobin. Within this broad classification of SCD
9
there are numerous genotypes including Hgb SS, Hgb SC, and Hgb β+ and 0 thalassemias. The genetic substitution occurs on chromosome 11, in the sixth position and is a substitution of valine for glutamic acid [39]. This substitution results in a polymerization of the hemoglobin and causes transformation of the erythrocytes. Presence of this mutation is determined by electrophoresis. SNM Severity Score: A Bayesian network model designed by Paola Sabastiani to estimate sickle cell disease severity [9]. Elements of Health Outcomes Cerebral Vascular Accident: Ischemic vaso-occlusion resulting from polymerization of the deoxygenated erythrocytes involving medium to large intracranial arteries. Some genetic factors may contribute to the phenotypical expression in SCD to this complication. End-stage Organ Disease: Chronic irreversible failure of a specific organ function. This damage commonly occurs in the cerebral, renal, pulmonary, and retinal vasculature and is related to microvascular injury. These occlusions and damage may remain subliminal until an acute response or change in status is observed. Pulmonary Hypertension: Sustained elevations of pulmonary artery pressure. Measured by echocardiogram and identified by Doppler ultrasound of the tricuspid regurgitation. Using the velocity of the regurgitation jet across the tricuspid valve a value of greater than 2.5 m/sec is considered significant for pulmonary hypertension. Sickle Cell Nephropathy: A consequence of sickled erythrocytes, resulting in decreased medullary blood flow, ischemic microvascular insults and papillary necrosis. Observable manifestations are impaired concentrating ability, hematuria, and loss of potassium. Sickle Cell Retinopathy: Vision loss in patients with SCD. The development is insidious and the patients usually are asymptomatic until hemorrhage or retinal detachment occurs. Sickle cell retinopathy may differ from diabetic retinopathy due to the increase of spontaneous or transient vision loss.
Assumptions 1. Phenotype of SCD in adults with SCD cannot be predicted by the hemoglobin
genotype alone. 2. Cumulative organ damage in adults with SCD is a better predictor of early mortality
than pain episodes. 3. Retrospective laboratory levels collected and processed by the study site followed a
standard operating procedure, and are accurate and reliable.
10
4. Expression of adhesion molecules in endothelial cells is up-regulated by serum CRP levels [40].
Potential Limitations 1. The principal limitation was the interpretation of the results in using a convenience,
cross-sectional data collection. The causal pathways underlying the variables will not be inferred to the relationship of secondary complications and end-stage organ damage.
2. The data collected regarding environmental factors was patient reported and was a limitation of this study.
3. SCD is considered an orphan disease with only approximately 100,000 patients in the United States. A power analysis was done to determine group size, but limitations exist with the use of a single center for patient recruitment and may have influenced the ability to obtain an adequate sample size.
4. If patients were not experiencing secondary complications, compliance with routine evaluations may not have occurred.
5. Processing specimens by a novice bench science researcher may have influenced the results. Saliva sampling was collected and stored by protocol and overseen by an NIH funded molecular lab with an experienced lab manager. Each sample was split and stored for replication submission if needed.
6. Genetic evaluation and identification of polymorphisms associated with expression levels continues to grow at a phenomenal rate. Results found in the literature have not been replicated to provide enough evidence to clearly use the selected microsatellite polymorphism as the strongest univariate predictor of risk.
11
CHAPTER 2. REVIEW OF LITERATURE
Sickle Cell Disease A review of literature relevant to the major concepts proposed in the conceptual framework is included in this chapter. The first section addresses SCD pathophysiology, prevalence, and risk. End-organ dysfunction associated with SCD is reviewed in section two. The final section of this chapter focuses on the role of inflammation, particularly CRP, in SCD and end-organ dysfunction and discusses genetic variations in the CRP gene. Pathophysiology SCD is the most prevalent genetic disease among the African-American population affecting approximately 100,000 people in the United States [1, 22]. The initial description of SCD was documented by Herrick in 1910 [41]. Sickle cell disease is a single gene, autosomal co-dominant mutation. This group of genetic disorders share a common feature: hemoglobin S (Hgb S), alone or in combination with other abnormal hemoglobin. Within this broad classification of SCD there are numerous genotypes including Hgb SS, Hgb SC, and Hgb β + and 0 thalassemia. The molecular basis was described in 1957 by Ingram as a genetic substitution for Hgb SS on chromosome 11, in the sixth position and is a substitution of valine for glutamic acid [39, 42]. The genetic substitution for Hgb SC was first described by Itano in 1950 [6] and was found to be a milder form of SCD. This haplotype and the β-thalassemia mutations are associated with hemoglobin red blood cell production. All of these substitutions result in a polymerization of the hemoglobin and causes transformation of the red blood cells. These changes lead to complications related to micro-vascular occlusions and chronic anemia. Variability of the expression of this disease is difficult to predict, but if both β-globin chains are affected the disease process may be more severe. The severity of the disease process and prediction of the phenotype are still unknown [4, 8, 43], and disease management creates a unique challenge.
If oxygen levels drop, morphological changes occur in the erythrocytes as the
Hgb S molecule polymerizes. The erythrocytes elongate into sickled shapes. The erythrocyte becomes fragile and changes shape with each deoxygenation-induced Hgb S polymerization. As these deformed cells move through the vascular system, episodic vascular occlusions occur. The occlusions interrupt or slow the blood flow causing microvascular oxygen deprivation. These occlusions are sporadic and vary in nature and intensity by individual patients.
Some occlusions are clinically undetectable initially but may involve multiple organs and tissue. Literature agrees that the red blood cell production for sickled cells is initiated by the mutation of the hemoglobin gene on chromosome 11. There remains a wide variability of the disease which cannot be fully ascribed to the deoxygenation
12
process of deformity; but the greatest clinical severity has been linked to the highest intra-erythrocyte Hgb S levels [6]. The pathogenic mechanism responsible for acute painful episodes may not reflect the same pathophysiology of organ damage [6]. Over the past 25 years, advances in early childhood treatments with prophylaxis penicillin have increased the life expectance of adults with SCD well into adulthood [1, 4, 8, 22, 43, 44]. The evolving clinical course of these adult patients remains associated with significant morbidity including leg ulcers, pulmonary hypertension, avascular necrosis, renal failure and stroke [5, 43, 45]. According to the US Department of Health and Human Services, “health maintenance activities must also address interactions between SCD and other common health problems of the adult population” (p. 41), [2]. Hydroxyurea is another relatively new environmental factor in the treatment regime of SCD. Hydroxyurea is used as an adjunct in the management of SCD to increase baseline hemoglobin and reduce painful episodes [39]. Long-term studies are underway to help identify the effects of this treatment but results are still pending. The vast majority of studies with hydroxyurea are in the Hgb SS population, indicating the Hgb SC population will be under represented in research findings. Prevalence, Prediction, and Risk Factors Unfortunately the elevated morbidity and early mortality risk remain through adulthood, in large part because of the effect of cumulative end-organ damage. Adults with SCD have extreme variable phenotypes, which can change through out their lifetime. Organ damage begins in childhood [6, 46-49]. There is a strong correlation between cumulative organ dysfunction and early mortality in patients with sickle cell disease [9, 50-52]. Development of chronic organ dysfunction is a more reliable predictor of early mortality than frequency of painful episodes, even though the latter gets more attention from patients and their caregivers. Any organ with a blood supply is susceptible to damage in patients. However, the most common target organs are the brain (cerebral vascular disease, ischemic and hemorrhagic stroke), lungs (pulmonary hypertension, restrictive lung disease, possibly, reactive airways disease), kidneys (protein-losing nephropathy, focal glomerulosclerosis, end-stage renal disease), retina (proliferative retinopathy) and joints (avascular necrosis), especially the hip and shoulder joints. The full extent of organ dysfunction in populations of patients with SCD is only now being recognized from recent studies of adult populations [2, 4, 53-57]. The studies have often identified advanced stages of organ damage such as end-stage renal disease, clinically overt stroke, and significant pulmonary hypertension. The prevalence of early signs of target organ dysfunction has not been widely reported. To make progress in the prevention of chronic organ damage and early mortality, better information is needed on the prevalence of early organ dysfunction, natural history and pathophysiology of cumulative organ damage.
13
Healthcare providers have been searching for a prognostic model to account for the complex nature of this disease process. A vast majority of the work has been in the pediatric setting [50, 58]. In the adult setting several independent risk factors have been identified with mortality, such as hemoglobin F% [4, 5], diastolic dysfunction [59], and CVA [58, 60]. Predicting the severity of SCD may assist the healthcare provider with a more precise prognosis, tailored treatment plans and minimize hazardous interventions. Numerous clinical and genetic variants are involved in the severity of SCD. Forecasting the severity of the SCD population has proven to be challenging. Models, which predict both end-organ dysfunction and mortality risk in adults with SCD, are needed. Understanding the relationship between the clinical and genetic variants would be helpful in measuring severity of SCD. Sebastiani, et al was the first to attempt to integrate 13 laboratory tests, 7 clinical events and demographic and treatment information into a Bayesian network modeling approach for predicting 5 year mortality [9]. This Bayesian network model was built on associations of variables and assumes “death” was the central component. All other variables stemmed from death. Key clinical and laboratory variables were then identified. The study concluded that the 14 variables: age, gender, systolic blood pressure, stroke, sepsis, white blood cell count, reticulocyte count, pain, priapism, blood transfusion therapy, lactate dehydrogenase (LDH), bilirubin, mean corpuscular volume (MCV), and acute chest syndrome were sufficient to predict the risk of death [9]. There were ten additional variables in the model that included hemoglobin genotype (Hgb SS, SC, Sβ+, or Sβ0), serum hemoglobin levels (Hgb), hemoglobin fetal percent (Hgb F%), platelet count, leg ulcers, serum creatinine, proteinuria, avascular necrosis (AVN), aspartate aminotransferase (AST), and alanine aminotransferase (ALT). The model showed these variables could be discerned by the earlier 14 variables The use of this model computes a score, which ranges from 0 (least severe) to 1 (most severe). The authors feel that this score would give an unbiased assessment of clinical severity. The initial data source included 3380 adult and pediatric patients from the Cooperative Study of Sickle Cell Disease (CSSCD). The average age of this population was 20 years. The authors used two unrelated data sets to confirm and validate their results [9]. The error rate was 7.5%, suggesting a positive predictive value for the severity score in estimating the likelihood of death within 5 years. There are several of the limitations of this model. First, genetic polymorphisms that could modulate the serum laboratory levels are not included in the model. A second consideration is the utility of applying this model to very young patients, who have not experienced many episodic vascular occlusions or childhood complications. A final consideration is the model may not accurately integrate treatment regimes such as chronic blood transfusions and hydroxyurea [9]. Sickle cell disease is characterized by micro-vascular occlusions, affecting a variety of organs, which may culminate in end-organ dysfunction. Despite advances in
14

treatments, adults with SCD have an elevated morbidity and early mortality risk largely because of secondary complications resulting in cumulative end-organ dysfunction.
End-Stage Organ Damage There is a substantial body of research that documents the variety of end-organ dysfunction, which occurs in adults with SCD. This review of literature analyzes three organ systems that impact the morbidity and mortality of these patients. The pulmonary hypertension, renal and cerebral vascular systems are all effected by micro-vascular occlusions related to this hemoglobinopathy. The micro-vascular occlusions have also been linked to the inflammatory process. C-reactive protein is a major component of the inflammatory complement. The association of serum CRP levels and genetic polymorphisms is also evaluated. Pulmonary Hypertension Pulmonary hypertension (pulmonary hypertension) is a severe complication and end-organ dysfunction in adults with SCD and has been linked to an increase in mortality [55, 59, 61, 62]. Reported prevalence of pulmonary hypertension is between 20% and 35% in adults with SCD [55, 59, 61]. One study reported a median survival rate of 25.6 months after diagnosis of pulmonary hypertension [54]. The lost of elasticity when the red blood cells sickle, results in microvascular occlusions and myocardial cell damage. While the exact pathogenesis is multifactorial, the reduced blood flow and the resulting ischemia are a major factor in the damage to the myocardium [6, 63]. Low hemoglobin levels in most SCD patients are associated with a high cardiac output secondary to an increase in the preload and decrease in the afterload, leading to cardiomegaly [6]. In patients not afflicted with SCD, but with chronic anemia, low hemoglobin levels are not associated with an increase in preload and cardiomegaly [62]. Heart murmurs, possibly from increased stroke volumes, have also been documented in SCD patients [62]. One study showed that the heart of a typical SCD patient is dilated, with septal hypertrophy but normal contractility [62]. Factors that may ameliorate the development of pulmonary hypertension are high levels of fetal hemoglobin and patients receiving hydroxyurea [55, 64]. Hydroxyurea therapy is attributed to raising fetal hemoglobin levels, and long-term early childhood use is being tested to determine if organ damage can be reversed or eliminated [64]. At present hydroxyurea is not considered a treatment for pulmonary hypertension. There is one study soon to be underway looking at the role hydroxyurea may have in preventing and treating PHT [65]. One study found the majority of patients with moderate to severe pulmonary hypertension (n = 42) had no correlation to genotype diagnosis of hemoglobinapathy sickle cell [61]. The early symptoms of pulmonary hypertension are nonspecific and the course of this complication is gradual. Fatigue, minimal activity, chest pain, and dyspnea can
15
mimic a patient with SCD who does not have pulmonary hypertension [61]. Screening may be crucial to a proper diagnosis. A right ventricular heart catheterization is the diagnostic measurement of choice for the most accurate diagnosis, but this invasive test is not a suitable screening tool [55]. Echocardiogram is widely used to screen for pulmonary hypertension [55, 61, 63]. The gold standard for quantifying the degree of heart failure is the ejection fraction, usually obtained with an echocardiogram. It has been demonstrated that the reading of right ventricular ejection fraction is not an accurate screening measurement of dysfunction in the patient with SCD [55] due to the normal contractility of the dilated heart muscle. Tricuspid regurgitation jet velocity (TRJV) can be measured with a Doppler echocardiogram and has been demonstrated to correlate well with readings obtained from cardiac catheterization [55, 66]. A diagnosis of pulmonary hypertension using the measurement of TRJV is accepted as the standard [55, 59, 61]. In one study a finding of 2.8-3.4 m/sec was used to define mild pulmonary hypertension [67]. The accepted diagnosis of pulmonary hypertension in patients with SCD is defined by TRJV of > 2.5 m/sec [61, 67]. Analysis of the enlargement of the right ventricle and its subsequent dysfunction is controversial. Marchano reported in a sample of adults with SCD (n = 141), 18% presented with evidence of diastolic dysfunction but only one-third had increases in TRJV [68]. Other measures such as total peripheral vascular resistance and heart chamber dilations are being explored to fully evaluate pulmonary hypertension [63]. Blood transfusions have been used in some patients [6] but the effectiveness remains controversial. One study showed some promising results treating pulmonary hypertension using oral arginine. In this small study 10 SCD patients were given a 5-day course of arginine, and a significant decline in pulmonary artery systolic pressure was found [69]. In another larger trial using arginine in children and adults with SCD failed to show the arginine had any cellular effect and did not show a reduction of TRJV [70]. Other treatment options include anticoagulation therapy, prostacyclins, and endothelin receptor antagonists, and are treatments options in non-sickle cell disease pulmonary hypertension populations [55]. While these treatments are being used in adults with SCD, there is little data to support their utility and success. Cerebral Vascular Disease Central nervous system (CNS) complications are among the most devastating secondary manifestations and have been recognized as key factors of morbidity and mortality in SCD. The risk of having a cerebral vascular accident (CVA) is 1 in 10 children with the hemoglobin genotype of SS [6]. There are several factors that contribute to CVA in SCD, and two occurring types: cerebral infarction and intracranial hemorrhage. One factor is large vessel lesions that restrict blood flow. Another factor involves small vessels and microvascular infarctions occurring from occlusions derived from circulation of sickled erythrocytes. A third factor is chronic anemia, which deletes cerebral vascular reserves and contributes to the formation of lesions and occlusions [6].
16
Eighty percent of CVA’s in SCD are infarction, but intracranial hemorrhage can coexist in the damaged area. Intracranial hemorrhage may be the result of aneurysms promoted by lesion formation. Intracranial hemorrhage is thought to be more prevalent in young adults. The average age of persons experiencing intracranial hemorrhage is 24 years [71]. CVA from infarction has been described in children prior to age 20 years [60]. CVA in SCD was first described in 1923 by Syndenstricker [6], using the neurologic exam as the basis of diagnosis with clinical manifestations of hemiparesis, facial asymmetry, and aphasia, with or without diminished mental capacity [72]. By the early 1970s cerebral arteriograms were reporting evidence of stenosis or occlusions of the distal internal carotid arteries or the proximal portions of the anterior cerebral arteries [73, 74]. During the 1990’s magnetic resonance imaging (MRI) and magnetic resonance angiography (MRA) testing revealed additional information on the extent and location of cerebral damage. The concept of silent cerebral infarcts was introduced and more screening for damage was initiated in children [58, 75]. Patients with overt CVA have a 46% to 90% risk of recurrent CVA [6] and intervention therapy of chronic transfusion has been a widespread practice since the 1970’s [76, 77]. The length of time transfusion therapy is used is under considerable question and many adult patients remain on this therapy. No clear guidelines for discontinuation have been established [78]. Chronic transfusion therapy is associated with significant risk of iron overload and alloimmunization. Anticoagulation therapy is not advised, due to the increased risk of intracranial hemorrhage in the patient with SCD. SCD Nephropathy The kidney is a major target for functional and structural damage for patients with SCD [53, 79, 80]. The kidney is affected along the length of the nephron from the glomerulus to the papillary tip. SCD alters the glomerular structure and function by allowing free filtration of H2O and small molecules but retards the filtration of proteins. Because of the microvascularity of the kidney is sensitive to hypoxia from sickled erythrocytes. There is an increase in oxygen consumption that may be induced by an increase in metabolic activity. SCD causes a sclerosing process leading to glomerular enlargement, identified as glomerulosclerosis [6]. Enlargement is most likely due to increased glomerular filtration rate (GFR). Changes in oxygen delivery from ischemic reperfusion injury also contribute to the physiological disturbances especially in the blood flow to the distal nephron and medullary [81]. Three major abnormalities have been identified in patients with SCD: 1) the decreased ability to concentrate urine, 2) incomplete formation of the distal renal tubule leads to increased acidosis, and 3) impaired potassium metabolism [6, 56, 81]. Kidney function is also complicated by cardiac-output. The ability to concentrate urine is dependent on the structural integrity of the loops of Henle. In patients with SCD, the defect is a result of the loss of deep juxtamedullary nephrons. The outer medulla remains unaffected, therefore under baseline
17
stable conditions the concentration ability is not affected [6]. When there is any volume loss or episodes of dehydration the condition is exacerbated. It is suspected this abnormality occurs at an early pediatric age [53, 56, 81].
In urinary acidification, the severity of the defect is directly related to the extent of the concentration defect. It occurs as a combination of events, primarily through the incomplete form of the distal tubule [6].
Potassium excretion by the kidneys is regulated by the action of aldosterone upon the distal tubule. Renal insufficiency is difficult to detect until progressive injury has occurred and serum indicators of nephropathy differ in patients with SCD. Treatment options using an ACE inhibitor may exacerbate hyperkalemia in patients with SCD, the hyperkalemia leads to an overestimation of GFR, when measuring normal serum creatinine levels [6]. Inaccurate GFR results make it imperative to healthcare providers to request patients complete a 24° urinalysis. A 24° urinalysis is the gold standard of kidney function and an accurate estimation of kidney function. Function can be measured but testing is not without problems [82]. It is difficult for patients to capture all of the urine in the designated time period, and to return the urine immediately to the lab for analysis. Transportation to and from the laboratory can be challenging and expensive for many adults with SCD and is an additional burden of chronic illness management.
The traditional definition of normal serum creatinine levels higher than 1.49 mg/dL (> 132 µmol/L), seriously underestimates the frequency and severity of renal impairment in patients with SCD (Hgb SS) [80]. There is currently no accepted definition of adjusted serum creatinine levels for SCD patients.
Inflammation and abnormal adhesion of sickled cells are thought to contribute to vascular occlusions that lead to chronic end-organ dysfunction [5, 10, 21, 24]. CRP induced inflammation is an acute phase response to vascular damage. Serum CRP levels are a newly recognized serum biomarker for vascular damage [25, 26, 83] but little literature addresses the utilization of CRP levels in assessing potential end-organ dysfunction in adults with SCD [21].
C-Reactive Protein
C-reactive protein (CRP) is a genetically controlled and highly conserved plasma protein, that participates and is active in the process of inflammatory response to any injury or foreign substance [40]. CRP functions by recognizing damaged cells and foreign pathogens and initiating an acute phase reaction. This reaction has an important role in the innate immunity response the body initiates when invaded by pathogenic organisms. CRP activates the classical complement pathway for the defense system against infections and injury and stimulates phagocytosis [40]. Tillett and Francis, first described this plasma protein in the 1930’s as a marker for pneumococcal infections [84]. Advances in the testing procedures and measuring of the CRP levels have found a link between CRP levels and low-grade chronic inflammatory responses that may point to the
18
development of Metabolic Syndrome (Met-S), and cardiovascular disease (CVD). The purpose of this discussion is to define the serum and genetic characteristics of CRP and its relationship to Met-S, CVD, and sickle cell disease (SCD).
Plasma CRP levels fluctuate in response to acute inflammation. Inflammation is
an immune response; it can be initiated by injury, infection or possibly by genetic predisposition. In healthy adults in a steady state, the plasma concentrations are in the range of 0.1 to 10 mg/L [14]. Traditional CRP has been used primarily as a marker of inflammation. There can be a 1000 X rise in plasma concentration levels following tissue damage or inflammation [14, 40]. Plasma protein levels have been used to determine disease progress or the effectiveness of treatments for many years. The specificity of the CRP test is general, only establishing the presence of inflammation and response to treatment. Secondary elevations in the plasma levels have been identified with inflammatory diseases, such as rheumatoid arthritis, autoimmune diseases, and inflammatory bowel disease. In the 1990’s a direct correlation between unstable angina and elevated plasma CRP levels was described [85-87]. CRP plasma protein is produced in the liver and smooth muscle cells of the coronary arteries [40, 88].
The CRP molecule structure consists of five identical noncovalent protomors clustered around a central core [40]. The surface contains binding sites and receptors that interact in the function of the molecule. There are critical interactions in a number of bacterial species but the configuration of the molecule makes circulating CRP inaccessible to normal cells. The CRP molecule can only bind to bacterial molecules in damaged and apoptotic cells [40, 88].
There are five essential functions of the CRP molecule. The first CRP function is to recognize and identify pathogens in the blood. When increased pathogens are recognized the release of increased levels of CRP is initiated. The second follows the first and is activation of the complement system. The complement system consists of 30 proteins that play an important role in body defense mechanisms that fight infection.
The third CRP function is to enhance phagocytosis. The most important facet of phagocytosis is its control of inflammation. Depending on the phagocytosed particle, phagocytosis can induce inflammation or, as in the case with apoptotic cells, induce resolution of inflammation. Phagocytosis is also involved in immune tolerance that prevents inflammation against normal components of the body.
The fourth CRP function is to up-regulate the expression of adhesion molecules in
endothelial cells. The fifth function of CRP is to inhibit endothelial nitric-oxide synthesis [40]. The CRP abilities to up regulate the expression of adhesion molecules in endothelial cells and to inhibit endothelial nitric-oxide synthesis are essential. Endothelial nitric-oxide generates nitric-oxide in blood vessels to regulate vascular function.
Approximately two-thirds of the American population have a plasma CRP level
under 3 mg/L [85]. A serum CRP level > 10 mg/L has been considered abnormal. Traditionally, higher normal circulating CRP levels, greater than 3 but less than or equal
19
to 10 mg/L, have been historically regarded as clinically insignificant. The estimated time to complete a plasma CRP level test is approximately 5 minutes. Test results can be reported in approximately 4 hours. Progressive increases in CRP levels correlate with increases of inflammatory injury. CRP levels may be used to follow therapeutic response medications. A higher sensitivity CRP level test (hs-CRP) has been developed. This is an automated blood test designed for greater accuracy in measuring chronic slight increases in CRP levels.
In the past 5 years there has been increasing evidence of the usefulness of CRP testing and research related to CRP levels. Research has been expanding in two areas. The first is using serum CRP levels as biomarkers and explaining the relationship of numerous disease processes to elevated CRP levels. The second is the emerging genetic characteristics and information that are being generated by the CRP gene. This information specifically looks at the CRP function and expression of the plasma protein in circulating blood. Nurses must be informed and knowledgeable regarding the advances involving this inflammatory biomarker. Atherosclerosis
Inflammation characterizes the process of atherosclerosis, and atherosclerotic plaque may be an important source of systemic markers of inflammation [89]. Increasing inflammation is associated with clinically instability of atherosclerosis [89]. Questions arise regarding the reliability of novel biomarkers to provide reliable, accurate, and cost-effective information and their ability to predict future events.
CRP is present in atherosclerotic plaques and has been associated with plaque
instability and thrombosis [15]. It is possible, through an effect on acute phase response, CRP genotype is more strongly associated with more severe events [15]. It was first reported in 1990 that CRP levels were elevated in patients with unstable angina [87]. Another landmark study demonstrated elevated CRP levels were useful in predicting the long term outcomes of unstable angina patients [86]. It was reported in a 1997 study, that CRP levels were elevated for many years prior to a myocardial infarction or CVA [90]. Study participants were men with increased CRP levels and the results showed a 3-fold increase in risk for myocardial infarction (MI) and a two-fold increase in risk for stroke. This study increases the probability of predicting risk of MI as many as 8-years in advance [90].
The CRP biologic marker of interest was also key in several prospective nested
case-control studies, that were associated with increase risk of MI, stroke, sudden cardiac death, and peripheral arterial disease [91]. CRP was found to be a strong predictor of future cardiovascular risk, and reported some clinical value with the treatments of statin therapy for primary prevention among persons with elevated CRP but low LDH levels [91]. A more sensitive measure of low serum levels of CRP is the hs-CRP test; several studies employ this measure to gauge inflammation.
20

The Women’s Health Study (WHS) conducted several important follow-up studies using CRP values. Results found that hs-CRP is associated more closely with ischemic stroke than CVD and that concomitant evaluation of lipid levels and hs-CRP may improve risk assessment [92]. Another analysis of the same cohort found that hs-CRP added prognostic information beyond what was conveyed by all lipid measures [93].
Cardiovascular guidelines stress the importance of identifying individuals with
Metabolic Syndrome (Met-S). These individuals are a high risk group for cardiovascular events [94]. WHS cohort showed CRP levels to be strong predictors of MI, stroke, and incidence of type 2 diabetes [94]. CRP is a marker for innate immunity and elevated CRP levels directly effect vessel walls [94]. Insulin resistance and atherosclerosis share a common inflammatory basis. Smoking and aspirin may affect CRP levels. Statin-class medications are relatively more effective in reducing vascular risk among those with elevated CRP levels. The WHS cohort study also showed that rosiglitazone directly reduced CRP levels. It is possible to speculate that CRP may potentially play a more direct role in promoting hypertension [25] and opening possible treatment options for chronic elevations in CRP levels. Recent data suggests CRP concentrations known to predict CV events directly squelch the production of nitric oxide by endothelial cells, possibly leading to disturbance of vasomotor tone and unopposed vasoconstriction [25]. Metabolic Syndrome
To fully evaluate the clinical usefulness of CRP as a new biomarker requires more direct comparison with Met-S biomarkers, either in combination with or in place of more traditional markers. In a secondary analysis from the National Health and Nutrition Examination Survey, the mean and median levels of CRP were higher in subjects with components of Met-S as defined by the Adult 3rd Report of the National Cholesterol Education Program Expert Panel on detection, evaluation and treatment of 5 components of Met-S [95]. This study included a large percentage of children and adolescents. In a prospective study of CRP and its relationship to diabetes and Met-S, CRP correlated with all metabolic indexes in women. CRP had a predictive value in Mexican women especially in the development of Met-S independent of adiposity and glucose but risk was not evident in men [96].
A study by Ridker, et al, showed interactions between biological markers and
more traditional risk factors, such as blood pressure, smoking, obesity, diabetes, decreased physical activity, and the use of hormone replacement therapy [94]. In an 8-year follow-up cross sectional study using baseline CRP levels and excluding hormone replacement therapy, CRP levels were found to add important and independent prognostic information in terms of cardiovascular risk [94]. In another secondary analysis of the WHS using self-reported blood pressure levels, the joint effects of the relative risk of future cardiovascular events were analyzed using CRP and blood pressure. All were found to be independent determinants of cardiovascular risk and their predictive value was additive [25].
21
Blake, et al found in a secondary analysis with CRP and blood pressure that these were determinants of cardiovascular risk and both added predictive value [25]. The Women’s Health Study conducted several important follow-up studies using CRP values. Conclusions were that hs-CRP is associated more closely with ischemic stroke than cardiovascular heart disease (CHD) and that concomitant evaluation of lipid levels and hs-CRP may improve risk assessment [92]. In another analysis of the same cohort conclusions were that hs-CRP added prognostic information beyond what was conveyed by all lipid measures [93]. Using a high risk cohort, Beckman et al found an increased CRP was associated with peripheral arterial disease using hard events (myocardial infraction, stroke and death) for follow-up [89].
The plasma CRP biomarker is likely to have an important role in establishing risk stratification of patients with Met-S and scoring risk for long-term implications of cardiovascular disease. This test has the advantage of being relatively risk-free, inexpensive and applicable to a wide range of populations at risk for Met-S. The hs-CRP test can be completed in a clinical outpatient setting. Immediate follow-up discussion, explanation of testing results and prevention interventions can be initiated. Because it is a diffuse test, the tissue or organ etiology may not be determined. It is still necessary that healthcare providers capture a thorough history, ongoing assessment, and complete testing for optimum continuity of care for patients at risk. The primary goal of risk prediction is to identify high-risk patients so prevention measures can be initiated to improve health outcomes. Sickle Cell Disease
In a review of selected literature, Albert, et al reported on the traditional CVD risk factors and African Americans. It was found that: 1) hypertension and left ventricular hypertrophy leads to an increase of out-of-hospital sudden deaths, 2) African Americans traditionally experience lower rates of coronary artery disease but an increase in morbidity of cardiovascular disease, 3) Met-S and obesity lead to congestive heart failure and sudden death, and 4) novel cardiovascular risk factors: CRP levels and Lp(a) levels are higher in African Americans. This evidence indicates a need to evaluate non-traditional biomarkers that may be associated with Met-S and CVD. Atherosclerosis would not be an issue in this ethnic population. It is unclear in the literature if any of these traditional CVD risk factors have been studied in the SCD population.
Biomarkers are blood plasma laboratory measurements of molecules, proteins or enzymes, which give independent prognostic or diagnostic value by highlighting an underlying disease process [26]. This may highlight a disease process such as sickle cell disease (SCD) or its sequelae such as pain episodes, secondary complications, or cardiovascular complications of SCD in adults. Additional biomarkers are needed to fully investigate the incidence of Met-S in this specific population. The testing must also be minimally invasively for best compliance with any population of patients. Levels of CRP in all SCD patients have not been extensively studied. Most efforts have involved pediatric age groups. A small study by Hibbert, et al showed CRP moderately increased
22

in stable symptom-free patients and significantly increased during painful vaso-occlusive crisis in children with SCD. Regression analysis of this small study (n=12) of children with SCD), demonstrated CRP was a predictor of corrected resting energy expenditure and fat mass in this population [97].
In a retrospective study, Schnog, et al reviewed CRP levels. The study was contrasting 3 groups. Group 1 was Hgb SS patients, group 2 was Hgb SC patients, and group 3 was matched African American blood bank donors. The results found elevated levels of CRP as a general marker of inflammation in all groups. No detection of significant correlation of hs-CRP levels was made to clinical events. A significant relationship was found in group 2, Hgb SC between free and total protein S and hs-CRP [24]. Genetic Evaluation
Genetic factors account for a 35-40% variance of CRP levels demonstrated by family and twin studies [13, 98]. Several common polymorphisms have been identified with altered plasma CRP levels [98]. The CRP gene lies on chromosome 1q23 and is composed of 2 exons and an intron. Numerous polymorphisms have been reported but none are known to change nonsynonymous amino acid production. The polymorphisms are the only genetic markers with potentially high linkage disequilibrium with causative genetic markers [13]. In a more in-depth analysis of the CRP gene, Crawford, et al re-sequenced 1000 chromosomes, his research demonstrated that the CRP gene is ideal for deep and medical re-sequencing because it is a small gene at ∼2kb [99]. From his research it is suggested that it may be more efficient to re-sequence individuals at extreme low/high end of distribution in search of rare single-nucleotide polymorphism’s (SNP) that impact phenotype. Re-sequenced genes for the purpose of cataloguing both common and rare variations may be used in common disease/common variant study designs using a tag SNP approach. Application of this approach can then be applied to several population studies with very few population specific modifications [99].
Dupuis, et al in 2005 attempted to describe inter-individual variability in systemic inflammatory biomarkers using banked DNA from the Framingham Heart Study. Multiple genes on chromosome 1 were found to influence inflammatory serum levels [27]. Using this same-banked DNA, Kathiresan, et al investigated the influence of genetic variation of the CRP gene on CRP blood levels. Thirteen SNP’s were genotyped with measured CRP levels. Clinical variables explained 26% of inter-individual variation in CRP [100]. Two novel common SNP’s in the promoter region of the CRP gene were identified and associated with plasma concentration of CRP by Kovacs, et al located at position –286 with C>T>A and –717 in relation to the transcriptional start site. Strength of the data did not support functionality of the variants [18]. The major limitation from these studies was the use of an all white cohort, opening the question of variation among other ethnic cohorts.
23
In a large genetic study using the NHANES III banked DNA, 4 haplotypes had significant association with CRP levels. It was demonstrated that specific CRP SNP’s and haplotypes are associated with serum CRP levels in the general population [101]. Heritability estimates were approximately 20-60% of the variance of baseline CRP. This evidence supports that CRP levels are attributed to basic genetics. In a 2003 study using male army recruits and patients receiving a coronary artery bypass graft (CABG), 2 novel polymorphisms were identified in the CRP gene. At location +1444 a C>T variant had a strong independent association influencing basal and stimulated CRP levels. This variant has preliminary support as a functional candidate SNP [14].
Suk, et al did an assessment of 2 SNPs in the CRP gene; exon 1059 G>C and
intron T>A as a base substitution. These genetic polymorphisms were significantly associated with baseline CRP levels even after adjustment for environmental variables. This provided evidence of genetic components of CRP levels, independent of traditional risk factors for CV disease [13].
In an attempt to show an association of polymorphisms in the CRP gene with
CRP serum levels and cardiovascular events, Lange, et al found no association between carotid intima-media thickness and cardiovascular events. This prospective trial involved 4 tag SNPs genotyped in 3941 white participants, and 5 tag SNPs in 700 black (African-American) participants. The study reported an association of SNP 790T with low CRP levels in the black population. It was also shown that homozygosity for the 790T allele was associated with a 4 fold increase risk for acute myocardial infarction [15].
Minor alleles of 4 SNPs are consistently associated with a functional role in
serum CRP levels in three major cohorts, reported by Miller, et al [16]. A secondary analysis and re-sequencing was undertaken with the WHS, the Pravastatin inflammation CRP evaluation trial and the Physician’s Health Study. The functional role for 5’ SNP –286 C>T>A and 3’ –UTR SNP and 1846 G>A did not associate with an increased risk of MI but implied that both genetic and environmental factors contribute to increased CRP levels [16].
Following Miller’s lead, DNA samples were analyzed for seven common
significant SNPs. It was found that minor alleles 1, 3, 4, and 6 were associated with high medium CRP levels. Alleles 5 and 7 were associated with low CRP values and 2 had no effect [98]. These results may be important in the study of future populations when attempting to characterize phenotypes. An allele associated with higher CRP levels would confer an increased risk of CVD [15]. Results suggest a genetic basis may underlie, in part, the relationship between CRP concentration and CVD risk in older adults [15]. In a smaller black cohort, specific CVD outcomes associated with CRP genotypes differed by ethnicity [15] and could be explained by allele frequencies. This study has the limitation of a smaller AA sample size (n = 700) vs. the Caucasian sample size (n = 3941) [15].
Strong evidence supports hs-CRP as an independent predictor of coronary artery
disease and is directly causally uncertain. Assessment of risk factors provides guidance for clinical management. Clinical combination of hs-CRP, tropin, and b-type naturetic
24
peptide has been advocated as a means of risk stratification [26]. One study using multiple cohorts indicated hs-CRP provided additive risk information across all levels of the Met-S [26], but few studies have explored populations outside of CVD.
Szalai, et al., has been working with an inflammatory disease populations
unrelated to CVD, 244 cases of systemic lupus etythematosus (SLE) were used in this study (n = 546) [12] and more recently with this same cohort looking for vascular arterial events such as arterial claudication and arterial thrombosis [102]. The study identified thirteen alleles of the microsatellite (CA)n in the intron of the CRP gene. Microsatellites are a simple sequence repeat, found in the nuclear DNA and generally a base pair combination-repeating unit. DNA structure is affected by base paired Cytosine (C) and Adenine (A) or CA repeats within the structure of the gene [12]. An example of a common microsatellite is a CA repeat. A CA repeat is frequently found in human DNA and other genomes and can have hundreds of consecutive repeats. Seventy-five percent of these repeats are found in the intergenic noncoding regions [103]. There are often many alleles present in a microsatellite locus, and have become powerful tools in population genetic studies, recombination mapping and providing support for specific alleles that are closely related [12, 104].
Nine to twenty-five repeats were counted and 75% of the subjects had (CA)16 and (CA)25 repeats. The controls used in this study were divided by Caucasian and African American (AA) ethnicity. A higher frequency of intermediate repeat alleles (CA17-CA25) arose from the AA linage. Other results from this study were association of different CRP alleles with differences in baseline CRP serum levels. Even with considerable variability in CRP expression of SLE patients, results strongly suggest a genetic component to baseline CRP levels [12]. Investigation continues to determine the mechanisms involved between the microsatellite (CA)n CRP polymorphism and CRP expression. Szalai’s study was one of the first to use a subject pool with an inflammatory disease process, other than atherosclerosis. The growing evidence from this study makes this polymorphism clearly worth investigating. Risk Factor
Stampfer, Ridker, and Dzau distinguished between causal risk factors that directly reflect underlying biology of disease and risk factors used solely for prediction [105]. A goal of identification of more predictive risk factors is to identify individuals who are more likely to develop the disease or secondary complications from a disease and target them for more intensive intervention. A predictive risk factor must be present and measurable before the clinical appearance of the outcome. Risk factors are independent predictors and improve the predictive power of other risk factors already identified. Risk factors may vary depending on the characteristic of the population.
Little work has been done in the area of genetic CRP polymorphisms in a sickle cell disease (SCD) population. It is consistently difficult to characterize the phenotype of patients with this disease process. As vast amounts of new data are being generated, the
25

nursing implications regarding CRP levels and the interpretation of plasma and genetic results will be a challenge for patient teaching. There is enough evidence to support CRP as a viable biomarker of severity. Further exploration will be needed to assess the importance and independent prognostic value of genetic and environmental factors for future events. Replication of genetic studies supporting genetic CRP variants, which link elevated levels to genetic variants, will be another step toward individualized medicine and evaluation of risk factors. It has yet to be determined if CRP levels and genetic polymorphisms in the CRP gene will be useful tools in the SCD population.
Summary of the Review of Literature Sickle cell disease is a genetic hemoglobinapathy characterized by micro-vascular occlusions. A multitude of secondary complications can arise from these occlusions. Three of the most severe complications are pulmonary hypertension, renal end-organ dysfunction and cerebral vascular accidents. Finding effective methods to evaluate the severity of these complications has been a challenge. One proposed method is to develop a severity score that would help predict both end-organ dysfunction and mortality risk in adults with SCD. Another proposed method of evaluating complications would be the use of serum and genetic biomarkers. SCD exhibits an unusual inflammatory profile. Research evidence demonstrates that inflammation may be a factor in the pathogenesis of vascular injury related to secondary complications. CRP has been targeted as a factor that might be promising as a serum and genetic biomarker for secondary complications in adults with SCD.
26
CHAPTER 3. METHODS This chapter provides a detailed description of the study design, sample, setting, and the instruments. Procedures for data collection and statistical analyses as well as protection of human subjects are discussed.
Material and Methods Research Design and Study Population In this descriptive, cross-sectional, convenience sample study, 29 patients with SCD were divided into two groups by clinical evidence of secondary complications, mild and severe. The severe group was further divided into three groups based on the type of secondary complication. The three groups were pulmonary hypertension, renal end-stage organ dysfunction, and cerebral vascular accident (CVA), see Figure 3.1. The renal group exhibited clinical evidence of end-stage renal dysfunction with a glomerular filtration rate (GFR) ≤ 60% or a 24° urine protein level ≥ 500 mg/24°. The pulmonary hypertension group exhibited clinical evidence with a tricuspid regurgitation jet velocity (TRJV) ≥ 2.5 m/s. The third severe group was clinical evidence of a CVA by historical documentation or magnetic resonance imaging (MRI) and magnetic resonance angiography (MRA). This was a prospective single visit study. All patients had a diagnosis of Hgb SS, SC, Sβ+, or Sβ0. The patients were screened and approached during scheduled routine clinic visits. Recruitment was from February 2008 to July 2008. A total of 81 patients from the adult hematology/oncology clinic had a complete secondary complication evaluation. Patients were evaluated by the physician co-investigator and the investigator. All patients who meet inclusion criteria were invited to participate. All subjects were 18 years of age or greater. Representative age samples of adults with SCD are typically between 18-59 years. To assess the feasibility of the study a retrospective chart review was completed in April 2007 at the University of Tennessee Cancer Institute.
Projected Sample Availability There is clear evidence that patients with SCD develop secondary complications that lead to end-stage organ damage and increased mortality rates. The projected sample availability was obtained from a retrospective chart review completed in the spring of 2007 at the University of Tennessee Cancer Institute. This study briefly highlighted the
27
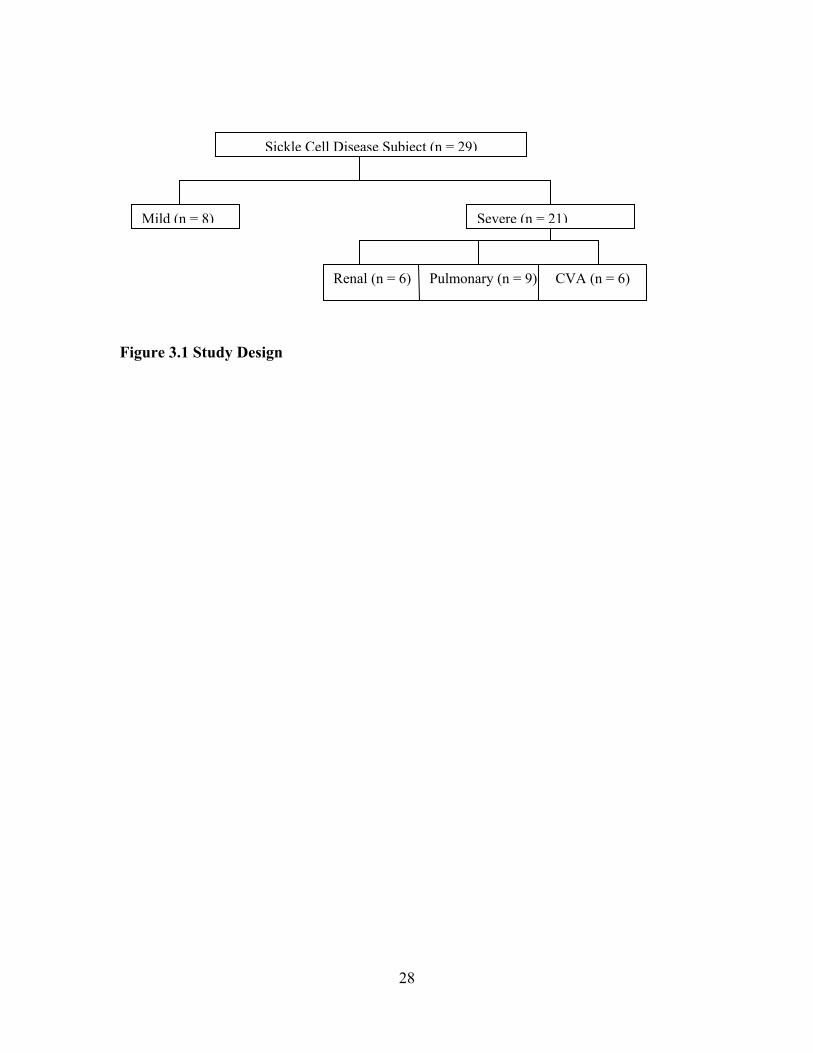
Mild (n = 8) Severe (n = 21)
Renal (n = 6) Pulmonary (n = 9) CVA (n = 6)
Sickle Cell Disease Subject (n = 29)
Figure 3.1 Study Design
28
common secondary complication of SCD. Morbid and potentially lethal organ injuries were very common in the adults with SCD. Additional work was necessary; using a regional population for a prospective study that would contribute to the understanding of severity in SCD.
Sample and Setting
A convenience sample was obtained from Hgb SS, SC, Sβ+, and Sβ0 patients who received care at the University of Tennessee Cancer Institute between February 2008 and July 2008. Data collection occurred at two locations of the University of Tennessee Cancer Institute, Medical Center and DeSoto Center. The patients were identified at follow-up routine hematological management of the underlying disease process and recruited by the investigator. Subjects were screened for potential participation in the study after chart review and consultation with the physician co-investigator, who clinically manages the patients.
Children under the age of 18 presented a complex set of medical and social issues that challenge the clinician and are under the care of pediatric hematologists outside of the study site, so children under the age of 18 were excluded. The pediatric caregivers treating the children with SCD transition the patients at age 18 years into the adult care setting. Thus, patients who were 18 years and older, and under the care of University of Tennessee Cancer Institute, were included in the identification and recruitment. A detailed description of the sample is provided in chapter 4. Inclusion Criteria
• Adults who previously had received a diagnosis of SCD with historical confirmatory electrophoresis of SCD including hemoglobin patterns (SS, SC, Sβ+, or Sβ0) were eligible.
• Participants had to be age 18 years to 65 years. • All participants had to be able to provide informed consent. • Stratifying criteria was then used for group placement.
Group I Mild: The subjects had to meet all areas to be included into this group.
• Negative history of ACS or pneumonia • Negative history of priapism • Negative history of leg ulcers • Negative history of clinical stroke • Tricuspid Regurgitation Jet Velocity < 2.5 m/s • Glomerular Filtration Rate > 90 % • 24º Urine protein < 200 mg
29
Group II Severe:
• Major severity--One system of the following had to be verified to be included into this group: pulmonary jet velocity from historical echocardiogram of ≥ 2.5 m/s, or glomerular filtration rate (GFR) ≤ 60%, or 24º Urine protein ≥ 500 mg, or clinical stroke by historical documentation or MRI.
• Minor-Multi-system severity--If subject did not meet the single organ criteria of severity, the inclusion for multi-system severity was defined as: GFR ≥ 59 but ≤ 90 % + 24º Urine protein > 200 < 500mg + MRI abnormalities suggesting silent cerebral ischemia or documentation of AVN or MRI abnormalities suggesting silent cerebral ischemia + 24º proteinura > 200 but < 500mg + retinopathy by historical exam or documentation of AVN.
Exclusion Criteria
• Presence of acute significant health problems requiring imminent hospitalization (i.e. severe cardiomyopathies, Hepatitis B, Hepatitis C, HIV, SCD renal failure)
• Pregnancy-determined by self report • Acute active pain episode at blood draw • Signs or symptoms of active infection (i.e. fever, chills, acute pain, nausea or
vomiting)
Instrumentation Each subject provided written informed consent. Consent was obtained at the clinic visit, after determination that all inclusion and exclusion criteria had been met. Demographic information such as date of birth, race, height, weight, gender, clinic location and clinical information such as history of surgical cholecystectomy, surgical splenectomy, leg ulcers, historical CVA, ACS, retinopathy, and priapism was obtained from the subject’s medical records to characterize and describe the sample. These variables were also used in the calculation of the SNM Severity Score. Samples Collection and Settings All samples were collected at the University of Tennessee Cancer Institute at two locations, Medical Center and DeSoto Center. Each patient had blood drawn for routine laboratory testing which occurs at each visit. Venous blood samples were processed in according to regulations from the certified Clinical Laboratory Improvement Amendment (CLIA) clinical laboratory at the study setting clinic using standard procedures. This laboratory testing was not considered part of the research protocol. Standard visit laboratory tests are complete blood counts (CBC), chemistry panel, hemoglobin electrophoresis, B-type naturiuretic peptide (BNP) CRP, and lactate dehydrogenase (LDH). Tests included in a CBC were: white blood cell count (WBC), red blood cell
30
count (RBC), hemoglobin level (Hgb), hematocrit (Hct), platelets, mean corpuscular volume (MCV), mean corpuscular hemoglobin (MCH) and WBC differential. Test included in a Chemistry panel were serum levels of: albumin, alkaline phosphatase (ALP), alanine aminotransferase (ALT), Aspartate aminotransferase (AST), total bilirubin, blood urea nitrogen (BUN), calcium, chloride, creatinine, glucose, potassium, total protein, and sodium.
Samples were collected during the routine clinic follow-up appointment using the
Oragene ™/saliva collection kits, which contain a proprietary solution to immediately stabilize the DNA. The primary investigator collected all DNA samples by having the subjects spit into coded sample containers. The samples were then de-identified with subject numbers. Risks associated with saliva sampling were transient dry mouth. When the lid is closed after sample collection the proprietary solution immediately mixes into the sample. Manual Purification of DNA Protocol DNA in Oragene sample kit is stable at room temperature. All samples were taken to Dr. Ron Adkins microbiology lab, located in the Children’s Research area of Le Bonheur Children’s Hospital, Memphis, TN within 48 hours of collection. The purification process started with each sample incubated at 50º C in a water incubator for a minimum of 1 hour. The Oragene/saliva sample was then placed in clean 1.5 mL microcentrifuge tubes by dividing the sample into five, 500µL aliquots. All remaining samples were frozen in a -20º C freezer. 20µL of Oragene Purifier (OG-L2P, supplied by the manufacturer, Gentek, Ottawa, Ontario, Canada) was then added to each microcentrifuge tube and mixed by vortexing for a few seconds. Each sample was incubated on ice for 10 minutes and then Centrifuge at room temperature for 15 minutes at 13,000 rpm (15,000 x g). The clear supernatant was then transferred into a fresh microcentrifuge tube. The impurities pellet was discarded. 500µL of room temperature 95-100% ethanol was added to each 500µL of supernatant. All tubes were mixed gently by inversion 10 times and allowed to sit at room temperature for 10 minutes. Each tube was then centrifuged at room temperature for 2 minutes at 13,000 rpm (15,000 x g). All pellets were carefully dislodged and collected into one of the microcentrifuge tubes. This single tube with the 5 pellets was centrifuged at room temperature for 2 minutes at 13,000 rpm (15,000 x g). The supernatant was carefully poured off and discarded. The pellet was allowed to air dry. 250µL of 70% ethanol at room temperature was added and allowed to sit for one minute to remove residual inhibitors. The ethanol was then gently poured off; care was taken to not disturb the pellet. 100µL of DNA buffer (1:10 TE) was added to DNA pellet and vortexed for 5 seconds to re-hydrate pellet. The sample was then incubated at room temperature for 24 hours. All samples were then maintained, when fully hydrated, at -20º C for long-term storage.
31
Measurement of Quality and Quantity of DNA For efficient use of DNA samples in sequence analysis, accuracy, and precision of the DNA concentration are critical. The OD method of DNA quantification has been found to be the most accurate method of measurement [106]. Purity was determined by calculating the ratio of absorbance at 260 mm to absorbance at 280mm. Pure DNA has a A260/280 ratio of 1.7 to 1.9. The concentration of the DNA samples was determined by calculating OD 260/280 readings from a dual beam Beckman DU-600 spectrophotometer (Beckman Coulter, Inc., Fullerton, CA). Primer Design Ensembl is a joint project between European Molecular Biology Laboratory-European Bioinformatics Institute (EMBL – EBI) and the Sanger Institute to develop a software system, which produces and maintains automatic annotation on selected eukaryotic genomes. Wellcome Trust primarily funded the project. The site has free access to all the data and software from the Ensembl project [107]. Using the Ensemble Mult-Blastview the intron of CRP was isolated [108]. The CRP intron is given in Figure 3.2.
The isolated intron information was then pasted into Clone Manager© from Scientific & Educational Software, Cary, North Carolina and this program designed the appropriate primers. One 5’primer and four 3’primers were designed. Table 3.1 presents the intron PCR primers.
PCR Reaction Protocol
The stock primers were reconstituted to working PCR primers, so that they would be fresh, this was accomplished by using 20µL stock and 380µL ddH2O. PCR reaction set up was made with a master mix of 17.75µL ddH2O, 10µL Mg Free Buffer, 4µL dNTP, 10µL MgCl2, 2.5µL 5´ primer, 2.5µL 3´ primer, 0.25µL Taq and 3µL DNA sample. Total volume was 50µL/tube. The Taq DNA Polymerase used was from Promega (M1661 in Stage Buffer B). Annealing temperature was set at 60º C. A Gradient Cycler PTC-225 Tetrad cycler (MJ Research, Waltham, MA) was programmed to execute the following formula: Step 1. 95° C for 2 minutes (to denature DNA) Step 2. 95° C for 1 minute Step 3. 60° C for 1 minute Step 4. 72° C for 2.5 minutes, then Step 5. Repeat Step 1, 39 times Step 6. 4° C Step 7. End A 1% agarose gel was used to assess amplification using 5µL of PCR product.
32
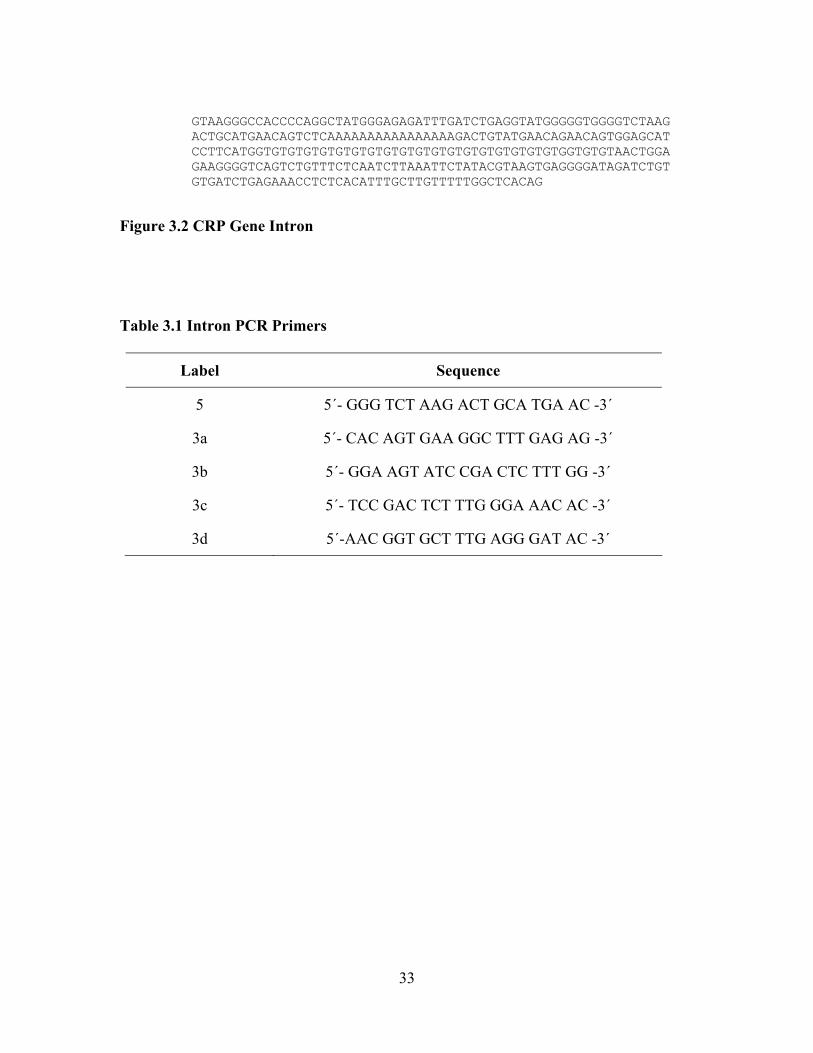
GTAAGGGCCACCCCAGGCTATGGGAGAGATTTGATCTGAGGTATGGGGGTGGGGTCTAAG ACTGCATGAACAGTCTCAAAAAAAAAAAAAAAAGACTGTATGAACAGAACAGTGGAGCAT CCTTCATGGTGTGTGTGTGTGTGTGTGTGTGTGTGTGTGTGTGTGTGGTGTGTAACTGGA GAAGGGGTCAGTCTGTTTCTCAATCTTAAATTCTATACGTAAGTGAGGGGATAGATCTGT GTGATCTGAGAAACCTCTCACATTTGCTTGTTTTTGGCTCACAG
Figure 3.2 CRP Gene Intron
Table 3.1 Intron PCR Primers
Label Sequence
5 5´- GGG TCT AAG ACT GCA TGA AC -3´
3a 5´- CAC AGT GAA GGC TTT GAG AG -3´
3b 5´- GGA AGT ATC CGA CTC TTT GG -3´
3c 5´- TCC GAC TCT TTG GGA AAC AC -3´
3d 5´-AAC GGT GCT TTG AGG GAT AC -3´
33
Preparation of Samples for Sequencing Protocol The samples with positive amplification were identified from the gel and were then ethanol precipitated to pellet the DNA. 45µL PCR product was added to 19.25µL 3M Sodium acetate (NaOAC) (12.3045 g Sodium acetate QS to 50 ml ddH2O) and 128.5µL Ethanol (Absolute). Mixture was vortexed well, and then left in a -20º C freezer overnight. The next morning the samples were removed from the freezer and spun at 13,000 rpm for 15 minutes to pellet the DNA. The supernatant was poured off and the pellet was allowed to air dry to evaporate the ethanol. The pellet was then reconstituted in 20µL ddH2O and placed in a 57 º C water bath for 15 minutes to encourage the DNA back into the solution. A 0.8% agarose gel was used to run the samples with 3µL of loading dye to fluoresce the sample. The samples were run for 2/3 length of gel. Visualization to confirm band intensity was made with gel doc photo. The bands were then cut out of the gel and placed in appropriately labeled microcentrifuge tubes. Gel extraction was done using the QIAquick Gel Extraction Kit Protocol (Qiagen). Each gel slice was weighed and 3 volumes of Buffer QG (supplied in Qiagen Kit) to 1 volume of gel (100mg ˜ 100µL) were added to each sample tube. The tubes are then incubated in a 50 º C water bath for 10 minutes. After DNA gel was dissolved completely, 1 gel volume of isopropanol was added and mixed. The DNA sample was applied to the QIAquick column in a clean microcentrifuge tube, and centrifuged for one minute. The flow-through was then discarded and the column replaced in the tube. 0.5 ml of Buffer QG (supplied in Qiagen Kit) was added to column and centrifuged for one minute. This step removed all traces of agarose. To wash, 0.75 ml of Buffer PE (supplied in Qiagen Kit) was added to column and centrifuged for one minute. The flow-through was again discarded and centrifuged for an additional minute at 10,000 x g. The column is then placed in a clean microcentrifuge tube and the DNA eluted with 50µL of Buffer EB (supplied in Qiagen Kit) and centrifuged for one minute. The average eluated volume was 48µL. The samples were then prepared for sequencing at the Molecular Resource Center (MRC) at the University of Tennessee Health Science Center (UTHSC) campus in Memphis, Tennessee. Samples were submitted as template/primer mixes, with the ratio of DNA/primer dependent on the type of template employed. A 0.5 flat top PCR tube was labeled with sample ID, primer used and investigators initials. In each tube 4.4µL of DNA extracted sample, 1.6µL of sequencing primer and 9.0µL ddH2O was added for a total of 12.0µL. The MRC is a Center of Excellence at the UTHSC and provides the university with state-of-the-art technologies for molecular based research. The MRC with its core laboratory had a full range of trained personnel and equipment to assist the investigator with the sequencing of the intron DNA segment. Automated DNA sequencing is done by the BI Model 3130 XL Genetic Analyzers (Applied Biosystems, Foster City, CA). Four color fluorescence based sequencing was done based on the Sanger method [103, 109]. In the MRC, following the incorporation of the labeled dNTP in the extension products, the reactions were purified by gel filtration, dried down, re-suspended in formamide, and run on the analyzer. The run sequence submitted to the MRC was 340bp and the analyzer was capable of running an extension of over 700bp. The process took
34
about 48 hours to complete and the results were placed on a server and were downloaded and analyzed using ABI software supplied by Applied Biosystems, Foster City, CA. DNA Clean Up When DNA failed PCR or sequencing, the sample was cleaned up using Phenol/Chloroform/Isopropyl (PCI). The PCI consisted of Phenol 25 ml; Chloroform 24ml; Isoamyl alcohol 1 ml, which fit into a 50 ml Polypropylene centrifuge tube. A little of the liquid layered over the phenol was similarly layered over this mix to prevent moisture or evaporation. The Chloroform was also needed for the second step in the procedure. The three samples needing clean up were identified in the laboratory notebook. The original snap cap tube with genomic DNA plus three snap cap tubes were used. Each of the 3 snap cap tubes was labeled with the sample DNA identification number. To the genomic DNA tube 1 ml PCI was added, care was taken to avoid the liquid layer top; the genomic DNA tube was vortexed well. After being centrifuged for 1 minute at 13,000 rpm, the top layer was carefully pipetted to the appropriately labeled first snap cap tube. The steps were repeated again with 1 ml PCI added, vortexed, and centrifuged the genomic DCA tube and pipetted to the second tube. Then 1 ml Chloroform was added to the second tube, the sample was well vortexed, and centrifuged for 1 minute at 13,000 rpm. The top layer was pipetted and placed in the third snap cap tube. One ml Absolute Ethanol was added and inverted several times, until the formation of a DNA swirl was seen. The sample was allowed to set for 10 minutes at room temperature, then spun 1 minute at 13,000 rpm. The pellet was found and then the ethanol was carefully poured off and allowed to air dry, briefly. The excess alcohol was removed. 100µL of DNA buffer (1:10 TE) was added to DNA pellet and vortexed for 5 seconds to re-hydrate pellet. The sample was then incubated at room temperature for 24 hours. The cleaned samples were then stored, when fully hydrated, at -20º for long-term storage. Databases Established in 1988, the National Center for Biotechnology Information (NCBI) created public databases, has conducted research in computational biology, and has developed software tools for analyzing genome data, and disseminated biomedical information. This national resource supports a more comprehensive understanding of molecular processes and the links to genetic processes, information and dissemination of information affecting human health and disease [110]. The website provides biomedical and bioinformatics information, its mission is to aid researchers in three areas: basic research, database and software development and outreach and education. Basic research is accomplished using a multi-disciplinary research group, concentrating on computational molecular biology. Database and software development consisted on GenBank DNA and sequencing database, building on sequences submitted
35
by individual laboratories worldwide; Entrez retrieval system for users to access vital background information on mapping, sequences and structural genetic data; and Blast, a program designed to execute a sequence match utilizing the entire DNA database using real-time information. Applied Biosystem Group (ABI) is an operating group of Applera Corporation. ABI serves the microbiology industry and research communities by developing and marketing systems, consumables, software and services unique to molecular biology. Sequencing Scanner© version 1.0 is available free as a download from the company. This software displays the traces as thumbnails data files, allowing quick overview of the sequences looking for anomalies. It enables the researcher to view, edit, print and export the sequences. It is also useful in identifying failed chemical reactions, low signal strength, spikes and off scale peaks and delays or shifts in injection [111]. The length of the PCR products ranged from 165 to 215 continuous read length base pair, corresponding to introns containing 15 to 20 repeats (CA15 to CA 20). The CRP intron was successfully amplified from 29 of 29 (100%) of the DNA samples tested. Sebastiani Network Model (SNM) Severity Score was designed using a Bayesian approach. This model assesses the relationship between historical clinical complications, current laboratory results and the risk of death in SCD patients [9]. The program that generated this network can be assessed at Bayesware Discoverer @ www.bayesware.com. Boston University has made available a website using the network model as a diagnostic tool to assist in identification of symptoms related to SCD severity. The severity score was calculated by providing clinical and laboratory data from each patient into the disease severity score calculator. The range of scores were 0 (least severe) to 1 (most severe) and the outcome measure for this score is the risk of death within 5 years [9]. Supplemental tables with analysis and conditional probability tables that define the network are also available at the Boston University website [112]. The severity score is to be used as an adjunct to clinical decision-making.
Statistical Analysis
Statistical analysis was performed using Statistical Package for the Social Science (SPSS®) version 15 (SPSS Inc, Chicago, IL) and p < 0.05 was considered significant in all tests. Statistical analysis included descriptive statistics expressed as mean, mode, range and standard deviation.
To project the minimum number of participants in each group that were needed to adequately power the study, the range of normal Hgb AA serum level CRP results were used to obtain an estimate of σ [113]. That information was then substituted to estimate the value of σ2 in the sample size equation to determine an approximate sample size. To achieve the minimum number of subjects per group it was estimated with a 95% confidence interval having a tolerable error of 3. The values of CRP ranged from 0.5 to 3.0, where σ = range/4 = (3-.5) and E = 3/2 [113]. Using the formula
36
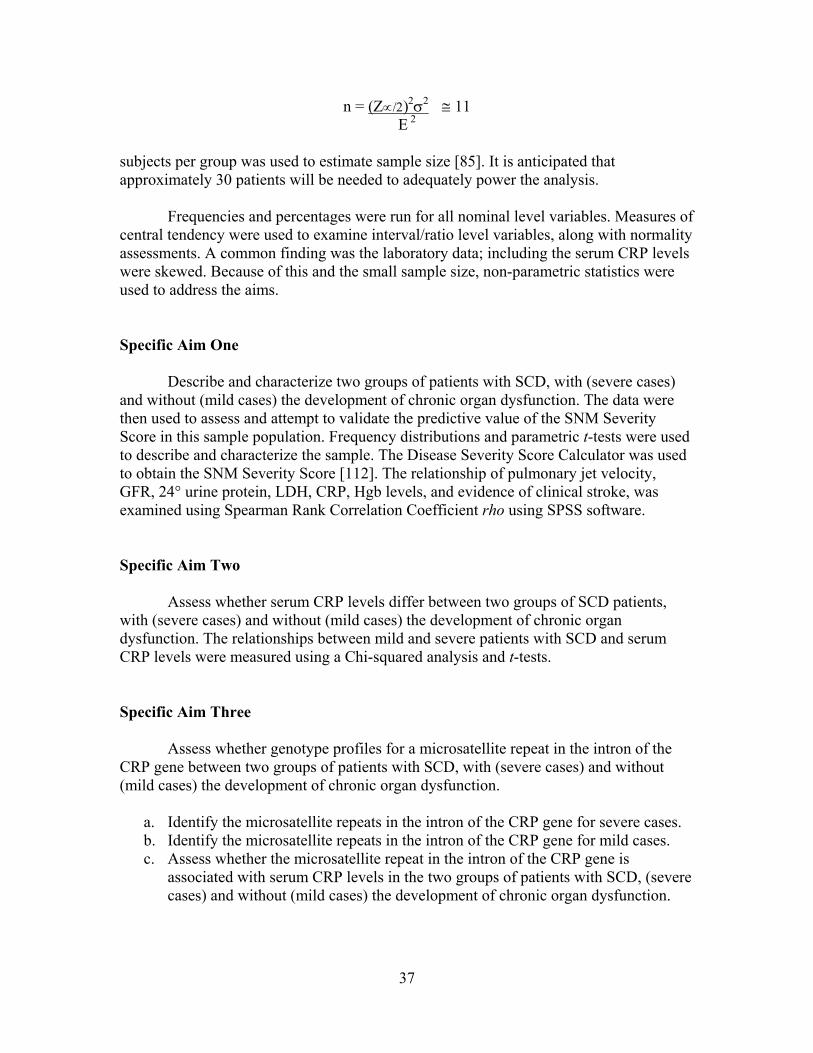
n = (Ζ∝/2)2σ2 ≅ 11 E 2
subjects per group was used to estimate sample size [85]. It is anticipated that approximately 30 patients will be needed to adequately power the analysis.
Frequencies and percentages were run for all nominal level variables. Measures of central tendency were used to examine interval/ratio level variables, along with normality assessments. A common finding was the laboratory data; including the serum CRP levels were skewed. Because of this and the small sample size, non-parametric statistics were used to address the aims. Specific Aim One
Describe and characterize two groups of patients with SCD, with (severe cases) and without (mild cases) the development of chronic organ dysfunction. The data were then used to assess and attempt to validate the predictive value of the SNM Severity Score in this sample population. Frequency distributions and parametric t-tests were used to describe and characterize the sample. The Disease Severity Score Calculator was used to obtain the SNM Severity Score [112]. The relationship of pulmonary jet velocity, GFR, 24° urine protein, LDH, CRP, Hgb levels, and evidence of clinical stroke, was examined using Spearman Rank Correlation Coefficient rho using SPSS software. Specific Aim Two
Assess whether serum CRP levels differ between two groups of SCD patients, with (severe cases) and without (mild cases) the development of chronic organ dysfunction. The relationships between mild and severe patients with SCD and serum CRP levels were measured using a Chi-squared analysis and t-tests. Specific Aim Three
Assess whether genotype profiles for a microsatellite repeat in the intron of the CRP gene between two groups of patients with SCD, with (severe cases) and without (mild cases) the development of chronic organ dysfunction.
a. Identify the microsatellite repeats in the intron of the CRP gene for severe cases. b. Identify the microsatellite repeats in the intron of the CRP gene for mild cases. c. Assess whether the microsatellite repeat in the intron of the CRP gene is
associated with serum CRP levels in the two groups of patients with SCD, (severe cases) and without (mild cases) the development of chronic organ dysfunction.
37
The sequence tracing were analyzed with Sequence Scanner from Applied Biosystem Group (ABI). The tracing were first evaluated for anomalies and compared side by side. The CA repeats were visually calculated and verified by an independent evaluator. The relationships between mild and severe patients with SCD and evidence of the microsatellite SNP on the CRP gene were measured using a Chi-squared analysis, t-tests and Spearman Rank Correlation Coefficient rho.
Consideration of Human Subjects
The study received approval from The University of Tennessee Health Science Center Institutional Review Board (IRB). It had the full cooperation and support from the research department, staff and physicians at The University of Tennessee Cancer Institute. All IRB guidelines were maintained and the research results were stored separately from individual identifiers with restricted access. The research results for each subject were not in the medical records and other third parties such as employers or insurers did not have access to the research results. Only aggregate data will be used to report findings in publications and presentations.
DNA was banked for future genetic studies. Ownership of the blood, data associated with it, data generated from analysis of it, and immortalized cell lines developed from the specimens belong to the University of Tennessee Cancer Institute. The samples were immortalized into a cell line; the storage of the samples will be indefinite.
This research study may provide valuable information about the risks of end-stage organ damage in adult sickle cell disease patients. At the time the data analysis of these samples was performed, findings did not have an impact on the participant’s health or treatment. Consequently, the results of this study were not shared with the subjects.
38
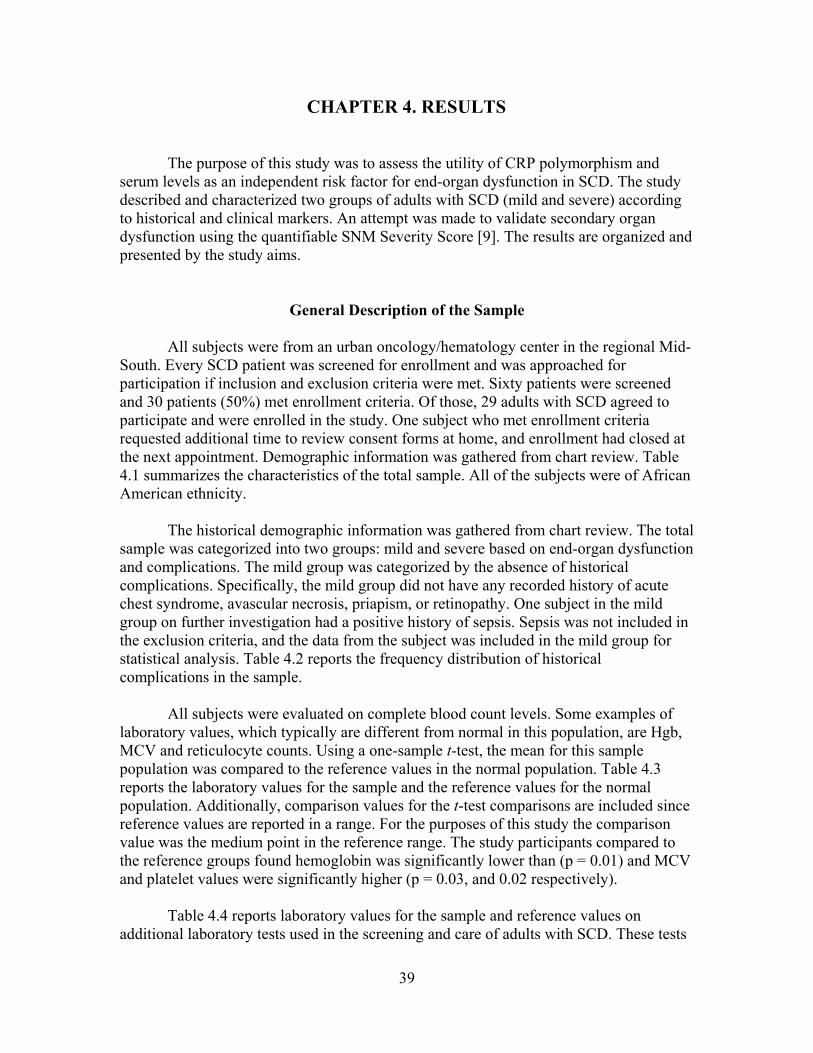
CHAPTER 4. RESULTS The purpose of this study was to assess the utility of CRP polymorphism and serum levels as an independent risk factor for end-organ dysfunction in SCD. The study described and characterized two groups of adults with SCD (mild and severe) according to historical and clinical markers. An attempt was made to validate secondary organ dysfunction using the quantifiable SNM Severity Score [9]. The results are organized and presented by the study aims.
General Description of the Sample
All subjects were from an urban oncology/hematology center in the regional Mid-South. Every SCD patient was screened for enrollment and was approached for participation if inclusion and exclusion criteria were met. Sixty patients were screened and 30 patients (50%) met enrollment criteria. Of those, 29 adults with SCD agreed to participate and were enrolled in the study. One subject who met enrollment criteria requested additional time to review consent forms at home, and enrollment had closed at the next appointment. Demographic information was gathered from chart review. Table 4.1 summarizes the characteristics of the total sample. All of the subjects were of African American ethnicity.
The historical demographic information was gathered from chart review. The total sample was categorized into two groups: mild and severe based on end-organ dysfunction and complications. The mild group was categorized by the absence of historical complications. Specifically, the mild group did not have any recorded history of acute chest syndrome, avascular necrosis, priapism, or retinopathy. One subject in the mild group on further investigation had a positive history of sepsis. Sepsis was not included in the exclusion criteria, and the data from the subject was included in the mild group for statistical analysis. Table 4.2 reports the frequency distribution of historical complications in the sample.
All subjects were evaluated on complete blood count levels. Some examples of laboratory values, which typically are different from normal in this population, are Hgb, MCV and reticulocyte counts. Using a one-sample t-test, the mean for this sample population was compared to the reference values in the normal population. Table 4.3 reports the laboratory values for the sample and the reference values for the normal population. Additionally, comparison values for the t-test comparisons are included since reference values are reported in a range. For the purposes of this study the comparison value was the medium point in the reference range. The study participants compared to the reference groups found hemoglobin was significantly lower than (p = 0.01) and MCV and platelet values were significantly higher (p = 0.03, and 0.02 respectively). Table 4.4 reports laboratory values for the sample and reference values on additional laboratory tests used in the screening and care of adults with SCD. These tests
39

Table 4.1 Characteristics of Total Sample (n = 29)
Total Sample SD Range
Age (years) 31.74 11.54 18-61.39
Gender male [n (%)] 15 (51.7%)
African-American [n (%)] 29 100%
Weight (lbs) 153.22 38.78 103-262.00
BMI (kg/m2) 24.52 06.09 18-43.20
Systolic B/P (mm/Hg) 118.52 13.28 87-145.00
Genotype Total Sample %
SS 17 48.60
SC 7 20.00
Sß+ 2 06.90
Sß0 3 10.30
40
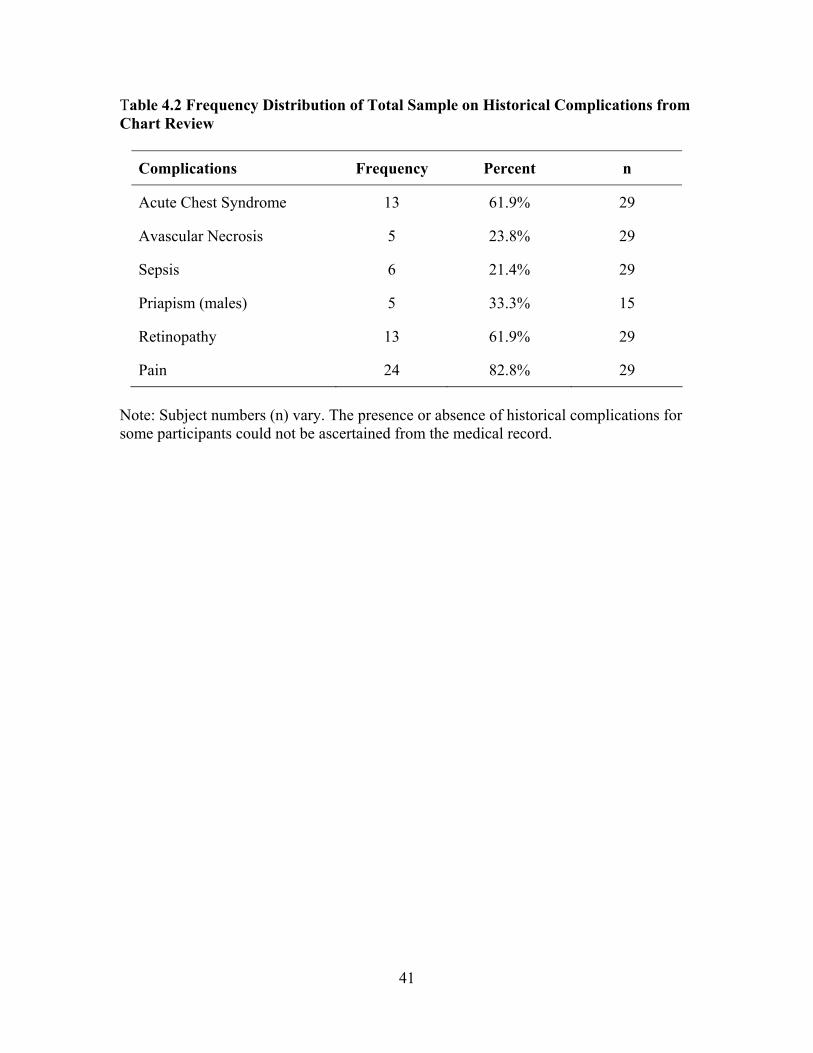
Table 4.2 Frequency Distribution of Total Sample on Historical Complications from Chart Review
Complications Frequency Percent n
Acute Chest Syndrome 13 61.9% 29
Avascular Necrosis 5 23.8% 29
Sepsis 6 21.4% 29
Priapism (males) 5 33.3% 15
Retinopathy 13 61.9% 29
Pain 24 82.8% 29
Note: Subject numbers (n) vary. The presence or absence of historical complications for some participants could not be ascertained from the medical record.
41
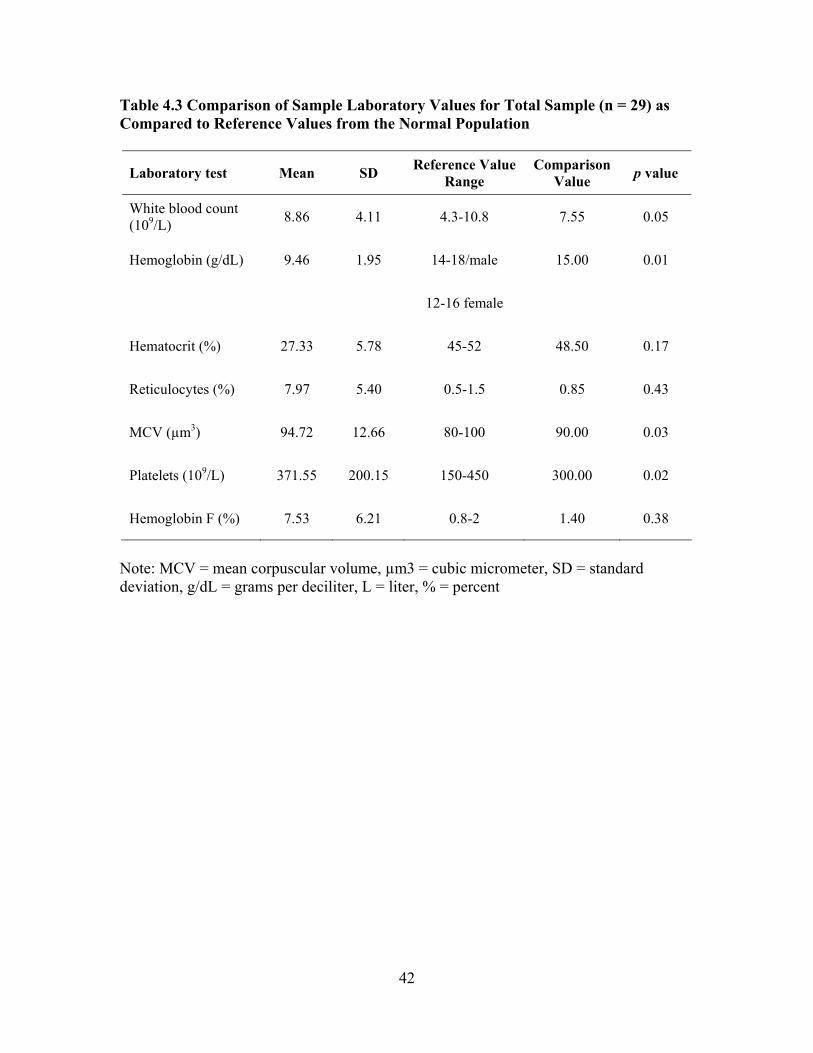
Table 4.3 Comparison of Sample Laboratory Values for Total Sample (n = 29) as Compared to Reference Values from the Normal Population
Laboratory test Mean SD Reference Value Range
Comparison Value p value
White blood count (109/L) 8.86 4.11 4.3-10.8 7.55 0.05
Hemoglobin (g/dL) 9.46 1.95 14-18/male 15.00 0.01
12-16 female
Hematocrit (%) 27.33 5.78 45-52 48.50 0.17
Reticulocytes (%) 7.97 5.40 0.5-1.5 0.85 0.43
MCV (µm3) 94.72 12.66 80-100 90.00 0.03
Platelets (109/L) 371.55 200.15 150-450 300.00 0.02
Hemoglobin F (%) 7.53 6.21 0.8-2 1.40 0.38
Note: MCV = mean corpuscular volume, µm3 = cubic micrometer, SD = standard deviation, g/dL = grams per deciliter, L = liter, % = percent
42
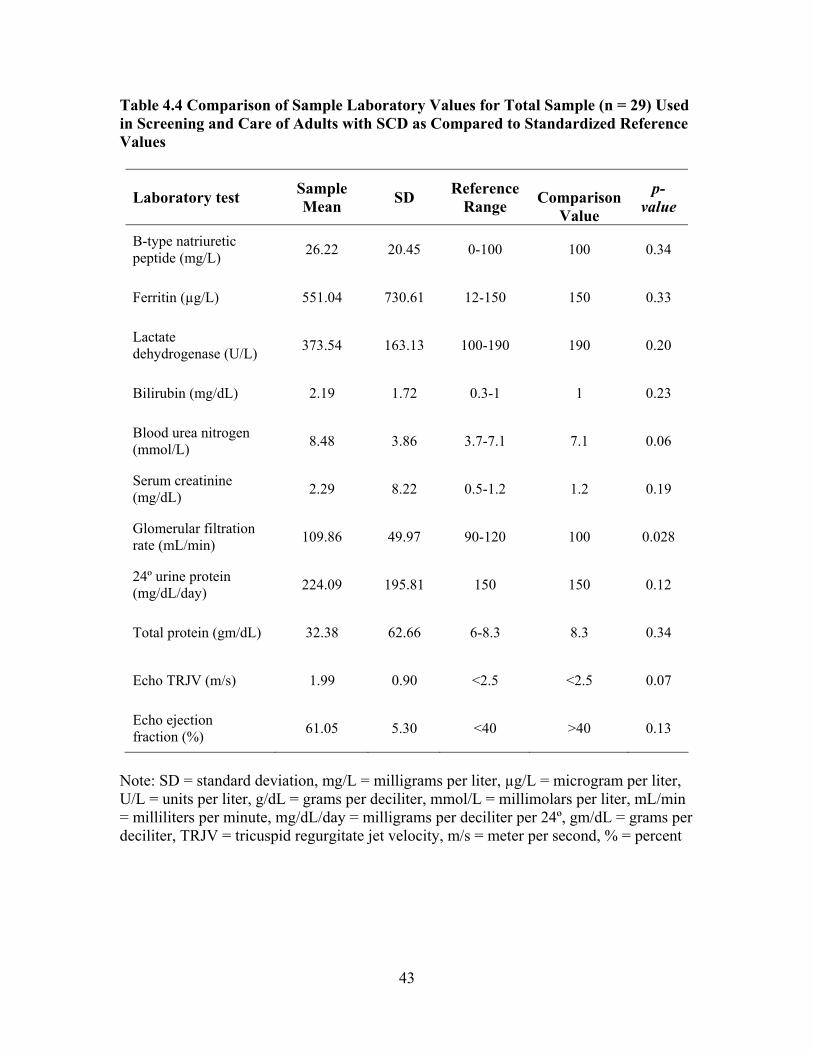
Table 4.4 Comparison of Sample Laboratory Values for Total Sample (n = 29) Used in Screening and Care of Adults with SCD as Compared to Standardized Reference Values
Laboratory test Sample Mean SD Reference
Range
Comparison
Value
p-value
B-type natriuretic peptide (mg/L) 26.22 20.45 0-100 100 0.34
Ferritin (µg/L) 551.04 730.61 12-150 150 0.33
Lactate dehydrogenase (U/L) 373.54 163.13 100-190 190 0.20
Bilirubin (mg/dL) 2.19 1.72 0.3-1 1 0.23
Blood urea nitrogen (mmol/L) 8.48 3.86 3.7-7.1 7.1 0.06
Serum creatinine (mg/dL) 2.29 8.22 0.5-1.2 1.2 0.19
Glomerular filtration rate (mL/min) 109.86 49.97 90-120 100 0.028
24º urine protein (mg/dL/day) 224.09 195.81 150 150 0.12
Total protein (gm/dL) 32.38 62.66 6-8.3 8.3 0.34
Echo TRJV (m/s) 1.99 0.90 <2.5 <2.5 0.07
Echo ejection fraction (%) 61.05 5.30 <40 >40 0.13
Note: SD = standard deviation, mg/L = milligrams per liter, µg/L = microgram per liter, U/L = units per liter, g/dL = grams per deciliter, mmol/L = millimolars per liter, mL/min = milliliters per minute, mg/dL/day = milligrams per deciliter per 24º, gm/dL = grams per deciliter, TRJV = tricuspid regurgitate jet velocity, m/s = meter per second, % = percent
43
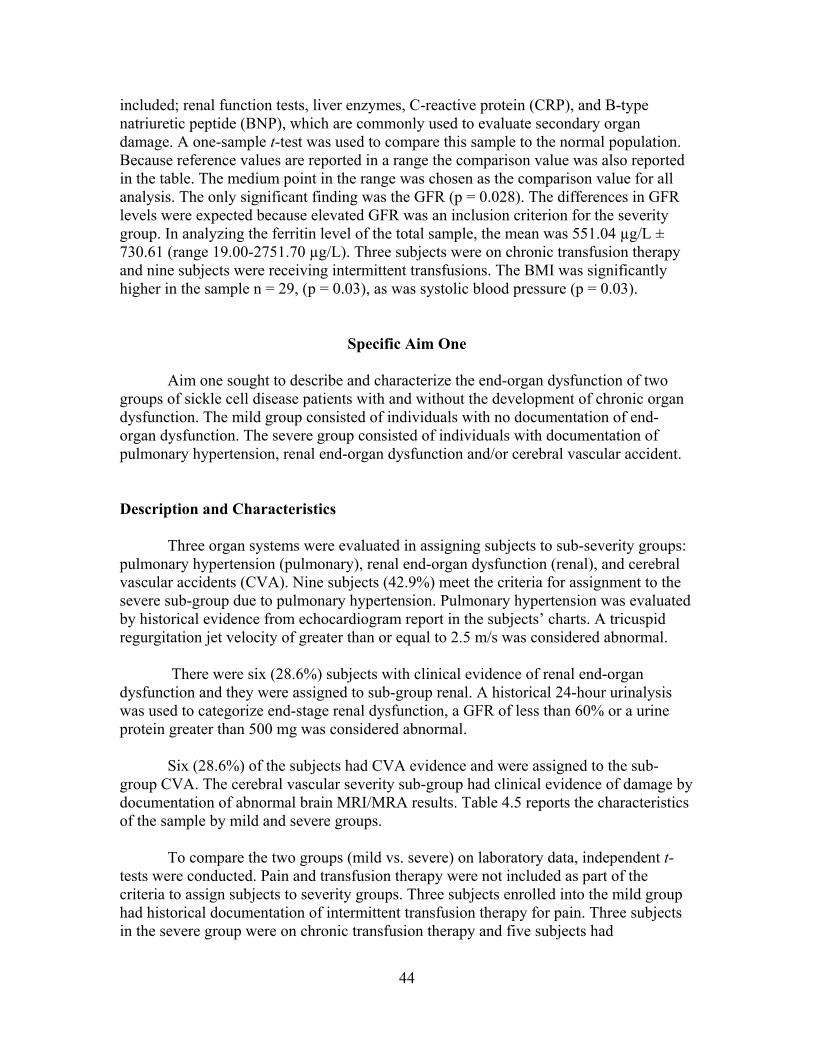
included; renal function tests, liver enzymes, C-reactive protein (CRP), and B-type natriuretic peptide (BNP), which are commonly used to evaluate secondary organ damage. A one-sample t-test was used to compare this sample to the normal population. Because reference values are reported in a range the comparison value was also reported in the table. The medium point in the range was chosen as the comparison value for all analysis. The only significant finding was the GFR (p = 0.028). The differences in GFR levels were expected because elevated GFR was an inclusion criterion for the severity group. In analyzing the ferritin level of the total sample, the mean was 551.04 µg/L ± 730.61 (range 19.00-2751.70 µg/L). Three subjects were on chronic transfusion therapy and nine subjects were receiving intermittent transfusions. The BMI was significantly higher in the sample n = 29, (p = 0.03), as was systolic blood pressure (p = 0.03).
Specific Aim One Aim one sought to describe and characterize the end-organ dysfunction of two groups of sickle cell disease patients with and without the development of chronic organ dysfunction. The mild group consisted of individuals with no documentation of end-organ dysfunction. The severe group consisted of individuals with documentation of pulmonary hypertension, renal end-organ dysfunction and/or cerebral vascular accident. Description and Characteristics
Three organ systems were evaluated in assigning subjects to sub-severity groups:
pulmonary hypertension (pulmonary), renal end-organ dysfunction (renal), and cerebral vascular accidents (CVA). Nine subjects (42.9%) meet the criteria for assignment to the severe sub-group due to pulmonary hypertension. Pulmonary hypertension was evaluated by historical evidence from echocardiogram report in the subjects’ charts. A tricuspid regurgitation jet velocity of greater than or equal to 2.5 m/s was considered abnormal.
There were six (28.6%) subjects with clinical evidence of renal end-organ
dysfunction and they were assigned to sub-group renal. A historical 24-hour urinalysis was used to categorize end-stage renal dysfunction, a GFR of less than 60% or a urine protein greater than 500 mg was considered abnormal.
Six (28.6%) of the subjects had CVA evidence and were assigned to the sub-
group CVA. The cerebral vascular severity sub-group had clinical evidence of damage by documentation of abnormal brain MRI/MRA results. Table 4.5 reports the characteristics of the sample by mild and severe groups. To compare the two groups (mild vs. severe) on laboratory data, independent t-tests were conducted. Pain and transfusion therapy were not included as part of the criteria to assign subjects to severity groups. Three subjects enrolled into the mild group had historical documentation of intermittent transfusion therapy for pain. Three subjects in the severe group were on chronic transfusion therapy and five subjects had
44
Table 4.5 Characteristics of Mild and Severe Groups
Mild Severe Age (years)
Age Range (years) 32.71 ±14.30 (18.67-61.39) 29.69 ± 8.9
(18.67-50.22)
Gender-male [n (%)] 2 (25%) 13 (61.9%)
Genotype n % n %
SS 5 62.5 12 57.1
SC 1 12.5 6 28.6
Sß+ 1 12.5 2 09.5
Sß0 1 12.5 1 04.7
Hydroxyurea Tx 1 12.5 16 76.2
Notes: Hydroxyurea Tx = hydroxyurea therapy
45
documentation of intermittent transfusion therapy. Table 4.6 presents a comparison of the two groups on traditional serum laboratory values.
Several variables were used to determine assignment into the severity sub-groups.
Table 4.7 reports additional comparisons of laboratory values between the mild vs. severe groups using biomarkers of end-organ dysfunction. Additional analysis was explored after finding no differences in laboratory values, except MCV, bilirubin and platelets, between mild vs. severe groups. A secondary question was formulated regarding the possibility that the organ of dysfunction may play a role in the analysis. The severe group was divided into subgroups based on the type of end-organ dysfunction. The sub-group of pulmonary hypertension (n = 9) had a mean TRJV of 2.85 m/s ± 0.27, compared to the mild group (n = 8) with a TRJV of 1.71 m/s ± 0.7 (p = 0.000).
The sub-group of renal end-organ dysfunction (n = 6) had a mean GFR of 74 % ± 37.49 and 24° urine protein level of 408.5 mg/L/day ± 215.58 compared to the mild group (n = 8) with a mean GFR of 117.64 % ± 40.91 and 24° urine protein level of 98.99 mg/L/day ± 40.05. Evidence of other secondary complications was reported with events of acute chest syndrome, sepsis, and retinopathy. Figure 4.1 reports the frequency of these complications by end-organ dysfunction sub-group. Evidence of priapism in the pulmonary end-organ dysfunction sub-group was found in 2 of 9 subjects (22.2%), for the renal sub-group there was 2 of 6 subjects (33.3%) and in the CVA sub-group 1 of the 6 subjects (16.6%). Only one subject from the renal sub-group had a history of leg ulcers.
The cerebral vascular severity group had clinical evidence of dysfunction identified by documentation of abnormal brain MRI/MRA results. Additionally, 2 of 9 subjects in the pulmonary sub-group and 3 of 6 subjects (50%) of the renal sub-group had abnormal brain MRI/MRA. Historical evidence of AVN was found in 2 of 8 subjects (22.2%) of the pulmonary sub-group, 1 of 6 subjects (16.6%) of the renal sub-group, and 2 of 6 subjects (33.3%) of the CVA sub-group. Additionally, retinopathy was documented from an ophthalmologist report, which was part of the screening process in this clinic setting. Retinal damage was found in 7 of 8 subjects (87.5%) of the pulmonary sub-group (one missing value in this group), 3 of 3 subjects (50%) in the renal sub-group, and 3 of 3 subjects (50%) of the CVA sub-group.
Treatment therapy was collected from the medical records of each subject. Figure
4.2 reports the distribution of hydroxyurea and transfusion therapy within the severity sub-groups. While not the focus of this study, another complication in the adult SCD population is pain. Pain was classified as positive if the subject had documentation in the medical record of pharmacologically treated pain episodes at the last follow-up clinic
46
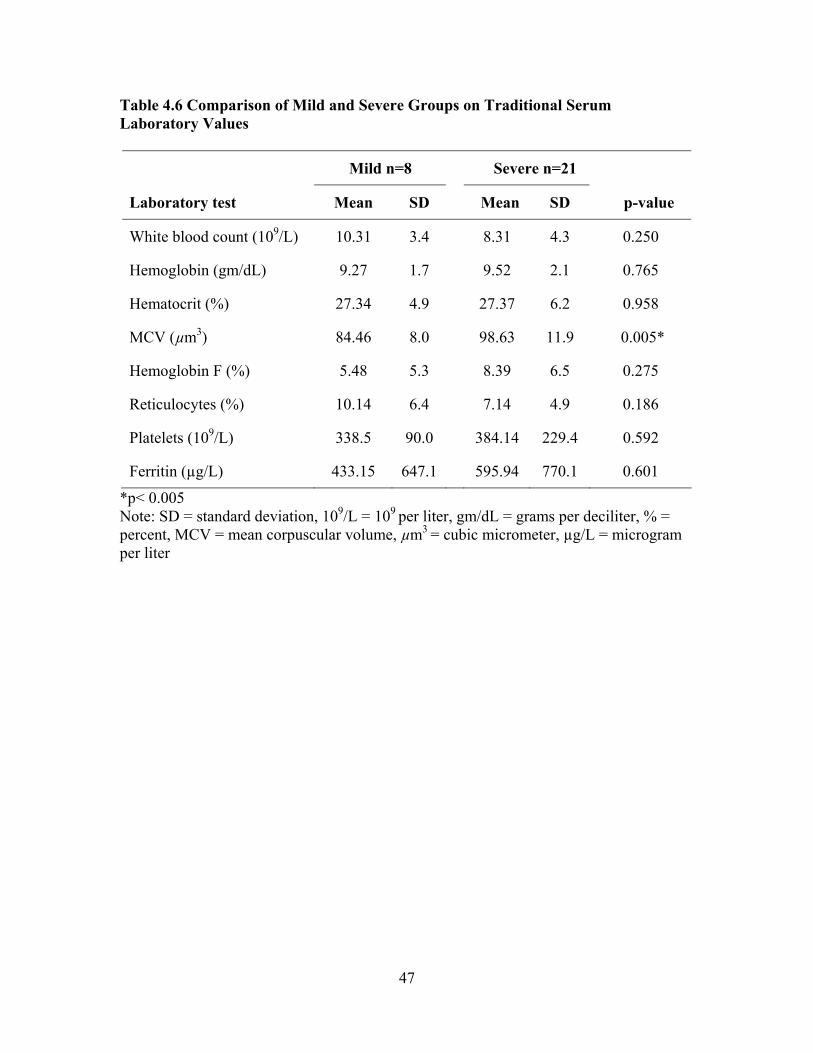
Table 4.6 Comparison of Mild and Severe Groups on Traditional Serum Laboratory Values
Mild n=8 Severe n=21
Laboratory test Mean SD Mean SD p-value
White blood count (109/L) 10.31 3.4 8.31 4.3 0.250
Hemoglobin (gm/dL) 9.27 1.7 9.52 2.1 0.765
Hematocrit (%) 27.34 4.9 27.37 6.2 0.958
MCV (µm3) 84.46 8.0 98.63 11.9 0.005*
Hemoglobin F (%) 5.48 5.3 8.39 6.5 0.275
Reticulocytes (%) 10.14 6.4 7.14 4.9 0.186
Platelets (109/L) 338.5 90.0 384.14 229.4 0.592
Ferritin (µg/L) 433.15 647.1 595.94 770.1 0.601
*p< 0.005 Note: SD = standard deviation, 109/L = 109 per liter, gm/dL = grams per deciliter, % = percent, MCV = mean corpuscular volume, µm3 = cubic micrometer, µg/L = microgram per liter
47
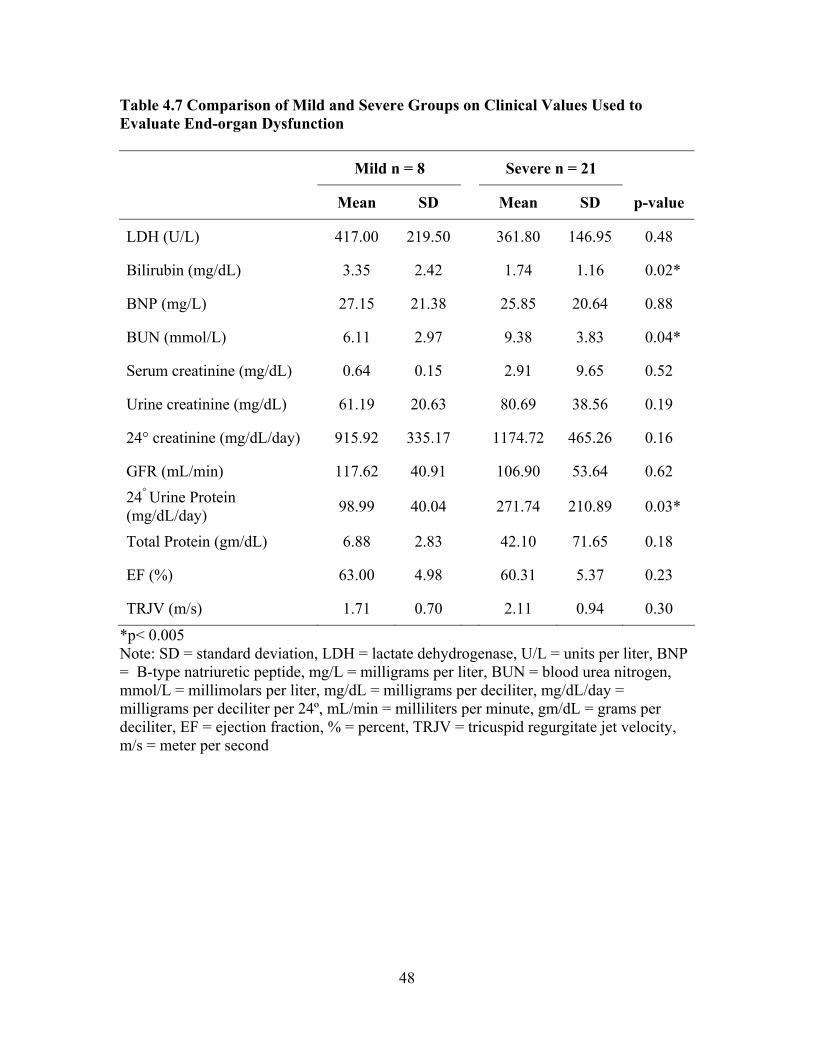
Table 4.7 Comparison of Mild and Severe Groups on Clinical Values Used to Evaluate End-organ Dysfunction
Mild n = 8 Severe n = 21
Mean SD Mean SD p-value
LDH (U/L) 417.00 219.50 361.80 146.95 0.48
Bilirubin (mg/dL) 3.35 2.42 1.74 1.16 0.02*
BNP (mg/L) 27.15 21.38 25.85 20.64 0.88
BUN (mmol/L) 6.11 2.97 9.38 3.83 0.04*
Serum creatinine (mg/dL) 0.64 0.15 2.91 9.65 0.52
Urine creatinine (mg/dL) 61.19 20.63 80.69 38.56 0.19
24° creatinine (mg/dL/day) 915.92 335.17 1174.72 465.26 0.16
GFR (mL/min) 117.62 40.91 106.90 53.64 0.62 24° Urine Protein (mg/dL/day) 98.99 40.04 271.74 210.89 0.03*
Total Protein (gm/dL) 6.88 2.83 42.10 71.65 0.18
EF (%) 63.00 4.98 60.31 5.37 0.23
TRJV (m/s) 1.71 0.70 2.11 0.94 0.30
*p< 0.005 Note: SD = standard deviation, LDH = lactate dehydrogenase, U/L = units per liter, BNP = B-type natriuretic peptide, mg/L = milligrams per liter, BUN = blood urea nitrogen, mmol/L = millimolars per liter, mg/dL = milligrams per deciliter, mg/dL/day = milligrams per deciliter per 24º, mL/min = milliliters per minute, gm/dL = grams per deciliter, EF = ejection fraction, % = percent, TRJV = tricuspid regurgitate jet velocity, m/s = meter per second
48

Freq
uenc
y va
lue
Retinopathy Sepsis
ACS
Pulmonary Renal CVA
Severity Sub-Groups
Figure 4.1 Frequency of Historical Evidence of ACS, Sepsis, and Nephropathy by End-organ Dysfunction Sub-groups within the Severe Group
49
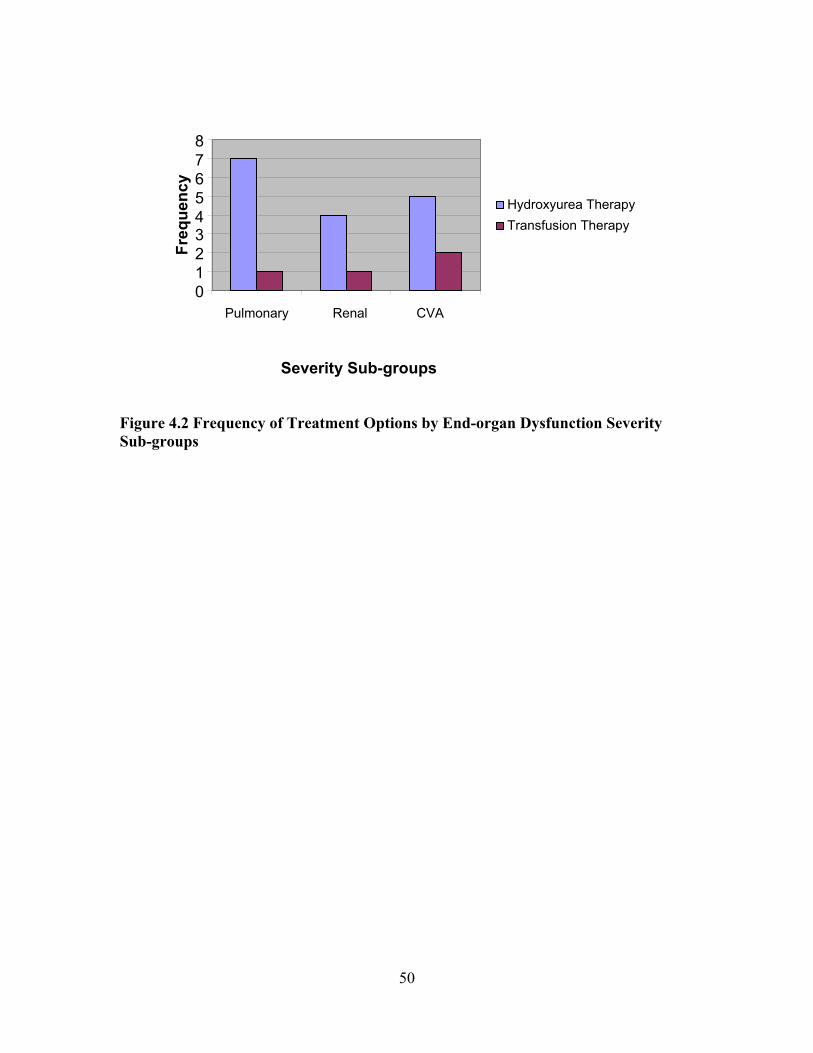
0 1 2 3 4 5 6 7 8
Freq
uenc
y
Transfusion TherapyHydroxyurea Therapy
Pulmonary Renal
CVA
Severity Sub-groups
Figure 4.2 Frequency of Treatment Options by End-organ Dysfunction Severity Sub-groups
50
visit. A majority of the subjects in both the mild and severe groups were positive for pain. For the mild group 6/8 (75%) had pain compared to 18/21 (85.7%) in the severe group. Pain was analyzed by end-organ dysfunction severity sub-groups and found 8 of 9 subjects (88.8%) of the pulmonary sub-group, 100% of the renal sub-group subjects and 4 of 6 subjects (66.6%) of the CVA sub-group had pain. Three subjects in the CVA sub-group with pain (n = 4) had intermittent or chronic transfusion therapy (75%). Sebastiani Network Model (SNM) Severity Score Validation The SNM Severity Scoring system [9] used to compare this sample, integrated documented disease complications and results of selected laboratory tests. This Bayesian network model was built on associations of variables and assumes “death” as the central outcome. This is a newly developed model and has not been independently validated with prospectively gathered data. The purpose of incorporating this model into the analysis was to compare our clinical assessment of severity to the network model severity score. Historical complications are considered an independent risk factor for severity evaluation. The charts that were reviewed to collect the gathered information included the childhood complications. There were 18 variables used in this network model of prediction. These variables included age, acute chest syndrome, priapism, avascular necrosis, sepsis, blood transfusions, LDH, MCV, gender, CVA, systolic blood pressure, WBC, genotype, bilirubin, reticulocyte count, and pain. An individual severity score was calculated for each subject using the “disease severity score calculator” found at www.bu.edu/sicklecell/downloads/Projects [112]. The possible range of scores was from zero to one with higher scores indicating greater risk of 5-year mortality. Figure 4.3 demonstrates the wide variability of the SNM Severity Scores within the sample population. There was no significant difference (p = 0.51) between the SNM Severity Score for the mild group [0.275 ± 0.302 (n = 8)] as compared to the severe group [0.362 ± 0.319 (n = 21)]. The mild group did have 7 of 8 subjects (87.5%) of the scores below the 0.5 value [9]. The mild group had one subject who was an outlier due to a historical finding of sepsis, which was not included as a criterion when assigning subjects to the mild and severe group. In the SNM Severity Score analysis, sepsis was identified as a strong predictor of disease severity. Figure 4.4 reports the distribution of SNM Severity Scores by mild vs. severe sub-groups. When looking at the severe end-organ dysfunction sub-groups separately, there were no significant correlation between the assigned SNM Severity Score and prognostic clinical markers used to assign subjects to a severity sub-groups.
What was most interesting was that the pulmonary sub-group had the widest range of severity scores, while the mild group had the smallest range. It is also interesting that all four groups had subjects with low severity scores, so variability was on the higher end of the scale.
51
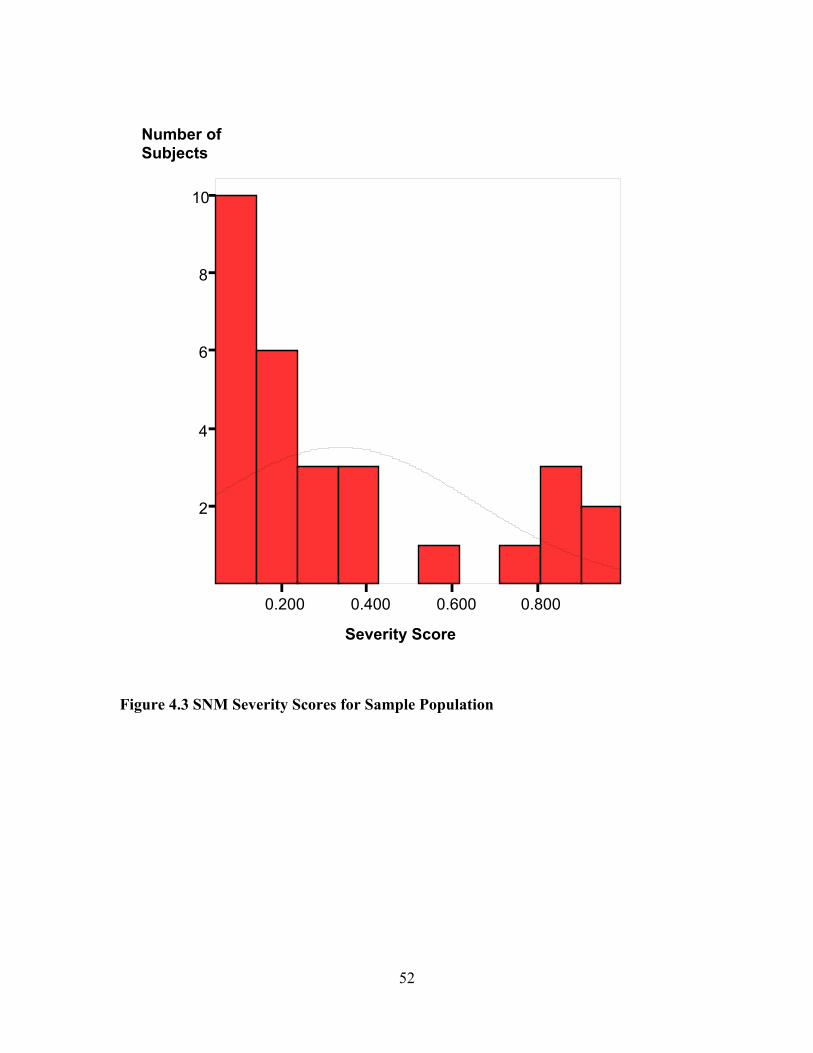
2
4
6
8
10
Number of Subjects
0.200 0.400 0.600 0.800
Severity Score
Figure 4.3 SNM Severity Scores for Sample Population
52

Mild Pulmonary
RenalCVA
Severity group
0.200
0.400
0.600
0.800
1.000
Severity Score
**
* = outliers
Figure 4.4 Boxplot of SNM Severity Score by Mild and Severity Sub-groups
53
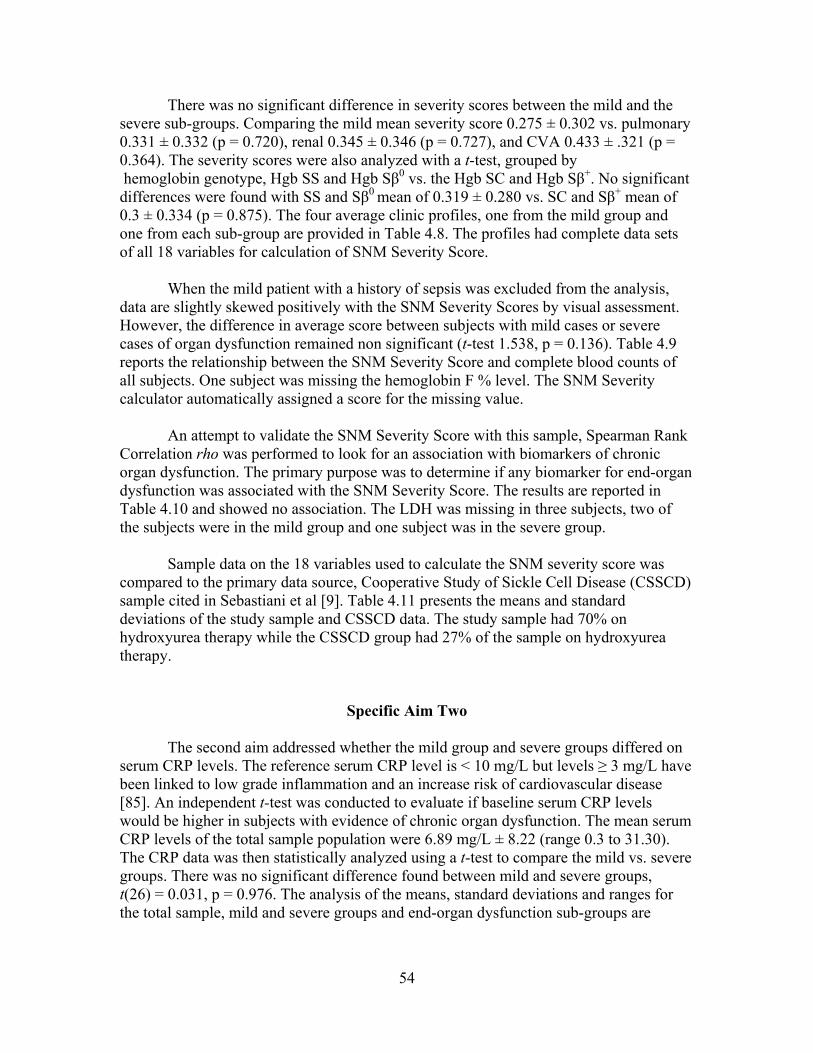
There was no significant difference in severity scores between the mild and the severe sub-groups. Comparing the mild mean severity score 0.275 ± 0.302 vs. pulmonary 0.331 ± 0.332 (p = 0.720), renal 0.345 ± 0.346 (p = 0.727), and CVA 0.433 ± .321 (p = 0.364). The severity scores were also analyzed with a t-test, grouped by hemoglobin genotype, Hgb SS and Hgb Sβ0 vs. the Hgb SC and Hgb Sβ+. No significant differences were found with SS and Sβ0 mean of 0.319 ± 0.280 vs. SC and Sβ+ mean of 0.3 ± 0.334 (p = 0.875). The four average clinic profiles, one from the mild group and one from each sub-group are provided in Table 4.8. The profiles had complete data sets of all 18 variables for calculation of SNM Severity Score. When the mild patient with a history of sepsis was excluded from the analysis, data are slightly skewed positively with the SNM Severity Scores by visual assessment. However, the difference in average score between subjects with mild cases or severe cases of organ dysfunction remained non significant (t-test 1.538, p = 0.136). Table 4.9 reports the relationship between the SNM Severity Score and complete blood counts of all subjects. One subject was missing the hemoglobin F % level. The SNM Severity calculator automatically assigned a score for the missing value. An attempt to validate the SNM Severity Score with this sample, Spearman Rank Correlation rho was performed to look for an association with biomarkers of chronic organ dysfunction. The primary purpose was to determine if any biomarker for end-organ dysfunction was associated with the SNM Severity Score. The results are reported in Table 4.10 and showed no association. The LDH was missing in three subjects, two of the subjects were in the mild group and one subject was in the severe group. Sample data on the 18 variables used to calculate the SNM severity score was compared to the primary data source, Cooperative Study of Sickle Cell Disease (CSSCD) sample cited in Sebastiani et al [9]. Table 4.11 presents the means and standard deviations of the study sample and CSSCD data. The study sample had 70% on hydroxyurea therapy while the CSSCD group had 27% of the sample on hydroxyurea therapy.
Specific Aim Two The second aim addressed whether the mild group and severe groups differed on serum CRP levels. The reference serum CRP level is < 10 mg/L but levels ≥ 3 mg/L have been linked to low grade inflammation and an increase risk of cardiovascular disease [85]. An independent t-test was conducted to evaluate if baseline serum CRP levels would be higher in subjects with evidence of chronic organ dysfunction. The mean serum CRP levels of the total sample population were 6.89 mg/L ± 8.22 (range 0.3 to 31.30). The CRP data was then statistically analyzed using a t-test to compare the mild vs. severe groups. There was no significant difference found between mild and severe groups, t(26) = 0.031, p = 0.976. The analysis of the means, standard deviations and ranges for the total sample, mild and severe groups and end-organ dysfunction sub-groups are
54
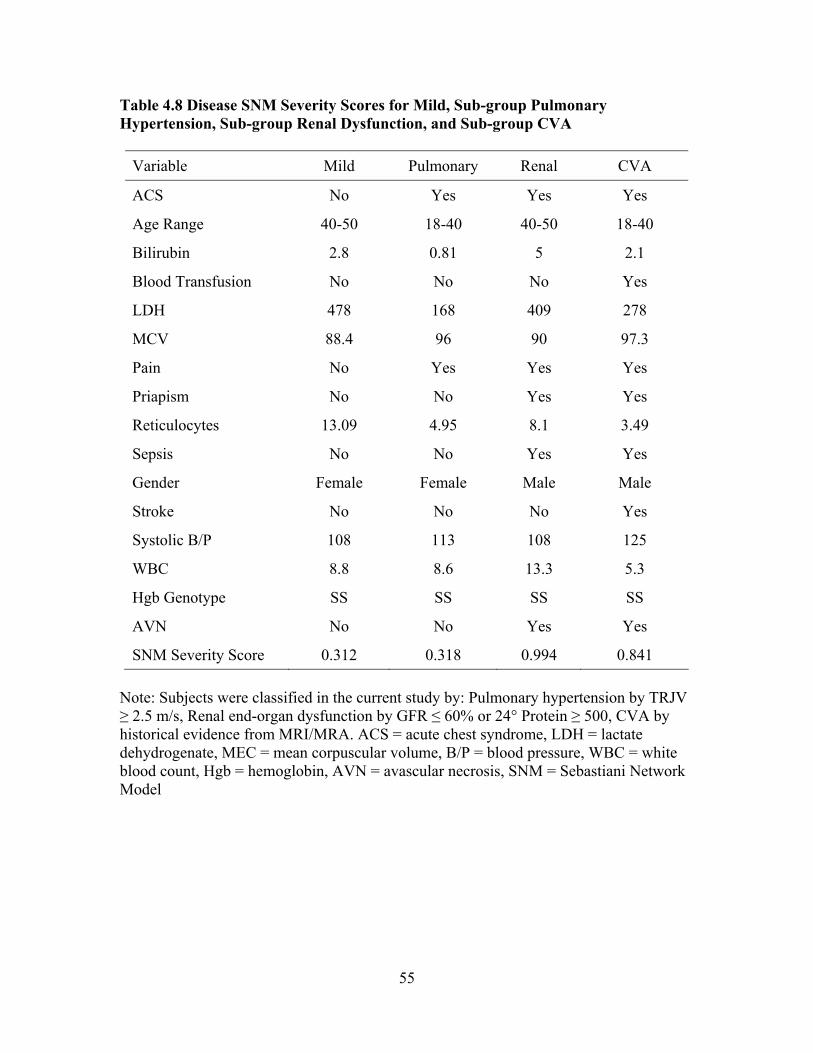
Table 4.8 Disease SNM Severity Scores for Mild, Sub-group Pulmonary Hypertension, Sub-group Renal Dysfunction, and Sub-group CVA
Variable Mild Pulmonary Renal CVA
ACS No Yes Yes Yes
Age Range 40-50 18-40 40-50 18-40
Bilirubin 2.8 0.81 5 2.1
Blood Transfusion No No No Yes
LDH 478 168 409 278
MCV 88.4 96 90 97.3
Pain No Yes Yes Yes
Priapism No No Yes Yes
Reticulocytes 13.09 4.95 8.1 3.49
Sepsis No No Yes Yes
Gender Female Female Male Male
Stroke No No No Yes
Systolic B/P 108 113 108 125
WBC 8.8 8.6 13.3 5.3
Hgb Genotype SS SS SS SS
AVN No No Yes Yes
SNM Severity Score 0.312 0.318 0.994 0.841 Note: Subjects were classified in the current study by: Pulmonary hypertension by TRJV ≥ 2.5 m/s, Renal end-organ dysfunction by GFR ≤ 60% or 24° Protein ≥ 500, CVA by historical evidence from MRI/MRA. ACS = acute chest syndrome, LDH = lactate dehydrogenate, MEC = mean corpuscular volume, B/P = blood pressure, WBC = white blood count, Hgb = hemoglobin, AVN = avascular necrosis, SNM = Sebastiani Network Model
55
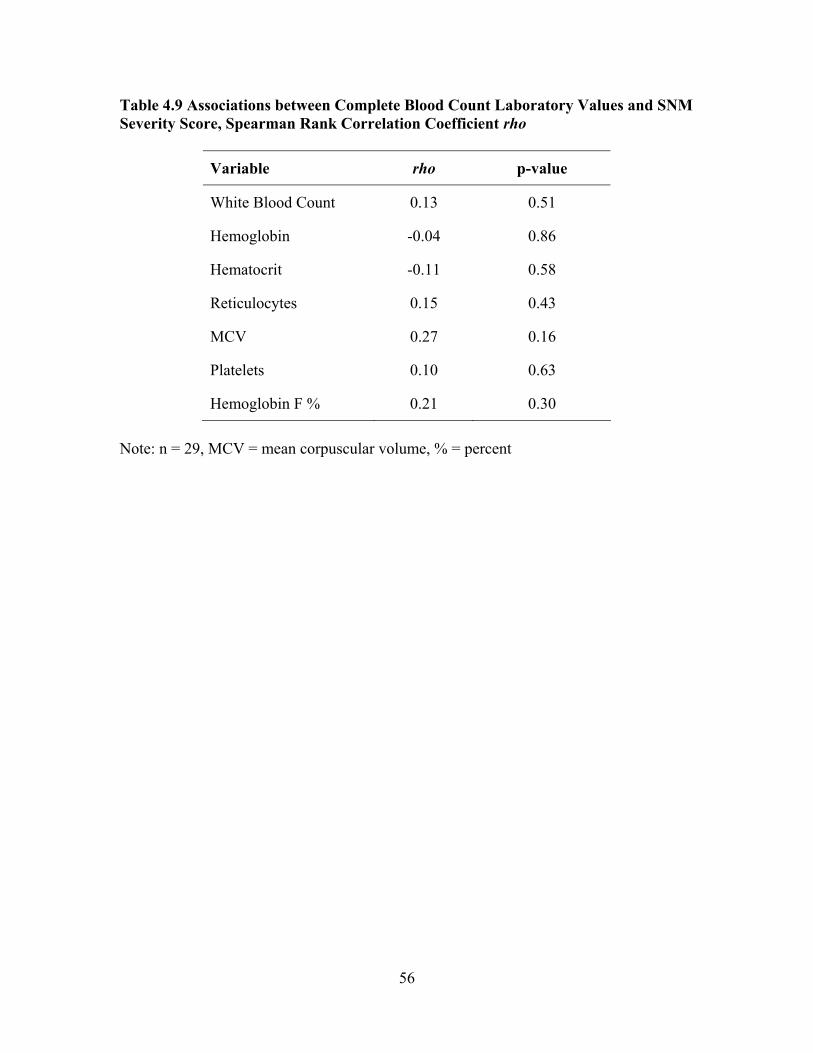
Table 4.9 Associations between Complete Blood Count Laboratory Values and SNM Severity Score, Spearman Rank Correlation Coefficient rho
Variable rho p-value
White Blood Count 0.13 0.51
Hemoglobin -0.04 0.86
Hematocrit -0.11 0.58
Reticulocytes 0.15 0.43
MCV 0.27 0.16
Platelets 0.10 0.63
Hemoglobin F % 0.21 0.30
Note: n = 29, MCV = mean corpuscular volume, % = percent
56
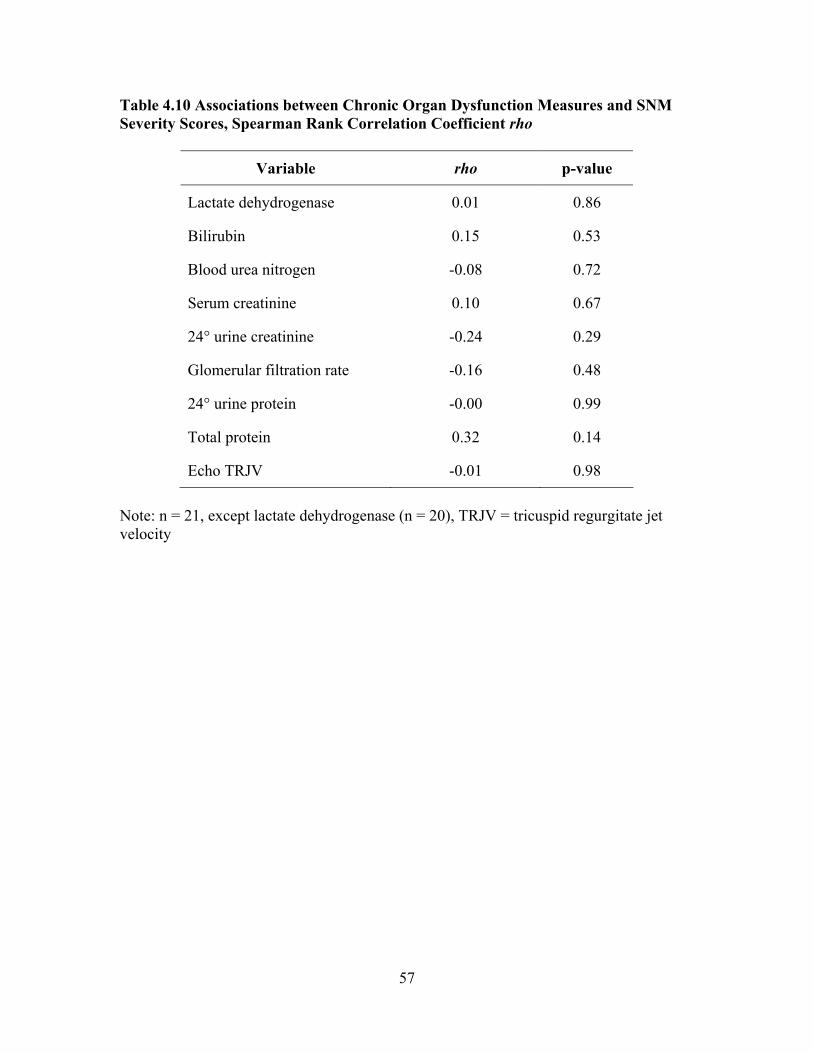
Table 4.10 Associations between Chronic Organ Dysfunction Measures and SNM Severity Scores, Spearman Rank Correlation Coefficient rho
Variable rho p-value
Lactate dehydrogenase 0.01 0.86
Bilirubin 0.15 0.53
Blood urea nitrogen -0.08 0.72
Serum creatinine 0.10 0.67
24° urine creatinine -0.24 0.29
Glomerular filtration rate -0.16 0.48
24° urine protein -0.00 0.99
Total protein 0.32 0.14
Echo TRJV -0.01 0.98
Note: n = 21, except lactate dehydrogenase (n = 20), TRJV = tricuspid regurgitate jet velocity
57

Table 4.11 Comparison of the Study Sample with SCCDC Data on Variables Used to Calculate SNM Severity Score
Current study
n = 29 CSSCD
n = 3380
Variable Mean SD Mean SD
Age (years) 31.14 11.58 20.00 14.4
Bilirubin (mg/dL) 2.19 1.72 2.71 1.89
BUN level (mmol/L) 8.48 3.86 9.36 5.36 Serum creatinine (mg/dL) 2.29 8.22 0.70 0.64
Hemoglobin (g/dL) 9.45 1.95 9.13 1.81
Hemoglobin F (%) 7.53 6.21 6.12 5.78
LDH (U/L) 374.54 163.13 459.51 206.34
MCV (µm3) 94.72 12.66 87.42 8.75
Platelets (109/L) 371.55 200.15 399.30 131.17
Reticulocytes (%) 7.97 5.4 9.56 5.85
Systolic B/P (mmHg) 118.52 13.28 105.70 12.35
WBC (109/L) 8.84 4.12 11.17 3.31
Note: CSSCD indicates Cooperative Study of Sickle Cell Disease. SD = standard deviation, BUN = blood urea nitrogen, mmol/L = millimolars per liter, mg/dL = milligrams per deciliter, gm/dL = grams per deciliter, % = percent, LDH = lactate dehydrogenase, U/L = units per liter, MCV = mean corpuscular volume, µm3 = cubic micrometer, 109/L = 109 per liter, B/P = blood pressure, mmHg = millimeters of mercury, WBC = white blood count
58
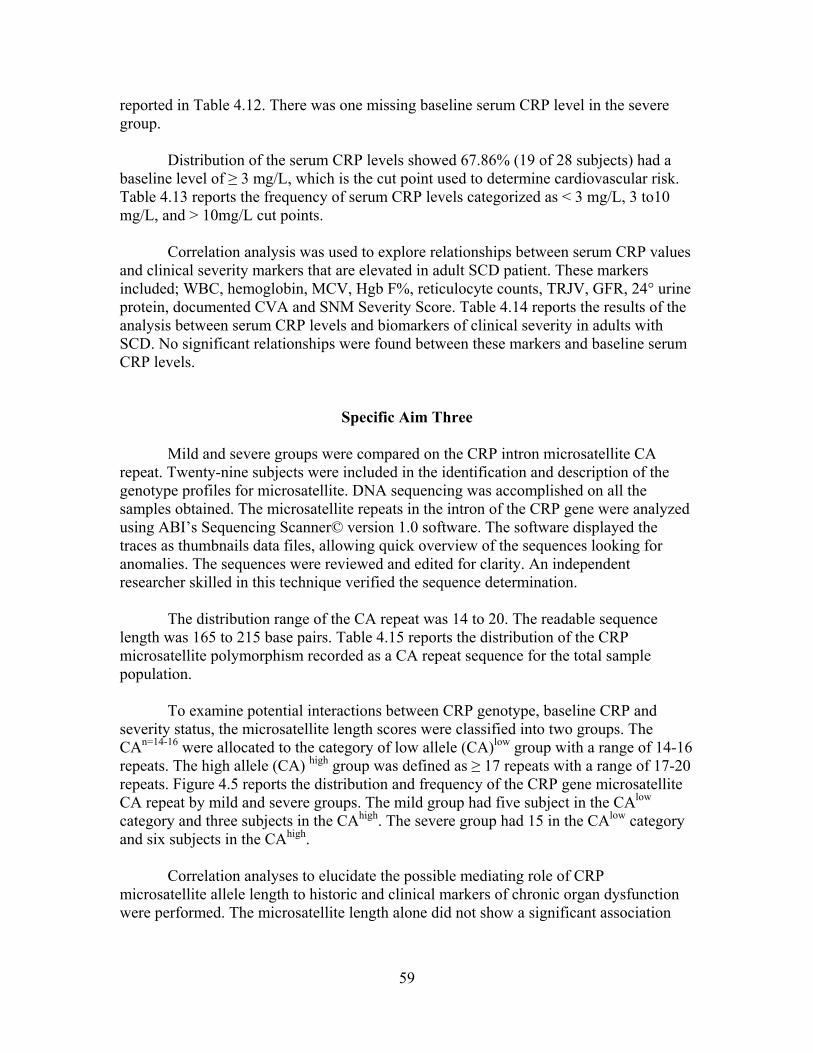
reported in Table 4.12. There was one missing baseline serum CRP level in the severe group.
Distribution of the serum CRP levels showed 67.86% (19 of 28 subjects) had a baseline level of ≥ 3 mg/L, which is the cut point used to determine cardiovascular risk. Table 4.13 reports the frequency of serum CRP levels categorized as < 3 mg/L, 3 to10 mg/L, and > 10mg/L cut points. Correlation analysis was used to explore relationships between serum CRP values and clinical severity markers that are elevated in adult SCD patient. These markers included; WBC, hemoglobin, MCV, Hgb F%, reticulocyte counts, TRJV, GFR, 24° urine protein, documented CVA and SNM Severity Score. Table 4.14 reports the results of the analysis between serum CRP levels and biomarkers of clinical severity in adults with SCD. No significant relationships were found between these markers and baseline serum CRP levels.
Specific Aim Three Mild and severe groups were compared on the CRP intron microsatellite CA repeat. Twenty-nine subjects were included in the identification and description of the genotype profiles for microsatellite. DNA sequencing was accomplished on all the samples obtained. The microsatellite repeats in the intron of the CRP gene were analyzed using ABI’s Sequencing Scanner© version 1.0 software. The software displayed the traces as thumbnails data files, allowing quick overview of the sequences looking for anomalies. The sequences were reviewed and edited for clarity. An independent researcher skilled in this technique verified the sequence determination. The distribution range of the CA repeat was 14 to 20. The readable sequence length was 165 to 215 base pairs. Table 4.15 reports the distribution of the CRP microsatellite polymorphism recorded as a CA repeat sequence for the total sample population.
To examine potential interactions between CRP genotype, baseline CRP and severity status, the microsatellite length scores were classified into two groups. The CAn=14-16 were allocated to the category of low allele (CA)low group with a range of 14-16 repeats. The high allele (CA) high group was defined as ≥ 17 repeats with a range of 17-20 repeats. Figure 4.5 reports the distribution and frequency of the CRP gene microsatellite CA repeat by mild and severe groups. The mild group had five subject in the CAlow category and three subjects in the CAhigh. The severe group had 15 in the CAlow category and six subjects in the CAhigh. Correlation analyses to elucidate the possible mediating role of CRP microsatellite allele length to historic and clinical markers of chronic organ dysfunction were performed. The microsatellite length alone did not show a significant association
59
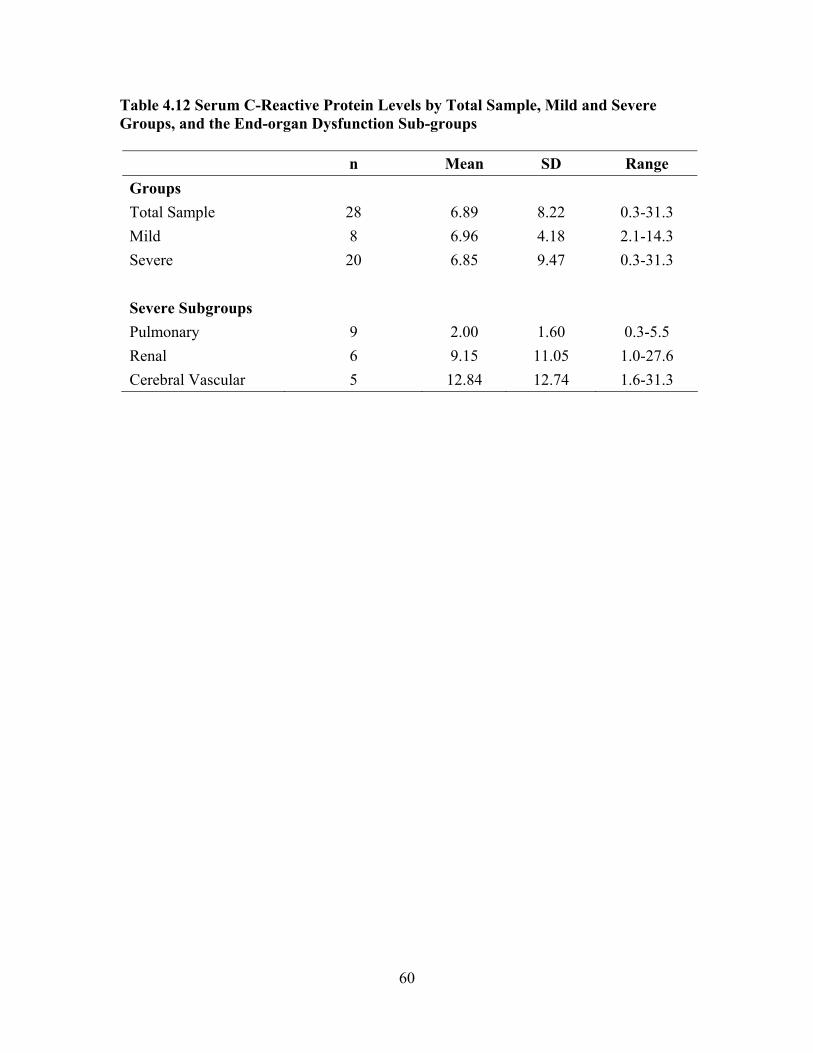
Table 4.12 Serum C-Reactive Protein Levels by Total Sample, Mild and Severe Groups, and the End-organ Dysfunction Sub-groups
n Mean SD Range Groups Total Sample 28 6.89 8.22 0.3-31.3 Mild 8 6.96 4.18 2.1-14.3 Severe 20 6.85 9.47 0.3-31.3 Severe Subgroups Pulmonary 9 2.00 1.60 0.3-5.5 Renal 6 9.15 11.05 1.0-27.6 Cerebral Vascular 5 12.84 12.74 1.6-31.3
60
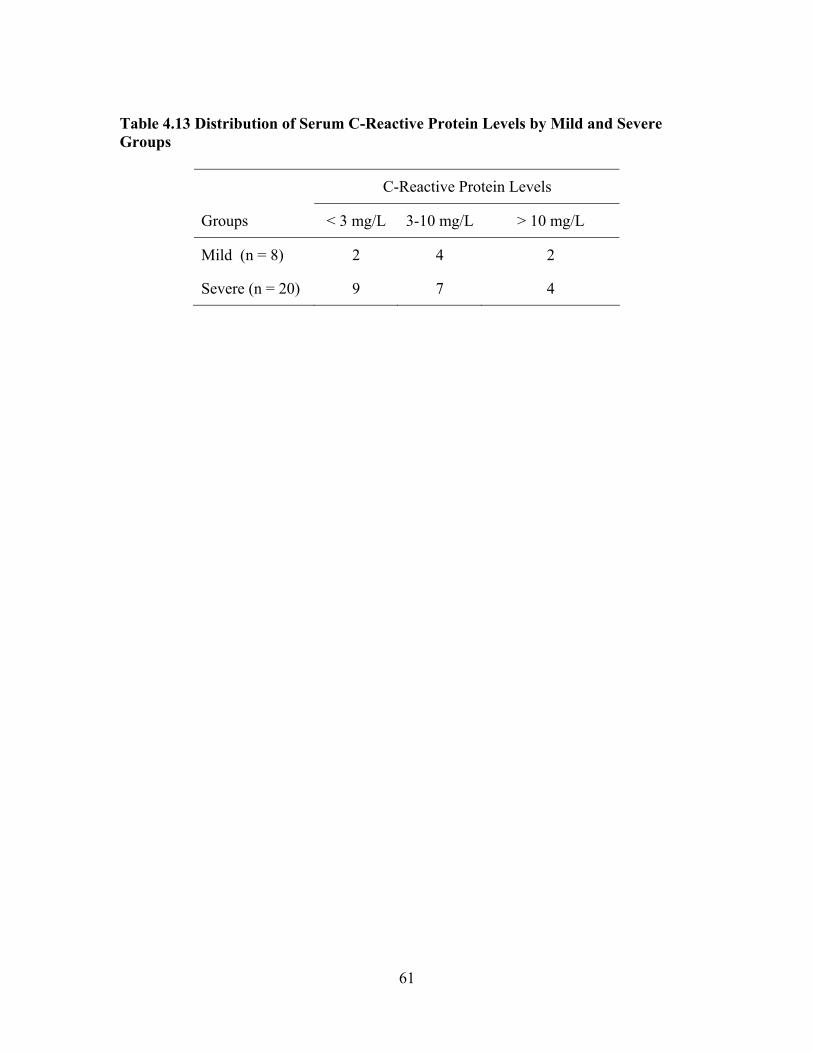
Table 4.13 Distribution of Serum C-Reactive Protein Levels by Mild and Severe Groups
C-Reactive Protein Levels
Groups < 3 mg/L 3-10 mg/L > 10 mg/L
Mild (n = 8) 2 4 2
Severe (n = 20) 9 7 4
61

Table 4.14 Associations between Serum CRP and Laboratory and Clinical Biomarkers of Severity in Adults with SCD Using Spearman Rank Correlation Coefficient rho
Category/Marker Variables rho p-value
Standard SCD Laboratory White Blood Count -0.048 0.808
Hemoglobin 0.075 0.705
MCV -0.086 0.664
Hgb F% -0.244 0.219
Reticulocytes 0.248 0.204
Pulmonary HTN TRJV -0.323 0.093
Renal Dysfunction GFR -0.226 0.248
24° Urine Protein -0.049 0.804
Cerebral Vascular CVA 0.033 0.867
Severity Validation Severity Score 0.127 0.521
CRP Genotype Allele Group 0.147 0.456
Note: n = 28 except for Hgb F % (n = 27)
62
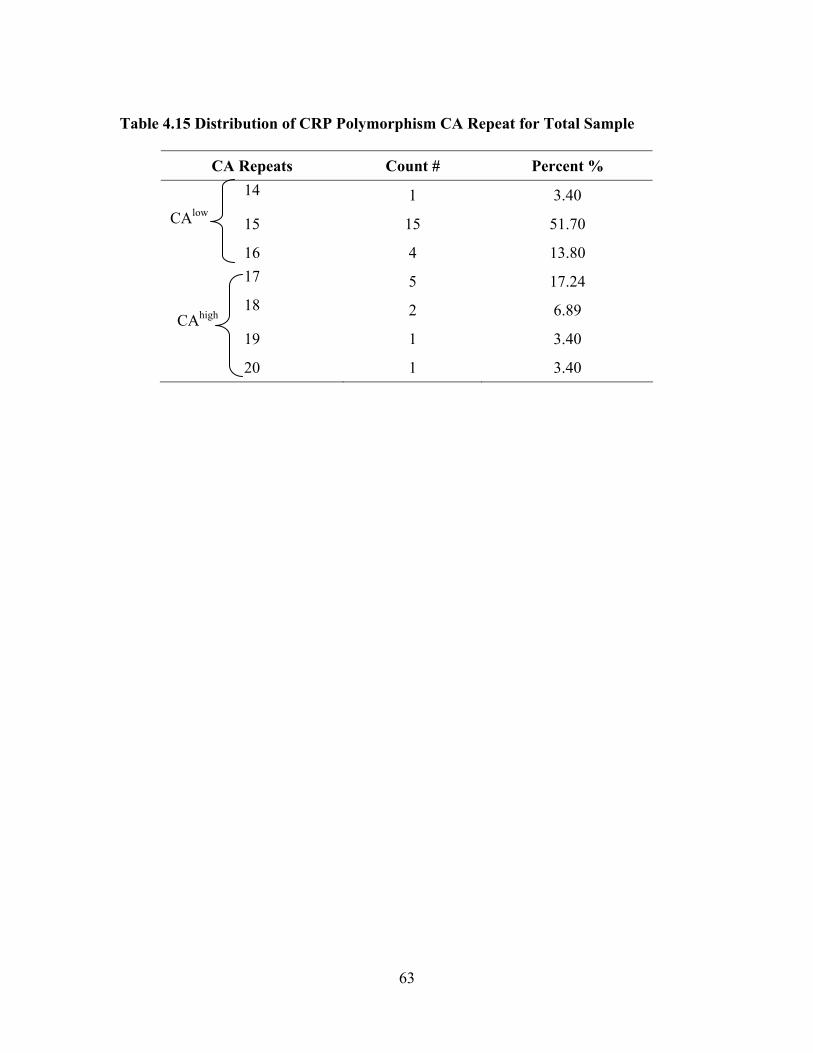
Table 4.15 Distribution of CRP Polymorphism CA Repeat for Total Sample
CA Repeats Count # Percent % 14 1 3.40
15 15 51.70
16 4 13.80 17 5 17.24 18 2 6.89
19 1 3.40
20 1 3.40
CAlow
CAhigh
63
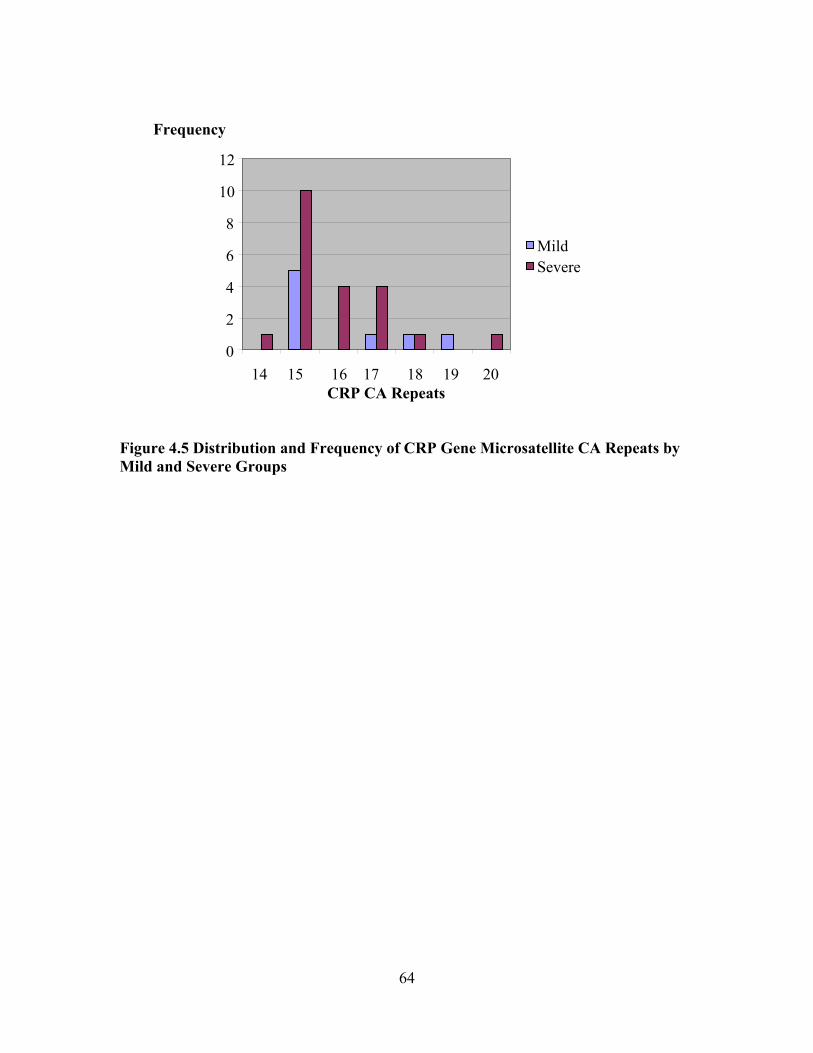
Figure 4.5 Distribution and Frequency of CRP Gene Microsatellite CA Repeats by Mild and Severe Groups
0
2
4
6
8
10
12
Frequency
Mild Severe
14 15 16 17 18 19 20 CRP CA Repeats
64
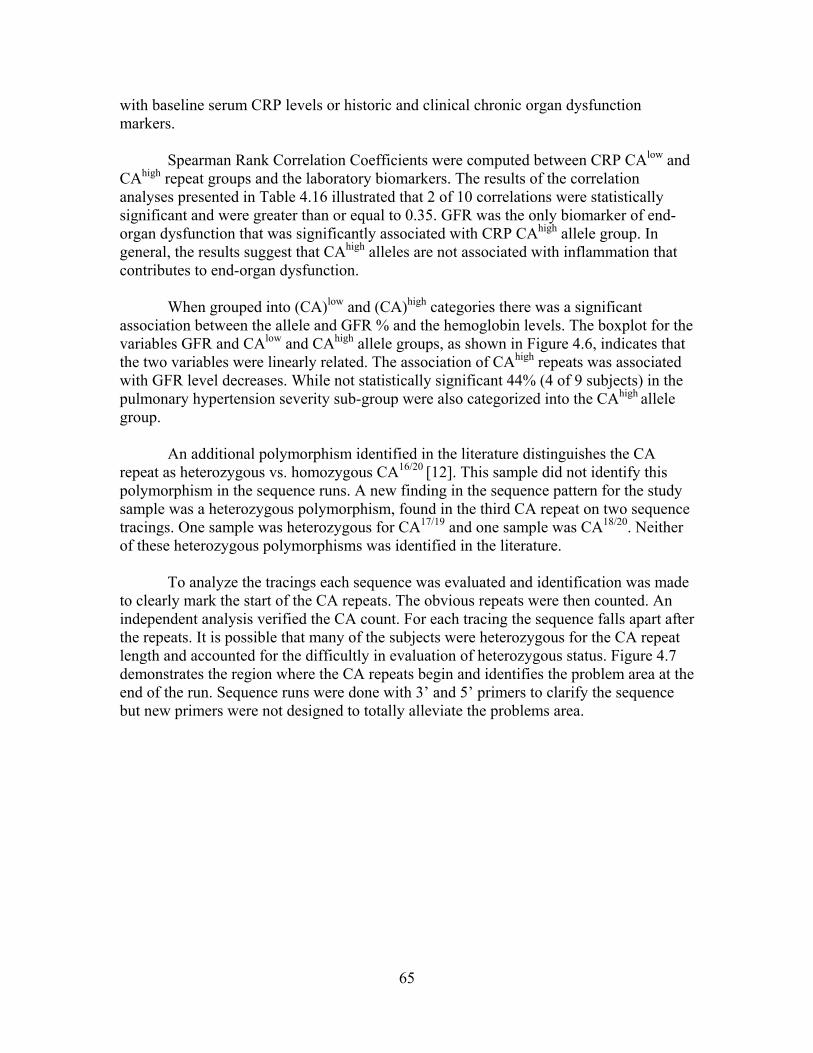
with baseline serum CRP levels or historic and clinical chronic organ dysfunction markers.
Spearman Rank Correlation Coefficients were computed between CRP CAlow and
CAhigh repeat groups and the laboratory biomarkers. The results of the correlation analyses presented in Table 4.16 illustrated that 2 of 10 correlations were statistically significant and were greater than or equal to 0.35. GFR was the only biomarker of end-organ dysfunction that was significantly associated with CRP CAhigh allele group. In general, the results suggest that CAhigh alleles are not associated with inflammation that contributes to end-organ dysfunction.
When grouped into (CA)low and (CA)high categories there was a significant association between the allele and GFR % and the hemoglobin levels. The boxplot for the variables GFR and CAlow and CAhigh allele groups, as shown in Figure 4.6, indicates that the two variables were linearly related. The association of CAhigh repeats was associated with GFR level decreases. While not statistically significant 44% (4 of 9 subjects) in the pulmonary hypertension severity sub-group were also categorized into the CAhigh allele group. An additional polymorphism identified in the literature distinguishes the CA repeat as heterozygous vs. homozygous CA16/20 [12]. This sample did not identify this polymorphism in the sequence runs. A new finding in the sequence pattern for the study sample was a heterozygous polymorphism, found in the third CA repeat on two sequence tracings. One sample was heterozygous for CA17/19 and one sample was CA18/20. Neither of these heterozygous polymorphisms was identified in the literature. To analyze the tracings each sequence was evaluated and identification was made to clearly mark the start of the CA repeats. The obvious repeats were then counted. An independent analysis verified the CA count. For each tracing the sequence falls apart after the repeats. It is possible that many of the subjects were heterozygous for the CA repeat length and accounted for the difficultly in evaluation of heterozygous status. Figure 4.7 demonstrates the region where the CA repeats begin and identifies the problem area at the end of the run. Sequence runs were done with 3’ and 5’ primers to clarify the sequence but new primers were not designed to totally alleviate the problems area.
65
Table 4.16 Associations between Clinical Laboratory Markers and CRP Allele Groups, Spearman Rank Correlation Coefficient rho
Category/Marker Variables rho N p-value
Standard SCD Laboratory White Blood Count 0.049 29 0.801
Hemoglobin -0.392 29 0.035*
MCV 0.067 29 0.73
Hgb F (%) -0.063 27 0.757
Reticulocytes 0.134 29 0.489
CRP 0.147 28 0.456
Pulmonary HTN TRJV 0.125 29 0.512
Renal Dysfunction GFR -0.401 29 0.031*
24-hour Urine Protein -0.058 29 0.765
Cerebral vascular CVA -0.175 29 0.369
Severity Validation Severity Score 0.076 29 0.696
*p < 0.05 Notes: SCD = Sickle cell disease, MCV = mean corpuscular volume, Hgb F = hemoglobin fetal, % = percent, HTN = hypertension, TRJV = tricuspid regurgitate jet velocity, GFR = glomerular filtration rate, CVA = cerebral vascular accident
66
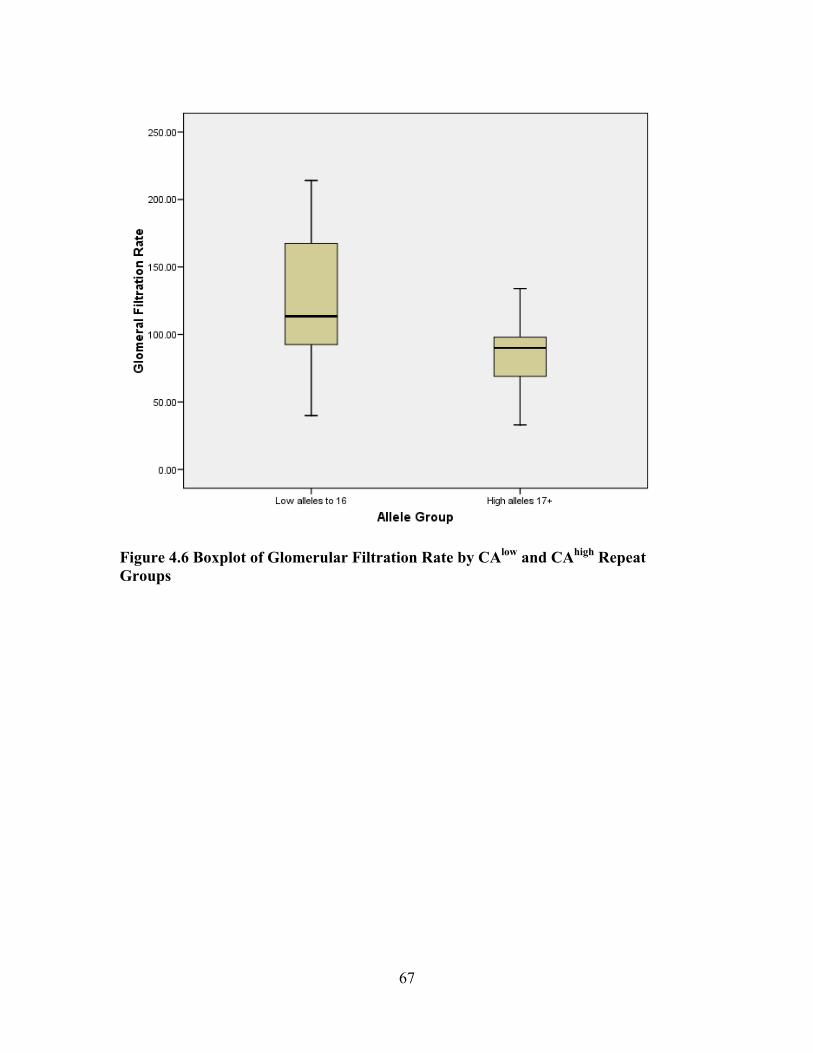
Figure 4.6 Boxplot of Glomerular Filtration Rate by CAlow and CAhigh Repeat Groups
67

sequence to defineone end of CA repeat clearly identifiable CA repeats 18
16
16
16
19
problem area
Figure 4.7 Sample Sequences with Defined Start and Problem Area Identified
68
CHAPTER 5. DISCUSSION AND LIMITATIONS
The purpose of this study was to assess the utility of CRP polymorphism and serum levels as an independent risk factor for end-organ dysfunction in SCD. The study described and characterized adults with SCD according to historical and clinical markers. The subjects were then classified into 2 groups, mild and severe, based on their clinical status. Their clinical status was based on chart review, current laboratory results and genetic samples. The data were used to calculate a severity score using the Sebastiani Network Model SNM (SNM) [9] and to explore the applicability to the sample. Further investigation assessed the relationship between the mild and severe groups on two variables; serum baseline CRP levels, and a genetic dinucleotide microsatellite in the intron of the CRP gene. Chapter five provides a discussion of the findings related to each specific aim, the strengths and limitations of the study and explores implications for future nursing practice and research. The sample consisted of 29 subjects, recruited from a regional urban oncology/hematology clinic. The subjects were under the direct care of one hematologist, who has implemented a standard management protocol for all individuals with SCD. There were eight mild cases gathered for evaluation. Mild cases were defined as those with no historical evidence of secondary complications and current laboratory findings were within the normal ranges. There were 21 severe cases recruited. The severe cases were defined as having evidence of end-organ dysfunction. In addition, the severe cases were further categorized by the type of end-stage organ dysfunction: pulmonary, renal, and cerebral vascular. Classification of pulmonary hypertension was determined from an echocardiogram, with results indicating a TRJV ≥ 2.5 m/s. Nine subjects were in this sub-group. End-stage renal dysfunction was classified by one of two historical laboratory indicators, GFR ≤ 60% or 24º protein level of ≥ 500 mg/day. Six subjects were in this sub-group. Historical evidence of cerebral vascular accident was used for the third sub-group, which had six subjects. Adults with SCD have statistically significant differences in baseline blood counts compared to standardized values [6]. Our study using the total sample demonstrated similar baseline clinical blood count values in white blood count, hemoglobin, reticulocyte count, MCV, platelets and hemoglobin F % levels as have been found in other national surveys of SCD patients [6, 39, 114]. All differences noted between sample SCD patients and reference values are well documented and consistent with the literature for the SCD population. As expected, in the analysis of the total sample, elevations in bilirubin and LDH levels were noted. Baseline serum bilirubin levels in SCD patients are often elevated as a consequence of hemolysis, making this biomarker unreliable as a measure of liver disease [6, 115]. Hepatic dysfunction is a recognized secondary complication frequently associated with iron overload from transfusion treatment [115, 116]. Ferritin levels were elevated for the sample, mean of 551.04 μg/L ± 730.61, (range of 19-2751.7). Subjects receiving intermittent or chronic transfusion therapy were 34.48% (n = 10). There is
69
some controversy regarding how well serum ferritin levels correlate with hepatic iron concentrations [117]. The LDH mean for this sample was 375.54 U/L ± 163.13. The elevation of LDH may reflect the presence of liver disease, and dysfunction may be explained by a history of sepsis, sequestration, cholecystitis, cirrhosis, obstruction, [116, 118] or viral infection [117]. Clear patterns of hepatic dysfunction have been difficult to characterize with standard clinical markers, however this laboratory finding is used in the SNM Severity Score. Laboratory findings are also labile in response to renal dysfunction in SCD patients. Elevated findings for this sample included blood urea nitrogen (8.48 mmol/L ± 3.86), serum creatinine (2.29 mg/dL ± 8.22), 24º protein (224.09 mg/dL/day ± 49.97), and total protein (32.38 gm/dL ± 62.66). The major contributors to these abnormal results are the inability to concentrate urine, incomplete form of distal renal tubular acidosis and impaired potassium metabolism [6, 119]. Current data show that genetic factors such as inherited β-gene cluster haplotype [6, 53], may help identify “at risk” groups for renal dysfunction. This could be explored in future studies. Clinical evidence of retinopathy was also gathered from the sample population. The highest percent of this sequela is generally found in Hgb SC (33%) [6]. Retinopathy was found in 44.82% (n = 13) of the subjects. One possible explanation is that most of these subjects (96.5%, n = 28) had completed an independent comprehensive eye exam as part of the clinical baseline evaluation process, which improved the diagnostic probability.
Specific Aim One The first specific aim was to describe and characterize two groups of sickle cell disease (SCD) patients with (severe cases) and without (mild cases) the development of chronic end-organ dysfunction. These data were then used to validate the predictive value of the SNM Severity Score. The mild group consisted of individuals with no documentation of end-organ dysfunction. The severe group consisted of individuals with documentation of pulmonary hypertension, renal end-organ dysfunction and/or cerebral vascular accident. Clinical events such as history of acute chest syndrome, pneumonia, avascular necrosis, leg ulcers, cerebral vascular accident, and priapism were controlled in the screening process by classifying the mild cases as free from these historical complications. Laboratory variables included: white blood cell, hemoglobin, hematocrit, reticulocytes, MCV, platelets and hemoglobin F % levels. There were no significant differences between groups (mild and severe) on these variables with the exception of MVC (mean of mild group, 84.46 µm3 vs. mean severe group 98.63 µm3, p = 0.005). These results may be attributed to the high % of severe group subjects treated with hydroxyurea therapy.
While not statistically significant, the mean of Hgb F % was also higher in the severe group. This is an interesting finding because higher Hgb F % are associated with lower clinical severity [4], but cannot fully explain the diversity of SCD phenotype. This
70

was probably influenced by the high percentage of subjects in the severe group, 76.2% (n = 16) using hydroxyurea as a treatment regime. Hydroxyurea was only noted in one subject in the mild group. Hydroxyurea increases the Hgb F% and has been found to decrease morbidity and mortality [51].
When evaluating baseline organ dysfunction, neither group had significant differences in laboratory levels of: LDH, BNP, serum creatinine, urine creatinine, 24º creatinine, GFR, and total protein. From the historical echocardiogram results there were no differences between the mild and severe group for ejection fraction or tricuspid regurgitate jet velocities. The severe group had significantly different levels of BUN and 24º Protein levels (BUN, p = 0.021 and 24º protein levels, p = 0.031). Another unusual finding was the difference between the mild and severe groups on bilirubin levels. The mild group was significantly higher p = 0.021 than the severe group. Baseline serum bilirubin levels in SCD patients are often elevated as a consequence of hemolysis, making this biomarker unreliable as a measure of liver disease [6]. This biomarker may also be affected by the increase in Hgb F %. The literature supports the association of increases in concentrations of Hgb F % and decreases in bilirubin levels [51]. All of these biomarkers have been studied as useful in the prediction of severity in SCD patients.
Severity is frequently assessed by hemoglobin genotype. While there was numerous support that the genotypic hemoglobinapathy Hgb SS was associated with the most complications [4, 5, 8, 50, 76] but secondary complications arise in all of the hemoglobin genotypes. In the severe group 57.1% were Hgb SS (n = 12) but also represented were Hgb SC 28.6% (n = 6), Hgb Sβº 9.5% (n = 2) and Sβ+ 4.8% (n = 1). Likewise, in the mild group Hgb SS was represented by 62.5% (n = 5), Hgb SC 12.5% (n = 1), Hgb Sβº 25% (n = 2), demonstrating that hemoglobin genotype alone cannot determine severity.
Predicting clinical severity in SCD has been elusive. The ability to predict disease expression could be beneficial to patients and healthcare providers in managing this disease process. A useful method of pre-determining the risk of secondary complications could allow individualized tailoring of therapy and education [4, 5, 9, 50]. The SNM Severity Score was designed to integrate historical clinical events and current laboratory finds into an objective quantifiable severity score. The SNM Severity Score is based on the risk of mortality within five years as the measured outcome [9].
The SNM Severity Score was calculated on the study sample by using each
subject’s historical information and current selected laboratory results. There were 18 variables used in this model of prediction. There were no significant relationship found between SNM Severity Scores and the current study severity classification. Using the SNM Severity Score to determine severity in the study sample found one subject in the mild group at a very high risk 0.996 of mortality within five years. There were 17 of 21 subjects in the severe group with documented end-organ dysfunction that had a SNM Severity Score < 0.5, a less than 50% chance of mortality in the next five years. Therefore, the SNM Severity Score may serve as a useful tool in predicting mortality, but may not be as useful for studies exploring the secondary complications of SCD. Accurate
71
assessment and evaluation of the secondary complications are essential to determine treatment options for patients. The SNM severity score could not be validated in this sample. The classification developed in this study may more accurately identify patients who will have secondary complications. These individuals may need closer health screening, additional surveillance and aggressive therapeutic intervention.
Specific Aim Two
Specific aim two was to explore the relationship of baseline serum CRP levels in two groups (mild and severe) with respect to evidence of clinical end-organ dysfunction. The mean serum CRP levels of the total population were 6.89 mg/L ± 8.22, (range 0.3 to 31.20). T-tests found no significant differences between the mild vs. severe groups, t(26) = 0.031, p = 0.976.
The relationship between CRP serum levels > 3 mg/L and low grade
inflammation and pathogenesis for cardiovascular disease has been well documented [90, 91, 120]. The role of CRP in SCD patients is still under scrutiny and reference norms for the SCD population have not been determined. Bourantas et al demonstrated increased serum CRP levels in steady state SCD patients [21]. Another study found the mean CRP concentration of Hgb SS patients to be 9.12 mg/L (range, 0.02-52.6). This study found similar results with a mean 6.89 mg/L ± 8.22 (range, 0.3-31.3) regardless of hemoglobin genotypes (SS, SC, Sβ°, and Sβ+). Singhal and colleagues found that CRP concentrations were increased above 5 mg/L even when symptom free in SS and SC genotype patients when compared to a healthy control AA group [121]. This was also supported by Mohan and colleagues with 64 SCD patients and 42 matched AA controls [113] and Hedo and colleagues with 73 Hgb SS patients [122]. One study demonstrated an increase in CRP in the prodromal phase of vaso-occlusive crisis (n = 10) [123]. Recently, researchers have looked for an association between CRP levels and hypermetabolism, as it affects growth and development in SCD patients [124]. A gap in the literature remains on the relationship of CRP to secondary complications and specifically end-organ dysfunction that effect the adult SCD population.
Analysis with the literature has also been difficult since there is a natural increase
in CRP levels with age. Many of the studies involving SCD and CRP levels had small sample sizes and combined adults, adolescents and children in the sample population. In the SCD literature on CRP children or adolescents [121, 125], two studies included a combination of adolescents (age 12 years) and adults [21, 122], one study used adults (n = 64) [113], while a third study did not report the age of the sample [123]. Factor analysis revealed no statistical differences between the mild and severe groups.
Several factors may have contributed to these findings. One factor may have been
the presence of several outliers, CRP levels > 10 mg/L in both the mild (n = 2) and severe (n = 4). When evaluating CRP as a contributor to cardiovascular risk the CRP levels are evaluated for baseline levels over 3mg/L. This study found that 67.86% (n = 19 of 28 subjects) had CRP levels greater than 3 mg/L. Possibly reflecting a sub-clinical
72

inflammatory response. When analyzed by mild and severe there were no differences; in fact, 75% (6 of 8 subjects) mild cases had CRP levels over 3 mg/L and 55% (11 of 20 subjects) severe cases had CRP levels over 3 mg/L. The role of sub-clinical inflammation may still be critical to the SCD population but not reflected in this small sample size. It is curious, if there could be a skewed effect because of the high percentage of elevated baseline results in this sample population. Interestingly, while it is yet to be determined if elevated serum CRP levels contribute to SCD severity, elevations were observed in this SCD sample.
Age and pain were confounding variables that may have affected serum CRP levels, as well as other clinical and laboratory values. The severity group had a mean age of 31. 37 mg/L ± 10.68 but the range was 19.79 to 58.9. Age could be a confounding and misleading variable in assessment of severity of SCD. As adults with SCD survive into the 4th and 5th decade of life, the ageing process will naturally affect CRP levels. CRP is a biomarker that increases with the age of the patient.
Serum C-reactive protein levels are also affected by pain. Pain is an acute and ongoing problem for adults with SCD. Pain was purposely not evaluated or described in this sample population, although presence or absence of acute pain and treatment was captured. Painful episodes are considered a strong predictor of severity [9, 50]. An immense amount of a healthcare provider’s time is focused on management of pain, but may overshadow the subliminal signs of impending end-organ dysfunction. This study attempted to emphasize that secondary complications might be occurring in the absence of pain. There were three subjects in the severity group that had no recorded pain or treatment for pain episodes.
Another factor contributing to the lack of differences in CRP levels may have
been the collection of several CRP levels from chart review. The medical record reflected a baseline status, but this may not have accurately captured current inflammatory status. More stringent control and prospective collection of the serum CRP sample could strengthen the validity of the sample results. Several confounding variables could be controlled when collecting prospective serum CRP levels such as excluding; red cell transfusions, peripheral vascular disease, long-term medications such as hydroxyurea, oral contraceptives, and analgesia use in the past month. Under these conditions it may have been extremely difficult, if not impossible, to collect samples.
Specific Aim Three The goal of specific aim three was to conduct pilot bench research to explore a microsatellite repeat in the intron of the CRP gene. DNA structure is affected by base-paired Cytosine (C) and Adenine (A) or CA repeats within the structure of the gene [12]. An increase in the number of CA repeats in this microsatellite in the intron of the CRP gene have been associated with an increase in the baseline serum CRP levels [12, 102]. The study identified the number of the microsatellite repeats in each subject and tested the possibility that a high number of polymorphic CA repeats contributed to an elevation
73
of serum CRP levels. The literature has supported the hypothesis that low grade inflammation from elevated CRP levels contributes to cardiovascular disease [90, 91, 120], but this hypothesis has not been tested for its contribution to other end-organ dysfunctions or in the SCD population.
This study was unable to find an association between baseline serum CRP levels and allele frequency with this small sample and there was great variability of the CRP levels. Serum CRP levels are influenced by episodic and sub-clinical inflammation stimuli. It has been demonstrated in other studies [21, 113, 122, 125] that SCD patients have a higher baseline CRP level, most likely due to episodic vascular occlusions and subclinical micro vascular occlusions, than the general population. During inflammation, cytokines and other pro-inflammatory markers may up-regulate the CRP gene. It may be possible that CAhigh alleles affect CRP levels when inflammatory markers are triggered. In several studies the concentration of serum CRP was elevated and was shown to be influenced by genetic variants [14, 18, 126], including the CA dinucleotide repeat found in the intron of the CRP gene [12, 102]. An association between CRP SNP’s (rs1800947) [127] and (rs2794520) [128] and basal CRP expression has been described. However, these SNP’s do not have sufficient support or validation to be classified as the sole genetic cause [14]. More research was needed to evaluate the effect of genetic CRP variants and any influence they exert on serum CRP levels. The CA repeat microsatellite was selected because the distribution of alleles differs significantly between Caucasians and African Americans [102] and the SCD population is predominately AA. According to Szalai et al the three most common genotypes (CA16, CA16/21, and CA21) were only found in 20% of all African-Americans [12]. Albeit the current study had a small total sample size, but the frequency of high repeat alleles was similar with 31%, (9 of 29 subjects). Further evidence from this study supported that differences in alleles are associated with differences in baseline CRP within races [102]. A significant negative association was found between the CAhigh allele group and GFR levels (rho = -0.401, p = 0.031). GFR levels are not an indicator of inflammation but may be an indirect measure of the inflammation that occurs in the kidney of a SCD patient. GFR may be under less control of the labile inflammation process and only reflects the damage that has already occurred in the kidney. It may also be a chance association. While not statistically significant, 44% (n = 4 of 9 subjects) of the sub-group pulmonary hypertension were also classified into the CAhigh allele group. Pulmonary hypertension results when there is a lost of elasticity as the red blood cells sickle. The sickling causes microvascular occlusions and myocardial cell damage. While the exact pathogenesis is multifactorial, the reduced blood flow and the resulting ischemia are a major factor in the damage to the myocardium [6, 63]. Again, CRP levels are not a marker for pulmonary hypertension but may reflect damage that has already occurred in the heart muscle.
74

Study of this CA microsatellite is not without detractors. Russell, et al concluded that CRP SNP’s more accurately define serum CRP expression than the length of the intronic repeat microsatellite [127]. Szalai et al noted that the CA allele could be in linkage disequilibrium with an unidentified section in the proximal promoter region of the CRP gene or an unknown gene [102]. It has been suggested that it may be important to obtain more indirect evidence of genetic influence prior to embarking on further genetic studies with family studies. Given the evidence of different allele frequencies in African-Americans, further exploration between matched controls and SCD patients may provide more evidence that this microsatellite has an affect on CRP levels. Polymorphisms in the CRP gene affecting serum CRP levels could lead to the development of a predictive model to assist in the identification of risk for secondary complications of SCD.
Strengths and Limitations
Strengths of the study include the comprehensive description of the clinical parameters of the sample due to the baseline screening protocol implemented by this clinic. The physician involved in the study has attempted to complete a baseline assessment of all SCD patients in this clinic. This assessment included; physical exam, extensive history review, screening serum blood levels on target organs (heart, kidney and liver), echocardiogram from an independent cardiologist, MRI/MRA of the brain, and retinal exam from an independent ophthalmologist. The results from this study suggested the need for a standardized comprehensive screening protocol for all SCD patients. Furthermore, the study indicates a need for accurate medical records beginning in childhood to capture all historical complications and events.
An additional strength was the willingness of African-Americans to participate in medical research. African Americans are frequently underrepresented in research trials. A study by Corbie-Smith and colleagues found African Americans expressed a greater distrust of healthcare professionals but the study did not evaluate willingness to participate [129]. Another recent study, (Caucasian n = 460, African American n = 257), measuring willingness to participate found that African Americans scored lower than Caucasians (27% vs. 39%, p = 0.001) [130]. The two variables strongly influencing the decision to participate in medical research are distrust toward medical researchers and a perceived chance of experiencing injury [130, 131]. There is a gap in the literature regarding African American willingness to participate specifically in genetic research. Interestingly, although not designed to answer this questions, this study showed that African Americans are willing to participate in genetic research, even when there was no direct impact to their health. The subject’s willingness may have stemmed from their view of the professional competences of the investigators and from satisfaction with the physician and the care their received. From anecdotal conversation, another factor in their willingness may be related to the severity of the disease and that little research is being conducted on adults with SCD.
75
Several methodological limitations are associated with this study. One major limitation of the study was the small sample size. The convenience sampling is considered a weak method but necessary given the small population size and the limitation of one geographic location. The small sample population restricts the use of randomization or random assignment for non-treatment descriptive studies, but external and internal validity are compromised with this approach. All of the comparisons in this study suffered from a lack of statistical power but this pilot work may stimulate research in other directions. Statistical analysis was restricted because the mild group was underrepresented. The inability to find mild cases points to a SCD population where the majority of patients experience some type of secondary complications in their life span.
It has been established that hydroxyurea changes the natural course of SCD [51]. Hydroxyurea therapy was recorded as a nominal (yes/no) variable for this study, but the length of therapy was not collected. It was unknown if hydroxyurea treatment was initiated in the pediatric setting, and medical records did not reflect an accurate length of therapy. Within the last five to ten years hydroxyurea has been used in select children with severe phenotype without randomized supporting literature. There is now a randomized trial involving children using hydroxyurea that is ongoing [132]. It is yet to be determined if hydroxyurea therapy initiated in early childhood can ameliorate the presentation of SCD in adults. Further research is ongoing to determine the extent that hydroxyurea changes the natural course of SCD. This therapy will have to be included as a confounding variable in future studies.
Another potential limitation was the fact that the principle investigator (PI) was a
novice bench researcher. To modify this limitation the PI attended the Summer Genetic Institute at the National Institute of Health, did an independent study in DNA extraction and polymorphism analysis at the bench at the University of Chicago, and worked with a bench researcher at the University of Tennessee Health Science during genetic analysis. While the sequencing was successful the evaluation may have influenced the results. Each sequence was evaluated by analyzing the tracings. Identification to clearly mark the start of the CA repeats was made on each tracing. Then the obvious repeats were counted. An independent analysis was done to verify the CA count. In each case the sequence falls apart after the repeats. It is possible that many of the subjects were heterozygous for the CA repeat length and could have accounted for the difficulty in evaluation of heterozygous status. An alternative method of evaluation of the intron would be to amplify the segment containing the repeat and judge the number of repeats based on the size of the amplicon (personal communication with Dr. Alex Szalai, August 12, 2008).
One genetic feature identified as a risk factor is the inherited β-gene cluster
haplotype [6, 53], this information was not gathered for this study. Another biomarker for renal dysfunction being explored is albuminuria levels, which were not available in this sample [53, 80].
76

Additional Findings Fragmentation of care is a concern in this population [133]. This study sample was taken from an urban clinical site that serves a large regional area. Therefore, some subjects may experience hospitalizations outside the large urban hospital associated with the clinic. There may be several reasons for the fracturing of care including transportation, extended wait periods in the urban ER, and hostile interaction with healthcare providers unfamiliar with SCD. The biggest challenge for the hematologist is to receive accurate and informative documentation from hospitalizations. This study found 53.57% (n = 15) subjects had elevated ferritin levels. Medical record information documented chronic transfusion therapy for 3 of the subjects. Five subjects had documentation evidence of intermittent red blood cell transfusions. Seven subjects had no medical record history that could explain an elevation of ferritin levels. It can only be conjecture that these subjects are receiving some type of transfusion therapy outside of direction of the hematologist. Another demonstration of the fragmentation of care is that in a retrospective chart review done prior to initiation of this study the clinic population of SCD patients was 161. Sixty patients were screened during the enrollment phase over a six-month time period. However, only 29 patients enrolled met inclusion/exclusion criteria. The recommended follow-up clinic appointment for this clinic is every six months to monitor for complications and laboratory tests. Of the 31 patients screened but not enrolled, 15 exhibited signs or symptoms of beginning end-organ dysfunction but did not meet the stringent inclusion criteria. Several patients with a clinic visit in the screening period lacked the necessary laboratory or clinical tests to meet inclusion/exclusion criteria, demonstrating the fragmentation of care. This indicates that numerous patients are not adequately utilizing health care services or are seeking care at another facility without requesting medical records be forwarded. There has been a call for adequate representation of African Americans in clinical trials and research [130, 131]. Only one patient that was approached for participation did not sign the consent. A study by Shavers, et al demonstrated that the differences in the patient’s willingness to participate in research are related to the trust they have in the medical provider [131]. The physician in this project had established a trust relationship with the SCD patients in the clinic and provided the necessary entree to the patients for the investigator. A frequent comment from subjects was “I’m glad research is going on to help SCD patients”.
Theoretical Implications The implementation of the study was based on the Interaction Model of Client Health Behavior [35, 37], which assumes relationships between Elements of Client Singularity (CRP genotype and serum blood levels), Elements of Client Professional Interaction (severity scores and groups), and Elements of Health Outcomes (end-organ dysfunction). Risk research reveals that many aspects of Client Singularity (genotype and
77
phenotype) and Client Professional Interaction (severity assessment and distrust of healthcare professionals) are relevant to patients. Sickle cell disease is a lifelong chronic illness that greatly impacts patients. This study has described and evaluated the risk of secondary complications and end-stage organ dysfunction. Healthcare providers must be equipped with risk assessment tools and knowledge in order to engage a patient during the Client Professional Interaction phase of this theory. Health information, obtained and discussed during the Client Professional Interaction, is important in predicting severity of SCD. According to the Interaction Model, health information has a direct impact on the Element of Health Outcomes, specifically clinical health status indicators, severity of healthcare problems and adherence to recommended care regime. Under this model, the relevance of risk related to health care information (severity score) to the adult with SCD will influence the patient utilization of healthcare services (treatment options), and patient satisfaction with care. As treatment options advance toward individualized therapy and gene therapy, more research will be needed to validate the theory that increased risk health information positively impacts the utilization of healthcare services.
Clinical Practice Implications Several studies have proposed and attempted to describe severity of the SCD patient [3, 4, 9, 50, 122]. Recently the most promising severity score has been SNM, using mortality as the outcome of measure. For nursing implications one valuable tool would be to establish a standardized screening protocol. This protocol would involve a battery of baseline clinical findings and laboratory testing that is needed to fully evaluate the heath status of adults with SCD. Without accurate information and assessment of end-organ damage, an accurate severity score or classification cannot be determined. This protocol would involve evaluation of pulmonary, renal, cerebral vascular, retinal and vascular (for priapism, leg ulcers and AVM) systems. The protocol should also involve a system to transfer historical and acute events from pediatric settings and rural hospital admissions. Healthcare providers must have confidence in the status of the patient’s condition before discussions about risk can be broached with a patient. This confidence is essential to maintaining a trust relationship between patient and healthcare provider. A second nursing implication would be to establish a trust relationship to assist patients in the effective utilization of health care services. Adults with SCD face major adjustment difficulties in dealing day to day with an unpredictable chronic illness. Some areas that have been identified by patients are anxiety about health, dependence on pain medication, disabilities, disruption of quality of life and conflict with healthcare providers [133]. A proposed screening protocol involves extensive testing frequently outside the hematology clinic setting. Nursing should be available to coordinate and facilitate acquisition of the proposed screening assessments. A patient’s active involvement will also be needed to agree to adherence to screening and therapy decisions. While not an outcome of the study nursing must also take the initiative to eliminate discrimination in the health care setting regarding SCD patients and their dependence on pain medications and utilization of ER facilities. Better understanding of this disease process and its secondary complications would equip the nurse to provide the necessary
78
care needed for adults with SCD. Conflict with healthcare providers should never be identified as a barrier to care for SCD patients. Finally, SCD may be one of the first genetically transmitted diseases to make major inroads in gene therapy and stem cell research because of the single gene base pair substitution. Nurses with genetic knowledge and understanding will be essential if they are going to interact with patients undergoing research procedures. Research towards more effective therapy or a cure will not be possible without the active support of the SCD population. Nursing must be prepared to facilitate this research with interventions to overcome the barriers SCD patients face in utilization of healthcare services. This is especially important in a population that has identified “conflict with healthcare providers” as a major obstacle to care [133, 134].
Recommendations for Additional Research This pilot study established a foundation for future investigation of the microsatellite in the intron of the CRP gene. This allele has been shown to be variable among ethnic groups and more frequently found in the African American population. A larger sample size selected from all SCD patients, not just mild and severe, and matched for race control group is suggested. The study was unable to support the hypothesis that the microsatellite repeat allele in the intron of the CRP gene indicated the propensity to develop inflammation as measured through the serum CRP levels. Timing of the collection of serum CRP may need to be more closely evaluated or a comparison of serum levels during baseline and acute events may give a more complete picture of CRP expression in the SCD patients. More comprehensive studies are needed to establish associations between the high CA repeat microsatellite allele and baseline CRP or markers of end-organ dysfunction. The incorporation of stringently controlled and prospectively gathered serum CRP samples would enhance the study design and help validate any association. Although reported associations suggest that several polymorphisms are significantly correlated with baseline CRP levels [135], it is possible that the observed associations are in strong linkage disequilibrium with yet unidentified regions. Future research could also assess other common single-nucleotide polymorphisms that have been identified in the literature, such as 3872A allele, 2667C allele, and the 790T allele [15].
Conclusion
The contribution of this study was to further characterize the adult SCD population regarding the pathophysiology of secondary end-organ dysfunction. It explored the possibility of further research regarding CRP and a polymorphism of the CRP gene by providing pilot data on a microsatellite in the intron of the CRP gene. The study was unable to provide support for the use of serum CRP as a biomarker of severity
79
in adults with SCD. Although the evidence of a correlation between CRP alleles and GFR was found in this pilot sample, the relationship was not strong. Additionally, it was unable to validate the use of a SNM Severity Score as a model of prediction for end-organ dysfunction when compared to the clinical findings of end-organ dysfunction found in the sample. This study does inform and support the direction of future research by establishing baseline information regarding CRP in the adult with SCD. It also documents the different types of severity and secondary complications encountered by the healthcare provider in caring for SCD patients. Numerous questions remain regarding the interaction of serum CRP, genetic expression of CRP and its mechanisms with end-stage organ dysfunction. Further genetic regulation of the expression of CRP levels still needs to be explored.
80
LIST OF REFERENCES 1. Wojciechowski, E.A., A. Hurtig, and L. Dorn, A natural history study of
adolescents and young adults with sickle cell disease as they transfer to adult care: a need for case management services. Journal of Pediatric Nursing, 2002. 17(1): p. 18-27.
2. Services, U.S.D.o.H.a.H., The Management of Sickle Cell Disease. 2004. 3. Powars, D., L.S. Chan, and W.A. Schroeder, The variable expression of sickle cell
disease is genetically determined. Seminars in Hematology, 1990. 27(4): p. 360-76.
4. Steinberg, M.H., Predicting clinical severity in sickle cell anaemia. British Journal of Haematology, 2005. 129(4): p. 465-81.
5. Platt, O.S., et al., Mortality in sickle cell disease. Life expectancy and risk factors for early death. New England Journal of Medicine, 1994. 330(23): p. 1639-44.
6. Sickle Cell Disease: Basic principles and clinical practice, ed. S.H. Embury, Hebbel, R.P., Mohandas, N., & Steinberg, M.H. 1994, New York: Raven Press. 902.
7. Khattab, A.D., B. Rawlings, and I.S. Ali, Care of patients with haemoglobin abnormalities: history and biology. British Journal of Nursing, 2006. 15(18): p. 994-8.
8. Powars, D.R., et al., Outcome of sickle cell anemia: a 4-decade observational study of 1056 patients. Medicine (Baltimore), 2005. 84(6): p. 363-76.
9. Sebastiani, P., et al., A network model to predict the risk of death in sickle cell disease. Blood, 2007. 110(7): p. 2727-35.
10. Makis, A.C., et al., C-reactive protein and vascular cell adhesion molecule-1 as markers of severity in sickle cell disease. Archives of Internal Medicine, 2006. 166(3): p. 366-8.
11. Nagel, R.L., Severity, pathobiology, epistatic effects, and genetic markers in sickle cell anemia. Seminars in Hematology, 1991. 28(3): p. 180-201.
12. Szalai, A.J., et al., Association between baseline levels of C-reactive protein (CRP) and a dinucleotide repeat polymorphism in the intron of the CRP gene. Genes and Immunity, 2002. 3(1): p. 14-9.
13. Suk, H.J., et al., Relation of polymorphism within the C-reactive protein gene and plasma CRP levels. Atherosclerosis, 2005. 178(1): p. 139-45.
14. Brull, D.J., et al., Human CRP gene polymorphism influences CRP levels: implications for the prediction and pathogenesis of coronary heart disease. Arteriosclerosis, Thrombosis, and Vascular Biology, 2003. 23(11): p. 2063-9.
15. Lange, L.A., et al., Association of polymorphisms in the CRP gene with circulating C-reactive protein levels and cardiovascular events. Journal of the American Medical Association, 2006. 296(22): p. 2703-11.
16. Miller, D.T., et al., Association of common CRP gene variants with CRP levels and cardiovascular events. Annals of Human Genetics, 2005. 69(Pt 6): p. 623-38.
17. Edberg, J.C., et al., Genetic Variation in the CRP Promoter: Association with Systemic Lupus Erythematosus (SLE). Human Molecular Genetics, 2008.
81
18. Kovacs, A., et al., A novel common single nucleotide polymorphism in the promoter region of the C-reactive protein gene associated with the plasma concentration of C-reactive protein. Atherosclerosis, 2005. 178(1): p. 193-8.
19. Blankenberg, S. and S. Yusuf, The inflammatory hypothesis: any progress in risk stratification and therapeutic targets? Circulation, 2006. 114(15): p. 1557-60.
20. Albert, M.A., et al., Perspective on selected issues in cardiovascular disease research with a focus on black Americans. Circulation, 2004. 110(2): p. e7-12.
21. Bourantas, K.L., et al., Acute phase proteins and interleukins in steady state sickle cell disease. European Journal of Haematology, 1998. 61(1): p. 49-54.
22. Woods, K.F., et al., Body composition in women with sickle cell disease. Ethn Dis, 2001. 11(1): p. 30-5.
23. Austin, H., et al., Sickle cell trait and the risk of venous thromboembolism among blacks. Blood, 2007. 110(3): p. 908-12.
24. Schnog, J.B., et al., Protein C and S and inflammation in sickle cell disease. American Journal of Hematology, 2004. 76(1): p. 26-32.
25. Blake, G.J., et al., Blood pressure, C-reactive protein, and risk of future cardiovascular events. Circulation, 2003. 108(24): p. 2993-9.
26. Tsimikas, S., J.T. Willerson, and P.M. Ridker, C-reactive protein and other emerging blood biomarkers to optimize risk stratification of vulnerable patients. Journal of American College of Cardiology, 2006. 47(8 Suppl): p. C19-31.
27. Dupuis, J., et al., Genome scan of systemic biomarkers of vascular inflammation in the Framingham Heart Study: evidence for susceptibility loci on 1q. Atherosclerosis, 2005. 182(2): p. 307-14.
28. Chater, K., Risk and representation: older people and noncompliance. Nursing Inquiry, 1999. 6(2): p. 132-8.
29. Shiloh, S., L. Gerad, and B. Goldman, The facilitating role of information provided in genetic counseling for counselees' decisions. Genetics in Medicine, 2006. 8(2): p. 116-24.
30. Rowan, F., The high stakes of risk communication. Preventive Medicine, 1996. 25: p. 26-29.
31. Jacobs, L.A., An analysis of the concept of risk. Cancer Nursing, 2000. 23(1): p. 12-9.
32. Kraemer, H.C., et al., Coming to terms with the terms of risk. Archives of General Psychiatry, 1997. 54(4): p. 337-43.
33. Weed, D.L., Weight of evidence: a review of concept and methods. Risk Analysis, 2005. 25(6): p. 1545-1557.
34. Ortendahl, M. and J.F. Fries, Discounting and risk characteristics in clinical decision-making. Medical Science Monitor, 2006. 12(3): p. RA41-5.
35. Cox, C.L., Online exclusive: a model of health behavior to guide studies of childhood cancer survivors. Oncology Nursing Forum, 2003. 30(5): p. E92-9.
36. Cox, C.L. and K.J. Roghmann, Empirical test of the interaction model of client health behavior. Research in Nursing and Health, 1984. 7(4): p. 275-85.
37. Cox, C.L., J.A. Sullivan, and K.J. Roghmann, A conceptual explanation of risk-reduction behavior and intervention development. Nursing Research, 1984. 33(3): p. 168-73.
82

38. Hartl, D.L.J.E.W., Genetic Analysis of Genes and Genomes. 6th ed. 2005, Sudbury, MA: Jones and Bartlett Publishers. 854.
39. Hastings, C., The Children's Hospital Oakland Hematology/Oncology Handbook. 2002, St. Louis: Mosby, Inc. 1-268.
40. Black, S., I. Kushner, and D. Samols, C-reactive Protein. Journal of Biological Chemistry, 2004. 279(47): p. 48487-90.
41. Herrick, C.J., The Evolution of Intelligence and Its Organs. Science, 1910. 31(784): p. 7-18.
42. Ingram, V.M., Gene mutations in human haemoglobin: the chemical difference between normal and sickle cell haemoglobin. Nature, 1957. 180(4581): p. 326-8.
43. Khoury, M.J., Genetics and genomics in practice: the continuum from genetic disease to genetic information in health and disease. Genetics in Medicine, 2003. 5(4): p. 261-8.
44. Leikin, S.L., et al., Mortality in children and adolescents with sickle cell disease. Cooperative Study of Sickle Cell Disease. Pediatrics, 1989. 84(3): p. 500-8.
45. de Krom, M., et al., Mutation analysis of the agouti related protein promoter region and the melanocortin-3 receptor in anorexia nervosa patients. Psychiatric Genetics, 2005. 15(4): p. 237.
46. Aguilar, C., E. Vichinsky, and L. Neumayr, Bone and joint disease in sickle cell disease. Hematology and Oncology Clinics in North America, 2005. 19(5): p. 929-41, viii.
47. Gebreyohanns, M. and R.J. Adams, Sickle cell disease: primary stroke prevention. CNS Spectrums, 2004. 9(6): p. 445-9.
48. Adams, R.J., et al., Prevention of a first stroke by transfusions in children with sickle cell anemia and abnormal results on transcranial Doppler ultrasonography. New England Journal of Medicine, 1998. 339(1): p. 5-11.
49. Simon, K., M.L. Lobo, and S. Jackson, Current knowledge in the management of children and adolescents with sickle cell disease: Part 1, Physiological issues. Journal of Pediatric Nursing, 1999. 14(5): p. 281-95.
50. Miller, S.T., et al., Prediction of adverse outcomes in children with sickle cell disease. New England Journal of Medicine, 2000. 342(2): p. 83-9.
51. Steinberg, M.H., et al., Effect of hydroxyurea on mortality and morbidity in adult sickle cell anemia: risks and benefits up to 9 years of treatment. Journal of the American Medical Association, 2003. 289(13): p. 1645-51.
52. Ashley-Koch, A., Q. Yang, and R.S. Olney, Sickle hemoglobin (HbS) allele and sickle cell disease: a HuGE review. American Journal of Epidemiology, 2000. 151(9): p. 839-45.
53. Guasch, A., et al., Glomerular involvement in adults with sickle cell hemoglobinopathies: Prevalence and clinical correlates of progressive renal failure. Journal of American Society of Nephrology, 2006. 17(8): p. 2228-35.
54. Castro, O., M. Hoque, and B.D. Brown, Pulmonary hypertension in sickle cell disease: cardiac catheterization results and survival. Blood, 2003. 101(4): p. 1257-61.
55. Ataga, K.I., et al., Pulmonary hypertension in sickle cell disease. American Journal of Medicine, 2004. 117(9): p. 665-9.
83

56. Allon, M., Renal abnormalities in sickle cell disease. Archives of Internal Medicine, 1990. 150(3): p. 501-4.
57. Downes, S.M., et al., Incidence and natural history of proliferative sickle cell retinopathy: observations from a cohort study. Ophthalmology, 2005. 112(11): p. 1869-75.
58. Adams, R., et al., The use of transcranial ultrasonography to predict stroke in sickle cell disease. New England Journal of Medicine, 1992. 326(9): p. 605-10.
59. Sachdev, V., et al., Diastolic dysfunction is an independent risk factor for death in patients with sickle cell disease. Journal of American College of Cardiology, 2007. 49(4): p. 472-9.
60. Ohene-Frempong, K., et al., Cerebrovascular accidents in sickle cell disease: rates and risk factors. Blood, 1998. 91(1): p. 288-94.
61. De Castro, L.M., et al., Pulmonary hypertension associated with sickle cell disease: Clinical and laboratory endpoints and disease outcomes. American Journal of Hematology, 2007. 83(1): p. 19-25.
62. Covitz, W., et al., The heart in sickle cell anemia. The Cooperative Study of Sickle Cell Disease (CSSCD). Chest, 1995. 108(5): p. 1214-9.
63. Martins, W., et al., Doppler echocardiographic study in adolescents and young adults with sickle cell anemia. Arq Bras Cardiology, 1999. 73(6): p. 463-74.
64. Atweh, G.F. and A.N. Schechter, Pharmacologic induction of fetal hemoglobin: raising the therapeutic bar in sickle cell disease. Current Opinions in Hematology, 2001. 8(2): p. 123-30.
65. VMB Research Studies: 01-DK-0088_Determining the prevelance and prognosis of secondary pulmonary hypertension in adult patients with sickle cell anemia. 2008, National Institute of Health.
66. Sukmawan, R., et al., Quantitative assessment of right ventricular geometric remodeling in pulmonary hypertension secondary to left-sided heart disease using real-time three-dimensional echocardiography. The American Journal of Cardiology, 2004. 94(8): p. 1096-1099.
67. Barst, R.J., et al., Diagnosis and differential assessment of pulmonary arterial hypertension. Journal of American College of Cardiology, 2004. 43(12 Suppl S): p. 40S-47S.
68. Machado, R.F., Sickle cell anemia-associated pulmonary arterial hypertension. Journal of Bras Pneumology, 2007. 33(5): p. 583-91.
69. Morris, C.R., et al., Arginine therapy: a new treatment for pulmonary hypertension in sickle cell disease? American Journal of Respiratory and Critical Care Medicine, 2003. 168(1): p. 63-9.
70. Surdacki, A., K., Zmudka, K., Bieron, E., Kostka-Trabka, and R., Gryglewski, Lack of beneficial effects of L-arginine infusion in primary pulmonary hypertension. Wien Klin Wochenschr, 1994. 106(16): p. 521-6.
71. Anson, J.A., et al., Subarachnoid hemorrhage in sickle-cell disease. Journal of Neurosurgery, 1991. 75(4): p. 552-8.
72. Baird, R.L., et al., Studies in Sickle Cell Anemia. Xxi. Clinico-Pathological Aspects of Neurological Manifestations. Pediatrics, 1964. 34: p. 92-100.
73. Merkel, K.H., et al., Cerebrovascular disease in sickle cell anemia: a clinical, pathological and radiological correlation. Stroke, 1978. 9(1): p. 45-52.
84

74. Stockman, J.A., et al., Occlusion of large cerebral vessels in sickle-cell anemia. New England Journal of Medicine, 1972. 287(17): p. 846-9.
75. Moser, F.G., et al., The spectrum of brain MR abnormalities in sickle-cell disease: a report from the Cooperative Study of Sickle Cell Disease. AJNR American Journal of Neuroradiology, 1996. 17(5): p. 965-72.
76. Powars, D., et al., The natural history of stroke in sickle cell disease. American Journal of Medicine, 1978. 65(3): p. 461-71.
77. Scothorn, D.J., et al., Risk of recurrent stroke in children with sickle cell disease receiving blood transfusion therapy for at least five years after initial stroke. Journal of Pediatrics, 2002. 140(3): p. 348-54.
78. Rana, S., et al., Discontinuation of long-term transfusion therapy in patients with sickle cell disease and stroke. Journal of Pediatrics, 1997. 131(5): p. 757-60.
79. Barros, F.B., et al., 51Cr-EDTA measurements of the glomerular filtration rate in patients with sickle cell anaemia and minor renal damage. Nuclear Medicine Communications, 2006. 27(12): p. 959-62.
80. Thompson, J., et al., Albuminuria and renal function in homozygous sickle cell disease: observations from a cohort study. Archives of Internal Medicine, 2007. 167(7): p. 701-8.
81. Little, J.A., et al., Combination erythropoietin-hydroxyurea therapy in sickle cell disease: experience from the National Institutes of Health and a literature review. Haematologica, 2006. 91(8): p. 1076-83.
82. Stevens, L.A. and A.S. Levey, Measurement of kidney function. Emergency Medicine Clinics of North America, 2005. 89(3): p. 457-73.
83. Blankenberg, S., et al., Comparative impact of multiple biomarkers and N-Terminal pro-brain natriuretic peptide in the context of conventional risk factors for the prediction of recurrent cardiovascular events in the Heart Outcomes Prevention Evaluation (HOPE) Study. Circulation, 2006. 114(3): p. 201-8.
84. Tillett, W.S., and Thomas, J., Serological reactions in pheumonia with a non-protein somatic fraction of pheumococcus. Journal of Experimental Medicine, 1930. 52: p. 561-71.
85. Deron, S.J., C-reactive protein: everything you need to know about crp and why it's more important than cholesteral to your health. 2004, New York: McGraw-Hill. 150.
86. Liuzzo, G., et al., The prognostic value of C-reactive protein and serum amyloid a protein in severe unstable angina. New England Journal of Medicine, 1994. 331(7): p. 417-24.
87. Berk, B.C., W.S. Weintraub, and R.W. Alexander, Elevation of C-reactive protein in "active" coronary artery disease. American Journal of Cardiology, 1990. 65(3): p. 168-72.
88. Kuta, A.E. and L.L. Baum, C-reactive protein is produced by a small number of normal human peripheral blood lymphocytes. Journal of Experimental Medicine, 1986. 164(1): p. 321-6.
89. Beckman, J.A., et al., Comparison of usefulness of inflammatory markers in patients with versus without peripheral arterial disease in predicting adverse cardiovascular outcomes (myocardial infarction, stroke, and death). American Journal of Cardiology, 2005. 96(10): p. 1374-8.
85
90. Ridker, P.M., R.J. Glynn, and C.H. Hennekens, C-reactive protein adds to the predictive value of total and HDL cholesterol in determining risk of first myocardial infarction. Circulation, 1998. 97(20): p. 2007-11.
91. Ridker, P.M., et al., Comparison of C-reactive protein and low-density lipoprotein cholesterol levels in the prediction of first cardiovascular events. New England Journal of Medicine, 2002. 347(20): p. 1557-65.
92. Everett, B.M., et al., The relative strength of C-reactive protein and lipid levels as determinants of ischemic stroke compared with coronary heart disease in women. Journal of American College of Cardiology, 2006. 48(11): p. 2235-42.
93. Ridker, P.M., et al., Non-HDL cholesterol, apolipoproteins A-I and B100, standard lipid measures, lipid ratios, and CRP as risk factors for cardiovascular disease in women. Journal of the American Medicane Association, 2005. 294(3): p. 326-33.
94. Ridker, P.M., et al., C-reactive protein, the metabolic syndrome, and risk of incident cardiovascular events: an 8-year follow-up of 14 719 initially healthy American women. Circulation, 2003. 107(3): p. 391-7.
95. Ford, E.S., U.A. Ajani, and A.H. Mokdad, The metabolic syndrome and concentrations of C-reactive protein among U.S. youth. Diabetes Care, 2005. 28(4): p. 878-81.
96. Han, T.S., et al., Prospective study of C-reactive protein in relation to the development of diabetes and metabolic syndrome in the Mexico City Diabetes Study. Diabetes Care, 2002. 25(11): p. 2016-21.
97. Hibbert, J.M., et al., Proinflammatory cytokines and the hypermetabolism of children with sickle cell disease. Experimental Biology and Medicine (Maywood), 2005. 230(1): p. 68-74.
98. Suk Danik, J., et al., Influence of genetic variation in the C-reactive protein gene on the inflammatory response during and after acute coronary ischemia. Annals of Human Genetics, 2006. 70(Pt 6): p. 705-16.
99. Crawford, D.C., et al., Allelic spectrum of the natural variation in CRP. Human Genetics, 2006. 119(5): p. 496-504.
100. Kathiresan, S., et al., Contribution of clinical correlates and 13 C-reactive protein gene polymorphisms to interindividual variability in serum C-reactive protein level. Circulation, 2006. 113(11): p. 1415-23.
101. Crawford, D.C., et al., Genetic variation is associated with C-reactive protein levels in the Third National Health and Nutrition Examination Survey. Circulation, 2006. 114(23): p. 2458-65.
102. Szalai, A.J., et al., Systemic lupus erythematosus in a multiethnic US Cohort (LUMINA). XXX: association between C-reactive protein (CRP) gene polymorphisms and vascular events. Rheumatology (Oxford), 2005. 44(7): p. 864-8.
103. Micklos, D.A., Freyer, G.A., & Crotty, D.A., DNA Science. 2nd ed. 2003, Cold Spring Harbor, NY: Cold Spring Harbor Laboratory Press. 575.
104. Goldstein, D.B., et al., An evaluation of genetic distances for use with microsatellite loci. Genetics, 1995. 139(1): p. 463-71.
105. Stampfer, M.J., P.M. Ridker, and V.J. Dzau, Risk factor criteria. Circulation, 2004. 109(25 Suppl 1): p. IV3-5.
86
106. Haque, K.A., et al., Performance of high-throughput DNA quantification methods. BMC Biotechnology, 2003. 3: p. 20.
107. Hubbard, T.J., et al., Ensembl 2007. Nucleic Acids Research, 2007. 35(Database issue): p. D610-7.
108. Hubbard, T.J., e!Ensembl multi blast view. Retrieved July 17, 2007 from www.ensembl.org/Mult/blastview.html.
109. Sanger, F., et al., Nucleotide sequence of bacteriophage lambda DNA. Journal of Molecular Biology, 1982. 162(4): p. 729-73.
110. National Center for Biotechnology Information, U.S.N.L of M. 2007, U.S. National Library of Medicine.
111. Edberg, J.C., et al., Genetic Variation in the CRP Promoter: Association with Systemic Lupus Erythematosus (SLE). Hum Mol Genet, 2008.
112. Sebastiani, P., et al., Sickle cell disease calculator. Retrieved July, 6, 2008 from http://www.bu.edu/sicklecell/downloads/Projects.
113. Mohan, J.S., et al., Plasma levels of tissue factor and soluble E-selectin in sickle cell disease: relationship to genotype and to inflammation. Blood Coagulation and Fibrinolysis, 2005. 16(3): p. 209-14.
114. Lenoci, J.M., et al., Self-care in adults with sickle cell disease. West Journal of Nursing Research, 2002. 24(3): p. 228-45.
115. Gurkan, E., et al., Liver involvement in sickle cell disease. Turkey Journal of Gastroenterology, 2005. 16(4): p. 194-8.
116. Kato, G.J., et al., Lactate dehydrogenase as a biomarker of hemolysis-associated nitric oxide resistance, priapism, leg ulceration, pulmonary hypertension, and death in patients with sickle cell disease. Blood, 2006. 107(6): p. 2279-85.
117. Olivieri, N.F., Progression of iron overload in sickle cell disease. Seminars in Hematology, 2001. 38(1 Suppl 1): p. 57-62.
118. Berry, P.A., et al., Hepatic dysfunction in sickle cell disease: a new system of classification based on global assessment. Clinical Gastroenterology and Hepatology, 2007. 5(12): p. 1469-76; quiz 1369.
119. Pham, P.T., et al., Renal abnormalities in sickle cell disease. Kidney International, 2000. 57(1): p. 1-8.
120. Folsom, A.R., et al., Association of C-reactive protein with markers of prevalent atherosclerotic disease. American Journal of Cardiology, 2001. 88(2): p. 112-7.
121. Singhal, A., et al., Is there an acute-phase response in steady-state sickle cell disease? Lancet, 1993. 341(8846): p. 651-3.
122. Hedo, C.C., et al., Acute phase reactants and severity of homozygous sickle cell disease. Journal of Internal Medicine, 1993. 233(6): p. 467-70.
123. Stuart, J., et al., Monitoring the acute phase response to vaso-occlusive crisis in sickle cell disease. Journal of Clinical Pathology, 1994. 47(2): p. 166-9.
124. Archer, D.R., et al., C-reactive protein and interleukin-6 are decreased in transgenic sickle cell mice fed a high protein diet. Journal of Nutrition, 2008. 138(6): p. 1148-52.
125. Akohoue, S.A., et al., Energy expenditure, inflammation, and oxidative stress in steady-state adolescents with sickle cell anemia. Pediatric Research, 2007. 61(2): p. 233-8.
87
126. Zee, R.Y. and P.M. Ridker, Polymorphism in the human C-reactive protein (CRP) gene, plasma concentrations of CRP, and the risk of future arterial thrombosis. Atherosclerosis, 2002. 162(1): p. 217-9.
127. Russell, A.I., et al., Polymorphism at the C-reactive protein locus influences gene expression and predisposes to systemic lupus erythematosus. Human Molecular Genetics, 2004. 13(1): p. 137-47.
128. Reiner, A.P., et al., Polymorphisms of the HNF1A gene encoding hepatocyte nuclear factor-1 alpha are associated with C-reactive protein. American Journal of Human Genetics, 2008. 82(5): p. 1193-201.
129. Corbie-Smith, G., S.B. Thomas, and D.M. St George, Distrust, race, and research. Archives of Internal Medicine, 2002. 162(21): p. 2458-63.
130. Braunstein, J.B., et al., Race, medical researcher distrust, perceived harm, and willingness to participate in cardiovascular prevention trials. Medicine (Baltimore), 2008. 87(1): p. 1-9.
131. Shavers, V.L., C.F. Lynch, and L.F. Burmeister, Racial differences in factors that influence the willingness to participate in medical research studies. Annals of Epidemiology, 2002. 12(4): p. 248-56.
132. Nabel, E.G., NHLBI Strategic Plan: Current and Future Opportunities for Blood Diseases and Resourses Research, L. National Heart, and Blood Institute, Editor. 2008. p. 72.
133. While, A.E. and J. Mullen, Living with sickle cell disease: the perspective of young people. British Journal of Nursing, 2004. 13(6): p. 320-5.
134. Segal, J.B., et al., Hydroxyurea for the treatment of sickle cell disease. Evidence Report/Technology Assessment (Full Rep), 2008(165): p. 1-95.
135. Carlson, C.S., et al., Polymorphisms within the C-reactive protein (CRP) promoter region are associated with plasma CRP levels. American Journal of Human Genetics, 2005. 77(1): p. 64-77.
88
APPENDIX A: IRB LETTER OF APPROVAL
89
APPENDIX B: UNIVERSITY OF TENNESSEE CANCER INSTITUTE CONSENT TO PARTICIPATE IN A RESEARCH
STUDY/CONSENT FORM
90
91
92
93
94
95
APPENDIX C: UNIVERSITY OF TENNESSEE CANCER INSTITUTE CONSENT TO PARTICIPATE IN A RESEARCH
STUDY/REPOSITORY CONSENT
96

97
98
99

100
101

102
VITA Elisabeth Chismark was born in 1957, and raised in Jonesboro, Indiana, where she graduated from Mississinewa High School in 1976. She attended Purdue University-West Lafayette, Indiana, and graduated with a Bachelor of Science degree in psychology and Associate Degree in nursing in December 1979. She practiced as a cardiac care nurse in Florida, Texas and California. In 1992, she graduated from University of Memphis-Memphis, Tennessee, with a Bachelor of Science in Nursing and began working as a cardiac research coordinator in pharmaceutical Phase I, II and III trials. She graduated in 2002, from Union University-Germantown, Tennessee, with a Master of Science in nursing education. She then worked as a clinical nurse specialist with a focus on transition of chronically ill adolescents to adult care. In 2005, she was accepted to The University of Tennessee Health Science Center-Memphis, Tennessee, in order to pursue a PhD in Nursing. She was awarded a Summer Genetics Institute Fellowship from the National Institute of Health in 2006. Her research advisor was Dr. Ann Cashion, who served as mentor and counselor providing knowledge, guidance and expertise through this successful dissertation process. Currently, Elisabeth practices as a consultant in International Nursing for St. Jude Children’s Research Hospital, Memphis, Tennessee.