Solid-state oxidation of aniline hydrochloride with various oxidants
Upload
univ-lille1Category
view
2download
0
C 1s and N 1s core excitation of aniline: Experiment by electron impact and ab initio calculations
D. Duflot and J.-P. FlamentLaboratoire de Physique des Lasers, Atomes et Molécules (PhLAM), UMR CNRS 8523, Centre d’Études et de Recherches Lasers etApplications (CERLA, FR CNRS 2416), Université des Sciences et Technologies de Lille, F-59655 Villeneuve d’Ascq Cedex, France
A. GiulianiDISCO Beamline, SOLEIL Synchrotron, BP 48, L’Orme des Merisiers, 91192 Gif-sur-Yvette Cedex, France
and Cepia, Institut National de la Recherche Agronomique, BP 71627, 44316 Nantes Cedex 3, France
J. Heinesch, M. Grogna, and M.-J. Hubin-FranskinLaboratoire de Spectroscopie d’Électrons diffusés, Université de Liège, Institut de Chimie B6c, B-4000 Liège 1, Belgium
�Received 20 January 2007; revised manuscript received 14 March 2007; published 30 May 2007�
Core shell excitation spectra of aniline at the carbon and nitrogen 1s edges have been obtained by inner-shellelectron energy-loss spectroscopy recorded under scattering conditions where electric dipolar conditions domi-nate, with higher resolution than in the previous studies. They are interpreted with the aid of ab initioconfiguration interaction calculations. The spectrum at the C 1s edge is dominated by an intense �* band.The calculated chemical shift due to the different chemical environment at the carbon 1s edge calculated is inagreement with the experimental observations within a few tenths of an eV. The transition energies of the mostintense bands in the C 1s excitation spectrum are discussed at different levels of calculations. In the nitrogen1s excitation spectrum the most intense bands are due to Rydberg-valence transitions involving the �*-typemolecular orbitals, in agreement with the experiment. This assignment is different from that of extendedHückel molecular orbital calculations. The geometries of the core excited states have been calculated andcompared to their equivalent core molecules and benzene.
DOI: 10.1103/PhysRevA.75.052719 PACS number�s�: 32.80.Hd, 34.80.Gs
I. INTRODUCTION
One of the most important properties of aniline is to po-lymerize easily in polyaniline. This polymer is relativelyeasy to synthesize and can get, under specific conditions,interesting electric conducting properties �1�. This is also in-volved for the synthesis of molecular systems having poten-tially large nonlinear optical responses �2�.
The physicochemical properties of polyaniline are relatedat least partly to the � molecular orbitals in the valencebands but also in the empty levels. In a general way these areexpected at least for thin films to be predicted to be not toodifferent from the individual molecule constituting the unit.
To our knowledge core excitation spectra of aniline havebeen reported by only two experimental studies previously,namely x-ray photoabsorption �near-edge x-ray-absorptionfine-structure �NEXAFS�� of the condensed multilayer solid�3–5� and inner-shell electron energy-loss spectroscopy�ISEELS� of aniline in gas phase �6�. Calculations of the coreexcitation spectra have been reported using the extendedHückel molecular orbital �EHMO� method �6�, the multicon-figuration self-consistent-field �MCSCF� method for the car-bon first �* transitions �5�, and the static exchange �STEX�method �7,8�. In Ref. �7�, the assignments of the main fea-tures of the spectra were briefly discussed, while in the laterwork, no detailed discussion was given.
In the present work the electronic structure of aniline, andmuch more specifically the unoccupied levels, have been in-vestigated by core shell excitation and ab initio calculations.Inner-shell electron energy-loss spectroscopy has been usedto record the C 1s and N 1s excitation spectra of aniline. Theexperimental conditions—high electron impact energy and
quite small scattering angle—are such that electron energy-loss spectra are expected to exhibit the same features withquite similar relative intensities to those of the correspondingones in photoabsorption.
The core excitation spectra have been measured for gas-eous aniline with higher energy resolution than in the previ-ous studies. Ab initio configuration interaction �CI� calcula-tions have been performed to assist in the spectralassignments and to discuss aspects of the unoccupiedmolecular-orbital electronic structure.
II. EXPERIMENTAL PART
The inner-shell electron energy-loss spectra were obtainedwith a Vacuum Science Workshop Ltd. spectrometer whichhas been adapted for gas studies and high-energy electronbeams and has been equipped with a home-made positionsensitive multidetector system in order to improve data col-lection times. The experimental apparatus and procedurehave been described in detail previously �9–11�.
Briefly the spectrometer consists of an electrostatic 180°monochromator operating in the constant pass energy mode,a collision chamber, and an electrostatic analyzer identical tothe monochromator. The monochromatized incident elec-trons are accelerated up to 2 keV and focused into the colli-sion chamber using a four-element electron lens. The elec-trons are slightly deflected �0.02 radians� by two sets of X-Yplates inside the collision chamber. The scattered electronsare energy analyzed and focused onto the entrance slit of theanalyzer by a lens similar to that used for acceleration.
In the collision conditions of quite low momentum trans-fer �i.e., high incident energy and quite small scattering
PHYSICAL REVIEW A 75, 052719 �2007�
1050-2947/2007/75�5�/052719�12� ©2007 The American Physical Society052719-1
angle�, only electronic electric-dipolar transitions are ex-cited. Inside the vacuum vessel, a residual pressure of lessthan 1�10−8 Torr is maintained by a cryogenic pumpingsystem. The electron gun and the analyzer regions are differ-entially pumped by turbomolecular pumps, respectively. Thespectra have been recorded with 0.040- and 0.020-eV steps.
In order to take into account valence and lower-energyinner-shell excitation cross section, a linear background hasbeen subtracted from the raw spectra by extrapolating aleast-square fit of the pre-edge experimental data points.
The absolute energy scale has been calibrated at bothedges relative to CO and the C 1s→�* ���=0� band at287.40±0.02 eV �12� recording the spectra with 0.01-eVsteps and the mean value of 400.99±0.09 eV between the N1s→�* ���=0� at �400.88 eV and the N 1s→�* ���=1� at401.1 eV �12� recording the spectra with 0.02-eV steps.
The sample has been provided by ACROS Organics witha stated purity better than 99.5%. It was used directly with-out further purification except for repetitive freeze-pump-thaw cycles in order to eliminate air and other volatile im-purities in the sample.
III. COMPUTATIONAL METHOD
Since the computational method used has been describedin detail elsewhere �13�, it will be briefly outlined. The start-ing hypothesis �14� is that, due to the important relaxation ofthe electronic density following the creation of the core hole,the molecular orbitals �MOs� of the core ionized moleculeare a better approximation for the description of the coreexcited states than the ground state MOs. Formally, the en-ergy of a given 1s→ i*core excited state may be obtained bycorrecting the core ion energy in the following manner:
E�1s → i*� = E�1s → �� + �i* + Pi* + Ci*,
where �i* is the Hartree-Fock monoelectronic energy of the i*
MO. E�1s→�� is the core ion energy, obtained using theROHF-GVB method implemented in the GAMESS-US pack-age �15�. The Pi* and Ci* terms represent the residual relax-ation and valence correlation effects of the i* electron withrespect to the core ion, respectively. The relaxation term istaken into account by performing a configuration interaction�CI� calculation in the monoexcitation space of the lowest-lying core states, obtained by a preliminary diagonalizationof the full 1s→ i* CI matrix. In order to evaluate the Ci*
term, the calculated CI wave functions serve as the zeroth-order space for a multireference MP2 calculation using thethree-class diagrammatic CIPSI method �16,17�. To sparecomputational time, an extrapolation procedure �18� was em-ployed, using six thresholds between 97.0 and 99.5 % of theexact wave functions. Finally, the dipolar electric transitionoscillator strengths with respect to the ground state of themolecule were computed, using the length gauge.
The Gaussian atomic orbitals �AOs� used are the TZPbasis set taken from Dunning �19�. For the calculation of thecore excited states, a set of Rydberg orbitals �5s ,5p ,2d� wasadded to the core excited atom basis set. The first exponentswere taken from Dunning and Hay �20� and the last ones
were determined in an “even-tempered” manner. In the fol-lowing, the basis set with diffuse functions will be named “TZP+R.” The theoretical width of the bands was set to theexperimental resolution �0.17 eV� and a Gaussian profilewas used in the comparison of the calculations and the ex-periment.
The aniline molecule contains four chemically nonequiva-lent carbons and one nitrogen atom �see Fig. 1 for labeling�.For the calculation of the core ionized MOs at both edges,core hole localization was assumed and the coupling be-tween excitations from different core holes was neglected.
IV. RESULTS AND DISCUSSION
It is now well known that aniline is nonplanar in itsground electronic state �21,22�, the amine group being pyra-midally distorted �Fig. 1�a��. The symmetry point group istherefore Cs, with the symmetry plane corresponding to the�yz� plane using the frame of Fig. 1�a�. The energy differencebetween the planar �Fig. 1�a�� and nonplanar �Fig. 1�c�� con-formations is rather small, with proposed values of524.4 cm−1 �23�, 454 cm−1 �24�, and 509.0 cm−1 �25�. Fromthe theoretical point of view, this quantity is very sensitive tothe basis set and method employed �26,27�. In the presentwork, the inversion barrier is calculated to be 388 cm−1 atthe HF level and 710 cm−1 at the MP2 level.
In the present work, as in previous theoretical studies ofcore excited aniline �5,6,8�, the planar conformation wasused. This geometry reduces the computational cost and al-lows calculating a larger number of states. Moreover, thehigh symmetry facilitates the assignment of the core states.The calculation of valence electronic spectrum for nonplanarand planar conformations �28� showed very small differencesfor the energies and intensities �Fig. 3 of �28��. Therefore forN and C4 atoms, the calculations were performed in the C2vgroup of planar aniline. For C2 and C3, because of assumedcore hole localization, the C2v symmetry was reduced to Cs,but with the symmetry plane being the �xz� plane of Fig. 1.Thus it should be kept in mind that the �xz� symmetry planeused for C2 and C3 is in fact perpendicular to the true �yz�symmetry plane of the molecule, resulting in an inversionbetween A� and A� irreducible representations.
The use of C2v symmetry also has some consequences onthe allowed dipole electric transitions: the 1s�a1�→�*�a2� ornd�a2� transitions are forbidden while all transitions shouldbe allowed in the nonplanar �Cs� conformation. However,their intensities should be small when compared to othertransitions.
The calculated HF electronic configuration of the neutralground state of aniline for the planar molecule is
1a122a1
23a121b2
22b224a1
25a126a1
27a123b2
28a124b2
29a12
�10a125b2
211a1212a1
26b227b2
21b1213a1
28b222b1
21a223b1
2.
The seven first MO’s �molecular orbitals� are the 1s orbit-als of the nitrogen atom and of the six carbon atoms. Thereare four occupied �-type MO’s, namely the 1b1, 2b1, 1a2,and 3b1. The 1b1 MO corresponds to the nitrogen lone pair,with C1 and C2 bonding character; the 2b1�1�� MO has
DUFLOT et al. PHYSICAL REVIEW A 75, 052719 �2007�
052719-2
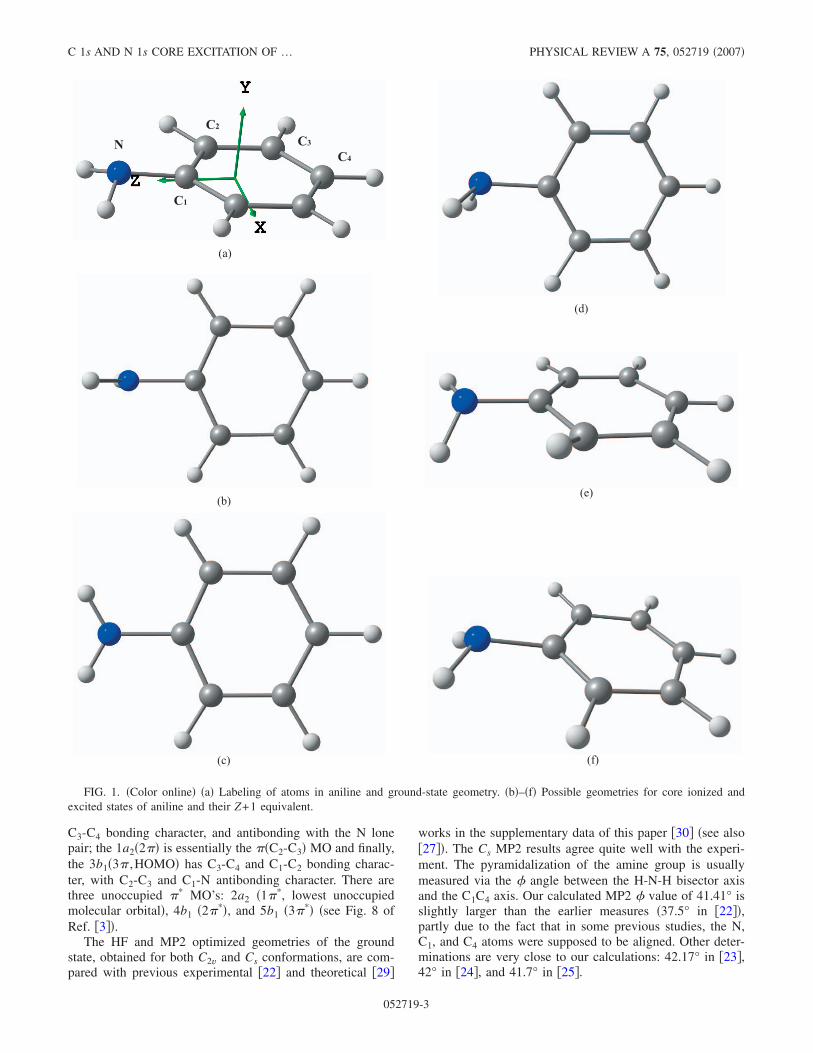
C3-C4 bonding character, and antibonding with the N lonepair; the 1a2�2�� is essentially the ��C2-C3� MO and finally,the 3b1�3� ,HOMO� has C3-C4 and C1-C2 bonding charac-ter, with C2-C3 and C1-N antibonding character. There arethree unoccupied �* MO’s: 2a2 �1�*, lowest unoccupiedmolecular orbital�, 4b1 �2�*�, and 5b1 �3�*� �see Fig. 8 ofRef. �3��.
The HF and MP2 optimized geometries of the groundstate, obtained for both C2v and Cs conformations, are com-pared with previous experimental �22� and theoretical �29�
works in the supplementary data of this paper �30� �see also�27��. The Cs MP2 results agree quite well with the experi-ment. The pyramidalization of the amine group is usuallymeasured via the � angle between the H-N-H bisector axisand the C1C4 axis. Our calculated MP2 � value of 41.41° isslightly larger than the earlier measures �37.5° in �22��,partly due to the fact that in some previous studies, the N,C1, and C4 atoms were supposed to be aligned. Other deter-minations are very close to our calculations: 42.17° in �23�,42° in �24�, and 41.7° in �25�.
N
C1
C2C3
C4
(a)
(b)
(c)
(d)
(e)
(f)
FIG. 1. �Color online� �a� Labeling of atoms in aniline and ground-state geometry. �b�–�f� Possible geometries for core ionized andexcited states of aniline and their Z+1 equivalent.
C 1s AND N 1s CORE EXCITATION OF … PHYSICAL REVIEW A 75, 052719 �2007�
052719-3
A. Core ionization energies
The calculated core ionization energies obtained at the�MP2 and �SCF levels are given in Table I and comparedwith the �SCF results of Carravetta et al. �8� and the XPSexperimental values �31�. Since in MP2 calculations, severalpossible definitions of the zero-order Hamiltonian for open-shell systems are possible �32�, the �MP2 values of thepresent work were obtained using three different models:RMP �33,34�, ZAPT �35,36�, and CIPSI. The two �SCF arenearly identical because Carravetta et al. �8� employed thesame basis set as in the present work. While RMP and ZAPTmethods are very similar, the CIPSI values are slightly dif-ferent. All results are within 0.5 eV of the experimental val-ues.
In order to test the influence of using a planar geometryon core energies, the calculations were done in both planar�C2v� and nonplanar �Cs� conformations. As shown in theEPAPS document �30�, using the nonplanar geometry affectsthe core ionization energies by at most 0.18 eV, although thevariation is different for each atom. For carbon atoms, thenonplanar absolute energy values are closer to experiment
than the planar results. The situation is reversed for nitrogen.Globally, for both geometries, chemical shifts are in goodagreement with experiment, while most calculated absoluteenergies are too large by a few tenths of an eV. A similartrend will be found in the calculation of the core excitationspectra �see next sections�. In order to remain consistent withthe calculation of the core excited states, the CIPSI valuesobtained in the planar geometry will be used as a reference inthe following.
B. Nitrogen K-shell electron energy-loss spectrum
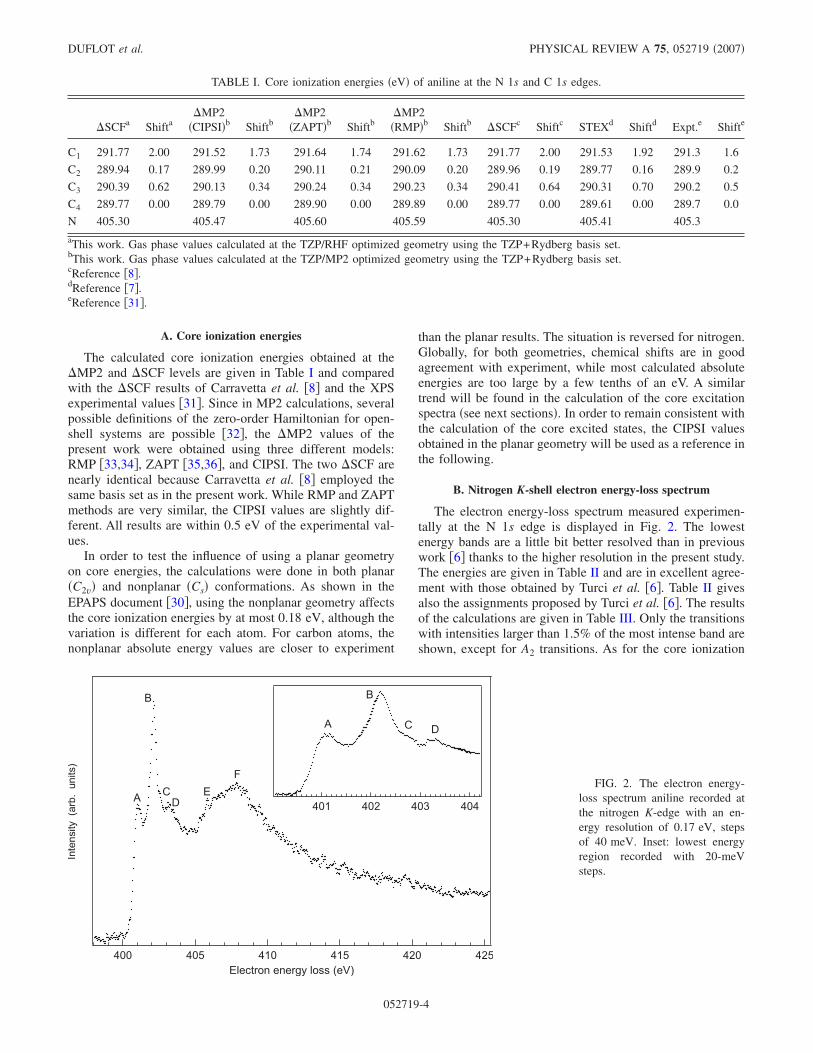
The electron energy-loss spectrum measured experimen-tally at the N 1s edge is displayed in Fig. 2. The lowestenergy bands are a little bit better resolved than in previouswork �6� thanks to the higher resolution in the present study.The energies are given in Table II and are in excellent agree-ment with those obtained by Turci et al. �6�. Table II givesalso the assignments proposed by Turci et al. �6�. The resultsof the calculations are given in Table III. Only the transitionswith intensities larger than 1.5% of the most intense band areshown, except for A2 transitions. As for the core ionization
TABLE I. Core ionization energies �eV� of aniline at the N 1s and C 1s edges.
�SCFa Shifta�MP2
�CIPSI�b Shiftb�MP2
�ZAPT�b Shiftb�MP2�RMP�b Shiftb �SCFc Shiftc STEXd Shiftd Expt.e Shifte
C1 291.77 2.00 291.52 1.73 291.64 1.74 291.62 1.73 291.77 2.00 291.53 1.92 291.3 1.6
C2 289.94 0.17 289.99 0.20 290.11 0.21 290.09 0.20 289.96 0.19 289.77 0.16 289.9 0.2
C3 290.39 0.62 290.13 0.34 290.24 0.34 290.23 0.34 290.41 0.64 290.31 0.70 290.2 0.5
C4 289.77 0.00 289.79 0.00 289.90 0.00 289.89 0.00 289.77 0.00 289.61 0.00 289.7 0.0
N 405.30 405.47 405.60 405.59 405.30 405.41 405.3
aThis work. Gas phase values calculated at the TZP/RHF optimized geometry using the TZP+Rydberg basis set.bThis work. Gas phase values calculated at the TZP/MP2 optimized geometry using the TZP+Rydberg basis set.cReference �8�.dReference �7�.eReference �31�.
Intensity
(arb.units)
425420415410405400Electron energy loss (eV)
F
A C E
B
D 404403402401
A
B
C D
FIG. 2. The electron energy-loss spectrum aniline recorded atthe nitrogen K-edge with an en-ergy resolution of 0.17 eV, stepsof 40 meV. Inset: lowest energyregion recorded with 20-meVsteps.
DUFLOT et al. PHYSICAL REVIEW A 75, 052719 �2007�
052719-4
energy, the calculated values seem to be overestimated by afew tenths of an eV. This implies that the calculated termvalues �TV’s� should be in better agreement with experimentthan the absolute energies. Therefore TV’s of Tables II andIII will be used for the assignment of the spectrum.
The first band A is observed at 401.1 eV �TV=4.2 eV�and is only partly resolved from the most intense one. It wasassigned by Turci et al. �6� to the N 1s→3s transition. Plash-
kevych et al. �7� suggested p�* �a1� MO with s character. Asshown in Table III, the calculations confirm partially thisassignment: the N 1s→3s� /�* �NH2� transition is calcu-lated at 401.49 eV �TV=3.98 eV� but its rather large inten-sity is due to the important �* �NH2� valence character of the3s Rydberg orbital.
The next band B is located at 402.2 eV �TV=3.1 eV� andwas assigned to the N 1s→3p /�* �NH2� �2�* ,4b1� transi-
TABLE II. Experimental energy values �eV� of the spectral bands in the N 1s excitation spectrum ofaniline and previous proposed assignments.
Band E �eV�a TV �eV�b E �eV�c TV �eV�c Assignmentc
A 401.1 4.2 400.7 4.6 3s
B 402.2 3.1 402.2 3.1 3p /�* �NH2� �2�* ,4b1�C 402.72 2.58
D 403.24 2.06 404 1.3 �* �NH2�E 406.1 −0.8
F 407.6 −2.3 407.6 −2.3 �* �CN�aThis work.bThis work using ionization energy of Ref. �31�.cReference �6�.
TABLE III. Calculated energies, term values �TV�, relative intensities, and assignments of N 1s coreexcited states of aniline.
State E �eV� TV �eV� Intensitya Main configurationsb �r2�
A1 401.49 3.98 0.114 0.97 N 1s→3s� /�* �NH2� 133
B2 402.53 2.94 0.465 0.97 N 1s→3p� /�* �NH2� 144
A2 402.60 2.87 0.000c 0.45 N 1s→1�* �2a2� 86
+0.43 N 1s→3d�
B1 402.61 2.86 0.171 0.54 N 1s→2�* �4b1� 89
+0.24 N 1s→3p�
+0.11 N 1s→4p� /2�*
B1 403.26 2.21 0.281 0.74 N 1s→3p� 181
+0.17 N 1s→2�* �4b1�A1 403.66 1.81 0.024 0.95 N 1s→4s� 309
B2 403.73 1.73 0.086 0.98 N 1s→3d� /�* �NH2� 244
A2 403.98 1.49 0.000c 0.54 N 1s→3d� 274
+0.43 N 1s→1�* �2a2�B1 403.99 1.47 0.023 0.96 N 1s→3d� 275
B2 404.09 1.38 0.072 0.98 N 1s→4p� /�* �NH2� 432
B1 404.26 1.21 0.098 0.77 N 1s→4p� /2�* �4b1� 524
A2 404.52 0.94 0.000c 0.90 N 1s→4d� 589
B1 404.64 0.83 0.036 0.92 N 1s→5p� 985
405.47 0.00 Ion
A1 405.47 0.00 0.123 096 N 1s→�* �NH2� 274
B2 405.56 −0.09 1.000d 0.96 N 1s→�* �NH2� 220
B1 406.60 −1.13 0.033 0.56 N 1s→3�* �5b1� 110
B2 406.90 −1.43 0.034 0.80 N 1s→�* �C3H� 147
aRelative intensity to the most intense band.bMain configuration of the CI wave function.cDipole-electric forbidden transition.dAbsolute calculated oscillator strengths �length gauge�: fL=0.0199.
C 1s AND N 1s CORE EXCITATION OF … PHYSICAL REVIEW A 75, 052719 �2007�
052719-5
tion by Turci et al. �6� and to a p�* �b2� MO by Plashkevychet al. �7�. The present calculations of Table III show a muchmore complex situation, since there are three transitions pre-dicted to have a TV around 2.9 eV. The most intense one,calculated at 402.53 eV �TV=2.94 eV�, is due to the N 1s→3p� /�* �NH2�, i.e., an in-plane 3p� with an important�* �NH2� valence character. The two other states are nearlydegenerate and correspond to transitions to the 1�* �2a2� and2�* �4b1� MO’s. For both states, the CI wave functions ap-pear to be a mixing between �* and Rydberg MO’s �3d� for1�* and 3p� /4p� for 2�*�. However, the low values of the�r2� parameters �86 and 89 a.u.2� prove without ambiguitythe two transitions to have a valence character and corre-sponding to the 1�* �2a2� and 2�* �4b1� transitions. Itshould also be noticed that if the nonplanar geometry hadbeen used, the A2 transition would have A� symmetry whilethe B1 transition would be A�. The A2 transition would thenbe allowed but its intensity should be weak. Experimentally,the � /� nature of band B could be confirmed by measuringthe near-edge x-ray-absorption fine-structure spectra of con-densed aniline at glancing and normal incidence �4�, as doneat the C 1s edge �3�, or by using the symmetry-resolvedmethod of Shigemasa et al. �37�.
A shoulder C not well resolved on the high-energy side ofthe most intense band is observed at 402.72 eV �inset of Fig.2, Table II�, corresponding to a TV of 2.58 eV. According tothe data of Table IV, it involves excitation to the 3p� MO,calculated at 403.26 eV �TV=2.30 eV�. While the �r2� valueof 181 a.u.2 identifies this transition to be of Rydberg char-acter, its unusually high intensity �28.1% of the most intenseband� may be explained by a mixing with the N 1s→2�*
�4b1� excitation.The next band D has its maximum at 403.24 eV �Table II�
with a TV of 2.06 eV and was assigned �6� to the transitionto a �* �NH2� state. For TV’s below 2 eV, the calculations ofTable III predict a large number of transitions, most of thembeing pure Rydberg states with very low intensities. A fewstates have larger intensities, because of a mixed Rydberg-valence character of the transition: the N 1s→3d� /�* �NH2� transition, calculated with a TV of1.73 eV, could be responsible for the 403.24-eV feature. TheN 1s→4p� /�* �NH2� and N 1s→4p� /2�* �4b1� transi-tions are also rather intense and contribute to the intensity inthis energy region.
At higher energies, the Rydberg transitions converge tothe continuum onset corresponding to the ionization energy,
calculated at 405.47 eV. A simple way to test the accuracy ofthe calculated Rydberg transitions is to perform a quantumdefect analysis using the well-known Rydberg formula:
E�1s → n�� = E�1s → �� −R
�n − ��2 ,
where R is the Rydberg constant, n is the principal quantumnumber, and � is the quantum defect. Table IV shows theresults of a fitting procedure using the calculated values ofTable III. For s and p transitions, the fitted ionization poten-tial �IP’s�, located between 405.38 and 405.45 eV, are closeto the experimental value �31� of 405.3 eV and consistentwith the CIPSI value of 405.47 eV.
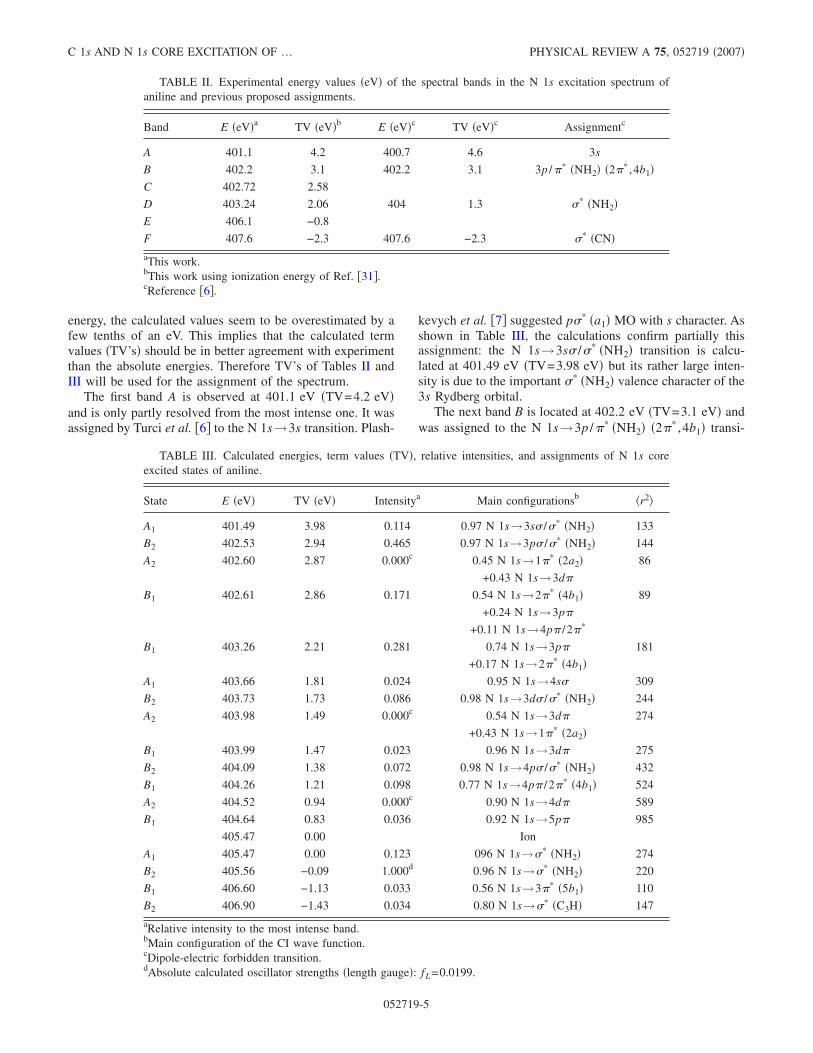
According to the calculations, the two N 1s→�* �NH2�have TV’s close to zero and lie at the ionization continuumonset. One of these transitions �B2 symmetry� has the largestintensity of the whole spectrum. It is highly probable thatthis proximity to the continuum induces a very short lifetimefor these transitions. Consequently, the corresponding bandshave probably large full width at half maximum �FWHM�which might explain the flatness of the observed spectrumaround 405 eV �Figs. 2 and 3�.
The last two bands E and F can be seen in theexperimental spectrum at higher energies �Fig. 2� at406.1 eV �TV=−0.8 eV� and 407.6 eV �TV=−2.3 eV�.Above the ionization threshold, the present calculations maynot be quantitatively accurate, since they do not take intoaccount the coupling with the continuum states. According toTable IV, the E band could be due to the N 1s→3�* and N1s→�* �C3H� transitions. The N 1s→3�* �5b1� state isstrongly mixed with a large number of di-excitations andthere is also a doubly excited state with small 3�* charactercalculated at 408.40 eV. A natural population analysis �38�shows without ambiguity that the 406.60-eV transition is es-sentially monoelectronic. A similar mixing also occurs forthe N 1s→�* �C3H� transition. For band F there is verylikely also a contribution from shape resonances, althoughthis type of assignment has been questioned �39�.
In Fig. 3, the experimental spectrum is compared with thecalculated one. It should be noticed that all calculated bandshave been taken into account, including the low intensitytransitions not shown in Table IV. There is good agreementbetween both sets of data, except from a slight overestima-tion ��0.5 eV� of the calculated values, as already statedbefore. It should be noticed that the STEX results of Car-ravetta et al. �Fig. 4 of Ref. �8�� were overestimated by
TABLE IV. Quantum defect analysis �energies in eV�.
N C1 C2 C3 C4
� IP � IP � IP � IP � IP
ns�a1� 1.14 405.42 ns�a1� 0.84 291.41 ns�a�� 0.97 290.12 ns�a�� 0.94 290.25 ns�a1� 0.83 289.69
np�a1� 0.56 405.45 np�a1� 0.60 291.47 np�a�� 0.71 290.07 np�a�� 0.70 290.21 np�a1� 0.65 289.71
np�b2� 0.84 405.45 np�b2� 0.58 291.42 np�a�� 0.68 290.14 np�a�� 0.67 290.27 np�b2� 0.48 289.66
np�b1� 0.48 405.38 np�b1� 0.32 291.40 np�a�� 0.35 289.83 np�a�� 0.43 290.07 np�b1� 0.33 289.65
CIPSI 405.47 291.52 289.99 290.13 289.79
DUFLOT et al. PHYSICAL REVIEW A 75, 052719 �2007�
052719-6
�1.2 eV with respect to the spectrum of Turci et al. �6�. Thisfigure also shows that the 0.17-eV bandwidth used is toonarrow to reproduce the observed spectrum, the most part ofthe broadness of the experimental bands being due to theshort lifetimes of the excited species.
C. Carbon K-shell electron energy-loss spectrum
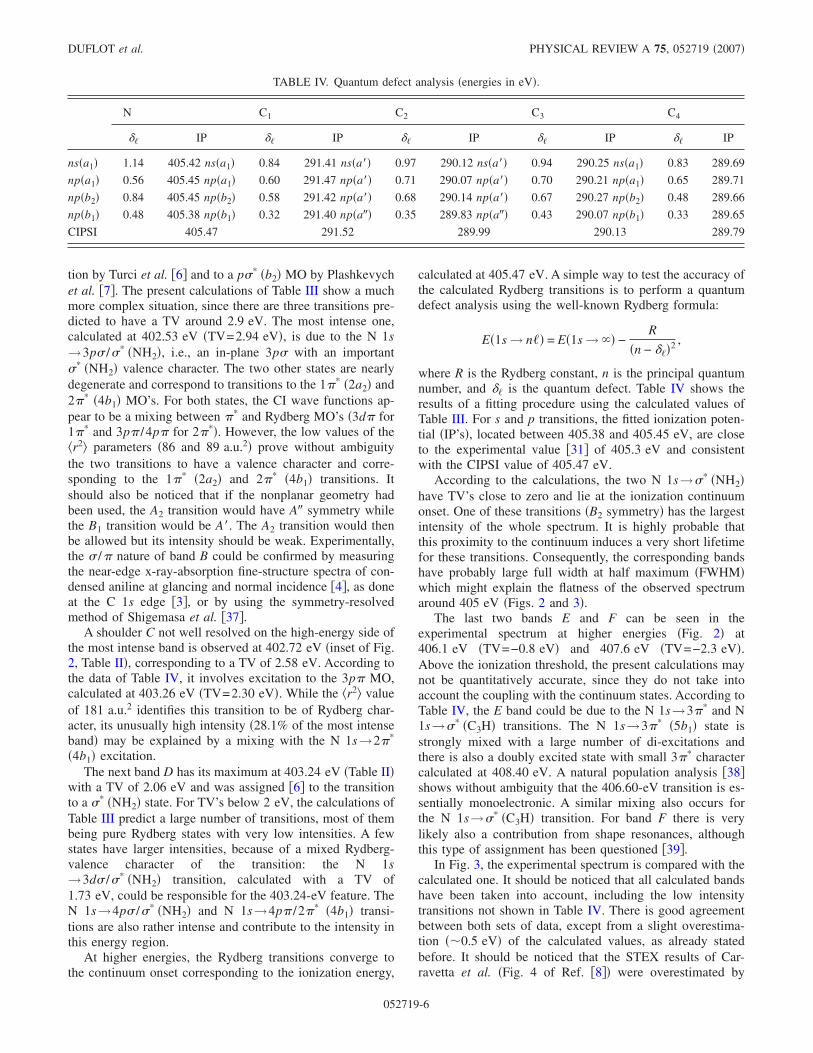
The experimental excitation spectrum at the C 1s edge ispresented in Fig. 4. It is quite similar to that of Turci et al.
�6�, some fine features being better resolved thanks to thehigher resolution in the present study. The energy values ofthe observed spectral bands are given in Table V and arecompared to previous studies on gaseous aniline but also onsamples condensed on metallic substrates. The table alsoprovides the assignments proposed previously for the gasphase spectra. In Table VI the results of the calculations aregiven. Only the transitions with intensities larger than 1.5%of the most intense band are shown, except for A2 transitions.For the assignment of the spectrum, one has to keep in mindthat the calculated values are probably slightly overestimated�see Fig. 5�. Contrary to the nitrogen case, using TV values ismore difficult, because of the four nonequivalent carbon at-oms.
The first band A, the most intense one, is observed at285.29 eV �Table V� and is assigned without ambiguity tothe excitation of the 2�* molecular orbital from C2 1s, C3 1s,and C4 1s which are calculated to be nearly degenerate, re-spectively, at 285.52, 285.53, and 285.64 eV as shown inTable VI. The largest intensity predicted is for C3 1s→2�*.These results are consistent with the experimental broadnessof the spectral band �Fig. 4� which has a FWHM of about0.9 eV. Table VII compares the present calculations to pre-vious theoretical studies. With the exception of the EHMOvalues of Turci et al. �6�, which are underestimated by sev-eral eV, all results are slightly too high. Table VIII confirmsthat C2 1s→2�* and C3 1s→2�* transitions are almost per-fectly degenerate, because they are less perturbed by the sub-stitution of a hydrogen atom by the amino group when goingfrom benzene to aniline. On the other hand, the chemicalshifts are more important for C4 and of course for C1. Theyappear to be smaller than their equivalent in the core ions�Table I�.
The band B has its maximum of intensity at 286.69 eVand is highly asymmetric on the high-energy side with a notwell resolved feature C at 286.88 eV as shown in the inset ofFig. 4. Feature C is not mentioned by Turci et al., very likely
Intensity(arb.units)
400 401 402 403 404 405 406 407Electron energy loss (eV)
FIG. 3. Comparison between the experimental and the theoreti-cal spectra for the pre-edge region at the nitrogen K-edge. Thecalculated results are convoluted by the experimental profile with0.17 eV as the bandwidth at half maximum. The vertical lines showthe measured ionization threshold.
Intensity(arb.units)
310300290280Electron energy loss (eV)
A
B
DE
FG
H292290288286
A
BC D E
FIG. 4. The electron energy-loss spectrum of aniline recordedat the carbon K-edge with an en-ergy resolution of 0.17 eV, stepsof 40 meV. Inset: lowest energyregion recorded with 20-meVsteps.
C 1s AND N 1s CORE EXCITATION OF … PHYSICAL REVIEW A 75, 052719 �2007�
052719-7
being not resolved at all in their spectrum. The B band hasbeen assigned to the C4 1s→2�* �4b1� �6�. The calculationssupport this assignment, since the C1 1s→2�* �4b1� transi-tion is predicted to occur at a slightly higher energy of287.16 eV �Table VIII�. This transition has also the highestintensity of all. The calculations also reveal the presence ofmany other transitions in this energy region. Some of them,being purely Rydberg, are not shown in Table VI. For C2, C3,and C4, the transitions to the 3s� MO are predicted at veryclose energies �between 286.79 and 287.07 eV�. Their rela-tively high intensity �about 4% of the most intense peak� isdue to their �* �CH� valence character. The correspondingtransition C1 1s→3s� /�*�NH2� �not shown in Table VI� iscalculated at 288.48 eV but with a very small intensity�0.3%�. The four transitions have nearly identical TV’s,around 3 eV.
The calculated transitions to the 1�* exhibit the same pat-terns as the 2�* and 3s� transitions for the four atoms: theC2, C3, and C4 transitions occur between 285.90 and286.59 eV, while the C1 transition is calculated at287.48 eV. There are, however, differences in the wave func-tions: for C1 and C4, the wave function is purely 1�*, whilefor C2 and C3, there is a mixing between 1�* and 3p� and3d� configurations. This mixing is due to the fact that C2and C3 were calculated in Cs symmetry while C2v symmetrywas used for C1 and C4. It is also interesting to note that theC2 and C3 transitions have very weak intensities. This wouldtend to confirm that the two A2 transitions would have alsoweak intensities in the nonplanar geometry.
The band D is observed with a maximum intensity at289.11 eV. It presents fine features not well resolved on thelow-energy side at 288.37 eV and on the high-energy side at289.43 eV. It has been reported previously �3,6� and as-signed to excitation of 3�* �5b1� or 3p MO’s �6� or possibly�* �CH� MO �3� from C2, C3, or C4 atoms. Plashkevych etal. �7� noticed that the experimental TV would suggest a 4prather than 3p transition in this region. The present calcula-
tions show that there are many n=4 and 5 Rydberg transi-tions from C1, C2, and C3 in this energy region. Most of themhave very low intensities and are not shown in Table VI.They contribute to the intensity on the low-energy side of theD band. In fact, according to the calculations, the D bandappears to be due to the excitation to the 3�* MO form C2and C4 and, to a lesser extent, from C3 in the low-energyside. As for N and C4, the wave functions appear to be amixing between 3�* and valence 1s �→�* �* di-excitedconfigurations. Because of their �r2� value around 90 a.u.2,they clearly have valence character. The configuration mix-ing might reflect the fact that the 3�* virtual MO of the coreion is not the best one to describe the core excitation, but itmay also indicate the presence of a true high intensityshake-up state, as we have found recently in the N 1s K shellof s-triazine �40�. This is especially true for C3, since thereare two states �calculated at 288.83 and 289.82 eV� with animportant 3�* character �19 and 27 %� mixed with di-excitations. In order to define the mono- or di-excited char-acter of this type of states, a natural orbital analysis �38� wasperformed. The resulting fractional occupation numbersshow that for C2, C3, and C4, there are about 1.5 electrons in�* MO’s, corresponding to an intermediate situation betweenmono- and di-excited states. With a population of 1.8 elec-trons in �* and about 0.9 electron removed from the � MO’s,the second C3 3�* state may be viewed as a “true” shake-upstate.
The next band E is located at 290.65 eV as shown in Fig.4 and is between the C2, C3, C4 ionization threshold and theC1 one. Previously it has been assigned to 3�* �5b1� �3,6� or�* �CNH2� �3,6,7� �Table V�. The calculations predict an in-tense transition at 290.88 eV involving the C1 1s→3�* tran-sition with an important �20%� 2� C1 1s→1�*2�* charac-ter. According to the natural MO’s analysis, it may beconsidered as monoelectronic since there is 1.1 electron in�* MO’s. There are also �* and shake-up transitions in thisenergy range but their intensities are low. The quasidegener-
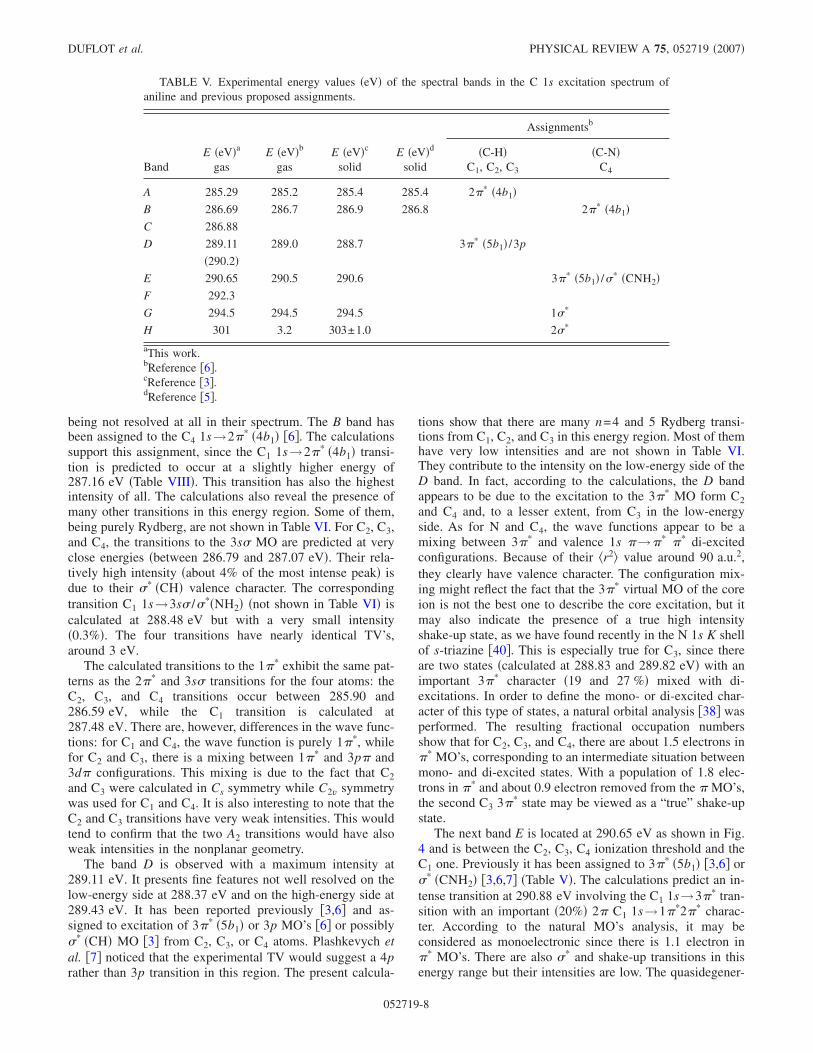
TABLE V. Experimental energy values �eV� of the spectral bands in the C 1s excitation spectrum ofaniline and previous proposed assignments.
BandE �eV�a
gasE �eV�b
gasE �eV�c
solidE �eV�d
solid
Assignmentsb
�C-H�C1, C2, C3
�C-N�C4
A 285.29 285.2 285.4 285.4 2�* �4b1�B 286.69 286.7 286.9 286.8 2�* �4b1�C 286.88
D 289.11 289.0 288.7 3�* �5b1� /3p
�290.2�E 290.65 290.5 290.6 3�* �5b1� /�* �CNH2�F 292.3
G 294.5 294.5 294.5 1�*
H 301 3.2 303±1.0 2�*
aThis work.bReference �6�.cReference �3�.dReference �5�.
DUFLOT et al. PHYSICAL REVIEW A 75, 052719 �2007�
052719-8
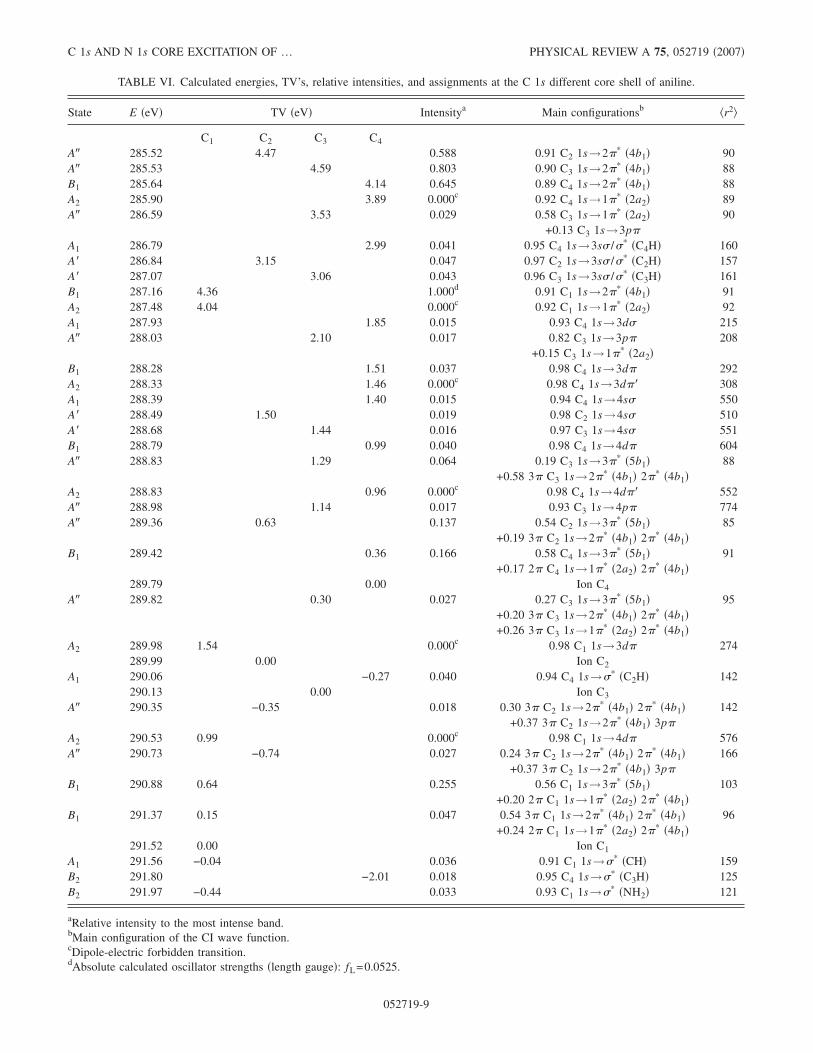
TABLE VI. Calculated energies, TV’s, relative intensities, and assignments at the C 1s different core shell of aniline.
State E �eV� TV �eV� Intensitya Main configurationsb �r2�
C1 C2 C3 C4
A� 285.52 4.47 0.588 0.91 C2 1s→2�* �4b1� 90A� 285.53 4.59 0.803 0.90 C3 1s→2�* �4b1� 88B1 285.64 4.14 0.645 0.89 C4 1s→2�* �4b1� 88A2 285.90 3.89 0.000c 0.92 C4 1s→1�* �2a2� 89A� 286.59 3.53 0.029 0.58 C3 1s→1�* �2a2� 90
+0.13 C3 1s→3p�
A1 286.79 2.99 0.041 0.95 C4 1s→3s� /�* �C4H� 160A� 286.84 3.15 0.047 0.97 C2 1s→3s� /�* �C2H� 157A� 287.07 3.06 0.043 0.96 C3 1s→3s� /�* �C3H� 161B1 287.16 4.36 1.000d 0.91 C1 1s→2�* �4b1� 91A2 287.48 4.04 0.000c 0.92 C1 1s→1�* �2a2� 92A1 287.93 1.85 0.015 0.93 C4 1s→3d� 215A� 288.03 2.10 0.017 0.82 C3 1s→3p� 208
+0.15 C3 1s→1�* �2a2�B1 288.28 1.51 0.037 0.98 C4 1s→3d� 292A2 288.33 1.46 0.000c 0.98 C4 1s→3d�� 308A1 288.39 1.40 0.015 0.94 C4 1s→4s� 550A� 288.49 1.50 0.019 0.98 C2 1s→4s� 510A� 288.68 1.44 0.016 0.97 C3 1s→4s� 551B1 288.79 0.99 0.040 0.98 C4 1s→4d� 604A� 288.83 1.29 0.064 0.19 C3 1s→3�* �5b1� 88
+0.58 3� C3 1s→2�* �4b1� 2�* �4b1�A2 288.83 0.96 0.000c 0.98 C4 1s→4d�� 552A� 288.98 1.14 0.017 0.93 C3 1s→4p� 774A� 289.36 0.63 0.137 0.54 C2 1s→3�* �5b1� 85
+0.19 3� C2 1s→2�* �4b1� 2�* �4b1�B1 289.42 0.36 0.166 0.58 C4 1s→3�* �5b1� 91
+0.17 2� C4 1s→1�* �2a2� 2�* �4b1�289.79 0.00 Ion C4
A� 289.82 0.30 0.027 0.27 C3 1s→3�* �5b1� 95+0.20 3� C3 1s→2�* �4b1� 2�* �4b1�+0.26 3� C3 1s→1�* �2a2� 2�* �4b1�
A2 289.98 1.54 0.000c 0.98 C1 1s→3d� 274289.99 0.00 Ion C2
A1 290.06 −0.27 0.040 0.94 C4 1s→�* �C2H� 142290.13 0.00 Ion C3
A� 290.35 −0.35 0.018 0.30 3� C2 1s→2�* �4b1� 2�* �4b1� 142+0.37 3� C2 1s→2�* �4b1� 3p�
A2 290.53 0.99 0.000c 0.98 C1 1s→4d� 576A� 290.73 −0.74 0.027 0.24 3� C2 1s→2�* �4b1� 2�* �4b1� 166
+0.37 3� C2 1s→2�* �4b1� 3p�
B1 290.88 0.64 0.255 0.56 C1 1s→3�* �5b1� 103+0.20 2� C1 1s→1�* �2a2� 2�* �4b1�
B1 291.37 0.15 0.047 0.54 3� C1 1s→2�* �4b1� 2�* �4b1� 96+0.24 2� C1 1s→1�* �2a2� 2�* �4b1�
291.52 0.00 Ion C1
A1 291.56 −0.04 0.036 0.91 C1 1s→�* �CH� 159B2 291.80 −2.01 0.018 0.95 C4 1s→�* �C3H� 125B2 291.97 −0.44 0.033 0.93 C1 1s→�* �NH2� 121
aRelative intensity to the most intense band.bMain configuration of the CI wave function.cDipole-electric forbidden transition.dAbsolute calculated oscillator strengths �length gauge�: fL=0.0525.
C 1s AND N 1s CORE EXCITATION OF … PHYSICAL REVIEW A 75, 052719 �2007�
052719-9
ate continuum onsets are probably responsible for the largewidth of this band.
The F feature at 292.3 eV appears as a shoulder on bandG. It is above the C1 ionization threshold. In this energyregion there are several bands with rather small intensitiespredicted by the calculations, involving �* and shake-uptransitions. At higher energy as shown in Fig. 4 there are twobroad bands with maximum of intensity at 294.5 and 301 eValso reported previously and assigned to �* type excitation�Table V�. They are tentatively assigned to shape resonances�39�.
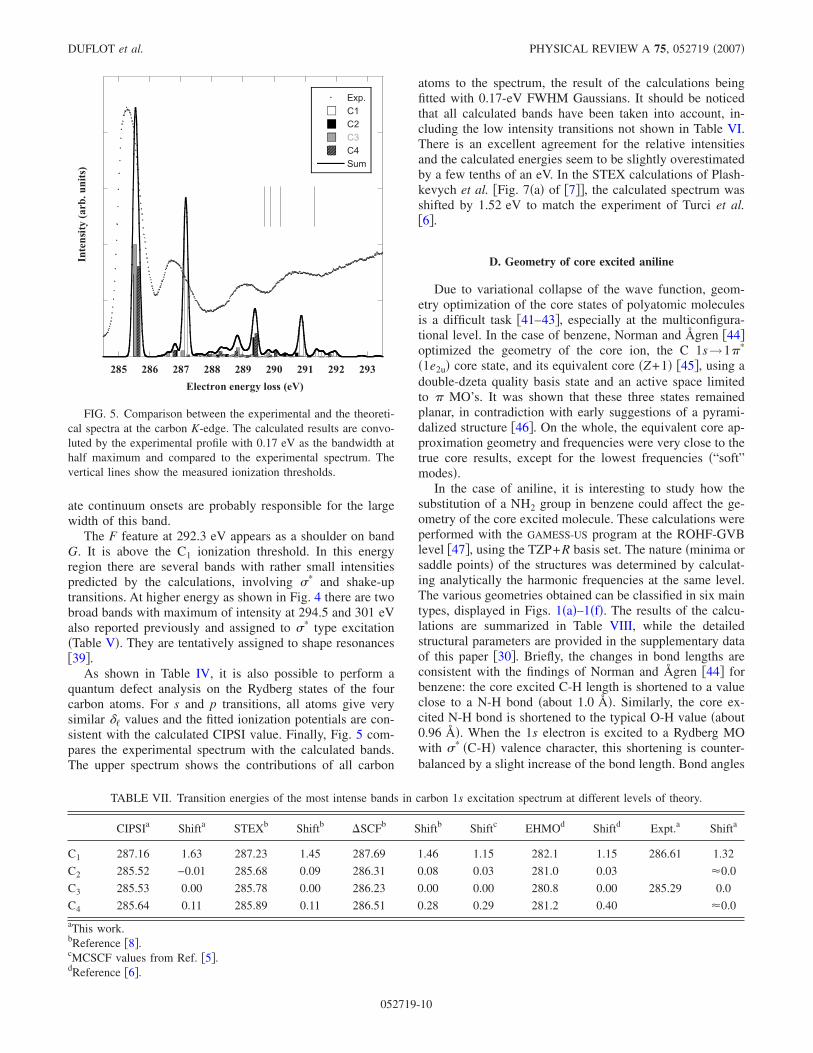
As shown in Table IV, it is also possible to perform aquantum defect analysis on the Rydberg states of the fourcarbon atoms. For s and p transitions, all atoms give verysimilar � values and the fitted ionization potentials are con-sistent with the calculated CIPSI value. Finally, Fig. 5 com-pares the experimental spectrum with the calculated bands.The upper spectrum shows the contributions of all carbon
atoms to the spectrum, the result of the calculations beingfitted with 0.17-eV FWHM Gaussians. It should be noticedthat all calculated bands have been taken into account, in-cluding the low intensity transitions not shown in Table VI.There is an excellent agreement for the relative intensitiesand the calculated energies seem to be slightly overestimatedby a few tenths of an eV. In the STEX calculations of Plash-kevych et al. �Fig. 7�a� of �7��, the calculated spectrum wasshifted by 1.52 eV to match the experiment of Turci et al.�6�.
D. Geometry of core excited aniline
Due to variational collapse of the wave function, geom-etry optimization of the core states of polyatomic moleculesis a difficult task �41–43�, especially at the multiconfigura-tional level. In the case of benzene, Norman and Ågren �44�optimized the geometry of the core ion, the C 1s→1�*
�1e2u� core state, and its equivalent core �Z+1� �45�, using adouble-dzeta quality basis state and an active space limitedto � MO’s. It was shown that these three states remainedplanar, in contradiction with early suggestions of a pyrami-dalized structure �46�. On the whole, the equivalent core ap-proximation geometry and frequencies were very close to thetrue core results, except for the lowest frequencies �“soft”modes�.
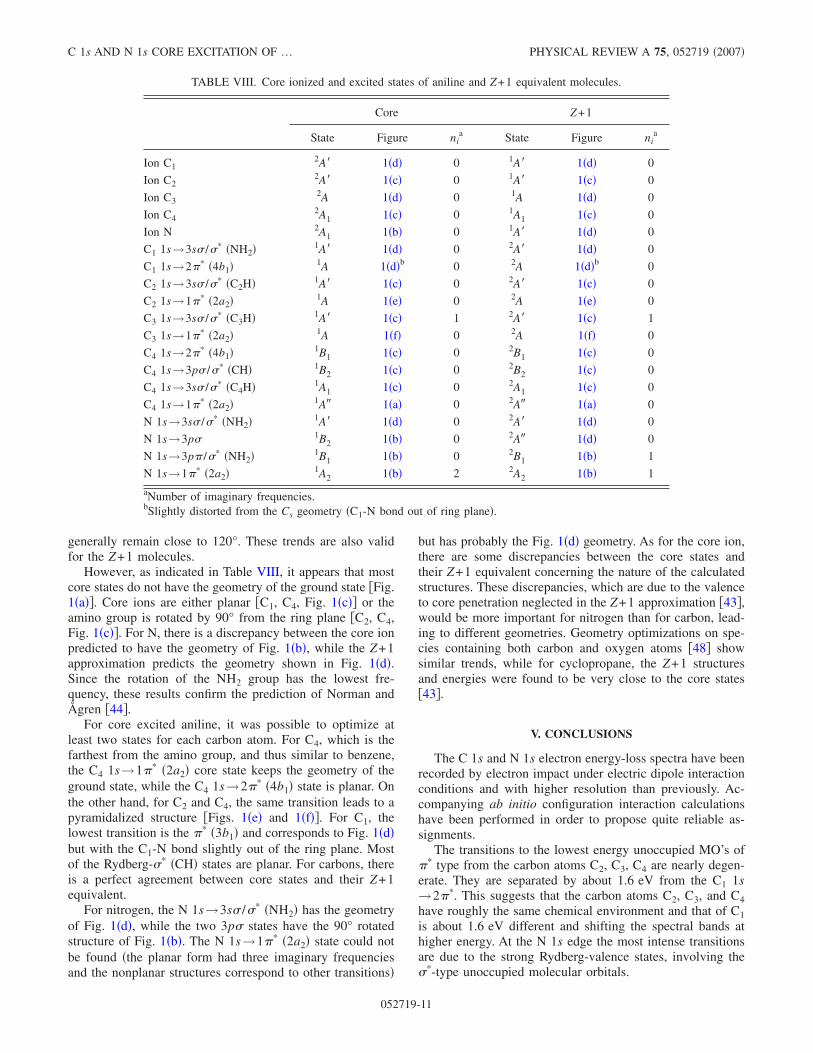
In the case of aniline, it is interesting to study how thesubstitution of a NH2 group in benzene could affect the ge-ometry of the core excited molecule. These calculations wereperformed with the GAMESS-US program at the ROHF-GVBlevel �47�, using the TZP+R basis set. The nature �minima orsaddle points� of the structures was determined by calculat-ing analytically the harmonic frequencies at the same level.The various geometries obtained can be classified in six maintypes, displayed in Figs. 1�a�–1�f�. The results of the calcu-lations are summarized in Table VIII, while the detailedstructural parameters are provided in the supplementary dataof this paper �30�. Briefly, the changes in bond lengths areconsistent with the findings of Norman and Ågren �44� forbenzene: the core excited C-H length is shortened to a valueclose to a N-H bond �about 1.0 Å�. Similarly, the core ex-cited N-H bond is shortened to the typical O-H value �about0.96 Å�. When the 1s electron is excited to a Rydberg MOwith �* �C-H� valence character, this shortening is counter-balanced by a slight increase of the bond length. Bond angles
TABLE VII. Transition energies of the most intense bands in carbon 1s excitation spectrum at different levels of theory.
CIPSIa Shifta STEXb Shiftb �SCFb Shiftb Shiftc EHMOd Shiftd Expt.a Shifta
C1 287.16 1.63 287.23 1.45 287.69 1.46 1.15 282.1 1.15 286.61 1.32
C2 285.52 −0.01 285.68 0.09 286.31 0.08 0.03 281.0 0.03 �0.0
C3 285.53 0.00 285.78 0.00 286.23 0.00 0.00 280.8 0.00 285.29 0.0
C4 285.64 0.11 285.89 0.11 286.51 0.28 0.29 281.2 0.40 �0.0
aThis work.bReference �8�.cMCSCF values from Ref. �5�.dReference �6�.
���������������
������
������
��������
������������
������
������ ���������������
��� ��� ��� ��������
��� ������������
���������������������������������������������������������������������������������������������������������������������������������������������������������������������������������������
������������
������������������
��� ������������������������������������������������������
��������
285 286 287 288 289 290 291 292 293
Exp.C1C2C3
�������������������������������������������������
C4Sum
Electron energy loss (eV)
Intensity(arb.units)
FIG. 5. Comparison between the experimental and the theoreti-cal spectra at the carbon K-edge. The calculated results are convo-luted by the experimental profile with 0.17 eV as the bandwidth athalf maximum and compared to the experimental spectrum. Thevertical lines show the measured ionization thresholds.
DUFLOT et al. PHYSICAL REVIEW A 75, 052719 �2007�
052719-10
generally remain close to 120°. These trends are also validfor the Z+1 molecules.
However, as indicated in Table VIII, it appears that mostcore states do not have the geometry of the ground state �Fig.1�a��. Core ions are either planar �C1, C4, Fig. 1�c�� or theamino group is rotated by 90° from the ring plane �C2, C4,Fig. 1�c��. For N, there is a discrepancy between the core ionpredicted to have the geometry of Fig. 1�b�, while the Z+1approximation predicts the geometry shown in Fig. 1�d�.Since the rotation of the NH2 group has the lowest fre-quency, these results confirm the prediction of Norman andÅgren �44�.
For core excited aniline, it was possible to optimize atleast two states for each carbon atom. For C4, which is thefarthest from the amino group, and thus similar to benzene,the C4 1s→1�* �2a2� core state keeps the geometry of theground state, while the C4 1s→2�* �4b1� state is planar. Onthe other hand, for C2 and C4, the same transition leads to apyramidalized structure �Figs. 1�e� and 1�f��. For C1, thelowest transition is the �* �3b1� and corresponds to Fig. 1�d�but with the C1-N bond slightly out of the ring plane. Mostof the Rydberg-�* �CH� states are planar. For carbons, thereis a perfect agreement between core states and their Z+1equivalent.
For nitrogen, the N 1s→3s� /�* �NH2� has the geometryof Fig. 1�d�, while the two 3p� states have the 90° rotatedstructure of Fig. 1�b�. The N 1s→1�* �2a2� state could notbe found �the planar form had three imaginary frequenciesand the nonplanar structures correspond to other transitions�
but has probably the Fig. 1�d� geometry. As for the core ion,there are some discrepancies between the core states andtheir Z+1 equivalent concerning the nature of the calculatedstructures. These discrepancies, which are due to the valenceto core penetration neglected in the Z+1 approximation �43�,would be more important for nitrogen than for carbon, lead-ing to different geometries. Geometry optimizations on spe-cies containing both carbon and oxygen atoms �48� showsimilar trends, while for cyclopropane, the Z+1 structuresand energies were found to be very close to the core states�43�.
V. CONCLUSIONS
The C 1s and N 1s electron energy-loss spectra have beenrecorded by electron impact under electric dipole interactionconditions and with higher resolution than previously. Ac-companying ab initio configuration interaction calculationshave been performed in order to propose quite reliable as-signments.
The transitions to the lowest energy unoccupied MO’s of�* type from the carbon atoms C2, C3, C4 are nearly degen-erate. They are separated by about 1.6 eV from the C1 1s→2�*. This suggests that the carbon atoms C2, C3, and C4have roughly the same chemical environment and that of C1is about 1.6 eV different and shifting the spectral bands athigher energy. At the N 1s edge the most intense transitionsare due to the strong Rydberg-valence states, involving the�*-type unoccupied molecular orbitals.
TABLE VIII. Core ionized and excited states of aniline and Z+1 equivalent molecules.
Core Z+1
State Figure nia State Figure ni
a
Ion C12A� 1�d� 0 1A� 1�d� 0
Ion C22A� 1�c� 0 1A� 1�c� 0
Ion C32A 1�d� 0 1A 1�d� 0
Ion C42A1 1�c� 0 1A1 1�c� 0
Ion N 2A1 1�b� 0 1A� 1�d� 0
C1 1s→3s� /�* �NH2� 1A� 1�d� 0 2A� 1�d� 0
C1 1s→2�* �4b1� 1A 1�d�b 0 2A 1�d�b 0
C2 1s→3s� /�* �C2H� 1A� 1�c� 0 2A� 1�c� 0
C2 1s→1�* �2a2� 1A 1�e� 0 2A 1�e� 0
C3 1s→3s� /�* �C3H� 1A� 1�c� 1 2A� 1�c� 1
C3 1s→1�* �2a2� 1A 1�f� 0 2A 1�f� 0
C4 1s→2�* �4b1� 1B1 1�c� 0 2B1 1�c� 0
C4 1s→3p� /�* �CH� 1B2 1�c� 0 2B2 1�c� 0
C4 1s→3s� /�* �C4H� 1A1 1�c� 0 2A1 1�c� 0
C4 1s→1�* �2a2� 1A� 1�a� 0 2A� 1�a� 0
N 1s→3s� /�* �NH2� 1A� 1�d� 0 2A� 1�d� 0
N 1s→3p� 1B2 1�b� 0 2A� 1�d� 0
N 1s→3p� /�* �NH2� 1B1 1�b� 0 2B1 1�b� 1
N 1s→1�* �2a2� 1A2 1�b� 2 2A2 1�b� 1
aNumber of imaginary frequencies.bSlightly distorted from the Cs geometry �C1-N bond out of ring plane�.
C 1s AND N 1s CORE EXCITATION OF … PHYSICAL REVIEW A 75, 052719 �2007�
052719-11
Some discrepancies between the N 1s excited core statesand their Z+1 equivalent concerning the nature of their equi-librium geometries are observed. It is not the case for thecarbons for which there is an excellent agreement betweencore states and their Z+1 equivalent. These differences, be-ing due to the valence to core penetration neglected in theZ+1 approximation, seem to be more important for nitrogenthan for carbon.
ACKNOWLEDGMENTS
The Laboratoire de Physique des Lasers, Atomes et Molé-cules �PhLAM� is Unité Mixte de Recherche du CNRS. The
Centre d’Études et de Recherches Lasers et Applications�CERLA, FR CNRS 2416� is supported by the Ministèrechargé de la Recherche, the Région Nord/Pas-de-Calais, andthe Fonds Européen de Développement Économique des Ré-gions �FEDER�. Parts of the computations were carried outat the CRI �Centre de Ressources Informatiques�, on theIBM-SP computer that is supported by the Programme deCalcul Intensif et Parallèle of the Ministère chargé de la Re-cherche, the Région Nord/Pas-de-Calais, and the FEDER.This research has been supported by the Fonds National de laRecherche Scientifique and the Patrimoine of University ofLiège. The support of the COST action P9 “Radiation Dam-age in Biomolecular Systems” is also acknowledged.
�1� M. Magnuson et al., J. Chem. Phys. 111, 4756 �1999�.�2� N. E. Agbor et al., Sens. Actuators B 41, 137 �1997�.�3� J. L. Solomon, R. J. Madix, and J. Stohr, Surf. Sci. 255, 12
�1991�.�4� J. Stöhr, NEXAFS Spectroscopy �Springer-Verlag, Berlin,
1992�.�5� Y. Luo et al., Phys. Rev. A 52, 3730 �1995�.�6� C. C. Turci, S. G. Urquhart, and A. P. Hitchcock, Can. J.
Chem. 74, 851 �1996�.�7� O. Plashkevych et al., Chem. Phys. 222, 125 �1997�.�8� V. Carravetta, O. Plashkevych, and H. Ågren, Chem. Phys.
263, 231 �2001�.�9� C. Hannay et al., Meas. Sci. Technol. 6, 1140 �1995�.
�10� M.-J. Hubin-Franskin et al., J. Chem. Phys. 106, 35 �1997�.�11� M.-J. Hubin-Franskin and J. Heinesch, Nucl. Instrum. Methods
Phys. Res. A 477, 546 �2002�.�12� R. N. S. Sodhi and C. E. Brion, J. Electron Spectrosc. Relat.
Phenom. 34, 363 �1984�.�13� D. Duflot et al., J. Chem. Phys. 118, 1137 �2003�.�14� S. Bodeur, P. Millié, and I. Nenner, Phys. Rev. A 41, 252
�1990�.�15� M. W. Schmidt et al., J. Comput. Chem. 14, 1347 �1993�.�16� B. Huron, J. P. Malrieu, and P. Rancurel, J. Chem. Phys. 58,
5745 �1973�.�17� R. Cimiraglia, J. Chem. Phys. 83, 1746 �1985�.�18� C. Angeli et al., Theor. Chem. Acc. 98, 57 �1997�.�19� T. H. Dunning, Jr., J. Chem. Phys. 55, 716 �1971�.�20� T. H. Dunning, Jr. and P. J. Hay, in Methods of Electronic
Structure Theory, edited by H. F. Schaefer III �Plenum Press,New York, 1977�, Vol. 3, p. 1.
�21� D. G. Lister and J. K. Tyler, Chem. Commun. �London� 6, 152�1966�.
�22� D. G. Lister et al., J. Mol. Struct. 23, 253 �1974�.�23� N. W. Larsen, E. L. Hansen, and F. M. Nicolaisen, Chem.
Phys. Lett. 43, 584 �1976�.�24� M. Quack and M. Stockburger, J. Mol. Spectrosc. 43, 87
�1972�.�25� J. Pyka and M. Kreglewski, J. Mol. Spectrosc. 109, 207
�1985�.�26� O. Bludský et al., J. Chem. Phys. 105, 11042 �1996�.�27� M. Alcolea Palafox, J. L. Nunez, and M. Gil, J. Mol. Struct.:
THEOCHEM 593, 101 �2002�.�28� Y. Honda et al., J. Chem. Phys. 117, 2045 �2002�.�29� P. M. Wojciechowski, W. Zierkiewicz, and D. Michalska, J.
Chem. Phys. 118, 10900 �2003�.�30� See EPAPS Document No. E-PLRAAN-75-069704 for de-
tailed structural and energy information on the ground, coreion, and core excited states of aniline. For more information onEPAPS, see http://www.aip.org/pubservs/epaps.html
�31� T. Ohta, T. Fujikawa, and H. Kuroda, Bull. Chem. Soc. Jpn.48, 2017 �1975�.
�32� T. D. Crawford, H. F. Schaefer III, and T. J. Lee, J. Chem.Phys. 105, 1060 �1996�.
�33� P. J. Knowles et al., Chem. Phys. Lett. 186, 130 �1991�.�34� W. J. Lauderdale et al. Chem. Phys. Lett. 187, 21 �1991�.�35� T. J. Lee et al. J. Chem. Phys. 100, 7400 �1994�.�36� T. J. Lee and D. Jayatilaka, Chem. Phys. Lett. 201, 1 �1993�.�37� E. Shigemasa et al., Phys. Rev. A 66, 022508 �2002�.�38� P.-O. Löwdin, Phys. Rev. 97, 1474 �1955�.�39� M. N. Piancastelli, J. Electron Spectrosc. Relat. Phenom. 100,
167 �1999�.�40� D. Duflot et al., Eur. Phys. J. D 35, 239 �2005�.�41� S. Shirai, S. Yamamoto, and S.-a. Hyodo, J. Chem. Phys. 121,
7586 �2004�.�42� A. B. Trofimov et al., J. Chem. Phys. 113, 6716 �2000�.�43� D. Duflot, S. Zeggari, and J.-P. Flament, Chem. Phys. 327,
518 �2006�.�44� P. Norman and H. Ågren, J. Mol. Struct.: THEOCHEM 401,
107 �1997�.�45� W. L. Jolly and D. N. Hendrickson, J. Am. Chem. Soc. 92,
1863 �1970�.�46� Y. Ma et al., Phys. Rev. Lett. 63, 2044 �1989�.�47� G. Chaban, M. W. Schmidt, and M. S. Gordon, Theor. Chem.
Acc. 97, 88 �1997�.�48� D. Duflot et al. �unpublished�.
DUFLOT et al. PHYSICAL REVIEW A 75, 052719 �2007�
052719-12
Copyright © 2022 FDOKUMEN