Ab initio calculations of the CaF2 electronic structure and F centers
10
See discussions, stats, and author profiles for this publication at: http://www.researchgate.net/publication/235477650 Ab initio calculations of the CaF_ {2} electronic structure and F centers ARTICLE in PHYSICAL REVIEW B · JULY 2005 Impact Factor: 3.74 · DOI: 10.1103/PhysRevB.72.045109 CITATIONS 47 DOWNLOADS 163 VIEWS 98 3 AUTHORS, INCLUDING: H. Shi Universität Osnabrück 28 PUBLICATIONS 276 CITATIONS SEE PROFILE Roberts Eglitis University of Latvia 155 PUBLICATIONS 1,824 CITATIONS SEE PROFILE Available from: Roberts Eglitis Retrieved on: 15 July 2015
Transcript of Ab initio calculations of the CaF2 electronic structure and F centers
Seediscussions,stats,andauthorprofilesforthispublicationat:http://www.researchgate.net/publication/235477650
AbinitiocalculationsoftheCaF_{2}electronicstructureandFcenters
ARTICLEinPHYSICALREVIEWB·JULY2005
ImpactFactor:3.74·DOI:10.1103/PhysRevB.72.045109
CITATIONS
47
DOWNLOADS
163
VIEWS
98
3AUTHORS,INCLUDING:
H.Shi
UniversitätOsnabrück
28PUBLICATIONS276CITATIONS
SEEPROFILE
RobertsEglitis
UniversityofLatvia
155PUBLICATIONS1,824CITATIONS
SEEPROFILE
Availablefrom:RobertsEglitis
Retrievedon:15July2015
Ab initio calculations of the CaF2 electronic structure and F centers
H. Shi, R. I. Eglitis, and G. BorstelFachbereich Physik, Universität Osnabrück, D-49069 Osnabrück, Germany
�Received 18 November 2004; published 7 July 2005�
We present and discuss the results of calculations of the CaF2 bulk and surface electronic structure. Theseare based on the ab initio Hartree-Fock method with electron correlation corrections and on density-functionaltheory calculations with different exchange-correlation functionals, including hybrid exchange techniques.Both approaches use the localized Gaussian-type basis set. According to our calculations the ab initio Hartree-Fock method considerably overestimates �20.77 eV� the optical band gap, whereas the density-functionalcalculations based on the Kohn-Sham equation with a number of exchange-correlation functionals, includinglocal-density approximation �8.72 eV�, generalized gradient approximations by Perdew and Wang �8.51 eV�,and Perdew, Burke, and Ernzerhof �8.45 eV� underestimate it. Our results show that the best agreement withexperiment �12.1 eV� can be obtained using a hybrid Hartree-Fock and density-functional theory exchangefunctional, in which Hartree-Fock exchange is mixed with density-functional theory exchange functionals,using Beckes three-parameter method, combined with the nonlocal correlation functionals by Perdew andWang �10.96 eV�. We also present calculations of CaF2 �111�, �110�, and �100� surfaces. Our calculated surfaceenergies confirm that the CaF2 �111� surface is the most stable one, in agreement with the experiment. Thecharacterization of F centers in CaF2 is still a question of debate. In order to understand the behavior of thematerial with respect to its optical properties, we performed ab initio calculations to determine the electronicstructure, atomic geometry, and formation energy of F center in CaF2.
DOI: 10.1103/PhysRevB.72.045109 PACS number�s�: 71.15.Ap, 71.15.Mb, 68.35.Bs
I. INTRODUCTION
Considering the high technological importance of CaF2, itis not surprising, that during the last years, it has been thesubject of many experimental and theoretical studies.1–14
Fluorite CaF2 is a cubic Fm3m large-gap insulator. The unitcell includes three ions, one cation chosen as origin, and twoanions that are situated at � 1
4a , 14a , 1
4a� and � 34a , 3
4a , 34a�,
where a is the lattice constant. The experimental lattice con-stant for CaF2 is 5.4630 Å.15 Today, a large amount of ex-perimental information on CaF2 has been accumulated,6,16–18
which requires an interpretation from the standpoint of theband structure of this crystal. Experimentally, the direct bandgap is 12.1 eV5 and the indirect gap is estimated to be11.8 eV5.
The electronic structure of CaF2 has been recently calcu-lated from first principles and published by several researchgroups. In the beginning of the 1990s, Catti et al.9 performedan all-electron ab initio Hartree-Fock �HF� calculation forthe band structure of CaF2. The energy-gap width betweenvalence and conduction bands at the � point was about21 eV, considerably exceeding the experimental value.
From another side, it is well known that the local-densityand generalized-gradient approximations �GGA� to density-functional theory �DFT� systematically underestimate theband gap in semiconductors and insulators; an error of afactor 2 is typical. For example, in Ref. 4 the indirect bandgap �X→�� of 7.07 eV is underestimated with respect toexperiment as expected in a GGA-DFT calculation. A similarresult for the indirect band gap in CaF2 �6.53 eV� using thefirst-principles orthogonalized linear combination of atomicorbitals �OLCAO� method in the local-density approxima-tion �LDA� was obtained by Gan et al.7
Contemporary knowledge of defects in solids has helpedto create a field of technology, namely, defect engineering,which is aimed at manipulating the nature and concentrationof defects in a material so as to tune its properties in a de-sired manner or to generate different behavior. CaF2 couldbecome an important optical material if one could avoid or,at least, control the photoinduced defect formation, whichthus far in applications degrades its optical quality. There-fore, it is important to understand the nature of defects inCaF2.
Two intrinsic color centers have been observed in CaF2 byelectron spin-resonance techniques. One is the Vk, or self-trapped hole, whose resonance has been reported by Hayesand Twidell19 in x-rayed CaF2 at liquid-nitrogen tempera-tures �LNT�. The other is the F center, an electron trapped inan anion vacancy, whose resonance has been found byArends20 in additively colored crystals and correlated with anoptical absorption band at 3.3 eV.
To get a reliable basis for defect calculations, which re-quires a precise description of the optical band gap, we cal-culated the electronic structure of bulk CaF2 by means ofab initio calculations based on the HF and DFT methods. Wealso present, in a second part of the paper, theoretical inves-tigations for pure CaF2 �111�, �110�, and �100� surfaces.These calculations will form the basis for future defect cal-culations in the surface region of CaF2. In this work, byusing the first principles calculations, we determine the elec-tronic structure, atomic geometry, and formation energy ofthe F center in CaF2.
II. METHOD OF CALCULATIONS
All numerical calculations dealing with the CaF2 elec-tronic structure were performed by the CRYSTAL computer
PHYSICAL REVIEW B 72, 045109 �2005�
1098-0121/2005/72�4�/045109�9�/$23.00 ©2005 The American Physical Society045109-1
code.21 In our calculations we used several quite differentmethods: Hartree-Fock with different density functionaltheory �DFT� type a posteriori electron correlation correc-tions to the total energy,22 such as generalized gradient ap-proximation, Perdew-91 �HFPer91�, Lee-Yang-Parr�HFLYP�, and full-scale DFT calculations based on theKohn-Sham equations with a number of exchange-correlation functionals, including local density approxima-tion, GGA by Perdew and Wang �PW�, Perdew, Burke, andErnzernhof �PBE�, as well as Becke exchange functionalsusing Beckes three-parameter method, combined with thenonlocal correlation functionals by Perdew and Wang, asthose by Lee, Yang, and Parr �B3LYP�. The CRYSTAL codeuses the localized Gaussian-type basis set. In our calculationsfor CaF2 we applied the basis set developed by Catti et al.9
and used a modified conjugate gradient algorithm23,24 to op-timize the atomic coordinates and locate minima on thepotential-energy surface �PES�.
We performed band-structure calculations with 8�8�8=512 k points in the Brillouin zone �BZ�. The calculationthresholds N �i.e., the calculation of integrals with an accu-racy of 10−N� were chosen as a compromise between theaccuracy of the calculations and the large computational timefor large cells. They are 7, 8, 7, 7, and 14 for the Coulomboverlap, Coulomb penetration, exchange overlap, the first-exchange pseudo-overlap, and for the second-exchangepseudo-overlap, respectively.25 The convergence criteria forthe self-consistent field �SCF� energy and eigenvalues wereset to 10−10 and 10−12 a.u., respectively. An additional advan-tage of the CRYSTAL code is that it treats isolated two-dimensional �2D� slabs, without an artificial periodicity inthe z direction perpendicular to the surface, and thereby is avery convenient tool for modeling of CaF2 surfaces.
Unlike the �111� neutral surface, the problem in modelingthe �100� polar surface is that it consists of charged planesF-F or Ca. If one assumes fixed ionic charges F−, and Ca2+
�which is the case for shell model calculations�, then model-ing of the �100� surface exactly as would be obtained from aperfect-crystal cleavage leads either to an infinite macro-scopic dipole moment perpendicular to the surface, when theslab is terminated by planes of different kinds �F2 and Ca�, or
to an infinite charge, when it is terminated by the same typeof crystalline planes �F2-F2 or Ca-Ca�. It is known that suchcrystal terminations make the surface unstable.26,27 In realquantum-mechanical calculations for a finite-thickness slabterminated by the different kind of planes, the charge redis-tribution near the surface arising during the self-consistent-field procedure, could, in principle, compensate the macro-scopic dipole moment. On the other hand, in the calculationsof slabs terminated by similar planes, the charge neutralitycould be easily retained by setting in the computer input anappropriate number of electrons or just put the net charge ofthe unit cell to zero. However, careful studies26,28,29 demon-strate that these two options are energetically expensive withrespect to the dipole moment elimination via introduction ofvacancies. This is why in our calculations we removed halfthe F atoms from the F2-terminated CaF2 �100� surface.
To simulate F centers, we started with a 48-atom supercellwith one of the fluorine atoms removed. After the fluorineatom is removed, the atomic configuration of the surroundingatoms is reoptimized via a search of the total energy mini-mum as a function of the atomic displacements from theregular lattice sites.
In order to have an accurate description of the F center, abasis set has been added at the fluorine vacancy, correspond-ing to the ghost atom. For the ghost atom, we used the samebasis set as that used for the F− ions of the bulk CaF2.
III. RESULTS OF CALCULATIONS
A. CaF2 bulk electronic structure
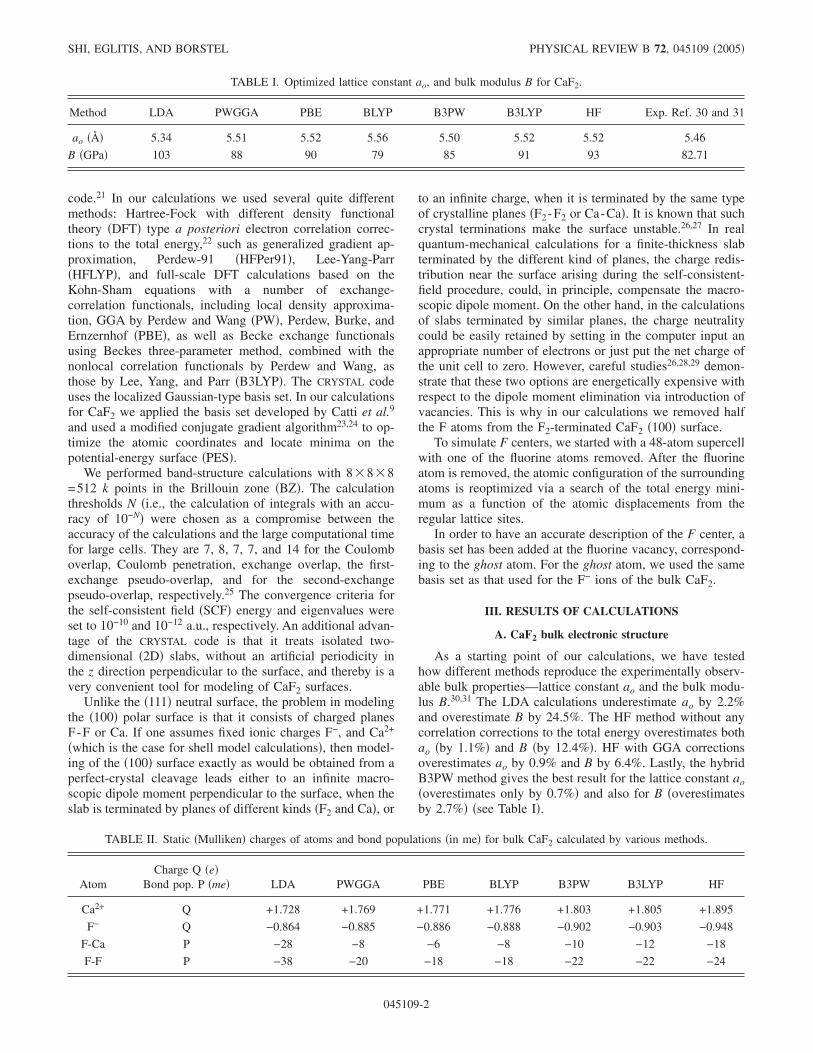
As a starting point of our calculations, we have testedhow different methods reproduce the experimentally observ-able bulk properties—lattice constant ao and the bulk modu-lus B.30,31 The LDA calculations underestimate ao by 2.2%and overestimate B by 24.5%. The HF method without anycorrelation corrections to the total energy overestimates bothao �by 1.1%� and B �by 12.4%�. HF with GGA correctionsoverestimates ao by 0.9% and B by 6.4%. Lastly, the hybridB3PW method gives the best result for the lattice constant ao�overestimates only by 0.7%� and also for B �overestimatesby 2.7%� �see Table I�.
TABLE I. Optimized lattice constant ao, and bulk modulus B for CaF2.
Method LDA PWGGA PBE BLYP B3PW B3LYP HF Exp. Ref. 30 and 31
ao �� 5.34 5.51 5.52 5.56 5.50 5.52 5.52 5.46
B �GPa� 103 88 90 79 85 91 93 82.71
TABLE II. Static �Mulliken� charges of atoms and bond populations �in me� for bulk CaF2 calculated by various methods.
AtomCharge Q �e�
Bond pop. P �me� LDA PWGGA PBE BLYP B3PW B3LYP HF
Ca2+ Q +1.728 +1.769 +1.771 +1.776 +1.803 +1.805 +1.895
F− Q −0.864 −0.885 −0.886 −0.888 −0.902 −0.903 −0.948
F-Ca P −28 −8 −6 −8 −10 −12 −18
F-F P −38 −20 −18 −18 −22 −22 −24
SHI, EGLITIS, AND BORSTEL PHYSICAL REVIEW B 72, 045109 �2005�
045109-2
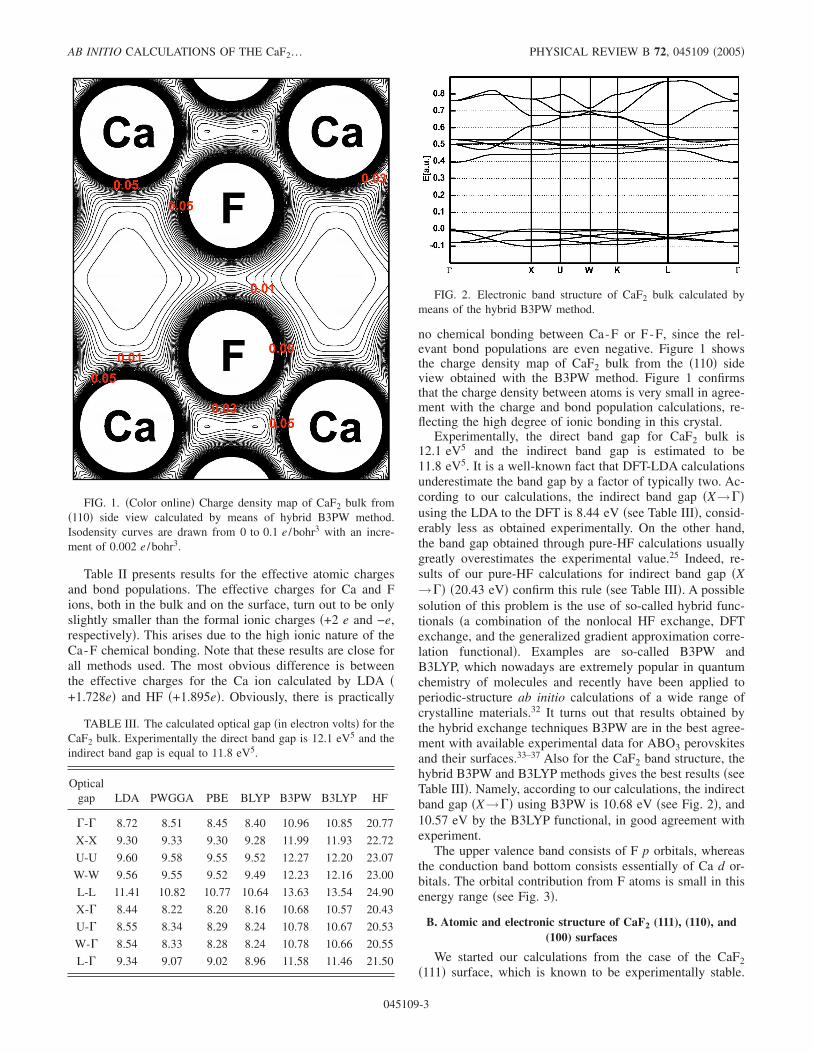
Table II presents results for the effective atomic chargesand bond populations. The effective charges for Ca and Fions, both in the bulk and on the surface, turn out to be onlyslightly smaller than the formal ionic charges �+2 e and −e,respectively�. This arises due to the high ionic nature of theCa-F chemical bonding. Note that these results are close forall methods used. The most obvious difference is betweenthe effective charges for the Ca ion calculated by LDA �+1.728e� and HF �+1.895e�. Obviously, there is practically
no chemical bonding between Ca-F or F-F, since the rel-evant bond populations are even negative. Figure 1 showsthe charge density map of CaF2 bulk from the �110� sideview obtained with the B3PW method. Figure 1 confirmsthat the charge density between atoms is very small in agree-ment with the charge and bond population calculations, re-flecting the high degree of ionic bonding in this crystal.
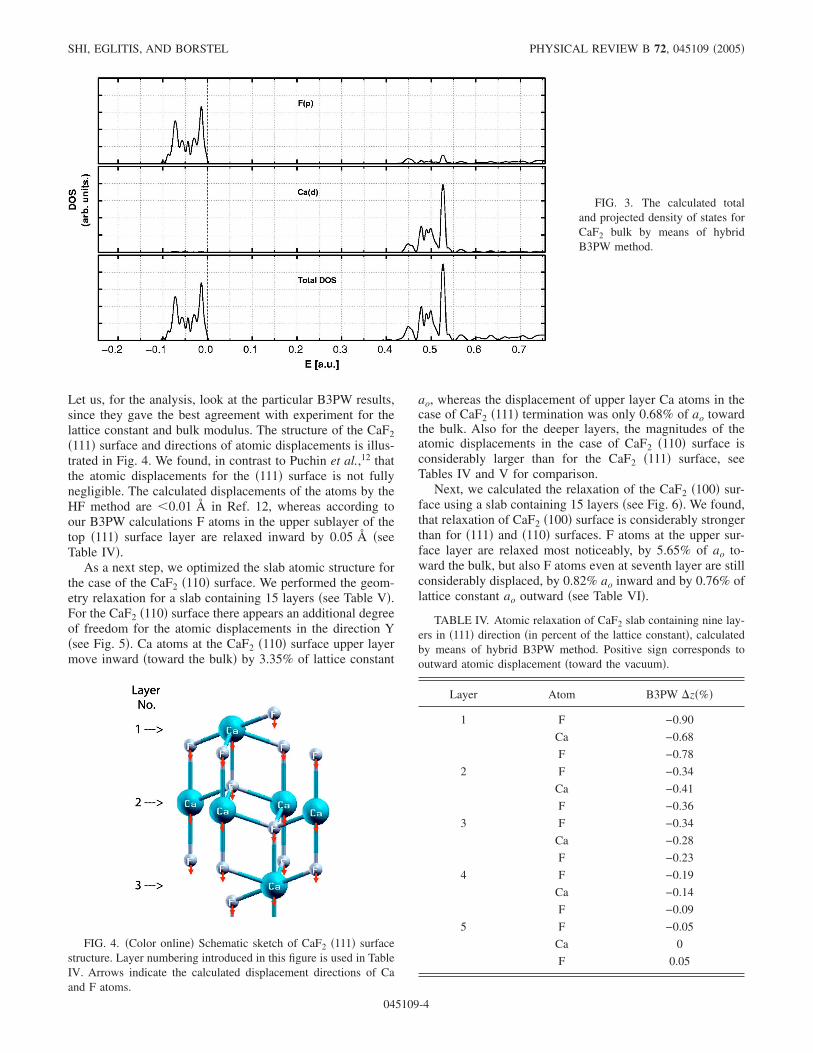
Experimentally, the direct band gap for CaF2 bulk is12.1 eV5 and the indirect band gap is estimated to be11.8 eV5. It is a well-known fact that DFT-LDA calculationsunderestimate the band gap by a factor of typically two. Ac-cording to our calculations, the indirect band gap �X→��using the LDA to the DFT is 8.44 eV �see Table III�, consid-erably less as obtained experimentally. On the other hand,the band gap obtained through pure-HF calculations usuallygreatly overestimates the experimental value.25 Indeed, re-sults of our pure-HF calculations for indirect band gap �X→�� �20.43 eV� confirm this rule �see Table III�. A possiblesolution of this problem is the use of so-called hybrid func-tionals �a combination of the nonlocal HF exchange, DFTexchange, and the generalized gradient approximation corre-lation functional�. Examples are so-called B3PW andB3LYP, which nowadays are extremely popular in quantumchemistry of molecules and recently have been applied toperiodic-structure ab initio calculations of a wide range ofcrystalline materials.32 It turns out that results obtained bythe hybrid exchange techniques B3PW are in the best agree-ment with available experimental data for ABO3 perovskitesand their surfaces.33–37 Also for the CaF2 band structure, thehybrid B3PW and B3LYP methods gives the best results �seeTable III�. Namely, according to our calculations, the indirectband gap �X→�� using B3PW is 10.68 eV �see Fig. 2�, and10.57 eV by the B3LYP functional, in good agreement withexperiment.
The upper valence band consists of F p orbitals, whereasthe conduction band bottom consists essentially of Ca d or-bitals. The orbital contribution from F atoms is small in thisenergy range �see Fig. 3�.
B. Atomic and electronic structure of CaF2 (111), (110), and(100) surfaces
We started our calculations from the case of the CaF2�111� surface, which is known to be experimentally stable.
TABLE III. The calculated optical gap �in electron volts� for theCaF2 bulk. Experimentally the direct band gap is 12.1 eV5 and theindirect band gap is equal to 11.8 eV5.
Opticalgap LDA PWGGA PBE BLYP B3PW B3LYP HF
�-� 8.72 8.51 8.45 8.40 10.96 10.85 20.77
X-X 9.30 9.33 9.30 9.28 11.99 11.93 22.72
U-U 9.60 9.58 9.55 9.52 12.27 12.20 23.07
W-W 9.56 9.55 9.52 9.49 12.23 12.16 23.00
L-L 11.41 10.82 10.77 10.64 13.63 13.54 24.90
X-� 8.44 8.22 8.20 8.16 10.68 10.57 20.43
U-� 8.55 8.34 8.29 8.24 10.78 10.67 20.53
W-� 8.54 8.33 8.28 8.24 10.78 10.66 20.55
L-� 9.34 9.07 9.02 8.96 11.58 11.46 21.50
FIG. 1. �Color online� Charge density map of CaF2 bulk from�110� side view calculated by means of hybrid B3PW method.Isodensity curves are drawn from 0 to 0.1 e /bohr3 with an incre-ment of 0.002 e /bohr3.
FIG. 2. Electronic band structure of CaF2 bulk calculated bymeans of the hybrid B3PW method.
AB INITIO CALCULATIONS OF THE CaF2… PHYSICAL REVIEW B 72, 045109 �2005�
045109-3
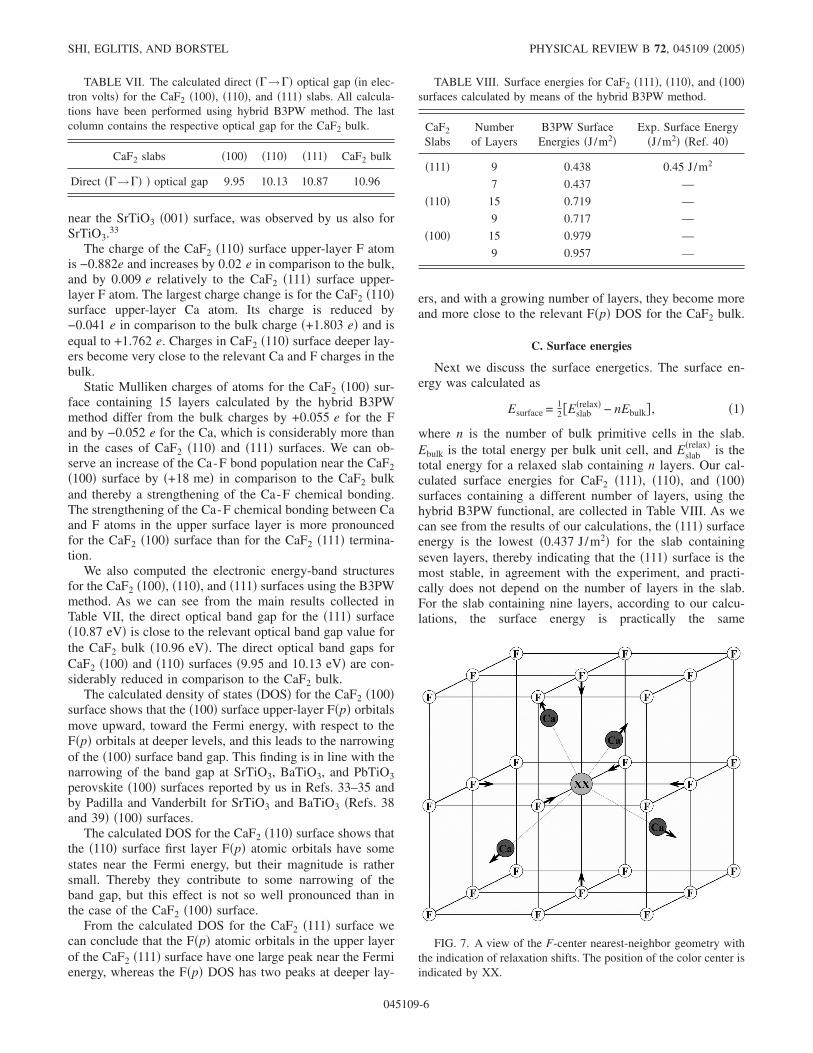
Let us, for the analysis, look at the particular B3PW results,since they gave the best agreement with experiment for thelattice constant and bulk modulus. The structure of the CaF2�111� surface and directions of atomic displacements is illus-trated in Fig. 4. We found, in contrast to Puchin et al.,12 thatthe atomic displacements for the �111� surface is not fullynegligible. The calculated displacements of the atoms by theHF method are �0.01 Å in Ref. 12, whereas according toour B3PW calculations F atoms in the upper sublayer of thetop �111� surface layer are relaxed inward by 0.05 Å �seeTable IV�.
As a next step, we optimized the slab atomic structure forthe case of the CaF2 �110� surface. We performed the geom-etry relaxation for a slab containing 15 layers �see Table V�.For the CaF2 �110� surface there appears an additional degreeof freedom for the atomic displacements in the direction Y�see Fig. 5�. Ca atoms at the CaF2 �110� surface upper layermove inward �toward the bulk� by 3.35% of lattice constant
ao, whereas the displacement of upper layer Ca atoms in thecase of CaF2 �111� termination was only 0.68% of ao towardthe bulk. Also for the deeper layers, the magnitudes of theatomic displacements in the case of CaF2 �110� surface isconsiderably larger than for the CaF2 �111� surface, seeTables IV and V for comparison.
Next, we calculated the relaxation of the CaF2 �100� sur-face using a slab containing 15 layers �see Fig. 6�. We found,that relaxation of CaF2 �100� surface is considerably strongerthan for �111� and �110� surfaces. F atoms at the upper sur-face layer are relaxed most noticeably, by 5.65% of ao to-ward the bulk, but also F atoms even at seventh layer are stillconsiderably displaced, by 0.82% ao inward and by 0.76% oflattice constant ao outward �see Table VI�.
TABLE IV. Atomic relaxation of CaF2 slab containing nine lay-ers in �111� direction �in percent of the lattice constant�, calculatedby means of hybrid B3PW method. Positive sign corresponds tooutward atomic displacement �toward the vacuum�.
Layer Atom B3PW �z�%�
1 F −0.90
Ca −0.68
F −0.78
2 F −0.34
Ca −0.41
F −0.36
3 F −0.34
Ca −0.28
F −0.23
4 F −0.19
Ca −0.14
F −0.09
5 F −0.05
Ca 0
F 0.05
FIG. 3. The calculated totaland projected density of states forCaF2 bulk by means of hybridB3PW method.
FIG. 4. �Color online� Schematic sketch of CaF2 �111� surfacestructure. Layer numbering introduced in this figure is used in TableIV. Arrows indicate the calculated displacement directions of Caand F atoms.
SHI, EGLITIS, AND BORSTEL PHYSICAL REVIEW B 72, 045109 �2005�
045109-4
The cation effective charges using the B3PW hybridmethod in two top CaF2 �111� surface layers �+1.797 e� and�+1.802 e� turn out to be smaller than in the bulk �+1.803 e�, whereas the F charges �−0.891 e� in the uppersublayer of the top surface layer is by 0.011 e larger than in the bulk �−0.902 e�. Changes in the atomic charges in the
deeper layers become very small. Bond population analysisbetween atoms for the CaF2 �111� surface shows that themajor effect observed here is a strengthening of the Ca-Fchemical bond near the surface. The bond population be-tween Ca and F atoms in the upper sublayer of the firstsurface layer by �+12 me� exceeds the respective bond popu-lation value between Ca and F atoms in the bulk. At deeperlayers of the CaF2 �111� surface, the bond population be-tween Ca and F atoms is practically the same as in the bulk.The similar effect, strengthening of the Ti-O chemical bond
TABLE V. Atomic relaxation of CaF2 slab containing 15 layersin �110� direction, calculated by means of hybrid B3PW method.�Y is the relative displacement �in percents of ao� between two Fatoms. Negative sign means the shortening of the F-F distance.
Layer AtomB3PW�y�%�
B3PW�z�%�
1 F +3.21 −0.87
Ca 0 −3.35
2 F −0.14 −0.83
Ca 0 +0.80
3 F +0.08 −0.26
Ca 0 −0.88
4 F −0.03 −0.40
Ca 0 −0.13
5 F +0.03 −0.22
Ca 0 −0.33
6 F −0.03 −0.18
Ca 0 −0.13
7 F +0.03 −0.08
Ca 0 −0.09
TABLE VI. Atomic relaxation of CaF2 slab containing 15 layersin �100� direction �in percent of the lattice constant�, calculated bymeans of the hybrid B3PW method. Positive sign corresponds tooutward atomic displacement �toward the vacuum�.
Layer Atom B3PW�z�%�
1 F −5.63
2 Ca +0.34
3 F −3.20
F +4.03
4 Ca −0.03
5 F +1.49
F −1.53
6 Ca −0.07
7 F −0.82
F +0.76
FIG. 5. �Color online� Schematic sketch of CaF2 �110� surfacestructure. For CaF2 surface there appears an additional degree offreedom in the Y direction for atomic displacements. Arrows indi-cate the calculated displacement directions of Ca and F atoms.
FIG. 6. �Color online� Schematic sketch of CaF2 �100� surfacestructure. Layer numbering introduced in this figure is used in TableVI. Arrows indicate the calculated displacement directions of Caand F atoms.
AB INITIO CALCULATIONS OF THE CaF2… PHYSICAL REVIEW B 72, 045109 �2005�
045109-5
near the SrTiO3 �001� surface, was observed by us also forSrTiO3.33
The charge of the CaF2 �110� surface upper-layer F atomis −0.882e and increases by 0.02 e in comparison to the bulk,and by 0.009 e relatively to the CaF2 �111� surface upper-layer F atom. The largest charge change is for the CaF2 �110�surface upper-layer Ca atom. Its charge is reduced by−0.041 e in comparison to the bulk charge �+1.803 e� and isequal to +1.762 e. Charges in CaF2 �110� surface deeper lay-ers become very close to the relevant Ca and F charges in thebulk.
Static Mulliken charges of atoms for the CaF2 �100� sur-face containing 15 layers calculated by the hybrid B3PWmethod differ from the bulk charges by +0.055 e for the Fand by −0.052 e for the Ca, which is considerably more thanin the cases of CaF2 �110� and �111� surfaces. We can ob-serve an increase of the Ca-F bond population near the CaF2�100� surface by �+18 me� in comparison to the CaF2 bulkand thereby a strengthening of the Ca-F chemical bonding.The strengthening of the Ca-F chemical bonding between Caand F atoms in the upper surface layer is more pronouncedfor the CaF2 �100� surface than for the CaF2 �111� termina-tion.
We also computed the electronic energy-band structuresfor the CaF2 �100�, �110�, and �111� surfaces using the B3PWmethod. As we can see from the main results collected inTable VII, the direct optical band gap for the �111� surface�10.87 eV� is close to the relevant optical band gap value forthe CaF2 bulk �10.96 eV�. The direct optical band gaps forCaF2 �100� and �110� surfaces �9.95 and 10.13 eV� are con-siderably reduced in comparison to the CaF2 bulk.
The calculated density of states �DOS� for the CaF2 �100�surface shows that the �100� surface upper-layer F�p� orbitalsmove upward, toward the Fermi energy, with respect to theF�p� orbitals at deeper levels, and this leads to the narrowingof the �100� surface band gap. This finding is in line with thenarrowing of the band gap at SrTiO3, BaTiO3, and PbTiO3perovskite �100� surfaces reported by us in Refs. 33–35 andby Padilla and Vanderbilt for SrTiO3 and BaTiO3 �Refs. 38and 39� �100� surfaces.
The calculated DOS for the CaF2 �110� surface shows thatthe �110� surface first layer F�p� atomic orbitals have somestates near the Fermi energy, but their magnitude is rathersmall. Thereby they contribute to some narrowing of theband gap, but this effect is not so well pronounced than inthe case of the CaF2 �100� surface.
From the calculated DOS for the CaF2 �111� surface wecan conclude that the F�p� atomic orbitals in the upper layerof the CaF2 �111� surface have one large peak near the Fermienergy, whereas the F�p� DOS has two peaks at deeper lay-
ers, and with a growing number of layers, they become moreand more close to the relevant F�p� DOS for the CaF2 bulk.
C. Surface energies
Next we discuss the surface energetics. The surface en-ergy was calculated as
Esurface = 12 �Eslab
�relax� − nEbulk� , �1�
where n is the number of bulk primitive cells in the slab.Ebulk is the total energy per bulk unit cell, and Eslab
�relax� is thetotal energy for a relaxed slab containing n layers. Our cal-culated surface energies for CaF2 �111�, �110�, and �100�surfaces containing a different number of layers, using thehybrid B3PW functional, are collected in Table VIII. As wecan see from the results of our calculations, the �111� surfaceenergy is the lowest �0.437 J /m2� for the slab containingseven layers, thereby indicating that the �111� surface is themost stable, in agreement with the experiment, and practi-cally does not depend on the number of layers in the slab.For the slab containing nine layers, according to our calcu-lations, the surface energy is practically the same
TABLE VII. The calculated direct ��→�� optical gap �in elec-tron volts� for the CaF2 �100�, �110�, and �111� slabs. All calcula-tions have been performed using hybrid B3PW method. The lastcolumn contains the respective optical gap for the CaF2 bulk.
CaF2 slabs �100� �110� �111� CaF2 bulk
Direct ��→�� � optical gap 9.95 10.13 10.87 10.96
TABLE VIII. Surface energies for CaF2 �111�, �110�, and �100�surfaces calculated by means of the hybrid B3PW method.
CaF2
SlabsNumber
of LayersB3PW Surface
Energies �J /m2�Exp. Surface Energy
�J /m2� �Ref. 40�
�111� 9 0.438 0.45 J /m2
7 0.437 —
�110� 15 0.719 —
9 0.717 —
�100� 15 0.979 —
9 0.957 —
FIG. 7. A view of the F-center nearest-neighbor geometry withthe indication of relaxation shifts. The position of the color center isindicated by XX.
SHI, EGLITIS, AND BORSTEL PHYSICAL REVIEW B 72, 045109 �2005�
045109-6
�0.438 J /m2�. The calculated �111� surface energy is close tothe �111� surface energy calculated earlier by Puchin et al.,12
using the ab initio Hartree-Fock method, and is in goodagreement with the only experimental estimation to ourknowledge available �0.45 J /m2�.40
Our calculated surface energy for the �110� surface is con-siderably larger �0.719 J /m2� than for the �111� surface. Fi-nally, our calculations show that the surface energy for the�100� surface is the largest one �0.979 J /m2� and also agreesqualitatively with the only previous ab initio �HF� calcula-tion mentioned in Ref. 12 �1.189 J /m2�.
D. F center in CaF2
To estimate the formation energy of the fluorine vacancyin CaF2 crystal, we used the following expression:
Eform�F� = E�Fluorine� + E�F� − E�perfect� , �2�
where E�Fluorine� is the energy for the isolated fluorineatom, E�F� and E�perfect� the energies of the defective crys-tal containing the F center �see Fig. 7� and the perfect crys-tal, respectively. The fluorine vacancy formation energy, cal-culated using the B3PW method, going from the 12 atomicsupercells to 48 atomic supercells, as shown in Table IX, isreduced only by 0.01 eV and equals to 7.87 eV for the su-percell containing 48 atoms.
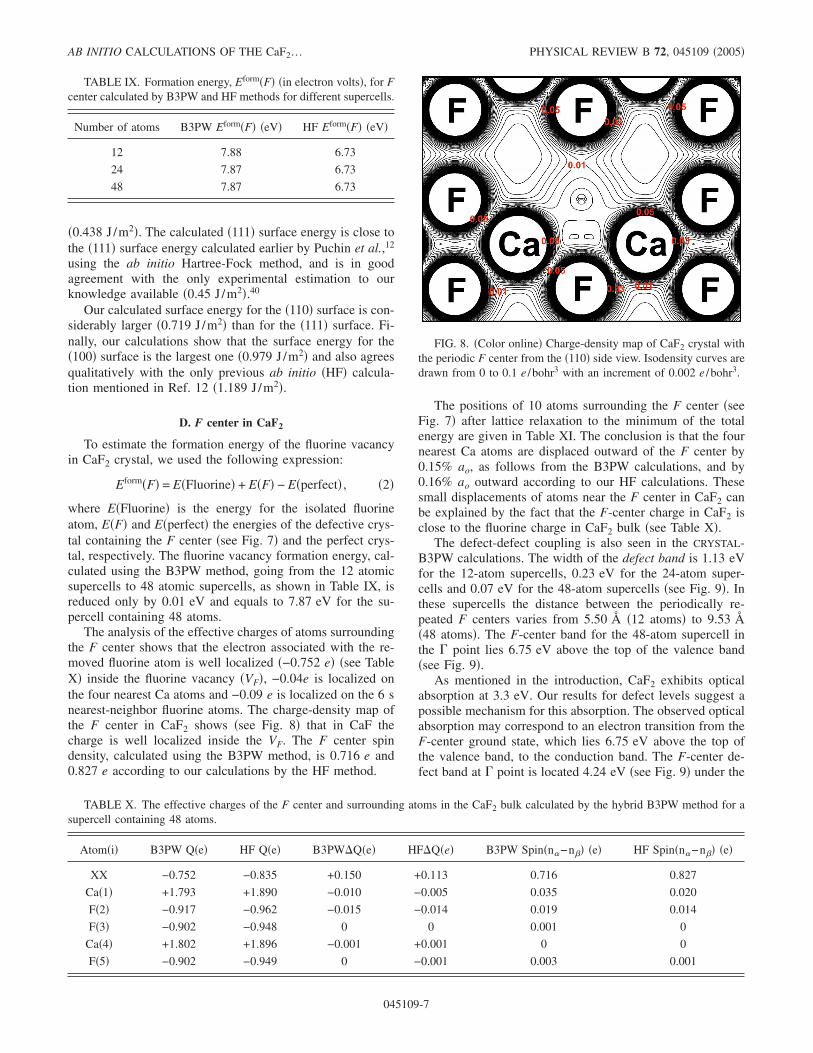
The analysis of the effective charges of atoms surroundingthe F center shows that the electron associated with the re-moved fluorine atom is well localized �−0.752 e� �see TableX� inside the fluorine vacancy �VF�, −0.04e is localized onthe four nearest Ca atoms and −0.09 e is localized on the 6 snearest-neighbor fluorine atoms. The charge-density map ofthe F center in CaF2 shows �see Fig. 8� that in CaF thecharge is well localized inside the VF. The F center spindensity, calculated using the B3PW method, is 0.716 e and0.827 e according to our calculations by the HF method.
The positions of 10 atoms surrounding the F center �seeFig. 7� after lattice relaxation to the minimum of the totalenergy are given in Table XI. The conclusion is that the fournearest Ca atoms are displaced outward of the F center by0.15% ao, as follows from the B3PW calculations, and by0.16% ao outward according to our HF calculations. Thesesmall displacements of atoms near the F center in CaF2 canbe explained by the fact that the F-center charge in CaF2 isclose to the fluorine charge in CaF2 bulk �see Table X�.
The defect-defect coupling is also seen in the CRYSTAL-B3PW calculations. The width of the defect band is 1.13 eVfor the 12-atom supercells, 0.23 eV for the 24-atom super-cells and 0.07 eV for the 48-atom supercells �see Fig. 9�. Inthese supercells the distance between the periodically re-peated F centers varies from 5.50 Š�12 atoms� to 9.53 �48 atoms�. The F-center band for the 48-atom supercell inthe � point lies 6.75 eV above the top of the valence band�see Fig. 9�.
As mentioned in the introduction, CaF2 exhibits opticalabsorption at 3.3 eV. Our results for defect levels suggest apossible mechanism for this absorption. The observed opticalabsorption may correspond to an electron transition from theF-center ground state, which lies 6.75 eV above the top ofthe valence band, to the conduction band. The F-center de-fect band at � point is located 4.24 eV �see Fig. 9� under the
TABLE IX. Formation energy, Eform�F� �in electron volts�, for Fcenter calculated by B3PW and HF methods for different supercells.
Number of atoms B3PW Eform�F� �eV� HF Eform�F� �eV�
12 7.88 6.73
24 7.87 6.73
48 7.87 6.73
TABLE X. The effective charges of the F center and surrounding atoms in the CaF2 bulk calculated by the hybrid B3PW method for asupercell containing 48 atoms.
Atom�i� B3PW Q�e� HF Q�e� B3PW�Q�e� HF�Q�e� B3PW Spin�n�−n�� �e� HF Spin�n�−n�� �e�
XX −0.752 −0.835 +0.150 +0.113 0.716 0.827
Ca�1� +1.793 +1.890 −0.010 −0.005 0.035 0.020
F�2� −0.917 −0.962 −0.015 −0.014 0.019 0.014
F�3� −0.902 −0.948 0 0 0.001 0
Ca�4� +1.802 +1.896 −0.001 +0.001 0 0
F�5� −0.902 −0.949 0 −0.001 0.003 0.001
FIG. 8. �Color online� Charge-density map of CaF2 crystal withthe periodic F center from the �110� side view. Isodensity curves aredrawn from 0 to 0.1 e /bohr3 with an increment of 0.002 e /bohr3.
AB INITIO CALCULATIONS OF THE CaF2… PHYSICAL REVIEW B 72, 045109 �2005�
045109-7
conduction band, which is close to the experimentally ob-served absorption energy of 3.3 eV.
IV. CONCLUSIONS
Summing up, a comparison of ab initio HF and DFT cal-culations employing different exchange-correlation function-als clearly demonstrates that the best agreement with experi-ment for the lattice constant, bulk modulus, as well as theband structure is possible to achieve by the hybrid B3PWfunctional. According to our calculations, the direct band gapfor CaF2 bulk �10.96 eV� is narrowed for the �111��10.87 eV�, �110� �10.13 eV�, and �100� �9.95 eV� surfaces.The CaF2 �111� surface energy, according to our calculations,is the smallest one �0.437 J /m2�, indicating that the �111�surface is the most stable, in good agreement with the avail-able experimental result.
The characterization of native point defects in CaF2 hasimportant technological implications. In this work, we ap-plied a first-principles approach to the calculations of F cen-ters in CaF2. We found, that the vacancy formation energy inCaF2 is 7.87 eV. The charge-density map of the F center in
CaF2 shows, that the charge is well localized inside the VO.The F-center spin density, calculated using the B3PWmethod, is 0.716e. The relaxation of atoms surrounding the Fcenter, according to our calculations, is small. Our results forF-center defect levels suggests a possible mechanism for ex-planation of the optical absorption observed experimentallyin CaF2 at 3.3 eV.
ACKNOWLEDGMENTS
The present work was supported by NATO CLG 980378Grant and Deutsche Forschungsgemeinschaft �DFG�. Theauthors are indebted to Professor M. Reichling for fruitfuldiscussions.
1 K. Schmalzl, D. Strauch, and H. Schober, Phys. Rev. B 68,144301 �2003�.
2 N. H. de Leeuw and T. G. Cooper, J. Mater. Chem. 13, 93 �2003�.3 N. H. de Leeuw, J. A. Purton, S. C. Parker, G. W. Watson, and G.
Kresse, Surf. Sci. 452, 9 �2000�.4 M. Verstraete and X. Gonze, Phys. Rev. B 68, 195123 �2003�.5 G. W. Rubloff, Phys. Rev. B 5, 662 �1972�.6 J. Barth, R. L. Johnson, M. Cardona, D. Fuchs, and A. M. Brad-
shaw, Phys. Rev. B 41, R3291 �1990�.7 F. Gan, Y. N. Xu, M. Z. Huang, W. Y. Ching, and J. G. Harrison,
Phys. Rev. B 45, 8248 �1992�.8 W. Y. Ching, F. Gan, and M. Z. Huang, Phys. Rev. B 52, 1596
�1995�.9 M. Catti, R. Dovesi, A. Pavese, and V. R. Saunders, J. Phys.:
Condens. Matter 3, 4151 �1991�.10 A. S. Foster, C. Barth, A. L. Shluger, R. M. Nieminen, and M.
Reichling, Phys. Rev. B 66, 235417 �2002�.11 A. Jockisch, U. Schröder, F. W. Wette, and W. Kress, J. Phys.:
Condens. Matter 5, 5401 �1993�.12 V. E. Puchin, A. V. Puchina, M. Huisinga, and M. Reichling, J.
Phys.: Condens. Matter 13, 2081 �2001�.13 M. Merawa, M. Lunell, R. Orlando, M. Gelize-Duvignau, and R.
Dovesi, Chem. Phys. Lett. 368, 7 �2003�.14 A. V. Puchina, V. E. Puchin, E. A. Kotomin, and M. Reichling,
Solid State Commun. 106, 285 �1998�.15 R. W. G. Wyckoff, Crystal Structures, 9th Ed. �Interscience/John
Wiley, New York, 1963�, Vol. 1.16 P. Camy, J. L. Doualan, S. Renard, A. Braud, V. Menard, and R.
Moncorge, Opt. Commun. 236, 395 �2004�.17 G. A. Kumar, R. Riman, S. C. Chae, Y. N. Jang, I. K. Bae, and H.
S. Moon, J. Appl. Phys. 95, 3243 �2004�.18 T. Tsujibayashi, K. Toyoda, S. Sakuragi, M. Kamada, and M.
Itoh, Appl. Phys. Lett. 80, 2883 �2002�.19 W. Hayes and J. W. Twidell, Proc. Phys. Soc. London 79, 1295
�1962�.20 J. Arends, Phys. Status Solidi 7, 805 �1964�.21 V. R. Saunders, R. Dovesi, C. Roetti, M. Causa, N. M. Harrison,
R. Orland, and C. M. Zicovich-Wilson, CRYSTAL-2003 UserManual �University of Torino, Italy, 2003�.
22 M. Causa and A. Zupan, Chem. Phys. Lett. 220, 145 �1994�.23 H. B. Schlegel, J. Comput. Chem. 3, 214 �1982�.24 B. Civalleri, P. D’Arco, R. Orlando, V. R. Saunders, and R.
Dovesi, Chem. Phys. Lett. 348, 131 �2001�.25 C. Pisani �ed.�, Quantum-Mechanical Ab initio Calculations of
the Properties of Crystalline Materials, Lecture Notes in Chem-istry, Vol. 67 �Springer, Berlin, 1996�.
26 C. Noguera, J. Phys.: Condens. Matter 12, R367 �2000�.27 P. W. Tasker, J. Phys. C 12, 4977 �1979�.
TABLE XI. Relaxation of 10 atoms surrounding the F centerplaced at the coordinate origin.
n-th nearest Atom Number B3PW�z�%� HF�z�%�
1 Ca 4 +0.15 +0.16
2 F 6 −0.28 −0.11
FIG. 9. Calculated band structure for the 48-atom supercellmodeling the F center.
SHI, EGLITIS, AND BORSTEL PHYSICAL REVIEW B 72, 045109 �2005�
045109-8
28 A. Pojani, F. Finocchi, and C. Noguera, Surf. Sci. 442, 179�1999�.
29 F. Bottin, F. Finocchi, and C. Noguera, Phys. Rev. B 68, 035418�2003�.
30 R. C. Weast �ed�, CRC Handbook of Chemistry and Physics �CRCPress, Boca Raton, 1976�.
31 M. Nicolav, J. Cryst. Growth 218, 62 �2000�.32 J. Muscat, A. Wander, and N. M. Harrison, Chem. Phys. Lett.
342, 397 �2001�.33 E. Heifets, R. I. Eglitis, E. A. Kotomin, J. Maier, and G. Borstel,
Phys. Rev. B 64, 235417 �2001�.
34 E. Heifets, R. I. Eglitis, E. A. Kotomin, J. Maier, and G. Borstel,Surf. Sci. 513, 211 �2002�.
35 R. I. Eglitis, S. Piskunov, E. Heifets, E. A. Kotomin, and G.Borstel, Ceram. Int. 30, 1989 �2004�.
36 S. Piskunov, E. A. Kotomin, E. Heifets, J. Maier, R. I. Eglitis, andG. Borstel, Surf. Sci. 575, 75 �2005�.
37 S. Piskunov, E. Heifets, R. I. Eglitis, and G. Borstel, Comput.Mater. Sci. 29, 165 �2004�.
38 J. Padilla and D. Vanderbilt, Surf. Sci. 418, 64 �1998�.39 J. Padilla and D. Vanderbilt, Phys. Rev. B 56, 1625 �1997�.40 J. J. Gilman, J. Appl. Phys. 31, 2208 �1960�.
AB INITIO CALCULATIONS OF THE CaF2… PHYSICAL REVIEW B 72, 045109 �2005�
045109-9