business strategies - Greenwich University
124
-
Upload
khangminh22 -
Category
Documents
-
view
0 -
download
0
Transcript of business strategies - Greenwich University

b
VOL.8, No.1, JUNE 2014 ISSN 1993–5765
JOURNAL OF
BUSINESSSTRATEGIES
KARACHI – PAKISTAN
w w w . g r e e n w i c h . p k
_____________________________________________________________________________________All rights reserved. No part of this publication may be reproduced in any form or by any
means without the prior permission of the publisher.
ii
Journal of Business Strategies Vol.8, No.1, June 2014
Notes for ContributorsGreenwich University, Karachi-Pakistan, publishes the Journal of Business Strategies(JBS) bi-annually. Contributions to the Journal may be the papers of original research inthe areas of Management Sciences and Information Studies, like business, management,marketing, banking, finance, computer sciences and information technology. The researchpapers submitted for publication in the Journal should not have been previously publishedor scheduled for publication in any other Journal.ManuscriptsJournal accepts research articles, book reviews and case studies written in English. Themanuscript should be written (double-spaced, with ample margins) on left side of the paperonly. Two copies of the manuscripts along with soft copy should be submitted. Authorsshould prepare their manuscripts according to the APA – Publication Manual (6th Ed). Allmanuscripts shall be preliminary evaluated by the editorial board and peer reviewed by theEvaluation Committee. Allow two months for publication decision and upto one year forpublication.TablesTables should be reduced to the simplest and must in no case be of a size or form that will notconveniently fit onto the Journal page size. Units of measurement should always be clearly stat-ed in the column headings; any dates relevant to the tabulated information should be stated in thetable title or in the appropriate column heading.IllustrationsFigures including both line drawings and photographs should be numbered consecutivelyin the order which are cited in the text. The approximate position of tables and figuresshould be indicated in the manuscript.UnitsUnit should follow the metric system. Yield or rate is expressed in metric tons/hectare orkg/hectare. Any reference to currency should be expressed in U.S. dollar or the equivalentto a local currency stated in a footnote.OffprintFree copies of the offprint will be given to each contributing author(s). Additional copiesmay be obtained on payment.CorrespondenceContribution and correspondence should be addressed to the Editor, Journal of BusinessStrategies: For sending soft copy use e-mail address <[email protected]> and forhard copy “Greenwich University, DK-10, 38 Street, Darakshan, Phase VI, Defense HousingAuthority, Karachi-75500”.
iii
Journal of Business Strategies
Patron
Ms. Seema MughalVice Chancellor
Greenwich UniversityKarachi, Pakistan
Editor-in-Chief
Prof. Dr. A.Q. MughalResearch Professor
Greenwich UniversityKarachi, Pakistan
EditorDr. Syed Arshad Imam
DirectorOffice of Research, Innovation and Commercialization (ORIC)
Greenwich UniversityKarachi, Pakistan
Assistant EditorSherbaz Khan
Research Coordinator ORICGreenwich University
Karachi, Pakistan
Designed & Composed byAbdul Kalam
Greenwich UniversityKarachi, Pakistan
Published Bi-Annually by Greenwich University, Karachi, PakistanGreenwich University, DK-10, 38 Street, Darakshan, Phase VI, DHA, Karachi-75500
Telephone: + 9221-3584-7662, 3584-7663, 3584-7664, UAN: 111-202-303ISSN: 1993-5765 Vol # 8(1): June 2014 pp: 1–110
Printed in Pakistan by Sardar Sons Printers, Pakistan Chowk, Karachi Tel: (021)32626984Disclaimer: Greenwich University or Editorial Board does not accept responsibility for the statements,
contents, opinions expressed or conclusion drawn by the contributors to the Journal of Business Strategies.
iv
EDITORIAL BOARD (INTERNATIONAL)Prof. Dr. Khalid Khawar Bhatti, Ankara University, Ankara, Turkey
Dr. Nazaraf H Shah, University of Essex, United Kingdom
Prof. Dr. Lawal Muhammad Anka, Educationist, Gusau Zamfara State, Nigeria
Dr. Nadeem Bhatti, North American College, Toronto, Canada
Prof. Dr. Zuraidah M. Zain, Universiti Malaysia Perlis (UniMap), Malaysia
Prof. Dató Wirs Dr M. Salleh Hi Din, Universiti Malaysia Perlis (UniMap), Malaysia
Prof. Rosni Bakar, Universiti Malaysia Perlis (UniMap), Malaysia
Prof. M. Murray Huntewr, Universiti Malaysia Perlis (UniMap), Malaysia
Prof. Rolley Pigot, University of New England, Armidale Australia
Prof. Dr. Afaq H. Rizvi, Illinois University, Chicago, USA
EDITORIAL BOARD (DOMESTIC)Prof. Dr. Shahida Sajjad, Federal Urdu University of Arts, Science & Technology, Karachi
Prof. Dr. Fatima Imam, Federal Urdu University of Arts, Science & Technology, Karachi
Dr. Arif Khan, Preston University, Karachi
Prof. Dr. Mustiges-ur-Rehman, Indus University, Karachi
Prof. Dr. Zareen Abbassi, University of Sindh, Jamshoro
Prof. Dr. Khalid Iraqi, University of Karachi, Karachi
Dr. Tariq Shah, Quaid-e-Azam University, Islamabad
Prof. Dr. Hamadullah Kakepoto, University of Sindh, Jamshoro
Prof. Dr. Ahsan Das, Isra University, Hyderabad
Prof. Dr. Abuzar Wajidi, University of Karachi, Karachi
REVIEWERSMr. Naveed Wahid Awan, Research Scholar, Applied Economics Research Centre, Karachi
Dr. Fouzia Naeem, Managing Director, Techno Pak advisors (Pvt) Ltd., Karachi
Dr. Arif Khan, Col. (R) Pakistan Army Education Corp
Dr. Muhammad Akhlas, Associate Professor, Iqra University, Karachi
Prof. Dr. Arif Hussain, Director Research, BIZTAK, Karachi
Prof. Dr. Fatima Imam, Federal Urdu University of Arts, Science & Technology, Karachi
Dr. Manzoor Ali Isran, Associate Professor, SZABIST, Karachi
Prof. Dr. Shahida Sajjad, Federal Urdu University of Arts, Science & Technology, Karachi
Dr. Doyin Atewologun, Queen Mary University of London
Dr. Elena Baglioni, Queen Mary University of London
Dr. Samina Khalil, Senior Research Economist, Applied Economics Research Centre, Karachi
Dr. Syed Faizan Burni, Research Economist, Applied Economics Research Centre, Karachi
Journal of Business Strategies, Vol. 8(1)June 2014
A Note from the Editor-in-Chief
This issue is the first to appear under my supervision as Editor-in-Chief. WhenI accepted this responsibility of ‘Business Strategies’ Journal as Editor-in-Chief,three questions were prominent in my mind: How could we further improvequality of research papers and work with heavy profile researchers? How couldwe best demonstrate our analysis and solution of important Business Educationproblems through this Journal? How could we further improve the quality ofreviewing the articles and improve its editing, formatting and proof reading?
In accepting this responsibility, I agreed to work on it with the very nextissue. It is for the readers to judge whether I succeeded in respondingappropriately to these questions. However to find the answer to my first concern,I devised the editorial policies to distribute preferred themes among the potentialcontributors and emphasized empirical mode of investigation in the publishedpapers. The answer to second concern (responsiveness to Business relatedproblems) I suggested to approach in reaching out beyond the boundaries of ourdisciplines by touching the issues of Economic relevance and themes thatintersect with various sister disciplines. As to further improvements in thequality of the review of articles I asked to select at least two experts from therelated disciplines and request them for their transparent review. I am thankfulto our valued reviewers who cooperated in our scheme to raise the level ofprofessionalism in a thorough review process.
Finally, I appreciate the sincere academic efforts of its Editor Prof. Dr. SyedArshad Imam for his continuous hard work in publishing this Journal, AssistantEditor Mr. Sherbaz Khan for his assistance and Mr. Abdul Kalam who did thearduous task of composing the journal materials very efficiently.
Prof. Dr. A. Q. MughalEditor-in-Chief
v

vi
Journal of Business Strategies, Vol. 8(1)June 2014
Table of Contents
Articles No.
Time Series Forecast Models for Pakistan’s EconomicActivities in Past Four Decades 1-8Muhammad Arif Hussain, Miftahuddin & Asif Ali Siddiqui
Economic Impact of Private Tuition in Pakistan 9-20Naima Tabassum, Tabassum Afzal & Huma Tabassum
Impact of Long Working Hours on Job Satisfaction ofEmployees Working in Services Sector of Karachi 21-37Hina Mubeen & Muhammed Zaki Rashidi
Perception about Service Quality in Shifa International Hospital 39-51Javed Iqbal
Investigating the Causes of Persistent Trade Deficit:A Study based on Marshal-Lerner Frame Work 53-62Muhammad Tariq & Yasmeen Amber Khuhro & Ranjeet Kumar
Art of Customer Retention in Developing Economy 63-76Irfan Saleem, Anjum Saleem & Arqam Javed Kayani
Fact FileRole of Taxation on Service Industry of the Country’s Economy 77-88Muhammad Imran Khan & Farzana Altaf
Case StudyAn Assessment of Organizational Commitment:A Case Study of BUITEMS, Quetta 89-99Abdul Raziq, Maqsood Ahmed & Muhammad Azam Tahir
Troika Directions of HRD: A Corporate Case Study of Emirates Airline 101-110Nadir Kolachi
vii

Nawaz Ahmad, Mohib Billoo & Asad Lakhan
Time Series Forecast Models forPakistan’s Economic Activities in Past
Four DecadesMuhammad Arif Hussain*
Instiute of Business and Technology (IBT), Karachi,
Miftahuddin & Asif Ali SiddiquiGovt. College for Men, Nazimabad, Karachi
A good collection of tax revenue plays an important role in the prosperity ofany country as it contributes to increase productivity of the national economy,which in turn reduces unemployment through creation of job opportunities. Thisstudy, analyzes and develops time series forecast models for the direct andindirect tax revenue of Pakistan over a period of about forty years, covering theperiod (1973-2011). First, test for normality has been applied to the direct andindirect tax revenue data sets using Minitab, 16. The Anderson-darling (AD)normality test reveals that both data are coming from non-normal processes.Secondly, we test for stationarity of available data using Augmented Dicky-Fullertest using computer application, R, which shows that first order differencing isneeded to make the observations stationary. Then different ARIMA models havebeen tested to get the most appropriate forecast models for direct income tax andindirect federal revenue observations using Minitab, 16. It has been found thatARIMA(1,1,1) and ARIMA(1,1,0) models are adequate forecast models for directincome tax and indirect federal revenue respectively. The finding of this studywill be helpful for government, policymakers, exporters, producers, industrialists,importers and investors.Keywords:Direct and indirect tax, Anderson-darling normality test, ARIMA models, Dicky-Fullertest.
IntroductionTax revenue and generation of tax revenue in any country is a major part of
the policy making to fund the government expenditure. These expendituresconsist of provision of social programs, infrastructural developments, defenseexpenditures and other liabilities of the government. Sustainable economicgrowth is considered crucial for improving the living standards. It is even moreimportant for developing countries like Pakistan which are suffering from manyeconomic problems. The government, international and national financialinstitutions, importers, exporters, industrialists and investors are very much
1
Journal of Business Strategies, Vol.8, No.1, 2014, pp 1–8
__________________________________________________________________________________*[email protected]

interested in the study of tax revenue and generation in the tax revenue as thisstudy is the base line of the economy of any country. The collection of tax (directand indirect) is the policy of concern for any government as it ensures theincome of government which later on helps in making decision in budget, likegovernment expenses, development funds, defense expenditures. In Pakistan,about 24% of people live below the poverty line (Ahmad & Wajid, 2013), soyield of tax revenue can be improved by mobilizing domestic resources andeliminating anti-trade biases. It can also be improved by minimizing theinequality and distortions of the existing tax system and by eliminating taxevasion through harmonization of tax regime and general tax reduction(Saahdong, 2008). This study aims at analyzing and developing forecast modelsfor the tax revenue of Pakistan over a period of about four decades by usingBox-Jenkins time series data analysis methodology. Augmented dickey fullertest is used to test for unit root in the time series. Augmented Dickey-Fuller testprovides a formal test for non-stationarity in the time series data. This test isused to test for the presence of unit root in the coefficient of lagged variables.If the coefficient of a lagged variable shows a value of one, then the equationshows that there exists unit root in the series (Dickey & Fuller, 1979 & 1981).The aims of this study are:
1. To test normal distribution followed by direct and indirect tax data sets2. To examine the presence of unit root in above data sets3. To analyze and suggest appropriate ARIMA models for direct tax collection
data.4. To analyze and suggest appropriate ARIMA models for indirect tax
collection data.
To develop forecast models for the direct and indirect tax in Pakistan andtesting following hypotheses, Minitab-16 and R computer applications are used(Hussain & Khan, 2014).
HypothesesTo check the characteristics of direct and indirect tax data, we construct
following hypotheses:
Ho = direct tax observations follow normal probability distribution.H1 = direct tax observations follow right skew probability distribution.Ho = indirect tax observations follow normal probability distribution.H2 = indirect tax observations follow right skew probability distribution.Ho = direct tax observations exhibit stationarity in the series.H3 = direct tax observations are non-stationary.
2
Hussain M.A,, Miftahuddin & Siddiqui A A
Ho = indirect tax observations exhibit stationarity in the series.H4 = indirect tax observations are non-stationary.
MethodThe data sets used for the analysis are secondary and consist of yearly tax
(direct and indirect) collections. This data have been collected from ”FBR” yearbook, Govt. of Pakistan, Revenue Division, Federal Board of Revenue,Directorate of Research and Statistics. The data used covered the period from1972-73 to 2010-11. For test of normality of distribution of collected taxobservations we use Anderson-Darling (AD) normality test. Time series analysisis the main statistical tool employed in the analysis of tax revenue collection data.Box-Jenkins (1976) methodology of ARIMA modeling is considered to be themost flexible method and has had been used by number of researchers forforecasting time series data. According to this method, a non-seasonal ARIMAmodel is denoted by ARIMA(p, d, q). This model is combination of Autoregression (AR) and moving averages (MA) with an order of integration ordifferencing (d). Where “p” is the order of autocorrelation and “q” is the order ofmoving average (Cooray, 2008).
A test is needed to get an idea about adequacy of the fitted models. It has beenshown that for a satisfactory model, the variable Q (Box and Pierce’s Q-test)
K
Q = NΣ ra2 (k), (1)k=1
where ra(k) are estimated autocorrelations for the residuals ai, have χ2
distribution with K-p-q degrees of freedom. Here, N = n - 1 (in our case equalsto the amount of initial data used). Next, we discuss results of this study.
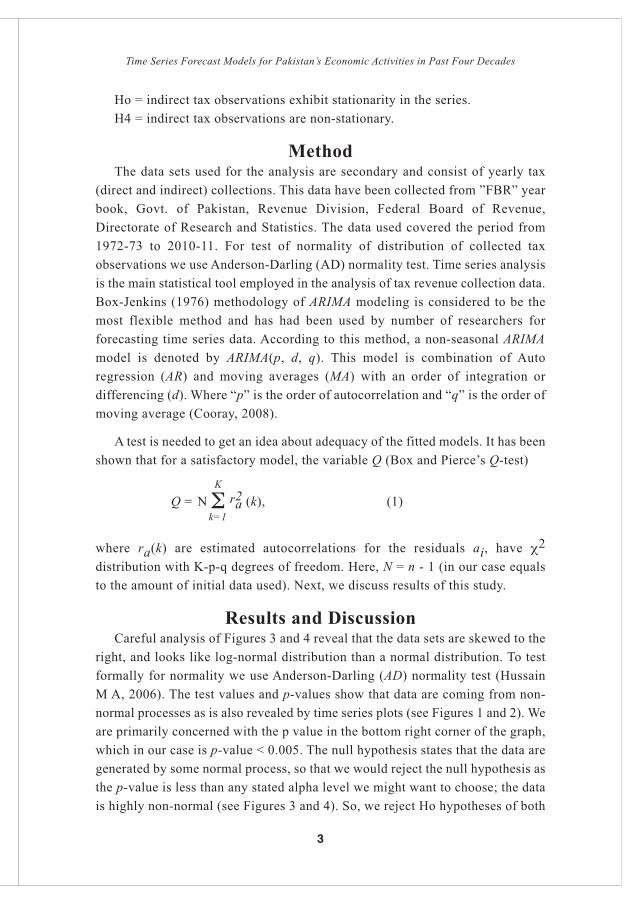
Results and DiscussionCareful analysis of Figures 3 and 4 reveal that the data sets are skewed to the
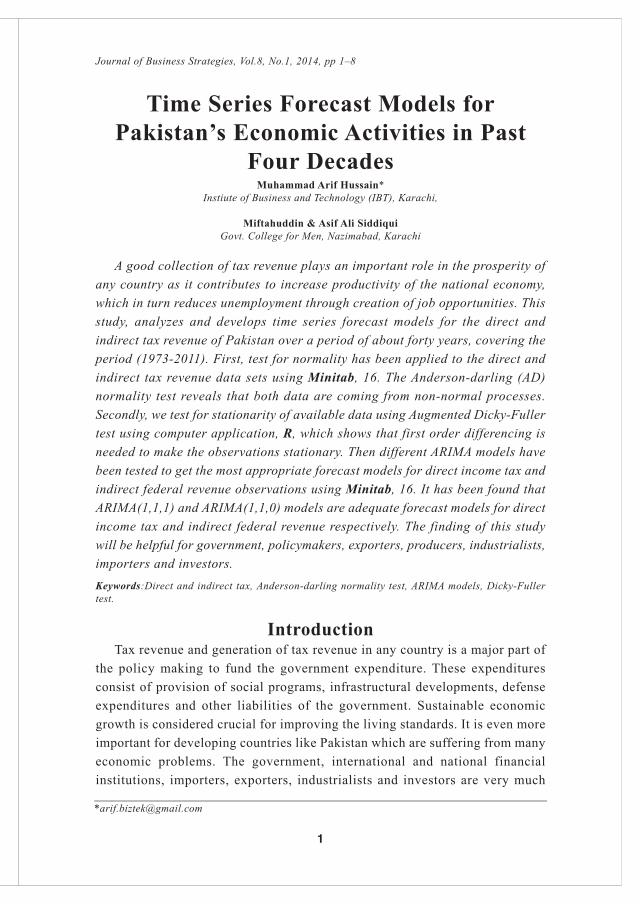
right, and looks like log-normal distribution than a normal distribution. To testformally for normality we use Anderson-Darling (AD) normality test (HussainM A, 2006). The test values and p-values show that data are coming from non-normal processes as is also revealed by time series plots (see Figures 1 and 2). Weare primarily concerned with the p value in the bottom right corner of the graph,which in our case is p-value < 0.005. The null hypothesis states that the data aregenerated by some normal process, so that we would reject the null hypothesis asthe p-value is less than any stated alpha level we might want to choose; the datais highly non-normal (see Figures 3 and 4). So, we reject Ho hypotheses of both
3
Time Series Forecast Models for Pakistan’s Economic Activities in Past Four Decades

data sets and conclude that observations are being generated by somemultiplicative processes. To bolster the above test result we conduct Dicky-Fullertest of unit roots.
Augmented Dicky-Fuller test (implemented in R) show that there is a unitroot in both the data sets at lag 1. So, the series should be differenced once. Foran ARIMA (p, d, q) model, it is necessary to obtain the order of the model. Theimportant step is to identify the order of differencing (d) needed to make theseries stationary (Box & Jenkins,1976). Modeling and predicting the economicdata such as annual revenue generation is required for reliable and effectiveplanning, managing, and operation of economic projects. In this study, a non-seasonal time series ARIMA mathematical model is described. One of theattractive features of the Box-Jenkins approach to forecasting is that ARIMAprocesses are very rich class of possible models and it is usually possible to finda process which provides an adequate description to the data. The study alsoshows that there will be an expected smooth increase of Federal tax revenue anddirect tax collection in the years to come. So, on the basis of Q-statistic (see Eq.1) and residuals partial correlation functions (see Figures 5 and 6), we can saythat the adequate models for direct income tax and indirect federal revenue areARIMA(1,1,1) and ARIMA(1,1,0) respectively.
Fig.1 Time series plot of federal revenue (fedexc) data.
4
Hussain M.A,, Miftahuddin & Siddiqui A A
Fig.2 Time series plot of income tax (intax) data.
Fig.3 Graphical descriptive summary of income tax data. Anderson-Darling (AD)normality test shows that underlying process in non-normal.
5
Time Series Forecast Models for Pakistan’s Economic Activities in Past Four Decades

Fig.4 Graphical descriptive summary of federal tax data. Anderson-Darling (AD)normality test shows that underlying process in non-normal.
Fig.5 Partial autocorrelation function plot of residuals of federal income tax data.
6
Hussain M.A,, Miftahuddin & Siddiqui A A
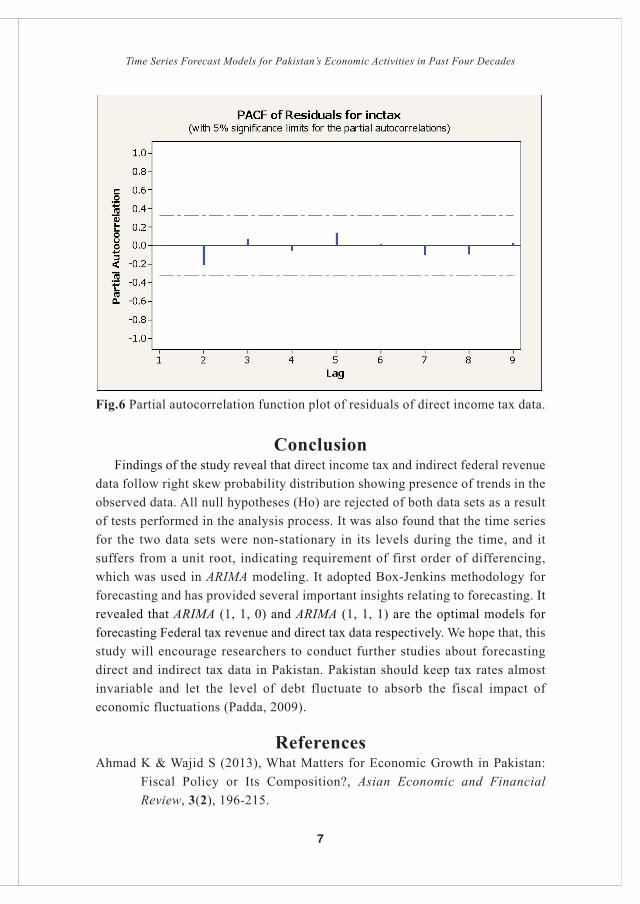
Fig.6 Partial autocorrelation function plot of residuals of direct income tax data.
ConclusionFindings of the study reveal that direct income tax and indirect federal revenue
data follow right skew probability distribution showing presence of trends in theobserved data. All null hypotheses (Ho) are rejected of both data sets as a resultof tests performed in the analysis process. It was also found that the time seriesfor the two data sets were non-stationary in its levels during the time, and itsuffers from a unit root, indicating requirement of first order of differencing,which was used in ARIMA modeling. It adopted Box-Jenkins methodology forforecasting and has provided several important insights relating to forecasting. Itrevealed that ARIMA (1, 1, 0) and ARIMA (1, 1, 1) are the optimal models forforecasting Federal tax revenue and direct tax data respectively. We hope that, thisstudy will encourage researchers to conduct further studies about forecastingdirect and indirect tax data in Pakistan. Pakistan should keep tax rates almostinvariable and let the level of debt fluctuate to absorb the fiscal impact ofeconomic fluctuations (Padda, 2009).
ReferencesAhmad K & Wajid S (2013), What Matters for Economic Growth in Pakistan:
Fiscal Policy or Its Composition?, Asian Economic and FinancialReview, 3(2), 196-215.
7
Time Series Forecast Models for Pakistan’s Economic Activities in Past Four Decades
Saahdong, C.I. (2008) Indirect Tax Reforms and Revenue Mobilization inCameroon, Master Thesis, University of Oslo.
Dickey, D. & Fuller, W. (1979). Distribution of the Estimators for AutoregressiveTime Series with A unit root. Journal of the American StatisticalAssociation, 84, 427-431. http://dx.doi.org/10.2307/2286348
Dickey, D. & Fuller, W. (1981). Likelihood Ratio Stastics for AutoregressiveTime Series with A unit root. Econometrica, 49, 1057-1072.http://dx.doi.org/10.2307/1912517
Hussain, M.A. & Khan, A.A. (2014), Monte Carlo Simulation of Environmentaland Business Data with Matlab and R, Proceedings 12th InternationalConference on Statistical Sciences, March 24-26, Dow University ofHealth Sciences, Karachi, vol. 46. ISBN-978-969-8858-14-8, Pakistan,pp. 33-46.
Cooray, T.M.J.A. (2008), Applied Time Series, Analysis and Forecasting, NarosaPublishing House, New Delhi.
Hussain, M.A. (2006) Mathematical Aspects of the Impact of Urban GreenhouseGas Emissions on Global Warming, Ph. D. Thesis, Federal UrduUniversity of Arts, Science and Technology (FUUAST), Karachi.
Box, E. P. & Jenkins, G. M. (1976) Time Series Analysis: Forecasting andControl. Prentice-Hall, Englewood Cliffs, NJ.
Padda, I.H. (2009) Have Developing Countries been Seeking to Minimize WelfareCost of Taxation? Evidence from Barro’s Tax Smoothing Hypothesis,Ph.D. Thesis, Federal Urdu University of Arts, Science and Technology(FUUAST), Islamabad.
8
Hussain M.A,, Miftahuddin & Siddiqui A A
Economic Impact ofPrivate Tuition in Pakistan
Naima Tabassum*University of Sindh, Jamshoro
Tabassum AfzalGovernment College of Education, Karachi
&Huma Tabassum
Government Girls Degree College, Hyderabad
This paper aims to explore economic impact of private tuition on students,their families and broader Pakistani society. This exploratory, cross sectionalresearch is based on primary data. The method for data collection was survey.The data was collected from students, teachers, parents and common people withthe help of a questionnaire developed by the researcher. This research paperfocuses on the amount of money invested by a student in private tuition everymonth. It also evaluated the difficulty people face in paying fee for the privatetuition. It also analyzed peoples’ perception regarding the impact of privatetuition on economic conditions of students’ families. Finally, the paper identifiesperceptions regarding private tuition’s responsibility in causing or reproducingthe economic inequalities among students in broader society.
Keywords: Private Tuition, Economic, Impact, Pakistan.
IntroductionPrivate tuition or often called as shadow education is rapidly growing around
the world. Some form of private tuition or tutoring exists in almost all countriesirrespective of their political structures, economic and social development orreligious or cultural situations. Several studies have explored the phenomenonof private tuition with special focus on different geographical regions or specificcountries. The list of countries in which detailed studies have been done regardingthe private tuition mania includes Azerbaijan, Bosnia & Herzegovina, Croatia,Cyprus, Egypt, France, Georgia, Greece, India, Italy, Kazakhstan, Korea,Kyrgyzstan, Lithuania, Malta, Mongolia, Pakistan, Poland, Portugal, Slovakia,Slovenian, Tajikistan, Turkey, and Ukraine (Afzal and Khan 2006; Bray 2006;Bray, Mazawi, and Sultana 2013; Education Support Program 2006; Heung-ju,2006, Silova 2009; Sujatha 2006b).
Pakistan is not an exception to this private tuition fever. A culture of private
9
Journal of Business Strategies, Vol.8, No.1, 2014, pp 9–20
__________________________________________________________________________________*[email protected]
tuition outside and after the regular school is rapidly increasing in Pakistan aswell. It is affecting Pakistani society in various aspects. It has implication for thequality of teaching and learning in public education system. It affects teacher’sperformance and attendance of students in the regular school or educationalinstitutions. Besides the educational effects, private tuition is also affecting socialand psychological aspects of students and their families. It has become a fashionbut still gives psychological stress to students for excessive burden and timeconsumption in studies and to families for arranging the best quality of instructionfor children to gain an edge in competition with others. Economic aspect of theprivate tuition in Pakistan is still a least explored area in academic studies. Privatetuition has emerged as a flourishing industry or business. It involves lot of moneyas fee paid by the students and their families and the money reaped by privatetutors or tuition centers.
This paper aims to explore economic impact of private tuition in Pakistan.The paper is divided into five parts. The introduction follows a review of relatedliterature. Third part deals with the methodological considerations adopted inthis research study. Fourth part is presenting the data and its analysis. The majorfocus is on the money invested in private tuition by students and their families,the difficulty they faced in paying this money for private tuition, the negativeeffect it has on economic conditions of family’s and the perceptions regardingcreation of socio-economic inequalities in the broader societies by privatetuition industry. Finally, the major findings of the paper will be highlighted tomake some concluding remarks along with recommendations for future researchand policy.
Literature ReviewPrivate tuition is the term generally used for paid supplementary instruction
for academic subjects provided outside the regular school (Aslam 2011; ESP2006). It is also known as “shadow education” (Baker and LeTendre 2005; Bray1999; Bray, Mazawi, and Sultana 2013; Bray and Silova 2006; Stevenson andBaker 1992). The culture of private tuition is on the rise all around Pakistan.There is a variety of causes behind this rapid growth of private tuition industryin the country. Different scholars have identified the large number of students inclasses, the declining learning environment, ineffective performance and the poorquality of education in government institutions as the causes of rising trend ofprivate tuition in Pakistan (Chuadhry and Javed 2012: 101; Urooj 2012; Aslam2011; Zafar 1992). Students and their parents also prefer private tuition for betteracademic performance and achieving higher grades in examinations (Sujatha2006a, 1; Urooj 2012).
10
Tabassum, N., Afzal, T. & Tabassum, H.
The private tuition industry has also some economic implications on students,their families and the overall society. Urooj (2011, 1121) claims that due tovarious interests of the students, teachers, and other professionals a large numberof private tuition centers have mushroomed and making money from thisbusiness. Humayon Dar (2013) also reported that thousands of private tuitioncenters have been established across Pakistan from cosmopolitan cities to thevillages and the private tutors are earning too much money as the monthly feepaid for an individual student ranges from Rs. 1,000 to Rs. 50,000.
The money these private tutors and the private tuition centers are reaping fromthis industry is becoming a burden on the students and their families. Chuadhryand Javed (2012, 109) discussing about the money invested in private tuition bystudents from public and private schools explains that at tuition academies andcenters the tuition fee are high. It is found that students have to pay Rs. 1000either for each science subject or for whole tuition at primary, middle or matriclevels (Chuadhry and Javed 2012, 109). Although the money invested is too highand creates an extra burden but still families invest money in private tuitions tomake their children have a comparative edge over others (Bray 2006). Chuadhryand Javed (2012, 109) inferred that this fee for private tuition along with theexpenditures on mainstream education makes a substantial economic burden formiddle class families.
Jokić et.al. (2013) in a comparative study of private tuition in Croatia, Bosniaand Herzegovina argue that one important factor contributing towards widespreadreliance on private tuition is its affordability. They identify that the competitivemarket sufficiently supply variety of quality and quantity of private tuition in avariety of fees making some kind of private instruction affordable for studentscoming from different socio-economic background. But still they identify that agroup of students cannot afford private tuition and it causes serious educationalinequalities. Bray (2006) also identified that “tuition is obviously a mechanismfor maintaining and increasing social stratification”. It is argued that the differentquality and quantity of private tuition available to access by different incomegroups across regions is a source of perpetuating the inequalities and creating thenew disparities among people (Bray 2006).
Aslam (2011) argues that “the option of giving (for the teachers) and receiving(for the pupils) tuition outside of normal school hours changes the incentivestructure of the provision of high quality instruction within the standard schoolsystem which in turn has implications for equity and social justice.” She furtherclaims that the relationship between acquiring private tuition and student’sachievement is becoming a focus of scholarly and policy attention because it
11
Economic Impact of Private Tuition in Pakistan
raises question about the quality of education provided within school and theability of students to pay for gaining access to this extra private instructions(Aslam 2011, 23). These questions are pointing towards the socio-economicinequalities that play important role in first determining who will be able toaccess this extra help and finally in shaping the result of this extra help in theform of unequal academic achievement.
The families with sufficient resources are able to invest more, than thoselacking in these resources, for acquiring best quality and more quantity of privatetuition for their children enabling them to perform better in school and later gainbetter earning opportunities (Bray 2006). Heung-ju (2006) argues that thisenhanced investment in private tutoring inherits social position and wealthconsequently making the educational environment more stratified on the basis ofeconomics than individual ability. Those children who cannot afford the high feefor private supplementary instruction are disadvantaged in terms of academicacquisition thus effecting their chances of enrollment in institutions of higherlearning like universities (Budiene 2006).
MethodThe research aims to focus on economic impact of growing private tuition
culture in Pakistan, in general and in District Hyderabad, in particular. It isdesigned as an exploratory research done with quantitative approach to datacollection and analysis. Survey method of data collection was used to collectprimary data. A questionnaire developed by researcher was used for the purposeof data collection. The respondents were randomly selected included students,teachers, and common people.
The questionnaire consisted of 85 items. Multiple types of the question wereused in the questionnaire. It was divided into three major sections. The firstsection comprising 14 items was dealing with the demographic features of therespondents. Second section dealing with the personal experiences of gaining orimparting tuition by respondents comprises of the multiple type of questions withaccordingly suitable answer categories (e.g. see in graph 1, the responsecategories for money invested in the private tuition). The third section dealt withpeople’s perception regarding the impact of private tuition on students, theirfamilies and the broader society. The questions in this section were developedon five point Likert scale (e.g. see the response categories in graph 3 and 4).
The data analyzed was collected from 245 respondents. They included 140students, 35 teachers, and 70 common people (also including parents of students).The gender wise distribution of the respondents included 60% male respondents
12
Tabassum, N., Afzal, T. & Tabassum, H.
and 40% female respondents. Due to non availability of any authentic number ofstudents and teachers involved in private tuitions in the district and the list oftheir names, the respondents for this study were randomly selected to ensureparticipation from people of diverse socio-economic background. They wereselected from different private tuition centers, public and private universities,colleges, and schools, parent teachers committees of these institutions, differentwork stations, NGOS, individual private tutors imparting tuitions at home, etc.
The data collected was statistically analyzed and presented in the form ofgraphs. Finally, the analyzed data was interpreted to highlight the major findingsregarding the main focus of the study.
ResultsThis paper analyses the economic impact of tuition culture on students, their
families and the broader Pakistani society. The impact has been analyzed byfocusing on the following aspects: 1) The amount of money invested by studentsfor acquiring private tuition, 2) the level of difficulty students and their familiesface in paying fee for private tuition, 3) the overall economic impact of privatetuition on students’ families, 4) and the responsibility of private tuition industryin creating economic inequalities in the broader society.
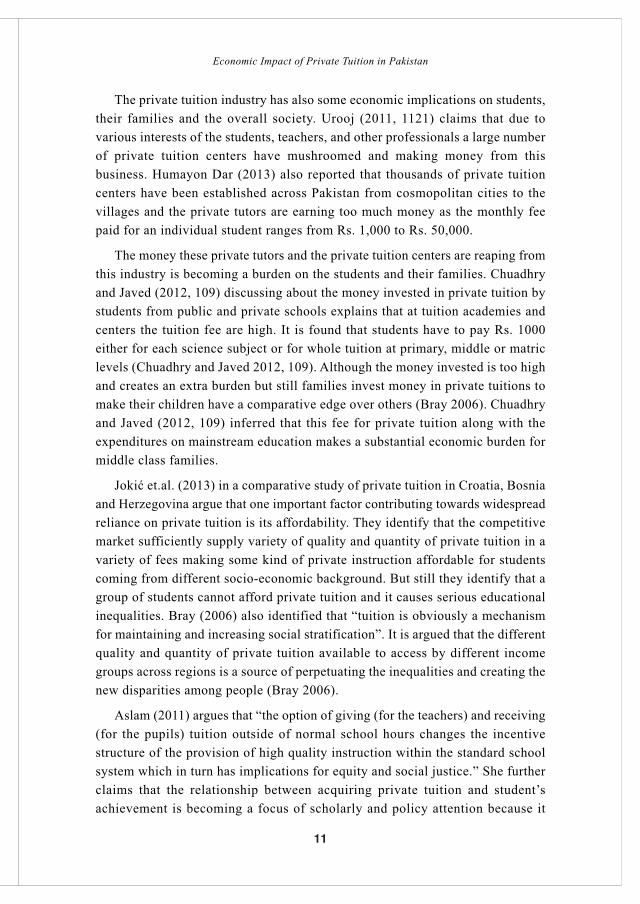
Amount of Money Invested for acquiring Private TuitionThe data analysis, presented in Graph 1, shows that majority of respondents (i.e.
more than 60%) are of the opinion that average students pay less than or up to 3000rupees per month for private tuition. Only 10% respondents consider that students paymore than 3000 and up to 5000 rupees for private tuition per month. Another morethan 25% of the respondents believe that students pay more than 5000 and up to 8000rupees for acquiring private academic instruction. Only 2% of the respondentsconsider that students pay more than 8000 rupees per month for private tuition.
This is certainly a high amount of money for an average income family tospend on their children’s supplementary instruction after mainstream educationalinstitutions. This burden becomes higher when calculated at annual bases. Theproblem also becomes severe as the household size in Pakistan is large and usuallyeach house has to afford the burden of education of more than one child at a time.
The difference in categories of the amount paid by students occurs on thebasis that which classes a student is taking tuition for. Usually when the tuitionis reported to be imparted on lower grades (e.g. for primary classes) the moneyinvested to this is also less, while when it comes to secondary, higher secondaryand tertiary education (e.g. matriculation, intermediate and college education)the amount of money starts increasing.
13
Economic Impact of Private Tuition in Pakistan
Graph 1. Money invested in private tuition by students & parents
Some other factors influencing the amount of fee are the geographical location(rural or urban, small town or big cities) where this private tuition is beingacquired, the institutional setup (e.g. at student or tutor’s home or at professionalprivate tuition academies/centers) where student take private instructions, andthe person (professional tutor, senior student, neighbors, etc) who provides theseprivate instructions to students.
Difficulty in Paying Fee for Private TuitionThe amount of money indicated to be paid by average student as fee for
private tuition is relatively high for an average income family in Pakistan. thedata analysis (in graph 2) reflects that the majority of the respondents (i.e.59.18%) are found believing that students and their family face difficulty inpaying fee for private tuition. Another 28.9% respondents consider that studentsand their family does not feel it difficult rather normally pay fee for privatetuition. Only 10.2% of the respondents believed that people easily pay fee forthe private tuition. A minority of the respondents (i.e. 1.63%) were showing theirunawareness in this regard.
It means that more than half of the respondents (59%) believe that a commonperson feels difficulty in paying the high amount of the fee to private supplementarytuition in Pakistan. On the other hand, less than half but still a large majority ofrespondents (i.e. 39%) believed that people do not face any difficulty rather payeither normally or easily the fee for acquiring private tuition for their children.
14
Tabassum, N., Afzal, T. & Tabassum, H.
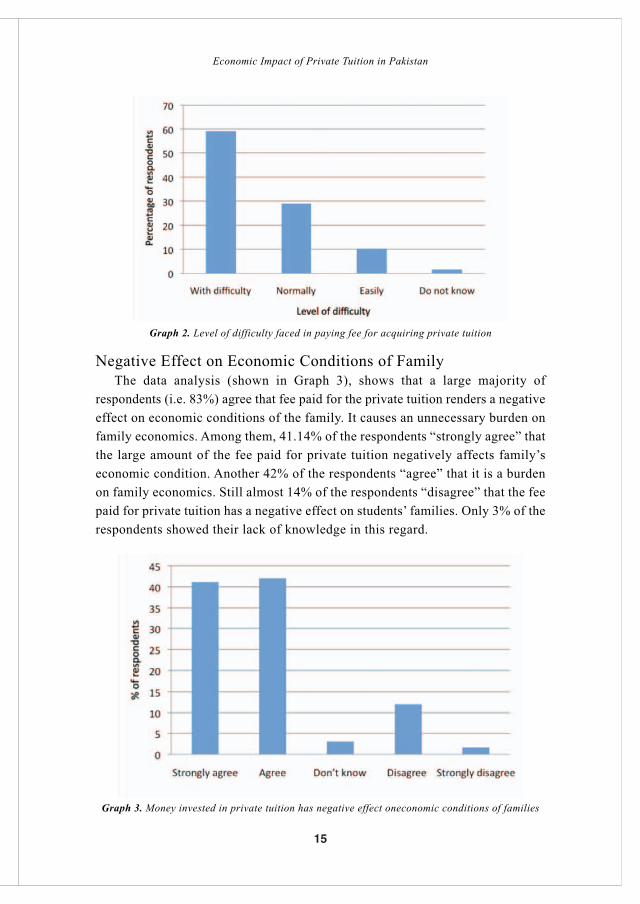
Graph 2. Level of difficulty faced in paying fee for acquiring private tuition
Negative Effect on Economic Conditions of FamilyThe data analysis (shown in Graph 3), shows that a large majority of
respondents (i.e. 83%) agree that fee paid for the private tuition renders a negativeeffect on economic conditions of the family. It causes an unnecessary burden onfamily economics. Among them, 41.14% of the respondents “strongly agree” thatthe large amount of the fee paid for private tuition negatively affects family’seconomic condition. Another 42% of the respondents “agree” that it is a burdenon family economics. Still almost 14% of the respondents “disagree” that the feepaid for private tuition has a negative effect on students’ families. Only 3% of therespondents showed their lack of knowledge in this regard.
Graph 3. Money invested in private tuition has negative effect oneconomic conditions of families
15
Economic Impact of Private Tuition in Pakistan
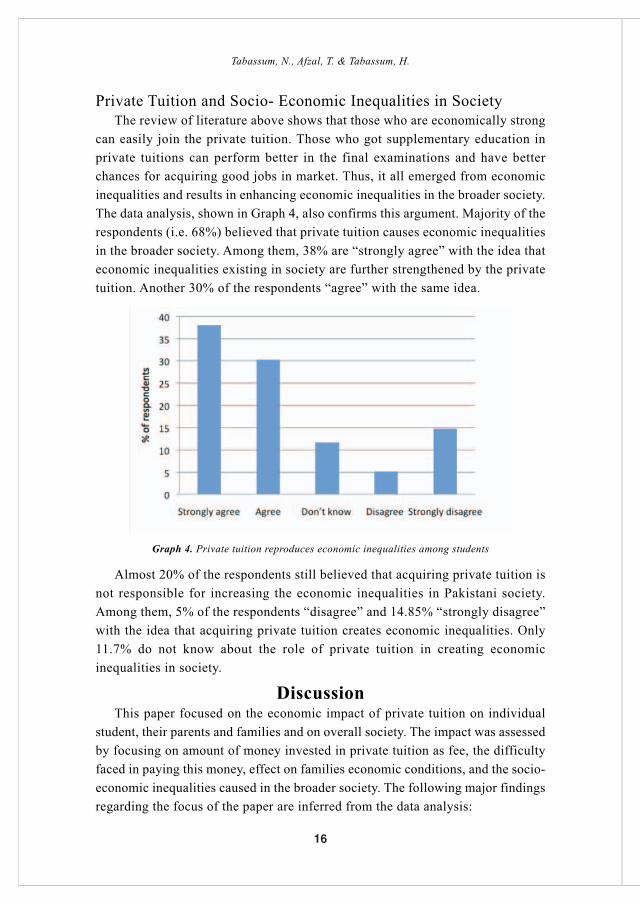
Private Tuition and Socio- Economic Inequalities in SocietyThe review of literature above shows that those who are economically strong
can easily join the private tuition. Those who got supplementary education inprivate tuitions can perform better in the final examinations and have betterchances for acquiring good jobs in market. Thus, it all emerged from economicinequalities and results in enhancing economic inequalities in the broader society.The data analysis, shown in Graph 4, also confirms this argument. Majority of therespondents (i.e. 68%) believed that private tuition causes economic inequalitiesin the broader society. Among them, 38% are “strongly agree” with the idea thateconomic inequalities existing in society are further strengthened by the privatetuition. Another 30% of the respondents “agree” with the same idea.
Graph 4. Private tuition reproduces economic inequalities among students
Almost 20% of the respondents still believed that acquiring private tuition isnot responsible for increasing the economic inequalities in Pakistani society.Among them, 5% of the respondents “disagree” and 14.85% “strongly disagree”with the idea that acquiring private tuition creates economic inequalities. Only11.7% do not know about the role of private tuition in creating economicinequalities in society.
DiscussionThis paper focused on the economic impact of private tuition on individual
student, their parents and families and on overall society. The impact was assessedby focusing on amount of money invested in private tuition as fee, the difficultyfaced in paying this money, effect on families economic conditions, and the socio-economic inequalities caused in the broader society. The following major findingsregarding the focus of the paper are inferred from the data analysis:
16
Tabassum, N., Afzal, T. & Tabassum, H.
More than 60% of the respondents agree that an average student pays lessthan or up to Rs. 3000 for acquiring private tuition. The amount of private tuitionfee can reach to Rs. 8000 or more. This is certainly a high amount of fee to bespent of extra supplementary tuition besides the regular expenditures done onchildren’s mainstream schooling.
People face difficulty in bearing the extra economic burden of supplementaryprivate tuition. The data analysis shows that majority of the respondents (i.e.59%) agree for students and their parents faced difficulty in paying this extramoney for acquiring private tuition for their children.
Accordingly, the money invested in private tuition is a source negativelyaffecting the families income. It places an extra burden on economic conditionsof the family. The data analysis shows that a clear majority of respondents (i.e.83%) consider that the fee paid for acquiring private tuition for children isnegatively effecting family’s economic conditions.
Keeping in view the amount of money needed to be paid as fee for privatetuition, it is clear that the chances of access to and acquiring private tuition areconditioned with the economic well being and affordability of the concernedstudent and family. The existing literature shows that the patterns of availingprivate tuition are already indicating to be as a result of socio-economicinequalities existing in society. The data analysis also shows that majority ofrespondents (i.e. 68%) were agreed that private tuition industry fosters theexisting socio-economic inequalities in the broader Pakistani society.
On the basis of above finding, the paper is also intended to extend somerecommendations to benefit students, their families, institutions, and the policymakers and practitioners. The suggestion in this regards are as following:
The state should formulate proper policy for such rapid mushrooming ofprivate tuition industry across the country. The fee structures, employmentconditions of teachers and facilities provided to the students should be designedto fulfill the requirements of equitable good quality of education to all.
The quality of education should be enhanced and maintained in governmenteducational institutions. So that the need and demand for private tuition forstudents should not be felt at such a major level.
ConclusionThis paper was an effort to analyze the economic impact of private tuition
on students, their families and broader society. Survey method of data
17
Economic Impact of Private Tuition in Pakistan

collection is used. The data was collected from students, their parents, teachersand common people. The data analysis shows that the amount of money paid bymajority of the participants of this study for acquiring private tuition rangesfrom less than one thousands rupees to more than 8000 thousands rupees. It canbe considered as an extra economic burden on students and their families asmost of the respondents face difficulty in paying this amount. Therefore, themajority of the respondents (83%) perceived that the money invested in privatetuition is negatively affecting economic conditions of the concerned studentsand their families. Majority of the respondents (68%) also considered thatprivate tuition reproduced the socio-economic inequalities existing in Pakistanisociety. The paper extends few suggestions for improving the conditions in thisregard. It is recommended that government should formulate and implementsome policy for controlling the fee structures, criteria for teachers to beemployed and quality of education provided in these institutions. It will help inreducing the socio-economic inequalities developed by the private tuition inPakistan.
ReferencesAfzal, T. & Khan, H. K. (2006). Private tuition in Pakistan. Asian Network of
Training and Research Institutions in Educational Planning (ANTRIEP)Newsletter, 11(1), 17-18.
Aslam, M. & Mansoor, S. (2011). The private tuition industry in Pakistan: Analarming trend. Annual Status of Education Report, 23-25.
Aslam, M. (2011). The private tuition industry in Pakistan: An alarming trend.ASER, 23-25. [Online]: http://www.aserpakistan.org/document/aser/2011/notes_aser_2011/Monazza%20Aslam.pdf (Retrieved in March 24, 2014)
Baker, D. P. & LeTendre, G. K. (2005). National differences, global similarities:World culture and the future of schooling. Stanford: Stanford UniversityPress.
Bray, M. & Silova, I. (2006). The private tutoring phenomenon: Internationalpatterns and perspectives (pp. 27-40) in Education Support Program(ESP). Education in a hidden marketplace: Monitoring of privatetutoring. Budapest: Education Support Program (ESP) of the OpenSociety Institute.
Bray, M. (1999). The shadow education system: Private tutoring and itsimplications for planners. Paris: UNESCO-International Institute forEducational Planning.
18
Tabassum, N., Afzal, T. & Tabassum, H.
Bray, M. (2006). Investigating the shadows: Comparative perspectives on privatetuition. Asian Network of Training and Research Institutions inEducational Planning (ANTRIEP) Newsletter, 11(1), 3-5.
Bray, M., Mazawi, A. E. & Sultana, R. G. (Eds.) (2013). Private tutoring acrossthe Mediterranean: Power dynamics and implications for learning andequity. Rotterdam: Sense Publishers.
Budiene, V. (2006). Private tutoring: Educating society or driving socialstratification? (pp. 7-9) in Education Support Program (ESP) Educationin a hidden marketplace: Monitoring of private tutoring. Budapest:Education Support Program (ESP) of the Open Society Institute.
Chuadhry, W. & Javed, F. (2012). History and culture of tuition academies:Voicing native’s perspective. Asian Journal of Management Sciences andEducation. 1(3): 101-110.
Dar, H. (2013). Economics and the popularity of private tuitions in Pakistan.[Online]: http://tribune.com.pk/story/645854/economics-and-the-popularity-of-private-tuitions-in-pakistan/ (Retrieved in March 20, 2014)
Education Support Program (ESP). (2006). Education in a hidden marketplace:Monitoring of private tutoring. Budapest: Education Support Program ofthe Open Society Institute.
Heung-ju, K. (2006). Korea’s obsession with private tutoring. Asian Network ofTraining and Research Institutions in Educational Planning (ANTRIEP)Newsletter, 11(1), 11-17.
Jokić, B., Soldo, A. & Dedić, Z. R. (2013). Private tutoring and social equity inCroatia and Bosnia & Herzegovina: A comparative qualitative study (pp.11-28) in M. Bray, A. E. Mazawi & R. G. Sultana (Eds.) Private tutoringacross the Mediterranean: Power dynamics and implications for learningand equity. Rotterdam: Sense Publishers.
Silova, I. (Ed.) (2009). Private supplementary tutoring in central Asia: Newopportunities and burdens. Paris: UNESCO-International Institute foreducational Planning.
Stevenson, D. L. & Baker, D. P. (1992). Shadow education and allocation informal schooling: Transition to university in Japan. American Journal ofSociology, 97(6): 1639-1657.
19
Economic Impact of Private Tuition in Pakistan
Sujatha, K. (2006a). Private tuition: Issues and concerns. Asian Network ofTraining and Research Institutions in Educational Planning (ANTRIEP)Newsletter, 11(1), 1-2.
Sujatha, K. (2006b). Private tuition in India. Asian Network of Training andResearch Institutions in Educational Planning (ANTRIEP) Newsletter,11(1), 6-10.
Urooj, S. (2012). The growing culture of tuition centers at secondary level ofeducation in Pakistan: An exploratory study. Interdisciplinary Journal ofContemporary Research in Business, 4(6), 1119-1125.
Zafar, K. (1992). Elements of teaching. Karachi: Rehbar Publishers.
20
Tabassum, N., Afzal, T. & Tabassum, H.
Impact of Long Working Hours on JobSatisfaction of Employees Working in
Services Sector of KarachiHina Mubeen* & Muhammed Zaki Rashidi
SZABIST, Karachi
Employees are often found complaining about prolonged working hours andrelating it to the fact that it abnormally cannibalizes their personal life. Workinghours are less often taken as a prime substantive concern in Pakistan. The aimof this research is to assess the working hours of employees and to validate thereasons of long working hours identified by Kodz et al (2003) and to gauge itsimpact on job satisfaction of employees working in service sector of Karachi.The respondents are permanent, full-time, managerial and professionalemployees working in private services sector organizations. The study specificallyfocuses three service sub-sectors banking, IT and media are focused. Twoorganizations from each sub-sector were selected. The respondents are engagedin non-manual jobs, namely, professional services. Both males and females wereincluded in the study. Data is collected through personally administered five-point Likert questionnaires. It consists of 32 items adapted from previous researchdone by International Labour Organization on Decent Working Time (2006) andJ. Kodz et al. (2003) on working time. The study proposes that employeesassociated with working in banking, IT and media firms of Karachi areexperiencing long working hours where they end up working more than 48 hoursa week. Job Strain is the most significant factor influencing long working hours.Organizational culture and job insecurity also play an important role inpromoting long-hours culture. Long working hours, Job strain, Job insecurity,Organizational culture, Personal choice and Rewards & Recognition adverselyaffects Job Satisfaction of employees.
Keywords: Long working hours, managerial employees, services sector, job satisfaction.
IntroductionIn the 21st century, employers have been able to realize that employees are the
most important assets for any organization. The employment relationship isregulated through an agreement between the employer and the employee.According to this agreement, employees are bound to fulfill certainresponsibilities for a specified time. Hence working time is one of the most
21
Journal of Business Strategies, Vol.8, No.1, 2014, pp 21–37
__________________________________________________________________________________*[email protected]
important elements of the employment relationship (Rubery, Ward & Grimshaw,2006). Working hours can be fixed or may be unspecified. At times, the workinghours are not specified by the employer nor are they agreed upon by the employee(Rubery et al., 2006). The concept of long work hours in organizations have beenintroduced quite long time back and one the example of this Robert Owen(Golden, 2009) who was the first one to argue for required working hours. Mostresearchers started analyzing the working hours trends with the start of theindustrial revolution, especially in European and North American countries.
According to the International standards, with few variations across differentcountries, “Generally, standard working hours are up to eight hours per day andup to 40 hours per week. Standard working hours plus overtime must not exceedcertain thresholds - namely 10 hours per day and 50 hours per week,respectively”. Under some circumstances, standard daily working hours may beextended up to 9 or 10 hours. For example, this can be done to create longerbreaks (like statutory holidays or weekends) or mutually agreed reduced workingweek. There has been a growing concern worldwide to assess the compliancewith the core standards delineated for working time (Widner, 2010). Excessiveworking hours is one of the major occupational stressors for employees (Spectoret al., 2004; Trimpop, Kirkcaldy, Athanasou & Cooper, 2000). Unlike men,female employees who work more than 55 hours per week have an increased riskof depression and anxiety as compared to those employees who work 35 – 40hours (Trimpop et al., 2000)
Long working hours are most common among managers, professionals andoperative and assembly workers. Both men and women on managerial grades workover 60 hours a week and in most cases they are not being compensated in anyform. People between 30 to 49 years of age are most likely to work long hours. Thetrend of long working hours is more evident in private sector than public sector(Kodz et al., 2003). Extended working hours, for both genders, are usually foundto be coupled with high educational attainment, white-collar jobs, self-employment, shift work and multiple job holding (Shields, 1999). (Shields, 1999)
According to Kodz et al. (2003), the biggest charm for manual workers is thatthey are paid overtime. So, they prefer to work longer hours for increased earnings.While for the managerial and professional workers the “overtime” is not paidusually. They work longer hours to get better evaluations and improve theirpromotion chances and job security. Hence they aim to increase their earnings inthe future. Another core reason for long hours is the workload / job requirement /volume of work. Recent research suggests that reduced working hours mightincrease employee productivity along with employment (Kodz et al., 2003).
22
Mubeen, H. & Rashidi, M.Z.
The ever increasing workload during these days can be attributed to radicalchanges within organizations like: decentralization, flat hierarchy, shortage ofworkers, cost cutting, increased focus on customer needs, meeting culture,excessive commuting for work related tasks, advancement in technology andemail overload (Kodz et al., 2003) and other types of communication overload.Kodz et al. (2003) argued that long working hours can lead to decline inproductivity, lower employee motivation and morale, impaired work performanceand efficiency, potential increase in error rates and health problems. It is alsodetrimental to social behavior like abrupt mood swings, impatience, intolerance,incomplete statements, speaking slowly, more repetitive, mispronunciations,relationship with colleagues etc.
The previous researches clearly indicate that due to adverse effect of longworking hours, the frequency of health and safety incidences increase (Kodz etal., 2003). This risk for occupational injuries substantially increases due to hecticwork schedules that involve long hours or overtime. Tight work schedules withless rest breaks causes fatigue or dysfunctional stress(Dembe, Erickson, Delbos& Banks, 2005). Kodz et al. (2003) argued that long working hours trendnegatively affects motivation while it positively affects absences and employeeturnover. Numerous researches have revealed a positive correlation between longworking hours and employee turnover. Extended working hours are reported toincrease number of sickness absences too. (Ala-Mursula et al., 2006)
Long working hours negatively affects both physiological and psychologicalhealth. It often causes fatigue and stress which plays an important role instimulating cardiovascular diseases and mental health disorders working hours(Spurgeon, Harrington & Cooper, 1997). Duration of overtime is a negative riskfactor for the development of type 2 diabetes mellitus (DM) in male employees(Nakanishi et al., 2001). Increased working hours may act as a risk factor forhypertension. The root cause of hypertension is stress, particularly work relatedstress. Inadequate time for sleep might be associated with disruption ofphysiological processes (Yang, Schnall, Jauregui, Su & Baker, 2006). Extendedworking hours result in unhealthy lifestyle such as retarded physical activity,sleep disorders, eating disorder, smoking, drinking, and fewer chances formedical examinations (Shields, 1999). Besides being definite cause ofhypertension, long working hours also increases body mass index (Wada et al.,2006). Women are more prone to undergo health related problems than men, ifthey work long hours (Kodz et al., 2003). These adverse effects surface withworking hours exceeding 50 hours per week (Spurgeon et al., 1997). Shield(1999) highlighted that long working hours is a pressing issue for Japanese
23
Impact of Long Working Hours on Job Satisfaction
workers and employers. An increasing number of workers are dying in their mostproductive years from various cardiovascular causes. Japanese have named suchdeaths as Karoshi, meaning “death from overwork”.
Working hours are a significant factor in managing work-life balance.Excessive working hours can create an imbalance which negatively affectspersonal and social life of an individual (Bielby, 1992). Overall job satisfactionof women, as compared to men, usually decreases with the increase in workinghours. Therefore, women are more likely to have an urge to reduce their workinghours. Working for long hours may increase job satisfaction as far as thepromotion panorama is concerned. This is especially true for women (Kodz etal., 2003). Although the recent national survey of labor force indicates a slightdecline in the number of employees working 50 hours and above but the declineis not satisfactory according to the ILO standards (Pakistan Bureau of Statistics,2014).
Job satisfaction is studied in many researches in Pakistan but working hoursis less often a prime substantive concern. The aim of this research is to assessthe working hours of employees and to validate the reasons of long working hoursidentified by Kodz et al (2003) and to gauge its impact on job satisfaction ofemployees working in service sector of Karachi.
Literature ReviewReasons given for long hours working
Organizations vary widely in cultures due to diversity in their norms, valuesand practices (Schein, 1985). According to Kodz et al. (2003) the literature andthe evidences form various case studies indicate that workload is a major reasonfor working long hours and this is attributable to ever increasing workload dueto the initiatives of restructuring of organizations. Flattening organizationalstructure leads to multitasking, greater customer focus, shortage of workforce,meeting culture, greater commuting requirements, IT/email overload etc. Theauthor also asserts that the attitude and expectations of managers and/orworkgroup are also sometimes significant in promoting a long hours culture. Insuch culture, presence at workplace is considered as a precursor of commitment.Unlike manual workers, this cultural pressure is more rampant amongst non-manual workers where the attitude of coworkers pushes them for unpaid overtime(Kodz et al., 2003). Job insecurity, career advancement, personal preference,career commitments are some other reasons given for working long hours.Usually employees have multiple reasons to do so which cannot be unscrambledeasily, particularly in an organization having a long hours culture (Boulin,
24
Mubeen, H. & Rashidi, M.Z.
Lallement & Michon, 2006). Another motive cited for working long hours waspersonal satisfaction. Also, employees prefer to work longer hours to bringquality in their work, promotions, pride and at times out of personal choice.Particularly at higher positions, some employees find their work so interestingthat it becomes fun for them. So, they are least bothered about increased workinghours (Kodz et al., 2003).
Happy OverworkingBosch (2006) argues that usually employees do not prefer working long hours.
Regardless of potential negative effects on health, there are people who worklong hours without expressing any offense. This phenomenon is known as “happyoverworking”. It is more common for employees working in countries havinglong hours culture like the United States, Australia and the United Kingdom ascompared to many other European countries.
“Happy overworking” is sometimes used as a caution against policyintervention to discourage long hours. Unreasonably long working hours havebeen expansively debated in Australia. It was observed that working long hours(more than 48 hours per week) is positively related to job quality. Therefore,considering that employees themselves prefer to work long hours. Subsequentresearch indicates that employees often are willing to work longer hours as a“rule of the game” and actively participate in the “rat race” because they knowthat the working hours are used to gauge their performance and even promotionsare based on this criterion. Employees who work shorter hours are penalized inone way or the other (Bosch, 2006).
Gauging Long HoursIt is difficult to know as to what extent employees take on long working
hours around the world. This can be attributed to the reason that it is a matterof perception as to how many hours are considered long enough to rootproblems. Therefore, working long hours is a relative concept (Lee &McCann, 2006).
There are three possible way to evaluate long hours. Since statutory workinghours are assumed to be the socially acceptable echelon of working hours, hoursexceeding this standard can be considered as long working hours. Another wayis to consider the number of working hours as long; which exceed the normalworking hours and when negative consequences on employees start surfacing.The third approach to examine long hours is to measure it according to theperception of employees. Hours beyond employees preferred working hours canbe recognized as long hours (Lee, McCann & Messenger, 2007).
25
Impact of Long Working Hours on Job Satisfaction
Long Hours and Managerial Positions“By working faithfully for eight hours a day, you may eventually get to be boss
and work twelve hours a day.” Robert Frost (Natti et al 2006 p.291). Working hoursmay vary across different professions and professional status. Often a manager’sjob responsibilities are not clearly defined with numerous ambiguities. Theactivities are usually disjointed taking place at remorseless pace. Time pressurelike having short deadlines, unannounced meetings, invariable interruptions, anddealing with numerous issues simultaneously is inherent to a manager’s job. Acomparative research of five countries indicated that many managers do not preferto work long hours to carry out their responsibilities. The same study revealed thatfull-time employees typically work 40 hours a week while managers work 5additional hours which accumulates their average weekly working hours to 45.Managerial working hours also vary slightly according to the gender. Femalemanagers work lesser number of hours as compared to their male counter parts.Unmarried male managers possessing achievement motivation and with lessinterest in hobbies are likely to work long hours. Married male managers withchildren are likely to work long hours. The same is true for single female managersand without children (Nätti, Anttila & Väisänen, 2006).
Long working hours and soaring demands come as a part and parcel ofmanagerial work. Managers can have multiple reasons behind stretching theirworking hours. There could be individual factors like attitude, personality, familystatus and demographic factors. Besides individual factors there can beorganizational and economic reasons as well. Good career prospects can also besecured through working long hours. Hence, managers who are highly committedto their work do so to achieve the most sought after reward like a high-status job(Nätti et al., 2006).
The statutory provisions regarding working hours and overtime are notapplicable to certain hierarchical levels e.g. managerial personnel with materialmanagement functions are exempted from working time provisions. An employeris not violating any such provision by expecting and making managerialemployees work beyond normal working hours. Employers would have beenheavily fined for violating the working hours provision, if this ‘manager’exception is not there. Therefore, it is obligatory to specifically define the postof a manager in terms of job grade. First-line and second-line managers (eventhird-line managers in some cases) are considered as ‘managers’. Other featuresof a ‘manager’ are the authority to direct subordinates, discretion over personalworking hours (can even work lesser number of hours, if they like) and aboveaverage compensation (Widner, 2010).
26
Mubeen, H. & Rashidi, M.Z.
‘Culture’: influence of managers and colleagues“A long hours culture is defined as being characterized by long hours working
being valued within an organization and interpreted as a sign of commitment”(Kodz et al. 2003 p.81). Literature identifies that there are various factors thatcontribute to the culture of long working hours. One such contributing factor isthe attitude and behavior of colleagues and managers within organization whereworking long hours or being present is valued and often perceived as a sign oforganizational commitment. This is in fact one of the most influential factors. Attimes managers themselves work long hours which reinforces such culture asthey were considered as role model to be followed. Many employees do notconsider this attitude of managers as a good example to be set for subordinates.Peer pressure, past trend within the organization, organizational norms, rat raceamongst employees to see who can put more hours and inability to declineunreasonable deadlines also fosters long hours culture. Long-hours culture orpresnteeism culture is the one where working extended hours is like a norm foremployees as they are expected and accepted to adapt to this culture. Othercontributing factors include performance appraisal, fear of being penalized,competitive environment, pay incentives, personal choice, customers, coworkers,boss, assembly line or machine (Kodz et al., 2003). Economic factors faced by theorganization like declining profitability, downsizing and job insecurity may alsoadversely affect working time (Nätti et al., 2006).
Long working Hours and Services SectorIn terms of the nature of economy, there has been a dramatic and noteworthy
increase in the size of services sector in the past 30 years. Therefore, this sectoris influencing the working time patterns greatly and perhaps working as a drivingforce. Generally, working hours in the services sector are longer as compared tothe manufacturing sector. In certain services subsectors like transport,communication, wholesale, retail trade, storage, hotels, restaurants, the averageweekly hours are usually higher as compared to other subsectors. The lowestaverage working hours were most typically observed in the education subsector,social services, and public sector employees involved in governmental functions.In other subsectors, such as real estate, renting and business activities, theworking hours vary radically across countries (Lee et al., 2007).
Differences in Working HoursThe issue of working time continues to be a pertinent since its inception.
There has been no comprehensive global analysis to compare working time rulesand regulations across various countries up till now (Widner, 2010). People have
27
Impact of Long Working Hours on Job Satisfaction
been optimistic since quite long about the working hours to be reduced or limitedthrough legal provisions but significant variation still exists in the actual workinghours between the developed and developing countries. Also, countries vary instatutory norms regarding working hours. There isn’t any evident mark ofworking hours being abridged. Many people argue that 40-hour and 48-hourworking week are only seen on papers and not practiced in real due to poorenforcement of stipulated working hours laws. Workers in developing countrieslike China as well as unexpectedly in some industrialized countries too areconsistently complaining about long working hours (Lee et al., 2007).
Concept of ‘Decent Working Time’ by the ILOInternational Labor Organization (ILO) has been continuously focusing on
the central issue of working time for the past many years. Besides establishinginternational standards to limit working hours, ILO has addressed numerousworking time related topics like providing for minimum weekly rest periods, paidannual leave, protections for night workers and equal treatment for part timeworkers (J.-Y. Boulin, 2006).
Profound changes in the nature of working time and employment relationship,witnessed in the past one or two decades, were highlighted in the ILO’s NinthInternational Symposium on Working Time. The economy has now shifted to 24-hourand 7-day economy due to excessive use of results-based employment relationships.This has significantly increased business requirements, the operating/opening hours,decentralization, neck to neck competition between businesses and workers. ThisSymposium assisted the ILO in further developing and refining the proposed policyframework for advancing “decent working time” (J.-Y. Boulin, 2006).
Dimensions of ILO’s Decent Working TimeCurrently, long working hours is one of the major concerns for the
International Labor Organization (ILO) and it is taking initiatives at internationallevel and pushing member states to curb this trend (Pakistan Bureau of Statistics,2012). ILO has suggested five crucial inter-connected dimensions of “decentworking time”. The first dimension relates to the protection of health and safetyof workers. The second dimension talks about family friendly working hours thathelp employees effectively manage both their work and family life. Thirddimension promotes gender equality. Fourth dimension considers working timeoptions like working hours record, sabbaticals and lifelong training schemescould prove to be instrumental in enhancing productivity and firm’ overallcompetitiveness. The last dimension argues for workers’ control over workinghours where an employee has choice to make individual decisions regardingmanaging his/her working hours (Anxo, Boulin & Fagan, 2006).
28
Mubeen, H. & Rashidi, M.Z.
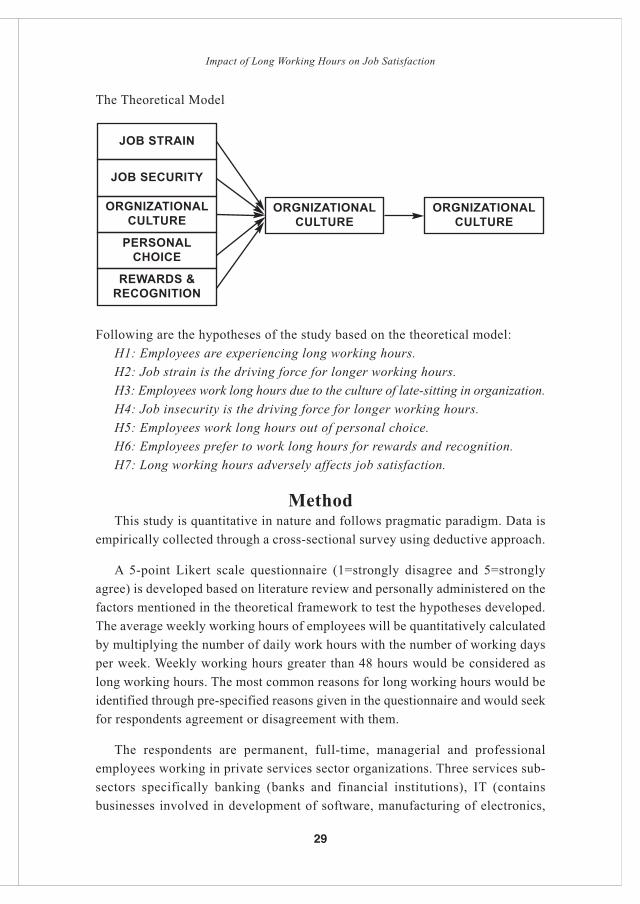
The Theoretical Model
Following are the hypotheses of the study based on the theoretical model:H1: Employees are experiencing long working hours.H2: Job strain is the driving force for longer working hours.H3: Employees work long hours due to the culture of late-sitting in organization.H4: Job insecurity is the driving force for longer working hours.H5: Employees work long hours out of personal choice.H6: Employees prefer to work long hours for rewards and recognition.H7: Long working hours adversely affects job satisfaction.
MethodThis study is quantitative in nature and follows pragmatic paradigm. Data is
empirically collected through a cross-sectional survey using deductive approach.
A 5-point Likert scale questionnaire (1=strongly disagree and 5=stronglyagree) is developed based on literature review and personally administered on thefactors mentioned in the theoretical framework to test the hypotheses developed.The average weekly working hours of employees will be quantitatively calculatedby multiplying the number of daily work hours with the number of working daysper week. Weekly working hours greater than 48 hours would be considered aslong working hours. The most common reasons for long working hours would beidentified through pre-specified reasons given in the questionnaire and would seekfor respondents agreement or disagreement with them.
The respondents are permanent, full-time, managerial and professionalemployees working in private services sector organizations. Three services sub-sectors specifically banking (banks and financial institutions), IT (containsbusinesses involved in development of software, manufacturing of electronics,
JOB STRAIN
JOB SECURITY
ORGNIZATIONALCULTURE
ORGNIZATIONALCULTURE
ORGNIZATIONALCULTURE
PERSONALCHOICE
REWARDS &RECOGNITION
29
Impact of Long Working Hours on Job Satisfaction
computers or products and services relating to information technology) and media(print and electronic content providers) are focused. Two organizations from eachsub-sector were selected. The respondents are engaged in non-manual jobs, like,professional services. Both males and females were included in the study. Asample size of 350 (same number of respondents from each of the three sectors)is selected at 95% confidence interval ± 5% margin of error by using quotasampling. Out of 350 questionnaires, 297 were returned after being filled.Response rate was 85%. 39 questionnaires were discarded due incompleteresponses. The final sample size is 258.
The study has one intervening variable, “Long Working Hours” and onedependent variables “Job Satisfaction” and five independent variables namely:Job strain, Organizational culture, Job insecurity, Personal choice, and Rewards& recognition.
Descriptive analysis, correlation analysis, regression analysis and chi-squaretest is done to verify the hypothesis. SPSS is used for statistical analysis and MSExcel for charts and graphs
Results & DiscussionThe aim of this study is to analyze the trend of long working hours and assess
its impact on job satisfaction of employees.
Profile of Respondents71% of the respondents of the study are males and 29% are females.
Majority of the respondents (59.3%) belong to the age group of 24 – 34 years,26% are between 35 to 50 years, 8.5% are less than 24 years and 6.2% areabove 50 years of age.
58% participants are married while 42% are either single, divorced orseparated.
46.5% respondents have children while the remaining 53.5% do not havechildren.
Out of 258 respondents of the study, 134 are from the banking, 73 from IT and51 from the media sector.
Reliability of ScaleThe overall reliability of scale is high (cronbach’s alpha = 0.848). The
reliability of Job Strain is also good (0.804), Rewards & Recognition (0.703) andJob Satisfaction (0.645) is acceptable while reliability of Long Working Hours(0.534), Organizational Culture (0.506) and Job Security (0.594) is low.
30
Mubeen, H. & Rashidi, M.Z.

Descriptive Analysis of all ConstructsExamining the descriptive statistics report of all dependent and independent
variables, it shows that their means are very similar and above 3 which is towardsthe agreement side of five-point Likert scale with the exception of JobSatisfaction which is 2.79 (SD=0.98668).
Correlation of VariablesAll correlations are statistically significant at 0.01 level and since the
significance value is 0.000 (which is less than 0.01), we can say that there is asignificant correlation among all the variables. The data also reveals that there isa strong positive correlation between Long Working Hours and Job Strain (0.664).Whereas the correlation of Long Working Hours with Organizational Culture,Job insecurity, Personal Choice, Rewards & Recognition is found to be positivebut weak. Job Satisfaction is negatively correlated to all variables. There is astrong positive correlation between Job Strain & Job Insecurity (0.649) andamong Personal Choice and Rewards & Recognition (0.655).
RegressionRegression analysis is done to test the significance of the model. The
adjusted R2 of the model is 0.470, which shows that independent variables areexplaining Long Working Hours 47% and remaining variation is unexplained.The model is significant as the p value is 0.000 (F = 46.574). The independentvariable, job strain, is significant as t = 7.934 and the coefficient is 0.494 whichshows that change in independent variable will effect dependent variable by0.494 units with change in one unit. The results indicate that Job Strain is onevery strong independent variable in the model while the rest (namelyorganizational culture, job insecurity, personal choice, rewards & Recognition)are not significant. So, then regression was checked by removing job strain toanalyze the significance of other constructs. After removing job strain from themodel, the adjusted R2 of the model is 0.340, which shows that independentvariables are explaining Long Working Hours 34% and remaining variation isunexplained. The model is significant as the p value is 0.000 (F = 34.125). Twoindependent variables, organizational culture and job insecurity comes out to besignificant. Organizational culture is significant as t = 3.431 and the coefficientis 0.213 which shows that change in organizational culture will effect LongWorking Hours by 0.213 units with change in one unit. Job insecurity is alsosignificant as t = 5.264 and the coefficient is 0.337 which shows that change injob insecurity will effect Long Working Hours by 0.337 units with change inone unit. However, Personal Choice and Rewards & Recognition still remaininsignificant (t < 2).
31
Impact of Long Working Hours on Job Satisfaction

Gauging Long Working HoursAs identified in the literature Long Working Hours can be measured in two ways.
Firstly, employees serving more than the statutory working hours, delineated in thelabor laws of Pakistan, would be considered as long working hours. Therefore,average weekly working hours are numerically calculated by multiplying the numberof working days per week with the average number of hours served per day.
Results indicate that 54% of the employees are working more than 48 hoursa week and around 13% employees are working up to 60 – 66 hours per week. Themean of weekly working hours is 49.0.
Another way to assess long working hours is through the four items in the 5point Likert questionnaire. The mean value of long working hours is 3.11 whichstatistically prove that employees are experiencing long working hours. To furtherprobe, cross tabulation between numerical and statistical data regarding longworking hours. The chi-square statistic value is 15.89 and p-value is 0.000, thereis statistically significant association between perceived Long Working Hours andActual Long Working Hours. It is observed that employees serving 48 hours a weekor less, even 85 out of 119 (71.4%) perceive that they are working long hours.
Split correlation – Gender wiseAt 1% level of significance, there is a correlation among all the variables. The
data also divulge that the positive correlation between Long Working Hours andJob Strain is comparatively stronger for males (0.686) than for females (0.611).On the other hand, the correlation between Long Working Hours andOrganizational Culture is greater for females (0.501) than for males (0.451).Similarly, correlation between Long Working Hours and Personal Choice is alsohigher for females (0.459) than for males (0.300). In case of relationship of LongWorking Hours with Job Insecurity, the value is greater for females (0.571) ascompared to males (0.518). Correlation between Long Working Hours andRewards & Recognition is same for both males and females. As far as therelationship between Long Working Hours and Job Satisfaction is concerned,correlation value is lesser for males (-0.514) than for females (-0.470).
Split correlation – Sector wiseFor all the three sectors (Banking, IT, Media), correlation between Long
Working Hours and Job Strain is statistically significant at 0.01 level and thesignificance value is 0.000 (which is less than 0.01). As compared to the mediasector, the correlation between Long Working Hours and Job Satisfaction isstronger in the Banking and IT sectors. There is a strong positive correlationbetween Job Strain & Job Insecurity in the Banking and Media sector.
32
Mubeen, H. & Rashidi, M.Z.
In the Banking sector, significant correlation of Organizational Culture withJob Strain (0.591), Job Insecurity (0.580), Personal Choice (0.358) and Rewards& Recognition (-0.419) is observed at 1% level of significance. In the other twosectors, Organizational Culture is not correlated to Personal Choice (0.196,significance value 0.168). It is also not correlated with Rewards & Recognition
Summary of AnalysisThis section encapsulates the major findings of the study. There are 7
hypotheses of the study based on the theoretical framework.
All correlations are statistically significant at 0.01 level and since thesignificance value is 0.000 (which is less than 0.01), we can say that there is asignificant correlation among all the variables. Job Satisfaction is negativelycorrelated to all variables while all other correlations are positive.
The overall reliability of scale is high (cronbach’s alpha = 0.848). Thereliability of Job Strain is also good (0.804), Rewards & Recognition (0.703) andJob Satisfaction (0.645) is acceptable while reliability of Long Working Hours(0.534), Organizational Culture (0.506) and Job Security (0.594) is low. Theadjusted R2 of the model is 0.470, which shows that independent variables areexplaining Long Working Hours 47% and remaining variation is unexplained.The model is significant as the p value is 0.000 (F = 46.574).
The numerical results regarding actual working hours indicate that 54% ofthe employees are working more than 48 hours a week and around 13%employees are working even up to 60 – 66 hours per week. The mean of actualweekly working hours is 49.0. The mean value of perceived long working hoursis 3.11 which statistically prove that employees are experiencing long workinghours. To further probe, cross tabulation between numerical and statistical dataregarding long working hours. The chi-square statistic value is 15.89 and p-valueis 0.000, there is statistically significant association between perceived LongWorking Hours and Actual Long Working Hours. It is observed that employeesserving 48 hours a week or less, even 85 out of 119 (71.4%) perceive that theyare working long hours. Therefore we accept H1 as the findings suggest thatemployees are experiencing long working hours.
Job strain is the driving force for longer working hours as the PearsonCorrelation value is 0.664 and it is significant. Gender-wise and Sector-wiseanalysis also indicates that Job Strain is more significantly correlated to LongWorking Hours as compared to all other variables. As per the regression analysisJob strain is significant as t = 7.934 and the coefficient is 0.494 which shows thatchange in independent variable will effect dependent variable by 0.494 units with
33
Impact of Long Working Hours on Job Satisfaction
change in one unit. The results indicate that Job Strain is one very strongindependent variable in the model. We can say that the data support ourhypothesis. Hence H2 is also accepted.
The Pearson Correlation value is 0.532 (p-value 0.000) shows significantcorrelation between Long Working Hours and Job Insecurity. Regression resultsalso report that Job insecurity is significant as t = 5.264 and the coefficient is0.337 which shows that change in job insecurity will effect Long WorkingHours by 0.337 units with change in one unit. We say data support ourhypothesis. Hence H3 is accepted that Job Insecurity is the driving force forlonger working hours.
Employees reported that they work long hours also due to the culture of late-sitting in organization. The Pearson Correlation value is 0.465 and it issignificant (p-value 0.000), we can say that there is significant correlationbetween Long Working Hours and Organizational Culture. Regression resultsalso report that Organizational Culture is significant as t = 3.431 and thecoefficient is 0.213 which shows that change in organizational culture willeffect Long Working Hours by 0.213 units with change in one unit. ThereforeH4 is accepted.
Positive but weak correlation is found between Long Working Hours andPersonal Choice as correlation value is 0.353 and p-value 0.000. But regressionresults indicate that Personal Choice insignificant as t<2. Hence H5 is rejected asdata does not support it. So, we can say Personal Choice is not the driving forcefor Long Working Hours.
Similarly, positive but weak correlation is found between Long WorkingHours and Rewards & Recognition (correlation value is 0.363, p-value 0.000).But regression results indicate that Personal Choice insignificant as t < 2. HenceH6 is also rejected and Rewards & Recognition is not the driving force for LongWorking Hours.
Long working hours adversely affects job satisfaction as both these variablesare significantly and negatively correlated. As compared to the media sector, thecorrelation between Long Working Hours and Job Satisfaction is stronger in theBanking and IT sectors.
ConclusionThe aim of this research was to assess the working hours of employees and to
validate the reasons of long working hours identified by Kodz et al (2003) viz.
34
Mubeen, H. & Rashidi, M.Z.
Job strain, Job insecurity, Organizational culture, Personal choice and Rewards& Recognition and to gauge impact of long working hours on job satisfaction ofemployees working in services sector of Karachi. The study proposes that full-time managerial employees associated with services sector, working in banking,IT and media firms of Karachi are experiencing long working hours where theyend up working more than 48 hours a week. The results of this study are inaccordance to the findings of Kodz et al (2003). Job Strain is the most significantfactor influencig long working hours which is also reported by Kodz et al (2003)and organizational culture and job insecurity also play an important role inpromting long-hours culture. Long working hours, Job strain, Job insecurity,Organizational culture, Personal choice and Rewards & Recognition adverselyaffects Job Satisfaction of employees.
RecommendationsTaking into account the findings of the study, it is proposed to the management
and human resource professionals to further investigate the issue of long workinghours in their organizations and its severity too. Long working hours is inverselyrelated to job satisfaction and this study confirms that job strain, organizationalculture and job insecurity are some of the prevalent reasons which pressurizeemployees to work more than the regular working hours. So, organizationsrequire some organizational development interventions to tackle with thesefactors effectively. Also, strict abidance should be ensured at the governmentallevel as long working hours is not merely an organizational issue rather it is amajor social concern as well. If this problem is not addressed as a sustentativeconcern, its numerous negative implications on the social behaviour ofindividuals and overall society will be devastating.
Areas for Further StudyThis study can be extended to other parts of the country to analyze the
differences among various regions. Furthermore, research needs to be done onother services subsectors of Karachi as well as the manufacturing sector toinvestigate the overall trend of long working hours in the city. An in-depthanalysis of all the individual factors contributing to long working hours isrequired to have the insights regarding each factor.
ReferencesAla-Mursula, L., Vahtera, J., Kouvonen, A., Väänänen, A., Linna, A., Pentti, J. &
Kivimäki, M. (2006). Long hours in paid and domestic work andsubsequent sickness absence: does control over daily working hoursmatter? Occupational and Environmental Medicine, 63(9), 608-616.
35
Impact of Long Working Hours on Job Satisfaction
Anxo, D., Boulin, J. Y. & Fagan, C. (2006). Decent Working Time in A Life-Course Perspective1. Decent working time, 93.
Bielby, D. D. (1992). Commitment to work and family. Annual Review ofSociology, 281-302.
Bosch, G. (2006). Working time and the standard employment relationship.Decent working time, 41.
Boulin, J. Y., Lallement, M. & Michon, F. (2006). Decent working time inindustrialized countries: Issues, scopes and paradoxes. Decent workingtime, 13.
Boulin, J.Y. (2006). Decent working time: New trends, new issues: ILO.
Dembe, A. E., Erickson, J. B., Delbos, R. G. & Banks, S. M. (2005). The impactof overtime and long work hours on occupational injuries and illnesses:new evidence from the United States. Occupational and EnvironmentalMedicine, 62(9), 588-597.
Golden, L. (2009). A brief history of long work time and the contemporarysources of overwork. Journal of business ethics, 84, 217-227.
Kodz, J., Davis, S., Lain, D., Strebler, M., Rick, J., Bates, P., . . . Gineste, S.(2003). Working long hours: a review of the evidence. Volume 1–Mainreport. Employment Relations Research Series(16).
Lee, S. & McCann, D. (2006). Working time capability: Towards realizingindividual choice. Decent working time, 65.
Lee, S., McCann, D. & Messenger, J. C. (2007). Working Time Around the World
Nakanishi, N., Nishina, K., Yoshida, H., Matsuo, Y., Nagano, K., Nakamura, K.,. . . Tatara, K. (2001). Hours of work and the risk of developing impairedfasting glucose or type 2 diabetes mellitus in Japanese male officeworkers. Occupational and Environmental Medicine, 58(9), 569-574.
Nätti, J., Anttila, T. & Väisänen, M. (2006). Managers and working time inFinland. Decent working time, 289.
Pakistan Bureau of Statistics. (2012). Pakistan Employment Trends 2011.
Pakistan Bureau of Statistics. (2014). Pakistan Employment Trends 2013.
Rubery, J., Ward, K. & Grimshaw, D. (2006). Time, work and pay: understandingthe new relationships. Decent working time, 123.
36
Mubeen, H. & Rashidi, M.Z.
Schein, E. H. (1985). Defining organizational culture. Classics of organizationtheory, 2, 381-395.
Shields, M. (1999). Long working hours and health. Health Reports-StatisticsCanada, 11, 33-48.
Spector, P. E., Cooper, C. L., Poelmans, S., Allen, T. D., O’DRISCOLL, M.,Sanchez, J. I., . . . Lu, L. (2004). A Cross National Comparative Study ofWork Family Stressors, Working Hours, and Well Being: China and LatinAmerica Versus The Anglo World. Personnel Psychology, 57(1), 119-142.
Spurgeon, A., Harrington, J. M. & Cooper, C. L. (1997). Health and safetyproblems associated with long working hours: a review of the currentposition. Occupational and Environmental Medicine, 54(6), 367-375.doi: 10.1136/oem.54.6.367
Trimpop, R., Kirkcaldy, B., Athanasou, J. & Cooper, C. (2000). Individualdifferences in working hours, work perceptions and accident rates inveterinary surgeries. Work & Stress, 14(2), 181-188.
Wada, K., Katoh, N., Aratake, Y., Furukawa, Y., Hayashi, T., Satoh, E., . . .Aizawa, Y. (2006). Effects of overtime work on blood pressure and bodymass index in Japanese male workers. Occupational Medicine, 56(8),578-580. doi: 10.1093/occmed/kql106
Widner, J. (2010). Rules on working hours and statutory rest periods relaxed.Retrieved from http://www.internationallawoffice.com/newsletters/website: http://www.internationallawoffice.com/newsletters/
Yang, H., Schnall, P. L., Jauregui, M., Su, T.-C. & Baker, D. (2006). Work Hoursand Self-Reported Hypertension Among Working People in California.Hypertension, 48(4), 744-750. doi: 10.1161/01.hyp.0000238327.41911.52
37
Impact of Long Working Hours on Job Satisfaction

38
Perception about Service Quality inShifa International Hospital
Javed Iqbal*International Islamic University Islamabad
The paper examines the factors responsible for service quality in one of theprivate sector organizations believed to be managed well. The simplifiedSERVQUAL model has been used to collect data through a survey of more thansix hundred respondents on convenience basis. The data have been collected fromthe customers approached the organization to front line employees. It is foundthat customers are happy as a whole with minor pockets of dissatisfaction. Forinstance, the customer had to wait for a reasonable amount of time to receive theservices; it suggests that the service quality mechanism designed and in place issatisfactory, however, some area (s) need improvement to make it more efficient.The model can be used by other similar organizations in the same industry orany other line of business with minor changes in private / public sectors. Thefindings confirmed the previous studies conducted about the topic.
Keywords: Survey, customer perception, service quality, Shifa International Hospital, SERVEQUAL
IntroductionService quality is an attitudinal build that depends upon service experience of
customer regarding a given vender or supplier (Cronin & Taylor, 1992). It is theoutcome of customer assessment process when they associate desires with whatthey receive or observe in a particular situation (Gronroos, 1984). Quality is acomparison between wants of service receiver and recognition of service(Parasureman et al, 1988); in other words a distinction between customerexpectations before performance of actual service and their observations of whatthey have actual received (Asubonteng et al, 1996). Improvement in servicequality expedite client fulfillment, reduces administration cost and enhancesprofit (Stevenson, 2002). Service quality is an instrument for survival andretention of customer which leads to loyalty in the long run (Dabholker, Shepherd& Thrope, 2000). It creates customer satisfaction that is the focal entity in today’scompetitive business environment; quality is considered a source of success(Annamalai et al, 2011) The customer can best be served if their expectations(needs and wants) are known. And they can be identified through research;however, there is not much research in the country about service quality. A fewstudies are found in literature such as Khan (2010), Naseem (2011) & Iqbal et al
39
Journal of Business Strategies, Vol.8, No.1, 2014, pp 39–51
__________________________________________________________________________________*[email protected]
(2013). This paper is an attempt to visit the customers of an organization toidentify the parameters of their satisfaction so that they can be applied by themor any other who is interested in to improve the level of offerings and harvest thebenefits stem out of their efforts. It is accomplished through a survey that consistsof eight dimensions of quality (Evans & Lindsay, 2013) which has beenaugmented with two more dimensions to accommodate specific requirements ofa developing nation like Pakistan.
Literature ReviewQuality is the “judgment of or attitude related to the superiority of a service
which is based on disconfirmation paradigm” (Parasuraman et al, 1988). It is arelationship between the levels of service the customer receives from the providerand their expectations and perceptions (Rajeswari & Sunmista, 2011). Lewis &Booms (1983) argue that “service quality is a measure of how well the servicelevel delivered matches customer expectations. Delivering quality service meansconforming to customer expectations on a consistent basis.”
Quality has been examined from product and service perspectives. Productquality has been seen as “free from defects”, “conformance to requirements”(Crosby, 1979), “fitness for use” (Juran & Godfrey, 1999). ISO has combinedboth product and service and defined quality as “the totality of features andcharacteristics of a product or service that bears its ability to satisfy stated orimplied needs.” (ISO 8402-1986). However, services are different from productsbecause they are intangible, heterogeneous and inseparable; therefore, it is noteasy to define service quality because it is more difficult for customer to evaluateit. Perceptions are formed through consumer expectations with actual servicesreceived and it involves the process of delivery (Parasuraman et al, 1985). Itsuggests the impediments on the way to define service quality than goods quality.
Service quality is a multidimensional phenomenon which was put forward bymany specialists. Garvin (1987) has identified a set of them: features,performance, reliability, conformance, durability, serviceability, aesthetics andperceptions. Another set of researchers focused on services and suggest a rangeof factors: tangibility, reliability, responsiveness, assurance and empathy(Parasuraman et al, 1985). These determinants have been the part of the well-known SERVEQUAL model that was empirically tested but criticized on theground that it is not applicable in retail environment (Dabholker et al, 1996).Recently Evans & Lindsay (2013) put forward eight dimensions of servicequality: time, timeliness, accuracy, consistency, completeness, accessibility,courtesy and responsiveness. The model is simpler than the previous one and is
Iqbal, J.
40
more understandable which needs empirical test. The paper is an attempt to putit in practice; therefore, it is explained in greater detail.
Time is the length of time measured in seconds, minutes, hours required to performan activity (Bahia & Nante, 2000). For example, they say, “while we were in arestaurant we waited a lot, we tried to capture the attention of waiter as well but he didnot respond us, so we decided to leave that restaurant and catch another one.” It is thetime customer has to wait normally in a queue so that the service delivery process starts.
Timelines is the time line promised for its completion e.g. taking Electrocardiography(ECG) in a healthcare unit. How many minutes are required to do an x-ray and receiveits result? Other things being equal shorter the timeline, the better it is and vice versa.However, it might be different in fast food preparation cooking; the food has to be cookedproperly to deliver it to customer. If it is delivered quickly but not properly cooked, thecustomer will be not happy. If services are not delivered according to promised timecustomer feel disappointed, dejected and dissatisfied (Yang, Peterson & Cai, 2003).
Completeness is the “process from beginning to end where all the tasks areprovided and requirements are filled.” (Martin, Molina & Esteban, 2007). In ahospital environment, testing blood to take the ‘profile’ or measuring blood sugar,cholesterol and other parameters involves taking blood in a required quantity,examining it, reporting it and delivering the report to the physician for furtheraction. If the hospital management promised to do it in three hours performing allthe required procedures then leads to customer satisfaction.
Courtesy is the way employees respond towards the clients (Jayaraman,Shauker & Mun, 2010); the behavior of front desk personnel (Evans & Lindsay,2013). It is graciousness, admiration, kindness and scalability (Wels-Lips, Ven &Pieters, 1998); is the employees’ supportive attitude, and individualizedconsideration (Parasuraman, 1991). Courtesy is helpful to create loyalty.
Consistency is related with the performance of service for every customer in asimilar way. Wel-Lips and his colleagues (1998) say it is the regularity, constancy,steadiness and uniformity of the level of service (Biolos and Nantel 2000) but it isthe most important factor for market leader (Walter, Ken & Curtis, 1999).
Accessibility is the approachability to the service point or personnel withoutany obstruction (Wels-Lips, Ven and Pieters, 1998). It helps customer to receivean offerings; sometimes convenience is related with location of service point orcustomer receive center (Yang, Peterson & Cai, 2003). However, in terms ofhospitals, they are situated at a given location; here accessibility may be abouttransport links or wider roads or less busy roads/areas.
41
Perception about Service Quality in Shifa International Hospital

Accuracy is interpreted as performance “right the first time”. (Juran & Godfrey, 1999).Yang (2003) and his colleagues call it flowers completion, precision and correctness.Accuracy leads to repeat purchase, reliability, reputation and integrity (Negi, 2009).
Responsiveness implies keenness of employees (Wel-Lips, Ven and Pieters, 1998),the willingness of personnel (Parasaraman, 1991). Consumer switching rate is low inresponsive organization and vice versa (Jayaraman, Shanker & Mun, 2010).
The above factors determine overall quality or satisfaction; the concept was coinedby Negi (2009) and applied by a Danish Company (Frohlich, 2009). The statisticalanalysis is linked with it in this study. The overall quality is the dependent variable inthe regression analysis that is determined through eight independent variables.
MethodIt has been divided into two subsections.
ParticipantsThe focus of the study is the assessment of quality at the employees working at
front desk and the quality management system that they follow which has been designedby the organization concerned. Therefore, it is a generic work instead of specific to theindustry or the industrial units. However, data have been collected from a specific entityto examine its mechanism. It may be helpful to generate special instances to arrive atmeaningful conclusion and to produce guidelines for those who are interested in toimplement such initiatives or service quality systems in their respective organizations.
The survey was administrated at Shifa International Hospital, Islamabad. Thesample comprised of 607 patients or their representatives collected on conveniencebasis. Total 650 questionnaires were administered but 43 of them were not returned;therefore, the response rate was 93 percent because of self-administration.
InstrumentThe questionnaire was based upon Evens & Lindsay (2013) model; it had been
enhanced with two more dimensions taken from the literature. Eleven questionswere formed; one each from all the dimensions except accessibility andconvenience. It was split into two questions to broaden the phenomenon and makeit more understandable.
ScaleFive point Likert scale was used to measure the degree of responses; the strongest
response was measured as “strongly agree” and the weakest response was measuredas “strongly disagree”. The SPSS version 15 was applied to determine statisticaloutcomes; model summary, ANOVA and coefficients were measured in the linear
42
Iqbal, J.
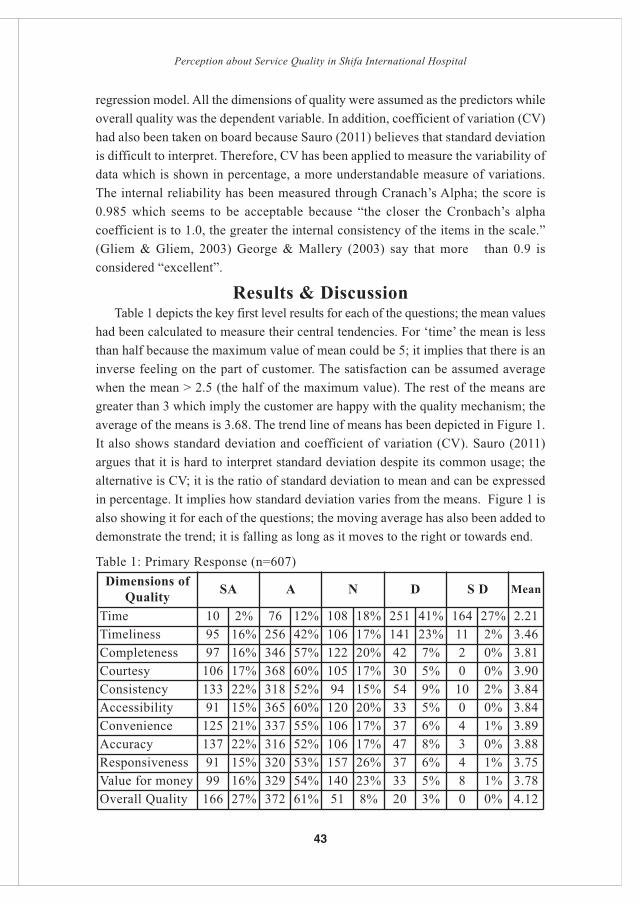
regression model. All the dimensions of quality were assumed as the predictors whileoverall quality was the dependent variable. In addition, coefficient of variation (CV)had also been taken on board because Sauro (2011) believes that standard deviationis difficult to interpret. Therefore, CV has been applied to measure the variability ofdata which is shown in percentage, a more understandable measure of variations.The internal reliability has been measured through Cranach’s Alpha; the score is0.985 which seems to be acceptable because “the closer the Cronbach’s alphacoefficient is to 1.0, the greater the internal consistency of the items in the scale.”(Gliem & Gliem, 2003) George & Mallery (2003) say that more than 0.9 isconsidered “excellent”.
Results & DiscussionTable 1 depicts the key first level results for each of the questions; the mean values
had been calculated to measure their central tendencies. For ‘time’ the mean is lessthan half because the maximum value of mean could be 5; it implies that there is aninverse feeling on the part of customer. The satisfaction can be assumed averagewhen the mean > 2.5 (the half of the maximum value). The rest of the means aregreater than 3 which imply the customer are happy with the quality mechanism; theaverage of the means is 3.68. The trend line of means has been depicted in Figure 1.It also shows standard deviation and coefficient of variation (CV). Sauro (2011)argues that it is hard to interpret standard deviation despite its common usage; thealternative is CV; it is the ratio of standard deviation to mean and can be expressedin percentage. It implies how standard deviation varies from the means. Figure 1 isalso showing it for each of the questions; the moving average has also been added todemonstrate the trend; it is falling as long as it moves to the right or towards end.
Table 1: Primary Response (n=607)Dimensions of
Quality SA A N D S D Mean
Time 10 2% 76 12% 108 18% 251 41% 164 27% 2.21Timeliness 95 16% 256 42% 106 17% 141 23% 11 2% 3.46Completeness 97 16% 346 57% 122 20% 42 7% 2 0% 3.81Courtesy 106 17% 368 60% 105 17% 30 5% 0 0% 3.90Consistency 133 22% 318 52% 94 15% 54 9% 10 2% 3.84Accessibility 91 15% 365 60% 120 20% 33 5% 0 0% 3.84Convenience 125 21% 337 55% 106 17% 37 6% 4 1% 3.89Accuracy 137 22% 316 52% 106 17% 47 8% 3 0% 3.88Responsiveness 91 15% 320 53% 157 26% 37 6% 4 1% 3.75Value for money 99 16% 329 54% 140 23% 33 5% 8 1% 3.78Overall Quality 166 27% 372 61% 51 8% 20 3% 0 0% 4.12
43
Perception about Service Quality in Shifa International Hospital
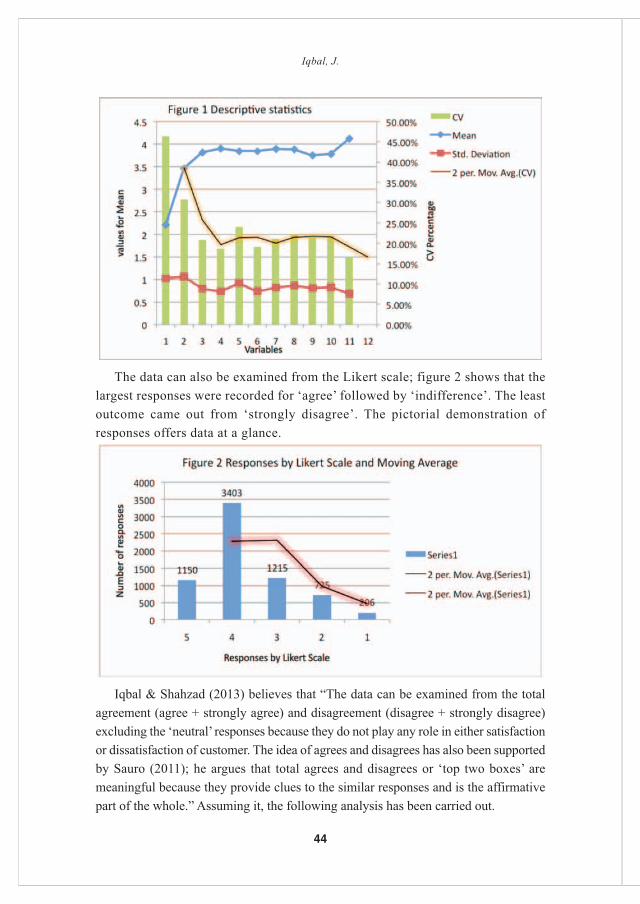
The data can also be examined from the Likert scale; figure 2 shows that thelargest responses were recorded for ‘agree’ followed by ‘indifference’. The leastoutcome came out from ‘strongly disagree’. The pictorial demonstration ofresponses offers data at a glance.
Iqbal & Shahzad (2013) believes that “The data can be examined from the totalagreement (agree + strongly agree) and disagreement (disagree + strongly disagree)excluding the ‘neutral’ responses because they do not play any role in either satisfactionor dissatisfaction of customer. The idea of agrees and disagrees has also been supportedby Sauro (2011); he argues that total agrees and disagrees or ‘top two boxes’ aremeaningful because they provide clues to the similar responses and is the affirmativepart of the whole.” Assuming it, the following analysis has been carried out.
44
Iqbal, J.

Figure 3 depicts the combined responses (agrees and disagrees): 14% believethat they wait for the service for hours; 58% have received the service when itwas promised; 73% have received the full bundle of expected service; 78%believe that employees treated them cheerfully; 74.9% declare that service wasuniform to every customer; 75 % feel convenient to obtain the service; 76% viewthey have received the service right the first time; 74.9% have the opinion thatservice personnel react quickly; 67% say the employees solved their unexpectedproblems; 70% view that the service is good value for money; and anoverwhelming majority of 88% believe that overall quality is good enough. Itmay be worthwhile to mention that the percentage of ‘agrees and disagrees’ havebeen calculated by excluding ‘neutral’ responses from the denominator. The ‘net’(total agrees minus total disagrees) values have also been shown to make thephenomenon more understandable.
The results have also been tested statistically; the regression has been shownin tables 2-4. Most of the values support basic assumptions outlined above thatthe overall quality (the dependent variable) seems to be acceptable despite somevariation. Beta values suggest that the relationships are both positive andnegative; some of them are strong while some are weak but the relationshipdoes exist.
The regression model for Shifa International Hospital is: Y (Overall quality)= 1.546 + 0.139 (time) + 0.372 (courtesy) + 0.500 (consistency) + 0.153(responsiveness)
Convenience, accuracy and timeliness are not significant; accessibility andcompleteness do not contribute. It suggests that the model is partially applicablebecause half of the independent variables support the dependent variable.
45
Perception about Service Quality in Shifa International Hospital
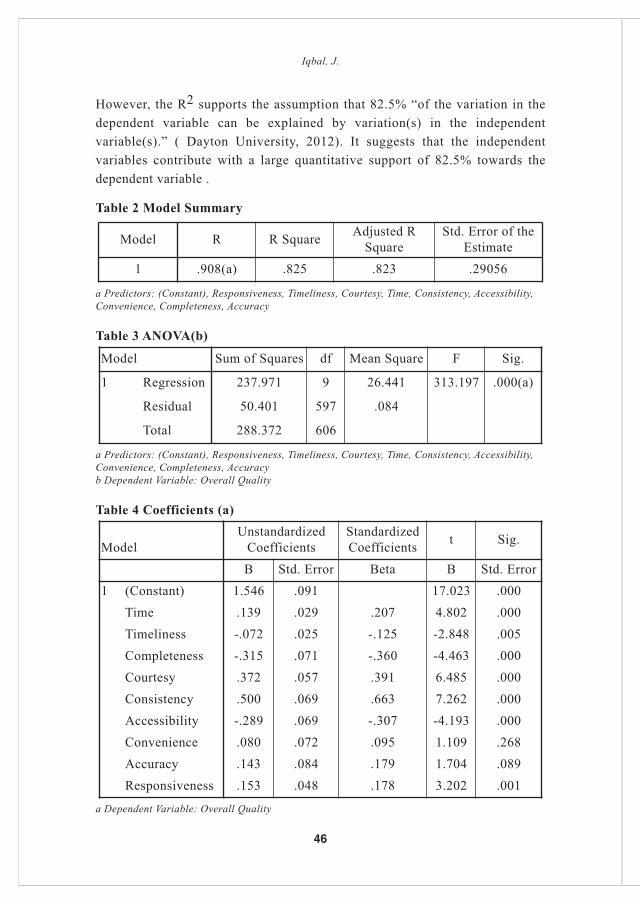
However, the R2 supports the assumption that 82.5% “of the variation in thedependent variable can be explained by variation(s) in the independentvariable(s).” ( Dayton University, 2012). It suggests that the independentvariables contribute with a large quantitative support of 82.5% towards thedependent variable .
Table 2 Model Summary
a Predictors: (Constant), Responsiveness, Timeliness, Courtesy, Time, Consistency, Accessibility,Convenience, Completeness, Accuracy
Table 3 ANOVA(b)
a Predictors: (Constant), Responsiveness, Timeliness, Courtesy, Time, Consistency, Accessibility,Convenience, Completeness, Accuracyb Dependent Variable: Overall Quality
Table 4 Coefficients (a)
a Dependent Variable: Overall Quality
ModelUnstandardized
CoefficientsStandardizedCoefficients t Sig.
B Std. Error Beta B Std. Error1 (Constant) 1.546 .091 17.023 .000
Time .139 .029 .207 4.802 .000Timeliness -.072 .025 -.125 -2.848 .005Completeness -.315 .071 -.360 -4.463 .000Courtesy .372 .057 .391 6.485 .000Consistency .500 .069 .663 7.262 .000Accessibility -.289 .069 -.307 -4.193 .000Convenience .080 .072 .095 1.109 .268Accuracy .143 .084 .179 1.704 .089Responsiveness .153 .048 .178 3.202 .001
Model Sum of Squares df Mean Square F Sig.
1 Regression 237.971 9 26.441 313.197 .000(a)
Residual 50.401 597 .084
Total 288.372 606
Model R R Square Adjusted RSquare
Std. Error of theEstimate
1 .908(a) .825 .823 .29056
46
Iqbal, J.
The findings confirm the previous work of Iqbal & Shahzad (2013), Rehman(2012) & Naseem (2011). Other organizations can apply the quality frameworkor enhance their level of customer satisfaction; the new organizations canintroduce such a system for better results.
The results of this study are in line with the findings of Solayappan,Jayakrishnan & Velmani (2011). They studied the service quality gap using theSERVQUAL model, and found that the gap was lowest for responsiveness as“employees at hospitals are always willing to help the patients”, and then the‘time’ as the operating hours of the hospital are considered convenient. Similarly,a comparative study of public and private health sector in Pakistan revealed thatpatients are more satisfied with the service quality in private hospitals. The meanof all dimensions for private hospitals was higher than public sector hospitals,except for assurance (Irfan & Ijaz, 2011).
The time dimension shows that the patients of the Shifa Hospital were notsatisfied due to long waiting time. It corresponds with the study of Malaysianhealth care sector that concludes patients were dissatisfied with hospitalmanagement as they did not respond in time. It took them more than thirtyminutes to receive the services (Suki et al, 2011). Samreen & Ahmed (2011)recommend that Karachi based hospitals should work for improving the ‘waitingtime’. The patients of Shifa Hospital believe that the services are consistent,responsive and are good value for money; the similar results were captured inthe previous studies (Ahmed & Samreen, 2011).
ConclusionThe purpose of the paper was to identify the factors that are responsible for
satisfaction of customer to receive quality services in Shifa InternationalHospital. The response of the customer has been divided into three categories:those who are satisfied with the mechanism of quality, those who are not happywith it, and those who did not show either of these; the objective was to measurethe responses according to the degree of intensity. Consequently three viewsemerged: satisfaction, dissatisfaction and indifference. There are variations at theindividual level or responses; for example, the ‘time’ or waiting time wasnegatively perceived which implies that customer had to wait for a reasonablelength of time to receive the services. However, they are happy about the othervariables and as a whole.
This study has several limitations. Firstly, it was based on a sample of 601respondents of a single hospital; the external validity of the study could beenhanced by expanding it to different hospitals in different regions of the country.
47
Perception about Service Quality in Shifa International Hospital
Secondly the findings for generalization can be improved by using StratifiedRandom Sampling.
The study has significant managerial implications for the managers of healthcare industry. The findings reveal that the patients of Shifa hospital are satisfiedwith the overall service quality however, attention should be paid to improve thewaiting time.
ReferencesAhmed, R. & Samreen, H. (2011). Assessing the Service quality of some selected
hospitals in Karachi based on the SERVQUAL model. Pakistan BusinessReview. 266-314.
Annamalai.S., Jothi. J. & Sethu, V. (2011). Quality Measurement for HospitalServices. 3rd International Conference on Information and FinancialEngineering IPEDR, 12.
Asubonteng P., McCleary K. & Swan, J. (1996). SERVQUAL revisited: A criticalreview of service quality. Journal of Services Marketing, 10(6), 62 - 81.
Bahia, K & J. Nantel (2000). A reliable and valid measurement scale forperceived service quality of banks, International Journal of BankMarketing, 18 (2), 84-91.
Biolos, Jim (2002). Six Sigma Meets the Service Economy. Boston: HarvardBusiness School Press.
Cronin, J. & Taylor, S. (1992). Measuring service quality: a reexamination andextension, Journal of Marketing, 56(July), 55-68.
Crosby, P (1979) Quality is Free. New York: McGraw-Hill.
Dabholkar, P.A., Thorpe, D.I. & Rentz, J.O. (1996). A Measure of Service Qualityfor Retail Stores: Scale Development and Validation. Journal of theAcademy of Marketing Science. 24(1), 3–16.
Dayton University, Interpreting SPSS Regression Output. [Online]:http://campus.udayton.edu/~jrs/tools/download/interpeting%20SPSS%20regression%20output.pdf (Retrieved in December 03, 2013)
Evans, James R. & William M. Lindsay (2013). The Management and Control ofQuality, Cincinnati: South-Western.
Frohlich Peter K (2009). How we measure quality? [Online]: www.DEIF.com.(Retrieved in December 03, 2013).
48
Iqbal, J.
Garvin, D., A. (1987). Competing on the Eight Dimensions of Quality. HarvardBusiness Review, 65, 421-422.
George, D. & Mallery, P. (2003). SPSS for Windows step by step: A simple guideand reference. 11.0 update (4thed.). Boston: Allyn & Bacon.
Gliem, Joseph A. & Rosemary R. Gliem (2003). Calculating, Interpreting, andReporting Cronbach’s Alpha Reliability Coefficient for Likert-TypeScales, 2003 Midwest Research to Practice Conference in Adult,Continuing, and Community Education. [Online]:https://scholarworks.iupui.edu/bitstream/handle/1805/344/Gliem+&+Gliem.pdf?sequence=1 (Retrieved in November 03, 2013).
Gronroos. (1984). A service quality model and its marketing implications.Journal of the Academy of Marketing Science, 24 (Winter), 36 – 44.
Irfan S. M., Ijaz, A. (2011). Comparison of service quality between Private andpublic hospitals: empirical evidences from Pakistan. Journal of Qualityand Technology Management, 7(1), 1,22.
Iqbal, J. & Shahzad, M. (2013). Consumer perception of service quality: the caseof passport office in Pakistan, Working Paper FMS-01-2013, Faculty ofManagement Sciences International Islamic University Islamabad.
Iqbal, J. (2014). Perceptions of customer about the service quality of front linepersonnel and the quality system in place in National Database andRegistration Authority, Working Paper FMS-01-14, Department ofTechnology Management, Faculty of Management Sciences,International Islamic University Islamabad
Jayaraman, M, Shankar. C & Hor Wai Mun (2010). Service Quality Delivery andIts Impact on Customer Satisfaction in the Banking Sector in Malaysia.International Journal of Innovation, Management and Technology, 1(4),398-404.
Juran, J. & Blanton, A.G. (1999). Juran’s Quality Handbook, New York: McGraw Hill.
Lewis, R.C. & Booms, B.H. (1983). The Marketing Aspects of Service Quality inL.L. Berry G.L.Shostack and G. D. Upah (eds), EmergingPerspectives onService Marketing, American Service Association, Chicago,1983, 99-107.
Martin-Consuegra, D., Molina, A. & Esteban, A., (2007). An Integrated Model ofPrice, Satisfaction and Loyalty: an Empirical Analysis in the ServiceSector, Journal of Product & Brand Management, 16(7), 459–468.
49
Perception about Service Quality in Shifa International Hospital
Negi, R. (2009). User’s Perceived Service Quality of Mobile Communications:Experience from Ethiopia. International Journal of Quality andReliability Management, 26(7), 699-711.
Naseem. A., Ejaz. S. & Malik. K. P. (2011). Improvement of Hotel ServiceQuality: An Empirical Research in Pakistan, International Journal ofMultidisciplinary Sciences and Engineering, 2(5), 1-11.
Parasuraman, A., Zeithaml, V.A. & Berry, L.L., (1985). A Conceptual Model ofService Quality and its Implications for Future Research, Journal ofMarketing. 49 (Fall 1985), 41-50.
Parasuraman, A., Berry, L.L. & Zeithaml, V.A. (1991). Refinement andReassessment of the SERVQUAL Scale. Journal of Retailing. 67(1), 39-48.
Parasuraman, A., Zeithaml, V.A. & Berry, L. (1988). SERVQUAL: a Multiple-Item Scale for Measuring Consumer Perceptions of Service Quality.Journal of Retailing. 64(1), 12-40.
Rajeswari, Dr.K. and Sunmista Mrs. K.J. (2011). Perceptions of Customers onService Quality of Post Offices -A Comparative Study. InternationalJournal of Business and Behavioral Sciences. 1(7),
Rehman. S. (2012). Measuring Service Quality in Public and Private SectorUniversity Libraries of Pakistan. Pakistan Journal of Library &Information Science, 13(2012), 52-56.
Sauro, Jeff (2011). How to interpret survey responses: 5 techniques, Availableat: http://www.measuringusability.com/blog/interpret-responses.php(accessed 12 December 2013).
Solayappan,A. Jayakrishnan, J. & Velmani, S. (2011). Quality Measurement forHospital Services. 3rd International Conference on Information andFinancial Engineering IPEDR, 12 IACSIT Press, Singapore.
Stevenson, W (2002) Production and Operations Management, New York:McGraw Hill
Suki, N. M., Lian, J. C. C., Suki, N. M. (2011). Do patients‘ perceptions exceedtheir expectations in private healthcare settings? International Journalof Health Care Quality Assurance, 24(1), 42-56.
Walker, D. (1990). Customer First: A Strategy for Quality Service, London: Gower.
50
Iqbal, J.
Walter J. Ferrier, Ken G. Smith & Curtis M. Grimm (1999). The Role ofCompetitive Action in Market Share Erosion and Industry Dethronement:A Study of Industry Leaders and Challengers. The Academy ofManagement Journal. 42(4), 372-388.
Wels-Lips, I., Ven, M. & Pieters, R., (1998). Critical Services Dimensions: anEmpirical Investigation across Six Industries. International Journal ofService Industry Management, 9(3), 286-309.
Yang, Z., Peterson, R. & Cai, S., (2003). Service Quality Dimensions of InternetRetailing. Journal of Services Marketing, 17(7), 685-700.
Yavas U., Bilgin Z. & Shemwell D. J. (1997). Service Quality in the BankingSector in an Emerging Economy:A Consumer Survey. InternationalJournal of Bank Marketing. (15) 6, 217-223.
51
Perception about Service Quality in Shifa International Hospital

52
Investigating the Causes ofPersistent Trade Deficit:
A Study based onMarshal-Lerner Frame WorkMuhammad Tariq* & Yasmeen Amber Khuhro
Iqra University, Karachi, Pakistan&
Ranjeet KumarGreenwhich University, Karachi, Pakistan
The focus of this paper is to investigate the causes of persistent Deficit in Pakistan’sBalance of Trade. The study considers one of the significant factor i.c. Currency. Thestudy investigates the Marshal-Lerner (M-L) conditions to study the cause and effectbetween Currency and Trade Balance, by applying OLS estimation Technique. Thestudy concludes that Currency Depreciation can benefit only in case of Trade withChina because the M-L factor (εχ + εµ) is greater than 1. The currency Depreciationhas positive effect on Balance of Trade. However, Trade with Sri Lanka in case ofCurrency Depreciation may be made favorable since total of elasticity is close to 1.More efforts than FTA are required to avail gain in Trade with Sri Lanka. The Tradewith India and Japan may have adverse effect on the Balance of Trade in case ofcurrency depreciation sine M-L factor is less than 1. The Trading of items withinelastic demand might be probable reason for adverse trade (in case of Currencydepreciation) with Japan and disturbed and irregular pattern of Trade with Indiamight be the strong reason for unfavorable Trade outcome with India. It is suggestedthat best way to improve Trade Balance is adding Trade items such as technologicalor innovative products and adding more items with more elastic demand. Accompaniedwith it, the concept of J-Curve theory should be added in Trade Policy by sustainingand increasing domestic production capacity to that describes the favorable outcomein trade after currency depreciation may be obtained in long run only if home country’sproduction is not only sustained but also it is improved. It may be made by resolvingthe energy crisis and motivating the local Industries for more production withGovernment support for export across borders.
Keywords. Marshal-Lerner condition, Co-integrating Vector, Currency Depreciation.
IntroductionThe role of Trade is highly crucial in economic development of an economy.
The Agricultural as well as Industrial Development may be channelized on the
53
Journal of Business Strategies, Vol.8, No.1, 2014, pp 53–62
__________________________________________________________________________________*[email protected]
bases of Trade Policy. The Investment and employment may be directed andincreased due to Foreign Trade. The efficiency of local producers may be boasteddue to competition with foreign producers. Consumers can enjoy more choicesespecially in terms of availability, variety and price due to cross border Trade.Foreign Policy of Pakistan (since 1950s) has been focusing on growth in Trade.Friendship with an economy is mainly due to Trade relations.. Pakistan is memberof WTO. The most recent Trade Policy (2012-2015) focuses on regional tradeand it emphasizes on institutional work for export promotion. Pakistan’s effortsfor Regional Trade include; Free Trade Agreements (FTA) with many countriessuch as: Pakistan-China FTA (July 1, 2007), Pakistan- Sri Lanka FTA (August2002), and multilateral agreement with South Asian countries SAFTA (July 1,2006) and SAARC. Pakistan’ Trade promotion efforts may be seen via attainmentof Generalized Scheme of Preferences (GSP), whereby most of export of Textileand leather may be made at zero tariff and many other items at preferential rate.
However, despite of significant Trade efforts and Foreign Policy measures,the Balance of Trade has been in deficit since 1950 till to date. Another economicaspect to avail favorable Terms of Trade as proposed by Marshall (1923) was bydepreciating currency. Currency depreciation causes export relatively cheaperand hence export may increase both in quantity as well as in amount, on the otherside, the import shall become relatively expensive and hence the import shalldecrease both in quantity as well as in amount, consequently the Balance of Tradeshall get improved Marshal (2003). Practically, this theory did not work fordeveloping countries such as Pakistan. Currency of Pakistan has continuouslybeen depreciating especially after 1970s still the Balance of Trade is in deficit.
Lerner (1944) extended Marshal’s work and proposed that, currencydepreciation could only benefit if the elasticity of export demanded (Ex) and thatof elasticity of import demanded (Em) is comparatively elastic. As long as thesum of Ex and Em is greater than One (1), then the currency depreciation willcause favorable improvement in Balance of Trade (Lerner, 1944).
Problem StatementPakistan has been suffering Economic Dilemma that Balance of Trade is in
Deficit despite of continuous Depreciation in its Currency. Marshal (1923) focusedon link of currency on Trade. The Study of Marshal (1923) suggested thatdepreciation in currency causes favorable improvement in Trade. Apparently, suchcondition is not working in Pakistan. This paper shall investigate the claim ofLerner (1944) for Pakistan, and shall find out whether the real cause for adverseBalance of Trade is that demand for exported goods and imported goods is inelastic.
54
Muhammad Tariq, M., Kumar, R. & Khuhro, Y.A.
Research HypothesisH1: Exchange Rate (Pakistan to its Trading Partner) has negative impact on
Export to Trading Partner.
H2: Exchange Rate (Pakistan to its Trading Partner) has negative effect onImport from Trading Partner.
The study takes into account Pakistan’s four major Asian Trading Partners:China, Japan, Sri Lanka and India. The above both Hypotheses shall be testedindividually for each country.
Literature ReviewAbundant literature is available on the subject of Trade. This article provides
literature and findings of few authors providing relevant concept and technicalanalysis. Raza, Larik and Tariq (2013) analyzed the effect of currency on thetrade balances in South Asia using Marshal- Lerner Model and J- curve thataffirmed that depreciation of money is one of the root cause to make exportsinexpensive and imports become high- priced commodities. The cross sectionaldata accessible from South Asian nations was analyzed by multiple regressionand the research make forecast on devaluation of money, its causes and itsrepercussions. Each country was separately made subject to analysis and theresults substantiate Marshal- Lerner model focusing that Balance of trade cannotbe progressed by Depreciation of money.
Pandey (2013) has practically verified the Marshal Lerner Model inrelevance to India’s external trade. The results points out that devaluation of theexchange rates bring about advancement in trade balance. Furthermore,multivariate co-integration approach was used to estimate the equilibrium ofimports and exports.
Bahmani-Oskooee and Cheema (2009) have used quarterly data of realexchange rates, export-import ratio and relative (US) income for the timeperiod examined the Marshall- Lerner Condition for Kenyan Economy makeuse of Long- range dependence, fractional integration and co-integrationmethods, based absolutely on integer degrees of differentiation. The resultsdesignate that a definite co-integrating connection lies in between balance ofpayments, real exchange rate and relative income, and in the long run theconditions of ML satisfies whereas the concurrence point is comparativelysteady. This further entails that reasonable devaluation of Kenyan shilling havesteady impact on balance of payments with high interest rates through thecurrent account.
55
Investigating the Causes of Persistent Trade Deficit
Chinn (2004) concluded that receptiveness of trade flows to exchange ratesand income changes is refocused with great concentration after chronic expandingof US trade deficit. He estimated import and export equations over a particularperiod across 1990s when there was a new boom in Economy and depreciation indollar prices. The results designate a low receptiveness of imports to exchangerate fluctuations and reduction of income elasticity irregularity. The grouping oflow price elasticity of imports with current amount of trade deficit means thatany fall in trade deficit will essentially go along with large exchange rates andincome trend modification.
The strongest and the most frequent work on M-L condition have been madeby Bahmani-Oskooee. Oskooee (1998) was first to take up long run method i.e.Co-integration Technique to approximate the trade elasticity in developingnations around the globe. Under the hypothesis of The Marshall-Lerner conditionif the aggregate import and export demand become less than or equal to one, inthe long run, the trade balance must get better. In the majority cases, the resultcertainly disclose that trade elasticity are considerable enough to sustaindevaluation as successful strategy to prosper Trade Balance. Bahmani-Oskooeeand Kara (2005) have employed ARDL co-integration methods that does notrequire pre- testing for unit route and assess the Income and Price elasticities of28 countries. He further emphasized that with the preface of new inferencemethodologies, old theories obtain a transformed concentration and one amongstthem is Trade Elasticity. The result suggests that Price Elasticity in mostoccurrences support the conclusion that Real Depreciation progress trade balance.
Rose (1990) examined the influence of exchange rate on the trade balance inthe emergent nations. The Non- Structured procedure points out that depreciationof Real Exchange rate is weakly correlated with noteworthy enhancement in thetrade balance.
Bahmani�Oskooee and Wang (2006) concluded that there is a significantdifference in effects of currency depreciation in the short run against long run.The J- phenomenon is observed in short run hence the trade balance decline anddevelopment comes after a span of time. Previous studies that were conducted inthis regard using cumulative trade data in China had diverse results. Undeniably,most of them ended up that real depreciation have no impact on trade balance inthe long run. The authors have separated data in categories, used time seriesmodeling and hypothesized the real trade balance model in China and its 13business and trade partner countries. It showed that real depreciation of currencyhas positive impact on her trade balance.
56
Muhammad Tariq, M., Kumar, R. & Khuhro, Y.A.

MethodThe data for Export, import and exchange rate has been taken from
“Handbook of Statistics on Pakistan Economy 2010”. The data for 2011 to 2013has been taken from “Economic Survey of Pakistan”. As already discussed, thisresearch paper investigates the Trade outcome with four major Asian countrieswhich are: China, Japan, Sri Lanka and India.
Research Model DevelopedElasticity of Demand for Export may be given as:
dX EEx = (———)(———)dE X
Elasticity of Demand for Import may be given as:
dM EEm = (———)(———)dE M
Therefore, Marshal-Lerner condition may become as:
EM– 1 + Ex + (———)(Em)>0X
Assume that initially BOT is balanced i.e. Export = Import
X = M
Then Inequality may be reduced as follows:
– 1 + Ex + Em >0 and finally:
εX + εM > 1
The above equation therefore suggests that εX + εM > 1. It means the sum ofelasticity of demand for export and import must be greater than 1.
Estimation of ElasticityIn order to estimate the elasticity for demand of export and elasticity for
demand of import, a simple Trade Model may be developed as follows:
Xi = f (Yi, PERi)
Mi = f (YPK, PERi)Here Xi = Export to Trading Partner
Yi = Income (GDP) of Trading PartnerYPK = Income (GDP) of Pakistan.
57
Investigating the Causes of Persistent Trade Deficit
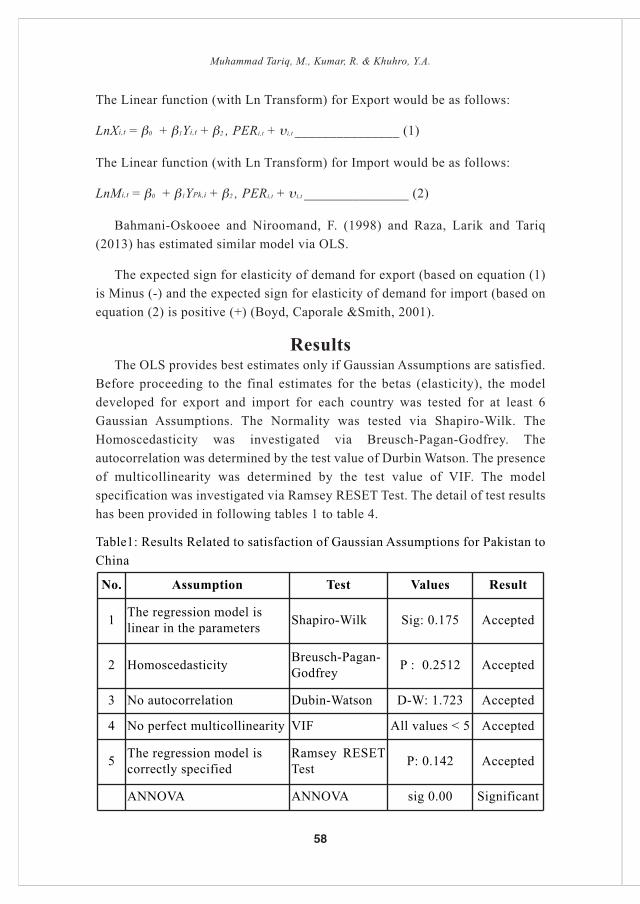
The Linear function (with Ln Transform) for Export would be as follows:
LnXi,t = β0 + β1Yi,t + β2 , PERi,t + υi,t _______________ (1)
The Linear function (with Ln Transform) for Import would be as follows:
LnMi,t = β0 + β1YPk,i + β2 , PERi,t + υi,t _______________ (2)
Bahmani-Oskooee and Niroomand, F. (1998) and Raza, Larik and Tariq(2013) has estimated similar model via OLS.
The expected sign for elasticity of demand for export (based on equation (1)is Minus (-) and the expected sign for elasticity of demand for import (based onequation (2) is positive (+) (Boyd, Caporale &Smith, 2001).
ResultsThe OLS provides best estimates only if Gaussian Assumptions are satisfied.
Before proceeding to the final estimates for the betas (elasticity), the modeldeveloped for export and import for each country was tested for at least 6Gaussian Assumptions. The Normality was tested via Shapiro-Wilk. TheHomoscedasticity was investigated via Breusch-Pagan-Godfrey. Theautocorrelation was determined by the test value of Durbin Watson. The presenceof multicollinearity was determined by the test value of VIF. The modelspecification was investigated via Ramsey RESET Test. The detail of test resultshas been provided in following tables 1 to table 4.
Table1: Results Related to satisfaction of Gaussian Assumptions for Pakistan toChina
No. Assumption Test Values Result
1 The regression model islinear in the parameters Shapiro-Wilk Sig: 0.175 Accepted
2 Homoscedasticity Breusch-Pagan-Godfrey P : 0.2512 Accepted
3 No autocorrelation Dubin-Watson D-W: 1.723 Accepted
4 No perfect multicollinearity VIF All values < 5 Accepted
5 The regression model iscorrectly specified
Ramsey RESETTest P: 0.142 Accepted
ANNOVA ANNOVA sig 0.00 Significant
58
Muhammad Tariq, M., Kumar, R. & Khuhro, Y.A.
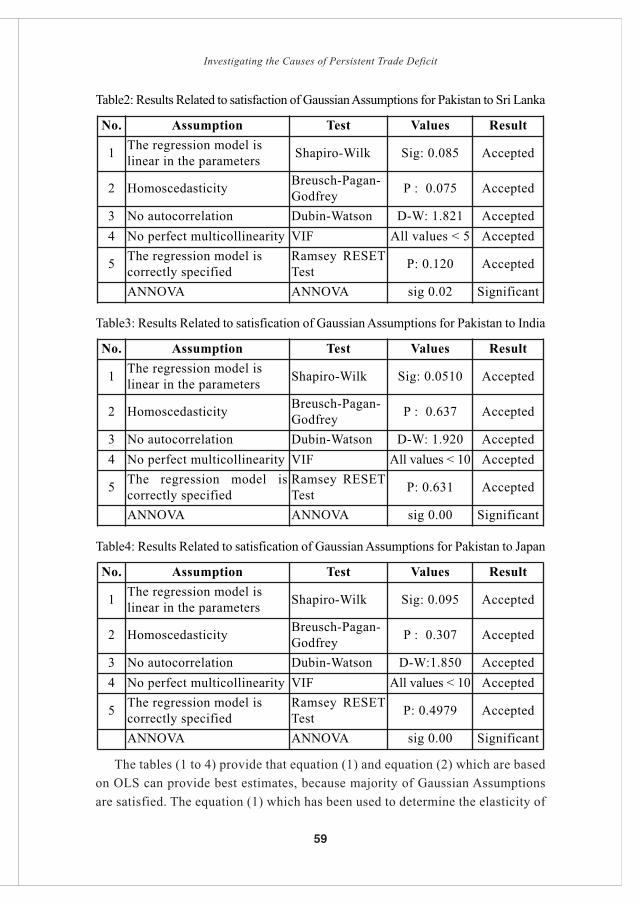
Table2: Results Related to satisfaction of GaussianAssumptions for Pakistan to Sri Lanka
Table3: Results Related to satisfication of Gaussian Assumptions for Pakistan to India
Table4: Results Related to satisfication of Gaussian Assumptions for Pakistan to Japan
The tables (1 to 4) provide that equation (1) and equation (2) which are basedon OLS can provide best estimates, because majority of Gaussian Assumptionsare satisfied. The equation (1) which has been used to determine the elasticity of
No. Assumption Test Values Result
1 The regression model islinear in the parameters Shapiro-Wilk Sig: 0.095 Accepted
2 Homoscedasticity Breusch-Pagan-Godfrey P : 0.307 Accepted
3 No autocorrelation Dubin-Watson D-W:1.850 Accepted4 No perfect multicollinearity VIF All values < 10 Accepted
5 The regression model iscorrectly specified
Ramsey RESETTest P: 0.4979 Accepted
ANNOVA ANNOVA sig 0.00 Significant
No. Assumption Test Values Result
1 The regression model islinear in the parameters Shapiro-Wilk Sig: 0.085 Accepted
2 Homoscedasticity Breusch-Pagan-Godfrey P : 0.075 Accepted
3 No autocorrelation Dubin-Watson D-W: 1.821 Accepted4 No perfect multicollinearity VIF All values < 5 Accepted
5 The regression model iscorrectly specified
Ramsey RESETTest P: 0.120 Accepted
ANNOVA ANNOVA sig 0.02 Significant
No. Assumption Test Values Result
1 The regression model islinear in the parameters Shapiro-Wilk Sig: 0.0510 Accepted
2 Homoscedasticity Breusch-Pagan-Godfrey P : 0.637 Accepted
3 No autocorrelation Dubin-Watson D-W: 1.920 Accepted4 No perfect multicollinearity VIF All values < 10 Accepted
5 The regression model iscorrectly specified
Ramsey RESETTest P: 0.631 Accepted
ANNOVA ANNOVA sig 0.00 Significant
59
Investigating the Causes of Persistent Trade Deficit

demand for Export and the equation (2) which is used for all four countries isobtained via OLS model; the results are provided in table 5.
Table 5: Elasticity for Export and Import
The sig values as shown in Table 5 for all four betas for export and for allbetas for import is less than 0.05, suggesting that Betas are significant. Table 5suggests that first Hypothesis (H1) is accepted for all China, Sri Lanka and Japanbecause their Betas are Negative indicating that exchange rate and export hasinverse relation i.e. decrease in exchange rate (currency depreciation) shall causeincrease in export and vice versa. However, H1 is rejected for India since its Betais positive showing that Exchange rate and export has positive relation. Thesecond hypothesis (H2) is accepted for all four countries since Betas are positive,showing positive relation of Exchange Rate with Import. It means increase indecrease in exchange rate (currency depreciation) shall cause decrease in Import.
Investigating the Marshal-Lerner ConditionThe summation of elasticity of demand for export Ex and Import Mp in
absolute terms is provided in Table 5. The elasticity is added if signs are same asexpected i.e. negative for Ex and positive for Ep. The elasticity shall besubtracted if signs are opposite to as expected as in case of India in table 5.
Table 6 : M-L Condition
* subtracted because sign of Ep is (positive) opposite to expected
Country Elasticity of Demand forExport (Ep)
Elasticity of Demand forImport (Mp)
Beta sig Value Beta sig Value
China -0.818 0 0.321 0.001
Sri Lanka -0.641 0.001 0.228 0.043
India 0.235 0.034 0.321 0.001
Japan -0.0982 0.021 0.213 0.043
Country M-L Condition(Ex+Em)
Effect on BoT due to currencydepreciation
China 1.139 Favorable
Sri Lanka 0.869 Adverse
India* 0.086 Adverse
Japan 0.3112 Adverse
60
Muhammad Tariq, M., Kumar, R. & Khuhro, Y.A.
ConclusionCurrency Depreciation can benefit only in case of Trade with China (since
εX + εM > 1). The friendship as well as Trade relation has flourished since theinception till today. The Trade between neighboring countries has been flourishedto $12b and in the upcoming period it is expected to reach at $15b by the end of2014. The currency Depreciation has positive effect on Balance of Trade. However,Trade with Sri Lanka in case of Currency Depreciation may be made favorable sincetotal of elasticity is close to 1. The Trade relation between Sri Lanka has improvedmainly due to Free Trade Agreement between both countries Abeyratne (2012),however, more efforts are required to improve the Trade. The Trade with India andJapan can adversely affect the Balance of Trade in case of currency depreciation. TheTrading of items with inelastic demand might be probable reason for adverse trade(in case of Currency depreciation) with Japan. Pakistan’s Major import from Japanconsists of automobile, auto spare parts and that of electric equipment (less elasticdemand) and Pakistan’s Major Export to Japan consists of Thread and some otherTextile Products (more elastic), the amount of import is larger than that of Export.Therefore, Pakistan’s Trade Account with Japan has been remained in deficit(Chaudhary & Abe, 2000). The major Trade with India is comprised of sugar, gems,fruits, fish and onyx (Taneja, 2006). The nature of demand of Trade item is lesselastic and the disturbed and irregular pattern of Trade might be the strong reasonfor unfavorable Trade outcome for both countries.
RecommendationsIt is suggested that best way to improve Trade Balance is adding Trade items
such as technological or innovative products and adding more items with moreelastic demand. Accompanied with it, the concept of J-Curve theory should beadded in Trade Policy that describes that the favorable outcome in trade aftercurrency depreciation may be obtained in long run only if home country’sproduction is not only sustained but also it is improved. It may be made byresolving the energy crisis and motivating the local Industries for more andproduction with Government support for export across borders.
ReferencesAbeyratne, S. (2012). Sri Lanka’s Free Trade Agreements with India and
Pakistan: Are They Leading Bilateral Trade Beyond Normalcy?. LahoreJournal of Economics, 17.
Bahmani-Oskooee, M. (1998). Cointegration approach to estimate the long-runtrade elasticities in LDCs. International Economic Journal, 12(3), 89-96.
Bahmani-Oskooee, M. & Cheema, J. (2009). Short-run and long-run effects of
61
Investigating the Causes of Persistent Trade Deficit
currency depreciation on the bilateral trade balance between Pakistan and hermajor trading partners. Journal of Economic Development, 34(1), 19-46.
Bahmani-Oskooee, M. & Kara, O. (2005). Income and price elasticities of trade:some new estimates. The International Trade Journal, 19(2), 165-178.
Bahmani-Oskooee, M. & Kara, O. (2005). Income and price elasticities of trade:some new estimates. The International Trade Journal, 19(2), 165-178.
Bahmani-Oskooee, M. & Niroomand, F. (1998). Long-run price elasticities and theMarshall–Lerner condition revisited. Economics Letters, 61(1), 101-109.
Bahmani�Oskooee, M. & Wang, Y. (2006). The J curve: China versus her tradingpartners. Bulletin of Economic Research, 58(4), 323-343.
Boyd, D., Caporale, G. M. & Smith, R. (2001). Real exchange rate effects on thebalance of trade: cointegration and the Marshall–Lerner condition.International Journal of Finance & Economics, 6(3), 187-200.
Boyd, D., Caporale, G. M. & Smith, R. (2001). Real exchange rate effects on thebalance of trade: cointegration and the Marshall–Lerner condition.International Journal of Finance & Economics, 6(3), 187-200.
Chaudhary, M. A. & Abe, K. (2000). Pakistan, Japan and Asean Trade RelationsAnd Economic Development (A Comparative Analysis). PakistanEconomic and Social Review, 193-214.
Chinn, M. D. (2004). Incomes, Exchange Rates and the US Trade Deficit, OnceAgain*. International Finance, 7(3), 451-469.
Lerner, A.P. (1944). The Economics of Control: Principles of Welfare Economics.New York: The MacMillian Company.
Marshal, A. (2003). Money, Credit and Commerce. Prometheus Books, Publishers.
Marshall, A. (1923). Money Credit and Commerce. London: MacMillian & Co. Ltd.
Pandey, R. (2013). Trade Elasticities and the Marshal Lerner Condition for India.Global Journal of Management and Business Studies, 3(4), 423-428.
Raza,A., Larik,A. & Tariq, M. (2013) Effects of Currency Depreciation on Trade Balancesof Developing Economies: A Comprehensive Study on South Asian Countries.
Rose, A. K. (1990). Exchange rates and the trade balance: some evidence fromdeveloping countries. Economics Letters, 34(3), 271-275.
Taneja, N. (2006). India-Pakistan Trade. Working Paper 182. New Delhi: IndianCouncil for Research on International Economic Relations.
62
Muhammad Tariq, M., Kumar, R. & Khuhro, Y.A.
Art of Customer Retention inDeveloping Economy
Irfan Saleem*Université de Bordeaux, France
&Anjum Saleem & Arqam Javed Kayani
Superior University Lahore, Pakistan
This research is conducted to measure the effect of company’s after salesservices practices for increased customer retention in the telecom sector ofdeveloping economy. Subsequently this study is an attempt to measure theimportance of the components which can improve the quality of after salesservices and their individual impact for competitive advantage. The sample istaken from the customers of the telecom products which are using the services oftelecommunication sector in Pakistan. Result show partially significantcorrelation of after sales services and customer’s retention, while the componentsinvolved in after sales services has significant impact on customer retention.However the overall relationship between variables is positive. The researchsuggests that in order to retain more customers, there is a dire need to adopt newand advanced ways of providing a better quality after sales services. Pakistanitelecom organizations need to know more about the customer’s retention bytraining sales staff, providing better quality of products and through better aftersales practice in the market.
Keywords: After sales service, Customer Retention, Developing Economy.
IntroductionToday’s competitive business environment enforces organization to feel thesignificant role of after sales service for sustainable advantage. Companies canusually offer after sales services to their customers in order to retain thecustomers and to take advantage over business competitors to build repute atmarket place for sustainable growth. The developing economy like Pakistan thecustomers have also become literate through intervention of Multinationalcompanies in the service as well as products which include telecomm, bankingand software services sector. Recently, world markets of various multinationalsare not that much focusing on just brands development though marketingstrategies but they are also focusing towards more customer retention that is whycompanies are always engaged in some kind of research activities in order toexplore innovative and new ways on the procedures that can be useful for the
63
Journal of Business Strategies, Vol.8, No.1, 2014, pp 63–76
__________________________________________________________________________________*[email protected]
companies towards the achievement of customer satisfaction for better retention(Mithas, Krishnan & Fornell, 2005). These innovative customer retentionpractices can make firms to learn about the customer behavior in dynamicscenarios. One can also say that becoming more efficient, innovative and newways of learning the ways makes customer happier and ultimately results incustomer’s retention to achieve competitive and sustainable advantage overbusiness competitors (Verhoef, 2003). These R&Ds can be an integrating pointbetween both the parties because in many situations a customer wants morecustomization in your product due a large number of competitive activities andit becomes difficult to satisfy the customers and to read the minds or perceptionof the customer this can lead to a loss of a customer for the company (Webster,1990). It is said that when a customer leaves a brand it takes 13 more customerswith him (Stern & Hammond, 2004). So it becomes very significant for thecompanies to keep these updates with itself to retain their customer. These studiesplay an important role due to its impact on customer satisfaction. This customerknowledge works really better to meets the customer needs and affects thesatisfaction level of customers. Customer oriented firms are able to get morerevenues for them because the utilization of a company’s brand by a loyalcustomer will be more than that of a regular customer (Stern & Hammond, 2004).
Any decline in customer Satisfaction which leads to customer retention is dueto poor after sales service would be a matter of concern and it should takesserious. Customers always well aware of the services provided by the othercompetitors and this developed more expectations by customers from thecompany. In other words, the quality of the service in different companies mattersa lot and it plays a major role in developing a strategy which can be according tothe customers’ expectations and meet the companies strategies. One cannot saythat this kind of service is only applicable in the services industries but it can apart of the product which can enhance the reliability of the product and make thecustomer more retained towards the company (Levitt, 1983). The product orservice of any company can use the impact of after sales services we just cannotconfine this approach only to the services or the manufacturing industry it will bebeneficial for all the sectors to use this kind of approach (Mithas, Krishnan &Fornell, 2005).
Nowadays there is a huge competitive surrounding and the aspect of servicequality is commonly known as the captious determinant required for the goodoutcome of a company. It is a responsibility to avoid respective degeneracy inconsumer serenity as a result of impaired serviceability. Presumptions have beenraised by the consumers due to awareness of increasing utilities orthodox and
64
Saleem, I., Saleem, A. & Kayani, A. J.
being amused by other competitors. Serviceability hold substantial place in thematter of organizations. It also applies when it comes to retailing (McColl &Truong, 2013).
The importance of after sale service can be of critical importance for the firmwhich in turns affects the long run and sort run outcomes of the company theseoutcomes may be in the form of revenues and the increase or decrease in thenumber of potential customers (Cespedes, Dougherty & Skinner, 2013; Levitt,1983). Hence the relationship management with the customer affects the overalloffering image of the company (Rigopoulou, Chaniotakis, Lymperopoulos &Siomkos, 2008).
The acquiring ability to retain the customer reflects the successful part of thefirm that how well the customer’s needs are met. Customer retention can bedefined as the ability of a company to keep its existing customers (Levitt, 1983;McColl & Truong, 2013). By using this approach of providing the after salesservices we can add a real time benefit to the perceptions of the customers whothink to have unique product and service all the time (Rigopoulou et al, 2008).
Customer retention is also necessary for the companies in the cost point ofview because the cost for acquiring a new customer would probably be more thanhaving an old customer. Company’s success is based on the customer’ssatisfaction. The term “customer is always right” makes a customer feel that anykind of suggestions given by him to the company will be of greater importance forthe company and then the companies will also be more engaged in providing thequality services after sales (Cespedes, Dougherty & Skinner, 2013; Levitt, 1983).
In the earlier days when the markets started to develop there were a lot ofcompanies who were not paying attentions to the customers because they had amonopoly kind of thing in their fields and industries and they knew it that if anycompetitor will come it cud not be matching their companies, at those times thecompetitions were not that much severe as they have now become successful(Verhoef, 2003; Webster, 1990). The new comers were not that efficient as thepresent companies of their times so this impact made the companies not muchconcerned about the after sales. So the customers were relying on the serviceswhich they had. The purpose of customer retention is to sustain the long termrelationships in business that has been developed among buyer and seller (Borleet al, 2005; Verhoef, 2003).
Increasing competition and internet usage is making the customer well aware ofthe services offered by different companies thus making customer more informativeregarding services selection, choices and preferences (Kumbhar, 2011). Thus
65
Art of Customer Retention in Developing Economy
change in the world emerging markets including developing economies hassubstantially increased the competition among competitor companies of similarindustry. The level of service quality given by company is the area where marketersneed help of researchers so that market share of a firm in the relevant industry couldimprove (Anderson, 1996). No doubt customer satisfaction is a human activitywhich means trying to satisfy the human needs and wants through human activities.The major focus of the company is always to satisfy the customer through differentperspectives and different ways because it is of significant importance as it meet theincreasing needs and wants of the customers thus provides a reason to the customerto be the potential customer of your company so companies keep on makingdifferent ways to satisfy those needs. Firms develop plans and strategies to meetsthe demands of the customers efficiently.
According to a study Anderson (1996) satisfying a customer cannot beconsidered separately considered form other business activities. According tohistoric studies customer is consider as champion, king, boss because as he/sheexercises the authority of being selector of any service/product at market placethat is why it is complicated for company to achieve customer’s stratification.This needs further research and evidences from developing economies togeneralize the research model well tested in modern economies.
Research ObjectivesIn the light of signification of after sales services in the context of Pakistani
Economy, where telecom sector has gained substantial growth, it is needed toidentify the factors of customer satisfaction. More specifically this study hasfollowing objectives.
1. First objective of the study is to explore the customer’s perceptionregarding company’s after sales services in the telecom sector.
2. Second objective of the study is to quantify measure repurchase behaviorof the customer though in depth analysis of after sales services packprovided by telecom companies.
3. Thirdly the objective of the study is to examine how customer after salespractices adopted by telecom companies can help to retain the customers.
4. Finally the objective of this research study is to explore the effect of aftersales services for better customer retention in telecom based companies.
Telecom Companies of PakistanThe telecom sector of Pakistan is growing and even at more pace in
comparison with it neighboring economy i.e. Indian telecommunication sector.
66
Saleem, I., Saleem, A. & Kayani, A. J.
Pakistan has currently five cellular phone operators including Moblink, Telenor,Ufone, Warid and Zong. Teledensity of the Pakistani telecom has been grownsubstantially up to 62% better than Indian Teledensity i.e. 37%. This has attractedforeign direct investment for Pakistan from Chinese companies like Zong to takeover the Paktel. As Pakistani market of telecommunication has becomingattractive for the foreign investment thus the new companies are interested incustomer retention tactics to enjoy more growth.
It is estimated that the mobile subscribers in the Pakistan would grow to anumber of 100 million in the nest year. The sector is growing rapidly and thegrowth rates are astonishing. The growth rate in the last year was only 7% thedecrease in the last year growth can be for many reasons, the major affect was dueto the devaluation of the money and the other one could be the registrationprocess of the Sims by PTA. This decrease was moreover seen in the metropolitanareas of Pakistan whereas we in the other areas of Pakistan many people arehaving more than one Sims, so we can say the growth in the sector will continuebut not as fast as it was it the past years. PTA is working hard to ensure the growthin the future but also taking into consideration the rules and regulation to maintaina healthy competition among the firms. Mobile internet is becoming very popularin the country and the future it would be beneficial service for the companies interms of revenues (Kumbhar, 2011). However mobile internet can also grow morebut the problem it is facing the low literacy; many customers are not really ableto understand it. This sector has another advantage hidden in itself for thecustomer that the monopoly cannot be created because of the number ofcompetitors. PTA is monitoring the sector on regular basis to remove any kind ofunlawful competition practices among the competitors to build a healthycompetition among them which in turn benefits the customer, because a pricewar is going among all the firms PTA has ensured to be it fair with theircompetitors not directly using any kind of unfair promotional campaigns.
Literature ReviewWhenever after sale services term comes in one’s mind, the customer can
think in two contexts. First is service and other is manufacturing (Bundschuh &Dezvane, 2003). Alternatively After sales services (ASS) can be defined asrelationship between company and her customer, whereas company providingproducts have some problem or any fault in the product, the services are requiredby customer and to be offered by company according to company’s policies(Kuo, Hu & Yang, 2013). After sales services is basically linked with thecompany’s internal department which is marketing department and it is the job ofthe service marketing manager to solve the issues, after sales could be a
67
Art of Customer Retention in Developing Economy
competitive edge or differentiator from your competitors because it gave you thelong term advantage as it retain the customer (Hauser, Simester & Wernerfelt,1994; Kuo, Hu & Yang, 2013).
The major advantage of after sales for which companies are struggling iscustomer retention. Customer retention is the repurchase of the same product bythat customer; we can also say it as customer loyalty about your offerings orproducts (Rigopoulou, Chaniotakis, Lymperopolous & Siomkos, 2008). Somepeople might have misunderstanding in customer satisfaction and customerretention because if you have the major emphasis on customer satisfaction youmight increase the customer satisfaction but at the same tie company can lose thecustomer’s loyalty (Saccani, Johansson & Perona, 2007; Banerjee & Singh,2013). Most of the times it is difficult and expensive to gain a new customerbecause you have to spend marketing expenses or different R&D expenses but itare rather easy to retain an existing one (Davis, 1997; Cespedes, Dougherty &Skinner, 2013). Many firms often follow the 80/20 rule according to this rule80% of the firms revenues are generated by the 20% of the firm’s loyal customers.
After Sales ServiceWhenever services or goods are provided by a company or a retailer to its
customer, the extra service which is given by the company e.g. to recover anydamage or any fault by the company this kind of service is called after saleservice (Banerjee & Singh, 2013). Usually most of the companies are giving thesekinds of services free of cost to the customer in order to build a good perceptionin the minds of the customer about the product or the company itself (Kuo, Hu& Yang, 2013). It is considered that the idea for providing after sale serviceswas introduced by the company named SONY.
Reliability of the servicesThe reliability of the company’s service is degree of after sales services
standard offered by the selling company (Cespedes, Dougherty & Skinner, 2013).This also shows the attributes and characteristics of the company’s services thatmeets or can exceed the customer mind’s perceptions even more or better thantheir business competitors. Services reliability in terms of after sale services(ASS) offered by company is that to which extent the customer trusts firm’s aservice and after sale requirements to meet or exceed the customer’s satisfaction(Hauser, Simester & Wernerfelt, 1994; Kuo, Hu & Yang, 2013; Banerjee & Singh,2013).
QualityDegree to which a set of inherent characteristics fulfill requirement (Juran,
68
Saleem, I., Saleem, A. & Kayani, A. J.
1974) describes the Quality of after sales service as “fitness for use”. Theimproved service delivery procedures adopted by firm in delivering the servicesby the company can be termed as service quality and these offered after salesprocedures and practice are directly or indirectly related with the enhancedcustomer’s satisfaction (Mithas, Krishnan & Fornell, 2005) which can result incutomer retionstion (Banerjee & Singh, 2013).
DeliveryService delivery of the firm in terms of after sales services quality delivered
can be defined in terms of in time response by company to resolve customer’sissue related to product delivered under warranty. More specifically whether aftersales services were delivered in timely fashion as claimed during sales transactionto the customer (Hu, Cheng, Chiu & Hong, 2011).
PersonnelSales staff or front desk staff defined as personnel of this study in terms of
after sale services is the staff of the company or the whole team of the companywhich is having interaction during transaction of the business (Kumbhar, 2011).According to research, if firm’s staff or employees are trained enough tocooperate with customer towards problems solving of services hired, staff that iswilling to take care of customer and to perform their best to resolve the customerfacing problems (Tsao & Chen, 2011; Banerjee & Singh, 2013). Thus the stafffacing the customer is really important for customer retention.
Customer retentionCustomer retention is the dependent variable for current study as
recommended by various studies of marketing research (Borle, 2005; Verhoef,2003). It can be defined as the repurchase behavior by firm’s customer of thesame product after good experience which he/ she had purchased and want to buyagain just because of better after sales services (Anderson, 1996; Cespedes,Dougherty & Skinner, 2013). This customer’s behavior indicates the customer’ssatisfaction about the relevant product or service provided by the company tomeet or exceeded the customer perception for better retention (Borle, Boatwright,Kadane, Nunes & Shmueli, 2005; Banerjee & Singh, 2013).
The above given are the variables of our research topic after sale service is theindependent variable which is possible by giving superior quality, innovationagainst your competitors better placement of your product, reliability and on timedelivery and if these things are focused then the customer retention will be surething which means that customer retention is our dependent variable.
69
Art of Customer Retention in Developing Economy
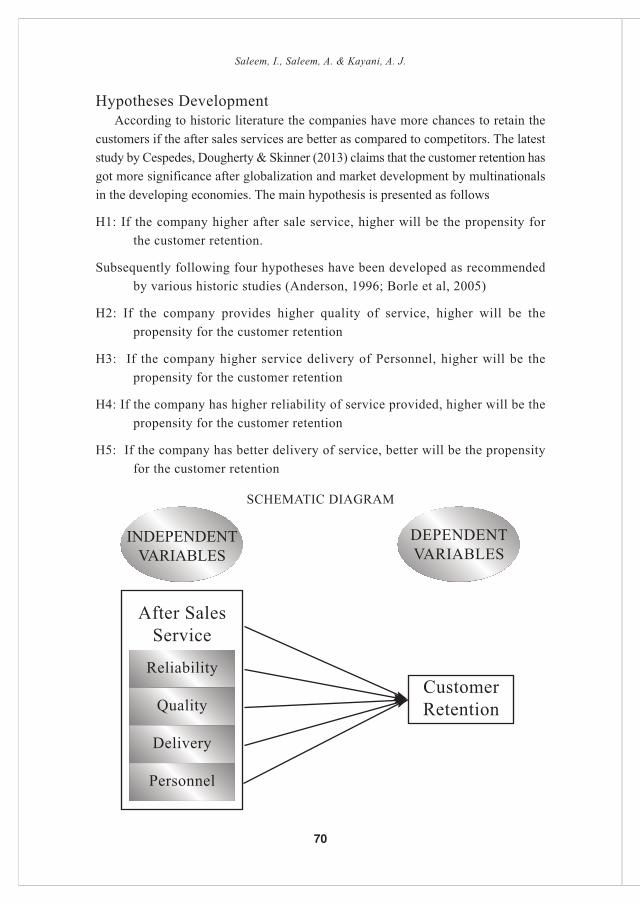
Hypotheses DevelopmentAccording to historic literature the companies have more chances to retain the
customers if the after sales services are better as compared to competitors. The lateststudy by Cespedes, Dougherty & Skinner (2013) claims that the customer retention hasgot more significance after globalization and market development by multinationalsin the developing economies. The main hypothesis is presented as follows
H1: If the company higher after sale service, higher will be the propensity forthe customer retention.
Subsequently following four hypotheses have been developed as recommendedby various historic studies (Anderson, 1996; Borle et al, 2005)
H2: If the company provides higher quality of service, higher will be thepropensity for the customer retention
H3: If the company higher service delivery of Personnel, higher will be thepropensity for the customer retention
H4: If the company has higher reliability of service provided, higher will be thepropensity for the customer retention
H5: If the company has better delivery of service, better will be the propensityfor the customer retention
SCHEMATIC DIAGRAM
INDEPENDENTVARIABLES
DEPENDENTVARIABLES
After SalesService
CustomerRetention
Reliability
Quality
Delivery
Personnel
70
Saleem, I., Saleem, A. & Kayani, A. J.

MethodThis section covers the quantification of the variables of interests.
Questionnaire has been used as data collection tool to quantify the variables ofinterest for this study. Targeted population consists for the study of variouscustomers of telecom sectors. 1600 questionnaires were distributed to the usersof various telecom operators, from those only 1350 were returned. 1270Questionnaires were filled properly which were actually used for this research.79% response rate of questionnaire are received which is good.
Reliability statisticsThe reliability of the measures is required to predict better results of the studyunder discussion. Following table presents the reliability statics
Table 1: Reliability of Study—————————————————————————————————Variable’s Name Alpha No. of items used—————————————————————————————————Customer Retention 0.74 04After Sales Service 0.72 16—————————————————————————————————Note: The value above 0.70 of alpha is considered to be more reliable items
The measure is reported to have convergent and discriminate validity ofCustomer retention, after sales service and sub variables of after sales service.Cronbach’s alpha for the measure for this sample was 0.743 for Customerretention and 0.726 for after sales service And in after sale s services we includedit’s all sub variables. Above 0.7 alpha values shows the higher reliability of Data.
Table 2: Descriptive Statistics—————————————————————————————————Variables Name Min Max Mean Std. Deviation—————————————————————————————————1.0 Gender 1.00 2.00 N/A N/A2.0 Education 1.00 5.00 3.55 0.663.0 Service Provider 1.00 5.00 3.07 1.08—————————————————————————————————
The unit of analysis was individuals who responded to the survey. Ourrespondents were the university students and the Average respondent of questionnairewas having bachelor’s degree or continuing the master’s degree because accordingto the scale assigned the mean is between 3 and 4 which is 3.5591.
We have chosen telecom industry and in population we are including WARID,U FONE, Mobilink, Telenor and Zong users. Every single representative ofpopulation like customer of the UFONE is an element for the current study. A smallpart of anything, intended as representative of the whole. We are taking 1270 assample size. The part of sentence or clause that commonly indicates what it is about
71
Art of Customer Retention in Developing Economy
or who or what performs the action. A sampling frame is the complete list or thesource material from which the sample can be drawn, it is the list of all those withinthe population who can be sample. For current study the sampling frame was notavailable as companies denied to give complete data of the customers. Howeverrandomly the users were asked and accessed to get the opinion about the servicesexperience. A sampling unit of this study is individual customer, which is definedas one of the units into which an aggregate is divided for the study for the purposeof sampling and better response. For this study each unit being regarded asindividual customer and has become indivisible when the selection is made on therandom basis from the telecom sector of the Pakistan. The methods used for thisstudy is simple random sample and as per convenience the drawing samples froma population i.e. telecom customer, it is usually in such a manner that the samplewill facilitate determination of the study’s propositions concerning the populationi.e. telecom sector. We are using simple random sampling because the main purposeis to calculate the impact of after sale service and we take after sale as a variableand any kind of change in after sale will affect the whole population the same way.
Results & DiscussionThe findings of the data have used correlation and regression techniques to
analyze the hypotheses proposed in preceding section.
Correlations analysisTable 2a: Correlation output of CR and ASS—————————————————————————————————Variable Mean S.D 1 2—————————————————————————————————1. CR 4.7500 1.264 1.002. ASS 4.7166 1.322 0.376**—————————————————————————————————Notes CR: Customer Retention; ASS: After Sale Service; n= 1270. ** p < .01.
The SPSS output of the above table is presented in the Annex II. The correlationmatrix provided the answer to the hypothesis. The first hypothesis stated that AfterSales Service is positively related to the Customer Retention. The correlation of0.376 (p<0.001) is between the After Sales Service and Customer Retention.Table 2b: Correlation Analysis—————————————————————————————————Variable Name Mean S.D 1 2 3 4 5—————————————————————————————————Customer Retention 4.7500 1.264 1Quality 4.7166 1.322 .541** 1Personnel 4.9110 1.348 .515** .491** 1Delivery 4.4891 1.035 .450** .500** .516** 1Reliability 4.4047 1.277 .487** .461** .487** .505** 1—————————————————————————————————
Note: n= 1270. ** p < .01.
72
Saleem, I., Saleem, A. & Kayani, A. J.
The correlation matrix presented in above table provides the answer to thesupposed hypothesis. The second hypothesis states that customer retention ispositively related to the quality of service delivered. The correlation value of(r=0.541; p<0.001) is between customer retention and the quality of the servicedelivered. The third hypothesis stated that customer retention is positively relatedto the service delivery by personnel. The correlation of (r=0.515; p<0.000) isbetween customer retention and the service delivery by personnel. The fourthhypothesis states that customer retention is positively related to the delivery ofthe service. The correlation of (r= 0.450; p<0.001) is between customer retentionand the delivery of the service. Fifth hypothesis states that customer retention ispositively related to the reliability of services. The correlation of (r=0.487;p<0.001) is between customer retention and the reliability of services.
Regression AnalysisThe regression technique is used to test the cause and effect relationship
between the after sales services and customer’s retention. R square is 0.412which shows that variation explained in the dependent variables because ofindependent variables is substantial and partially variations in the dependentvariables can be explained by the analysis using regression technique. 41.2%customer retention varies due to Quality, Personnel, Delivery, Reliability(independent variables). The Total variance which is explained by theindependent variables i.e. Quality, Personnel, Delivery, Reliability throughRegression is 41.2% with degree of freedom (4) and the variance which is notexplained by the independent variables are called Residual that is 58.8%. Thefurther regression equation is resented in the next section as under.
Equation for regression analysis1. Y = a0 + a1 (x1) + e2. Y = a0 + a2 (x2) + e3. Y = a0 + a3 (x3) + e4. Y = a0 + a4 (x4) + eY = a0 + a1*x1 + a2*x2 + a3*x3+ a4*x4 + eWhere:Y = Dependent variable. (Customer Retention)x = Independent variables.Where x1 = Quality; x2 = Personnel; x3 = Delivery; X4= Reliability; e= Std. Error
Research suggests that there is a positive and statistically significantrelationship between the after sales services components and customer retentionthe dependent variable, and they are partially significant because after sales
73
Art of Customer Retention in Developing Economy

services have some of its components which differentiates it from good to bad incustomer’s perception. The above research was confined only to the customerstargeted and the questionnaire were distributed among the students due to timelimitations, but in future this research can be conducted in a city or in a country.
The findings of this study are partially consistent with Borle (2005). Theresults regarding product orientation predicts that more customer orientation ispossible if companies give after sales service through better trained staff dealingwith queries of telecom products. The evidence is the less time for waiting oncecustomer called to asked for details of the product. The fiding f the study are alsoconsistent with Bundschuh & Dezvane (2003) who said that satisfied customerhave more chances of retention if dealt properly through communication. Thefinding of this study are inconsistent with the findings of Davis (1997) andSaccani, Johansson & Perona (2007). As according to Davis (1997) retention ofcustomer depends upon maintaining the database of customers, while Saccani,Johansson & Perona (2007) focused on supply chain of the products which isquite not possible in telecom sector just providing cellular services and products.This study is not without limitation. The first limitation of the study is the samplesize. The second is that the study needs to identify the mediating and moderatingvariables like customer loyalty, marketing culture in the particular industry,customer knowledge about services and customer satisfaction (Hauser, Simester& Wernerfelt, 1994).
ConclusionThe above research is clearly indicating the impact of after sales services and
their positive effects but the main thing which should be given more importanceis that only the after sales is not enough but the components involved whichenhances the quality of the of the services must be kept in mind. In order to getmore and more customer we need to give good impression of the company whichneeds something different or unique from the competitors and this competitiveadvantage can be increased by improving the customer care in a healthy manner.Because the world is becoming the global village that’s why the competitions arebecoming more severe and to get a good market share we must have a good imagein the mind of customers about our products and services being provided to thecustomers. And the companies must understand the problems of customersregarding their offerings.
ReferencesAnderson, E. W. (1996). Customer satisfaction and price tolerance. Marketing
Letters, 7(3), 265-274.
74
Saleem, I., Saleem, A. & Kayani, A. J.
Banerjee, S. & Singh, P. (2013). Impact of after sales services on consumersbuying behaviour for consumer durables: with special reference to airconditioners. International Journal of Applied Services MarketingPerspectives, 2(2), 369-374.
Borle, S., Boatwright, P., Kadane, J. B., Nunes, J. C. & Galit, S. (2005). Theeffect of product assortment changes on customer retention. Marketingscience, 24(4), 616-622.
Bundschuh, R. G. & Dezvane, T. M. (2003). How to make after-sales servicespay off. McKinsey Quarterly, (4), 116-127.
Cespedes, F. V., Dougherty, J. P. & Skinner III, B. E. N. S. (2013). How toIdentify the Best Customers for Your Business. MIT Sloan ManagementReview, 54(2), 53-59.
Davis, J. F. (1997). Maintaining customer relationships through effective databasemarketing: a perspective for small retailers. Journal of Marketing Theoryand Practice, 31-42.
Hauser, J. R., Simester, D. I. & Wernerfelt, B. (1994). Customer satisfactionincentives. Marketing science, 13(4), 327-350.
Hu, H. Y., Cheng, C. C., Chiu, S. I. & Hong, F. Y. (2011). A study of customersatisfaction, customer loyalty and quality attributes in Taiwan’s medicalservice industry. African Journal of Business Management, 5(1), 187-195.
Kumbhar, V. M. (2011). Determinants of internet banking adoption: an Empiricalevidences from Indian banking. Indian Journal of Commerce &Management Studies, 2(4), 15-25.
Kuo, Y. F., Hu, T. L. & Yang, S. C. (2013). Effects of inertia and satisfaction infemale online shoppers on repeat-purchase intention: The moderatingroles of word-of-mouth and alternative attraction. Managing ServiceQuality, 23(3), 168-187.
Levitt, T. (1983). After the sale is over. Harvard business review, 61(5), 87-93.
McColl, R. & Truong, Y. (2013). The Effects of Facial Attractiveness and Genderon Customer Evaluations During A Web-Video Sales Encounter. Journalof Personal Selling and Sales Management, 33(1), 117-128.
Mithas, S., Krishnan, M. S. & Fornell, C. (2005). Why do customer relationshipmanagement applications affect customer satisfaction?. Journal ofMarketing, 201-209.
75
Art of Customer Retention in Developing Economy

Rigopoulou, I. D., Chaniotakis, I. E., Lymperopoulos, C. & Siomkos, G. I. (2008).After-sales service quality as an antecedent of customer satisfaction: Thecase of electronic appliances. Managing Service Quality, 18(5), 512-527.
Saccani, N., Johansson, P. & Perona, M. (2007). Configuring the after-salesservice supply chain: A multiple case study. International Journal ofProduction Economics, 110(1), 52-69.
Stern, P. & Hammond, K. (2004). The relationship between customer loyalty andpurchase incidence. Marketing Letters, 15(1), 5-19.
Verhoef, P. C. (2003). Understanding the effect of customer relationshipmanagement efforts on customer retention and customer sharedevelopment. Journal of Marketing, 30-45.
Webster, C. (1990). Toward the measurement of the marketing culture of a servicefirm. Journal of Business Research, 21(4), 345-362.
76
Saleem, I., Saleem, A. & Kayani, A. J.
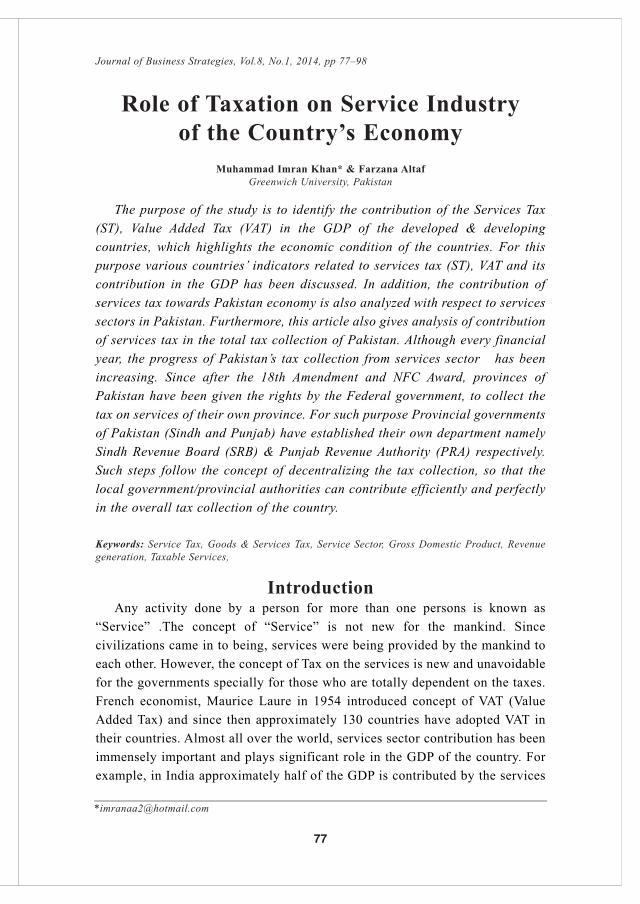
Role of Taxation on Service Industryof the Country’s Economy
Muhammad Imran Khan* & Farzana AltafGreenwich University, Pakistan
The purpose of the study is to identify the contribution of the Services Tax(ST), Value Added Tax (VAT) in the GDP of the developed & developingcountries, which highlights the economic condition of the countries. For thispurpose various countries’ indicators related to services tax (ST), VAT and itscontribution in the GDP has been discussed. In addition, the contribution ofservices tax towards Pakistan economy is also analyzed with respect to servicessectors in Pakistan. Furthermore, this article also gives analysis of contributionof services tax in the total tax collection of Pakistan. Although every financialyear, the progress of Pakistan’s tax collection from services sector has beenincreasing. Since after the 18th Amendment and NFC Award, provinces ofPakistan have been given the rights by the Federal government, to collect thetax on services of their own province. For such purpose Provincial governmentsof Pakistan (Sindh and Punjab) have established their own department namelySindh Revenue Board (SRB) & Punjab Revenue Authority (PRA) respectively.Such steps follow the concept of decentralizing the tax collection, so that thelocal government/provincial authorities can contribute efficiently and perfectlyin the overall tax collection of the country.
Keywords: Service Tax, Goods & Services Tax, Service Sector, Gross Domestic Product, Revenuegeneration, Taxable Services,
IntroductionAny activity done by a person for more than one persons is known as
“Service” .The concept of “Service” is not new for the mankind. Sincecivilizations came in to being, services were being provided by the mankind toeach other. However, the concept of Tax on the services is new and unavoidablefor the governments specially for those who are totally dependent on the taxes.French economist, Maurice Laure in 1954 introduced concept of VAT (ValueAdded Tax) and since then approximately 130 countries have adopted VAT intheir countries. Almost all over the world, services sector contribution has beenimmensely important and plays significant role in the GDP of the country. Forexample, in India approximately half of the GDP is contributed by the services
77
Journal of Business Strategies, Vol.8, No.1, 2014, pp 77–98
__________________________________________________________________________________*[email protected]

sector whereas finance services sector of UK contributes approximately 10%towards GDP of the country. As per Roy Morgan survey data end 2010, saidAustralian financial service sector provides services to approximately 15.5million customers.
World’s four largest economies out of ten, belong to Asia namely China,India, Indonesia & Japan.By 2025 these four economies will lead the worldeconomy. The role of Pakistan among these big four giants will be very vital,due to its regional importance and position which will help Pakistan inestablishing and stabilizing its economic condition by providing the services tothese four giants. Various multinational companies are moving towards Asiaowing to expanding middle-class in the region to fulfill the needs and basicnecessities of life like cell phone, insurance, credit card services, onlineshopping, vehicles, social gathering in restaurants, travelling, using ATMmachines and etc. It is being observed that the Indirect taxes and speciallyServices Tax plays a vital role towards the stability reason being services taxusually collected on real time basis with efficient collection procedures.
ObjectivesThe objectives of study are as follow:• Analyze the growth and development of Services sector in Pakistan and
developed countries.• Analyze the contribution of Services tax towards GDP/economy of
Pakistan and developed countries.
MethodThe study is based on quantitative and qualitative research. The sources of
data for this article are WDI, Official websites, Journals and Annualperformance reports of Services sectors of different countries. In additionvarious issues related to secondary data sources have been concerned with thestandard publications and official websites of the different countries.
Results & DiscussionPerformance of Services Sector in Pakistan
Contribution of Services sector towards GDP and economic growth ofPakistan is gradually increasing significantly recently and since last three yearsPakistan tax on services sector is contributing remarkably in the GDP growthand revenue of the country. Below given table shows the contribution ofservices sector in the revenue of Pakistan.
78
Khan, M.I. & Altaf, F.
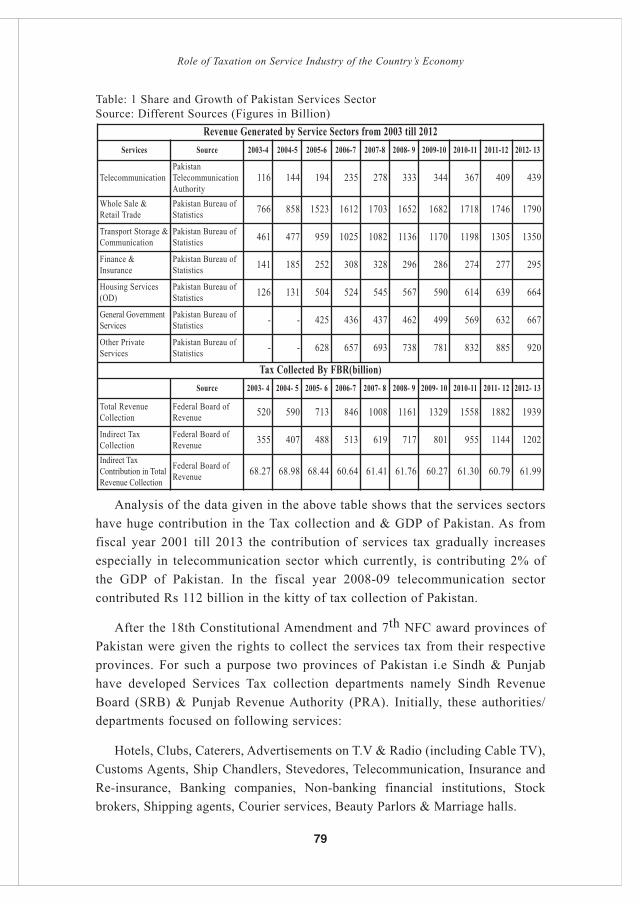
Table: 1 Share and Growth of Pakistan Services SectorSource: Different Sources (Figures in Billion)
Analysis of the data given in the above table shows that the services sectorshave huge contribution in the Tax collection and & GDP of Pakistan. As fromfiscal year 2001 till 2013 the contribution of services tax gradually increasesespecially in telecommunication sector which currently, is contributing 2% ofthe GDP of Pakistan. In the fiscal year 2008-09 telecommunication sectorcontributed Rs 112 billion in the kitty of tax collection of Pakistan.
After the 18th Constitutional Amendment and 7th NFC award provinces ofPakistan were given the rights to collect the services tax from their respectiveprovinces. For such a purpose two provinces of Pakistan i.e Sindh & Punjabhave developed Services Tax collection departments namely Sindh RevenueBoard (SRB) & Punjab Revenue Authority (PRA). Initially, these authorities/departments focused on following services:
Hotels, Clubs, Caterers, Advertisements on T.V & Radio (including Cable TV),Customs Agents, Ship Chandlers, Stevedores, Telecommunication, Insurance andRe-insurance, Banking companies, Non-banking financial institutions, Stockbrokers, Shipping agents, Courier services, Beauty Parlors & Marriage halls.
Revenue Generated by Service Sectors from 2003 till 2012Services Source 2003-4 2004-5 2005-6 2006-7 2007-8 2008- 9 2009-10 2010-11 2011-12 2012- 13
TelecommunicationPakistanTelecommunicationAuthority
116 144 194 235 278 333 344 367 409 439
Whole Sale &Retail Trade
Pakistan Bureau ofStatistics 766 858 1523 1612 1703 1652 1682 1718 1746 1790
Transport Storage &Communication
Pakistan Bureau ofStatistics 461 477 959 1025 1082 1136 1170 1198 1305 1350
Finance &Insurance
Pakistan Bureau ofStatistics 141 185 252 308 328 296 286 274 277 295
Housing Services(OD)
Pakistan Bureau ofStatistics 126 131 504 524 545 567 590 614 639 664
General GovernmentServices
Pakistan Bureau ofStatistics - - 425 436 437 462 499 569 632 667
Other PrivateServices
Pakistan Bureau ofStatistics - - 628 657 693 738 781 832 885 920
Tax Collected By FBR(billion)Source 2003- 4 2004- 5 2005- 6 2006-7 2007- 8 2008- 9 2009- 10 2010-11 2011- 12 2012- 13
Total RevenueCollection
Federal Board ofRevenue 520 590 713 846 1008 1161 1329 1558 1882 1939
Indirect TaxCollection
Federal Board ofRevenue 355 407 488 513 619 717 801 955 1144 1202
Indirect TaxContribution in TotalRevenue Collection
Federal Board ofRevenue 68.27 68.98 68.44 60.64 61.41 61.76 60.27 61.30 60.79 61.99
79
Role of Taxation on Service Industry of the Country’s Economy
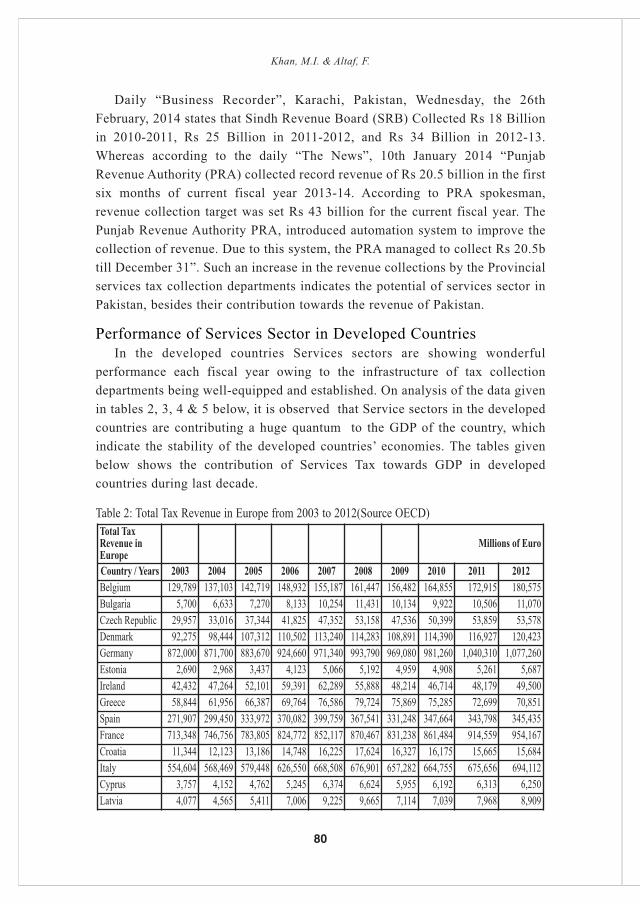
Daily “Business Recorder”, Karachi, Pakistan, Wednesday, the 26thFebruary, 2014 states that Sindh Revenue Board (SRB) Collected Rs 18 Billionin 2010-2011, Rs 25 Billion in 2011-2012, and Rs 34 Billion in 2012-13.Whereas according to the daily “The News”, 10th January 2014 “PunjabRevenue Authority (PRA) collected record revenue of Rs 20.5 billion in the firstsix months of current fiscal year 2013-14. According to PRA spokesman,revenue collection target was set Rs 43 billion for the current fiscal year. ThePunjab Revenue Authority PRA, introduced automation system to improve thecollection of revenue. Due to this system, the PRA managed to collect Rs 20.5btill December 31”. Such an increase in the revenue collections by the Provincialservices tax collection departments indicates the potential of services sector inPakistan, besides their contribution towards the revenue of Pakistan.
Performance of Services Sector in Developed CountriesIn the developed countries Services sectors are showing wonderful
performance each fiscal year owing to the infrastructure of tax collectiondepartments being well-equipped and established. On analysis of the data givenin tables 2, 3, 4 & 5 below, it is observed that Service sectors in the developedcountries are contributing a huge quantum to the GDP of the country, whichindicate the stability of the developed countries’ economies. The tables givenbelow shows the contribution of Services Tax towards GDP in developedcountries during last decade.
Table 2: Total Tax Revenue in Europe from 2003 to 2012(Source OECD)Total TaxRevenue inEurope
Millions of Euro
Country / Years 2003 2004 2005 2006 2007 2008 2009 2010 2011 2012Belgium 129,789 137,103 142,719 148,932 155,187 161,447 156,482 164,855 172,915 180,575Bulgaria 5,700 6,633 7,270 8,133 10,254 11,431 10,134 9,922 10,506 11,070Czech Republic 29,957 33,016 37,344 41,825 47,352 53,158 47,536 50,399 53,859 53,578Denmark 92,275 98,444 107,312 110,502 113,240 114,283 108,891 114,390 116,927 120,423Germany 872,000 871,700 883,670 924,660 971,340 993,790 969,080 981,260 1,040,310 1,077,260Estonia 2,690 2,968 3,437 4,123 5,066 5,192 4,959 4,908 5,261 5,687Ireland 42,432 47,264 52,101 59,391 62,289 55,888 48,214 46,714 48,179 49,500Greece 58,844 61,956 66,387 69,764 76,586 79,724 75,869 75,285 72,699 70,851Spain 271,907 299,450 333,972 370,082 399,759 367,541 331,248 347,664 343,798 345,435France 713,348 746,756 783,805 824,772 852,117 870,467 831,238 861,484 914,559 954,167Croatia 11,344 12,123 13,186 14,748 16,225 17,624 16,327 16,175 15,665 15,684Italy 554,604 568,469 579,448 626,550 668,508 676,901 657,282 664,755 675,656 694,112Cyprus 3,757 4,152 4,762 5,245 6,374 6,624 5,955 6,192 6,313 6,250Latvia 4,077 4,565 5,411 7,006 9,225 9,665 7,114 7,039 7,968 8,909
80
Khan, M.I. & Altaf, F.
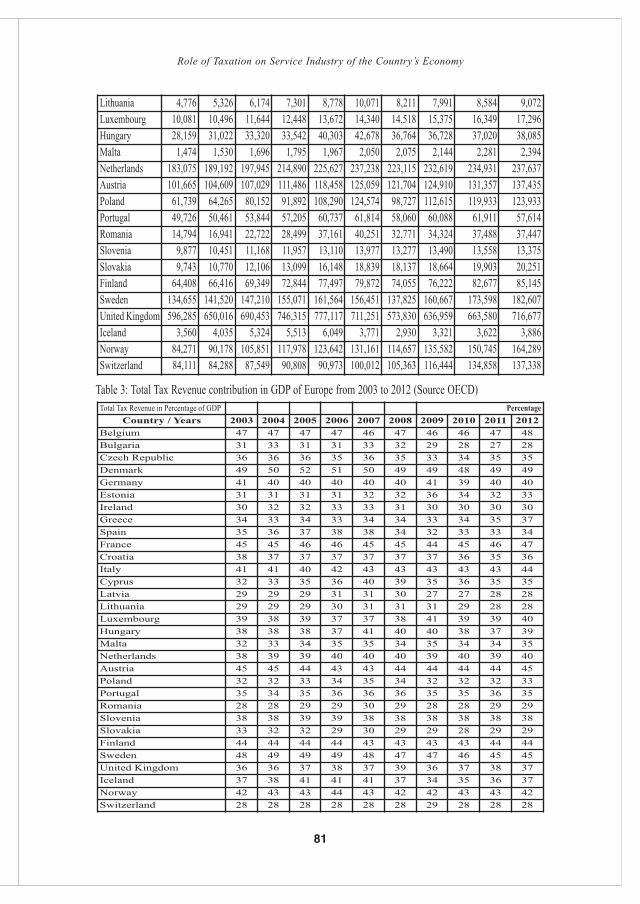
Table 3: Total Tax Revenue contribution in GDP of Europe from 2003 to 2012 (Source OECD)Total Tax Revenue in Percentage of GDP Percentage
Country / Years 2003 2004 2005 2006 2007 2008 2009 2010 2011 2012Belgium 47 47 47 47 46 47 46 46 47 48Bulgaria 31 33 31 31 33 32 29 28 27 28Czech Republic 36 36 36 35 36 35 33 34 35 35Denmark 49 50 52 51 50 49 49 48 49 49Germany 41 40 40 40 40 40 41 39 40 40Estonia 31 31 31 31 32 32 36 34 32 33Ireland 30 32 32 33 33 31 30 30 30 30Greece 34 33 34 33 34 34 33 34 35 37Spain 35 36 37 38 38 34 32 33 33 34France 45 45 46 46 45 45 44 45 46 47Croatia 38 37 37 37 37 37 37 36 35 36Italy 41 41 40 42 43 43 43 43 43 44Cyprus 32 33 35 36 40 39 35 36 35 35Latvia 29 29 29 31 31 30 27 27 28 28Lithuania 29 29 29 30 31 31 31 29 28 28Luxembourg 39 38 39 37 37 38 41 39 39 40Hungary 38 38 38 37 41 40 40 38 37 39Malta 32 33 34 35 35 34 35 34 34 35Netherlands 38 39 39 40 40 40 39 40 39 40Austria 45 45 44 43 43 44 44 44 44 45Poland 32 32 33 34 35 34 32 32 32 33Portugal 35 34 35 36 36 36 35 35 36 35Romania 28 28 29 29 30 29 28 28 29 29Slovenia 38 38 39 39 38 38 38 38 38 38Slovakia 33 32 32 29 30 29 29 28 29 29Finland 44 44 44 44 43 43 43 43 44 44Sweden 48 49 49 49 48 47 47 46 45 45United Kingdom 36 36 37 38 37 39 36 37 38 37Iceland 37 38 41 41 41 37 34 35 36 37Norway 42 43 43 44 43 42 42 43 43 42Switzerland 28 28 28 28 28 28 29 28 28 28
Lithuania 4,776 5,326 6,174 7,301 8,778 10,071 8,211 7,991 8,584 9,072Luxembourg 10,081 10,496 11,644 12,448 13,672 14,340 14,518 15,375 16,349 17,296Hungary 28,159 31,022 33,320 33,542 40,303 42,678 36,764 36,728 37,020 38,085Malta 1,474 1,530 1,696 1,795 1,967 2,050 2,075 2,144 2,281 2,394Netherlands 183,075 189,192 197,945 214,890 225,627 237,238 223,115 232,619 234,931 237,637Austria 101,665 104,609 107,029 111,486 118,458 125,059 121,704 124,910 131,357 137,435Poland 61,739 64,265 80,152 91,892 108,290 124,574 98,727 112,615 119,933 123,933Portugal 49,726 50,461 53,844 57,205 60,737 61,814 58,060 60,088 61,911 57,614Romania 14,794 16,941 22,722 28,499 37,161 40,251 32,771 34,324 37,488 37,447Slovenia 9,877 10,451 11,168 11,957 13,110 13,977 13,277 13,490 13,558 13,375Slovakia 9,743 10,770 12,106 13,099 16,148 18,839 18,137 18,664 19,903 20,251Finland 64,408 66,416 69,349 72,844 77,497 79,872 74,055 76,222 82,677 85,145Sweden 134,655 141,520 147,210 155,071 161,564 156,451 137,825 160,667 173,598 182,607United Kingdom 596,285 650,016 690,453 746,315 777,117 711,251 573,830 636,959 663,580 716,677Iceland 3,560 4,035 5,324 5,513 6,049 3,771 2,930 3,321 3,622 3,886Norway 84,271 90,178 105,851 117,978 123,642 131,161 114,657 135,582 150,745 164,289Switzerland 84,111 84,288 87,549 90,808 90,973 100,012 105,363 116,444 134,858 137,338
81
Role of Taxation on Service Industry of the Country’s Economy
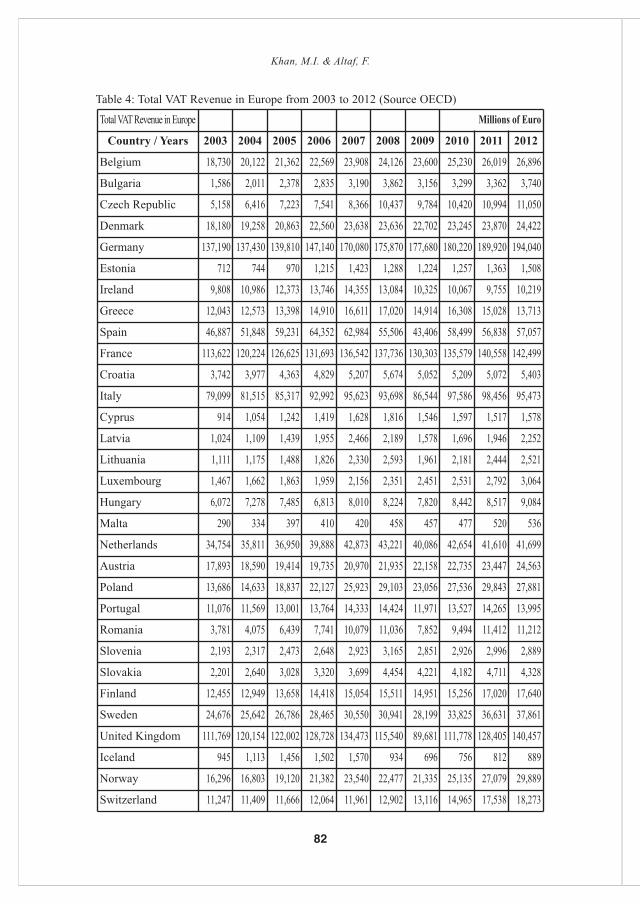
Table 4: Total VAT Revenue in Europe from 2003 to 2012 (Source OECD)
Total VAT Revenue in Europe Millions of Euro
Country / Years 2003 2004 2005 2006 2007 2008 2009 2010 2011 2012
Belgium 18,730 20,122 21,362 22,569 23,908 24,126 23,600 25,230 26,019 26,896
Bulgaria 1,586 2,011 2,378 2,835 3,190 3,862 3,156 3,299 3,362 3,740
Czech Republic 5,158 6,416 7,223 7,541 8,366 10,437 9,784 10,420 10,994 11,050
Denmark 18,180 19,258 20,863 22,560 23,638 23,636 22,702 23,245 23,870 24,422
Germany 137,190 137,430 139,810 147,140 170,080 175,870 177,680 180,220 189,920 194,040
Estonia 712 744 970 1,215 1,423 1,288 1,224 1,257 1,363 1,508
Ireland 9,808 10,986 12,373 13,746 14,355 13,084 10,325 10,067 9,755 10,219
Greece 12,043 12,573 13,398 14,910 16,611 17,020 14,914 16,308 15,028 13,713
Spain 46,887 51,848 59,231 64,352 62,984 55,506 43,406 58,499 56,838 57,057
France 113,622 120,224 126,625 131,693 136,542 137,736 130,303 135,579 140,558 142,499
Croatia 3,742 3,977 4,363 4,829 5,207 5,674 5,052 5,209 5,072 5,403
Italy 79,099 81,515 85,317 92,992 95,623 93,698 86,544 97,586 98,456 95,473
Cyprus 914 1,054 1,242 1,419 1,628 1,816 1,546 1,597 1,517 1,578
Latvia 1,024 1,109 1,439 1,955 2,466 2,189 1,578 1,696 1,946 2,252
Lithuania 1,111 1,175 1,488 1,826 2,330 2,593 1,961 2,181 2,444 2,521
Luxembourg 1,467 1,662 1,863 1,959 2,156 2,351 2,451 2,531 2,792 3,064
Hungary 6,072 7,278 7,485 6,813 8,010 8,224 7,820 8,442 8,517 9,084
Malta 290 334 397 410 420 458 457 477 520 536
Netherlands 34,754 35,811 36,950 39,888 42,873 43,221 40,086 42,654 41,610 41,699
Austria 17,893 18,590 19,414 19,735 20,970 21,935 22,158 22,735 23,447 24,563
Poland 13,686 14,633 18,837 22,127 25,923 29,103 23,056 27,536 29,843 27,881
Portugal 11,076 11,569 13,001 13,764 14,333 14,424 11,971 13,527 14,265 13,995
Romania 3,781 4,075 6,439 7,741 10,079 11,036 7,852 9,494 11,412 11,212
Slovenia 2,193 2,317 2,473 2,648 2,923 3,165 2,851 2,926 2,996 2,889
Slovakia 2,201 2,640 3,028 3,320 3,699 4,454 4,221 4,182 4,711 4,328
Finland 12,455 12,949 13,658 14,418 15,054 15,511 14,951 15,256 17,020 17,640
Sweden 24,676 25,642 26,786 28,465 30,550 30,941 28,199 33,825 36,631 37,861
United Kingdom 111,769 120,154 122,002 128,728 134,473 115,540 89,681 111,778 128,405 140,457
Iceland 945 1,113 1,456 1,502 1,570 934 696 756 812 889
Norway 16,296 16,803 19,120 21,382 23,540 22,477 21,335 25,135 27,079 29,889
Switzerland 11,247 11,409 11,666 12,064 11,961 12,902 13,116 14,965 17,538 18,273
82
Khan, M.I. & Altaf, F.
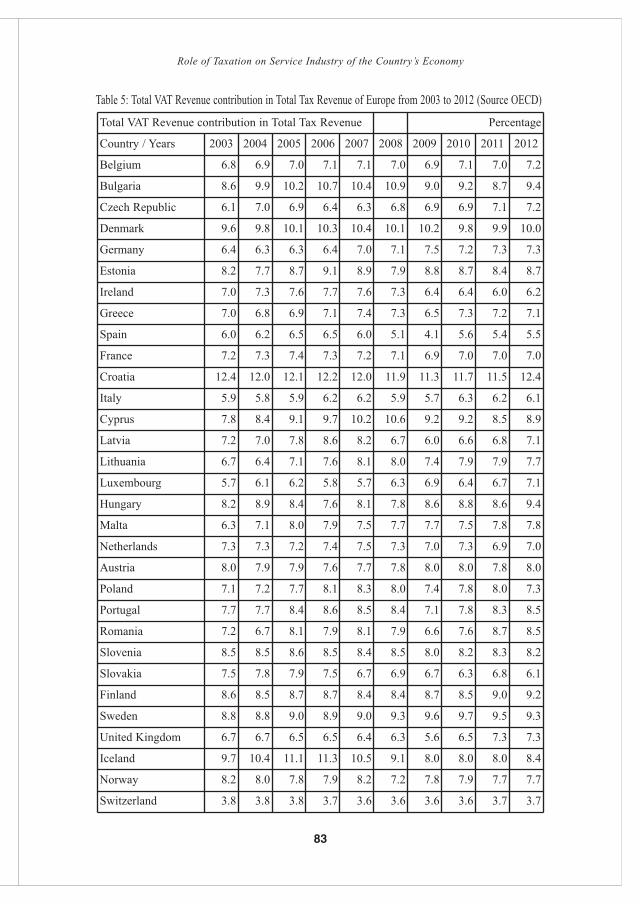
Table 5: Total VAT Revenue contribution in Total Tax Revenue of Europe from 2003 to 2012 (Source OECD)
Total VAT Revenue contribution in Total Tax Revenue Percentage
Country / Years 2003 2004 2005 2006 2007 2008 2009 2010 2011 2012
Belgium 6.8 6.9 7.0 7.1 7.1 7.0 6.9 7.1 7.0 7.2
Bulgaria 8.6 9.9 10.2 10.7 10.4 10.9 9.0 9.2 8.7 9.4
Czech Republic 6.1 7.0 6.9 6.4 6.3 6.8 6.9 6.9 7.1 7.2
Denmark 9.6 9.8 10.1 10.3 10.4 10.1 10.2 9.8 9.9 10.0
Germany 6.4 6.3 6.3 6.4 7.0 7.1 7.5 7.2 7.3 7.3
Estonia 8.2 7.7 8.7 9.1 8.9 7.9 8.8 8.7 8.4 8.7
Ireland 7.0 7.3 7.6 7.7 7.6 7.3 6.4 6.4 6.0 6.2
Greece 7.0 6.8 6.9 7.1 7.4 7.3 6.5 7.3 7.2 7.1
Spain 6.0 6.2 6.5 6.5 6.0 5.1 4.1 5.6 5.4 5.5
France 7.2 7.3 7.4 7.3 7.2 7.1 6.9 7.0 7.0 7.0
Croatia 12.4 12.0 12.1 12.2 12.0 11.9 11.3 11.7 11.5 12.4
Italy 5.9 5.8 5.9 6.2 6.2 5.9 5.7 6.3 6.2 6.1
Cyprus 7.8 8.4 9.1 9.7 10.2 10.6 9.2 9.2 8.5 8.9
Latvia 7.2 7.0 7.8 8.6 8.2 6.7 6.0 6.6 6.8 7.1
Lithuania 6.7 6.4 7.1 7.6 8.1 8.0 7.4 7.9 7.9 7.7
Luxembourg 5.7 6.1 6.2 5.8 5.7 6.3 6.9 6.4 6.7 7.1
Hungary 8.2 8.9 8.4 7.6 8.1 7.8 8.6 8.8 8.6 9.4
Malta 6.3 7.1 8.0 7.9 7.5 7.7 7.7 7.5 7.8 7.8
Netherlands 7.3 7.3 7.2 7.4 7.5 7.3 7.0 7.3 6.9 7.0
Austria 8.0 7.9 7.9 7.6 7.7 7.8 8.0 8.0 7.8 8.0
Poland 7.1 7.2 7.7 8.1 8.3 8.0 7.4 7.8 8.0 7.3
Portugal 7.7 7.7 8.4 8.6 8.5 8.4 7.1 7.8 8.3 8.5
Romania 7.2 6.7 8.1 7.9 8.1 7.9 6.6 7.6 8.7 8.5
Slovenia 8.5 8.5 8.6 8.5 8.4 8.5 8.0 8.2 8.3 8.2
Slovakia 7.5 7.8 7.9 7.5 6.7 6.9 6.7 6.3 6.8 6.1
Finland 8.6 8.5 8.7 8.7 8.4 8.4 8.7 8.5 9.0 9.2
Sweden 8.8 8.8 9.0 8.9 9.0 9.3 9.6 9.7 9.5 9.3
United Kingdom 6.7 6.7 6.5 6.5 6.4 6.3 5.6 6.5 7.3 7.3
Iceland 9.7 10.4 11.1 11.3 10.5 9.1 8.0 8.0 8.0 8.4
Norway 8.2 8.0 7.8 7.9 8.2 7.2 7.8 7.9 7.7 7.7
Switzerland 3.8 3.8 3.8 3.7 3.6 3.6 3.6 3.6 3.7 3.7
83
Role of Taxation on Service Industry of the Country’s Economy
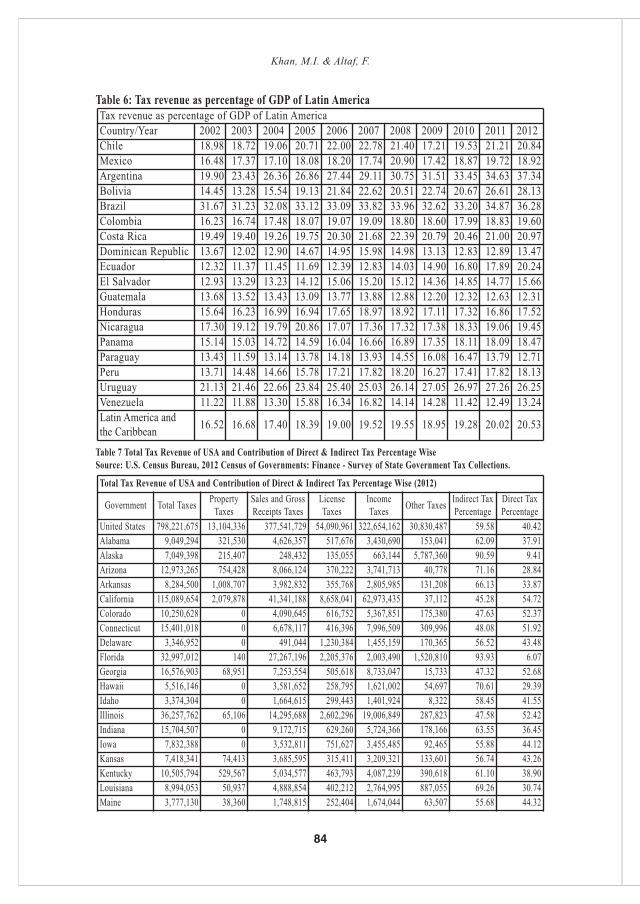
Table 6: Tax revenue as percentage of GDP of Latin America
Table 7 Total Tax Revenue of USA and Contribution of Direct & Indirect Tax Percentage WiseSource: U.S. Census Bureau, 2012 Census of Governments: Finance - Survey of State Government Tax Collections.
Total Tax Revenue of USA and Contribution of Direct & Indirect Tax Percentage Wise (2012)
Government Total Taxes PropertyTaxes
Sales and GrossReceipts Taxes
LicenseTaxes
IncomeTaxes Other Taxes Indirect Tax
PercentageDirect TaxPercentage
United States 798,221,675 13,104,336 377,541,729 54,090,961 322,654,162 30,830,487 59.58 40.42Alabama 9,049,294 321,530 4,626,357 517,676 3,430,690 153,041 62.09 37.91Alaska 7,049,398 215,407 248,432 135,055 663,144 5,787,360 90.59 9.41Arizona 12,973,265 754,428 8,066,124 370,222 3,741,713 40,778 71.16 28.84Arkansas 8,284,500 1,008,707 3,982,832 355,768 2,805,985 131,208 66.13 33.87California 115,089,654 2,079,878 41,341,188 8,658,041 62,973,435 37,112 45.28 54.72Colorado 10,250,628 0 4,090,645 616,752 5,367,851 175,380 47.63 52.37Connecticut 15,401,018 0 6,678,117 416,396 7,996,509 309,996 48.08 51.92Delaware 3,346,952 0 491,044 1,230,384 1,455,159 170,365 56.52 43.48Florida 32,997,012 140 27,267,196 2,205,376 2,003,490 1,520,810 93.93 6.07Georgia 16,576,903 68,951 7,253,554 505,618 8,733,047 15,733 47.32 52.68Hawaii 5,516,146 0 3,581,652 258,795 1,621,002 54,697 70.61 29.39Idaho 3,374,304 0 1,664,615 299,443 1,401,924 8,322 58.45 41.55Illinois 36,257,762 65,106 14,295,688 2,602,296 19,006,849 287,823 47.58 52.42Indiana 15,704,507 0 9,172,715 629,260 5,724,366 178,166 63.55 36.45Iowa 7,832,388 0 3,532,811 751,627 3,455,485 92,465 55.88 44.12Kansas 7,418,341 74,413 3,685,595 315,411 3,209,321 133,601 56.74 43.26Kentucky 10,505,794 529,567 5,034,577 463,793 4,087,239 390,618 61.10 38.90Louisiana 8,994,053 50,937 4,888,854 402,212 2,764,995 887,055 69.26 30.74Maine 3,777,130 38,360 1,748,815 252,404 1,674,044 63,507 55.68 44.32
Tax revenue as percentage of GDP of Latin AmericaCountry/Year 2002 2003 2004 2005 2006 2007 2008 2009 2010 2011 2012Chile 18.98 18.72 19.06 20.71 22.00 22.78 21.40 17.21 19.53 21.21 20.84Mexico 16.48 17.37 17.10 18.08 18.20 17.74 20.90 17.42 18.87 19.72 18.92Argentina 19.90 23.43 26.36 26.86 27.44 29.11 30.75 31.51 33.45 34.63 37.34Bolivia 14.45 13.28 15.54 19.13 21.84 22.62 20.51 22.74 20.67 26.61 28.13Brazil 31.67 31.23 32.08 33.12 33.09 33.82 33.96 32.62 33.20 34.87 36.28Colombia 16.23 16.74 17.48 18.07 19.07 19.09 18.80 18.60 17.99 18.83 19.60Costa Rica 19.49 19.40 19.26 19.75 20.30 21.68 22.39 20.79 20.46 21.00 20.97Dominican Republic 13.67 12.02 12.90 14.67 14.95 15.98 14.98 13.13 12.83 12.89 13.47Ecuador 12.32 11.37 11.45 11.69 12.39 12.83 14.03 14.90 16.80 17.89 20.24El Salvador 12.93 13.29 13.23 14.12 15.06 15.20 15.12 14.36 14.85 14.77 15.66Guatemala 13.68 13.52 13.43 13.09 13.77 13.88 12.88 12.20 12.32 12.63 12.31Honduras 15.64 16.23 16.99 16.94 17.65 18.97 18.92 17.11 17.32 16.86 17.52Nicaragua 17.30 19.12 19.79 20.86 17.07 17.36 17.32 17.38 18.33 19.06 19.45Panama 15.14 15.03 14.72 14.59 16.04 16.66 16.89 17.35 18.11 18.09 18.47Paraguay 13.43 11.59 13.14 13.78 14.18 13.93 14.55 16.08 16.47 13.79 12.71Peru 13.71 14.48 14.66 15.78 17.21 17.82 18.20 16.27 17.41 17.82 18.13Uruguay 21.13 21.46 22.66 23.84 25.40 25.03 26.14 27.05 26.97 27.26 26.25Venezuela 11.22 11.88 13.30 15.88 16.34 16.82 14.14 14.28 11.42 12.49 13.24Latin America andthe Caribbean 16.52 16.68 17.40 18.39 19.00 19.52 19.55 18.95 19.28 20.02 20.53
84
Khan, M.I. & Altaf, F.
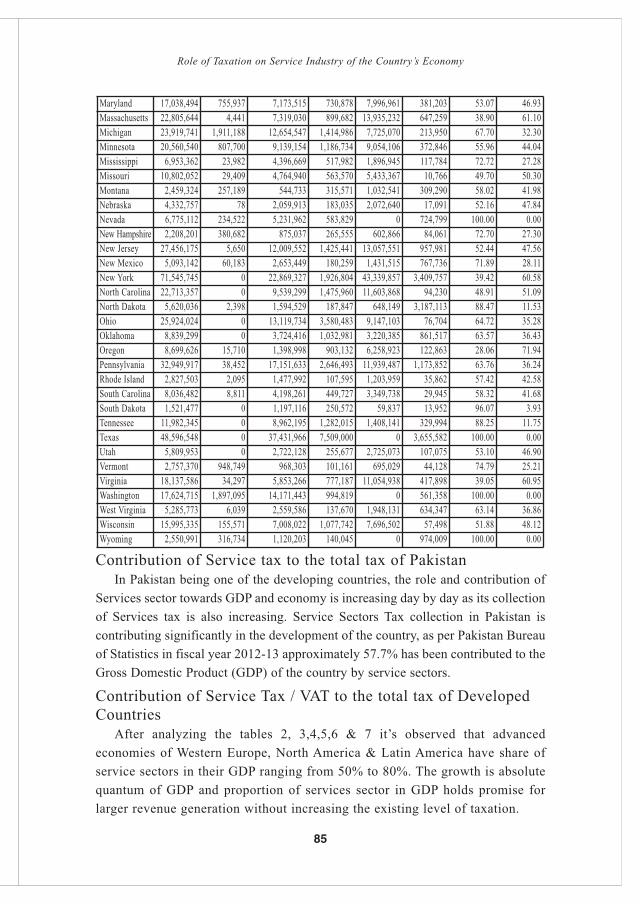
Contribution of Service tax to the total tax of PakistanIn Pakistan being one of the developing countries, the role and contribution of
Services sector towards GDP and economy is increasing day by day as its collectionof Services tax is also increasing. Service Sectors Tax collection in Pakistan iscontributing significantly in the development of the country, as per Pakistan Bureauof Statistics in fiscal year 2012-13 approximately 57.7% has been contributed to theGross Domestic Product (GDP) of the country by service sectors.
Contribution of Service Tax / VAT to the total tax of DevelopedCountries
After analyzing the tables 2, 3,4,5,6 & 7 it’s observed that advancedeconomies of Western Europe, North America & Latin America have share ofservice sectors in their GDP ranging from 50% to 80%. The growth is absolutequantum of GDP and proportion of services sector in GDP holds promise forlarger revenue generation without increasing the existing level of taxation.
Maryland 17,038,494 755,937 7,173,515 730,878 7,996,961 381,203 53.07 46.93Massachusetts 22,805,644 4,441 7,319,030 899,682 13,935,232 647,259 38.90 61.10Michigan 23,919,741 1,911,188 12,654,547 1,414,986 7,725,070 213,950 67.70 32.30Minnesota 20,560,540 807,700 9,139,154 1,186,734 9,054,106 372,846 55.96 44.04Mississippi 6,953,362 23,982 4,396,669 517,982 1,896,945 117,784 72.72 27.28Missouri 10,802,052 29,409 4,764,940 563,570 5,433,367 10,766 49.70 50.30Montana 2,459,324 257,189 544,733 315,571 1,032,541 309,290 58.02 41.98Nebraska 4,332,757 78 2,059,913 183,035 2,072,640 17,091 52.16 47.84Nevada 6,775,112 234,522 5,231,962 583,829 0 724,799 100.00 0.00New Hampshire 2,208,201 380,682 875,037 265,555 602,866 84,061 72.70 27.30New Jersey 27,456,175 5,650 12,009,552 1,425,441 13,057,551 957,981 52.44 47.56New Mexico 5,093,142 60,183 2,653,449 180,259 1,431,515 767,736 71.89 28.11New York 71,545,745 0 22,869,327 1,926,804 43,339,857 3,409,757 39.42 60.58North Carolina 22,713,357 0 9,539,299 1,475,960 11,603,868 94,230 48.91 51.09North Dakota 5,620,036 2,398 1,594,529 187,847 648,149 3,187,113 88.47 11.53Ohio 25,924,024 0 13,119,734 3,580,483 9,147,103 76,704 64.72 35.28Oklahoma 8,839,299 0 3,724,416 1,032,981 3,220,385 861,517 63.57 36.43Oregon 8,699,626 15,710 1,398,998 903,132 6,258,923 122,863 28.06 71.94Pennsylvania 32,949,917 38,452 17,151,633 2,646,493 11,939,487 1,173,852 63.76 36.24Rhode Island 2,827,503 2,095 1,477,992 107,595 1,203,959 35,862 57.42 42.58South Carolina 8,036,482 8,811 4,198,261 449,727 3,349,738 29,945 58.32 41.68South Dakota 1,521,477 0 1,197,116 250,572 59,837 13,952 96.07 3.93Tennessee 11,982,345 0 8,962,195 1,282,015 1,408,141 329,994 88.25 11.75Texas 48,596,548 0 37,431,966 7,509,000 0 3,655,582 100.00 0.00Utah 5,809,953 0 2,722,128 255,677 2,725,073 107,075 53.10 46.90Vermont 2,757,370 948,749 968,303 101,161 695,029 44,128 74.79 25.21Virginia 18,137,586 34,297 5,853,266 777,187 11,054,938 417,898 39.05 60.95Washington 17,624,715 1,897,095 14,171,443 994,819 0 561,358 100.00 0.00West Virginia 5,285,773 6,039 2,559,586 137,670 1,948,131 634,347 63.14 36.86Wisconsin 15,995,335 155,571 7,008,022 1,077,742 7,696,502 57,498 51.88 48.12Wyoming 2,550,991 316,734 1,120,203 140,045 0 974,009 100.00 0.00
85
Role of Taxation on Service Industry of the Country’s Economy

Model & Analysis
The graph shows the graphical representation of the responses for EuropeVAT which is also normally distributed.
The graph shows the graphical representation of the responses for EuropeTax which is also normally distributed.
Correlations
**Correlation is significant at the 0.01 level (2-tailed).
Europe_VAT Europe_TaxEurope_VAT Pearson Correlation 1 .956**
Sig. (2-tailed) .000N 47 47
Europe_Tax Pearson Correlation .956** 1Sig. (2-tailed) .000N 47 47
86
Khan, M.I. & Altaf, F.

The correlation between Europe–VAT and Europe–Tax is 0.956 showing avery strong and direct correlation between the two variables. The sig value of0.000 shows that the correlation is statistically significant at 95% confidence.Keeping this in mind, we significantly reject our null hypothesis.
The purpose of Service tax is to provide the government enough and sufficientrevenue by which they can resolve their issues and contribute in the development ofthe country which will be beneficial for the people of the country. Services taxcontributes a lot in the development of the countries it is observed that how the worldis collecting the huge amount of tax just from the service sectors. In Pakistan & Indiaapproximately 50% of their GDP comes from the services sectors and the rest of theworld is also getting immense share from services sectors taxation. It is beingobserved that aviation industry in 2011 transported approximately 2.8 billionpassengers and approximately 47.6 million metric tons of air cargo and such aninformation highlights the services sector importance & potential in the entire worldfor, when 2.8 billion of passengers across the globe travel from one destination toanother and while travelling they might use unlimited services being provided bythe different services sectors like service of restaurants, hotels, taxis,telecommunication, beauty parlors, internet, online shopping, cinemas, night clubs,banking, money changers, credit cards, online transactions, travelling cheque etc.
The best policy of collecting the Service Tax cannot be ultimate solution unlessit’s being implemented effectively. In many parts of the world, especially in thedeveloping countries agriculture sector is not taxed, due to lack of competent andtrained tax machinery and also due to the lack of will of government. As in Pakistanit is approximately more than 70% tax amount is collected from one city namelyKarachi, whereas the other parts of Pakistan contribute the rest. Such a figure isdisturbing for the future prospects of tax collection in Pakistan. Therefore, taxcollection department of Pakistan should reconsider its policies and should developsuch an infrastructure by which implementation of these policies can be materialised.Nevertheless, province based services tax collection departments of Pakistan areperforming well, as SRB (Sindh Revenue Board) has been achieving its targets forthe last two fiscal years 2011-12 & 2012-13 and PRA (Punjab Revenue Authority) isalso performing good by achieving Revenue targets. Overall contribution of ServicesTax in Pakistan tax revenue is playing a vital role in the development of the country.
ConclusionThe conclusion of the article is that, Service sectors are contributing well in
the GDP of the countries all over the world and do generate a large portion ofrevenue for the development of the country economy and its people.
87
Role of Taxation on Service Industry of the Country’s Economy
ReferencesAyaz Ahmed & Henna Ahsan, Contribution of Service Sector in the Economy of
Pakistan, Pakistan Institute of Development Economics (PIDE) workingpapers 2011:79.
Central Board of Revenue, Year Book 2005-2006.
Charles River Associates, Taxation of the Financial Services Sector in the UK,Published October 2010.
Federal Board of Revenue, Annual Report 2009-2010.
Federal Board of Revenue, Year Book 2007-2008.
Federal Board of Revenue, Year Book 2012-2013.
Fiscal Policy Statement, Debt Policy Coordination Office (DPCO), Ministry ofFinance, Government of Pakistan, Islamabad. January 31, 2008.
IATA (International Air Transport Association). 2007. “Aviation EconomicBenefits.” IATA Economics Briefing No. 8, July. Available atp://www.iata.org/whatwedo/Documents/economics/aviation_economic_benefits.pdf.
Mrs. K. Hema Malini, Dr.V.Balachandran, Changed Role of Service Sector AndEnhanced Service Tax Revenue – An Introspection, Journal of BusinessManagement & Social Sciences Research (JBM&SSR) ISSN No: 2319-5614 Volume 2, No.9,September 2013
Pakistan Fiscal Policy Statement 2009-10
Pakistan Tax Policy Report, December 2008.
Pakistan Telecommunication Authority, Annual Report, 2011.
Pakistan Telecommunication Authority, Annual Report, 2012.
Pakistan Telecommunication Authority, Annual Report, 2013.
PWC, The Total Tax Contribution of UK Financial Services, Third Edition,December 2010.
Real GDP (Sector Wise Data), www.sbp.org.pk/stats/survey/index.asp,2 April 2014.
Team Hiregange- Bangalore & Hyderabad, Service Tax Concepts, October 2012.
88
Khan, M.I. & Altaf, F.
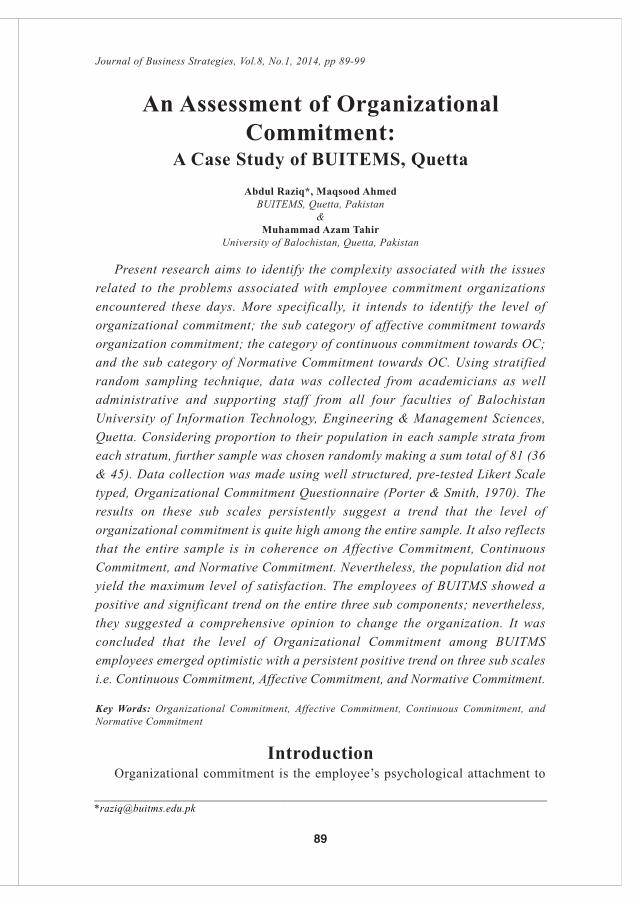
An Assessment of OrganizationalCommitment:
A Case Study of BUITEMS, QuettaAbdul Raziq*, Maqsood Ahmed
BUITEMS, Quetta, Pakistan&
Muhammad Azam TahirUniversity of Balochistan, Quetta, Pakistan
Present research aims to identify the complexity associated with the issuesrelated to the problems associated with employee commitment organizationsencountered these days. More specifically, it intends to identify the level oforganizational commitment; the sub category of affective commitment towardsorganization commitment; the category of continuous commitment towards OC;and the sub category of Normative Commitment towards OC. Using stratifiedrandom sampling technique, data was collected from academicians as welladministrative and supporting staff from all four faculties of BalochistanUniversity of Information Technology, Engineering & Management Sciences,Quetta. Considering proportion to their population in each sample strata fromeach stratum, further sample was chosen randomly making a sum total of 81 (36& 45). Data collection was made using well structured, pre-tested Likert Scaletyped, Organizational Commitment Questionnaire (Porter & Smith, 1970). Theresults on these sub scales persistently suggest a trend that the level oforganizational commitment is quite high among the entire sample. It also reflectsthat the entire sample is in coherence on Affective Commitment, ContinuousCommitment, and Normative Commitment. Nevertheless, the population did notyield the maximum level of satisfaction. The employees of BUITMS showed apositive and significant trend on the entire three sub components; nevertheless,they suggested a comprehensive opinion to change the organization. It wasconcluded that the level of Organizational Commitment among BUITMSemployees emerged optimistic with a persistent positive trend on three sub scalesi.e. Continuous Commitment, Affective Commitment, and Normative Commitment.
Key Words: Organizational Commitment, Affective Commitment, Continuous Commitment, andNormative Commitment
IntroductionOrganizational commitment is the employee’s psychological attachment to
89
Journal of Business Strategies, Vol.8, No.1, 2014, pp 89-99
__________________________________________________________________________________*[email protected]
the organization. It could be compared with other work-related attitudes, such asJob Satisfaction (an employee’s feelings about his/her job) and OrganizationalContinuous Commitment (Meyer & Allen, 1991). This is a key factor in makingthe organization effective, as there is a direct relationship between theorganizational commitment and organizational effectiveness. The higher theemployee’s commitment the higher will be the organization effective. The extentof this commitment varies from person to person and from organization toorganization. HR policies influence the organizational commitment a lot, becausethis is very concerned with employees. Organizational commitment is importantbecause committed employees are less likely to leave for another job and aremore likely to perform at higher levels. Organizational scientists have developedmany definitions of organizational commitment, and numerous scales to measurethem. Exemplary of this work is Meyer & Allen’s (1991) model of commitment,developed to integrate numerous definitions of commitment that had proliferatedin the research literature. The commitment of employee is vital for the effectiveutilization of organization’s resources, as the fundamental responsibility of topmanagement is to maintain the organization in a state necessary to carryout itsoperations. Efficient top management thus shows high concern, a sense ofresponsibility for and commitment to sustaining the welfare of the organization(Selznick, 1957 & Person, 1972).
For the last 40 years, a lot of research has been conducted to identify, andmeasure the organizational commitment. Commitment is an attitude of anemployee towards his or her organization. It is a desire to maintain membershipin the organization. Employees build this attitude due to the socialization process,which occurs in family, society and organization (Ulrich, 2001).
Commitment is also a function of the rewards and costs associated withorganizational membership (Becker, 1960; Farell & Rusbult, 1981; Grusky,1966). It is a binding of the individuals to behavioral acts that result whenindividuals attribute an attitude of commitment to themselves after engaging inbehaviors that are volitional, precise, irreversible (Kiesler & Sakumura, 1966;O’Reilly & Caldwell, 1980; Salanick, 1977).
Becker (1960) defined commitment as a function of the rewards and costsassociated with organizational relationship. He gave the idea of side bets,whereby individuals stake some unrelated aspect of their lives on continuedorganizational membership. For instance, people may be unwilling to quit anorganization for fear they perceived as “job hoppers.” In such situations,individuals make side bets by staking their reputation for stability on the decision
90
Raziq, A., Ahmed, M. & Tahir, M.A.
to remain with particular organization. Commitment can be characterized by threefactors, a strong belief in and acceptance of the organization’s goals, values, awillingness to apply significant effort on behalf of the organization and a strongdesire to maintain membership in the organization (Porter et al., 1974).
The organizational commitment was initially measured by organizationalcommitment questionnaire, developed by Porter et al., 1974. Their questionnairereflects an individual’s willingness to work towards and accept organizationalgoals (Brian et al., 2003). However, Meyer & Allen (1997) defines organizationalcommitment is the attitude of an employee towards his or her organization. Apsychological state categorizes the employee’s relationship with the organization,and has implications for the decision to continue membership in organizationdistinguished three components of commitment: affective, continuance andnormative. According to Meyer and Allen’s (1991) three-component model ofcommitment, prior research indicated that there are three “mind sets” which cancharacterize an employee’s commitment to the organization:
Affective Commitment: AC is defined as the employee’s emotionalattachment to the organization. As a result, he or she strongly identifies with thegoals of the organization and desires to remain a part of the organization. Thisemployee commits to the organization because he/she “wants to”. In developingthis concept, Meyer and Allen drew largely on Mowday, Porter, and Steers (1982)concept of commitment.
Continuance Commitment: The individual commits to the organization becausehe/she perceives high costs of losing organizational membership (cf. Becker’s1960 “side bet theory”), including economic losses (such as pension accruals) andwould have to be given up social costs (friendship ties with co-workers). Theemployee remains a member of the organization because he/she “has to”.
Normative Commitment: The individual commits to and remains with anorganization because of feelings of obligation. For instance, the organization mayhave invested resources in training an employee who then feels an obligation toput forth effort on the job and stay with the organization to ‘repay the debt.’ Itmay also reflect an internalized norm, developed before the person joins theorganization through family or other socialization processes, that one should beloyal to one’s organization. The employee stays with the organization becausehe/she “ought to”.
According to Meyer and Allen, these components of commitment are notmutually exclusive an employee can simultaneously be committed to theorganization in an affective, normative, and continuance sense, at varying levels
91
An Assessment of Organizational Commitment
of intensity. This idea led Meyer and Herscovitch (2001) to argue that at any pointin time, an employee has a “commitment profile” that reflects high or low levelsof all three of these mind-sets, and that different profiles have different effects onworkplace behavior such as job performance, absenteeism, and the chance thatthey will quit. The factors like pay, benefits, match people with jobs that fit theirinterests and skills, coworkers, making job fun, the work itself, promotions,supervision, work group, working conditions. The outcomes of these factors areprobably the low turnover, low absenteeism, and high performance.
The proposed research aims to identify the complexity of the issue withrespect to the problems associated with employee commitment towards theorganizations, which they face these days. After having a deliberative discussiontowards the idea, the present research will satisfy the questions. a) To identifyholistically the level of organizational commitment. b) To quantify the subcategory of Affective Commitment towards OC. c) To Know the sub category ofContinuous Commitment towards OC. d) To circumference the sub category ofNormative Commitment towards OC.
MethodSample
The research was conducted from all four faculties included professors,associate professors, assistant professors, lecturers. The administrative staffincluded registrar, deputy registrar, assistant registrars, superintendents, clerksand all service staff (class 4 category). Stratified random sampling technique wasused to find sample size. From each stratum, employees were randomly selectedin proportion to their population in each sample strata through followingformula.(Table 1.1).
nh = n * NhN
Where
n = Size of sample to be drawn
N = Size of the population
nh = Size of sub-population drawn from kth stratum
Nh = Size of kth stratum
The distribution of sampled employees (faculty and members ofadministrative staff) is presented in table 1.1. It shows that majority of employees55 % were from administrative staff and the remaining 45 % were facultymembers.
92
Raziq, A., Ahmed, M. & Tahir, M.A.
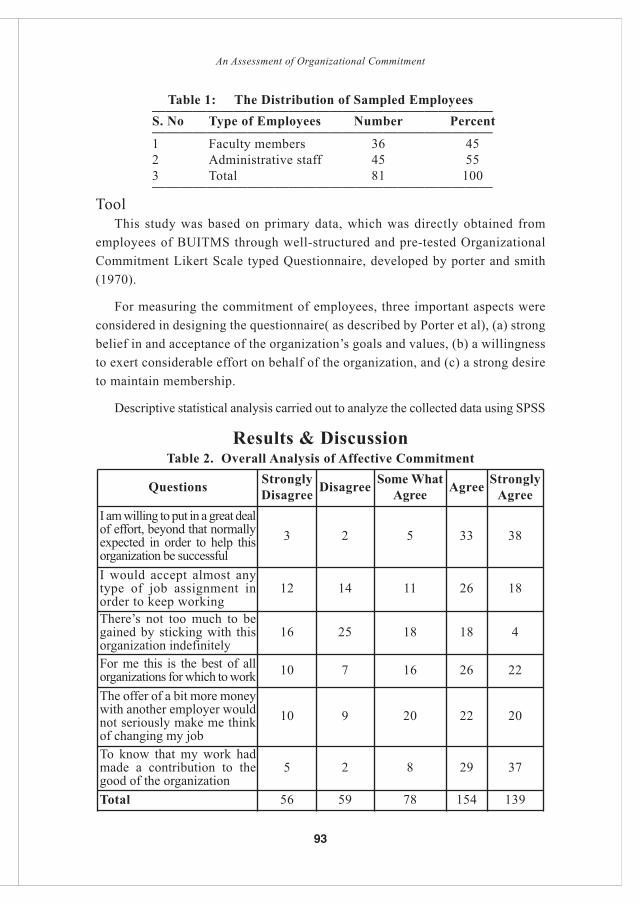
Table 1: The Distribution of Sampled Employees—————————————————————————S. No Type of Employees Number Percent—————————————————————————1 Faculty members 36 452 Administrative staff 45 553 Total 81 100—————————————————————————
ToolThis study was based on primary data, which was directly obtained from
employees of BUITMS through well-structured and pre-tested OrganizationalCommitment Likert Scale typed Questionnaire, developed by porter and smith(1970).
For measuring the commitment of employees, three important aspects wereconsidered in designing the questionnaire( as described by Porter et al), (a) strongbelief in and acceptance of the organization’s goals and values, (b) a willingnessto exert considerable effort on behalf of the organization, and (c) a strong desireto maintain membership.
Descriptive statistical analysis carried out to analyze the collected data using SPSS
Results & DiscussionTable 2. Overall Analysis of Affective Commitment
Questions StronglyDisagree Disagree
SomeWhatAgree Agree StronglyAgree
I am willing to put in a great dealof effort, beyond that normallyexpected in order to help thisorganization be successful
3 2 5 33 38
I would accept almost anytype of job assignment inorder to keep working
12 14 11 26 18
There’s not too much to begained by sticking with thisorganization indefinitely
16 25 18 18 4
For me this is the best of allorganizations for which to work 10 7 16 26 22
The offer of a bit more moneywith another employer wouldnot seriously make me thinkof changing my job
10 9 20 22 20
To know that my work hadmade a contribution to thegood of the organization
5 2 8 29 37
Total 56 59 78 154 139
93
An Assessment of Organizational Commitment
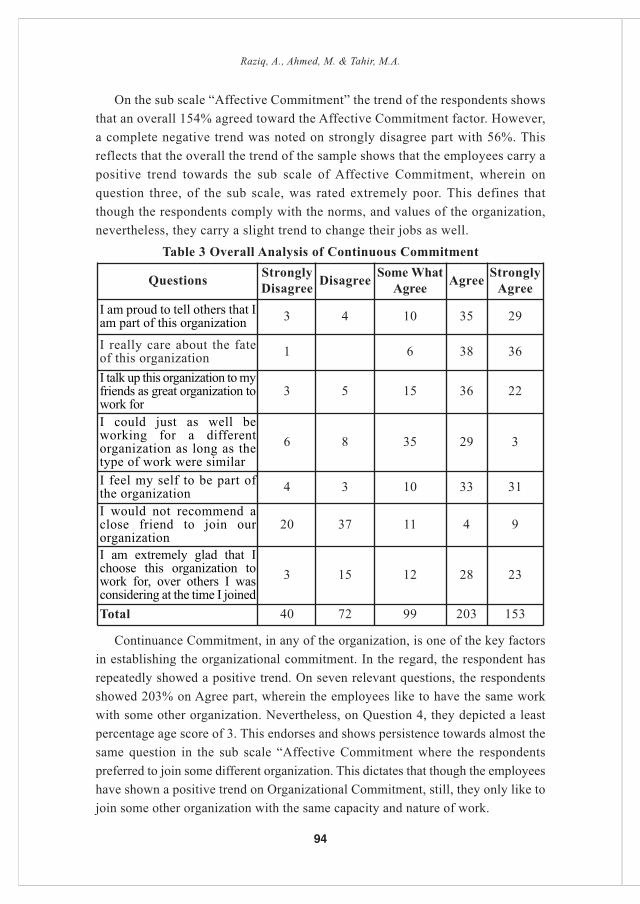
On the sub scale “Affective Commitment” the trend of the respondents showsthat an overall 154% agreed toward the Affective Commitment factor. However,a complete negative trend was noted on strongly disagree part with 56%. Thisreflects that the overall the trend of the sample shows that the employees carry apositive trend towards the sub scale of Affective Commitment, wherein onquestion three, of the sub scale, was rated extremely poor. This defines thatthough the respondents comply with the norms, and values of the organization,nevertheless, they carry a slight trend to change their jobs as well.
Table 3 Overall Analysis of Continuous Commitment
Continuance Commitment, in any of the organization, is one of the key factorsin establishing the organizational commitment. In the regard, the respondent hasrepeatedly showed a positive trend. On seven relevant questions, the respondentsshowed 203% on Agree part, wherein the employees like to have the same workwith some other organization. Nevertheless, on Question 4, they depicted a leastpercentage age score of 3. This endorses and shows persistence towards almost thesame question in the sub scale “Affective Commitment where the respondentspreferred to join some different organization. This dictates that though the employeeshave shown a positive trend on Organizational Commitment, still, they only like tojoin some other organization with the same capacity and nature of work.
Questions StronglyDisagree Disagree
SomeWhatAgree Agree StronglyAgree
I am proud to tell others that Iam part of this organization 3 4 10 35 29
I really care about the fateof this organization 1 6 38 36
I talk up this organization to myfriends as great organization towork for
3 5 15 36 22
I could just as well beworking for a differentorganization as long as thetype of work were similar
6 8 35 29 3
I feel my self to be part ofthe organization 4 3 10 33 31
I would not recommend aclose friend to join ourorganization
20 37 11 4 9
I am extremely glad that Ichoose this organization towork for, over others I wasconsidering at the time I joined
3 15 12 28 23
Total 40 72 99 203 153
94
Raziq, A., Ahmed, M. & Tahir, M.A.
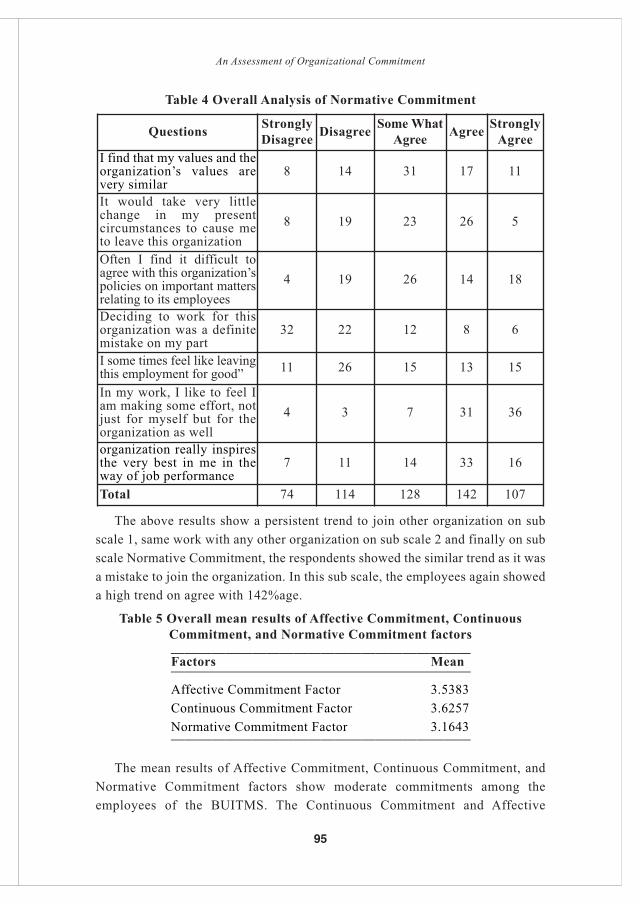
Table 4 Overall Analysis of Normative Commitment
The above results show a persistent trend to join other organization on subscale 1, same work with any other organization on sub scale 2 and finally on subscale Normative Commitment, the respondents showed the similar trend as it wasa mistake to join the organization. In this sub scale, the employees again showeda high trend on agree with 142%age.
Table 5 Overall mean results of Affective Commitment, ContinuousCommitment, and Normative Commitment factors——————————————————————Factors Mean——————————————————————Affective Commitment Factor 3.5383Continuous Commitment Factor 3.6257Normative Commitment Factor 3.1643——————————————————————
The mean results of Affective Commitment, Continuous Commitment, andNormative Commitment factors show moderate commitments among theemployees of the BUITMS. The Continuous Commitment and Affective
Questions StronglyDisagree Disagree
SomeWhatAgree Agree StronglyAgree
I find that my values and theorganization’s values arevery similar
8 14 31 17 11
It would take very littlechange in my presentcircumstances to cause meto leave this organization
8 19 23 26 5
Often I find it difficult toagree with this organization’spolicies on important mattersrelating to its employees
4 19 26 14 18
Deciding to work for thisorganization was a definitemistake on my part
32 22 12 8 6
I some times feel like leavingthis employment for good” 11 26 15 13 15
In my work, I like to feel Iam making some effort, notjust for myself but for theorganization as well
4 3 7 31 36
organization really inspiresthe very best in me in theway of job performance
7 11 14 33 16
Total 74 114 128 142 107
95
An Assessment of Organizational Commitment
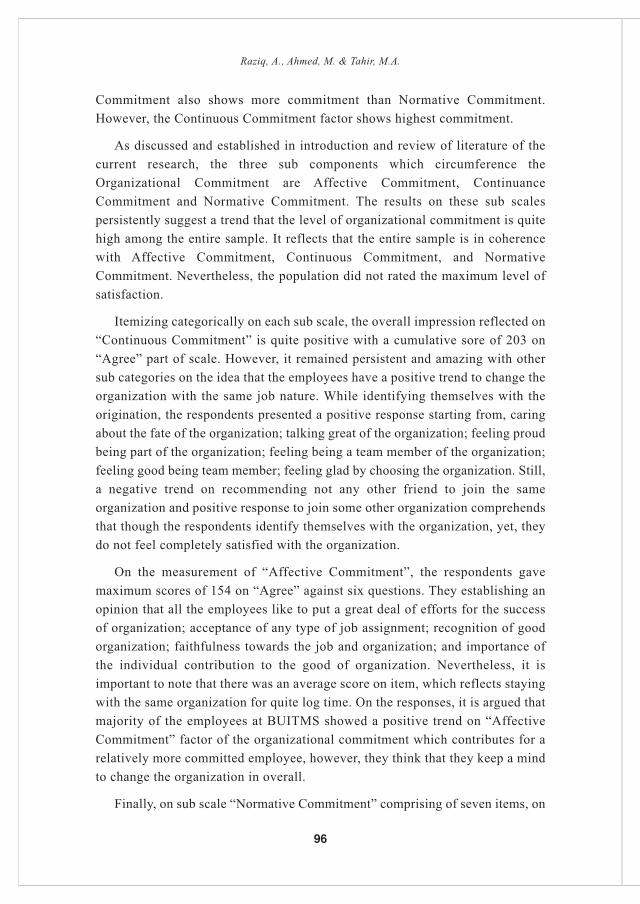
Commitment also shows more commitment than Normative Commitment.However, the Continuous Commitment factor shows highest commitment.
As discussed and established in introduction and review of literature of thecurrent research, the three sub components which circumference theOrganizational Commitment are Affective Commitment, ContinuanceCommitment and Normative Commitment. The results on these sub scalespersistently suggest a trend that the level of organizational commitment is quitehigh among the entire sample. It reflects that the entire sample is in coherencewith Affective Commitment, Continuous Commitment, and NormativeCommitment. Nevertheless, the population did not rated the maximum level ofsatisfaction.
Itemizing categorically on each sub scale, the overall impression reflected on“Continuous Commitment” is quite positive with a cumulative sore of 203 on“Agree” part of scale. However, it remained persistent and amazing with othersub categories on the idea that the employees have a positive trend to change theorganization with the same job nature. While identifying themselves with theorigination, the respondents presented a positive response starting from, caringabout the fate of the organization; talking great of the organization; feeling proudbeing part of the organization; feeling being a team member of the organization;feeling good being team member; feeling glad by choosing the organization. Still,a negative trend on recommending not any other friend to join the sameorganization and positive response to join some other organization comprehendsthat though the respondents identify themselves with the organization, yet, theydo not feel completely satisfied with the organization.
On the measurement of “Affective Commitment”, the respondents gavemaximum scores of 154 on “Agree” against six questions. They establishing anopinion that all the employees like to put a great deal of efforts for the successof organization; acceptance of any type of job assignment; recognition of goodorganization; faithfulness towards the job and organization; and importance ofthe individual contribution to the good of organization. Nevertheless, it isimportant to note that there was an average score on item, which reflects stayingwith the same organization for quite log time. On the responses, it is argued thatmajority of the employees at BUITMS showed a positive trend on “AffectiveCommitment” factor of the organizational commitment which contributes for arelatively more committed employee, however, they think that they keep a mindto change the organization in overall.
Finally, on sub scale “Normative Commitment” comprising of seven items, on
96
Raziq, A., Ahmed, M. & Tahir, M.A.
“Agree” the majority of the respondents internalized with the task andresponsibilities at, being part of the organization. Majority of the sample showeda high trend on the question that the organization job performance is appreciatedby the organization; while putting some efforts at work; having a slight ofchanging the organization; having compatible values with the organization;difficulties with the organizational values; and leaving job for good, showed asystematic down ward trend. Largely, it shows a medium level of NormativeCommitment towards the organization.
According to Kelaman’s (1958, 1961) research to argue that commitment maybe based on Affective Commitment, Continuous Commitment, and NormativeCommitment. Affective Commitment occurs when attitude and behaviors areadopted in order to obtain certain specific rewards or to obtain certainpunishment. Continuous Commitment occurs when attitudes and behaviors areadopted in order to be associated with a satisfying self-defining relationship withanother person or group. Finally, Normative Commitment occurs when attitudesand behaviors are adopted because the content of the attitude or behavior iscongruent with the individual’s value system. The Affective Commitment,Continuous Commitment and Normative Commitment, as bases of commitmentare differentially related to prosocial organizational behaviour, turnover, andintent to stay with the organization (O’Reilly, 1986, Becker et al, 1993)
ConclusionIt is interesting to note that though the employees of BUITMS showed
positive and significant trend on the three sub components, nevertheless theyhave a sound opinion to change the organization. It was concluded that theOrganizational Commitment level among BUITMS employees is positive with apersistent positive trend on three sub scales i.e. Continuous Commitment,Affective Commitment, and Normative Commitment.
RecommendationsFollowing are some of the recommendations based on the results obtained
from the analysis of current study.
1. Since all the previous studies have been conducted in advanced countries,the precise definition of organizational commitment has to be redressedto fit in the values and culture of Pakistan, being a third world country.
2. Results of such a small sample cannot be generalized towards theorganizational commitment.
97
An Assessment of Organizational Commitment

3. Another sub factor of Motive for Commitment has to be introduced,keeping in view the culture of Pakistan.
4. Variables like gender, socio-economic status, qualification, may also beaddressed to evaluate the level of variance.
ReferencesAshman Ian, Winstanley Diana, (2006), The Ethics Of Organizational
Commitment, Business Ethics.
Becker .E. Thomas, Billing .S .Robert, (1993), Profiles of Commitment: AnEmpirical Test, Journal of Organizational Behavior, pp. 177-190.
Becker, H.S(1960) Notes on the Concept of Commitment. American Journal ofSociology, 66, 32- 40.
Daellonbach, S.U., Mccarthy, M.A. & Schoenecker, S.T. (1999) Commitment toInnovation: The Impact of Top Management Team Characteristic. R & DManagement 29, 200-208.
Dordevic Biljana, (2004), Employee Commitment in Times of RadicalOrganizational Changes, Economics and Organization 2: 111-117.
Farrell, D. & Rubult, C.E.(1981) Exchange Variables As Predictors Of JobSatisfaction, Job Commitment And Turn Over: The Impact Of Rewards,Costs, Alternatives And Investments. Organizational Behavior andHuman Performance, 28, 78-95.
Dungan, G., Alan F. & Francis, G. (2001), Employer Policies and OrganizationalCommitment in Britain, Journal of Management Studies 38:8.
Thaneswor, G., Rolf, D.V. & Ulrich, W. (2001), Organizational Commitment InNepalese Settings, Asian Journal of Social Psychology 4:239-248.
Grusky, O. (1966) Career Mobility and Organizational Commitment.Administrative Science Quarterly, 10, 488-503.
Jernigan E. I, Beggs M. Joyce (2005). An Examination of Satisfaction with MySupervisor and Organizational Commitment. Journal of AppliedPsychology 35,10: 2171-2192.
Kiesler, C.A & Sakumura,J. (1966) A Test of a Model for Commitment. Journalof Personality and Social Psychology, 3, 349-353.
98
Raziq, A., Ahmed, M. & Tahir, M.A.

O’ Reilly,C & Caldwell, d.(1980), Job Choice: The Impact of Intrinsic andExtrinsic Factors on Subsequent Satisfaction and Commitment. Journalof Applied Psychology, 65, 559-569.
Reichers, E.A. (1985), A Review and Reconceptulization of OrganizationCommitment, The Academy of Management Review, 465-476.
Salanick, G.R. (1977) Commitment and the Control of Organizational BehaviourAnd Belief. In B.M. Staw & G.R. Salanick(eds), New Directions inOrganizational Behaviour (pp. 1-54). Chicago: St. Clair.
Masao, T., Hiroto, T. & Masahiro, I. (1998), A Study of Antecedents ofOrganizational Commitment, Japanese Psychological Research 1998-2005
Meyer J. P. & Allen, N. J. (1991). A Three-Component Conceptualization OfOrganizational Commitment. Human Resource Management Review, 1,61-89.
Meyer, J. P. & Allen, N. J. (1997). Commitment in the Workplace: Theory,Research, and Application. Thousand Oaks, CA, USA: SagePublications.
Porter, L. W., Steers, R. M., Mowday, R. T. & Boulian, P. V. (1974).Organizational Commitment, Job Satisfaction, and Turnover AmongPsychiatric Technicians. Journal of Applied Psychology, 59, 603-609.
Mowday, R. T., Porter, L. W. & Steers, R. (1982). Organizational Linkages: ThePsychology of Commitment, Absenteesm, and Turnover. San Diego CA:Academic Press.
O’Reilly, C. A. & Chatman, J. (1986). Organizational Commitment andPsychological Attachment: The Effect of Affective Commitment,Continuous Commitment, And Normative Commitment On Pro-SocialBehavior. Journal of Applied Psychology, 71, 492-499.
99
An Assessment of Organizational Commitment

100
Troika Directions of HRD: A CorporateCase Study of Emirates Airline
Nadir Kolachi*Skyline University, University City of Sharjah, UAE
This paper aims to explain corporate tactics in collaborative ways with specialreference to the parameters developed as troika directions for multinationalcorporations. It focuses on human resource development’s (HRD) role in achievingthese troika directions and explores the parameters adopted by the EmiratesAirline. Upcoming consulting businesses that contribute to information overloadhave proven to be earning agents rather than real corporate solution providers.This study examines the case of Emirates Airline as a guideline for othermanagers, and reports the HRD functions and directions in the context of theorganized parameters mentioned in the troika directions that could helporganizations set their directions in an appropriate manner. It suggests acorporate case study as the best method to address this topic. The role of HRD willalways be important in managing MNCs. Managers can utilize troika directionsto eliminate the cost of unnecessary training and avoid wasting employees’ time.The findings have practical implications for modern managers.
Keywords: Troika Directions, Strategic HRD, Modern Companies, Emirates Airline.
IntroductionThis study employs multiple methods, namely, basic (innovative troika
direction model) and applied (application of troika direction). Such studies oftenemploy the case study method. This study aims to develop and evaluate troikadirections and apply them to Emirates Airline to guide professionals, students,and faculty. The troika model may be applied to any company to evaluate itsposition. Business changes have become difficult to predict but cordialcollaboration among organizational elements within the operations of businesshas controlled such difficulty. The proposed model of directions has proved thatcollaboration tactic is the solution for the problem of setting directions. As theworld is moving at a rapid pace, the HR has sensed and planned to tackle thispace through modern and socially enabled processes. Such initiatives have helpedorganizations build a realistic pool of cooperation in order to achieveorganizational goals. The study observed that most of the companies haveexperienced failure due to lack of effective leadership that did not motivate andunderstand the sensitivity of the employees. Some companies experienced
101
Journal of Business Strategies, Vol.8, No.1, 2014, pp 101-110
__________________________________________________________________________________*[email protected]

management that did not use innovative techniques to utilize the resources of thecompany. Others experienced poor commitment levels in the company whereeverything was left in the lurch, leading to these companies becoming iconicfailures in today’s competitive environment. This deadly sin was mostlycommitted by modern service companies that did not instill the importance ofcommitment in the minds of its people and everything went in vain. Thedirections in this model form the basis of the new processes proposed in thisstudy that are highly recommended for adoption by the modern companies.Successful companies can ascribe their success to adherence and achievement oftheir mission and vision statements. The tactic is very sensitive and can be abusedif not watched properly. Non-compliance with the company plan cansurreptitiously damage everything within no time. This tactic of adherence is theefficiency of any successful organization. Some of today’s giants like Google,BP, IBM, and Emirates Airline are the best examples of such adherence.
The word “troika” literally means “a set of three,” and it can be used to referto different things such as a triumvirate of judges/political leaders or three horsesharnessed side-by-side. This paper uses “troika” to refer to the combination ofthree important HRD factors—leadership, management, and commitment. Thispaper proposes the troika direction model. The word troika has been used toeasily identify and remember the strategic directions mentioned in the model.The study of a successful organization is based on the important parameters offoundation, compliance with standards, and corporate family. In order to maintainall these, one must be a visionary with a high exposure to organizationalactivities. Leaders always set foundations that are easy to follow and act upon. Agood strategy is required to make everyone comply with company standards andachieve in limited time. This is achieved through building a cordial atmosphere.Some good bosses were successful in building such a culture of corporate family,as one can witness in Google and Microsoft. Foundation phase identifies theleadership vision. A serious and strong foundation can transfer the vision andcharacter of the leader to all the employees. Leadership vision is the primerequisite to instill ownership among employees. A visionary may bring characterthat will enhance the emotional stability of employees in the organization.Leadership troika is the basic requirement for any successful company. Thefoundation is based on the leader’s perception, and this perception can transformits employees. If this is done smoothly and smartly, the rest of the steps willfollow automatically in the process. Leadership troika is the hub of success forany organization. Top leadership is always clear on its mission; they are alsorequired to tactically transfer the same to other divisional heads within the
102
Kolachi, N.
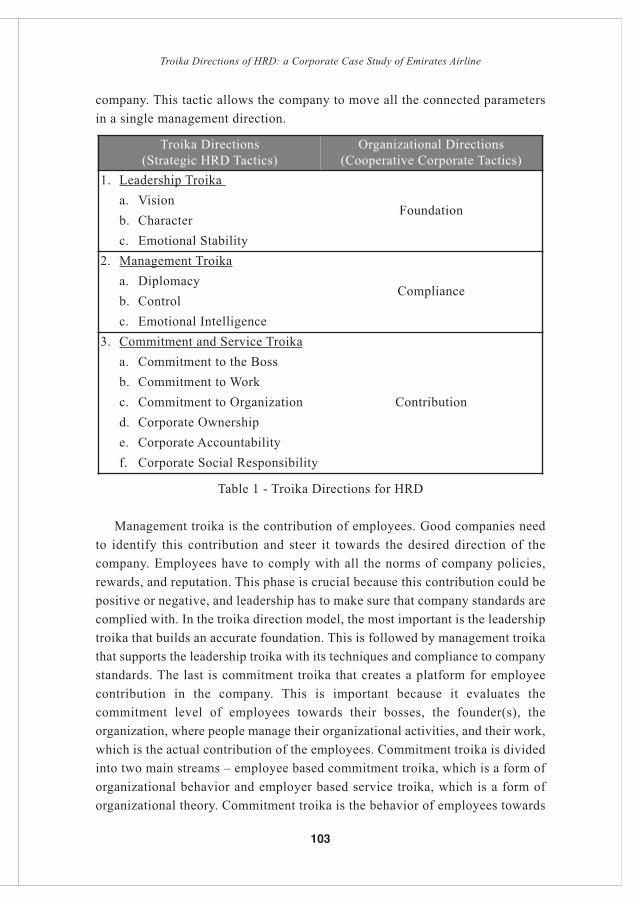
company. This tactic allows the company to move all the connected parametersin a single management direction.
Table 1 - Troika Directions for HRD
Management troika is the contribution of employees. Good companies needto identify this contribution and steer it towards the desired direction of thecompany. Employees have to comply with all the norms of company policies,rewards, and reputation. This phase is crucial because this contribution could bepositive or negative, and leadership has to make sure that company standards arecomplied with. In the troika direction model, the most important is the leadershiptroika that builds an accurate foundation. This is followed by management troikathat supports the leadership troika with its techniques and compliance to companystandards. The last is commitment troika that creates a platform for employeecontribution in the company. This is important because it evaluates thecommitment level of employees towards their bosses, the founder(s), theorganization, where people manage their organizational activities, and their work,which is the actual contribution of the employees. Commitment troika is dividedinto two main streams – employee based commitment troika, which is a form oforganizational behavior and employer based service troika, which is a form oforganizational theory. Commitment troika is the behavior of employees towards
Troika Directions(Strategic HRD Tactics)
Organizational Directions(Cooperative Corporate Tactics)
1. Leadership Troika
Foundationa. Visionb. Characterc. Emotional Stability
2. Management Troika
Compliancea. Diplomacyb. Controlc. Emotional Intelligence
3. Commitment and Service Troika
Contribution
a. Commitment to the Bossb. Commitment to Workc. Commitment to Organizationd. Corporate Ownershipe. Corporate Accountabilityf. Corporate Social Responsibility
103
Troika Directions of HRD: a Corporate Case Study of Emirates Airline
an organization while service troika is the behavior of the organization towardsits employees. It is very important to handle this in an organization as it coversmost of the motivational and service theories of both the employers and theemployees. The relevant literature is replete with cases of leadership andmanagement in different directions, but mostly suggests that leadership should bevisionary, managerial, or committed. This study presents an organized methodof evaluating strategic HRD directions in the form of different troika to identifytheir compliance with the foundation, standards, and employees in particular.
Literature ReviewThe concepts of HRM (human resource management) always include
corporate strategies. The HR department takes more responsibility and initiativeto contribute in the strategic direction. Good companies always follow theconcepts of the HR functions mentioned by Pynes, who found that HRMfacilitates the effective utilization of employees in terms of knowledge andcharacteristics. According to Pynes, “HRM is the design of formal systems in anorganization to ensure the effective use of employees’ knowledge, skills, abilities,and other characteristics (KSAOCs) to accomplish organizational goals” (Pynes,2009, 3). This broad definition is supplemented with some specific HRMfunctions such as “recruitment, selection, training and development,compensation and benefits, retention, evaluation and promotion of employees,and labor-management relations within an organization” (Pynes, 2009, 3). Troikadirections are truly in line with these concepts mentioned by Pynes, in terms ofeffective utilization of workforce and HRM functions to direct companiestowards success. HRD troika is the most disciplined method to carry out variousfunctions in the company. An organization is successful mostly due to thisdiscipline. As suggested by Klinger, the functions typically carried out by humanresources departments are “planning, acquisition, development, and discipline”(Klingner, 2009, 3).
This is the best approach to mold everything in a disciplined manner to achieveHRD troika. Organizations are required to adopt accurate policy processes. Thesepolicies are based on the HRD troika parameters and must be carried out in a verysystematic manner. It is important to maintain consistency in informationidentification, as indicated by Peggy & Woolridge. Peggy Jackson (2007) and BlueWoolridge (2004) indicate that strategic plans should include an organizationalprofile to present relevant information about operations, history, success enjoyed,challenges faced, and applicable statistical data; environmental scan and analysisto identify external factors that must be considered to project what the future holdsfor these peripheral elements. Such elements need to be utilized for HRD troika.
104
Kolachi, N.
Organizations are always looking to design good HRD directions to developintellectual capital and to make the workforce more mature to enhanceperformance. This can be achieved through proper training. Tan & Kiker haveindicated the importance of knowledge workers and quality training. However,since knowledge and skills are becoming scarce, the challenge will mainly be onknowledge workers (Tan, 2008) and intellectual capital, the key to a company’ssuccess. Mature knowledge workers are valuable sources of experience andknowledge, so human resource managers need to strive to prolong their tenure(Callahan, Kiker & Cross, 2003). In rapidly changing knowledge environment,there is an absolute need to offer good quality training programs to maintainemployees’ employability. Further, Mitchell advocates that workers with greaterintellectual capacity can help the organization as they help solving problems andbuild intellectual capital. Knowledge workers are defined as workers who possessgreat capacity in problem solving as well as production of knowledge, whichrequires a high level of intellectual capital in the form of specialized tacitknowledge (Mitchell & Meacheam, 2011). Above is the traditional technique thatis instilled in troika model to help organizations. The commitment and servicetroika is possible only through well-organized training and development.Employees need to be trained well to respond to the needs of the organization.Training and learning always help intellectual development. Learning increaseshuman capital (Lazear, 1998), and organizations have to engage their workers intraining and development because of a rapidly changing work environment (Wild,Griggs & Downing, 2002; Beaver & Hutchings, 2005)
Troika directions are proposed as one of the important quality managementsystems for an organization to excel in today’s changing environment. Though,this is mostly based on the qualification approach side but designed as qualitymanagement approach in the organization. Many companies have designed andadopted different “quality management systems.” According to Turkel & Kline,a quality management system ensures that employees behave with a sense ofresponsibility and perform their actions by themselves without being told aboutthe necessary work to be done (Türkel, 1998:41). A quality management systemseems to play a key role in human resource management (Kline, 2002:73). HRDtroika is also one of the approaches of a quality management system in modernorganizations. HRM’s behavior creates a culture in the organization. If thebehavior is positive, it spreads positivity and if it is negative, it becomes aparasite and spoils the organizational culture. HRM has always been an activeand important role in the organization. It helps through modern changes andcollaboration among employees, employers and customers. Further Hansen
105
Troika Directions of HRD: a Corporate Case Study of Emirates Airline
believes that HRM is the key to handling a competitive atmosphere. HRM shouldbe able to overcome problems posed by the expansion of the field related tohuman, work in new competitive atmosphere (Hansen, 2002: 516).
Application of Troika Direction on Emirates AirlineEmirates flew its first route in 1985. It flew with just two aircrafts (a Boeing
737 and an Airbus 300 B4). The management and leadership of Emirates airlinemade it reach the pinnacle of success. In 2001, Emirates announced the largestpurchase order in aviation history, valued at USD 15 billion. In 2005, itannounced the largest-ever Boeing order worth Dirham 35.7 billion, and in 2006,a Boeing deal worth USD 3.3 billion was signed. In 2007, Emirates announced ahistoric Airbus order worth USD 34.9 billion. Further, in 2011, Emirates ordered70 Boeing aircrafts worth USD 26 billion. Today, Emirates fly to more than 130destinations in more than 70 countries, and more destinations are constantlyadded. Under the patronage and His Highness Sheikh Ahmed Bin Saeed AlMaktoum, Chairman and CEO of Emirates Airline and Group, Emirates airlinehas achieved many milestones very swiftly and effectively. His Highness hasshown remarkable leadership in making it the most successful company in theworld. Emirates Airline has proved that customer focus is the easiest way toachieve success, as it caters to the needs of all types of customers residing in anypart of the continent. Its service, leadership, management, and commitment areknown to all regular travelers. This airline is now targeting almost all theimportant destinations in different continents.
DiscussionThe troika model is the best fit for Emirates Airline as discussed below.
1. Leadership Troikaa. Visionb. Characterc. Emotional Stability
The top cooperative corporate tactic that has been used at Emirates is the focuson the foundation. Initially, the founding members invested in the character of itsleaders and created a very cordial atmosphere, while showing utmost emotionalstability to solve organizational issues, if any. They planned and created anenormous policy document that is known as the vision document. They investedheavily over the years in pitching the best ideas to build the foundation. Initially,the important things that the founding members did, was to identity high profileintellectual capital and plan the long-term strategies. This helped them build areal foundation for vision, character, and emotional stability parameters. The
106
Kolachi, N.
foundation of leadership troika was based on the character and interest ofvisionary leaders. Emirates hired a talented workforce in various units, andtrained them for ownership and emotional stability.
2. Management Troikaa. Diplomacyb. Managing Controlc. Emotional Intelligence
The divisional heads at Emirates started interacting with their employees andappreciated them for their ambassadorship. They were trained to be positive,diplomatic, and good listeners and to offer best solutions even to minor problems.Later, this became the norm for dealing with every issue. The managementhierarchy of Emirates had clarified that all issues, big or small, will be addressedwith equal importance. This style of working connected all the units andstreamlined all the activities within the organization. After managing control, themanagement group trained employees on emotional intelligence in order to havefull understanding of their role for coordination within the organization. The basisof management troika was to be positive and diplomatic in addressing every issuewithin the organization. Employees were highly trained and in-turn hired atrained workforce that was emotionally intelligent and psychologically stable andhad a sense of ownership towards the company. This process made theorganization easy to control and opened many avenues of progress. Based onsuch initiatives, the organization was busy only with innovation as there werenot many problems to be dealt with. This troika made all employees complieswith the standards of the company.
3. Commitment and Service Troikaa. Commitment to the Bossb. Commitment to Workc. Commitment to Organizationd. Corporate ownershipe. Corporate Accountabilityf. Corporate Social Responsibility
The commitment and service troika consist of factors that have proved to besources of success or failure of any company. Good companies, which wereaccurate with the above commitment, had lesser troubles in climbing successladders while bad companies became only worse, as they could not understand theimportance of instilling such commitment. The commitment troika consists ofthe policies and vision of the company that are transferred to the employees while
107
Troika Directions of HRD: a Corporate Case Study of Emirates Airline
the service troika is the combined effort of employer and employees to maintainthe customers properly. Emirates Airline had initiated such unique processes tobe among the top airline companies. This built a work driven environment. Theydemanded that employees must be committed to their work that will ultimatelyshow their commitment to their bosses and the organization. Regarding workcommitment, companies train employees about corporate ownership where theycould consider Emirates Airline as their second home. Such ownership opened thedoors of accountability and social responsibility from the organizational platform.Therefore, the foundation of such a service was formed through the great cultureof corporate family that made the company’s employees committed to their workand ownership. As a part of Emirates Airline and group, the Emirates AirlineFoundation (EAF) provides humanitarian, philanthropic aid and servicesworldwide. It helps underprivileged children with their basic needs of food,education, medicine, and housing.
Recommendations for Emirates and Other CompaniesEmirates Airline needs to maintain the focus towards troika directions.
Emirates needs to invest more in managing control as customer preferences maychange in times to come. Emirates Airline has already touched many destinationsbut need to facilitate more as the workforce movement has increased over theyears. Emirates have the best in-house culture that it must cash in on for moreinnovations to provide more advanced facilities.
Some recommendations for other companies would be as follows:
Other Companies should adopt troika directions mentioned in the research.1. ther Companies should explore the methods Emirates has adopted.2. Other Companies may add some more points to troika directions that are
applicable to them and are compatible with the rest of the parameters. Troikamodel may be considered as a policy document and added in the handbookof the company as employees may learn the directions of the company.
3. Other Airlines/Companies should refer to the paper and present it to the boardand the employees to move towards success. Emirates should be set as thebenchmark for the company to be in good position in today’s competition.
Conclusion and Case FindingsThe analysis of the troika model shows that these factors were completely
followed by the Emirates Airline. The research shows that troika factors formedthe leadership style at the company. The research found that troika factors couldguide many modern companies towards success. The research found that thetroika directions are the main strategic directions for Emirates, especially the
108
Kolachi, N.

leadership troika that connects the foundation to compliance and builds a cordialatmosphere like a corporate family. The success of Emirates Airline is an examplefor many companies. All other airline companies that are stuck in losses can takea cue from Emirates for its successful adoption of troika directions. The modelshows that Emirates penetrated into its stiff competition and proved to be themost successful company. The case study revealed that Emirates Airline needs toreevaluate the existing model and try to beat the competition. The author believesthat Emirates will give tough competition to many companies. The researchconcludes that troika directions are the easiest ways to make companies move ina systematic direction towards success. The troika directions explain theimportant parameters required for the success of companies. This study hasapplied troika directions with special reference to the foundation, compliance,and corporate culture at Emirates Airline.
Teaching Guidelines for discussion in Management & HRD classesSome Discussion Questions for future use.
Case Discussion Questions1. What is the uniqueness of the company as compared to others?
2. What is the effectiveness of Troika model on the company?
3. What emirates should do to be number 1 or among top five airlines of the world?
4. How employees can stay in the company for longer time, why they stay forlonger time?
Case Discussion GuidelinesStudents must share and collect information who have experienced the
facilities of Emirates airline.
Case Discussion rulesAll students maintain strict discipline and cooperate with the moderator, Case
must be distributed early and students should prepare some notes in advance.Students can not refer to notes during discussion as they must be extempore duringdiscussion. All students must be very attentive to every individual during discussion.Everyone must have some important points whenever they get the turn to discuss.
ReferencesBeaver, G. & Hutchings, K. (2005). Training and developing an age diverse
workforce in SMEs. The need for a strategic approach. Education +Training, 47(8/9), 592-604
109
Troika Directions of HRD: a Corporate Case Study of Emirates Airline
Callahan, J.S., Kiker, D.S. & Cross, T. (2003). Does Method Matter? A Meta-Analysis of the Effects of Training Method on Older Learner TrainingPerformance. Journal of Management, 29 (5), 663-680.
Hansen, W. L. (2002), Developing New Proficiencies For Human Resource AndIndustrial Relations, Human Resource Management Review 12, 2002
Kline, J. J. (2002). The Development of Human Resources Management inQuality Award Winning Governments. Journal of OrganizationalExcellence, 21(4), 71-80.
Klingner, D. E. (2009). Competing perspectives on public personnel administration:Civil service, patronage, and privatization. In Public human resourcesmanagement: Problems and prospects, eds. Steven W. Hays
Kuru, F. K. (2009), Küresel Mali Kriz Kapsamında İnsan Kaynakları YönetimiUygulamaları ve Örgütsel Yabancılaşma Arasındaki İlişkininİncelenmesine Yönelik Bir Araştırma, Yıldız Teknik Üniversitesi SosyalBilimler Enstitüsü Yayımlanmamış Yüksek Lisans Tezi, İstanbul.
Lazear, E. P. (1998). Personnel Economics for Managers. New York: John Wiley& Sons
Mitchell, R. & Meacheam, D. (2011). Knowledge worker control: understanding viaprincipal and agency theory. The Learning organization, 18(2), 149-160.
Peggy Jackson, M. (2007). Nonprofit strategic planning. New Jersey: John Wiley& Sons.
Pynes, J. E. (2009). Human resources management for public and nonprofitorganizations: A strategic approach. 3d ed. San Francisco: Jossey-Bass.
Tan, F.M. (2008). Organizational support as the mediator of career-related HRMpractices and affective commitment: Evidence from knowledge workers.Research and Practice in Human Resource Management,
Türkel, A. (1998), İşletme Yöneticileri İçin Toplam Kalite Yönetimi ve İnsanKaynakları, İstanbul: Türkmen Kitabevi.
Woolridge, B. (2004). Preparing public administrators for an era of globalizationand decentralization: A strategic contingency approach. InternationalReview of Administrative Sciences 70 385-403.
110
Kolachi, N.

111

112

113