Food Promotion Strategies: Drivers of Global Business Expansion
29
-
Upload
iimlmarconference -
Category
Documents
-
view
1 -
download
0
Transcript of Food Promotion Strategies: Drivers of Global Business Expansion

© BRIDGE TO INDIA, 2013 1
© BRIDGE TO INDIA, 2013
DISCLAIMER© 2013 BRIDGE TO INDIA Energy Pvt. Ltd.All rights reserved October 2013, New Delhi
This report is owned by BRIDGE TO INDIA and is protected by Indian copyright and international copyright/intellectual property laws under applicable treaties and/or conventions. The user agrees not to export any report into a country that does not have copyright/intellectual property laws that will protect BRIDGE TO INDIA’s rights therein.
BRIDGE TO INDIA hereby grants the user a personal, non-exclusive, non-refundable, non-transferable license to use the report for research purposes only pursuant to the terms and conditions of this agreement. BRIDGE TO INDIA retains exclusive and sole ownership of each report disseminated under this agreement. The user cannot engage in any unauthorized use, reproduction, distribution, publication or electronic transmission of this report or the information/forecasts therein without the express written permission of BRIDGE TO INDIA.
No part of this report may be used or reproduced in any manner or in any form or by any means without mentioning its original source.
BRIDGE TO INDIA is not herein engaged in rendering professional advice and services to you. BRIDGE TO INDIA makes no warranties, expressed or implied, as to the ownership, accuracy, or adequacy of the content of this product. BRIDGE TO INDIA shall not be liable for any indirect, incidental, consequential, or punitive damages or for lost revenues or profits, whether or not advised of the possibility of such damages or losses and regardless of the theory of liability.
For further enquiries or to advertise in future publications, please contact:Mr. Jasmeet Khurana jasmeet. [email protected]
Contact
BRIDGE TO INDIA Pvt. Ltd.
N-117, Panchsheel Park
New Delhi 110017
India
www.bridgetoindia.com
www.bridgetoindia.com/blog
www.IndiaSolarMarket.com
www.IndiaSolarHomes.com
Follow us on

© BRIDGE TO INDIA, 2013
CONTENTS1. Overview 01
2. Market Dashboard 02 2.1 Market Compass 02 2.2 India Solar Market Prices 02 2.3 Installed Capacity in India 03
3. Policy and Projects Outlook 04 3.1 National Solar Mission 04 3.2 State policies 05 Tamil Nadu 06 Andhra Pradesh 06 Karnataka 07 Madhya Pradesh 07 Rajasthan 07 Uttar Pradesh 07 Punjab 08 3.3 Renewable Purchase Obligation 08 3.4 REC projects 08
4. Industry 4.1 Interview: Mr. HR Gupta, Managing Director, Indo Solar 10
5. Key question: How does the group captive model sale of solar power work in India? 12
5.1 Background 12 5.2 Definition 12 5.3 Regulations: The“open access” mechanism 12 5.4 Benefits ofthe “group captive” model 15 5.5 Group captive power plants under an OPEX model 16 5.6 The business case for “group captive” power projects 17 5.7 Risks 21 5.8 Conclusion 22
6. Annexure 23 6.1 Glossary of terms 23

© BRIDGE TO INDIA, 2013
© BRIDGE TO INDIA, 2013 01
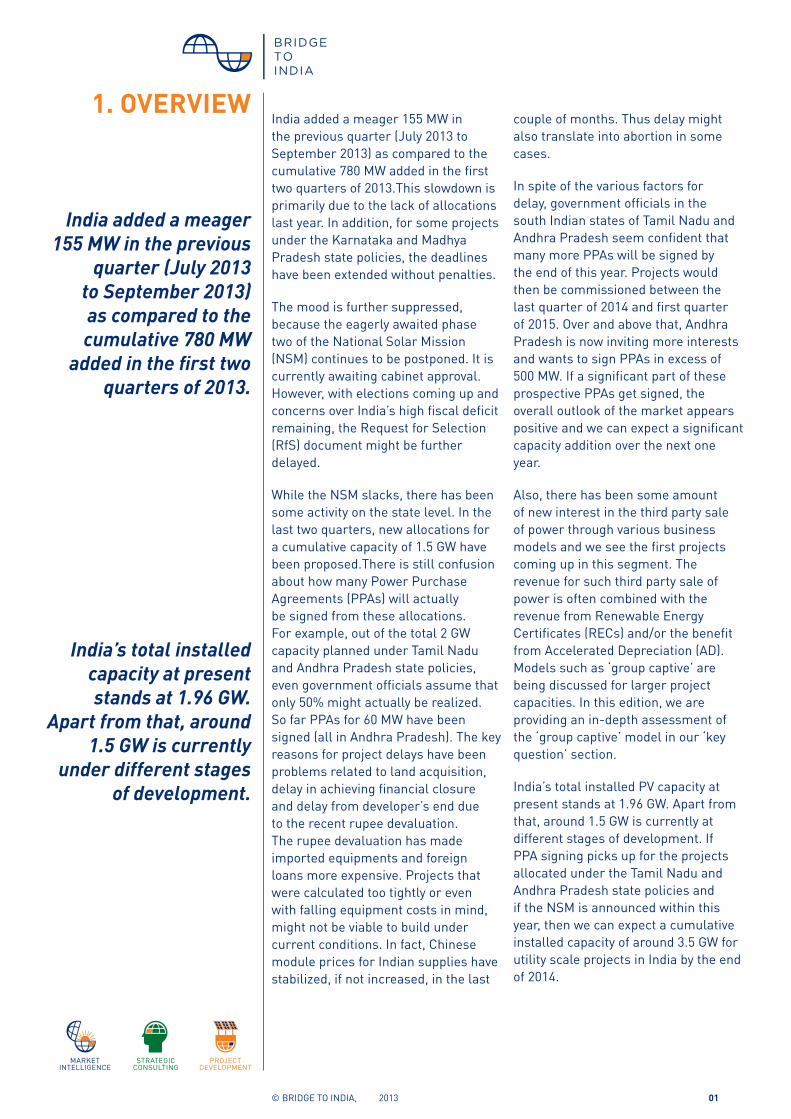
India added a meager 155 MW in the previous quarter (July 2013 to September 2013) as compared to the cumulative 780 MW added in the first two quarters of 2013.This slowdown is primarily due to the lack of allocations last year. In addition, for some projects under the Karnataka and Madhya Pradesh state policies, the deadlines have been extended without penalties.
The mood is further suppressed, because the eagerly awaited phase two of the National Solar Mission (NSM) continues to be postponed. It is currently awaiting cabinet approval. However, with elections coming up and concerns over India’s high fiscal deficit remaining, the Request for Selection (RfS) document might be further delayed.
While the NSM slacks, there has been some activity on the state level. In the last two quarters, new allocations for a cumulative capacity of 1.5 GW have been proposed.There is still confusion about how many Power Purchase Agreements (PPAs) will actually be signed from these allocations. For example, out of the total 2 GW capacity planned under Tamil Nadu and Andhra Pradesh state policies, even government officials assume that only 50% might actually be realized. So far PPAs for 60 MW have been signed (all in Andhra Pradesh). The key reasons for project delays have been problems related to land acquisition, delay in achieving financial closure and delay from developer’s end due to the recent rupee devaluation. The rupee devaluation has made imported equipments and foreign loans more expensive. Projects that were calculated too tightly or even with falling equipment costs in mind, might not be viable to build under current conditions. In fact, Chinese module prices for Indian supplies have stabilized, if not increased, in the last
couple of months. Thus delay might also translate into abortion in some cases.
In spite of the various factors for delay, government officials in the south Indian states of Tamil Nadu and Andhra Pradesh seem confident that many more PPAs will be signed by the end of this year. Projects would then be commissioned between the last quarter of 2014 and first quarter of 2015. Over and above that, Andhra Pradesh is now inviting more interests and wants to sign PPAs in excess of 500 MW. If a significant part of these prospective PPAs get signed, the overall outlook of the market appears positive and we can expect a significant capacity addition over the next one year.
Also, there has been some amount of new interest in the third party sale of power through various business models and we see the first projects coming up in this segment. The revenue for such third party sale of power is often combined with the revenue from Renewable Energy Certificates (RECs) and/or the benefit from Accelerated Depreciation (AD). Models such as ‘group captive’ are being discussed for larger project capacities. In this edition, we are providing an in-depth assessment of the ‘group captive’ model in our ‘key question’ section.
India’s total installed PV capacity at present stands at 1.96 GW. Apart from that, around 1.5 GW is currently at different stages of development. If PPA signing picks up for the projects allocated under the Tamil Nadu and Andhra Pradesh state policies and if the NSM is announced within this year, then we can expect a cumulative installed capacity of around 3.5 GW for utility scale projects in India by the end of 2014.
1. OVERVIEW
India added a meager 155 MW in the previous
quarter (July 2013 to September 2013) as compared to the cumulative 780 MW
added in the first two quarters of 2013.
India’s total installed capacity at present stands at 1.96 GW.
Apart from that, around 1.5 GW is currently
under different stages of development.
© BRIDGE TO INDIA, 2013 02
Source: BRIDGE TO INDIA
2. MARKET DASHBOARD
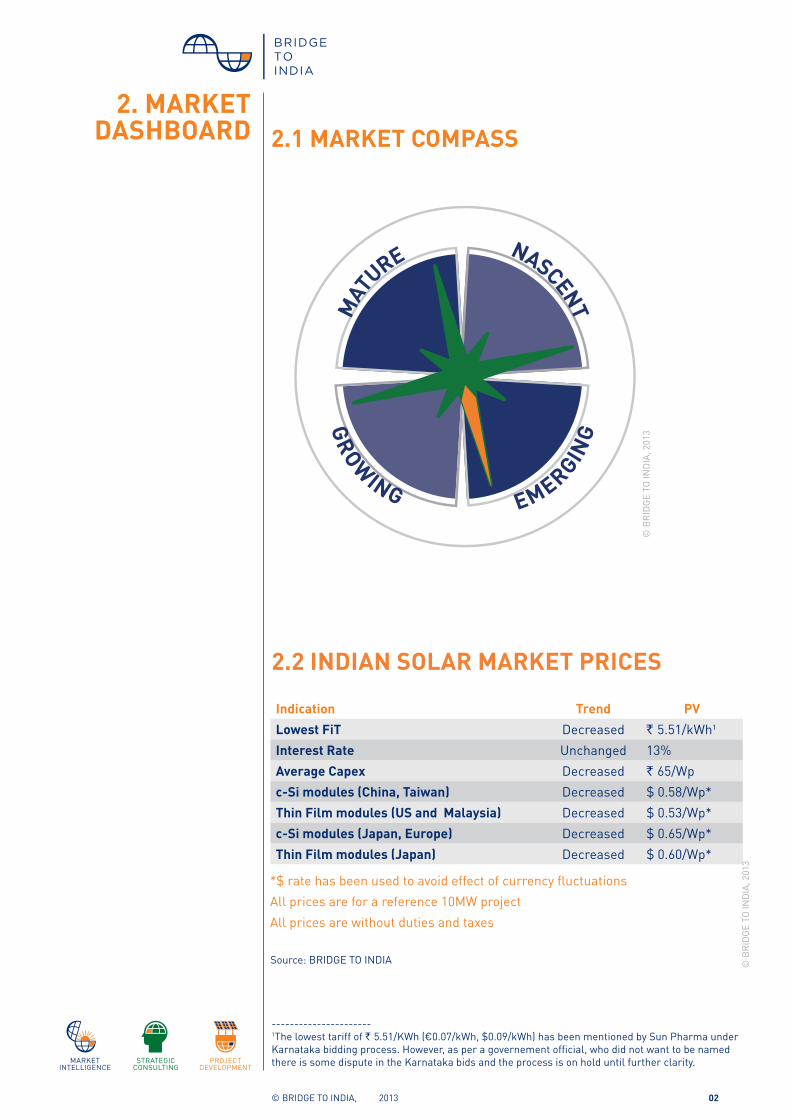
Indication Trend PVLowest FiT Decreased ` 5.51/kWh1
Interest Rate Unchanged 13%Average Capex Decreased ` 65/Wpc-Si modules (China, Taiwan) Decreased $ 0.58/Wp*Thin Film modules (US and Malaysia) Decreased $ 0.53/Wp*c-Si modules (Japan, Europe) Decreased $ 0.65/Wp*Thin Film modules (Japan) Decreased $ 0.60/Wp*
© B
RID
GE
TO IN
DIA
, 201
3
----------------------1The lowest tariff of ` 5.51/KWh (€0.07/kWh, $0.09/kWh) has been mentioned by Sun Pharma under Karnataka bidding process. However, as per a governement official, who did not want to be named there is some dispute in the Karnataka bids and the process is on hold until further clarity.
© B
RID
GE
TO IN
DIA
, 201
3
GROW
ING EMERGING
MAT
URE NASCENT
2.1 MARKET COMPASS
*$ rate has been used to avoid effect of currency fluctuationsAll prices are for a reference 10MW projectAll prices are without duties and taxes
2.2 INDIAN SOLAR MARKET PRICES

© BRIDGE TO INDIA, 2013 03
2.3 INSTALLED CAPACITY IN INDIA
© BRIDGE TO INDIA, 2013Source: BRIDGE TO INDIA

© BRIDGE TO INDIA, 2013 04
3. POLICY AND PROJECTS OUTLOOK
We would describe the last quarter as being dominated by policy instability: We have seen confusion in Tamil Nadu over the tariff proposed by its regulatory commission; the announcement of the creation of the new state of Telangana from Andhra Pradesh, which put the allocations and future bankability of projects under question; Gujarat briefly contemplated a retrospective tariff revision; and new allocations in Karnataka seem to have been put on hold due to a dispute (refer below). Moreover, there has been no penalty levied for delayed projects under the Madhya Pradesh and Karnataka policies, which is setting a bad precedent for the upcoming projects in those states. On the bright side, in the last quarter (July 2013 to September 2013), the states of Punjab, Uttar Pradesh and Karnataka allocated new projects.
A capacity of close to 1.5 GW is currently under different stages of development across India. With this proposed capacity addition we can expect India’s cumulative PV capacity for utility scale projects to reach at least 2.5 GW by mid of 2014 and close to 3.5 GW by the end of 2014. Earlier, BRIDGE TO INDIA had predicted an installed capacity of 4 GW by the end of 2014. However, due to delays in the signing of PPAs in Andhra Pradesh and Tamil Nadu and due to a no-show of phase two of the NSM until now, we have revised our projections downward.
In the upcoming quarter (October 2013 to December 2013), the bulk of newly commissioned projects will come not from policies, but from the private sale of solar power under the REC mechanism.
3.1 NATIONAL SOLAR MISSIONProject developers have been looking forward to the new allocations under batch one of phase two of the National Solar Mission (NSM) for some time now. The draft RfS document was released in April 2013 and the bidding process was originally expected for May of this year. However, there has been no official news since. As per recent statements by ministry officials, the finalized policy and related documents have now been submitted to the Union Cabinet for approval. However, with concerns about India’s high fiscal deficit and with the model code of conduct for the upcoming elections, it is unlikely that the policy will be approved soon. If the allocations under the NSM are not annonced within a month, there is a high probability that it might be postponed until after the general elections in May 2014. BRIDGE TO INDIA, however, is optimistic that the bidding process for the NSM will begin this year itself.
In the last quarter, the states of Punjab, Uttar
Pradesh and Karnataka allocated new projects.
The finalized policy and related documents
for phase two of the NSM have now been
submitted to the Union Cabinet for
approval.

© BRIDGE TO INDIA, 2013
Table 3-1: Overview of the state policies in India
Tamil Nadu
Andhra Pradesh
Karna-taka
Punjab Madhya Pradesh
Uttar Pradesh
Rajasthan Total/aver-age
Allocation date
Jun-13 Jun-13 Apr-12 Jul-13 May-12 Jul-13 Mar-13 Most of the allocations happened in the first half of 2013
PPAs signed as on September 2013 (MW)
0 60 60 0 225 0 75 420
Tariff (INR/kWh)
6.48 (with an escalation of 5% p.a. for the first 10 years)
6.49 7.94 – 8.5 (60 MW)5.51 – 8.05 (130 MW)
7.2 – 8.63 7.9-8.05 8.01 – 9.27 6.45 7.59
New PPAs expected to be signed by the year end (MW)
500 80 100 230 0 120 0 1,330
Further allocations (MW)
None 500* None None None None RfS for 1 MW x 50 announced
550
Delayed projects (MW)
NA NA 50 NA 120 NA NA 170
Expected commi-ssioning date of projects under deployment
Dec-2014 Dec-2014
Mar-14 (50 MW)Dec-14 (110MW)
Dec -14 Mar-14 Dec-14 Mar-14 250 MW by March 2014;1,240 MW by Dec-14
Expected period of procurem-ent
Jan 14 –Mar 14
Jan 14 – Mar 14
Ongoing Jan 14 –Mar 14
Ongoing Jan 2014 – Mar 2014
Ongoing Most of the procure-ments will take place between January- March 2014
Key Projects Mohan Breweries (110 MW), United Telecom (100 MW), Welspun (60 MW)
Essel Mining (35 MW), Kranthi Edifice (30 MW ), Mahira Power (20 MW)
Essel Infra (10 MW), Helena Power (10 MW), SaiSudhir (10 MW)
Welspun (32 MW), Asopus (34 MW), Essel Infra-projects (30 MW)
Acme (25 MW), Moserbaer (25 MW), Welspun (25 MW)
Essel Infra (50 MW), Moserbaer (20 MW), Sri developed (20 MW)
Roha Dyechem (25 MW), Essel Mining (20 MW), Energo Engineering (10 MW)
* Based on an interview with the Andhra Pradesh state department officials, this will be based on direct allocation at the pre- determined tariff
© B
RID
GE
TO IN
DIA
, 201
3So
urce
: BR
IDG
E TO
IND
IA

© BRIDGE TO INDIA, 2013 06
----------------------21 EUR = INR 80 and 1 USD = INR 603http://bridgetoindia.com/blog/?p=1605
Tamil NaduTamil Nadu’s tender in December 2012 led to an issuance of Letter of Intents (LOIs) for 690 MW of projects. As per our discussion with the officials, no PPAs have been signed as of September 2013 but all PPAs are expected to be signed in the next couple of months. The state’s nodal agency, Tamil Nadu Energy Development Agency (TEDA), has offered a tariff of `6.48/kWh (€0.08/kWh, $0.10/kWh) with a 5% escalation for the first 10 years. The Tamil Nadu Electricity Regulatory Commission (TNERC), the regulatory agency that is required to sanction all tariffs, has proposed a separate tariff of `5.78/kWh(€0.07/kWh, $0.10/kWh)2 without escalation. The PPA with the developers is only bankable if TNERC approves the tariff being offered by TEDA. TEDA has tried to assure the project developers that the new proposed tariff will have no bearing on their projects and that TNERC will provide a sanction for the tariffs currently being offered.
In a situation where the tariffs being offered by TEDA are not approved by TNERC, we can expect a majority of the project developers to back out. On the other hand, if TNERC approves the older tariffs, the largest capacity addition in 2014 can be expected from Tamil Nadu. As there has been an initial delay due to the concerns over the tariff revision, we might not see 300 MW projects being commissioned by June 2014 as predicted by us in the July 2013 edition of the India Solar Compass. Instead, we expect a capacity of 200 MW to be commissioned by September 2014.
Andhra PradeshMost investors are currently skeptical about projects in Andhra Pradesh taking off anytime soon. One reason is that the initial retrospective change in tariff by the state3 has led to a
loss in confidence in the processes being followed. Out of the 1,700 MW of original applications submitted in 2013, applications for less than 150 MW is expected to finalize. Another reason for a poor response from investor and developers in the state is the expected split of Andhra Pradesh into two separate states (the new state is to be called Telangana. As per our discussions with the government officials, they do not foresee the proposed division of the state to have a considerable impact on the solar projects.However, some developers have their reservations. This is especially true for those who have projects in central Andhra Pradesh, where the distribution company might be bifurcated in the future.
Around 61 MW of PPAs have already been signed and as per the officials of New and Renewable Energy Development Corporation of Andhra Pradesh, another 80 MW of PPAs are expected soon. As there is an incentive for early commissioning in Andhra Pradesh, project developers who have a head start in terms of finalizing land procurement and partner selection for Engineering Procurement and Construction (EPC) before signing of the PPAs, will be able to benefit from that. We expect that at least a capacity of 60 MW will be commissioned ahead of schedule and within the third quarter of 2014.
Apart from this, Andhra Pradesh has provided an open offer for developers to take up projects at the existing tariffs. Four to five large projects (up to 100 MW) are expected to take up this offer.
TEDA has tried to assure the project
developers that the new proposed tariff
in Tamil Nadu will have no bearing on
their projects and that TNERC will provide a
sanction for the tariffs currently being offered.
Out of 1,700 MW of original applications
submitted in 2013, applications for less
than 150 MW are expected to finalize in
Andhra Pradesh.

© BRIDGE TO INDIA, 2013 07
Andhra Pradesh has also opened up a window for new interests for developers to set up solar projects at the same tariff that is being offered to the existing projects (`6.49/kWh (€0.08/kWh, $0.10/kWh). As per our conversations with the officials, they are expecting fresh applications of around 500 MW. However, given the low tariffs in the state, BRIDGE TO INDIA thinks that their estimates are too optimistic and we do not expect that the fresh additional capacity will exceed 200 MW.
KarnatakaA capacity of 60 MW had been allocated under the Karnataka state policy in April 2012. As per the PPA, these projects were to be commissioned by October 2013. However, due to delay in land acquisition and financial closure, only one project with a capacity of 10 MW by Jindal Aluminum has been commissioned on time. The official deadline has been extended until 2014 without fines for the delays. According to unconfirmed sources, the recent allocation process for a capacity of 130 MW has been put on hold as some companies have disputed the published tariffs, claiming some procedural mistake. These allocations are likely to remain on hold until there is more clarity. We think that commissioning of any part of the newly allocated capacity of 130 MW within the next year is unlikely. The left over capacity of 50 MW from the allocations in 2012 is expected to be commissioned by the end of the first quarter of 2014.
Madhya PradeshIn Madhya Pradesh, four projects of 25 MW each, one project of 20 MW and another of 105 MW were allocated in May 2012. The 25 and 20 MW projects were to be commissioned by June 2013 and the 105 MW project by December 2013. However, as of September 2013, only a 105 MW project by Welspun has been commissioned ahead of schedule. As so often, the delay is cited as being due to difficulties in achieving
financial closure coupled with delays in acquiring land for projects has led to substantial delay in the commissioning of the remaining projects. One project developer commented that the delay of their project has been due to the recent rupee devaluation.
The deadline for the remaining capacity of 120 MW has now been extended until March 2014 and none of the project developers is being penalized. Hence, we expect a capacity of 80 MW to be commissioned before the new deadline.
RajasthanA capacity of 75 MW that has been allocated in Rajasthan seems to be on track. As per officials in the department, all projects are expected to meet their deadline of March 2014. Also, they mentioned that most of the projects have either secured financial closure or are in the process of finalizing it. Given the experience under most solar policies and going by the previous experinece of the developers, we, however, expect that two to three projects with a capacity of around 25 MW will be commissioned by the March 2014 deadline and the remaining by around June 2014.
Uttar PradeshUttar Pradesh has finalized agreements with seven project developers for a cumulative capacity of 130 MW. The developers are: Jakson Power (10 MW), Moser Baer (20 MW), Sree Developers (20 MW), DK Infracon (10 MW), Refex Energy (10 MW), Azure power (10 MW) and Essel Infraprojects (50 MW). The PPAs in the state are expected to be signed before the end of the year. The government has further signed a memorandum of understanding with National Hydro Power Corporation (NHPC) for a proposed 100 MW solar project. It is not yet clear when this project is to be finalized. Most of the mentioned project developers will likely do their own EPC and might be able to complete their projects ahead
The recent allocation process in Karnataka,
for a capacity of 130 MW has been put on hold as some companies have
disputed the published tariffs.
Uttar Pradesh has finalized agreements
with seven project developers for a
cumulative capacity of 130 MW.

© BRIDGE TO INDIA, 2013 08
----------------------4EPC providers are setting up solar parks specifically for REC or captive projects. These parks provide land and grid-connectivity assistance to solar project developers.
2014. This is because the time spent in selecting an EPC partner will be saved and the allocation of internal resources will be more efficient. Also, as all the decisions regarding the technical design, selection of equipment and timelines will be taken by the project developer itself, it is expected that there will not be any procedural delays.
PunjabPunjab has finalized agreements with 26 project developers to develop a cumulative capacity of 250 MW. Some of the key projects in the state are: Asopus Infrastructure (34 MW), Welspun Solar (32 MW), Essel Infraprojects (30 MW), Moserbaer Clean Energy (30 MW), Azure Power (30 MW), Solairedirect (20 MW), Punj Lloyd (20 MW). The projects have been given six months for financial closure and 13 months for commissioning. The average tariff in Punjab is `8.28/kWh (€0.10/kWh, $0.14/kWh).This is higher than most other states, largely due to the high land costs and relatively low irradiation in the state. As the debt financing is usually done after the land has been bought, these projects will look more attractive to the lenders at the time of debt financing. Due to this reason, the debt financing for projects in Punjab is expected to be relatively easier. None of the PPAs have been signed until now and we expect them to be signed by the end of the year. As a result, it is unlikely that there will be any major capacity additions from Punjab in the first half of 2014. However, we might see an additional capacity of around 100 MW by September 2014.
3.3 RENEWABLE PURCHASE OBLIGATIONRecently, there has been more confidence in the market with regards
to the enforcement of Renewable Purchase Obligation (RPOs) in India. Delhi distribution companies (DISCOMs), for example, have already included the RPO compliance expenses in the tariff. The Madhya Pradesh Electricity Regulatory Commission has mandated the DISCOMs to comply with RPOs. Similarly, the obligated entities in Punjab have been mandated to comply with the RPOs of financial year 2011-12 and 2012-13. West Bengal is planning to comply with its solar RPO by the end of 2013. These developments are an indication that more states are getting serious about implementing RPOs. As more states begin to implement the RPO mechanism the demand for solar power will increase. This can provide an additional impetus to the solar market. For example, for the states that are not currently meeting their RPOs, National Thermal Power Corporation is setting up various power plants across the country for the DISCOMs in these states. Many of these projects are expected to be commissioned by March 2014. This includes the 50 MW project in Madhya Pradesh (EPC contracted to Tata Power Solar), 10 MW and 15 MW project in Uttar Pradesh (EPC contracted to BHEL) and 10 MW project in Orissa (EPC contracted to BHEL).
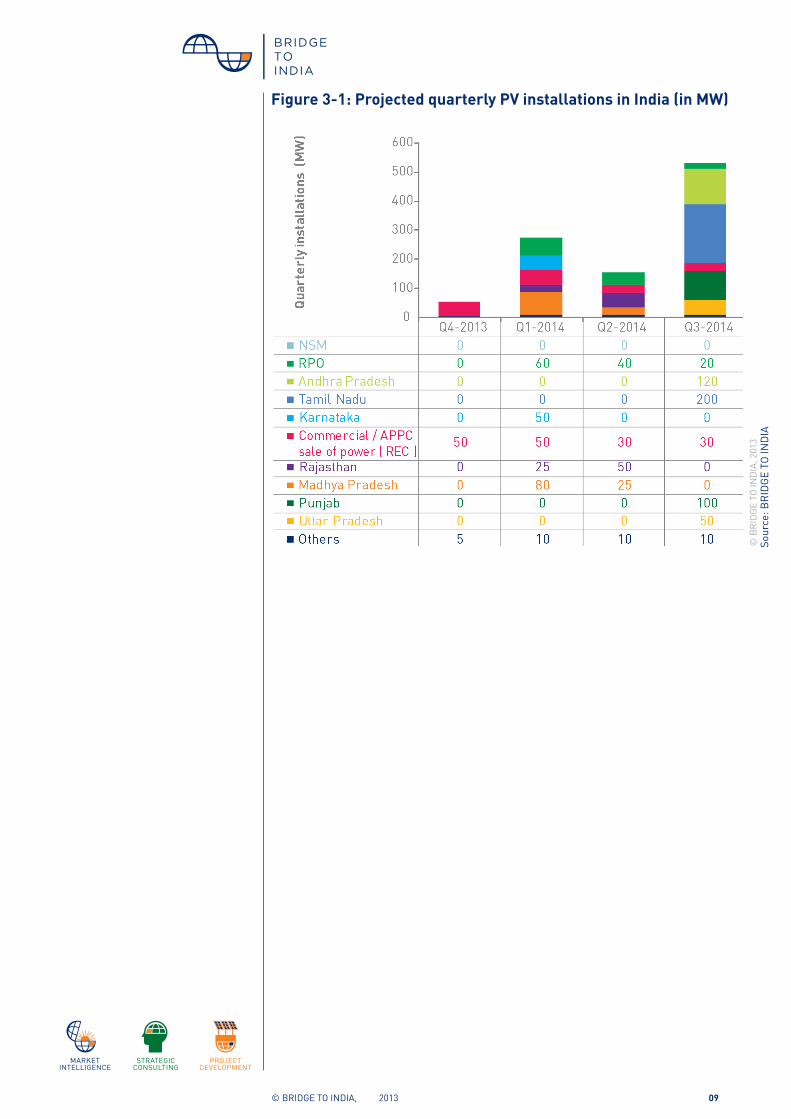
3.4 REC PROJECTSOut of a capacity of 155 MW that has been added in India in the previous quarter, around 40 MW is for the projects under the REC mechanism. With projects for third-party sale of power gaining popularity and several ‘solar parks’4 coming up primarily in the states of Madhya Pradesh and Rajasthan, in the next one year, we expect an additional capacity of 150 MW for projects that use a combination of revenue through RECs with industrial or commercial tariffs.
Punjab has finalized agreements with 26
project developers to develop a cumulative
capacity of 250 MW.
Out of a capacity of 155 MW that has been
added in India in the previous quarter,
around 40 MW is for the projects under the
REC mechanism.
© BRIDGE TO INDIA, 2013 09
Figure 3-1: Projected quarterly PV installations in India (in MW)
Sour
ce: B
RID
GE
TO IN
DIA
© B
RID
GE
TO IN
DIA
, 201
3

© BRIDGE TO INDIA, 2013 10
As of today, with some exceptions, most of the photovoltaic (PV) manufacturing capacity in India is either lying idle or operating at a very low capacity. Indian manufacturers have largely been unable to compete with international module suppliers on costs. To revive their fortunes, manufacturers are banking on the implementation of anti-dumping duties (ADD) and a domestic content requirement (DCR). DCR is only applicable for the NSM projects in India and it is expected that batch one of phase two of the NSM would have a capacity of around 200 MW earmarked for domestic modules. This is despite the fact that the US has challenged DCR in the World Trade Organization (WTO). However, this would be insufficient to support the 2 GW of manufacturing capacity in India. ADD on the other hand has the potential to change the supply dynamics in the Indian solar sector drastically. In the January 2013 edition of the India Solar Compass, BRIDGE TO INDIA had forecast that going by the procedure followed for ADD, an interim order could be announced as early as July 2013. Given that no interim order has been announced until date, it can be assumed that this investigation is taking longer than usual. This might be due to the fact that this is a high profile case with considerable international scrutiny and pressure. As per the normal procedure, the final outcome should have been expected 23rd November 2013 (one year from the date of initiation). However, given that the final outcome has to be preceded by an interim order, the investigations might well miss the deadline.
BRIDGE TO INDIA has maintained that imposition of ADD would be negative for the Indian solar sector as it will drive up costs and slow down adoption of the technology, which should be the primary goal. Nevertheless, this is a legal and not a political procedure
and if dumping has taken place, then ADD will most likely be imposed irrespective of the implications on the industry.
To present a contrarian view, we asked HR Gupta, Managing Director of Indo Solar, to share his views on the Indian solar manufacturing sector. Indo Solar is India’s largest cell manufacturer with a current manufacturing capacity of 160 MWp. The company has plans to increase the capacity to 360 MWp.
4.1 INTERVIEW: HR GUPTA, MANAGING DIRECTOR, INDO SOLAR1. What is the current state of the Indian solar manufacturing industry?
Cell manufacturing in India is practically idle. These facilities are either underutilized or completely shut. Module makers are mostly catering to the off-grid requirement and are now also receiving some enquires from Europe. However, sizeable orders and visibility is not there. Some module manufacturers are also developing their own projects and using their own modules for these projects to keep their plants operational.
2. What can be expected in terms of DCR and anti-dumping duties? By when can we expect some clarity on the subject?
My understanding on DCR is that the documents for phase two of the NSM are awaiting cabinet approval.
On ADD, we are now in the 20th month since we sought remedial action and 10th month since initiation. There is a high probability that the matter will be decided next month.
4. INDUSTRY
An anti-dumping duty has the potential to
change the supply dynamics in the Indian
solar sector drastically.
HR Gupta, Managing Director,
Indo Solar

© BRIDGE TO INDIA, 2013 11
3. If anti-dumping duties are enforced, the tariffs for solar power are expected to go up. Do you agree? Is it justified?
The cost of solar power on a dumping basis has already wiped out around US$ 80 Billion in market capital and the supply side of the solar value chain has been decimated globally.
If one allows only negative margins on the supply side, soon there will be no supply side at all. In order to maintain a stable production capacity and allow for R&D, prices should be commensurate to support the sustainability of the sector.
4. What would be your recipe to make the manufacturing of solar modules competitive in the long run?
If you closely analyze costs, as was done by NREL and MIT, in the US, you will see that operational manufacturing costs are similar globally. In India, we have high cost of debt and high power costs but these can easily be optimized when manufacturers are bankable, can borrow cheaper offshore and switch to grid power.
Manufacturing of solar cells and modules is already competitive and the bill of materials is anyway similar amongst all manufacturers.
In India, we have high cost of debt and high
power costs but these can easily be optimized
when manufacturers are bankable and
can borrow cheaper offshore and switch to
grid power.
Errata from the previous edition of the India Solar Compass (July 2013):
Correction is in the table on page 19. Satec Enviro supplied only the steel for the trackers. They did not install the tracking system as reported by us. Insolare has installed the trackers for their project.
© BRIDGE TO INDIA, 2013 12
5. KEY QUESTION: HOW
DOES THE GROUP
CAPTIVE MODEL WORK?
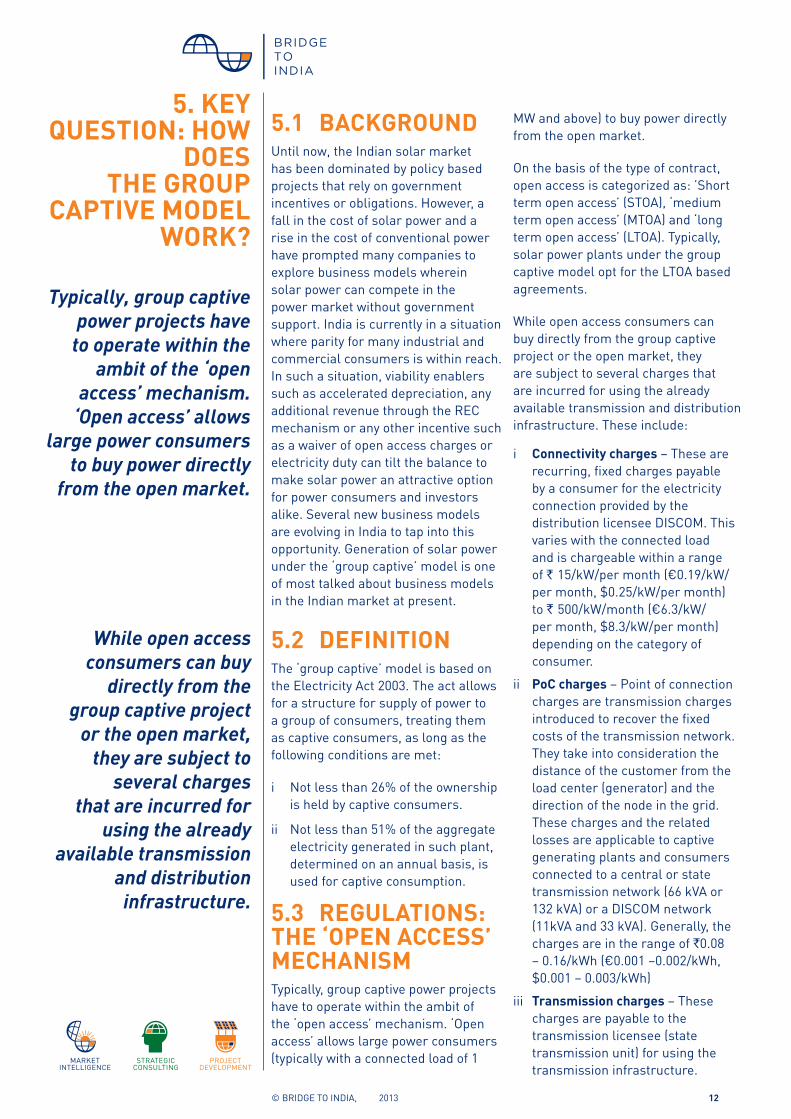
5.1 BACKGROUNDUntil now, the Indian solar market has been dominated by policy based projects that rely on government incentives or obligations. However, a fall in the cost of solar power and a rise in the cost of conventional power have prompted many companies to explore business models wherein solar power can compete in the power market without government support. India is currently in a situation where parity for many industrial and commercial consumers is within reach. In such a situation, viability enablers such as accelerated depreciation, any additional revenue through the REC mechanism or any other incentive such as a waiver of open access charges or electricity duty can tilt the balance to make solar power an attractive option for power consumers and investors alike. Several new business models are evolving in India to tap into this opportunity. Generation of solar power under the ‘group captive’ model is one of most talked about business models in the Indian market at present.
5.2 DEFINITIONThe ‘group captive’ model is based on the Electricity Act 2003. The act allows for a structure for supply of power to a group of consumers, treating them as captive consumers, as long as the following conditions are met:
i Not less than 26% of the ownership is held by captive consumers.
ii Not less than 51% of the aggregate electricity generated in such plant, determined on an annual basis, is used for captive consumption.
5.3 REGULATIONS: THE ‘OPEN ACCESS’ MECHANISMTypically, group captive power projects have to operate within the ambit of the ‘open access’ mechanism. ‘Open access’ allows large power consumers (typically with a connected load of 1
MW and above) to buy power directly from the open market.
On the basis of the type of contract, open access is categorized as: ’Short term open access’ (STOA), ‘medium term open access’ (MTOA) and ‘long term open access’ (LTOA). Typically, solar power plants under the group captive model opt for the LTOA based agreements.
While open access consumers can buy directly from the group captive project or the open market, they are subject to several charges that are incurred for using the already available transmission and distribution infrastructure. These include:
i Connectivity charges – These are recurring, fixed charges payable by a consumer for the electricity connection provided by the distribution licensee DISCOM. This varies with the connected load and is chargeable within a range of ` 15/kW/per month (€0.19/kW/per month, $0.25/kW/per month) to ` 500/kW/month (€6.3/kW/per month, $8.3/kW/per month) depending on the category of consumer.
ii PoC charges – Point of connection charges are transmission charges introduced to recover the fixed costs of the transmission network. They take into consideration the distance of the customer from the load center (generator) and the direction of the node in the grid. These charges and the related losses are applicable to captive generating plants and consumers connected to a central or state transmission network (66 kVA or 132 kVA) or a DISCOM network (11kVA and 33 kVA). Generally, the charges are in the range of `0.08 – 0.16/kWh (€0.001 –0.002/kWh, $0.001 – 0.003/kWh)
iii Transmission charges – These charges are payable to the transmission licensee (state transmission unit) for using the transmission infrastructure.
Typically, group captive power projects have
to operate within the ambit of the ‘open
access’ mechanism. ‘Open access’ allows
large power consumers to buy power directly
from the open market.
While open access consumers can buy
directly from the group captive project
or the open market, they are subject to
several charges that are incurred for
using the already available transmission
and distribution infrastructure.

© BRIDGE TO INDIA, 2013 13
Figure 5-1: Key charges and losses taken for an average case of group captive sale of power in India
These charges are in the range of `50,000 to 200,000/MW/month (€625 – 2,500/MW/month, $833- 3,333/MW/month for LTOA consumers and in range of `0.10 – 0.50/kWh (€0.001 – 0.006/kWh, $0.002 – 0.008/kWh) for STOA consumers.
iv Transmission losses – Losses are considered for the assumed electricity units lost in the transmission line between the generator and the consumer. Typically, these are in the range of 2 – 6 %.
v Wheeling charges – These charges are payable to the distribution licensee for using the distribution network. They are applicable to all power generating plants connected to the distribution grid at 33 kV or below and availing open access. They are typically in the range of `0.10 – 0.80/kWh (€0.001 – 0.01/kWh, $0.002 – 0.013/kWh).
vi Wheeling losses – These are the losses incurred while transporting electricity through the distribution network. They are determined by the State Electricity Regulatory Commissions (SERCs) for each consumer categories and typically range from 4 – 10 %.
vii Cross Subsidy Surcharge – These are charges payable by consumers who opt for supply through open access. In India, industrial and commercial clients cross subsidize electricity rates for agricultural and residential consumers. When a consumer opts for open access, the distribution licensee loses a high value consumer who would have subsidized low paying consumers. This surcharge is designed to make up for the lost cross subsidy.
viii SLDC/RLDC charge – These are charges payable by STOA consumers who avail services of the state/regional load dispatch center (SLDC/RLDC). Such services include scheduling, revisions in scheduling and energy accounting. They are typically in the range of `1,500 – 2,500 (€19 – 31, $25 – 42) per day or part of the day.
The largest impact is that of the Cross Subsidy Surcharge (CSS), wheeling charges and transmission charges. CSS, however, is waived off for group captive projects. Therefore, we are only concerned with the wheeling and transmission charges. These charges currently vary between zero and `2.12/kWh (€0.03/kWh, $0.04/kWh) depending on the state.
The largest impact, amongst all the open
access charges is that of the Cross
Subsidy Surcharge, wheeling charges and transmission charges.
Transmission and wheeling losses vary
significantly across states.
© BRIDGE TO INDIA, 2013Source: BRIDGE TO INDIA

© BRIDGE TO INDIA, 2013 14
As we can see in the Figure 5-2 the impact of open access charges and losses will be the lowest in Andhra Pradesh, Uttar Pradesh and Delhi and the highest in Maharashtra, Himachal
Pradesh and Odisha. The overall impact can vary between `0.63/kWh - 2.74/kWh (€0.008 – 0.03/kWh, $0.01- 0.5/kWh).
Figure 5-2: State-wise costs associated with the open access mechanism (without any concessional benefits, in INR/kWh)
0.0
0.5
1.0
1.5
2.0
2.5
3.0
Additional cost impact on solar power under the open access mechanism (without any concessional charges)
Open access losses (impact in INR/kWh)
Open access charges
Del
hiM
adhy
a Pr
ades
hAn
dhra
Pra
desh
Bih
arK
arna
taka
Utt
ar P
rade
shCh
hatt
isga
rhTa
mil
Nad
uG
ujar
atW
est B
enga
lH
arya
naPu
njab
Raj
asth
anK
eral
aM
ahar
asht
raH
imac
hal P
rade
shO
dish
a
Andhra Pradesh and Uttar Pradesh, for example, have completely waived off these charges for the solar projects.Odisha and Himachal Pradesh, on the other hand, have the highest charges among all states. Transmission and wheeling losses also vary significantly across states.
A combination of these can vary from 7.74% to 12.25% of the total power supplied. The tariff orders in Karnataka and Rajasthan account for the lowest losses in India, Punjab and Madhya Pradesh account for the highest.
In some states,developers can avail
concessional open access charges. For example, Andhra Pradesh and Uttar Pradesh have waived off the open access charges for solar power and Madhya Pradesh, Punjab and Gujarat are known to provide some concessions in terms of charges and losses considered.
However, according to Central Electricity Regulatory Commission (CERC) guidelines, RECs cannot be claimed if concessional wheeling and distribution charges are being availed. Therefore, developers must choose between the two benefits.
Sour
ce: B
RID
GE
TO IN
DIA
© B
RID
GE
TO IN
DIA
, 201
3
The impact of open access charges and
losses will be the lowest in Andhra
Pradesh, Uttar Pradesh and Delhi and the highest in
Maharashtra, Himachal Pradesh and Odisha.

© BRIDGE TO INDIA, 2013 15
Additional cost impact on solar power under the open access mechanism (with concessional charges)
Open access losses (impact in INR/kWh)
Open access charges
States with concessional charges
Utt
ar P
rade
shAn
dhra
Pra
desh
Del
hiM
adhy
a Pr
ades
hB
ihar
Guj
arat
Kar
nata
kaCh
hatt
isga
rhPu
njab
Tam
il N
adu
Wes
t Ben
gal
Har
yana
Raj
asth
anK
eral
aM
ahar
asht
raH
imac
hal P
rade
shO
riss
a0.0
0.5
1.0
1.5
2.0
2.5
3.0
Figure 5-3: Cost associated with the open access mechanism for selcted states at currently available concessional charges (in INR/kWh)
5.4 BENEFITS OF THE ‘GROUP CAPTIVE’ MODELApart from the incentives such as a waiver of CSS, power banking facilities and concessional open access charges, group captive consumers also have the following benefits:
i The key benefit of the group captive model is that bankability risks of the off-taker can be minimized by spreading it across multiple power consumers. Along with that, in case a power consumer stops buying power, another off-taker can easily be accommodated instead.
ii Smaller power customers can come together to build a larger project,
thereby benefitting from economies of scale.
iii In some states, it is also possible for power consumers to get ’additional power entitlement’. This means that users are usually entitled to draw a certain amount of power from the sub-station and in case they need more power, they would need to get an additional sanction at a one-time cost or, in some cases with revised tariff. A group captive model can help provide an additional entitlement without changing the sanctioned load from the sub-station.
iv Accelerated depreciation (AD) benefits and revenue through the sale of RECs might provide additional financial incentives.
Sour
ce: B
RID
GE
TO IN
DIA
© B
RID
GE
TO IN
DIA
, 201
3
The key benefit of the group captive model is
that bankability risks of the off-taker can be
minimized by spreading it across multiple
power consumers.
Smaller power customers can come
together to build a larger project, thereby
benefitting from economies of scale.
© BRIDGE TO INDIA, 2013 16
----------------------5Accelerated depreciation refers to any one of several methods by which a company, for ‘financial accounting’ or tax purposes, depreciates a fixed asset in such a way that the amount of depreciation taken each year is higher during the earlier years of an asset’s life. As this is subtracted from the cash flow, it allows the company to avoid paying taxes on the depreciated amount. An accelerated depreciation of 80% in the first year is allowed for infrastructure projects under section 80 (I) of the income tax act.
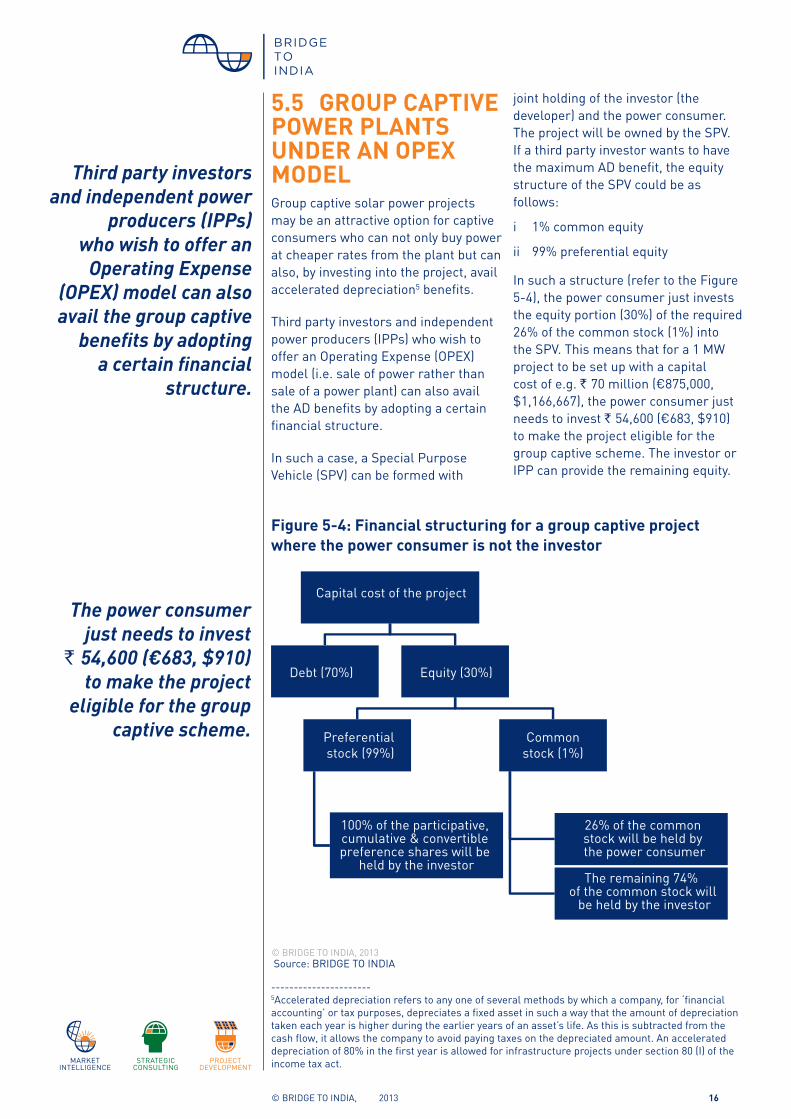
Figure 5-4: Financial structuring for a group captive project where the power consumer is not the investor
Capital cost of the project
Debt (70%) Equity (30%)
Preferential stock (99%)
100% of the participative, cumulative & convertible preference shares will be
held by the investor
Common stock (1%)
26% of the common stock will be held by the power consumer
The remaining 74% of the common stock will
be held by the investor
5.5 GROUP CAPTIVE POWER PLANTS UNDER AN OPEX MODELGroup captive solar power projects may be an attractive option for captive consumers who can not only buy power at cheaper rates from the plant but can also, by investing into the project, avail accelerated depreciation5 benefits.
Third party investors and independent power producers (IPPs) who wish to offer an Operating Expense (OPEX) model (i.e. sale of power rather than sale of a power plant) can also avail the AD benefits by adopting a certain financial structure.
In such a case, a Special Purpose Vehicle (SPV) can be formed with
joint holding of the investor (the developer) and the power consumer. The project will be owned by the SPV. If a third party investor wants to have the maximum AD benefit, the equity structure of the SPV could be as follows:
i 1% common equity
ii 99% preferential equity
In such a structure (refer to the Figure 5-4), the power consumer just invests the equity portion (30%) of the required 26% of the common stock (1%) into the SPV. This means that for a 1 MW project to be set up with a capital cost of e.g. ` 70 million (€875,000, $1,166,667), the power consumer just needs to invest ` 54,600 (€683, $910) to make the project eligible for the group captive scheme. The investor or IPP can provide the remaining equity.
© BRIDGE TO INDIA, 2013Source: BRIDGE TO INDIA
Third party investors and independent power
producers (IPPs) who wish to offer an
Operating Expense (OPEX) model can also avail the group captive
benefits by adopting a certain financial
structure.
The power consumer just needs to invest
` 54,600 (€683, $910) to make the project
eligible for the group captive scheme.

© BRIDGE TO INDIA, 2013 17
There is no rule to specify the split between the preferential stock and the common stock and it can vary from project to project. The group captive regulations states that the 26% minimum share required for the power consumer is of the equity (or common stock).
Disclaimer: Most project developers claim that this financial structuring is completely legal and followed for several power projects for other sources of power. However, some government officials are known to have raised concerns over the legality of such a model.
As a new SPV is created for the purpose of the project and does not yet have a profit on its balance sheets, it cannot avail the benefits of accelerated depreciation (AD) on the SPV’s assets.
Based on common understanding of the accelerated depreciation benefit, it does not make sense for a newly created SPV to claim the benefit as it has no existing profit on its balance sheets that it can offset against the depreciation claimed. However, one of the project developer pointed us to a Supreme Court ruling which said that accelerated depreciation can be claimed by the ‘part’ or ‘full’ owner of the SPV. Based on the information provided, we understand that Section 32 (I) of the Income Tax Act was amended in 1997 and there is a Supreme Court ruling from the case of Seth Banarsi Dass Gupta v. CIT 166 ITR 783, that says that based on the changes in section 32 (I) of the Income Tax Act, an owner or a fraction owner of the SPV is entitled to claim depreciation on the asset owned by a SPV. However, based on our discussion with tax experts, we do not believe that there is any viable way for a SPV to claim AD. Moreover, General Anti-Avoidance Rules (GAAR) under the Direct Tax Code (DTC), which is likely to be implemented from April 2015, will make it extremely difficult for anyone to carry out financial manipulations just from the taxation perspective.
Therefore, investors looking to sell power (OPEX model) using the group captive mode should not expect to avail the benefits of AD.
5.6 THE BUSINESS CASE FOR ‘GROUP CAPTIVE’ POWER PROJECTSA ‘group captive’ project must be able to supply power to a consumer at a tariff that is below the existing alternative cost of procuring power. Solar will always compete with other sources of power that can be bought using the open access mechanism. However, as the availability and price of other sources of power may vary by location and circumstances, we have not included such a comparison in our analysis.
The main parameters for the analysis are as follows:
i For the grid tariff for industrial and commercial consumers,we have chosen HT 33 kVA consumer tariffs for our analysis.
ii LTOA transmission charges and wheeling (distribution) charges for HT 33 kV consumers were converted into `/kWh.
iii The intra state transmission and wheeling losses are considered and the percentage values have been converted into `/kWh.
iv Equally, the ‘open access’ charges and losses have been converted into INR/kWh.
v The viable solar PPA tariff is calculated for four different REC scenarios (no RECs sold, 25% of the RECs sold, 50% of the RECs sold and 75% of the RECs sold). For each scenario, we have calculated an option with and without AD benefit. We have left out the scenario for 100% of the RECs being sold as we think that there is no realistic possibility of that happening.
Based on common understanding of
the accelerated depreciation benefit, it
does not make sense for a newly created SPV
to claim the benefit as it has no existing profit
on its balance sheets
Solar will always compete with other
sources of power that can be bought
using the open access mechanism.

© BRIDGE TO INDIA, 2013 18
----------------------6http://bit.ly/mVPsSl
vi The equity IRR expectation is taken as 15%.
vii Irradiation level has been taken as averages for each state.
The following assumptions have been made for the analysis:
i Wheeling and transmission charges are usually given in percentage terms. We have converted it into INR/kWh for a better understanding and analysis (generation of 1.6 million units/MWp installed has been used for this conversion).
ii For all other calculations, the capacity utilization factor (CUF) for each state has been used as per CERC6.
iii Size of solar power plant is 10 MW.
iv RECs traded at the floor price until 2017, post which no further REC revenue
v Plant life and PPA period of 25 years
vi No escalation of the tariff throughout the PPA period
vii CAPEX of ` 65 million/MW (€812,500/MW, $1,083,333/MW).
viii O&M costs of ` 1 million/MW/year (€12,500/MW/year, $16,667/MW/year)
ix Debt Equity ratio of 70:30
x When no RECs are sold, the concessional open access charges have been considered as follows:
o Andhra Pradesh, Uttar Pradesh: transmission and wheeling charges exempted
o Punjab, Madhya Pradesh:concessional wheeling losses of 2%
Based on our modeling, if up to 25% of RECs are sold, ’group captive’ power plants can be viable in the following states: Delhi and Maharashtra.
If 50% of the RECs are sold; ‘group captive’ power plants can be viable in the following additional states: Andhra Pradesh, Karnataka, Punjab, Rajasthan and Tamil Nadu.
If 75% of the RECs are solar, ‘group captive’ power plants can be viable in the following additional states: Bihar Kerala and West Bengal.
If up to 25% of RECs are sold, ’group captive’ power plants can be
viable in the following states: Delhi and
Maharashtra.
© BRIDGE TO INDIA, 2013
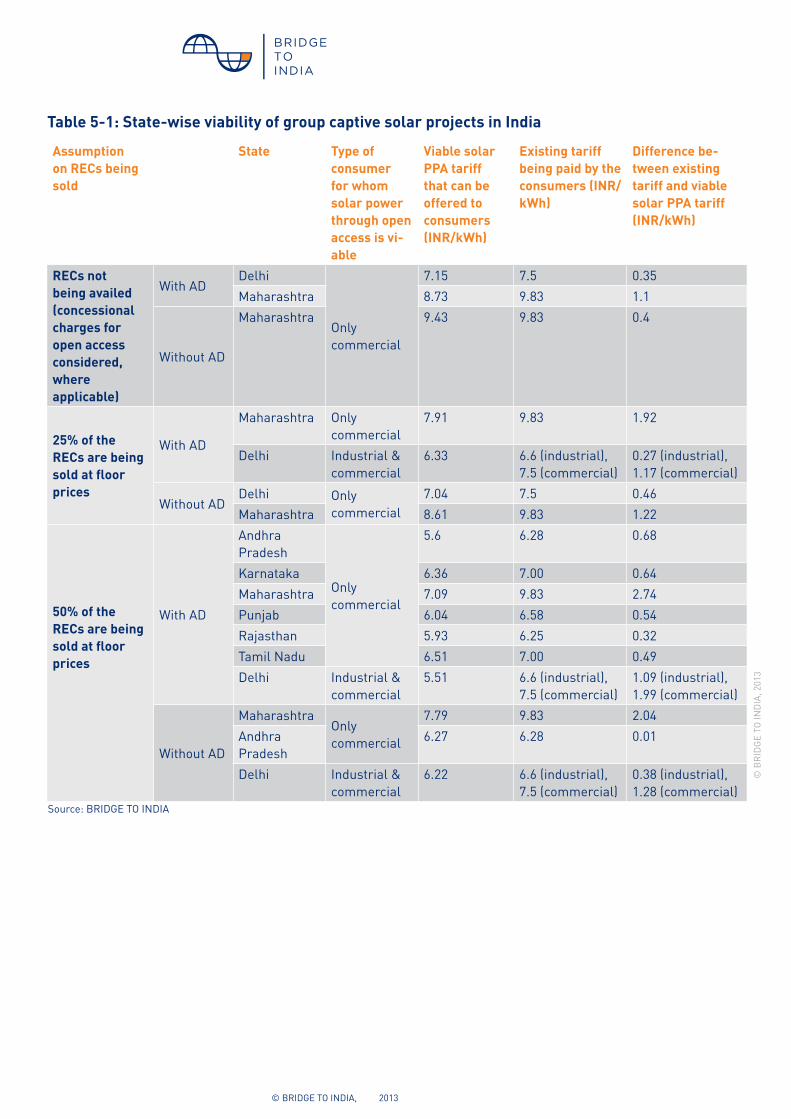
Table 5-1: State-wise viability of group captive solar projects in India
Assumption on RECs being sold
State Type of consumer for whom solar power through open access is vi-able
Viable solar PPA tariff that can be offered to consumers (INR/kWh)
Existing tariff being paid by the consumers (INR/kWh)
Difference be-tween existing tariff and viable solar PPA tariff (INR/kWh)
RECs not being availed (concessional charges for open access considered, where applicable)
With AD Delhi
Only commercial
7.15 7.5 0.35Maharashtra 8.73 9.83 1.1
Without AD
Maharashtra 9.43 9.83 0.4
25% of the RECs are being sold at floor prices
With AD
Maharashtra Only commercial
7.91 9.83 1.92
Delhi Industrial & commercial
6.33 6.6 (industrial), 7.5 (commercial)
0.27 (industrial), 1.17 (commercial)
Without ADDelhi Only
commercial7.04 7.5 0.46
Maharashtra 8.61 9.83 1.22
50% of the RECs are being sold at floor prices
With AD
Andhra Pradesh
Only commercial
5.6 6.28 0.68
Karnataka 6.36 7.00 0.64Maharashtra 7.09 9.83 2.74Punjab 6.04 6.58 0.54Rajasthan 5.93 6.25 0.32Tamil Nadu 6.51 7.00 0.49Delhi Industrial &
commercial5.51 6.6 (industrial),
7.5 (commercial)1.09 (industrial), 1.99 (commercial)
Without AD
MaharashtraOnly commercial
7.79 9.83 2.04Andhra Pradesh
6.27 6.28 0.01
Delhi Industrial & commercial
6.22 6.6 (industrial), 7.5 (commercial)
0.38 (industrial), 1.28 (commercial)
Source: BRIDGE TO INDIA
© B
RID
GE
TO IN
DIA
, 201
3

© BRIDGE TO INDIA, 2013 20
Assumption on RECs being sold
State Type of consumer for whom solar power through open access is vi-able
Viable solar PPA tariff that can be offered to consumers (INR/kWh)
Existing tariff being paid by the consumers (INR/kWh)
Difference be-tween existing tariff and viable solar PPA tariff (INR/kWh)
75% of the RECs are being sold at floor prices
With AD
Andhra Pradesh
Industrial & commercial
4.78 5.3 (industrial), 6.28 (commercial)
0.52 (industrial), 1.5 (commercial)
Bihar 5.27 5.5 (industrial), 5.5(commercial)
0.23 (industrial), 0.23 (commercial)
Delhi 4.69 6.6 (industrial), 7.5 (commercial)
1.91 (industrial), 2.81 (commercial)
Maharashtra 6.27 6.33 (industrial), 9.83(commercial)
0.06 (industrial), 3.56 (commercial)
Punjab 5.22 6.33(industrial) , 6.58(commercial)
1.11 (industrial), 1.36(commercial)
Rajasthan 5.11 5.50 (industrial), 6.25(commercial)
0.39 (industrial), 1.14 (commercial)
Karnataka Only commercial
5.54 7.0 1.46
Kerala 6.04 6.5 0.46Tamil Nadu 5.69 7.0 1.31West Bengal 5.87 6.2 0.33Haryana 5.54 5.85 0.31Uttar Pradesh
5.63 6.0 0.37
Without AD
DelhiIndustrial & commercial
5.4 6.6 (industrial) , 7.5 (commercial)
1.2 (industrial), 2.1 (commercial)
Punjab 5.89 6.33 (industrial), 6.58 (commercial)
0.44(industrial), 0.69 (commercial)
Karnataka Only commercial
6.25 7.0 0.75
Maharashtra 6.97 9.83 2.86Tamil Nadu 5.77 7.0 1.23Andhra Pradesh
5.45 6.28 0.83
Source: BRIDGE TO INDIA
© B
RID
GE
TO IN
DIA
, 201
3
State

© BRIDGE TO INDIA, 2013 21
5.7 RISKSApart from all the generic risks associated with solar power projects (refer to our report called, ‘Bankability and Debt Financing for Solar Projects in India’ (April 2013) for details)7, there are some risks specific to the group captive model. These risks can be categorized as follows:
i Annual revision of open access charges and rules – Open access charges and rules are often unclear. On top of this, they are subject to change every year. In such a scenario, assessing the financial viability of a long term project always has an element of uncertainty attached. The risk is heightened in a scenario where utilities feel threatened because their high paying customers move to other power procurement sources. We have already seen utilities in the US complaining about the impact of solar power on their business. In the same manner, the threat perception among Indian utilities may also increase, which may result in higher open access charges. This risk might be reduced by the overall policy support for solar power and the power deficit in India.
ii Structural changes in the power supply –More secure availability of power can be a significant driver for consumers opting for power purchases from group captive plants. The South Indian states of Andhra Pradesh and Tamil Nadu, for instance, have very high power deficits. As a result, the cost of power on the open access market regularly reaches as high as ` 8/kWh. However, structural changes such as the connection of the southern grid to the northern grid, which is expected soon, can significantly alter the demand and supply situation and thus the prices on the open access market.
BRIDGE TO INDIA believes that the overall deficit in power availability will continue to increase and that tariffs will continue to rise over the medium and long-term. However, structural shifts may occur on specific locations.
iii Bankability of the off-taker – In case one of the power consumer stops buying power from the group captive project and no other consumer is willing to step in, this amount of power might have to be sold to the power distribution company at the Average Pooled Purchase Cost (APPC) of power, probably at a lower price. Some of the projected revenue would be lost.
iv Risk associated with RECs– The REC market in India has not developed as hoped. Even though the RPO mechanism itself might pick up, if states are serious about implementation, the REC market will still remain subdued as the difference in the cost of solar power and the cost of an REC (essentially ‘solar’ without ‘power’) has increased significantly. While solar power is now available for third-party sale at ` 7 – 8/kWh (€0.09 – 0.10/kWh, $0.12 – 0.13 /kWh), the base price of an REC, where the obligated entity does not even get the power component is priced at a minimum rate of ` 9.3/kWh (€0.12/kWh, $0.16/kWh). Moreover, under current regulations, most REC demand is still expected only towards the end of the financial year, when some obligated entities are looking to meet their RPOs for the given year. The cash-flow for the project has to be managed carefully, especially with respect to a debt repayment plan. Developers should, therefore, only assume a limited sale of RECs in their financial calculations and within that too, the revenue should be expected to be largely concentrated towards the end of the financial year.
Open access charges are subject to change
every year. In such a scenario, assessing
the financial viability of a long term project
always has an element of uncertainty attached.
Even though the RPO mechanism itself
might pick up, if states are serious about
implementation, the REC market will still
remain subdued as the difference in the cost
of solar power and the cost of an REC
----------------------7 http://bridgetoindia.com/our-reports/india-solar-decision-briefs#

© BRIDGE TO INDIA, 2013 22
5.8 CONCLUSIONBased on the above analysis, BRIDGE TO INDIA thinks that the ‘group captive’ model is viable in some states with/without RECs. Even in the states where it is viable, it might not be the best option for the power consumer as solar power would still need to compete with other available sources of power.
The key benefit of the ‘group captive’ model is that it provides a good way for solar project developers to reach the needed scale, it helps reduce the PPA risk by having multiple off-takers and it also helps reduce legal risks as the asset can be located outside of the power consumer’s premises, vis-à-vis a single customer captive project, where the project is typically located at the customer’s premises.
In a number of states, a group captive plant might be able to sell solar power at tariffs of around ` 5.50 – 7.00/kWh (€0.06 – 0.07/kWh, $0.09 – 0.12/kWh),up to 50% of the RECs can be sold. Currently, the sale of power through the group captive and open access mechanism is viable without RECs only in Delhi and Maharashtra. Until now, none of the solar projects have taken group captive route. States such as Andhra Pradesh, Karnataka, Punjab, Rajasthan and Tamil Nadu would become viable, if 50% of the RECs can be sold at the floor price till 2017.
There are several scenarios with a slight deviation from the above analysis that can help this model become a more viable business proposition. These are as follows:
i An encouraging development is that open access charges are being waived off under most new solar policies. We have already noted this in Andhra Pradesh and Uttar Pradesh, where open access charges have been waived off entirely. Madhya Pradesh and Punjab also offer concessional
open access charges. We expect this trend will continue. If CERC allows RECs to be availed along with these concessional charges, as Andhra Pradesh has petitioned it to , the equation would change considerably in favor of the group captive model over co-located projects.
ii In the above analysis, no escalation has been considered. However, most industry observers believe that power prices in India will continue to rise. In the wake of debt-structuring plans for the state distribution companies, drastic upward tariff revisions can be expected. We have already seen upward tariff revisions in excess of 30% in states such as Tamil Nadu and Uttar Pradesh over the last year alone. If a developer can convince power consumers to agree to an annual increment in the price of solar power even lower tariffs can be offered to the consumers.
Several projects for third-party sale of power are currently being planned across India under the ‘group captive’ model. Judging by the tariffs being offered, many of these projects are expected to be considering an overly optimistic scenario for the revenue through RECs. We expect that such projects will not see the light of the day as it will be extremely difficult for them to arrange debt. Whether or not ‘group captive’ projects become mainstream in India is still an open question. Compared to the projects on the power consumers’ location, currently, the open access charges are too high to provide for any real benefit of scale. The key to the short to medium term success for such projects is regulatory support in terms of lower open access charges for solar power plants. Most new policies, are already taking the steps in this right direction. If more states follow this trend, we can expect to see an increased viability for the group captive model in the future.
Currently, the sale of power through the
group captive and open access mechanism is
viable without RECs only in Delhi and
Maharashtra.
The key to the short to medium term success
for such projects is regulatory support in
terms of lower open access charges for
solar power plants.

© BRIDGE TO INDIA, 2013 23
6. ANNEXURE6.1 GLOSSARY OF TERMSAD – Accelerated Depreciation
ADD- Anti-dumping duties
APPC – Average Pooled Purchase Cost
CAPEX – Capital Expenditure
CERC – Central Electricity Regulatory Commission
CSP – Concentrated Solar Power
CUF – Capacity Utilization Factor
DCR- Docmestic Content Requirement
DISCOM – State Distribution Company
EPC – Engineering, Procurement and Construction
FiT – Feed-in-Tariff
IPP – Independent Power Producers
LoI – Letter of Intent
LTOA – Long Term Open Access
MTOA – Medium Term Open Access
MNRE – Ministry of New and Renewable Energy
NHPC – National Hydro Power Corporation
NSM – Jawaharlal Nehru National Solar Mission
O&M – Operation and Maintenance
OPEX – Operational Expense
PoC – Point of Connection
PPA – Power Purchase Agreement
PV – Photovoltaic
REC – Renewable Energy Certificate
RfS – Request for Selection
RLDC – Regional Load Dispatch Centre
RPO – Renewable Purchase Obligation
SERC – State Energy Regulatory Commission
SLDC – Regional Load Dispatch Centre
SPV – Special Purpose Vehicle
STOA – Short Term Open Access
SECI – Solar Energy Corporation of India

© BRIDGE TO INDIA, 2013 24
© BRIDGE TO INDIA, 2013 25
BRIDGE TO INDIA is a consulting company with an entrepreneurial approach based in New Delhi, Munich and Hamburg. Founded in 2008, the company focuses on renewable energy technologies in the Indian market. BRIDGE TO INDIA offers market intelligence, strategic consulting and project development services to Indian and international investors, companies and institutions. Through customized solutions for its clients, BRIDGE TO INDIA contributes to a sustainable world by implementing the latest technological and systemic innovations where their impact is the highest.
www.bridgetoindia.com
Follow us on facebook.com/bridgetoindia
www.bridgetoindia.com/blog