
“Business models and Pricing Strategies in videogames ...
81
ΔΘΑΣΜΗΜΑΣΘΚΟ ΠΡΟΓΡΑΜΜΑ ΜΕΣΑΠΣΤΥΘΑΚΩΝ ΠΟΤΔΩΝ ΣΑ ΠΛΗΡΟΦΟΡΘΑΚΑ ΤΣΗΜΑΣΑ Διπλωμαηική Εργαζία “Business models and Pricing Strategies in videogames industry” ηοσ ΠΑΥΑΛΗ ΑΡΑΜΠΑΣΖΗ Τποβλήθηκε ως απαιηούμενο για ηην απόκηηζη ηοσ μεηαπηστιακού διπλώμαηος ειδίκεσζης ζηα Πληροθοριακά σζηήμαηα Φεβροσάριος 2014
-
Upload
khangminh22 -
Category
Documents
-
view
1 -
download
0
Transcript of “Business models and Pricing Strategies in videogames ...

ΔΘΑΣΜΗΜΑΣΘΚΟ ΠΡΟΓΡΑΜΜΑ ΜΕΣΑΠΣΤΥΘΑΚΩΝ ΠΟΤΔΩΝ ΣΑ
ΠΛΗΡΟΦΟΡΘΑΚΑ ΤΣΗΜΑΣΑ
Διπλωμαηική Εργαζία
“Business models and Pricing
Strategies in videogames industry”
ηοσ
ΠΑΥΑΛΗ ΑΡΑΜΠΑΣΖΗ
Τποβλήθηκε ως απαιηούμενο για ηην απόκηηζη ηοσ μεηαπηστιακού
διπλώμαηος ειδίκεσζης ζηα Πληροθοριακά σζηήμαηα
Φεβροσάριος 2014

2

3
Abstract
In our thesis we examine which factors have an influence on players‟ intention
to buy virtual items. In order to examine these factors we created a research model and
conducted an online survey. Especially, we included constructs from an IS (Information
System) perspective as well as from a game centric approach. We analyzed the results
using PLS-SEM method and we found out that the Game-centric constructs:
customization options, in-game functionality features, prestige, participation and
perceived enjoyment have a positive effect. We distinguished as the most important
Game-centric constructs the customization options, the in-game functionality features
and the prestige. IS-centric constructs such as performance expectancy, effort
expectancy and perceived value are also important for players‟ intention to buy virtual
items and they have a strong effect. These results can be useful to videogame companies
which adopt business models that include virtual item transactions. Based on these
results we suggest that videogame companies should offer virtual items taking into
account the most important Game-centric constructs and establish or improve their
virtual shops by taking into account the IS-centric constructs.

4
Acknowledgements
I would especially like to thank my supervisor Professor Dr. Anastasios Economides
and Phd Vasileios Terzis for their trust and valuable guidance.
Besides, I would like to thank everyone who has taken the time to complete the
questionnaire of this Thesis.

5
Table of Contents
Abstract .................................................................................................................................... 3
Contents of Tables .................................................................................................................... 6
Contents of Figures ................................................................................................................... 6
Contents of Images ................................................................................................................... 7
Introduction .............................................................................................................................. 8
Current state of video games industry ................................................................................... 8
Video game industry: old and new trends and changes ....................................................... 10
Literature Review ................................................................................................................... 12
Game as a Product (GaaP) ............................................................................................... 12
Game as a Service (GaaS) ............................................................................................... 13
Benchmarks and metrics of business models ....................................................................... 17
Video games Business Models: Theoretical framework ....................................................... 18
Pay-once/Fire and forget model ....................................................................................... 18
In-Game advertising ........................................................................................................ 20
User Generated Content (UGC) ....................................................................................... 23
Video Games Betting ...................................................................................................... 25
Sponsored Games / Donationware ................................................................................... 27
Crowdfunding ................................................................................................................. 29
Subscription .................................................................................................................... 30
Pay per play / Pay as you go / Pay per time ...................................................................... 33
Bitcoin mining as a means of payment ............................................................................. 35
Free to play (F2P) ........................................................................................................... 37
Microtransactions ............................................................................................................ 37
Virtual items transactions in business models ..................................................................... 39
Theoretical Background of research model ......................................................................... 41
Methodology .......................................................................................................................... 47
Case Study method ............................................................................................................. 47
Online Survey ...................................................................................................................... 48
PLS-SEM method ................................................................................................................. 49
The Research model ................................................................................................................ 51
Data Analysis and Interpretation of Results ............................................................................. 58
Measurement Model .......................................................................................................... 59

6
Structural Model ................................................................................................................. 60
Implications ............................................................................................................................ 64
Bibliography ........................................................................................................................... 67
Appendix ................................................................................................................................ 77
Contents of Tables
Table 1-Global Market 2012 - 2016 .......................................................................................... 9
Table 2 SWOT analysis of pay-once/fire and forget model ...................................................... 20
Table 3 SWOT analysis of In-Game advertising model ........................................................... 21
Table 4 SWOT analysis of user generated content model......................................................... 24
Table 5 SWOT analysis of player to player wagering .............................................................. 25
Table 6 SWOT analysis of skill-based progressive jackpots ..................................................... 27
Table 7 SWOT analysis of crowdfunding model ..................................................................... 30
Table 8 SWOT analysis of subscription model ........................................................................ 31
Table 9 SWOT analysis of pay per play / pay as you go / pay per time model .......................... 33
Table 10 SWOT analysis of bitcoin mining as a means of payment model ............................... 36
Table 11 SWOT analysis of microtransactions ........................................................................ 38
Table 12 Price list of In-game Credits ..................................................................................... 39
Table 13 Virtual items transactions in business models............................................................ 40
Table 14 Summary of selected constructs, related causal links and support evidence. .............. 55
Table 15 Results for the Measurement Model .......................................................................... 59
Table 16 Discriminant validity for the measurement model ..................................................... 60
Table 17 Hypothesis testing results ......................................................................................... 60
Contents of Figures
Figure 1 Global Market 2012 – 2016 ......................................................................................... 9
Figure 2-CARGs of all platforms ............................................................................................ 10
Figure 3 Game as a Product model .......................................................................................... 13
Figure 4 Game as a Service model .......................................................................................... 16
Figure 5 Moore„s High-Tech Marketing Model - Technology Adoption Life Cycle................. 17
Figure 6 - Value chain evolution ............................................................................................. 19
Figure 7- Number of World of Warcraft subscribers 2005 -2013 ............................................. 32
Figure 8- Revenue of GemStone III ......................................................................................... 35
Figure 9 - The Research model ................................................................................................ 51

7
Contents of Images
Image 1 - Ad placement patent ............................................................................................... 21
Image 2 - Interactive ad placement patent .............................................................................. 22

8
Introduction
Current state of video games industry
Video games are a new and fairly niche market, that has been developed
quickly and become a very important part of the digital entertainment media industry. In
particular, when it comes to growth rates, the field of video games is expected to
continue to grow at a pace of four times compared to the overall growth rate of the
digital entertainment market (De Prato, Feijóo, Nepelski, Bogdanowic, & Simon, 2010).
To make it easier to understand the extent and the impact of the particular
industry, we note that the domain of video games surpassed in size the film industry in
the U.S. in 2001 and in UK in 2009 (De Prato at al., 2010). Currently, the world of
video games turnovers an amount of $ 70.4 billion and by 2016 is expected to overpass
$ 86.1 billion (Warman, 2013). Revenues from gaming products and services in a
country like the United States have a direct effect on its gross domestic product (GDP)
(Crandall & Sidak, 2006).
The current pillars of video games growth are the console industry with pc
gaming industry to follow up (Figure 1). However, it is important to distinguish the
rising mobile gaming growth rate and the downfall of the handhelds and social/casual
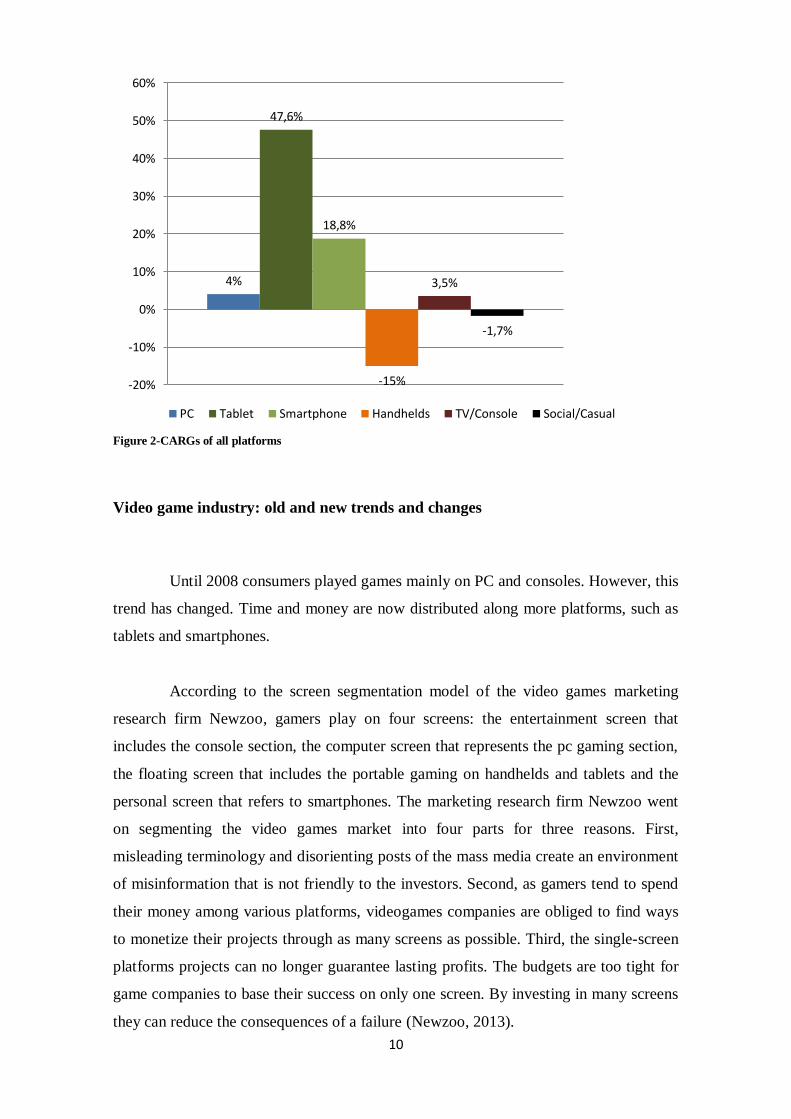
gaming. Specially, in Figure 2 we can notice the Compound Annual Growth Rate
(CAGR) of each platform. Tablets have the highest CAGR at 47,6%,while smartphones
have a CAGR of 18,8%. On the other hand, handhelds and social gaming have a
negative outlook, as they are expected to shrink at rate of 15% and 1,7%, respectively.
While, PC and Consoles are expected to have relatively steady CAGRs at 4% and 3,5%.
Overall, global video games market is expected to have a CAGR of 6,7% until 2016
(Warman, 2013).

9
Figure 1 Global Market 2012 – 2016 (“Global Monetization of Games Emerging Markets as Drivers of Growth, 2013”)
Table 1-Global Market 2012 - 2016
Annual Growth Rates
Year 2012 2013 2014 2015 2016
PC 29,6% 29,8% 29,4% 28,9% 28,5%
Tablet 3,2% 5,3% 7,5% 9,6% 11,6%
Smartphone 10,6% 12,1% 13,6% 15,0% 16,2%
Handhelds 9,8% 7,3% 6,1% 5,1% 3,9%
TV/Consoles 36,7% 36,1% 34,8% 33,5% 32,4%
Social/Casual 10,2% 9,4% 8,6% 7,9% 7,3%
Total market
revenue $ 66.3 bln $ 70.4 bln $ 70.5 bln $ 80.5 bln $ 86.1 bln
10
Figure 2-CARGs of all platforms
Video game industry: old and new trends and changes
Until 2008 consumers played games mainly on PC and consoles. However, this
trend has changed. Time and money are now distributed along more platforms, such as
tablets and smartphones.
According to the screen segmentation model of the video games marketing
research firm Newzoo, gamers play on four screens: the entertainment screen that
includes the console section, the computer screen that represents the pc gaming section,
the floating screen that includes the portable gaming on handhelds and tablets and the
personal screen that refers to smartphones. The marketing research firm Newzoo went
on segmenting the video games market into four parts for three reasons. First,
misleading terminology and disorienting posts of the mass media create an environment
of misinformation that is not friendly to the investors. Second, as gamers tend to spend
their money among various platforms, videogames companies are obliged to find ways
to monetize their projects through as many screens as possible. Third, the single-screen
platforms projects can no longer guarantee lasting profits. The budgets are too tight for
game companies to base their success on only one screen. By investing in many screens
they can reduce the consequences of a failure (Newzoo, 2013).
4%
47,6%
18,8%
-15%
3,5%
-1,7%
-20%
-10%
0%
10%
20%
30%
40%
50%
60%
PC Tablet Smartphone Handhelds TV/Console Social/Casual

11

12
Literature Review
Game as a Product (GaaP)
Players traditionally buy games in a box from retail stores or from other e-
commerce websites such as GAME and GameStop. Players can also pick up and
download digital versions of games from digital delivery services such as Steam,
Orange, Google Play and App Store (Grutzky & Cederholm, 2010). Players through
these distribution channels do not have direct contact with the publishers or the
developers (Grutzky & Cederhlom, 2010). The contact with the customers has been
outsourced to third party companies. Moreover, games distributed through these
channels usually follow the pay-once model and have to make a profit during the first
month or sooner (Dyack, 2013; MacDonald, 2013).
Even though, companies like Sony or Microsoft have their exclusive online
virtual stores such as PlayStation Store and Xbox Live, the same purchase process
occurs in these stores so far without fundamental changes (Grutzky & Cederholm,
2010). The first wave that used these distribution channels was small development
studios that also followed the pay-once model. It is notable that digital distribution
minimized the cost of stocking and enabled small development studios based on limited
resources to take more risks than they normally would, if they had to release their
games in retail stores (Lovell, 2010).
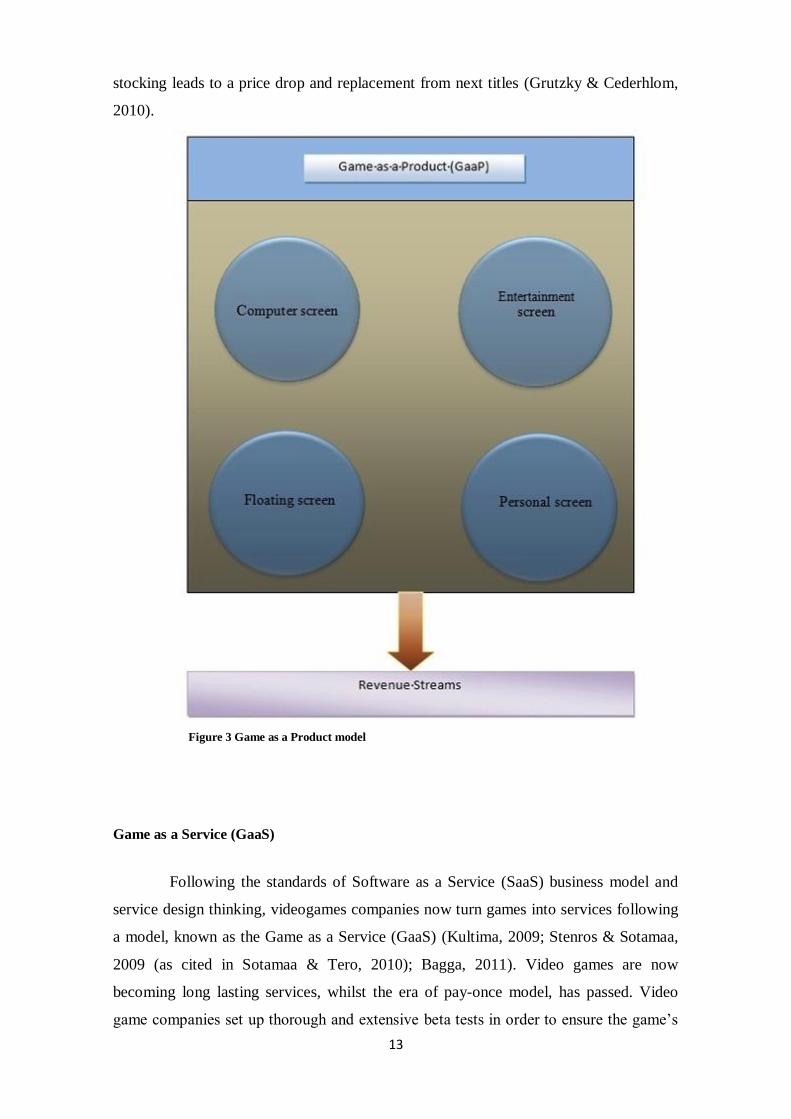
In Figure 3 we see Game as a Product model (GaaP). In this model games are
separate products for each platform without interoperability. Consequently, computer
screen, entertainment screen floating screen and personal screen are separate platforms.
Moreover, revenue streams do not take place in-game because publishers adopt mostly
the pay-once model (Bourcier, 2012). Therefore, players buy games in a box from retail
stores or from e-commerce websites and other distributional channels. Games following
this model fails if they do not meet the sales target, within a month, as the cost of
13
stocking leads to a price drop and replacement from next titles (Grutzky & Cederhlom,
2010).
Figure 3 Game as a Product model
Game as a Service (GaaS)
Following the standards of Software as a Service (SaaS) business model and
service design thinking, videogames companies now turn games into services following
a model, known as the Game as a Service (GaaS) (Kultima, 2009; Stenros & Sotamaa,
2009 (as cited in Sotamaa & Tero, 2010); Bagga, 2011). Video games are now
becoming long lasting services, whilst the era of pay-once model, has passed. Video
game companies set up thorough and extensive beta tests in order to ensure the game‟s

14
quality and get direct feedback from the players, because now the monetization
channels occur within the game (Davie, 2012).
Moreover, social network features are integrating into game projects. Even
before the advent of social networks, players were creating their own communities by
using external communicating channels such as forums, chat rooms and email
messages. Nowadays social networks have simplified this process. People create social
clusters so as to gain more value from the cluster than they gain alone (Terschluse &
Karen, 2009; Koster, 2011). That is why platforms and video games blur the lines
between the game elements and the social network features. Communicating and
Sharing are the two key features of this connection (Terschluse & Karen, 2009; Rogers,
2011). The importance of sharing is shown in the design for next-generation
entertainment and Computer screens. Floating screens also have their own direct
connections to social networks as well as personal screens. Video game companies have
instant data from social clusters in order to design and monetize content based on
interactions and preferences of groups of players.
The expansion of cloud gaming services also reforms all four screens. Many
steps have been taken in the development of cloud gaming service. In 2000 G-cluster
was the first cloud gaming platform for handheld devices (Ojala & Tyrväinen, 2011).
Since then lots of cloud gaming services have showed up such as OnLive or Gaikai
(Shea, Jiangchuan, Ngai & Yong, 2013). In 2012 console manufacturer Sony Computer
Entertainment spent $380 million to acquire Gaikai, a cloud-based gaming service.
During Consumer Electronics Show (CES 2014) Sony announced “PlayStation Now”
powered by Gaikai brings cloud gaming services to PlayStation devices, smartphones,
tablets and latest Bravia TV models (House, 2014). Microsoft also announced that
offers cloud gaming services with Xbox ONE (Bruno, 2013). Both consumers and
developers can use cloud computing power. Players enjoy an enhanced experience
because the power of the cloud can boost Xbox ONE capabilities, while developers that
build games for Xbox can use cloud computing power for free (Bruno, 2013).
Apart from cross platform experiences and augmenting computing power of
gaming devices, cloud services also alter the availability of distribution channels and
business models. The two most important features of cloud gaming are the easy access

15
and the flexibility for both gamers and video game companies. For the players, cloud
gaming services offer a unique opportunity to have their games available instantly
among various platforms. For the companies, according to Donahue (2012) the instant
access is the key for the customer acquisition process. It helps companies to understand
better who their customers are and what are their entertainment needs. As players no
longer have to wait to download data, instant game experiences increase the chances to
attract customers. In addition more pricing models become available. So far, retailers
demand from publishers certain pricing standards. However as cloud gaming offers an
alternative distribution channel, publishers can now set the rules. Swanson (2013)
explained that the pay once model does not offer price flexibility. Gupta and Donahue
(2012) added that publishers have more customization options for pricing models,
because now games are always instant available and publishers can form their own
pricing strategies without logistic restrains.
There are also no hardware restraints, as cloud gaming services are not
dependent on customers‟ hardware. Players can experience and purchase video games
content on any supported device anywhere. Thus, the power of the cloud contributes to
the transformation of video games software items into services (Early, 2012). Kessissian
(2012) provided financial results of G-cluster enterprise1as an example of cloud gaming
services. Especially he noted that the profits of G-cluster were up to 50,000,000 $ while
the conversion rate of non-paying players to customers was a 10%. Overall, the results
were 10 times bigger than other cloud services.
Another factor that reshapes the videogames industry is the business model
innovation. Although, traditional business models still exist at some extent, they must
evolve and adapt so as to monetize new gaming audiences. Companies explore and
implement new types of monetization in order to convert that broader audience into
gaming customers (Newel, 2013; Wallis, 2013).
One of the major changes of the new business models is the fact that now the
revenue streams are integrated into games (Bagga, 2011; Bourcier, 2012). Taking into
account the flow state of the players, videogames enterprises have designed
monetization systems that let player pay while they are playing. Players no longer need
to interrupt their gaming experience and quit the game in order to interact with external
1 G-cluster is a Finnish cloud gaming company.
16
payment systems. The purchase strategies are not only part of gameplay mechanics but
are part of the game development in total.
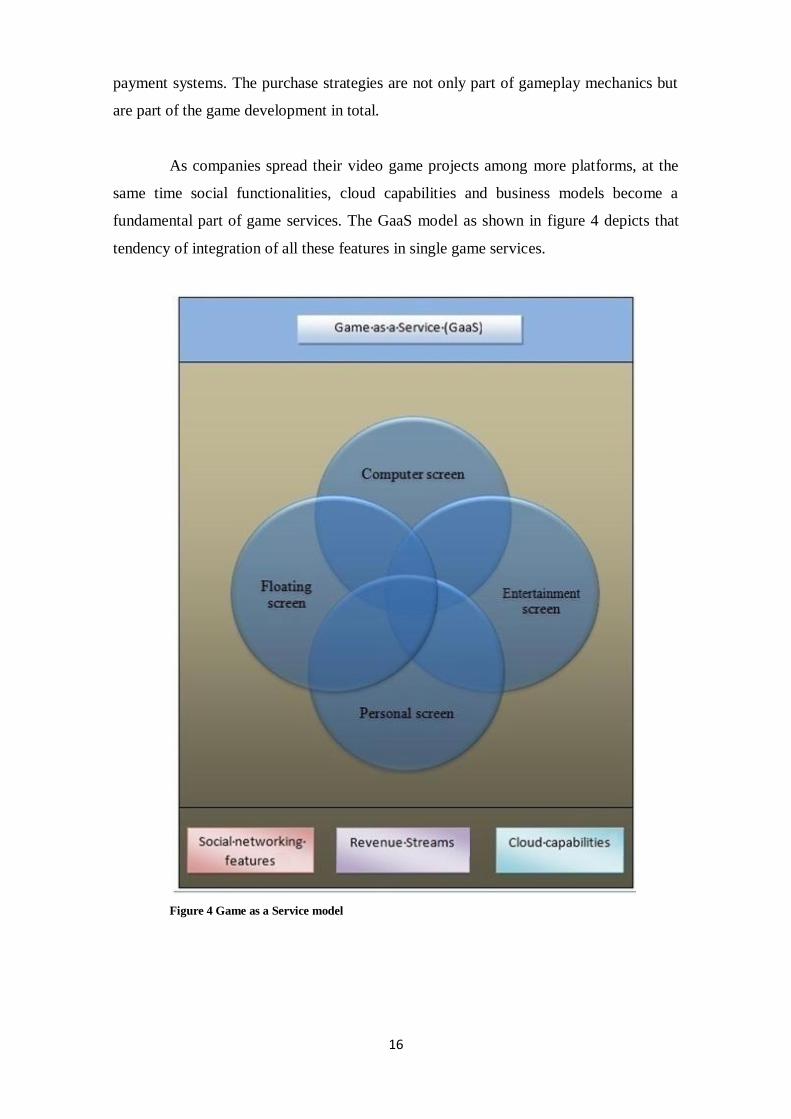
As companies spread their video game projects among more platforms, at the
same time social functionalities, cloud capabilities and business models become a
fundamental part of game services. The GaaS model as shown in figure 4 depicts that
tendency of integration of all these features in single game services.
Figure 4 Game as a Service model

17
Benchmarks and metrics of business models
In order to understand and compare video games business models of game
services, benchmarks and metrics are required. However, we have to keep in mind that
there are no specific globally accepted metrics (Gazecki, 2012).
The absence of globally accepted metrics and benchmarks is triggered by the
differentiation and the uniqueness of each game and its life-cycle. Even if the same kind
of games are produced on the same platform, there are going to have different aspects
that are important to different metrics. Moreover, videogames have a life-cycle
(Gazecki, 2012). Figure 5 depicts the Moore„s lifecycle adoption model. As a video
game product passes through various stages such as the early adoption, the growth and
the maturity, business model may change. As a result, each of these phases requires
different metrics (Moore, 2001). Hence, there are no global accepted metrics,
benchmarks and metrics vary on each video game (Gazecki, 2012).
.
Figure 5 Moore„s High-Tech Marketing Model - Technology Adoption Life Cycle (Moore,
2001).

18
Video games Business Models: Theoretical framework
In this section there is a brief presentation of video games business models. We
examine the main functionalities of each business model and we present some examples
and brief case studies.
Pay-once/Fire and forget model
In the pay-once model, video games companies sell video games to customers
through a single transaction in local and online stores. The pay-once model is the most
traditional model in the video games industry. There is only one revenue stream and it
takes place during the purchase process (Grutzky & Cederhlom, 2010). There is a fixed
price for all the customers in each retail or online store and there are no alternatives
during the first days of release (Dreunen, 2011).
In Figure 6, we see the evolution of the supply chain for the pay once model.
Initially a developer has to find a publisher. Publishers use various distribution channels
to deliver the boxed games to local stores for consumers. However, there are some
different distribution channels such as the online distribution without a publisher or the
direct distribution of the game by the developer. Either way, though all the distribution
channels lead to the same single transaction process for the end user (De Prato et al.,
2010).

19
Figure 6 - Value chain evolution (De Prato, Feijóo, Nepelski, Bogdanowic, & Simon, 2010)
Notably, some researchers distinguish the digital from the retail sales of video
games that follow the pay-once model (Dreunen, 2011). On the other hand, Bourcier
(2012) is a strategic error to divide sales into retail boxes and digital. He suggests that
we have to examine the industry as an undivided entity. In both cases, companies apply
price-discrimination tactics. Companies set high prices for first served users and drop
them after a short period or when a similar product enter the market. As a result, players
may opt to buy the game later in order to avoid high prices. However, this consumer
behavior is a threat for the business model because it causes losses in the revenue
streams (Nair, 2007). As a result, Bourcier (2012) believes that this is a declining
business model.
Bourcier (2012) also mentions that the Pareto law (80-20 rule) applies in all
fast-moving consumer goods (FMCG), including video games. He provides evidence
regarding his statement, by explaining that 4% of all games available correspond to half
of the console software sales. Thus, this model is weak for smaller companies and it is
more suitable for established game brands.
In the Table 2 we summarize the strengths, weaknesses, opportunities and
threats of pay-once/fire and forget business model

20
Table 2 SWOT analysis of pay-once/fire and forget model
Pay-once/Fire and forget model
Strengths Weaknesses
Direct profit for all value chain
members (De Prato et al., 2010)
Enables price-discrimination tactics
(Nair, 2007)
Single transaction model (Grutzky
& Cederhlom, 2010)
Only one revenue stream (Grutzky
& Cederhlom, 2010)
Fixed price during early days of
release (Dreunen, 2011)
Opportunities Threats
Suitable for established game
brands (Bourcier, 2012)
Late majority buyers (Nair, 2007)
In-Game advertising
In the in-game advertising model, enterprises pay publishers and development
studios in order to advertise their products and services in virtual worlds of video
games. Ads may reflect specific brands that appear in virtual goods or can be
incorporated as elements of games (Vedrashko, 2006).
SWOT analysis
We identify as strength of in-game advertising model the direct revenue
stream. Video game companies make direct profit from partnership with the advertised
companies (Lewis, 2006). Weakness of this model is permanent ad placement. If ad
placement is static even if it is required, it cannot be removed (Steiner, 2008).
Opportunity of this model is the experience enhancement. Suitable in-game
advertisements can enhance players‟ alternate reality (Vedrashko, 2006). Threat for this

21
model is unsuitable advertised brands. Players may feel that advertised brands are not
associated with certain game type (Boyd & Lalla, 2009).
.
Table 3 SWOT analysis of In-Game advertising model
In-Game advertising
Strengths Weaknesses
Direct revenue stream (Lewis, 2006) Permanent ad placement (static)
(Steiner, 2008)
Opportunities Threats
Experience enhancement (Vedrashko,
2006)
Unsuitable advertised brands
(Boyd & Lalla, 2009)
Ad placement can be either Static or Dynamic. Static product placement is the
introduction of permanent advertising messages in the game. An example of static
product placement is the advertisement displayed in motorsport and sports games. In
image 1 there are in-game ad placements that cannot be changed (Zalewski, 2009).
Image 1 - Ad placement patent (Zalewski, 2009)
Dynamic product placement is different to Static placement because we can
dynamically change the content of the ads. The elements of a dynamic product
placement may vary in terms of location, date and player‟s profile. For example, in
image 2 Sony patent dynamically shows different advertisements based on gender
(Zalewski, 2009).

22
Image 2 - Interactive ad placement patent (Zalewski, 2009)
Advergames
Advergames are video games that their sole purpose is to advertise a product, a
brand or an organization (Heide Smith and Nørholm, 2009). Advertised companies
usually fund development studios to cover production costs. According to this model,
when development studios complete game production, advertised companies distribute
it for free or for a small fee (Steiner, 2008).
SWOT analysis
We identify as strength of advergames the low production and development
cost. Generally, advergames development is relatively easy for video game companies
(Steiner, 2008). Weakness for advergames is the fact that most advergames are single
player games (Steiner, 2008). As a result, there are no network externalities.
Opportunity for advergames model is the fact that possible revenue depends on video
game company‟s reputation (Perry & DeMaria, 2009). A threat that we face in this
23
model is that full-length advergames are very difficult to develop. As a result,
development it is difficult for inexperienced development studios (Steiner, 2008).
Advergames
Strengths Weaknesses
Low production and development
costs (Steiner, 2008)
Single-player games (Steiner,
2008)
Opportunities Threats
Reputation determines possible
revenue (Perry & DeMaria, 2009)
Full-length advergames‟
development very complex
(Steiner, 2008)
Example
A prime example of Adver-Games is Burger King games. Burger King
company made a partnership agreement with Microsoft about releasing three adver-
games on X-box and X-box 360 consoles. The cost for each game was 3.99 $ and 10.99
$ as a set. It is worth to note that each disc included versions for both consoles (Miller,
2006).
User Generated Content (UGC)
In user-generated content business model videogame companies make profit
from the intellectual property rights of players‟ created content Video game enterprises
sell it to other players as an expansion of their service or product. They also sell it to
other companies as a new intellectual property (Di Gangi & Wasko, 2009). Moreover,
video game enterprises charge players for trading created content. Revenue for video
game enterprises, in that case, derives by keeping a percentage of the transactions
(Searle, 2011).
SWOT analysis
24
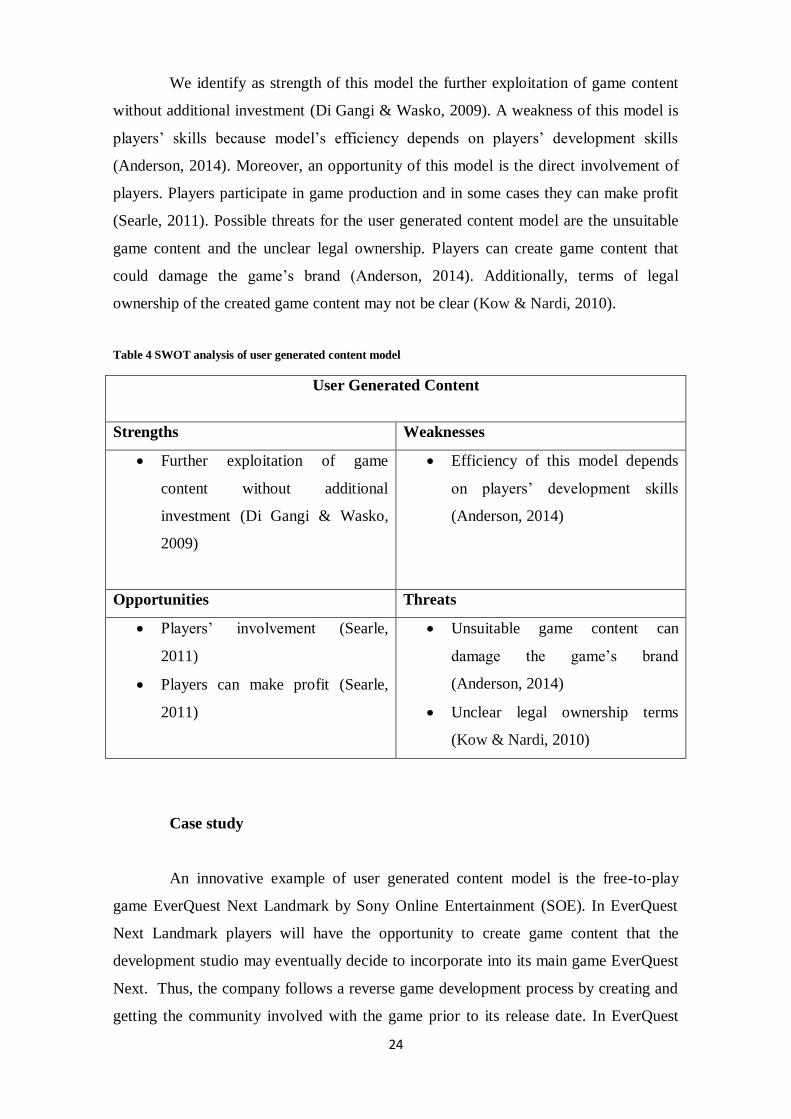
We identify as strength of this model the further exploitation of game content
without additional investment (Di Gangi & Wasko, 2009). A weakness of this model is
players‟ skills because model‟s efficiency depends on players‟ development skills
(Anderson, 2014). Moreover, an opportunity of this model is the direct involvement of
players. Players participate in game production and in some cases they can make profit
(Searle, 2011). Possible threats for the user generated content model are the unsuitable
game content and the unclear legal ownership. Players can create game content that
could damage the game‟s brand (Anderson, 2014). Additionally, terms of legal
ownership of the created game content may not be clear (Kow & Nardi, 2010).
Table 4 SWOT analysis of user generated content model
User Generated Content
Strengths Weaknesses
Further exploitation of game
content without additional
investment (Di Gangi & Wasko,
2009)
Efficiency of this model depends
on players‟ development skills
(Anderson, 2014)
Opportunities Threats
Players‟ involvement (Searle,
2011)
Players can make profit (Searle,
2011)
Unsuitable game content can
damage the game‟s brand
(Anderson, 2014)
Unclear legal ownership terms
(Kow & Nardi, 2010)
Case study
An innovative example of user generated content model is the free-to-play
game EverQuest Next Landmark by Sony Online Entertainment (SOE). In EverQuest
Next Landmark players will have the opportunity to create game content that the
development studio may eventually decide to incorporate into its main game EverQuest
Next. Thus, the company follows a reverse game development process by creating and
getting the community involved with the game prior to its release date. In EverQuest
25
Next Landmark players have the opportunity to learn how to create and sell game
content to other players through the Player Studio, which is the community shop of
Sony Online Entertainment (Georgeson, Murphy, & Michaels, 2013).
Video Games Betting
In this group of videogames business models there is a partnership between
third-party companies who organize game tournaments and developers or publishers.
This business model is based on the competitiveness of the players. Players can legally
(where it is allowed) enjoy their games by betting money or virtual items to win real
rewards. Revenue in video games betting models derives from the sales of virtual goods
and competition participation fees (Levin, 2009).
Player to Player Wagering
According to this model, before players start competing against each other on
video games, they bet money or virtual goods. After competing against each other on a
game the winner takes all the bets The higher the competition, the higher the bets will
be. Video game companies gain revenue from this process by selling virtual items to
tournament organizers or directly to players (Perry & DeMaria, 2009).
SWOT analysis
We identify as strength of this model the positive relationship between
competition and bets for virtual goods/money (Perry & DeMaria, 2009). A weakness of
this model is related to legal issues because videogames betting is forbidden in some
countries (Harris, J., & Hagan, 2012). An opportunity for this model is the fact that
virtual items become obsolete after some time. As a result, video game companies force
players to purchase new items, even if they are winning (Perry & DeMaria, 2009). A
possible threat for this model is cheating (Yan & Randell, 2005; Perry & DeMaria,
2009). Players try harder to cheat if prizes involve real money (Perry & DeMaria,
2009).
Table 5 SWOT analysis of player to player wagering
Player to Player Wagering
Strengths Weaknesses

26
Positive relationship between
competition and bets for virtual
goods/money (Perry & DeMaria,
2009)
Legal issues (Harris, J., & Hagan,
2012)
Opportunities Threats
Virtual items become obsolete after
some time (Perry & DeMaria,
2009).
Cheating (Yan & Randell, 2005; Perry
& DeMaria, 2009)
Example
An example of this model is the venture between WorldGaming.com and
Virgin Group, virgin‟s gaming service. The Virgin Gaming service is working in
partnership with Electronic Arts, Ubisoft and other video game companies. This
collaboration enables players to play and compete against each other in their favorite
games for real money, cash and prizes (virgingaming.com, 2013).
Skill-Based Progressive Jackpots
In this model, players pay a participation fee (real money or virtual items) and
enter a tournament – game. After the payment process, a progressive jackpot is
triggered and the player can win a sum of money or virtual items to be spent on bets if
he/she fulfills some content game conditions. Third-party enterprises, publishers and
development studios gain revenue from this process by keeping a percentage of total
fees and the charges for virtual items. The main difference between gambling and this
business model is the fact that it tests players‟ skill and it is not purely luck-based (Perry
& DeMaria, 2009).
SWOT analysis
We identify as strength of this model the increased competition. Players
participate more frequently and compete harder if there is involvement of real prizes

27
(Perry & DeMaria, 2009). On the other hand, a weakness of this model is related to
legal issues. Videogames betting models are not legal in all countries (Harris & Hagan,
2012). An opportunity for this model is that tests players‟ skill and it is not based on
pure luck factor (Perry & DeMaria, 2009). A possible threat for this model is that
players try harder to cheat if there is involvement of real prizes (Yan & Randell, 2005;
Perry & DeMaria, 2009).
Table 6 SWOT analysis of skill-based progressive jackpots
Skill-Based Progressive Jackpots
Strengths Weaknesses
Increased competition (Perry &
DeMaria, 2009)
Legal issues (Harris & Hagan,
2012)
Opportunities Threats
Skill based (Perry & DeMaria,
2009)
Cheating (Yan & Randell, 2005;
Perry & DeMaria, 2009)
Case study
An example of this business model is the Space Tale game from Boss Media.
Special Tale is a video slot game with bonus rounds based on certain players‟ skills.
The game has a progressive jackpot and the players win if they line two to five jackpot
gems on an active line. In order to play the game, players need up to 90 virtual coins,
which according to their size cost from $ 4.50 to $ 90. Although, it is a slot game, there
is a bonus round for every 1000 points. In a bonus round, the gameplay changes
completely. Players use key arrows to guide a spacecraft and hit targets so as to win up
to 10000 coins (casinoclub.com).
Sponsored Games / Donationware
In the donationware model philanthropists, state or charity organizations
financially support video game companies which develop Serious Games (videogames
that help players acquire new skills, or improve the world) (Perry & DeMaria, 2009;
Mehdi, Elmaghraby, & Ch'ng, 2009). Moreover, if a development studio has a strong
social impact, charity organizations may opt to sponsor its games (Mehdi et al., 2009).

28
SWOT analysis
We identify as strength of this model the strong social impact. Players
financially aid the development of videogames that someway help society (Perry &
DeMaria, 2009). A weakness of this model is its limited use. Videogame companies
adopt this model in order to develop Serious Games (Perry & DeMaria, 2009). An
opportunity for this model is the collaboration with philanthropists, state or charity
organizations (Perry & DeMaria, 2009; Mehdi et al., 2009). If a development studio has
a strong social impact Charity organizations may opt to sponsor its games (Mehdi et al.,
2009). A threat for this model is its non-profit goal. Perry and DeMaria (2009) warn
videogame companies to make sure that donations cover development and distribution
costs because videogame companies that adopt this model barely make money.
Sponsored Games/Donationware
Strengths Weaknesses
Strong social impact (Perry &
DeMaria, 2009)
Limited to Serious Games (Perry &
DeMaria, 2009)
Opportunities Threats
Collaboration with philanthropists,
state or charity organizations
(Perry & DeMaria, 2009; Mehdi et
al., 2009)
Non-profit goal (Perry & DeMaria,
2009)
Case Study
An example of this model is the Decode Global„s game Get Water! on iOS
devices. Get Water! is about navigating a little girl, Maya, through the slums where she
lives, so as to complete tasks and find clean water. Players can help her not to get
distracted from school in her quest to find water, by making some in-app purchases.
This happens because Decode Global donates all the proceeds from in-app purchases to

29
non-profit organizations that help people in developing countries to have access to clean
and safe water (decodeglobal.org, 2013).
Crowdfunding
In the crowdfunding model a development studio presents its project on a
crowdfunding platform and requests financial support. Players who want to support that
project have to pay an initial amount of money before the development of the game has
begun or while it is at its initial stages (Hemer, 2011; Agrawal, Catalini, & Goldfarb,
2013). Crowdfunding platforms (such as kickstarter or indiegogo) work as the middle
man and gain revenue from this process by applying a percentage fee to the funds
collected, only if funding is successful. If funding is not successful, there are no fees
and the crowdfunding platform is not liable for any damage or loss relating to the
project. In that case it is up to players who funded the game to take legal action. If the
project reaches its monetary goals, players after some time gain access to physical
game content or virtual items according to the amount of money they pledged. If the
project fails no fees are applied (Hemer, 2011; Agrawal et al., 2013).
SWOT analysis
We identify as strengths of this model the better matches and the information
that crowdfunding generates. Through crowdfuning platforms videogame companies
can find better matches about the players who are the most willing to fund their
projects. (Hemer, 2011; Agrawal et al., 2013). Moreover, crowdfunding generates more
information compared to other early fundraising models because videogame companies
have direct communication with players before and during game production (Agrawal et
al., 2013. The weaknesses of this model are frequent and the creators‟ incompetence.
Creators may lack the skills in predicting development costs, handling logistics etc.
Players may have to wait for long before they actually see the project completed (Agrawal et
al., 2013). The opportunities of this model are the monetization of early access and
community participation to entrepreneurial initiative. Videogame companies can
monetize the early access to their projects in this model while players have the

30
opportunity to feel they take part in an entrepreneurial venture (Agrawal et al., 2013).
The threats of crowfunding model are the collective action problem and the project risk.
Collective action problem refers to the fact that if investment levels are low players will
hesitate to take part in the project. As a result, players may wait one another and nobody
invests. Moreover, ventures that are at their early stages are inherently risky (Agrawal et
al., 2013).
Table 7 SWOT analysis of crowdfunding model
Strengths Weaknesses
Better matches (Agrawal et al.,
2013).
Information (Hemer, 2011;
(Agrawal et al., 2013)
Often delays (Agrawal et al.,
2013).
Creators incompetence. (Agrawal
et al., 2013)
Opportunities Threats
Early access (Agrawal et al., 2013)
Community participation (Agrawal
et al., 2013)
Project risk (Agrawal et al., 2013)
Collective action problem
(Agrawal et al., 2013)
Case study
Torment: Tides of Numenera was a Role-playing game from inXile
Entertainment. Torment: Tides of Numenera was the most crowfunded Kickstarter
videogame project and was successfully funded in the first six hours. More than 70.000
backers pledged more than $ 4.180.000 during 30 days. Players could back the project
by pledging $ 5 to $ 350 for virtual items and $ 165 to $ 10.000 for physical goods
(kickstarter.com, 2013).
Subscription
In the subscription model, players pay a subscription monthly, quarterly or on
an annual basis. Players may also need to buy a part of the game, either online or in
physical form. The revenue stream of this model is based on continuous membership

31
(Nojima, 2007). However, in most cases a user can unsubscribe for some time without
losing his achievements and progress (Perry & DeMaria, 2009).
SWOT analysis
We identify as strengths of the subscription model the recurring revenue and the
predictable revenue. Players‟ continuous membership offers videogame companies
recurring revenue (Nojima, 2007). Moreover, the subscription business model enables
enterprises to better make better predictions because of exepcted revenue (Sullivan, 2011).
A possible weakness of the flat-rate subscription model is that you gain the same value
from all the players (Nojima, 2007). Opportunities of this model are the diversifying
price model and the continuous relationship with the company. Subscription based
games offer videogame companies various pricing model options such as prepaid or flat-
rate (Nojima, 2007). Moreover, companies and subscribers establish a continuous
relationship. As a result, companies can collect more information about subscribers‟
profile revenue (Sullivan, 2011). A possible threat of this model is the fact that retention
depends on immersion. If players stop feeling immersion then they abandon the game
(Langlotz, Rhode, & Whaley, 2008).
Table 8 SWOT analysis of subscription model
Subscription
Strengths Weaknesses
Recurring revenue (Nojima, 2007)
Predictable revenue (Sullivan,
2011)
Same value from each of your
customers (flat-rate) (Nojima,
2007)
Opportunities Threats
Diversifying price model (Nojima,
2007)
Continuousrelationship (Sullivan,
2011)
Retention depends on players‟
continuous immersion (Langlotzl
et al., 2008)

32
Case Study
A prime example of a successful subscription based game is World of Warcraft
a game by Blizzard Entertainment. Blizzard Entertainment first released the World of
Warcraft in 2004 as a subscription based MMORPG and still follows the same business
model. Nowadays, there are three available subscription options. The players can buy
one month game time for 12.99 €, 3 months game time for 11.99 € and 6 months for
10.99 €. In 2008 World of Warcraft was estimated to hold 68% of the total subscription
based MMORPG market (Videogamedesigncolleges.org, 2011). By 2010 Blizzard had
12.000.000 subscribers (figure 7). Today subscribers are dwindling (statista.com, 2013).
Various researchers and employees of Blizzard such as Tom Chilton2 suggest that
Blizzard should change its business model and follow a combination of virtual items
transactions and free-to-play models (Chilton, 2013). On the other hand, Jason
Hutchins3 underlines the fact that the game is not built for a free to play model and that
the stable player base along with the subscription model keeps the game successful all
these years (Hutchins, 2013).
Figure 7- Number of World of Warcraft subscribers from 1st quarter 2005 to 3rd quarter 2013 (statista.com, 2013)
2 Tom Chilton is the lead designer of World of Warcraft 3 Jason Hutchins is the senior game producer of World of Warcraft
0,00
2,00
4,00
6,00
8,00
10,00
12,00
14,00
Q1
'05
Q3
'05
Q1
'06
Q3
'06
Q1
'07
Q3
'07
Q1
'08
Q3
'08
Q4
'09
Q4
'10
Q2
'11
Q4
'11
Q2
'12
Q4
'12
*
Q2
'13
Number of World of Warcraft subscribers
from 1st quarter 2005 to 3rd quarter 2013
Subscribers in millions

33
Pay per play / Pay as you go / Pay per time
In the pay per time business model video game companies charge players for
the time they played the game. Depending on a fee schedule, charges can differ. Players
can use some in-game items that reduce the charge per hour for a certain time limit.
However, the player usually has to spend many hours before he/she can acquire them
(Perry & DeMaria, 2009; Ojala, 2012).
SWOT analysis
We identify as strengths of pay per play / pay as you go / pay per time model
are the continuous revenue stream and the diversification of user base. In this model
video game enterprises make profit all the time players spend on video games (Harris,
2012). The weaknesses of this model are that there is the same price for all customers
and the need to maintain records of usage. There are no personalized pricing options
because enterprises charge all the players the same. Moreover, enterprises may need to
keep records of usage. Consequently, there is an increase in administrative costs (Ojala,
2012). An opportunity for this model is diversification of user base. Games are available
to players who play occasionally or for some specific purpose (Ojala, 2012). Threats for
this model are the overuse of the product and the low switching costs. If a player plays
for too long, total charges may be extravagant. As a result, the player may opt to quit
playing (Harris, 2012). Another threat is low switching costs. Players can switch games
if there is an alternative option available at a lower price (Ojala, 2012).
Table 9 SWOT analysis of pay per play / pay as you go / pay per time model
Pay per play / Pay as you go / Pay per time
Strengths Weaknesses
Continuous revenue stream (Harris,
2012).
Same price for all customers
(Ojala, 2012)
Need to keep records of usage
(Ojala, 2012)
Opportunities Threats
Diversification of user base (Ojala, Overuse (Harris, 2012).

34
2012)
Low switching costs (Ojala, 2012)
Case study
The GemStone III is MUD4 game which first appeared as GemStone in 1987
as part of the online service Genie5. During the first years of release the business model
Genie followed the “pay per hour” model. Players had to pay for every hour they were
spending in the game and charges varied according to a fee schedule. The initial cost of
the service was 6 $ per hour during times of low demand (evening hours and weekends)
while during times of high demand the cost elevated at 36 $ per hour. While playing
GemStone III, players had the chance to win real gemstones if they had previously
found them in-game. As a result, this marketing policy urged players to play more hours
(Coyier, 2009).
Neil Harris (2012) mentioned that the success of this business model is based on
the pleasure that players receive while playing an online video game. Indeed, the more
fun a game offers, the more time players spend on it. As a result, that eventually lead
them to pay more as well.
4 MUD: MUD games were online RPGs that didn‟t have any user interface and the interaction among the
players was achieved only using command line. 5 Genie: General Electric Network for Information Exchange: it is an ASCII text-based department of
General Electric, which began in 1985 and ended in 1999

35
Figure 8- Revenue of GemStone III, March 1996 (Harris, 2012)
In figure 8 we see the results of GemStone III with this business model. In 1996
there were 50.000 players in total paying 6 $/hour, that yielded AOL 3.000.000 $ in a
month. During that period, the contract between Simutronics and AOL enabled the
developer team of GemStone III to earn 20% of the profit while AOL claimed 80%.
Moreover, this 80% of the profit, which was 2.400.000 $ was earned by 10.000 users
which corresponds to 20% of the total users. This also led GemStone III to have an
Average revenue per user (ARPU) up to 60 $.
Taking into account the available data, players of GemStone III spent most of their
available time playing the game. Actually, they spent almost 400 hours per month on
GemStone III and they paid 2.400 $. However, many of them after reaching a certain
amount of hours, stopped playing (Harris, 2012).
Bitcoin mining as a means of payment
In the bitcoin mining as a means of payment model, a player downloads and
installs a mining client. Then, that mining client starts generating a certain number of
bitcoins, which change into real money. Eventually, the mining client provider takes a
cut of the money and pays the game company which in exchange, provides players with
in-game currency, cheaper monthly subscription fees or virtual items (Farivar, 2012).

36
SWOT analysis
We identify as strength of this model the continuous revenue stream. As long
as players keep the mining client installed, video game companies make profit (Farivar,
2012). Weaknesses of this model are minimum mining process requirements. It is
unlikely all players to have powerful devices enough to meet mining process
requirements (Koss, 2012). As a result, players on weaker systems reject the idea.
Opportunity for this model is the participation of non-paying players (Bishop, 2012).
Threats for this model are related to legal issues of bitcoin and bitcoin unstable
exchange rate. Speculative investors dominate bitcoin network and cause bitcoin
exchange rate volatile fluctuations. Moreover, various financial institutions warn
consumers and investors about possible security threats of virtual currency such as fraud
or illegal activity engagement (Elwell, Murphy, & Seitzinger, 2013).
Table 10 SWOT analysis of bitcoin mining as a means of payment model
Bitcoin mining as a means of payment
Strengths Weaknesses
Continuous revenue stream
(Farivar, 2012)
Mining process requirements
(Koss, 2012)
Opportunities Threats
Participation of non-paying players
(Bishop, 2012)
Security concers (bitcoin) (Elwell
et al., 2013)
Unstable exchange rate (bitcoin)
(Elwell et al., 2013)
Case study
A pioneer of this model is Coinlab, a start-up company that wants to offer an
alternative game monetization service by using bitcoin mining process. Coinlab‟s new

37
tagline is “All your gamers are gold” According to Coinlab‟s calculations, the average
gamer generates 50 cents to $2 per day or about 15 $ per month. That numbers are
impressive for some game companies, because non-paying players can now bring more
revenue than paying customers (Bishop, 2012). Moreover, this business model can offer
50 times average revenue per user compared to advertisements (Vessenes, 2012). Wurm
Online and Grafighters have already partnered with CoinLab and more companies are
expected to follow (Koss, 2012).
Free to play (F2P)
The games based on the free to play model allow players to have free access
and try the game. This model is used to attract players, without a fee barrier, as no costs
are involved. Thus the free to play model is combined with other business models such
as microtransactions (Weidemann, 2011).
Microtransactions
In the microtransactions business model video game companies gain revenue
by selling virtual items to players. Virtual items may already exist in a game or they can
be exclusive additional content. In this way video game companies can add value to
their games even after the release date (Hamari & Lehdonvirta, 2010).
SWOT analysis
We identify as strength of microtransactions business model the power of
choice (Oh & Ryu, 2007). Players have the power to specifically choose what game
items they want to buy. Weakness of this model is that players may feel dimed about
microtransactions (Epps, Muligan, & Hood, 2009). This happens because some players
think microtransactions as a pay to win method and not as an additional option.
Opportunities for this model are the personalized pricing, the scarcity and the added
value. Harris (2012) suggested that video game companies should follow a personalized

38
pricing in microtransactions by creating and charging virtual items based on each
player‟s needs. Moreover, video game companies can offer virtual items transactions in
order to exploit the scarcity of certain in-game items (Hamari & Lehdonvirta, 2010).
Video game companies can also add virtual items in their released games in order to
increase their value or alter the content (Hamari & Lehdonvirta, 2010). Threat for this
model is related to in-game balance issues. The implementation of virtual items can
alter the game‟s economy and affect game mechanics. Thus, video game companies
should examine the consequences of changes carefully and schedule the adequate game
updates, if necessary (Hamari & Lehdonvirta, 2010).
Table 11 SWOT analysis of microtransactions
Microtransactions
Strengths Weaknesses
Power of choice (Oh & Ryu, 2007)
Players may feel dimed (Epps et
al., 2009)
Opportunities Threats
Added value or alteration of
content after release (Hamari &
Lehdonvirta, 2010)
Scarcity (Hamari & Lehdonvirta,
2010).
Personalized pricing (Harris, 2012)
In-game balance issues (Hamari &
Lehdonvirta, 2010).
As far as the payment process is concerned players can buy virtual items with
real money. However, in some cases players have to buy virtual currency before
acquiring any virtual items (Oh & Ryu, 2007). According to Hamari and Lehdonvirta
(2010) a common pricing strategy is to set the prices of virtual items at a level that leave
customers with an amount of change that they cannot use it for further purchases. As a
result, players have to buy more virtual currency, if they want to buy more virtual items.

39
(sonyentertainmentnetwork.com, 2013)
Case study
From 1997 Gran Turismo series followed only the pay-once model. However
Gran Turismo 6 the latest installment in the series is the first which adopts two models:
the pay-once model and the microtransactions model (Karmali, 2013). Players who
bought a copy of the game, they could save time and effort by purchasing virtual
currency (“Credits”). In that way players could spend their Credits on buying new cars
for their virtual collection. Yoshida (2013) stated that the game was not built around
microtransactions. He further explained that microtransactions was an alternative,
optional way to play the game. Specially players who did not have the time and
preferred to buy rather than to unlock the virtual cars. Taking into account the price list
of In-Game Credits if the player wanted one of the top priced virtual cars, for example
the Jaguar XJ13, which cost 20 million credits, he/she would have to spend 150 €
(sonyentertainmentnetwork.com, 2013)
.
Table 12 Price list of In-game Credits
Number of In-Game Credits Price
500.000 4.99 €
1.000.000 9.99 €
2.500.000 19. 99 €
7.000.000 49.99 €
We realize that the cost of a single virtual car was more than twice as high as
the Manufacturer's Suggested Retail Price (MSRP) for the game which was 59.99 €
(sonyentertainmentnetwork.com, 2013). However, we have to note that the
microtransactions model faced serious challenges in Gran Turismo 6, because in-game
inconsistencies enabled players to cheat and earn millions of Credits without effort
(Matulef, 2013). As a result, game economy became unbalanced and there was no
motive for purchasing Credits due to such technical problems.
Virtual items transactions in business models

40
Table 13 Virtual items transactions in business models
Business models Virtual items transactions in revenue streams
Pay-once/Fire and forget -
In-Game advertising
-
Advergames
-
User Generated Content
(possible)
(Di Gangi & Wasko, 2009)
Player to Player Wagering
(possible)
(Perry & DeMaria, 2009)
Skill-Based Progressive
Jackpots
(Perry & DeMaria, 2009)
Sponsored Games /
Donationware
(possible)
(Perry & DeMaria, 2009; Mehdi et al., 2009)
Crowdfunding
(Hemer, 2011; Agrawal et al., 2013)
Subscription -
Pay per play / Pay as you go /
Pay per time
-
Bitcoin mining as a means of
payment
(Farivar, 2012)
Microtransactions
(Hamari & Lehdonvirta, 2010)
In table 13 we notice that more than half of videogames business models
involve virtual items transactions in their revenue streams. Especially,
microtransactions, bitcoin mining as a means of payment, sponsored games /
donationware, user generated content, player wagering, skill-based progressive jackpots
and crowdfunding models involve virtual items transactions in their revenue streams.
As a result, virtual items transactions play a significant role in these
videogames business models. Therefore, the players‟ intention to buy virtual items can
affect the revenue streams of these models. Thus, by examining the factors of players‟
intention to buy virtual items we better understand the role of virtual items as a factor of

41
success of business models. Furthermore, by examining acceptance models of virtual
items, we also understand what factors are important for players‟ adaptation to
videogames business models which include virtual items transactions.
Theoretical Background of research model
We used technology acceptance models (TAM) in order to examine the
acceptance of virtual items acquisition model and virtual items purchase drivers.
The basis of the technology acceptance models is the Theory of Reasoned
Action (TRA) (Fishbein & Ajzen, 1975). The Theory of Reasoned Action (TRA) is a
social psychology approach that defines the theoretical framework of human reactions.
The most fundamental element of this concept is the possibility of the actor to perform
as it was predicted that he/she would intent to react. The two underlying factors that
determine the behavioral intention is the individual attitude and the subjective norm
(Ajzen & Fishbein, 1980). The individual attitude refers to the tendency someone has to
like or dislike something (Fishbein & Ajzen, 1975). While the subjective norm refers to
the personal judgment about the acceptance of actor‟s behavior (Franzoi, 2003).
The evolution of TRA was the Technology acceptance model (TAM) that was
first introduced by Davis (1989). According to TAM the acceptance of information
technology depends on two factors: perceived usefulness (PU) and perceived ease of use
(PEOU). The perceived usefulness refers to the personal belief that the usage of the
information system (IS) enhances user‟s technical skill while the perceived ease of use
refers to the difficulty level of adoption. Hsu and Lu (2004) suggested that more
external variables can be added and adaptations of the model can occur in order to have
a better control of behavioral intentions.
Based on TRA Ajzen (1991) introduced another method the Theory of Planned
Behaviour (TPB). This model defines the behavioral intention using three variables the
behavior, the subjective norms and the perceived behavioral control.
You & Park (2010) suggested that TAM has quite an explicative power
However, TAM compared to TBP has been found to be more suitable for the acceptance

42
of information systems in the medical sector (Chau & Hu, 2002). Moreover, according
to Wu and Liu (2007) TRA may be more adequate for examining entertainment
technology such as online games, whereas TAM is not likely to be so effective. Hence,
these and other studies have concluded that the comparison among TAM, TRA and
TPB have not provide clear outcomes yet (Dishaw & Strong, 1999; Davis, Bagozzi, &
Warshaw, 1989).
Venkatesh et al. (2003) have gathered and examined various factors and IS
acceptance models in order to develop a unified model, the Unified Theory of
Acceptance and Use of Technology (UTAUT). UTAUT‟s four core constructs were
effort expectancy, performance expectancy, social influence and facilitating conditions.
However, only effort expectancy, performance expectancy, social influence are
determinants of behavioral intention. Performance expectancy refers to the degree to
which a user believes that using an information system will help him or her increase his
or her job performance. Effort expectancy refers to the usability of the information
system. Social influence refers to the degree that a user believes that he or she should
use a new information system because important others believe he or she should do that.
Guo and Barnes (2007) suggested that web-based transaction platforms have a lot in
common with these IS acceptance models. Based on UTAUT, Guo and Barnes (2007)
reconceptualized and expectancy, performance expectancy, social influence in order to
examine players‟ purchase behavior intention (PBI).
Lin and Sun (2007) depicted that the virtual worlds enterprises should find
another revenue stream apart from subscription fees, by selling virtual items. These
items can be aesthetic only or can be more practical in order to improve user‟s
experience. Online games according to Curtis (1992) are virtual worlds that allow
interaction among multiple players. Based on TAM, TPB, UTAUT and other
technology acceptance models, Guo & Barnes (2007) were the first who developed a
research model that defined the purchase behavior in virtual worlds. Guo and Barnes
(2009) expanded their initial theoretical framework by distinguishing the three basic
parts of the psychological process of shopping virtual items behavior: i) the motivators
for chasing virtual items, ii) the reasons behind the usage of trading them so as to obtain
other virtual items and iii) the factors that lead to purchase decision.

43
Yee (2007) examined players‟ motivations for buying virtual items, his
primary research target was to examine the players‟ motivations (advancement,
mechanics, relationship, competition, teamwork, customization, discovery, socializing,
escapism) for taking part in massively multiplayer online role-playing games
(MMORPGs). Guo and Barnes (2009) suggested that not all motivations for
participating in virtual words are relevant to virtual items purchase behavior. Although,
there are some common elements, only customization and advancement are important to
virtual items
Yee (2005) proposed that the main reasons that lead a player to seek more and
more advanced items in online games are the customization choices and the sense of
achievement. These two elements were also proposed by Oh and Ryu (2007) in their
research about the item-selling based payment model in Korean online games. Oh and
Ryu (2007) showed that satisfaction levels increase as players use functional and
decorative virtual items. Lin and Sun (2007) further clarified these two elements by
categorizing virtual items in two categories: functional and decorative in their research
about free-to-play multiplayer online game worlds.
Studies related to the acceptance of IS (Van der Heijden, 2004; Dahlberg, et
al., 2003, Lee, et al., 2006; Moon & Kim, 2001) suggested the perceived enjoyment for
examining users‟ IS adoption behavior. Guo & Barnes (2009) underlined the
importance of functional and decorative attributes along with the perceived enjoyment
but they added that there should be a link between the enjoyment of using virtual items
and the participation of the players. Players must be urged to use virtual items in order
to achieve their in-game goals. If players get used to combine an enjoyable gaming
experience with the usage of virtual items so as to attain their goals, probabilities for
purchasing virtual items are increasing.
Although, virtual items must be essential for players in order to succeed in
completing in-game tasks, their usage should not be disruptive for players‟ efforts.
Players should base their chances to achieve their in-game goals on their skills and not
only at virtual items acquisition. Heijden (2004) proposed that IS acceptance models
can offer instrumental or hedonic value. Attributes of Utilitarian Systems have
instrumental value if they can provide information to the user so as to attain his goals,
whilst IS have hedonic value if they offer enjoyment to the user by their own. Existing

44
research has shown that the focus has been on the utilitarian aspect of IS (Legris et al.,
2003; Van der Heijden, 2004). Especially, for online games Guo and Barnes (2009) also
distinguished the difference between these two values (hedonic and instrumental) and
they emphasized on the importance of the instrumental attribute. According to their
point of view, virtual items should be considered as tools that can offer enjoyment
through participation and appropriate use and not as pleasure itself.
According to the theory of consumption values of Sheth, Newman and Gross
(1991), there are five consumption values: functional, emotional, social, epistemic and
conditional. Functional values refer to the functions of products. Emotional values refer
to product characteristics that can trigger consumer‟s feelings. Social values refer to
product characteristics that connect consumer with a brand. Epistemic values refer to
product characteristics that increase consumer‟s curiosity. Conditional values refer to
situational factors that induce purchase behavior. Many previous studies related to
marketing, online products and e-commerce have shown that the five consumption
values have an influence on PBI (Ho & Wu, 2012). However, in online games the
following three consumption values are proven to affect the PBI: the functional, the
emotional and the social value (Ho & Wu, 2012).
Social value derives from the social stratification of online game societies.
Martineau (1958) showed that the shopping behavior is influenced by the social status.
In online games the perceived social status is related to the acquisition of virtual items.
Lehdonvirta (2009) proposed the social quality that virtual items may carry, as a factor
that triggers the PBI. The social quality for every virtual item is related to its rarity ,
whilst the emotional quality refers to the customization options and the functional
quality to the performance. In online persistent world games, as players want to move
up the social class ladder, the social mobility should be connected with the usage of
virtual items. By using virtual items and achieving their goals, players gain reputation
and change their social status. The construct, Prestige, captures the influence that virtual
items have on players‟ desire for recognition by obtaining more advanced virtual items
(Lehdonvirta, 2009).
Castranova (2001) examined the virtual world Norrath and showed that users
use virtual items in virtual worlds in order to gain reputation and increase their
competence. He also noted that users spend a lot of money in order to make such
45
progress. In online persistent world games, players also spend a lot of money in order to
become powerful and prestigious. The more money players spend on a specific game,
the more they are locked in that game. This occurs because the switching costs are high.
If players have already spent their money on one game, it is unlikely that they choose
another game and start making progress from scratch. It is more likely that they keep
spending their money on purchasing virtual items for the game they already play in
order to maintain their status or further advancement (Guo and Barnes, 2012).
So far we have examined the factors that affect players‟ PBI that are mostly
related to game mechanics and players‟ preferences. However, players‟ purchase
options are not only depended on these factors. According to Transaction Cost
Economics (TCE), transactions are also based on economic efficiency. Williamson
(1981) suggested that consumers‟ choices about transactions are based on rationality
and opportunism at some extent. Based on these attributes, previous studies related to e-
shopping drivers (Foucault and Scheufelem, 2002; Cheung and Liao, 2001) proposed
the transactional cost and the price as constructs in PBI model. They have shown that
both constructs have a negative effect on PBI. We have to note that the concept of the
transaction becomes more complex in online business and especially in virtual worlds
sectors. Users in virtual worlds and players in online games can use non-purchase
channels in order to acquire virtual items. Thus, the value of the virtual items have two
dimensions: i) the time and the effort required to obtain them and ii) the price that they
are valued at trading platforms or virtual stores (Guo & Barnes, 2009). Chen and
Dubinsky (2009) examined these attributes and they developed a more abstract
construct, the perceived value so as to depict the dependencies of the value of the items
in e-commerce. In real world, the perceived value describes the difference between the
perceived utility of the item and the perceived effort that is required in order to obtain it
(Zeithaml, 1988). Particularly for virtual worlds, Guo and Barnes (2012) redefined the
framework of the perceived value of virtual items. They suggested that the valuation of
virtual items has different (monetary or non-monetary) weights for each player. As a
result, the perceived value of virtual items depicts the players‟ cost benefit valuation
regarding the use of virtual stores.
Previous studies (Davis, Bagozzi, and Warshaw, 1992; Venkatesh et al., 2003)
noted the importance of the perceived value as a variable of the online-based PBI. Apart
from perceived value they also proposed performance expectancy, effort expectancy

46
and social influence as variables in IS acceptance models. Guo and Barnes (2009) found
that social factor is not significant while performance expectancy and effort expectancy
are significant. Guo and Barnes (2012) expanded their research in a pure game centric
concept and found the same results.
47
Methodology
Case Study method
In our research we use the case study method in order to examine the revenue
streams and the results of video games business models. Generally, this method is an
iterative process based on collecting data from multiple sources about specific situations
(Easton, 2010; Flyvbjerg, 2006). Random data or representative situations may not be
the most suitable strategy because it is unlikely that contains the amount of information
we need.
On the other hand, extreme cases may contain more valuable information than
representative situations because they include more basic clues and more actors.
Moreover, we want to investigate the deeper causes and the effects of a problem.
Random data or a great amount of representative occasions rarely produce such insight.
Thus, we should pick few cases based on their validity (Flyvbjerg, 2006). According to
Gibbert and Ruigrok (2010) these case studies can offer researcher the opportunity to
study situations and gather information that otherwise it would be beyond his/her ability
to attain. This information is not just raw data, it reveals relationships between different
elements and patterns of the studied subject (Bickmand & Rog, 1998; Eisenhardt &
Graebner, 2007). As a result, case study method provides a context-dependent
knowledge without limiting the researcher on theoretical assumptions (Flyvbjerg, 2006).
Although the case study method enables the researcher to clarify the factors
that affect a specific construct, it has its own drawbacks. First of all, case studies data
consists of individual studied events. The selection of this data can be biased and the
outcomes can proven to be quite subjective (Bennett & George, 2005). Moreover, while
quantitative methods can be used for generalization, case studies are not considered
reliable enough (Gummesson, 2006). In case studies we usually include narrative
elements. Consequently, we might be able to put these narratives into a scientific
formulae (Benhabib, 1990; Mitchell & Charmaz, 1996; Roth, 1989; Rouse, 1990;
White, 1990 (as cited in (Flyvbjerg, 2006)).

48
All in all, the use of the case study method is most appropriate when we try to
explain the means and the causes of a process, as well as theory omissions. It is worth to
note that the experience of the actors and the exploratory nature of the research are of
vital importance to have concrete and sufficient results (Baratt, Choi, & Li, 2011).
Therefore, we decide to use this method to examine the factors, the process and the
functions of the video games business models.
Online Survey
In order to investigate the factors that have a significant impact on players‟
intention to buy virtual items we opt to conduct an online survey. The online survey
method has the advantages of being global, flexible, convenient, low-cost and timeless
(Evans & Mathur, 2005) Moreover, online surveys enable the researcher to access unique
populations that otherwise would not be possible to approach (Garton, Haythornthwaite,
& Wellman, 1999; Wellman, 1997 (as cited in Wright, 2005)). Thus, it is a suitable kind
of survey for a niche market such as videogames. Online surveys also decrease the time
needed for data collection from these spatially disperse respondent groups (Fricker &
Schonlau, 2002). The geographical distance between the interviewer and the respondent
is desirable to eradicate interviewer bias and other possible problems. Specially, online
surveys considered less personal than telephone surveys or other conventional surveys
such as face to face (Duffy, Smith, Terhanian, & Bremer, 2005).
However, the impersonal nature of the online surveys can trigger security
suspicions about data transmissions and data usage by the interviewer (Evans & Mathur,
2005). Moreover, the distance between the interviewer and the respondents may cause
problems, if the questions are not clear because no guidance can be provided (Ray &
Tabor, 2003). This also can happen, if the respondents lack online experience.
Nonetheless, when it comes to videogames industry most players have the online
experience required to answer an online questionnaire. Another problem that we must
keep in mind is that the generating sample can be misleading if we have multiple
answers from single users. So, it is of vital importance for the validity of the sample to
reassure the uniqueness of answers (Wright, 2005).

49
Timelessness, flexibility and anonymity are the elements that we think as the
most important for our research. So, we conclude to follow this approach to gather the
information from gamers around the globe.
PLS-SEM method
In order to analyze the data from our research we followed the PLS-SEMi
statistical method. The four pillars of a PLS-SEM multivariate analysis are: (1) the
constructs, (2) the indicators (manifest variables), (3) the relationships among them and
(4) the error terms. Specially, we can divide the analysis into two measurement types:
(a) the exogenous latent variables (the constructs that define other constructs) and (b)
the endogenous latent variables (constructs that are being clarified). The error terms
express the variance when the structural models are estimated. However, not all
variables are connected to error terms. Exogenous latent variables do not contain error
terms whilst endogenous latent variables are connected to them (Hair et al., 2013).
The PLS-SEM method is a second-generation technique, proper for our
exploratory research in contrast to Covariance-based SEM (CB-SEM). The PLS-SEM
path modeling target is to clarify the relationships among the constructs whereas CB-
SEM is theory testing confirmation. Moreover, when it comes to data, we should have
normal distributions when we follow a CB-SEM method while PLS-SEM can handle
non-normal data (Hair, Ringle, & Sarstedt, 2011). Another major advantage of PLS-
SEM method over CB-SEM is that it provides statistical power and precision even with
small sample sizes (Cassel, Hackl, & Westlund, 1999). However, if we have larger
sample populations (N > = 250) CB-SEM and PLS-SEM outcomes are equivalent (Hair
et al., 2013).
However, the PLS-SEM approach does not come without its disadvantages.
The problems of this approach are the limitations that can be imposed if the researcher
uses categorical data. Moreover, the PLS-SEM path modeling is not appropriate if the
error terms demand supplementary specification like covariation (Hair et al., 2011).
Taking into account that the goal of this research is an exploratory view on the
factors that have an influence on players‟ intention to buy virtual items. Thus, we
conclude the degree of importance of each latent variable in the model.

50

51
The Research model
The theoretical framework that was previously discussed and survey items of
Lehdonvirta (2009), Guo and Barnes (2012), Ho and Wu (2012) along with the trends6
of the video games industry led us to the development of the research model. We
developed this model (Figure 9) in order to examine the factors that have an influence
on players‟ intention to buy virtual items. More specifically, we explored indicators
from an IS (Information System) perspective as well as from a game centric approach.
Figure 9 - The Research model
We examined IS factors related to players‟ purchase behavior. We chose
Performance Expectancy (PE), Effort Expectancy (EE) and Perceived Value (PV)
because we wanted to examine which factors of virtual stores have an influence on
players‟ intention to buy virtual items. Performance Expectancy (PE) and Effort
Expectancy (EE) play a significant role in virtual world purchase behavior (Guo &
Barnes, 2012). Guo & Barnes (2012) suggested that the use of virtual stores can be
6 i) Social networking features
ii) In-game monetization channels iii) Cloud capabilities

52
considered as an acceptance of an IS. Thus, we used them to examine players‟intention
to buy virtual items. In order to examine the value of virtual stores‟ available virtual
items we used the perceived value (PV). Guo & Barnes (2012) used Perceived Value
(PV) in order to examine the value of available items in virtual stores taking into
account the effort of finding them in non-monatery channels. Moreover we examined
game factors related to players‟ purchase behavior According to theoretical background
Customization Options (CO), Functionality (FU), Prestige (PRE), Participation (PON)
and Perceived Enjoyment (PE) are significant to players‟ intention to buy virtual items
in virtual worlds and online games. We chose Customization Options (CO),
Functionality (FU), Prestige (PRE), Participation (PON) and Perceived Enjoyment (PE)
because we wanted to examine the influence of decorative choices, in-game effective
items, social status and participation in gaming groups on players‟ purchase behavioral
intention. We also examined Perceived Enjoyment (PE) because we wanted to examine
the effect of perceived enjoyment that players gain from playing the game and using
virtual items effectively on players‟ intention to buy virtual items.
Performance expectancy (PE)
Performance expectancy refers to the degree that a player will choose to buy
desired virtual items instead of trying to obtain them through non-monetary channels.
Performance expectancy is high if a player reckons that using a virtual store would help
him/her to acquire the virtual item he/she wants (Venkatesh et al., 2003; Guo & Barnes,
2012).
H1: Performance expectancy will have a positive effect on the Intention to buy
virtual items
Effort expectancy (EE)
Effort expectancy refers to the relation between the ease of use of the virtual
store and the PBI. An appropriate virtual store should have an effective user interface
design as well as search and comparison options. If players can easily find and compare

53
virtual items, it is more likely that virtual items sales will increase (Venkatesh et al.,
2003; Guo& Barnes, 2012).
H2: Effort expectancy will have a positive effect on the Intention to buy virtual
items
Perceived Value (PV)
Perceived Value refers to the perception of the value of the virtual item that is
offered in a virtual store in comparison to the resources required (time, energy, other
virtual items or money) in order to obtain it. The Perceived Value is a result of the
players‟ cost-benefit analysis for desired virtual items. If a virtual item has a high
perceived value, it is probable that players will purchase it (Chen & Dubinsky, 2009;
Guo & Barnes 2012).
H3: Perceived Value will have a positive effect on the Intention to buy virtual
items
Customization options (CO)
Customization options refer to players‟ desire for aesthetics changes. Players
can buy virtual items and modify parts of the game according to their taste. Through
these aesthetic changes, a player can express himself/herself and make other players
notice him/her (Lehdonvirta, 2009; Guo & Barnes, 2009; Kim, Gupta, & Koh, 2011;
Ho & Wu, 2012).
H4: Customization options will have a positive effect on the Intention to buy
virtual items
Functionality (FU)
Functionality refers to the functional quality of the virtual items and it is the
most controversial value. Many players, who lack in time or skill, use functional virtual

54
items in order to improve their performance. If players do not use functional virtual
items, they will not be able to overcome in-game difficulties (Lin & Sun, 2007;
Lehdonvirta, 2009; Guo & Barnes, 2009; Kim et al., 2011; Ho & Wu, 2012).
H5: Functionality will have a positive effect on the Intention to buy virtual
items
Participation (PON)
Participation (PON) can be defined as the social factors that lead a player to
buy virtual items. Participation refers to the player who will purchase virtual items that
will help him/her become a part of a group or maintain his/her place in an existing one
(Hsu & Lu, 2004; Kim & Park, 2006; Okazaki, Skapa, & Grande, 2007; Lin & Sun,
2007; Guo & Barnes, 2009; Lehdonvirta, 2009; Ho & Wu, 2012, Kim et al., 2013).
H6: Participation will have a positive effect on the Intention to buy virtual
items
Prestige (PRE)
Prestige is related to the players‟ desire to outstand and show off his/her social
status compared to other players. As players obtain more advanced virtual items and
progress, they not only gain a functional advantage but they also climb higher up the
social ladder of the virtual game community (Lin & Sun, 2007; Guo & Barnes, 2009;
Lehdonvirta, 2009; Ho & Wu, 2012).
H7: Prestige will have a positive effect on the Intention to buy virtual items
Perceived enjoyment (PE)
The Perceived enjoyment refers to the perception of enjoyment that players
gain from playing the game and using virtual items effectively. The perceived
enjoyment of playing and using virtual items boosts the sales of virtual items (Moon &
Kim, 2001; Dahlberg, Mallet & Oorni, 2003; Van der Heijden, 2004; Lee, Cheung, Sia, and
Lim, 2006; Guo & Barnes, 2009).
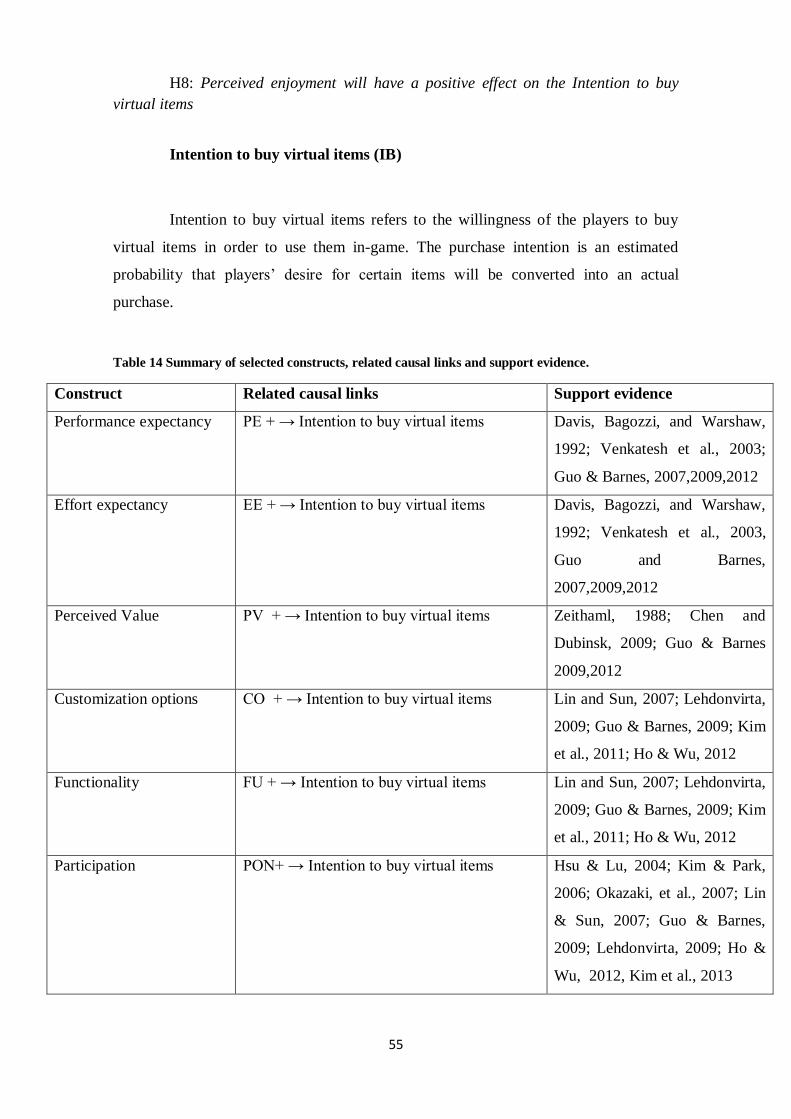
55
H8: Perceived enjoyment will have a positive effect on the Intention to buy
virtual items
Intention to buy virtual items (IB)
Intention to buy virtual items refers to the willingness of the players to buy
virtual items in order to use them in-game. The purchase intention is an estimated
probability that players‟ desire for certain items will be converted into an actual
purchase.
Table 14 Summary of selected constructs, related causal links and support evidence.
Construct Related causal links Support evidence
Performance expectancy PE + → Intention to buy virtual items
Davis, Bagozzi, and Warshaw,
1992; Venkatesh et al., 2003;
Guo & Barnes, 2007,2009,2012
Effort expectancy EE + → Intention to buy virtual items
Davis, Bagozzi, and Warshaw,
1992; Venkatesh et al., 2003,
Guo and Barnes,
2007,2009,2012
Perceived Value PV + → Intention to buy virtual items
Zeithaml, 1988; Chen and
Dubinsk, 2009; Guo & Barnes
2009,2012
Customization options CO + → Intention to buy virtual items
Lin and Sun, 2007; Lehdonvirta,
2009; Guo & Barnes, 2009; Kim
et al., 2011; Ho & Wu, 2012
Functionality FU + → Intention to buy virtual items Lin and Sun, 2007; Lehdonvirta,
2009; Guo & Barnes, 2009; Kim
et al., 2011; Ho & Wu, 2012
Participation
PON+ → Intention to buy virtual items Hsu & Lu, 2004; Kim & Park,
2006; Okazaki, et al., 2007; Lin
& Sun, 2007; Guo & Barnes,
2009; Lehdonvirta, 2009; Ho &
Wu, 2012, Kim et al., 2013

56
Prestige PRE + → Intention to buy virtual items
Lin & Sun, 2007; Guo &
Barnes, 2009; Lehdonvirta,
2009; Ho & Wu, 2012
Perceived enjoyment
PE + → Intention to buy virtual items
Moon & Kim, 2001; Dahlberg,
Mallet & Oorni, 2003; Van der
Heijden, 2004; Lee et al., 2006;
Guo & Barnes, 2009

57

58
Data Analysis and Interpretation of Results
We used partial least-squares (PLS) analysis to measure the results of the
structural model. Our sample exceeds the minimum recommended value, which is
defined by the larger of the two following guidelines: (a) 10 times larger than the
number of items for the most complex construct; (b) 10 times the largest number of
independent variables impacting a dependent variable (Chin, 1998). The most complex
construct of our model has four items, therefore the minimum value is 40, which is
much lower than our sample of 108 individuals.
Regarding the reliability and validity of the measurement model we assessed
the internal consistency, convergent validity and discriminant validity (Barclay,
Higgins, & Thompson, 1995; Wixon& Watson, 2001). Specifically, we measured: (1)
The items‟ factor loadings on the corresponded constructs. Regarding factor loadings, a
value higher than 0.7 is acceptable. (2) The AVE (Average Variance Extracted). AVE
should be higher than 0.5 and the AVE‟s squared root of each variable should be larger
than any correlation with every other variable (Barclay et al., 1995; Chin, 1998; Fornell
& Larcker, 1981). (3) The composite reliability which should be larger than 0.7
(Agarwal & Karahanna, 2000; Compeau, Higgins, & Huff, 1999).
The structural model and hypotheses are estimated by two criteria: (1) the
value of the variance measured for (R2) by the antecedent constructs. Cohen (1988)
proposed 0.2, 0.13 and 0.26 as small, medium and large variance respectively; (2) the t-
values regarding path coefficients and total effects measured by using bootstrapping
procedure.
The analysis regarding the measurement and structural model was conducted
with the SmartPLS 2.0 (Ringle, Wende, & Will, 2005)

59
Measurement Model
This subsection displays the data analysis‟ results regarding the measurement
model. Table 15 shows that all the factor loadings of the items exceed the required
value. Furthermore, the values of the composite reliability, the Cronbach α and the
average variance extracted regarding each variable are larger than the adequate values.
In addition, Table 16 demonstrates the correlations among the variables and the AVEs
which are the diagonal elements in bold. All the AVEs are higher than any other
correlation; therefore the discriminant validity of the measurement model is verified.
Table 15 Results for the Measurement Model
Construct Items Mean Standard
Deviation
Factor
Loading
(>0.7)a
Cronbach a
(>0.7) a
Composite
Reliability
(>0.7) a
Average
variance
extracted
(>0.5) a
Performance expectancy 2.83 1.02 0.94 0.96 0.89
PE1 0.95
PE2 0.94
PE3 0.93
Effort Expectancy 2.40 0.96 0.82 0.89 0.74
EE1 0.83
EE2 0.85
EE3 0.89
Perceived Value 3.4 0.82 0.77 0.86 0.69
PV1 0.83
PV2 0.88
PV3 0.77
Customization Options 3.8 1.2 0.88 0.92 0.74
CO1 0.91
CO2 0.92
CO3 0.78
Functionality 2.48 0.86 0.91 0.94 0.85
FU1 0.88
FU2 0.94
FU3 0.94
Participation 2.67 0.69 0.83 0.89 0.66
PON1 0.74
PON2 0.83
PON3 0.85
PON4 0.83
Prestige 2.94 0.74 0.84 0.88 0.71
PRE1 0.82
PRE2 0.89
PRE3 0.87
Perceived Enjoyment 3.94 0.84 0.89 0.90 0.73
PE1 0.85
PE2 0.90
PE3 0.91

60
Intention to Buy Virtual
Items
2.58 1.06 0.94 0.96 0.89
IB 1 0.94
IB 2 0.96
IB 3 0.94
a Indicates an acceptable level of reliability and validity.
Table 16 Discriminant validity for the measurement model
Discriminant validity for the measurement model
Construct PE EE PV FU CO PON PRE PE IB
PE 0.95
EE 0.58 0.86
PV 0.27 0.26 0.83
FU 0.30 0.26 0.43 0.86
CO 0.61 0.55 0.23 0.31 0.92
PON 0.67 0.52 0.23 0.36 0.54 0.82
PRE 0.44 0.55 0.52 0.62 0.55 0.48 0.84
PE 0.48 0.41 0.33 0.28 0.32 0.55 0.52 0.85
IB 0.73 0.58 0.22 0.28 0.62 0.67 0.60 0.55 0.95
Bold values: the square root of the average variance extracted (AVE) of each construct.
Structural Model
The Structural model was examined through the statistical significance of path
coefficients, total effects and R2 values. T-values regarding path coefficients and total
effects were measured through a bootstrap procedure with 1000 resamples. Table 17
and figure 10 summarize the results regarding the hypotheses.
Table 17 Hypothesis testing results
Hypothesis testing results
Hypothesis Path Path coefficient t value Results
H1 PE-> IB 0.38** 7.68 support
H2 EE-> IB 0.26** 6.83 support

61
H3 PV-> IB 0.23** 3.09 support
H4 CO-> IB 0.53** 13.8 support
H5 FU -> IB 0.29** 6.83 support
H6 PON -> IB 0.11* 0.75 Marginally support
H7 PRE -> IB 0.18** 3.55 Support
H8 PE -> IB 0.17* 1.83 Marginally support
* p<0.1, **p < 0.01.
Figure 10 Path coefficients of the research model

62
Results
The R2
= 61% is an indicator which shows how “successful” is our regression.
It specific means how effective is the explanation of independent variables on the
dependent variables. In our case we have panel data which means we are satisfied if the
R2
is above 30%.
Intention to buy virtual items was influenced positive by Performance
Expectancy (0.38) and it is high statistically significant (t=3.55>𝑡𝑐=2,6).
Intention to buy virtual items was influenced positive by Effort Expectancy
(0.26) and it is high statistically significant (t=6.83>𝑡𝑐=2.6).
Intention to buy virtual items was influenced positive by Perceived Value
(0.23) and it is high statistically significant (t=3.09>𝑡𝑐=2.6).
Intention to buy virtual items was influenced positive by Customization options
(0.53) and it is high statistically significant (t=13.8>𝑡𝑐=2.6).
Intention to buy virtual items was influenced positive by Functionality (0.29)
and it is high statistically significant (t=6.83>𝑡𝑐=2.6).
Intention to buy virtual items was influenced positive by Prestige (0.18) and it
is high statistically significant (t=3.55>𝑡𝑐=2.6).
Intention to buy virtual items was influenced positive by Participation (0.11)
and it is marginal statistically significant because the confidence interval is 90%.
Intention to buy virtual items was influenced positive by Perceived Enjoyment
(0.17) and it is marginal statistically significant because the confidence interval is 90%.

63
Thus, PE (0,38), EE (0,26), PV (0,23), CO (0,53), FU (0,29), PRE (0,18) are
the most important constructs of our model. We have to note that the IS –centric
construct Performance Expectancy (PE) (0,38) and the Game-centric construct
Customization options (CO) (0,53) have the strongest effect on players‟ purchase
behavior. Additionally, the Game-centric construct Prestige (PRE) (0,18) and the IS –
centric construct Perceived Value (PV) (0,23) have the lowest impact. While,
customization options (CO) (0,53) has the strongest effect and Prestige (PRE) (0,18) the
lowest impact on players‟ purchase behavior.
According, to our survey items, players are more likely to spend their money
on aesthetics and in-game effective virtual items, rather than on virtual items that are
pertinent to their relationships with other players. Moreover, in contrast to Game-centric
constructs, all IS-centric constructs have a strong influence on players‟ purchase
intentions. Game mechanics should adapt to and emphasize on promoting in-game
virtual items that offer the player customization options and in-game effectiveness.
Virtual stores should help player to find his/her desired virtual items and search process
should be easy. Moreover, virtual stores should offer virtual items with high perceived
value.
Last but not least, we have to underline the limitations of our model. This
model does not include any indirect effects that may exist. We do not take into account
other possible virtual item drivers such as cultural references or provenance
(Lehdonvirta, 2009) because we focus more on Game-centric and IS-centric constructs.
We do not examine the habit as a possible virtual item driver because habit has an effect
on the actual purchase behavior and not on intention (Guo & Barnes 2009). We do not
take into account constructs related to intention to play online games such as flow or
critical mass (Hsu and Lu, 2004). We do not include Price Utility (PU) because Price
Utility refers only to monetary value of virtual items. We prefer Perceived Value to
Price Utility because Perceived Value includes both monetary and non monetary value
of the virtual items available at virtual stores. Moreover, this is a generic model, without
having any possible modifiers such as game type (Ho & Wu, 2012).
64
Implications
Previous studies (Guo and Barnes, 2012) also found that Performance
Expectancy (PE), Effort Expectancy (EE), Customization Options (CO), Prestige
(PRE), Perceived Enjoyment (PE) and Perceived Value (PV) have a positive effect.
However, Guo and Barnes (2012) found that Participation (PON) does not affect
positively players‟ purchase behavior. Ho and Wu (2012) found that indeed,
Participation (PON) affects players‟ intention to buy virtual items. Ho and Wu (2012)
also found that Customization Options (CO) and Prestige (PRE) affect positively
players‟ purchase behavior. On the other hand, we have different results with Ho and
Wu (2012) because Ho and Wu (2012) found that Functionality (FU) does not affect
positively players‟ purchase behavior.
Moreover, Guo and Barnes (2012) found that Perceived Value (PV) has the
strongest effect on players‟ purchase behavior. On the other hand we found that
Perceived Value (PV) has the least strong impact on players‟ purchase behavior. Ho and
Wu (2012) found that Price Utility (PU) has the strongest effect. We agree with Guo
and Barnes (2012) and Ho and Wu (2012) that Prestige (PRE) has the least strong
impact on players‟ purchase behavior. We also have to note that both Guo and Barnes
(2012) and Ho and Wu (2012) found that Customization options (CO) has the second
most strong effect. In our research we found that Customization options (CO) has the
strongest effect on players‟ purchase behavior.
The results of our survey may be useful to video game companies that follow
business models that include virtual items transactions in their revenue streams and
third-party enterprises such as game-tournament organizers.
Video game companies that follow these business models and have their own
virtual store may take into account the strong effects of IS-centric constructs
(Performance Expectancy (PE), Effort Expectancy (EE), Perceived Value (PV) in order
to enhance their virtual stores‟ efficiency. Most players should find their desired virtual
items in virtual stores. Virtual stores should also have comparison tools and advanced
search capabilities in order to help players in their search. Moreover, virtual stores

65
should offer virtual items with high perceived value according to game audience
attributes. For example, a virtual store offers virtual items with high perceived value, if
the only other way players can obtain them is by waiting and most players do not have
time to wait. If video game enterprises have to focus on only one construct, they should
focus on Performance Expectancy (PE). As a result they should focus on helping
players find their desired virtual items in virtual stores.
Moreover, video game companies may take into account the effects of Game-
centric constructs (Customization Options (CO), Functionality (FU), Prestige (PRE)).
Our results may help them to set game design priorities. In order to create virtual items
with high selling value, video game companies should take into the most strong effects,
Customization Options (CO) and Functionality (FU). As a result, video game
companies should focus offering virtual items related to in-game effectiveness and
customization options. For example, a video game company can focus on offering
damage proof items, costumes or background themes. If video game enterprises have to
focus on only one construct, they should focus on Customization Options (CO). Hence,
they should focus on offering virtual items related to alternative aesthetic changes.
More specifically, video game companies that follow user generated content
model should promote more the creation of virtual items related to in-game
effectiveness and customization options. Players that take part in this business model
may also find our results useful in their trade with other players or the video game
company which holds the rights of the game.
What is more video game enterprises can offer virtual items related to Prestige
(PRE). Such virtual items may show off player‟s progress or status. For example, in
videogames betting models such virtual items are virtual special badges that depict
players‟ consecutive wins.
Video game enterprises that follow the crowdfunding model can use our results
in order to charge for early access to virtual items related to aesthetic changes, in-game
effectiveness and social recognition in order to get funded more quickly.
Our results can also be useful to video game companies that follow the
donationware model. Video game companies can offer virtual items that are game
effective and have social impact. For instance, players can donate some money and get

66
virtual medical health packs in exchange in order to help other players that face
difficulties during a virtual natural disaster. Charity organization can use some of
donations in order to have a real social impact.
Video game companies may also offer virtual items related, to Participation
(PON), if there are strong social bonds in the communities of a video game. For
example, such virtual items are special rings that allow player to communicate with
his/her gaming group but only if they hold the same type. However, we have to note
that Participation (PON) and Perceived Enjoyment (PE) require further research.
Even if the factors of players‟ purchase behavior change from time to time, it‟s
difficult to change game mechanics or business model aspects from one day to another
without affecting in-game balance. The success of adaptation lies in the balance
between the value for the players and the revenue for the video game companies.

67
Bibliography
Agrawal, A. K., Catalini, C., & Goldfarb, A. (2013). Some simple economics of crowdfunding in
innovation policy and the economy. National Bureau of Economic Research, Inc, 14, pp. 10-21.
Agarwal, R., & Karahanna, E. (2000). Time flies when you’re having fun:Cognitive absorption
and beliefs about information technology usage. MIS Quarterly, 24, pp. 665–694.
Ajzen, I., & Fishbein, M. (1975). In Belief, attitude, intention and behavior: an introduction to
theory and research. Reading: Addison-Wesley Publishing Company.
Ajzen, I., & Fishbein, M. (1980). Understanding attitudes and predicting social behavior.
Englewood Cliffs: Prentice-Hall.
Alexander, L., Bennett, G., & Bennett, A. (2005). In case studies and theory development in the
social sciences (pp. 19-20). Cambridge: The MIT Press.
Anderson, D. (2014). More than a game: brand and trademark use in video games and virtual
worlds. World Trademark Review, 47, pp. 67-71.
Bagga, A. (2011). Emerging Trends in Games-as-a-Service. Game Developers Conference Online,
(pp. 27-34). Austin.
Barclay, D., Higgins, C., & R., &. T. (1995). The partial least squares approach to causal
modelling: personal computer adoption and use as an illustration. Technology Studies, 2 (1),
pp. 285–309.
Barratt, M., Choi, T., & Li, M. (2011). Qualitative case studies in operations
management:Trends, research outcomes, and future research implications. Journal of
Operations Management, 29 (4), pp. 329–342.
Bennett, A., & George, A. L. (2005). Case studies and theory development in the social sciences.
Cambridge, MA and London, England: MIT Press.
Bickman, L., & Rog, D. (1998). Handbook of Applied Social Research Methods. SAGE
Publications.
Bishop, T. (2012). Bitcoin startup coinLab lands funding from Tim Draper and others, aims to
help monetize games. Retrieved 8 4, 2013, from geekwire.com:
http://www.geekwire.com/2012/bitcoin-startup-coinlab-lands-funding-tim-draper-monetize-
games/
Bourcier, L. (2012). Game In Progress New Business Models for the Videogame Industry.
Retrieved 2 2014, 5, from http://www.slideshare.net/LucBourcier1/game-in-progress-new-
business-models-for-the-videogame-industry-12278071

68
Boyd, G., & Lalla, V. (2009, 2 11). Emerging issues in in-game advertising. Retrieved 12 12,
2013, from gamasutra:
http://www.gamasutra.com/view/feature/3927/emerging_issues_in_ingame_.php
Bruno, J. (2013, 10 15). Games on Xbox One – Better with Xbox Live Compute 2013. Retrieved
12 12, 2013, from Xbox: http://news.xbox.com/2013/10/xbox-one-cloud
casinoclub.com. (n.d.). http://en.casinoclub.com/casino-games/slots-games/space-tale.aspx.
Retrieved 11 18, 2013, from casinoclub.com/: http://en.casinoclub.com/casino-games/slots-
games/space-tale.aspx
Cassel, C., Hackl, P., & Westlund, A. H. (1999). Robustness of partial least squares method for
estimating latent variable quality structures. Journal of Applies Statistics, 26 (4), pp. 435-446.
Castronova, E. (2001). Virtual worlds: A first-hand account of market and society on the
cyberian frontier. CESifo Working Paper Series, pp. 618.
Chau, P., & Hu, P. (2002). Examining a model of information technology acceptance by
individual professionals:An exploratory study. Journal of Management Information Systems, 18
(4), pp. 191–229.
Chen, Z., & Dubinsky, A. (2009). A conceptual model of perceived customer value in e-
commerce: A preliminary identifying attributes that drive purchase decisions. Electronic
Commerce Research, 9 (2), pp. 97-113.
Chilton, T. (2013). World of Warcraft would be 'in bad shape' without embracing the casual
revolution. (E. Gera, Interviewer) Retrieved 5 2, 2014, from
http://www.polygon.com/2013/8/23/4650246/world-of-warcraft-would-be-in-bad-shape-
without-embracing-the-casual
Chin, W. W. (1998). The partial least squares approach to structural equation Modeling. In G.
A. Marcoulides (Ed.). In W. W. Chin, Modern Business Research Methods (pp. 295–336). NJ:
Lawrence Erlbaum Associates.
Cohen, J. (1988). Statistical power analysis for the behavioural sciences (2nd ed.). Hillsdale,NJ:
Erlbaum.
Compeau, D., Higgins, C. A., & Huff, S. (1999). Social cognitive theory and individual reactions
to computing technology:A longitudinal study. MIS Quarterly, 23, pp. 145–158.
Coyier, C. (2009). 10 years of simutronics. Retrieved 4 2013, 12, from
http://chriscoyier.net/2009/10/29/10-years-of-simutronics/
Crandall, R. W., & Sidak, J. G. (2006). Video games serious business for America’s economy.
Entertainment Software Association Report, pp. 28-30.
Curtis, P. (1992). Mudding: Social phenomena in text-based virtual realities. Proceedings of
Directions and Implications of Advanced Computing. Xerox Corporation. Retrieved 6 2, 2014,
from http://w2.eff.org/Net_culture/MOO_MUD_IRC/curtis_mudding.

69
Dahlberg, T., Mallet, N., & Oorni, A. (2003). Trust enhanced technology acceptance model
Consumer acceptance of mobile payment solutions. Proceedings of the CIC roundtable, (pp. 4-
6). Helsinki.
Davie, M. (2012). Running F2P mobile games as a service. Casual Connect. Seattle.
Davis, F. (1989). Perceived usefulness, perceived ease of use, and user acceptance of
information technology. MIS Quarterly, 13 (3), pp. 319-340.
Davis, F., Bagozzi, R., & Warshaw, P. (1992). Extrinsic and intrinsic motivation to use computers
in the workplace. Journal of Applied Social Psychology, 22 (14), pp. 1111-1132.
Davis, F., Bagozzi, R., & Warshaw, P. (1989). User acceptance of computer technology:A
comparison of two theoretical models. Management Science, 35 (8), pp. 982–1003.
De Prato, G., Feijóo, C., Nepelski, D., Bogdanowic, M., & Simon, J. (2010). Born digital / grown
digital:Assessing the future competitiveness of the EU video games software industry.
Retrieved 5 4, 2013, from EU Joint Research Centre:
http://publications.jrc.ec.europa.eu/repository/bitstream/111111111/15272/1/reqno_jrc6071
1_jrc60711.pdf
decodeglobal.org. (2013, 9 5). From Game to Reality:Making access to clean water a true story.
Retrieved 12 5, 2013, from Decode Global: http://decodeglobal.org/2013/from-game-to-
reality-making-access-to-clean-water-a-true-story/
Di Gangi, P. M., & Wasko, M. (2009). The co-creation of value: exploring user engagement in
user-generated content websites. Sprouts: Working Papers on Information Systems, 9 (50), pp.
7.
Dishaw, M., & Strong, D. (1999). Extending the technology acceptance model with Task–
Technology Fit constructs. Information and Management, 36 (1), pp. 21.
Donahue, C., Kessissian, S., Gupta, V., Early, C., & Winters, D. (2012). Publisher perspective on
cloud gaming. Cloud Gaming USA 2012. San Francisco: Video Games Intelligence.
Dreunen, J. V. (2011). A business history of video games: Revenue models from 1980 to today.
The Game behind the Video Game (pp. 4-9). New Brunswick: Columbia Institute for Tele-
Information.
Duffy, B., Smith, K., Terhanian, G., & Bremer, J. (2005). Comparing data from online and face-
to-face surveys. International Journal of Market Research, 47 (6), pp. 615-639.
Dyack, D. (2013). Triple-A as it stands is unsustainable, says former Silicon Knights head.
Retrieved 8 15, 2013, from OXM: http://www.oxm.co.uk/59291/dennis-dyack-the-games-
industry-today-is-like-early-1920s-hollywood/
Easton, G. (2010). Critical realism in case study research. Industrial Marketing Management,
pp. (39), pp. 118–128.

70
Elwell, C. K., Murphy, M. M., & Seitzinger, M. V. (2013). Bitcoin:Questions, answers, and
analysis of legal issues. Retrieved 2 12, 2013, from fas:
http://www.fas.org/sgp/crs/misc/R43339.pdf
Eisenhardt, K., & Graebner, M. (2007). Theory building from cases:Opportunities and
challenges. Academy of Management Journal, 40 (1), pp. 25–32.
Epps, S. R., Muligan, M., & Hood, E. (2009, June 25). Eight models for monetizing digital
content. Retrieved 12 12, 2013, from forrester:
http://www.forrester.com/Eight+Models+For+Monetizing+Digital+Content/fulltext/-/E-
RES53811
Evans, J. R., & Mathur, A. (2005). The value of online surveys. Internet Research, 15 (2), pp. 195
- 219.
Farivar, C. (2012, 4 26). CoinLab gets $500,000 in VC for bitcoin-related gaming startup.
Retrieved 8 7, 2013, from arstechnica: http://arstechnica.com/business/2012/04/coinlab-gets-
500000-in-vc-for-bitcoin-related-gaming-startup/
Schonlau, M., & Fricker, R. D. (2002). Advantages and disadvantages of internet research
surveys:Evidence from the literature field methods. Field Methods, 14 (4), pp. 347-367.
Flyvbierg, B. (2006). Five misunderstandings about case study research. Qualitative Inquiry, 12
(2), pp.219-245. doi: 10.1177/1077800405284363.
Fornell, C., & Lacker, D. F. (1981). Evaluating structural equations models with unobservable
variables and measurement error. Journal of Marketing Research, 18 (1), pp. 39-50.
Foucault, B., & Scheufelem, D. (2002). Web versus campus store? Why students buy textbook
online. Journal of Consumer Marketing, 19 (5), pp. 409-423.
Franzoi, S. (2003). In Psychology:A discovery experience. New York: McGraw-Hill.
Fricker, R. D. Schonlau, M., & Schonlau, M., (2002). Advantages and disadvantages of internet
research surveys:Evidence from the literature field methods. Field Methods, 14 (4), pp. 347-
367.
Gazecki, M. (2012). "The Game Life-Cycle and Game Analytics: What metrics matter when?".
Casual Connect Europe 2012. Berlin: Honey Tracks:Game Analytics. Retrieved 8 2, 2014 from
http://casualconnect.org/lectures/business/the-game-life-cycle-and-game-analytics-what-
metrics-matter-when-mark-gazecki/.
Georgeson, D., Murphy, C. D., & Michaels, T. (2013, November 14). EQN Landmark Livestream:
November 13, 2013. Retrieved 11 15, 2013, from http://www.youtube.com/:
http://www.youtube.com/watch?v=xeTv5nnq9IY
Gibbert, M., & Ruigrok, W. (2010, 3 4). ‘The ‘‘what’’ and ‘‘how’’ of case study rigor: three
strategies based onpublished work. Organizational Research Methods, 13(4), pp. 710–737. doi:
10.1177/1094428109351319.

71
Grutzky, M. B., & Cederholm, A. (2010). The obstacles and opportunities for digital distribution
in the video game Industry, today and tomorrow. Stockholm, Sweden: KTH School of
Coumputer Science and Communication.
Gummesson, E. (2006). Qualitative research in management:Addressing complexity, context
and persona. Management Decision, 44 (2), pp. 167-179. doi:10.1108/00251740610650175.
Guo, Y., & Barnes, S. (2012). Explaining purchasing behavior within World of Warcraft. Journal
of Computer Information Systems, 52 (3), pp. 18-30.
Guo, Y., & Barnes, S. (2009). Virtual item purchase behavior in virtual worlds:An exploratory
investigation. Electronic Commerce Research, 9 (1-2), pp. 77-96 doi:10.1007/s10660-009-9032-
6.
Guo, Y., & Barnes, S. (2007). Why people buy virtual items in virtual worlds with real money.
The DATA BASE for Advances in Information Systems, 38 (4), pp. 69-76.
Hair, J. F., Hult, G. T., Ringle, C. M., & Sarstedt, M. (2013). A Primer on Partial Least Squares
Structural Equation Modeling (PLS-SEM). California: SAGE Publications.
Hair, J. F., Ringle, C. M., & Sarstedt, M. (2011). PLS-SEM: Indeed a silver bullet. The Journal of
Marketing Theory and Practice, 19 (2), pp. 139-151.
Hamari, J., & Lehdonvirta, V. (2010). Game design as marketing: How game mechanics create
demand for virtual goods. International Journal of Business Science & Applied Management, 5
(1), pp. 14-29.
Harris, J., & Hagan, H. (2012). In Gaming Law: Jurisdictional comparisons (pp. 18-26). London:
European Lawyer Reference Series.
Harris, N. (2012). Game Design & Business Models. Casual Connect, (pp. 5-17). Hamburg.
Retrieved 6 2, 2014, from http://www.slideshare.net/theheroengine/game-design-business-
models.
Heiden, J., & Nørholm, J. (2009). Playful Persuasion: The Rhetorical Potential of
Advergames. Nordican Review, 30 (2), pp. 53-68.
Hemer, J. (2011). A snapshot on crowdfunding, 2, Working Papers Firms and region,
pp. 9-15
Ho, C. H., & Wu, T. Y. (2012). Factors affecting intent to purchase virtual goods in online games.
International Journal of Electronic Business Management, 10 (3), pp. 204-212.
House, A. (2013). Sony E3 2013 Press Conference. Electronic Entertainment Expo. Los Angeles.
Retrieved 8 2, 2014, from http://www.youtube.com/watch?v=DmoZAPDV3ew.
Hsu, C. L., & Lu, H. P. (2004). Why do people play on-line games? An extended TAM with social
influences and flow experience. Information & Management, 41, pp. 853–856,
doi:10.1016/j.im.2003.08.014.

72
Hutchins, J. (2013). Blizzard: "World of Warcraft is not built to be free-to-play". (E. Makuch,
Interviewer) Retrieved 5 2, 2014, from http://www.gamespot.com/articles/blizzard-world-of-
warcraft-is-not-built-to-be-free-to-play/1100-6416076/
Karmali, L. (2013). Gran Turismo 6 includes microtransactions. Retrieved 2 12, 2013, from ign:
http://uk.ign.com/articles/2013/11/19/gran-turismo-6-includes-microtransactions
kickstarter.com. (2013). Torment: Tides of Numenera. Retrieved 12 12, 2013, from
kickstarter.com: http://www.kickstarter.com/projects/inxile/torment-tides-of-
numenera?ref=category
Kim, G., Choe, D., Lee, J., Park, S., Jun, S., & Jang, D. (2013). The Technology Acceptance Model
for Playing Console Game in Korea. IJCSNS International Journal of Computer Science and
Network Security, 13 (5), pp. 9-12.
Kim, H., Gupta, S., & Koh, J. (2011). Investigating the intention to purchase digital items in
social networking communities: A customer value perspective. Information & Management, 48
(6), pp. 228-234.
Koss, C. (2012). Bitcoin: CoinLab earns gamers In-game gold and developers real dollars,
coinLab announces game monetization service and successful fundraising. Seattle, USA:
CoinLab. Retrieved 5 2, 2014, from http://www.pr.com/press-release/408169.
Koster, R. (2011). It's All Games Now! How Games and Social Media are Converging. Game
Developers Conference. Retrieved 5 2, 2014, from http://www.gdcvault.com/play/1015142/It-
s-All-Games-Now, (pp. 20-50).
Kow, Y. M., & Nardi, B. (2010). Who owns the mods? first monday (online), 15 (5). Retrieved
12 12, 2013, from firstmonday: http://firstmonday.org/article/view/2971/2529
Kultima, A. (2009). Model for expanded game experiences. Futureplay '10 Proceedings of the
International Academic Conference on the Future of Game Design and Technology (pp. 66-73).
New York: University of Tampere. doi:10.1145/1920778.1920788.
Langlotz A. C. H., Rhode M., Whaley C. (2008). Video games industry overview an
analysis of the current market and future growth trends Retrieved 12 12, 2013, from holgerlanglotz:http://holgerlanglotz.de/downloads/BU4510_VideoGamesIndustry_LanglotzEtAl.pdf
Lee, M., Cheung, C., Sia, C., & Lim, K. (2006). How positive informational social influence affects
consumers’ decision of Internet shopping? Proceedings of the 39th Hawaii International
Conference on System Sciences, 6, pp.115a doi:10.1109/HICSS.2006.204.
Legris, P. J., Ingham, A., & Collerette, P. (2003). Why do people use information technology? A
critical review of the technology acceptance model. Information & Management, 40 (3), pp.
191-204.
Lehdonvirta, V. (2009). Virtual item sales as a revenue model:Identifying attributes that drive
purchase decisions. Electronic Commerce Research, 9 (1/2), pp. 97-113.

73
Levin, W. (2009). The gamerblog: bringit.com bets big on video game gambling. (J. Robinson,
Interviewer) Retrieved 5 2, 2014, from http://sports.espn.go.com/espnmag/story?id=3725594
Lewis. B. (2006). Measuring player perceptions of advertising in online games
(Master‟s thesis). Retrieved 12 12, 2013 from http://etd.lsu.edu/docs/available/etd-
11162006-101838/
Liao, Z., & Cheung, M. (2001). Internet-based e-shopping and consumer attitudes: An empirical
study. Information and Management, 38 (5), pp. 299-306.
Lin, H., & Sun, C. T. (2007). Cash trade within the magic circle: Free-to-play game challenges
and massively multiplayer online game player responses. Proceedings of DiGRA 2007, (pp. 335-
343).
Lovell, N. (2010). How to Publish a Game. San Fransisco: GAMESbrief,TIGA.
MacDonald, K. (2013). Square-Enix reveals sales expectations for tomb raider. Retrieved 12 12,
2013, from IGN: http://uk.ign.com/articles/2013/04/09/square-enix-reveals-sales-
expectations-for-tomb-raide
Martineau, P. (1958). Social class and spending behavior. Journal of Marketing, 23 (2), pp. 121-
130.
Mehdi, Q., D., A., Elmaghraby, A., & Ch'ng, E. (2009). Proceedings of CGAMES'2009 USA. 14th
International Conference on Computer Games: AI, Animation, Mobile, Interactive Multimedia,
Educational and Serious Games (pp. 68-76). Louisville,Kentucky: University of Wolverhampton,
School of Computing and Information Technology.
Matulef, J. (2013,). GT6 glitch gives you 20 million credits in three minutes. Retrieved 12 26,
2013, from eurogamer: http://www.eurogamer.net/articles/2013-12-11-gt6-glitch-gives-you-
20-million-credits-in-three-minutes
Miller, R. (2006). The Burger King Achievements. Retrieved 12 12, 2013, from joystiq:
http://www.joystiq.com/2006/10/09/the-burger-king-achievements/
Moon, J.-W., & Kim, Y.-G. (2001). Extending the TAM for the World-Wide-Web context.
Information and Management, 38 (4), pp. 217-230. doi:0.1016/S0378-7206(00)00061-6
Moore, G. A. (2001). High-tech marketing illusion. In Crossing the Chasm: Marketing and
Selling Disruptive Products to Mainstream Customers (pp. 7-19). New York: PerfectBound.
Nair, H. (2007). Intertemporal Price Discrimination with Forward-Looking Consumers:
Application to the US Market for Console Video-Games. Quantitative Marketing and
Economics, 5 (3), pp. 239-292.
Newell, G. (2013). Newell: Big companies won't stay relevant. (R. Crossley, Interviewer)
Retrieved 5 2, 2014, from http://www.computerandvideogames.com/386224/newell-big-
companies-wont-stay-relevant/
Newzoo. (2013). Placing Mobile Games in Perspective of the Total Games Market: Free Mobile
Trend Report. Newzoo.

74
Nojima, M. (2007). Pricing models and motivations for MMO play. In proceedings of DiGRA (pp.
672-680). Tokyo: Seikei University.
Oh, G., & Ryu, T. (2007). Game Design on Item-selling Based Payment Model in Korean Online
Games. Proceedings of DiGRA 2007, (pp. 650-657). Tokyo.
Ojala, A. Comparison of different revenue models in SaaS. In E.Prakash (Ed.). Proceedings of
5th Computer Games, Multimedia & AlliedTechnology Conference (CGAT 2012) (pp. 120-123).
Singapore: GSTF.
Ojala, A., & Tyrväinen, P. (2011). Value networks in cloud computing. Journal of Business
Strategy, 32 (6), pp. 40-49 doi:10.1108/02756661111180122.
Okazaki, S., Skapa, R., & Grande, I. (2007). Global youth and mobile games: Applying
the extended technology acceptance model in the U.S.A., Japan, Spain and Czech
Republic. Cross-Cultural Buyer Behavior Advances in international marketing, 18, pp.
253-270 doi:10.1016/S1474-7979(06)18011-4.
Perry, D., & DeMaria, R. (2009). Dave Perry on Game Design: A Brainstorming Toolbox. Boston:
Course Technology.
Ray, M. N., & Tabor, S. W. (2003). Cybersurveys come of age: smart marketers are overcoming
the challenges of online research. Marketing Research, 15 (1), pp. 32-37.
Ringle, C. M., Wende, S., & Will, A. (2005). SmartPLS 2.0 (beta). University of Hamburg.
Germany. Retrieved from http://www.smartpls.de
Rogers, P. (2011). Building Community with PlayStation®. Network. Develop in Brighton.
Brighton: Sony Computer Entertainment Europe Research & Development.
Sullivan, E. (2011). Subscription Billing For Dummies Aria Special Edition (pp. 22-24).
Indianapolis: John Wiley & Sons, Inc.
Searle, N. (2011). In Changing Business Models in the Creative Industries: The cases of
television, computer games and music (pp. 11-27). Cardiff, United Kingdom: Intellectual
Property Office.
Shea, R., Jiangchuan, L., Ngai, E. C., & Yong, C. (2013). Cloud Gaming: Architecture and
performance. IEEE Network, 27 (4), pp. 16-21. doi:10.1109/mnet.2013.6574660.
Sheth, J., Newman, B., & Gross, B. (1991). Consumption values and market choice. OH: South-
Western Publishing.
sonyentertainmentnetwork.com. (2013). Gran Turismo®6 Price list of In-game Credits.
Retrieved 12 12, 2013, from sonyentertainmentnetwork:
https://store.sonyentertainmentnetwork.com/#!/en-gr/games/gran-turismo-6/cid=EP9001-
NPEA00502_00-0000000000000000
Sotamaa, O., & Karppi, T. (2010). Games as Services. Tampere: University of Tampere.
Retrieved 8 2, 2014, from http://tampub.uta.fi/bitstream/handle/10024/65772/978-951-44-
8167-3.pdf?sequence=1.
75
statista.com. (2013). Number of World of Warcraft subscribers from 1st quarter 2005 to 4th
quarter 2013. Retrieved 12 12, 2013, from statista:
http://www.statista.com/statistics/276601/number-of-world-of-warcraft-subscribers-by-
quarter/
Steiner, T. (2008). Advertising in online games and EC audiovisual media regulation. Retrieved
12 12, 2013, from unilu: http://www.unilu.ch/files/advertising.pdf
Stenros, J., & Sotamaa, O. (2009). Commoditization of helping players play:Rise of the service
paradigm. DiGRA 2009 Conference Proceedings (pp. 2-8). London: Brunel University.
Swanson, A. (2013). Cloud Gaming USA 2013. San Francisco: Video Games Intelligence.
Terschluse, C., & Karen, O. B. (2009). Gamer 2.0, Exploring the use of gaming, community, &
social media. Crimson Consulting.
Van, d. H. (2004). User acceptance of hedonic information systems. MIS Quarterly, 28 (4), pp.
695-704.
Vedrashko, I. (2006). Advertising in computer games. Massachusetts, USA: Massachusetts
Institute of Technology, Department of Comparative Media Studies.
Venkatesh, V., Morris, M.G., Davis, G.B., and Davis, F.D. (2003) User acceptance of
information technology: Toward a unified view, MIS Quarterly, 27 (3), pp. 425-478.
Vessenes, P. (2012, 4 26). CoinLab gets $500,000 in VC for bitcoin-related gaming startup.
Retrieved 7 1, 2013, from arstechnica: http://arstechnica.com/business/2012/04/coinlab-gets-
500000-in-vc-for-bitcoin-related-gaming-startup/
Videogamedesigncolleges.org. (2011, 6 1). Video Games Design Colleges. Retrieved 5 30, 2011,
from Video Games Design Colleges: http://www.vg247.com/2011/06/01/infographic-world-of-
warcraft-by-the-numbers/
virgingaming.com. (2013). Win money playing video games. Retrieved 11 1, 2013, from
virgingaming: http://www.virgingaming.com/
Wallis, T. (2013). Game Monetisation Whitepaper, Q1 2013. Video Games Intelligence.
Warman, P. (2013). Global Monetization of Games Emerging Markets as Drivers of Growth.
Casual Connect (p. 11). San Francisco: Newzoo.
Weidemann, T. (2011, 3 15). Virtual Economies. Retrieved 12 12, 2013, from kapitalrejsen:
http://kapitalrejsen.dk/sites/kapitalrejsen.dk/files/dokumenter/f2p_Teutday.pdf
Williamson, O. E. (1981). The Economics of Organization: The Transaction Cost Approach. The
American Journal of Sociology, 87 (3) , pp. 548–577. doi:10.2307/2778934.
Wixon, B. H., & Watson, H. J. (2001). An empirical investigation of the factors affecting data
warehousing success. MIS Quarterly, 25 (1), pp. 17–41.
Wright, K. B. (2005). Researching Internet-Based Populations: Advantages and disadvantages
of online survey research, online questionnaire authoring software packages, and web survey

76
Services. Journal of Computer-Mediated Communication, 10 (3), pp. 00-00 doi:
10.1111/j.1083-6101.2005.tb00259.x.
Wu, J., & Liu, D. (2007). The Effects of trust and enjoyment on intention to play online games.
Journal of Electronic Commerce Research, 8 (2), pp. 128-140.
Yan, J., & Randell, B. (2005). A systematic classification of cheating in online games. Proceeding
NetGames '05 Proceedings of 4th ACM SIGCOMM workshop on Network and system support
for games, pp. 1-9. doi: 10.1145/1103599.1103606
Yee, N. (2005). Motivations of play in MMORPGs. Proceedings of DiGRA 2005 (pp. 1-8).
Stanford University.
Yee, N. (2007). Motivations of play in online games. Journal of Cyber Psychology and Behavior,
9, pp. 772-775.
Yoshida, S. (2013, 12). Microtransaction per se is not a bad thing, how the game is designed
around it could become a problem. Retrieved 12 12, 2013, from
https://twitter.com/yosp/status/408280068889120768
You, J., & Park, C. (2010). A Comprehensive Review of Technology Acceptance Model
Researches. Journal of Information Technology, 9 (2), pp. 31-50.
Zalewski, G. M. (2009). System for converting television commercials into interactive networked
video games Patent No. 61/183,539. USA.
Zeitham, V. (1988). Consumer perceptions of price, quality, and value: A means-end model and
synthesis of evidence. Journal of Marketing, 52 (3), pp. 2-22.
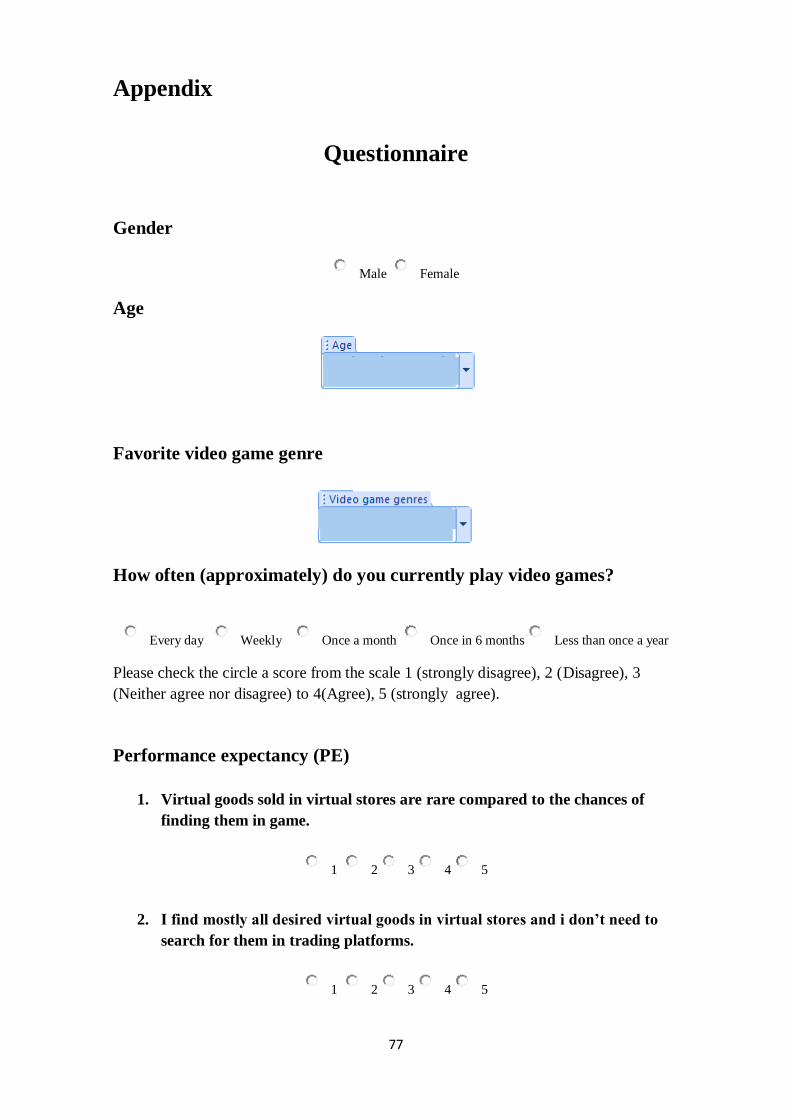
77
Appendix
Questionnaire
Gender
Male Female
Age
Favorite video game genre
How often (approximately) do you currently play video games?
Every day Weekly Once a month Once in 6 months Less than once a year
Please check the circle a score from the scale 1 (strongly disagree), 2 (Disagree), 3
(Neither agree nor disagree) to 4(Agree), 5 (strongly agree).
Performance expectancy (PE)
1. Virtual goods sold in virtual stores are rare compared to the chances of
finding them in game.
1 2 3 4 5
2. I find mostly all desired virtual goods in virtual stores and i don‟t need to
search for them in trading platforms.
1 2 3 4 5

78
3. Virtual goods sold in virtual stores help me to save time in order to obtain
other desired items.
1 2 3 4 5
Effort expectancy (EE)
4. I can navigate and easily find my desired items in virtual stores.
1 2 3 4 5
5. Virtual stores have payment procedures that are easy to understand.
1 2 3 4 5
6. Virtual stores have comparison tools and advanced search capabilities.
1 2 3 4 5
Perceived Value (PV)
7. Virtual goods sold in virtual stores should be useful and reliable.
1 2 3 4 5
8. Virtual goods sold in virtual stores have the same or better quality
compared to virtual items i can find in-game.
1 2 3 4 5
9. Virtual goods sold in virtual stores should be value for money.
1 2 3 4 5
Customization Options (CO)
10. Using virtual items sold in virtual stores are important for me to
personalize game features( characters, backgrounds or environments etc).
1 2 3 4 5

79
11. Using virtual items sold in virtual stores are aesthetically fashionable.
1 2 3 4 5
12. Using virtual items sold in virtual stores help me look different than other
players.
1 2 3 4 5
Functionality (FU)
13. Using virtual items sold in virtual stores make me more effective in
accomplishing game tasks.
1 2 3 4 5
14. Using virtual items sold in virtual stores help me to progress more quickly.
1 2 3 4 5
15. Using virtual items sold in virtual stores are of satisfactory quality.
1 2 3 4 5
Participation (PON)
16. Using virtual items sold in virtual stores help me make new friends.
1 2 3 4 5
17. Using virtual items sold in virtual stores help me enter clans or other
gaming groups.
1 2 3 4 5
18. Using virtual items sold in virtual stores help me retain my social
relationships.
1 2 3 4 5

80
Prestige (PRE)
19. Using virtual items sold in virtual stores can help me show off my social
status.
1 2 3 4 5
20. Using virtual items sold in virtual stores can help me show off my progress
to others.
1 2 3 4 5
21. Using virtual items sold in virtual stores can help me enhance the point of
view that other players have about me.
1 2 3 4 5
Perceived Enjoyment (PE)
22. Using virtual items sold in virtual stores is a pleasant experience.
1 2 3 4 5
23. Using virtual items sold in virtual stores satisfy my curiosity.
1 2 3 4 5
24. Using virtual items sold in virtual stores contribute to keep me immersed in
game.
1 2 3 4 5
Intention to buy virtual items (IB)
25. I …….with the idea of purchasing virtual items in video games.
1 2 3 4 5
26. My willingness to buy virtual items is high.

81
1 2 3 4 5
27. The chances to buy virtual items in my next games that offer virtual items
are high.
1 2 3 4 5