Building Concepts: Outliers - Texas Instruments
17
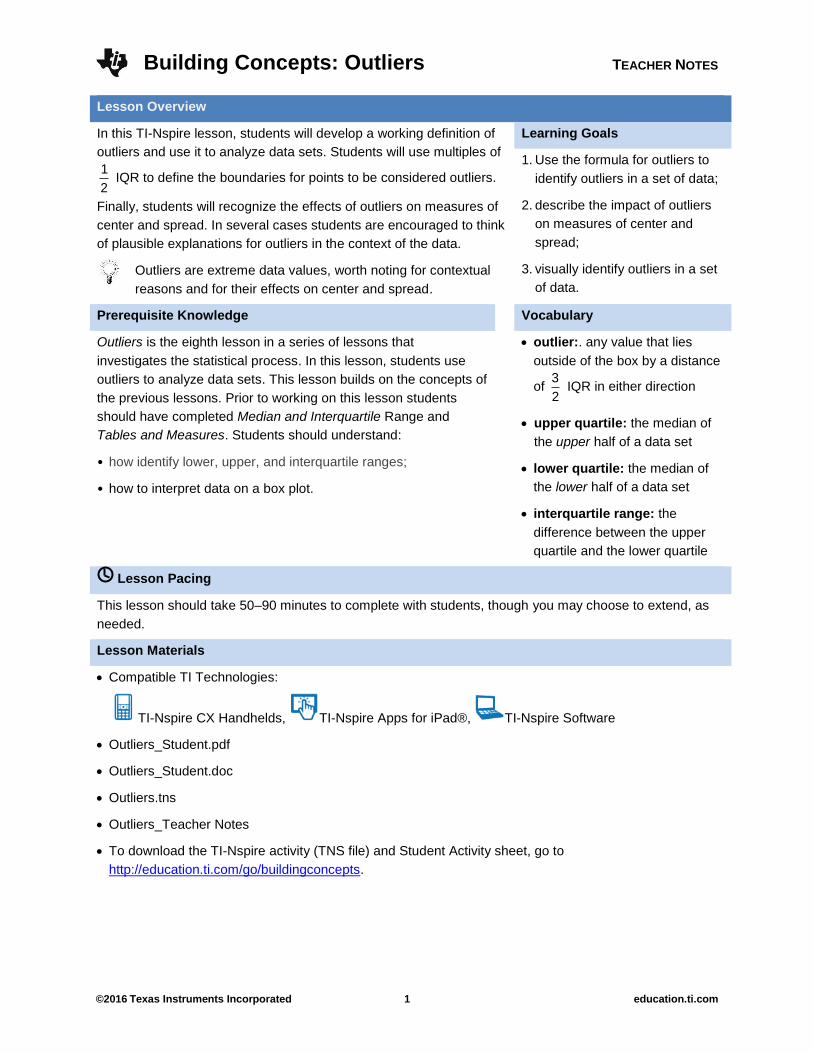
Building Concepts: Outliers TEACHER NOTES ©2016 Texas Instruments Incorporated 1 education.ti.com Lesson Overview In this TI-Nspire lesson, students will develop a working definition of outliers and use it to analyze data sets. Students will use multiples of 1 2 IQR to define the boundaries for points to be considered outliers. Finally, students will recognize the effects of outliers on measures of center and spread. In several cases students are encouraged to think of plausible explanations for outliers in the context of the data. Learning Goals 1. Use the formula for outliers to identify outliers in a set of data; 2. describe the impact of outliers on measures of center and spread; 3. visually identify outliers in a set of data. Outliers are extreme data values, worth noting for contextual reasons and for their effects on center and spread. Prerequisite Knowledge Vocabulary Outliers is the eighth lesson in a series of lessons that investigates the statistical process. In this lesson, students use outliers to analyze data sets. This lesson builds on the concepts of the previous lessons. Prior to working on this lesson students should have completed Median and Interquartile Range and Tables and Measures. Students should understand: • how identify lower, upper, and interquartile ranges; • how to interpret data on a box plot. outlier:. any value that lies outside of the box by a distance of 3 2 IQR in either direction upper quartile: the median of the upper half of a data set lower quartile: the median of the lower half of a data set interquartile range: the difference between the upper quartile and the lower quartile Lesson Pacing This lesson should take 50–90 minutes to complete with students, though you may choose to extend, as needed. Lesson Materials Compatible TI Technologies: TI-Nspire CX Handhelds, TI-Nspire Apps for iPad®, TI-Nspire Software Outliers_Student.pdf Outliers_Student.doc Outliers.tns Outliers_Teacher Notes To download the TI-Nspire activity (TNS file) and Student Activity sheet, go to http://education.ti.com/go/buildingconcepts.
-
Upload
khangminh22 -
Category
Documents
-
view
0 -
download
0
Transcript of Building Concepts: Outliers - Texas Instruments
Building Concepts: Outliers TEACHER NOTES
©2016 Texas Instruments Incorporated 1 education.ti.com
Lesson Overview
In this TI-Nspire lesson, students will develop a working definition of
outliers and use it to analyze data sets. Students will use multiples of
1
2 IQR to define the boundaries for points to be considered outliers.
Finally, students will recognize the effects of outliers on measures of
center and spread. In several cases students are encouraged to think
of plausible explanations for outliers in the context of the data.
Learning Goals
1. Use the formula for outliers to
identify outliers in a set of data;
2. describe the impact of outliers
on measures of center and
spread;
3. visually identify outliers in a set
of data.
Outliers are extreme data values, worth noting for contextual
reasons and for their effects on center and spread.
Prerequisite Knowledge Vocabulary
Outliers is the eighth lesson in a series of lessons that
investigates the statistical process. In this lesson, students use
outliers to analyze data sets. This lesson builds on the concepts of
the previous lessons. Prior to working on this lesson students
should have completed Median and Interquartile Range and
Tables and Measures. Students should understand:
• how identify lower, upper, and interquartile ranges;
• how to interpret data on a box plot.
outlier:. any value that lies
outside of the box by a distance
of 3
2 IQR in either direction
upper quartile: the median of
the upper half of a data set
lower quartile: the median of
the lower half of a data set
interquartile range: the
difference between the upper
quartile and the lower quartile
Lesson Pacing
This lesson should take 50–90 minutes to complete with students, though you may choose to extend, as
needed.
Lesson Materials
Compatible TI Technologies:
TI-Nspire CX Handhelds, TI-Nspire Apps for iPad®, TI-Nspire Software
Outliers_Student.pdf
Outliers_Student.doc
Outliers.tns
Outliers_Teacher Notes
To download the TI-Nspire activity (TNS file) and Student Activity sheet, go to
http://education.ti.com/go/buildingconcepts.
Building Concepts: Outliers TEACHER NOTES
©2016 Texas Instruments Incorporated 2 education.ti.com
Class Instruction Key
The following question types are included throughout the lesson to assist you in guiding students in their
exploration of the concept:
Class Discussion: Use these questions to help students communicate their understanding of the
lesson. Encourage students to refer to the TNS activity as they explain their reasoning. Have students
listen to your instructions. Look for student answers to reflect an understanding of the concept. Listen for
opportunities to address understanding or misconceptions in student answers.
Student Activity: Have students break into small groups and work together to find answers to the
student activity questions. Observe students as they work and guide them in addressing the learning goals
of each lesson. Have students record their answers on their student activity sheet. Once students have
finished, have groups discuss and/or present their findings. The student activity sheet can also be
completed as a larger group activity, depending on the technology available in the classroom.
Deeper Dive: These questions are provided for additional student practice and to facilitate a deeper
understanding and exploration of the content. Encourage students to explain what they are doing and to
share their reasoning.
Mathematical Background
Distributions of data are characterized by their shape, center and spread. In some cases, the distribution
includes values that do not seem to fit the pattern of the other data. Extreme values, far from the other
values, are called outliers: in this lesson, an outlier is any value that is more than 1.5 times the interquartile
range above the upper quartile or less than 1.5 times the interquartile range below the lower quartile, i.e.,
an outlier is a value x such that UQ+1.5 IQRx or LQ 1.5 IQRx . John Tukey (1984), who originated
exploratory data analysis, when asked about why 1.5 IQR was used responded that one IQR identified
too many outliers and two IQRs did not identify enough. Other formulas used for outliers typically involve
the mean and some measure of spread; these are considered in more advanced courses.
Outliers can be important signals about the data. Outliers may occur because of processing errors
(mistyping, transposing digits, etc.); some outliers indicate some aspect of the data that might be useful in
understanding the story in the data such as indicating a possible new trend (for example, a different
medicine made a great improvement in a patient or a spike in the number of crimes in a city might signal
the need to rethink how the city is patrolled).
Building Concepts: Outliers TEACHER NOTES
©2016 Texas Instruments Incorporated 3 education.ti.com
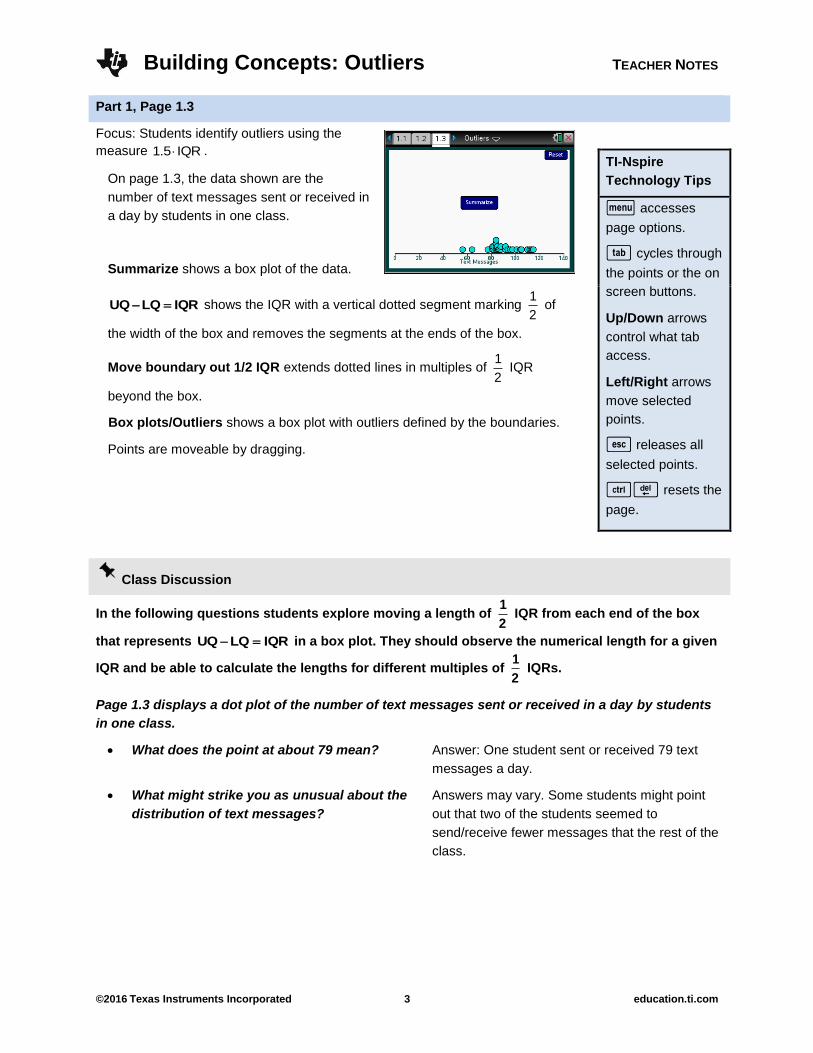
Part 1, Page 1.3
Focus: Students identify outliers using the
measure 1.5 IQR .
On page 1.3, the data shown are the
number of text messages sent or received in
a day by students in one class.
Summarize shows a box plot of the data.
TI-Nspire
Technology Tips
b accesses
page options.
e cycles through
the points or the on
screen buttons.
Up/Down arrows
control what tab
access.
Left/Right arrows
move selected
points.
d releases all
selected points.
/. resets the
page.
UQ LQ IQR shows the IQR with a vertical dotted segment marking 1
2 of
the width of the box and removes the segments at the ends of the box.
Move boundary out 1/2 IQR extends dotted lines in multiples of 1
2 IQR
beyond the box.
Box plots/Outliers shows a box plot with outliers defined by the boundaries.
Points are moveable by dragging.
Class Discussion
In the following questions students explore moving a length of 1
2 IQR from each end of the box
that represents UQ LQ IQR in a box plot. They should observe the numerical length for a given
IQR and be able to calculate the lengths for different multiples of 1
2 IQRs.
Page 1.3 displays a dot plot of the number of text messages sent or received in a day by students
in one class.
What does the point at about 79 mean? Answer: One student sent or received 79 text
messages a day.
What might strike you as unusual about the
distribution of text messages?
Answers may vary. Some students might point
out that two of the students seemed to
send/receive fewer messages that the rest of the
class.
Building Concepts: Outliers TEACHER NOTES
©2016 Texas Instruments Incorporated 4 education.ti.com
Class Discussion (continued)
Describe the distribution of the number of
text messages sent or received.
Answers may vary. Except for two students who
send/receive around 60 messages a day, the
distribution is skewed right. Most of the students
send/receive between about 78 and 90
messages a day with some going to nearly 120.
Estimate the median and the IQR and explain
what each means.
Answers will vary. Students might suggest 82
messages for the median, which indicates that
half of the students in the class sent/received 82
or more messages a day, while half
sent/received 82 or less. An estimate of the IQR
is about 20, which indicates that spread of the
number of messages sent by the middle half of
the students is only 20; students are pretty alike
in how many messages they send/receive.
Select Summarize.
Why is the segment on the box plot to the
left longer than the segment to the right?
Answer: The number of messages students in
the lower fourth of the distribution send/receive is
spread out from below 60 to about 85 messages,
while the number of messages students in the
top fourth of the distribution send/receive is
spread over a shorter span, from about 102 to
118 messages.
Select UQ LQ IQR . Describe what
changed.
Answer: The segments disappeared and left the
box that shows the length of the IQR. The
median disappeared and a vertical segment
showed up in the middle of the box as well as a
dotted horizontal segment through the box. The
IQR shows on the screen. The dots that are not
represented in the box are colored orange.
Select Move boundary out 1/2 IQR. Describe
what changed.
Answer: The dotted line in the box is gone, and
dotted horizontal segments are outside the box
on both ends. Now the dots representing
students outside of the dotted segments are
colored orange. All those inside the box and
dotted segments are blue/green.
What do the dotted segments represent and
how long are they? Answer: They represent the length
1
2 IQR,
which is 8.5.
Building Concepts: Outliers TEACHER NOTES
©2016 Texas Instruments Incorporated 5 education.ti.com
Class Discussion (continued)
Move out until none of the dots are orange.
How many IQRs did you move on either side of the box?
Answer: Four times or four 1
2 IQRs, which would be 2 IQRs.
What is the length of the dotted segments extending from either end of the box?
Answer: 34
Move in 1
2 IQR. Now how far do the dotted segments extend from either end of the box?
Answer: 25.5
Student Activity Questions—Activity 1
1. Select menu> Class> Set 2 to look at the number of text messages sent/received from students
in another class. Select Summarize, then UQ LQ IQR .
a. What is 1
2 IQR?
Answer: 10.75
b. Estimate how many times you will have to Move boundary out 1/2 IQR before none of the
dots will be left outside of the dotted segments.
Answers will vary. Students might estimate four or five times.
c. Select UQ LQ IQR . Check your conjecture to b. How long are the dotted segments?
Answer: You can only move out five times and one dot is still orange. The total length of the dotted
segments on each side of the box is 53.75 messages in length.
2. Sometimes it is important to determine whether a value is extreme and really distinct from the
others. These values are called outliers. An outlier is any value that lies outside of the box by a
distance of three 1
2 IQRs in either direction.
a. How many IQRs is three 1
2 IQRs?
Answer: 1.5 IQR or 1
1 IQR2
b. Use Move boundary in 1/2 IQR and Move boundary out 1/2 IQR to identify the students who
are outliers in terms of the number of text messages they send/receive in this class.
Answer: Two of the students are outliers; the one who sends/receives over 130 messages and the
one who sends/receives a bit less than 110.

Building Concepts: Outliers TEACHER NOTES
©2016 Texas Instruments Incorporated 6 education.ti.com
Student Activity Questions—Activity 1 (continued)
c. Select Box Plot/Outliers. How can you tell from the box plot which students are outliers
with respect to the number of texts they send/receive?
Answer: The box plot looks like a regular plot, but the outliers are not part of the segment. They
are represented as dots. Note outliers are still part of the data set and in the upper fourth quarter
of the data. The box plot representation has been adapted to make the outliers visible.
d. Give a plausible explanation for why these students might be outliers.
Answers will vary. Students might suggest they were involved in organizing something and had to
send a lot of messages to people to get the event organized. Another explanation might be that
the students are addicted to texting.
3. Reset. Select Set 1. Show the box plot with outliers for the distribution.
a. Identify students in this class who are outliers.
Answer: The student who sends/receives less than 60 messages a day is an outlier.
b. Give a plausible explanation for why students might be outliers.
Answer: Perhaps his parents restricted his time texting or he was ill. It could have been an error in
recording the data.
c. Select Set 3. Do you think the distribution will have any outliers? Use the TNS activity to
check your thinking.
Answers will vary. None of the students in this class are outliers.
4. Mathematicians like formulas.
a. If x represents a value, which of the formulas below do you think can be used to find an
outlier? Explain your reasoning.
i. x UQ ii. x UQ IQR
iii. 1
x UQ IQR2
iv. 3
x UQ IQR2
Answer: iv. Not every value beyond the UQ is an outlier; it has to be far away from the other
values. The right one is the value that is more than 3
2 IQRs above the UQ.
b. Use your reasoning from question a above to write a formula to describe an outlier at the
left end of a distribution.
Answer: LQ 1.5 IQRx

Building Concepts: Outliers TEACHER NOTES
©2016 Texas Instruments Incorporated 7 education.ti.com
Student Activity Questions—Activity 1 (continued)
c. If LQ=135 , UQ=185 , identify each as true or false. An outlier will be any value
i. larger than 185.
ii. larger than 210.
iii. larger than 260.
iv. smaller than 60.
Answer: iii and iv are true.
5. Which of the following are true? Give an example from the TNS activity to support your
reasoning.
a. The smallest and largest values of any distribution are outliers.
Answer: That was not true in any of the examples we explored.
b. Not all distributions have outliers.
Answer: True, one of the distributions did not have any values beyond three 1
2 IQRs above or
below the box.
c. An outlier will be more than one box plot width plus half of the width of the box plot to the
left and right of the box.
Answer: True, one box is an IQR and so it is the same as adding an IQR plus 1
2 IQR, which is
11 IQR
2 , to the UQ or subtracting it from the LQ.
d. The segments on each side of the box always extend 1
1 IQR2 beyond the LQ and the UQ.
Answer: False, the segments go only until the last data point that is not an outlier, which is what
they did on all the examples.
Part 2, Page 1.5
Focus: Students will identify outliers both visually and using the
formula and noticing the impact of outliers on the mean and mean
absolute deviation. Students should recognize that outliers have no
impact on the median and interquartile range.
Page 1.5 functions in the same way as page 1.3, except each data
set is different.
Building Concepts: Outliers TEACHER NOTES
©2016 Texas Instruments Incorporated 8 education.ti.com
Class Discussion
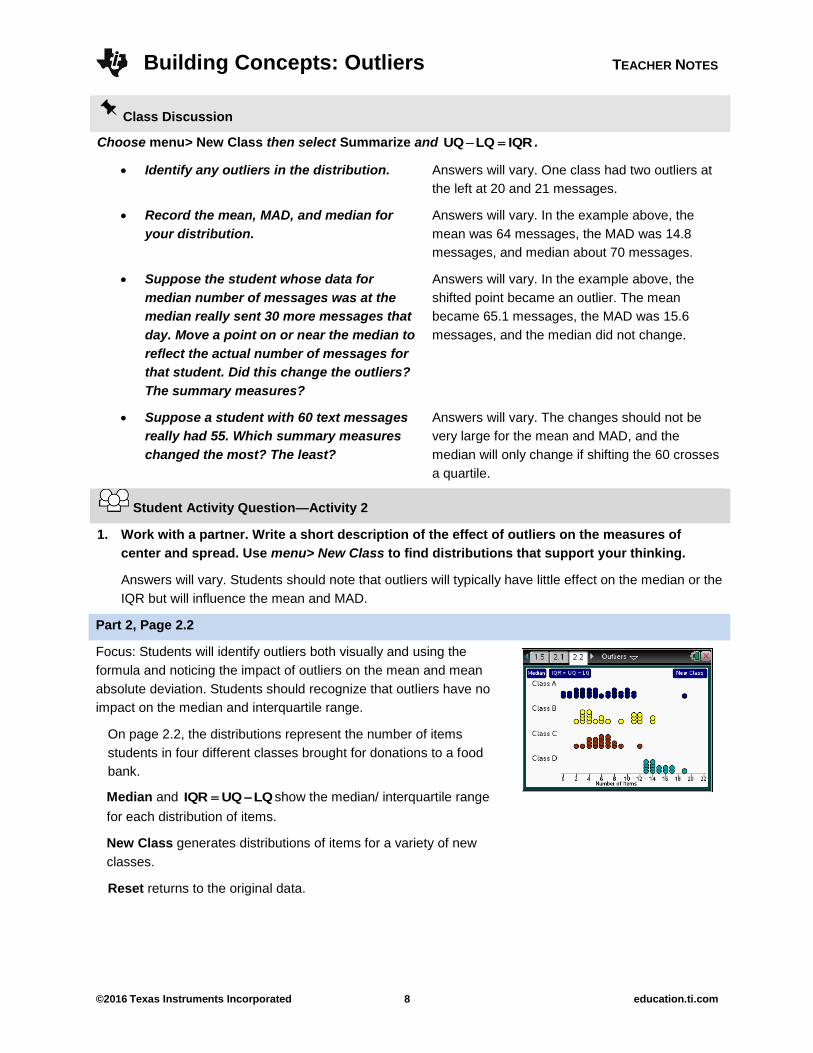
Choose menu> New Class then select Summarize and UQ LQ IQR .
Identify any outliers in the distribution. Answers will vary. One class had two outliers at
the left at 20 and 21 messages.
Record the mean, MAD, and median for
your distribution.
Answers will vary. In the example above, the
mean was 64 messages, the MAD was 14.8
messages, and median about 70 messages.
Suppose the student whose data for
median number of messages was at the
median really sent 30 more messages that
day. Move a point on or near the median to
reflect the actual number of messages for
that student. Did this change the outliers?
The summary measures?
Answers will vary. In the example above, the
shifted point became an outlier. The mean
became 65.1 messages, the MAD was 15.6
messages, and the median did not change.
Suppose a student with 60 text messages
really had 55. Which summary measures
changed the most? The least?
Answers will vary. The changes should not be
very large for the mean and MAD, and the
median will only change if shifting the 60 crosses
a quartile.
Student Activity Question—Activity 2
1. Work with a partner. Write a short description of the effect of outliers on the measures of
center and spread. Use menu> New Class to find distributions that support your thinking.
Answers will vary. Students should note that outliers will typically have little effect on the median or the
IQR but will influence the mean and MAD.
Part 2, Page 2.2
Focus: Students will identify outliers both visually and using the
formula and noticing the impact of outliers on the mean and mean
absolute deviation. Students should recognize that outliers have no
impact on the median and interquartile range.
On page 2.2, the distributions represent the number of items
students in four different classes brought for donations to a food
bank.
Median and IQR UQ LQ show the median/ interquartile range
for each distribution of items.
New Class generates distributions of items for a variety of new
classes.
Reset returns to the original data.

Building Concepts: Outliers TEACHER NOTES
©2016 Texas Instruments Incorporated 9 education.ti.com
Class Discussion
The distributions on page 2.2 are the number of items students in four different classes brought
for donations to a food bank.
Which of the classes seems to have brought the most items? Make a frequency table and use
it to support your answer.
Answer: Class A had a lot of students, but all the students in Class D brought at least 13 items.
Class A Freq Total
Items
Class D Freq Total
Items
0 2 0 13 4 52
1 2 2 14 4 56
2 3 6 15 2 30
3 3 9 16 2 32
4 3 12 17 2 34
5 3 15 19 1 19
6 1 6 Sum 223
7 2 14
8 3 24
9 2 18
10 3 30
11 2 22
19 1 19
Sum 177
Did any of the classes have a student who
really brought a lot or hardly any items
compared to the rest of the class? Explain.
Answers may vary. One student in Class A
brought 19 items, 8 more than the other students
in the class. One student in Class C brought 12
items, but that was only three more than the next
student.
How could you find an answer to the
answer above?
Answer: Find out if there is an outlier.
Do you think any of the Classes will have
the same IQR? Why or why not? Select
IQR UQ LQ to check your thinking.
Answers will vary. Class A and Class B are close
(6 and 7 respectively), but Class C at 2.5 and
Class D at 3 are even closer to having the same
IQR.

Building Concepts: Outliers TEACHER NOTES
©2016 Texas Instruments Incorporated 10 education.ti.com
Student Activity Questions—Activity 3
1. Look at the distributions with the IQR segments.
a. Which distributions will probably not have an outlier? Explain how you know.
Answers may vary. Students may think Classes B and D seem unlikely to have an outlier because
there is no extreme point in either distribution.
b. Find 1.5 IQR for each of the classes.
Answer: Class A—9; Class B—10.5; Class C—3.75; Class D—4.5
c. Use your work from the question above to estimate whether each distribution has an
outlier.
Answer: An outlier for Class A would be greater than the UQ 1.5 IQR 9 9 18 , so the value
at 19 is an outlier. An outlier for Class C would be greater than 10.75, so 12 items would be an
outlier in that class.
2. Select New Classes.
a. Decide if students in any of the classes brought a lot more or a lot less items than their
classmates. Use the IQR to help you decide. Check your work with a partner.
Answers will vary. In one example, Class C had one student who only brought 2 items (1.5 IQR
was 4.5) and Class D had one student who only brought 1 item (1.5 IQR was 6).
b. Determine the total number of items brought by one of the classes. Calculate the mean
number of items for that class. Explain how you found your answer.
Answers will vary. Some students might set up a frequency table. In one set, one class had four
students who brought 7 items, two brought 8, one brought 9 and one who brought 19. The total
would be 28 16 9 19 72 and to find the mean number of items, 72
98
.
c. Select New Classes until you find two of the four classes with outliers. Check your work
with a partner.
Answers will vary.

Building Concepts: Outliers TEACHER NOTES
©2016 Texas Instruments Incorporated 11 education.ti.com
Deeper Dive — page 2.2
In one class, the IQR was 0. How could that happen?
Answer: All of the students in the middle 50% for items brought, brought exactly the same number of
items.
The digits in the test score for one of 25 students were reversed, which made that score an outlier.
Including the score with the reversed digits, the maximum score was 98, median 80, upper quartile
88, lower quartile 72 and the minimum score was 46.
Which score was an outlier?
Answer: 46
If the correct score was entered, would it still be an outlier?
Answer: No because the 1.5(88 72) 24 and 72 24 48 . 64 is greater than 48, so it would no
longer be an outlier.
Which of the five number summary statistics would be affected when the correct score is
entered?
Answer: Only the minimum, which would no longer be 46
Work with a partner using page 2.2. Each of you should decide whether any of the classes have an
outlier by estimating the median and IQR. Then compare your answers and discuss your
strategies. Select IQR UQ LQ to check your thinking. Choose New Classes and try again. Do
this several times until you both guess correctly for at least three of the four distributions.
Answers will vary. Listen to student strategies for ones you would like them to share with the whole class.
Investigate outliers in statistical analyses of data from real contexts and identify at least three
reasons for the existence of outliers and give examples from the particular contexts.
Answers will vary. Websites such as http://pareonline.net/getvn.asp?v=9&n=6 or
https://savionline.wordpress.com/2013/07/24/the-importance-of-outliers/ can be used to answer the
question.

Building Concepts: Outliers TEACHER NOTES
©2016 Texas Instruments Incorporated 12 education.ti.com
Sample Assessment Items
After completing the lesson, students should be able to answer the following types of questions. If
students understand the concepts involved in the lesson, they should be able to answer the following
questions without using the TNS activity.
1. The table below shows the number of customers at a Bike Shop for 10 days, as well as the mean
(average) and the median number of customers for these 5 days.
Day Customers
100
95
90
10
80
75
91
110
92
88
Summary Lower quartile = 80
Median = 90.5
Upper quartile = 95
Mean = 83.1
Mean absolute deviation = 16.86
a. Is the 10 an outlier? Explain your reasoning.
Answer: Yes because the IQR = 15 and 1.5(15) = 22.5; 80 – 22.5 = 57.5. 10 < 57.5 so 10 is an
outlier.
b. Which summary statistics are most affected by the 10?
Answer: The mean and MAD
Building Concepts: Outliers TEACHER NOTES
©2016 Texas Instruments Incorporated 13 education.ti.com
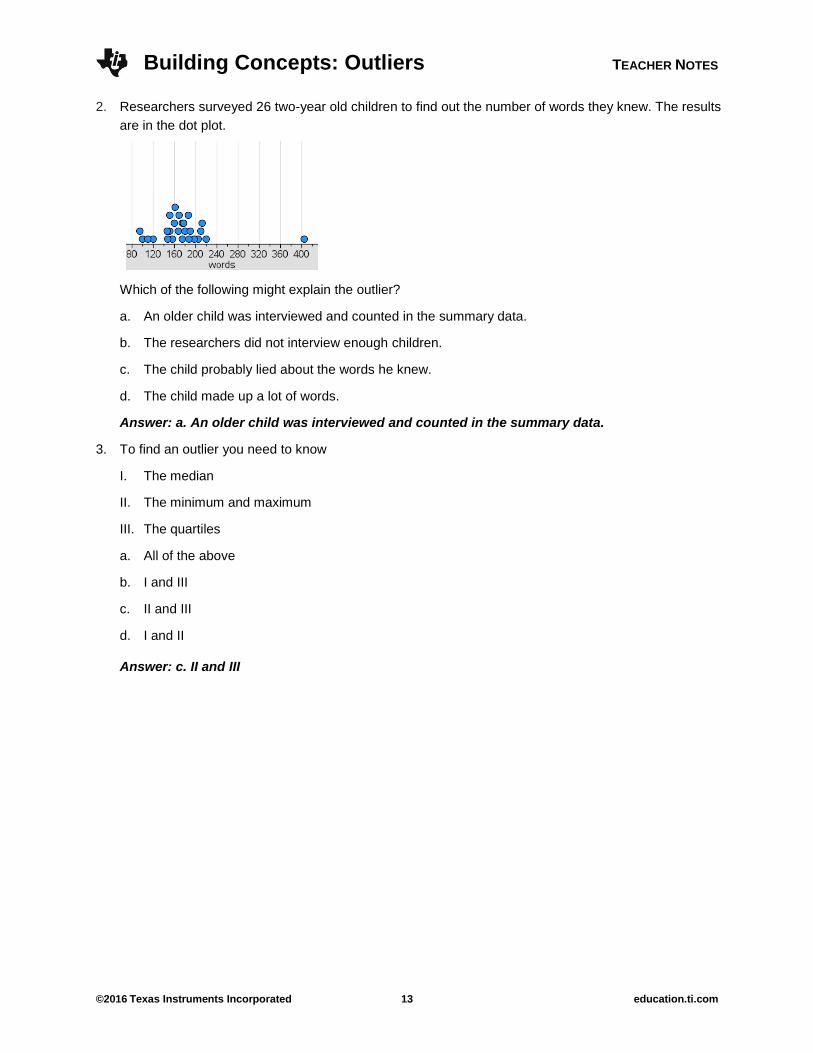
2. Researchers surveyed 26 two-year old children to find out the number of words they knew. The results
are in the dot plot.
Which of the following might explain the outlier?
a. An older child was interviewed and counted in the summary data.
b. The researchers did not interview enough children.
c. The child probably lied about the words he knew.
d. The child made up a lot of words.
Answer: a. An older child was interviewed and counted in the summary data.
3. To find an outlier you need to know
I. The median
II. The minimum and maximum
III. The quartiles
a. All of the above
b. I and III
c. II and III
d. I and II
Answer: c. II and III
Building Concepts: Outliers TEACHER NOTES
©2016 Texas Instruments Incorporated 14 education.ti.com
Student Activity Solutions
In these activities you will use outliers to analyze data sets. After completing the activities, discuss and/or
present your findings to the rest of the class.
Activity 1 [Page 1.3]
1. Select menu> Class> Set 2 to look at the number of text messages sent/received from students in
another class. Select Summarize, then UQ LQ IQR .
a. What is 1
2 IQR?
Answer: 10.75
b. Estimate how many times you will have to Move boundary out 1/2 IQR before none of the dots
will be left outside of the dotted segments.
Answers will vary. Students might estimate four or five times.
c. Select UQ LQ IQR . Check your conjecture to b. How long are the dotted segments?
Answer: You can only move out five times and one dot is still orange. The dotted segments are
53.75 messages in length.
2. Sometimes it is important to determine whether a value is extreme and really distinct from the others.
These values are called outliers. An outlier is any value that lies outside of the box by a distance of
three 1
2 IQRs in either direction.
a. How many IQRs is three 1
2 IQRs?
Answer: 1.5 IQR or 1
1 IQR2
b. Use Move boundary in 1/2 IQR and Move boundary out 1/2 IQR to identify the students who
are outliers in terms of the number of text messages they send/receive in this class.
Answer: Two of the students are outliers; the one who sends/receives over 130 messages and the
one who sends/receives a bit less than 110.
c. Select Box Plot/Outliers. How can you tell from the box plot which students are outliers with
respect to the number of texts they send/receive?
Answer: The box plot looks like a regular plot, but the outliers are not part of the segment. They
are represented as dots. Note outliers are still part of the data set and in the upper fourth quarter
of the data. The box plot representation has been adapted to make the outliers visible.
d. Give a plausible explanation for why these students might be outliers.
Answers will vary. Students might suggest they were involved in organizing something and had to
send a lot of messages to people to get the event organized. Another explanation might be that
the students are addicted to texting.
Building Concepts: Outliers TEACHER NOTES
©2016 Texas Instruments Incorporated 15 education.ti.com
3. Reset. Select Set 1. Show the box plot with outliers for the distribution.
a. Identify students in this class who are outliers.
Answer: The student who sends/receives less than 60 messages a day is an outlier.
b. Give a plausible explanation for why students might be outliers.
Answer: Perhaps his parents restricted his time texting or he was ill. It could have been an error in
recording the data.
c. Select Set 3. Do you think the distribution will have any outliers? Use the TNS activity to check
your thinking.
Answers will vary. None of the students in this class are outliers.
4. Mathematicians like formulas.
a. If x represents a value, which of the formulas below do you think can be used to find an outlier?
Explain your reasoning.
i. x UQ ii. x UQ IQR
iii. 1
x UQ IQR2
iv. 3
x UQ IQR2
Answer: iv. Not every value beyond the UQ is an outlier; it has to be far away from the other
values. The right one is the value that is more than 3
2 IQRs above the UQ.
b. Use your reasoning from question a above to write a formula to describe an outlier at the left end
of a distribution.
Answer: LQ 1.5 IQRx
c. If LQ=135 , UQ=185 , identify each as true or false. An outlier will be any value
i. larger than 185.
ii. larger than 210.
iii. larger than 260.
iv. smaller than 60.
Answer: iii and iv are true.
5. Which of the following are true? Give an example from the TNS activity to support your reasoning.
a. The smallest and largest values of any distribution are outliers.
Answer: That was not true in any of the examples we explored.
b. Not all distributions have outliers.
Answer: True, one of the distributions did not have any values beyond three 1
2 IQRs above or
below the box.
Building Concepts: Outliers TEACHER NOTES
©2016 Texas Instruments Incorporated 16 education.ti.com
c. An outlier will be more than one box plot width plus half of the width of the box plot to the left and
right of the box.
Answer: True, one box is an IQR and so it is the same as adding an IQR plus 1
2 IQR, which is
11 IQR
2 , to the UQ or subtracting it from the LQ.
d. The segments on each side of the box always extend 1
1 IQR2 beyond the LQ and the UQ.
Answer: False, the segments go only until the last data point that is not an outlier, which is what
they did on all the examples.
Activity 2 [Page 1.5]
1. Work with a partner. Write a short description of the effect of outliers on the measures of center
and spread. Use menu> New Class to find distributions that support your thinking.
Answers will vary. Students should note that outliers will typically have little effect on the median or the
IQR but will influence the mean and MAD.
Activity 3 [Page 2.2]
1. Look at the distributions with the IQR segments.
a. Which distributions will probably not have an outlier? Explain how you know.
Answers may vary. Students may think Classes B and D seem unlikely to have an outlier because
there is no extreme point in either distribution.
b. Find 1.5 IQR for each of the classes.
Answer: Class A—9; Class B—10.5; Class C—3.75; Class D—4.5
c. Use your work from the question above to estimate whether each distribution has an outlier.
Answer: An outlier for Class A would be greater than the UQ 1.5 IQR 9 9 18 , so the value
at 19 is an outlier. An outlier for Class C would be greater than 10.75, so 12 items would be an
outlier in that class.

Building Concepts: Outliers TEACHER NOTES
©2016 Texas Instruments Incorporated 17 education.ti.com
2. Select New Classes.
a. Decide if students in any of the classes brought a lot more or a lot less items than their
classmates. Use the IQR to help you decide. Check your work with a partner.
Answers will vary. In one example, Class C had one student who only brought 2 items (1.5 IQR
was 4.5) and Class D had one student who only brought 1 item (1.5 IQR was 6).
b. Determine the total number of items brought by one of the classes. Calculate the mean number of
items for that class. Explain how you found your answer.
Answers will vary. Some students might set up a frequency table. In one set, one class had four
students who brought 7 items, two brought 8, one brought 9 and one who brought 19. The total
would be 28 16 9 19 72 and to find the mean number of items, 72
98
.
c. Select New Classes until you find two of the four classes with outliers. Check your work with a
partner.
Answers will vary.