
Building a software experience factory using granular-based models
29
Fuzzy Sets and Systems 145 (2004) 111 – 139 www.elsevier.com/locate/fss Building a software experience factory using granular-based models Marek Reformat a , Witold Pedrycz a; b; ∗ , Nicolino Pizzi c a Department of Electrical and Computer Engineering, University of Alberta, Edmonton, Alta., Canada T6G 2G7 b Systems Research Institute, Polish Academy of Sciences, Warsaw 01-447, Poland c Institute for Biodiagnostics, National Research Council Winnipeg, Canada Abstract Software quality is one of the most important practical features of software development. Project managers and developers look for methods and tools supporting software development processes and ensuring a required level of quality. To make such tools relevant, they should provide the designer/manager with some quanti- tative input useful for purposes of interpretation of the results. Knowledge provided by the tools leads to better understanding of the investigated phenomena. In this paper, we propose a comprehensive development methodology of logic-based models represented by fuzzy neural networks. A process of model development is performed in the stages of structural and parametric optimization. The structural optimization framework utilizes mechanisms of evolutionary computing, which become especially attractive in light of the structural optimization of the models. The parametric optimization is performed using the gradient-base method. The study comprises two detailed case studies dealing with existing software data. The rst one deals with the quality assessment of software objects in an exploratory biomedical data analysis and visualization system. The second case is concerned with the model of software development eort discussed in the setting of some medical information system. c 2003 Elsevier B.V. All rights reserved. Keywords: Granular computing; Logic-based models; Software experience factory; Software quality; Software experimental data; Evolutionary computing; Software development eort 1. Introduction Software quality is one of the most important topics related to software development. Project managers and developers look for methods and tools supporting software development processes and ensuring a required level of quality. However, software is dierent from most products. First, software ∗ Corresponding author. Department of Electrical and Computer Engineering, University of Alberta, Edmonton, Alta., Canada T6G 2G7. Tel.: +1-204-474-8380; fax: +1-204-261-4639. E-mail address: [email protected] (W. Pedrycz). 0165-0114/$ - see front matter c 2003 Elsevier B.V. All rights reserved. doi:10.1016/j.fss.2003.10.007
Transcript of Building a software experience factory using granular-based models

Fuzzy Sets and Systems 145 (2004) 111–139www.elsevier.com/locate/fss
Building a software experience factory usinggranular-based models
Marek Reformata, Witold Pedrycza;b;∗, Nicolino Pizzic
aDepartment of Electrical and Computer Engineering, University of Alberta, Edmonton, Alta., Canada T6G 2G7bSystems Research Institute, Polish Academy of Sciences, Warsaw 01-447, Poland
cInstitute for Biodiagnostics, National Research Council Winnipeg, Canada
Abstract
Software quality is one of the most important practical features of software development. Project managersand developers look for methods and tools supporting software development processes and ensuring a requiredlevel of quality. To make such tools relevant, they should provide the designer/manager with some quanti-tative input useful for purposes of interpretation of the results. Knowledge provided by the tools leads tobetter understanding of the investigated phenomena. In this paper, we propose a comprehensive developmentmethodology of logic-based models represented by fuzzy neural networks. A process of model developmentis performed in the stages of structural and parametric optimization. The structural optimization frameworkutilizes mechanisms of evolutionary computing, which become especially attractive in light of the structuraloptimization of the models. The parametric optimization is performed using the gradient-base method. Thestudy comprises two detailed case studies dealing with existing software data. The 5rst one deals with thequality assessment of software objects in an exploratory biomedical data analysis and visualization system.The second case is concerned with the model of software development e6ort discussed in the setting of somemedical information system.c© 2003 Elsevier B.V. All rights reserved.
Keywords: Granular computing; Logic-based models; Software experience factory; Software quality; Softwareexperimental data; Evolutionary computing; Software development e6ort
1. Introduction
Software quality is one of the most important topics related to software development. Projectmanagers and developers look for methods and tools supporting software development processes andensuring a required level of quality. However, software is di6erent from most products. First, software
∗ Corresponding author. Department of Electrical and Computer Engineering, University of Alberta, Edmonton, Alta.,Canada T6G 2G7. Tel.: +1-204-474-8380; fax: +1-204-261-4639.
E-mail address: [email protected] (W. Pedrycz).
0165-0114/$ - see front matter c© 2003 Elsevier B.V. All rights reserved.doi:10.1016/j.fss.2003.10.007

112 M. Reformat et al. / Fuzzy Sets and Systems 145 (2004) 111–139
is developed rather than produced. Second, software has a non-visible nature—it is diHcult to seethe structure or the function of software. This very nature of software means that a special attentionis needed to ensure development of high quality systems. An interesting approach addressing thisproblem is the Experience Factory [3]. It is “a logical and=or physical organization that supportsproject developments by analyzing and synthesizing all kinds of experience, acting as a repository forsuch experience, and supplying that experience to various projects on demand”. Gained experiencesare deployed into recommended best practices, estimation models, and software development trainingcourses, which are spread as process improvements throughout development teams. The main ideabehind Experience Factory is reuse. In this case reuse is related not only to software products,components and objects, but mainly to experience and knowledge that was gained during previoussoftware development processes. In this case, knowledge has to be packaged appropriately for reuse.
The paradigm of the Experience Factory identi5es a need for collecting software data, analysisof the data and representation of results obtained from the analysis. The Factory describes creationof an experience database and de5nes a basic framework for these activities. However, it does notindicate methods and approaches that are to be used.
The 5rst phase of constructing the Factory is gathering data that represent and describe softwareproducts and processes related to software development. Collected data have to be in a format thatallows automatic=semi-automatic processing. In order to ful5ll this requirement, software modulesand objects are represented using software metrics. This approach has already been identi5ed asone of the ways of dealing with qualitative problems in a quantitative way [2,4]. Software metricscan be extracted directly from software and illustrates di6erent features and attributes of objects.Measures can also be identi5ed features that are not directly extracted from the software and relatedto processes such as construction, testing, maintenance, and even evolution of software objects. Inthis case, measures represent features of objects such as the number of defects, object readability,and compliance with coding standards. Having such a set of data available, one can look at di6erentmethods and approaches to process the data and construct models representing relationships existingbetween di6erent measures of software objects. These activities represent the second stage of buildingthe Experience Factory and are the main subject of this study.
Knowledge extraction from data and its simultaneous processing can be accomplished by synthe-sizing a class of models capable of dealing with two highly conMicting design requirements such astransparency and accuracy of a model. In an attempt to address these issues in our study, we notethe following:
• the concept of granular computation is extremely promising, granules of software measures canbe used in analysis of software processes, as well as in the development of models with the intentof achieving a high level of comprehension of phenomena represented by the data;
• models of well-de5ned logic structure are essential, this becomes a prerequisite to their trans-parency and user-friendliness;
• a multiphase process in which we clearly delineate between structural and parametric developmentis essential; the process starts with building a “skeleton” (more qualitative than quantitative) orblueprint of the model that is concerned with the structural relationships, and subsequently, weconcentrate on its further numeric re5nement (parametric optimization).
The set of observations mentioned above, has led to the application of fuzzy neural networks asthe best “candidates” for transparent yet accurate models built on principles of granular computing.

M. Reformat et al. / Fuzzy Sets and Systems 145 (2004) 111–139 113
Finding the best structure of the model is accomplished by application of evolutionary computingtechniques.
The proposed approach is used to design models representing processes of quality assessmentof software objects and estimation of development e6orts of software modules. Both processes areimportant elements of the Experience Factory. Models of these processes are simultaneously “pack-ages” of knowledge and estimation tools. They can be used to guide the development process aswell as evaluate software modules and objects.
The paper is organized into 6 sections. Section 2 introduces basic concepts of granulation andgranular-based models. Section 3 describes evolutionary-based techniques treated as a design back-bone of such models. Section 4 covers details of data analysis and an overall modeling of the processof quality assessment. In Section 5, analysis and modeling approaches are applied to a process ofestimating development e6orts of software modules. Section 6 presents concluding remarks.
2. Granular computation
2.1. Information granulation
By its very nature, software data are complex to analyze. There are several main reasons, namely(a) nonlinear nature of relationships existing between experimental data, (b) a need for visualizationof results to support their understanding and interpretation, and (c) scarcity of data combined witha diversity of additional factors not conveyed by the dataset itself.
While the use of statistical methods is pervasive in data analysis, the scope of such analysiscan be enhanced by the technology of granular computing. Granular computing is geared towardrepresenting and processing information granules. Information granules are collections of entities,usually originating at the numeric level, that are arranged together due to their similarity, functionaladjacency, indistinguishability or alike [13]. This approach is suitable in situations when there isa need to comprehend the problem and provide greater insight into its essence rather than beinginundated by unnecessary details. In this sense, granulation serves as an important mechanism ofabstraction. This approach allows hiding some imperfections in analyzed data thereby making theanalysis more immune to outliers.
Granular computation often exploits fuzzy set theory to represent knowledge in terms of informa-tion granules. Fuzzy sets are particularly advantageous due to their clearly de5ned semantics, whichcan formalize the linguistic terms used by users=designers when analyzing data. One can easilychange the size of information granules (by adjusting the membership functions) so that subsequentdata analysis may be performed at the most bene5cial and parsimonious level of detail.
2.2. Granular-based system
Representation of data using information granules leads to the application of models that are bothcapable of dealing with granules and expressive of their interrelationships. Fuzzy modeling, whichhinges on information granules, can generate such models, while fuzzy sets and fuzzy relationscan represent the granules. The interaction of the models with the environment (predominantlynumeric) is realized through model interfaces. The input interface (encoder or fuzzi5cation block)

114 M. Reformat et al. / Fuzzy Sets and Systems 145 (2004) 111–139
ENCODER DECODER PROCESSING UNIT ENCODER DECODER PROCESSING UNIT
(a) (b)
Fig. 1. Two fundamental scenarios of the development of fuzzy models (gray boxes represent areas of modeling activity):external optimization at the level of numeric data (a) and internal optimization at the level of fuzzy sets in the input andoutput space (b).
expresses input data in the format compatible with fuzzy set granules. The output interface (decoderor defuzzi5cation module) translates the results, derived from the appropriate level of granularity,into the numeric format of the modeling environment (where the original numeric data come from).
As discussed in [12], two main modeling and ensuing development scenarios can be envisioned,refer to Fig. 1.
In the 5rst scenario (Fig. 1(a)), we are concerned with the external optimization of the fuzzy modelviz. a way in which it manifests at the level of numeric experimental data. From the functionalstandpoint, the fuzzy model is a structure of three mappings put in series, that is the encoderx=ENC(x), the processing part of the fuzzy model, y=FM (x; p), and the decoder y=DEC(y)where x and y are elements in the unit hypercube while “x” and “y” are the respective input andoutput of the model manifested at the numeric level, that is x, y are reals. As the experimental dataare given in the form of input–output numeric pairs, say {x(k); target(k)}, k = 1; 2; : : : ; N , and werequire that y(k) (the output of the fuzzy model for the input x(k)) equal target(k); y(k)≈ target(k),the optimization of the parameters of the fuzzy model (p) requires a backpropagation of the errorthrough the decoder. In other words, the gradient-based scheme requires the calculations of thefollowing expression
@y(k)@pi
=@DEC(y)@FM (x; p)
@FM (x; p)@pi
where “i” denotes the ith position of the vector of the parameters of the fuzzy model. It becomesevident that the form of the decoder plays an important role in the optimization process becauseof the chaining e6ect i.e., a way in which the parameters of the model (p) can be “accessed”for optimization purposes. Furthermore as both the encoder and decoder are included in the modelidenti5cation, they may be optimized as well.
While the 5rst scenario could be viewed an external mode of fuzzy identi5cation, the second oneis an internal one. As shown in Fig. 1(b), the processing module is optimized here. The originaltraining data {x(k), target(k)} are converted through fuzzy sets occurring in the encoding anddecoding blocks {x(k); target(k)} and as such used for the optimization of the fuzzy model. Weconsider these fuzzy sets to be 5xed in advance. In other words, we end up with a requirement

M. Reformat et al. / Fuzzy Sets and Systems 145 (2004) 111–139 115
target i yi
wij
zjxk
vjk
n h m
AND OR
Fig. 2. A structure of the fuzzy neural network along with detailed notation.
y(k)≈ target(k) k = 1; 2; : : : ; N . More realistically, a sum of squared errors needs to be minimizedwith regard to the structure of the fuzzy model (FM) and its parameters,
Q =N∑
k=1
(FM (x(k); p) − target(k))T(FM (x(k); p) − target(k)) ⇒ Min:
In this study, we concentrate on granular modeling, which is geared toward internal optimization,Fig. 1b. This type of optimization promotes the interpretability of the fuzzy model as we focus onthe mapping of the fuzzy sets rather than the numeric experimental data.
The structure of the fuzzy neural network, Fig. 2, is fully determined by the structural optimization.The gradient-based learning of the network leads to further re5nements that appear at the numericlevel. Proceeding with the architectural details, the fuzzy neural network is governed by the followingexpressions (refer to Fig. 2).
As we noted, the mapping from the structure to the fuzzy neural network is straightforward. Recallthat an h-input single output OR neuron is described in the form
y = OR(z;w)
where z; y∈ [0; 1]. The connections w1; w2; : : : ; wh are arranged in a vector form (w). Rewriting theabove expression in a coordinate-wise manner, we obtain
y =hSi=1
(zitwi)
where ‘t’ means t-norm modeling logical connection AND, and ‘s’ is a t-conorm representing logicalconnection OR. The above expression means that the neuron realizes an s–t composition of thecorresponding 5nite sets z and w.

116 M. Reformat et al. / Fuzzy Sets and Systems 145 (2004) 111–139
Table 1A learning environment of the fuzzy neural network: speci5cation of the problem and an on-linelearning algorithm
On-line learning mode:(updates of the connections are preformed after processing ofeach input–output pair of data: {x target})Performance index: Q =�k(y(k) − target(k))T(y(k) − target(k))(where y(k) is the output of the network for a data point k)Initial connections: random initializationUpdate formulas for the connections
wij(iter+) = wij(iter) − �@Q
@wij(iter)
vjk(iter+) = vjk(iter) − �@Q
@vjk(iter)
The AND neuron z=AND(x; v) is governed by the expression
z =nTi=1
(xisvi)
with ‘t’ and ‘s’ de5ned as above. Computationally, this neuron realizes a standard t–s compositionof x and v.
The role of the connections in both neurons is to weight the inputs in order to provide suHcientparametric Mexibility. A monotonicity property holds. In case of OR neurons, the higher the connec-tion weight, the more essential the associated input. For AND neurons an opposite situation holds:a lower connection weight indicates that the respective input is more essential. In general, a certainthresholding operation can be sought. For any OR neuron, we consider the input irrelevant if theassociated connection weight assumes values lower than 0.5. An input of the AND neuron is viewedirrelevant if the connection weight exceeds 0.5.
The learning is realized as a gradient-based optimization scheme [11]. The details of the on-linelearning algorithm are given in Table 1. The listed computations use the t-norm and t-conorm speci-5ed as a product operation and a probabilistic sum. The choice of these intuitively simple (co)normshas been motivated by the fact that they are commonly used in many implementations of fuzzyneural networks. However, they lead to problems related to data dimensionality (see below).
The parametric learning of the fuzzy neural network has been well developed and documented inthe literature [11,14]. Several general observations are worth summarizing:
• The gradient-based learning supports optimization that may result in a local minimum of theperformance index. Global minimum could be out of reach of this learning mechanism.
• The eHciency of learning depends upon the choice of the triangular norms and co-norms. Herethe minimum and maximum operators deserve particular attention as they lead to optimizationtraps. One of the reasons is that both minimum and maximum are non-interactive meaning thatthe results depend upon extreme values encountered and the 5nal outcome does not reMect theremaining arguments of these t- and s-norms. On the other hand, for most other t-norms, we

M. Reformat et al. / Fuzzy Sets and Systems 145 (2004) 111–139 117
may end up with a saturation e6ect that may be extremely diHcult to handle in case of higherdimensions of the problem. For instance, consider the product as a model of the t-norm. If thenumber of arguments increases, the result of aggregation carried out in this way tends to zero.Now, if one envisions such an AND neuron located in the input layer of the fuzzy neural networkand assume that all connections are the same and equal to zero, the output of the neuron reads asz=
∏ni=1 xi. For any input less than one, say 1 − " we end up with the output equal to (1 − ")n.
One can easily check that a situation in which "= 0:5 and n= 40 inputs produces the output ofthe neuron equal to 9:095 ∗ 10−13. This activation level reduces quickly once the dimensionalityof the problem goes up.
• The learning may be very slow especially when the size of the network gets large. The wayin which the connections are initialized (random values) precludes any initial associations topreliminary knowledge about the network structure (this implies a fully connected topology whereall neurons are connected with the neurons in neighboring layers), nor it can guard against thecurse of dimensionality.
In light of these observations, the general design paradigm proposed in this study is stronglysupported. Instead of learning the fuzzy neural network from scratch (a process that may fail quiteeasily), we concentrate 5rst on establishing a structural blueprint of the network and then continuewith the learning of the connections. In the approach proposed, the structural optimization meansselection of a given (usually small) number of connections between input and hidden nodes, aswell as between hidden and output nodes. E6ectively, this network blueprint reduces the numberof connections to be learned and practically eliminates the saturation e6ect (see above). Structuraloptimization of the network cannot be achieved through parametric (gradient-based) optimizationand requires methods along the line of evolutionary computing [8,20].
3. Evolutionary-based synthesis of granular models
3.1. Concept
The evident diversity of fuzzy models existing in the literature is amazingly uniform in termsof their underlying design. In a nutshell, the original numeric data are transformed through fuzzysets and this is followed by the construction (estimation) of the parameters of the fuzzymodel.
In contrast, the proposed development of the fuzzy model comprises three fundamental phases:
• First, we produce a collection of fuzzy sets (or fuzzy relations) that may be regarded as basicconceptual “building” blocks of the fuzzy model. We would like these entities to be as independentas possible from the ensuing detailed structure of the model. In this sense, these informationgranules stand on their own and exhibit a well-de5ned semantics.
• Second, we look for a structure of the fuzzy model. Any structural optimization of the model is farmore challenging than a parametric optimization (adjustment of the values of the parameters). Atthis phase, we exploit evolutionary computing to optimize the structure. Furthermore, the structuraloptimization is carried out independently from parametric optimization. By distinguishing betweenthe structure and the parameters, we attempt to concentrate on the topology of the model and
118 M. Reformat et al. / Fuzzy Sets and Systems 145 (2004) 111–139
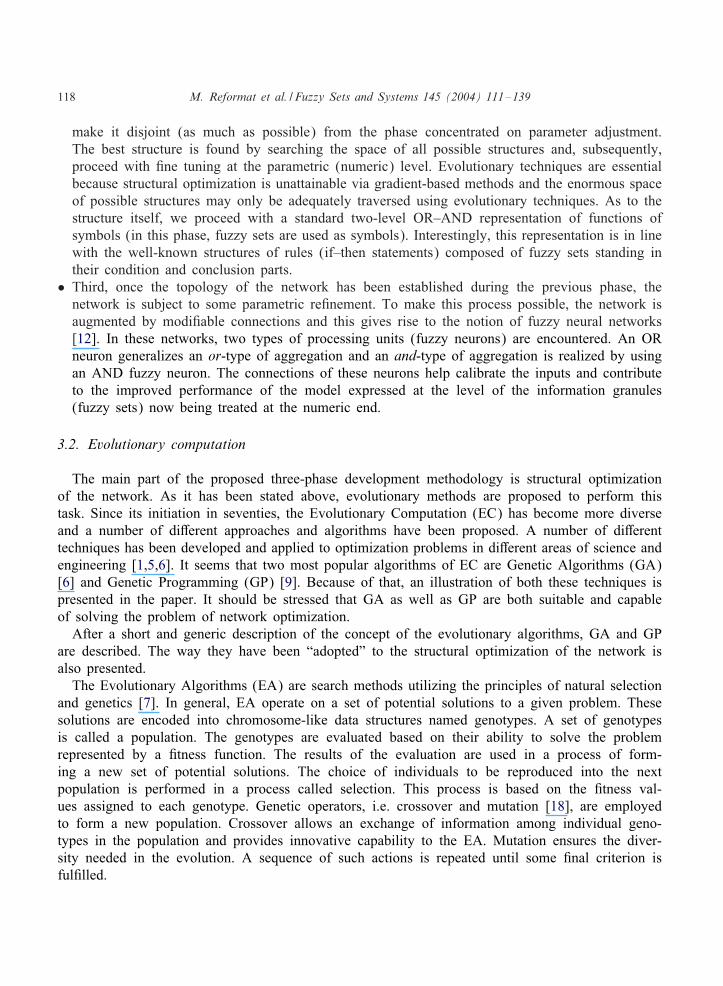
make it disjoint (as much as possible) from the phase concentrated on parameter adjustment.The best structure is found by searching the space of all possible structures and, subsequently,proceed with 5ne tuning at the parametric (numeric) level. Evolutionary techniques are essentialbecause structural optimization is unattainable via gradient-based methods and the enormous spaceof possible structures may only be adequately traversed using evolutionary techniques. As to thestructure itself, we proceed with a standard two-level OR–AND representation of functions ofsymbols (in this phase, fuzzy sets are used as symbols). Interestingly, this representation is in linewith the well-known structures of rules (if–then statements) composed of fuzzy sets standing intheir condition and conclusion parts.
• Third, once the topology of the network has been established during the previous phase, thenetwork is subject to some parametric re5nement. To make this process possible, the network isaugmented by modi5able connections and this gives rise to the notion of fuzzy neural networks[12]. In these networks, two types of processing units (fuzzy neurons) are encountered. An ORneuron generalizes an or-type of aggregation and an and-type of aggregation is realized by usingan AND fuzzy neuron. The connections of these neurons help calibrate the inputs and contributeto the improved performance of the model expressed at the level of the information granules(fuzzy sets) now being treated at the numeric end.
3.2. Evolutionary computation
The main part of the proposed three-phase development methodology is structural optimizationof the network. As it has been stated above, evolutionary methods are proposed to perform thistask. Since its initiation in seventies, the Evolutionary Computation (EC) has become more diverseand a number of di6erent approaches and algorithms have been proposed. A number of di6erenttechniques has been developed and applied to optimization problems in di6erent areas of science andengineering [1,5,6]. It seems that two most popular algorithms of EC are Genetic Algorithms (GA)[6] and Genetic Programming (GP) [9]. Because of that, an illustration of both these techniques ispresented in the paper. It should be stressed that GA as well as GP are both suitable and capableof solving the problem of network optimization.
After a short and generic description of the concept of the evolutionary algorithms, GA and GPare described. The way they have been “adopted” to the structural optimization of the network isalso presented.
The Evolutionary Algorithms (EA) are search methods utilizing the principles of natural selectionand genetics [7]. In general, EA operate on a set of potential solutions to a given problem. Thesesolutions are encoded into chromosome-like data structures named genotypes. A set of genotypesis called a population. The genotypes are evaluated based on their ability to solve the problemrepresented by a 5tness function. The results of the evaluation are used in a process of form-ing a new set of potential solutions. The choice of individuals to be reproduced into the nextpopulation is performed in a process called selection. This process is based on the 5tness val-ues assigned to each genotype. Genetic operators, i.e. crossover and mutation [18], are employedto form a new population. Crossover allows an exchange of information among individual geno-types in the population and provides innovative capability to the EA. Mutation ensures the diver-sity needed in the evolution. A sequence of such actions is repeated until some 5nal criterion isful5lled.

M. Reformat et al. / Fuzzy Sets and Systems 145 (2004) 111–139 119
3.2.1. Genetic algorithmsGA are one of the most popular methods of evolutionary computation. An implementation of
a typical GA begins with the creation of an initial population, which consists of genotypes gen-erated at random. Next, an evaluation of genotypes from an initial population is performed. Eachgenotype string is broken into substrings that are used as the input values to the 5tness func-tion. The number of substrings depends on the problem to be solved and is unlimited. The 5tnessvalue is assigned to each genotype based on the value of 5tness function obtained for a givengenotype. An intermediate population is created next. This population is the result of a selectionprocess.
The selection can be performed in numerous ways. One of them is called stochastic samplingwith replacement. In this method, the entire population is mapped onto a roulette wheel where eachindividual is represented by the area corresponding to its 5tness. Individuals of an intermediatepopulation are chosen by repetitive spinning of the roulette wheel.
Finally, the operations of crossover and mutation are performed on individuals from intermediatepopulation. This process leads to the creation of the next population. Crossover is applied to therandomly paired genotypes from the intermediate population with the probability pc. In the case ofa basic crossover, called one-point crossover, the genotypes of each pair are split into two parts atthe crossover point generated at random, and then recombined into a new pair of genotypes. In thecase of mutation, all bits in all substrings of genotypes are altered with the probability pm.
All steps described above are then repeated. The population being evaluated is named the currentpopulation and is the same as the next population from the previous iteration (each iteration isreferred to as a generation). GA pseudo-code is presented below where PGA(tGA) denotes the GApopulation at tGA generation.
Genetic algorithmtGA := 0initialize PGA(tGA)evaluate PGA(tGA)while not terminate do
P′GA(tGA) := select (PGA(tGA));
P′′GA(tGA) := crossover (P′
GA(tGA));P′′′
GA(tGA) := mutate (P′′GA(tGA));
PGA(tGA + 1) :=P′′′GA(tGA);
tGA := tGA + 1;evaluate PGA(tGA)
od
3.2.2. Genetic programmingAnother evolutionary algorithm is GP. GP can be seen as an extension of the genetic paradigm
into the area of programs. Objects, which constitute the population, are not 5xed-length stringsthat encode possible solutions to the given problem, but they are programs, which “are” candidatesolutions to the problem. In general, these programs are expressed as parse trees, rather than aslines of code. A tree representation of a simple program (instruction) “a+ b∗c” is shown in Fig. 3.

120 M. Reformat et al. / Fuzzy Sets and Systems 145 (2004) 111–139
c
+
a *
b
Fig. 3. Tree representation of the instruction “a + b ∗ c”.
This representation of candidate solutions combined with some constraints regarding their structureallows for a straightforward representation of di6erent structures. Each structure is evaluated bysolving a given problem. After the evaluation a selection is performed. In this process, individualsare chosen to form the next population. The choice is made on the basis of favoring individualswith higher 5tness values [1,6]. Crossover and mutation are two operations, which modify structuresperforming manipulations on the lists [9]. This results in overall “improvement” of individuals fromone generation to the next.
3.3. Genetic algorithms-based construction of models
Having identi5ed the shortcomings of learning in the fuzzy model, an intuitively appealing ap-proach has been proposed. It relays on a hybrid learning methodology comprising of two fundamentaltechniques, namely genetic optimization and gradient-based optimization.
To battle the dimensionality problem, a skeleton of the network is constructed by detecting themost essential connections that shape the architecture and then the detailed optimization of these con-nections is performed. As to the blueprint, the network has to capture the essence of the mapping ofan input to an output. Therefore, the connections are binary (0–1) for the purpose of this optimiza-tion. The optimization has to be global. In light of these two requirements, genetic optimization isa suitable avenue to follow.
A standard version of a GA is considered 5rst as an optimization method used for structuraloptimization. The structure of the network is represented by a binary string. As the connectionsare two-valued, the entries of the string map directly onto the connections of the neurons. Thearrangement of the connections is presented in Fig. 4, which illustrates the details of the structure ofthe network pertain to the data with 36 inputs (12 input variables with 3 fuzzy sets per variable) 3outputs (that is, 3 fuzzy sets de5ned for the output variable) and connectivity of 2 inputs per nodein the hidden layer.
The treatment of the connections as binary entities is highly desirable. By doing this, we concen-trate our e6ort on the determination of the most essential structure of the model that attempts toreveal the crux of its topology. We anticipate that such structure will hold in spite of small varia-tions in data and therefore could be regarded as a Boolean “skeleton” of the processing core of themodel.

M. Reformat et al. / Fuzzy Sets and Systems 145 (2004) 111–139 121
#1
#2
#3
#3
#2
#1
7 in4_1
in4_2
in4_3
in5_1
in5_2
in5_3
in6_1
in6_2
in6_3
in7_1
in7_2
out_3
out_2
out_1
15 8 10 15 7 18 1
hidden nodes
#2
0 0 1 0 1 0 1 1
#1 #3 output nodes
#3 #2 #1
8
9
10
11
12
13
14
15
16
17
18 in7_3
hidden nodes output nodes
Fig. 4. A part of the network and its one-to-one correspondence with the binary string to be optimized by GA.
The binary connections of the neuron have a straightforward interpretation. In the case of theAND neuron: if the connection is equal to zero, this means that the corresponding input impacts theoutput of this neuron. For the OR neuron, the converse holds: a connection equal to one impliesthat the speci5c input is essential and a6ects the output of the neuron.
From the design standpoint, we can control the development of the topology of the network. Inparticular, we can 5x the level of connectivity between the input and hidden layer. We may refer toa maximal number of connections from the input nodes to each node (AND neuron) in the hiddenlayer as the network connectivity. For instance, if we have two inputs to the 5rst AND neuron, fourto the second and three to the third, we say that the connectivity of the neuron is equal four.
122 M. Reformat et al. / Fuzzy Sets and Systems 145 (2004) 111–139
This connectivity analysis o6ers some insight into the nature of the data. First, the number ofmeaningful (zero) connections of the neuron determines a local dimensionality of the input space;the contributing inputs form this local space. The dimensionality of this space can vary from neuronto neuron. By varying the maximum number of connections that are allowed, we can better realizethe intrinsic dimensionality of the data space. The connections of the OR neuron indicate which ofthese local input spaces contribute to the output of the network.
An initial con5guration of the network skeleton is set up as follows. For the given number ofneurons in the hidden layer and the connectivity level (that is the number of the inputs goingto each neuron in the hidden layer), we randomly initialize the connections of the AND neu-rons (making sure that the number of the connections between the inputs and each neuron isas speci5ed). Initially, the connections of the OR neurons are all equal to one. Then we allowthe genetic optimization to adjust the connections. The adjustment of connections is driven bythe 5tness function, which is an objective function of an optimization process. The adjustmentsare realized by the two genetic operations: crossover and mutation. Details of these elements areas follow:
• Fitness functionThe role of the 5tness function is to assess how well the model matches the experimental data.We are concerned with fuzzy sets de5ned in the input spaces. While they show up in the listsas symbols (say, A1, B3, etc.), their membership functions are present in the computations of the5tness function. The 5tness function is computed in the form:
Fit Fun =1
1 + Q;
where Q is a commonly used performance index assuming the form
Q =N∑
k=1
(F(k) − F̂(k))T(F(k) − F̂(k))
with N being the number of training data points
F(k) = [F1(k); F2(k); : : : ; Fm(k)]T;
F̂(k) = [F1(k); F2(k); : : : ; Fm(k)]T;
Fi(k) the value of the output “i” for given training data point “k” obtained from the model; F̂ i(k)the original value of the output “i” for given training data point “k”; m the number of outputs,equal to number of fuzzy sets de5ned in the output space
• CrossoverThe role of this operator is to explore the search space formed by a collection of lists. Themechanism of a possible crossover is presented in Fig. 5. An arbitrary point in the parent stringsis picked and the information is exchanged between parents. As a result, two new strings areobtained that have beginnings and ends coming from di6erent parent strings.

M. Reformat et al. / Fuzzy Sets and Systems 145 (2004) 111–139 123
hidden nodes
#2
#1
#3
output nodes
#3
#2
#1
0 1 0 1 0 1 1 0 1 18 7 8 10 15 15
hidden nodes
#2
#1
#3
output nodes
#3
#2
#1
1 0 0 1 1 1 0 1 1 11 10 16 7 2 5
hidden nodes
#2
#1
#3
output nodes
#3
#2
#1
0 1 0 1 0 1 1 0 1 18
7 8 10 15 15
hidden nodes
#2 #1 #3 output nodes
#3
#2
#1
1 0 0 1 1 1 0 1 1 11
10 16 7 2 5
Fig. 5. Crossover operation used in the genetic optimization of the model.
• MutationThe role of mutation is to introduce diversity into a population and promote a probabilistic-liketraversing of the search space. As shown in Fig. 6, mutations form a new binary string by makingan alteration to the string in a copy of a single, parent string.
3.4. Genetic programming-based construction of models
The second approach to evolutionary-based construction of models uses GP as an optimizationtool. Di6erences of GP, in comparison to GA, result in di6erent and more Mexible representations ofthe constructed models. GP operates on a population of lists, which are blueprints of fuzzy models.In other words, each individual of a population—a list—represents a single fuzzy model. A fuzzyneural network of single output is a tree with an OR node as the root, AND nodes at the 5rst level,and nodes representing inputs at the second level (see Fig. 7). The OR and AND nodes can havemultiple inputs. Additionally, in order to represent fuzzy neural networks with multiple outputs, asingle AND node can be connected to more than one OR node.
A population of fuzzy models evolves according to the rules of selection and genetic operationssuch as crossover and mutation. Each individual in the population (Fig. 8) is evaluated by means

124 M. Reformat et al. / Fuzzy Sets and Systems 145 (2004) 111–139
hidden nodes
#2
#1
#3
output nodes
#3
#2
#1
0 1 0 1 0 1 1 0 1 18 7 8 10 15 15
hidden nodes
#2 #1 #3 output nodes
#3
#2
#1
0 1 0 1 0 1 1 0 1 6 7 8 10 15 15
Fig. 6. Mutation operation used in the genetic optimization of the model.
b
OR
a
AND
a
AND
AND
c b
b
c
Fig. 7. Tree representation of a simple fuzzy neural network.
D1
AND
C2 AND
D2C1 AND
C2B2
OR OR
Y1 Y2
B3
A1
Fig. 8. Single list representation of the fuzzy neural network. The fuzzy sets, A2, B2, C1, C2, D1, D2, are de5ned usingthe respective inputs (input spaces), A, B, C , D. The fuzzy sets, Y1, Y2, are de5ned using the output space Y.
M. Reformat et al. / Fuzzy Sets and Systems 145 (2004) 111–139 125
of a certain 5tness function. In this process, individuals are selected to form the next population onthe basis of favoring individuals with higher 5tness values [1,6,7,9].
Crossover and mutation are two operations that modify the structure of fuzzy models performingmanipulations on the lists [19]. This results in “improvement” of population from generation togeneration. Let us discuss these components in detail.
• Fitness functionThe 5tness function represents an objective of the optimization process. The GP-based constructionprocess uses the same 5tness function as the GA-based process, i.e.
Fit Fun =1
1 + Q;
where Q is a commonly used performance index representing the error between the output of thenetwork and the outputs of the training data points, its form is
Q =N∑
k=1
(F(k) − F̂(k))T(F(k) − F̂(k))
(the description of used symbols is in Section 3.3)• Crossover
The proposed GP approach uses two crossover operations. One of them is performed at the levelof inputs to OR node. In other words, it means that this crossover leads to exchange of numberof AND nodes. The mechanism of the crossover is presented in Fig. 9a. Two arbitrary points inparent structures A and B are picked. A structure from parent A is copied from the root downto the crossover point, then a structure from parent B is copied from the crossover point to thebottom of the structure. The new structure is a concatenation of a “head” of one parent structurewith a “tail” of the other.
The second crossover operation is performed at the level of AND node inputs. In this casean exchange process is restricted only to inputs to an AND node. The crossover is illustrated inFig. 9b. As it can be seen, a set of inputs from a randomly selected AND node replaces a set ofinputs of a randomly selected AND node from the other parent.
Using two crossover mechanisms we have introduced di6erent levels of alternation of parentsin a process of creation of o6spring. By its nature a GP crossover creates a di6erent o6springcreated as the result of crossover of two identical parents. This can have a disruptive e6ect aswell as be useful in a process of searching of the domain.
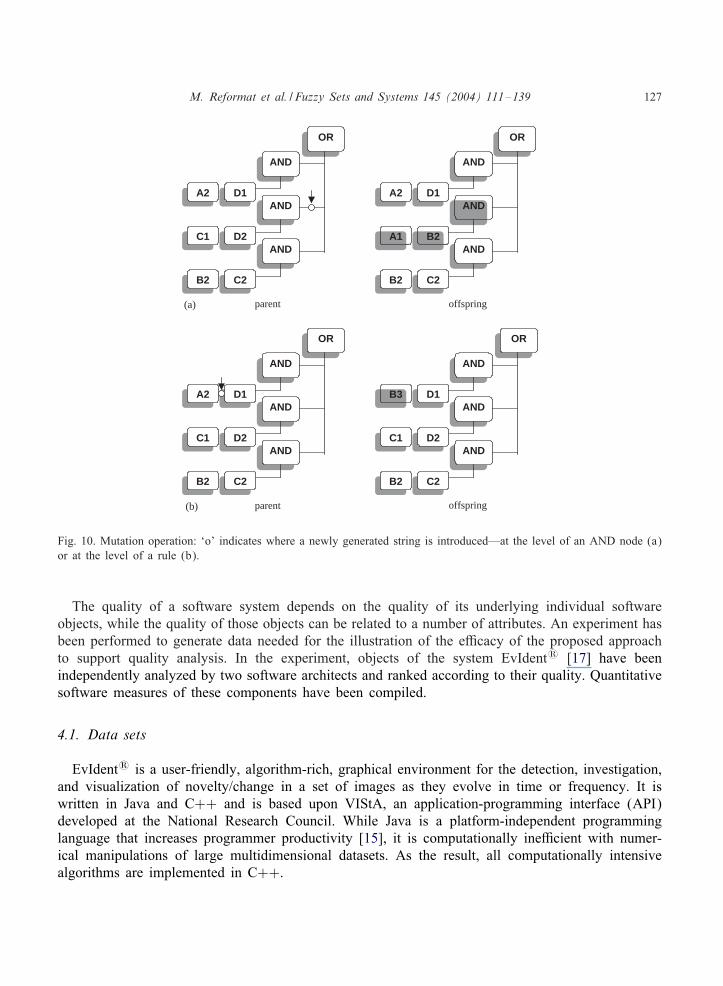
• MutationThe GP mutation is shown in Fig. 10, mutations build new structures by making (usually small)alterations to the string in a copy of a single, parent structure. Also in the case of mutation wecan have two kinds of mutation operations. The one which is performed on the level of ANDnodes, Fig. 10a, and the other performed on the level of inputs to a single AND node, Fig. 10b.
An important step in GP is the generation of an initial population of strings (structures). Alllists representing fuzzy models are generated randomly with the constraint that each AND nodecannot have more than one fuzzy set de5ned for the same variable. The interpretation aspect of theensuing model motivates the introduction of this constraint as any eventual duplicates are not easily

126 M. Reformat et al. / Fuzzy Sets and Systems 145 (2004) 111–139
D1
AND
A2AND
D2C1AND
C2B2
OR
D1
AND
A2AND
C2B3
OR
B2
AND
A1AND
D2A1AND
C2B3
OR
parent A offspring parent B
(a)
D1
AND
A2AND
D2C1AND
C2B2
OR
B2
AND
A1AND
D2A1AND
C2B3
OR
D1
AND
A2AND
D2 AND
C2 B2
OR
B2A1
parent A parent B offspring
(b)
Fig. 9. Crossover operation (‘o’ indicates a crossover point). Crossover can be done at the level of AND nodes (a), or atthe level of rules (b).
interpretable. The same approach is used for the mutation operation, where new strings of inputsare created (Fig. 10). In the case of crossover, we carry out checking for a repetition of fuzzy setsoccurring in strings of the same rule obtained during the exchange process (Fig. 9b).
4. Quality assessment of software objects
A primary aim of the Experience Factory is to support activities that lead assurances of softwarequality. Gathering experience related to these activities and 5nding ways to simulate and performthem is an important element of the Factory. The presented approach of a granular-based modelis applied to software quality data obtained during a process of quality evaluation. The developedmodel, which at the same time represents knowledge related to software quality evaluation, becomesan essential part of the Factory. The model can also serve as a “quality 5lter” for software objects.Using it, a system manager can evaluate quality of software objects and identify low quality objectsfor review and possible revision.
M. Reformat et al. / Fuzzy Sets and Systems 145 (2004) 111–139 127
D1
AND
A2 AND
D2 C1 AND
C2 B2
OR
D1
AND
A2AND
B2A1AND
C2B2
OR
parent offspring (a)
parent offspring
D1
AND
A2 AND
D2 C1 AND
C2 B2
OR
D1
AND
B3AND
D2C1AND
C2B2
OR
(b)
Fig. 10. Mutation operation: ‘o’ indicates where a newly generated string is introduced—at the level of an AND node (a)or at the level of a rule (b).
The quality of a software system depends on the quality of its underlying individual softwareobjects, while the quality of those objects can be related to a number of attributes. An experiment hasbeen performed to generate data needed for the illustration of the eHcacy of the proposed approachto support quality analysis. In the experiment, objects of the system EvIdentJ [17] have beenindependently analyzed by two software architects and ranked according to their quality. Quantitativesoftware measures of these components have been compiled.
4.1. Data sets
EvIdentJ is a user-friendly, algorithm-rich, graphical environment for the detection, investigation,and visualization of novelty/change in a set of images as they evolve in time or frequency. It iswritten in Java and C++ and is based upon VIStA, an application-programming interface (API)developed at the National Research Council. While Java is a platform-independent programminglanguage that increases programmer productivity [15], it is computationally ineHcient with numer-ical manipulations of large multidimensional datasets. As the result, all computationally intensivealgorithms are implemented in C++.

128 M. Reformat et al. / Fuzzy Sets and Systems 145 (2004) 111–139
EvIdent
VIStA GUI Package
Data Models Algorithms
Native Methods
C++
Java
Fig. 11. EvIdentJ software model with the VIStA API.
The VIStA API is written in Java and o6ers a generalized data model, an extensible algorithmframework, and a suite of graphical user interface constructs. Using the Java Native Interface, VIStAallows seamless integration of native C++ algorithms. Fig. 11 shows the class model and relation-ships between the three main Java packages used in VIStA.
All Java-based EvIdentJ=VIStA objects have been used in this study (C++-based objects wereexcluded). For each of the 312 objects, two system architects, A1 and A2, were asked to indepen-dently rank its quality (low, medium, or high) with respect to extensibility, maintainability, eHciency,and clarity. The rankings were based entirely on the subjective assessments done by the architects.If an object was assessed to be in need of signi5cant rewriting, then it received the label, low. If anobject was deemed to be so well written that it would have been included in our coding standardsdocument, as an example of good programming practice, then the object received the label, high.A label of medium was assigned otherwise.
A set of n= 19 software metrics were compiled for each object. Table 2 lists the minimum,maximum, and mean for each object. NM , IC, KIDS, SIBS, and FACE are the respective numberof methods, inner classes, children, siblings, and implemented interfaces for each object. DI is theobject’s depth of inheritance (including interfaces). The features rCC and rCR are the respectiveratios of lines of code to lines of comments and overloaded inherited methods to those that are not.CBO is a measure of coupling between objects, a count of the number of other objects to whichthe corresponding object is coupled.
RFO is a measure of the response set for the object, that is, the number of methods that canbe executed in response to a message being received by the object. Note that the standard Javahierarchy was not included in the calculations of IC, KIDS, SIBS, FACE, DI , and RFO.LCOM , the lack of cohesion in methods, is a measure that reveals the disparate nature of an
object’s methods. If Ij is the set of instance variables used by method j, and the sets P and Q arede5ned as
P = {(Ii; Ij) | Ii ∩ Ij = ∅};Q = {(Ii; Ij) | Ii ∩ Ij = ∅}
then, if card(P)¿card(Q), LCOM = card(P) − card(Q), otherwise LCOM = 0 [16].LOC, TOK , and DEC are the number of lines of code, tokens, and decisions, respectively. The
5nal feature, WND, is a weighted measure of the number of nested decisions (the greater the nestingthe greater the associated weight). There are also mLOC, mTOK , mDEC, and mWND representingmean values per method of LOC, TOK , DEC, and WND.

M. Reformat et al. / Fuzzy Sets and Systems 145 (2004) 111–139 129
Table 2Set of software measures
Feature Min Max Mean
NM 0 162 14.4LOC 0 5669 296.7mLOC 0 108 15.9TOK 0 26,611 1387.2mTOK 0 16,383 1051.2DEC 0 582 25.1mDEC 0 21 1.6WND 0 1061 51.6mWND 0 91 3.4IC 0 20 0.7DI 0 3 0.4KIDS 0 10 0.3SIBS 0 16 1.0FACE 0 5 0.5rCC 0 348 11.3rCR 0 2.5 0.1CBO 0 11 1.0LCOM 0 9018 193.0RFO 0 1197 66.1
An attribute, Quality Assessment (QA), has been identi5ed as output attribute of an object. QArepresents ranking of the quality assessment performed by the architects where 1 means low, 2 meansmedium and 3 means high.
4.2. Analysis of results
Synthesis of models representing the architects is performed using the GA-based approach. Soft-ware measures representing objects are inputs to the models. Granulation of input is done by de5ning3 fuzzy sets for each software measure with the following linguistic labels: small, medium and large.The output of the models represents quality of the objects. Discrete character of the output (1—lowquality, 2—medium quality, 3—high quality) has lead to some modi5cations of a 5tness functionbeing used in the experiments. An element representing a number of properly evaluated objects hasbecome a part of a 5tness function.
The models are developed for each architect independently. 2=3 of the data are used as a trainingset during construction of the models, and the remaining 1=3 is used as a test set. Applied GeneticAlgorithm has had a tournament selection, one-point crossover, a uniform mutation, and a populationof size 200, crossover probability of 0.85 and mutation probability of 0.45. The algorithm has usedelitist strategy and run for 500 generations.
A series of experiments for two parameters controlling the structure of the network, the level ofconnectivity and the number of AND nodes in the hidden layer, has been carried out. The trainingand test set results for the 5rst architect are presented in Table 3 where the performance index isthe average error per data point. These quantities present the results independently from the size of

130 M. Reformat et al. / Fuzzy Sets and Systems 145 (2004) 111–139
Table 3The results of the GA optimization of the network for the 5rst architect using the training (a) and test (b) sets (3membership functions, the case in boldface is used in further optimization of the model)
Connectivity no.
Hidden nodes no. 2 3 4 5
(a) Training data set—after GA, before tuning2 0.2347 0.2379 0.2505 0.25503 0.2467 0.2495 0.2860 0.29934 0.2557 0.2573 0.2944 0.31955 0.2420 0.2484 0.2670 0.28036 0.2488 0.2522 0.2707 0.27597 0.2469 0.2491 0.2423 0.28938 0.2448 0.2464 0.2663 0.27729 0.2482 0.2317 0.2524 0.2685
10 0.2250 0.2397 0.2617 0.2739
(b) Testing data set—after GA, before tuning2 0.2471 0.2506 0.2643 0.25773 0.2521 0.2610 0.2851 0.29924 0.2612 0.2701 0.2953 0.31785 0.2468 0.2611 0.2674 0.29016 0.2608 0.2562 0.2718 0.28247 0.2538 0.2573 0.2559 0.29148 0.2559 0.2516 0.2661 0.28689 0.2584 0.2455 0.2559 0.2679
10 0.2414 0.2489 0.2680 0.2760
the training and testing sets. The table shows the values of the performance index of networks withdi6erent number of hidden nodes (rows) and di6erent connectivity number (columns).
It can be said that for a 5xed connectivity, the increase of the size of the hidden layer results (ingeneral) in lower values of the performance index. A number of hidden nodes represents a numberof if–then rules which can be extracted from the network. It means that an increased number ofrules leads to better “coverage” of the input data space. At the same time the increased number ofhidden nodes (if–then rules) leads to diHculties with comprehension of the results. Therefore, wehave limited the number of the hidden nodes to ten.
It is also interesting to learn that the increased connectivity for a 5xed size of the hidden layergives rise to higher values of the performance index. The experiments have been designed in a waythat a given connectivity is “forced” during a given experiment. It means that if the connectivity isthree then three inputs have to be attached to a single hidden node. It seems that the nature of thedata used is such that too many number of di6erent attributes in the “if” part of the rule does notlead to improvement of the performance index.
The “meaningful” connections of the AND neurons are those equal to zero. For the OR neurons,the connections equal to 1 are essential. The architecture of the constructed network is presented inFig. 12.
In the second development phase a blueprint of the network, produced by GA, is an objectof parametric optimization. The gradient-based learning starts with connections established by GAoptimization. At the beginning the weights of the connections from input nodes to hidden nodes

M. Reformat et al. / Fuzzy Sets and Systems 145 (2004) 111–139 131
mLOC_1
mLOC_2
TOK_1
mTOK_2
DEC_1
DEC_3
mWND_1
IC_2
IC_3
DI_1
KIDS_3
Q_3
Q_2
Q_1
SIBS_3
FACE_2
CBO_2
rCR_3
LOM_1
LOC_2
RFO_2
LOM_2
Fig. 12. A network generated by the GA optimization process “representing” the 5rst architect.
are equal to zero, and the weights of connections from the hidden notes to the output nodes areone. The gradient-based learning process modi5es these weights. This enhancement aims at furtherreduction in the value of performance index, Table 4.
The process of modi5cation of the weights can results in a modi5cation of the structure of thenetwork. If the weights of connections to AND nodes increase above 0.5, and if the weights ofconnections to OR node decrease below 0.5 then such connections have very little inMuence on theresults. In such case, these connections can be removed from the network. A new architecture ofthe network representing only valid connections (with weights below 0.5 for AND nodes, and above0.5 for OR nodes) is presented in Fig. 13.
The dominant (the weights ¡0:2 for AND, and ¿0:8 for OR) if-conditions for the networkrepresenting the 5rst architect are:
ifNUMBER OF INNER CLASSES is medium (IC 2)andLACK OF COHESION is medium (LOM 2)

132 M. Reformat et al. / Fuzzy Sets and Systems 145 (2004) 111–139
Table 4The results of the parametric optimization of the network for the 5rst architect for the training (a) and testing (b) sets
Connectivity no.
Hidden nodes no. 2 3 4 5
(a) Training data set—after tuning2 0.1902 0.1909 0.1887 0.19143 0.1900 0.1892 0.1911 0.19164 0.1907 0.1835 0.1875 0.19095 0.1856 0.1873 0.1884 0.19346 0.1877 0.1865 0.1902 0.18927 0.1868 0.1861 0.1853 0.18708 0.1860 0.1839 0.1852 0.18899 0.1880 0.1842 0.1879 0.1864
10 0.1831 0.1852 0.1843 0.1856
(b) Testing data set—after tuning2 0.2047 0.2071 0.2054 0.20203 0.1998 0.2002 0.2069 0.20454 0.2021 0.1990 0.1994 0.20515 0.1978 0.1995 0.2018 0.20936 0.2042 0.1982 0.2042 0.20527 0.2018 0.2018 0.2030 0.19398 0.1981 0.1994 0.1974 0.20209 0.2004 0.1992 0.2038 0.1990
10 0.1987 0.1957 0.2016 0.1964
thenESTIMATED QUALITY is small (Q 1)
ifNUMBER OF TOKENS is small (TOK 2)andNUMBER OF INNER CLASSES is medium (IC 2)
orMEAN NUMBER OF TOKENS is medium (mTOK 2)andNUMBER OF SIBLINGS is large (SIBS 3)
thenESTIMATED QUALITY is medium (Q 2)
ifNUMBER OF DECISIONS is small (DEC 1)andNUMBER OF CHILDREN is large (KID 3)
thenESTIMATED QUALITY is large (Q 3)

M. Reformat et al. / Fuzzy Sets and Systems 145 (2004) 111–139 133
mLOC_2
TOK_1
mTOK_2
DEC_1
DEC_3
mWND_1
IC_2
IC_3
DI_1
KIDS_3
Q_3
Q_2
Q_1
SIBS_3
FACE_2
rCR_3
LOM_1
RFO_2
LOM_2
0.95
0.99
0.51
0.55
0.88
0.77
0.84
0.77
0.99
0.63
0.00
0.10
0.00
0.35 0.61 0.28
0.00
0.00
0.43
0.45
0.00
0.00
0.09
0.00 0.00
Fig. 13. A network generated by the GA optimization process and tuned by parametric optimization “representing” the5rst architect; only valid connections are shown.
The same set of experiments has been repeated using data generated by the second architect. Inthis case, the resulting network is presented in Fig. 14. The dominant if-conditions are the following:
ifMEAN NUMBER OF DECISIONS is small (mDEC 1)andNUMBER OF IMPELMENTED INTERFACES is large (FACE 3)
orNUMBER OF DECISIONS is small (DEC 1)andMAEN NUMBER OF NESTED DECISIONS is medium (mWND 2)
thenESTIMATED QUALITY is small (Q 1)
ifNUMBER OF INNER CLASSES is large (IC 3)andNUMBER OF IMPELMENTED INTERFACES is medium (FACE 2)

134 M. Reformat et al. / Fuzzy Sets and Systems 145 (2004) 111–139
NM_1
NM_2
TOK_1
DEC_1
mDEC_1
mDEC_2
mWND_2
IC_3
FACE_2
Q_3
Q_2
Q_1
FACE_3
rCC_2
LOM_1
CBO_3
RFO_1
0.99 0.80
0.99
0.65
0.87 0.74
0.99
0.99 0.85
0.79
0.99
0.96
0.76
0.00 0.00
0.00
0.19
0.00
0.00 0.00
0.00
0.00
0.00
0.17
0.00
0.18
0.00
0.09
0.00
0.00
Fig. 14. A network generated by the GA optimization process and tuned by parametric optimization “representing” thesecond architect; only valid connections are shown.
orNUMBER OF DECISIONS is small (DEC 1)andMEAN NUMBER OF DECISIONS is medium (mDEC 2)
orNUMBER OF IMPELMENTED INTERFACES is large (FACE 3)andLACK COHESION METHODS is small (LOM 1)
thenESTIMATED QUALITY is medium (Q 2)
ifNUMBER OF METHODS is small (NM 1)
thenESTIMATED QUALITY is large (Q 3)
5. Module development e/orts
By its de5nition, the Experience Factory embraces all kinds of knowledge related to softwareprocess development. Development of software is not only design and construction but also testing

M. Reformat et al. / Fuzzy Sets and Systems 145 (2004) 111–139 135
Table 5List of attributes of the MIS dataLOC Length of code with commentsCL Length of code without commentsTCHAR Number of charactersTCOMM Number of commentsMCHAR Number of comment charactersDCHAR Number of code charactersN Program length, N =N1 + N2, where N1 is
the total number of operators, and N2 isthe total number of operands
NE Estimated program length, NE = 21 log2 21
+22 log2 22 where 21 is the number ofunique operators and 22 is the number ofunique operands
NF Jensen’s program length, NF = (log2 21)!+(log2 22)!
VG McCabe’s cyclomatic number, is onemore than the number of decision nodesin the control Mow graph
BW Belady’s bandwidth metric,where BW = 1=nSUM (iLi) and Li
represents the number of nodes at level iin a nested control Mow graph of n nodes,this metric is indicative of the averagelevel of nesting or width of the controlMow graph representation of the program
NC Number of changes
and di6erent forms of maintenance such as corrective and adaptive ones. In this case, it is impor-tant to know the relationships between the construction of objects and the number of defects andmodi5cations that objects have to go through. A model expressing relationships between softwaremeasures of software components and the number of needed modi5cations of each component needsto be constructed. Knowledge about these relationships can lead to increased accuracy of estimatesof software development processes, mostly during the phases of testing and maintenance.
5.1. Data set—a brief description
The Medical Imaging System (MIS) is a commercial software system consisting of approximately4500 routines. It is written in Pascal, FORTRAN and PL=M assembly code. In total, there are about400,000 lines of code. MIS development took 5 years and the system has been in commercial useat several hundred sites.
The MIS data set [10] contains a description of 390 software modules that comprise the system.The description is done in terms of 11 software measures (size of the code, McCabe complexitymeasure, Jensen complexity measure, etc.) and the number of changes made to each module due tofaults discovered during system testing and maintenance. A list of all attributes (software measures)is presented in Table 5, and their min, max and mean values in Table 6.

136 M. Reformat et al. / Fuzzy Sets and Systems 145 (2004) 111–139
Table 6Set of software measuresFeature Min Max Mean
LOC 0 5669 296.7CL 0 108 15.9TCHAR 0 26,611 1387.2TCOMM 0 16,383 1051.2MCHAR 0 582 25.1DCHAR 0 21 1.6N 0 1061 51.6NE 0 91 3.4NF 0 20 0.7VG 0 3 0.4BW 0 10 0.3NC 0 16 1.0
AND
AND
AND
OR
AND
N sm
OR
VG smTCOMM sm
NC low
NC high
NE lg
VG smN md
DCHAR sm
TCHAR md
DCHAR smMCHAR sm
AND
Fig. 15. An optimal structure of a two-output fuzzy network for the MIS data as the result of GP optimization.
5.2. Analysis of results
The fuzzy models are developed using 2=3 of the data points from the MIS data with the restused as a test set. The number of fuzzy sets is 3 in each input space (attribute), and 2 in the outputspace. All fuzzy sets are described by means of Gaussian membership functions.
The GP used in the experiments implements tournament selection, elitist strategy, and two kindsof crossover operation and two kinds of mutation operation that have been described in Section 3.4.Probabilities of crossover and mutation have been set to 0.9 and 0.3 respectively. The experimentshave been run with a population size of 200, and a number of generations equal to 1000.
The experiment is concerned with the development of a model with two outputs. Each of theoutputs represents a single fuzzy set de5ned in the output space. The optimized structure of suchmodel, the result of GP optimization, is shown in Fig. 15. Fig. 16 illustrates the course of the

M. Reformat et al. / Fuzzy Sets and Systems 145 (2004) 111–139 137
0 250 500 750 10000
5
10
15
20
Generation No.
Per
form
ance
Inde
x Q
Fig. 16. Performance index Q in successive generations of GP optimization.
0 500 1000 15009
10
11
12
Per
form
ance
Inde
x Q
Iteration No.
Fig. 17. Performance index Q in successive learning epochs for parametric learning of fuzzy neural network representingthe MIS data.
optimization process by changes in the values of the performance index Q. The normalized per-formance index Q̃ (that is the value of Q divided by the number of data points) of the optimalstructure is equal to 0.0235. Using the test set, Q̃ rises slightly to 0.0301. The optimal structure ofthe model contains 7 out of 11 attributes of the MIS data.
The fuzzy model obtained in the process of GP optimization is then optimized parametricallythrough a gradient-based learning. The learning rate (�) is set to 0.005 and it runs for 1500 learn-ing epochs. The values of the performance index versus successive learning epochs are shown inFig. 17. The normalized performance index, Q̃, of the optimal fuzzy neural network, after structuraland parametric optimization, is equal to 0.0187, and for the test set is 0.0269. The value of theindex, compared with its initial value after the structural optimization, improves by 20% in the caseof training data, and by 11% in the case of testing data.
The structure of the MIS data model after parametric optimization is presented in Fig. 18. In thismodel, all connections have been augmented by the values, which change the signi5cance of someinput sets and the rules. The dominant if-condition for membership function low is “N is medium

138 M. Reformat et al. / Fuzzy Sets and Systems 145 (2004) 111–139
AND
AND
AND
OR
AND
N sm
OR
VG smTCOMM sm
NC low
NC high
NE lg
VG smN md
DCHAR md
TCHAR md
DCHAR smMCHAR sm
AND
.8859
.8095.0000
.0139
.2293
.7150
.8852
.9965
.0000
.9176
.5156
.5617
.1844
.0000
.0563
.0000.5618
Fig. 18. Structure of a two-output fuzzy network after parametric optimization representing the MIS data.
AND VG is small”. In the case of high membership function, there are only two if-conditions“TCHAR is medium AND NE is large” and “DCHAR is medium AND N is small” and both ofthem have similar signi5cance represented by the value around 0.5.
6. Conclusions
In this study, we have proposed a general design methodology for granular-based models ful5llingtwo fundamental requirements of granular modeling: accuracy and transparency. The optimizationtandem of evolutionary computing and gradient-based learning of fuzzy neural networks naturallysupports structural and parametric optimization of the models that helps achieve accuracy. The trans-parency of the model is accomplished by subscribing to the logic-oriented architecture of the fuzzyneural networks.
The proposed approach has been used to build elements of the Experience Factory, which supportssoftware development projects by supplying experience obtained from previous software projects.
A genetic algorithm-based method has been applied to construct a process model of quality assess-ment of software objects. The model has led to the recognition of signi5cant relationships betweensoftware measures, which are essential for evaluation purposes. Software managers can use such amodel to support the quality assessment process. Developers can employ these models for estimationof results of their work. Based on work done so far, developers can semi-automatically synthesizemodels, modify them to their experiences, and use these models in a preliminary process of qualityevaluation to identify poorly implemented objects.
The second proposed approach, using a genetic programming-based method, has been used todevelopment of a model representing development e6orts. Knowledge about relationships betweensoftware measures representing modules and the number of needed modi5cations of each module

M. Reformat et al. / Fuzzy Sets and Systems 145 (2004) 111–139 139
is essential for software managers and developers for realistic estimations of work needed in thetesting and maintenance phases of software development.
Acknowledgements
Support from the Natural Sciences and Engineering Research Council (NSERC) and the AlbertaSoftware Engineering Research Consortium (ASERC) is gratefully acknowledged.
References
[1] T. Back, D.B. Fogel, Z. Michalewicz (Eds.), Evolutionary Computations I, Institute of Physics Publishing, Bristol,2000.
[2] V.R. Basili, L.C. Briand, W. Melo, A validation of object-oriented design metrics as quality indicators, IEEE Trans.Software Eng. 22 (10) (1996) 751–761.
[3] V.R. Basili, G. Caldiera, H.D. Rombach, The Experience Factory, in: J. Marciniak (Ed.), Encyclopedia of SoftwareEngineering, vol. 1, Wiley, NY, 1994, pp. 469–476.
[4] S.R. Chidamber, C.F. Kemerer, A metrics suite for object-oriented design, IEEE Trans. Software Eng. 20 (6) (1994)476–493.
[5] D.B. Fogel, Evolutionary computation, Toward a New Philosophy of Machine Intelligence, IEEE Press, Piscataway,1995.
[6] D.E. Goldberg, Genetic algorithms in search, optimization, and machine learning, Addison-Wesley, Reading, MA,1989.
[7] J.H. Holland, Adaptation in natural and arti5cial systems, 2nd Edition, MIT Press, Cambridge, MA, 1992.[8] P.G. Korning, Training neural networks by means of genetic algorithms working on very long chromosomes, Internat.
J. Neural Systems 6 (3) (1995) 299–316.[9] J.R. Koza, Genetic Programming, MIT Press, Cambridge, MA, 1992.
[10] J.C. Munson, T.M. Khoshgoftaar, Software metrics for reliability assessment, in: M.R. Lyu (Ed.), Software ReliabilityEngineering, Computer Society Press, Los Alamitos, CA, 1996, pp. 493–529.
[11] W. Pedrycz, Fuzzy Sets Engineering, CRC Press, Boca Raton, FL, 1995.[12] W. Pedrycz, Computational Intelligence: An Introduction, CRC Press, Boca Raton, FL, 1997.[13] W. Pedrycz, Granular computing: an introduction, in: M.H. Smith, W.A. Gruver, L. Hall (Eds.), Proc. Joint
9th IFSA World Congr. and 20th NAFIPS Internat. Conf., IEEE Press, Vancouver, Canada, July 25–28, 2001,pp. 1349–1354.
[14] W. Pedrycz, F. Gomide, An Introduction to Fuzzy Sets, Analysis and Design, MIT Press, Cambridge, MA, 1998.[15] J.F. Peters, W. Pedrycz, Software Engineering: An Engineering Approach, Wiley, New York, USA, 2000,
pp. 505–551.[16] G. Phipps, Comparing observed bug and productivity rates for Java and C++, Software Practice and Experience 29
(1999) 345–358.[17] N.J. Pizzi, R.A. Vivanco, R.L. Somorjai, EvIdent: a functional magnetic resonance image analysis system, Arti5cial
Intelligence Med. 21 (2001) 263–269.[18] M. Russo, Genetic fuzzy learning, IEEE Trans. Evolutionary Comput. 4 (3) (2000) 259–273.[19] W.M. Spears, Crossover or mutation? in: L.D. Whitley (Ed.), Foundations of Genetic Algorithms Workshop, Morgan
Kaufmann, San Mateo, CA, 1992, pp. 221–237.[20] X. Yao, Evolving arti5cial neural networks, Proc. IEEE 87 (9) (1999) 1423–1447.