Brownfield Study_FR_ENG - Hong Kong - 規劃署
90
Final Report Final│November 2019
-
Upload
khangminh22 -
Category
Documents
-
view
0 -
download
0
Transcript of Brownfield Study_FR_ENG - Hong Kong - 規劃署

Final Report
Final│November 2019

Planning Department
Agreement No. CE40/2016 (TP) Study on Existing Profile and Operation of Brownfield Sites in the New Territories – Feasibility Study
Final Report
Agreement No. CE 40/2016 (TP)
Final November 2019
This report takes into account the particular instructions and requirements of our client.
It is not intended for and should not be relied upon by any third party and no responsibility is undertaken to any third party. Job number 255189
Ove Arup & Partners Hong Kong Ltd Level 5 Festival Walk 80 Tat Chee Avenue Kowloon Tong Kowloon Hong Kong www.arup.com

Planning Department Agreement No. CE40/2016 (TP)
Study on Existing Profile and Operation of Brownfield Sites in the New Territories – Feasibility Study
Final Report
Agreement No. CE 40/2016 (TP) | Final | November 2019
Contents
Page
Contents 1
Abbreviations and Acronyms 3
1 INTRODUCTION 5
1.1 General 5 1.2 Background of Study 5 1.3 Main Objectives 5 1.4 Study Area 5 1.5 Purpose of Final Report 6
2 DEFINITION OF BROWNFIELD SITES 7
2.1 Background of Brownfield Sites in Hong Kong 7 2.2 Definition of Brownfield Sites 8 2.3 Categorisation of Brownfield Sites 9
3 FINDINGS OF STAKEHOLDER INTERVIEWS 14
3.1 Stakeholder Interviews 14 3.2 Findings of Stakeholder Interviews 14
4 PROFILE OF BROWNFIELD SITES IN THE NEW TERRITORIES 18
4.1 Survey Methodology 18 4.2 Spatial Distribution of Brownfield Sites 19 4.3 Industries of Active Brownfield Sites 21 4.4 Spatial Distribution of Industries on Active Brownfield
Sites 23 4.5 Employment 24 4.6 Tenure Status and Monthly Rent 26 4.7 Land Status 26 4.8 Land Use Zonings 27 4.9 Starting Year of Operations 28 4.10 Operational and Locational Requirements 29 4.11 Views on Operating at Alternative Locations 30
5 KEY ISSUES PERTINENT TO BROWNFIELD SITES 35
5.1 General 35 5.2 Key Issues Relating to Impacts from Existing Brownfield
Sites 35 5.3 Key Issues Encountered in Displacement of Brownfield
Sites 42

Planning Department Agreement No. CE40/2016 (TP)
Study on Existing Profile and Operation of Brownfield Sites in the New Territories – Feasibility Study
Final Report
Agreement No. CE 40/2016 (TP) | Final | November 2019
5.4 Key Issues Relating to Development Potential of Brownfield Sites 45
6 CLASSIFICATION OF POSSIBLE DEVELOPMENT POTENTIAL OF BROWNFIELD SITES 47
6.1 Classification of Possible Development Potential 47
7 INTERNATIONAL EXPERIENCE 51
7.1 Overview 51 7.2 Intensification and Consolidation into MSBs or Industrial Hub
- Jurong Industrial Area, Singapore 51 7.3 Redevelopment or Regeneration for Residential or
Commercial Uses - Pennsylvania, United States and Bristol, United Kingdom 52
7.4 Rehabilitation for Greening, Conservation or Recreation Purposes - East Palo Alto, California, United States 54
8 CONCLUSION 56
Appendix A 58
Survey Questionnaire
Figures
Figure 1.1 Study Area Figure 4.1 Distribution of Brownfield Sites in the New Territories Figure 4.2 Distribution of Brownfield Sites in the New Territories (Including
Boundaries of New Development Areas/Potential Development Areas) Figure 4.3a Distribution of Active Brownfield Sites by Industry in Southeast New
Territories Figure 4.3b Distribution of Active Brownfield Sites by Industry in Southwest New
Territories Figure 4.3c Distribution of Active Brownfield Sites by Industry in Northeast New
Territories Figure 4.3d Distribution of Active Brownfield Sites by Industry in Northwest New
Territories Figure 4.4a Land Status of Active Brownfield Sites in Southwest New Territories Figure 4.4b Land Status of Active Brownfield Sites in Southeast New Territories Figure 4.4c Land Status of Active Brownfield Sites in Northeast New Territories Figure 4.4d Land Status of Active Brownfield Sites in Northwest New Territories Figure 5.2 Active Brownfield Sites with Scale of Environmental Impact on
Adjacent Residential Area Figure 5.3 Brownfield Sites within Conservation Related Zones Figure 5.4 Brownfield Industries with Comparatively Higher Traffic Concern Figure 6.1 Classification of Possible Development Potential of Brownfield Sites
in the New Territories
Notes: Numbers presented throughout the report might not add up precisely to totals due to rounding.

Planning Department Agreement No. CE40/2016 (TP)
Study on Existing Profile and Operation of Brownfield Sites in the New Territories – Feasibility Study
Final Report
Agreement No. CE 40/2016 (TP) | Final | November 2019
Abbreviations and Acronyms
“AOI” ‘Area of Influence’
“Arup” Ove Arup & Partners Hong Kong Limited
“BGL” Block Government Lease
“CA” “Conservation Area”
“CPA” “Coastal Protection Area”
“CP” “Country Park”
“DPA” Development Permission Area
“EPA” Environmental Protection Agency
“FLN” Fanling North
“GDP” Gross Domestic Product
“HSK” Hung Shui Kiu
“HT” Ha Tsuen
“IP21” Industrial Land Plan 21
“JTC” Jurong Town Corporation
“KTN” Kwu Tung North
“MSB” Multi-Storey Building
“NDA” New Development Area
“NENT” Northeast New Territories
“NT” New Territories
“NTN” New Territories North
“NWNT” Northwest New Territories
“OSL” “Old Schedule” Lots
“OU(CDWEA)” “Other Specified Uses” annotated “Comprehensive
Development and Wetland Enhancement Area”
“OU(CDWRA)” “Other Specified Uses” annotated “Comprehensive
Development to include Wetland Restoration Area”
“OU(Nature
Park)” “Other Specified Uses” annotated “Nature Park”
“PlanD” Planning Department
“SENT” Southeast New Territories
“SME” Small and Medium Enterprise

Planning Department Agreement No. CE40/2016 (TP)
Study on Existing Profile and Operation of Brownfield Sites in the New Territories – Feasibility Study
Final Report
Agreement No. CE 40/2016 (TP) | Final | November 2019
“SSSI” “Site of Special Scientific Interest”
“SWNT” Southwest New Territories
“The Study” The Study on Existing Profile and Operations of Brownfield
Sites in the New Territories – Feasibility Study
“UAV” Unmanned Aerial Vehicle
“YLS” Yuen Long South
Planning Department Agreement No. CE40/2016 (TP)
Study on Existing Profile and Operation of Brownfield Sites in the New Territories – Feasibility Study
Final Report
Agreement No. CE 40/2016 (TP) | Final | November 2019 Page 5
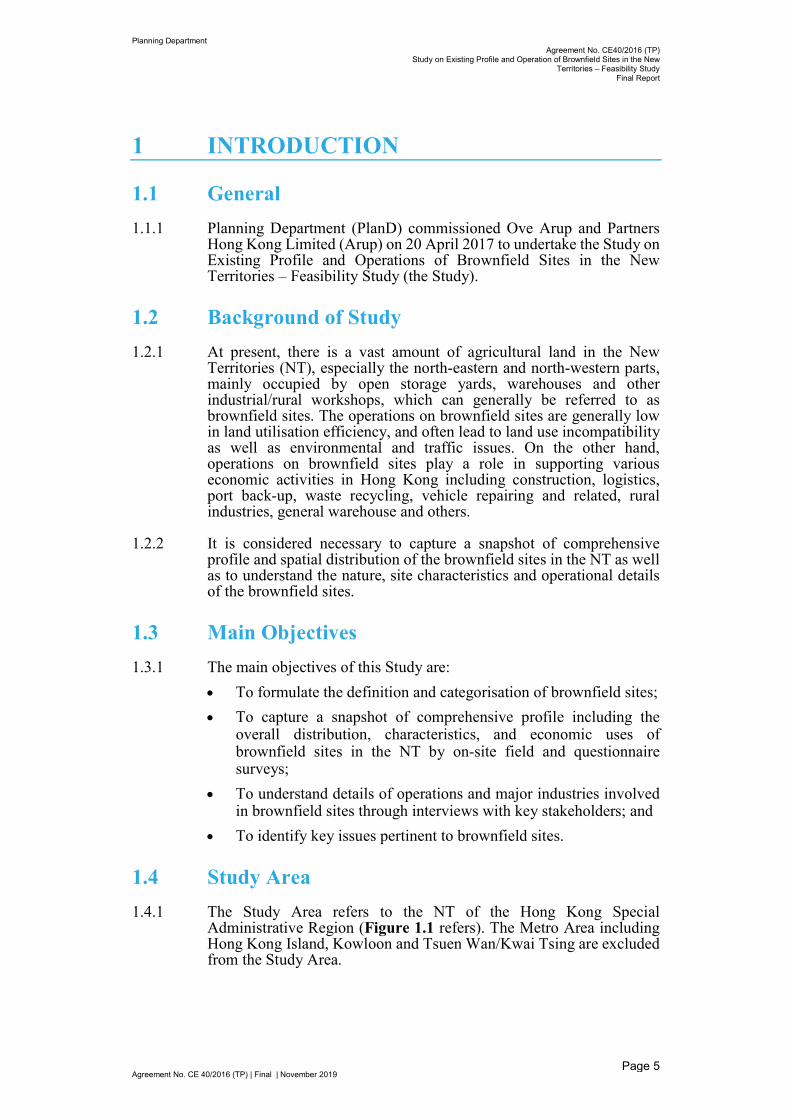
1 INTRODUCTION
1.1 General
1.1.1 Planning Department (PlanD) commissioned Ove Arup and Partners Hong Kong Limited (Arup) on 20 April 2017 to undertake the Study on Existing Profile and Operations of Brownfield Sites in the New Territories – Feasibility Study (the Study).
1.2 Background of Study
1.2.1 At present, there is a vast amount of agricultural land in the New Territories (NT), especially the north-eastern and north-western parts, mainly occupied by open storage yards, warehouses and other industrial/rural workshops, which can generally be referred to as brownfield sites. The operations on brownfield sites are generally low in land utilisation efficiency, and often lead to land use incompatibility as well as environmental and traffic issues. On the other hand, operations on brownfield sites play a role in supporting various economic activities in Hong Kong including construction, logistics, port back-up, waste recycling, vehicle repairing and related, rural industries, general warehouse and others.
1.2.2 It is considered necessary to capture a snapshot of comprehensive profile and spatial distribution of the brownfield sites in the NT as well as to understand the nature, site characteristics and operational details of the brownfield sites.
1.3 Main Objectives
1.3.1 The main objectives of this Study are:
To formulate the definition and categorisation of brownfield sites;
To capture a snapshot of comprehensive profile including the overall distribution, characteristics, and economic uses of brownfield sites in the NT by on-site field and questionnaire surveys;
To understand details of operations and major industries involved in brownfield sites through interviews with key stakeholders; and
To identify key issues pertinent to brownfield sites.
1.4 Study Area
1.4.1 The Study Area refers to the NT of the Hong Kong Special Administrative Region (Figure 1.1 refers). The Metro Area including Hong Kong Island, Kowloon and Tsuen Wan/Kwai Tsing are excluded from the Study Area.
Planning Department Agreement No. CE40/2016 (TP)
Study on Existing Profile and Operation of Brownfield Sites in the New Territories – Feasibility Study
Final Report
Agreement No. CE 40/2016 (TP) | Final | November 2019 Page 6
1.5 Purpose of Final Report
1.5.1 This Final Report is to consolidate the findings and recommendations of the Study.

Planning Department Agreement No. CE40/2016 (TP)
Study on Existing Profile and Operation of Brownfield Sites in the New Territories – Feasibility Study
Final Report
Agreement No. CE 40/2016 (TP) | Final | November 2019 Page 7
2 DEFINITION OF BROWNFIELD SITES
2.1 Background of Brownfield Sites in Hong Kong
2.1.1 Back in the 1960s and as shown in Photo 2.1, apart from pockets of village-type settlements and woodland/hilly areas, most of the land in the NT was agriculture land. There were more than 10,000 hectares (ha) of active farmland in the NT in the 1960s1.
Photo 2.1 Orthophoto of the 1960s in the NT (Extract from DOP1000 – 1963P). Source: Digital Orthophoto from Lands Department.
2.1.2 The economic development of Hong Kong during the 1970s and 1980s provided chances for people in the NT to move and work in urban areas for light industries. As a result, agricultural activities in the NT declined. Also, new town developments in the NT improved transport network and released the development potential of land in the NT.
2.1.3 At the same time, the open door policy of the Mainland had substantially increased international and cross-border export and import volume and stimulated the development of port back-up and logistics industries in Hong Kong. Hence, the demand of land for relevant operations (e.g. container yard, open storage, warehouse etc.) increased rapidly. The higher income generated from these operations as compared to agricultural uses created monetary incentives for land owners to rent out their land for these operations. Besides, workshops and warehouses of other industries such as waste recycling and construction industries were also gradually developed on abandoned
1 Hong Kong Statistics 1947 to 1967, Census and Statistics Department, Hong Kong (1969) p.71

Planning Department Agreement No. CE40/2016 (TP)
Study on Existing Profile and Operation of Brownfield Sites in the New Territories – Feasibility Study
Final Report
Agreement No. CE 40/2016 (TP) | Final | November 2019 Page 8
agricultural land, taking advantage of the improved accessibility and low rental cost of land in the NT.
2.1.4 Most of the private land in the NT is held under “Old Schedule” Lots (OSL) granted under Block Government Lease (BGL) under which the schedule of uses are for agricultural and related uses such as “padi”, “cultivation” etc. The Melhado Case in 1983 ruled that the schedule of uses is descriptive only, and that lots granted under the BGL are subject to no restriction except for “Noisome or Offensive Trades”, provided that the development on-site does not involve any buildings. This opened up a means for non-agricultural business undertakings/operations on these OSL, resulting in the conversion of many agricultural land for open storage, rural industries and port back-up uses in the NT.
2.2 Definition of Brownfield Sites
2.2.1 In general, brownfield sites refer to agricultural land in the NT converted into various operations and uses, including open storage, warehouse, workshop, logistics and freight operation, container storage, vehicle parking, vehicle repair yard and vehicle body building yard. Against this background, and taking account of the findings of field and questionnaire surveys as well as stakeholder interviews, which will be reported in the next chapters, brownfield sites are defined as “primarily agricultural land in the New Territories which has been formed and occupied by industrial, storage, logistics and parking uses.” (棕地泛指新界一些遭平整的農耕土地,用作工業、貯物、物流、及泊車用途)2
2.2.2 The following are not considered as brownfield sites under the definition:
(a) Sites with non-industrial operation, including recreation, shop and services, eating place, and office uses;
(b) Land used for agricultural and farming purposes such as plant nursery, livestock farm, active or abandoned farmland;
(c) Sites without business operation, including residential use (e.g. squatters), uses ancillary to residential use (e.g. storage of household items, residential car parks), and community/religious related uses;
(d) Sites with permanent structures or under construction for permanent developments;
(e) Government use with land allocation, e.g. work sites; and
(f) Land covered by vegetation or observed to be covered by vegetation with no signs of present or previous disturbance such as grassland, woodland and scrubland.
2 ‘Agricultural land’ in the definition refers to the land essentially used for agricultural purpose in the past as shown in satellite images taken in the 1960s, regardless of land lease status and zoning.

Planning Department Agreement No. CE40/2016 (TP)
Study on Existing Profile and Operation of Brownfield Sites in the New Territories – Feasibility Study
Final Report
Agreement No. CE 40/2016 (TP) | Final | November 2019 Page 9
2.3 Categorisation of Brownfield Sites
2.3.1 For the purpose of this Study and based on the findings of the field and questionnaire surveys carried out under the Study, brownfield sites in active use (i.e. active brownfield sites) are categorized into 10 industries and details of which are elaborated as follows:
Active Brownfield Sites
(a) Construction Industry covers mainly open storage and warehouse of construction materials and/or machinery, some of which are large and heavy that can only be stored in open-air and large sites. Workshops including concrete batching plants and asphalt batching plants as well as works areas and site offices are also included in this category.
Photo 2.2 Open Storage of Construction Machinery
(b) Logistics Industry covers modern and general logistics
operations. They are mainly in the form of logistics centres and container freight stations. Many of the operations involve the import and export trade, with some providing services related to international/regional distribution of goods, e-commerce, cold storage and other value-added services.
Photo 2.3 Logistics & Freight Operation
(c) Port Back-up (Container-related) Industry covers storage of empty/laden containers, parking of container vehicles and repair of containers.

Planning Department Agreement No. CE40/2016 (TP)
Study on Existing Profile and Operation of Brownfield Sites in the New Territories – Feasibility Study
Final Report
Agreement No. CE 40/2016 (TP) | Final | November 2019 Page 10
Photo 2.4 Container Storage
(d) Waste Recycling Industry covers open
storage/warehouse/workshop for collection, storage, dismantling, and/or processing of the recyclables such as paper, metal, plastic, waste electrical and electronic equipment etc.
Photo 2.5 Open Storage of Recycling Materials
(e) Vehicle Repairing and Related Industry covers mainly vehicle
repair yards for private and/or commercial vehicles. Vehicle body building yards for private and/or commercial vehicles, displaying and trading of new, second-hand, or other vehicles, as well as operations providing auto detailing and car beauty services are also covered in this industry.
Photo 2.6 Vehicle Repair Yard
(f) Vehicle Scrapping Industry covers workshops for disassembly of vehicles and open storage/warehouse of scrapped vehicles and/or used vehicle parts.

Planning Department Agreement No. CE40/2016 (TP)
Study on Existing Profile and Operation of Brownfield Sites in the New Territories – Feasibility Study
Final Report
Agreement No. CE 40/2016 (TP) | Final | November 2019 Page 11
Photo 2.7 Vehicle Scrapping Workshop
(g) Rural Industries cover a wide range of rural workshops 3 , including food processing (e.g. noodles, dairies, soy sauce, bean curd, lard boiling, meat roasting etc), metalware processing, ice manufacturing, paper products processing, chemical processing, etc.
Photo 2.8 Food Processing Workshop
3 According to the Definition of Terms used in statutory plans, rural workshops refer to low-rise building or temporary structures, used for industrial purpose and the operation of which is usually of a smaller scale and less sophisticated in nature. It includes informal industrial activities operated in workshop premises.

Planning Department Agreement No. CE40/2016 (TP)
Study on Existing Profile and Operation of Brownfield Sites in the New Territories – Feasibility Study
Final Report
Agreement No. CE 40/2016 (TP) | Final | November 2019 Page 12
(h) Vehicle Parking covers parking of private and/or commercial vehicles operating on a commercial basis, but excludes parking solely for container vehicles (which is categorized under port back-up (container-related) industry).
Photo 2.9 Vehicle Parking
(i) General Warehouse / Storage covers warehouse and open storage of vehicles or vehicle parts including new, second-hand, left-hand-drive and other vehicles, as well as warehouse and open storage of general goods that does not belong to the other industries mentioned in para. 2.3.1. It also covers warehouse and open storage sites on which the main items/materials involved cannot be clearly identified.
Photo 2.10 General Warehouse

Planning Department Agreement No. CE40/2016 (TP)
Study on Existing Profile and Operation of Brownfield Sites in the New Territories – Feasibility Study
Final Report
Agreement No. CE 40/2016 (TP) | Final | November 2019 Page 13
(j) General Workshops cover workshops engaging in activities that do not belong to other industries mentioned in para. 2.3.1, such as repairing of machines and electrical appliances. It also covers workshops on which the main activities engaged cannot be clearly identified.
Photo 2.11 General Workshops
Inactive Brownfield Sites
2.3.2 Inactive brownfield sites refer to sites which were previously “agricultural land” and subsequently formed but found vacant or with vacant structures not in operation during the surveys4.
Photo 2.12 Inactive Brownfield Sites
4 During the field survey, the field surveyor would preliminarily identify inactive brownfield site based on on-site observation and recorded details by taking site photos for further verification. The findings had been further verified by comparing such vacant /inactive brownfield status with historical aerial photos to confirm the identified inactive brownfield sites had previously been used for brownfield operation.

Planning Department Agreement No. CE40/2016 (TP)
Study on Existing Profile and Operation of Brownfield Sites in the New Territories – Feasibility Study
Final Report
Agreement No. CE 40/2016 (TP) | Final | November 2019 Page 14
3 FINDINGS OF STAKEHOLDER INTERVIEWS
3.1 Stakeholder Interviews
3.1.1 With a view to understanding the major industries involved in brownfield sites in detail, interviews have been conducted with relevant trade associations and professional institutions in major industries involved in brownfield sites including construction, logistics, port back-up, waste recycling, vehicle repairing and rural industries. From July to November 2017, 19 stakeholder groups were interviewed. A summary of participants is given in the table below.
Table 3.1 List of Trade Associations and Professional Institutions participated in the Stakeholder Interviews
Trade Associations and Professional Institutions
1 The Chartered Institute of Logistics and Transport
2 Hong Kong Container Depot & Repairer Association
3 Hung Uk Tsuen Merchants Association
4 Lok Ma Chau China-Hong Kong Freight Association
5 Hong Kong Commercial Vehicle Maintenance Association
6 Hong Kong Construction Association
7 Hong Kong Auto (Parts & Machinery) Association
8 Hong Kong General Building Contractors Association
9 Hong Kong Recycling Chamber of Commerce
10 Coalition of Open Storage Operators in the North West of the New Territories
11 The Association of the New Territories Open Storage Operators
12 Hong Kong Logistics Association
13 Hong Kong Construction Materials Association
14 New Territories Warehouse And Logistics Business Association
15 The New Territories North District Manufacturers Association of Hong Kong
16 The Hong Kong Federation of Electrical and Mechanical Contractors Limited
17 Hong Kong Container Tractor Owner Association
18 Hong Kong Container Terminal Operators Association Limited
19 Hong Kong Recycle and Development Association
3.2 Findings of Stakeholder Interviews
3.2.1 Based on the views collected from the stakeholder interviews, major findings are consolidated below. These have provided some references and insights in understanding the major industries involved in brownfield sites, so as to facilitate the formulation of appropriate measures for the planning and consolidation of brownfield sites in the future.

Planning Department Agreement No. CE40/2016 (TP)
Study on Existing Profile and Operation of Brownfield Sites in the New Territories – Feasibility Study
Final Report
Agreement No. CE 40/2016 (TP) | Final | November 2019 Page 15
Construction Industry
3.2.2 The stakeholders generally have positive views on the prospect of the industry. Most stakeholders considered that it was necessary to retain their operations in Hong Kong due to cost-effectiveness and legal/customs issues. Securing reliable supply of local materials and services, convenient and cheap sites for storage of construction materials and machinery in Hong Kong can help lower the cost of local construction projects.
3.2.3 The major reasons why the construction industry used brownfield sites included heavy floor loading and high floor-to-floor height requirements, lack of suitable premises in other forms, convenient and accessible location. The ideas of constructing specially-designed multi-storey buildings (MSBs) and Construction Industry Hubs (CIHs), and centralizing construction related uses in a hub setting as well as development of caverns for permanent facilities to house construction-related operations were supported. There were, however, reservations with regard to future management issues, as well as admission criteria and facilities provided in MSBs/CIHs being not suitable for their needs.
Logistics and Port Back-up Industries
3.2.4 More and more cross-boundary freight has shifted from land-borne to river-borne transport. Far less empty containers are stored in Hong Kong now since the cost of container storage and maintenance is cheaper in the Mainland. There has been a decline of container yards on brownfield sites which the operators are now receiving less income than before. However, there is an increasing demand for local/regional distribution of goods, third party logistics and business-to-customer goods distribution due to the growth of the market in Hong Kong and the Mainland in tandem with the growth in e-commerce.
3.2.5 Given an acute shortage of space for logistics operation, brownfield sites offer the industry benefits in operation efficiency, low rental cost and locational advantage. The stakeholders requested for Government support to provide new land specifically for logistics use. The MSB for logistics use should provide large floor plate, high ceiling height and wide ramps, be equipped with enough container vehicle bays, parking and turnaround space, and the rent should not be too high to ensure affordability for the operators. However, there is doubt on the benefits and effectiveness of MSBs to accommodate container storage use, particularly in terms of floor height, loading capacity and operational difficulties.
Waste Recycling Industry
3.2.6 Waste recycling operations, despite many being low value-added and land extensive, are essential for local waste reduction as part of the waste management system in Hong Kong. However, the industry is export-oriented and vulnerable to changes in the policies of major markets. Some operations involve importing recyclables to secure a sufficient amount of suitable recyclables for export. Besides, the stakeholders suggested that the recycling industry in Hong Kong should be upgraded from simple sorting and storage of recyclables to development of manufacturing operations to upcycle the local waste. Locally-made green products should be promoted in the local and

Planning Department Agreement No. CE40/2016 (TP)
Study on Existing Profile and Operation of Brownfield Sites in the New Territories – Feasibility Study
Final Report
Agreement No. CE 40/2016 (TP) | Final | November 2019 Page 16
overseas market. However, the upgrading would require much capital investment which would be difficult for small and medium enterprises (SMEs).
3.2.7 The reasons of locating recycling operations at brownfield sites included cheap rent, convenient road access, availability of storage space, proximity to supporting facilities, and separation from residential developments. The recycling industry would prefer open storage which allows sizeable space for storage of renewable resources. In particular, waste recycling operations handling very heavy/bulky materials (e.g. ferrous metal) or using bulky machinery would not be suitable to be accommodated in MSBs due to high requirements on floor loading and ceiling height. The operation cost in MSBs is also a concern.
Vehicle Repairing and Related Industries
3.2.8 The vehicle repairing industry mainly provides local services. One key issue of the industry is that whether the operators could be centralized at a single or a few major cluster(s) to enjoy the advantages from economy of scale and business chains or to encourage the operators to spread out across the territory under the free market system to reach out to individual customers. The Government should take note of the potential of import/export trading of vehicle parts and/or accessories which may however be involved in the vehicle scrapping industry of a different nature.
3.2.9 Taking advantage of the availability of brownfield sites, there are established clusters of vehicle industry in Kam Tin and Pat Heung. Other locations include Lok Ma Chau, Tin Shui Wai, Man Kam To, Sheung Shui and Fanling. The stakeholders were concerned about the possible high rent of MSBs and opined that the management of MSBs should be government-led. Repairing workshops for heavy goods vehicles and Liquefied Petroleum Gas vehicles should be separately located.
Rural Industries
3.2.10 The rural industries mainly include food processing, paper products, metalware and chemical workshops. The operators stated that their operations, mainly serving the population and industries in Hong Kong, were essential and should not be overlooked. For SMEs operators, cheap rent is their primary consideration and they cannot compete with larger scale operations in obtaining the premises / sites in industrial estates, or their operations cannot be accommodated in conventional flatted factories due to extensive land and/or high ceiling requirements, and thus they choose to locate at brownfield sites in rural areas.
3.2.11 Some of the stakeholders opined that MSB would not be attractive to them if the rent was higher than what they paid at present, and some could not be accommodated in MSBs due to their special operational requirements, e.g. inherent risks of the dangerous good handled. In case the operations needed to be relocated, some stated that they would close down their business since the profit margin was not high and their next generation did not want to continue their business.
3.2.12 Based on the stakeholder interviews, it is observed that the concerns from the stakeholders on the brownfield sites are cross-cutting issues

Planning Department Agreement No. CE40/2016 (TP)
Study on Existing Profile and Operation of Brownfield Sites in the New Territories – Feasibility Study
Final Report
Agreement No. CE 40/2016 (TP) | Final | November 2019 Page 17
and would need to be addressed from a holistic, comprehensive and strategic perspective rather than being resolved on an individual project basis. The main considerations of various operations choosing brownfield sites are mainly low rent, operational requirements and locational factors. In addition, the operations of brownfield sites of major industries play different roles in their operation chains and would involve some business linkages to the operations under other industries, for instance, vehicles repairing operations may serve other operations. Some stakeholders expressed views that it would be feasible or partly feasible to relocate their operations from brownfield sites to specially designed MSB or industrial hub rather than general industrial buildings or industrial estates. However, some of the brownfield operations involving heavy and bulky materials and/or machinery could only be accommodated at open-air sites.

Planning Department Agreement No. CE40/2016 (TP)
Study on Existing Profile and Operation of Brownfield Sites in the New Territories – Feasibility Study
Final Report
Agreement No. CE 40/2016 (TP) | Final | November 2019 Page 18
4 PROFILE OF BROWNFIELD SITES IN THE NEW TERRITORIES5
4.1 Survey Methodology
4.1.1 The field and questionnaire surveys for the Study were conducted from 9 August 2017 to 8 October 2018.
4.1.2 In order to facilitate the conducting of on-site field and questionnaire surveys by batches and reporting of the survey findings, the Study Area is divided into four sub-regions namely Northeast NT (NENT), Northwest NT (NWNT), Southeast NT (SENT) and Southwest NT (SWNT). The boundaries of the sub-regions have largely made reference to the boundaries of relevant Outline Zoning Plans (Figure 1.1).
Sub-region Coverage
SENT Sai Kung, Tseung Kwan O, and Islands on the southeastern part of Hong Kong
SWNT Lantau and Islands on the southwestern part of Hong Kong
NENT Sha Tin, Tai Po, Sheung Shui and north and northeastern part of the NT
NWNT Tuen Mun and Yuen Long, and northwestern part of the NT
4.1.3 Based on a desktop study of Digital Orthophoto (i.e. DOP5000) of 2015, about 1,300 ha of brownfield sites in active use were initially identified at the beginning of the Study in 2017, which served as the initial baseline profile for the Study. Subsequently, with reference to the latest helicopter aerial photos, satellite images and unmanned aerial vehicle (UAV) photos taken in 2017/2018, other relevant planning data and survey maps provided by Survey and Mapping Office of Lands Department, land which were likely brownfield sites including but not limited to the estimated 1,300 ha were identified for carrying out on-site field and questionnaire surveys to confirm their status and usage. All identified sites were visited in full enumeration for on-site field survey and face-to-face questionnaire survey.
4.1.4 During the field survey, field surveyors were required to record a list of information of the visited sites and operations, including their uses and site characteristics. Field surveyors were also required to take photos of the sites to keep record of the site conditions for future reference, and record information on land uses adjoining to the sites as appropriate for subsequent analysis. In situation where a single site was found to be occupied by more than one operation, the site would be sub-divided according to the information obtained during the surveys. The area of each brownfield site was based on the boundary identified in the latest orthophotos, taking into account the findings and observations during the on-site survey.
5 Numbers presented throughout the report might not add up precisely to totals due to rounding.

Planning Department Agreement No. CE40/2016 (TP)
Study on Existing Profile and Operation of Brownfield Sites in the New Territories – Feasibility Study
Final Report
Agreement No. CE 40/2016 (TP) | Final | November 2019 Page 19
4.1.5 For sites identified with operation, questionnaire surveys were conducted to collect information related to the operational characteristics and requirements, equipment/facilities installed for the operation, locational factors/preferences, business nature and linkage, history of the operation, technical requirements and future business plan of the operation. A sample of the questionnaire is included in Appendix A.
4.1.6 For sites that were observed to be vacant or not having any operation carried out on the sites (e.g. residential use), status/use(s) of the sites were recorded and no questionnaire survey would be conducted.
4.1.7 The survey successfully interviewed 3,420 active brownfield sites, among 7,373 active brownfield sites that are with operation. The response rate of the questionnaire survey is 46%.
4.1.8 While efforts have been made to ensure the accuracy of the survey findings, the study methodology is still subject to the following constraints and limitations:-
(a) Due to the transient nature of brownfield sites, the profile and spatial distribution of brownfield sites established under this Study could only provide a snapshot picture of brownfield sites based on the field and questionnaire surveys conducted during August 2017 to October 2018;
(b) The area of each brownfield site is mainly based on the boundary demarcated using latest orthophotos / satellite images / UAV photos, taking into account findings and observations during the on-site survey. Therefore, there could be some discrepancies between the actual site area and the surveyed area;
(c) There are some sites which field surveyors were unable to access or being refused to access during the survey. The land uses of these sites are identified based on on-site observation or interpretation of aerial photos. There could be some discrepancies between the actual use of the site and the identified uses; and
(d) Where the response rate of some questions in the questionnaire was too low, meaningful analysis is not possible and thus not included in this report.
4.2 Spatial Distribution of Brownfield Sites
Brownfield Sites
4.2.1 The survey finds a total of 7,373 active brownfield sites (area of about 1,414 ha) in the NT 6 . Please refer to Figure 4.1 for the spatial distribution of active brownfield sites.
4.2.2 The number and area of active brownfield sites by sub-regions are shown in Table 4.2.1. About 70% of active brownfield sites (5,295 sites) are located in NWNT (75.0% in terms of area; i.e. 1,060.46 ha), followed by NENT (23.0% in terms of area; i.e. 325.72 ha), SENT
6 The survey also finds a total of 996 inactive brownfield sites (area of about 165 ha) in the NT.

Planning Department Agreement No. CE40/2016 (TP)
Study on Existing Profile and Operation of Brownfield Sites in the New Territories – Feasibility Study
Final Report
Agreement No. CE 40/2016 (TP) | Final | November 2019 Page 20
(1.4% in terms of area; i.e. 20.29 ha) and SWNT (0.6% in terms of area; i.e. 7.37 ha).
4.2.3 Table 4.2.1 Number and Area of Active Brownfield Site
Sub-Regions
Number of Active Brownfield Sites
Area of Active Brownfield Sites
Number % Area (ha) %
SENT 156 2.1% 20.29 1.4%
SWNT 58 0.8% 7.37 0.6%
NENT 1,864 25.3% 325.72 23.0%
NWNT 5,295 71.8% 1,060.46 75.0%
Total of Sites 7,373 100.0% 1,413.84 100.0%
Distribution of Active Brownfield Sites within New Development Areas (NDAs)/Potential Development Areas (PDAs)7
4.2.4 Among the 1,414 ha of active brownfield sites, about 615 ha (43%) fall within the boundaries of NDAs/PDAs8 (Table 4.2.2). Figure 4.2 shows the overall distribution of brownfield sites including the boundaries of NDAs/PDAs.
Table 4.2.2 Brownfield Sites Falling within the Boundaries of NDAs/PDAs
7 In this report, “NDAs/PDAs” statistics also include Yuen Long South Development, which is positioned as an extension of Yuen Long New Town. 8 As identified by the PlanD, among the active and inactive brownfield sites outside NDAs/PDAs, 76 ha are within conservation related zones (please refer to paras. 5.2.16 and 5.2.17), about 120 ha are covered by government projects under active planning, and about 30 ha are already covered by known development projects initiated by private parties or landowners. 9 According to the “Preliminary Feasibility Study on Developing the New Territories North” (the NTN Study), potential developments areas in NTN include San Tin/Lok Ma Chau Development Node, Man Kam To Logistics Corridor and NTN New Town.
NDAs/PDAs
Area of Active Brownfield
Sites (ha)
Area of Inactive Brownfield
Sites (ha)
Area of Brownfield Sites
(ha)
Hung Shui Kiu/Ha Tsuen
(HSK/HT) NDA 240.46 5.84 246.30
Yuen Long South (YLS)
Development 90.25 3.65 93.90
Kwu Tung North (KTN) and
Fanling North (FLN) NDAs 66.14 4.21 70.35
New Territories North
(NTN)9 217.92 24.60 242.52
Total 614.77 38.30 653.07

Planning Department Agreement No. CE40/2016 (TP)
Study on Existing Profile and Operation of Brownfield Sites in the New Territories – Feasibility Study
Final Report
Agreement No. CE 40/2016 (TP) | Final | November 2019 Page 21
Remarks: There are 38.30 ha of inactive brownfield sites falling within the boundaries of NDAs/PDAs
4.3 Industries of Active Brownfield Sites
Distribution by Industry
4.3.1 The overall distribution of active brownfield sites by industry is shown in Table 4.3.1. Among 1,414 ha of active brownfield sites, the major industries are general warehouse / storage (26.8% / 378.86 ha), followed by construction (26.0% / 367.39 ha), and logistics (13.2% / 186.14 ha) (Chart 4.1). The three industries occupy about 66% of active brownfield site area.
Chart 4.1 Distribution of Active Brownfield Sites by Industry (ha)
4.3.2 For SENT, the major industries on active brownfield sites are construction (49.5% / 10.04 ha), vehicle repairing and related (15.8% / 3.21 ha), general workshop (10.3% / 2.1 ha). Distribution of active brownfield sites by industry in SENT is shown in Figure 4.3a.
4.3.3 For SWNT, the major industries on active brownfield sites are construction (55.9% / 4.12 ha), vehicle repairing and related (25.6% / 1.89 ha), general warehouse/storage (14.1% / 1.04 ha). Distribution of active brownfield sites by industry in SWNT is shown in Figure 4.3b.
4.3.4 For NENT, the major industries on active brownfield sites are general warehouse/storage (32.6% / 106.23 ha), construction (31.6% / 102.91 ha), waste recycling (8.9% / 29.06 ha). Distribution of active brownfield sites by industry in NENT is shown in Figure 4.3c.
General Warehouse / Storage, 378.86ha
26.8%
Construction, 367.39ha 26.0%Logistics,
186.14ha, 13.2%
Vehicle Repairing and Related, 137.21ha,
9.7%
Vehicle Parking, 105.64ha, 7.5%
Port Back-up (Container-related),
87.96ha 6.2%
Waste Recycling, 85.27ha, 6.0%
Rural Industries, 22.97ha 1.6%
General Workshop, 21.68ha, 1.5%
Vehicle Scrapping, 20.72hahaha, 1.5%

Planning Department Agreement No. CE40/2016 (TP)
Study on Existing Profile and Operation of Brownfield Sites in the New Territories – Feasibility Study
Final Report
Agreement No. CE 40/2016 (TP) | Final | November 2019 Page 22
4.3.5 For NWNT, the major industries on active brownfield sites are general warehouse/storage (25.4% / 269.64 ha), construction (23.6% / 250.32 ha), logistics (15.6% / 165.46 ha). Distribution of active brownfield sites by industry in NWNT is shown in Figure 4.3d.
Average Site Size of Active Brownfield Sites
4.3.6 The average site size of active brownfield sites is also shown in Table 4.3.1. The overall average site size of active brownfield site is about1,918 square metres (sq m). Active brownfield sites in port back-up (container-related) industry have the largest average size of about 5,787 sq m, whereas general workshop has the smallest average size, which is about 1,232 sq m.
Table 4.3.1 –Number and Area of Brownfield Sites by Industry
Type of Industry
Sub-Region Overall
Average Site Size (sq
m)
SENT SWNT NENT NWNT Area of
Sites (ha)
Area of Sites (ha)
Area of Sites (ha)
Area of Sites (ha)
Area of Sites (ha)
% No. of Sites10
%
General Warehouse / Storage
1.95 1.04 106.23 269.64 378.86 26.8% 2,718 36.9% 1,393.89
Construction 10.04 4.12 102.91 250.32 367.39 26.0% 1,558 21.1% 2,358.09 Logistics 0.39 0.19 20.10 165.46 186.14 13.2% 560 7.6% 3,323.93 Vehicle Repairing and Related
3.21 1.89 23.17 108.94 137.21 9.7% 1,102 14.9% 1,245.01
Vehicle Parking
1.85 0.11 12.90 90.78 105.64 7.5% 435 5.9% 2,428.51
Port Back-up (Container-related)
0 0 19.39 68.57 87.96 6.2% 152 2.1% 5,786.84
Waste Recycling
0.35 0 29.06 55.86 85.27 6.0% 441 6.0% 1,933.56
Rural Industries
0.40 0.02 8.06 14.49 22.97 1.6% 104 1.4% 2,208.65
General Workshops
2.10 0 3.83 15.75 21.68 1.5% 176 2.4% 1,231.82
Vehicle Scrapping
0 0 0.07 20.65 20.72 1.5% 127 1.7% 1,631.50
Total Active Brownfield Sites
20.29 7.37 325.72 1,060.46 1,413.84 100% 7,373 100% 1917.59
Inactive Brownfield Sites
4.13 2.3 49.84 108.81 165.08 - 996 - 1,657.53
Total 24.42 9.67 375.56 1,169.27 1,578.92 - 8,369 - 1,886.63 Note: Information based on Question A2 of the questionnaire survey and field observation
10 The “sites” were counted by the consultant with reference to the physical features on site (e.g. fencing and road) observed in brownfields captured during on-site visit and also the responses or information collected during interviews with brownfield operators.
Planning Department Agreement No. CE40/2016 (TP)
Study on Existing Profile and Operation of Brownfield Sites in the New Territories – Feasibility Study
Final Report
Agreement No. CE 40/2016 (TP) | Final | November 2019 Page 23
4.4 Spatial Distribution of Industries on Active Brownfield Sites
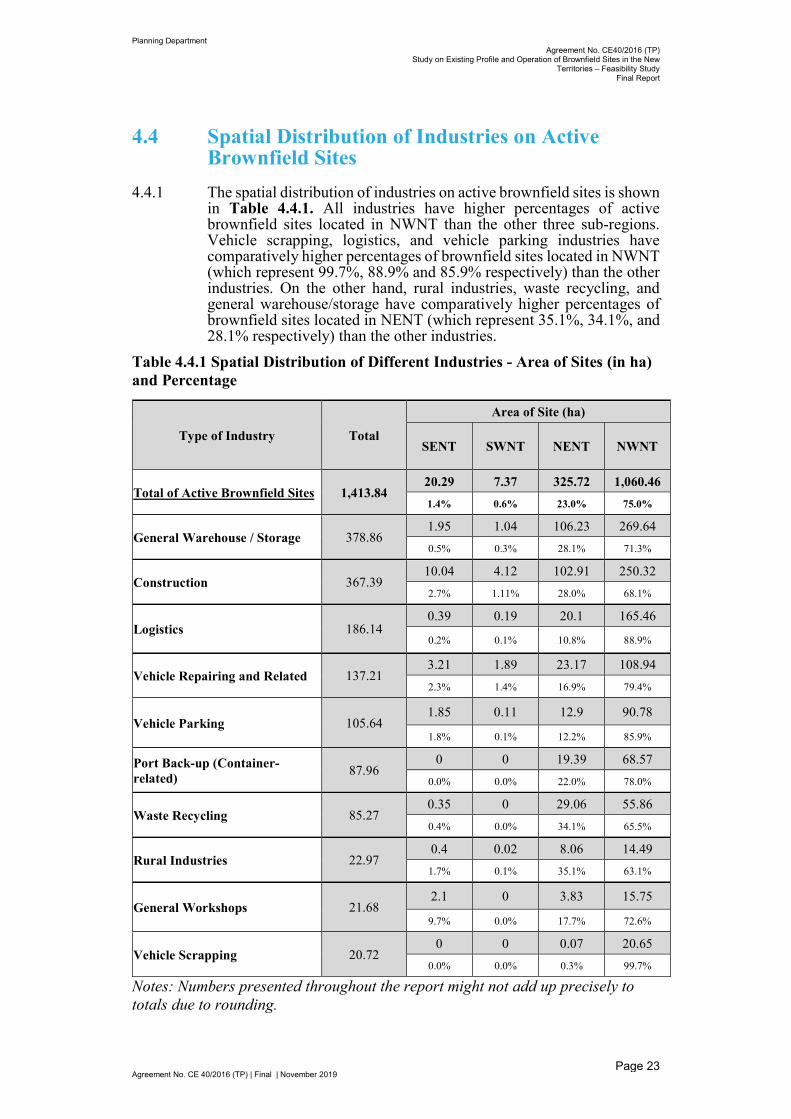
4.4.1 The spatial distribution of industries on active brownfield sites is shown in Table 4.4.1. All industries have higher percentages of active brownfield sites located in NWNT than the other three sub-regions. Vehicle scrapping, logistics, and vehicle parking industries have comparatively higher percentages of brownfield sites located in NWNT (which represent 99.7%, 88.9% and 85.9% respectively) than the other industries. On the other hand, rural industries, waste recycling, and general warehouse/storage have comparatively higher percentages of brownfield sites located in NENT (which represent 35.1%, 34.1%, and 28.1% respectively) than the other industries.
Table 4.4.1 Spatial Distribution of Different Industries - Area of Sites (in ha) and Percentage
Type of Industry Total
Area of Site (ha)
SENT SWNT NENT NWNT
Total of Active Brownfield Sites 1,413.84 20.29 7.37 325.72 1,060.46
1.4% 0.6% 23.0% 75.0%
General Warehouse / Storage 378.86 1.95 1.04 106.23 269.64
0.5% 0.3% 28.1% 71.3%
Construction 367.39 10.04 4.12 102.91 250.32
2.7% 1.11% 28.0% 68.1%
Logistics 186.14 0.39 0.19 20.1 165.46
0.2% 0.1% 10.8% 88.9%
Vehicle Repairing and Related 137.21 3.21 1.89 23.17 108.94
2.3% 1.4% 16.9% 79.4%
Vehicle Parking 105.64 1.85 0.11 12.9 90.78
1.8% 0.1% 12.2% 85.9%
Port Back-up (Container-related)
87.96 0 0 19.39 68.57
0.0% 0.0% 22.0% 78.0%
Waste Recycling 85.27 0.35 0 29.06 55.86
0.4% 0.0% 34.1% 65.5%
Rural Industries 22.97 0.4 0.02 8.06 14.49
1.7% 0.1% 35.1% 63.1%
General Workshops 21.68 2.1 0 3.83 15.75
9.7% 0.0% 17.7% 72.6%
Vehicle Scrapping 20.72 0 0 0.07 20.65
0.0% 0.0% 0.3% 99.7%
Notes: Numbers presented throughout the report might not add up precisely to totals due to rounding.

Planning Department Agreement No. CE40/2016 (TP)
Study on Existing Profile and Operation of Brownfield Sites in the New Territories – Feasibility Study
Final Report
Agreement No. CE 40/2016 (TP) | Final | November 2019 Page 24
4.5 Employment
4.5.1 Table 4.5.1 shows the number of employment on active brownfield sites by industry. Projected by extrapolation based on the questionnaire returns, active brownfield sites in the NT generate about 50,600 full-time jobs. Among all industries, general warehouse/storage has the highest number of full-time jobs, which contributes about 31% / 15,650 full-time jobs, followed by construction industry (about 26% / 12,930 full-time jobs), and logistics industry (about 15% / 7,670 full-time jobs).
4.5.2 As estimated from the questionnaire return, active brownfield sites in the NT generate about 1,510 part-time/temporary jobs. Among all industries, general warehouse/storage has the highest number of part-time/temporary jobs, which contributes about 47% / 710 part-time/temporary jobs), followed by construction industry (about 14% / 210 part-time/temporary jobs), and logistics industry (about 10% / 150 part-time/temporary jobs).
4.5.3 The overall employment (full-time and part-time/temporary) in active brownfield sites is about 52,110.

Planning Department Agreement No. CE40/2016 (TP)
Study on Existing Profile and Operation of Brownfield Sites in the New Territories – Feasibility Study Final Report
Agreement No. CE 40/2016 (TP) | Final | November 2019 Page 25
Table 4.5.1 – Estimated Employment in Active Brownfield Sites (Projected by extrapolation based on the questionnaire returns)
Type of In
dustry
Total N
umb
er of Site
Total A
rea (ha)
Full-time Part-time/Temporary Total Employment
Area of R
espon
ded Case
Em
ploym
ent Density of
Resp
onded
Cases/p
er ha
Estim
ated E
mploym
ent (F
ull-tim
e) (round to the
nearest ten)
% (F
ull-time)
Area of R
espon
ded Case
Em
ploym
ent Density of
Resp
onded
Cases/p
er ha
Estim
ated E
mploym
ent (P
art-time/T
emporary)
(round to the n
earest ten)
% (P
art-time/T
emporary)
Total E
stimated
Em
ploym
ent (round to the
nearest ten)
% (T
otal)
General Warehouse/ Storage 2,718 378.86 71.44 41.3 15,650 31% 71.44 1.9 710 47% 16,360 31%
Construction 1,558 367.39 203.42 35.2 12,930 26% 203.42 0.6 210 14% 13,140 25%
Logistics 560 186.14 114.40 41.2 7,670 15% 114.40 0.8 150 10% 7,820 15%
Vehicle Repairing and Related 1,102 137.20 84.85 31.6 4,340 9% 84.85 0.8 110 7% 4,450 9%
Vehicle Parking 435 105.64 20.71 18.7 1,970 3% 20.71 1.3 140 9% 2,110 4%
Port Back-up (Container-related) 152 87.96 42.10 23.8 2,090 4% 42.10 0.0 0 0% 2,090 4%
Waste Recycling 441 85.27 40.04 32.4 2,760 5% 40.04 1.0 90 6% 2,850 5%
Rural Industries 104 22.97 11.78 57.1 1,310 3% 11.78 0.3 10 1% 1,320 3%
General Workshops 176 21.68 5.51 63.7 1,380 3% 5.51 3.6 80 5% 1,460 3%
Vehicle Scrapping 127 20.72 13.10 24.1 500 1% 13.10 0.4 10 1% 510 1%
Total 7,373 1,413.84 N.A. N.A. 50,600 100.0% N.A. N.A. 1,510 100.0% 52,110 100.0% Note: Information on employment density based on Question A7 of the questionnaire.

Planning Department
Agreement No. CE40/2016 (TP)Study on Existing Profile and Operation of Brownfield Sites in the New
Territories – Feasibility Study Final Report
Agreement No. CE 40/2016 (TP) | Final | November 2019 Page 26
4.6 Tenure Status and Monthly Rent
Tenure Status
4.6.1 Among 3,420 respondents to the questionnaire survey, 2,539 respondents (74%) indicated that their sites were under tenancy.
4.6.2 According to the questionnaire survey, the median and average rents of brownfield sites are $3.0/ square feet11 (sq ft) and $3.9/sq ft respectively. A diverse median rent ranging from $2.3/sq ft paid by vehicle scrapping industry to $4.3/sq ft paid by general workshops; and average rent ranging from $2.3/sq ft paid by rural industries to $4.7/sq ft paid by logistics and port back-up (container-related) industry were observed (Table 4.6.1).
Table 4.6.1 – Tenure Status and Monthly Rent by Industry for 3,420 cases responding
Industry No. of Sites
under Tenancy
% of Sites Under Tenancy Among
Responded Cases#
Max $/sq ft
Min $/ sq ft
Median $/ sq ft
Average $/ sq ft
General Warehouse/Storage
340 50.3% 16.1 1.0 3.1 4.3
Construction 690 75.8% 12.7 0.9 2.8 3.5
Logistics 366 88.8% 22.2 2.0 3.5 4.7
Vehicle Repairing and Related
662 89.3% 15.3 0.9 3.1 3.8
Vehicle Parking 60 33.9% 11.0 1.0 2.8 3.9
Port Back-up (Container-related)
55 71.4% 12.6 1.1 3.2 4.7
Waste Recycling 204 88.7% 18.2 1.0 3.4 4.5
Rural Industries 37 62.7% 3.7 0.9 2.5 2.3
General Workshops 40 83.3% 11.0 1.3 4.3 4.6
Vehicle Scrapping 85 94.4% 5.6 0.9 2.3 2.6
Total 2,539 74.2% 22.2 0.9 3.0 3.9
Note: Information based on Question A8 of the questionnaire. # The percentage is calculated based on the total number of active brownfield site with completed survey under each industry.
4.7 Land Status
4.7.1 Among the 1,414 ha of active brownfield sites, the majority (1,180 ha / 83%) is on private land and the remaining (234 ha / 17%) is on government land (Table 4.7.1).
4.7.2 Breaking down by number of sites, out of the total 7,373 active brownfield sites, 350 sites (5%) involve government land only (i.e. 51 ha in terms of area), 1,760 sites (24%) involve private land only (i.e. 219 ha in terms of area), and 5,263 sites (71%) involve both private land
11 One square metre equals 10.76 square feet.

Planning Department
Agreement No. CE40/2016 (TP)Study on Existing Profile and Operation of Brownfield Sites in the New
Territories – Feasibility Study Final Report
Agreement No. CE 40/2016 (TP) | Final | November 2019 Page 27
and government land (i.e. 961 ha of private land and 183 ha of government land in terms of area).
4.7.3 Figure 4.4a to Figure 4.4d show the spatial distribution of active brownfield sites on private land and government land in each sub-region.
Table 4.7.1 Land Status of Active Brownfield Sites Land Status Area (ha) %
Private Land 1,179.94 83.5%
Government Land 233.90 16.5%
Total 1,413.84 100.0%
4.8 Land Use Zonings
4.8.1 Among the 1,414 ha of active brownfield sites, 321 ha (23%) fall under industrial and storage related use zones under statutory town plans, and 579 ha (41%) fall under development zones. Conservation related zones account for 69 ha (5%). (Table 4.8.1).
Table 4.8.1 Zoning of Active Brownfield Sites
Zoning Group Area (ha) %
Industrial and Storage Related Use Zones (including “Open Storage”, “Industrial (Group D)”, “Other Specified Uses” annotated “Port Back-up”,
“Industrial”, “Other Specified Uses” annotated “Logistics Facility”, “Other Specified Uses” annotated
“Port Back-up, Storage and Workshop Uses”)
321.23 22.7%
Development Zones (including “Residential (Group A)”, “Residential (Group B)”, “Residential (Group C)”, “Residential (Group D)”,
“Residential (Group E)”, “Commercial”, “Commercial/Residential”, “Comprehensive
Development Area”, “Village Type Development”, “Other Specified Uses” annotated “Rural Use”,
“Government, Institution or Community”, “Open Space”, “Recreation”, etc.)
578.60 40.9%
Conservation Related Zones (including “Conservation Area”, “Coastal Protection Area”, , “Other Specified Uses” annotated “Nature
Park”, “Other Specified Uses” annotated “Comprehensive Development and Wetland
Enhancement Area”, “Other Specified Uses” annotated “Comprehensive Development to include Wetland
Restoration Area”)
68.66 4.9%
Green Belt Zone 106.08 7.5% Agriculture Zone 152.80 10.8%
Others (including “Undetermined”, and other zones)
142.15 10.1%
Outside Coverage of Statutory Plans 44.32 3.1% Total 1413.84 100.0%

Planning Department
Agreement No. CE40/2016 (TP)Study on Existing Profile and Operation of Brownfield Sites in the New
Territories – Feasibility Study Final Report
Agreement No. CE 40/2016 (TP) | Final | November 2019 Page 28
4.9 Starting Year of Operations
4.9.1 Among 3,420 respondents to the questionnaire survey, 1,267 respondents (37%) indicated that they started their operations at the current brownfield site in “2009 or before”, followed by “2015 or after” (672 respondents / 20%) and “2010 – 2014” (573 respondents / 17%). 908 respondents (26%) refused to answer the question / were not sure about the answer (Table 4.9.1).
4.9.2 For individual industry, comparatively higher percentage of respondents in logistics industry (36% / 150 respondents) indicated their starting year as “2015 or after”, and comparatively higher percentage of respondents in rural industries (73% / 43 respondents) indicated their starting year as “2009 or before”.
Table 4.9.1 Starting Year of Operations
Industry Starting Year of Operations
2009 and before
2010- 2014
2015 or after
Refuse to Answer/Not Sure
Total
General Warehouse/Storage
180 81 104 311 676
26.6% 12.0% 15.4% 46.0%
Construction 362 169 173 206
910 39.8% 18.6% 19.0% 22.6%
Logistics 111 100 150 51
412 26.9% 24.3% 36.4% 12.4%
Vehicle Repairing and Related
357 118 148 118 741
48.2% 15.9% 20.0% 15.9%
Vehicle Parking 44 16 8 109
177 24.9% 9.0% 4.5% 61.6%
Port Back-up (Container-related)
27 12 9 29 77
35.1% 15.6% 11.7% 37.7%
Waste Recycling 77 45 57 51
230 33.5% 19.6% 24.8% 22.2%
Rural Industries 43 5 3 8
59 72.9% 8.5% 5.1% 13.6%
General Workshop 17 9 12 10
48 35.4% 18.8% 25.0% 20.8%
Vehicle Scrapping 49 18 8 15
90 54.4% 20.0% 8.9% 16.7%
Total 1267 573 672 908
3420 37.0% 16.8% 19.6% 26.5%
Note: Information based on Question A1 of the questionnaire survey.

Planning Department
Agreement No. CE40/2016 (TP)Study on Existing Profile and Operation of Brownfield Sites in the New
Territories – Feasibility Study Final Report
Agreement No. CE 40/2016 (TP) | Final | November 2019 Page 29
4.10 Operational and Locational Requirements
Reasons of Choosing the Current Site for Operation
4.10.1 According to the questionnaire survey, “Site Meeting Operational Requirement” and “Affordable Rent” were the two most selected reasons considered by the respondents as the reason(s) of choosing the current site for operation. Among 3,420 respondents to the questionnaire survey, 60% and 34% of the respondents selected the two reasons respectively (Chart 4.2).
4.10.2 The above two reasons are also the mostly selected reasons for individual industry. Apart from the above two reasons, for logistics industry (412 respondents), about 250 of the respondents (61%) in the industry also selected “Near the Port”, “Good Logistics Facilities”, “Benefits of Co-locating with Other Operations’ and/or “Near the Border” as their reason(s) for choosing the current site. For port back-up (container related) industry (77 respondents), 32% of the respondents in the industry selected the reasons of “Near the Port” and/or “Near the Border”. For waste recycling industry (230 respondents), about 6% of the respondents in the industry chose “Close to Waste Collection/Processing Points” as the reason or one of the reasons of choosing the current site for operation.
Chart 4.2 Reasons of Choosing the Current Site for Operation
Note: Information based on Question A12 of the questionnaire survey. Multiple responses are allowed in this question.
Requirement for Operating at Open-air Site
4.10.3 Among the 3,420 respondents to the questionnaire survey, about 43% indicate the need to operate at open-air site. Construction (57%), logistics (50%), port back-up (container-related) (57%), waste recycling (55%) industries have comparatively higher percentages of respondents within its industry indicating the need to operate at open-air site than other industries. General workshops (23%), general warehouse/storage (23%), and vehicle parking (23%) industries have
96 207 157 40207
1178
150
2057
0
500
1000
1500
2000
2500
Near the B
order
Near the P
ort
Good L
ogistics Facilities
Good S
upply of Labour
Force
Benefits of C
o-locating w
ith Other O
perations
Affordable R
ent
Close to W
aste C
ollection/P
rocessing Points
Site M
eeting Operational
Requirem
ents

Planning Department
Agreement No. CE40/2016 (TP)Study on Existing Profile and Operation of Brownfield Sites in the New
Territories – Feasibility Study Final Report
Agreement No. CE 40/2016 (TP) | Final | November 2019 Page 30
comparatively lower percentages of respondents indicating the need to operate at open-air site (Chart 4.3).
Chart 4.3 Requirement for Operating at Open-air Site
Note: Information based on Question C2 of the questionnaire survey.
4.11 Views on Operating at Alternative Locations
Suitability of Relocating to Buildings/Special Locations
4.11.1 Among the 3,420 respondents to the questionnaire survey, only 376 respondents (i.e. 11%) indicated that it was suitable for their operation to relocate to other locations including general industrial buildings, industrial estate, industrial hub and/or specially designed MSB (with large operational space and specially designed ramp allowing large trucks/vehicles to access various floors direct). The cargo and logistics centres in Kwai Chung have been referred to as examples (Chart 4.4).
23.4%
56.5% 50.2%40.6%
23.2%
57.1% 55.2%
35.6%22.9%
40.0% 42.7%
31.2%
21.8% 30.3% 43.6%
16.4%
7.8%
29.1%
50.8%60.4%
51.1%31.1%7.8%
13.5%16.7% 13.4%
10.2%
11.7%
8.7%11.9%
10.4%6.7%
12.0%37.6%
8.2% 2.7% 2.4%
50.3%
23.4%7.0% 1.7% 6.3% 2.2%
14.2%
0%10%20%30%40%50%60%70%80%90%
100%
General
Warehouse/S
torage
Construction
Logistics
Vehicle R
epairing and R
elated
Vehicle P
arking
Port B
ack-up (C
ontainer-related)
Waste R
ecycling
Rural Industries
General W
orkshop
Vehicle S
crapping
Overall R
esponse
Yes No Not Sure No Response

Planning Department
Agreement No. CE40/2016 (TP)Study on Existing Profile and Operation of Brownfield Sites in the New
Territories – Feasibility Study Final Report
Agreement No. CE 40/2016 (TP) | Final | November 2019 Page 31
Chart 4.4 Suitability of Relocating to Buildings/Special Locations
Note: Information based on Question C3 of the questionnaire survey.
4.11.2 Among the 376 respondents who considered their operation suitable to relocate to other locations, most respondents (228 / 61%) chose “Industrial Hub” as suitable (or as one of the suitable locations) for their operation, followed by “Industrial Estate” (196 / 52%), “General Industrial Building” (178 / 47%) and “Specially Designed MSB” (100 / (27%).
4.11.3 Notwithstanding the above, participants of the stakeholder interviews generally considered that it would be feasible or partly feasible to relocate their operations from brownfield sites to specially MSB or industrial hub, provided that the design of which was able to suit their operational requirements.
Factors Encouraging Relocation of Operation to General Industrial Building/ Industrial Estate/ Industrial Hub/ Specially Designed MSBs
4.11.4 When asked about what factor(s) that could encourage operators to relocate to designated locations or buildings including general industrial building/ industrial estate/ industrial hub/ specially designed MSBs, among the 3,420 respondents, 34% or 1,169 of respondents selected “Subsidy on Rent” as the encouraging factor(s), followed by “Sufficient Floor Space for Operation and Storage” (26% / 899) and “Subsidy to Add Equipment” (14% / 494) (Chart 4.5).
Suitable, 376, 11%
Not Suitable, 1776, 52%
Not Sure, 749, 22%
No Response, 519, 15%
Suitable Not Suitable Not Sure No Response

Planning Department
Agreement No. CE40/2016 (TP)Study on Existing Profile and Operation of Brownfield Sites in the New
Territories – Feasibility Study Final Report
Agreement No. CE 40/2016 (TP) | Final | November 2019 Page 32
Chart 4.5 No. of Response on Factors Encouraging Relocation to Designated Location or Buildings
Note: Information based on Question C7 of the questionnaire survey. Multiple responses allowed in this question.
Possibility to Operate Outside Hong Kong
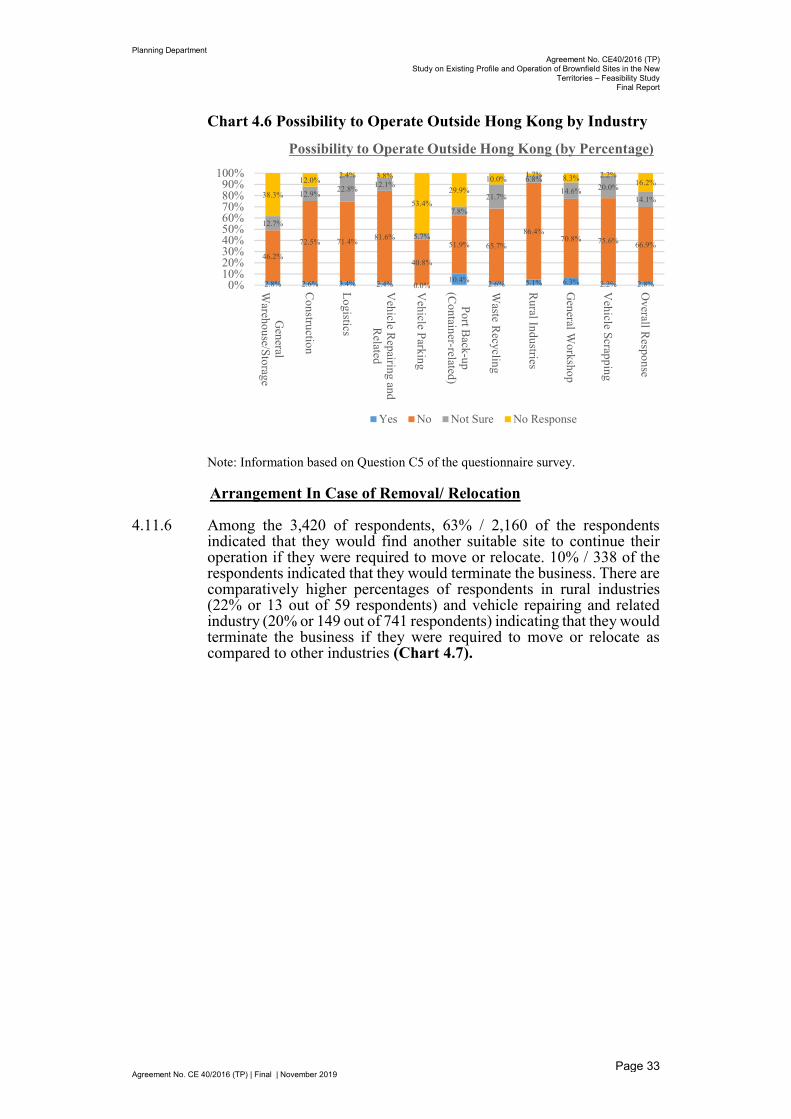
4.11.5 According to the questionnaire survey, only 3% or 93 of the respondents stated that it was possible for their operation to operate outside Hong Kong (Chart 4.6). Among all industries, port back-up (container-related) industry has the highest percentage of respondents (10%) within its industry considering it possible for their operation to operate outside Hong Kong.
1169
494
206 219 188260
899
188
20
241
470
1371
0
200
400
600
800
1000
1200
1400
1600
Subsidy on Rent
Provide Subsidy to Add E
quipment
Appropriate O
peration Support
Appropriate Floor to Floor H
eight
Appropriate Floor L
oading Capacity
Passage for Heavy V
ehicles to Reach D
ifferent Levels
Sufficient Floor Space for Operations and Storage
Sufficient Loading/U
nloading Bays
Cranes/L
ifts for Containers
Convenient G
eographical Location
Good T
ransport Facilities
No Specific Factors/ N
o Response
Planning Department
Agreement No. CE40/2016 (TP)Study on Existing Profile and Operation of Brownfield Sites in the New
Territories – Feasibility Study Final Report
Agreement No. CE 40/2016 (TP) | Final | November 2019 Page 33
Chart 4.6 Possibility to Operate Outside Hong Kong by Industry
Note: Information based on Question C5 of the questionnaire survey.
Arrangement In Case of Removal/ Relocation
4.11.6 Among the 3,420 of respondents, 63% / 2,160 of the respondents indicated that they would find another suitable site to continue their operation if they were required to move or relocate. 10% / 338 of the respondents indicated that they would terminate the business. There are comparatively higher percentages of respondents in rural industries (22% or 13 out of 59 respondents) and vehicle repairing and related industry (20% or 149 out of 741 respondents) indicating that they would terminate the business if they were required to move or relocate as compared to other industries (Chart 4.7).
2.8% 2.6% 3.4% 2.4% 0.0%10.4% 2.6% 5.1% 6.3% 2.2% 2.8%
46.2%
72.5% 71.4%81.6%
40.8%
51.9% 65.7%
86.4%70.8% 75.6% 66.9%
12.7%
12.9%22.8%
12.1%
5.7%
7.8%
21.7%
6.8%
14.6% 20.0%
14.1%38.3%
12.0%2.4% 3.8%
53.4%
29.9%
10.0%1.7% 8.3% 2.2%
16.2%
0%10%20%30%40%50%60%70%80%90%
100%
General
Warehouse/S
torage
Construction
Logistics
Vehicle R
epairing and R
elated
Vehicle P
arking
Port B
ack-up (C
ontainer-related)
Waste R
ecycling
Rural Industries
General W
orkshop
Vehicle S
crapping
Overall R
esponsePossibility to Operate Outside Hong Kong (by Percentage)
Yes No Not Sure No Response

Planning Department
Agreement No. CE40/2016 (TP)Study on Existing Profile and Operation of Brownfield Sites in the New
Territories – Feasibility Study Final Report
Agreement No. CE 40/2016 (TP) | Final | November 2019 Page 34
Chart 4.7 Arrangement In Case of Removal/ Relocation by Industry
Note: Information based on Question C11 of the questionnaire survey.
4.11.7 Among the 2,160 of respondents indicating they would continue operating at another suitable site, a majority of respondents (97% / 2,096) indicated that they would find a site similar to where they are currently located. All industries follow a similar pattern.
49.0%
76.5%59.7%
69.1% 67.5% 70.0% 66.1%
33.9%49.0%
75.0%63.2%
4.1%
6.3%
7.8%
12.2% 20.1% 17.8% 22.0%
3.4%
4.1%
8.3%
9.9%9.0%
14.1%
13.0%
11.7%8.6% 10.0% 10.2%
11.3%
9.0%
10.4%12.0%37.9%
3.2%19.5%
7.0% 3.8% 2.2% 1.7%
51.4%37.9%
6.3% 14.9%
0%10%20%30%40%50%60%70%80%90%
100%
General
Warehouse/S
torage
Logistics
Port B
ack-up (C
ontainer-related)
Waste R
ecycling
Vehicle R
epairing and R
elated
Vehicle S
crapping
Rural Industries
Vehicle P
arking
General
Warehouse/S
torage
General W
orkshop
Overall R
esponse
Arrangement In Case of Removal/ Relocation by Industry
Finding Other Suitable Sites to Continue the Operation Terminate Business Other Arrangement No Response

Planning Department
Agreement No. CE40/2016 (TP)Study on Existing Profile and Operation of Brownfield Sites in the New
Territories – Feasibility Study Final Report
Agreement No. CE 40/2016 (TP) | Final | November 2019 Page 35
5 KEY ISSUES PERTINENT TO BROWNFIELD SITES
5.1 General
5.1.1 Summarizing from the findings and observations from stakeholder interviews, field and questionnaire surveys, the following sections identify key issues pertinent to brownfield operations, which include (i) key issues relating to impacts from existing brownfield sites, (ii) key issues encountered in displacement of brownfield sites, and (iii) key issues relating to development potential of brownfield sites.
5.2 Key Issues Relating to Impacts from Existing Brownfield Sites
5.2.1 Key issues relating to impacts from existing brownfield sites are mainly on the environmental, ecological and traffic impacts created by the brownfield sites. Based on mainly the observations from the field survey, environmental, ecological and traffic impacts of brownfield sites in different industries on sensitive receivers have been identified and explained in the paragraphs below.
Potential Environmental Impacts from Brownfield Sites in Different Industries
5.2.2 As observed during the on-site surveys of the brownfield sites, active brownfield sites in different industries would generate different degrees of potential environmental impacts on the surrounding sensitive receivers depending on the nature of activities involved.
5.2.3 Residential use is the main sensitive use susceptible to the adverse environmental impacts including noise, dust, odour, visual and land/water contamination from brownfield sites. Photos 5.1 to 5.4 are some typical examples showing the interface problem between active brownfield sites and adjacent residential uses.

Planning Department
Agreement No. CE40/2016 (TP)Study on Existing Profile and Operation of Brownfield Sites in the New
Territories – Feasibility Study Final Report
Agreement No. CE 40/2016 (TP) | Final | November 2019 Page 36
Photo 5.1 Piling up of construction materials in open storage near residential developments
Photo 5.2 Brownfield operation may cause adverse environmental impact and visual intrusion
Photo 5.3 Brownfield sites mixed with residential land uses in close proximity
Photo 5.4 Operation at vehicle repairing yard may create nuisance to the nearby residential neighbourhood
5.2.4 Based on the field survey findings and the broad qualitative assessments, it is identified that active brownfield sites in the industries of waste recycling, vehicle repairing and related, vehicle scrapping, rural industries, general workshops, port back-up (container-related), logistics and construction generate “Higher” potential environmental impact in terms of noise, dust, odour, visual and land/water contamination; while vehicle parking and general warehouse/storage generate “Lower” potential environmental impact12.
5.2.5 The scale of environmental impact of a particular brownfield site on adjacent residential areas should be determined by not only the degree of potential environmental impacts of the brownfield sites, but also the concentration level of residential use adjacent to the brownfield sites.
5.2.6 According to Environmental Protection Department’s Code of Practice (CoP) on Handling Environmental Aspects of Temporary Uses & Open Storage Sites, if the open storage use is within 100m from the nearest residential building, it is considered environmentally undesirable to allow such nuisances to affect residents. Hong Kong Planning Standards and Guidelines Chapter 9 also recommend a buffer distance of at least 100m for dusty use, such as open storage areas, from other uses. As such, an ‘Area of Influence’ (AOI) (within 100m radius from
12 The analyses on potential environmental impacts from different industries on brownfield sites are only broad-brush in nature. The degree/magnitude of the potential environmental impact from each operation in particular industry would depend on the modus operandi of that particular operation (e.g. scale of operation, types of materials/commodities/vehicles involved). Detailed impact of particular brownfield site on adjacent agricultural land should be assessed separately.

Planning Department
Agreement No. CE40/2016 (TP)Study on Existing Profile and Operation of Brownfield Sites in the New
Territories – Feasibility Study Final Report
Agreement No. CE 40/2016 (TP) | Final | November 2019 Page 37
the brownfield site) is adopted as the yardstick 13 to measure the concentration level of residential area surrounding the active brownfield site that is affected by the brownfield operations. The concentration level is measured by the proportion of the 100m AOI from each active brownfield site that is occupied by residential area, with the “High” level being ‘Above 20%’14, “Medium” level being ‘above 0% to 20% or below’, and “Low” level being ‘No residential use’.
5.2.7 Based on the degree of potential environmental impacts of active brownfield sites in different industries and the concentration level of residential area adjacent to the active brownfield sites, three scales of environmental impacts from brownfield sites on adjacent residential areas have been identified. Table 5.2.1 below shows the scale of environmental impacts of brownfield sites on adjacent residential uses. They are categorised into the following three scales of environmental impacts:
5.2.8 LARGE scale of environmental impacts: Active brownfield sites with potential Higher environmental impacts and High concentration level of adjacent residential area in the 100m AOI of the site;
5.2.9 MODERATE scale of environmental impacts: Active brownfield sites with potential Higher environmental impacts and Medium concentration level of adjacent residential area in the 100m AOI of the site, or brownfield sites with potential Lower environmental impacts and High concentration level of adjacent residential area in the 100m AOI of the site; and
5.2.10 SMALL scale of environmental impacts: Active brownfield sites with potential Higher environmental impacts and Low concentration level of adjacent residential area in the 100m AOI of the site, or brownfield sites with potential Lower environmental impacts and Low or Medium concentration level of adjacent residential area in the 100m AOI of the site.
5.2.11 There are 243.57 ha of active brownfield sites with large scale of impacts (with 86.22 ha within NDAs/PDAs), 737.28 ha of active brownfield sites with moderate scale of impacts (with 334.37 ha within NDAs/PDAs), and 432.99 ha of active brownfield sites with small scale of impacts (with 194.19 ha within NDAs/PDAs)15.
13 100m Area of Influence is adopted as a general yardstick only for the broad-brush assessment of the likely size of the community that may be affected by environmental impacts from brownfield operations under the Study, whilst detailed assessment which is outside the scope of the Study, such as noise measurements, would be required for assessing the actual environmental impacts from a specific brownfield site on the adjacent residential use. 14 Derived statistically from distribution. 15 The analysis does not cover the 165 ha inactive brownfield sites, since those sites do not involve any operation at the time of survey and thus the scale of environmental impacts on adjacent residential use cannot be determined. As a general information, among the 165 ha inactive brownfield sites, 33% of them (54 ha) are identified with high concentration of residential use in the adjacent areas, 60% (99 ha) with medium concentration, and 7% (12 ha) with low concentration.

Planning Department
Agreement No. CE40/2016 (TP)Study on Existing Profile and Operation of Brownfield Sites in the New
Territories – Feasibility Study Final Report
Agreement No. CE 40/2016 (TP) | Final | November 2019 Page 38
Table 5.2.1 Scales of environmental impacts from active brownfield sites on adjacent residential areas
Concentration Level of Residential Area Affected by Adjacent Brownfield Sites
(i.e. Proportion of 100m AOI from Brownfield Sites Occupied by Residential Area)
No Adjacent
Residential Area (Low Concentration
Level)
Above 0% to 20% (Medium
Concentration Level)
Above 20% (High Concentration
Level)
Deg
ree
of P
oten
tial
Env
iron
men
tal I
mp
act
of
Bro
wnf
ield
Sit
es
Industry with Potential Higher Environmental Impacts Waste Recycling Vehicle Repairing
and Related Vehicle Scrapping General Workshops Rural Industries Logistics Port Back-up
(Container-related) Construction
135.76 550.01 243.57
Industry with Potential Lower Environmental Impacts General Warehouse/
Storage Vehicle Parking
53.22 244.01 187.27
Area of brownfield sites in Large, Moderate and Small Scale of Environmental Impacts on Adjacent Residential Use
Legend Scale of Environmental Impacts
Total Area of Active Brownfield Sites (in ha)
Large Scale of Impacts 243.57
Moderate Scale of Impacts 737.28
Small Scale of Impacts 432.99
5.2.12 Figure 5.2 shows the general locations of active brownfield sites with Large, Moderate and Small scale of environmental impact on adjacent residential area.
5.2.13 Active brownfield sites generating large scale of environmental impacts are concentrated around HSK/HT NDA, KTN NDA, YLS Development, the PDAs identified under the NTN Study including NTN New Town and San Tin/Lok Ma Chau Development Node; as

Planning Department
Agreement No. CE40/2016 (TP)Study on Existing Profile and Operation of Brownfield Sites in the New
Territories – Feasibility Study Final Report
Agreement No. CE 40/2016 (TP) | Final | November 2019 Page 39
well as Pat Heung, Shek Kong, Kam Tin, Lam Tei, Ping Shan, Kwu Tung South, Ngau Tam Mei and Tai Sang Wai.
5.2.14 The above analysis is a broad-brush assessment on the scale of potential environmental impacts from brownfield sites on adjacent residential areas having only taken into account the nature of brownfield operations in different industries and the concentration level of residential area adjacent to the brownfield sites. Actual environmental impacts from individual brownfield sites are subject to various site-specific factors such as government control on the site operation and management 16 . Detailed environmental assessment is required for future projects on specific brownfield sites.
Ecological Impacts from Active Brownfield Sites in Conservation Related Zones
5.2.15 Operations on active brownfield sites may also create adverse ecological impacts on the adjacent areas of conservation interest (e.g. fishponds, wetlands, egretries, ecologically important streams, fung shui woods etc.), which include the following:-
The access road to brownfield operations are often immediately adjacent to fishponds/ wetlands which may be sensitive to brownfield operations and traffic generated. The frequent traffic to/from access roads may also cause much traffic noise and affect feeding activities in fishpond/wetland. Photo 5.5 refers.
Fish ponds in the area have intrinsic value as they function ecologically as a main source of food supply and as an important habitat for roosting and foraging of waterbirds. Fishponds/ wetlands are feeding habitats to birds and wetland-dependent species. Loss of fish ponds will reduce the food available to these species.
Noise from brownfield operations (e.g. car repairing etc.) and exhaust fumes from vehicles would create nuisance to birds and wildlife in the fishpond/wetland. Photo 5.6 refers.
Sewage and waste from brownfield operations might create water pollution and land contamination in the adjacent fishpond/wetland. Polluted runoff/drainage may enter the wetlands and watercourses.
16 For example, some brownfield operations have obtained planning permission and are required to comply with various approval conditions to mitigate the adverse environmental impacts from the operations, such as restrictions on operation time, activities on the site or types of vehicles parked/stored on the site; as well as provision of landscaping or fire services installations.
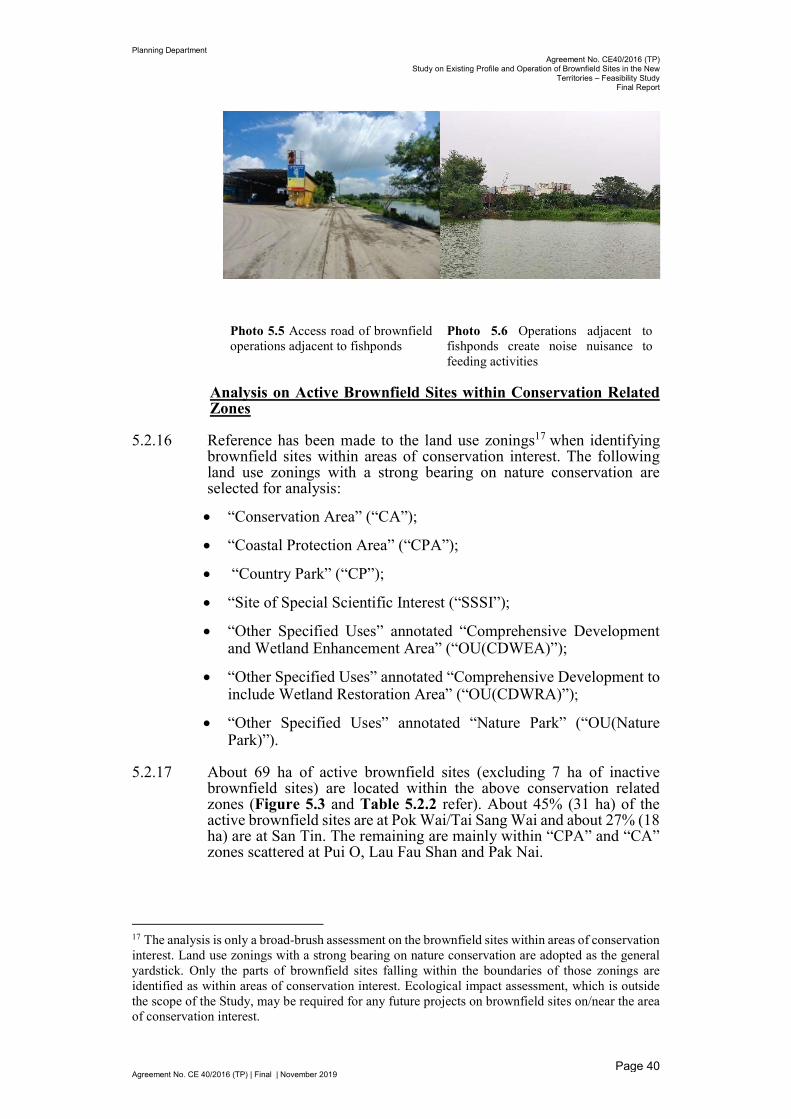
Planning Department
Agreement No. CE40/2016 (TP)Study on Existing Profile and Operation of Brownfield Sites in the New
Territories – Feasibility Study Final Report
Agreement No. CE 40/2016 (TP) | Final | November 2019 Page 40
Photo 5.5 Access road of brownfield operations adjacent to fishponds
Photo 5.6 Operations adjacent to fishponds create noise nuisance to feeding activities
Analysis on Active Brownfield Sites within Conservation Related Zones
5.2.16 Reference has been made to the land use zonings17 when identifying brownfield sites within areas of conservation interest. The following land use zonings with a strong bearing on nature conservation are selected for analysis:
“Conservation Area” (“CA”);
“Coastal Protection Area” (“CPA”);
“Country Park” (“CP”);
“Site of Special Scientific Interest (“SSSI”);
“Other Specified Uses” annotated “Comprehensive Development and Wetland Enhancement Area” (“OU(CDWEA)”);
“Other Specified Uses” annotated “Comprehensive Development to include Wetland Restoration Area” (“OU(CDWRA)”);
“Other Specified Uses” annotated “Nature Park” (“OU(Nature Park)”).
5.2.17 About 69 ha of active brownfield sites (excluding 7 ha of inactive brownfield sites) are located within the above conservation related zones (Figure 5.3 and Table 5.2.2 refer). About 45% (31 ha) of the active brownfield sites are at Pok Wai/Tai Sang Wai and about 27% (18 ha) are at San Tin. The remaining are mainly within “CPA” and “CA” zones scattered at Pui O, Lau Fau Shan and Pak Nai.
17 The analysis is only a broad-brush assessment on the brownfield sites within areas of conservation interest. Land use zonings with a strong bearing on nature conservation are adopted as the general yardstick. Only the parts of brownfield sites falling within the boundaries of those zonings are identified as within areas of conservation interest. Ecological impact assessment, which is outside the scope of the Study, may be required for any future projects on brownfield sites on/near the area of conservation interest.
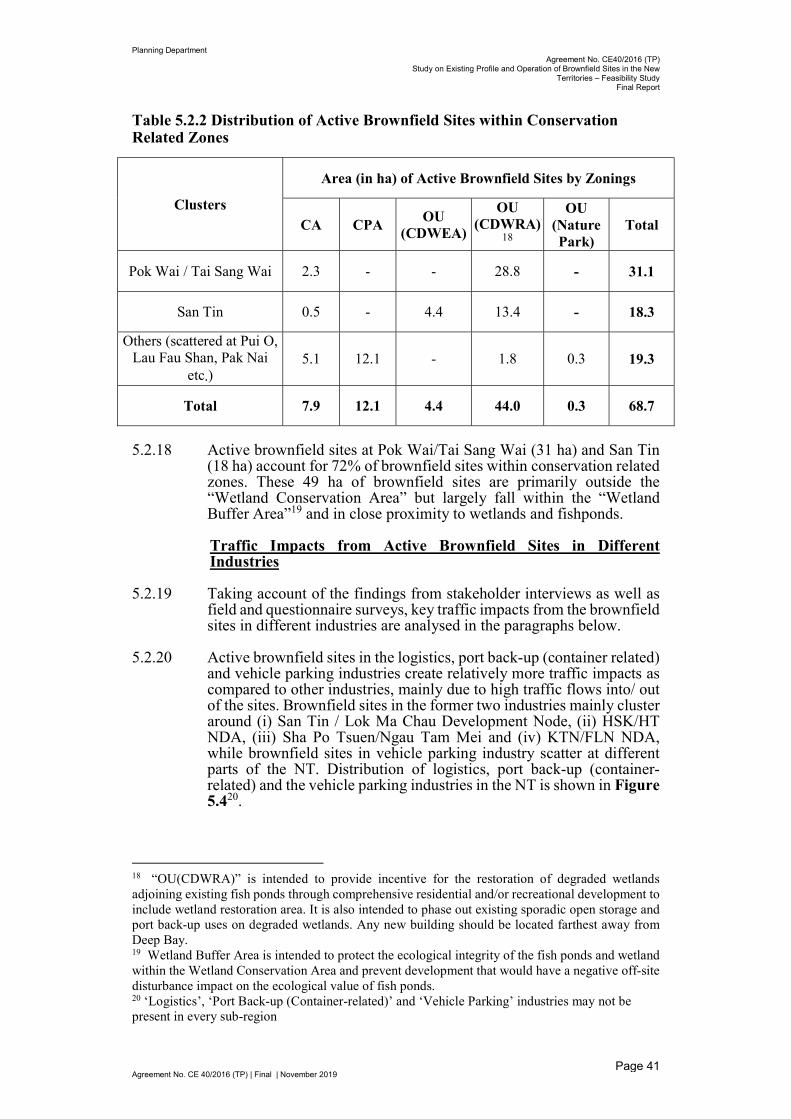
Planning Department
Agreement No. CE40/2016 (TP)Study on Existing Profile and Operation of Brownfield Sites in the New
Territories – Feasibility Study Final Report
Agreement No. CE 40/2016 (TP) | Final | November 2019 Page 41
Table 5.2.2 Distribution of Active Brownfield Sites within Conservation Related Zones
Clusters
Area (in ha) of Active Brownfield Sites by Zonings
CA CPA OU
(CDWEA)
OU (CDWRA)
18
OU (Nature Park)
Total
Pok Wai / Tai Sang Wai 2.3 - - 28.8 - 31.1
San Tin 0.5 - 4.4 13.4 - 18.3
Others (scattered at Pui O, Lau Fau Shan, Pak Nai
etc.) 5.1 12.1 - 1.8 0.3 19.3
Total 7.9 12.1 4.4 44.0 0.3 68.7
5.2.18 Active brownfield sites at Pok Wai/Tai Sang Wai (31 ha) and San Tin (18 ha) account for 72% of brownfield sites within conservation related zones. These 49 ha of brownfield sites are primarily outside the “Wetland Conservation Area” but largely fall within the “Wetland Buffer Area”19 and in close proximity to wetlands and fishponds.
Traffic Impacts from Active Brownfield Sites in Different Industries
5.2.19 Taking account of the findings from stakeholder interviews as well as field and questionnaire surveys, key traffic impacts from the brownfield sites in different industries are analysed in the paragraphs below.
5.2.20 Active brownfield sites in the logistics, port back-up (container related) and vehicle parking industries create relatively more traffic impacts as compared to other industries, mainly due to high traffic flows into/ out of the sites. Brownfield sites in the former two industries mainly cluster around (i) San Tin / Lok Ma Chau Development Node, (ii) HSK/HT NDA, (iii) Sha Po Tsuen/Ngau Tam Mei and (iv) KTN/FLN NDA, while brownfield sites in vehicle parking industry scatter at different parts of the NT. Distribution of logistics, port back-up (container-related) and the vehicle parking industries in the NT is shown in Figure 5.420.
18 “OU(CDWRA)” is intended to provide incentive for the restoration of degraded wetlands adjoining existing fish ponds through comprehensive residential and/or recreational development to include wetland restoration area. It is also intended to phase out existing sporadic open storage and port back-up uses on degraded wetlands. Any new building should be located farthest away from Deep Bay. 19 Wetland Buffer Area is intended to protect the ecological integrity of the fish ponds and wetland within the Wetland Conservation Area and prevent development that would have a negative off-site disturbance impact on the ecological value of fish ponds. 20 ‘Logistics’, ‘Port Back-up (Container-related)’ and ‘Vehicle Parking’ industries may not be present in every sub-region

Planning Department
Agreement No. CE40/2016 (TP)Study on Existing Profile and Operation of Brownfield Sites in the New
Territories – Feasibility Study Final Report
Agreement No. CE 40/2016 (TP) | Final | November 2019 Page 42
5.2.21 Residential uses are observed at the surrounding areas of brownfield sites in those four clusters and inadequate parking and loading/unloading spaces available to the brownfield sites causing blockage of ingress/egress of nearby sites is common.
5.2.22 Currently, operations on these brownfield sites are mainly served by informal local roads/ tracks, which are not well maintained and the capacity is generally limited. Pedestrian safety is another major concern, as pavements are usually absent or occupied by parked vehicles.
5.2.23 Photos 5.7 and 5.8 demonstrate the above issues.
Photo 5.7 Informal and narrow rural track shared by pedestrians and vehicles
Photo 5.8 Unloaded materials and vehicles blocked the pedestrian paths and entrance of a brownfield site
5.3 Key Issues Encountered in Displacement of Brownfield Sites
Socio-economic Needs and Importance of Industries Occupying Brownfield Sites
5.3.1 Active brownfield sites in NT with a total area of 1,414 ha provide a significant source of industrial land in Hong Kong. Many industries have certain need for brownfield sites. For example, local demand on logistics services (especially third-party logistics and business-to-customer e-commerce) is rising and the scale of logistics centres on brownfield sites is expanding. Besides, local demand on vehicle repairing and related industries is rising as driven by the increase in number of commercial and private vehicles, and brownfield sites could provide land with lower cost for that sector. Other than logistics and vehicle repairing, brownfield operations are also serving various industries including construction, waste recycling and port back-up (container-related) industries. According to stakeholder interviews, some operations must be retained in Hong Kong for efficient operation of those industries. Brownfield operations also provide a considerable number of jobs, especially low-skilled jobs and serve as an integral part of the local economy.
5.3.2 According to stakeholder interviews, many workers at the brownfield operations reside in the nearby new towns and rural areas and work on full-time or part-time basis (e.g. logistics operations in HSK employ
Planning Department
Agreement No. CE40/2016 (TP)Study on Existing Profile and Operation of Brownfield Sites in the New
Territories – Feasibility Study Final Report
Agreement No. CE 40/2016 (TP) | Final | November 2019 Page 43
residents from the nearby Tin Shui Wai new town). Relocation/closure of brownfield operations would affect the employment in some of the new towns and rural areas quite significantly.
5.3.3 The economic significance of the construction sector in Hong Kong has been growing in recent years and the sector contributes about 5% of Gross Domestic Product (GDP). In 2018, the employment in the sector is about 351,700 people. Construction industry mainly serves the local market. The total employment in brownfield sites for construction industry (13,140 jobs) contributes about 4% of the employment of brownfield sites in the NT.
5.3.4 In terms of both value added and number of employment, trading and logistics is one of the four main economic pillars in the territory. The logistics industry alone contributed 3.2% of Hong Kong’s GDP and 180,600 jobs. It is estimated that brownfield sites involved in logistics industry provide 7,820 jobs.
5.3.5 Operations in waste recycling industry, despite many being relatively low value-added and land extensive, are essential for local waste reduction as part of the waste management system in Hong Kong. The brownfield sites involved in waste recycling industry are estimated to provide 2,850 jobs. The recent changes in Mainland’s requirements of recyclable imports may have an implication on the land requirements of waste recycling industry.
5.3.6 Vehicle repairing and related industry mainly serves the local market. The brownfield sites involved in the industry are estimated to provide 4,450 jobs.
5.3.7 The container terminals of Hong Kong are facing strong competition from counterparts in the Mainland and elsewhere in Asia, affecting the container throughput in Hong Kong. More and more cross-boundary freight has shifted from land-borne to river-borne transport. Far less empty containers are stored in Hong Kong now since there are fast developments of Mainland ports and the cost of container storage and maintenance is cheaper in the Mainland. However, there remains about 88 ha of port back-up uses in the brownfield sites providing 2,090 jobs.
5.3.8 In view of their economic contributions, should the brownfield operations in these industries be displaced for alternative uses on the sites such as urban-type developments, appropriate measures may be needed to deal with the displaced operations. The Government should also thoroughly assess the long-term development and operational needs of individual industries with a view to estimating their respective land requirements and to examining options in providing additional spaces for their operations.
The Site Requirements/Preference for Industries and Implications on Brownfield Sites
5.3.9 According to the stakeholder interviews and questionnaire survey results, brownfield sites being affordable and open-air are important for particular industries such as construction, port back-up (container-related), and, to some extent, logistics and waste recycling.
Planning Department
Agreement No. CE40/2016 (TP)Study on Existing Profile and Operation of Brownfield Sites in the New
Territories – Feasibility Study Final Report
Agreement No. CE 40/2016 (TP) | Final | November 2019 Page 44
5.3.10 For construction industry, storage of bulky construction machinery or materials with heavy floor loading and high clearance requirements would need to operate at open-air sites. The brownfield sites contribute to ensuring easy accessibility to bulky machinery and materials for efficient construction operations.
5.3.11 Container storage yards require high clearance and heavy floor loading as containers need to be stacked up for storage for more efficient operation and land usage.
5.3.12 The logistics operations usually require fast processing of goods and large storage space as well as frequent traffic of container vehicles/trucks and loading/unloading of goods at the site. Spacious and horizontal working spaces with convenient loading/unloading and parking are required. Therefore, while there are many examples of high-rise logistics facilities, open-air sites are preferred by the logistics industry for more efficient operation.
5.3.13 Some operations in waste recycling industry involving heavy materials (e.g. ferrous metal) also require heavy floor loading. Some require ground floor space for installing conveyor belts which need to be sunken into the ground. The open-air brownfield sites could meet such requirements, although it is still possible for them to be accommodated indoors.
5.3.14 For those industries, in their response to the questionnaire, the consideration that brownfield sites could meet their operating requirement is the major reason for them to choose brownfield sites.
Considerations in Relocation of Brownfield Sites
5.3.15 Brownfield sites are considered important to a number of industries, including construction, logistics, waste recycling, port back-up in Hong Kong in terms of employment / value-added / providing essential function. Appropriate measures may be needed to deal with the displaced operations.
5.3.16 As expressed by the stakeholders, those operations involving bulky/heavy materials or machinery may not be suitable to be accommodated in MSBs, such as brownfield sites for storage of heavy and bulky construction machinery in construction industry, storage of heavy and bulky recyclables in waste recycling industry, container storage in port back-up (container-related) industry, etc. According to the survey result, there are about 64 ha of container storage use. Among the open storage uses in construction industry and waste recycling industry, about 115 ha in construction industry (e.g. open storage of metal beams, cranes, boom lifts) and 5 ha in waste recycling industry (e.g. open storage of ferrous metal) involve bulky materials/machinery which may be difficult to be accommodated in MSBs.
5.3.17 Moreover, there are other concerns for accommodating brownfield operations in MSBs or industrial hubs including operational efficiency and sufficient space for operation and storage, as revealed from stakeholder interviews and questionnaire survey. Rent affordability is also a key concern as the rent of brownfield sites is considerably lower than that chargeable for industrial space in the urban areas (e.g.

Planning Department
Agreement No. CE40/2016 (TP)Study on Existing Profile and Operation of Brownfield Sites in the New
Territories – Feasibility Study Final Report
Agreement No. CE 40/2016 (TP) | Final | November 2019 Page 45
industrial buildings and STT sites for port back-up uses in districts such as Kwai Tsing). The above considerations should be taken into account when planning and designing MSBs / industrial hubs for accommodating or consolidating brownfield sites in the future. Apart from MSBs, a certain amount of open-air sites may still be needed for displaced brownfield operations which cannot be accommodated in MSB.
5.3.18 Despite only a small percentage of respondents (11%) considered it suitable for their operation to relocate to alternative locations (including MSBs) (Para. 4.11.1 refers), it should be noted that the views of the respondents in the questionnaire survey highly depend on the degree of their understanding about MSB and other alternative locations. Also, some respondents may not have thoroughly considered the possibilities when asked a “yes or no” question about the future. In the stakeholder interviews, some industries such as construction industry are in general supportive of the idea of accommodating some of their operations in MSBs or in a construction hub, as long as it fulfils certain financial or operational requirements, e.g. affordable rent, sufficient operational and storage space, sufficient floor loading, etc.
5.3.19 Based on the findings of the questionnaire survey, it is also observed that there is a diverse range of rent being paid by different industries, with average rent ranging from $2.3/sq ft paid by rural industries to $4.7/sq ft paid by logistics and port back-up (container-related) industry. It shows that it would not be easy to find a rent level fit for all industries and the government’s policy formulation should be based on sectoral needs.
5.3.20 As mentioned in Section 5.2, some operations in brownfield sites are creating adverse impacts (e.g. environmental and traffic) to the surrounding. When relocating them to alternative locations (e.g. MSBs, open-air sites), the recipient sites should be prudently identified to avoid land use incompatibility. Moreover, those MSBs and/or open-air sites should be carefully designed and implemented to reduce/mitigate the adverse impact including conducting detailed technical assessments (e.g. environmental, traffic, drainage) and carrying out mitigation measures if needed.
5.4 Key Issues Relating to Development Potential of Brownfield Sites
5.4.1 Brownfield sites are scattered in different areas, vary in size and are of irregular shape. In the absence of comprehensive planning of these land parcels, brownfield sites often intermingle with villages, squatters, active or fallow farmland and fish ponds. Sometimes, they also lack infrastructure facilities needed to support high-density development such as roads and sewerage. In addition, brownfield sites in NT provide a significant source of industrial land in Hong Kong and supporting local industries and employments.
5.4.2 In considering whether brownfield sites can be redeveloped for other purposes (e.g. housing development), it is necessary to comprehensively examine a full range of technical considerations, including the overall development strategy, transport accessibility, infrastructure provision, land use compatibility and environmental
Planning Department
Agreement No. CE40/2016 (TP)Study on Existing Profile and Operation of Brownfield Sites in the New
Territories – Feasibility Study Final Report
Agreement No. CE 40/2016 (TP) | Final | November 2019 Page 46
implication. As a result, we cannot assume that brownfield sites even those initially identified as having development potential, could all be used for housing or other types of development.
5.4.3 Notwithstanding the difficulties and challenges encountered, some brownfield sites which are large in size and located nearer to existing new towns and major highways possess greater potential for further development.
Scattered Distribution of Brownfield Sites in the NT
5.4.4 Some brownfield sites in the NT, especially those outside NDAs/PDAs, are scattered in different areas (e.g. Shek Kong, Pat Heung, San Tin, Lung Kwu Tan etc.), varying in size and are of irregular shape. Brownfield sites of a more sizeable area (say, 2 ha or more) may have higher potential for comprehensive development, which should be taken into account when classifying the possible development potential of brownfield sites.
Traffic Infrastructure Provision and Proximity to Existing New Town and Other Considerations
5.4.5 Some brownfield sites in the NT, especially outside NDAs/PDAs, are at quite remote locations, and lack convenient access to highways. Some brownfield sites are distant from the existing new towns where facilities including community, medical and educational facilities are available.
5.4.6 Proximity to strategic highways and existing new towns should be taken into account when classifying the possible development potential of brownfield sites.
5.4.7 Some brownfield sites are located in ecologically sensitive areas and not suitable for development. These may be considered for restoration and conservation.

Planning Department
Agreement No. CE40/2016 (TP)Study on Existing Profile and Operation of Brownfield Sites in the New
Territories – Feasibility Study Final Report
Agreement No. CE 40/2016 (TP) | Final | November 2019 Page 47
6 CLASSIFICATION OF POSSIBLE DEVELOPMENT POTENTIAL OF BROWNFIELD SITES
6.1 Classification of Possible Development Potential
6.1.1 Although the focus of the Study is on establishing a comprehensive profile and spatial distribution of brownfield sites in the NT, some initial work has been done to classify the possible development potential of brownfield sites (both active and inactive brownfield sites) to assist future work on examining alternative uses for the sites. The classification is a desktop exercise purely based on simple quantifiable criteria on distance and size, without carrying out any assessment on feasibility of individual sites for development. The following criteria have been taken into consideration in the classification process:-
Table 6.1.1 Criteria to Classify Possible Development Potential of Brownfield Sites
Category Criteria
Possible Development Potential
(Score)
Low Potential
(1)
Medium Potential
(2)
High Potential
(3)
Strategic Location
Distance from Existing New Towns
> 2000m ≤ 2000m & > 500m
≤ 500m
Transport Considerations
Distance From Existing Highways
> 2000m ≤ 2000m &
> 500m ≤ 500m
Size of Brownfield Clusters
Size in hectares < 0.25 ha ≥ 0.25 ha & < 2 ha
≥ 2 ha
6.1.2 Strategic Location: it refers to the straightline distance of brownfield sites to existing new towns 21 , which will provide common facilities/services including retail shops/restaurants, educational, community, commercial and medical facilities, and public transport services. The availability of and accessibility to nearby facilities are essential to actualize the development potential of brownfield sites, and important for achieving a reasonable quality of life for future residents.
21 The distance measures from the edge of the brownfield sites to the boundaries of the existing new towns. The delineation of the existing new towns is adopted from the boundaries developed by the Civil Engineering and Development Department and Planning Department for new town development purposes.

Planning Department
Agreement No. CE40/2016 (TP)Study on Existing Profile and Operation of Brownfield Sites in the New
Territories – Feasibility Study Final Report
Agreement No. CE 40/2016 (TP) | Final | November 2019 Page 48
6.1.3 Transport Considerations: it refers to the straightline distance22 of brownfield sites to the existing highways23. The transport accessibility is essential to actualize the development potential of brownfield sites, as it will facilitate future residents to travel to a wider area for a diverse range of employment, social and recreation facilities.
6.1.4 Size of Brownfield Clusters: brownfield sites locating close to one another are referred to as a brownfield cluster. There would be a higher opportunity to develop a brownfield cluster of larger size 24 for alternative uses through comprehensive development.
6.1.5 For each criterion, the potential of the brownfield sites has been given different marks, with High potential scoring ‘3’ marks, Medium potential scoring ‘2’ marks and Low potential scoring ‘1’ mark. Full marks would be ‘9’ marks. The overall preliminary development potential is determined by achieving the following scores:
High Preliminary Development Potential: 8-9 marks
Medium Preliminary Development Potential: 6-7 marks
Low Preliminary Development Potential: 3-5 marks
6.1.6 Figure 6.1 refers to the possible development potential of brownfield sites in the NT. Table below shows the locations and area of brownfield sites with High, Medium and Low possible development potential25 respectively based on the classification results.
22 The classification is only based on straightline distance to existing highways without taking into account the actual access to those highways and their capacity. 23 The distance measures from the edge of the brownfield sites to the centerline of the existing highways. ‘Existing highways’ refer to existing trunk roads and expressways. According to para. 3.2.1 in Chapter 8 of the Hong Kong Planning Standards and Guidelines, ‘trunk roads’ are for longer-distance traffic movements between main centres of population and activities. While ‘expressways’ (i.e. connecting the main centres of population and activities) would perform similar functions to ‘trunk roads’, they would be designed to a higher standard, and are designated under the Road Traffic Ordinance. Besides, according to Chapter 5 of the Road Users’ Code prepared by Transport Department, trunk roads are busy roads which link important towns and districts, and some trunk roads are designated as expressways. 24 With reference to the average site area of potential public housing developments identified by the Government, brownfield clusters with an area of 2 ha or more can be classified as having higher development potential. 25 Brownfield sites within “OU(CDWRA)”, “OU(CDWEA)”, “CA”, “CPA” and “OU (Nature Park)” zones (as mentioned in para. 5.2.17 above), which are intended for nature conservation under the zonings, are not included in the classification of possible development potential of brownfield sites.

Planning Department
Agreement No. CE40/2016 (TP)Study on Existing Profile and Operation of Brownfield Sites in the New
Territories – Feasibility Study Final Report
Agreement No. CE 40/2016 (TP) | Final | November 2019 Page 49
Table 6.1.2 Classification of Possible Development Potential of Brownfield Sites
Possible Development
Potential
Main Locations Area of Brownfield Sites Active and
Inactive Brownfield
Sites 26
Excluding Brownfield
Sites Already Covered By
Development Projects
High Parts of HSK/HT NDA, KTN and FLN NDAs and YLS Development
Sha Po Tsuen, Shap Pat Heung, Ping Shan, Lam Tei, Wang Chau, Tai Hang etc.
455 ha 160 ha
Medium San Tin/Lok Ma Chau Development Node, Man Kam To Logistics Corridor and NTN New Town
Parts of HSK/HT NDA, KTN and FLN NDAs and YLS Development
Ngau Tam Mei, Lau Fau Shan, Southern Part of Lung Kwu Tan etc.
765 ha 290 ha
Low Shek Kong, Pat Heung, Northern Part of Lung Kwu Tan, Sha Tau Kok etc.
283 ha 250 ha
Total 1 503 ha 700 ha
26 Brownfield sites already covered by development Projects include both active and inactive brownfield sites within NDAs/PDAs (653 ha), covered by government projects under active planning (about 120 ha), and covered by known development projects initiated by private parties or landowners (about 30 ha).
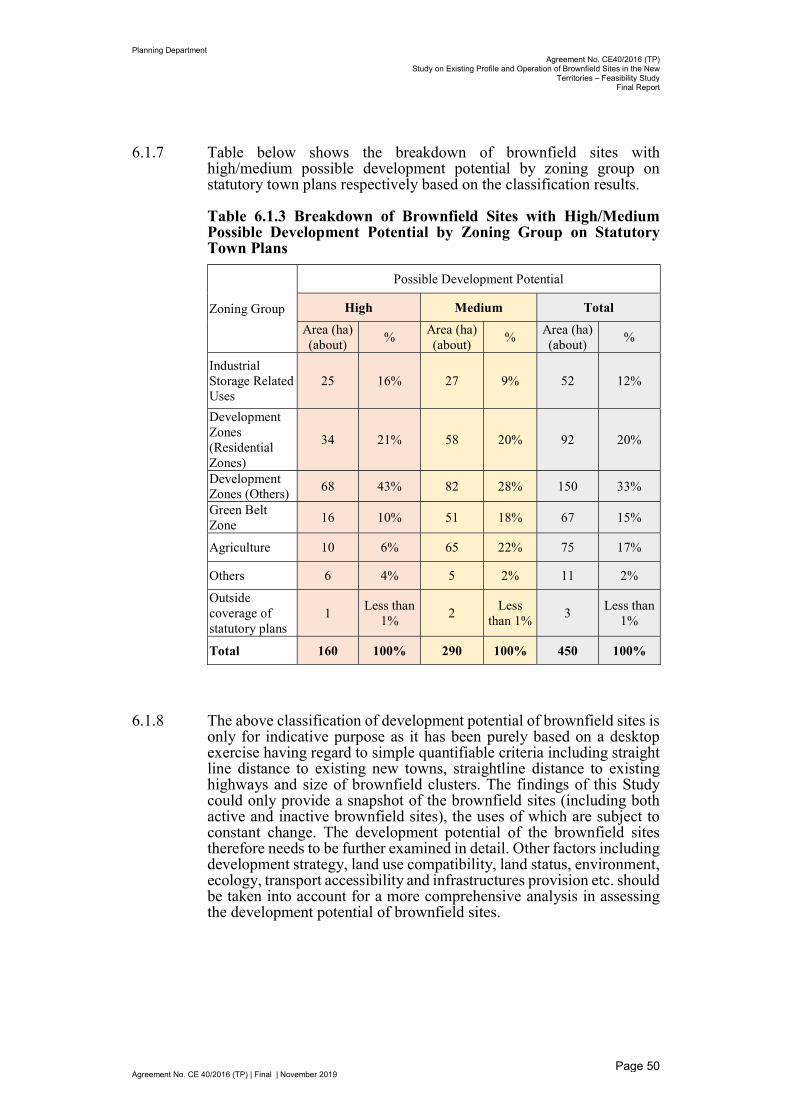
Planning Department
Agreement No. CE40/2016 (TP)Study on Existing Profile and Operation of Brownfield Sites in the New
Territories – Feasibility Study Final Report
Agreement No. CE 40/2016 (TP) | Final | November 2019 Page 50
6.1.7 Table below shows the breakdown of brownfield sites with high/medium possible development potential by zoning group on statutory town plans respectively based on the classification results.
Table 6.1.3 Breakdown of Brownfield Sites with High/Medium Possible Development Potential by Zoning Group on Statutory Town Plans
Zoning Group
Possible Development Potential
High Medium Total
Area (ha) (about)
% Area (ha) (about)
% Area (ha) (about)
%
Industrial Storage Related Uses
25 16% 27 9% 52 12%
Development Zones (Residential Zones)
34 21% 58 20% 92 20%
Development Zones (Others)
68 43% 82 28% 150 33%
Green Belt Zone
16 10% 51 18% 67 15%
Agriculture 10 6% 65 22% 75 17%
Others 6 4% 5 2% 11 2%
Outside coverage of statutory plans
1 Less than
1% 2
Less than 1%
3 Less than
1%
Total 160 100% 290 100% 450 100%
6.1.8 The above classification of development potential of brownfield sites is only for indicative purpose as it has been purely based on a desktop exercise having regard to simple quantifiable criteria including straight line distance to existing new towns, straightline distance to existing highways and size of brownfield clusters. The findings of this Study could only provide a snapshot of the brownfield sites (including both active and inactive brownfield sites), the uses of which are subject to constant change. The development potential of the brownfield sites therefore needs to be further examined in detail. Other factors including development strategy, land use compatibility, land status, environment, ecology, transport accessibility and infrastructures provision etc. should be taken into account for a more comprehensive analysis in assessing the development potential of brownfield sites.

Planning Department
Agreement No. CE40/2016 (TP)Study on Existing Profile and Operation of Brownfield Sites in the New
Territories – Feasibility Study Final Report
Agreement No. CE 40/2016 (TP) | Final | November 2019 Page 51
7 INTERNATIONAL EXPERIENCE
7.1 Overview
7.1.1 While the definition and character of brownfield sites may vary in different geographical, economic, environmental and legislation conditions of different regimes, tackling brownfield sites in general generates certain direct and indirect benefits, for instance optimising the utilisation of existing land resources, and eliminating environmental degradation. Tackling brownfield, however, faces challenges of ownership issues and remediation costs.
7.1.2 Overseas experiences reviewed indicate three possible approaches and their mechanisms and relevant considerations in tackling brownfield sites, including:-
i. intensification and consolidation into MSBs or industrial hubs;
ii. redevelopment or regeneration for residential or commercial uses; and
iii. rehabilitation for greening, conservation or recreation purposes.
7.2 Intensification and Consolidation into MSBs or Industrial Hub - Jurong Industrial Area, Singapore
7.2.1 The strategy of land intensification to achieve higher plot ratios was adopted in Singapore in the 1990s where the original brownfield operations were mostly lighter and cleaner manufacturing activities on Jurong Island and now being consolidated in multi-storey industrial buildings under the strategic plan of Industrial Land Plan 21 (IP21). IP21 put forward policy programs to encourage intensification of industrial land use and reduce space wastage27.
7.2.2 The role of the implementation agent was the key issue when carrying out relocation of brownfield operations. Jurong Town Corporation (JTC), the statutory board under the Ministry of Trade and Industry, was appointed and responsible for undertaking the master planning and development, leasing and management of all industrial sites and obtain the old industrial and brownfield sites through en-bloc redevelopment of the area. En-bloc redevelopment programme by JTC aimed to redevelop the older brownfield sites with low land utilisation and inadequate supporting facilities to meet the needs of modern industries. JTC offers a compensation package that comprises the value of the remaining lease based on market value, an ex-gratia relocation
27 Leng Chow, Y., Eng Ong, S., & Chze-Lin Thang, D. (2002). A cointegration approach to understanding Singapore’s industrial space supply. Journal of Property Investment & Finance, 20(2), 96-115.

Planning Department
Agreement No. CE40/2016 (TP)Study on Existing Profile and Operation of Brownfield Sites in the New
Territories – Feasibility Study Final Report
Agreement No. CE 40/2016 (TP) | Final | November 2019 Page 52
allowance, priority allocation and other incentives such as price discounts of 3-5% of JTC-owned high-rise factories rental price28.
7.2.3 Such reacquired land was then put to higher intensity use and reallocated to multi-storey industrial park and buildings with higher plot ratios and with higher economic productivity per unit of land. According to the International Society of City and Regional Planners (2012)29, ramp-up facilities ranging from 6 to 9 storeys high were now replacing small terraced workshops and standalone factories, comparable to the prevailing situation of brownfield operations in Hong Kong. As a result, up to 90 of the land-based companies (averaging 0.2 to 0.4 ha each) could now be stacked up and housed in factory complexes that only took up 4.5 to 5 ha of land, generating significant savings in land resources.
7.2.4 The major challenges for the land intensification approach are the land ownership and economic return. En-bloc redevelopment entails buying back private land ownership to facilitate land assembly. Meanwhile, industries to be moved into the new industrial buildings need to be thoroughly analyzed and carefully selected.
7.3 Redevelopment or Regeneration for Residential or Commercial Uses - Pennsylvania, United States and Bristol, United Kingdom
Pennsylvania, United States
7.3.1 The Environmental Protection Agency (EPA) of the United States is responsible for formulating the ‘Brownfield Program’ to devise planning and development guideline, providing grants for community-benefited projects, decontamination works of brownfield sites with the coordinated involvement of various states and local authorities since 1995 30. The main objectives of regeneration of brownfield sites into land uses with higher economic returns such as residential and commercial uses are to promote economic development, create business and job opportunities and improve tax revenue.
7.3.2 Two examples in Pennsylvania are widely recognized brownfield regeneration projects. They were both led by the Urban Redevelopment Authority (URA) of Pittsburgh, the public planning authority in Pennsylvania. Washington’s Landing is a mixed use development which was capitalizing on its waterfront location to revitalize the former cattle stockyards and rural meat-packaging industrial plants into a residential, office, research & development communities with public park and waterfront 31 . In this project, URA of Pittsburgh was
28 Yu. S.M. (2003) Optimizing Industrial Land Use: The Case of En Bloc Redevelopment. Redevelopment Pacific Rim Real Estate Society Conference 29 The International Society of City and Regional Planners (2012). http://www.isocarp.net/Data/case_studies/2100.pdf 30 EPA, US (2015). https://www.epa.gov/sites/production/files/2015-09/documents/anat_bf_redev_101106.pdf 31URA of Pittsburgh. https://www.ura.org/media/W1siZiIsIjIwMTgvMDIvMTQvMzY1aGxsc3RhMV9XYXNoaW5ndG9uX3NfTGFuZGluZ19maW5hbC5wZGYiXV0/Washington_s_Landing_final.pdf
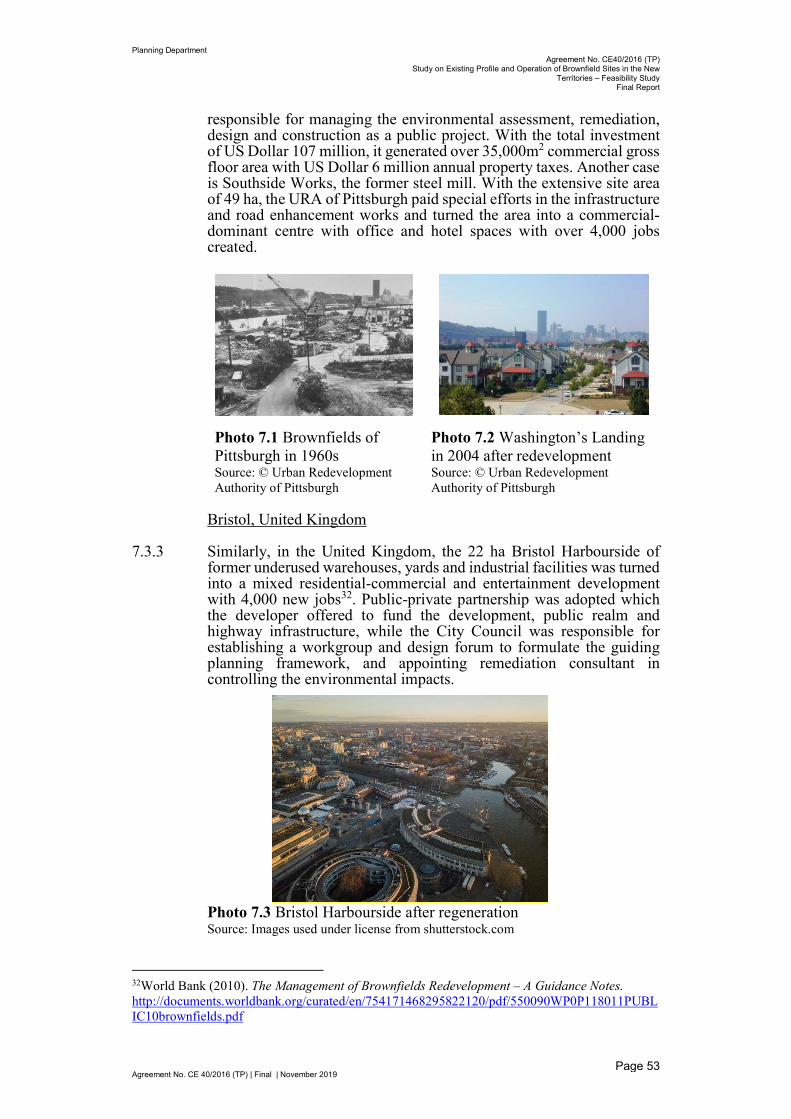
Planning Department
Agreement No. CE40/2016 (TP)Study on Existing Profile and Operation of Brownfield Sites in the New
Territories – Feasibility Study Final Report
Agreement No. CE 40/2016 (TP) | Final | November 2019 Page 53
responsible for managing the environmental assessment, remediation, design and construction as a public project. With the total investment of US Dollar 107 million, it generated over 35,000m2 commercial gross floor area with US Dollar 6 million annual property taxes. Another case is Southside Works, the former steel mill. With the extensive site area of 49 ha, the URA of Pittsburgh paid special efforts in the infrastructure and road enhancement works and turned the area into a commercial-dominant centre with office and hotel spaces with over 4,000 jobs created.
Photo 7.1 Brownfields of Pittsburgh in 1960s Source: © Urban Redevelopment Authority of Pittsburgh
Photo 7.2 Washington’s Landing in 2004 after redevelopment Source: © Urban Redevelopment Authority of Pittsburgh
Bristol, United Kingdom
7.3.3 Similarly, in the United Kingdom, the 22 ha Bristol Harbourside of former underused warehouses, yards and industrial facilities was turned into a mixed residential-commercial and entertainment development with 4,000 new jobs32. Public-private partnership was adopted which the developer offered to fund the development, public realm and highway infrastructure, while the City Council was responsible for establishing a workgroup and design forum to formulate the guiding planning framework, and appointing remediation consultant in controlling the environmental impacts.
Photo 7.3 Bristol Harbourside after regeneration Source: Images used under license from shutterstock.com
32World Bank (2010). The Management of Brownfields Redevelopment – A Guidance Notes. http://documents.worldbank.org/curated/en/754171468295822120/pdf/550090WP0P118011PUBLIC10brownfields.pdf

Planning Department
Agreement No. CE40/2016 (TP)Study on Existing Profile and Operation of Brownfield Sites in the New
Territories – Feasibility Study Final Report
Agreement No. CE 40/2016 (TP) | Final | November 2019 Page 54
7.3.4 The key lesson on redevelopment of brownfield sites into residential or commercial land uses in both the United States and the United Kingdom is the need for effective pre-development planning and coordination among public and private stakeholders. A guiding planning and development framework should first be prepared by the planning authority to fully utilize the site and followed by a pre-development feasibility study to confirm the remediation and technical issues, publicly-funded clean-up meeting community needs, and financing the development through various public, private or partnership initiatives.
7.4 Rehabilitation for Greening, Conservation or Recreation Purposes - East Palo Alto, California, United States
7.4.1 The EPA and the Water Quality Control Board, and community partners of Packard Foundation and CalRecycle regenerated a toxic dump site handling fuel wastes into Cooley Landing Park and Education Center aiming to provide open space for educational and passive recreational uses with outdoor classroom and community gathering places to promote healthy lifestyles and environmental and historic education. The new Cooley Landing Park will support economic development and jobs creation. With the opening of this park, the East Palo Alto city increased the public parkland by 72% to 12,140 sq m per 1,000 people in 201233.
7.4.2 The major considerations of the rehabilitation project are the locational advantage of the site, availability of funding for remedial works and the prevailing clean-up standards. The city government also establishes a close partnership with the private sector to secure fundings for implementation and operation. A well-defined plan of division of works and responsibilities across institutions is prepared. For instance, the EPA is responsible for clean-up and grants, whilst the regional department is responsible for infrastructural works while community and non-government environmental organisations are responsible for the park operation34.
33 EPA, US (2015). https://www.epa.gov/sites/production/files/2015-10/documents/epa_oblr_successstory_region9_openspace_v2_508.pdf 34 https://19january2017snapshot.epa.gov/www3/region9/superfund/cooley/index.html#funding

Planning Department
Agreement No. CE40/2016 (TP)Study on Existing Profile and Operation of Brownfield Sites in the New
Territories – Feasibility Study Final Report
Agreement No. CE 40/2016 (TP) | Final | November 2019 Page 55
Photo 7.4 Redeveloping brownfields as open space, at Cooley Landing Park in East Palo Alto, California Source from © San Francisco Bay Trail Project
7.4.3 To sum up, the above-mentioned international experiences provide insights in terms of reserving land for industrial hubs, residential, commercial or conservation uses upon the regeneration of brownfield sites, as well as identifying an appropriate implementation approach (e.g. implementation by the public sector, the private sector, or through public-private partnership). It should be noted that the definition of ‘brownfield’ and its operations vary across jurisdictions and are highly related to the historical, social, economic and environmental contexts of the sites. These examples could only serve as a general reference for tackling the issue of brownfield operations in Hong Kong.

Planning Department
Agreement No. CE40/2016 (TP)Study on Existing Profile and Operation of Brownfield Sites in the New
Territories – Feasibility Study Final Report
Agreement No. CE 40/2016 (TP) | Final | November 2019 Page 56
8 CONCLUSION
Key Findings
Brownfield sites are defined as “primarily agricultural land in the NT which has been formed and occupied by industrial, storage, logistics and parking uses”(棕地泛指新界一些遭平整的農耕土地,用作工業、貯物、物流及泊車用途)
According to the latest survey findings, there are 7,373 active brownfield sites (area of about 1,414 ha) in the NT.
In terms of area, about 75% of active brownfield sites are clustered in NWNT (about 1,060 ha), followed by NENT (23%; i.e. about 326 ha), SENT (1.4%; i.e. about 20 ha) and SWNT (0.6%; i.e. about 8 ha).
The most common industries (in terms of area) are general warehouse / storage (26.8% / 379 ha), followed by construction (26.0% / 367 ha), logistics (13.2% / 186 ha) and vehicle repairing and related (9.7% / 137 ha).
It is estimated that about 52,110 jobs are provided on active brownfield sites.
The median and average rents of brownfield sites are $3.0/sq ft and $3.9/sq ft respectively.
A vast majority of active brownfield land (over 80%) is under private ownership.
8.1.1 The Study has captured a snapshot of comprehensive profile and spatial distribution of brownfield sites in the NT, and details of the operations and major industries involved in brownfield sites.
8.1.2 Due to the transient nature of brownfield sites, the profile and spatial distribution of brownfield sites established under this Study could only provide a snapshot of the brownfield sites based on field and questionnaire surveys. While periodic update of the overall amount of brownfield land would be possible through desktop analysis of aerial photos, satellite images and other available information, comprehensive review of the data (including site profile and characteristics, etc.) can only be carried out through on-site surveys.
8.1.3 Brownfield sites are scattered in different areas, vary in size, are of irregular shape and lack convenient access to highway. In the absence of comprehensive planning of these land parcels, some brownfield sites in NT are underutilised with development potential. The Study has identified the key issues pertinent to brownfield operations in the NT with a broad analysis on the environmental, ecological and traffic problems caused by the brownfield sites. The Study has also classified the possible development potential of both active and inactive brownfield sites. In considering whether brownfield sites can be redeveloped for other purposes (e.g. housing development), further

Planning Department
Agreement No. CE40/2016 (TP)Study on Existing Profile and Operation of Brownfield Sites in the New
Territories – Feasibility Study Final Report
Agreement No. CE 40/2016 (TP) | Final | November 2019 Page 57
comprehensive study taking into account a full range of considerations and technical assessments would need to be conducted.
8.1.4 In displacing brownfield sites for development, appropriate measures will be needed to handle or relocate the existing operations on these brownfield sites considering the economic importance of the relevant industries occupying brownfield sites. The Government has to assess the long-term development and operational needs of individual industries with a view to estimating their respective land requirements and to examining options in providing spaces for their operations.

Planning Department
Agreement No. CE40/2016 (TP)Study on Existing Profile and Operation of Brownfield Sites in the New
Territories – Feasibility Study Final Report
Agreement No. CE 40/2016 (TP) | Final | November 2019 Page 58
Appendix A
Survey Questionnaire

1
新界棕地使用及作業現況研究 ─ 可行性研究
調查問卷
樣本編號:____________________ 訪問員編號:____________________
您好,我是政策二十一有限公司的訪問員,我們受規劃署委託進行一項「棕地」問卷調查。是次調
查的主要目的是了解現時在新界地區的棕地使用及作業現況,藉此進一步了解不同行業的運作、土
地用途、業務鏈及業務聯繫,以及聽取相關經營者對營運場地及日後業務發展的意見,以協助政府
制訂適當的政策及措施全面地處理棕地事宜。訪問過程中所蒐集到的所有個人資料會絕對保密。是
次獲邀受訪的經營者並不視為其「棕地」作業已獲資格得到政府提供任何可能的搬遷或賠償安排。
此項調查不是凍結登記,也不會作為日後有可能由地政總署所進行凍結登記的參考。此外,調查亦
非規劃署為檢視《城市規劃條例》下的涉嫌「違例發展」而進行。
「棕地」並未有正式或統一的定義,一般是指位於新界某些農地或鄉郊土地,已荒廢及改作其他與
周哪環境不協調的用途,包括貨櫃場、停車場、修車工場、物流作業、鄉郊工場、露天貯物、廢料
回收場、建造機械及物料貯存等。我們十分希望您願意接受訪問,為棕地事宜提供意見。
請訪問員向營運場地的負責人進行訪問,如果營運場地沒有負責人,可詢問在場職員有關負責人的
資料並填寫於下方。
負責人名稱 :____________________
聯絡人電話 :____________________
預約日期 :____________________
訪問員填寫公司及營運場地資料:
1 公司名稱 :________________________________________
2 公司地址 :________________________________________
3 營運場地名稱 :________________________________________
4 營運場地地址 :________________________________________

2
第一部分 基本資料
A1 請問這個營運場地於哪一年開始運作? ___________
A2 請問這個營運場地的業務類型是:(可以選擇多過一項,營運場地的主要業務類型請用“★”標
明(根據業務佔營運場地面積))
1 □ 貨櫃場,貯存哪一類型的貨櫃:
(a) □ 空置貨櫃
(b) □ 載貨貨櫃
2 □ 露天貯物場,屬於哪一類型的露天貯物:(可以選擇多過一項)
(a) □ 建築物料
(b) □ 建築機械 / 建築設備
(c) □ 車輛 / 車輛零件 請註明是哪一類型的車輛: __________
(追問是否:)
(i) □ 新車 (ii) □ 二手車 (iii) □左軚車 (iv) □待拆 (v) □ 其他:____
(d) □ 回收物料
(1) 場地屬於哪一種用途
(i) □只是用作貯存回收物料 (ii) □貯存及處理廢物分類或簡單的壓捆
(2) 請指出哪一種物料會被回收及其數量:(可以選擇多過一項)
(i) □ 廢紙; _____噸/月 (ii) □ 金屬; _____噸/月 (iii) □ 塑膠; _____噸/月
(iv) □ 電器 / 電子用品; _____噸/月
(v) □其他回收物料,請註明是哪一種物料:__________ ; _____噸/月
(3) 回收物料來源
(i) 從本地所收集的回收物料佔總處理量約_____%
(ii) 入口物料佔總處理量約_____% ; (主要種類為_______________)
(e) □ 危險品,請註明是哪一類型的危險品:__________
(f) □ 其他物料,請註明是哪一種物料:__________
3 □ 倉庫,屬於哪一類型的倉庫貯物:(可以選擇多過一項)
(a) □ 建築物料
(b) □ 建築機械 / 建築設備
(c) □ 車輛 / 車輛零件 請註明哪一類型的車輛: ____________
(追問是否:)
(i) □ 新車 (ii) □ 二手車 (iii) □左軚車 (iv) □/待拆 (v) □ 其他:____
(d) □ 回收物料
(1) 場地屬於哪一類型的用途
(i) □只是用作貯存回收物料 (ii) □貯存及處理廢物分類或簡單的壓捆
(2) 請指出會回收哪一種的物料同數量:(可以選擇多過一項)
(i) □ 廢紙; _____噸/月 (ii) □ 金屬; _____噸/月 (iii) □ 塑膠; _____噸/月
(iv) □ 電器 / 電子用品; _____噸/月
(v) □其他回收物料,請註明是哪一種物料:__________ ; _____噸/月
(3) 回收物料來源
(i) 從本地收集的回收物料佔總處理量約_____%

3
(ii) 入口物料佔總處理量約_____% ; (主要種類為_______________)
(e) □ 危險品,請註明是哪一種類類的危險品:__________
(f) □ 其他物料,請註明是哪一種的物料:__________
4 □ 停車場,泊哪一類車為主:(可以選擇多過一項)
(a) □ 私家車 (b) □ 輕型貨車 (c) □ 中型貨車 (d) □ 重型貨車
(e) □ 掛接式的車輛(包括拖頭及拖架) (f) □ 特別用途車輛
(g) □ 其他類型,請註明是哪一類型的車輛:__________
5 □ 車輛維修場,請指明車輛的種類:(可以選擇多過一項)
(a) □ 私家車 (b) □ 輕型貨車 (c) □ 中型貨車 (d) □ 重型貨車
(e) □ 掛接式的車輛(包括拖頭及拖架) (f) □ 特別用途車輛
(g) □ 其他類型,請註明是哪一類型的車輛:__________
6 □ 車身製造工場以作 (i) □ 新車裝嵌 及/或 (ii) □ 車輛維修 用途,製造哪一類車為主:(可
以選擇多過一項)
(a) □ 私家車 (b) □ 輕型貨車 (c) □ 中型貨車 (d) □ 重型貨車
(e) □ 掛接式的車輛(包括拖頭及拖架) (f) □ 特別用途車輛
(g) □ 其他類型,請註明是哪一類型的車輛:__________
7 □ 工場(不包括車輛維修場及車身製造工場),屬於哪一類型的工場:
(a) □ 回收再造業 (例如有專門的廢料壓縮、壓碎同分揀機器的場地)
請指出會回收哪一種物料,業務的類型及一般描述:
(1) 請指出會回收哪一種物料同數量:(可以選擇多過一項)
(i) □ 廢紙; _____噸/月 (ii) □ 金屬; _____噸/月 (iii) □ 塑膠; _____噸/月
(iv) □ 電器 / 電子用品; _____噸/月
(v) □其他回收物料,請註明是哪一類型:__________ ; _____噸/月
(2) 請指出是哪一種業務的類型:(可以選擇多過一項)
(i) □ 收集 (ii) □ 加工處理(如壓縮、壓碎、分揀、打捆)
(iii) □ 再造(如加工成原材料、破碎及清洗、拆解、再造等)
(iv) □ 其他,請註明是哪一類別:__________
(3) 業務的一般描述:__________
(4) 回收物料來源
(i) 從本地收集的回收物料佔總處理量約_____%
(ii) 入口物料佔總處理量約_____% ; (主要種類為_______________)
(b) □ 建造業(例如建築物料的製造或者建築機械 / 建築設備的維修)
(c) □ 食品製造或加工
(d) □ 車輛拆卸
(e) □ 其他,請提供業務的類型及一般描述:_____________
8 □ 物流及貨運中心(可以選擇多過一項)
(a)□ 牽涉出/入口貿易
(i)□ 國際/區域性配送,請描述貨物主要來自什麼國家/地區:_______________; 及
貨物配送至什麼國家/地區:____________________
(ii) □本地性配送
(iii) □電子商務物流,請描述貨物主要來自什麼國家/地區:___________________; 及
貨物配送至什麼國家/地區:______________________________

4
請描述貨物類型(如生活百貨、衣飾、電子產品):_________
(iv) □冷凍倉,請描述貨物類型:__________________________________________
(v)□高増值的成品,高價值商品及高增值物流,請描述貨物類型(如高級食品、醫
藥保健品、珠寶鐘錶):____________;及當中涉及的增值工序/服務(如貨物檢
驗、包裝、加工):____________
(b) □ 不牽涉出/入口貿易,請提供業務的類型及一般描述:_____________
9 □ 其他(包括混合用途),請提供業務的類型及一般描述:_________________
A3 請問這個營運場地在相關行業內擔當什麼角色?(可以選擇多過一項)
1 □ 生產原料 2 □ 運輸物流 3 □ 出口貿易 4 □ 貯存物料 5□ 生產/加工
6 □ 提供服務 7 □ 其他,請指明是哪一角色: _____________
A4 請問這個場地的運作牽涉或哪一行業/生意?哪一個是主要的行業/生意?(以收入為準)
1 □ 建造 2 □ 資源回收 3 □ 物流 4 □ 港口後勤
5 □ 食品加工/製造 6 □ 進出口貿易 7 □ 汽車維修/製造/拆車
8 □ 停車場
(請註明顧客的種
類:
_______________)
9 □ 廢棄物處理 10 □ 國際/本地速遞活動 11 □ 公營項目
(請註明是什麼項
目:
_______________)
12 □ 農業 13 □ 機械設備租賃 14 □ 倉庫/貯物業 15 □ 其他
(請註明是哪一行
業/生意:
__________)
16 □ 沒有
* 請註明主要行業/生意為上述第 項
A5 請問這個營運場地有沒有由其他場地/作業空間輸入物料或者採用它們的服務?會用哪一種運送
模式?
1 □ 有,其他場地的類型是:(可以選擇多過一項)
(a) □ 鄰近的場地/作業空間,請指明輸入哪一種物料或服務,及運送模式﹕__________________
(b) □ 本地其他地區的場地/作業空間,請指明輸入哪一種物料或服務,及運送模式﹕___________
(c) □ 中國內地的場地/作業空間,請指明輸入哪一種物料或服務,及運送模﹕_____________________
(d) □ 其他國家的場地/公司,請指明輸入哪一種物料或服務,及運送模﹕_________________________
2 □ 沒有
A6 請問這個營運場地有沒有向其他場地/作業空間賣物料或者提供服務?會用哪一種運送模式?
1 □ 有,其他場地類型是:(可以選擇多過一項)

5
(a) □ 鄰近的場地/作業空間,請指明銷售的物料或服務,及運送模式﹕___________________
(b) □ 本地其他地區的場地/作業空間,請指明銷售的物料或服務,及運送模式﹕___________
(c) □中國內地的場地/作業空間,請指明銷售的物料或服務,及運送模式﹕
_____________________
(d) □ 其他國家的場地/公司,請指明銷售的物料或服務,及運送模式﹕_________________________
2 □ 沒有
A7 請問這個營運場地現在總共有幾多個員工?
全職員工 :_____________
兼職或臨時員工:_____________
A8 請問這個營運場地是租還是買?
1 □ 租賃
(a) 契約形式:1 □ 私人業主租約 2 □ 政府租約 3 □ 無租約
(b) 一個月租金為:$ ______________
(c) 合約年期: ____________年
(d) 出租人為: 1 □註冊土地擁有人 2 □ 構築物擁有人 3 □ 其他構築物使用者
4. □其他,請註明是哪一種身份: _____________
2 □ 購買
3 □ 其他,請註明是哪一類別:_____________
A9 請問這個營運場地的總面積是多少?當中各個場地的用途[當中包括辦公室、通道/車路、閒置空
間及其他(包括混合用途)] 所佔的面積是多少?
(a) 營運場地的總面積:_____________平方呎
(b) 所佔面積是 (如果不清楚實際面積,可提供各場地用途佔營運場地總面積的百分比)
(可以選擇多過一項)
1 □ 貨櫃場(空置貨櫃) ____________平方呎 / _______________%
2 □ 貨櫃場(載貨貨櫃) ____________平方呎 / _______________%
3 □ 露天貯物場(建築物料) ____________平方呎 / _______________%
4 □ 露天貯物場(建築機械 / 建築設備) ____________平方呎 / _______________%
5 □ 露天貯物場(車輛 / 車輛零件) ____________平方呎 / _______________%
6 □ 露天貯物場(回收物料) ____________平方呎 / _______________%
7 □ 露天貯物場(危險品) ____________平方呎 / _______________%
8 □ 露天貯物場(其他物料,請註明是哪一種物料:__________)
____________平方呎 / _______________%
9 □ 倉庫(建築物料) ____________平方呎 / _______________%
10 □ 倉庫(建築機械 / 建築設備) ____________平方呎 / _______________%
11 □ 倉庫(車輛 / 車輛零件) ____________平方呎 / _______________%
12 □ 倉庫(回收物料) ____________平方呎 / _______________%
13 □ 倉庫(危險品) ____________平方呎 / _______________%
14 □ 倉庫(其他物料,請註明是哪一種物料:__________)
____________平方呎 / _______________%

6
15a □ 停車場(主要為私家車/輕型貨車)
15b □ 停車場(主要為中型貨車/重型貨車)
15c □ 停車場(主要為掛接式車輛包括拖頭及拖架)
15d □ 停車場(主要為特別用途車輛)
16 □ 車輛維修場
17 □ 車身製造工場
18 □ 工場(回收再造業)
19 □ 工場(建造業)
20 □ 工場(食品加工)
21 □ 工場(車輛拆卸)
____________平方呎 / _______________%
____________平方呎 / _______________%
____________平方呎 / _______________%
____________平方呎 / _______________%
____________平方呎 / _______________%
____________平方呎 / _______________%
____________平方呎 / _______________%
____________平方呎 / _______________%
____________平方呎 / _______________%
____________平方呎 / _______________%
22 □ 工場(其他用途,請註明是哪一種用途:__________)
____________平方呎 / _______________%
23 □ 物流同貨運中心 ____________平方呎 / _______________%
24 □ 辦公室 ____________平方呎 / _______________%
25 □ 通道/車路 ____________平方呎 / _______________%
26 □ 附設停車泊位數量
a □私家車/輕型貨車,數目:_________
b □ 中型貨車/重型貨車,數目:________
c □ 掛接式車輛包括拖頭及拖架,數目:________
____________平方呎 / _______________%
27 □ 上落貨泊位,數目:________ ____________平方呎 / _______________%
28 □ 閒置空間 ____________平方呎 / _______________%
29 □ 其他,請註明是哪一種用途:__________ ____________平方呎 / _______________%
總共:100%
A10 請問這個場地以哪一種形式的空間營運?各個場地形式的面積大約幾多 (如果不清楚實際面積,
可提供各場地用途佔營運場地總面積的百分比)?(可以選擇多過一項)
1 □ 露天場所 _______________平方呎 / _______________%
2 □ 臨時結構,請註明有多少層:____層 _______________平方呎 / _______________%
(只以底層計算)
3 □ 永久性結構,請註明有多少層:____層 _______________平方呎 / _______________%
(只以底層計算)
4 □用臨時貨櫃作營運用途(例如辦公室)的用
地 :
_______________平方呎 / _______________%
5 □ 其他,請註明是哪一種形式:_________________
_______________平方呎 / _______________%
A11 請問這個營運場地在這裡運作之前,有沒有曾經在其他場地營運?位置在哪裡?請說明離開先
前營運場地的原因?(可以選擇多過一項)
1 □ 有,位於:
a □新界東北(例如坪輋、打鼓嶺、古洞),請指明地區:_________

7
b □新界西北(例如洪水橋、新田、錦田、八鄉),請指明地區:_________
c □北大嶼(例如小蠔灣) d □葵青 e □離島 f □市區 g □其他,請註明其他地方:
場地類型及離開原因:
(a) □ 露天場地
1 □ 租金昂貴 2 □ 地方被收回 3 □ 物流配套落後 4 □ 人手不足
5 □ 地理位置不方便 6 □ 其他,請指明其他原因_____________________
(b) □ 多層樓宇(例如工廠大廈或者商業大廈)
1 □租金昂貴 2 □地方被收回 3 □ 物流配套落後 4 □ 人手不足
5 □ 地理位置不方便 6 □其他,請指明其他原因_____________________
(c) □ 工業邨/環保園
1 □ 租金昂貴 2 □地方被收回 3 □ 物流配套落後 4 □ 人手不足
5 □ 地理位置不方便 6 □ 其他,請指明其他原因____________________
2 □ 沒有在其他地方營運
A12 請問選擇這個場地/地區營運的原因是:(可以選擇多過一項)
1 □ 鄰近哪境
2 □ 鄰近港口
3 □ 物流配套比較完善
4 □ 有勞動人口的供應
5 □ 可以分享集聚經濟效益
6 □ 租金或者地價比較容易負擔
7 □ 接近廢物收集/處理點
8 □ 場地空間同設施可以滿足運作要求
9 □ 其他,請註明原因:__________
第二部分 營運場地運作情況
B1 請問這個營運場地有沒有以下哪一種車輛出入地盤?如果有,每日大概會有多少架次? 有沒有
繁忙時段?(可以選擇多過一項)
1 □ 私家車或者其他載人為主的汽車:_____架次
2 □ 5.5 噸或以下(總重量)貨車:_____架次,請註明貨車的噸數:__________噸
3 □ 7.5 噸至 13 噸(總重量)貨車:_____架次,請註明貨車的噸數:__________噸
4 □ 16 噸至 24 噸(總重量)貨車:_____架次,請註明貨車的噸數:__________噸
5 □ 24 噸以上(總重量)貨車:_____架次,請註明貨車的噸數:__________噸
6 □ 無任何車輛出入
7 □ 其他,請註明車輛的類別(一):__________/_____架次
請註明車輛的類別(二):__________/_____架次

8
請註明車輛的類別(三):__________/_____架次
繁忙時段
1 □ 早上六點至八點 2 □ 早上八點至十點 3 □ 早上十點至中午十二點
4 □ 中午十二點至下午二點 5 □ 下午二點至四點 6 □ 下午四點至六點
7 □ 晚上六點至八點 8 □ 晚上八點至十二點 9 □沒有繁忙時段
B2 請問上述提及的貨車在作業期間主要往返什麼地區?(可以選擇多過一項)
1 □ 港島區 2 □ 九龍西 3 □ 九龍東 4 □ 葵青
5 □ 屯門 6 □ 元朗 7 □ 荃灣 8 □ 沙田
9 □ 大埔 10 □ 西貢 11 □ 北區 12 □ 離島
13 □ 內地
B3 請問這個營運場地有沒有存放貨櫃?存放哪一類型的貨櫃?每日平均數量同貨櫃的流轉頻率是
多少?
1 □ 有,存放哪一類型的貨櫃?
a) □ 空置的貨櫃:每日平均數量: __________個、流轉頻率:_____天
b) □ 載貨的貨櫃;每日平均數量: __________個、流轉頻率:_____天
2 □ 沒有
B4 請問這個營運場地有沒有特別的載重要求?
1 □有,請註明是什麼要求: ______________ 噸
2 □ 沒有
3 □ 不清楚
B5 請問要維持現時的作業需要大約幾多存放及作業空間?
a) 存放空間最少要有 ________平
方呎
有上蓋的空間面積:_______平方呎
□ 沒有特定需求空間所需的高度:___________呎
無上蓋的空間面積:_______平方呎
b) 作業空間最少要有 ________平
方呎
有上蓋的空間面積:_______平方呎
□ 沒有特定需求空間所需的高度:___________呎
無上蓋的空間面積:_______平方呎
B6 請問營運場地內有沒有貨物起卸台?如果有,請指明有多少個相關的泊位?
1 □ 有 ,請指明(數量):__________個泊位
2 □ 沒有

9
B7 請問在營運場地內有沒有用特殊設施或者機械?
1 □ 有(可以選擇多過一項)
a □ 挖掘機 i □ 運輸帶
b □ 起重機 j □ 打包機
c □ 搬土機 k □ 鏟車
d □ 推土機 l □ 污水處理設施
e □ 壓實機 m□ 拉粒機
f □ 吊機 n □ 變壓器
g □ 秤橋 o □ 鍋爐及壓力容器
h □ 破碎機 p □ 其他,請指明哪一種設施或機器:__________
2 □ 沒有
B8 請問這個營運場地平均每個月的總營運收入及支出分別是多少 (港幣)?
總營運收入:
□ $100,000 以下
□ $100,001-$500,000
□ $500,001-$1,000,000
□ $1,000,001-$5,000,000
□ $5,000,001-$10,000,000
□ $10,000,000 以上
□ 不清楚
□ 不方便透露
總營運支出:
□ $10,000 以下
□ $10,001-$50,000
□ $50,001-$100,000
□ $100,001-$500,000
□ $500,001-$1,000,000
□ $1,000,001-$5,000,000
□ $5,000,000 以上
□ 不清楚
□ 不方便透露
B9 請問這個營運場地支出類型分別是什麼?不同支出大約佔每個月平均總支出的百分比?
a) □ 租金,佔 ____________%,每月呎租: ____________
b) □ 工資,佔 ____________%
c) □ 水電開支,佔 ____________%
d) □ 其地開支,佔 ____________%
B10 營運場地有沒有特別的設施、牌照等去配合營運的需要?

10
1 □ 有
a □ 牌照,請指明所需申請牌照類別:_________________
b □ 電力(可以選擇多過一項)
i □ 變電裝置
ii □ 後備電源裝置
iii□ 用三相供電
iv □ 其他,請指明:_____________
c □ 噪音管制的限制
d □ 污水/廢料進行處理(可以選擇多過一項)
i □ 化糞池
ii □ 獨立污水處理設施(並排放去:__________)
iii □ 處理化學廢物
iv □ 專人回收處理
v□ 其他,請指明:_________
e □ 空氣管制的措施
f □ 危險品貯存, 請說明:__________
2 □ 沒有
3 □ 不清楚
B11 請問你的營運場地現時有沒有遇到操作或者業務上的困難?
1 □ 有(可以選擇多過一項)
a □ 場地及空間
b □ 技術及設備
c □ 財務
d □ 行業發展及前景
e □ 人力及招聘
f □ 法例規管及政策
g □ 受到針對業務/附近居民的投訴(空氣污染、噪音、消防設備問題)
h □ 其他,請指明:__________
2 □ 沒有
第三部分 營運場地的發展
C1 貴公司會否考慮於未來五年內改變經營規模?
1 □ 會(可以選擇多過一項)
a □ 擴大營運面積:__________平方呎
b □ 減少營運面積:__________平方呎
c □ 增聘員工:__________人
d □ 裁減員工:__________人
e □ 增加設施或機械,請指明:__________
f □ 減少設施或機械,請指明:__________
g □ 結束經營
h □ 其他,請指明:__________

11
2 □ 不會
C2 你認為現時的營運方式是否一定要在露天的地方進行?
a □ 是,請註明原因:_______________
b □ 不是,請註明原因:_______________
c □ 不肯定
C3 你認為現時的營運方式是否適合放在一般的工廠大廈(例如現時元朗工業區內面的工廠大廈) 、
為產業而設的樞紐(包括工業邨(例如元朗工業邨、大埔工業邨)、產業園或特別設計多層樓宇等
(例如有比較大的作業空間、貨車可以到達不同樓層的特別設計運輸通道等,例子可參考現時位
於葵涌的貨櫃物流中心))或其他地方裏面運作?
1 □ 適合,可以在:(可以選擇多過一項)
a □ 一般工廠大廈
b □ 工業邨
c □ 產業園
d □ 特別設計多層樓宇
但現時不選擇在以上地方營運的原因:_____________________________________
2 □ 不適合的原因是(可以選擇多過一項)
i) 一般工廠大廈 ii) 工業邨 iii) 產業園 iv) 特別設計多層
樓宇
a) 不夠效率 □ □ □ □
b) 面積不可能滿足
實際要求□ □ □ □
c) 樓底不可能滿足
實際要求□ □ □ □
d) 樓層載重量不可
能滿足實際要求□ □ □ □
e) 租金太貴 □ □ □ □
f) 貨車不能倒車 □ □ □ □
g) 缺乏資金增買裝
備□ □ □ □
h) 營運與鄰近用途
不相協調□ □ □ □
i) 地理位置不理想 □ □ □ □
j) 泊車位/ 上落貨
區位置不足□ □ □ □
k) 其他 □請註明原因:
_____________
□請註明原因:
_____________
□請註明原因:
_____________
□請註明原因:
_____________
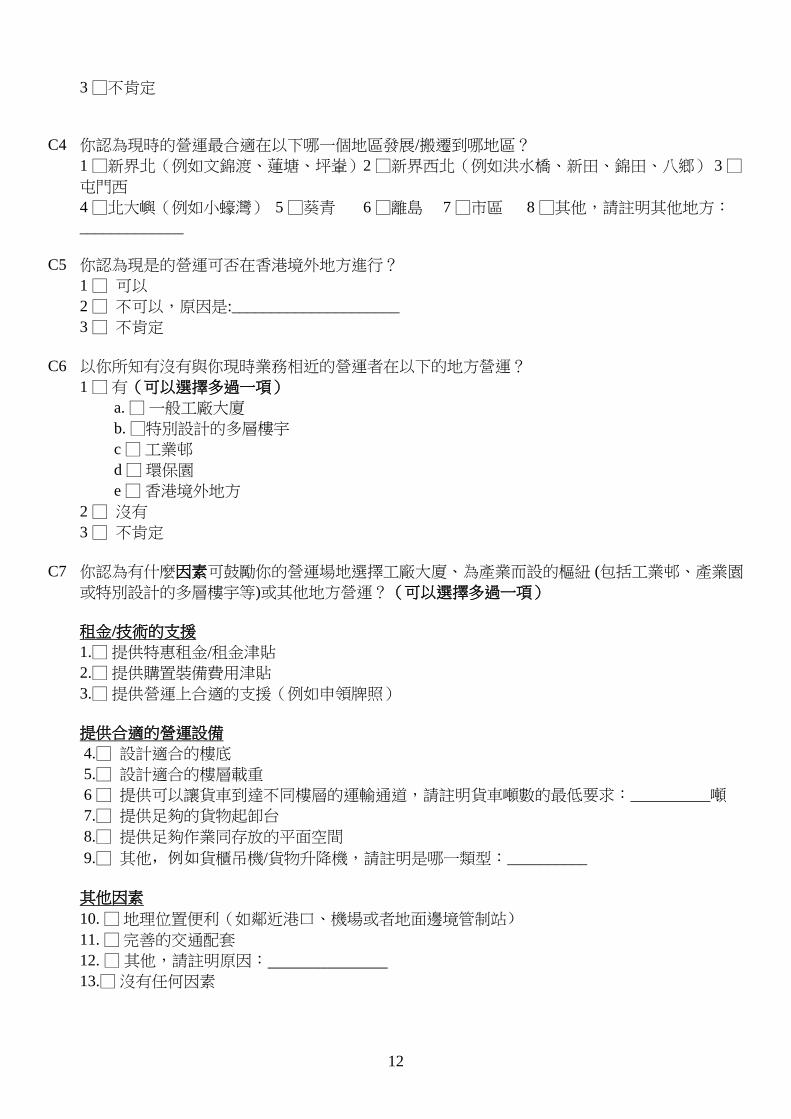
12
3 □不肯定
C4 你認為現時的營運最合適在以下哪一個地區發展/搬遷到哪地區?
1 □新界北(例如文錦渡、蓮塘、坪輋)2 □新界西北(例如洪水橋、新田、錦田、八鄉) 3 □
屯門西
4 □北大嶼(例如小蠔灣) 5 □葵青 6 □離島 7 □市區 8 □其他,請註明其他地方:_____________
C5 你認為現是的營運可否在香港境外地方進行?
1 □ 可以
2 □ 不可以,原因是:_____________________
3 □ 不肯定
C6 以你所知有沒有與你現時業務相近的營運者在以下的地方營運?
1 □ 有(可以選擇多過一項)
a. □ 一般工廠大廈
b. □特別設計的多層樓宇
c □ 工業邨
d □ 環保園
e □ 香港境外地方
2 □ 沒有
3 □ 不肯定
C7 你認為有什麼因素可鼓勵你的營運場地選擇工廠大廈、為產業而設的樞紐 (包括工業邨、產業園
或特別設計的多層樓宇等)或其他地方營運?(可以選擇多過一項)
租金/技術的支援
1.□ 提供特惠租金/租金津貼
2.□ 提供購置裝備費用津貼
3.□ 提供營運上合適的支援(例如申領牌照)
提供合適的營運設備
4.□ 設計適合的樓底
5.□ 設計適合的樓層載重
6 □ 提供可以讓貨車到達不同樓層的運輸通道,請註明貨車噸數的最低要求:__________噸
7.□ 提供足夠的貨物起卸台
8.□ 提供足夠作業同存放的平面空間
9.□ 其他,例如貨櫃吊機/貨物升降機,請註明是哪一類型:__________
其他因素
10. □ 地理位置便利(如鄰近港口、機場或者地面邊境管制站)
11. □ 完善的交通配套
12. □ 其他,請註明原因:________________
13.□ 沒有任何因素

13
C8 你認為有沒有其他行業(包括類似行業)同你營運的場地設置在同一個工廠大廈、為產業而設
的樞紐 (包括工業邨、產業園或者特別設計的多層樓宇等)或其他地方內,會對你的業務有沒有
正面幫助?為何?
1 □ 有,行業包括(可以選擇多過一項)
a □ 貨櫃貯存,請指明原因:__________
b □ 物流運輸,請指明原因:__________
c □ 車輛維修,請指明原因:__________
d □ 停車場,請指明原因:__________
e □ 貨倉,請指明原因:__________
f □ 廢料回收場(例如收集、分揀或打捆回收物料),請指明原因:__________
g □ 廢料處理場(例如將回收物料加工做原材料、破碎同清洗、拆解、再造等),
請指明原因:__________
h □ 以上所有行業,請指明原因:__________
i □ 其他,請指明行業及原因:__________
2 □ 没有
C9 你認為有沒有其他行業(包括類似的行業)可以與你的營運場地放在同一個工廠大廈、為產業
而設的樞紐 (包括工業邨、產業園或者特別設計的多層樓宇等)或其他地方裏面?為何?
1 □ 有,行業包括(可以選擇多過一項)
a □ 貨櫃貯存,請指明原因:__________
b □ 物流運輸,請指明原因:__________
c □ 車輛維修,請指明原因:__________
d □ 停車場,請指明原因:__________
e □ 貨倉,請指明原因:__________
f □ 廢料回收場(例如收集、分揀或者打捆回收物料),請指明原因:__________
g □ 廢料處理場(例如將回收物料加工做原材料、破碎同清洗、拆解、再造等),
請指明原因:__________
h □ 以上所有行業,請指明原因:__________
i □ 其他,請指明行業及原因:__________
2 □沒有
C10 你認為有沒有方法或設施(例如:加設高密度的鋼架或其他現代化器械)才可以增加現時的營運
同效率或產量?方法/設施包括:
_______________________________________________________________________________
C11 如果政府將來需要將你現時的業務遷出現時營運的地方,你會有什麼安排﹖
1 □自己尋找或搬去其他合適的地方繼續營運
a) □ 近似現時營運場地的地方
b) □ 一般多層工業大廈。最高可接受/最合理的平均月租價格:每平方呎$___________ (以
實用面積計算)
c) □ 工業邨。最高可接受/最合理的平均月租價格:每平方呎$___________ (以實用面積計
算)

14
d) □ 產業園。最能接受/最合理的平均月租價格:每平方呎$___________ (以實用面積計算)
e) □ 特別設計的多層樓宇。最能接受/最合理的平均月租價格:每平方呎$___________ (以
實用面積計算)
2 □ 結束營業, 請註明原因: _____________
3 □ 其他,請註明什麼地點:_____________
多謝你接受我們的訪問,為了確保訪問的質素,我們的同事可能會在日後打電話給你複核問卷的內
容,多謝!
受訪者名稱:_________________ 聯絡電話:_________________
受訪者職位:_________________
-完-

Figures


I 0 4,400 8,8002,200 Meters
1:220,000
LJ SK PCOct 19
4.1Distribution of Brownfield Sites in the New Territories
LegendSub-regions in Study AreaMetro AreaActive Brownfield SitesInactive Brownfield Sites

I 0 4,400 8,8002,200 Meters
1:220,000
LJ SK PCOct 19
4.2Distribution of Brownfield Sites in the New Territories (includingBoundaries of New Development Areas/Potential Development Areas)
LegendSub-regions in Study Area Metro Area Active Brownfield SitesInactive Brownfield Sites
hthlaw
打字機
New Development Area (NDA)/Potential Development Area (PDA) Boundary
hthlaw
打字機

SENT
NENT
I 0 1,600 3,200800 Meters
1:82,000
LJ SK PCMay 19
4.3aDistribution of Active Brownfield Sites by Industry in Southeast New Territories
LegendSub-regions in Study AreaMetro Area
Brownfield Site by Industry! Construction! Logistics! Port Back-up (Container-related)! Waste Recycling! Vehicle Repairing and Related! Vehicle Scrapping! Rural Industries! Vehicle Parking! General Warehouse/Storage! General Workshop
Note: The annotated dots only denotethe location of brownfield sites, andhave no relevance to the land area ofthese sites

NWNT
SWNT
I 0 1,600 3,200800 Meters
1:82,000
LJ SK PCMay 19
4.3bDistribution of Active Brownfield Sites by Industry in Southwest New Territories
LegendSub-regions in Study AreaMetro Area
Brownfield Site by Industry! Construction! Logistics! Port Back-up (Container-related)! Waste Recycling! Vehicle Repairing and Related! Vehicle Scrapping! Rural Industries! Vehicle Parking! General Warehouse/Storage! General Workshop
Note: The annotated dots only denotethe location of brownfield sites, andhave no relevance to the land area ofthese sites

SENT
NWNT
NENT
I 0 1,600 3,200800 Meters
1:82,000
LJ SK PCMay 19
4.3cDistribution of Active Brownfield Sites by Industry in Northeast New Territories
LegendSub-regions in Study AreaMetro Area
Brownfield Site by Industry! Construction! Logistics! Port Back-up (Container-related)! Waste Recycling! Vehicle Repairing and Related! Vehicle Scrapping! Rural Industries! Vehicle Parking! General Warehouse/Storage! General Workshop
Note: The annotated dots only denotethe location of brownfield sites, andhave no relevance to the land area ofthese sites
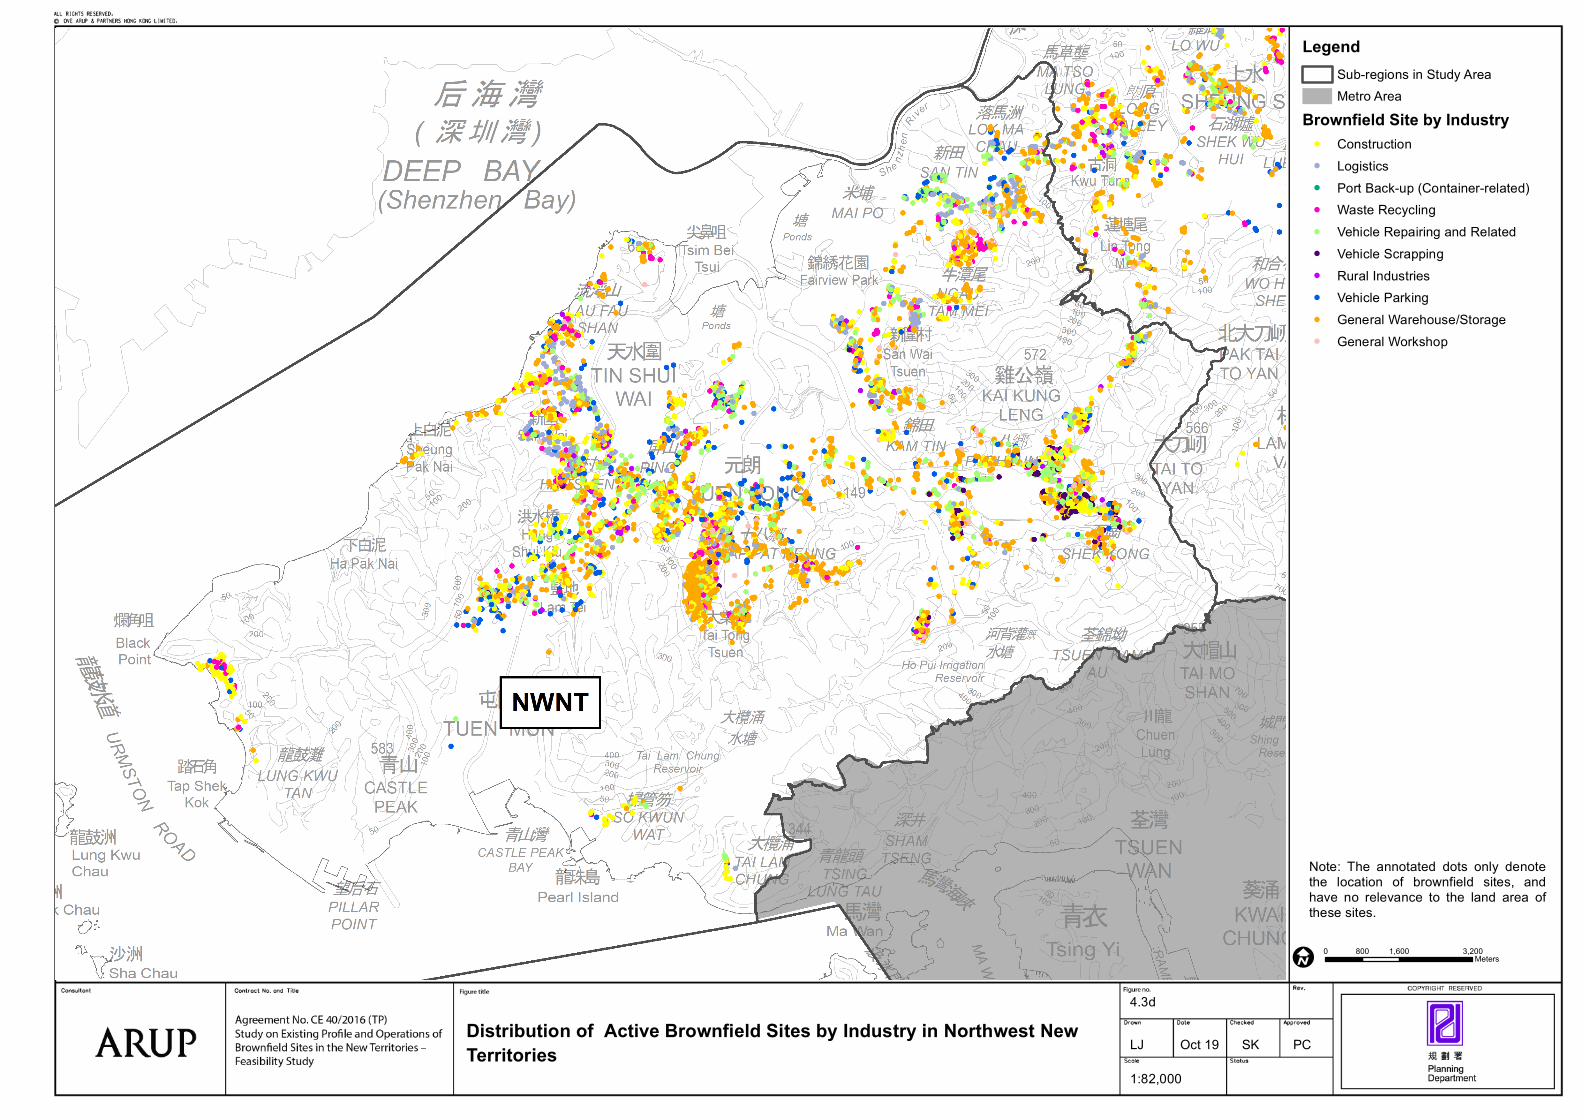
I 0 1,600 3,200800 Meters
1:82,000
LJ SK PCOct 19
4.3dDistribution of Active Brownfield Sites by Industry in Northwest New Territories
Note: The annotated dots only denotethe location of brownfield sites, andhave no relevance to the land area ofthese sites.
LegendSub-regions in Study AreaMetro Area
Brownfield Site by Industry! Construction! Logistics! Port Back-up (Container-related)! Waste Recycling! Vehicle Repairing and Related! Vehicle Scrapping! Rural Industries! Vehicle Parking! General Warehouse/Storage! General Workshop

NWNT
SWNT
I0 1,600 3,200800 Meters
1:82,000
LJ SK PCNov 19
4.4aLand Status of Brownfield Sites in Southwest New Territories
LegendSub-regions in Study AreaMetro Area
Land Status of BrownfieldSite
Private LandGovernment Land
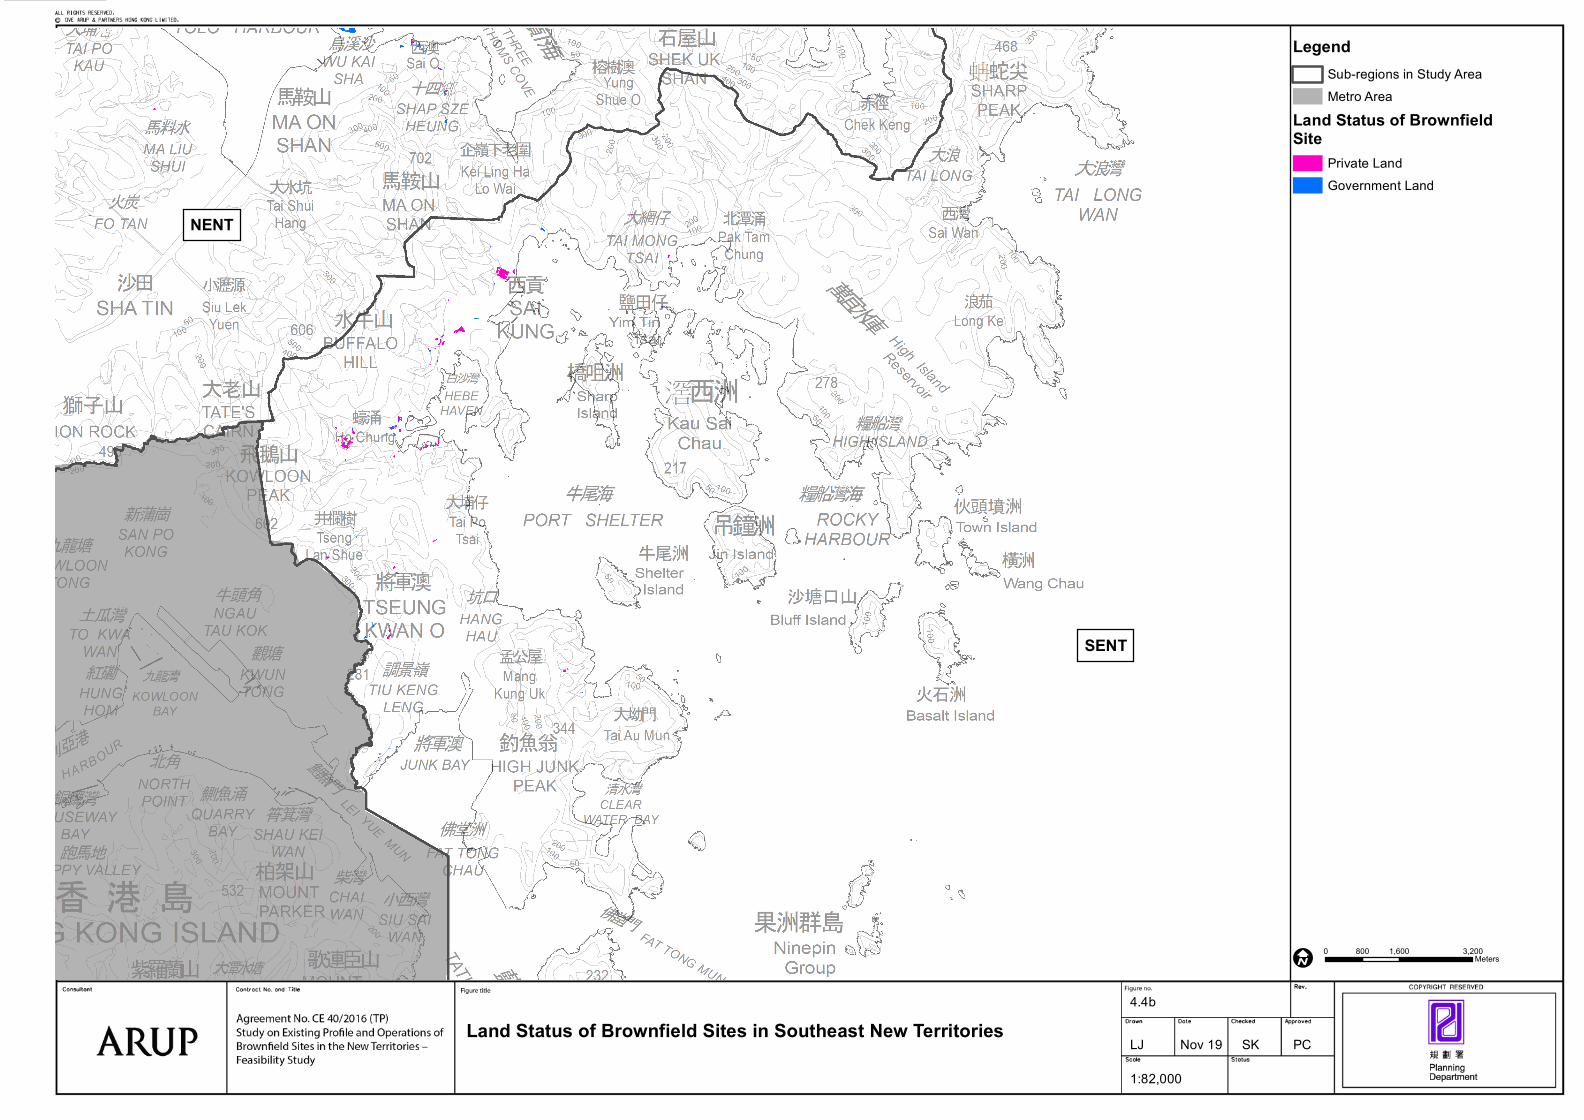
SENT
NENT
I0 1,600 3,200800 Meters
1:82,000
LJ SK PCNov 19
4.4bLand Status of Brownfield Sites in Southeast New Territories
LegendSub-regions in Study AreaMetro Area
Land Status of BrownfieldSite
Private LandGovernment Land

SENT
NWNT
NENT
I0 1,600 3,200800 Meters
1:82,000
LJ SK PCNov 19
4.4cLand Status of Brownfield Sites in Northeast New Territories
LegendSub-regions in Study AreaMetro Area
Land Status of BrownfieldSite
Private LandGovernment Land
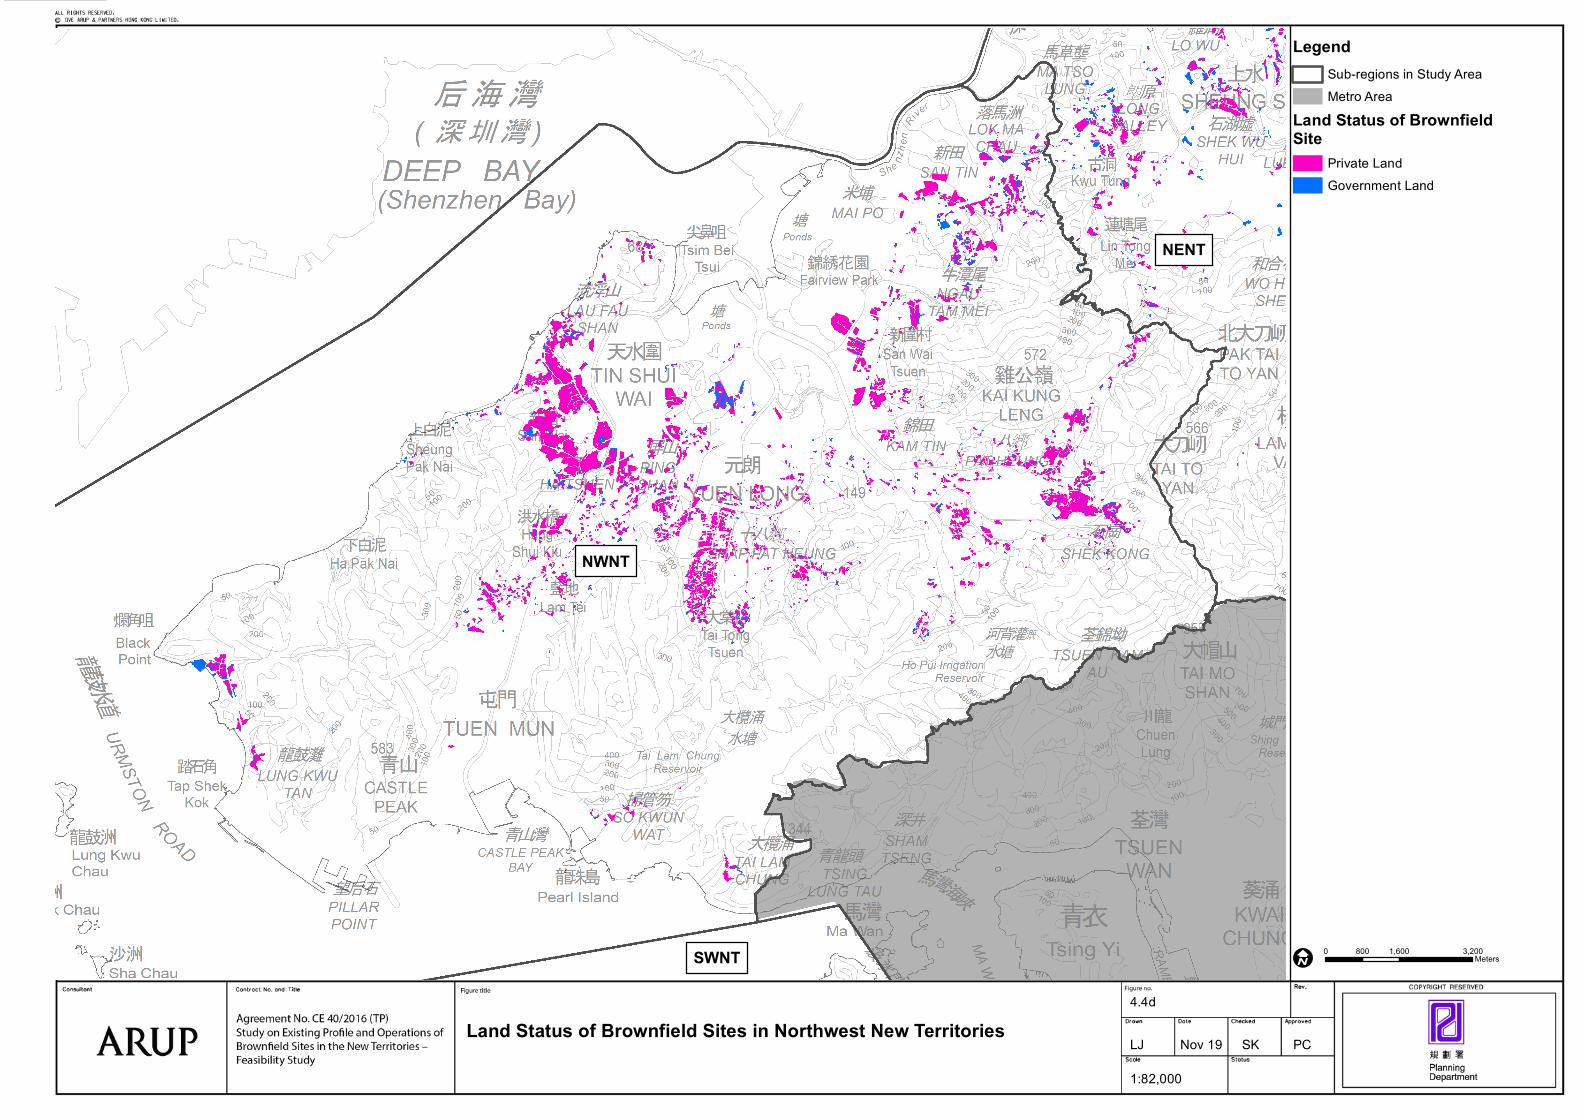
NWNT
NENT
SWNT I0 1,600 3,200800 Meters
1:82,000
LJ SK PCNov 19
4.4dLand Status of Brownfield Sites in Northwest New Territories
LegendSub-regions in Study AreaMetro Area
Land Status of BrownfieldSite
Private LandGovernment Land
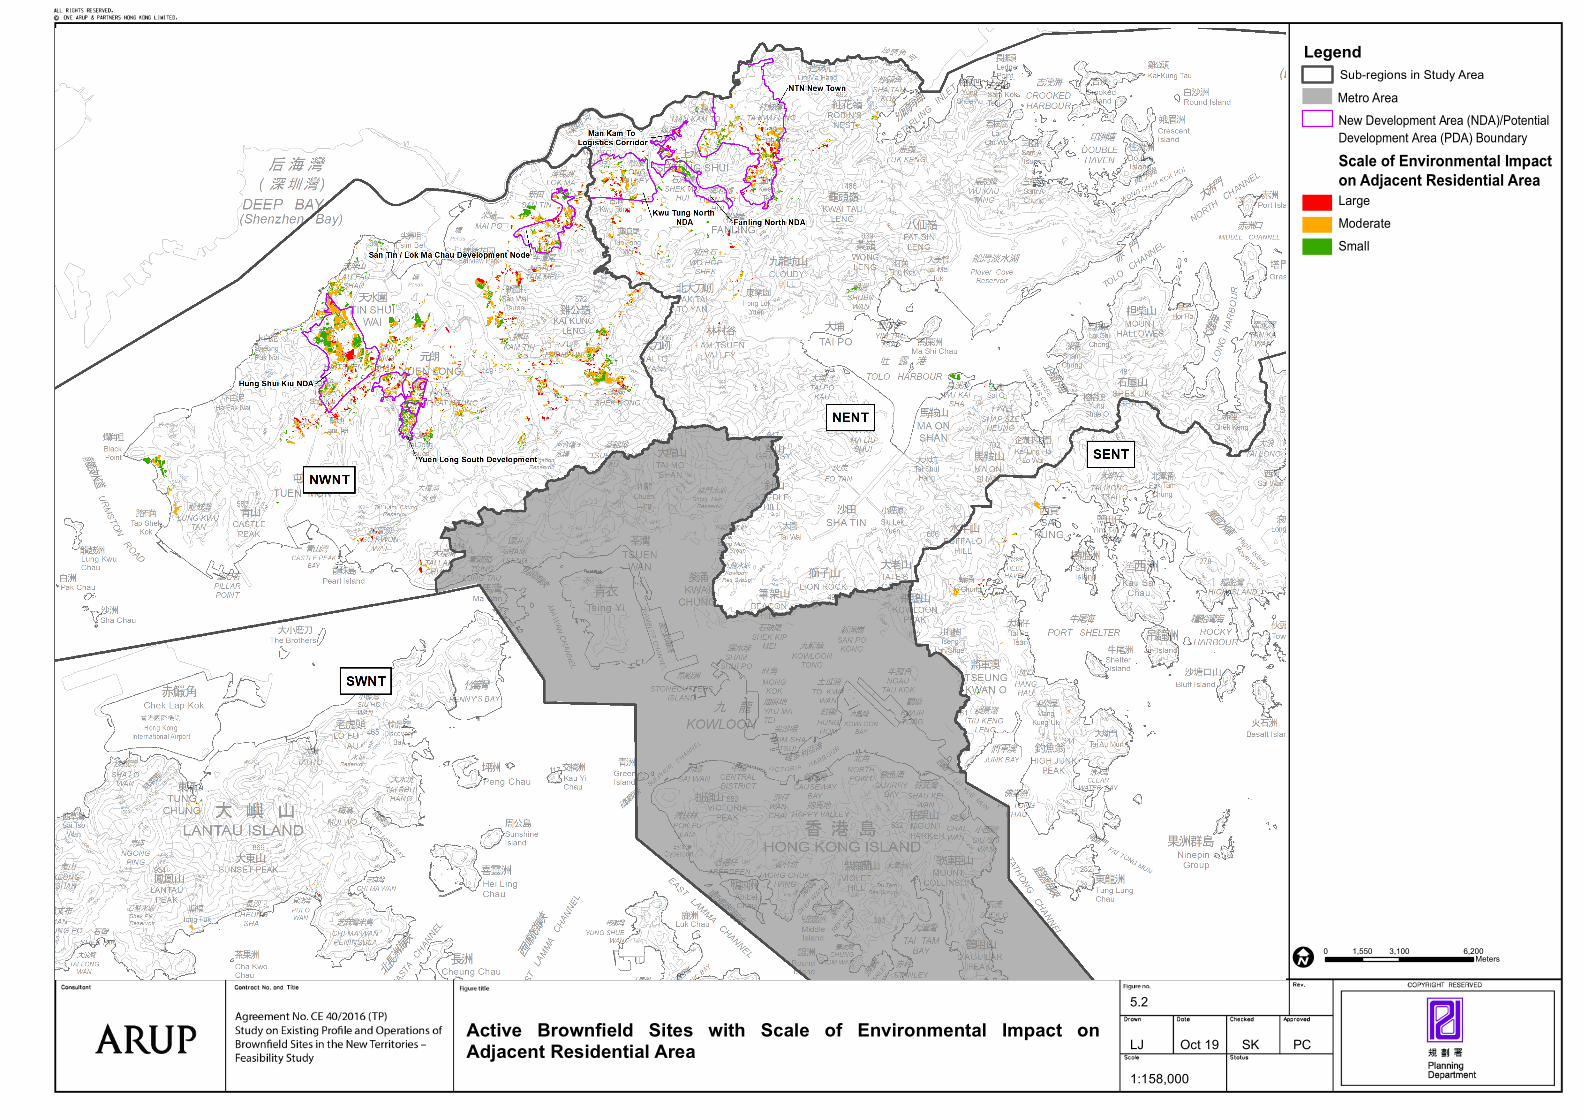
I 0 3,100 6,2001,550 Meters
1:158,000
LJ SK PCOct 19
5.2Active Brownfield Sites with Scale of Environmental Impact onAdjacent Residential Area
Legend Sub-regions in Study Area
Metro AreaNew Development Area (NDA)/Potential Development Area (PDA) BoundaryScale of Environmental Impact on Adjacent Residential AreaLargeModerateSmall

SENT
NWNT
NENT
SWNT
I 0 3,100 6,2001,550 Meters
1:158,000
LJ SK PCMay 19
5.3Brownfield Sites within Conservation Related Zones
LegendSub-regions in Study AreaMetro Area
Brownfield Sites withinConservation Related Zones
Active Brownfield SitesInactive Brownfield Sites

I 0 3,100 6,2001,550 Meters
1:158,000
LJ SK PCOct 19
5.4Brownfield Industries with Comparatively Higher Traffic Concern
Note: The annotated dots only denotethe location of brownfield sites, andhave no relevance to the land area ofthese sites.
LegendSub-regions in Study AreaMetro Area
Active Brownfield Sites byIndustry! Logistics! Port Back-up (Container-related)! Vehicle Parking

I 0 3,100 6,2001,550 Meters
1:158,000
LJ SK PCOct 19
6.1Classification of Possible Development Potential of Brownfield Sitesin the New Territories
LegendSub-regions in StudyMetroNew Development Area (NDA)/Potential Development Area (PDA) BoundaryExisting Highways
Existing New TownPossible Development Potential
HighMediumLow
Note:1. Brownfield sites fallingwithin conservation related zones (asstated in paras. 5.2.16 and 5.2.17 ofthe Final Report) are excluded from theclassification.2. The classification of possibledevelopment potential of brownfield siteshas not taken into account the planneduses for NDAs