按區議會分區劃分的人口及住戶統計資料Population and ...
43
按區議會分區劃分的 人口及住戶統計資料 Population and Household Statistics Analysed by District Council District 2001 有關本刊物的查詢,請聯絡: 政府統計處 綜合住戶統計調查組﹝一﹞ 地址:中國香港北角英皇道二百五十號北角城中心五樓(北角城中心分處) 電話:(852) 2887 5512 圖文傳真:(852) 2508 1501 電子郵址:[email protected] Enquiries about this publication can be directed to: General Household Survey Section (1) Census and Statistics Department Address : Fortress Tower Sub-office, 5/F, Fortress Tower, 250 King's Road, North Point, Hong Kong, China. Tel. No. : (852) 2887 5512 Fax No. : (852) 2508 1501 E-mail : [email protected] 政府統計處網站 Website of the Census and Statistics Department http://www.info.gov.hk/censtatd/ 二零零二年三月 March 2002
-
Upload
khangminh22 -
Category
Documents
-
view
0 -
download
0
Transcript of 按區議會分區劃分的人口及住戶統計資料Population and ...

按區議會分區劃分的
人口及住戶統計資料
Population and Household StatisticsAnalysed by
District Council District
2001
有關本刊物的查詢,請聯絡:
政府統計處 綜合住戶統計調查組﹝一﹞
地址:中國香港北角英皇道二百五十號北角城中心五樓(北角城中心分處)
電話:(852) 2887 5512 圖文傳真:(852) 2508 1501電子郵址:[email protected]
Enquiries about this publication can be directed to:General Household Survey Section (1)
Census and Statistics DepartmentAddress : Fortress Tower Sub-office, 5/F, Fortress Tower,
250 King's Road, North Point, Hong Kong, China.Tel. No. : (852) 2887 5512 Fax No. : (852) 2508 1501
E-mail : [email protected]
政府統計處網站 Website of the Census and Statistics Department http://www.info.gov.hk/censtatd/
二零零二年三月
March 2002

目錄 Contents 頁數 Page
I. 引言
II. 統計數字摘要
III. 詳細統計表
統計表註釋
統計表一覽
Introduction
Summary Statistics
Detailed Statistical Tables
Notes on the Tables
List of Tables
1
5
10
10
表 1 按區議會分區及住戶人數劃分的
家庭住戶數目Table 1 Domestic Households by District
Council District and Household Size 12
表 2 按區議會分區及居所類型劃分的
家庭住戶數目 Table 2 Domestic Households by District
Council District and Type ofAccommodation
13
表 3 按區議會分區及居所租住權劃分
的家庭住戶數目 Table 3 Domestic Households by District
Council District and Tenure ofAccommodation
14
表 4 按區議會分區及住戶每月入息劃
分的家庭住戶數目 Table 4 Domestic Households by District
Council District and MonthlyHousehold Income
15
表 5 按區議會分區、性別及年齡劃分的
人口數目 Table 5 Population by District Council District,
Sex and Age 16
表 6A 按區議會分區、性別及教育程度劃
分的人口數目 Table 6A Population by District Council District,
Sex and Educational Attainment 19
表 6B 按區議會分區及年齡劃分的具中
學及以上教育程度人士所佔百分
比
Table 6B Percentage of Persons with SecondaryEducation and Above by DistrictCouncil District and Age
22
表 7 按區議會分區、性別及婚姻狀況劃
分的十五歲及以上人口數目 Table 7 Population Aged 15 and Over by
District Council District, Sex andMarital Status
23
表 8 按區議會分區及經濟活動身分劃
分的人口數目 Table 8 Population by District Council District
and Economic Activity Status26
表 9 按區議會分區、性別及年齡劃分的
勞動人口數目Table 9 Labour Force by District Council
District, Sex and Age27

目錄 Contents 頁數 Page
附錄一:按區議會分區劃分的年中人口估
計數字
Appendix 1 : Mid-year Population Estimates by District Council District
30
附錄二:詞彙釋義 Appendix 2 : Definition of Terms 32
購買途徑及郵購表格 Purchase Channels and Order Form 37

- 1 -
I. 引言 I. Introduction
背景 Background
1.1 本報告書載列二零零一年年中按區議會
分區劃分有關人口及社會經濟特徵的統計數
字。這些數字主要是根據二零零一年五月至八
月進行的綜合住戶統計調查的結果所編製,與
根據二零零一年人口普查的結果所編製的統計
數字不能作嚴格比較。
1.1 This report presents statistics on thedemographic and socio-economic characteristics ofthe population in mid-2001 at the District Council(DC) district level. These statistics are primarilybased on data collected in the General HouseholdSurvey (GHS) in May to August 2001, and are thusnot strictly comparable with the statistics based ondata collected in the 2001 Population Census (01C).
1.2 由於本報告書的統計數字是以一項抽樣
統計調查的結果為基礎,受到樣本規模的局
限,所作的分析只限於按區議會分區劃分的範
疇。相反地,由於二零零一年人口普查的分析
基礎規模較大,可提供有關更細小的地區的統
計數據。
1.2 As the statistics in this report are based on asample survey and subject to the sample sizeconstraint, the level of analysis is confined to the DCdistricts only. On the contrary, the 01C can providestatistics pertaining to smaller geographical areasowing to its much larger base for analysis.
1.3 二零零一年人口普查的涵蓋範圍及統計
時點與本報告書的統計數字所涉及的稍有分
別。二零零一年人口普查涵蓋全港人口,而本
報告書的統計數字只涵蓋陸上非住院人口(見
第 1.7 段)。至於統計時點方面,兩者相差約三
個月。二零零一年人口普查反映二零零一年三
月時的情況,而本報告書的統計數字則反映二
零零一年六月三十日時的情況。
1.3 It should be noted that both the coverage andthe reference time point of the 01C are slightlydifferent from that adopted for the statistics in thisreport. While the 01C covers the entire populationof Hong Kong, the statistics in this report cover onlythe land-based non-institutional population (see para.1.7). As regards the reference time point, there is atime lag of about 3 months. The 01C refers to thesituation in March 2001 while the statistics in thisreport refer to the position as at 30 June 2001.
註釋: (1) 本報告書的統計表內離中系數超過20%的估計
會註上星號(∗),顯示有關估計須謹慎闡釋。
有關離中系數的技術性詳情,請參閱第11頁的
第III部分第3.5 - 3.7段。
Notes: (1) In the tables in this report, estimates with coefficientof variation (CV) greater than 20% are marked withan asterisk (*) and should be interpreted withcaution. For technical details regarding the CV,please see para. 3.5 - 3.7 of Section III on page 11.
(2) 自二零零零年起,區議會的英文名稱由
'District Board' 改為 'District Council'。(2) As from 2000, 'District Board' has been re-named as
'District Council'.

- 2 -
1.4 本系列按年報告書提供有關按區議會分
區劃分的人口的統計數字。雖然與本報告書相
類的數據亦可以根據二零零一年人口普查的結
果編製,但本報告書仍會按一貫的處理方式,
根據綜合住戶統計調查的結果而編製,使讀者
在研究分析這些統計數據的趨勢時,可以在同
一統計架構下進行。但讀者須注意二零零一年
人口普查的數據與本報告書所載數據的基本分
別,並須謹慎闡釋。
1.4 This series of annual reports providesstatistics on the population at the DC district level.Although statistics similar to those in this reportcould also be compiled based on 01C results, thisreport is still published for adherence to the generalpractice of compiling the statistics based on GHSresults so as to facilitate trend analysis of suchstatistics under a coherent statistical framework.However, readers should bear in mind the inherentdifferences between the two sets of figures (i.e.statistics based on 01C results and statistics in thisreport) and interpret them with caution.
1.5 由於(i)人口數字已於二零零零年八月改
為以「居住人口」方法計算;及(ii)自一九九六
年以後的人口估計數列已根據二零零一年八月
公布的二零零一年人口普查結果而更新,本報
告書載列有關人口及社會經濟特徵的統計數字
亦以更新的「居住人口」估計數字為基礎。這
些統計數字與過往載於本系列報告書內的統計
數字可作概括比較。
1.5 Consequential to (i) the change-over to the'resident population' approach for compilingpopulation figures as from August 2000; and (ii) theupdating of the past series of population estimatescompiled since 1996 with the availability of theresults of the 01C in August 2001, statisticspertaining to the demographic and socio-economiccharacteristics of the population by DC districtpresented in this report are based on the updatedestimates of 'resident population'. These statisticsare broadly comparable with those of earlier yearspublished in the past issues of this series of reports.
綜合住戶統計調查 General Household Survey
1.6 綜合住戶統計調查是一項自一九八一年
八月開始持續進行的抽樣統計調查,旨在搜集
有關勞動人口、就業、失業和就業不足的資料。
同時亦搜集一些有關人口及社會經濟特徵的資
料。
1.6 The GHS is a continuous sample surveywhich has been conducted since August 1981. Itsmain objective is to collect information on the labourforce, employment, unemployment andunderemployment. In addition, information on thedemographic and socio-economic characteristics ofthe population is also collected.
1.7 這項統計調查涵蓋陸上非住院人口,因
而並不包括:
1.7 The survey covers the land-based non-institutional population and thus does not cover:
a) 公共機構/社團院舍的住院人士;及 a) inmates of institutions; and
b) 水上居民。
b) persons living on board vessels.
這項統計調查的涵蓋範圍約佔居港人口的 99%(見第 III 部分)。
The survey covers about 99% of the Hong KongResident Population (see Part III).

- 3 -
1.8 此項統計調查採用「循環式複樣本」設
計,按照這抽樣方式,當月所抽選的屋宇單位
樣本,約有半數在三個月前曾經接受訪問,而
另外半數則為新抽選的屋宇單位。每月的樣本
規模約為八千個住戶。
1.8 A rotational replicate sample design isadopted in the survey, such that about half of thesampled quarters in the current month had beenenumerated three months ago, while another half arenewly selected quarters. The sample size is about8 000 households each month.
1.9 綜合住戶統計調查是以屋宇單位的樣本
作依據。該樣本是從本港所有永久性及臨時樓
宇紀錄中,以一個根據科學方法設計的抽樣系
統選出。抽樣單位是:
1.9 The GHS is based on a sample of quartersselected in accordance with a scientifically designedsampling scheme. The sample is selected fromrecords of all permanent and temporary structures inHong Kong. The sampling units are :
a) 在已建設地區(包括市區、新市鎮和
主要發展區)內的永久性屋宇單位;
及
a) permanent quarters in built-up areas(including urban areas, new towns andmajor developments); and
b) 在非建設地區內的小區(每一小區平
均約有十個屋宇單位)。
b) segments in non-built-up areas (i.e. eachcontaining about 10 quarters on average).
資料項目 Data items
1.10 有關全港勞動人口特徵的詳細資料,已
於綜合住戶統計調查按季統計報告內發表。本
報告書則刊載各區議會分區的人口及住戶特徵
資料。每一分區的主要資料項目包括:
1.10 Detailed information on the labourforce characteristics of the population for Hong Kongas a whole is published in the Quarterly Report onGeneral Household Survey. The present reportcontains a broad range of the population andhousehold characteristics in each DC district. Majoritems of information included for each district are:
家庭住戶 Domestic Households
住戶人數
居所類型
Household size Type of accommodation
居所租住權 Tenure of accommodation 住戶每月入息
Monthly household income
人口 Population
年齡 Age 性別 Sex 婚姻狀況 Marital status 教育程度 Educational attainment 經濟活動身分 Economic activity status 勞動人口 Labour force

- 4 -
1.11 本報告書第 II部分載列每一區議會分區
的主要統計數字總覽,而第 III 部分則載列更詳
細的統計表。此兩部分有關人口及住戶特徵的
數字,只是指綜合住戶統計調查所涵蓋的人口
範圍(如上文第 1.7 段所述)而言。有關此等估
計數字的涵蓋範圍及可靠性的進一步資料,可
參考第 III 部分的「統計表註釋」。
1.11 Part II of this report gives an overview of thekey statistics in each DC district, while Part IIIcontains the more detailed tables. Figures on thepopulation and household characteristics in both partsrefer only to the population covered by the GHS (asspecified in para. 1.7). Readers may refer to the'Notes on the Tables' in Part III for more informationon the coverage and reliability of these estimates.
1.12 此外,按區議會分區劃分的二零零一年
年中全港人口估計數字另載於附錄一。該些數
字所涵蓋的人口範圍,較本報告書內根據綜合
住戶統計調查結果而編製的所有其他統計表
(包括第II及第III部分的統計表)的數字所涵蓋
的範圍更為廣泛。前者涵蓋所有人口,而後者
則只涵蓋陸上非住院人口。有關編製按區議會
分區劃分的年中全港人口估計數字的資料來源
及方法,亦詳列於附錄一。
1.12 Separately, the mid-2001 territorialpopulation estimates by DC district are shown inAppendix 1. These estimates refer to a widerpopulation coverage than those in all other tables(including tables in Parts II and III) in this report,which are based on the GHS results. Specifically,the former cover the entire population while the latterrefer only to the land-based non-institutionalpopulation. Details about the data sources andmethodology of the compilation of the mid-yearterritorial population estimates by DC district are alsogiven in Appendix 1.
1.13 載列於附錄一的按區議會分區劃分的
二零零一年年中全港年中人口估計數字,是根
據二零零一年人口普查的結果為基準而編製。
至於一九九六年至二零零零年根據二零零一年
人口普查結果而更新的相應數字,亦載列於附錄一,以供參考。
1.13 It should also be noted that the mid-2001territorial population estimates by DC districtpresented in Appendix 1 are compiled using theresults of the 01C as the benchmark. For readers'reference, the updated territorial population estimatesfor 1996-2000 with the 01C results incorporated arealso included in Appendix 1 correspondingly.
1.14 有關本報告書所涉及的詞彙釋義,載
於附錄二。
1.14 The definitions of terms used in this reportare given in Appendix 2.

II. 統計數字摘要II. Summary Statistics
摘要統計表甲 家庭住戶特徵Summary Table A Domestic household characteristics
居於整個單位/全層樓宇/整間
洋房的住戶百分比 居於自置居所住戶平 Percentage of 的住戶百分比 住戶每月入息均人數 households Percentage 中位數
區議會分區 Average occupying of owner- (港元)District household a whole flat/ occupier Median monthlyCouncil district size floor/house households household income
(%) (%) (HK$)
中西區 2.8 92.1 58.1 24,800Central & Western
灣仔 2.7 91.7 57.2 24,000Wan Chai
東區 3.2 96.6 62.9 22,000Eastern
南區 3.3 98.2 43.4 21,500Southern
油尖旺 2.8 81.7 60.0 15,000Yau Tsim Mong
深水 2.9 88.4 39.3 13,500Sham Shui Po
九龍城 3.1 91.9 57.5 19,500Kowloon City
黃大仙 3.3 98.5 38.3 15,600Wong Tai Sin
觀塘 3.1 97.6 38.0 15,000Kwun Tong
葵青 3.3 98.0 34.1 15,000Kwai Tsing
荃灣 3.1 94.7 57.9 20,000Tsuen Wan
屯門 3.3 99.4 55.1 16,500Tuen Mun
元朗 3.3 99.6 56.4 15,000Yuen Long
北區 3.3 97.6 59.8 15,000North
大埔 3.4 98.4 60.7 18,100Tai Po
沙田 3.3 99.4 57.9 20,000Sha Tin
西貢 3.4 99.1 58.9 20,500Sai Kung
離島 2.9 97.8 57.3 18,000Islands
合計 3.2 96.0 52.2 17,700Overall
- 5 -

摘要統計表乙 人口特徵Summary Table B Demographic characteristics
以下年齡組別人士佔區內人口百分比區議會分區 性別比率 年齡中位數 Persons in the following age groups asDistrict Sex ratio Median age percentage of population in districtCouncil district 0 - 14 15 - 59 > 60
(%) (%) (%)
中西區 880 37 14.2 71.2 14.5Central & Western
灣仔 828 39 12.0 71.0 16.9Wan Chai
東區 903 38 15.0 68.8 16.3Eastern
南區 914 36 16.0 69.1 14.9Southern
油尖旺 1 006 38 14.2 67.7 18.1Yau Tsim Mong
深水 981 39 14.8 65.1 20.1Sham Shui Po
九龍城 898 38 15.0 67.1 17.9Kowloon City
黃大仙 985 37 15.6 64.7 19.7Wong Tai Sin
觀塘 989 38 14.7 65.9 19.4Kwun Tong
葵青 1 013 36 15.2 68.6 16.1Kwai Tsing
荃灣 948 36 16.6 69.7 13.8Tsuen Wan
屯門 998 34 18.9 71.9 9.3Tuen Mun
元朗 982 33 20.4 68.3 11.2Yuen Long
北區 976 34 20.4 68.2 11.4North
大埔 957 35 19.1 70.3 10.6Tai Po
沙田 942 35 16.3 71.7 12.0Sha Tin
西貢 949 34 18.8 71.3 9.8Sai Kung
離島 956 35 17.3 69.7 13.0Islands
合計 955 36 16.4 68.8 14.8Overall
- 6 -

摘要統計表乙 (續) 人口特徵Summary Table B (Cont'd) Demographic characteristics
以下年齡組別中具中學及
以上教育程度人士佔區內
相應年齡組別人口百分比Persons with secondary
education and above in the就讀全日制課程人士 following age groups as
佔區內人口百分比 percentage of population in the 總撫養比率
區議會分區 Persons studying full- respective age groups in district OverallDistrict time as percentage of dependencyCouncil district population in district 15-29 30-49 >50 ratio
(%) (%) (%) (%)
中西區 18.0 97.5 89.3 47.5 336Central & Western
灣仔 16.5 98.0 94.5 58.6 327Wan Chai
東區 19.3 97.4 86.0 45.9 373Eastern
南區 20.6 96.4 77.9 30.1 377Southern
油尖旺 18.2 97.3 81.9 40.7 375Yau Tsim Mong
深水 19.5 97.3 76.9 32.2 440Sham Shui Po
九龍城 19.7 97.6 86.1 45.8 394Kowloon City
黃大仙 20.5 97.5 78.0 19.5 450Wong Tai Sin
觀塘 19.1 98.0 79.1 26.5 414Kwun Tong
葵青 20.4 98.5 76.1 27.3 362Kwai Tsing
荃灣 20.8 97.3 84.4 35.6 359Tsuen Wan
屯門 24.0 97.0 72.7 29.3 341Tuen Mun
元朗 24.5 97.8 76.0 34.2 406Yuen Long
北區 25.2 97.8 74.9 28.6 410North
大埔 24.9 98.6 74.1 31.8 371Tai Po
沙田 22.4 97.8 80.5 33.6 335Sha Tin
西貢 23.2 98.0 80.3 37.2 350Sai Kung
離島 18.9 85.1 76.5 23.9 377Islands
合計 21.1 97.5 79.9 34.4 379Overall
- 7 -

摘要統計表丙 勞動人口特徵Summary Table C Labour force characteristics
勞動人口參與率Labour force participation rate
區議會分區 男性/年齡組別 女性/年齡組別District Male/Age group Female/Age group 合計Council district 15 - 19 20 - 49 > 50 15 - 19 20 - 49 > 50 Overall
(%) (%) (%) (%) (%) (%) (%)
中西區 13.9 * 92.0 57.3 11.3 * 75.1 27.5 66.3Central & Western
灣仔 - * 94.1 52.5 8.3 * 77.9 26.1 65.3Wan Chai
東區 14.6 94.6 48.9 12.4 75.7 24.3 63.8Eastern
南區 14.5 * 93.9 46.7 14.3 * 73.9 20.1 62.8Southern
油尖旺 8.4 * 92.7 50.1 14.0 * 70.4 21.6 60.6Yau Tsim Mong
深水 15.9 * 93.5 43.9 11.6 * 69.0 18.6 57.9Sham Shui Po
九龍城 12.9 * 91.9 45.6 9.0 * 70.6 19.4 59.0Kowloon City
黃大仙 11.4 * 93.1 36.5 14.6 68.9 13.0 56.4Wong Tai Sin
觀塘 14.3 92.3 43.1 17.0 69.0 16.6 57.9Kwun Tong
葵青 17.1 93.0 45.9 16.0 69.3 16.9 59.5Kwai Tsing
荃灣 12.1 * 94.1 47.6 9.9 * 72.4 14.4 62.6Tsuen Wan
屯門 18.4 94.6 59.0 19.8 64.4 20.6 64.0Tuen Mun
元朗 21.7 94.6 47.7 18.1 62.3 15.3 61.3Yuen Long
北區 14.5 * 92.8 48.9 12.2 * 63.3 17.0 60.2North
大埔 18.5 95.6 52.6 17.8 63.1 19.6 61.8Tai Po
沙田 15.7 92.5 52.7 18.0 67.1 20.3 61.7Sha Tin
西貢 13.2 * 93.9 53.9 19.5 71.5 21.5 66.1Sai Kung
離島 11.5 * 87.1 51.4 13.5 * 63.5 21.5 60.5Islands
合計 15.1 93.4 48.2 15.3 69.2 19.3 61.3Overall
註釋 : * 此估計的精確程度較低 (離中系數超過 20%),因此須謹慎闡釋。
Note : * Denotes an estimate with relatively low precision (coefficient of variation having avalue greater than 20%) which should thus be interpreted with caution.
- 8 -

摘要統計表丙 (續) 勞動人口特徵Summary Table C (Cont'd) Labour force characteristics
勞動人口 勞動人口的區議會分區 的性別比率 年齡中位數District Sex ratio of Median age ofCouncil district labour force labour force
中西區 1 105 38Central & Western
灣仔 996 39Wan Chai
東區 1 162 38Eastern
南區 1 186 38Southern
油尖旺 1 389 38Yau Tsim Mong
深水 1 411 39Sham Shui Po
九龍城 1 209 38Kowloon City
黃大仙 1 451 37Wong Tai Sin
觀塘 1 428 37Kwun Tong
葵青 1 477 37Kwai Tsing
荃灣 1 316 37Tsuen Wan
屯門 1 505 37Tuen Mun
元朗 1 526 36Yuen Long
北區 1 466 37North
大埔 1 444 38Tai Po
沙田 1 328 37Sha Tin
西貢 1 267 36Sai Kung
離島 1 346 37Islands
合計 1 338 37Overall
- 9 -

- 10 -
III. 詳細統計表 III. Detailed StatisticalTables
統計表註釋 Notes on the Tables
涵蓋範圍 Coverage
3.1 除特別註明外,本報告書載列的統計數
字涵蓋陸上非住院人口,這約佔居港人口(包
括常住居民及流動居民)的99%。
3.1 Unless otherwise specified, statistics in thisreport cover the land-based non-institutionalpopulation, which constitutes about 99% of the HongKong Resident Population (i.e. including both UsualResidents and Mobile Residents).
3.2 綜合住戶統計調查基本上採用「居住人
口」為基礎,涵蓋香港的常住居民及流動居
民。
3.2 The General Household Survey (GHS)basically adopts the 'resident population' approachwhereby all Usual Residents and Mobile Residents ofHong Kong are covered.
註釋:「常住居民」包括兩類人士:(一)在統計時點之
前的六個月內,在港逗留最少三個月,又或在統
計時點之後的六個月內,在港逗留最少三個月的
香港永久性居民,不論在統計時點他們是否身在
香港;及(二)在統計時點身在香港的香港非永久
性居民。
Notes: 'Usual Residents' include two categories of people: (1)Hong Kong Permanent Residents who have stayed inHong Kong for at least three months during the sixmonths before the reference time-point or for at leastthree months during the six months after the referencetime-point, regardless of whether they are in Hong Kongor not at the reference time-point; and (2) Hong KongNon-permanent Residents who are in Hong Kong at thereference time-point.
至於「流動居民」,是指在統計時點之前的六個
月內,在港逗留最少一個月但少於三個月,又或
在統計時點之後的六個月內,在港逗留最少一個
月但少於三個月的香港永久性居民,不論在統計
時點他們是否身在香港。
As for 'Mobile Residents', they are Hong KongPermanent Residents who have stayed in Hong Kong forat least one month but less than three months during thesix months before the reference time-point or for at leastone month but less than three months during the sixmonths after the reference time-point, regardless ofwhether they are in Hong Kong or not at the referencetime-point.
3.3 在綜合住戶統計調查中,在被抽選的屋
宇單位內所有的常住居民及流動居民均被問及
關於個人、勞動力和住戶特徵的資料。統計調
查採用「移動統計時點」的搜集資料方法。
3.3 In the GHS, information on personal, labourforce and household characteristics is collected fromall Usual Residents and Mobile Residents in thesampled quarters where appropriate. A 'shiftingsurvey moment' approach is applied.
3.4 本報告書內(附錄一除外)載列的統
計數字是根據二零零一年五月至八月進行的綜
合住戶統計調查的結果而編製。由於二零零一
年六月三十日為這段期間的中間點,故這些統
計數字可被視為反映有關二零零一年六月三十
日時的情況。
3.4 The statistics presented in this report (exceptAppendix 1) are based on data collected in the GHSin May to August 2001 which are centred at 30 June2001. Therefore, these statistics may be regarded asreferring to the position as at 30 June 2001.

- 11 -
估計的可靠性 Reliability of the estimates
3.5 綜合住戶統計調查的結果受抽樣誤差和
非抽樣誤差影響。本報告書(附錄一除外)所
載的估計是根據一個樣本所得的資料編製。以
同樣的抽樣方式,可抽選出許多相同規模的可
能樣本,而是項統計調查的樣本為眾多樣本的
其中之一。不同樣本得出的估計可能有差異。
「抽樣誤差」正是計算這些差異的統計量數,
可用以量度從一個特定樣本所得的估計,在估
算總體數據方面的精確程度。
3.5 Results of the GHS are subject to samplingerror and non-sampling error. The estimatescontained in this report (except Appendix 1) arebased on information obtained from a sample, whichis one of a large number of possible samples of thesame size that could be selected using the samesample design. Estimates derived from differentsamples would probably differ. The 'sampling error'is a measure of these variations and is thus a measureof the precision with which an estimate derived froma particular sample would approximate the populationparameter to be measured.
3.6 本報告書在比較各種變數估計的精確程
度時,採用了離中系數。離中系數的計算方
法,是將標準誤差除以有關估計,再以百分比
表示。標準誤差是根據統計原理所訂的公式計
算。一般來說,標準誤差與總體內各元素的變
異、樣本規模和樣本設計相關。
3.6 For comparing the precision of the estimatesof various variables in this report, the coefficient ofvariation (CV) is used. CV is obtained byexpressing the standard error (SE) as a percentage ofthe estimate to which it refers. In turn, the SE iscomputed according to a formula which is establishedon the basis of statistical theory. Generallyspeaking, the SE is related to the variability of theelements in the population, the size of the sample andthe sample design adopted for the survey.
3.7 在本報告書內,離中系數超過20%的估
計會註上星「*」號。此等估計的精確程度較
低,因此須謹慎闡釋。
3.7 In this report, estimates with CV greaterthan 20% are marked with an asterisk '*'.Considering their relatively low precision, theyshould be interpreted with caution.
數字的捨入 Rounding of figures
3.8 由於四捨五入的關係,統計表內個別項
目的數字加起來可能與總數略有出入。
3.8 Owing to rounding, there may be a slightdiscrepancy between the sum of individual items andthe total as shown in the tables.
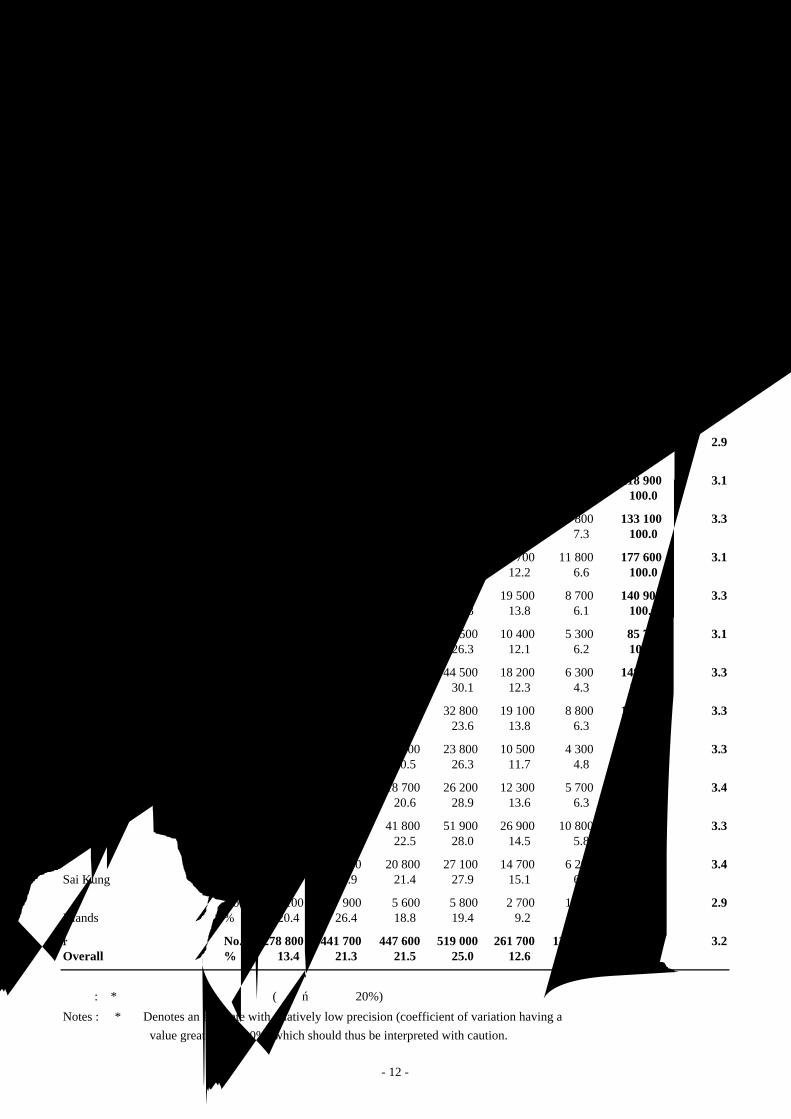
表 1 按區議會分區及住戶人數劃分的家庭住戶數目Table 1 Domestic Households by District Council District and
Household size
住戶人數 住戶平Household size 均人數
區議會分區 AverageDistrict 總計 householdCouncil district 1 2 3 4 5 > 6 Total size
中西區 數目 No. 19 500 23 200 16 800 17 600 8 000 5 500 90 600 2.8Central & Western 百分比 % 21.5 25.6 18.6 19.5 8.8 6.0 100.0
灣仔 數目 No. 14 600 14 000 11 600 9 000 6 100 3 900 59 100 2.7Wan Chai 百分比 % 24.7 23.7 19.6 15.2 10.3 6.5 100.0
東區 數目 No. 21 400 40 700 43 600 47 000 24 700 12 200 189 500 3.2Eastern 百分比 % 11.3 21.4 23.0 24.8 13.0 6.4 100.0
南區 數目 No. 8 200 16 900 18 800 21 400 11 900 6 200 83 400 3.3Southern 百分比 % 9.9 20.2 22.6 25.7 14.2 7.4 100.0
油尖旺 數目 No. 21 000 25 400 19 900 19 700 9 200 6 000 101 300 2.8Yau Tsim Mong 百分比 % 20.7 25.1 19.7 19.4 9.1 6.0 100.0
深水 數目 No. 21 400 28 200 23 800 24 400 11 500 7 500 116 700 2.9Sham Shui Po 百分比 % 18.3 24.2 20.4 20.9 9.8 6.4 100.0
九龍城 數目 No. 15 400 25 900 25 800 27 600 16 200 7 900 118 900 3.1Kowloon City 百分比 % 12.9 21.8 21.7 23.2 13.7 6.6 100.0
黃大仙 數目 No. 16 100 24 800 29 200 35 200 18 000 9 800 133 100 3.3Wong Tai Sin 百分比 % 12.1 18.7 21.9 26.4 13.6 7.3 100.0
觀塘 數目 No. 24 600 38 900 38 200 42 400 21 700 11 800 177 600 3.1Kwun Tong 百分比 % 13.9 21.9 21.5 23.9 12.2 6.6 100.0
葵青 數目 No. 15 300 25 700 31 800 39 900 19 500 8 700 140 900 3.3Kwai Tsing 百分比 % 10.8 18.3 22.6 28.3 13.8 6.1 100.0
荃灣 數目 No. 8 900 19 700 18 800 22 500 10 400 5 300 85 700 3.1Tsuen Wan 百分比 % 10.4 23.0 22.0 26.3 12.1 6.2 100.0
屯門 數目 No. 13 500 30 400 35 200 44 500 18 200 6 300 148 100 3.3Tuen Mun 百分比 % 9.1 20.5 23.8 30.1 12.3 4.3 100.0
元朗 數目 No. 19 300 30 200 28 700 32 800 19 100 8 800 138 900 3.3Yuen Long 百分比 % 13.9 21.7 20.6 23.6 13.8 6.3 100.0
北區 數目 No. 14 100 18 900 18 500 23 800 10 500 4 300 90 200 3.3North 百分比 % 15.7 21.0 20.5 26.3 11.7 4.8 100.0
大埔 數目 No. 10 800 17 000 18 700 26 200 12 300 5 700 90 800 3.4Tai Po 百分比 % 11.9 18.7 20.6 28.9 13.6 6.3 100.0
沙田 數目 No. 18 600 35 600 41 800 51 900 26 900 10 800 185 600 3.3Sha Tin 百分比 % 10.0 19.2 22.5 28.0 14.5 5.8 100.0
西貢 數目 No. 9 900 18 400 20 800 27 100 14 700 6 200 97 100 3.4Sai Kung 百分比 % 10.2 18.9 21.4 27.9 15.1 6.4 100.0
離島 數目 No. 6 100 7 900 5 600 5 800 2 700 1 800 * 29 900 2.9Islands 百分比 % 20.4 26.4 18.8 19.4 9.2 5.9 100.0
合計 數目 No. 278 800 441 700 447 600 519 000 261 700 128 600 2 077 400 3.2Overall 百分比 % 13.4 21.3 21.5 25.0 12.6 6.2 100.0
註釋 : * 此估計的精確程度較低 (離中系數超過 20%),因此須謹慎闡釋。
Notes : * Denotes an estimate with relatively low precision (coefficient of variation having a value greater than 20%) which should thus be interpreted with caution.
- 12 -

表 2 按區議會分區及居所類型劃分的家庭住戶數目Table 2 Domestic Households by District Council District and
Type of Accommodation居所類型
Type of accommodation整個單位/全層
區議會分區 樓宇/整間洋房District Whole flat/ 其他 總計Council district floor/house Others Total
中西區 數目 No. 83 500 7 100 90 600Central & Western 百分比 % 92.1 7.9 100.0
灣仔 數目 No. 54 200 4 900 59 100Wan Chai 百分比 % 91.7 8.3 100.0
東區 數目 No. 183 200 6 400 189 500Eastern 百分比 % 96.6 3.4 100.0
南區 數目 No. 81 900 1 500 * 83 400Southern 百分比 % 98.2 1.8 100.0
油尖旺 數目 No. 82 800 18 500 101 300Yau Tsim Mong 百分比 % 81.7 18.3 100.0
深水 數目 No. 103 200 13 500 116 700Sham Shui Po 百分比 % 88.4 11.6 100.0
九龍城 數目 No. 109 300 9 600 118 900Kowloon City 百分比 % 91.9 8.1 100.0
黃大仙 數目 No. 131 100 2 000 133 100Wong Tai Sin 百分比 % 98.5 1.5 100.0
觀塘 數目 No. 173 300 4 200 177 600Kwun Tong 百分比 % 97.6 2.4 100.0
葵青 數目 No. 138 000 2 900 140 900Kwai Tsing 百分比 % 98.0 2.0 100.0
荃灣 數目 No. 81 200 4 500 85 700Tsuen Wan 百分比 % 94.7 5.3 100.0
屯門 數目 No. 147 100 1 000 * 148 100Tuen Mun 百分比 % 99.4 0.6 100.0
元朗 數目 No. 138 300 600 * 138 900Yuen Long 百分比 % 99.6 0.4 100.0
北區 數目 No. 88 000 2 100 90 200North 百分比 % 97.6 2.4 100.0
大埔 數目 No. 89 300 1 400 * 90 800Tai Po 百分比 % 98.4 1.6 100.0
沙田 數目 No. 184 400 1 200 * 185 600Sha Tin 百分比 % 99.4 0.6 100.0
西貢 數目 No. 96 300 800 * 97 100Sai Kung 百分比 % 99.1 0.9 100.0
離島 數目 No. 29 300 700 * 29 900Islands 百分比 % 97.8 2.2 100.0
合計 數目 No. 1 994 400 83 000 2 077 400Overall 百分比 % 96.0 4.0 100.0
註釋 : * 此估計的精確程度較低 (離中系數超過 20%),因此須謹慎闡釋。
Note : * Denotes an estimate with relatively low precision (coefficient of variation having avalue greater than 20%) which should thus be interpreted with caution.
- 13 -
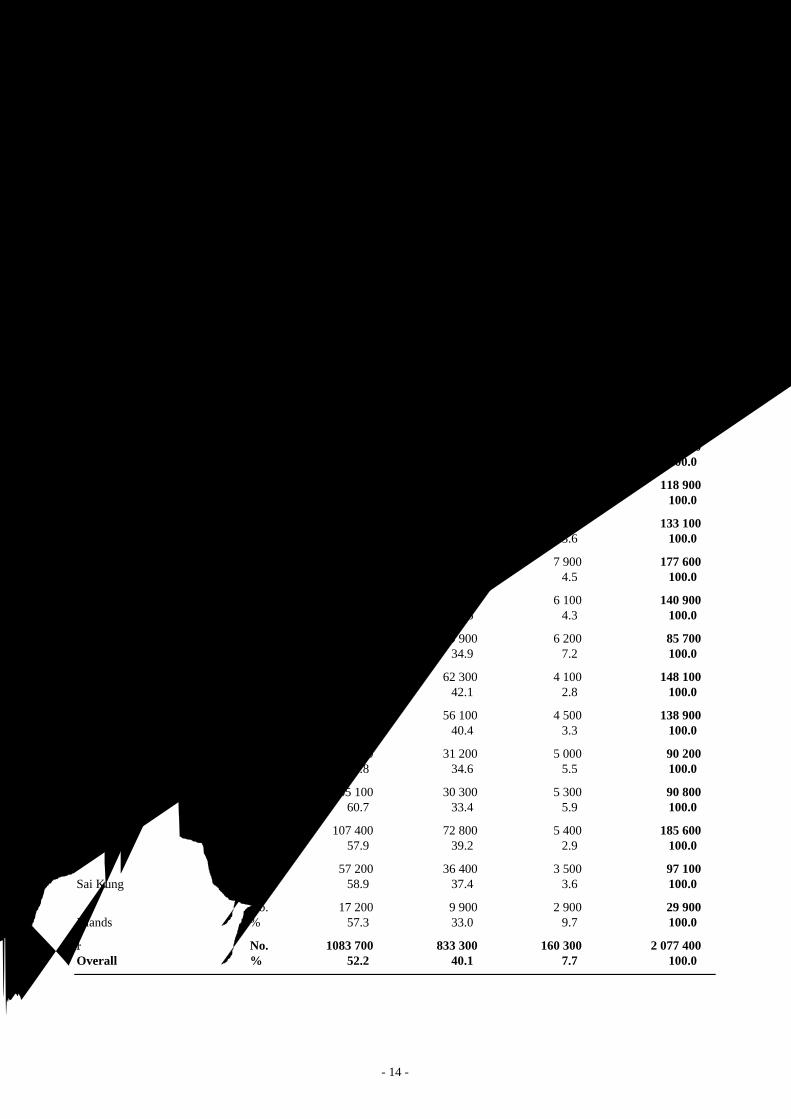
表 3 按區議會分區及居所租住權劃分的家庭住戶數目Table 3 Domestic Households by District Council District and
Tenure of Accommodation居所租住權
Tenure of accommodation
區議會分區 自置 全租District Owner- Sole 其他 總計Council district occupier tenant Others Total
中西區 數目 No. 52 700 21 200 16 700 90 600Central & Western 百分比 % 58.1 23.4 18.4 100.0
灣仔 數目 No. 33 800 13 500 11 800 59 100Wan Chai 百分比 % 57.2 22.9 19.9 100.0
東區 數目 No. 119 300 55 700 14 500 189 500Eastern 百分比 % 62.9 29.4 7.7 100.0
南區 數目 No. 36 200 38 800 8 400 83 400Southern 百分比 % 43.4 46.6 10.0 100.0
油尖旺 數目 No. 60 800 18 800 21 700 101 300Yau Tsim Mong 百分比 % 60.0 18.5 21.4 100.0
深水 數目 No. 45 900 53 600 17 200 116 700Sham Shui Po 百分比 % 39.3 45.9 14.8 100.0
九龍城 數目 No. 68 400 36 300 14 200 118 900Kowloon City 百分比 % 57.5 30.5 11.9 100.0
黃大仙 數目 No. 50 900 77 300 4 800 133 100Wong Tai Sin 百分比 % 38.3 58.1 3.6 100.0
觀塘 數目 No. 67 500 102 200 7 900 177 600Kwun Tong 百分比 % 38.0 57.6 4.5 100.0
葵青 數目 No. 48 000 86 800 6 100 140 900Kwai Tsing 百分比 % 34.1 61.6 4.3 100.0
荃灣 數目 No. 49 600 29 900 6 200 85 700Tsuen Wan 百分比 % 57.9 34.9 7.2 100.0
屯門 數目 No. 81 600 62 300 4 100 148 100Tuen Mun 百分比 % 55.1 42.1 2.8 100.0
元朗 數目 No. 78 300 56 100 4 500 138 900Yuen Long 百分比 % 56.4 40.4 3.3 100.0
北區 數目 No. 53 900 31 200 5 000 90 200North 百分比 % 59.8 34.6 5.5 100.0
大埔 數目 No. 55 100 30 300 5 300 90 800Tai Po 百分比 % 60.7 33.4 5.9 100.0
沙田 數目 No. 107 400 72 800 5 400 185 600Sha Tin 百分比 % 57.9 39.2 2.9 100.0
西貢 數目 No. 57 200 36 400 3 500 97 100Sai Kung 百分比 % 58.9 37.4 3.6 100.0
離島 數目 No. 17 200 9 900 2 900 29 900Islands 百分比 % 57.3 33.0 9.7 100.0
合計 數目 No. 1083 700 833 300 160 300 2 077 400Overall 百分比 % 52.2 40.1 7.7 100.0
- 14 -

表 4 按區議會分區及住戶每月入息劃分的家庭住戶數目Table 4 Domestic Households by District Council District and
Monthly Household Income
住戶每月入息(港元) 住戶每月入息
Monthly household income (HK$) 中位數
(港元)
區議會分區
DistrictCouncil district <10,000
10,000-29,999 >30,000
總計
Total
Median monthlyhousehold
income (HK$)
中西區 數目 No. 17 200 35 400 38 000 90 600 24,800Central & Western 百分比 % 19.0 39.1 41.9 100.0
灣仔 數目 No. 12 600 20 400 26 100 59 100 24,000Wan Chai 百分比 % 21.4 34.5 44.1 100.0
東區 數目 No. 37 800 79 500 72 200 189 500 22,000Eastern 百分比 % 19.9 42.0 38.1 100.0
南區 數目 No. 16 800 35 100 31 400 83 400 21,500Southern 百分比 % 20.2 42.1 37.7 100.0
油尖旺 數目 No. 33 400 43 900 24 000 101 300 15,000Yau Tsim Mong 百分比 % 33.0 43.4 23.7 100.0
深水 數目 No. 41 400 53 100 22 200 116 700 13,500Sham Shui Po 百分比 % 35.5 45.5 19.0 100.0
九龍城 數目 No. 28 600 52 200 38 200 118 900 19,500Kowloon City 百分比 % 24.0 43.9 32.1 100.0
黃大仙 數目 No. 36 800 71 000 25 300 133 100 15,600Wong Tai Sin 百分比 % 27.6 53.3 19.0 100.0
觀塘 數目 No. 53 200 88 400 36 000 177 600 15,000Kwun Tong 百分比 % 29.9 49.8 20.3 100.0
葵青 數目 No. 39 000 73 600 28 300 140 900 15,000Kwai Tsing 百分比 % 27.7 52.2 20.1 100.0
荃灣 數目 No. 16 800 40 500 28 300 85 700 20,000Tsuen Wan 百分比 % 19.6 47.3 33.1 100.0
屯門 數目 No. 33 700 86 800 27 600 148 100 16,500Tuen Mun 百分比 % 22.8 58.6 18.6 100.0
元朗 數目 No. 38 800 72 500 27 600 138 900 15,000Yuen Long 百分比 % 27.9 52.2 19.9 100.0
北區 數目 No. 27 600 44 100 18 400 90 200 15,000North 百分比 % 30.7 49.0 20.4 100.0
大埔 數目 No. 19 700 49 100 22 000 90 800 18,100Tai Po 百分比 % 21.7 54.1 24.2 100.0
沙田 數目 No. 37 200 93 000 55 400 185 600 20,000Sha Tin 百分比 % 20.0 50.1 29.9 100.0
西貢 數目 No. 14 400 51 300 31 400 97 100 20,500Sai Kung 百分比 % 14.8 52.9 32.3 100.0
離島 數目 No. 7 600 13 900 8 500 29 900 18,000Islands 百分比 % 25.3 46.4 28.2 100.0
合計 數目 No. 512 600 1 003 900 560 800 2 077 400 17,700Overall 百分比 % 24.7 48.3 27.0 100.0
- 15 -

表 5 按區議會分區、性別及年齡劃分的人口數目
Table 5 Population by District Council District, Sex and Age
男女合計/年齡組別 總撫養比率Both sexes/Age group Overall
區議會分區 年齡 depenDistrict 總計 中位數 -dencyCouncil district 0-14 15-29 30-39 40-49 50-59 > 60 Total Median age ratio
中西區 數目 No. 37 000 51 200 54 400 49 800 29 800 37 800 259 800 37 336Central & Western 百分比 % 14.2 19.7 20.9 19.2 11.5 14.5 100.0
灣仔 數目 No. 19 900 32 200 33 000 31 900 20 200 27 900 165 100 39 327Wan Chai 百分比 % 12.0 19.5 20.0 19.3 12.3 16.9 100.0
東區 數目 No. 91 700 121 800 114 800 114 100 71 000 99 700 613 100 38 373Eastern 百分比 % 15.0 19.9 18.7 18.6 11.6 16.3 100.0
南區 數目 No. 44 900 58 700 54 500 52 100 28 300 41 800 280 200 36 377Southern 百分比 % 16.0 20.9 19.4 18.6 10.1 14.9 100.0
油尖旺 數目 No. 40 200 57 300 49 400 49 100 34 900 50 900 281 800 38 375Yau Tsim Mong 百分比 % 14.2 20.3 17.5 17.4 12.4 18.1 100.0
深水 數目 No. 51 500 65 500 59 200 64 000 38 200 70 000 348 300 39 440Sham Shui Po 百分比 % 14.8 18.8 17.0 18.4 11.0 20.1 100.0
九龍城 數目 No. 56 900 75 300 70 300 64 900 43 600 67 800 378 800 38 394Kowloon City 百分比 % 15.0 19.9 18.5 17.1 11.5 17.9 100.0
黃大仙 數目 No. 69 200 88 600 82 400 75 400 40 900 87 500 444 000 37 450Wong Tai Sin 百分比 % 15.6 20.0 18.6 17.0 9.2 19.7 100.0
觀塘 數目 No. 82 700 116 500 102 000 93 300 59 200 108 900 562 600 38 414Kwun Tong 百分比 % 14.7 20.7 18.1 16.6 10.5 19.4 100.0
葵青 數目 No. 72 500 110 200 84 500 78 300 54 400 77 000 476 900 36 362Kwai Tsing 百分比 % 15.2 23.1 17.7 16.4 11.4 16.1 100.0
荃灣 數目 No. 45 000 57 600 55 800 47 500 28 300 37 300 271 500 36 359Tsuen Wan 百分比 % 16.6 21.2 20.5 17.5 10.4 13.8 100.0
屯門 數目 No. 92 300 119 900 88 500 96 200 47 300 45 400 489 600 34 341Tuen Mun 百分比 % 18.9 24.5 18.1 19.6 9.7 9.3 100.0
元朗 數目 No. 93 500 102 900 92 500 81 600 35 400 51 400 457 100 33 406Yuen Long 百分比 % 20.4 22.5 20.2 17.8 7.7 11.2 100.0
北區 數目 No. 60 500 64 000 59 100 56 700 22 600 33 900 296 700 34 410North 百分比 % 20.4 21.6 19.9 19.1 7.6 11.4 100.0
大埔 數目 No. 58 900 69 100 55 600 64 400 27 200 32 600 307 800 35 371Tai Po 百分比 % 19.1 22.5 18.1 20.9 8.8 10.6 100.0
沙田 數目 No. 101 500 149 300 110 900 120 500 66 500 74 600 623 400 35 335Sha Tin 百分比 % 16.3 24.0 17.8 19.3 10.7 12.0 100.0
西貢 數目 No. 62 300 73 500 73 300 60 500 29 000 32 600 331 200 34 350Sai Kung 百分比 % 18.8 22.2 22.1 18.3 8.8 9.8 100.0
離島 數目 No. 15 800 19 000 21 300 15 600 7 700 11 800 91 200 35 377Islands 百分比 % 17.3 20.9 23.3 17.1 8.5 13.0 100.0
合計 數目 No. 1096 300 1432 500 1 261 200 1 215 500 684 600 989 100 6 679 200 36 379Overall 百分比 % 16.4 21.4 18.9 18.2 10.2 14.8 100.0
- 16 -
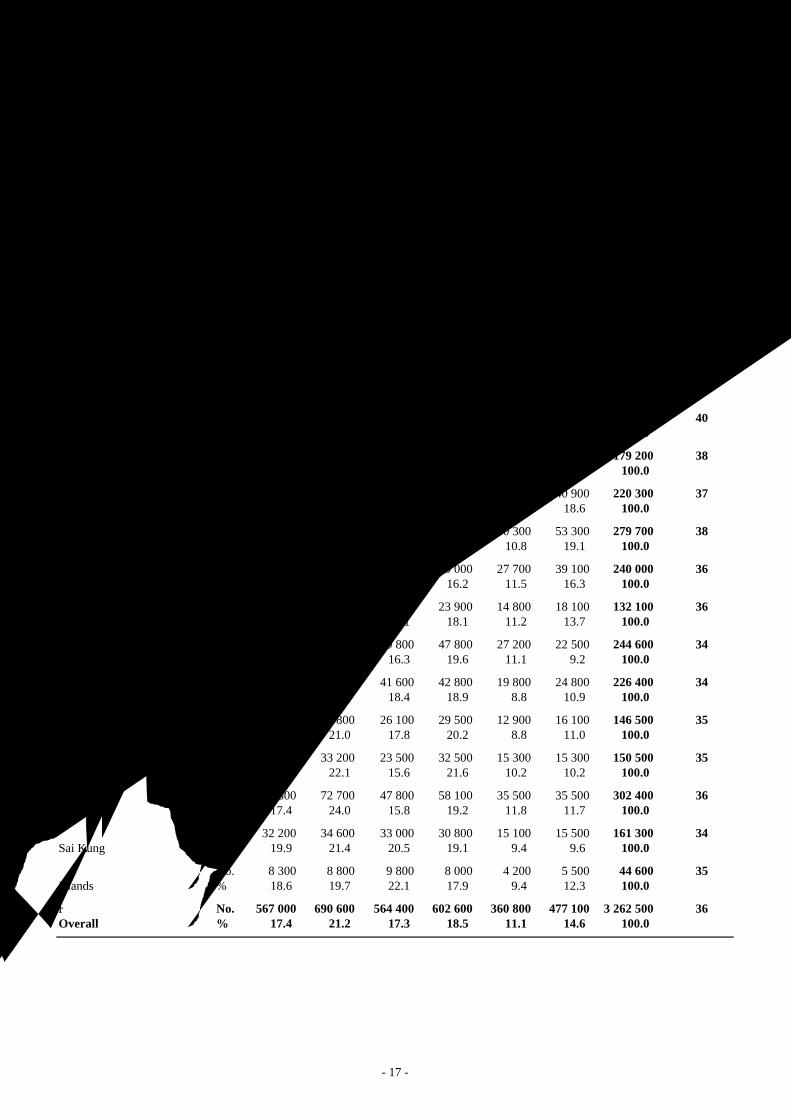
表 5 (續) 按區議會分區、性別及年齡劃分的人口數目Table 5 (Cont'd) Population by District Council District, Sex and Age
男性/年齡組別Male/Age group
區議會分區 年齡District 總計 中位數Council district 0-14 15-29 30-39 40-49 50-59 > 60 Total Median age
中西區 數目 No. 19 300 23 300 22 600 23 100 15 300 18 000 121 700 37Central & Western 百分比 % 15.8 19.2 18.6 19.0 12.6 14.8 100.0
灣仔 數目 No. 10 100 13 200 13 200 14 500 10 400 13 400 74 800 40Wan Chai 百分比 % 13.5 17.7 17.7 19.3 13.9 17.9 100.0
東區 數目 No. 47 300 57 000 49 800 54 800 36 000 46 000 290 900 38Eastern 百分比 % 16.3 19.6 17.1 18.8 12.4 15.8 100.0
南區 數目 No. 23 100 27 800 23 700 24 900 14 400 19 900 133 800 37Southern 百分比 % 17.3 20.8 17.7 18.6 10.7 14.8 100.0
油尖旺 數目 No. 21 000 27 900 22 700 24 200 19 200 26 400 141 300 39Yau Tsim Mong 百分比 % 14.8 19.8 16.0 17.1 13.6 18.7 100.0
深水 數目 No. 26 600 32 100 26 200 32 700 20 400 34 400 172 500 40Sham Shui Po 百分比 % 15.4 18.6 15.2 18.9 11.8 20.0 100.0
九龍城 數目 No. 29 600 35 000 29 500 30 800 21 600 32 600 179 200 38Kowloon City 百分比 % 16.5 19.5 16.5 17.2 12.1 18.2 100.0
黃大仙 數目 No. 35 900 43 900 39 900 39 000 20 600 40 900 220 300 37Wong Tai Sin 百分比 % 16.3 19.9 18.1 17.7 9.4 18.6 100.0
觀塘 數目 No. 42 500 58 400 48 900 46 300 30 300 53 300 279 700 38Kwun Tong 百分比 % 15.2 20.9 17.5 16.5 10.8 19.1 100.0
葵青 數目 No. 37 700 55 700 40 900 39 000 27 700 39 100 240 000 36Kwai Tsing 百分比 % 15.7 23.2 17.0 16.2 11.5 16.3 100.0
荃灣 數目 No. 23 200 27 000 25 200 23 900 14 800 18 100 132 100 36Tsuen Wan 百分比 % 17.6 20.5 19.1 18.1 11.2 13.7 100.0
屯門 數目 No. 47 600 59 800 39 800 47 800 27 200 22 500 244 600 34Tuen Mun 百分比 % 19.5 24.4 16.3 19.6 11.1 9.2 100.0
元朗 數目 No. 48 100 49 300 41 600 42 800 19 800 24 800 226 400 34Yuen Long 百分比 % 21.2 21.8 18.4 18.9 8.8 10.9 100.0
北區 數目 No. 31 100 30 800 26 100 29 500 12 900 16 100 146 500 35North 百分比 % 21.2 21.0 17.8 20.2 8.8 11.0 100.0
大埔 數目 No. 30 600 33 200 23 500 32 500 15 300 15 300 150 500 35Tai Po 百分比 % 20.4 22.1 15.6 21.6 10.2 10.2 100.0
沙田 數目 No. 52 800 72 700 47 800 58 100 35 500 35 500 302 400 36Sha Tin 百分比 % 17.4 24.0 15.8 19.2 11.8 11.7 100.0
西貢 數目 No. 32 200 34 600 33 000 30 800 15 100 15 500 161 300 34Sai Kung 百分比 % 19.9 21.4 20.5 19.1 9.4 9.6 100.0
離島 數目 No. 8 300 8 800 9 800 8 000 4 200 5 500 44 600 35Islands 百分比 % 18.6 19.7 22.1 17.9 9.4 12.3 100.0
合計 數目 No. 567 000 690 600 564 400 602 600 360 800 477 100 3 262 500 36Overall 百分比 % 17.4 21.2 17.3 18.5 11.1 14.6 100.0
- 17 -

表 5 (續) 按區議會分區、性別及年齡劃分的人口數目Table 5 (Cont'd) Population by District Council District, Sex and Age
女性/年齡組別Female/Age group
區議會分區 年齡District 總計 中位數Council district 0-14 15-29 30-39 40-49 50-59 > 60 Total Median age
中西區 數目 No. 17 700 27 800 31 700 26 600 14 600 19 800 138 200 36Central & Western 百分比 % 12.8 20.1 23.0 19.3 10.5 14.3 100.0
灣仔 數目 No. 9 800 19 000 19 800 17 400 9 900 14 600 90 300 38Wan Chai 百分比 % 10.8 21.0 21.9 19.3 10.9 16.1 100.0
東區 數目 No. 44 400 64 700 65 000 59 300 35 000 53 700 322 200 37Eastern 百分比 % 13.8 20.1 20.2 18.4 10.9 16.7 100.0
南區 數目 No. 21 700 30 900 30 700 27 300 13 900 21 900 146 400 36Southern 百分比 % 14.8 21.1 21.0 18.6 9.5 15.0 100.0
油尖旺 數目 No. 19 200 29 400 26 700 24 900 15 700 24 600 140 400 38Yau Tsim Mong 百分比 % 13.6 20.9 19.0 17.7 11.2 17.5 100.0
深水 數目 No. 24 800 33 300 33 000 31 300 17 800 35 600 175 900 38Sham Shui Po 百分比 % 14.1 19.0 18.8 17.8 10.1 20.2 100.0
九龍城 數目 No. 27 300 40 300 40 700 34 000 22 000 35 200 199 600 37Kowloon City 百分比 % 13.7 20.2 20.4 17.1 11.0 17.6 100.0
黃大仙 數目 No. 33 200 44 700 42 500 36 400 20 300 46 700 223 700 38Wong Tai Sin 百分比 % 14.9 20.0 19.0 16.2 9.1 20.9 100.0
觀塘 數目 No. 40 200 58 100 53 100 47 000 28 900 55 600 282 900 38Kwun Tong 百分比 % 14.2 20.5 18.8 16.6 10.2 19.7 100.0
葵青 數目 No. 34 900 54 500 43 700 39 300 26 700 37 900 236 800 36Kwai Tsing 百分比 % 14.7 23.0 18.4 16.6 11.3 16.0 100.0
荃灣 數目 No. 21 800 30 600 30 600 23 600 13 500 19 300 139 300 35Tsuen Wan 百分比 % 15.6 22.0 21.9 16.9 9.7 13.8 100.0
屯門 數目 No. 44 700 60 200 48 700 48 400 20 100 23 000 245 000 33Tuen Mun 百分比 % 18.3 24.6 19.9 19.7 8.2 9.4 100.0
元朗 數目 No. 45 400 53 600 50 800 38 800 15 500 26 600 230 700 33Yuen Long 百分比 % 19.7 23.2 22.0 16.8 6.7 11.5 100.0
北區 數目 No. 29 400 33 200 32 900 27 100 9 700 17 900 150 200 34North 百分比 % 19.6 22.1 21.9 18.1 6.4 11.9 100.0
大埔 數目 No. 28 300 35 900 32 100 31 900 11 900 17 300 157 300 35Tai Po 百分比 % 18.0 22.8 20.4 20.3 7.6 11.0 100.0
沙田 數目 No. 48 800 76 600 63 100 62 400 31 000 39 100 321 000 35Sha Tin 百分比 % 15.2 23.9 19.7 19.4 9.7 12.2 100.0
西貢 數目 No. 30 200 38 900 40 300 29 600 13 800 17 100 169 900 33Sai Kung 百分比 % 17.7 22.9 23.7 17.4 8.1 10.1 100.0
離島 數目 No. 7 500 10 200 11 400 7 600 3 500 6 300 46 600 34Islands 百分比 % 16.1 22.0 24.5 16.3 7.5 13.6 100.0
合計 數目 No. 529 200 741 900 696 800 613 000 323 800 512 000 3 416 700 36Overall 百分比 % 15.5 21.7 20.4 17.9 9.5 15.0 100.0
- 18 -

表 6A 按區議會分區、性別及教育程度劃分的人口數目Table 6A Population by District Council District, Sex and
Educational Attainment男女合計/教育程度
Both sexes/Educational attainment未受教育/ 專上教育
區議會分區 幼稚園 中學/預科 TertiaryDistrict No schooling/ 小學 Secondary/ 非學位課程 學位課程 總計Council district Kindergarten Primary Matriculation Non-degree Degree Total
中西區 數目 No. 28 500 50 900 106 400 18 000 56 100 259 800Central & Western 百分比 % 11.0 19.6 40.9 6.9 21.6 100.0
灣仔 數目 No. 15 300 25 600 75 100 8 000 41 100 165 100Wan Chai 百分比 % 9.3 15.5 45.5 4.8 24.9 100.0
東區 數目 No. 73 400 129 400 290 200 34 700 85 300 613 100Eastern 百分比 % 12.0 21.1 47.3 5.7 13.9 100.0
南區 數目 No. 42 700 68 000 114 500 16 300 38 700 280 200Southern 百分比 % 15.3 24.3 40.9 5.8 13.8 100.0
油尖旺 數目 No. 30 400 74 000 125 200 17 700 34 400 281 800Yau Tsim Mong 百分比 % 10.8 26.3 44.4 6.3 12.2 100.0
深水 數目 No. 42 900 103 800 154 000 19 200 28 400 348 300Sham Shui Po 百分比 % 12.3 29.8 44.2 5.5 8.2 100.0
九龍城 數目 No. 43 900 84 500 171 500 26 200 52 700 378 800Kowloon City 百分比 % 11.6 22.3 45.3 6.9 13.9 100.0
黃大仙 數目 No. 62 400 135 800 201 300 20 400 23 900 444 000Wong Tai Sin 百分比 % 14.1 30.6 45.3 4.6 5.4 100.0
觀塘 數目 No. 75 100 162 700 250 300 29 900 44 600 562 600Kwun Tong 百分比 % 13.3 28.9 44.5 5.3 7.9 100.0
葵青 數目 No. 59 700 136 500 220 700 26 300 33 700 476 900Kwai Tsing 百分比 % 12.5 28.6 46.3 5.5 7.1 100.0
荃灣 數目 No. 32 300 66 700 128 700 17 200 26 500 271 500Tsuen Wan 百分比 % 11.9 24.6 47.4 6.3 9.8 100.0
屯門 數目 No. 56 400 140 000 240 100 25 000 28 100 489 600Tuen Mun 百分比 % 11.5 28.6 49.0 5.1 5.7 100.0
元朗 數目 No. 57 700 124 800 225 000 19 200 30 500 457 100Yuen Long 百分比 % 12.6 27.3 49.2 4.2 6.7 100.0
北區 數目 No. 35 400 86 300 142 200 13 900 18 900 296 700North 百分比 % 11.9 29.1 47.9 4.7 6.4 100.0
大埔 數目 No. 34 600 84 800 144 900 15 900 27 600 307 800Tai Po 百分比 % 11.2 27.6 47.1 5.2 9.0 100.0
沙田 數目 No. 67 200 156 900 296 700 39 900 62 700 623 400Sha Tin 百分比 % 10.8 25.2 47.6 6.4 10.1 100.0
西貢 數目 No. 38 600 81 300 154 700 23 800 32 800 331 200Sai Kung 百分比 % 11.7 24.5 46.7 7.2 9.9 100.0
離島 數目 No. 17 200 23 200 35 000 4 300 11 400 91 200Islands 百分比 % 18.8 25.4 38.4 4.8 12.6 100.0
合計 數目 No. 813 700 1 735 400 3 076 700 376 000 677 500 6 679 200Overall 百分比 % 12.2 26.0 46.1 5.6 10.1 100.0
- 19 -

表 6A (續) 按區議會分區、性別及教育程度劃分的人口數目Table 6A (Cont'd) Population by District Council District, Sex and
Educational Attainment男性/教育程度
Male/Educational attainment未受教育/ 專上教育
區議會分區 幼稚園 中學/預科 TertiaryDistrict No schooling/ 小學 Secondary/ 非學位課程 學位課程 總計Council district Kindergarten Primary Matriculation Non-degree Degree Total
中西區 數目 No. 10 000 24 100 48 700 7 500 31 300 121 700Central & Western 百分比 % 8.2 19.8 40.0 6.2 25.7 100.0
灣仔 數目 No. 5 500 11 700 31 600 3 200 22 800 74 800Wan Chai 百分比 % 7.4 15.6 42.2 4.3 30.5 100.0
東區 數目 No. 27 400 61 200 137 600 15 800 48 900 290 900Eastern 百分比 % 9.4 21.0 47.3 5.4 16.8 100.0
南區 數目 No. 17 000 34 100 54 400 7 300 21 100 133 800Southern 百分比 % 12.7 25.5 40.6 5.5 15.7 100.0
油尖旺 數目 No. 12 600 36 600 63 500 8 900 19 700 141 300Yau Tsim Mong 百分比 % 8.9 25.9 44.9 6.3 13.9 100.0
深水 數目 No. 14 200 53 500 80 900 8 700 15 200 172 500Sham Shui Po 百分比 % 8.2 31.0 46.9 5.1 8.8 100.0
九龍城 數目 No. 16 100 38 600 82 400 13 000 29 000 179 200Kowloon City 百分比 % 9.0 21.6 46.0 7.3 16.2 100.0
黃大仙 數目 No. 20 900 69 100 106 300 11 400 12 400 220 300Wong Tai Sin 百分比 % 9.5 31.4 48.3 5.2 5.6 100.0
觀塘 數目 No. 26 600 82 900 130 200 15 000 25 000 279 700Kwun Tong 百分比 % 9.5 29.7 46.5 5.4 8.9 100.0
葵青 數目 No. 22 400 68 500 117 100 13 000 19 000 240 000Kwai Tsing 百分比 % 9.3 28.5 48.8 5.4 7.9 100.0
荃灣 數目 No. 12 600 32 100 63 200 9 800 14 400 132 100Tsuen Wan 百分比 % 9.6 24.3 47.8 7.4 10.9 100.0
屯門 數目 No. 23 100 68 300 125 000 13 000 15 300 244 600Tuen Mun 百分比 % 9.4 27.9 51.1 5.3 6.2 100.0
元朗 數目 No. 23 200 62 200 115 100 9 400 16 600 226 400Yuen Long 百分比 % 10.2 27.5 50.8 4.2 7.3 100.0
北區 數目 No. 13 900 42 400 71 800 7 300 11 000 146 500North 百分比 % 9.5 28.9 49.0 5.0 7.5 100.0
大埔 數目 No. 13 100 42 000 73 600 7 600 14 200 150 500Tai Po 百分比 % 8.7 27.9 48.9 5.0 9.4 100.0
沙田 數目 No. 26 000 75 000 148 500 17 300 35 600 302 400Sha Tin 百分比 % 8.6 24.8 49.1 5.7 11.8 100.0
西貢 數目 No. 15 200 38 800 76 600 11 800 19 000 161 300Sai Kung 百分比 % 9.4 24.0 47.5 7.3 11.8 100.0
離島 數目 No. 7 300 12 100 16 600 2 100 6 400 44 600Islands 百分比 % 16.4 27.2 37.3 4.6 14.4 100.0
合計 數目 No. 307 100 853 200 1 543 000 182 300 376 900 3 262 500Overall 百分比 % 9.4 26.2 47.3 5.6 11.6 100.0
- 20 -

表 6A (續) 按區議會分區、性別及教育程度劃分的人口數目Table 6A (Cont'd) Population by District Council District, Sex and
Educational Attainment女性/教育程度
Female/Educational attainment未受教育/ 專上教育
區議會分區 幼稚園 中學/預科 TertiaryDistrict No schooling/ 小學 Secondary/ 非學位課程 學位課程 總計Council district Kindergarten Primary Matriculation Non-degree Degree Total
中西區 數目 No. 18 500 26 800 57 700 10 500 24 700 138 200Central & Western 百分比 % 13.4 19.4 41.7 7.6 17.9 100.0
灣仔 數目 No. 9 700 13 900 43 500 4 800 18 400 90 300Wan Chai 百分比 % 10.8 15.4 48.2 5.3 20.3 100.0
東區 數目 No. 45 900 68 300 152 600 19 000 36 400 322 200Eastern 百分比 % 14.3 21.2 47.4 5.9 11.3 100.0
南區 數目 No. 25 700 33 900 60 200 9 000 17 600 146 400Southern 百分比 % 17.6 23.2 41.1 6.1 12.0 100.0
油尖旺 數目 No. 17 900 37 300 61 700 8 800 14 700 140 400Yau Tsim Mong 百分比 % 12.7 26.6 44.0 6.3 10.5 100.0
深水 數目 No. 28 700 50 300 73 100 10 500 13 300 175 900Sham Shui Po 百分比 % 16.3 28.6 41.6 6.0 7.6 100.0
九龍城 數目 No. 27 800 45 900 89 100 13 200 23 600 199 600Kowloon City 百分比 % 13.9 23.0 44.6 6.6 11.8 100.0
黃大仙 數目 No. 41 500 66 700 95 000 9 000 11 500 223 700Wong Tai Sin 百分比 % 18.6 29.8 42.5 4.0 5.1 100.0
觀塘 數目 No. 48 500 79 800 120 100 14 800 19 600 282 900Kwun Tong 百分比 % 17.1 28.2 42.5 5.2 6.9 100.0
葵青 數目 No. 37 300 68 000 103 600 13 300 14 700 236 800Kwai Tsing 百分比 % 15.8 28.7 43.7 5.6 6.2 100.0
荃灣 數目 No. 19 700 34 600 65 600 7 400 12 100 139 300Tsuen Wan 百分比 % 14.2 24.8 47.1 5.3 8.7 100.0
屯門 數目 No. 33 300 71 800 115 100 12 000 12 800 245 000Tuen Mun 百分比 % 13.6 29.3 47.0 4.9 5.2 100.0
元朗 數目 No. 34 500 62 500 109 900 9 800 13 900 230 700Yuen Long 百分比 % 14.9 27.1 47.6 4.2 6.0 100.0
北區 數目 No. 21 500 43 900 70 300 6 500 7 900 150 200North 百分比 % 14.3 29.2 46.8 4.4 5.3 100.0
大埔 數目 No. 21 500 42 900 71 300 8 300 13 400 157 300Tai Po 百分比 % 13.7 27.2 45.3 5.3 8.5 100.0
沙田 數目 No. 41 200 81 900 148 200 22 500 27 100 321 000Sha Tin 百分比 % 12.8 25.5 46.2 7.0 8.4 100.0
西貢 數目 No. 23 500 42 500 78 100 12 000 13 800 169 900Sai Kung 百分比 % 13.8 25.0 46.0 7.1 8.1 100.0
離島 數目 No. 9 900 11 100 18 400 2 300 5 000 46 600Islands 百分比 % 21.1 23.8 39.5 4.9 10.8 100.0
合計 數目 No. 506 600 882 100 1533 700 193 700 300 600 3 416 700Overall 百分比 % 14.8 25.8 44.9 5.7 8.8 100.0
- 21 -

表 6B 按區議會分區及年齡劃分的具中學及以上教育程度人士
所佔百分比
Table 6B Percentage of Persons with Secondary Education and Above by District Council District and Age
年齡組別
Age group區議會分區 合計District 15-19 20-29 30-39 40-49 50-59 > 60 OverallCouncil district (%) (%) (%) (%) (%) (%) (%)
中西區 99.1 97.0 94.5 83.7 69.1 30.4 78.5Central & Western
灣仔 99.0 97.7 96.4 92.6 78.0 44.6 83.4Wan Chai
東區 99.4 96.6 92.1 79.9 66.6 31.1 75.5Eastern
南區 98.9 95.2 88.1 67.2 51.6 15.5 68.3Southern
油尖旺 97.0 97.5 91.3 72.4 55.5 30.5 70.9Yau Tsim Mong
深水 99.0 96.5 88.0 66.7 51.2 21.8 65.1Sham Shui Po
九龍城 99.6 96.8 93.8 77.6 61.5 35.6 74.8Kowloon City
黃大仙 98.0 97.3 90.1 64.8 39.7 10.1 62.6Wong Tai Sin
觀塘 98.4 97.8 90.9 66.2 46.1 15.9 65.3Kwun Tong
葵青 99.3 98.1 89.9 61.2 41.0 17.7 66.3Kwai Tsing
荃灣 98.1 97.1 92.0 75.6 54.8 21.1 73.6Tsuen Wan
屯門 98.4 96.3 85.5 61.0 42.2 16.0 69.9Tuen Mun
元朗 98.8 97.3 88.0 62.3 52.0 21.9 72.2Yuen Long
北區 99.1 97.0 89.8 59.4 49.5 14.7 70.0North
大埔 99.7 98.0 86.6 63.4 47.7 18.5 70.8Tai Po
沙田 98.9 97.3 91.9 70.1 50.7 18.3 72.8Sha Tin
西貢 98.2 97.9 89.2 69.6 51.2 24.7 75.3Sai Kung
離島 93.2 82.1 84.7 65.4 35.4 16.3 65.0Islands
合計 98.7 96.9 90.2 69.2 52.5 22.0 70.8Overall
- 22 -

表 7 按區議會分區、性別及婚姻狀況劃分的十五歲及以上人口數目
Table 7 Population Aged 15 and Over by District Council District,Sex and Marital Status
男女合計/婚姻狀況Both sexes/Marital status
區議會分區 從未結婚 已婚 離婚/分居District Never Currently 喪偶 Divorced/ 總計Council district married married Widowed Separated Total
中西區 數目 No. 71 400 133 300 13 100 5 000 222 900Central & Western 百分比 % 32.1 59.8 5.9 2.2 100.0
灣仔 數目 No. 47 800 85 900 8 100 3 500 145 300Wan Chai 百分比 % 32.9 59.1 5.6 2.4 100.0
東區 數目 No. 158 100 317 000 34 100 12 300 521 400Eastern 百分比 % 30.3 60.8 6.5 2.4 100.0
南區 數目 No. 78 600 139 000 14 600 3 200 235 400Southern 百分比 % 33.4 59.1 6.2 1.4 100.0
油尖旺 數目 No. 73 500 145 000 15 800 7 300 241 600Yau Tsim Mong 百分比 % 30.4 60.0 6.6 3.0 100.0
深水 數目 No. 89 100 172 500 25 300 9 900 296 900Sham Shui Po 百分比 % 30.0 58.1 8.5 3.3 100.0
九龍城 數目 No. 101 000 192 700 21 600 6 600 321 900Kowloon City 百分比 % 31.4 59.9 6.7 2.0 100.0
黃大仙 數目 No. 126 900 210 300 31 300 6 300 374 800Wong Tai Sin 百分比 % 33.9 56.1 8.4 1.7 100.0
觀塘 數目 No. 157 500 276 000 35 000 11 400 479 900Kwun Tong 百分比 % 32.8 57.5 7.3 2.4 100.0
葵青 數目 No. 136 700 231 900 27 100 8 600 404 300Kwai Tsing 百分比 % 33.8 57.4 6.7 2.1 100.0
荃灣 數目 No. 72 500 137 700 12 100 4 100 226 500Tsuen Wan 百分比 % 32.0 60.8 5.3 1.8 100.0
屯門 數目 No. 125 000 245 700 17 000 9 600 397 300Tuen Mun 百分比 % 31.5 61.8 4.3 2.4 100.0
元朗 數目 No. 106 900 229 200 17 500 10 000 363 600Yuen Long 百分比 % 29.4 63.0 4.8 2.8 100.0
北區 數目 No. 71 200 145 100 12 700 7 300 236 200North 百分比 % 30.1 61.4 5.4 3.1 100.0
大埔 數目 No. 80 600 148 500 13 500 6 400 248 900Tai Po 百分比 % 32.4 59.7 5.4 2.6 100.0
沙田 數目 No. 177 800 302 700 28 000 13 400 521 900Sha Tin 百分比 % 34.1 58.0 5.4 2.6 100.0
西貢 數目 No. 79 700 171 800 12 500 4 900 268 900Sai Kung 百分比 % 29.6 63.9 4.6 1.8 100.0
離島 數目 No. 26 000 43 800 4 200 1 400 * 75 400Islands 百分比 % 34.5 58.1 5.6 1.8 100.0
合計 數目 No. 1 780 400 3 328 200 343 300 131 100 5 583 000Overall 百分比 % 31.9 59.6 6.1 2.3 100.0
註釋 : * 此估計的精確程度較低 (離中系數超過 20%),因此須謹慎闡釋。Note : * Denotes an estimate with relatively low precision (coefficient of variation having a
value greater than 20%) which should thus be interpreted with caution.- 23 -

表 7 (續) 按區議會分區、性別及婚姻狀況劃分的十五歲及以上人口數目
Table 7 (Cont'd) Population Aged 15 and Over by District Council District,Sex and Marital Status
男性/婚姻狀況Male/Marital status
區議會分區 從未結婚 已婚 離婚/分居District Never Currently 喪偶 Divorced/ 總計Council district married married Widowed Separated Total
中西區 數目 No. 32 800 65 300 2 900 1 400 * 102 400Central & Western 百分比 % 32.1 63.7 2.8 1.4 100.0
灣仔 數目 No. 20 500 41 800 1 400 * 1 000 * 64 700Wan Chai 百分比 % 31.6 64.6 2.1 1.6 100.0
東區 數目 No. 77 400 156 300 5 400 4 500 243 600Eastern 百分比 % 31.8 64.2 2.2 1.9 100.0
南區 數目 No. 39 500 67 300 2 500 1 300 * 110 700Southern 百分比 % 35.7 60.9 2.3 1.2 100.0
油尖旺 數目 No. 39 500 74 800 3 300 2 700 120 300Yau Tsim Mong 百分比 % 32.8 62.1 2.7 2.3 100.0
深水 數目 No. 46 400 90 500 4 500 4 400 145 800Sham Shui Po 百分比 % 31.8 62.1 3.1 3.0 100.0
九龍城 數目 No. 49 000 94 800 3 400 2 400 149 600Kowloon City 百分比 % 32.7 63.4 2.3 1.6 100.0
黃大仙 數目 No. 68 900 107 100 6 000 2 400 184 300Wong Tai Sin 百分比 % 37.4 58.1 3.2 1.3 100.0
觀塘 數目 No. 85 800 140 100 6 900 4 500 237 200Kwun Tong 百分比 % 36.2 59.1 2.9 1.9 100.0
葵青 數目 No. 74 100 119 400 5 900 2 900 202 300Kwai Tsing 百分比 % 36.6 59.0 2.9 1.4 100.0
荃灣 數目 No. 36 900 68 600 2 200 1 200 * 108 900Tsuen Wan 百分比 % 33.9 63.0 2.0 1.1 100.0
屯門 數目 No. 66 400 125 100 2 500 3 000 197 000Tuen Mun 百分比 % 33.7 63.5 1.3 1.5 100.0
元朗 數目 No. 55 600 116 100 3 200 3 500 178 400Yuen Long 百分比 % 31.2 65.1 1.8 2.0 100.0
北區 數目 No. 36 400 73 600 2 400 3 100 115 400North 百分比 % 31.5 63.8 2.0 2.7 100.0
大埔 數目 No. 41 000 74 500 2 500 1 800 * 119 900Tai Po 百分比 % 34.2 62.2 2.1 1.5 100.0
沙田 數目 No. 90 600 149 600 4 800 4 700 249 700Sha Tin 百分比 % 36.3 59.9 1.9 1.9 100.0
西貢 數目 No. 41 800 83 600 1 900 1 900 129 100Sai Kung 百分比 % 32.4 64.7 1.5 1.4 100.0
離島 數目 No. 13 900 21 000 800 * 500 * 36 300Islands 百分比 % 38.4 57.8 2.3 1.5 100.0
合計 數目 No. 916 300 1 669 600 62 400 47 300 2 695 500Overall 百分比 % 34.0 61.9 2.3 1.8 100.0
註釋 : * 此估計的精確程度較低 (離中系數超過 20%),因此須謹慎闡釋。
Note : * Denotes an estimate with relatively low precision (coefficient of variation having avalue greater than 20%) which should thus be interpreted with caution.
- 24 -

表 7 (續) 按區議會分區、性別及婚姻狀況劃分的十五歲及以上人口數目
Table 7 (Cont'd) Population Aged 15 and Over by District Council District,Sex and Marital Status
女性/婚姻狀況Female/Marital status
區議會分區 從未結婚 已婚 離婚/分居District Never Currently 喪偶 Divorced/ 總計Council district married married Widowed Separated Total
中西區 數目 No. 38 600 68 100 10 300 3 600 120 500Central & Western 百分比 % 32.1 56.5 8.5 3.0 100.0
灣仔 數目 No. 27 400 44 100 6 700 2 400 80 600Wan Chai 百分比 % 34.0 54.7 8.3 3.0 100.0
東區 數目 No. 80 700 160 700 28 700 7 700 277 800Eastern 百分比 % 29.1 57.8 10.3 2.8 100.0
南區 數目 No. 39 200 71 600 12 000 1 900 124 700Southern 百分比 % 31.4 57.5 9.6 1.5 100.0
油尖旺 數目 No. 33 900 70 300 12 500 4 500 121 300Yau Tsim Mong 百分比 % 28.0 58.0 10.3 3.7 100.0
深水 數目 No. 42 700 82 000 20 800 5 500 151 000Sham Shui Po 百分比 % 28.3 54.3 13.7 3.7 100.0
九龍城 數目 No. 52 000 97 900 18 200 4 200 172 300Kowloon City 百分比 % 30.2 56.8 10.6 2.4 100.0
黃大仙 數目 No. 58 000 103 200 25 400 3 900 190 500Wong Tai Sin 百分比 % 30.5 54.2 13.3 2.1 100.0
觀塘 數目 No. 71 700 135 900 28 100 6 900 242 700Kwun Tong 百分比 % 29.5 56.0 11.6 2.9 100.0
葵青 數目 No. 62 600 112 500 21 100 5 800 202 000Kwai Tsing 百分比 % 31.0 55.7 10.5 2.9 100.0
荃灣 數目 No. 35 600 69 100 9 900 2 900 117 500Tsuen Wan 百分比 % 30.3 58.8 8.4 2.5 100.0
屯門 數目 No. 58 600 120 600 14 500 6 600 200 300Tuen Mun 百分比 % 29.3 60.2 7.2 3.3 100.0
元朗 數目 No. 51 300 113 100 14 300 6 500 185 300Yuen Long 百分比 % 27.7 61.1 7.7 3.5 100.0
北區 數目 No. 34 900 71 500 10 300 4 200 120 800North 百分比 % 28.9 59.2 8.5 3.5 100.0
大埔 數目 No. 39 600 74 000 11 000 4 500 129 100Tai Po 百分比 % 30.7 57.3 8.5 3.5 100.0
沙田 數目 No. 87 200 153 100 23 300 8 700 272 200Sha Tin 百分比 % 32.0 56.2 8.5 3.2 100.0
西貢 數目 No. 37 900 88 200 10 600 3 100 139 800Sai Kung 百分比 % 27.1 63.1 7.6 2.2 100.0
離島 數目 No. 12 100 22 800 3 400 800 * 39 100Islands 百分比 % 30.9 58.3 8.7 2.1 100.0
合計 數目 No. 864 100 1 658 600 281 000 83 800 2 887 500Overall 百分比 % 29.9 57.4 9.7 2.9 100.0
註釋 : * 此估計的精確程度較低 (離中系數超過 20%),因此須謹慎闡釋。
Note : * Denotes an estimate with relatively low precision (coefficient of variation having avalue greater than 20%) which should thus be interpreted with caution.
- 25 -
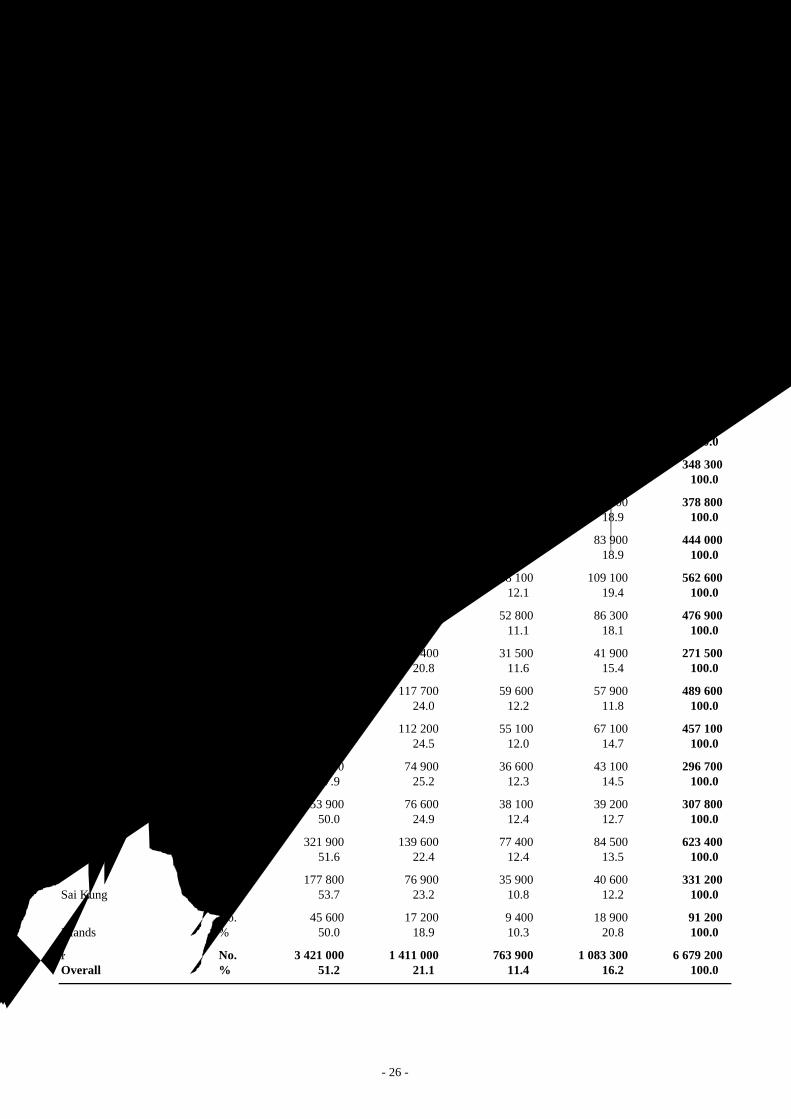
表 8 按區議會分區及經濟活動身分劃分的人口數目Table 8 Population by District Council District and Economic Activity Status
非從事經濟活動 Economically inactive
全日制課程區議會分區 從事經濟活動 學生District Economically Full-time 料理家務者 其他 總計Council district active students Home-makers Others Total
中西區 數目 No. 147 700 46 800 24 600 40 800 259 800Central & Western 百分比 % 56.8 18.0 9.5 15.7 100.0
灣仔 數目 No. 94 900 27 200 16 500 26 500 165 100Wan Chai 百分比 % 57.5 16.5 10.0 16.1 100.0
東區 數目 No. 332 500 118 500 59 600 102 500 613 100Eastern 百分比 % 54.2 19.3 9.7 16.7 100.0
南區 數目 No. 147 800 57 700 28 600 46 200 280 200Southern 百分比 % 52.7 20.6 10.2 16.5 100.0
油尖旺 數目 No. 146 500 51 300 31 800 52 100 281 800Yau Tsim Mong 百分比 % 52.0 18.2 11.3 18.5 100.0
深水 數目 No. 171 800 68 000 37 500 71 100 348 300Sham Shui Po 百分比 % 49.3 19.5 10.8 20.4 100.0
九龍城 數目 No. 190 000 74 500 42 800 71 500 378 800Kowloon City 百分比 % 50.2 19.7 11.3 18.9 100.0
黃大仙 數目 No. 211 400 90 800 57 900 83 900 444 000Wong Tai Sin 百分比 % 47.6 20.5 13.0 18.9 100.0
觀塘 數目 No. 278 000 107 400 68 100 109 100 562 600Kwun Tong 百分比 % 49.4 19.1 12.1 19.4 100.0
葵青 數目 No. 240 400 97 300 52 800 86 300 476 900Kwai Tsing 百分比 % 50.4 20.4 11.1 18.1 100.0
荃灣 數目 No. 141 700 56 400 31 500 41 900 271 500Tsuen Wan 百分比 % 52.2 20.8 11.6 15.4 100.0
屯門 數目 No. 254 400 117 700 59 600 57 900 489 600Tuen Mun 百分比 % 52.0 24.0 12.2 11.8 100.0
元朗 數目 No. 222 700 112 200 55 100 67 100 457 100Yuen Long 百分比 % 48.7 24.5 12.0 14.7 100.0
北區 數目 No. 142 100 74 900 36 600 43 100 296 700North 百分比 % 47.9 25.2 12.3 14.5 100.0
大埔 數目 No. 153 900 76 600 38 100 39 200 307 800Tai Po 百分比 % 50.0 24.9 12.4 12.7 100.0
沙田 數目 No. 321 900 139 600 77 400 84 500 623 400Sha Tin 百分比 % 51.6 22.4 12.4 13.5 100.0
西貢 數目 No. 177 800 76 900 35 900 40 600 331 200Sai Kung 百分比 % 53.7 23.2 10.8 12.2 100.0
離島 數目 No. 45 600 17 200 9 400 18 900 91 200Islands 百分比 % 50.0 18.9 10.3 20.8 100.0
合計 數目 No. 3 421 000 1 411 000 763 900 1 083 300 6 679 200Overall 百分比 % 51.2 21.1 11.4 16.2 100.0
經濟活動身分 Economic activity status
- 26 -

表 9 按區議會分區、性別及年齡劃分的勞動人口數目Table 9 Labour Force by District Council District, Sex and Age
男女合計/年齡組別Both sexes/Age group
區議會分區 年齡District 總計 中位數Council district 15-19 20-29 30-39 40-49 50-59 > 60 Total Median age
中西區 數目 No. 1 600 * 31 700 46 100 39 800 22 000 6 500 147 700 38Central & Western 百分比 % 1.1 21.4 31.2 27.0 14.9 4.4 100.0
灣仔 數目 No. 300 * 19 900 28 800 27 100 14 500 4 300 94 900 39Wan Chai 百分比 % 0.3 20.9 30.3 28.6 15.3 4.5 100.0
東區 數目 No. 4 700 71 600 100 000 94 400 48 500 13 200 332 500 38Eastern 百分比 % 1.4 21.5 30.1 28.4 14.6 4.0 100.0
南區 數目 No. 2 600 33 600 47 400 41 000 18 500 4 700 147 800 38Southern 百分比 % 1.8 22.7 32.0 27.7 12.5 3.2 100.0
油尖旺 數目 No. 1 800 * 34 300 41 200 37 700 23 400 8 200 146 500 38Yau Tsim Mong 百分比 % 1.2 23.4 28.1 25.7 16.0 5.6 100.0
深水 數目 No. 3 000 36 200 47 900 50 600 25 900 8 100 171 800 39Sham Shui Po 百分比 % 1.7 21.1 27.9 29.5 15.1 4.7 100.0
九龍城 數目 No. 2 300 43 000 58 600 50 300 27 200 8 600 190 000 38Kowloon City 百分比 % 1.2 22.6 30.9 26.5 14.3 4.5 100.0
黃大仙 數目 No. 3 600 50 500 68 700 57 400 24 700 6 400 211 400 37Wong Tai Sin 百分比 % 1.7 23.9 32.5 27.1 11.7 3.0 100.0
觀塘 數目 No. 5 500 67 900 83 800 70 600 38 600 11 500 278 000 37Kwun Tong 百分比 % 2.0 24.4 30.2 25.4 13.9 4.1 100.0
葵青 數目 No. 5 700 64 000 70 900 58 200 32 800 8 700 240 400 37Kwai Tsing 百分比 % 2.4 26.6 29.5 24.2 13.7 3.6 100.0
荃灣 數目 No. 1 800 * 34 900 47 800 36 900 16 600 3 700 141 700 37Tsuen Wan 百分比 % 1.3 24.6 33.7 26.0 11.7 2.6 100.0
屯門 數目 No. 7 600 67 400 69 500 71 700 31 700 6 500 254 400 37Tuen Mun 百分比 % 3.0 26.5 27.3 28.2 12.5 2.6 100.0
元朗 數目 No. 7 000 57 200 71 000 59 800 22 700 5 000 222 700 36Yuen Long 百分比 % 3.2 25.7 31.9 26.8 10.2 2.2 100.0
北區 數目 No. 3 300 32 400 46 200 41 400 14 900 4 000 142 100 37North 百分比 % 2.3 22.8 32.5 29.2 10.5 2.8 100.0
大埔 數目 No. 4 800 36 400 44 400 46 500 18 100 3 800 153 900 38Tai Po 百分比 % 3.1 23.6 28.9 30.2 11.8 2.4 100.0
沙田 數目 No. 8 100 82 700 91 300 88 200 43 700 7 900 321 900 37Sha Tin 百分比 % 2.5 25.7 28.4 27.4 13.6 2.5 100.0
西貢 數目 No. 3 800 42 500 60 900 47 400 19 200 4 000 177 800 36Sai Kung 百分比 % 2.1 23.9 34.3 26.7 10.8 2.2 100.0
離島 數目 No. 600 * 9 100 17 000 11 800 5 100 2 000 45 600 37Islands 百分比 % 1.4 20.0 37.2 25.9 11.2 4.4 100.0
合計 數目 No. 68 300 815 200 1 041 400 930 800 448 300 117 000 3 421 000 37Overall 百分比 % 2.0 23.8 30.4 27.2 13.1 3.4 100.0
註釋 : * 此估計的精確程度較低 (離中系數超過 20%),因此須謹慎闡釋。
Note : * Denotes an estimate with relatively low precision (coefficient of variation having avalue greater than 20%) which should thus be interpreted with caution.
- 27 -
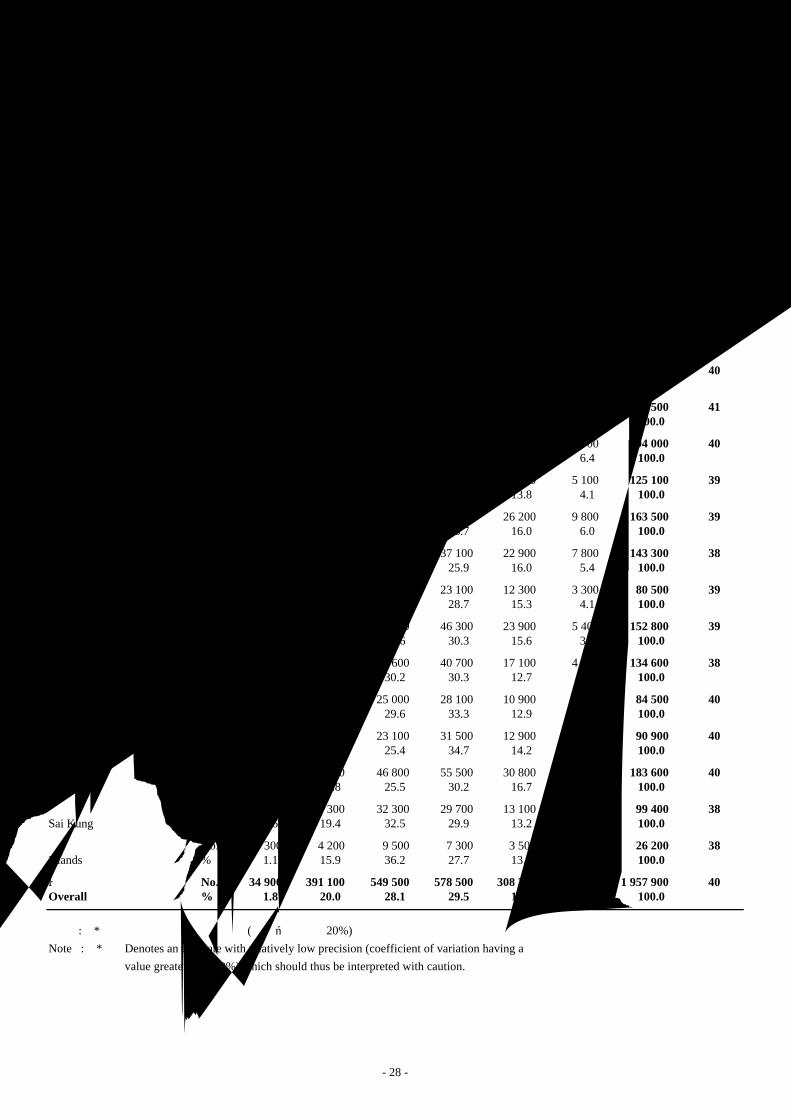
表 9 (續) 按區議會分區、性別及年齡劃分的勞動人口數目Table 9 (Cont'd) Labour Force by District Council District, Sex and Age
男性/年齡組別Male/Age group
區議會分區 年齡District 總計 中位數Council district 15-19 20-29 30-39 40-49 50-59 > 60 Total Median age
中西區 數目 No. 900 * 13 500 21 700 22 400 13 800 5 200 77 500 40Central & Western 百分比 % 1.2 17.3 27.9 28.9 17.9 6.7 100.0
灣仔 數目 No. - * 8 000 12 700 14 100 9 500 3 000 47 400 41Wan Chai 百分比 % - 17.0 26.9 29.8 20.0 6.3 100.0
東區 數目 No. 2 600 32 700 49 600 53 700 30 300 9 800 178 700 40Eastern 百分比 % 1.5 18.3 27.7 30.1 17.0 5.5 100.0
南區 數目 No. 1 400 * 15 700 22 900 24 200 12 100 3 900 80 200 40Southern 百分比 % 1.7 19.6 28.6 30.1 15.1 4.9 100.0
油尖旺 數目 No. 700 * 16 800 22 100 22 800 16 200 6 700 85 200 40Yau Tsim Mong 百分比 % 0.8 19.7 25.9 26.8 19.0 7.8 100.0
深水 數目 No. 1 800 * 17 700 25 600 31 300 17 400 6 700 100 500 41Sham Shui Po 百分比 % 1.8 17.6 25.5 31.2 17.3 6.7 100.0
九龍城 數目 No. 1 400 * 19 600 28 600 29 700 18 000 6 700 104 000 40Kowloon City 百分比 % 1.3 18.9 27.5 28.6 17.4 6.4 100.0
黃大仙 數目 No. 1 600 * 25 400 38 500 37 100 17 300 5 100 125 100 39Wong Tai Sin 百分比 % 1.3 20.3 30.8 29.7 13.8 4.1 100.0
觀塘 數目 No. 2 600 34 500 46 700 43 600 26 200 9 800 163 500 39Kwun Tong 百分比 % 1.6 21.1 28.6 26.7 16.0 6.0 100.0
葵青 數目 No. 3 000 32 600 39 900 37 100 22 900 7 800 143 300 38Kwai Tsing 百分比 % 2.1 22.8 27.8 25.9 16.0 5.4 100.0
荃灣 數目 No. 1 000 * 16 000 24 800 23 100 12 300 3 300 80 500 39Tsuen Wan 百分比 % 1.2 19.9 30.8 28.7 15.3 4.1 100.0
屯門 數目 No. 3 800 34 200 39 200 46 300 23 900 5 400 152 800 39Tuen Mun 百分比 % 2.5 22.4 25.6 30.3 15.6 3.5 100.0
元朗 數目 No. 3 900 28 000 40 600 40 700 17 100 4 100 134 600 38Yuen Long 百分比 % 2.9 20.8 30.2 30.3 12.7 3.1 100.0
北區 數目 No. 1 800 * 15 300 25 000 28 100 10 900 3 300 84 500 40North 百分比 % 2.2 18.1 29.6 33.3 12.9 3.9 100.0
大埔 數目 No. 2 500 17 700 23 100 31 500 12 900 3 200 90 900 40Tai Po 百分比 % 2.8 19.4 25.4 34.7 14.2 3.5 100.0
沙田 數目 No. 3 900 40 000 46 800 55 500 30 800 6 700 183 600 40Sha Tin 百分比 % 2.1 21.8 25.5 30.2 16.7 3.6 100.0
西貢 數目 No. 1 600 * 19 300 32 300 29 700 13 100 3 400 99 400 38Sai Kung 百分比 % 1.6 19.4 32.5 29.9 13.2 3.4 100.0
離島 數目 No. 300 * 4 200 9 500 7 300 3 500 1 500 * 26 200 38Islands 百分比 % 1.1 15.9 36.2 27.7 13.5 5.5 100.0
合計 數目 No. 34 900 391 100 549 500 578 500 308 300 95 600 1 957 900 40Overall 百分比 % 1.8 20.0 28.1 29.5 15.7 4.9 100.0
註釋 : * 此估計的精確程度較低 (離中系數超過 20%),因此須謹慎闡釋。
Note : * Denotes an estimate with relatively low precision (coefficient of variation having avalue greater than 20%) which should thus be interpreted with caution.
- 28 -

表 9 (續) 按區議會分區、性別及年齡劃分的勞動人口數目Table 9 (Cont'd) Labour Force by District Council District, Sex and Age
女性/年齡組別Female/Age group
區議會分區 年齡District 總計 中位數Council district 15-19 20-29 30-39 40-49 50-59 > 60 Total Median age
中西區 數目 No. 700 * 18 200 24 400 17 400 8 200 1 300 * 70 100 35Central & Western 百分比 % 1.0 26.0 34.8 24.8 11.6 1.8 100.0
灣仔 數目 No. 300 * 11 800 16 100 13 000 5 000 1 400 * 47 600 36Wan Chai 百分比 % 0.6 24.9 33.8 27.3 10.6 2.8 100.0
東區 數目 No. 2 100 38 900 50 400 40 700 18 200 3 400 153 700 36Eastern 百分比 % 1.4 25.3 32.8 26.5 11.8 2.2 100.0
南區 數目 No. 1 300 * 17 800 24 500 16 800 6 400 800 * 67 600 36Southern 百分比 % 1.9 26.4 36.2 24.9 9.5 1.2 100.0
油尖旺 數目 No. 1 100 * 17 500 19 100 14 900 7 200 1 500 * 61 300 35Yau Tsim Mong 百分比 % 1.8 28.6 31.1 24.3 11.8 2.4 100.0
深水 數目 No. 1 200 * 18 500 22 300 19 300 8 500 1 400 * 71 300 36Sham Shui Po 百分比 % 1.7 26.0 31.3 27.1 12.0 2.0 100.0
九龍城 數目 No. 900 * 23 400 30 000 20 600 9 200 1 900 86 000 35Kowloon City 百分比 % 1.1 27.2 34.9 23.9 10.7 2.2 100.0
黃大仙 數目 No. 2 000 25 100 30 200 20 200 7 400 1 300 * 86 200 35Wong Tai Sin 百分比 % 2.3 29.1 35.0 23.5 8.6 1.5 100.0
觀塘 數目 No. 2 800 33 400 37 100 27 000 12 400 1 600 * 114 500 35Kwun Tong 百分比 % 2.5 29.2 32.4 23.6 10.8 1.4 100.0
葵青 數目 No. 2 700 31 400 31 000 21 100 9 900 1 000 * 97 100 33Kwai Tsing 百分比 % 2.8 32.3 31.9 21.7 10.2 1.0 100.0
荃灣 數目 No. 800 * 18 900 23 000 13 800 4 300 400 * 61 200 34Tsuen Wan 百分比 % 1.3 30.8 37.6 22.6 7.1 0.6 100.0
屯門 數目 No. 3 800 33 200 30 400 25 300 7 800 1 100 * 101 600 34Tuen Mun 百分比 % 3.7 32.7 29.9 24.9 7.7 1.1 100.0
元朗 數目 No. 3 100 29 300 30 300 19 000 5 600 900 * 88 200 33Yuen Long 百分比 % 3.5 33.2 34.4 21.6 6.3 1.0 100.0
北區 數目 No. 1 500 * 17 000 21 200 13 300 4 000 700 * 57 600 34North 百分比 % 2.5 29.6 36.7 23.1 7.0 1.2 100.0
大埔 數目 No. 2 300 18 700 21 300 14 900 5 200 500 * 63 000 35Tai Po 百分比 % 3.6 29.7 33.9 23.7 8.2 0.8 100.0
沙田 數目 No. 4 200 42 700 44 500 32 700 13 000 1 200 * 138 300 35Sha Tin 百分比 % 3.1 30.9 32.2 23.6 9.4 0.9 100.0
西貢 數目 No. 2 300 23 300 28 600 17 700 6 100 600 * 78 400 33Sai Kung 百分比 % 2.9 29.6 36.4 22.6 7.7 0.7 100.0
離島 數目 No. 300 * 4 900 7 500 4 600 1 600 * 500 * 19 400 35Islands 百分比 % 1.7 25.4 38.6 23.4 8.1 2.8 100.0
合計 數目 No. 33 400 424 100 491 900 352 300 140 000 21 400 1 463 100 35Overall 百分比 % 2.3 29.0 33.6 24.1 9.6 1.5 100.0
註釋 : * 此估計的精確程度較低 (離中系數超過 20%),因此須謹慎闡釋。
Note : * Denotes an estimate with relatively low precision (coefficient of variation having avalue greater than 20%) which should thus be interpreted with caution.
- 29 -

- 30 -
附錄一
Appendix 1
按區議會分區劃分的年中人口估計數
字Mid-year Population Estimates by DistrictCouncil District
1. 政府統計處定期發布每年年中及年底的
全港人口估計數字,亦與跨部門的人口分布推
算小組,共同編製按區議會分區劃分的年中人
口估計數字。
1. Territorial mid-year and end-year populationestimates are released regularly by the Census andStatistics Department (C&SD). For each year,breakdown of the mid-year population estimate byDistrict Council (DC) district is also compiled jointlyby C&SD and an inter-departmental Working Groupon Population Distribution Projections (WGPD).
2. 自二零零零年八月開始,「居住人口」
方法已取代「廣義時點」方法以編製香港的人
口估計。政府統計處亦已根據最新的二零
零一年人口普查結果,更新一九九六年
年中起的香港人口估計數字。一篇題為
「香港人口估計的編製」的專題文章,
已於《香港統計月刊》二零零二年二月
號刊登。文章內刊載一九七一年至二零
零一年的更新人口數據系列及闡釋有關
人口估計的編製方法。該文章亦登載於政
府統計處的網站內(http://www.info.gov.hk/censtatd/chinese/whatsnew/new_pop_est/pop_fa_index.html)。
2. Since August 2000, the 'resident population'approach has been adopted in place of the 'extended defacto' approach for compiling population estimates ofHong Kong. With the availability of the latest 2001Population Census results, the population estimatessince mid-1996 have been updated. A featurearticle, entitled 'Compiling Population Estimates ofHong Kong', was published in the February 2002issue of the Hong Kong Monthly Digest of Statistics.The article contains the updated series of populationestimates, covering the period 1971 – 2001, and alsodetails of the compilation methodology of theestimates. The article is also available on the websiteof the C&SD (http://www.info.gov.hk/censtatd/eng/whatsnew/new_pop_est/pop_fa_index.html).
3. 按區議會分區劃分的二零零一年年中全
港人口估計數字載於本附錄的表A1。一九九六
年至二零零零年已根據二零零一年人口普查結
果而更新的相應數字亦載於表A1。
3. The territorial population estimates by DCdistrict as at mid-2001 are shown in Table A1 of thisAppendix. The corresponding figures for 1996 to2000 which have been updated with the availabilityof the 2001 Population Census results are also shownin Table A1.
4. 區議會分區人口估計數字,是根據每區
屋宇單位數量以及每個屋宇單位的平均人數編
製而成。前者是基於政府統計處所保存的屋宇
單位清單和各政府部門有關屋宇單位興建及拆
卸的最新資料,而後者則是基於綜合住戶統計
調查結果、最新人口普查/中期人口統計結果,
及行政紀錄得出來的。由於綜合住戶統計調查
的統計範圍並不包括一些公共機構/社團院舍的
住院人士,及水上人口,故不能從該統計調查
的結果得知這些人口組別的人數及其按區分
布。除水上人口外,上述人口組別的人口數目
及按區分布,乃基於行政記錄而估計。水上人
口數目,則基於過往趨勢而估計。
4. Population estimate in each DC district iscompiled by taking into account the number ofquarters (based on the frame of quarters maintainedby C&SD and up-to-date information from variousgovernment departments on new completion anddemolition) and the average number of persons perquarters (based on the results of the GeneralHousehold Survey (GHS), the latest PopulationCensus/By-census and administrative records) in eachdistrict. As inmates of some institutions and themarine population are not covered in the GHS, thesize of these groups of the population and theirdistribution by district cannot be estimated from theGHS results. Except for marine population, theabove groups of the population and their distributionby district are estimated from administrative records.The marine population is estimated based on pasttrends.

- 31 -
5. 表 A1 的總人口估計,與載於本報告書
內根據綜合住戶統計調查結果而編製的其他統
計表的總人口不同。這是由於後者是指陸上非
住院人口,故不包括一些公共機構/社團院舍的
住院人士,及水上人口。但在表 A1 的全港人口
估計數字,則已包括這些人口組別。
5. The total population in Table A1 is differentfrom that in the other tables in this report which arebased on results of the GHS. This is because thelatter refers to the land-based non-institutionalpopulation, thus excluding inmates of someinstitutions and the marine population. Thesegroups of the population, however, are covered in theterritorial population estimate in Table A1.
表 A1: 按區議會分區劃分的年中本港人口
Table A1 : Mid-year Population by District Council District數目(千人)No. ('000)
區議會分區 # District Council District # 1996* 1997* 1998* 1999* 2000* 2001
香港島 Hong Kong Island中西區 Central and Western 282.3 287.1 279.7 276.7 271.1 260.3灣仔 Wan Chai 191.8 191.0 193.2 191.8 185.1 165.4東區 Eastern 621.5 621.4 613.8 617.5 611.9 614.4南區 Southern 292.0 291.9 283.4 285.5 280.2 286.8小計 Sub-total 1 387.6 1 391.4 1 370.2 1 371.6 1 348.4 1 326.9
九龍 Kowloon油尖旺 Yau Tsim Mong 273.6 273.6 272.0 289.8 289.7 281.8深水 Sham Shui Po 376.4 372.0 364.4 364.8 363.9 351.1九龍城 Kowloon City 393.8 391.2 392.3 397.4 402.9 379.1黃大仙 Wong Tai Sin 396.7 399.3 413.5 413.7 424.8 446.3觀塘 Kwun Tong 582.6 576.4 579.8 566.9 557.0 564.8小計 Sub-total 2 023.1 2 012.5 2 022.0 2 032.6 2 038.2 2 023.0
新界 New Territories葵青 Kwai Tsing 473.0 470.2 453.1 454.4 461.9 479.6荃灣 Tsuen Wan 280.4 285.3 290.7 290.7 282.0 272.0屯門 Tuen Mun 470.3 475.6 477.9 480.1 471.7 493.6元朗 Yuen Long 356.0 383.1 395.4 401.4 440.4 459.5北區 North 253.7 265.6 273.8 272.5 287.9 298.8大埔 Tai Po 298.1 294.2 308.0 305.7 317.3 309.5沙田 Sha Tin 590.5 606.0 612.2 613.7 610.7 626.4西貢 Sai Kung 206.8 223.4 245.0 287.4 313.7 334.2離島 Islands 69.2 69.8 85.1 86.9 85.5 95.6小計 Sub-total 2 997.9 3 073.1 3 141.3 3 192.8 3 271.2 3 369.3
陸上總計 Land total 6 408.5 6 477.1 6 533.4 6 596.9 6 657.8 6 719.2
加:水上人口 plus: Marine population 9.9 8.9 8.0 7.1 6.4 5.7
加:越南難民^
plus: Vietnamese migrants^
17.1 3.3 2.3 2.4 0.7 -
總人口 Total Population 6 435.5 6 489.3 6 543.7 6 606.5 6 665.0 6 724.9
註釋﹕# 區議會的英文名稱自二零零零年起由'District Board'改為'District Council',而中文名稱則保持不變。∗ 已根據二零零一年人口普查結果而更新的數字。^ 自二零零一年起,沒有越南難民的獨立數字。
Notes: # 'District Board' has been renamed as 'District Council' starting from 2000, while the Chinese name remainsunchanged.
∗ Updated figures with the availability of the 2001 Population Census results.^ Starting from 2001, separate figure for Vietnamese migrants is not available.

- 32 -
附錄二
Appendix 2
詞彙釋義 Definition of Terms
年齡:指某人在出生後所度過的完整年數。 Age refers to the number of complete years a person haspassed since his/her birth date.
區議會分區:是按 1999 年選區(區議會)宣布
令(1999 年第 131 號法律公告)在憲報公布的
地域分區。 以上分區公布令是為一九九九年
十一月二十八日的區議會選舉而頒布的。全港
共有以下十八個區議會分區,其中四個在香港
島,五個在九龍及九個在新界:
District Council Districts are the geographicaldistricts as declared in the Declaration ofConstituencies (District Councils) Order 1999 (L.N.131 of 1999) for District Council election held on 28November 1999. There are 18 districts: 4 on HongKong Island; 5 in Kowloon and 9 in the NewTerritories, as shown below :
香港島 Hong Kong Island中西區 Central & Western灣仔 Wan Chai東區 Eastern南區 Southern
九龍 Kowloon油尖旺 Yau Tsim Mong深水 Sham Shui Po九龍城 Kowloon City黃大仙 Wong Tai Sin觀塘 Kwun Tong
新界 New Territories葵青 Kwai Tsing荃灣 Tsuen Wan屯門 Tuen Mun元朗 Yuen Long北區 North大埔 Tai Po沙田 Sha Tin西貢 Sai Kung離島 Islands
家庭住戶:指一群住在一起及分享生活所需的
人士,他們之間不一定有親戚關係。自己單獨
安排生活所需的個別人士亦當為一戶,即「單
人住戶」。
Domestic household consists of a group ofpersons who live together and make commonprovision for essentials for living. These personsneed not be related. If a person makes provision foressentials for living without sharing with otherpersons, he/she is also regarded as a household. Inthis case, the household is a one-person household.

- 33 -
經濟活動身分:人口可劃分為從事經濟活動人
口(即勞動人口)及非從事經濟活動人口兩大
類。
Economic activity status : The population can bedivided into two main groups, economically activepopulation (that is the labour force) and economicallyinactive population.
從事經濟活動人口,即勞動人口,可再分為就
業人口及失業人口。
The economically active population, synonymouswith the labour force, comprises the employedpopulation and the unemployed population.
就業人口 The employed population
由所有就業人士構成。一名十五歲或以上人士如符合下列情況,可界定為就業人士:
a) 統計前七天內從事一些工作賺取薪酬或利潤;或
This comprises all employed persons. For aperson aged 15 or over to be classified asemployed, that person should:
a) be engaged in performing work for pay orprofit during the seven days beforeenumeration; or
b) 有一份正式工作(即該人士持續支取工資或薪金;或已獲保證或已有既定日期返回工作崗位或所經營之業務;或正支取補償費而無須接受其他工作)。
b) have formal job attachment (i.e. that theperson has continued receipt of wage orsalary; or has an assurance or an agreed dateof return to job or business; or is in receipt ofcompensation without obligation to acceptanother job).
失業人口: The unemployed population
1) 由所有失業人士構成。一名十五歲或以上人士如符合下列情況,便界定為失業人士:
1) This comprises all unemployed persons. Fora person aged 15 or over to be classified asunemployed, that person should:
a) 在統計前七天內並無職位,且並無為賺取薪酬或利潤而工作;及
a) not have had a job and should not haveperformed any work for pay or profitduring the seven days beforeenumeration; and
b) 在統計前七天內隨時可工作;及 b) have been available for work during theseven days before enumeration; and
c) 在統計前三十天內有找尋工作。
c) have sought work during the thirty daysbefore enumeration.
另外,一名十五歲或以上的人士,如果他/她符合上述(a)和(b)的條件,但由於相信沒有工作可做而在統計前三十天內沒有找尋工作,亦會被界定為失業,即所謂「因灰心而不求職的人士」。
Besides, if a person aged 15 or over fulfils theconditions (a) and (b) above but has notsought work during the thirty days beforeenumeration because he/she believed thatwork was not available, he/she is stillclassified as unemployed, being regarded as aso-called ’discouraged worker’.

- 34 -
2) 除上述情況外,下列人士亦視作失業人士:
2) Notwithstanding the above, the followingtypes of persons are also classified asunemployed:
a) 並無職位,有找尋工作,但由於暫時生病而不能工作的人士;及
a) persons without a job, have sought workbut have not been available for workbecause of temporary sickness; and
b) 並無職位,且隨時可工作,但由於下列原因並無找尋工作的人士:
i) 已為於稍後時間擔當的新工作或開展的業務作出安排;或
b) persons without a job, have beenavailable for work but have not soughtwork because they:
i) have made arrangements to take upa new job or to start business at asubsequent date; or
ii) 正期待返回原來的工作崗位(例如散工在有需要時通常會獲通知開工)。
ii) were expecting to return to theiroriginal jobs (e.g. casual workersare usually called back to workwhen service is needed).
非從事經濟活動人口:包括所有在統計前七天
內並無職位亦無工作的人士,在這七天內正在
休假的人士及失業人士除外。料理家務者、退
休人士及所有十五歲以下人士等均包括在內。
The economically inactive population is made up ofthose persons who have not had a job and have not beenat work during the seven days before enumeration,excluding persons who have been on leave/holidayduring the seven-day period and persons who areunemployed. Persons such as home-makers, retiredpersons and all those below the age of 15 are thusincluded.
教育程度:指某人在學校或其他教育機構達到
的最高教育水平,不論他/她已否完成該項課
程。計算教育程度時只包括正式課程。正式課
程須符合下列準則:
Educational attainment refers to the highest level ofeducation attained by a person in an educationalinstitution regardless of whether he/she hadcompleted the course. Only formal courses arecounted as educational attainment. A formal coursemust satisfy the following criteria:
a) 最少為期一學年。 a) It lasts for at least one academic year.
b) 入學須具備特定的學歷資格(香港公開大
學的學位課程除外)。
b) It has specific academic qualifications forentrance (except degree courses offered by theOpen University of Hong Kong).
c) 採用考試方式評定學業成績。 c) It adopts examinations to assess the academicachievement.
住戶人數:指家庭住戶內的住戶成員人數。 Household size refers to the number of householdmembers in a domestic household.
勞動人口參與率:指勞動人口佔所有十五歲及
以上陸上非住院人口的比例。
Labour force participation rate refers to theproportion of labour force in the total land-based non-institutional population aged 15 and over.

- 35 -
婚姻狀況:指被訪者在統計調查中所報稱的婚
姻狀況。有關的婚姻或離婚事件有否經過任何
合法註冊或儀式,則未有查核。
Marital status was recorded according to thestatus reported by the respondents in the survey.There was no check on whether the marriage ordivorce had undergone any legal registration orceremony.
年齡中位數:顯示人口平均年齡的一種指標,
人口總數的百分之五十在這年齡之上,其餘的
百分之五十則在這年齡之下。
Median age refers to the average age socalculated that 50% of the total number of personsare above that age and the other 50% are below it.
住戶每月入息:指住戶成員於上月的總現金入息(包括從所有工作獲得的收入及其他現金入息)。
Monthly household income refers to the total cashincome (including earnings from all jobs and othercash incomes) received in the last month bymembers of the household.
總撫養比率:指十五歲以下和六十五歲及以上
人口數目與每千名十五至六十四歲人口相對的
比率。
Overall dependency ratio refers to the numberof persons aged under 15 and 65 and over per1 000 persons aged between 15 and 64.
居於自置居所的住戶百分比:指居於自置居所
的住戶數目與每百個家庭住戶相對的比率。
Percentage of owner-occupier households refersto the number of owner-occupier households per100 domestic households.
性別比率:指男性人口數目與每千名女性人口
相對的比率。
Sex ratio refers to the number of males per 1 000females in the population.
居所租住權:指居所被家庭住戶佔用的條款和
情況。
Tenure of accommodation refers to the terms orconditions under which the accommodation isheld by a domestic household.
自置:住戶擁有其居住的屋宇單位。 Owner-occupier: A household which owns thequarters it occupies.
全租:住戶向不在該屋宇單位居住的人士租住
整個屋宇單位,但不與其他住戶同住或分租。
Sole tenant: A household which rents the wholequarters it occupies from someone who livesoutside the quarters without sharing it with otherhousehold(s) or subletting.
其他包括下列: Others include the following:
二房東:住戶向不在該屋宇單位居住的人
士租住整個屋宇單位,及再將屋宇單位的
部分地方分租予其他住戶。
Main tenant: A household which rents thewhole quarters it occupies from someonewho lives outside the quarters and sublets itto other household(s).
三房客:住戶向居住在同一屋宇單位內的
人士租住該屋宇單位的部分地方。
Sub-tenant: A household which rents part ofa quarters from someone who lives in thesame quarters.

- 36 -
由僱主提供:住戶居住在由其成員之一的
僱主提供的屋宇單位,包括以象徵式租金
向僱主租住屋宇單位的住戶。假如住戶使
用由僱主提供的房屋津貼租住屋宇單位,
則租住權不屬於「由僱主提供」類。
Provided by employer: A household whichoccupies an accommodation provided by theemployer of one of the household members.This also includes households occupyingquarters leased from employer at a nominalrent. If a household member uses housingallowance given by his/her employer forrenting accommodation, the tenure is notregarded as provided by employer.
免租:住戶在已獲得或未獲得業主同意情
況下免費居住在一屋宇單位,但不包括本
身是業主或由僱主提供屋宇單位的住戶。
Rent free: A household which occupies anaccommodation free, with or without theowner's permission. This does not includeowner-occupiers or households occupyingaccommodation provided by employers.
居所類型:指住戶在屋宇單位內所居住地方的
類型。
Type of accommodation refers to the type ofliving space occupied by a household within aquarters.
整個單位/全層樓宇/整間洋房:是指整個屋
宇單位由一個住戶住用。
Whole flat/floor/house: The quarters is occupiedsolely by a household.
其他包括下列幾類: Others include the following:
房間/小室:住戶居住在有固定間隔的居
處,而只佔用屋宇單位的一部分。
Rooms/Cubicles: Part of the quarters enclosedby fixed partitions is occupied by ahousehold.
閣仔:在商舖或屋宇單位內架起的平台或
小樓台,通常用來存放物品,但亦用來居
住。
Cockloft: An overhanging structure, which iserected inside a shop or a quarters usually forstorage purpose, is used for living purpose.
非住宅單位:包括沒有地方特別分隔作居
住用途的儲物室、工場、酒樓內的居處。
Non-domestic quarters: This includesaccommodation in store-rooms, workshopsand restaurants, where there is no areapartitioned for residential purpose.

- 37 -
購買途徑及郵購表格 PURCHASE CHANNELS AND ORDERFORM
「二零零一年按區議會分區劃分的人口及住
戶統計資料」及其他政府統計處刊物可透過
以下途徑購買:
'Population and Household Statistics Analysed by DistrictCouncil District 2001' and other publications of theCensus and Statistics Department can be purchased fromthe following channels:
網上銷售服務 Online Purchase
互聯網用戶可在「香港統計數據書店」(網址:http://www.statisticalbookstore.gov.hk)網上購買
刊物,並即時付款。購買刊物的下載版可即時
在網上下載,而購買印刷版則會以郵遞送達。
用戶亦可於網上安排訂閱期刊或行將出版的
刊物。「香港統計數據書店」與其他公共服務
集中設於「公共服務電子化」計劃 (ESD)的入
門網站中(網址: http://www.esd.gov.hk)。
Internet users may purchase the publications online at the'Statistical Bookstore, Hong Kong' (Address:http://www.statisticalbookstore.gov.hk) with paymentmade instantly. Softcopies of the publications purchasedare available for immediate downloading whilehardcopies purchased will be delivered by mail.Subscription to regular publications and advance orderingof upcoming releases are also available. The StatisticalBookstore is hosted on the ESD portal (Address:http://www.esd.gov.hk) together with other publicservices.
郵購服務 Mail Order Service
大部分政府統計處的刊物均附有郵購表格,供
訂購或按期訂閱刊物的印刷版。填妥的郵購表
格可連同支付所需費用和郵費的支票或匯票
寄回。郵購表格亦可從政府統計處網站下載
(網址:http://www.info.gov.hk/censtatd/chinese/service_desk/forms_index.html)。
A mail order form for ordering or arranging subscriptionto hardcopies of publications is available in mostpublications of the Census and Statistics Department. Itmay be completed and sent back together with a cheque orbank draft covering all necessary cost and postage. Theorder form is also available for downloading from thewebsite of the Department (Address:http://www.info.gov.hk/censtatd/eng/service_desk/forms_index.html).
銷售中心 Sales Centres
香港金鐘道六十六號
金鐘道政府合署低座地下
政府刊物銷售處
電話:(852) 2537 1910傳真:(852) 2523 7195
Government Publications CentreG/F Low BlockQueensway Government Offices66 Queensway, Hong KongTel.: (852) 2537 1910Fax.: (852) 2523 7195
香港灣仔港灣道十二號
灣仔政府大樓十九樓
政府統計處刊物出版組
電話:(852) 2582 3025傳真:(852) 2827 1708
Publications UnitCensus and Statistics Department19/F Wanchai Tower12 Harbour RoadWan Chai, Hong KongTel.: (852) 2582 3025Fax.: (852) 2827 1708

- 38 -

- 39 -
郵購表格
按區議會分區劃分的人口及住戶統計資料(二零零一年版)
致: 香港北角英皇道二百五十號北角城中心五樓
政府統計處綜合住戶統計調查組(一)
(電話:2887 5512, 傳真:2508 1501, 電子郵址:[email protected])
請在適當空格( )內加上(√ )號。
(港元)
刊物名稱每本售價
每本本地郵費
每本合計(a)
數量
(b)
總計
(a) x (b)
按區議會分區劃分的人口及住戶統計資料
二零零一年版 (J33770100B0)
20.0 3.5 23.5
合計
本人現附上支票*(編號: )港幣 元,購買上述刊物。(註:支票應予劃線,
並註明支付「香港特別行政區政府」。)
訂戶資料
姓名: 地址:
職銜:
部門:
機構名稱: 電話: 傳真:
日期:
機構主要從事業務類別 : 進出口貿易業 建造業 金融、保險及地產業
製造業 商用服務業 教育機構
研究機構 零售貿易業 社區、社會及個人服務業
其他,請註明
讀者類別 (可選多項) : 經理 分析員、研究員 市場、推廣部人員
教師、大專院校講師 學生 其他,請註明
訂戶類別 : 機構 私人
你是否願意收到本處推廣其他刊物的資料?
是 否
* 外地郵購人士暫時無須附上支票,所需郵費將於收到訂購要求後另行通知。
你在表格上所提供的資料,只會用作辦理書刊郵購事宜,不會向任何和郵購無關的人士透露。如欲查看
或更改所填報的資料,請與政府統計處的資料管理人員聯絡。地址:香港灣仔港灣道十二號灣仔政府大樓二十一樓。

- 40 -
Order FormPopulation and Household Statistics Analysed by
District Council District (2001 Edition)To : General Household Survey Section (1), Census and Statistics Department
5/F., Fortress Tower, 250 King's Road, North Point, Hong Kong.(Tel. No. : 2887 5512, Fax. No. : 2508 1501, E-mail: [email protected])
Please tick (√ ) in the appropriate box ( ).(HK$)
Title of PublicationPriceper
copy
Localpostage
Totalprice(a)
Quantity(b)
Totalamount
(a) x(b)
Population and Household Statistics Analysed byDistrict Council District, 2001 (J33770100B0)
20.0 3.5 23.5
TOTAL
I enclose a cheque * (No. ) of HK$ for the payment of the above order.(Cheque should be crossed and made payable to ‘The Government of the Hong Kong Special AdministrativeRegion’.)
Purchaser’s Information
Name : Address :
Title of Post :
Department :
Name of Tel. No. : Fax. No. :
Organization : Date :
Major type of business of organization : Import/export trades Construction Financing, insurance and real estate Manufacturing Business services Educational institution Research institution Retail trade Community, social and personal services Others, please specify
Type of readers (more than one choice allowed) : Manager Analyst / researcher Marketing / promotional personnel Teaching staff / lecturer Student Others, please specify
Type of purchaser : Organization Individual
Do you want to receive promotional materials of other publications of this department? Yes No
* For mailings to addresses outside Hong Kong, please do not send in a cheque now. The required postage will beadvised upon receipt of order.
The information provided herein will only be used for processing your order of publications and will not bedisclosed to parties which are not involved in the processing. You may seek access to or correction of theinformation by addressing your request to the Data Controlling Officer, Census and Statistics Department, 21/F.,Wanchai Tower, 12 Harbour Road, Wan Chai, Hong Kong.