Briefing Session on 2018 HKDSE Geography Examination
150
Briefing Session on 2018 HKDSE Geography Examination (5 & 6 November 2018)
-
Upload
khangminh22 -
Category
Documents
-
view
0 -
download
0
Transcript of Briefing Session on 2018 HKDSE Geography Examination

Briefing Session on 2018 HKDSE Geography Examination
(5 & 6 November 2018)

Programme
• Report on Examination Statistics
• Review on the Examination Papers
• Review on Candidates’ Performance
• Reminders for Candidates in 2019 Geography
Examination
• Revisions in 2019 Geography Examination
• Q & A
2

Report on Examination Statistics

4
Entry Statistics 2012 2013 2014 2015 2016 2017 2018
Day Schools
Geog-C 8 814 8 387 7 567 6 995 6 040 5 408 5 203
Geog-E 4 990 4 712 4 354 4 286 4 270 4 147 4 155
Total 13 804 13 099 11 921 11 281 10 310 9 555 9 358
Whole Group
Geog-C 9 045 9 016 8 275 7 571 6 571 5 834 5 531
Geog-E 5 006 4 921 4 613 4 469 4 465 4 351 4 308
Total 14 051 13 937 12 888 12 040 11 036 10 185 9 839

5
Day Schools Level % 2012 2013 2014 2015 2016 2017 2018
5** 0.7 1.0 1.0 1.1 1.3 1.2 1.2
5*+ 3.2 4.0 3.9 4.7 4.7 4.9 4.7
5+ 7.9 9.4 10.4 11.3 11.5 11.9 11.4
4+ 30.3 33.5 35.4 36.2 37.1 38.7 37.7
3+ 61.5 61.3 63.0 63.0 62.7 64.9 65.5
2+ 83.4 84.0 84.8 85.3 85.9 87.1 88.1
1+ 94.7 95.3 95.5 95.3 95.6 96.5 97.4
U 5.3 4.7 4.5 4.7 4.4 3.5 2.6

6
Whole Group Level % 2012 2013 2014 2015 2016 2017 2018
5** 0.7 1.0 1.0 1.1 1.2 1.2 1.1
5*+ 3.1 3.9 3.9 4.7 4.7 5.0 4.6
5+ 7.8 9.4 10.3 11.2 11.5 11.8 11.2
4+ 29.9 33.5 35.3 36.0 37.0 38.5 37.2
3+ 61.0 61.3 62.8 62.7 62.4 64.6 64.9
2+ 82.9 83.8 84.4 84.8 85.5 87.1 87.5
1+ 94.4 95.0 95.1 94.9 95.3 96.5 97.1
U 5.6 5.0 4.9 5.1 4.7 3.5 2.9

7
M.C. Statistics 2012 2013 2014 2015 2016 2017 2018
Day Schools
Mean (%)
24.2 (60.5)
26.5 (66.2)
26.9 (67.3)
26.0 (65.0)
25.0 (62.4)
24.6 (61.4)
25.7 (64.3)
SD (%) 5.2 (13.0) 5.6 (14.0) 5.2 (13.0) 4.7 (11.7) 5.8 (14.5) 5.1 (12.7) 5.2 (13.0)
Lowest 3 3 6 1 0 0 0
Highest 38 40 39 39 40 39 36
Whole Group
Mean (%)
24.2 (60.4)
26.5 (66.2)
26.9 (67.2)
26.0 (64.9)
25.0 (62.4)
24.6 (61.4)
25.6 (64.0)
SD (%) 5.2 (13.1) 5.6 (14.0) 5.2 (13.1) 4.7 (11.8) 5.8 (14.6) 5.1 (12.8) 5.3 (13.3)
Lowest 3 3 6 1 0 0 0
Highest 38 40 39 39 40 39 36

8
2018 Performance on Individual Questions Paper 1
Q1
(18)
Q2
(18)
Q3
(18)
Q4
(18)
Q5
(12)
Q6
(12)
Q7
(12)
Mean
Score
(% marks)
8.98
(49.9)
10.58
(58.8)
8.82
(49.0)
8.97
(49.8)
3.89
(32.4)
4.79
(39.9)
3.91
(32.6)
Highest
Score 18 18 18 18 11 12 12

9
2018 Performance on Individual Questions Paper 2
Q1
(18)
Q2
(18)
Q3
(18)
Q4
(18)
Q5
(12)
Q6
(12)
Q7
(12)
Q8
(12)
Mean
Score
(% marks)
10.34
(57.4)
9.14
(50.8)
5.72
(31.8)
9.44
(52.4)
3.46
(28.8)
4.59
(38.3)
2.73
(22.8)
2.77
(23.1)
Highest
Score 18 18 15 17 12 12 12 10

Popularity % of Questions in 2018 Paper 1
10
0
10
20
30
40
50
60
70
Q1 Q2 Q3 Q4 Q5 Q6 Q7
69
33 32
65
8
63
29

Popularity % of Questions in 2018 Paper 2
11
0
5
10
15
20
25
30
35
40
Q1 Q2 Q3 Q4 Q5 Q6 Q7 Q8
38
27
8
26 23
34
11
31

School Survey on the 2018 HKDSE Geography Examination Papers
(140 responses)

The duration of the examination is appropriate.
13
Strongly agree 4.3%
Agree 72.9%
Slightly agree 15.0%
Slightly disagree
6.4%
Disagree 1.4%

The level of difficulty of the examination is appropriate.
14
Strongly agree 3.6%
Agree 70.0%
Slightly agree 20.7%
Slightly disagree
5.0%
Disagree 0.7%

The examination reflects the assessment aims & objectives stated in the C & A Guide.
15
Strongly agree 5.0%
Agree 77.9%
Slightly agree 16.4%
Slightly disagree
0.7%
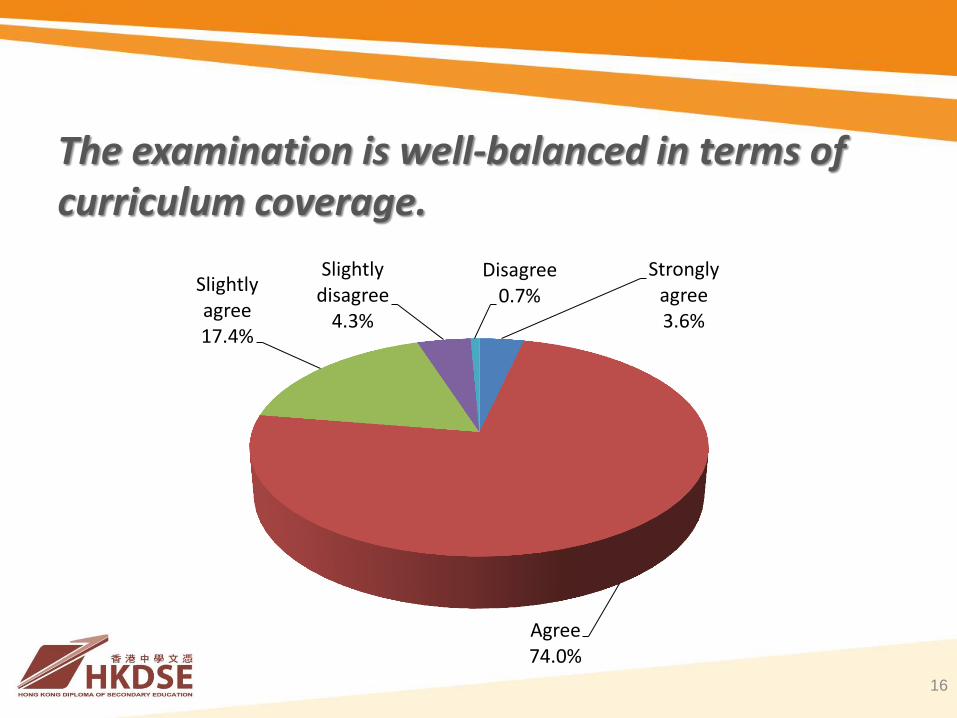
The examination is well-balanced in terms of curriculum coverage.
16
Strongly agree 3.6%
Agree 74.0%
Slightly agree 17.4%
Slightly disagree
4.3%
Disagree 0.7%

An appropriate balance between questions testing basic knowledge / skills & those testing higher-order skills.
17
Strongly agree 3.6%
Agree 77.9%
Slightly agree 16.4%
Slightly disagree
1.4%
Disagree 0.7%
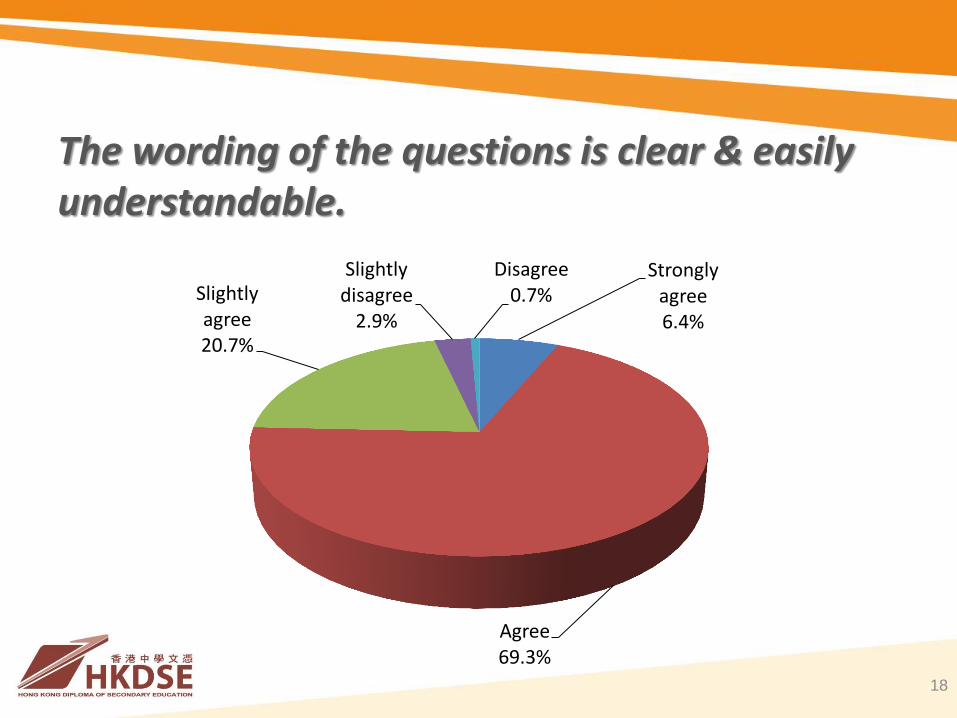
The wording of the questions is clear & easily understandable.
18
Strongly agree 6.4%
Agree 69.3%
Slightly agree 20.7%
Slightly disagree
2.9%
Disagree 0.7%

The optional questions are at a comparable level of difficulty.
19
Strongly agree 2.1%
Agree 52.6%
Slightly agree 33.3%
Slightly disagree
5.7%
Disagree 2.8%
NA 3.5%

The two language versions are identical in meaning.
20
Strongly agree 1.4%
Agree 60.5%
Slightly agree 18.0%
Slightly disagree
3.6%
Strongly disagree
0.7%
NA 15.8%

Review on Candidates’ Performance

Comments from Markers on Candidates’ Standard Compared with 2017 Examination
22
N.A. 9.4%
Much better 1.2%
Slightly better 14.1%
About the
same 47.1%
Slightly poorer 28.2%
Paper 1
N.A. 28.6%
Slightly better 10.7%
About the
same 42.9%
Slightly poorer 16.1%
Much poorer 1.8%
Paper 2

Review on Candidates’ Performance in Paper 1

Overall Comments in Section A
• The average number of questions answered correctly
by candidates was 25.
• There was a slight improvement in the overall
performance of candidates as compared with last year.
• Five questions in which distractors were more popular
than the key have been selected for further discussion.
24

Section A: Item 3
• Candidates choosing option B likely calculated the average gradient of the section of Repulse Bay Road using the straight line distance between the two road junctions instead of the actual length of the road.
25

Section A: Item 4
• Candidates who chose Option D might have interpreted the map extract not in details and therefore overlooked the fact that the view of Cape Collison from spot height 348 would be blocked by Pottinger Peak.
26

Section A: Item 21
• Candidates who chose Option B might not have realised that an increase in tariffs will result in a restriction of foreign import of goods and therefore helps attract the manufacturing industry to return.
27

Section A: Item 23
• Candidates who chose Option D might have misinterpreted the rise in rural population as suburbanisation.
28

Section A: Item 26
• Candidates who chose Option A might have overlooked the fact that reducing the number of bus stops can improve air quality at street level because it reduces the time buses idle with their engines still running.
29

Overall Comments in Sections B & C
• Candidates should apply geographical knowledge
and concepts in their answers.
• Candidates should avoid writing vast amount of
information by memory in the answers.
• Candidates should enhance their spatial concepts
and apply appropriate geographical concepts and
terminology when answering the questions.
30

Overall Comments in Sections B & C (cont.)
• Candidates’ answers should not be confined by
‘framework’ or ‘rules’.
• Candidates should not make inappropriate
comparisons between two items for the purpose of
stating their ‘similarities’ and ‘differences’, or raise
non-geographical, irrelevant, illogical, or
contradictory justifications to achieve the discussion
of ‘pros’ and ‘cons’ arguments.
31

Overall Comments in Sections B & C (cont.)
• Candidates should interpret the questions
cautiously and be alert to the key terms for a clear
understanding of their requirements.
• For questions of ‘discuss whether’, candidates
should state clearly their stance of ‘whether or not’,
and avoid giving an ambiguous conclusion.
32

Overall Comments in Sections B & C (cont.)
• Candidates should get used to extracting relevant evidence from various information and data to support their arguments, so as to improve their performance in such types of questions. Candidates should also organise such evidence systematically to correspond with their arguments.
• Candidates should avoid oversimplifying or stereotyping the problems in the less developed countries.
33

34
Section B: Question 1 (a) Refer to Figure 1a. Answer the following questions with reference to the plate tectonics theory.
(i) Compare the locations of earthquakes in areas X and Y.
• Some candidates wrote answers unrelated to the plate tectonics theory or the locations of earthquakes, e.g. coastal areas.
• Some candidates described the locations but not compared.
• Fair. Quite a number of candidates stated the location of the earthquake of either area X or area Y incorrectly at the constructive/ conservative plate boundary.
35
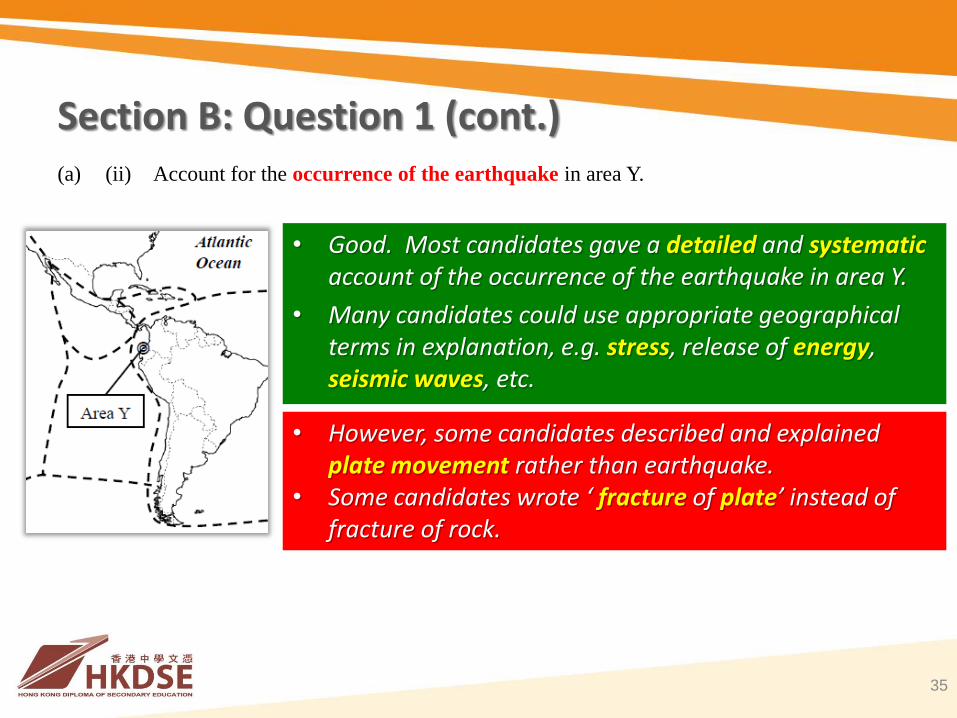
Section B: Question 1 (cont.) (a) (ii) Account for the occurrence of the earthquake in area Y.
• Good. Most candidates gave a detailed and systematic account of the occurrence of the earthquake in area Y.
• Many candidates could use appropriate geographical terms in explanation, e.g. stress, release of energy, seismic waves, etc.
• However, some candidates described and explained
plate movement rather than earthquake. • Some candidates wrote ‘ fracture of plate’ instead of
fracture of rock.

36
Section B: Question 1 (cont.) (b) (i) Describe the differences in losses between the earthquakes of areas X and Y.
• Good. Most candidates could interpret the data and describe correctly the differences in death toll and economic loss between the earthquakes of areas X and Y.

37
Section B: Question 1 (cont.) (b) (ii) Quoting evidence from Figure 1b
and Table 1c, explain the differences
mentioned in (b) (i)
• Fair. Most candidates stated the socio-economic factors leading to the differences in death toll in the earthquakes.

38
Section B: Question 1 (cont.)
• Some candidates stated the differences in earthquake magnitudes and GDP per capita between the two areas but without further explanation.
• Many candidates either did not quote relevant evidence systematically to support their explanations, or did not use appropriate geographical terminology.
?
Coastal location = Tsunami? Better design =
Quakeproof buildings?

39
Section B: Question 1 (cont.)
• Candidates generally did not explain correctly the higher economic loss in area X.
• Some candidates gave contradictory explanations.
“The death toll in area
X was smaller
because of the large
number of quakeproof
buildings, but there
was greater economic
loss since more
buildings collapsed.”

40
Section B: Question 1 (cont.) (c) Refer to Figure 1a and Table 1c. Discuss whether the earthquake in area X might have
triggered the earthquake in area Y.
Directions and rates of plate movement
Distance & energy loss of seismic waves
• Poor. Most candidates did not apply geographical concepts.

41
Section B: Question 1 (cont.)
• Quite a number of candidates either quoted irrelevant information or made a simple logical deduction only.
• The majority of candidates did not arrive at a conclusion.
? ? ?

42
Section B: Question 2 (a) Refer to Figure 2a, Figure 2b and the map extract (1:20 000) of Hong Kong.
(i) Identify coastal landforms P and Q.
Good. Most candidates correctly identified coastal landforms P and Q.

43
Section B: Question 2 (cont.) (a) (ii) Quoting map evidence, suggest the physical factors favouring the formation of
coastal landforms P and Q respectively.
• Satisfactory. Candidates generally had clear concepts of the physical factors which were favourable for the formation of the two coastal landforms, such as fetch, degree of site exposure, etc.
• However, many candidates were not used to quoting relevant map evidence to support their answers.
P Q
44
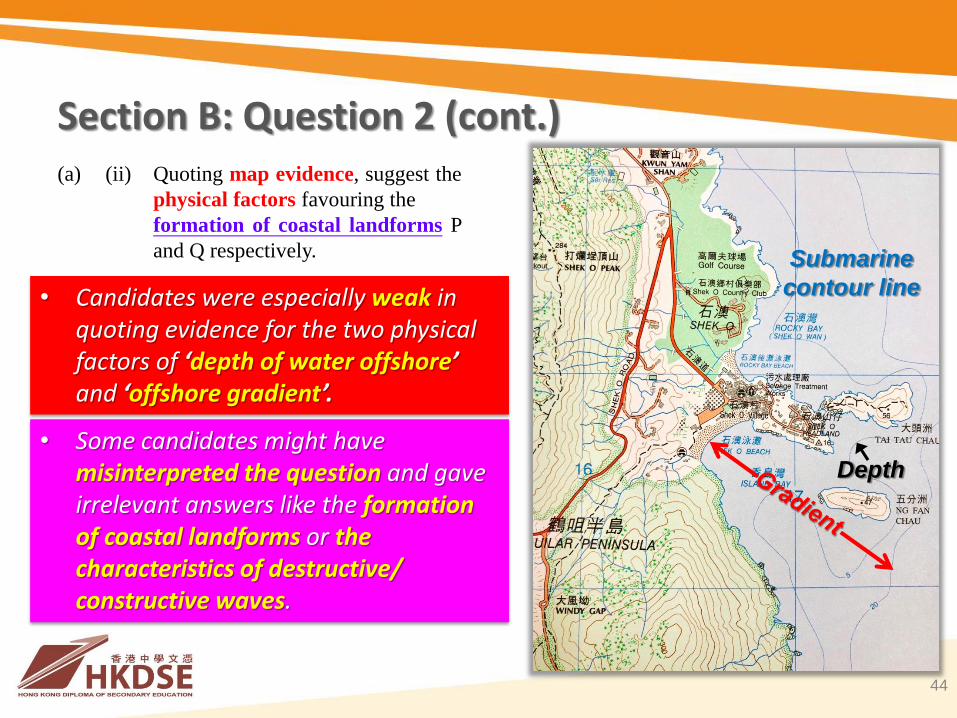
Section B: Question 2 (cont.) (a) (ii) Quoting map evidence, suggest the
physical factors favouring the
formation of coastal landforms P
and Q respectively.
• Candidates were especially weak in quoting evidence for the two physical factors of ‘depth of water offshore’ and ‘offshore gradient’.
• Some candidates might have misinterpreted the question and gave irrelevant answers like the formation of coastal landforms or the characteristics of destructive/ constructive waves.
Submarine
contour line
Depth

45
Section B: Question 2 (cont.) (a) (iii) Describe and explain the formation of coastal landform P.
• Good. Candidates generally correctly described and explained the formation of coastal landform P.
• However, some candidates omitted a few key processes in the answer, such as undercutting, sea cliff retreat, etc.

46
Section B: Question 2 (cont.) (b) Refer to Figure 2b, Photograph 2c and the map extract (1:20 000) of Hong Kong.
(i) Identify coastal management strategy R shown in Photograph 2c. Explain how the
strategy protects the coast.
• Good. Most candidates correctly identified coastal management strategy R with proper explanation.

47
Section B: Question 2 (cont.) (b) (ii) Assume there is a need to protect coastal landform Q.
With regard to the present use of coastal landform Q, discuss whether coastal
management strategy R is appropriate.
• Fair. Although many candidates stated the pros and cons of coastal management strategy R, only some discussed them with reference to the present use of the coastal site, using less profound arguments in general.
• Some candidates suggested other coastal management strategies.
• Many candidates gave ambiguous conclusion without taking a clear stance.
• A small number of candidates might have overlooked the impact of wave erosion on beaches and raised such an incorrect argument that ‘protection of the beach is unnecessary as it is formed by wave deposition’.

48
Section B: Question 3 (a) Refer to Map A in Figure 3b and Photograph 3c.
(i) Identify land use X.
Fair. Some candidates did not name land use X correctly.

49
Section B: Question 3 (cont.) (a) Refer to Map A in Figure 3b and Photograph 3c.
(ii) What adverse environmental impact may
be brought about by land use X?
• Good. Most candidates could describe the adverse environmental impact.
• However, the descriptions given by some candidates tended to be general, such as affecting the ecosystem, reducing the biodiversity, etc.
• Some candidates confused ‘air pollutants’ and ‘greenhouse gases’.
Candidates should answer according to the specific situation of the question.

50
Section B: Question 3 (cont.) (b) Refer to Figure 3b.
(i) According to Map B, describe how the land occupied by land use X is to be developed.
• Fair. Most candidates described generally how the land occupied by land use X is to be developed.
• However, only a small fraction of candidates described in detail the land development of different spaces.
Spatial difference

51
Section B: Question 3 (cont.) (b) (ii) Explain how the above development may help alleviate the adverse environmental
impact mentioned in (a) (ii).
• Fair. Most candidates tended to give general and nonspecific explanation.
• The knowledge of candidates in land use planning was generally inadequate.
• Many candidates had an incorrect concept of green area like its purpose to slow down global warming or provide wildlife habitats.
• They should illustrate how to utilise green area as buffer zone and in landscaping to reduce land use conflicts.

52
Section B: Question 3 (cont.) (c) Refer to Figure 3a and Map B in Figure 3b.
Explain how the transport system may foster economic development in Hung Shui Kiu NDA.
• Fair. Many candidates answered the question with general knowledge and their explanation tended to be nonspecific, e.g. accessibility.
Many candidates emphasised the economic benefits brought about by cross-border visitors while overlooking the importance of cross-border goods transport to the NDA.
Candidates should explain concretely how the MTR station and highway foster economic activities of the adjacent land uses.

53
Section B: Question 3 (cont.) (d) Refer to Figure 3b and Table 3d.
Discuss whether the planning of Hung Shui Kiu NDA may help achieve social sustainability.
• Poor. The knowledge of most candidates in ‘social sustainability’ was inadequate.
• Many candidates discussed economic and environmental sustainability which were irrelevant.
• Candidates generally stated only the increase in housing and job opportunities.

54
Section B: Question 3 (cont.) • Candidates should analyse the information provided in the question for an
in-depth discussion. • Most candidates did not take a clear stance in the conclusion.
Keeping of
rural
settlement
Importance of
green area and
park to the
community

55
Section B: Question 4 (a) Refer to Figure 4a. Describe and explain the global distribution of tropical rainforests.
• Most candidates described the general global distribution of tropical rainforests.
• They could briefly explain the distribution.
• Some candidates explained the temperature and rainfall characteristics of tropical rainforests rather than the distribution.
Some candidates might have misinterpreted the question and wrote irrelevant answers like describing the reduction of tropical rainforest area.

56
Section B: Question 4 (cont.) (b) Refer to Figure 4b.
(i) Compare the characteristics of vegetation between a tropical rainforest and an
oil palm plantation.
• Good. Most candidates correctly identified and compared the characteristics of
vegetation between a tropical rainforest and an oil palm plantation. • Many candidates could use the proper terms, e.g. structure, density, biodiversity,
etc. in making comparison.
• Some candidates mixed up the characteristics of ‘vegetation’ and ‘trees’, e.g. buttress roots, drip-tip leaves, etc.

57
Section B: Question 4 (cont.) (b) (ii) Describe and explain how the energy flow within the oil palm plantation ecosystem
differs from that of the tropical rainforest.
• Poor. Most candidates showed inadequate knowledge. • Few candidates could describe and explain correctly the changes of energy flow
(shorter but not faster) within the oil palm plantation ecosystem. • Many candidates confused ‘nutrient cycle’ and ‘energy flow’.
• Some candidates correctly described the changes in trophic levels and food web but without further explaining how such changes affect energy flow.

58
Section B: Question 4 (cont.) (c) Refer to Table 4c. Account for the decreasing rainforest area in Indonesia from 2000 to 2015.
• Satisfactory. Most candidates explained by referring to the figures in Table 4c.
Some candidates gave general explanations like increase in food demand or housing demand due to population increase.
They should also refer to the situation of oil palm growing in Indonesia.

59
Section B: Question 4 (cont.) (d) Refer to Figure 4a and Table 4c. Discuss whether limiting the area of oil palm plantations in
Indonesia may help conserve tropical rainforests in the world.
• Fair. Most candidates only described the general difficulties of limiting the area of oil palm plantations, e.g. corrupted government, lack of monitoring, etc. (Stereotyping and without referring to the information given)
• Many candidates focused their discussion on the conservation of tropical rainforest in Indonesia but not of ‘the world’.
• Most candidates did not arrive at a conclusion in their discussion.

60
Section B: Question 4 (cont.) (d) Refer to Figure 4a and Table 4c. Discuss whether limiting the area of oil palm plantations in
Indonesia may help conserve tropical rainforests in the world.
• Some candidates noted other activities might have caused deforestation in other rainforests.
• Some candidates calculated the area of rainforest in Indonesia conserved.
• Candidates should give more specific and in-depth discussion with reference to the information provided.

Section C: Question 5 Account for the locational factors leading to the clustering of the iron and steel industry in China
after the 1970s. Explain how these locational factors affected the clustering of the IT industry in
the US.
61
• Poor. Candidates commonly had inadequate knowledge of the factors leading to the clustering of iron and steel industry in China after the 1970s.
• Many candidates simply wrote a brief and general description of the spatial changes of iron and steel industry in China from the 1970s, or even from the 1950s, until after 2000.
• Some candidates gave general locational factors of the industry only, i.e. iron ore, coal, cooling water, etc. without referring to ‘clustering’ or ‘after the 1970s’.
• Some candidates mentioned the ‘open door policy’ but without a specific and correct explanation of how the policy has led to the clustering of the iron and steel industry. Their answers were often a general description of the policy and setting up of SEZ only.

Section C: Question 5 (cont.) Account for the locational factors leading to the clustering of the iron and steel industry in China
after the 1970s. Explain how these locational factors affected the clustering of the IT industry in
the US.
62
• Most of the answers given by candidates were either too general or
irrelevant, e.g. clustering of IT industry in CHINA.
• Many candidates only described and explained the multi-point production of
the IT industry and its advantages.
• Some candidates had their answers related to IT industry in the US but they
generally did NOT respond to the clustering of industry; instead they mostly
explained the general locational factors affecting the IT industry, such as
greenfield sites, etc.
• Inadequate knowledge of the clustering pattern of IT industry and the
locational factors, i.e. government policy, agglomeration economies,
transport, technology, etc. was common among candidates.

Section C: Question 6 Describe and explain the physical factors leading to frequent famine in the Sahel region.
Discuss whether the growing of genetically modified crops may alleviate the famine
problem in this region.
63
• Fair. The majority of candidates correctly described the physical environment
of the Sahel region, mostly illustrated with appropriate examples of rivers
and lakes and climatic data.
• However, candidates commonly explained only the farming constraints of the
region without stating correctly the physical factors leading to frequent
famine, such as unreliable rainfall and low carrying capacity of land, etc.
• Some candidates were not able to identify nomadic herding as the major
traditional farming in the region.

Section C: Question 6 (cont.) Describe and explain the physical factors leading to frequent famine in the Sahel region.
Discuss whether the growing of genetically modified crops may alleviate the famine
problem in this region.
64
• Most candidates only suggested the general merits and demerits of genetically modified (GM) crops.
• Most candidates did not discuss according to the specific physical (prolonged drought) and human (change from nomadic herding to sedentary farming, subsistence to commercial farming of GM crops for export) environment in the Sahel region.
• Candidates should also discuss whether GM crops may alleviate the socio-economic factors leading to frequent famine in the Sahel region.
• Some candidates discussed irrelevant issues, such as the problems (e.g. super-pests) brought about by the growing of GM crops, or other more effective measures (e.g. drip irrigation) to alleviate the famine problem.
• Candidates should make a clear conclusion when discussing whether GM crops may alleviate the famine problem.

Section C: Question 7 Account for the increasing greenhouse gas emissions in less developed countries. Discuss the
constraints encountered by less developed countries in reducing greenhouse gas emissions.
65
• Fair. Most candidates had a general understanding of the human activities emitting greenhouse gases.
• Not many candidates could explain the increasing trend, i.e. rapid industrial development and urbanisation in less developed countries.
• Many candidates over-emphasised the impact of farming, e.g. paddy, cattle rearing, etc.
• Some candidates gave irrelevant answers, such as the reduction in carbon sink resulted from deforestation, factors of the relocation of industries from more developed countries to less developed countries, etc.
• Some candidates quoted information of Indonesia directly from Question 4 in Section B as examples to illustrate their answers.
• Some candidates confused ‘greenhouse gases’ and ‘air pollutants’.

Section C: Question 7 (cont.) Account for the increasing greenhouse gas emissions in less developed countries. Discuss the
constraints encountered by less developed countries in reducing greenhouse gas emissions.
66
• Most candidates raised arguments which were general and superficial, such
as corrupted government, lack of capital, low technological level or
environmental awareness, etc., showing their inadequate knowledge of the
issue.
• Candidates showed a tendency of oversimplifying or stereotyping the
problems in the less developed countries.
• Very few candidates discussed specifically the constraints of developing
green energy or energy saving technology.
• Candidates should also consider the difficulties of cutting emissions in less
developed countries brought about by their low per capita emissions.

Review on Candidates’ Performance in Paper 2

68
丁部:題 1 (a) 參閱圖 1 a。
(i) 辨認 X 岩石類型及 Y 岩石類型。
大部分考生正確地辨認岩石類別。
(ii) 解釋 Y 岩石類型如何影響大嶼山的地勢。
大部分考生正確地解釋 Y 岩石如何影響大嶼山的地形。

69
丁部:題 1(續)

70
丁部:題 1(續)
(b) 參閱圖 1b 、圖 1c 及照片 1d。
(i) 解釋為何圖 1b 的風化剖面常見於 X 岩石類型地區。
大部分考生根據氣候及岩石特徵解釋風化剖面,但只有少數考生正確
地解釋風化剖面表層與底層的差異。
考 生 引 用 圖 1b 及圖 1c 的資料,解釋為何圖 1b 的風化剖面常見於 X 岩石類型地區。
71
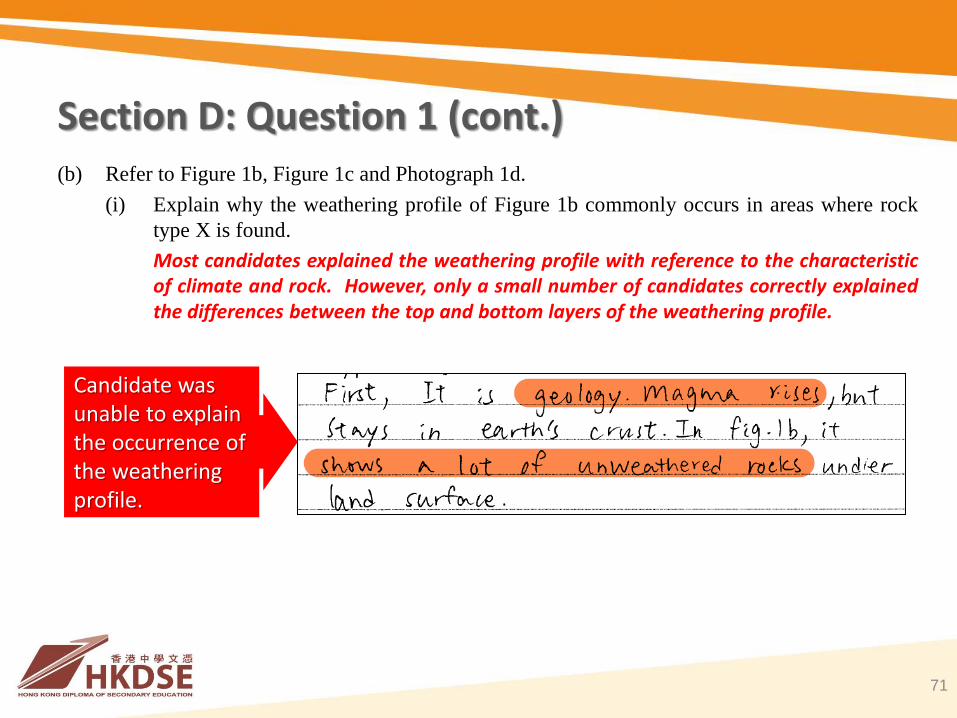
Section D: Question 1 (cont.) (b) Refer to Figure 1b, Figure 1c and Photograph 1d.
(i) Explain why the weathering profile of Figure 1b commonly occurs in areas where rock
type X is found.
Most candidates explained the weathering profile with reference to the characteristic of climate and rock. However, only a small number of candidates correctly explained the differences between the top and bottom layers of the weathering profile.
Candidate was unable to explain the occurrence of the weathering profile.

72
丁部:題 1(續)
(b) (ii) 根據圖 1b 的風化剖面,解釋照片 1d 所示 Z 地形形貌的形成過程。
大部分考生只簡略地解釋突岩的形成過程。部分考生混淆了「風化」
與「侵蝕」的概念,另有部分考生只將題 (b) (i) 的答案重複一次。
考生只概括地解釋
Z 地形形貌的形成過程。

73
Section D: Question 1 (cont.) (b) (ii) Explain the formation of landform feature Z shown in Photograph 1d with reference to the
weathering profile in Figure 1b.
Most candidates gave only a brief explanation of the formation of tors. Some candidates confused ‘weathering’ and ‘erosion’ while some simply repeated the answer in (b) (i).
Candidate explained the formation of landform Z with unrelated concept.
Candidate briefly explain the formation of landform Z.
74
丁部:題 1(續)
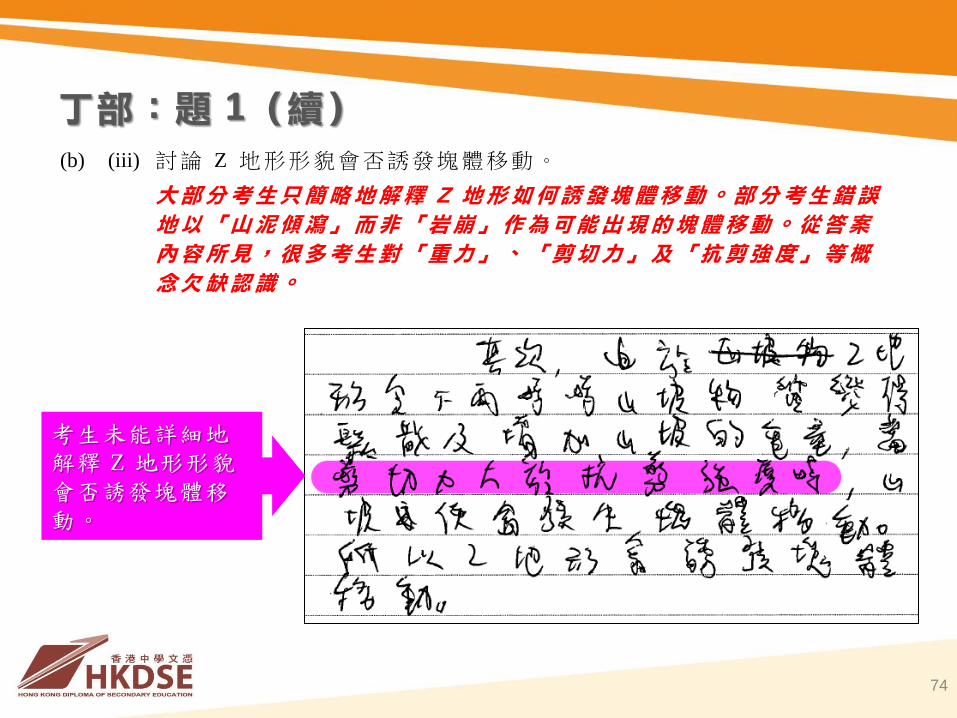
(b) (iii) 討論 Z 地形形貌會否誘發塊體移動。
大部分考生只簡略地解釋 Z 地形如何誘發塊體移動。部分考生錯誤
地以「山泥傾瀉」而非「岩崩」作為可能出現的塊體移動。從答案
內容所見,很多考生對「重力」、「剪切力」及「抗剪強度」等概
念欠缺認識。
考生未能詳細地解釋 Z 地形形貌會否誘發塊體移動。

75
Section D: Question 1 (cont.) (b) (iii) Discuss whether landform feature Z may induce mass wasting.
Most candidates gave only a brief explanation of how landform Z may induce mass wasting. Some candidates wrongly put ‘landslide’ but not ‘rock fall’ as the possible mass wasting. Many candidates’ understanding of the concepts of ‘force of gravity’, ‘shear stress’ and ‘shear strength’ was not very clear as revealed in the content of their answers.
Candidate was unable to give a detail explanation of whether landform Z may induce mass wasting.

76
Section D: Question 2 (a) Refer to Figure 2a. Describe and
explain the monsoon system in Hong
Kong under the influence of the pressure
pattern in July.
Many candidates correctly explain the summer monsoon system in Hong Kong. Some candidates described the spatial distribution of pressure belts with reference to the location of land and sea. However, some candidates understood vaguely the location of continental Asia and Australasia.

77
Section D: Question 2 (cont.) (a) Refer to Figure 2a. Describe and explain the monsoon system in Hong Kong under the influence
of the pressure pattern in July.
Candidate made use of the information in Figure 2a to describe and explain the monsoon system in Hong Kong.

78
Section D: Question 2 (cont.) (b) Refer to Figure 2b. Account for the favourable conditions for the formation of weather
system P.
Most candidates gave only a brief description and explanation of the conditions for the formation of typhoon. Some candidates confused ‘sensible heat’ and ‘latent heat’.

79
Section D: Question 2 (cont.) (b) Refer to Figure 2b. Account for the favourable conditions for the formation of weather
system P.
Candidate gave only a brief description and explanation of the conditions for the formation of typhoon.

80
丁部:題 2(續)
(b) 參閱圖 2b。說明有利於 P 天氣系統形成的條件。
大部分考生只簡略地描述及解釋形成颱風的條件。部分考生分不清「感
熱」與「潛熱」的概念。

81
丁部:題 2(續) (b) 參閱圖 2b。說明有利於 P 天氣系統形成的條件。
考生只能簡單地描述及解釋颱風形成的條件。

82
Section D: Question 2 (cont.) (c) Refer to Figure 2b and Table 2c.

83
Section D: Question 2 (cont.)
(c) (i) On which day would weather conditions X and Y most likely occur respectively?
Most candidates correctly identified the dates of weather conditions X and Y. A
small fraction of candidates might have overlooked the changes in weather
conditions on two consecutive days, hence their answers were incorrect.
(ii) Describe and explain the changes in weather conditions of Hong Kong on these two
days.
Most candidates correctly described and explained the changes in weather
conditions on two consecutive days. Some candidates did not correctly explain the
changes in wind direction, wind speed and rainfall on the second day. Answer in
this part would be directly affected by whether candidates could correctly identify
the dates of weather conditions X and Y in (b) (i).

84
Section D: Question 2 (cont.) (c) (i) On which day would weather conditions X and Y most likely occur respectively?
(ii) Describe and explain the changes in weather conditions of Hong Kong on these two days.
Candidate gave a detail description and explanation of the changes in weather conditions of Hong Kong.

85
丁部:題 2(續)
(c) (i) X 天氣情況與 Y 天氣情況最有可能分別在哪天出現?
大部分考生正確地寫出 X 天氣情況及 Y 天氣情況的日期。考生給出了
錯誤的答案,或許是因為未有留意天氣情況在連續兩天出現的變化。
(ii) 描述及解釋香港於該兩天的天氣情況變化。
大部分考生正確地描述及解釋連續兩天天氣情況的變化。部分考生未
有正確地解釋在第二天的風向、風速及降雨量的變化。考生在題 (c) (i)
能否正確地辨認 X 天氣情況及 Y 天氣情況的日期,會直接影響他們在本
部分的表現。

86
丁部:題 2(續)
(c) 參閱圖 2b 及表 2c。
(i) X 天氣情況與 Y 天氣情況最有可能分別在哪天出現?
(ii) 描述及解釋香港於該兩天的天氣情況變化。
考生只能簡單地描述及解釋香港天氣的變化。

87
Section D: Question 2 (cont.) (d) Explain how weather system P may temporarily disturb the monsoon system in Hong Kong
mentioned in (a).
Most candidates did not explain in detail and correctly how weather system P may affect the summer monsoon system in Hong Kong.
Candidate briefly explained how weather system P may temporarily disturb the monsoon system in Hong Kong.

88
丁部:題 2(續)
(d) 解釋 P 天氣系統會如何對題 (a) 所述的香港季風系統造成短暫性的干擾。
大部分考生未有詳細或正確地解釋 P 天氣系統會如何影響香港夏季的季風
系統。
考生只能簡單地解釋 P 天氣系統如何短暫地影響香港的季風系統。

89
丁部:題 3 (a) 參閱表 3a 及圖 3b。
(i) 比較表 3a 所示由 2004 年至 2016 年香港與深圳貨櫃港的吞吐量。
大部分考生根據表 3a 的資料作出正確的比較。然而,不少考生未有指出香港貨櫃港由 2004 年至 2016 年的吞吐量出現波動;部分考生亦未有指出香港貨櫃港在 2008 年的吞吐量下降的趨勢。
考生未能準確地比較表 3a 所示由2004 年至2016 年香港與深圳貨櫃港的吞吐量的變化。

90
Section D: Question 3 (cont.) (a) Refer to Table 3a and Figure 3b.
(i) Compare the throughput of container
ports in Hong Kong and Shenzhen
from 2004 to 2016 shown in Table 3a.
Most candidates made a correct comparison with reference to the information in Table 3a. However, quite a number of candidates did not state the fluctuations of throughput of container port in Hong Kong from 2004 to 2016 while some also did not state the decreasing trend of throughput of container port in Hong Kong in 2008.
Candidate was unable to compare accurately the changes in throughput of container ports in Hong Kong and Shenzhen from 2004 to 2016 shown in Table 3a.

91
丁部:題 3(續)
(a) (ii) 2004 年後珠江三角洲地區的主要快速公路網絡有什麼轉變?
大部分考生只描述了快速公路網絡在密度上的轉變,卻沒有提到其在
連接程度及結點數目上的變化。
考生未能解釋2004 年後珠江三角洲地區的主要快速公路網絡有什麼轉變。

92
Section D: Question 3 (cont.) (a) (ii) What were the changes in the network of major highways in the Zhujiang Delta Region
after 2004?
Most candidates only described the changes in the density of the network of major highways without mentioning the changes in connectivity and the number of nodes.
Candidate was unable to explain the changes in the network of major highways in the Zhujiang Delta region after 2004.

93
Section D: Question 3 (cont.) (a) (iii) How did the changes mentioned in (a) (ii) favour the development of container ports in
Shenzhen?
Many candidates did not state the relationship between the development in the Zhujiang Delta Region and the development of container ports in Shenzhen. Some candidates did not mention the development of container ports in Shenzhen and explained only the increase in vehicle flow.
Candidate was unable to explain how the changes mentioned in (a) (ii) favour the development of container ports in Shenzhen.

94
丁部:題 3(續)
(b) 有建議興建港珠澳大橋,以促進香港與珠江三角洲地區的陸路連通,從而
提升香港貨櫃港的吞吐量。
(i) 解釋港珠澳大橋可如何改善珠江三角洲地區的貨物流通。
很多考生只粗淺地解釋港珠澳大橋如何增加貨物流量。
考生未能解釋港珠澳大橋如何改善珠江三
角洲地區的貨物流通。

95
Section D: Question 3 (cont.) (b) There was a suggestion to construct the Hong Kong-Zhuhai-Macao Bridge to improve land
connection between Hong Kong and the Zhujiang Delta Region, hence raising the throughput
of container port in Hong Kong.
(i) Explain how the Hong Kong-Zhuhai-Macao Bridge may improve the flow of goods in
the Zhujiang Delta Region.
Many candidates gave only a superficial explanation of how the Hong Kong-Zhuhai- Macao Bridge may increase the flow of goods.
Candidate used common knowledge to explain how the Hong Kong-Zhuhai-Macao Bridge may improve the flow of goods in the Zhujiang Delta Region.
96
丁部:題 3(續)
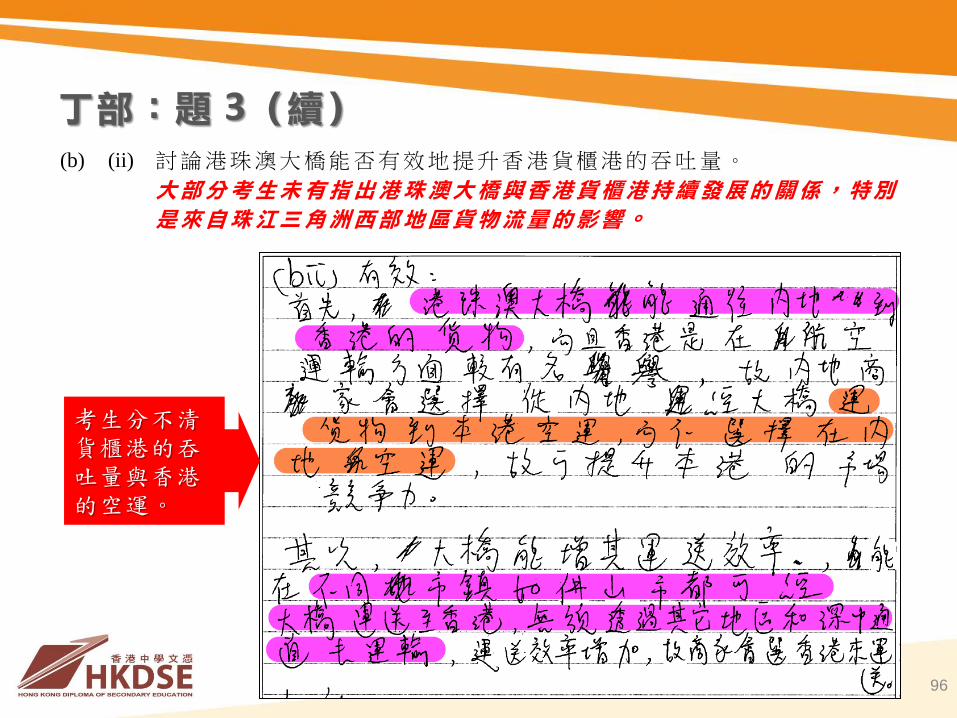
(b) (ii) 討論港珠澳大橋能否有效地提升香港貨櫃港的吞吐量。
大部分考生未有指出港珠澳大橋與香港貨櫃港持續發展的關係,特別
是來自珠江三角洲西部地區貨物流量的影響。
考生分不清貨櫃港的吞吐量與香港的空運。

97
丁部:題 3(續) (b) (ii) 討論港珠澳大橋能否有效地提升香港貨櫃港的吞吐量。
考生錯誤理解港珠澳大橋對空運的影響。
考生能指出香港貨櫃港面對的挑戰。

98
Section D: Question 3 (cont.) (b) (ii) Discuss whether the Hong Kong-Zhuhai-Macao Bridge may effectively raise the
throughput of container port in Hong Kong.
Most candidates did not state the relationship between the Hong Kong-Zhuhai-Macao Bridge and the sustained development of container port in Hong Kong, especially the influences from the flow of goods in the western part of the Zhujiang Delta Region.
Candidate was unable to discuss whether the Hong Kong-Zhuhai-Macao Bridge may effectively raise the throughput of container port in Hong Kong.

99
Section D: Question 4 (a) Refer to Figure 4a and Table 4b.
(i) Describe the characteristics of the production operation shown in Figure 4a.
Most candidates correctly described the characteristic of ‘front end shop, backyard factory’. However, some candidates wrongly interpreted the production operation as ‘multi-point production’.

100
Section D: Question 4 (cont.) (a) (i) Describe the characteristics of the production operation shown in Figure 4a.
Candidate correctly describe the characteristics of the production operation shown in Figure 4a.

101
丁部:題 4(續)
(a) 參閱圖 4a 及表 4b。
(i) 描述圖 4a 所示生產運作的特徵。
大部分考生正確地描述「前店後
廠」的特徵,但有部分考生將該
項生產運作誤解為「多邊區位生
產」。
考生只能簡單地描述圖 4a 所示生產運作的特徵。

102
Section D: Question 4 (cont.) (a) (ii) Explain why this production operation occurred in the 1980s.
Most candidates correctly explained the favourable factors for the setting up of factory in Shenzhen but only a minor fraction of candidates mentioned the reasons for Hong Kong as the front end shop.
Candidate has a clear understanding of why this production operation occurred in the 1980s.

103
丁部:題 4(續)
(a) (ii) 解釋為何這類生產運作在 1980 年代出現。
大部分考生正確地解釋在深圳設廠的有利因素,但只有少數考生提 及
香港作為前店角色的原因。
考生了解在深圳生產的優勢,但對香港作為為前店的認識不足。

104
Section D: Question 4 (cont.) (b) Refer to Tables 4b and 4c.
(i) Describe the changes in major types of industry in Shenzhen in the 1980s and 2000s.
Most candidates correctly described the changes in major types of industry in Shenzhen.
Candidate clearly described the changes in major types of industry in Shenzhen.

105
丁部:題 4(續)
(b) 參閱表 4b 及表 4c。
(i) 描述深圳在 1980 年代及 2000 年代主要工業類型的轉變。
大部分考生正確地描述深圳主要工業類型的轉變。
考生未能準確地描述深圳在1980 年代及2000 年代主要工業類型的轉變 。

106
Section D: Question 4 (cont.) (b) (ii) Explain the changes mentioned in (b) (i).
Many candidates explained appropriately the reasons of the changes in major types of industry in Shenzhen.
Candidate clearly explained the changes.

107
丁部:題 4(續)
(b) (ii) 解釋題 (b) (i) 所述的轉變。
很多考生恰當地解釋深圳主要工業類型轉變的原因。
考生未能解釋題 (b) (i) 所述的轉變。
108
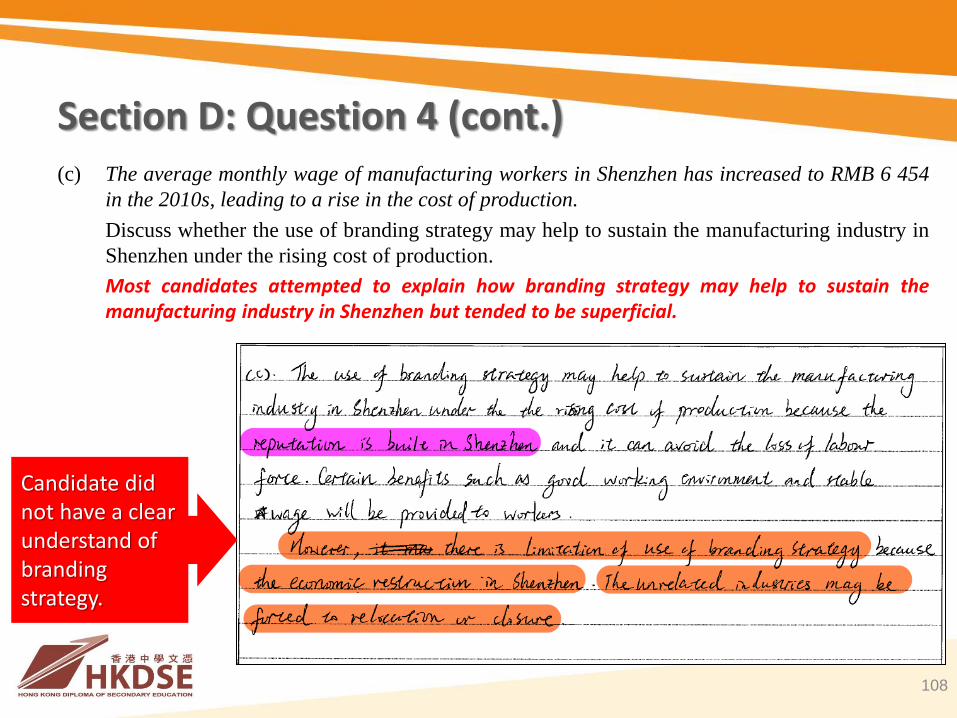
Section D: Question 4 (cont.) (c) The average monthly wage of manufacturing workers in Shenzhen has increased to RMB 6 454
in the 2010s, leading to a rise in the cost of production.
Discuss whether the use of branding strategy may help to sustain the manufacturing industry in
Shenzhen under the rising cost of production.
Most candidates attempted to explain how branding strategy may help to sustain the manufacturing industry in Shenzhen but tended to be superficial.
Candidate did not have a clear understand of branding strategy.

109
丁部:題 4(續)
(b) 2010 年代深圳製造業工人平均月薪已增加至 6 454人民幣,導致生產成本上
升。
討論在生產成本上升的情況下,品牌營銷策略的運用是否有助於持續深圳的
製造業。
大部分考生嘗試解釋品牌營銷策略可如何有助持續深圳的製造業,但答案流
於粗淺。
考生對品牌營銷策略缺乏深入了解。
戊部:題 5 描述主要斷層的分布如何塑造香港的自然景觀。討論所形成的自然景觀會否
影響香港的城市發展。
110
在本題的第一部分,很多考生正確地解釋主要斷層如何塑造香港的自
然景觀,但有部分考生錯誤地指出香港的主要斷層形成了斷塊山及裂
谷。
部分考生正確地描述了主要斷層走向與香港的自然景觀(如:低地、
山谷及小灣)分布的關係,但有少數考生錯誤地指出香港的斷層是形
成小規模地形(如:海蝕穴、海蝕拱)的主要條件。

戊部:題 5(續)
111
考生能描述主要斷層的分布及斷層如何塑造香港的自然景觀。

Section E: Question 5 (cont.) Describe how the distribution of major faults shaped the physical landscape in Hong Kong.
Discuss whether the resultant physical landscape may affect urban development in Hong Kong.
112
In the first part of the question, many candidates correctly explained how major faults shaped the physical landscape in Hong Kong. However, some candidates wrongly stated that the major faults in Hong Kong formed block mountains and rift valleys. Some correctly described the relationship between the orientation of major faults and the distribution of physical landscape (such as lowland, valleys and water inlets) in Hong Kong. However, a small number of candidates wrongly stated the presence of faults in Hong Kong as the major condition for the formation of small scale landforms, such as sea caves and sea arches.
Candidate had limited knowledge of how the distribution of major faults shaped the physical landscape in Hong Kong.

戊部:題 5(續) 描述主要斷層的分布如何塑造香港的自然景觀。討論所形成的自然景觀會否
影響香港的城市發展。
113
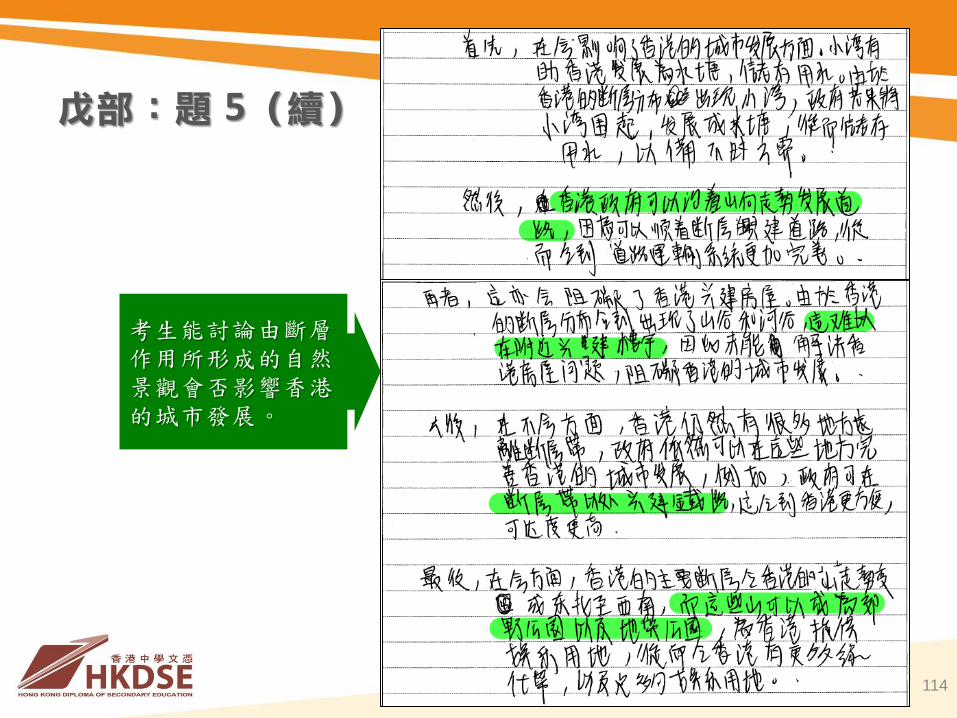
在本題的第二部分,只有少數考生恰當地討論了斷層作用會如何影響
香港的城市發展。部分考生討論了與本題無關的地下岩洞對城市發展
的影響。另有部分考生分不清「城市發展」與「經濟發展」,因此討
論了與本題無關的斷層景觀如何有利於發展旅遊業。
戊部:題 5(續)
114
考生能討論由斷層作用所形成的自然景觀會否影響香港的城市發展。

Section E: Question 5 (cont.) Describe how the distribution of major faults shaped the physical landscape in Hong Kong.
Discuss whether the resultant physical landscape may affect urban development in Hong
Kong.
115
In the second part of the question, only a small number of candidates
discussed appropriately how faulting may affect urban development in Hong
Kong. Some produced irrelevant discussions of the impact of underground
caverns on urban development. Other candidates confused ‘urban
development’ and ‘economic development’, hence they made irrelevant
discussions of how faulting landscape favours the development of tourism.

Section E: Question 5 (cont.)
116
Candidate had limited knowledge of whether the resultant physical landscape of faulting may affect urban development in Hong Kong.

Section E: Question 6 Compare the rainfall characteristics between northern and southern China. Discuss the
effectiveness of the water transfer scheme in alleviating the water problems related to such rainfall
characteristics.
117
In the first part of the question, many candidates correctly described and
explained the differences in rainfall characteristics between northern and
southern China. They also stated the factors affecting rainfall characteristics,
such as monsoon, relief, latitude and the influences of land and sea, etc.
When explaining the rainfall characteristics, some candidates used incorrect
statements, such as ‘uneven distribution of rainfall in North China’ and ‘even
distribution of rainfall in South China’.

Section E: Question 6 (cont.)
118
Candidate could made a clear comparison of the rainfall characteristics between northern and southern China.

戊部:題 6(續) 比較中國北部與南部的降雨特徵。討論調水計畫在紓緩與這些降雨特徵有關
的水問題上的效用。
119
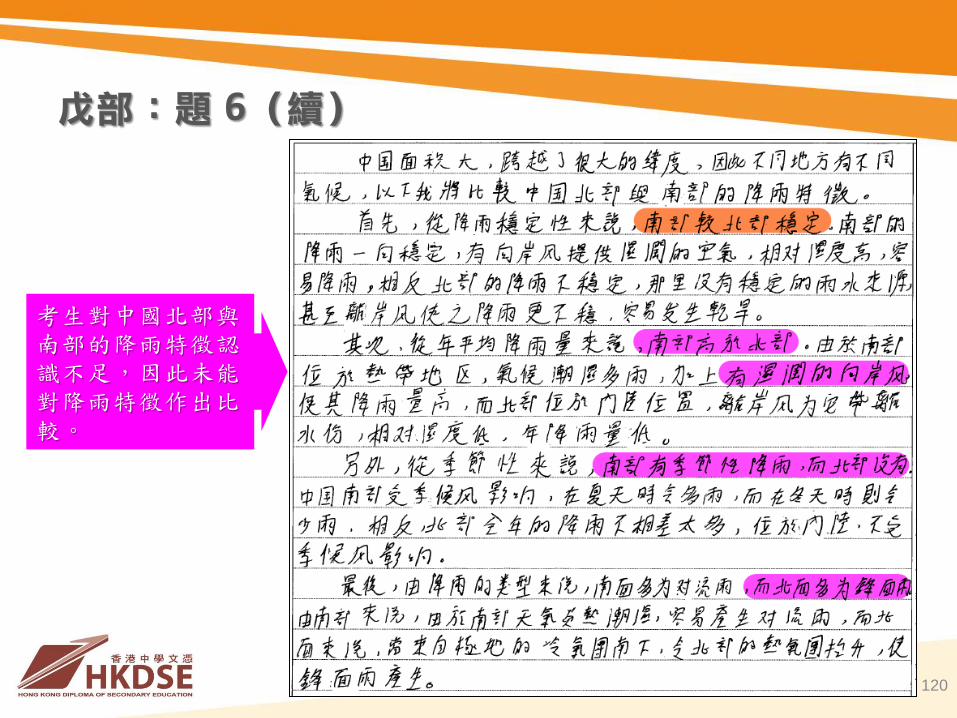
在本題的第一部分,很多考生正確地描述及解釋了中國北部與南部
降雨特徵的差異。他們亦提出了影響降雨特徵的因素,如:季風、
地形、緯度及海洋與陸地的影響等。部分考生在解釋降雨特徵時使
用了不正確的陳述,如:「華北地區雨量分布不平均」及「華南地
區雨量分布平均」。
戊部:題 6(續)
120
考生對中國北部與
南部的降雨特徵認
識不足,因此未能
對降雨特徵作出比
較。

Section E: Question 6 Compare the rainfall characteristics between northern and southern China. Discuss the
effectiveness of the water transfer scheme in alleviating the water problems related to such
rainfall characteristics.
121
In the second part of the question, many candidates wrongly focussed their
answers on the detail of the water transfer scheme, instead of discussing the
effectiveness of the scheme in alleviating the water problems brought about
by rainfall characteristics. Hence they listed only the basic information of the
water transfer scheme, putting aside the discussion of the recent development
of the scheme in alleviating the water problems. Some candidates stated only
the general causes which defeated the effectiveness of the water transfer
scheme, such as high cost, lengthy construction time and absence of inter-
provincial cooperation, etc., or irrelevant answers such as corruption, impact
on wildlife habitat, etc.

Section E: Question 6 (cont.)
122
Candidate had only a superficial understanding of the effectiveness of the water transfer scheme in alleviating the water problems related to such rainfall characteristics.

戊部:題 6(續) 比較中國北部與南部的降雨特徵。討論調水計畫在紓緩與這些降雨特徵有關
的水問題上的效用。
123
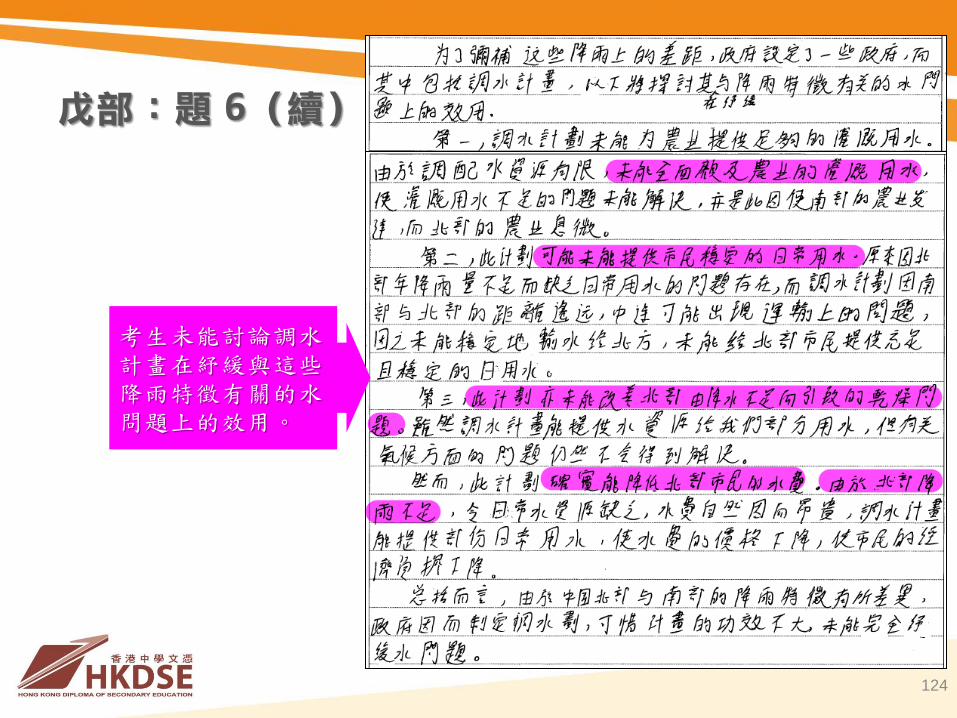
在本題的第二部分,很多考生將答案的重點錯誤地放於調水計畫的詳
情,而非討論該計畫對紓緩降雨特徵所帶來的水問題的效用,因此他
們只列出了調水計畫的基本資料,卻未有討論該計畫在紓緩水問題上
的最新發展。部分考生只提出了令調水計畫無效的普遍原因,如:成
本高昂、建造時間長、各省之間欠缺合作等,或一些與本題無關的答
案,如:貪污、影響野生生物生境等。
戊部:題 6(續)
124
考生未能討論調水
計畫在紓緩與這些
降雨特徵有關的水
問題上的效用。

戊部:題 7 解釋香港的運輸形態如何導致道路擠塞。討論電子道路收費系統在紓緩香港
道路擠塞上的效用。
125
在本題的第一部分,很多考生未有以香港的運輸形態來解釋道路擠
塞,卻提出了無關的原因,如:道路樽頸。
考生未能解釋香港的運輸形態如何導致道路擠塞。

Section E: Question 7 (cont.) Explain how the transport patterns in Hong Kong cause road congestion. Discuss the
effectiveness of electronic road pricing in alleviating road congestion in Hong Kong.
126
In the first part of the question, many candidates did not explain road
congestion with regard to the transport patterns in Hong Kong. They instead
mentioned irrelevant causes such as bottle neck of roads.
Candidate had only basic knowledge of the transport patterns in Hong Kong.

Section E: Question 7 (cont.)
127
Candidate was unable to explain how the transport patterns would cause road congestion.

戊部:題 7(續) 解釋香港的運輸形態如何導致道路擠塞。討論電子道路收費系統在紓緩香港
道路擠塞上的效用。
128
在本題的第二部分,很多考生將隧道收費的「快易通」誤解為「電子
道路收費系統」,顯示他們對於後者的認識有限。
考生對電子道路收費系統缺乏認識。

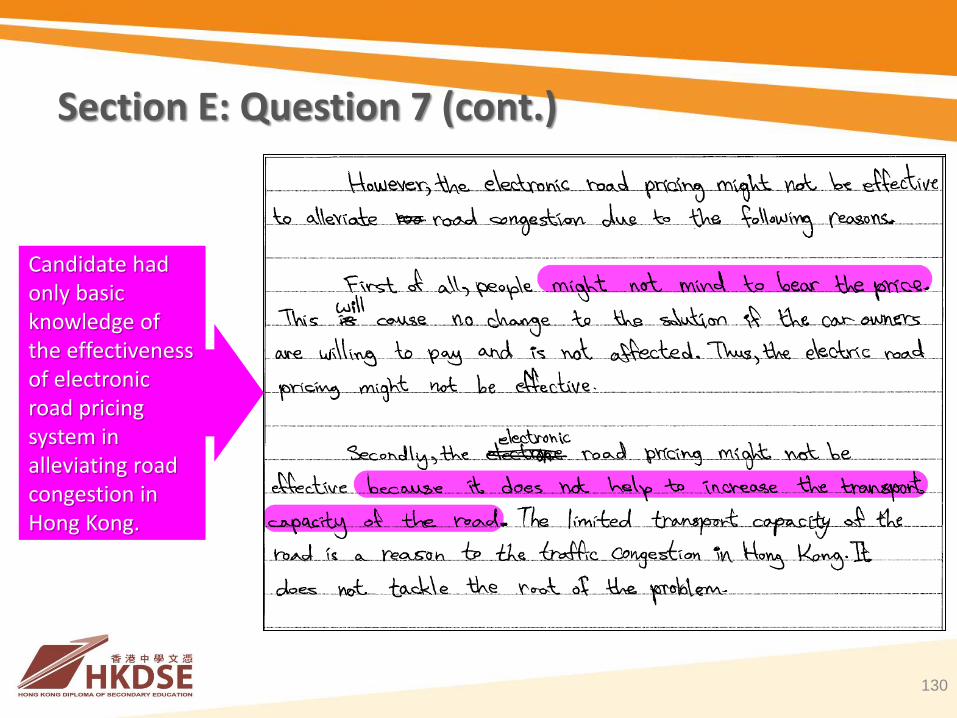
Section E: Question 7 (cont.) Explain how the transport patterns in Hong Kong cause road congestion. Discuss the
effectiveness of electronic road pricing in alleviating road congestion in Hong Kong.
129
In the second part of the question, many candidates showed little
understanding of ‘electronic road pricing’ and misinterpreted it as ‘Autotoll’ of
tunnel fees.
Candidate had only basic knowledge of the effectiveness of electronic road pricing system in alleviating road congestion in Hong Kong.
Section E: Question 7 (cont.)
130
Candidate had only basic knowledge of the effectiveness of electronic road pricing system in alleviating road congestion in Hong Kong.

Section E: Question 8 Explain why the air pollution problem is becoming more serious in the Zhujiang Delta
Region in recent years. Discuss whether cross-border cooperation may help alleviate air
pollution in the Zhujiang Delta Region.
131
In the first part of the question, many candidates gave the correct reasons of
the worsening of the air pollution problem in the Zhujiang Delta Region.
Some candidates confused ‘greenhouse gases’ and ‘air pollutants’. Some
chronicled the situation starting from the 1980s instead of explaining the
situation ‘in recent years’ as stated in the question.

Section E: Question 8 (cont.)
132
Candidate had a clear understanding of why the air pollution problem is becoming more serious in the Zhujiang Delta Region in recent years.

戊部:題 8(續) 解釋近年珠江三角洲地區的空氣污染問題為何日益嚴重。討論跨境協作是否
有助於紓緩珠江三角洲地區的空氣污染。
133
在本題的第一部分,很多考生提出了導致近年珠江三角洲地區的空氣
污染問題惡化的正確原因。部分考生分不清「溫室氣體」與「空氣污
染物」。部分考生從1980 年代開始解釋,而非題目所列明的「近年」
情況。

戊部:題 8(續)
134
考生未能解釋近年珠江三角洲地區的空氣污染問題為何日益嚴重。

Section E: Question 8 (cont.) Explain why the air pollution problem is becoming more serious in the Zhujiang Delta Region in
recent years. Discuss whether cross-border cooperation may help alleviate air pollution in
the Zhujiang Delta Region.
135
In the second part of the question, many candidates showed little
understanding of the cross-border cooperation between Hong Kong and the
Guangdong Province. Some misinterpreted cross-border cooperation as inter-
provincial cooperation or international cooperation, giving incorrect answers
such as ‘international disputes defeat the effectiveness of cooperation’.
Candidate had little Understanding of cross-border cooperation between Hong Kong and the Guangdong Province.

戊部:題 8(續) 解釋近年珠江三角洲地區的空氣污染問題為何日益嚴重。討論跨境協作是否
有助於紓緩珠江三角洲地區的空氣污染。
136
在本題的第二部分,很多考生對香港與廣東省的跨境協作的認識有
限。部分考生將跨省協作或跨國協作誤解為跨境協作,並提出了如
「國際爭議令協作無效」這類錯誤答案。

戊部:題 8(續)
137
考生對跨境協作是否有助於紓緩珠江三角洲地區的空氣污染缺乏認識。

Overall Comments in Sections D & E
• Candidates should study the questions carefully to
avoid giving wrong answers because they may have
overlooked key geographical terminology.
• Candidates should interpret the data and information
provided in the questions carefully. They should also
apply geographical knowledge and concepts to
specific situations or cases in the questions.
138

Overall Comments in Sections D & E (cont.)
• Candidates should organise their ideas systematically
and logically. They should also provide relevant
examples to demonstrate their understanding of the
concepts and spatial location of the cases.
• In the short essay questions, candidates should put
forward concrete arguments and state their stands
clearly and logically. They should give clear and
definite descriptions, arguments and conclusions in
their answers.
139

Overall Comments in Sections D & E (cont.)
• Candidates should answer the questions appropriately by referring to the directive terms given. They should avoid giving answers by rote learning the content in textbooks.
• Candidates should familiarise themselves with the recent development of geographical issues in Hong Kong, China and the world as such issues are changing over time. Teachers are also reminded to keep abreast of the most current geographical issues into their teaching.
140

Information of 2019 HKDSE Geography Examination

Reminders for Candidates in 2019 Geography Examination
• Self-made transparent plastic sheets with gridlines are NOT allowed
• DO NOT use colour pencils, colour marker pens or highlighters
• CLEAR HANDWRITING is essential for accurate marking
• Mark CAREFULLY & ACCURATELY the question number box on
EACH PAGE of the Answer Book
• Pay SPECIAL ATTENTION to the new question numbering in Sections B, C & D of Paper 1
• Study carefully the 2019 Handbook for Candidates
142

Assessment Framework for 2019 Geography Examination
143

Topics for Fieldwork-based Question in Coming HKDSE Geography Examinations
144
2019 Examination 2020 Examination 2021 Examination
• Managing Coastal
Environment
• Changing Industrial
Location
• Building a Sustainable
City
• Managing Coastal
Environment
• Building a Sustainable
City
• Combating Famine
• Opportunities and
Risks
• Building a Sustainable
City
• Combating Famine

145
Components of Geography Paper 1 (Starting from 2019 examination)
Section Question Type Number of
Question(s) to be Answered
Weighting Raw
Score
A Multiple-choice 20 20% 1 x 20
B Fieldwork-based 1 (Compulsory) 15% 18 x 1
C Data/Skill-based/Structured 2 out of 4 30% 18 x 2
D Short Essay 1 out of 3 10% 12 x 1

146
Components of Geography Paper 2 (Starting from 2019 examination)
Section Question Type Number of
Question(s) to be Answered
Weighting Raw
Score
E Data/Skill-based/Structured 1 out of 4 15% 18 x 1
F Short Essay 1 out of 4 10% 12 x 1
The two questions chosen from Sections E and F respectively can be taken from the
same or different electives.

147
Subject Information of HKDSE Geography on HKEAA Website
(http://www.hkeaa.edu.hk/en/hkdse/assessment/subject_information/category_a_subjects/hkdse_subj.html?A2&2&13)

148
Sample Format of HKDSE Geography Paper 1 (Applicable to the 2019 HKDSE and Onwards)

Reminders for Paper 2 from 2019 Geography Examination
• Paper 2 will consist of 2 sections (E & F) and the
questions will be set from the Elective Part.
• Both Sections E and F will consist of 4 questions each.
Candidates are required to choose 1 question from
each section, of which the 2 questions chosen can be
taken from the SAME or DIFFERENT electives.
149

For enquiries and suggestions, please contact:
Patrick Tam
Manager-Assessment Development (Geography), HKEAA
Direct Line: 3628 8013
E-mail: [email protected]
Thank You for Your Participation
150