Brain structural differences associated with the behavioural phenotype in children with Williams...
11
Neuropsychologia 47 (2009) 1034–1044 Contents lists available at ScienceDirect Neuropsychologia journal homepage: www.elsevier.com/locate/neuropsychologia A comparative study of cognition and brain anatomy between two neurodevelopmental disorders: 22q11.2 deletion syndrome and Williams syndrome Linda E. Campbell a,b,∗ , Angela Stevens a , Eileen Daly a , Fiona Toal a,d , Rayna Azuma a , Annette Karmiloff-Smith c , Declan G.M. Murphy a , Kieran C. Murphy d a Section of Brain Maturation, Institute of Psychiatry, King’s College London, United Kingdom b Priority Research Centre for Brain & Mental Health, University of Newcastle, Australia c Centre for Brain & Cognitive Development, Birkbeck, University of London, United Kingdom d Department of Psychiatry, Royal College of Surgeons in Ireland, Dublin, Ireland article info Article history: Received 18 March 2008 Received in revised form 14 October 2008 Accepted 31 October 2008 Available online 13 November 2008 Keywords: 22q11.2 deletion syndrome Velo-cardio-facial syndrome Williams syndrome Magnetic resonance imaging Cognition abstract Background: 22q11.2 deletion syndrome (22q11DS) is associated with intellectual disability, poor social interaction and a high prevalence of psychosis. However, to date there have been no studies comparing cognition and neuroanatomical characteristics of 22q11DS with other syndromes to investigate if the cognitive strengths and difficulties and neuroanatomical differences associated with 22q11DS are specific to the syndrome. Hence, it is difficult to know if the observed features of 22q11DS are simply due to a non-specific effect of having a genetic disorder or are specific to 22q11DS. Methods: In this study, cognition and brain anatomy of 12 children with 22q11DS were compared to 12 age, gender and full scale IQ (FSIQ) matched children with William syndrome (WS) in order to investigate which cognitive and neuroanatomical features are specific to 22q11DS. We chose WS since the literature suggests that both groups have areas of physical/cognitive/behavioural overlap but as yet there has been no direct comparison of the two groups. Results: Despite being matched on FSIQ the WS group had significantly greater impairment than those with 22q11DS on tests of Performance IQ, while performing significantly better on tasks measuring verbal, social and facial processing skills. Moreover there were significant differences in brain anatomy. Despite similar overall brain volumes, midline anomalies were more common among the 22q11DS group, and regional differences such as increased striatal volumes and reduced cerebellar volumes in the 22q11DS group were detected. Conclusions: These findings suggest that although the behavioural phenotype is similar in some aspects there are key differences in cognition and neuroanatomy between the two groups. Different neuropsy- chological profiles need to be considered when designing educational frameworks for working with these children. © 2008 Elsevier Ltd. All rights reserved. 1. Introduction Velo-cardio-facial syndrome, or 22q11.2 Deletion Syndrome (22q11DS), one of the most common genetic syndromes, occurs Abbreviations: 22q11DS, 22q11.2 deletion syndrome; WS, Williams syndrome; MRI, magnetic resonance imaging. Presented at the Society for the Study of Behavioural Phenotypes 11th Annual Scientific Meeting, Royal College of Surgeons, Dublin, Ireland, 2006. ∗ Corresponding author at: Priority Research Centre for Brain & Mental Health, Officers Quarters Complex, James Fletcher Hospital, Newcomen Street, Newcastle, NSW 2300, Australia. Tel.: +61 2 4924 6648; fax: +61 2 4924 6608. E-mail address: [email protected] (L.E. Campbell). with a prevalence of 1:4000–5000 (Botto et al., 2003). Peo- ple with 22q11DS often have lowered intellectual functioning and problems with cognitive functions such as attention, execu- tive functions and memory (Bearden et al., 2001; Bish, Ferrante, McDonald-McGinn, Zackai, & Simon, 2005; Henry et al., 2002). Also, behavioural problems such as Attention-Deficit/Hyperactivity disorder, autism spectrum disorders and psychosis are prevalent (Gothelf et al., 2004; Murphy, Jones, & Owen, 1999; Vorstman et al., 2006). However, the majority of studies have used non-full scale IQ (FSIQ) matched control groups. A few studies of cognition in peo- ple with 22q11DS have used learning disabled control groups (Debbané, Van der Linden, Glaser, & Eliez, 2008; Glaser et al., 2002; 0028-3932/$ – see front matter © 2008 Elsevier Ltd. All rights reserved. doi:10.1016/j.neuropsychologia.2008.10.029
-
Upload
independent -
Category
Documents
-
view
2 -
download
0
Transcript of Brain structural differences associated with the behavioural phenotype in children with Williams...

Ana
LAa
b
c
d
a
ARRAA
K2VWMC
1
(
M
S
ON
0d
Neuropsychologia 47 (2009) 1034–1044
Contents lists available at ScienceDirect
Neuropsychologia
journa l homepage: www.e lsev ier .com/ locate /neuropsychologia
comparative study of cognition and brain anatomy between twoeurodevelopmental disorders: 22q11.2 deletion syndromend Williams syndrome�
inda E. Campbell a,b,∗, Angela Stevensa, Eileen Dalya, Fiona Toala,d, Rayna Azumaa,nnette Karmiloff-Smithc, Declan G.M. Murphya, Kieran C. Murphyd
Section of Brain Maturation, Institute of Psychiatry, King’s College London, United KingdomPriority Research Centre for Brain & Mental Health, University of Newcastle, AustraliaCentre for Brain & Cognitive Development, Birkbeck, University of London, United KingdomDepartment of Psychiatry, Royal College of Surgeons in Ireland, Dublin, Ireland
r t i c l e i n f o
rticle history:eceived 18 March 2008eceived in revised form 14 October 2008ccepted 31 October 2008vailable online 13 November 2008
eywords:2q11.2 deletion syndromeelo-cardio-facial syndromeilliams syndromeagnetic resonance imaging
ognition
a b s t r a c t
Background: 22q11.2 deletion syndrome (22q11DS) is associated with intellectual disability, poor socialinteraction and a high prevalence of psychosis. However, to date there have been no studies comparingcognition and neuroanatomical characteristics of 22q11DS with other syndromes to investigate if thecognitive strengths and difficulties and neuroanatomical differences associated with 22q11DS are specificto the syndrome. Hence, it is difficult to know if the observed features of 22q11DS are simply due to anon-specific effect of having a genetic disorder or are specific to 22q11DS.Methods: In this study, cognition and brain anatomy of 12 children with 22q11DS were compared to 12age, gender and full scale IQ (FSIQ) matched children with William syndrome (WS) in order to investigatewhich cognitive and neuroanatomical features are specific to 22q11DS. We chose WS since the literaturesuggests that both groups have areas of physical/cognitive/behavioural overlap but as yet there has beenno direct comparison of the two groups.Results: Despite being matched on FSIQ the WS group had significantly greater impairment than thosewith 22q11DS on tests of Performance IQ, while performing significantly better on tasks measuring verbal,social and facial processing skills. Moreover there were significant differences in brain anatomy. Despite
similar overall brain volumes, midline anomalies were more common among the 22q11DS group, andregional differences such as increased striatal volumes and reduced cerebellar volumes in the 22q11DSgroup were detected.Conclusions: These findings suggest that although the behavioural phenotype is similar in some aspectsthere are key differences in cognition and neuroanatomy between the two groups. Different neuropsy-chological profiles need to be considered when designing educational frameworks for working with these children.. Introduction
Velo-cardio-facial syndrome, or 22q11.2 Deletion Syndrome22q11DS), one of the most common genetic syndromes, occurs
Abbreviations: 22q11DS, 22q11.2 deletion syndrome; WS, Williams syndrome;RI, magnetic resonance imaging.
� Presented at the Society for the Study of Behavioural Phenotypes 11th Annualcientific Meeting, Royal College of Surgeons, Dublin, Ireland, 2006.∗ Corresponding author at: Priority Research Centre for Brain & Mental Health,fficers Quarters Complex, James Fletcher Hospital, Newcomen Street, Newcastle,SW 2300, Australia. Tel.: +61 2 4924 6648; fax: +61 2 4924 6608.
E-mail address: [email protected] (L.E. Campbell).
wpatMAd(2
(p(
028-3932/$ – see front matter © 2008 Elsevier Ltd. All rights reserved.oi:10.1016/j.neuropsychologia.2008.10.029
© 2008 Elsevier Ltd. All rights reserved.
ith a prevalence of 1:4000–5000 (Botto et al., 2003). Peo-le with 22q11DS often have lowered intellectual functioningnd problems with cognitive functions such as attention, execu-ive functions and memory (Bearden et al., 2001; Bish, Ferrante,
cDonald-McGinn, Zackai, & Simon, 2005; Henry et al., 2002).lso, behavioural problems such as Attention-Deficit/Hyperactivityisorder, autism spectrum disorders and psychosis are prevalentGothelf et al., 2004; Murphy, Jones, & Owen, 1999; Vorstman et al.,
006).However, the majority of studies have used non-full scale IQFSIQ) matched control groups. A few studies of cognition in peo-le with 22q11DS have used learning disabled control groupsDebbané, Van der Linden, Glaser, & Eliez, 2008; Glaser et al., 2002;

sychol
Htcpiocpio‘aooaawrnTsciSrcbmaufcXttt2ttSa
aFobbm2afaacewe
l(bfBhv
rbmeRb2spfiWFrtCwraopta
hob2wbiWfrWdisec
2
2
bsGW(TgScpitt2asto
L.E. Campbell et al. / Neurop
enry et al., 2002). In one such study, Glaser et al. (2002) inves-igated language skills in children with 22q1DS compared withhildren with idiopathic developmental delay. They report that theattern of expressive and receptive impairments were different
n the two groups, with the 22q11DS children performing bettern expressive compared with receptive language. However, bothlinical groups were equally impaired on word associations com-ared with a group of typically developing controls. This approach
s important in providing information about the general patternf impairment in the syndrome and whether some domains are
spared’ (although this does not necessary mean that the processesre intact). However, it is also important to compare 22q11DS withther developmentally delayed groups with a known genetic aeti-logy to investigate if there are specific aetiology-related strengthsnd difficulties associated with 22q11DS and/or if characteristicsre shared by some other aetiological groups or perhaps are sharedith most people with a learning disability. One such study has
ecently been published, Simon et al. (2008) conducted a study ofumeracy in children with 22q11DS compared with females withurner Syndrome and found that both clinical groups performedimilarly on the tasks despite differences in intellectual ability indi-ating that the impairments were not due to global differences inntelligence but rather due to deficits of specific cognitive functions.uch understanding is vital in selecting appropriate educationalemediation strategies for children with genetic syndromes. Espe-ially since it has been found that genetic disorders, with particularehavioural phenotypes, can elicit specific behaviours from others,odulating interaction and reinforcement (Ly & Hodapp, 2005) and
lso influence type of education offered, potentially resulting innderachievement (Whittington et al., 2004). There have been a
ew studies investigating the behavioural phenotype in 22q11DSompared with e.g., people with Prader-Willi syndrome, Fragile
and Williams syndrome. One such study indicated that whilehe children with 22q11Ds were equally extravert and agreeable,hey were less conscientious and emotional stable and more irri-able and dependent compared with other groups (Prinzie et al.,002). Although cross-syndrome comparisons have been made athe behavioural level, there exist no studies that have comparedhe neuroanatomical phenotype of 22q11DS with other syndromes.uch imaging data can provide additional insights into the neuralnd genetic basis of the behavioural phenotype.
The current study is the first to compare cognitive functionnd neuroanatomical characteristics in 22q11DS children with anSIQ matched group of children with another microdeletion dis-rder, facilitating the identification of specific characteristics inoth groups. We chose to use Williams syndrome since it haseen reported that children with Williams syndrome (WS) shareany characteristics with those of 22q11DS children. People with
2q11DS and WS share a high prevalence of physical problems suchs heart abnormalities, feeding difficulties, sensitive hearing andacial dysmorphology. The two groups also share many person-lity characteristics and experience problems with peer relations,nxiety, concentration and over-activity (Prinzie et al., 2002). Theommonalities between the two syndromes, especially the sharednvironmental influences from early corrective surgeries, problemsith social interaction and learning problems, makes WS an inter-
sting comparison group to 22q11DS.In addition, both syndromes are characterised by lower intel-
ectual functioning, including problems with non-verbal abilitiesMervis & Klein-Tasman, 2000; Swillen et al., 1997). Indeed, it has
een reported that 63% of people with 22q11DS meet all the criteriaor the characteristic ‘Williams Syndrome Cognitive Profile’ (WSCP,earden, Wang, & Simon, 2002). While people with both syndromesave a relatively preserved (volume) of the frontal lobes there areolumetric reductions of the posterior parts of the brain, such as2
ac(
ogia 47 (2009) 1034–1044 1035
eductions of grey matter in the parieto-occipital regions. It has alsoeen reported that both syndromes have larger reductions of whiteatter compared with grey matter (Boddaert et al., 2006; Campbell
t al., 2006; Eliez, Schmitt, White, & Reiss, 2000; Kates et al., 2001;eiss et al., 2004, 2000). While there has only been one study ofrain anatomy in school-aged children with WS (Boddaert et al.,006) reporting reductions in the parieto-occipital regions, severaluch studies in 22q11DS have reported anatomical differences com-ared with ‘typically’ developing controls. When comparing thesendings to those reported in studies of children and adults withS some regions appear differentially affected by the deletions.
or example, there have been reports of reduced amygdala volumeeductions in 22q11DS (Deboer, Wu, Lee, & Simon, 2007) whilsthis region is increased in Williams syndrome (Reiss et al., 2004).onversely the basal ganglia has been found to be larger in peopleith 22q11DS compared to ‘typically’ developing brains while the
egion is volumetrically smaller in people with WS (Campbell etl., 2006; Chiang et al., 2007). Furthermore, structural alterationsf the cerebellum and fusiform gyrus have been reported in peo-le with 22q11DS (Campbell et al., 2006; Glaser et al., 2007) whilehese regions appear well preserved in people with WS (Chiang etl., 2007).
The current study is one of the first studies to use a compre-ensive battery to compare children 22q11DS and children withther disorders at a cognitive and neuroanatomical level. On theasis of previous literature, we hypothesised that: (1) children with2q11DS would have similar intellectual profiles to WS children,ith increased verbal relative to non-verbal abilities since this has
een reported in both groups but in separate studies. However, its not known whether this effect is stronger in either group; (2) the
S group would perform better on sociability and social cognitiveunctioning than the 22q11DS group. Although both groups expe-ience social interactive problems, the pattern is reversed with the
S children often described as hypersocial and the 22q11DS chil-ren as hyposocial: (3) there would be syndrome specific changes
n the amygdala, fusiform gyrus, lateral ventricles, cerebellum, andtriatum. These regions have been found to be structurally differ-nt in 22q11DS and/or WS compared with ‘typically’ developinghildren.
. Methods
.1. Participants
The study included 12 children with 22q11DS (9 had a de novo deletion, 5 girls, 7oys, mean age = 11 (SD = 3), mean FSIQ = 59 (SD = 6)) with a demonstrated chromo-ome 22q11.2 deletion using fluorescence in situ hybridisation (FISH) (Oncor Inc.,aithersburg, MD 20877, USA). The comparison group consisted of 12 children withilliams syndrome (WS) (5 girls, 7 boys, mean age = 12 (SD = 4), mean FSIQ = 58
SD = 6)) with a confirmed microdeletion at chromosome 7q11.23 using a FISH test.he cohorts were matched for gender, age and FSIQ. The mean FSIQ in the 22q11DSroup was lower than typically reported for the syndrome. In a recent study, Demedt and colleagues reported a mean FSIQ of 73 (range 50–109) in a study of 103hildren with 22q11DS (De Smedt et al., 2007). Hence the current sample was com-ared with a larger group of 22q11DS people (n = 38, mean FSIQ = 68, partly reported
n Campbell et al. (2006, in preparation) on the tasks used in the current study. Thewo groups differed on the WISC-III FSIQ score, but did not differ on the cognitiveasks administered in the present study. The participants were recruited from the2q11DS (UK) support group and the Williams Syndrome Foundation to minimisescertainment bias. Each family was provided with a complete description of thetudy before consent was obtained under protocols agreed by local ethical commit-ees. Some individuals did not complete the MRI scan. Anatomical results are basedn a subgroup of nine pairs matched on chronological age, gender and FSIQ.
.2. Procedure
The cognitive battery was designed to assess general cognitive functionnd psychoeducational abilities. To measure intellectual functioning the childrenompleted the full ‘Wechsler Intelligence Scales for Children—third edition (UK)’WISC-III UK; Wechsler, 1991). This provides four index scores, representing the

1 sycho
fdmfD(FaT(t(Owoansfood
3
3
iaGwvfT
4
4
aiasbwa1
5
5
cDdbatwmmsTwt
atmawm
5
swHuvlontrer(
6
6
dnavo0uaaWmdso(asbc
6
hpd
7
X2 or the Fisher Exact Probability Test analyses (depending
036 L.E. Campbell et al. / Neurop
ollowing domains: verbal comprehension, perceptual organisation, freedom fromistractibility and processing speed. In addition, the following educational instru-ents were administered: the ‘British Picture Vocabulary Scale’ (BPVS); the ‘Test
or the Reception of Grammar’ (TROG; Bishop, 1983); ‘Wechsler Objective Numericalimensions’ (WOND; Wechsler, 1995); the ‘Wechsler Objective Language Dimensions’
WOLD); and the ‘Wechsler Objective Reading Dimensions’ (WORD; Wechsler, 1983).or memory functioning, the ‘Children’s Memory Scale’ (CMS; Cohen, 1997) was useds a comprehensive measure of different aspect of episodic memory and learning.o measure fine motor speed and manipulative dexterity ‘The Grooved Pegboard’GPB) was used (Lafayette Instrument Co. Loughborough, UK). To test visuopercep-ual abilities we selected subtests from the ‘Birmingham Object Recognition Battery’BORB). The tasks used were the Foreshortened and Minimal features view tasks,bject decision, Picture naming and Associative matching. In addition a set of testsere chosen to measure social cognition and sociability. This included first and sec-
nd order ‘Theory of Mind’ tasks (the Smarties task, Sally-Ann and Chocolate task)nd the ‘Strange Stories’ tasks (with stories requiring mentalising and those that didot, termed physical stories; Frith, 1989; Happé, 1994) and the ‘Interactive sociabilitycale’ (R. Goodman, personal communication). Different aspects that contribute toacial emotion perception were measured using the ‘Medical Research Council devel-pment of face processing skills battery’, requiring participants to match faces basedn emotional expression, identity or facial speech, and the identification of eye gazeirectionality (Bruce et al., 2000).
. MRI protocol
.1. Image acquisition
Whole-head coronal 3D “Spoiled Gradient Recalled Acquisitionn Steady State” (SPGR) images (TR = 11.9 ms, TE = 5.2 ms, 256 × 192cquisition matrix, 124 mm × 1.5 mm slices) was obtained using aE Signa 1.5T Neuro-optimised MR system (General Electric, Mil-aukee WI, USA) at the Maudsley Hospital, London, UK. For the
isual neuroradiological assessments a whole brain axial dual echoast spin echo images was acquired (TR = 4000 ms, TE1 = 20 ms,E2 = 100 ms, 256 × 256 acquisition matrix, 60 mm × 3 mm slices).
. Data analysis
.1. Qualitative assessment
A qualitative assessment of the MRI scans was performed byneuroradiologist (VN) blind to subject group status. A standard-
sed protocol was used to assess the presence or absence of midlinebnormalities such as cavum septum pellucidum and vergae whileubsequent neurodevelopmental abnormalities were labelled aseing present or absent. White matter hyperintensities (WMHI’s)ere assessed using a four-point rating scale in accordance withstandardised protocol published elsewhere (Kozachuk et al.,
990).
. Automated MRI analysis
.1. Pre-processing of structural data
The images were pre-processed using the ‘Optimized proto-ol’ for ‘Statistical Parametric Mapping’ software (SPM2, Wellcomeepartment of Imaging Neurosciences, University College Lon-on). A detailed description of the image processing steps haveeen described elsewhere (Ashburner & Friston, 2000; Good etl., 2001). To ensure a reliable segmentation, study-specific cus-omised prior probability maps were created. The steps in SPM2ere: (1) the images were segmented into grey matter, whiteatter and CSF; (2) the segmented tissue type maps were nor-
alised to the corresponding specific tissue template to preventkull and other non-brain voxels from being included in the model.he derived warping parameters were applied to the original T1-eighted image to map it into standard MNI space. This image was
hen re-sliced with a voxel size of 1.5 mm × 1.5 mm × 1.5 mm: (3) to
oeNa(
logia 47 (2009) 1034–1044
chieve optimal performance the images were re-segmented; (4)he maps were corrected for volume changes occurring due to nor-
alisation; and (5) the images were smoothed at 5-mm Full-Widtht Half-Maximum (FWHM). Total grey and white matter volumesere calculated from the segmented, normalised and modulatedaps.
.2. Manual tracing
The 3D whole-head coronal spoiled-gradient acquisition in theteady state (SPGR) images were imported into the Measure soft-are program (Barta, Dhingra, Royall, & Schwartz, 1997; Johnsopkins University, Baltimore, MD, USA) for the volumetric man-al tracing of brain structures. Regional volumes (total intracranialolume and bulk tissue volume, i.e., grey + white matter of right andeft cerebral hemispheres, frontal, temporal, parietal and parieto-ccipital lobes, lateral and third ventricles, hippocampus, caudateucleus, putamen and cerebellum) were obtained by multiplyinghe summed pixel cross-sectional areas by slice thickness in eachegion-of-interest (for anatomical definitions, see van Amelsvoortt al., 2004). Intraclass correlation computation for traced brainegions were used to determine inter and intra-rater reliabilitiesrange; 0.89–0.92; Bartko & Carpenter, 1976).
. Statistical analysis
.1. Cognition
Statistical analyses were performed in SPSS (SPSS 11.0 for win-ows, SPSS Inc., Chicago, IL, USA). All variables were checked forormality and if not present, a natural log transformation waspplied to improve normality. For all cognitive variables an alphaalue of p < 0.05 (two-tailed) was used. The effect sizes werebtained from the SPSS output, partial eta squared (0.01 = small,.06 = moderate, 0.14 = large). Independent samples t-tests weresed to investigate group differences in FSIQ, Verbal IQ (VIQ), PIQnd motor coordination. One-way between groups multivariatenalysis of variance (MANOVA) was used for the analyses of theISC-III factor index scores and subtests, memory and achieve-ent measures. A mixed between-within ANOVA assessed group
ifferences in the physical and mentalising ‘Strange Stories’. Chi-quare (�2) tests were used to assess differences in the distributionf VIQ-PIQ discrepancies and performance on the ‘Theory of Mind’ToM) tasks. A non-parametric Mann–Whitney U test was used tonalyse facial and object perceptual processing. Due to the smallample size in the current study, all parametric tests were repeatedy means of appropriate non-parametric methods, but this did nothange the pattern of the reported results.
.2. Total grey and white matter volume
Total grey matter volume was not normally distributed andence, a non-parametric Mann–Whitney U test was used to com-are groups. An independent t-test was used to assess groupifferences in total white matter volume.
. Radiological assessment
n cell size) were used to investigate between-group differ-nces in radiological visual assessment of the structural images.on-parametric Mann–Whitney (two-tailed) test was used tossess between-group differences of white matter hyperintensitiesWMHI’s).

sychologia 47 (2009) 1034–1044 1037
7
Mmetcscistyf
7
thtWmdcbpswwse
7
7
F
7
nMd1
TD
NG
M
M
S
Al
c2bepS(wtpiSptphp
psic
L.E. Campbell et al. / Neurop
.1. Analysis of MRI data by automated VBM analysis
Using fully automated and computerised ‘Brain Activation andorphological Mapping’ (BAMM) software, regional grey and whiteatter differences across the whole brain were mapped (Bullmore
t al., 1999; Sigmundsson et al., 2001). The data were corrected forotal grey or white matter volume and analysed using an analysis ofovariance (ANCOVA) model at all intracerebral voxels in standardpace while regional relationships were tested at the level of voxellusters (Bullmore et al., 1999; Sigmundsson et al., 2001). Statisticsncluding 3D cluster mass spatial information are powerful, sincetructural brain changes are likely to extend over a number of con-iguous voxels. The cluster significance threshold was chosen toield an expected number of false positive clusters less than onealse positive per analysis.
.2. Manually traced regions
Hand traced brain regions were expressed as a percentage of theotal intracranial volume to control for the relationship betweenead size and cerebral volume. A one-way between-groups mul-ivariate analysis of variance (MANOVA) with group (22q11DS or
S control) as a between-subject variable was utilised to esti-ate any manually traced total or regional brain volume group
ifferences with follow-up univariate analyses to investigate spe-ific regional volumetric differences. Due to strong correlationsetween ROI’s, Multivariate analyses of variance (MANOVAs) wereerformed with the total, left, and right hemisphere measureseparately. Whole brain volume and total intracranial volumeere analysed separately with independent samples t-tests. Thereas one extreme WS outlier in the lateral ventricular mea-
ures and therefore non-parametric (Mann–Whitney U test) wasmployed.
.3. Results
.3.1. Demographic data (see Table 1)There were no significant between-group differences in age,
SIQ or gender (p > 0.7).
.3.2. Cognition (see Table 2)
Despite being matched on FSIQ, the 22q11DS group had sig-ificantly higher Performance IQ (PIQ) (t(22) = 3.08, p = 0.006).ore individuals with WS had a clinically significant VIQ > PIQ
iscrepancy (11 points or higher). (In the 22q11DS group onlyhad a clinically higher VIQ than PIQ while 7 had such a dis-
able 1emographical information.
22q11DS WS
umber 12 12ender (male/female) 7/5 7/5
ean CA (SD) 11 (3) 12 (4)CA range 6–16 6–16
ean FSIQ (SD) 59 (6) 58 (6)FSIQ range 52–71 50–71
choolingMainstream 4 –Main with help 4 3MLD 3 3SLD – 4Other 2 2
bbreviations: CA: chronological age; MLD: Moderate learning disability; SLD: severeearning disability.
ptab
Graph 1. Intellectual profile in WS.
repancy in the WS group.) (X2 = 7.2, p = 0.03; see Graphs 1 and). Performance on the four index scores differed significantlyetween groups (F(4,19) = 7.8, p = 0.001, Pillai’s Trace = 0.6, partialta squared = 0.6) and follow-up tests revealed that the WS grouperformed worse on Processing Speed (F(1,22) = 19.4, p = 0.0005).ubtest performance also differed significantly between the groupsF(13,10) = 3.2, p = 0.04, Pillai’s Trace = 0.8, partial eta squared = 0.8)ith further analyses disclosing a better performance on the sub-
ests of Coding (F(1,22) = 26.2, p = .0005), Mazes (F(1,22) = 17.95,= 0.005) and a similar trend on Block Design (F(1,22) = 4.5, p = 0.05)
n the 22q11DS group while the WS performed better on theimilarities (F(1,22) = 5.2, p = 0.03) and Vocabulary (F(1,22) = 6.0,= 0.02) subtests. There were no significant group differences on
he educational, memory or motor coordination tasks or object-erceptual tasks (p > 0.05) although the WS children appeared toave more problems with learning in the CMS (F(1,21) = 11.39,= 0.003) (Table 3 ).
On the social cognition tests, there were no differences on theass or fail rate on the Theory of Mind tasks or the social interactioncale. There was a main effect of type of story (physical vs. mental-sing) indicating a lower performance on the mentalising storiesompared with the physical stories for both groups (F(1,22) = 6.50,
= 0.02, Pillai’s trace = 6.5, partial eta squared = 0.23). However,here was no main effect of group (p = 0.65) or a significant inter-ction between type of story and group (p = 0.1). The scores inoth groups were low on both tasks indicating problems with
Graph 2. Intellectual profile in 22q11DS.

1038 L.E. Campbell et al. / Neuropsychologia 47 (2009) 1034–1044
Table 2Group performance on cognitive tasks.
Measure 22q11DS (n = 12) WS (n = 12) Statistic (t) P-value
Mean SD Mean SD
WISC-IIIFSIQ 59.4 5.8 58.3 6.2 0.48 0.64VIQ 64.0 9.1 69.2 10.1 3.08 0.2PIQ 60.6 7.0 53.3 4.1 −1.31 0.006*
22q11DS (n = 12) WS (n = 12) Statistic (F) P-value Effect size Power
Mean SD Mean SD
Index scoresVerbal comprehension 66.6 8.5 72.5 11.5 2.06 0.17 0.09 0.28Perceptual organization 61.3 8.9 56.2 4.8 3.13 0.1 0.13 0.4Freedom from distractibility 68.0 9.2 66.0 66.0 .31 0.58 0.01 0.08Processing speed 70.9 9.4 56.8 5.8 19.39 0.0005** 0.47 0.99
SubtestsPicture Completion 4.2 2.3 3.8 2.3 .2 0.66 0.01 0.07Information 5.6 2.6 4.7 2.5 .77 0.39 0.03 0.13Coding 4.2 2.1 1.2 0.4 26.19 0.0005** 0.54 1.0Similarities 3.8 1.9 6.7 3.9 5.24 0.03* 0.19 0.59Picture Arrangement 3.5 2.1 2.7 1.6 1.18 0.29 0.05 0.18Arithmetic 3.3 2.3 3.3 1.8 .0005 1.0 0.0005 0.05Block Design 3.3 2.6 1.7 1.0 4.51 0.05* 0.17 0.53Vocabulary 2.6 1.8 4.9 2.8 6.0 0.02* 0.21 0.65Object assembly 3.1 2.1 2.4 1.7 0.75 0.4 0.03 0.13Comprehension 3.6 2.8 4.0 2.7 0.14 0.71 0.01 0.07Symbol Search 4.0 2.1 2.8 2.0 2.24 0.15 0.09 0.3Digit span 5.6 1.3 4.8 2.0 1.15 0.3 0.05 0.18Mazes 6.7 2.9 2.5 1.8 17.95 0.005* 0.45 0.98
BPVS 74.8 13.3 82.2 13.8 1.79 0.2 0.08 0.25TROG 12.3 4.6 12.7 4.5 0.03 0.9 0.001 0.05
WORDReading 76.1 8.8 79.3 14.8 0.41 0.53 0.02 0.09Spelling 77.7 11.9 70.0 8.9 3.19 0.09 0.13 0.40Reading comprehension 73.9 13.7 77.8 14.3 .45 0.51 0.02 0.1
WONDMathematical reasoning 72.2 10.4 68.1 6.0 1.39 0.25 0.06 0.20Numerical operations 71.0 7.9 65.7 8.0 2.70 0.11 0.11 0.35
WOLDListening comprehension 78.8 11.9 78.8 78.8 0.0005 0.99 0.0005 0.05Oral expression 82.3 7.2 81.4 7.8 0.09 0.77 0.004 0.06
CMSVisual Immediate Memory 79.3 16.3 71.3 13.0 1.68 0.21 0.07 0.24Visual Delayed Memory 80.6 13.4 76.4 14.3 0.51 0.48 0.02 0.11Verbal Immediate 84.8 17.3 71.6 15.5 3.74 0.07 0.15 0.45Verbal Delayed Recognition Memory 81.6 15.3 68.1 17.1 4.0 0.06 0.16 0.48Attention/concentration 73.6 10.9 67.6 12.1 1.52 0.23 0.07 0.22Learning 83.5 19.8 62.1 9.1 11.39 0.003* 0.35 0.9Delayed recognition 81.09 19.31 69.92 17.89 2.08 0.16 0.09 0.28
22q11DS (n = 12) WS (n = 12) Statistic (t) P-value
Mean SD Mean SD
GPB (secs)tNon-dominant hand 195 127 211 71 −1.06 0.77Dominant hand 148 70 181 45 −.30 0.77
22q11DS (n = 12) WS (n = 12) Statistic (z) P-value
Mean SD Mean SD
BORBMinimal features view 23.8 1.6 23.2 2.3 −0.58 0.59Foreshortened view task 22.3 2.8 22.8 2.4 −0.38 0.71Object decision 23.4 3.5 22.9 4.0 −0.23 0.91Picture naming 11.6 2.5 12.0 2.7 −0.37 0.74Associative match 26.4 4.1 26.4 3.5 0.0005 1.0
L.E. Campbell et al. / Neuropsychologia 47 (2009) 1034–1044 1039
Table 2 (Continued )
22q11DS (n = 12) WS (n = 12) Statistic (t) P-value
Mean SD Mean SD
Interactive sociability scaleScores 8.3 2.9 10.1 3.3 −1.37 0.19
22q11DS (n = 12) WS (n = 12) Statistic (z) P-value
Mean SD Mean SD
Face processing skillsFacial expression 15.8 6.6 19.2 6.6 −2.16 0.03*
Identity 35.4 8.6 51.2 17.6 −2.05 0.04*
Facial speech 20.9 12.2 24.1 11.9 −1.28 0.22Eye gaze 10.3 4.4 14.2 4.8 −1.95 0.05*
22q11DS (n = 12) WS (n = 12) Statistic (F) P-value Effect size Power
Mean SD Mean SD
Strange stories#
Physical stories 3.1 2.3 2.2 2.1 .218 .646 .010 .073ToM stories 1.8 2.1 1.9 1.9
eractio
rwtg(
77pie
7ht5H((i
fctmpt
Gp
Tinigt(
7s((W(cmrw
8
* p < 0.05.** p < 0.001.# A between-within ANOVA, no main effect for group or group x type of story int
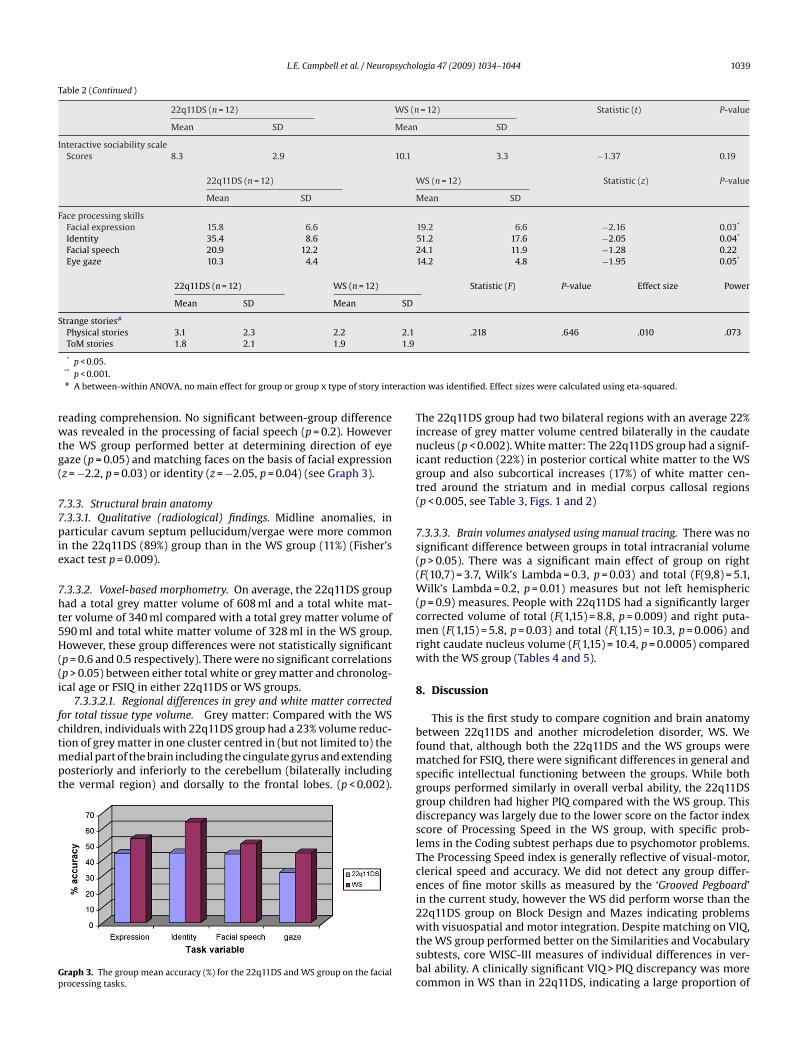
eading comprehension. No significant between-group differenceas revealed in the processing of facial speech (p = 0.2). However
he WS group performed better at determining direction of eyeaze (p = 0.05) and matching faces on the basis of facial expressionz = −2.2, p = 0.03) or identity (z = −2.05, p = 0.04) (see Graph 3).
.3.3. Structural brain anatomy
.3.3.1. Qualitative (radiological) findings. Midline anomalies, inarticular cavum septum pellucidum/vergae were more common
n the 22q11DS (89%) group than in the WS group (11%) (Fisher’sxact test p = 0.009).
.3.3.2. Voxel-based morphometry. On average, the 22q11DS groupad a total grey matter volume of 608 ml and a total white mat-er volume of 340 ml compared with a total grey matter volume of90 ml and total white matter volume of 328 ml in the WS group.owever, these group differences were not statistically significant
p = 0.6 and 0.5 respectively). There were no significant correlationsp > 0.05) between either total white or grey matter and chronolog-cal age or FSIQ in either 22q11DS or WS groups.
7.3.3.2.1. Regional differences in grey and white matter correctedor total tissue type volume. Grey matter: Compared with the WS
hildren, individuals with 22q11DS group had a 23% volume reduc-ion of grey matter in one cluster centred in (but not limited to) theedial part of the brain including the cingulate gyrus and extendingosteriorly and inferiorly to the cerebellum (bilaterally includinghe vermal region) and dorsally to the frontal lobes. (p < 0.002).
raph 3. The group mean accuracy (%) for the 22q11DS and WS group on the facialrocessing tasks.
bfmsggdslTcei2wtsbc
n was identified. Effect sizes were calculated using eta-squared.
he 22q11DS group had two bilateral regions with an average 22%ncrease of grey matter volume centred bilaterally in the caudateucleus (p < 0.002). White matter: The 22q11DS group had a signif-
cant reduction (22%) in posterior cortical white matter to the WSroup and also subcortical increases (17%) of white matter cen-red around the striatum and in medial corpus callosal regionsp < 0.005, see Table 3, Figs. 1 and 2)
.3.3.3. Brain volumes analysed using manual tracing. There was noignificant difference between groups in total intracranial volumep > 0.05). There was a significant main effect of group on rightF(10,7) = 3.7, Wilk’s Lambda = 0.3, p = 0.03) and total (F(9,8) = 5.1,
ilk’s Lambda = 0.2, p = 0.01) measures but not left hemisphericp = 0.9) measures. People with 22q11DS had a significantly largerorrected volume of total (F(1,15) = 8.8, p = 0.009) and right puta-en (F(1,15) = 5.8, p = 0.03) and total (F(1,15) = 10.3, p = 0.006) and
ight caudate nucleus volume (F(1,15) = 10.4, p = 0.0005) comparedith the WS group (Tables 4 and 5).
. Discussion
This is the first study to compare cognition and brain anatomyetween 22q11DS and another microdeletion disorder, WS. Weound that, although both the 22q11DS and the WS groups were
atched for FSIQ, there were significant differences in general andpecific intellectual functioning between the groups. While bothroups performed similarly in overall verbal ability, the 22q11DSroup children had higher PIQ compared with the WS group. Thisiscrepancy was largely due to the lower score on the factor indexcore of Processing Speed in the WS group, with specific prob-ems in the Coding subtest perhaps due to psychomotor problems.he Processing Speed index is generally reflective of visual-motor,lerical speed and accuracy. We did not detect any group differ-nces of fine motor skills as measured by the ‘Grooved Pegboard’n the current study, however the WS did perform worse than the2q11DS group on Block Design and Mazes indicating problems
ith visuospatial and motor integration. Despite matching on VIQ,he WS group performed better on the Similarities and Vocabularyubtests, core WISC-III measures of individual differences in ver-al ability. A clinically significant VIQ > PIQ discrepancy was moreommon in WS than in 22q11DS, indicating a large proportion of

1040 L.E. Campbell et al. / Neuropsychologia 47 (2009) 1034–1044
Table 3Regional differences in grey matter in children with 22q11DS compared with children with Williams syndrome (voxel-based morphometry).
Cluster number (from inferior to superior) Centroid of region (and other regionsincluded in the cluster)
BA of centroid (and other BAsin the cluster)
Side Tal (x) Tal (y) Tal (z) N
Grey matter deficit1 Cingulate gyrus (Cerebellum, fusiform
gyrus, lingual gyrus, cuneus,precuneus, medial frontal gyrus,superior frontal and paracentral gyrus)
30 (4, 6, 8, 7, 9, 10, 17, 18, 19, 23,24, 29, 31, 32)
R/L 3.0 −49.0 16.5 9530
Grey matter excess1 Caudate Nucleus (cingulate gyrus,
thalamus)R 10.0 8.5 8.4 372
2 Caudate Nucleus L −11.6 10.6 10.2 273
White matter deficit1 Middle temporal lobe, cingulate region,
superior occipital lobe, inferior parietalregions, precuneus, medial frontalregions, paracentral regions
N/A R 29.5 −63.1 16.0 1440
2 Cingulate region, superior occipitalregion, precuneus
N/A L −21.5 −59.5 35.0 446
White matter excess1 Medial temporal, internal-, external
capsule, putamen/globus pallidusregion, precentral regions, corpuscallosum, cingulate region
N/A R/L 26.3 −8.1 16.0 2599
2 Inferior frontal region, internal-,external capsule, putamen/globuspallidus region
N/A L −26.2 1.1 17.3 2157
Fig. 1. Relative reductions (blue/pink) and increases (red/yellow) of grey matter volume in 22q11DS children compared with WS children (Cluster threshold = 0.01, p = 0.002,CI = ±1.6, corrected for total grey matter volume). The maps are oriented with the right side of the brain shown on the left side of each panel. The z-coordinate for each rowof axial slices in the standard space of Talairach and Tournoux (1988) is given in millimetres.

L.E. Campbell et al. / Neuropsychologia 47 (2009) 1034–1044 1041
F lumeC .
cpawiiwcpdf
eiwoabWipWccd
patcrficosWm
atmaeepbobttaig2etd
daaippfftmdi
ig. 2. Relative reductions (blue/pink) and increases (red/yellow) of white matter voI = ±0.9, corrected for total white matter volume). See Fig. 1 legend for explanation
hildren with a non-verbal learning disability in WS. The groupserformed similarly on overall achievement measures, memorynd object perception and Theory of Mind. Both groups performedorse on the mentalising ‘Strange Stories’ compared with the phys-
cal stories. However, performance on both types of stories was lown both groups indicating that the general level of comprehensionas low. Our study revealed specific group differences in face pro-
essing tasks. Compared with the WS group, the 22q11DS grouperformed poorer on tasks requiring the discrimination of eye gazeirection, emotional expressivity and identity identification but not
acial speech.Although, the two groups performed at a similar level in gen-
ral intellectual ability, memory and academic achievement it isnteresting to notice that while a large proportion of the children
ith 22q11DS group attended mainstream school with and with-ut assistance, the WS group tended to attend schools for moderatend severe learning disabilities. We do not know the reason for thisut can hypothesise that significantly lower non-verbal IQ in theS group would make it more difficult for the WS to successfully
ntegrate in mainstream schools. Furthermore, the behaviouralhenotypes in the two syndromes are different; it may be that theS group appear more disabled with their inappropriate hyperso-
ial behaviour paired with a stronger non-verbal learning disabilityompared with the more withdrawn and internalizing behaviourisplayed by many with 22q11DS.
We found significant differences in brain anatomy between peo-le with 22q11DS and WS. The 22q11DS group had increased greynd white striatal matter compared with the WS group. Conversely,he 22q11DS group had decreased grey matter in the cerebellum,ingulate gyrus and parietal lobes and in posterior white matteregions. These structural brain differences replicate our previousndings where we compared children with 22q11DS with sibling
ontrols (Campbell et al., 2006). Most striking are the findingsf grey matter decreases of the cerebellum and increases of thetriatum in the 22q11DS group compared with both sibling andS controls. Also, with regards to the WS group increased greyatter volumes of the cerebellum, fusiform gyrus, cingulate gyrus
CMhRp
in 22q11DS children compared with WS children (Cluster threshold = 0.01, p = 0.005,
nd anterior parietal lobe, decreased grey and white matter inhe striatal region and decreased posterior corpus callosal white
atter were identified both compared with the 22q11DS groupnd a control group of typically developing children (Campbellt al., in press). Hence, these brain regions appear to be differ-ntially affected by the respective deletion. Meanwhile, overallarieto-occipital grey matter which was significantly different inoth the 22q11DS and WS group compared with ‘typically’ devel-ping controls (Campbell et al., 2006, in press) did not differentiateetween them in the current study although regional changes inhe medial occipital gyrus were present, indicating that both dele-ions are associated with a decrease of posterior brain matter. Welso found that the integrity of white matter appears more affectedn the group of children with 22q11DS compared with the WSroup. White matter disruptions have previously been reported in2q11DS (Barnea-Goraly et al., 2003; Campbell et al., 2006; Katest al., 2001; Simon et al., 2005) and it has been suggested thathese changes may be linked with an increased vulnerability to theevelopment of psychotic symptoms.
One of the major behavioural differences between the syn-romes is in the degree of sociability. While individuals with WSre described as hypersocial, people with 22q11DS are more shynd withdrawn. There are many cognitive mechanisms involvedn social interaction and in the current study the 22q11DS grouperformed worse than the WS group on tasks measuring facerocessing. Several brain regions have been implicated in socialunctioning such as the vermis and the fusiform gyrus. It has,or example been suggested that a midline cerebellar structure,he vermis may be indicative of degree of sociability since ver-
al reductions have been revealed in syndromes characterised byecreased sociability, e.g., Joubert syndrome and Fragile X and also
n 22q11DS (Eliez, Schmitt, White, Wellis, & Reiss, 2001; Guerreiro,
amargo, Kato, & al, 1998; Holroyd, Reiss, & Bryan, 1991; Mostofsky,azzocco, Aakalu, & al, 1998), while increased vermal volumeas been reported in WS (Schmitt, Eliez, Warsofsky, Bellugi, &eiss, 2001). The current study, for the first time directly com-aring children with WS and 22q11DS, can confirm that there

1042 L.E. Campbell et al. / Neuropsychologia 47 (2009) 1034–1044
Table 4Hemispheric and lobar brain volumes as defined by manual tracing in individuals with 22q11DS and WS.
Brain structure 22q11DS (n = 9) WS (n = 9) F (df. = 1,15) P-value Effect size Power
Total intracranial volume 1485.9 (124.3)◦ 1408.3 (122.2)* 1.34 0.2
HemispheresTotal 1144.4 (92.8)◦ 1091.4 (94.7)* 1.2 0.25
77.2% (4.5)+ 77.5% (1.5)* −0.22 0.83
Left 573.4 (44,8) 541.8 (46.1) 2.17 0.16 0.12 0.2838.7% (2.4) 38.5% (0.5) 0.05** 0.82 0.003 0.06
Right 571.8 (52.6) 547.4 (48.7) 1.05 0.32 0.06 0.1638.5% (2.05) 38.9% (1.0) 0.23 0.64 0.01 0.07
Frontal lobeTotal 582.8 (46.1) 539.4 (25.0)** 6.17 0.02 0.28 0.65
39.3% (3.05) 38.4% (1.9) 0.58 0.46 0.04 0.11
Left 291.8 (22.2) 267.5 (11.0) 8.64** 0.01 0.35 0.7919.7% (1.5) 19.1% (01.1) 1.05 0.32 0.06 0.16
Right 291.0 (24.8) 271.9 (14.6) 3.96 0.06 0.2 0.4619.6% (1.6) 19.4% (0.9) 0.21 0.66 0.01 0.07
Occipital-parietal regionTotal 136.0 (30.0) 138.1 (33.2)** 0.02 0.89 0.001 0.05
9.1% (1.7) 9.8% (1.8) 0.59 0.46 0.04 0.11
Left* 69.1 (15.8) 70.7 (20.7) 0.04 0.86 0.002 0.054.6% (1.0) 5.0% (1.1) 0.47** 0.5 0.03 0.1
Right 66.8 (15.5) 67.4 (13.7) 0.006 0.94 0.000 0.054.5% (0.9) 4.9% (0.8) 0.57 0.46 0.03 0.11
Parietal lobeTotal 305.5 (57.2) 276.1 (46.3)** 1.43 0.25 0.08 0.20
20.6% (3.5) 19.5% (2.4) 0.52 0.48 0.03 0.1
Left 152.5 (28.6) 135.7 (24.3) 1.8 0.2 0.1 0.2410.3% (1.8) 9.6% (1.3) 0.83** 0.38 0.05 0.14
Right 153.0 (28.8) 140.4 (22.4) 1.07 0.32 0.06 0.1610.3% (1.7) 9.9% (1.1) 0.26 0.62 0.02 0.08
Temporal lobeTotal 135.8 (19.8) 120.7 (17.7)** 2.89 0.11 0.15 0.36
9.2% (1.5) 8.6% (1.1) 0.99 0.33 0.06 0.16
Left 67.0 (10.0) 60.4 (8.9) 2.22 0.16 0.12 0.29**
is
a2acsdhittigbgartgub
totfa2icfiabfitt2d
4.5% (0.7) 4.3% (0.6)
Right 68.8 (10.7) 60.4 (10.9)4.7% (0.8) 4.3% (0.6)
s a distinct difference between the vermal regions in the twoyndromes.
Grey matter reductions in the fusiform gyral region, as wells impairments of facial perception, have also been revealed in2q11DS compared with both sibling and WS controls (Campbell etl., 2006, in press). Additionally, preliminary data suggest an asso-iation between fronto-striatal grey matter and social behaviour,uch as peer relations, in 22q11DS implicating another brain regionifferentially affected by the deletion (Campbell et al., 2006). Theseypotheses provide an indication of the complexity of determin-
ng direct relationships between structural brain anatomy andhe behavioural phenotype. Hence, to rely on specific neural sys-ems dysfunctions to explain the cognitive phenotype in 22q11DSs to limit research to a modular and static approach and disre-ards the widespread perturbation to brain development occurringoth pre- and post-natal due to (1) the early expression of theenetic insult in 22q11DS; (2) the plasticity of both typical andtypical brain development; (3) the presence of dynamic envi-
onmental influences. It is therefore important to compare bothhe structural brain anatomy and behavioural phenotype lon-itudinally as well as cross-aetiologically to get an improvednderstanding of the relationship between genetics, brain andehaviour.e52aa
0.48 0.5 0.03 0.1
2.72 0.12 0.15 0.341.36 0.26 0.08 0.2
It is important to remember that this is a preliminary study andherefore only includes a relatively small sample of participants andnly overt cognitive measures. Although performances on variousests indicate a similar performance this does not mean that the per-ormance levels are obtained in an identical manner, neither does itssume a similar developmental trajectory (Karmiloff-Smith, 1998,007). For example it has been found that although face-processing
n WS on the surface is similar to that of ‘typically’ developingontrols, the cognitive and brain mechanisms underlying the per-ormance are very different (Karmiloff-Smith et al., 2004). However,t was not the goal of the present study to investigate these mech-nisms; rather this is just the first step in delineating differencesetween the two syndromes and to discuss what implications thendings have for future research. It is also important to bear in mindhat the mean FSIQ scores in the general 22q11DS population sys-ematically are higher than in the current sample of children with2q11DS. The mean FSIQ of a recent large sample of Belgian chil-ren with 22q11DS was reported as 73 (range 50–109; De Smedt
t al., 2007). However, in a paper currently under preparation of0 (including the 12 children in the current study) children with2q11DS the mean FSIQ was only 66 (range 40–94) (Campbell etl., in preparation) indicating that depending on sampling the vari-bility of FSIQ in 22q11DS is large. Hence, the current sample may
L.E. Campbell et al. / Neuropsychologia 47 (2009) 1034–1044 1043
Table 5Regional brain volumes of manually traced subcortical structures in individuals with 22q11DS and WS controls.
Brain structure 22q11DS (n = 9) WS (n = 9) F (df. = 1, 15) P Effect size Power
PutamenTotal 6.2 (1.1) 4.7 (0.9) 10.04** 0.006 0.39 0.85
0.4% (0.06) 0.3% (0.05) 8.76 0.009† 0.35 0.79
Left 3.1 (0.5) 2.5 (0.4) 8.85 0.009 0.36 0.80.2% (0.03) 0.2% (0.03) 4.59** 0.05 0.22 0.52
Right 3.0 (0.7) 2.2 (0.8) 5.92 0.03 0.27 0.630.2% (0.04) 0.2% (0.05) 5.76 0.03† 0.27 0.62
CaudateTotal 8.4 (1.4) 6.6 (1.2) 9.19** 0.008 0.37 0.81
0.6% (0.08) 0.5% (0.05) 10.27 0.006† 0.39 0.85
Left 4.0 (0.6) 3.3 (0,46) 8.99 0.009 0.36 0.80.3% (0.04) 0.2% (0.02) 7.75** 0.01 0.33 0.74
Right 4.4 (0.9) 3.3 (0.7) 8.71 0.009 0.35 0.790.3% (0.05) 0.2% (0.04) 10.35 0.005† 0.39 0.86
Cerebellum 125.3 (17.2) 133.1 (17.0) 0.94** 0.35 0.06 0.158.5% (1.3) 9.5% (1.4) 2.56 0.13 0.14 0.32
◦Mean raw volume in ml (SD.), +% of intracranial volume (SD.), total and regional brain volumes (ml), univariate GLM for raw volume or ratio correction for total intracranialv
ntbdwpwrft
2ibbinoloi
A
Wn
R
A
B
B
B
B
B
B
B
B
B
B
B
C
C
C
C
D
D
D
E
olume.* Independent samples t-test.
** Multivariate ANOVA not significant, values are group means (SD.).† p < 0.05.
ot necessarily be representative of the whole 22q11DS popula-ion. However, we did take this into account in the current studyy comparing the current sample with a larger sample of 38 chil-ren with 22q11DS and although their performance on the WISC-IIIas lower there were no major differences between the cognitiverofiles in the two groups. Finally, due to the small sample size weere unable to examine brain–behaviour correlations in the cur-
ent study but this direction would be worthwhile to pursue inuture studies to shed more light on the interactions present in thewo genetic syndromes concerned.
To conclude, the current study provides a starting point in2q11DS cross-syndromal research and highlights that when look-
ng at overt behaviour many similarities but also dissimilaritiesetween 22q11DS and WS are present. These differences may partlye explained by early genetic influences on brain structure. Hence,
t is important to look at the organisation of the underlying cog-itive mechanisms, and trace them back to the earliest possiblebservable behaviour through assessments of infants and throughongitudinal studies of both brain development and cognition inrder to enable appropriate early remediation therapies to min-mise disturbances directly linked to the syndrome.
cknowledgements
We would like to thank the participating families and theilliams Syndrome Foundation, U.K., without you this study would
ot have been possible.
eferences
shburner, J., & Friston, K. J. (2000). Voxel-based morphometry—the methods. Neu-roimage, 11, 805–821.
arnea-Goraly, N., Menon, V., Krasnow, B., Ko, A., Reiss, A., & Eliez, S. (2003). Investi-gation of white matter structure in velocardiofacial syndrome: a diffusion tensorimaging study. American Journal of Psychiatry, 160, 1863–1869.
arta, P. E., Dhingra, L., Royall, R., & Schwartz, E. (1997). Improving stereologicalestimates for the volume of structures identified in three-dimensional arrays of
spatial data. Journal of Neuroscience Methods, 75, 111–118.artko, J., & Carpenter, W. J. (1976). On the methods and theory of reliability. Journalof Nervous and Mental Disease, 163, 307–317.
earden, C., Wang, P., & Simon, T. (2002). Williams syndrome cognitive profile alsocharacterizes Velocardiofacial/DiGeorge syndrome. American Journal of HumanGenetics, 114, 689–692.
E
F
earden, C., Woodin, M., Wang, P., Moss, E., McDonald-McGinn, D., Zackai, E., Eman-nuel, B., & Cannon, T. (2001). The neurocognitive phenotype of the 22Q11.2deletion syndrome: Selective deficit in visual-spatial memory. Journal of Clinicaland Experimental Neuropsychology, 23, 447–464.
ish, J., Ferrante, S., McDonald-McGinn, D., Zackai, E., & Simon, T. (2005). Maladap-tive conflict monitoring as evidence for executive dysfunction in children withchromosome 22q11.2 deletion syndrome. Developmental Science, 8, 36–43.
ishop, D. (1983). Published by the author and available from Age and CognitivePerformance Research Centre, University of Manchester, M13 9PL.
oddaert, N., Mochel, F., Meresse, I., Seidenwurm, D., Cachia, A., Brunelle, F., Lyon-net, S., & Zilbovicius, M. (2006). Parieto-occipital grey matter abnormalities inchildren with Williams syndrome. Neuroimage, 30, 721–725.
otto, L., May, K., Fernhoff, P., Correa, A., Coleman, K., Rasmussen, S., Merritt,R., O’Leary, L., Wong, L.-Y., Elixson, M., Mahle, W., & Campbell, R. (2003). Apopulation-based study of the 22q11.2 deletion: Phenotype, incidence, and con-tribution to major birth defects in the population. Pediatrics, 112.
ruce, V., Campbell, R. N., Doherty-Sneddon, G., Import, A., Langton, S., McAuley, S.,& Wright, R. (2000). Testing face processing skills in children. British Journal ofDevelopment Psychology, 18, 319–333.
ullmore, E., Suckling, J., Overmeyer, S., Rabe-Hesketh, S., Taylor, E., & Brammer, M.(1999). Global, voxel, and cluster tests, by theory and permutation, for a differ-ence between two groups of structural MR images of the brain. IEEE Transactionson Medical Imaging, 18, 32–42.
ampbell, L., Daly, E., Toal, F., Stevens, A., Azuma, R., Catani, M., Ng, V., van Amelsvoort,T., Chitnis, X., Cutter, W., Murphy, D., & Murphy, K. (2006). Brain and behaviourin children with 22q11.2 deletion syndrome: a volumetric and voxel-based mor-phometry MRI study. Brain, 129, 1218–1228.
ampbell, L., Daly, E., Toal, F., Stevens, A., Azuma, R., Karmiloff-Smith, A., Murphy, D.G. M., Murphy, K. C. (in press). Brain structural differences associated with thebehavioural phenotype in children with Williams syndrome. Brain Research.
hiang, M., Reiss, A., Lee, A., Bellugi, U., Galaburda, A. M., Korenberg, J., Mills, D.,Toga, A., & Thompson, P. (2007). 3D pattern of brain abnormalities in Williamssyndrome visualized using tensor-based morphometry. Neuroimage, 36,1096–1109.
ohen, M. (1997). Children’s Memory Scale. San Antonio, TX: Psychological Corpora-tion, Harcourt Brace & Co.
e Smedt, B., Devriendt, K., Fryns, J., Vogels, A., Gewillig, M., & Swillen, A. (2007).Intellectual abilities in a large sample of children with Velo-Cardio-Facial Syn-drome: An update. Journal of Intellectual Disability Research, 51, 666–670.
ebbané, M., Van der Linden, M., Glaser, B., & Eliez, S. (2008). Source monitoring foractions in adolescents with 22q11.2 deletion syndrome (22q11DS). PsychologicalMedicine, 38, 811–820.
eboer, T., Wu, Z., Lee, A., & Simon, T. (2007). Hippocampal volume reduction in chil-dren with chromosome 22q11.2 deletion syndrome is associated with cognitiveimpairment. Behavioral and Brain Functions, 54.
liez, S., Schmitt, J., White, C., & Reiss, A. (2000). Children and adolescents with velo-
cardio-facial syndrome: A volumetric MRI study. American Journal of Psychiatry,157, 409–415.liez, S., Schmitt, J. E., White, C. D., Wellis, V. G., & Reiss, A. L. (2001). A quanti-tative MRI study of posterior fossa development in velocardiofacial syndrome.Biological Psychiatry, 49, 540–546.
rith, U. (1989). Autism. Explaining the enigma. Oxford: Blackwell.

1 sycho
G
G
G
G
G
H
H
H
K
KK
K
K
L
M
M
M
P
R
R
S
S
S
S
S
T
v
V
W
W
044 L.E. Campbell et al. / Neurop
laser, B., Mumme, D. L., Blasey, C., Morris, M. A., Dahoun, S. P., Antonarakis, S. E.,Reiss, A. L., & Eliez, S. (2002). Language skills in children with velocardiofacialsyndrome (deletion 22q11.2). Journal of Pediatrics, 140, 753–758.
laser, B., Schaer, M., Berney, S., Debbane, M., Vuilleumier, P., & Eliez, S. (2007). Struc-tural changes to the fusiform gyrus: a cerebral marker for social impairments in22q11.2 deletion syndrome? Schizophrenia Research, 96, 82–86.
ood, C. D., Johnsrude, I. S., Ashburner, J., Henson, R. N. A., Friston, K. J., & Frackowiak,R. S. J. (2001). A voxel-based morphometric study of ageing in 465 normal adulthuman brains. Neuroimage, 14, 21–36.
othelf, D., Presburger, G., Levy, D., Nahmani, A., Burg, M., Berant, M., Blieden, L.,Finkelstein, Y., Frisch, A., Apter, A., & Weizman, A. (2004). Genetic, developmen-tal, and physical factors associated with attention deficit hyperactivity disorderin patients with velocardiofacial syndrome. The American Journal of HumanGenetics B (Neuropsychiatric Genetics), 126B, 116–121.
uerreiro, M., Camargo, E., Kato, M., et al. (1998). Fragile X syndrome. Clinical,electroencephalographic and neuroimaging characteristics. Arquivos de Neuro-Psiquiatria, 56, 18–23.
appé, F. (1994). Autism, an introduction to psychological theory. London: UCL PressLtd.
enry, J., van Amelsvoort, T., Morris, R., Owen, M., Murphy, D., & Murphy, K. (2002).An investigation of the neuropsychological profile in adults with velo-cardio-facial syndrome (VCFS). Neuropsychologia, 40, 471–478.
olroyd, S., Reiss, A., & Bryan, R. (1991). Autistic features in Joubert syndrome: Agenetic disorder with agenesis of the cerebellar vermis. Biological Psychiatry, 29,287–294.
armiloff-Smith, A. (1998). Development itself is the key to understanding devel-opmental disorders. Trends in Cognitive Sciences, 2, 389–398.
armiloff-Smith, A. (2007). Atypical epigenesis. Developmental Science, 10, 1.armiloff-Smith, A., Thomas, M., Annaz, D., Humphreys, K., Ewing, S., Brace, N.,
van Duuren, M., Pike, G., Grice, S., & Campbell, R. s. y. (2004). Exploringthe Williams Syndrome Face Processing Debate: The importance of build-ing developmental trajectories. Journal of Child Psychology and Psychiatry, 45,1258–1274.
ates, W., Burnette, C., Jabs, E., Rutberg, J., Murphy, A., Grados, M., Geraghty, M.,Kaufmann, W., & Pearlson, G. (2001). Regional cortical white matter reductionsin velocardiofacial syndrome: a volumetric MRI analysis. Biological Psychiatry,49, 677–684.
ozachuk, W., DeCarli, C., Schapiro, M., Wagner, E., Rapoport, S., & Horwitz, B.(1990). White matter hyperintensities in dementia of Alzheimer’s type and inhealthy subjects without cerebrovascular risk factors. Archives of Neurology, 47,1306–1310.
y, T., & Hodapp, R. (2005). Children with Prader-Willi syndrome vs. Williamssyndrome: indirect effects on parents during a jigsaw puzzle task. Journal ofIntellectual Disability Research, 49, 929–939.
ervis, C., & Klein-Tasman, B. (2000). Williams syndrome: Cognition, personality,and adaptive behaviour. Mental Retardation & Developmental Disabilities ResearchReviews, 6, 148–158.
ostofsky, S., Mazzocco, M., Aakalu, G., et al. (1998). Decreased cerebellar posteriorvermis size in fragile X syndrome: Correlation with neurocognitive performance.Neurology, 50.
W
W
logia 47 (2009) 1034–1044
urphy, K. C., Jones, L. A., & Owen, M. J. (1999). High rates of schizophrenia in adultswith velo-cardio-facial syndrome. Archives of General Psychiatry, 56, 940–945.
rinzie, P., Swillen, A., Vogels, A., Kockuyt, V., Curfs, L., Haselager, G., Hellinckx, W.,Devriendt, K., Onghena, P., Van Lieshout, C. F., & Fryns, J. P. (2002). Personalityprofiles of youngsters with velo-cardio-facial syndrome. Genetic Counseling, 13,265–280.
eiss, A., Eckert, M., Rose, F., Karchemskiy, A., Kesler, S., Chang, M., Reynolds, M.,Kwon, H., & Galaburda, A. (2004). An experiment of nature: Brain anatomy par-allels cognition and behavior in Williams syndrome. Journal of Neuroscience, 24,5009–5015.
eiss, A., Eliez, S., Schmitt, J., Straus, E., Lai, Z., Jones, W., & Bellugi, U. (2000). IV.Neuroanatomy of Williams syndrome: a high-resolution MRI study. Journal ofCognitive Neuroscience, 12, 65–73.
chmitt, J., Eliez, S., Warsofsky, I., Bellugi, U., & Reiss, A. (2001). Enlarged cerebellarvermis in Williams syndrome. Journal of Psychiatric Research, 35, 225–229.
igmundsson, T., Suckling, J., Maier, M., Williams, S., Bullmore, E., Greenwood, K.,Fukuda, R., Ron, M., & Toone, B. (2001). Structural abnormalities in frontal,temporal, and limbic regions and interconnecting white matter tracts inschizophrenic patients with prominent negative symptoms. American Journalof Psychiatry, 158, 234–243.
imon, T., Ding, L., Bish, J., McDonald-McGinn, D., Zackai, E., & Gee, J. (2005). Vol-umetric, connective, and morphologic changes in the brains of children withchromosome 22q11.2 deletion syndrome: an integrative study. Neuroimage, 25,169–180.
imon, T., Takarae, Y., DeBoer, T., McDonald-McGinn, D., Zackai, E., & Ross, J. (2008).Overlapping numerical cognition impairments in children with chromosome22q11.2 deletion or Turner syndromes. Neuropsychologia, 46, 82–94.
willen, A., Devriendt, K., Legius, E., Eyskens, B., Dumoulin, M., Gewillig, M., & Fryns, J.(1997). Intelligence and psychosocial adjustment in velocardiofacial syndrome:a study of 37 children and adolescents with VCFS. Journal of Medical Genetics, 34,453–458.
alairach, J., & Tournoux, P. (1988). Co-planar stereotaxic atlas of the human brain (M.Rayport, Trans.). Stuttgart: Beorg Thieme Verlag.
an Amelsvoort, T., Daly, E., Henry, J., Robertson, D., Ng, V., Owen, M., Murphy, K.,& Murphy, D. (2004). Brain anatomy in adults with velo-cardio-facial syndromewith and without schizophrenia: preliminary results of a structural magneticresonance imaging study. Archives of General Psychiatry, 61, 1085–1096.
orstman, J., Morcus, M., Duijff, S., Klaassen, P., Heineman-de Boer, J., Beemer, F.,Swaab, H., Kahn, R., & van Engeland, H. (2006). The 22q11.2 deletion in children:high rate of autistic disorders and early onset of psychotic symptoms. Journal ofthe American Academy of Child and Adolescent Psychiatry, 45, 1104–1113.
echsler, D. (1983). Wechsler Objective Reading Dimensions (WORD). UK: The Psy-chological Corporation.
echsler, D. (1991). Wechsler Intelligence Scales for Children—third edition. San Anto-
nio, TX: The Psychological Corporation.echsler, D. (1995). Wechsler Objective Numerical Dimensions (WOND). UK: The Psy-chological Corporation.
hittington, J., Holland, A., Webb, T., Butler, J., Clarke, D., & Boer, H. (2004). Academicunderachievement by people with Prader-Willi syndrome. Journal of IntellectualDisability Research, 48, 188–200.