Brain function assessment in different conscious states
12
PROCEEDINGS Open Access Brain function assessment in different conscious states Murat Ozgoren 1* , Onur Bayazit 1 , Sibel Kocaaslan 1 , Necati Gokmen 2 , Adile Oniz 1 From Consciousness and its Measures: Joint Workshop for COST Actions NeuroMath and Consciousness Limassol, Cyprus. 29 November – 1 December 2009 Abstract Background: The study of brain functioning is a major challenge in neuroscience fields as human brain has a dynamic and ever changing information processing. Case is worsened with conditions where brain undergoes major changes in so-called different conscious states. Even though the exact definition of consciousness is a hard one, there are certain conditions where the descriptions have reached a consensus. The sleep and the anesthesia are different conditions which are separable from each other and also from wakefulness. The aim of our group has been to tackle the issue of brain functioning with setting up similar research conditions for these three conscious states. Methods: In order to achieve this goal we have designed an auditory stimulation battery with changing conditions to be recorded during a 40 channel EEG polygraph (Nuamps) session. The stimuli (modified mismatch, auditory evoked etc.) have been administered both in the operation room and the sleep lab via Embedded Interactive Stimulus Unit which was developed in our lab. The overall study has provided some results for three domains of consciousness. In order to be able to monitor the changes we have incorporated Bispectral Index Monitoring to both sleep and anesthesia conditions. Results: The first stage results have provided a basic understanding in these altered states such that auditory stimuli have been successfully processed in both light and deep sleep stages. The anesthesia provides a sudden change in brain responsiveness; therefore a dosage dependent anesthetic administration has proved to be useful. The auditory processing was exemplified targeting N1 wave, with a thorough analysis from spectrogram to sLORETA. The frequency components were observed to be shifting throughout the stages. The propofol administration and the deeper sleep stages both resulted in the decreasing of N1 component. The sLORETA revealed similar activity at BA7 in sleep (BIS 70) and target propofol concentration of 1.2 μg/mL. Conclusions: The current study utilized similar stimulation and recording system and incorporated BIS dependent values to validate a common approach to sleep and anesthesia. Accordingly the brain has a complex behavior pattern, dynamically changing its responsiveness in accordance with stimulations and states. Background The human brain represents one of the most complex biological systems in the world. When it comes to its computational power, the estimates are overwhelming and are not comparable to man-made systems [1]. This complex organ also has a very dynamic nature, during which it shifts from one state to another, almost entirely changing its functional properties. These major states can be exemplified in the case of conscious states. Hence the consciousness can also be defined with this concept of altered state of brain cognitive functioning. A perfect definition of consciousness is still not available; however the existence of differentiations between some conscious states is out of debate. The sleep, anesthesia and wakefulness are three of such separable states with distinct features (Figure 1). * Correspondence: [email protected] 1 Department of Biophysics, Faculty of Medicine, Dokuz Eylul University, Izmir, 35340, Turkey Ozgoren et al. Nonlinear Biomedical Physics 2010, 4(Suppl 1):S6 http://www.nonlinearbiomedphys.com/content/4/S1/S6 © 2010 Ozgoren et al; licensee BioMed Central Ltd. This is an open access article distributed under the terms of the Creative Commons Attribution License (http://creativecommons.org/licenses/by/2.0), which permits unrestricted use, distribution, and reproduction in any medium, provided the original work is properly cited.
Transcript of Brain function assessment in different conscious states

PROCEEDINGS Open Access
Brain function assessment in differentconscious statesMurat Ozgoren1 Onur Bayazit1 Sibel Kocaaslan1 Necati Gokmen2 Adile Oniz1
From Consciousness and its Measures Joint Workshop for COST Actions NeuroMath and ConsciousnessLimassol Cyprus 29 November ndash 1 December 2009
Abstract
Background The study of brain functioning is a major challenge in neuroscience fields as human brain has adynamic and ever changing information processing Case is worsened with conditions where brain undergoesmajor changes in so-called different conscious states Even though the exact definition of consciousness is a hardone there are certain conditions where the descriptions have reached a consensus The sleep and the anesthesiaare different conditions which are separable from each other and also from wakefulness The aim of our group hasbeen to tackle the issue of brain functioning with setting up similar research conditions for these three consciousstates
Methods In order to achieve this goal we have designed an auditory stimulation battery with changingconditions to be recorded during a 40 channel EEG polygraph (Nuamps) session The stimuli (modified mismatchauditory evoked etc) have been administered both in the operation room and the sleep lab via EmbeddedInteractive Stimulus Unit which was developed in our lab The overall study has provided some results for threedomains of consciousness In order to be able to monitor the changes we have incorporated Bispectral IndexMonitoring to both sleep and anesthesia conditions
Results The first stage results have provided a basic understanding in these altered states such that auditorystimuli have been successfully processed in both light and deep sleep stages The anesthesia provides a suddenchange in brain responsiveness therefore a dosage dependent anesthetic administration has proved to be usefulThe auditory processing was exemplified targeting N1 wave with a thorough analysis from spectrogram tosLORETA The frequency components were observed to be shifting throughout the stages The propofoladministration and the deeper sleep stages both resulted in the decreasing of N1 component The sLORETArevealed similar activity at BA7 in sleep (BIS 70) and target propofol concentration of 12 microgmL
Conclusions The current study utilized similar stimulation and recording system and incorporated BIS dependentvalues to validate a common approach to sleep and anesthesia Accordingly the brain has a complex behaviorpattern dynamically changing its responsiveness in accordance with stimulations and states
BackgroundThe human brain represents one of the most complexbiological systems in the world When it comes to itscomputational power the estimates are overwhelmingand are not comparable to man-made systems [1] Thiscomplex organ also has a very dynamic nature duringwhich it shifts from one state to another almost entirely
changing its functional properties These major statescan be exemplified in the case of conscious statesHence the consciousness can also be defined with thisconcept of altered state of brain cognitive functioning Aperfect definition of consciousness is still not availablehowever the existence of differentiations between someconscious states is out of debate The sleep anesthesiaand wakefulness are three of such separable states withdistinct features (Figure 1) Correspondence muratozgorendeuedutr
1Department of Biophysics Faculty of Medicine Dokuz Eylul University Izmir35340 Turkey
Ozgoren et al Nonlinear Biomedical Physics 2010 4(Suppl 1)S6httpwwwnonlinearbiomedphyscomcontent4S1S6
copy 2010 Ozgoren et al licensee BioMed Central Ltd This is an open access article distributed under the terms of the Creative CommonsAttribution License (httpcreativecommonsorglicensesby20) which permits unrestricted use distribution and reproduction inany medium provided the original work is properly cited
The changes in the dynamic features of the brain canbe obtained through its responsiveness The consciousstates are usually determined with the degree of lack ofresponses to outer world Therefore a gradually chan-ging response monitoring system can be useful in thistype of approach The auditory domain could be aproper stimulation modality as it has been a commonchoice in neuroscience [23] The auditory evokedpotentials have been described with the acoustic featuresand stimulation patterns Out of these sub features thefrequency intensity and location are among the mostwell known properties [24] Typically tones (sinusoidal)or clicks are applied as the stimuli and the sensorycog-nitive responses are recorded via electrodes attached tothe scalp The basic sensory features (bottom-up) areinherently accompanied with other features such asattention memory (top-down) etc Thus the top-downand bottom-up properties all paint a complex landscapewith very short latencies such as Auditory Brain-stemResponses (ABR) Middle Latency Responses (MLRs) tolong latency wave forms [5] A recently revisited audi-tory stimulation pattern has been the dichotic one witha certain scope on brain asymmetry (syllables tonesetc) [6-8] From tones and clicks to syllables these sim-ple and semi-complex stimulations form a plausibledomain for assessment of brain responsiveness Theneed to obtain different features has forced the experi-mental design to include acoustical properties atten-tion-free assessment with mismatch attention-boundoddball dichotic and diotic features Therefore these dif-ferent properties have become a bundle of blocks consti-tuting Brain biophysics battery (BBB)
On the other hand the conditions of performing idealexperiments may not be an easy task as the operationroom and the sleep environment are far from perfectneuropsychological setups One of the major problemsin surgery room comes from being electromagneticallyhostile environment [910] therefore effecting the out-come of electrophysiological recording During sleepthe ever changing body position as well as depth ofsleep becomes problematic in conducting sensorycogni-tive auditory tests (ie presenting perfect symmetricaland ideal auditory stimulations) Thirdly the stimula-tions especially in sleep may cause some alterations inthe state of responsiveness of the brain [11]Recently the state of consciousness and brain func-
tioning during sleep and anesthesia have become a topicof interest [512-16] Furthermore Tung and Medelson[17] reviewed the studies and issues related to bothsleep and anesthesia addressing components from neu-romodulators to nuclei Having noted above mentionedpoints the present paper will address issues related tobrain responsiveness in anesthesiology and sleep Thepresentation of auditory stimulations with different phy-sical and design related properties would enable theacquisition of some of the dynamic and complexresponse patterns of the brain
MethodsSleep procedureThe sleep experiments were performed in the SleepDynamics Research Laboratory of the BiophysicsDepartment The participants slept for one night in thelaboratory and therefore the current study is based on
Figure 1 The electrophysiological recordings of a wake subject (left) recording during sleep (middle) and anaesthesia (right) with a similarEEG cap and stimulation system (EMISU)
Ozgoren et al Nonlinear Biomedical Physics 2010 4(Suppl 1)S6httpwwwnonlinearbiomedphyscomcontent4S1S6
Page 2 of 12
their first night sleep recordings Overnight sleep datawere collected from 12 healthy volunteer individuals(mean age 245 range 18-32 10 males) Except one allparticipants were right handed The exclusion criteriaincluded a past andor present history of any neurologi-cal psychiatric or chronic disorders and use of anydrugs that effect cognitive functions The participantswere advised not to take any caffeine on the night ofthe recording dayParticipants arrived at the laboratory approximately
two hours before their normal sleeping time and record-ings were realized approximately between 2300-0800orsquoclock Over the entire course of the recording sessionresearchers stayed in the laboratory in which the record-ing systems were present The participants spent awhole night lying on the bed in the isolated room whichlimited electromagnetic interference Furthermore thewalls of the laboratory have been enveloped with anacoustic material to isolate room from the external audi-tory noise The sleeping room was dimly lighted and thesubject was monitoredBispectral index (BIS) recording was performed using
a bispectral index monitor (Aspect-A2000) with a sensor(BIS Quatro) Sensors were checked for signal quality(SQI) assuring impedance below 5 kOhms In every fiveseconds BIS was recorded via the RS232 cable using aHyperTerminal protocol The BIS SQI values had beenplanned to be rejected below 50 However obtained SQIvalues were over 50 thus no rejection was requiredSleep scoring was performed according to theRechtschaffen and Kales (RampK) [18] criteria in 30-s timewindows For every RampK score there were six BIS values(a BIS value obtained in every five seconds) Sleep datawere analyzed in five BIS clusters which have BIS values90 80 70 60 50 respectively For each stimulus sweepswith 500 ms prestim and 1500 ms poststim data seg-ments were formed in these five BIS clusters Thesweeps which had amplitudes higher than plusmn100 microV inElectrooculography (EOG) channel were automaticallyrejected The recordings were corrected based on hori-zontal axis (baseline corrected) and digitally filtered withthe 05-48 Hz band pass filter (12 dBoct and zerophase shift Neuroscan 43) Henceforth every singlesubjectrsquos data were averaged and all of the subjectsrsquogrand average was prepared
Anesthesia procedureThe anesthesia related experiments were conducted inthe surgery room 12 subjects (9 females) participatedwith an age range of 25-46 (mean 3775) years Thesewere patients with a similar surgery protocol undergoingfor lumbar disc hernia The ethical approval has beenreceived from the local Ethics Committee All patientshave signed a consent form prior to procedures
The propofol administration was controlled with a tar-get-controlled infusion mechanism (Fresenius VialOrchestra Base Primea Le Grand Chemin France)where precalculated brain dosage (effect-site) would beobtained Accordingly the concentration levels of 0 microgmL to 16 microgmL of Propofol were obtained Besides thevarious monitoring devices the bispectral index monitorwas used The BIS provides a dimensionless numberfrom 0 to 100 which denotes to anesthesia depth It uti-lizes electrophysiological (EEG) parameters includingbispectral index The wakefulness values range aroundgt95 and with the propofol administration sudden dropsin the index values occur At around 10 microgmL of Pro-pofol administration the activity would be in the rangearound 80 Commonly levels would be kept around 50-60 range to perform adequate surgery
Brain biophysics batteryThe brain biophysics battery is an amalgamation ofauditory blocks with different featuresAuditory evoked potential (AEP) 1500 Hz 80 dBSPL
500 ms 2ndash3s inter stimulus interval (ISI) Unless men-tioned otherwise throughout this manuscript AEP wasused as the main example of stimulus conditionAuditory event related potential (AERP) Auditory
oddball paradigm applied via headphones (binaural)Auditory stimuli were 500 ms 80 dBSPL sinusoidal(target 1600 Hz nontarget1500 Hz) sounds Targetsoccurred in 20-25 of the casesDichotic linguistic (DL) 36 different combinations of
ba da ga ka pa ta syllables were representedby headphones one from each ear ISI was varied ran-domly between 25 and 3 secondsDichotic tone (DT) Two different tones applied via
headphones binaurally Tones were 291 Hz and 392 HzMismatch negativity (MMN) A modified version of
optimized MMN paradigm developed by Pakarinen etal [19] was used Standard tone was 75 ms in durationat an intensity of 70 dB composed of three sinusoidalpartials (523 Hz as fundamental frequency) and pre-sented simultaneously via headphones (resulting in per-ception of the sound source as localized in the centre)There were four type of deviants (duration intensityfrequency location) each with three levels Locationdeviance was achieved by delaying the tone monaurallyright or left with equal probabilityThese abovementioned stimuli were given in varying
blocks from the onset to the end of the experimentalsessions
EEG recordingA special stimulus unit developed in our lab EmbeddedMicrocontroller Interactive Stimulus Unit (EMISU) [20]was used for the generation of stimuli and the recording
Ozgoren et al Nonlinear Biomedical Physics 2010 4(Suppl 1)S6httpwwwnonlinearbiomedphyscomcontent4S1S6
Page 3 of 12
of electrophysiological data both in sleep and anesthesiaexperiments The EEG recording was achieved in theoperation room by means of 40 channel EEG (Nuamps)headphones with noise cancellation feature (CreativeHN-700 Republic of Singapore) MATLAB EEGLABand EMISU software were used The auditory stimuliwere administered through noise cancelling head phonesat a level of 85 dB SPL The stimuli were consisted oftones 1500 Hz 500 ms duration 30 ms risefall timewith randomly varying intervals ranging from 25 to5 sec
EEG segment selection and data preparationThe continuous EEG data files (cnt) were epoched forthe evoked condition or segmented for the spontaneouscondition to equal data lengths Each segment contained601 data points (sampling rate 1000 Hz) which equaledto -200 to 400 ms for the epoched sections Sponta-neous segment would be selected from an artifact freesection with no stimulation In a section with stimula-tions then the segment would be temporally separatedby 2-3 seconds pre and post stimuliBy means of manual observation the artifacts were
removed These artifact free sections were baseline cor-rected The obtained sweeps were than averaged Due tohostile conditions in the surgery room not all the chan-nels were artifact free For this reason 18 channels[2122] with equal distribution across anteriorposteriorand hemispheric locations were fixed across all subjectsThese data segments were then transferred into standar-dized low resolution electromagnetic tomography(sLORETA) protocol The data were transformed withproper electrode locations to obtain X Y Z coordinateswhich were then used to create transformation matrixfile in sLORETA application ldquoGlobal field powerrdquo (GFP)was used to estimate the target peaks Therefore at agiven sLORETA image the current density value (CDV)of maximal GFP peaks are presented
sLORETA proceduressLORETA was applied to estimate the neural sources ofevent related scalp potentials [2324] in the LORETA2D potential distribution to 3D brain volume MontrealNeurological Institute (MNI) was referred for standardsolution space which was subdivided into a 3D grid con-sisting of 2394 volume elements with a regular cube sizeof 7x7x7 mm An equivalent current dipole is posi-tioned for which a current density (microAmm2) is com-puted on each of these voxels [2324]
Spectral representationsThe spectrograms for the presentations of EEG data seg-ments were obtained by means of a MATLAB routine[25] The outline of the method is given below
Wavelet transform of a signal gives the time-scaleinformation found by the Wavelet transform of a signals(t) gives the time-scale information found by the follow-ing formula
W b a s tt b
adts ( ) = ( ) minus⎛
⎝⎜⎞⎠⎟
minusinfin
infin
int
where the mother wavelet function sdot( ) was chosenas Complex Morlet denotes the complex conjugate b is the shift para-
meter the corresponding scale is given by dilation para-meter a Since most of the signal processing applicationsfocus on the time-frequency analysis it is essential toconvert the scale information into frequency The for-mula given below provides corresponding frequency Fafor a specified scale value a
FF
aac=
Δ
with the parameters Fc denoting center frequency ofthe wavelet in Hz Δ denoting the sampling period Forobtaining the spectrogram the Central (Cz) electrodedata were used
StatisticsThe Shapiro-Wilk test was used for determining distri-bution of the groups and deciding statistical methodsWhen the groups were in normal distribution paired t-test was used to compare the above mentioned two con-ditions The correlation of BIS and propofol dosage wasdetermined with nominal logistic regression
ResultsThe electrophysiological recordings the auditory stimu-lations and the BIS monitoring have been successfullyperformed in all subjects of the two experimentalgroups Additionally in anesthesia group drug infusionsystem was used The conditions for the stimulationswere kept similar
The anesthesia experimentAll subjects have undergone the step-wise propofol admin-istration One subjectrsquos data were not available for bothBIS and perfusion control system therefore it wasdismissed The subjects had been instructed to stay awakeAround 08-12 microgmL (propofol) they have lost conscious-ness (LOC) at which point they ceased to respond to com-ments The electrophysiological recordings were continuedregardless of LOC till reaching level of 16 microgmL There-fore all subjects received a similar dosage regime of propo-fol as well as auditory stimulations
Ozgoren et al Nonlinear Biomedical Physics 2010 4(Suppl 1)S6httpwwwnonlinearbiomedphyscomcontent4S1S6
Page 4 of 12
The figure 2 represents the distribution of BIS valuesacross the propofol dosageNominal logistic regression propofol concentrations
versus BIS ScoresIn table 1 nominal logistic regression analysis has been
applied to model the relationship between propofol con-centrations and BIS values Positive coefficient value forlogit 1 indicates that as BIS score increases propofol
concentration tends to be in propofol concentration 12microgmL compared to propofol concentration 16 microgmLSince all coefficients are positive the conclusions are allsame p-value = 0000 for all coefficients show that BISscore affects being in propofol concentrations 12 0804 and 0 microgmL compared to concentration 16 microgmLThe results reveal that the odds increase when we com-pare lower concentrations with concentration 16 microgmL Nominal logistic regression has been chosen overordinal logistic regression since effect of BIS are notsame for each concentration of propofol which isobvious from the larger regression coefficients and oddsratios for logit 2 3 and 4Accordingly the increments of propofol resulted in
decreasing of the BIS index (plt00001) (Table 2) Theauditory stimulations were presented throughout thesession The evoked waveforms are presented in figure 3Here the upper waveforms represent the averagedresponse with a distinct N1 component (yellow verticalbox points out) The lower lines represent the increasinglevel of propofol Accordingly the highest level of pro-pofol displays no clear N1 waveform In order to high-light the differences between the conditions the lowerdosages (04 and 08 microgmL) and the higher dosagelevels (12 and 16 microgmL) were grouped The compari-son of higher dosage group with the lower one revealeda significant difference (p=0003)A sample sLORETA of group average is provided in
figure 4 On the left hand side the spectrogram of theevoked response for N1 is given The 0 denotes the sti-mulus onset time The major part of the activity lies
Figure 2 BIS and propofol administration box plot The verticalaxis denotes the BIS index values whereas the horizontal axispresent the propofol dosage (target effector site concentration inmicrogmL) The boxes represent the distribution of BIS versus thepropofol The outliers show the standard error
Table 1 Logistic regression table with coefficients and confidence intervals for each propofol concentrations
95 CI
Predictor Coef SE Coef Z P Odds Ratio Lower Upper
Logit 1(12microgmL 16 microgmL)
ConstantBIS scores
-18920021
01670002
-1130986
00000000 102 102 103
Logit 2(08 microgmL 16 microgmL)
ConstantBIS scores
-78750098
01910002
-41244198
00000000
110110 111
Logit 2(04 microgmL 16 microgmL)
ConstantBIS scores
-184850215
02890003
-64046506
00000000 124 123 125
Logit 2(0 microgmL 16 microgmL)
ConstantBIS scores
-203290226
03970004
-51155104
00000000 125 124 126
Propofol dosage 16 microgmL has been chosen as the reference level The Coef (coefficient) column shows the change in the logit of the given dosage compared todosage 16 microgmL when BIS values increse by 1 unit BIS bispectral index CI confidence interval SE standard error
Ozgoren et al Nonlinear Biomedical Physics 2010 4(Suppl 1)S6httpwwwnonlinearbiomedphyscomcontent4S1S6
Page 5 of 12
from delta to alpha ranges (35-11 Hz) The sLORETAreveals highest power to be located at Broadman Area(BA) 6 Additionally with the administration of propo-fol especially reaching around 08 microgmL the distinctivespindle oscillations at around 11-14 Hz were observedThese waveforms lasted approximately for 1 second andwere predominantly present in the central line electro-des (Figure 5)Lower propofol dosage (04 and 08 microgmL) level
revealed sLORETA locations of maximal activity areas toinclude BA6 (5 subjects) BA7 (7 subjects) BA20 (3 sub-jects) BA3 (1 subject) BA11 (1 subjects) BA18 (3 subject)BA19 (1 subject) BA38 (1 subject) BA47 (2 subjects)For the higher propofol dosage (12 and 16 microgmL)
the locations from the maximal activity areas includedBA6 (6 subjects) BA7 (7 subjects) BA3 (1 subject) BA8(2 subjects) BA11 (2 subjects) BA19 (2 subjects) BA20(1 subject) BA21 (1 subject) BA22 (1 subject) BA37 (1subject)
The sleep experimentThe Bispectral Index (BIS) measurements have been uti-lized both for anesthesia and sleep conditions The BISvalues follow the depth of sleep closely The figure 6presents the BIS (blue) and classical RampK stages (red) invertical axesAccording to Spearman analysis the correlation rate
between BIS values and sleep stages in this sleep periodwas r =082
The microstates of sleep and possible effect ofstimulationsDuring the administration of auditory stimulationsupon changing of the type of stimulation of BBB wehave observed changes in depth of sleep of subjectsThese changes have been noted eg figure 7 especiallywith the presentation of syllables (DL) after simpletones (DT) The second application of syllables resultedin a similar increase in BIS values (arrow in Fig 7) Asevery subject would have a unique sleep pattern-and itis not predictable- the causal relationship of external sti-mulation changes on the sleep patterns remains afurther study topic
Auditory stimulations during sleepThe auditory evoked potentials have been succesfullyobtained during different stages of sleep The figure 8and Table 3 represent the N1 potential across differentBIS values ldquoThe lower the BIS value deeper the sleeprdquowas already obtained above (figure 6) [26] Therefore
Table 2 The N1 amplitudes corresponding to differentpropofol target concentrations (SE are given within thebrackets)
Propofol N1 (microV)
00 microgmL -224 (067)
04 microgmL -198 (061)
08 microgmL -140 (037)
12 microgmL -104 (066)
16 microgmL -039 (038)
Figure 3 The auditory N1 component in sleep The waveforms represent grand average (N=12) of electrophysiological recordings duringanesthesia The horizontal axis denotes the temporal domain from prestimulus 500 ms to poststimulus 1000 ms The 0 marks the point ofauditory stimulation
Ozgoren et al Nonlinear Biomedical Physics 2010 4(Suppl 1)S6httpwwwnonlinearbiomedphyscomcontent4S1S6
Page 6 of 12
Figure 4 The wavelet spectrogram and the sLORETA sources of anesthesia The spectrogram (left) has seconds in horizontal axis whereasthe 0 value represent the point of auditory stimulation The vertical axis denotes the frequency increasing towards bottom (Hz) The possiblesources are presented at right side with a sLORETA power maxima matching the 100 ms (N1)
Figure 5 The EEG recording and the spectrogram of the spindle oscillations The EEG was obtained during a propofol level around 08 microgmL The spectrogram shows a spindle oscillation at around 11-14 Hz which lasts slightly under 1 sec
Ozgoren et al Nonlinear Biomedical Physics 2010 4(Suppl 1)S6httpwwwnonlinearbiomedphyscomcontent4S1S6
Page 7 of 12
the lower BIS values in figure 8 represent deeper sleepstages through which the N1 wave starts to dissappearSimilar to the anesthesia the higher BIS group (80
and 70) and the lower BIS group (60 and 50) weregrouped The comparison of higher BIS group with thelower one revealed a significant difference (p=0005)A sample sLORETA of group average is provided in
figure 9 On the left hand side the spectrogram of theevoked response for N1 during sleep is given Themajor part of the activity lies around delta with someactivity towards theta ranges (35-7 Hz) The sLORETAreveals highest power to be located at Broadman Area 7
DiscussionThe current manuscript presents data from differentexperimental setups and from different conscious statesTherefore a confined approach was applied Accord-ingly the effect of simple auditory stimulations in therange of 100-150 ms was focused The anesthesia proce-dure by means of step-wise administration of propofolhas displayed a gradual loss of N1 Likewise with dee-pening of sleep -which could be monitored also withBIS- the N1 component diminishedIt has been reported that approximately after the
100-150 ms of the auditory stimulation a waveform
Figure 6 The comparison of BIS and RampK sleep stages The right vertical axis represents the BIS values (0 to 100) The horizontal axisrepresent the temporal values (minutes) The secondary vertical axis represents the sleep stages The thick lines (red) denote the RampK stage andthe blue dots represent the BIS values
Figure 7 The brain biophysics battery application during sleep monitored via BIS The raw BIS index during sleep (gray dots) is shown inline The vertical bars represent the time points where the auditory blocks were presented (DT dichotic tone DL dichotic listening MMNmismatch negativity AEP auditory evoked potentials AERP auditory event related potential) The arrow points to a sudden increase of BIS valuesupon application of dichotic syllables
Ozgoren et al Nonlinear Biomedical Physics 2010 4(Suppl 1)S6httpwwwnonlinearbiomedphyscomcontent4S1S6
Page 8 of 12
which has a negative peak was observed in awake sub-jects [627] This waveform is called (N100) ldquoN1rdquo Theneuronal generators for this waveform are suggested tobe planum temporale in the secondary cortical area[28]The current results revealed activities located at
around BA3 BA6 BA7 BA8 BA11 BA19 BA20 BA21BA22 BA37 BA38 and BA47 regions during the audi-tory stimulations under propofol anesthesia These loca-tions were found across the subjects using the GFPmaxima matching the N1 peak (113 ms) The presenceof BA6 and BA7 were more frequent than the otherlocations The BA7 area had been located in other stu-dies highlighting the functional prospects of precuneus[29-31] Additionally the vegetative state has beenlinked to impaired activity at this area using PET ima-ging [32]Furthermore the current sleep experiment findings
revealed locations around BA4 BA7 and BA9 Likewise
in the study of Anderer [22] the sleep spindles whichare more frequent in Stage 2 (and thus around BIS level70) were found to be related to BA9 and BA10 In [22]BA7 BA9 and BA10 were among the common activa-tion areas The activation of these areas has been linkedto sleep spindles Accordingly the areas from the currentstudy are plausible target areas of sleep and anaesthesiadomains Interestingly the sleep and anaesthesia sharesimilar areas to a degree for the functional changes Theshort term spectral changes like in the case of spindlesneed to be further addressed in parallel experimentaldesignsWith the administration of propofol especially reach-
ing around 08 microgmL the distinctive spindle oscillationsat around 11-14 Hz were observed At this level also thesubjects started losing their consciousness and secondlythe N1 waveform began to disappear While the forma-tion of LOC the disappearance of N1 and the appear-ance of spindle oscillations can be coincidental therehave been various reports supporting the case [33-35]The presence of this type oscillatory activity has beenattributed to inductive versus disruptive properties[35-38] Therefore the dual nature of these activitiesneeds to be unveiled via controlled studiesThe sleep related EEG segments and the spectrograms
also revealed spindle activity at around BIS levels of 80-70 The causal mechanisms and relationship of thesespindles to anesthesia are beyond the scope of currentmanuscript however there have been various studies
Figure 8 The auditory N1 component in sleep The waveforms represent grand average (N=12) of electrophysiological recordings Thehorizontal axis denotes the temporal domain from prestimulus 500 ms to poststimulus 1000 ms The 0 marks the point of auditory stimulationThe yellow bar represents the N1 waveform
Table 3 The N1 amplitudes corresponding to differentsleep depth (via BIS index) (SE are given within thebrackets)
BIS N1 (microV)
90 -09 (104)
80 -06 (042)
70 06 (070)
60 11 (062)
50 14 (071)
Ozgoren et al Nonlinear Biomedical Physics 2010 4(Suppl 1)S6httpwwwnonlinearbiomedphyscomcontent4S1S6
Page 9 of 12
indicating functional aspects of the spindles[2233353940]The spatiotemporal properties of brain functioning
undergo some degree of changes during alterations inthe conscious states Some of these mechanisms may belinked to minor to large scale networks in the brain[41-43] These changes may be necessary for brain toshift from one state to another (ie sleep) or they canbe direct effects of medications (ie propofol anesthesia)
Does auditory cognitive processing cessate in deepanesthesiaThe disappearance of basic electrophysiological patternsdoes not necessarily point to cessation of auditory cog-nitive processing This could be analyzed with implicitmemory paradigms as well as other special designsHenceforth caution is necessary while commenting onelectrophysiological data in relationship to cognition
Sleep dynamicsThe first stage results have provided a basic understand-ing in these altered states such that various auditory sti-muli are successfully processed in both light and deepsleep stages In addition to information processing dur-ing sleep a large group of researchers is concerned with
sleep disorders [44-46] However all these studies arestill far away from elucidating the sleep field In order toshed light on sleep processes the brain functioning inwakefulness shouldnrsquot be completely neglected It hasbeen indicated that sleep has a marked effect on N1waveform [28] Researchers have stated that at thebeginning of sleep there is a prolongation in latency anddecrease in amplitude of N100 component [2947] Ithas been also reported that N100 waveform is highlysensitive to physical properties of the stimulus and withthe repetition of the same stimuli N100 amplitudedecreases [48] It was stated that during NREM sleepamplitude of N100 decreases and the latency lengthens[49] In a research it has been found that the amplitudeof N100 reduces in slow wave sleep and slightlyincreases in REM sleep [50] Naumlaumltaumlnen has pronouncedthat in alert wakefulness the N100 component is corre-lated with task performance [51] As can be seen fromthe above mentioned studies many researchers havepointed that N100 waveform is susceptible to the stateof the brain A common feature of stage 2 the sleepspindles is thought to be related with suppression ofinformation processing [52] It has been associated thatdecrease in N100 amplitude in N2 sleep to the afore-mentioned function of the sleep spindles [53] Atienza
Figure 9 The wavelet spectrogram and the sLORETA sources of sleep The spectrogram (left) has seconds in horizontal axis whereas the 0value represent the point of auditory stimulation The vertical axis denotes the frequency increasing towards bottom (Hz) The possible sourcesare presented at right side with a sLORETA power maxima matching the 100 ms (N1)
Ozgoren et al Nonlinear Biomedical Physics 2010 4(Suppl 1)S6httpwwwnonlinearbiomedphyscomcontent4S1S6
Page 10 of 12
et al have interpreted the decrease of N100 amplitudeas reduced afferent sensorial processing at the subcorti-cal level [47] In the light of these results one couldexplain the decrease in N100 amplitude in deeper sleepstages in our study to be due to the suppression of audi-tory stimulation in order to maintain sleepingFrom a higher scope the stages of sleep are artificial
separations whereas during natural sleep the brain mayshift abruptly from one state to another The externaland internal conditions may all play a role in this sleepequilibrium These shorter term stages may be definedas microstates The external stimulations do have effecton immediate neurocognitive properties Additionallythese stimulations may also play a causative role for thebrain change its response state Therefore the observa-tions that we have stated in our study will remain as astudy area for our group The brain biophysics battery ismade up of different auditory stimulation blocks Hencethe different properties of brain responsiveness can beaddressed while the block changes might serve to high-light the microstates level
Future research agendaThe field of studying brain functioning as in the presentapproach would benefit from further experiments orresearch methods These can be enriched by incorporat-ing ldquoDirected information transferrdquo ldquoEntropy and coher-encerdquo ldquoCausal relationshipsrdquo and ldquoBrain asymmetry (iedichotomy) under different conditionsrdquo Additionally anextended inclusion of various parameters such as bodytemperature and other physiological data might be bene-ficial to explain further mechanisms of the brain thatinteract with the body
ConclusionsBoth sleep and anesthesia are dynamic conditions whichrequire a uniform approach Auditory stimulations withdistinct features may provide a thorough insight into thebrain responsiveness in different conscious states Addi-tionally spectro-temporal properties of the dynamicstates and the analysis of microstates can constitute tobetter understanding of underlying mechanisms Theother line of plausible applications includes the neurop-sychiatric pathologies coma and other major states ofthe brain
List of abbreviationsABR Auditory Brain-stem Responses AEP Auditory Evoked Potentials AERPAuditory Event Related Potential BA Broadman Area BBB Brain BiophysicsBattery BIS Bispectral Index CDV Current Density Value DL DichoticListening DT Dichotic Tone ECoG Electrocorticogram EEGElectroencephalography EMISU Embedded Microcontroller InteractiveStimulus Unit EOG Electrooculography fMRI functional Magnetic ResonanceImaging GFP Global Field Power ISI Inter Stimulus Interval LOC Loss OfConsciousness MEG Magneto Encephalography MLRs Middle Latency
Responses MNI Montreal Neurological Institute MMN Mismatch NegativityPET Positron Emission Tomography RampK Rechtschaffen and Kales ROIRegion Of Interest sLORETA standardized Low Resolution ElectromagneticTomography SPL Sound Pressure Level SQI Signal Quality Index)
AcknowledgementsThe authors are grateful to Emre Cek for his support on wavelet basedspectral analysis tool and to Cagdas Guducu for his support on the graphicsand data sets and to Ugras Erdogan for participation in the design of theEMISU system and to Dr Ozgul Vupa for her support on statistical analysisWe thank to the neurosurgery and anesthesia teams The study wassupported by means of projects DEU2006KBSAG017 DEU2007KBSAG06165 and TUBITAK 108S113 COST BM601 (Neuromath) The study was partiallypresented at the conference of ldquoConsciousness and its Measuresrdquo November29 - December 1 2009 Limassol Cyprus (httpwwwhumanbraindynamicscomneuroconsci2009)This article has been published as part of Nonlinear Biomedical PhysicsVolume 4 Supplement 1 2010 Consciousness and its Measures JointWorkshop for COST Actions Neuromath and Consciousness The fullcontents of the supplement are available online athttpwwwnonlinearbiomedphyscomsupplements4S1
Author details1Department of Biophysics Faculty of Medicine Dokuz Eylul University Izmir35340 Turkey 2Department of Anesthesiology Faculty of Medicine DokuzEylul University Izmir35340 Turkey
Authorsrsquo contributionsMO conceived of the study and constructed its design and coordinationOB participated in the anesthesia experiments and supported the sLORETAassessments SK participated in the sleep experiments and supported withthe analysis of the data NG participated in the anesthesia experiments andAO participated in the design of the study and manuscript All authors readand approved the final manuscript
Competing interestsThe Embedded Interactive Stimulus Unit (EMISU) system has a ldquopatentpendingrdquo status
Published 3 June 2010
References1 Wang Y Liu D Discovering the capacity of human memory Brain and
Mind 2003 4(2)189-1982 Plourde G Auditory evoked potentials Best Pract Res Clin Anaesthesiol
2006 20(1)129-1393 Jones JG Konieczko K Hearing and memory in anaesthetised patients Br
Med J (Clin Res Ed) 1986 2921291-12934 Naumlaumltaumlnen R The mismatch negativity a powerful tool for cognitive
neuroscience Ear Hear 1995 16(1)6-185 Fudickar A Kluzik A Weiler N Scholz J Tonner PH Bein B A comparison of
auditory evoked potentials derived from a monitor integrated moduleversus standard technique J Neurosurg Anesthesiol 2009 21(2)120-126
6 Bayazit O Oniz A Hahn C Guumlntuumlrkuumln O Ozgoren M Dichotic listeningrevisited Trial-by-trial ERP analyses reveal intra- and interhemisphericdifferences Neuropsychologia 2009 47536-545
7 Hugdahl K Symmetry and asymmetry in the human brain Eur Rev 20053(2)119-133
8 Hugdahl K Dichotic listening in the study of auditory laterality TheAsymmetrical Brain MIT PressHugdahl K amp Davidson RJ 2005 441-476
9 Ozgoren M Recording neuroelectrical activity under hostile surgicalenvironment Int J Psychophysiol 2008 69(3)160
10 Gokmen N Oniz A Bayazit O Erdogan U Akkan T Ozkurt A Ozgoren MThe assessment of acoustical and electromagnetic noise on EEGmonitoring during spinal surgery operations J Neurol Sci Turk 200926(4)472-83 [httpjnsdergisiorgtextphp3id=322]
11 Nasibov E Ozgoren M Ulutagay G Oniz A Kocaaslan S On the analysis ofBIS stage epochs via fuzzy clustering Biomed Tech (Berl) in press
12 Schneider G Hollweck R Ningler M Stockmanns G Kochs EF Detection ofconsciousness by electroencephalogram and auditory evoked potentialsAnesthesiology 2005 103934-943
Ozgoren et al Nonlinear Biomedical Physics 2010 4(Suppl 1)S6httpwwwnonlinearbiomedphyscomcontent4S1S6
Page 11 of 12
13 McNeer RR Bohόrquez J Ozdamar O Influence of auditory stimulationrates on evoked potentials during general anesthesia Anesthesiology2009 1101026-1035
14 Nakamura M Uchida S Maehara T Kawai K Hirai N Nakabayashi TArakaki H Okubo Y Nishikawa T Shimizu H Sleep spindles in humanprefrontal cortex an electrocorticographic study Neurosci Res 200345419-427
15 Manshanden I De Munck JC Simon NR Lopes da Silva Fernando H Sourcelocalization of MEG sleep spindles and the relation to sources of alphaband rhythms Clin Neurophysiol 2002 1131937-1947
16 Simpson TP Manara AR Kane NM Barton RL Rowlands CA Butler SR Effectof propofol anaesthesia on the event-related potential mismatchnegativity and the auditory-evoked potential N1 Br J Anaesth 200289(3)382-388
17 Tung A Mendelson WB Anesthesia and sleep Sleep Med Rev 20048213-225
18 Rechtschaffen A Kales A A manual of standardized terminologytechniques and scoring system for sleep stages of human subjectsBrain information serviceBrain Research Institute University of California 1968
19 Pakarinen S Takegata R Rinne T Huotilainen M Naumlaumltaumlnen R Measurementof extensive auditory discrimination profiles using the mismatchnegativity (MMN) of the auditory event-related potential (ERP) ClinNeurophysiol 2007 118(1)177-185
20 Ozgoren M Erdogan U Bayazit O Taslica S Oniz A Brain asymmetrymeasurement using EMISU (embedded interactive stimulation unit) inapplied brain biophysics Comput Biol Med 2009 39(10)879-88
21 Anderer P Gruber G Saletu B Kloumlsch G Zeitlhofer J Pascual-Marqui c RDNon-invasive electrophysiological neuroimaging of sleep Int Congr Ser2002 1232795-800
22 Anderer P Kloumlsch G Gruber G Trenker E Pascual-Marqui RD Zeitlhofer JBarbanoj MJ Rappelsberger P Saletu B Low-resolution brainelectromagnetic tomography revealed simultaneously active frontal andparietal sleep spindle sources in the human cortex Neuroscience 2001103581-592
23 Pascual-Marqui RD Michel CM Lehmann D Low resolutionelectromagnetic tomography A new method for localizing electricalactivity in the brain Int J Psychophysiol 1994 1849-65
24 Pascual-Marqui RD Standardized low resolution brain electromagnetictomography (sLORETA) Technical details Methods Find Exp ClinPharmacol 2002 24(Suppl D)5-12
25 Cek E Ozgoren M Savaci A Continuous time wavelet entropy of auditoryevoked potentials Comput Biol Med doi101016jcompbiomed200911005
26 Ozgoren M Kocaaslan S Oniz A Analysis of non-REM sleep staging withelectroencephalography bispectral index Sleep Biol Rhythms 20086249-255
27 Oniz A Guumlduumlcuuml C Aydin B Ozgoren M Event-related delta and thetaresponses by tactile stimuli J Neurol Sci Turk 2008 25(2)117-127[httphttpjnsdergisiorgtextphp3id=221]
28 Bastuji H Garcia-Larrea L Evoked potentials as a tool for the investigationof human sleep Sleep Med Rev 1999 323-45
29 Ozgoren M Bayazit O Gokmen N Oniz A Spectral pattern analysis ofpropofol induced spindle oscillations in the presence of auditorystimulations Open Neuroimag J submitted
30 Vogt BA Laureys S Posterior cingulate precuneal amp retrosplenial corticescytology amp components of the neural network correlates ofconsciousness Prog Brain Res 2005 150205-217
31 Cavanna AE Trimble MR The precuneus a review of its functionalanatomy and behavioural correlates Brain 2006 129564-583
32 Laureys S Goldman S Phillips C van Bogaert P Aerts J Luxen A Franck GMaquet P Impaired effective cortical connectivity in vegetative statepreliminary investigation using pet NeuroImage 1999 9377-382
33 Ferenets R Lipping T Suominen P Turunen J Puumala P Jaumlntti VHimanen SL Huotari AM Comparison of the properties of EEG spindlesin sleep and propofol anesthesia Proceedings of the 28th IEEE EMBSAnnual International Conference 2006
34 Lee U Mashour GA Kim S Noh G-J Choi BM Propofol induction reducesthe capacity for neural information integration Implications for themechanism of consciousness and general anesthesia Conscious Cogn2009 1856-64
35 Mackenzie L Pope KJ Willoughby JO Pysiological and pathologicalspindling phenomena have similar regional EEG power distributionsBrain Res 2004 100892-106
36 Palva S Palva JM New vistas for a-frequency band oscillations TrendsNeurosci 2007 30150-158
37 Klimesch W Sauseng P Hanslmayr S EEG alpha oscillations theinhibitionndashtiming hypothesis Brain Res Rev 2007 5363-88
38 Sherman SM Tonic and burst firing dual modes of thalamocortical relayTrends Neurosci 2001 24122-126
39 Huotari AM Koskinen M Suominen K Alahuhta S Remes R Hartikainen KMJaumlntti V Evoked EEG patterns during burst suppression with propofol BrJ Anaesth 2004 9218-24
40 Schabus M Hoedlmoser K Pecherstorfer T Anderer P Gruberb GParapatics S Sauter C Kloesch G Klimesch W Saletu B Zeitlhofer JInterindividual sleep spindle differences and their relation to learning-related enhancements Brain Res 2008 1191127-135
41 Bressler SL Tognoli E Operational principles of neurocognitive networksInt J Psychophysiol 2006 60139-148
42 Fingelkurts AA Fingelkurts AA Kivisaari R Autti T Borisov S Puuskari VJokela O Kaumlhkoumlnen S Increased local and decreased remote functionalconnectivity at EEG alpha and beta frequency bands in opioid-dependent patiens Psychopharmacology 2006 18842-52
43 Fingelkurts AA Kaumlhkoumlnen S Fingelkurts AA Kivisaari R Autti T Borisov SPuuskari V Jokela O Autti T Reorganization of the brain oscillations andtheir temporal characteristics during opioid withdrawal JPsychopharmacol 2008 22(3)270-284
44 Baklan B Narcolepsy-cataplexy J Int Med Sci 2007 3(26)19-2645 Degirmenci E Bir LS Oncel C Unilateral thalamodiencephalic syndrome
presenting with severe hypersomnia J Neurol Sci Turk 2008 25(3)196-199[httpjnsdergisiorgtextphp3id=230]
46 Alemdar M Iseri P Kamacı S Efendi H Budak F Komsuoglu SS Risk factorsand seasonal-diurinal variatons in lacunar infarctions J Neuro Sci Turk2006 23(2)124-128 [httpjnsdergisiorgtextphp3id=95]
47 Atienza M Cantero JL Escera C Auditory information processing duringhuman sleep as revealed by event related brain potentials ClinNeurophysiol 2001 1122031-2045
48 Loveless NE Brunia CMH Effects of rise-time on late components of theauditory evoked potential J Psychophysiol 1990 4369-380
49 Paavilainen P Cammann R Alho K Reinikainen K Sams M Naumlaumltaumlnen REvent related potentials to pitch change in an auditory stimulussequence during sleep Current trends in event-related potential researchJohnson R Rohrbaugh JW Parasuraman R 1987 246-255
50 Bastuji H Garcia-Larrea L Franc C Mauguiere F Brain processing ofstimulus deviance during slow-wave and paradoxical sleep A study ofhuman auditory evoked responses using the oddball paradigm J ClinNeurophysiol 1995 12155-167
51 Naumlaumltaumlnen R The role of attention in auditory information processing asrevealed by event-related potentials and other brain measures ofcognitive function Behav Brain Sci 1990 13201-208
52 Steriade M McCormick DA Sejnowski TJ Thalamocortical oscillations inthe sleeping and aroused brain Science 1993 262679-685
53 Elton M Winter O Heslenfeld D Loewy D Campbell K Kok A Eventrelated potentials to tones in the absence and presence of sleepspindles J Sleep Res 1997 678-83
doi1011861753-4631-4-S1-S6Cite this article as Ozgoren et al Brain function assessment in differentconscious states Nonlinear Biomedical Physics 2010 4(Suppl 1)S6
Ozgoren et al Nonlinear Biomedical Physics 2010 4(Suppl 1)S6httpwwwnonlinearbiomedphyscomcontent4S1S6
Page 12 of 12
- Abstract
-
- Background
- Methods
- Results
- Conclusions
-
- Background
- Methods
-
- Sleep procedure
- Anesthesia procedure
- Brain biophysics battery
- EEG recording
- EEG segment selection and data preparation
- sLORETA procedures
- Spectral representations
- Statistics
-
- Results
-
- The anesthesia experiment
- The sleep experiment
- The microstates of sleep and possible effect of stimulations
- Auditory stimulations during sleep
-
- Discussion
-
- Does auditory cognitive processing cessate in deep anesthesia
- Sleep dynamics
-
- References
-
- Future research agenda
-
- Conclusions
- Acknowledgements
- Author details
- Authors contributions
- Competing interests
- References
-
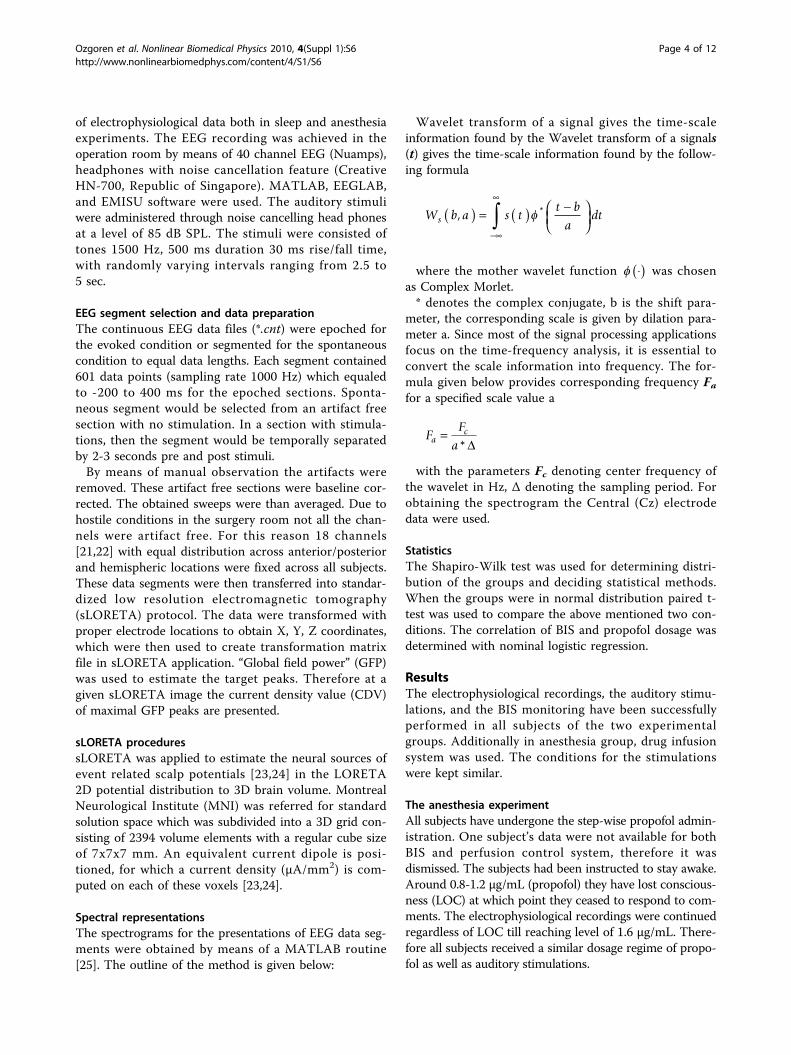