Brain Computer Interface For Mobility- A Case Study With ALS Patient
16
International Journal of Applied Engineering Research SSN 0973-4562 Volume 9, Number 24 (2014) pp. 26055-26070 © Research India Publications http://www.ripublication.com Brain Computer Interface For Mobility- A Case Study With ALS Patient D.Hari Krishna, Rakesh Sengupta, I.A.Pasha and T.Satya Savithri Abstract The aim of this paper is to explore different classification algorithms in classifying an EEG signal acquired from ALS and normal subject by conducting motor imagery based BCI system experiment and P300 based temporal oddball experiment. We also tested the performance of the these classifiers in moving a robotic wheel chair from one point to another in shortest path using optimal path planning algorithm. The results of the classification accuracy and time taken by different classifiers are presented. The system is useful for ALS patients in moving from one location to another location in indoor environment. Index Terms—BCI, ALS, Motor Imagery, cross correlation. Introduction Advances in biomedical signal processing, especially the EEG signal, and mobile robot control have allowed the development of robotic wheelchairs commanded by BCI [1-2]. Such vehicles use some EEG characteristics, such as potentials from an imaginary motor task or evoked potentials in the development. By integrating BCI features and autonomous robot capabilities with normal wheel chair, we can get the useful assistive device. This is helpful for people who are paralyzed, and are unable to control parts of their body as much as necessary to activate the joystick of a robotic wheelchair. Many people can use this to gain autonomy, and to avoid a helper to move their wheelchair in a controlled environment indoors. With the new system, the ALS patient sits in the wheelchair and thinks about the direction they want to move. When people concentrate on a desired direction, their brains start emanating P300 waves because attention is deployed in those directions more than others. Even the desire for a movement can be recorded as event-related de-synchrony (ERD) in the EEG signal. These are promptly recorded by an EEG machine which sends the controller in the desired direction. This paper presents two approaches for wheel chairnavigation: i. Motor imagery based navigation ii. P300 based oddball paradigm. For autonomous robotic systems, it is also essential to detect and avoid the obstacles in its path as well as to make its own decisions in the path planning.
-
Upload
srecwarangal -
Category
Documents
-
view
2 -
download
0
Transcript of Brain Computer Interface For Mobility- A Case Study With ALS Patient
International Journal of Applied Engineering Research
SSN 0973-4562 Volume 9, Number 24 (2014) pp. 26055-26070
© Research India Publications
http://www.ripublication.com
Brain Computer Interface For Mobility- A Case Study With
ALS Patient
D.Hari Krishna, Rakesh Sengupta, I.A.Pasha and T.Satya Savithri
Abstract
The aim of this paper is to explore different classification algorithms in
classifying an EEG signal acquired from ALS and normal subject by conducting
motor imagery based BCI system experiment and P300 based temporal oddball
experiment. We also tested the performance of the these classifiers in moving a
robotic wheel chair from one point to another in shortest path using optimal path
planning algorithm. The results of the classification accuracy and time taken by
different classifiers are presented. The system is useful for ALS patients in
moving from one location to another location in indoor environment.
Index Terms—BCI, ALS, Motor Imagery, cross correlation.
Introduction Advances in biomedical signal processing, especially the EEG signal, and mobile robot
control have allowed the development of robotic wheelchairs commanded by BCI [1-2].
Such vehicles use some EEG characteristics, such as potentials from an imaginary
motor task or evoked potentials in the development. By integrating BCI features and
autonomous robot capabilities with normal wheel chair, we can get the useful assistive
device. This is helpful for people who are paralyzed, and are unable to control parts of
their body as much as necessary to activate the joystick of a robotic wheelchair. Many
people can use this to gain autonomy, and to avoid a helper to move their wheelchair in
a controlled environment indoors. With the new system, the ALS patient sits in the
wheelchair and thinks about the direction they want to move. When people concentrate
on a desired direction, their brains start emanating P300 waves because attention is
deployed in those directions more than others. Even the desire for a movement can be
recorded as event-related de-synchrony (ERD) in the EEG signal. These are promptly
recorded by an EEG machine which sends the controller in the desired direction. This
paper presents two approaches for wheel chairnavigation: i. Motor imagery based
navigation ii. P300 based oddball paradigm. For autonomous robotic systems, it is also
essential to detect and avoid the obstacles in its path as well as to make its own
decisions in the path planning.
26056 D.Hari Krishna, Rakesh Sengupta, I.A.Pasha and T.Satya Savithri
while moving from source to the destination. Several path planning techniques have
been developed for mobile robots [3-5]. These techniques depend on different
environments and types of sensors etc, and these approaches help to improve
performance in terms of time, distance, cost and complexity. There are three subtasks in
the robot navigation problems - a) mapping and modeling the environment, b) path
planning, and c) path traversal with collision avoidance [6]. In the current work we
designed a control system using A-star/Dijkstra path planning algorithm
In the present paper, Section 2 describes about i) Motor imagery based BCI system
experiment ii) P300 based temporal odd ball paradigm experiment in which data
collection, data analysis (pre-processing, feature extraction and feature classification)
steps are involved. Section 3 discusses in detail the path planning algorithm. Section 4
elaborates the proposed control system configuration and finally section 5 about
conclusion of the proposal.
Experiment Details
Motor Imagery based BCI System
In motor imagery based BCI paradigm, subjects have to imagine performing a specific
motor action (e.g. clenching hand or rotating foot) without any external motor
movement. We then classify the patterns in the electro encephalogram signal (EEG)
with the help of feature extraction and classification into useful commands to be given
to an external device. In this way the EEG signals can be used as feedback for motor
disabled patients to communicate with the external environment.
We employed EEG machine mainly consisting of master controller and type-D EEG
amplifier. During the experiment, a 24 electrode EEG cap is placed on the scalp with a
conductive gel to record the activity of the brain cells. Recording these voltages over
time gives us the EEG. Signal received from EEG cap will be amplified by EEG
amplifier before transmitting to EEG controller as the original EEG signal was having
very modest amplitude in the order of µV. Master Controller is the control station of the
system, coordinating the inputs from the ERP stimulator and the EEG amplifier.
Generally EEG signals are Multi channel Time series evaluations that are indicators
of the underlying the brain activity. The channels are most often not independent and
often there is a high degree of correlation between different channels in EEGs and they
are very noisy. Due to the characteristics of signal periodicity we can separate the EEG
signal from noise and we can use it to measure the degree of similarity between two
signals in time.
We conducted the motor imagery (MI) experiments where subjects imagined
movements of Right hand, right leg, left leg and left hand for 256 trials (each trial
length: 4 sec) on a Normal subject as well as ALS patient (Figures 1and 2). The system
first instructs the subject by showing the visual display that indicates to the subject
which MI task has to be performed. Figure 1a and 1b show how the visual displays are
given. After each imagined movement subject has to relax for 4 sec. Then EEG signals
are recorded from the 24 channels which are placed on the top of the cap.

Brain Computer Interface For Mobility- A Case Study With ALS Patient 26057
a b
Figure 1: MI Experiments conducted on a) ALS Patient b) Normal subject right hand
MI visual feedback
Cross correlation technique for the features extraction
To analyze and classify the Motor imagery data we proposed two algorithms CC-SVM
and CC-LDA which are a combination of cross correlation for feature extraction [7]
and SVM/LDA for classification. The Cross Correlation of two signals is obtained by
multiplying corresponding ordinates and summing for all portions of the signals within a
time window. Cross correlation follows three steps to extract the features from the
given set of data: 1) random selection of one of the EEG channels as a reference
channel 2) cross-correlate the reference channel with the remaining data channels 3)
calculate the six statistical features (mean, median, mode, standard deviation, maximum
and minimum) from each cross-correlation sequence to reduce the dimensions [8].
(1)
Rxy(m) is the cross-correlated sequence at m lag. If each of the signals, x and y,
consists of M finite number of samples, the resultant cross-correlation sequence has
2M-1 samples. If x and y are not the same length, for example, x and y have N and M
number of samples, respectively, and if N>M, the resultant cross-correlation sequence
has (2N-1) number of samples. The shorter vector, here y, is zero-padded to the length
of the longer vector, x.
Here we chose the Fp1 as reference channel for the Right hand MI task as there is no
specific selection criterion in the Cross Correlation system. As mentioned before, there
are 24 channels in each of the two classes of a subject. The reference channel data
obtained from the MI experiment performed on the subject is cross-correlated with the
data from the remaining 23 channels of the Right Hand class and 24 cross-correlation
sequences are obtained for this class. Again, in the Left Leg class of the same subject,
the reference channel data is cross-correlated with each of 24 channels data and
produces 24 cross-correlation sequences. Thus, a total of 47 cross-correlation
sequences are obtained for the two-class MI data for each subject. The results of cross-
correlation sequences named as cross-correlograms for the Right Hand and the Left
Leg of MI data of subject are plotted as shown in Figure 2. It can be observed that
when the test observation matches with the same class we get a spike in the

26058 D.Hari Krishna, Rakesh Sengupta, I.A.Pasha and T.Satya Savithri
correlogram (Figure 2), and in case of mismatch class results we cannot identify any
significant spike in correlogram.
Figure 2: Cross-correlograms for the Right hand
It is important to note that the cross-correlogram or cross-correlation sequences (Rxy)
are calculated using Eq. (1) for each lag. Finally, we obtain 23 feature vectors of six
dimension for six statistical features for subject Right hand and another 23 feature
vectors for Left leg.
Cross correlation based classifiers
The feature vectors are fed to LDA and SVM classifiers as inputs to classify the
differentiations for given input feature vectors. The classified output emulates the input
MI task which can be translated as command for controller system. Here we also
calculated the classifier accuracy by cross validation method for our data set. We
choose the 3-fold cross validation procedure. The 47 feature vectors of six dimensions
are divided into three subsets containing the equal number of observations. Each time, a
subset is used as a testing set and the remaining two subsets comprise a training set.
The procedure is repeated three times (the folds) with each of the subsets as the test set.
Finally the average classification accuracy is evaluated across all the folds, is called the
cross validation accuracy.
P300 based temporal odd ball paradigm for BCI system
The P300 wave is an ERP component commonly observed in a variety of phenomena
including the decision making process. The user is subjected to events that can be
categorized into two distinct categories. One of the category is rarely displayed. The
user performs a task that cannot be done without categorization into either one of the
categories [9]. Whenever the rare event is displayed it generates a P300 signal. It is a
distinct large positive signal that occurs 300 milliseconds after the event onset. The
signal is typically measured most strongly by the electrodes covering the parietal lobe.
We analyzed Cz electrode, the amplitude of the P300 signal is inversely related to the
rate of the rare event presented to the user. Although many P300-BCI systems have

Brain Computer Interface For Mobility- A Case Study With ALS Patient 26059
achieved 100% accuracy [2], the problem with this type of BCI is its dependence on the
continuous visual attention of the user, which is usually intolerable for locked-in patients
who are the most important target for BCI technology - especially if used for a long
time. The presence, magnitude and timing of the P300 signal are often used as metrics
of cognitive function in decision making processes. In our proposal, we considered the
features of P300 to decide whether the subject is interested to move from his/her
present position or not based on the classifier response applied to the wheel chair
controller.
2.2a Data collection
In behavioral method, we have placed an oddball of variable clock frequency in a
temporal sequence of standard stimuli. 4 normal subjects of age between 18 and 21
have participated in the experiment. They were immature with respect to the purpose of
the experiment. All had normal or corrected-to-normal vision. The stimuli were
presented using a monitor of size 17". The subjects sat at a distance of 66cm from the
screen. The standard ball was a black circle with 10mm radius, cantered on the screen.
The oddball is represented in red color with same size. Both standard and oddball
stimuli are presented on a white background. Figure 3 shows different trials of odd ball
paradigm stimuli.
Figure 3: Odd ball paradigm stimuli
The subjects are required to fixate the centre of each standard or oddball as it
appears and to maintain fixation on this location between the appearances of successive
stimuli throughout the experiment. Each oddball occurred within a train of standard
stimuli of constant objective duration. We considered a sequence of 6 balls. The oddball
appeared randomly at any position in the sequence.
The sequence of oddball appearance tested within the experiment (Figure 4) were
randomized so that the observers could not know when the oddball would appear. A
26060 D.Hari Krishna, Rakesh Sengupta, I.A.Pasha and T.Satya Savithri
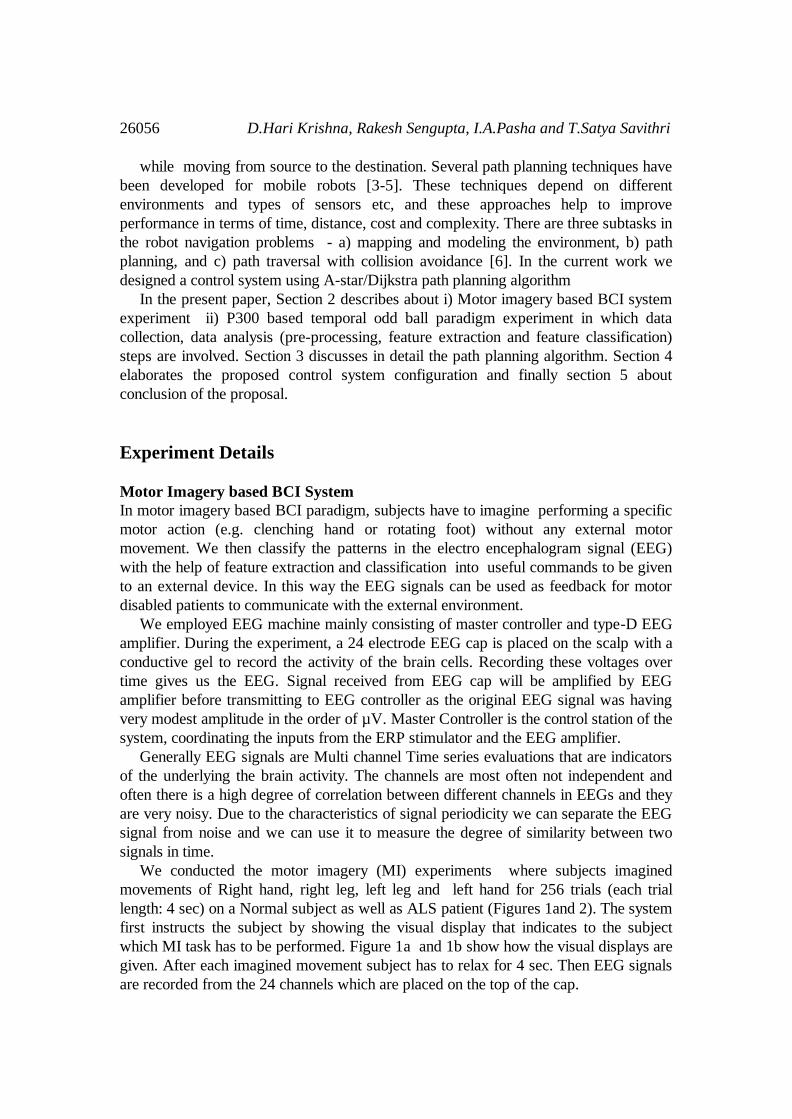
total of 108 stimuli were presented to the subject which lasted for an average time of 45
minutes. The observers were told that all the standards were of constant duration.
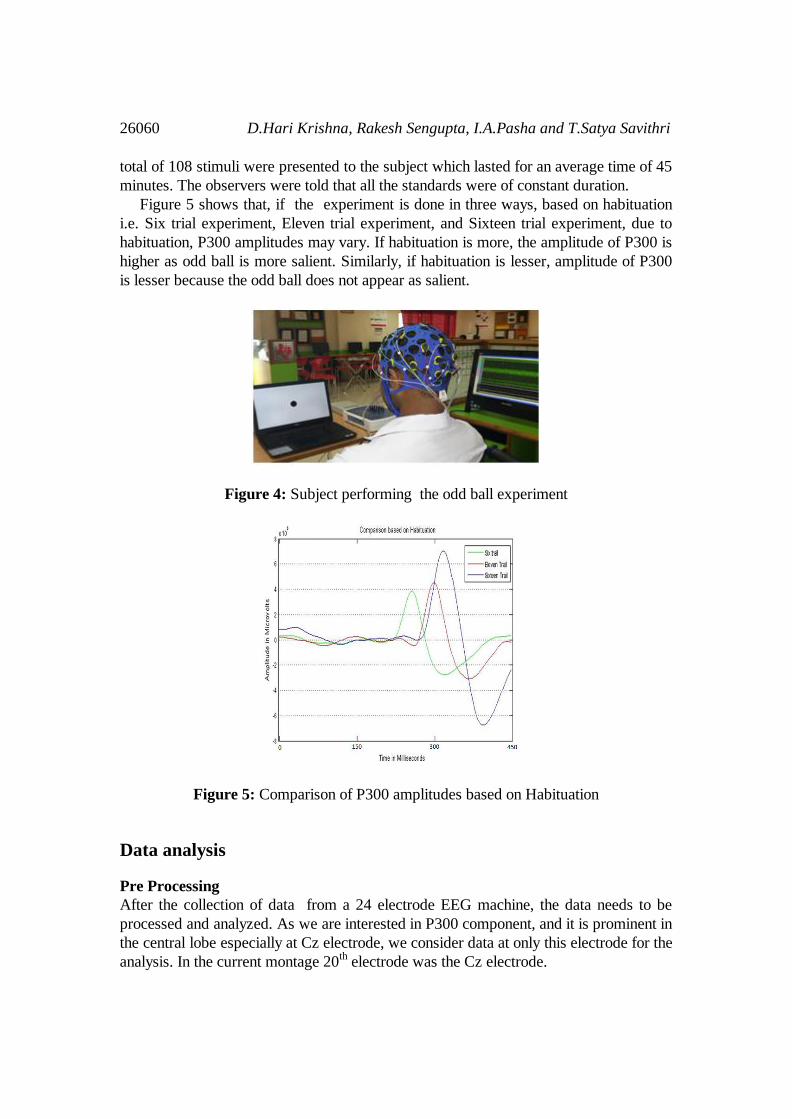
Figure 5 shows that, if the experiment is done in three ways, based on habituation
i.e. Six trial experiment, Eleven trial experiment, and Sixteen trial experiment, due to
habituation, P300 amplitudes may vary. If habituation is more, the amplitude of P300 is
higher as odd ball is more salient. Similarly, if habituation is lesser, amplitude of P300
is lesser because the odd ball does not appear as salient.
Figure 4: Subject performing the odd ball experiment
Figure 5: Comparison of P300 amplitudes based on Habituation
Data analysis
Pre Processing
After the collection of data from a 24 electrode EEG machine, the data needs to be
processed and analyzed. As we are interested in P300 component, and it is prominent in
the central lobe especially at Cz electrode, we consider data at only this electrode for the
analysis. In the current montage 20th electrode was the Cz electrode.
Brain Computer Interface For Mobility- A Case Study With ALS Patient 26061
Artifact removal
For artifact removal, we use Moving average filter. The moving average is the most
common filter in Digital Signal Processing (DSP), mainly because it is the easiest
digital filter to understand and use. A moving average is commonly used with time
series data to smooth out short-term fluctuations and highlight longer-term trends or
cycles. The threshold between short-term and long-term depends on the application, and
the parameters of the moving average will be set accordingly. Here we use a window of
size 12. Given a series of numbers and a fixed subset size, the first element of the
moving average is obtained by taking the average of the initial fixed subset of the
number series. Then the subset is modified by shifting forward; that is, excluding the
first number of the series and including the next number following the original subset in
the series. This creates a new subset of numbers, which is averaged. This process is
repeated over the entire data series. The plot line connecting all the (fixed) averages is
the moving average. A moving average is a set of numbers, each of which is
the average of the corresponding subset of a larger set of datum points.
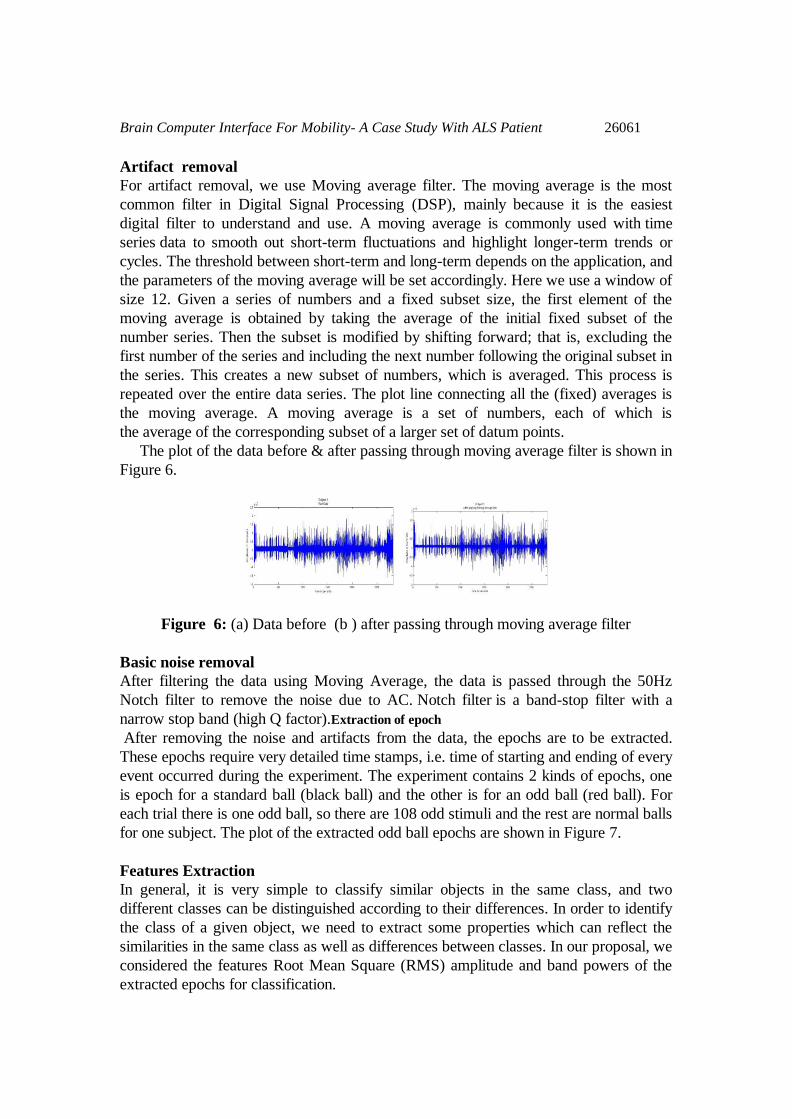
The plot of the data before & after passing through moving average filter is shown in
Figure 6.
Figure 6: (a) Data before (b ) after passing through moving average filter
Basic noise removal
After filtering the data using Moving Average, the data is passed through the 50Hz
Notch filter to remove the noise due to AC. Notch filter is a band-stop filter with a
narrow stop band (high Q factor).Extraction of epoch
After removing the noise and artifacts from the data, the epochs are to be extracted.
These epochs require very detailed time stamps, i.e. time of starting and ending of every
event occurred during the experiment. The experiment contains 2 kinds of epochs, one
is epoch for a standard ball (black ball) and the other is for an odd ball (red ball). For
each trial there is one odd ball, so there are 108 odd stimuli and the rest are normal balls
for one subject. The plot of the extracted odd ball epochs are shown in Figure 7.
Features Extraction
In general, it is very simple to classify similar objects in the same class, and two
different classes can be distinguished according to their differences. In order to identify
the class of a given object, we need to extract some properties which can reflect the
similarities in the same class as well as differences between classes. In our proposal, we
considered the features Root Mean Square (RMS) amplitude and band powers of the
extracted epochs for classification.
26062 D.Hari Krishna, Rakesh Sengupta, I.A.Pasha and T.Satya Savithri
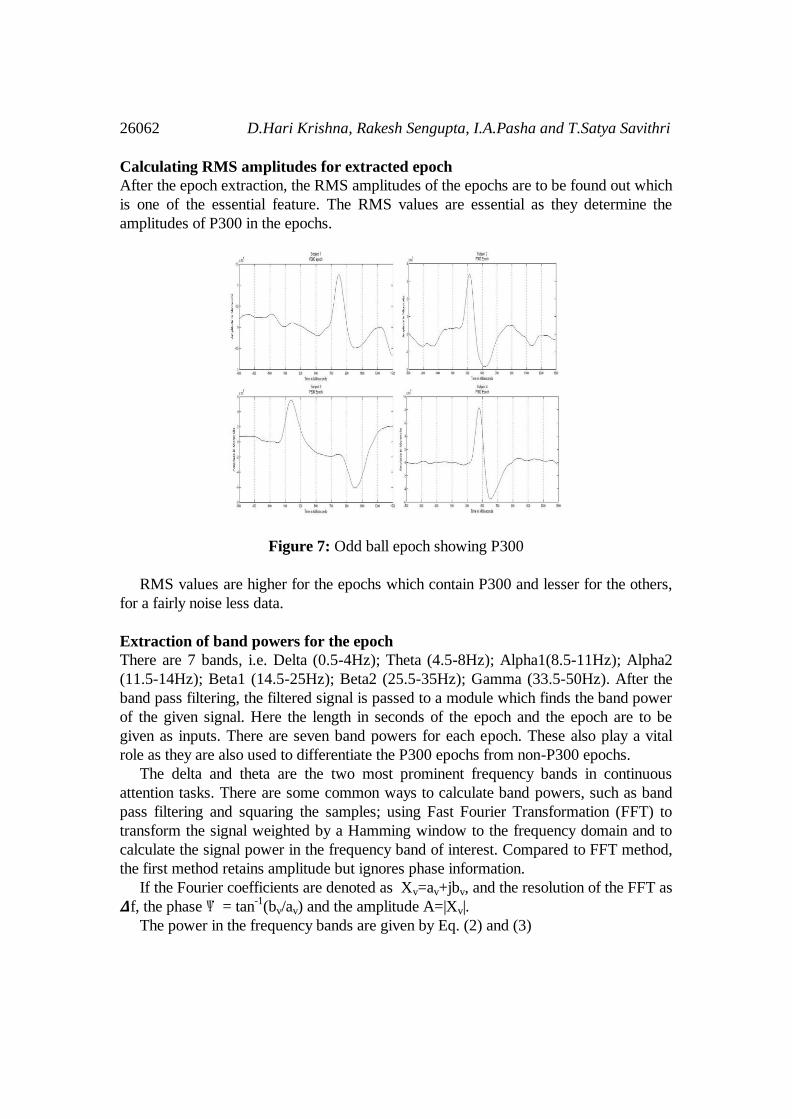
Calculating RMS amplitudes for extracted epoch
After the epoch extraction, the RMS amplitudes of the epochs are to be found out which
is one of the essential feature. The RMS values are essential as they determine the
amplitudes of P300 in the epochs.
Figure 7: Odd ball epoch showing P300
RMS values are higher for the epochs which contain P300 and lesser for the others,
for a fairly noise less data.
Extraction of band powers for the epoch
There are 7 bands, i.e. Delta (0.5-4Hz); Theta (4.5-8Hz); Alpha1(8.5-11Hz); Alpha2
(11.5-14Hz); Beta1 (14.5-25Hz); Beta2 (25.5-35Hz); Gamma (33.5-50Hz). After the
band pass filtering, the filtered signal is passed to a module which finds the band power
of the given signal. Here the length in seconds of the epoch and the epoch are to be
given as inputs. There are seven band powers for each epoch. These also play a vital
role as they are also used to differentiate the P300 epochs from non-P300 epochs.
The delta and theta are the two most prominent frequency bands in continuous
attention tasks. There are some common ways to calculate band powers, such as band
pass filtering and squaring the samples; using Fast Fourier Transformation (FFT) to
transform the signal weighted by a Hamming window to the frequency domain and to
calculate the signal power in the frequency band of interest. Compared to FFT method,
the first method retains amplitude but ignores phase information.
If the Fourier coefficients are denoted as Xv=av+jbv, and the resolution of the FFT as
f, the phase Ѱ = tan-1
(bv/av) and the amplitude A=|Xv|.
The power in the frequency bands are given by Eq. (2) and (3)
Brain Computer Interface For Mobility- A Case Study With ALS Patient 26063
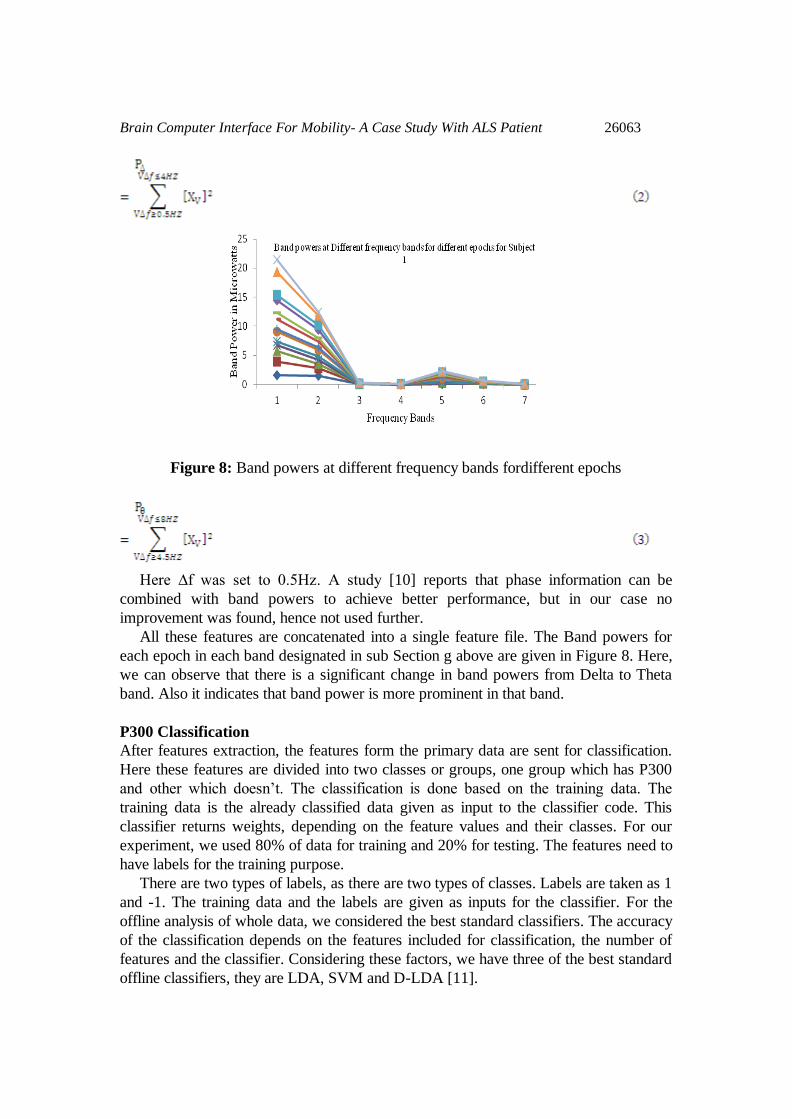
Figure 8: Band powers at different frequency bands fordifferent epochs
Here ∆f was set to 0.5Hz. A study [10] reports that phase information can be
combined with band powers to achieve better performance, but in our case no
improvement was found, hence not used further.
All these features are concatenated into a single feature file. The Band powers for
each epoch in each band designated in sub Section g above are given in Figure 8. Here,
we can observe that there is a significant change in band powers from Delta to Theta
band. Also it indicates that band power is more prominent in that band.
P300 Classification
After features extraction, the features form the primary data are sent for classification.
Here these features are divided into two classes or groups, one group which has P300
and other which doesn’t. The classification is done based on the training data. The
training data is the already classified data given as input to the classifier code. This
classifier returns weights, depending on the feature values and their classes. For our
experiment, we used 80% of data for training and 20% for testing. The features need to
have labels for the training purpose.
There are two types of labels, as there are two types of classes. Labels are taken as 1
and -1. The training data and the labels are given as inputs for the classifier. For the
offline analysis of whole data, we considered the best standard classifiers. The accuracy
of the classification depends on the features included for classification, the number of
features and the classifier. Considering these factors, we have three of the best standard
offline classifiers, they are LDA, SVM and D-LDA [11].
26064 D.Hari Krishna, Rakesh Sengupta, I.A.Pasha and T.Satya Savithri
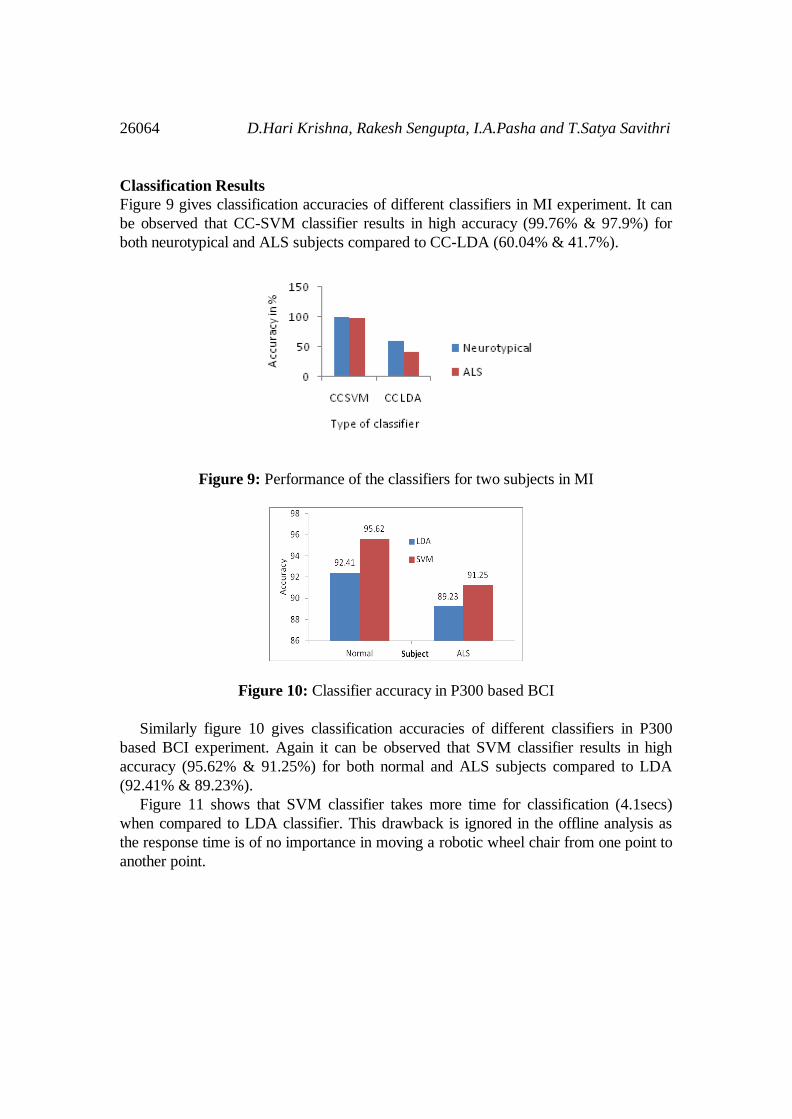
Classification Results
Figure 9 gives classification accuracies of different classifiers in MI experiment. It can
be observed that CC-SVM classifier results in high accuracy (99.76% & 97.9%) for
both neurotypical and ALS subjects compared to CC-LDA (60.04% & 41.7%).
Figure 9: Performance of the classifiers for two subjects in MI
Figure 10: Classifier accuracy in P300 based BCI
Similarly figure 10 gives classification accuracies of different classifiers in P300
based BCI experiment. Again it can be observed that SVM classifier results in high
accuracy (95.62% & 91.25%) for both normal and ALS subjects compared to LDA
(92.41% & 89.23%).
Figure 11 shows that SVM classifier takes more time for classification (4.1secs)
when compared to LDA classifier. This drawback is ignored in the offline analysis as
the response time is of no importance in moving a robotic wheel chair from one point to
another point.

Brain Computer Interface For Mobility- A Case Study With ALS Patient 26065
Figure 11: Time taken by Different classifiers in P300 based BCI
Path Planning Of Controller Using Modified A-Star Algorithm Modified A-Star algorithm for path planning: In A-star algorithm shortest path
between two points is decided by calculating F score for each cell in the map. Here F
score can be calculated from the formulae F=G+H, where G represents the moment
cost from one cell to its adjacent cell either in horizontal, vertical or in diagonal
directions starting from source until it proceeds to the end point. H represents the
distance between the present cell and the goal node in terms of number of cells. The
shortest path can be the one with least F scores between the starting and goal nodes.
The process of calculating the F score and choosing the path with least F score will be
repeated until the target node is added to the closed list and open list is to be cleared.
Obstacle avoidance: In our proposed control system we consider two obstacle
problems i. Static obstacle, ii. Dynamic obstacle.
Table 1: Rotational angle correction of wheel chair for direction change
Directions/Node
Location(deg) Row Column
Same Row Same
Row Column+1
Right/+90 Row+1 No change
Left/-90 Row-1 No change
Front diagonal right/+45 Row+1 Column+1
Front diagonal left/-45 Row-1 Column+1
Back diagonal right/+135 Row+1 Column-1
Back diagonal left/-135 Row-1 Column-1
Back/-180 Same
Row Column-1
26066 D.Hari Krishna, Rakesh Sengupta, I.A.Pasha and T.Satya Savithri
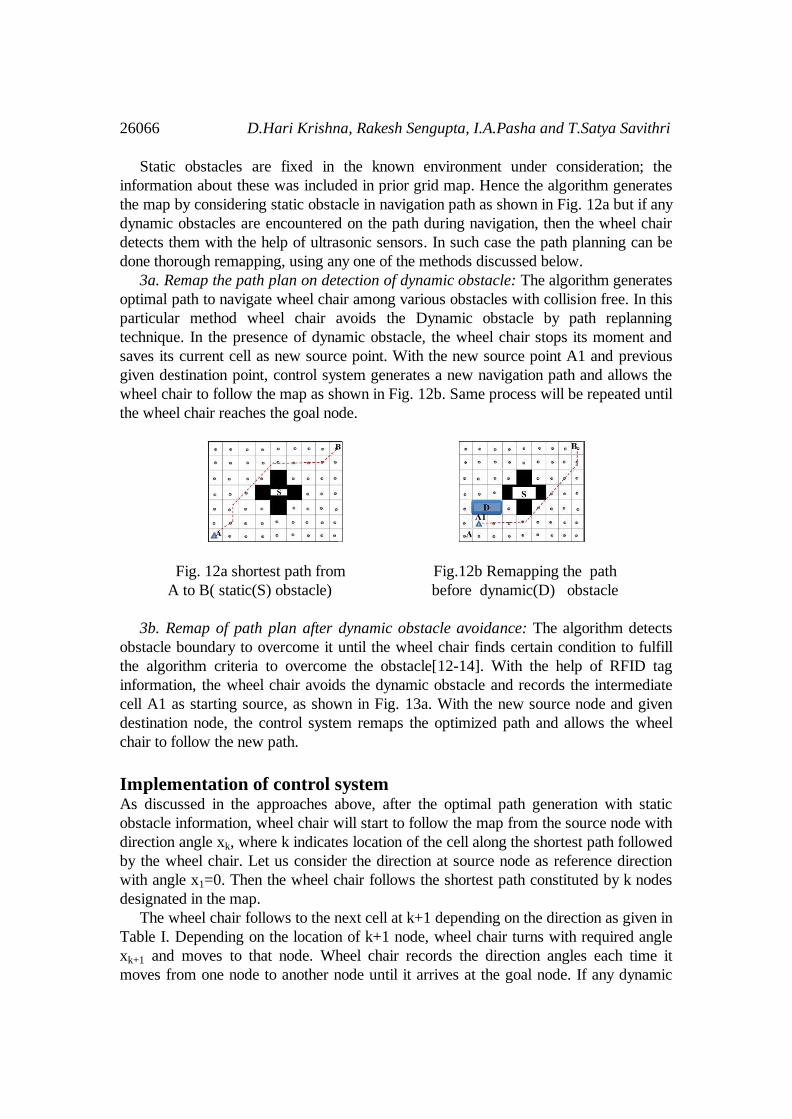
Static obstacles are fixed in the known environment under consideration; the
information about these was included in prior grid map. Hence the algorithm generates
the map by considering static obstacle in navigation path as shown in Fig. 12a but if any
dynamic obstacles are encountered on the path during navigation, then the wheel chair
detects them with the help of ultrasonic sensors. In such case the path planning can be
done thorough remapping, using any one of the methods discussed below.
3a. Remap the path plan on detection of dynamic obstacle: The algorithm generates
optimal path to navigate wheel chair among various obstacles with collision free. In this
particular method wheel chair avoids the Dynamic obstacle by path replanning
technique. In the presence of dynamic obstacle, the wheel chair stops its moment and
saves its current cell as new source point. With the new source point A1 and previous
given destination point, control system generates a new navigation path and allows the
wheel chair to follow the map as shown in Fig. 12b. Same process will be repeated until
the wheel chair reaches the goal node.
Fig. 12a shortest path from Fig.12b Remapping the path
A to B( static(S) obstacle) before dynamic(D) obstacle
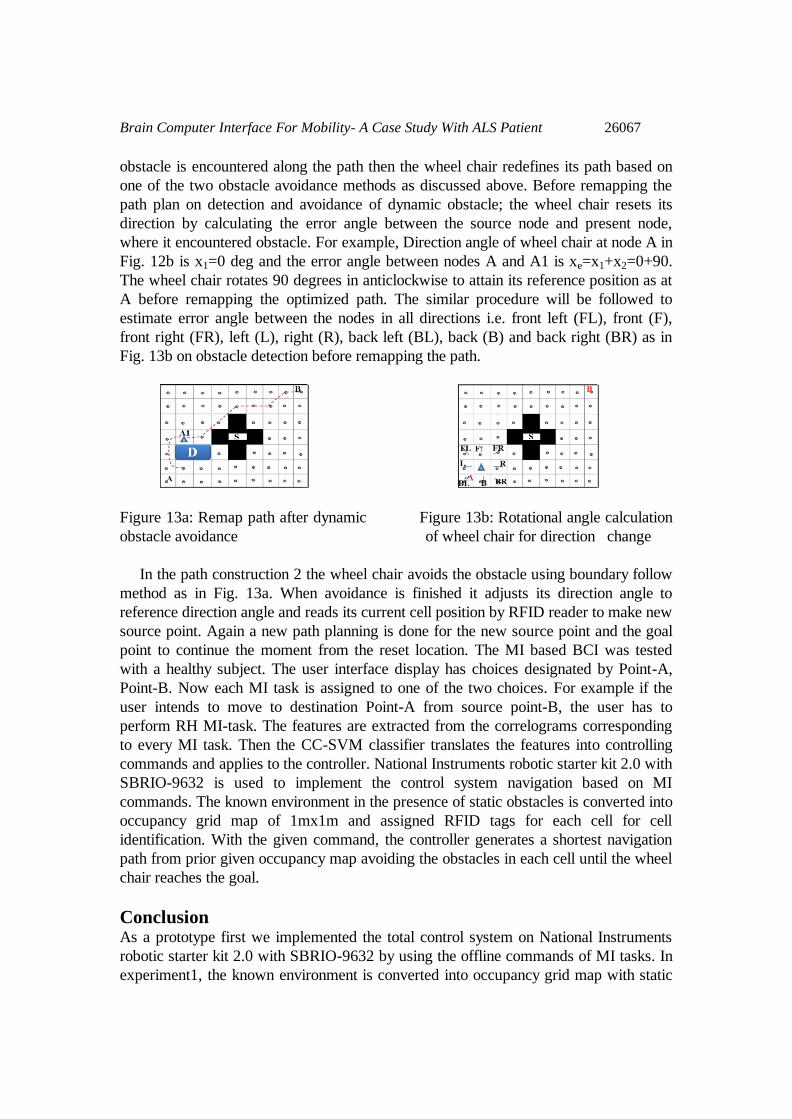
3b. Remap of path plan after dynamic obstacle avoidance: The algorithm detects
obstacle boundary to overcome it until the wheel chair finds certain condition to fulfill
the algorithm criteria to overcome the obstacle[12-14]. With the help of RFID tag
information, the wheel chair avoids the dynamic obstacle and records the intermediate
cell A1 as starting source, as shown in Fig. 13a. With the new source node and given
destination node, the control system remaps the optimized path and allows the wheel
chair to follow the new path.
Implementation of control system As discussed in the approaches above, after the optimal path generation with static
obstacle information, wheel chair will start to follow the map from the source node with
direction angle xk, where k indicates location of the cell along the shortest path followed
by the wheel chair. Let us consider the direction at source node as reference direction
with angle x1=0. Then the wheel chair follows the shortest path constituted by k nodes
designated in the map.
The wheel chair follows to the next cell at k+1 depending on the direction as given in
Table I. Depending on the location of k+1 node, wheel chair turns with required angle
xk+1 and moves to that node. Wheel chair records the direction angles each time it
moves from one node to another node until it arrives at the goal node. If any dynamic
Brain Computer Interface For Mobility- A Case Study With ALS Patient 26067
obstacle is encountered along the path then the wheel chair redefines its path based on
one of the two obstacle avoidance methods as discussed above. Before remapping the
path plan on detection and avoidance of dynamic obstacle; the wheel chair resets its
direction by calculating the error angle between the source node and present node,
where it encountered obstacle. For example, Direction angle of wheel chair at node A in
Fig. 12b is x1=0 deg and the error angle between nodes A and A1 is xe=x1+x2=0+90.
The wheel chair rotates 90 degrees in anticlockwise to attain its reference position as at
A before remapping the optimized path. The similar procedure will be followed to
estimate error angle between the nodes in all directions i.e. front left (FL), front (F),
front right (FR), left (L), right (R), back left (BL), back (B) and back right (BR) as in
Fig. 13b on obstacle detection before remapping the path.
Figure 13a: Remap path after dynamic Figure 13b: Rotational angle calculation
obstacle avoidance of wheel chair for direction change
In the path construction 2 the wheel chair avoids the obstacle using boundary follow
method as in Fig. 13a. When avoidance is finished it adjusts its direction angle to
reference direction angle and reads its current cell position by RFID reader to make new
source point. Again a new path planning is done for the new source point and the goal
point to continue the moment from the reset location. The MI based BCI was tested
with a healthy subject. The user interface display has choices designated by Point-A,
Point-B. Now each MI task is assigned to one of the two choices. For example if the
user intends to move to destination Point-A from source point-B, the user has to
perform RH MI-task. The features are extracted from the correlograms corresponding
to every MI task. Then the CC-SVM classifier translates the features into controlling
commands and applies to the controller. National Instruments robotic starter kit 2.0 with
SBRIO-9632 is used to implement the control system navigation based on MI
commands. The known environment in the presence of static obstacles is converted into
occupancy grid map of 1mx1m and assigned RFID tags for each cell for cell
identification. With the given command, the controller generates a shortest navigation
path from prior given occupancy map avoiding the obstacles in each cell until the wheel
chair reaches the goal.
Conclusion As a prototype first we implemented the total control system on National Instruments
robotic starter kit 2.0 with SBRIO-9632 by using the offline commands of MI tasks. In
experiment1, the known environment is converted into occupancy grid map with static

26068 D.Hari Krishna, Rakesh Sengupta, I.A.Pasha and T.Satya Savithri
obstacles and RFID tags are assigned and applied to the robot. In the map robot is at
location 'A' as shown in Figure 11. Now the user performed an MI task of Left leg after
the completion of all steps which are signal acquisition, cross-correlation and
classification a controlling command is generated and applied to the controller of robot
then the controller generates a shortest path from prior given occupancy grid map and
controls the moment of robot in that direction with the help of RFID tags placed in cells
by checking and avoiding the obstacles in each cell as shown in Figure 11 a-d. In the
experiment2, we have implemented a wheel chair navigation using the P300 signal
attained from an oddball experiment of variable clock frequency in a temporal sequence
of standard stimuli. P300 stimulus is produced when the subject intends to move from
source to the destination. The current location of the wheel chair will be considered as
the source point for the wheel chair. We tested our algorithm as a prototype and
implemented the total control system on National Instruments robotic starter kit 2.0 with
SBRIO-9632 by using the offline commands of P300 stimulus. First the known
environment is converted into occupancy grid map with static obstacles and RFID tags
are assigned and applied to the robotic wheel chair.
This novel implementation opens newer possibilities not just towards assistive
technologies, but also in terms of cognitive assessment of ALS and quadriplegic
patients.
Figure 11: a. Start location from A Figure 11: b. Path planning
Figure 11: c. Obstacle avoidance Figure 11: d. End location to B.
Acknowledgment This work was supported by Department of Science and Technology (DST),
Government of India, under the Cognitive Science Initiative (CSI) sponsored project
(Ref. No: SR/CSI/133/2011).
Brain Computer Interface For Mobility- A Case Study With ALS Patient 26069
References
[1] Bastos-Filho T F., Cavalieri D C., Celeste W C., Ferreira A., Filgueira P N
S., Arantes I B., Martins V R., Silva R L and Sarcinelli-Filho M., 2008,
"Case study: Cognitive control of a robotic wheel chair," in Wearable
Robots: Biomechatronic Exoskeletons, J L Pons (Ed.) New York: John
Wiley & Sons, pp 314-322.
[2] Millán J, Mouriñoand W, Gerstner J, Renkens F, 2004, "Non-invasive brain
actuated control of a mobile robot," IEEE Trans. Biomed. Eng., 51(6), pp.
1026-1033.
[3] Buniyamin N., Wan Ngah W.A.J., Sariff N., Mohamad Z., 2011, "A Simple
Local Path Planning Algorithm for Autonomous Mobile Robots,"
International Journal of Systems applications, Engineering & development, 5(2),
pp. 151-159.
[4] Sariff N B., Buniyamin N., 2010, "Ant Colony System For Robot Path
Planning In Global Static Environment," in 9th WSEAS International
Conference on System Science and Simulation in Engineering
(ICOSSSE'10), Japan, pp.192-197.
[5] D.HariKrishna., N.V.Jagadeesh., I.A.Pasha and T.Satya Savithri., 2013,
"BCI controller based on imagery activity using shortest path algorithm," in
IEEE Asia Pacific Conference on Postgraduate Research in
Microelectronics and Electronics (PrimeAsia), India, pp. 68-72.
[6] Behnke S, 2004, "Local Multi resolution Path Planning," in 7th Robo cup
Int. Symposium, Italy, pp. 332-343.
[7] Siuly, Li Yan P. Wen, 2013, "Identification of Motor Imagery Tasks through
CC-LR Algorithm in Brain Computer Interface," International Journal of
Bioinformatics Research and Applications, 9(2), pp. 156-172.
[8] Abdullah H., Maddage N C., Cosic I and Cvetkovic D., 2010, "Cross-
correlation of EEG frequency bands and heart rate variability for sleep
apnoea classification," Med Biol Eng Computer, 48(12), pp. 1261-1269.
[9] Bogacz R., Usher M., Zhang J and McClelland J.L., 2007, "Extending a
biologically inspired model of choice: multialternatives, nonlinearity and
value-based multidimensional choice," Philos. Trans. R. Soc. Lond. B Biol.
Sci, 362 (1485), pp 1655–1670.
[10] Graimann B., Pfurtscheller G., Townsend G., 2006, "A comparison of
common spatial patterns with complex band power features in a four-class
BCI experiment," IEEE Transactions on Bio medical Engineering, 53(4),
pp 642-651.
[11] Arnaldi B., Congedo M., Lamarche F., Lécuyer A and Lotte F., 2007, " A
review of classification algorithms for EEG-based brain-computer
interfaces," Journal of Neural Engineering, 4(2), pp. R1–R13.

26070 D.Hari Krishna, Rakesh Sengupta, I.A.Pasha and T.Satya Savithri
[12] Choset H., Lynch K.M., Hutchinson. S., Kantor. G., Burgard. W., Kavraki.
L. E., Thrun S., 2005, "Principles of Robot Motion: Theory, Algorithms and
Implementations," Boston, London: MIT Press.
[13] Sankaranarayanar. A., Vidyasagar. M., 1990, "Path planning for moving a
point object amidst unknown obstacles in a plane: a new algorithm and a
general theory for algorithm development in Decision and Control," in 29th
IEEE Conference on Decision and Control Hawai, pp.1111-1119.
[14] Claudiu. P., Dupac. M., 2009, "An Optimal Path Algorithm for Autonomous
Searching Robots," in Annals of University of Craiova, Math. Comp. Sci.
Ser, 36(1), pp. 37-48.