Bovine TB Risk in Britain: Past and Present
19
1 Bovine tuberculosis and badgers in Britain: relevance of the past Peter J. Atkins Department of Geography, University of Durham, Durham DH1 3LE, England; e-mail: [email protected] Philip A. Robinson Department of Geography, University of Durham, Durham DH1 3LE, England; e-mail: [email protected] This is an early draft. For the published version, please see: Atkins, P.J. and Robinson, P.A. (2013) Bovine tuberculosis and badgers in Britain: relevance of the past, Epidemiology and Infection doi:10.1017/S095026881200297X http://journals.cambridge.org/action/displayJournal?jid=HYG
Transcript of Bovine TB Risk in Britain: Past and Present

1
Bovine tuberculosis and badgers in Britain: relevance of the past
Peter J. Atkins
Department of Geography, University of Durham, Durham DH1 3LE, England;
e-mail: [email protected]
Philip A. Robinson
Department of Geography, University of Durham, Durham DH1 3LE, England;
e-mail: [email protected]
This is an early draft. For the published version, please see:
Atkins, P.J. and Robinson, P.A. (2013) Bovine tuberculosis and badgers in Britain: relevance
of the past, Epidemiology and Infection doi:10.1017/S095026881200297X
http://journals.cambridge.org/action/displayJournal?jid=HYG

2
Bovine tuberculosis and badgers in Britain: relevance of the past
SUMMARY
The European badger (Meles meles) has been identified as a wildlife reservoir of bovine
tuberculosis and a source of transmission to cattle in Britain and Ireland. Both behavioural
ecology and statistical ecological modelling have indicated the long-term persistence of the
disease in some badger communities, and this is postulated to account for the high incidence
of bovine tuberculosis in cattle across large tracts of England and Wales. The present paper
questions this consensus by using historical cartographic evidence to show that tuberculosis
in cattle had a very different spatial distribution before 1960 to the present day. Since few of
the badgers collected in road traffic accidents between 1972 and 1990 had tuberculosis in
counties such as Cheshire, where the disease had until shortly before that been rife in the
cattle population, the role of badgers as reservoirs in spreading disease in similar counties
outside the south-west of England has to be questioned.
Key words: badgers, bovine tuberculosis, Britain, wildlife reservoirs
INTRODUCTION
It is well known that bovine tuberculosis (bTB) placed a heavy burden on the British cattle
industry in the first half of the twentieth century. In the absence of proper control, some
animals reached the most advanced stage of the disease before they were slaughtered and it
was common for infected meat and milk to reach the market [1, 2]. Being a zoonotic disease,
bTB also challenged the human population, usually at non-pulmonary sites of the body. Each
year in the early 1930s over 4000 people were infected and 2000 died of bTB infection [3].
It was not until after the Second World War that the Ministry of Agriculture finally
faced up to the scale of the problem. Starting in 1950, they followed an area eradication
programme of slaughtering cattle ‘reactors’ to the tuberculin test, and where necessary whole
herds were eliminated. This policy was so successful that the entire UK was declared attested
in 1960 and it was assumed that the few remaining pockets of disease would be dealt with in
time. In the 1970s, though, a final clearance looked less likely with the discovery of
reservoirs of infection in wildlife, particularly the European badger (Meles meles) in the
south-west of England. Then in the 1980s there started a slow recrudescence of bTB in
3
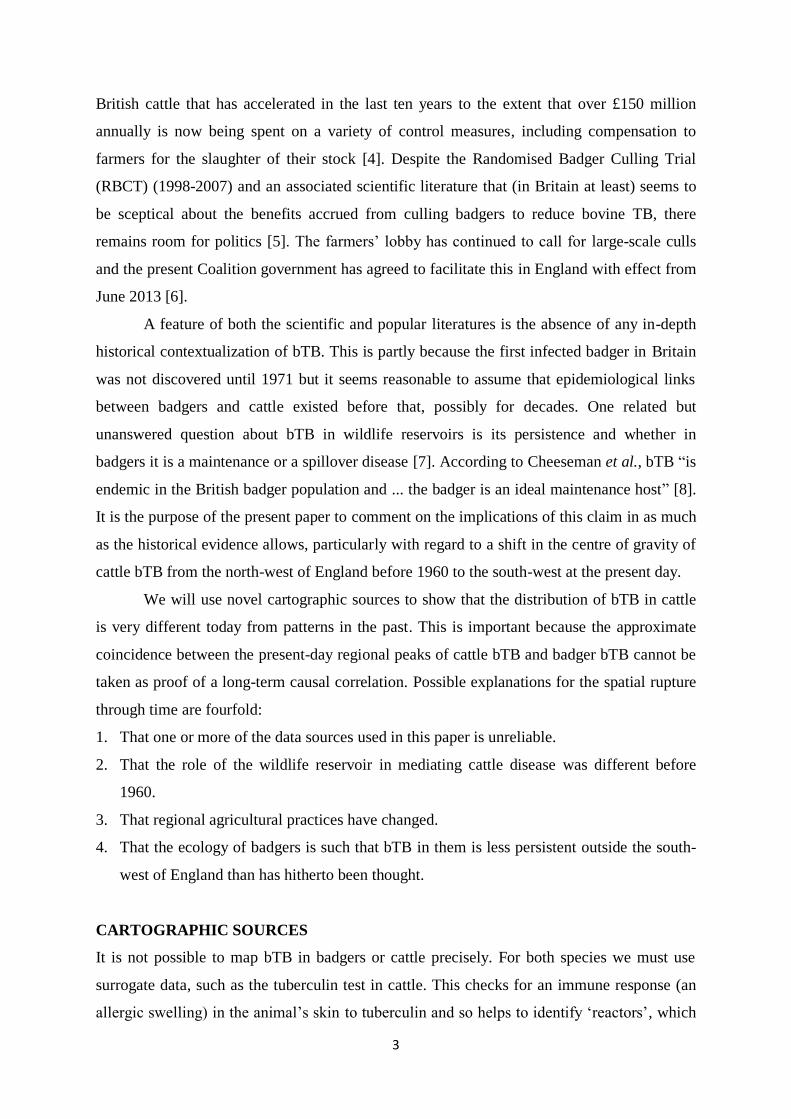
British cattle that has accelerated in the last ten years to the extent that over £150 million
annually is now being spent on a variety of control measures, including compensation to
farmers for the slaughter of their stock [4]. Despite the Randomised Badger Culling Trial
(RBCT) (1998-2007) and an associated scientific literature that (in Britain at least) seems to
be sceptical about the benefits accrued from culling badgers to reduce bovine TB, there
remains room for politics [5]. The farmers’ lobby has continued to call for large-scale culls
and the present Coalition government has agreed to facilitate this in England with effect from
June 2013 [6].
A feature of both the scientific and popular literatures is the absence of any in-depth
historical contextualization of bTB. This is partly because the first infected badger in Britain
was not discovered until 1971 but it seems reasonable to assume that epidemiological links
between badgers and cattle existed before that, possibly for decades. One related but
unanswered question about bTB in wildlife reservoirs is its persistence and whether in
badgers it is a maintenance or a spillover disease [7]. According to Cheeseman et al., bTB “is
endemic in the British badger population and ... the badger is an ideal maintenance host” [8].
It is the purpose of the present paper to comment on the implications of this claim in as much
as the historical evidence allows, particularly with regard to a shift in the centre of gravity of
cattle bTB from the north-west of England before 1960 to the south-west at the present day.
We will use novel cartographic sources to show that the distribution of bTB in cattle
is very different today from patterns in the past. This is important because the approximate
coincidence between the present-day regional peaks of cattle bTB and badger bTB cannot be
taken as proof of a long-term causal correlation. Possible explanations for the spatial rupture
through time are fourfold:
1. That one or more of the data sources used in this paper is unreliable.
2. That the role of the wildlife reservoir in mediating cattle disease was different before
1960.
3. That regional agricultural practices have changed.
4. That the ecology of badgers is such that bTB in them is less persistent outside the south-
west of England than has hitherto been thought.
CARTOGRAPHIC SOURCES
It is not possible to map bTB in badgers or cattle precisely. For both species we must use
surrogate data, such as the tuberculin test in cattle. This checks for an immune response (an
allergic swelling) in the animal’s skin to tuberculin and so helps to identify ‘reactors’, which

4
then become ‘confirmed breakdowns’ if lesions are identified in the abattoir or if the disease
is cultured from tissue samples in the laboratory. Figure 1(a) shows the distribution of
confirmed TB breakdowns in Britain in 1991, most of which it can be assumed will have
been initially detected by use of the single intradermal comparative cervical tuberculin test.
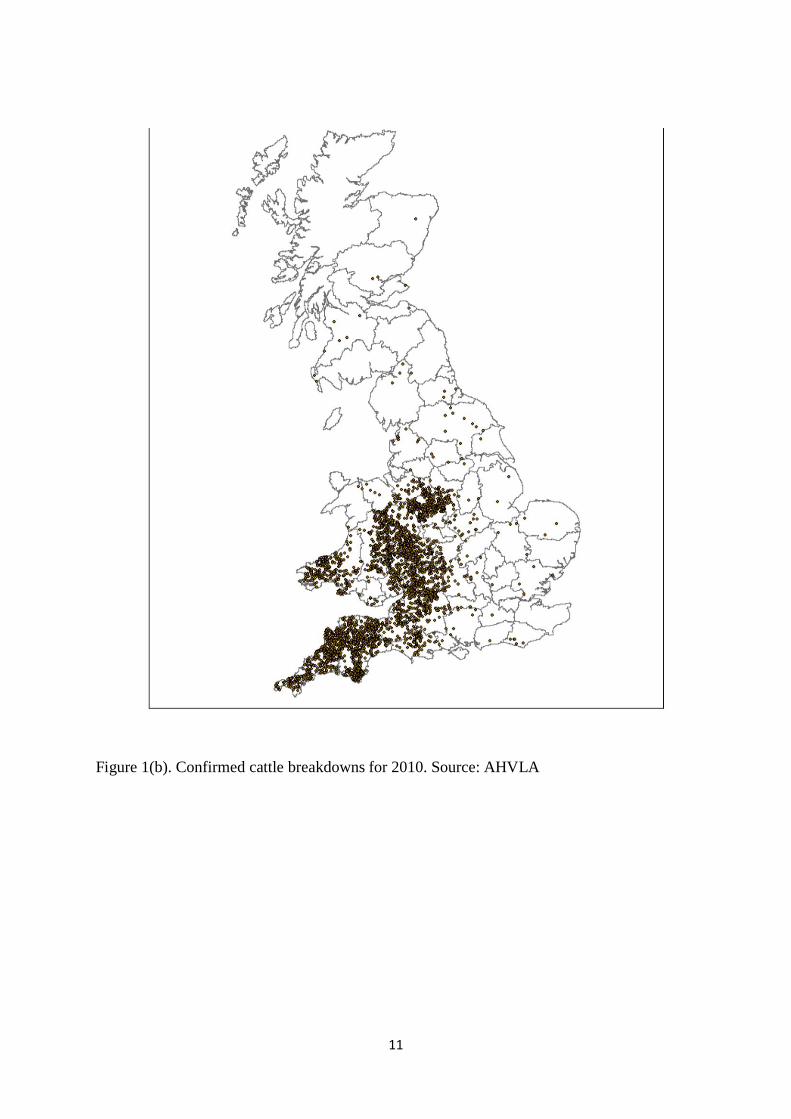
This was a decade before the recent rapid increase in the number of reactors. Since then what
appeared to be an archipelago of small islands of infection became a series of larger islands
that on the map for 2010 look to have merged to form an epidemic mainland (Figure 1(b)).
We can be confident that at the regional scale it is indicative of the spatial distribution of bTB
in Britain’s cattle herds although, having said that, it is important to note, (a) that the
tuberculin test is imperfectly sensitive and is thought to detect only about 80% of infected
animals [9, 10], (b) that ethnographic work with veterinarians shows that some do not stick
closely to the official testing protocol [11], and (c) that routine herd test intervals vary from
one to four years in different parishes around Britain according to local TB incidence, but
herds will be tested more frequently when contiguous to breakdowns.
< Figure 1 here >
Figure 2 and Table 1 relate to badgers rather than cattle. The distribution is of those
that were collected from road traffic accidents (RTAs) and then tested post mortem for bTB.
The overall distribution is not representative of the national spread of badgers, most likely
because members of the public reporting carcases were more aware of the need for testing in
some parts of the country than others, introducing potential biases in the data [12, 13].
Nevertheless in those regions with coverage we can show the location of tuberculous badgers
in relation to those without the disease. According to Goodchild et al., RTAs are informative
indicators of the prevalence of bTB in the badger population [14], although they cannot be
taken as definitive evidence.
< Figure 2 here >
< Table 1 here >
From Figures 1 and 2 we have an impression of the spatial patterning of bTB in cattle
and badgers during the early stages of the disease’s resurgence. The situation before 1960
was somewhat different, however, and is best exemplified by Figure 3. This map shows the
results of tuberculin testing in 1938 by government vets, when data were compiled ahead of
what the then government hoped would be an extensive area eradication scheme for
tuberculous cattle, although in the event this final push to slaughter all reactors was
postponed by the war until the 1950s. In the late 1930s skin testing had at last been accepted
after a period of scepticism among farmers and vets [15]. In 1938 there were on average 130

5
reactors per thousand head tested in Britain as a whole, with over 300 in eight counties and a
peak of 416 in Cheshire. It is important to note that this testing does not seem to have been
undertaken with a view to strict statistical representativeness. Focusing on self-contained
herds that bred their own replacements, for instance, will have underestimated disease in
regions used to buying in stock, and a few counties were omitted in the survey. One
knowledgeable commentator observed that the true figure for Cheshire was probably 600-800
tuberculous dairy cows per thousand and for Derbyshire over 500 [16]. Nor were post
mortems undertaken, so these data will include some of the false positives that are still today
a weakness of the skin test.
< Figure 3 here >
Figure 4 depicts the regional distribution of cattle slaughtered under the Tuberculosis
Orders in the period 1926-40. Once again, Cheshire was unenviably close to the top of this
list and, with its contiguous counties, formed the largest cluster of infection among cattle in
the period. The data for this series were the result of diagnoses by veterinarians, largely based
on their inspections of udders for signs of disease. This picked up only advanced cases and
other tuberculous cows were missed when they were withheld from the test due to a
calculation by some farmers that a diseased cow that still produced milk was worth more than
the compensation that was likely to be paid out by the government under the Tuberculosis
Orders. In short, this map under-represents both the scale and extent of the problem,
especially in the dairy districts.
< Figure 4 here >
ANALYSIS
Figure 1(a) is a representation of the early phase of the return of bTB in cattle. It is focused
on three principal areas: Cornwall and Devon; Gloucester, Hereford and Worcester; and
South Wales, with a scattering of other breakdowns, for instance in Staffordshire, Sussex and
Dorset. Similarly the pattern of infected badgers in the RTA data (Figure 2) has
concentrations south of the Bristol Channel in the Gloucestershire and Wiltshire Cotswolds,
Devon, Cornwall and Sussex. Because Figure 2 was compiled over an extended period
(1972-1990), before the collection of the cattle confirmed breakdown data in Figure 1(a), it
could be argued that it was prefiguring what was to come. Badgers were collected and
analysed in this way for over 20 years and the core areas of infection were stable over this
period.

6
Research on badgers from the 1980s onwards has found strong links between
infection in the two species, including evidence of spatial correlation. Most of this research
has tended to be observational and no one has yet proved definitively which direction the
infection travels and which species is the maintenance host. Nevertheless, the RBCT
organized by the Independent Scientific Group on Cattle TB (ISG) provided a rare
opportunity to gather data and some of the analysis by its members is indicative of
interwoven worlds of infection within a radius of 1-2 kms [17].
In the light of the patterns discussed above, Figures 3 and 4 are strikingly similar to
each other (but different from Figures 1a and 1b). The two maps have much in common at the
regional level, and John Ritchie, (Chief Veterinary Officer, 1952-1965) commented that “the
weight of infection as revealed by the Tuberculosis Orders figures very closely conforms
with the test survey figures” [18]. The regional patterns also correlate broadly with the
extensive qualitative commentaries of agricultural journalists, veterinarians and civil servants
in the press, parliamentary inquiries and official reports [19]. It seems unlikely that they are
an artefact of the enthusiasm for control of certain local authorities or the result of the pre-
war scarcity of statistical resources.
The north-west and north-Midlands of England were the main hotspots, along with
the south coast of England and central and north-east Scotland. Note how low the south-west
of England and south Wales stand in this interwar period. There are a few discrepancies, for
instance Ross and Cromarty being in the top quartile in Figure 3 but in the bottom category in
Figure 4. This is probably a small numbers problem, with only 500 cattle tested there in 1938,
the second lowest for the counties in Scotland.
The spatial clustering of counties in the top quartile and the consistency between the
two maps suggests a real pattern that has to be taken seriously. There is also further,
corroborative evidence to support this claim drawn from the bTB that was identified in
human surgical and pathological samples collected and typed from 1943 to 1945 [Table 2].
These were mainly taken from consumers of infected milk. We would not expect a perfect
geographical match with the cattle disease because milk was transported from the specialist
producer districts to distant cities such as London, and so the disease spread beyond its place
of origin. Even so, the North Midlands and North-West were the worst affected and, since
these regions were largely self-sufficient in milk, we can assume that people there were
picking up a local infection [20].
< Table 2 here >

7
The spatial disjuncture between bTB at present and 50 years ago poses an important
question. How is it that there is so little evidence of continuity in wildlife disease in those
regions where cattle in the past were so heavily infected? One would have expected a
proportion of badgers in, say, Cheshire still to have been tuberculous in the 1970s and 1980s,
within 10-20 years of the eradication of bTB in cattle in that county (1960) for one of two
reasons. If wildlife was a cause of disease in cattle before attestation then the slaughter of all
tuberculous cattle would have made little difference to the level of infection in badgers. Or, if
the pathway of contagion was in the opposite direction, badgers would undoubtedly have
been challenged because, with over 40 per cent of local cattle being tuberculous and some in
an advanced stage of the disease that is never seen today, there would have been a greater
shedding of bacteria on the pastures here than anywhere else in Britain at any time in history.
Much modern research indicates close parallels between disease development in the two
species, even to the point of them sharing the same strain (spoligotype) within a radius of 1-2
kms [21, 22]. Why then is it that only one of 389 badgers collected from RTAs in Cheshire
1972-90 proved to be tuberculous?
DISCUSSION
Some writers have argued that bTB is endemic in British badgers [8]. Anderson and
Trewhella suggested that under favourable circumstances an equilibrium of 10-20 per cent
prevalence will be reached in an infected community after 30-40 years and others have run
similar simulation models over several decades or in one case for 100 years [23, 24]. A
minimum badger group size of 6-8 is usually said to be required for disease persistence [25],
although this and other assumptions about the relationship between group size and bTB
incidence have been questioned recently [26]. It is now thought, for instance, that badger
mortality from bTB is relatively low and this has implications for the disease’s basic
reproductive rate.
One difference between the present and the 1930s is the increase in badger numbers
since the main protective legislation of 1973, 1981 and 1992. Before that badger numbers
were kept down by gamekeepers, farmers and sett diggers. Smaller numbers of badgers
before the war meant a lower risk of them catching bTB from cattle but the sheer weight of
disease in dairy herds meant the maximum possible exposure of any local wildlife. Even if
badgers were naive of the disease at the beginning of the twentieth century, it seems very
likely that some infection would have leaked along this route by the 1930s.
8
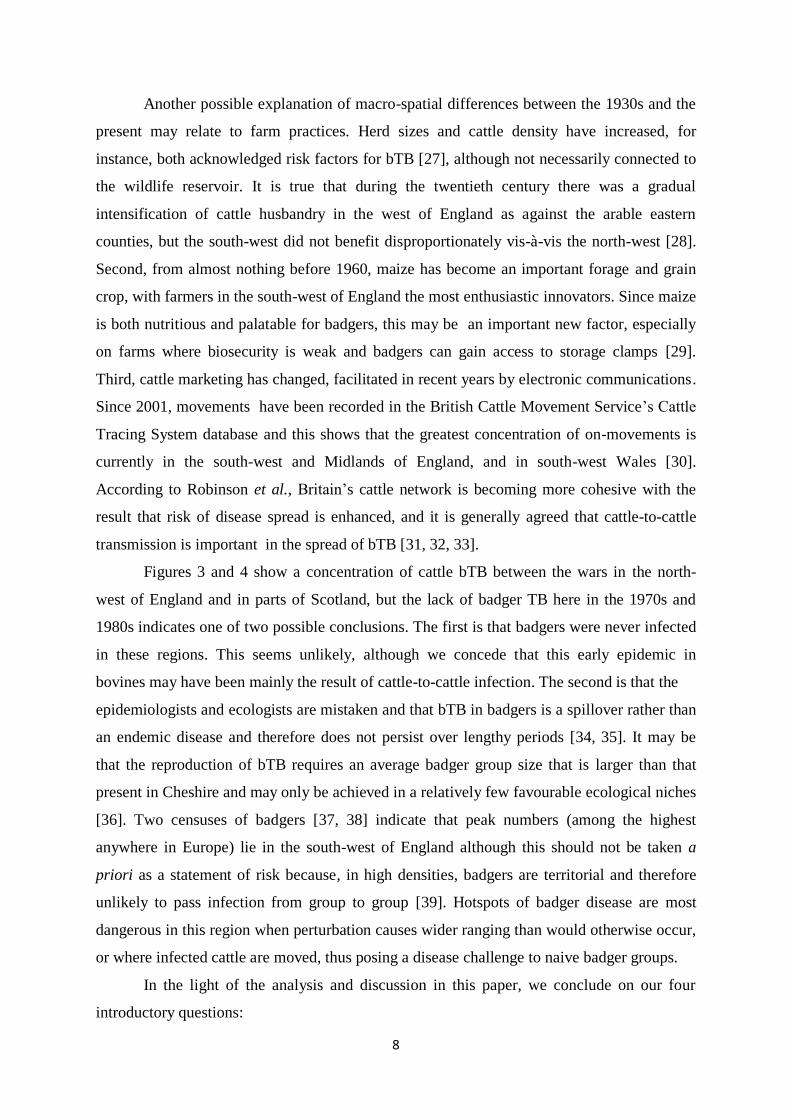
Another possible explanation of macro-spatial differences between the 1930s and the
present may relate to farm practices. Herd sizes and cattle density have increased, for
instance, both acknowledged risk factors for bTB [27], although not necessarily connected to
the wildlife reservoir. It is true that during the twentieth century there was a gradual
intensification of cattle husbandry in the west of England as against the arable eastern
counties, but the south-west did not benefit disproportionately vis-à-vis the north-west [28].
Second, from almost nothing before 1960, maize has become an important forage and grain
crop, with farmers in the south-west of England the most enthusiastic innovators. Since maize
is both nutritious and palatable for badgers, this may be an important new factor, especially
on farms where biosecurity is weak and badgers can gain access to storage clamps [29].
Third, cattle marketing has changed, facilitated in recent years by electronic communications.
Since 2001, movements have been recorded in the British Cattle Movement Service’s Cattle
Tracing System database and this shows that the greatest concentration of on-movements is
currently in the south-west and Midlands of England, and in south-west Wales [30].
According to Robinson et al., Britain’s cattle network is becoming more cohesive with the
result that risk of disease spread is enhanced, and it is generally agreed that cattle-to-cattle
transmission is important in the spread of bTB [31, 32, 33].
Figures 3 and 4 show a concentration of cattle bTB between the wars in the north-
west of England and in parts of Scotland, but the lack of badger TB here in the 1970s and
1980s indicates one of two possible conclusions. The first is that badgers were never infected
in these regions. This seems unlikely, although we concede that this early epidemic in
bovines may have been mainly the result of cattle-to-cattle infection. The second is that the
epidemiologists and ecologists are mistaken and that bTB in badgers is a spillover rather than
an endemic disease and therefore does not persist over lengthy periods [34, 35]. It may be
that the reproduction of bTB requires an average badger group size that is larger than that
present in Cheshire and may only be achieved in a relatively few favourable ecological niches
[36]. Two censuses of badgers [37, 38] indicate that peak numbers (among the highest
anywhere in Europe) lie in the south-west of England although this should not be taken a
priori as a statement of risk because, in high densities, badgers are territorial and therefore
unlikely to pass infection from group to group [39]. Hotspots of badger disease are most
dangerous in this region when perturbation causes wider ranging than would otherwise occur,
or where infected cattle are moved, thus posing a disease challenge to naive badger groups.
In the light of the analysis and discussion in this paper, we conclude on our four
introductory questions:
9
1. That while the historical and present-day data sources face questions of precision and
representativeness, our considered view is that they do indicate a significant change in the
spatial pattern of cattle bTB.
2. That it is unlikely that badger numbers were great before 1960 in those counties where
bTB was at its peak in both cattle and human disease. Bovine TB was probably therefore
more of a cattle-to-cattle infection in the past than it is said to be today.
3. That the intensification of cattle husbandry, increase of herd size, frequent movement of
animals, and cultivation of new crops such as maize have all played their part in
restructuring the industry. Whether this is enough to explain the heightened risk of bTB
infection in the south-west is a question that requires further investigation.
4. That our present assumptions about the endemicity and persistence of bTB in badger
groups in lower density regions need to be revisited. We challenge the idea that bTB has
historically been persistent in enough wildlife pockets around the country, flaring up
recently as badger numbers have increased, to account for the epidemic of the last ten
years in cattle.
Overall, we hope that our introduction of a historical perspective will encourage
further research on long-term bTB disease dynamics. Potentially there is a new agenda here,
not least because policy-makers have structured their interventions on evidence from the
voluminous literature of the last twenty years, largely ignoring the long and difficult history
of bTB governance [40].
ACKNOWLEDGEMENTS
Philip Robinson wishes to thank the Department of Agriculture and Rural Development,
Northern Ireland, for his doctoral scholarship. The 1991 and 2010 bTB locational data were
kindly provided by Barbara Wibberley of the AHVLA and are protected by the terms of an
Open Government Licence.
DECLARATION OF INTEREST
None.

10
Figure 1(a). Confirmed cattle breakdowns for 1991. Source: AHVLA
11
Figure 1(b). Confirmed cattle breakdowns for 2010. Source: AHVLA

12
Figure 2. Badger RTAs 1972-1990
Source: Krebs, 1997

13
Figure 3. Reactors per thousand cattle tested, 1938, quartiles
Source: Francis, 1947

14
Figure 4. Cattle slaughtered per 1000 head under TB Order, 1926-1940, quartiles
Source: Francis, 1947

15
Table 1. bTB in badgers collected from RTAs, 1972-1994
County RTA badgers analysed Tuberculous (%)
Avon 1243 7.96
Cornwall 3426 5.98
Cheshire 389 0.26
Devon 1441 3.12
Dorset 1202 2.25
Somerset 1067 0.66
Sussex 1006 3.08
Wiltshire 1479 4.80
Rest of England 11,253 4.32
Scotland 48 2.08
Wales 1673 0.96
Great Britain 21,731 4.05
Source: AHVLA

16
Table 2. bTB in English human non-respiratory samples, 1943-45
Region Samples Bovine (per cent)
North East 119 11.8
North West 163 34.4
North Midlands 185 43.2
South Midlands 97 20.6
East 128 31.3
South East 95 13.7
South West 59 28.8
London and Middlesex 63 12.7
Other 85 15.3
All 994 26.3
Source: Wilson, et al., 1949, 339.
Note: These are modified Registrar General’s regions.
17
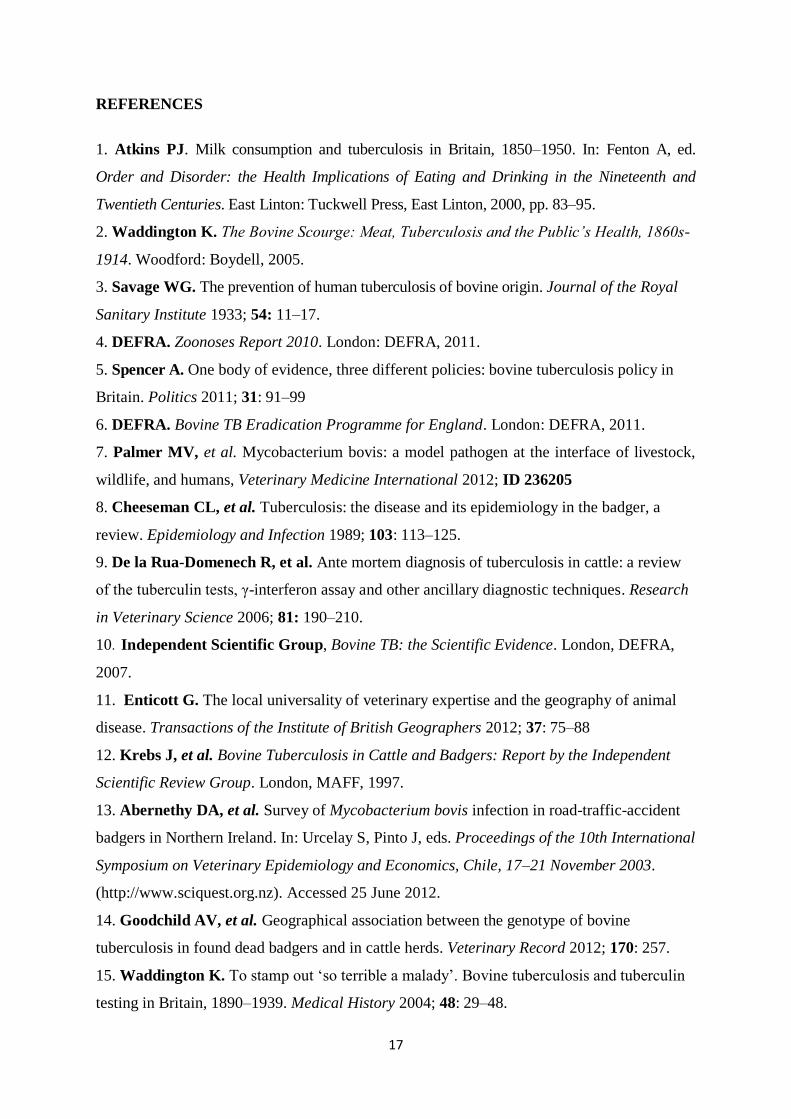
REFERENCES
1. Atkins PJ. Milk consumption and tuberculosis in Britain, 1850–1950. In: Fenton A, ed.
Order and Disorder: the Health Implications of Eating and Drinking in the Nineteenth and
Twentieth Centuries. East Linton: Tuckwell Press, East Linton, 2000, pp. 83–95.
2. Waddington K. The Bovine Scourge: Meat, Tuberculosis and the Public’s Health, 1860s-
1914. Woodford: Boydell, 2005.
3. Savage WG. The prevention of human tuberculosis of bovine origin. Journal of the Royal
Sanitary Institute 1933; 54: 11‒17.
4. DEFRA. Zoonoses Report 2010. London: DEFRA, 2011.
5. Spencer A. One body of evidence, three different policies: bovine tuberculosis policy in
Britain. Politics 2011; 31: 91–99
6. DEFRA. Bovine TB Eradication Programme for England. London: DEFRA, 2011.
7. Palmer MV, et al. Mycobacterium bovis: a model pathogen at the interface of livestock,
wildlife, and humans, Veterinary Medicine International 2012; ID 236205
8. Cheeseman CL, et al. Tuberculosis: the disease and its epidemiology in the badger, a
review. Epidemiology and Infection 1989; 103: 113‒125.
9. De la Rua-Domenech R, et al. Ante mortem diagnosis of tuberculosis in cattle: a review
of the tuberculin tests, γ-interferon assay and other ancillary diagnostic techniques. Research
in Veterinary Science 2006; 81: 190–210.
10. Independent Scientific Group, Bovine TB: the Scientific Evidence. London, DEFRA,
2007.
11. Enticott G. The local universality of veterinary expertise and the geography of animal
disease. Transactions of the Institute of British Geographers 2012; 37: 75–88
12. Krebs J, et al. Bovine Tuberculosis in Cattle and Badgers: Report by the Independent
Scientific Review Group. London, MAFF, 1997.
13. Abernethy DA, et al. Survey of Mycobacterium bovis infection in road-traffic-accident
badgers in Northern Ireland. In: Urcelay S, Pinto J, eds. Proceedings of the 10th International
Symposium on Veterinary Epidemiology and Economics, Chile, 17–21 November 2003.
(http://www.sciquest.org.nz). Accessed 25 June 2012.
14. Goodchild AV, et al. Geographical association between the genotype of bovine
tuberculosis in found dead badgers and in cattle herds. Veterinary Record 2012; 170: 257.
15. Waddington K. To stamp out ‘so terrible a malady’. Bovine tuberculosis and tuberculin
testing in Britain, 1890–1939. Medical History 2004; 48: 29–48.
18
16. Francis J. Bovine Tuberculosis. London, Staples Press, 1947.
17. Woodroffe R, et al. Spatial association of Mycobacterium bovis infection in cattle and
badgers Meles meles. Journal of Applied Ecology 2005; 42: 852–862.
18. Ritchie JA. in Pool WA, President Section of Comparative Medicine: discussion on the
methods to be employed in eradicating tuberculosis of bovine origin from the human and
animal populations. Journal of the Royal Society of Medicine 1946; 39: 213‒222.
19. Atkins PJ. A History of Uncertainty: Bovine Tuberculosis and the Reluctant State in
Britain, 1850 to the Present Day. Forthcoming, 2013.
20. Wilson GS, et al. Non pulmonary tuberculosis in England and Wales: account of a group
investigation undertaken during the years 1943 to 1945. Journal of Hygiene 1949; 47: 337‒359.
21. Woodroffe R, et al. Spatial association of Mycobacterium bovis infection in cattle and
badgers Meles meles. Journal of Applied Ecology 2005; 42: 852–862.
22. Woodroffe R, et al. Bovine tuberculosis in cattle and badgers in localized culling areas.
Journal of Wildlife Diseases 2009; 45: 128‒143.
23. Anderson RM, Trewhella W. Population dynamics of the badger (Meles meles) and the
epidemiology of bovine tuberculosis (Mycobacterium bovis). Philosophical Transactions of
the Royal Society B 1985; 310: 327‒381.
24. White PCL, Harris S. Bovine tuberculosis in badger (Meles meles) populations in South
West England: the use of a spatial stochastic simulation model to understand the dynamics of
the disease. Philosophical Transactions of the Royal Society B 1995; 349: 391‒413.
25. Smith GC, et al. Modelling bovine tuberculosis in badgers in England: preliminary
results. Mammalia 1995; 59: 639‒650.
26. Woodroffe R, et al. Social group size affects Mycobacterium bovis infection in European
badgers (Meles meles), Journal of Animal Ecology 2009; 78: 818‒827.
27. Brooks-Pollock E, Keeling M. Herd size and bovine tuberculosis persistence in cattle
farms in Great Britain. Preventative Veterinary Medicine 2009; 92: 360‒365.
28. RADAR. The Cattle Book 2008. London: DEFRA
29. Roper TJ. Badger. London: Collins, 2010.
30. Mitchell A et al. Characteristics of cattle movements in Britain – an analysis of records
from the Cattle Tracing System. Animal Science 2005; 80: 265‒273.
31. Robinson SE, Everett MG, Christley RM. Recent network evolution increases the
potential for large epidemics in the British cattle population. Journal of the Royal Society
Interface 2007; 4: 669-674.
19
32. Gilbert M et al. Cattle movements and bovine tuberculosis in Great Britain. Nature
2005; 435: 491‒496.
33. Green DM et al. Estimates for local and movement-based transmission of bovine
tuberculosis in British cattle. Proceedings of the Royal Society of London B 2008; 275: 1001–
1005.
34. Corner LAL et al. Mycobacterium bovis infection in the Eurasian badger (Meles meles):
the disease, pathogenesis, epidemiology and control. Journal of Comparative Pathology
2011; 144: 1‒24.
35. Nugent G. Maintenance, spillover and spillback transmission of bovine tuberculosis in
multi-host wildlife complexes: a New Zealand case study. Veterinary Microbiology 2011;
151: 34–42.
36. Allen AR et al. Bovine TB: a review of badger-to-cattle transmission. 2011
(http://www.dardni.gov.uk). Accessed 12 June 2012.
37. Cresswell P et al. The History, Distribution, Status and Habitat Requirements of the
Badger in Britain. Peterborough: Nature Conservancy Council, 1990.
38. Wilson G et al. Changes in the British Badger Population, 1988–1997. London: People’s
Trust For Endangered Species, 1997.
39. Böhm M et al. Contact networks in a wildlife-livestock host community: identifying
high-risk individuals in the transmission of bovine TB among badgers and cattle. PLoS ONE
2009; 4: e5016.
40. Grant W. Intractable policy failure: the case of bovine tb and badgers. British Journal of
Politics and International Relations 2009; 11: 557–573.