Borrelia burgdorferi Induces TLR1 and TLR2 in Human Microglia and Peripheral Blood Monocytes but...
23
Copyright @ 2006 by the American Association of Neuropathologists, Inc. Unauthorized reproduction of this article is prohibited. ORIGINAL ARTICLE Borrelia burgdorferi Induces TLR1 and TLR2 in Human Microglia and Peripheral Blood Monocytes but Differentially Regulates HLA-Class II Expression Riccardo Cassiani-Ingoni, MS, Erik S. Cabral, MS, Jan D. Lu ¨nemann, MD, Zoila Garza, MS, Tim Magnus, MD, PhD, Harald Gelderblom, MD, Peter J. Munson, PhD, Adriana Marques, MD, and Roland Martin, MD Abstract The spirochete Borrelia burgdorferi is the agent of Lyme disease, which causes central nervous system manifestations in up to 20% of patients. We investigated the response of human brain microglial cells, glial progenitors, neurons, astrocytes, as well as peripheral blood monocytes to stimulation with B. burgdorferi. We used oligoarrays to detect changes in the expression of genes important for shaping adaptive and innate immune responses. We found that stimulation with B. burgdorferi lysate increased the expression of Toll-like receptors (TLRs) 1 and 2 in all cell types except neurons. However, despite similarities in global gene profiles of monocytes and microglia, only microglial cells responded to the stimulation with a robust increase in HLA-DR, HLA-DQ, and also coexpressed CD11-c, a dendritic cell marker. In contrast, a large number of HLA-related molecules were repressed at both the RNA and the protein levels in stimulated monocytes, whereas secretion of IL-10 and TNF-> was strongly induced. These results show that signaling through TLR1/2 in response to B. burgdorferi can elicit opposite immunoregulatory effects in blood and in brain immune cells, which could play a role in the different susceptibility of these compartments to infection. Key Words: Glia, HLA class II, Lyme disease, Microglia, Monocyte, Outer surface protein A, Toll-like receptor. INTRODUCTION Lyme disease is the most frequently occurring vector- borne infection in the United States and is also endemic in Europe and parts of Asia (1). Transmitted by Ixodes ticks, its causative agent Borrelia burgdorferi initially propagates locally in the skin before it disseminates hematogenously to other organ systems. Neurologic involvement occurs in up to 20% of patients and presents as cranial neuritis, meningor- adiculitis, or encephalitis. Tissue tropism of B. burgdorferi for the nervous system and the inflammatory mechanisms that are involved in the local immune responses are at present only partly understood. The immune privilege of the central nervous system (CNS) and the functional character- istics of resident CNS cells likely play important roles. In animal models of Lyme disease, CNS invasion leads to local tissue damage as a consequence of potent induction of proinflammatory mediators by microglial cells (2, 3). Microglia are resident immune cells within the CNS with a slow rate of turnover from circulating monocytes. When activated, microglial cells are capable of initiating a strong and prompt immune reaction against invading pathogens and orchestrate peripheral leukocyte infiltration (4). These responses are probably under tight spatial and temporal regulation, depending on the inducing stimulus/ inflammatory context, to prevent immune-mediated brain damage. If activated in an uncontrolled fashion, microglial cells can amplify deleterious chronic immune responses within the CNS as suggested for cerebral malaria or multiple sclerosis (4, 5). Besides microglial cells, B. burgdorferi-mediated inflammation affects other glial and neuronal cells as well, which may occur directly through engagement of pattern recognition receptors expressed on these cells or indirectly as a result of mediator release from activated microglia. Pattern recognition receptors, which comprise the Toll-like receptors (TLR), can act as pathogen Bsensors^ by recognizing specific molecular structures that are conserved among members of each class of infectious agents. In this way, they confer From the Cellular Immunology Section (RCI, ESC, JDL, HG, RM), Neuroimmunology Branch, National Institute of Neurological Disorders and Stroke, Bethesda, Maryland; Mathematical and Statistical Comput- ing Laboratory (ZG, PJM), Analytical Biostatistics Section, Center for Information Technology, Bethesda, Maryland; Stem Cell Biology Unit (TM), Laboratory of Neuroscience, National Institute on Aging, Bethesda, Maryland; Laboratory of Clinical Infectious Diseases (AM), National Institute of Allergy and Infectious Diseases, National Institutes of Health, Bethesda, Maryland; and Department of Human Physiology and Pharmacology (RCI), Center of Excellence in Biology and Molecular Medicine, University of Rome BLa Sapienza,[ Rome, Italy. Send correspondence and reprint requests to: Riccardo Cassiani-Ingoni, MS, Bldg.10, Room 5B06, 10 Center Drive, Bethesda, MD 20892; E-mail: [email protected] This research was supported in part by the Intramural Research Program of the National Institutes of Health, NINDS, NIAID, and NIMH. RCI is supported by the Integrative Neural Immune Program (INIP) of NIMH and is a doctoral candidate in the Research in Neurophysiology program at the University of Rome BLa Sapienza.^ Supplementary data is available online at http://www.jneuropath.com. J Neuropathol Exp Neurol Volume 65, Number 6, June 2006 540 J Neuropathol Exp Neurol Copyright Ó 2006 by the American Association of Neuropathologists, Inc. Vol. 65, No. 6 June 2006 pp. 540 Y 548
-
Upload
independent -
Category
Documents
-
view
0 -
download
0
Transcript of Borrelia burgdorferi Induces TLR1 and TLR2 in Human Microglia and Peripheral Blood Monocytes but...

Copyright @ 2006 by the American Association of Neuropathologists, Inc. Unauthorized reproduction of this article is prohibited.
ORIGINAL ARTICLE
Borrelia burgdorferi Induces TLR1 and TLR2 in Human Microgliaand Peripheral Blood Monocytes but Differentially Regulates
HLA-Class II Expression
Riccardo Cassiani-Ingoni, MS, Erik S. Cabral, MS, Jan D. Lunemann, MD, Zoila Garza, MS,
Tim Magnus, MD, PhD, Harald Gelderblom, MD, Peter J. Munson, PhD,
Adriana Marques, MD, and Roland Martin, MD
AbstractThe spirochete Borrelia burgdorferi is the agent of Lyme
disease, which causes central nervous system manifestations in up
to 20% of patients. We investigated the response of human brain
microglial cells, glial progenitors, neurons, astrocytes, as well as
peripheral blood monocytes to stimulation with B. burgdorferi. We
used oligoarrays to detect changes in the expression of genes
important for shaping adaptive and innate immune responses. We
found that stimulation with B. burgdorferi lysate increased the
expression of Toll-like receptors (TLRs) 1 and 2 in all cell types
except neurons. However, despite similarities in global gene
profiles of monocytes and microglia, only microglial cells
responded to the stimulation with a robust increase in HLA-DR,
HLA-DQ, and also coexpressed CD11-c, a dendritic cell marker. In
contrast, a large number of HLA-related molecules were repressed
at both the RNA and the protein levels in stimulated monocytes,
whereas secretion of IL-10 and TNF-> was strongly induced.
These results show that signaling through TLR1/2 in response to
B. burgdorferi can elicit opposite immunoregulatory effects in
blood and in brain immune cells, which could play a role in the
different susceptibility of these compartments to infection.
Key Words: Glia, HLA class II, Lyme disease, Microglia,
Monocyte, Outer surface protein A, Toll-like receptor.
INTRODUCTION
Lyme disease is the most frequently occurring vector-borne infection in the United States and is also endemic inEurope and parts of Asia (1). Transmitted by Ixodes ticks, itscausative agent Borrelia burgdorferi initially propagateslocally in the skin before it disseminates hematogenously toother organ systems. Neurologic involvement occurs in up to20% of patients and presents as cranial neuritis, meningor-adiculitis, or encephalitis. Tissue tropism of B. burgdorferifor the nervous system and the inflammatory mechanismsthat are involved in the local immune responses are atpresent only partly understood. The immune privilege of thecentral nervous system (CNS) and the functional character-istics of resident CNS cells likely play important roles.
In animal models of Lyme disease, CNS invasionleads to local tissue damage as a consequence of potentinduction of proinflammatory mediators by microglial cells(2, 3). Microglia are resident immune cells within the CNSwith a slow rate of turnover from circulating monocytes.When activated, microglial cells are capable of initiating astrong and prompt immune reaction against invadingpathogens and orchestrate peripheral leukocyte infiltration(4). These responses are probably under tight spatial andtemporal regulation, depending on the inducing stimulus/inflammatory context, to prevent immune-mediated braindamage. If activated in an uncontrolled fashion, microglialcells can amplify deleterious chronic immune responses withinthe CNS as suggested for cerebral malaria or multiple sclerosis(4, 5). Besides microglial cells, B. burgdorferi-mediatedinflammation affects other glial and neuronal cells as well,which may occur directly through engagement of patternrecognition receptors expressed on these cells or indirectly asa result of mediator release from activated microglia. Patternrecognition receptors, which comprise the Toll-like receptors(TLR), can act as pathogen Bsensors^ by recognizing specificmolecular structures that are conserved among members ofeach class of infectious agents. In this way, they confer
From the Cellular Immunology Section (RCI, ESC, JDL, HG, RM),Neuroimmunology Branch, National Institute of Neurological Disordersand Stroke, Bethesda, Maryland; Mathematical and Statistical Comput-ing Laboratory (ZG, PJM), Analytical Biostatistics Section, Center forInformation Technology, Bethesda, Maryland; Stem Cell Biology Unit(TM), Laboratory of Neuroscience, National Institute on Aging,Bethesda, Maryland; Laboratory of Clinical Infectious Diseases (AM),National Institute of Allergy and Infectious Diseases, National Institutesof Health, Bethesda, Maryland; and Department of Human Physiologyand Pharmacology (RCI), Center of Excellence in Biology andMolecular Medicine, University of Rome BLa Sapienza,[ Rome, Italy.
Send correspondence and reprint requests to: Riccardo Cassiani-Ingoni, MS,Bldg.10, Room 5B06, 10 Center Drive, Bethesda, MD 20892; E-mail:[email protected]
This research was supported in part by the Intramural Research Program ofthe National Institutes of Health, NINDS, NIAID, and NIMH. RCI issupported by the Integrative Neural Immune Program (INIP) of NIMHand is a doctoral candidate in the Research in Neurophysiology programat the University of Rome BLa Sapienza.^
Supplementary data is available online at http://www.jneuropath.com.
J Neuropathol Exp Neurol � Volume 65, Number 6, June 2006540
J Neuropathol Exp NeurolCopyright � 2006 by the American Association of Neuropathologists, Inc.
Vol. 65, No. 6June 2006
pp. 540 Y548

Copyright @ 2006 by the American Association of Neuropathologists, Inc. Unauthorized reproduction of this article is prohibited.
crucial information for shaping the specific immune response,for example, antibacterial as opposed to antiviral (6). TLR2mediates immune responses to a broad range of microbialproducts and is critical for the recognition of bacteriallipopeptides or live infectious organisms (7); when itfunctions in combination with another member, TLR1, itcan bind triacylated lipopeptides like mycobacterial lip-oprotein and the outer surface protein A of B. burgdorferi(8, 9).
In vitro studies in murine microglia have shown thatB. burgdorferi is capable of inducing the expression ofpattern recognition receptors like TLR2 and CD14 in thesecells (10), a critical step in immune activation in the CNS.Based on the potential impact of B. burgdorferi-inducedcellular activation patterns for the human disease, it wasimportant to investigate the cellular response of humanbrain and blood cells to these molecules. We stimulatedmicroglia, astrocytes, neurons, and glial progenitors withB. burgdorferi in vitro. Using oligoarrays, we comparedthe individual cellular responses with that of peripheralblood monocytes in the same conditions. This analysishighlighted overlapping but characteristic expression pro-files of monocytes and microglial cells as well as pre-viously unrecognized differences in their response afterTLR engagement.
MATERIALS AND METHODS
Isolation and Characterization of Brain Cellsand Blood Monocytes
We used primary microglial cells, neuronal and glialprogenitor cells isolated from human fetal tissue (ScienCell,San Diego, CA). Fluorescence-activated cell sorting (FACS)was used to further purify individual cell populations basedon the expression of lineage-specific surface markers. Weused antibodies against CD11-b (BD Biosciences, San Jose,CA) to sort microglial cells, A2B5 staining (Roche, Indian-apolis, IN) for progenitors, and a mixture of tetanus toxinfragment C (TnTx) (Roche) together with a mouse mono-clonal anti-TnTx antibody to sort neurons and neuronalprogenitors, as previously described (11, 12). In culture, over85% of neuronal cells were positive by antineurofilament(Chemicon, Temecula, CA) staining after 4 to 5 days. Purepopulations of GFAP+ (Dako, Carpinteria, CA) astrocyteswere differentiated in vitro from fetal neurospheres with10% human serum (Gemini Bio Products, Woodland, CA)for 7 days. CD14-expessing peripheral monocytes wereisolated from healthy volunteers by countercurrent elutria-tion from peripheral blood at the Department of TransfusionMedicine, Clinical Research Center, National Institutes ofHealth under a protocol approved by the National CancerInstitute Institutional Review Board, and all volunteerssigned informed consent. Microglial cells and monocyteswere cultured in IMDM (Gibco Invitrogen, Carlsbad, CA)with 3% human serum, glutamine, and antibiotics. The otherbrain cells were cultured in DMEM supplemented with 2%B-27 (both from Gibco Invitrogen) and antibiotics. Sortedpopulations were cultured in parallel in 6-well plates for at
least 48 hours before stimulation with bacterial antigens toallow complete removal of the antibodies used for sorting asshown previously (13).
Stimulation with Borrelia burgdorferi Antigens
Stimulation with bacterial antigens was done using 1 Kg/mL low-passage sonicate of B. burgdorferi sensu stricto strainB31 (Biodesign, Saco, ME) or with 0.1 Kg/mL recombinantLipidated-outer surface protein A (L-OspA) of B. burgdorferi(SmithKline Beecham Biologicals, Rixensart, Belgium).Antigen stimulation was performed in 2 mL fresh mediumfor 48 hours. No bacterial molecules were added in thecontrol cultures. The final endotoxin concentration in mediumfor all antigens tested was G0.05 EU/mL (Endosafe-PTS) orG0.1 EU/mL (Cambrex Bioscience, East Rutherford, NJ).This time point and antigen concentration were chosenaccording to pilot time course and dose-titration experiments(data not shown) as well as published data using differentcells (14, 15).
Oligoarray Hybridization
Total RNA was isolated with RNeasy (Qiagen, Valencia,CA) from parallel cultures of stimulated and unstimulated cellsfrom individual donors. We independently hybridized RNAsamples from a number of cell preparations of microglia(4 challenged, 3 mock), of monocytes (4 challenged, 3control), neurons (1 challenged, 3 control), glial progenitors(2 challenged, 2 control), and astrocytes (1 challenged, 1control). A minimum of 5 Kg total RNA per cell preparation/condition was reverse-transcribed with T7-polyA primers(Invitrogen Life Technologies, Carlsbad, CA). In vitrotranscription of cDNA was performed in the presence ofbiotinylated ribonucleotides (ENZO Diagnostics, New York,NY). Hybridization of 15 Kg of cRNA to each HumanGenome 133A GeneChip (Affymetrix, Santa Clara, CA) wasdone overnight. Secondary detection and scanning followedthe manufacturer`s protocols.
Statistical Analysis of Array Data
Affymetrix software GCOS version 1.2 was used tocontrol the fluidics and scanners and to process raw intensitydata into signal and present call values. Data were trans-ferred and stored in the NIHLIMS database of Affymetrixmicroarray results. Data were analyzed using the MSCLAnalyst’s Toolbox (http://abs.cit.nih.gov) and the JMPstatistical software (http://www.jmp.com). Signal valueswere retrieved, log10-transformed, and normalized to themedian intensity of each chip. A principal componentsanalysis (PCA) on the transformed data permitted visual-ization of the 24 samples in bivariate plots of the low-orderprincipal components to detect possible outliers and toprovide a global view of the study results.
The study included 5 cell types and 2 conditions(control and challenged). The response of microglia andmonocytes (or the other cell types) was compared in a one-way analysis of variance with 4 levels. The p values werecollected for each probe set and the corresponding false
J Neuropathol Exp Neurol � Volume 65, Number 6, June 2006 Cellular Response to Borrelia
� 2006 American Association of Neuropathologists, Inc. 541

Copyright @ 2006 by the American Association of Neuropathologists, Inc. Unauthorized reproduction of this article is prohibited.
discovery rate values computed. Log-fold change valueswere computed as the difference between the averagestimulated (challenge) and unstimulated (mock) values foreach cell type. Genes with >2-fold change in eitherdirection, on either cell type, with a false discovery rateG10% were selected for further analysis. Two-way hierarch-ical clustering was performed on all 24 samples for a subsetof 715 probe sets having high variability across samples(standard deviation above 0.7 in log10 units) and also havingpresent calls in more than 3 samples. Hierarchical clusteringwas performed using Ward’s method and JMP software.Colored heat maps give expression levels (above or belowthe mean level for each gene) as red or green, respectively.
Quantitative Reverse TranscriptaseYPolymeraseChain Reaction
Total RNA was reverse-transcribed into cDNA withrandom hexamers using the TaqMan reverse transcriptionreagents per manufacturers instructions (Perkin Elmer,Boston, MA). Quantitative reverse transcriptaseYpolymerasechain reaction (RT-PCR) was performed on an ABI Prism7700 Sequence Detection System (Perkin Elmer). Primers andprobes were designed for detection of MyD88, TLR1, TLR2,TLR4, and TLR6 (Synthegen, Houston, TX) (SupplementaryTable S2). For the detection of HLA-DR, IL-6, andGAPDH, we used Pre Developed Assay Reagents (PerkinElmer). Gene expression was normalized to the levels ofexpression of GAPDH using the $$ Ct method.
Fluorescence-Activated Cell Sorting Analysis ofMonocytes and Microglia
Cells from stimulated and control cultures of mono-cytes or microglial cells were detached from the cultureplates and stained for 30 minutes at 4-C using mousemonoclonal antibodies against the following human surfaceantigens: CD14 (M5E2), HLA-DQ (Tu169), HLA-DR (G46-6 or L243), CD11-c (HL3), and CD209 (DNC46) (allpurchased from BD Biosciences, San Jose, CA) in additionto human TLR1 (GD2.F4) and TLR2 (TL2.1) (both fromeBioscience, San Diego, CA). After 2 washes, medianfluorescence intensity was measured using a FACSCaliburand data were analyzed using CellQuest software. Isotype-specific antibodies were used to set respective background.
Cytokine and Chemokine ProteinSecretion Assays
Supernatants were collected from challenged andmock-incubated human monocytes and microglial cells (2 �106 cells/2 mL medium/well) after 24 and 48 hours. This timepoint had been established as optimal in previous time courseexperiments. IFN-F, TNF->, IL-1A, IL-6, IL-10, IL-12, IL-15,and GM-CSF concentrations were determined with a Lumi-nex100 cytometer (Luminex Corp., Austin, TX) usingBioPlex Manager software (Bio-Rad Laboratories, Hercules,CA) and Lincoplex Cytokine Kits (Linco Research, St.Charles, MO) according to the manufacturer`s instructions.
FIGURE 1. Microarray analysis of brain and blood cells after stimulation with Borrelia burgdorferi. Two-way hierarchical clusteringwas used to analyze samples comprising astrocytes, neurons, oligodendrocyte/glial progenitor cells, microglia, and peripheralmonocytes stimulated with B. burgdorferi lysate (BBL) versus controls (CON). The resulting heat map visualizes the relativeexpression level measured for selected probe sets (see ‘‘Materials and Methods’’) within each sample, where red indicates anabove-average and green a below-average response. Stimulated and control samples are accurately partitioned within each celltype. Microglia and monocytes cluster together and separate from all the other cell types.
Cassiani-Ingoni et al J Neuropathol Exp Neurol � Volume 65, Number 6, June 2006
� 2006 American Association of Neuropathologists, Inc.542

Copyright @ 2006 by the American Association of Neuropathologists, Inc. Unauthorized reproduction of this article is prohibited.
RESULTS
Gene Expression of Brain Cells and PeripheralMonocytes in Response to Borrelia burgdorferi
Hierarchical cluster analysis was used to analyze gene-expression profiles (Fig. 1) of CD11-b+ microglial cells,A2B5+ glial progenitors, GFAP+ astrocytes, and neurofila-ment+ neuronal cells as well as CD14+ peripheral monocytes,stimulated with B. burgdorferi lysate. Clustering showed thatmonocytes and microglia grouped together separate from theother cell types. These similarities in global gene expressionprofiles between microglial cells and monocytes wereexpected in light of a similar immunologic function and of acommon origin of these cells. Moreover, stimulation evokedchanges in a greater number of genes in these 2 cell typescompared with the others tested (not shown).
At the level of single genes or groups of genes, ourinitial analysis focused on the modulation of receptormolecules involved in innate immunity. We observed thatthe RNA for TLR2 was significantly upregulated in stimu-lated microglia and monocytes. Also, TLR1 was consistentlyup by an average of 1.5-fold in these cells. B. burgdorferi ledto upregulation of both receptors also in astrocytes and glialprogenitors, but not in neurons (not shown), suggesting that,
among the TLRs, these 2 receptors could play a pivotal rolein the response of all glial cell types in the event of CNSinfection and on tissue injury.
Comparison of Gene Profiles BetweenMicroglia and Monocytes
Understanding potential differences in the cellularresponse of monocytes and microglia to B. burgdorfericould provide insight into the CNS tissue-specific immunemechanisms. We thus focused our analysis on those genesthat were up- or downregulated in stimulated microglia and/or monocytes compared with controls, leaving out all thosegenes that were not significantly changed in both cell typesin response to the stimulus. Antigen stimulation evokedstatistically significant, greater than 2-fold changes in 155probe sets in microglial cells (93 up- and 62 downregulated)and in 308 probe sets in monocytes (171 up- and 137downregulated); the full list of genes is provided as supple-mentary information (Supplementary Table S1). Table 1provides a summary of the changes measured in genesencoding for TLRs, MHC class II-associated molecules,chemokines, and other molecules related to immune func-tion; some of these molecules are further highlighted in thebivariate plot (Supplementary Fig. S1). We found that,although B. burgdorferi stimulation induced TLR2 tran-scription both in microglial cells and monocytes, themodulation of several MHC class II-related genes was verydifferent. This stimulus induced a significant downmodula-tion of numerous HLA-associated genes only in monocytes,whereas these were not significantly altered (except for one)in microglial cells at 48 hours (Table and SupplementaryTable S1). Among the differentially regulated genes werealso members of the chemokine family and their receptors,which are particularly important in attracting immune cellsto sites of inflammation and injury. In this context, thestimulation led to increased transcription of CXCL12 inmicroglia, but not in monocytes; in contrast, the RNA levelof CXCL13 was highly increased in monocytes butdecreased in microglia. These differences in responseindicate that, under the same conditions, signaling throughthe TLR1/2 pathway in response to B. burgdorferi can elicitcontrasting cell type-specific biologic changes in bloodmonocytes and brain microglial cells.
Changes in Toll-Like Receptor ExpressionDetected by Quantitative Polymerase ChainReaction and Fluorescence-ActivatedCell Sorting
To confirm at the mRNA and protein levels the changesmeasured by oligoarray, we analyzed TLR gene expression inmicroglia and monocytes using RT-PCR for selected receptors(TLR1, 2, 4, and 6) and for the adaptor molecule MyD88. Wealso used flow cytometry to compare TLR1 and TLR2 surfaceexpression on resting versus stimulated cells. Besides stimulat-ing monocytes and microglial cells with B. burgdorferi lysate,we used recombinant L-OspA, which is one of the majorlipoproteins of this spirochete (8, 16). As shown in Figure 2A,
TABLE 1. Summary of the Genes Whose Levels WereSignificantly Changed at 48 Hours in Microglia and/orMonocytes After Stimulation With Borrelia burgdorferi LysateCompared With Unstimulated Control Cells
Gene Category Gene Symbol Microglia Monocyte
Toll-like receptors TLR-2 j+2.4 j+3.2
Major histocompatibilitycomplex, class II
CD74 = ,+2.8j
MHC-II-TA = ,j6
HLA-DPA1 = ,j3.3
HLA-DPB1 = ,j3.4
HLA-DQA1 = ,j3.2
HLA-DQB1 ,b2.1 ,j4.8
HLA-DQB2 = ,j2.1
HLA-DRB3 = ,j2.7
HLA-DMA = ,j3.2
Chemokine CXCL12 j+2.0 =
CCR7 j+2.1 j+2.0
CX3CR1 = ,j3.1
CCR2 = j+4.2
CXCL13 ,j2 j+60
Others IL1-R2 j+6.4 ,j4.3
PGDS ,j2.4 j2
NFKB2 j+2 =
MARCO j+6.3 j+11.2
TREM-1 = j+6.9
CD44 = j+4
SOCS-3 = j+19
HSP-70 = j+2.1
TREM-2 ,j2.1 ,j57
j, Genes upregulated; =, genes not significantly changed; ,, genes downregulated;numbers indicate the relative fold changes in expression.
J Neuropathol Exp Neurol � Volume 65, Number 6, June 2006 Cellular Response to Borrelia
� 2006 American Association of Neuropathologists, Inc. 543

Copyright @ 2006 by the American Association of Neuropathologists, Inc. Unauthorized reproduction of this article is prohibited.
1 Kg/mL B. burgdorferi lysate or 0.1 Kg/mL L-OspA bothinduced a comparable 2-fold upregulation of TLR1 and a3-fold upregulation of TLR2 gene expression at 48 hours inboth monocytes and microglia. Both stimuli had no relevanteffects (G2-fold change) on the expression of TLR4 (whichrecognizes lipopolysaccharide [LPS]) and TLR6 (whichrecognizes diacyl lipopeptides and lipoteichoic acid inconjunction with TLR2) or on the common signalingadaptor-protein MyD88 (which is shared by more than oneTLR). The parallel induction of TLR1 and TLR2 geneexpression in the 2 cell types was reflected by a robustincrease in surface expression of both receptors as detected byflow cytometry (Fig. 2B).
Borrelia burgdorferi Induces MHC Class IIUpregulation in Microglia but Downregulationin Monocytes
As revealed first by oligoarray analysis, only mono-cytes significantly downregulated several HLA-relatedgene transcripts within 48 hours. We sought to confirmthese changes by measuring HLA-DR transcription using
RT-PCR (Fig. 3A). We found that HLA-DR mRNA levelswere strongly induced in microglial cells stimulated withB. burgdorferi or with L-OspA. In contrast, HLA-DR genetranscription was decreased in monocytes.
It should be noted that changes in gene expression donot always reflect parallel changes in protein expression.This is especially true for MHC class II molecules, whichare readily mobilized from and then recycled to intracellularstorage pools without a strict dependence on transcription.We thus analyzed by flow cytometry the levels of surfaceprotein expression of HLA-DR, as well as of HLA-DQ, inresting and in B. burgdorferi-stimulated microglial cells andmonocytes. Results of this analysis are shown in Figure 3B.We found that both HLA-DR and HLA-DQ molecules areexpressed on unstimulated microglia and monocytes; baselinelevels of expression are, however, lower on microglia, whichreflects the very low expression level of MHC molecules inthe nervous system. Surface expression of these moleculeswas clearly differentially regulated on stimulation. Althoughmonocytes downregulated the expression of HLA moleculesafter challenge with B. burgdorferi lysate, or with L-OspA(not shown), either stimulus increased the expression of
FIGURE 2. Modulation of Toll-like receptor (TLR) tran-scription and surface expression in stimulated microgliaand monocytes. (A) Reverse transcriptaseYpolymerasechain reaction analysis of the mRNA levels of TLR1,TLR2, TLR4, TLR6, and MyD88 in microglia (white bars)and monocytes (black bars) after 48-hour stimulationwith Borrelia burgdorferi lysate (left) or L-OspA (right)shows the induction of TLR1 and TLR2, but not of TLR4,TLR6, or MyD88, on both cells (n Q3). (B) Representa-tive fluorescence-activated cell sorting profiles of TLR1and TLR2 surface expression on microglia and mono-cytes before and after B. burgdorferi stimulation showthe increased expression of these receptors afterstimulation. Open curves indicate fluorescent profilesof cells stained using isotype controls, as opposed toblack curves for staining with the respective mono-clonal antibodies. Bar graphs on the left summarizechanges in mean fluorescent intensities (MFI) recordedin multiple experiments (n Q3).
Cassiani-Ingoni et al J Neuropathol Exp Neurol � Volume 65, Number 6, June 2006
� 2006 American Association of Neuropathologists, Inc.544

Copyright @ 2006 by the American Association of Neuropathologists, Inc. Unauthorized reproduction of this article is prohibited.
HLA-DR and HLA-DQ in microglia. These results supportthe oligoarray data and further characterize the differentialmodulation of HLA-molecules in monocytes and microglialcells when stimulated by TLR agonists.
Borrelia burgdorferi Differentially Induces IL-10and TNF-> in Monocytes and Microglia
Signaling through TLR1/2 can induce the release ofautocrine factors that modulate the state of cellular activationthrough feedback mechanisms. We next investigated if differ-ential cytokine production could account for the opposingeffect of B. burgdorferi stimulation on MHC class IIexpression. Monocytes and microglia were stimulated withB. burgdorferi lysate 1 Kg/mL for 24 and 48 hours, and levelsof IFN-F, TNF->, IL-1A, IL-6, IL-10, IL-12, IL-15, and GM-CSF were measured in the supernatants. We found thatmonocytes produced 10 to 20 times higher amounts of IL-10and TNF-> than microglia at both time points (Fig. 4). Therewere no differences in the production of the other cytokines.It is interesting that by microarray, only stimulated monocytesincreased the expression of CXCL13 and SOCS-3 anddownregulated MHC-II-TA (Table). Although these were allchanges suggestive of IL-10 signaling in these cells (17Y19),differences in IL-10 RNA were not detected.
Stimulated Microglial Cells Express DendriticCell Markers
The functional immunomodulatory role of microglialcells as brain dendritic cells received substantial attention
FIGURE 3. Modulation of HLA-DR and HLA-DQ expres-sion in stimulated microglia and monocytes. (A) ReversetranscriptaseYpolymerase chain reaction analysis of HLA-DRmRNA levels in microglia and monocytes after stimulationwith Borrelia burgdorferi (black bars) or L-OspA (gray bars)normalized to the levels measured in unstimulated cells(control, white bars) at 48 hours. Both stimuli induce adownregulation in the transcription of HLA-DR in monocytesbut an upregulation in microglial cells. (B) Representativefluorescence-activated cell sorting profiles for HLA-DR andHLA-DQ on stimulated and unstimulated cells. Althoughstimulation with bacterial molecules increases the surfaceexpression of HLA-DR and HLA-DQ on microglial cells,expression of both molecules is downregulated in mono-cytes. Bar graphs summarize changes in mean fluorescentintensities (MFI) recorded in multiple experiments (n Q3).
FIGURE 4. Borrelia burgdorferi induces robust secretion ofIL-10 and TNF->. Bars indicate the concentration of IL-10 (top)and TNF-> (bottom) in supernatants from microglial (white)and monocytic (black) cultures after 24 and 48 hours ofstimulation compared with control cells at 48 hours. Underthe same conditions, only monocytes secrete large amounts ofboth factors (n = 3).
J Neuropathol Exp Neurol � Volume 65, Number 6, June 2006 Cellular Response to Borrelia
� 2006 American Association of Neuropathologists, Inc. 545

Copyright @ 2006 by the American Association of Neuropathologists, Inc. Unauthorized reproduction of this article is prohibited.
recently, especially in relation to inflammatory demyelinat-ing conditions (20Y22). The increased TLR and HLAexpression in B. burgdorferi-stimulated microglial cellswas accompanied by profound changes in cellular mor-phology (Fig. 5A). Stimulated microglial cells lost the char-acteristic elongated morphology to become more round withradial processes that was reminiscent of those of blooddendritic cells in culture. Next, we asked whether microglialcells stimulated with B. burgdorferi could acquire theexpression of dendritic cell markers, namely CD11-c orCD209 (DC-SIGN), as determined by flow cytometry.TLR1/2 stimulation induced a robust expression of CD11-con approximately 20% of all CD11-b+ microglial cells. Incontrast, we did not detect CD209 on microglial and bothmolecules were absent on stimulated and unstimulatedmonocytes.
These data indicate that a subset of microglial cellscould acquire dendritic cell functions after TLR stimulationby bacterial antigens.
DISCUSSION
Infiltration of the spirochete B. burgdorferi from theblood into the CNS compartment in patients with Lymedisease is associated with inflammation of the meninges,nerve roots, or the brain and spinal cord, which result in theclinical manifestations of neuroborreliosis. Because nervoussystem manifestations of Lyme disease occur frequently,besides the chronic involvement of the skin, the heart, andthe joints, and because the CNS is considered an immuno-privileged organ, it is important to understand which factorscontribute to tissue inflammation in the CNS. Althoughadaptive immune responses by T cells and antibodies havereceived most attention in the past in this context, it hasbecome clear that the recognition of microbial molecularpatterns by innate immune mechanisms plays an importantrole not only during acute inflammation, but also in shapingadaptive immune responses. After their initial character-ization in Drosophila, the functional importance of TLRs forthe recognition of bacterial and viral antigens, as well as ofendogenous molecules associated with tissue damage, hasbeen recognized also in mammalian cells (23, 24). Signalingthrough these receptors influences and finely tunes bothinnate and adaptive immune responses by controlling the
state of activation of antigen presenting cells, scavengercells, and lymphocytes, and possibly many other cell typesas well. A number of TLRs are expressed in the normalhuman brain (25). Upregulation of specific receptors hasbeen demonstrated in mouse microglial cells and astrocytesexposed to inflammatory signals (14,26). TLR2, in partic-ular, together with a number of different chemokines andcytokines, appears to play an important role in the patho-genesis of Lyme disease both in humans and in experimentalmodels (27Y29).
Interestingly, we found that TLR2 is upregulated onmicroglial cells, astrocytes, glial progenitors, but not inneurons, in response to stimulation B. burgdorferi. On onehand, this indicates that all 3 cell types express themolecular machinery that allows them to bind and react tosignals of Bdanger^ released by invading pathogens as wellas by the injured tissue itself. It was particularly interestingto challenge glial progenitor cells, which are generallyidentified in the adult brain by surface coexpression ofA2B5 and NG2 antigens, because these cells become rapidlyactivated, divide, and migrate extensively in response totissue damage and inflammation (30). However, a directinfluence of bacterial molecules on progenitors through theTLR pathway had not been previously investigated. BecauseTLR2 can also bind the hydrophilic portions of endogenousmolecules that are released by dead cells in the injured tissue(31), this receptor could play a broader role in activatingglial cells in the surrounding areas and/or guiding them tothe damaged sites of the CNS. On the other hand, progenitorcells could also be actively involved in the orchestration ofbrain`s immune response.
Because B. burgdorferi disseminates mainly through thebloodstream, it was important to include monocytes in ouranalysis and to compare the expression profiles of blood cellswith those of brain cells. Microglial cells and monocytesshowed comparable gene expression profiles and clusteredtogether both in resting conditions and on stimulation. Also, agreater number of genes were changed by B. burgdorferistimulation in monocytes and microglia compared with theother cells (not shown), consistent with the notion thatmicroglial cells constitute the first line of immune surveil-lance in the brain. A closer look, however, revealed importantdifferences in their response to stimulation.
The downregulation of numerous HLA molecules seenonly in monocytes was striking. Interestingly, some researchsuggests that certain pathogens might use TLR signaling totheir own benefit (32), besides serving the host`s immune cellsas molecular pattern receptors. Activation of the TLR1/2pathway could help induce a state of tolerance in sometissues, thereby suppressing the inflammatory reaction thatwould otherwise eliminate the pathogen (33, 34). A similarsuppression has been described in monocytes stimulated withMycobacterium tuberculosis (35), which in turn decreased theproinflammatory responsiveness of these cells to interferon-F(36) as well as antigen-processing and presentation to T-lymphocytes (37, 38). It has been suggested that B. burgdorferimay also avoid immune surveillance by cell-associatedpersistence (39Y 41) and/or by avoiding complement-mediated
FIGURE 5. Expression of dendritic cell markers by microglia.(A) Morphologic changes in microglial cells stimulated withBorrelia burgdorferi lysate. (B) This stimulation induces theexpression of CD11-c, but not of CD209, in a subset (20%) ofCD11-b+ microglial cells as detected by flow cytometry (n = 3).
Cassiani-Ingoni et al J Neuropathol Exp Neurol � Volume 65, Number 6, June 2006
� 2006 American Association of Neuropathologists, Inc.546

Copyright @ 2006 by the American Association of Neuropathologists, Inc. Unauthorized reproduction of this article is prohibited.
killing (42Y44) through a variety of mechanisms. Down-modulation of HLA molecules on peripheral monocytes bycontact with B. burgdorferi antigens could represent animportant factor in immune evasion by this organism.
Although the inhibitory effect on HLA expression onmonocytes was proposed to be TLR2-dependent in experi-ments using Mycobacterium (37), the differential modulationof this gene family shown by microglia indicated aninfluence on HLA class II expression by pathways down-stream of TLR signaling. We found that IL-10 and TNF->, 2molecules that can induce a state of tolerance in monocytes(34, 36, 45) and repress MHC expression when released inresponse to antigenic stimulation (46, 47), were robustlyinduced in monocytes in response to B. burgdorferi. Con-sistent with autocrine effects of IL-10, the levels of some ofits known targets were changed; by microarray, only mono-cytes increased the expression of CXCL13 and SOCS-3 anddecreased MHC class II transactivator, which are all knownchanges induced by IL-10 (17Y19). We therefore suggestthat the opposing effects on HLA class II regulation are atleast partially mediated by differential secretion of thesefactors in response to B. burgdorferi. Further investigation ofthese molecular pathways is clearly of interest in the contextof immune evasion by human pathogens, and the direct com-parison of the responses of monocytes and microglia in vitrocan serve as a useful model to address some of these questions.
Among the genes encoding for chemokines that weredifferentially induced or repressed in the 2 cell types,CXCL12 (stromal derived factor-1> [SDF-1>]) was the onlychemokine transcript significantly upregulated in microglia.This observation is interesting because elevated levels CXCL12have been detected in the cerebrospinal fluid of patients withLyme neuroborreliosis (48). Furthermore, CXCL12 is knownto direct dendritic cells as well as neural/glial progenitor cellsto sites of injury in the CNS (48Y50), which can stimulatetissue repair as well. Microglial cells probably represent animportant source of this chemokine in vivo. On the other hand,CXCL13 (B-cell-attracting chemokine-1 [BCA-1]) was theonly chemokine increased in monocytes but downregulated inmicroglia. This molecule has been previously associated withB. burgdorferi infection of peripheral tissues in a primatemodel of Lyme disease where it might modulate peripheralantibody-mediated responses to the spirochete (2). Moreover,CXCL13 is also a putative diagnostic marker for Lyme neu-roborreliosis (51, 52).
Microglial cells stimulated with B. burgdorferi showedprofound changes in morphology, resulting in the acquisitionof a more round cellular shape, elevated surface levels ofHLA-DR and HLA-DQ molecules, and increased secretionof IL-6 (not shown; which has also been detected at highlevels in the CNS in Lyme disease [53]). In this context,microglial cells might rapidly acquire function as antigen-presenting cells in the brain and further stimulate theinflammatory response (54, 55). Interestingly, we found thata subpopulation of microglial cells acquired expression ofCD11-c, a marker of dendritic cells that is known to interactwith a diverse repertoire of ligands, including CD23expressed by activated B-lymphocytes and blood dendritic
cells. These results mirror previous observations on imma-ture blood dendritic cells, showing that some bacterialproducts can stimulate their differentiation toward a moremature phenotype (56Y58). Maturation of microglial cellscould allow for efficient antigen presentation in the brainparenchyma, which is necessary for mounting a locallyconfined immune response against the spirochete.
We are currently investigating the relevance of thesepatterns of activation in vivo by analyzing the brains of miceinfected with a neurotropic strain of Borrelia. Interestinglyenough, CNS infection was accompanied by widespreadglial activation, together with increased TLR1 and TLR2expression (unpublished data). Future work will aim atelucidating the contribution of the TLR1/2 pathway in thepathogenesis of neuroborreliosis.
ACKNOWLEDGMENTThe authors thank Ronald Hornung for performing the
Luminex assays.
REFERENCES1. Steere AC, Coburn J, Glickstein L. The emergence of Lyme disease.
J Clin Invest 2004;113:1093Y1012. Pachner AR, Dail D, Narayan K, et al. Increased expression of
B-lymphocyte chemoattractant, but not pro-inflammatory cytokines, inmuscle tissue in rhesus chronic Lyme borreliosis. Cytokine 2002;19:297Y307
3. Isogai E, Isogai H, Kimura K, et al. Cytokines in the serum and brain inmice infected with distinct species of Lyme disease Borrelia. MicrobPathog 1996;21:413Y19
4. Aloisi F. Immune function of microglia. Glia 2001;36:165Y795. Benveniste EN. Role of macrophages/microglia in multiple sclerosis and
experimental allergic encephalomyelitis. J Mol Med 1997;75:165Y736. Iwasaki A, Medzhitov R. Toll-like receptor control of the adaptive
immune responses. Nat Immunol 2004;5:987Y957. Lien E, Sellati TJ, Yoshimura A, et al. Toll-like receptor 2 functions as
a pattern recognition receptor for diverse bacterial products. J BiolChem 1999;274:33419Y25
8. Alexopoulou L, Thomas V, Schnare M, et al. Hyporesponsiveness tovaccination with Borrelia burgdorferi OspA in humans and in TLR1-and TLR2-deficient mice. Nat Med 2002;8:878Y84
9. Takeuchi O, Sato S, Horiuchi T, et al. Cutting edge: role of Toll-likereceptor 1 in mediating immune response to microbial lipoproteins.J Immunol 2002;169:10Y14
10. Rasley A, Anguita J, Marriott I. Borrelia burgdorferi inducesinflammatory mediator production by murine microglia. J Neuro-immunol 2002;130:22Y31
11. Maric D, Maric I, Barker JL. Flow cytometric strategies to study CNSdevelopment. In: Boulton AA, Baker GB, eds. Neuromethods. Totowa,NJ: Humana, 1999:287Y318
12. Maric D, Maric I, Barker JL. Developmental changes in cell calciumhomeostasis during neurogenesis of the embryonic rat cerebral cortex.Cereb Cortex 2000;10:561Y73
13. Wu YY, Mujtaba T, Han SS, et al. Isolation of a glial-restricted tripotentialcell line from embryonic spinal cord cultures. Glia 2002;38:65Y79
14. Olson JK, Miller SD. Microglia initiate central nervous system innateand adaptive immune responses through multiple TLRs. J Immunol2004;173:3916Y24
15. Carpentier PA, Begolka WS, Olson JK, et al. Differential activation ofastrocytes by innate and adaptive immune stimuli. Glia 2005;49:360Y74
16. Haupl T, Landgraf S, Netusil P, et al. Activation of monocytes by threeOspA vaccine candidates: Lipoprotein OspA is a potent stimulator ofmonokines. FEMS Immunol Med Microbiol 1997;19:15Y23
J Neuropathol Exp Neurol � Volume 65, Number 6, June 2006 Cellular Response to Borrelia
� 2006 American Association of Neuropathologists, Inc. 547

Copyright @ 2006 by the American Association of Neuropathologists, Inc. Unauthorized reproduction of this article is prohibited.
17. Donnelly RP, Dickensheets H, Finbloom DS. The interleukin-10 signaltransduction pathway and regulation of gene expression in mononuclearphagocytes. J Interferon Cytokine Res 1999;19:563Y73
18. Perrier P, Martinez FO, Locati M, et al. Distinct transcriptionalprograms activated by interleukin-10 with or without lipopoly-saccharide in dendritic cells: Induction of the B cell-activating chemo-kine, CXC chemokine ligand 13. J Immunol 2004;172:7031Y42
19. Yee CS, Yao Y, Xu Q, et al. Enhanced production of IL-10 by dendriticcells deficient in CIITA. J Immunol 2005;174:1222Y29
20. Greter M, Heppner FL, Lemos MP, et al. Dendritic cells permit immuneinvasion of the CNS in an animal model of multiple sclerosis. Nat Med2005;11:328Y34
21. Suter T, Malipiero U, Otten L, et al. Dendritic cells and differentialusage of the MHC class II transactivator promoters in the centralnervous system in experimental autoimmune encephalitis. Eur JImmunol 2000;30:794Y802
22. McMahon EJ, Bailey SL, Castenada CV, et al. Epitope spreadinginitiates in the CNS in two mouse models of multiple sclerosis. NatMed 2005;11:335Y39
23. Akira S, Hemmi H. Recognition of pathogen-associated molecularpatterns by TLR family. Immunol Lett 2003;85:85Y95
24. Morr M, Takeuchi O, Akira S, et al. Differential recognition ofstructural details of bacterial lipopeptides by toll-like receptors. EurJ Immunol 2002;32:3337Y47
25. Bsibsi M, Ravid R, Gveric D, et al. Broad expression of Toll-likereceptors in the human central nervous system. J Neuropathol ExpNeurol 2002;61:1013Y21
26. Ebert S, Gerber J, Bader S, et al. Dose-dependent activation ofmicroglial cells by Toll-like receptor agonists alone and in combination.J Neuroimmunol 2005;159:87Y96
27. Hirschfeld M, Kirschning CJ, Schwandner R, et al. Cutting edge:inflammatory signaling by Borrelia burgdorferi lipoproteins is mediatedby toll-like receptor 2. J Immunol 1999;163:2382Y86
28. Thomas V, Fikrig E. The Lyme disease vaccine takes its toll. VectorBorne Zoonotic Dis 2002;2:217Y22
29. Wang G, Ma Y, Buyuk A, et al. Impaired host defense to infection andToll-like receptor 2-independent killing of Borrelia burgdorferi clinicalisolates in TLR2-deficient C3H/HeJ mice. FEMS Microbiol Lett 2004;231:219Y25
30. Chen ZJ, Negra M, Levine A, et al. Oligodendrocyte precursor cells:reactive cells that inhibit axon growth and regeneration. J Neurocytol2002;31:481Y95
31. Seong SY, Matzinger P. Hydrophobicity: An ancient damage-associatedmolecular pattern that initiates innate immune responses. Nat RevImmunol 2004;4:469Y78
32. Matzinger P. The danger model: A renewed sense of self. Science 2002;296:301Y305
33. Chiao JW, Pavia C, Riley M, et al. Antigens of Lyme disease ofspirochaete Borrelia burgdorferi inhibits antigen or mitogen-inducedlymphocyte proliferation. FEMS Immunol Med Microbiol 1994;8:151Y55
34. Diterich I, Rauter C, Kirschning CJ, et al. Borrelia burgdorferi-inducedtolerance as a model of persistence via immunosuppression. InfectImmun 2003;71:3979Y87
35. Noss EH, Harding CV, Boom WH. Mycobacterium tuberculosis inhibitsMHC class II antigen processing in murine bone marrow macrophages.Cell Immunol 2000;201:63Y74
36. Fortune SM, Solache A, Jaeger A, et al. Mycobacterium tuberculosisinhibits macrophage responses to IFN-gamma through myeloid differ-entiation factor 88-dependent and -independent mechanisms. J Immunol2004;172:6272Y80
37. Noss EH, Pai RK, Sellati TJ, et al. Toll-like receptor 2-dependentinhibition of macrophage class II MHC expression and antigenprocessing by 19-kDa lipoprotein of Mycobacterium tuberculosis.J Immunol 2001;167:910Y18
38. Gehring AJ, Rojas RE, Canaday DH, et al. The Mycobacteriumtuberculosis 19-kilodalton lipoprotein inhibits gamma interferon-regulated HLA-DR and Fc gamma R1 on human macrophages throughToll-like receptor 2. Infect Immun 2003;71:4487Y97
39. Montgomery RR, Nathanson MH, Malawista SE. The fate of Borreliaburgdorferi, the agent for Lyme disease, in mouse macrophages.Destruction, survival, recovery. J Immunol 1993;150:909Y15
40. Girschick HJ, Huppertz HI, Russmann H, et al. Intracellular persistenceof Borrelia burgdorferi in human synovial cells. Rheumatol Int 1996;16:125Y32
41. Klempner MS, Noring R, Rogers RA. Invasion of human skinfibroblasts by the Lyme disease spirochete, Borrelia burgdorferi.J Infect Dis 1993;167:1074Y81
42. Liang FT, Jacobs MB, Bowers LC, et al. An immune evasionmechanism for spirochetal persistence in Lyme borreliosis. J Exp Med2002;195:415Y22
43. Bubeck-Martinez S. Immune evasion of the Lyme disease spirochetes.Front Biosci 2005;10:873Y78
44. Kraiczy P, Skerka C, Kirschfink M, et al. Immune evasion of Borreliaburgdorferi: insufficient killing of the pathogens by complement andantibody. Int J Med Microbiol 2002;291(suppl 33):141Y46
45. Wolk K, Kunz S, Crompton NE, et al. Multiple mechanisms of reducedmajor histocompatibility complex class II expression in endotoxintolerance. J Biol Chem 2003;278:18030Y36
46. Jasinski M, Wieckiewicz J, Ruggiero I, et al. Isotype-specific regulation ofMHC class II gene expression in human monocytes by exogenous andendogenous tumor necrosis factor. J Clin Immunol 1995;15:185Y93
47. Kowalczyk D, Mytar B, Jasinski M, et al. Modulation of monocyteantigen-presenting capacity by tumour necrosis factor-alpha (TNF):Opposing effects of exogenous TNF before and after an antigen pulseand the role of TNF gene activation in monocytes. Immunol Lett 1995;44:51Y57
48. Pashenkov M, Teleshova N, Kouwenhoven M, et al. Recruitment ofdendritic cells to the cerebrospinal fluid in bacterial neuroinfections.J Neuroimmunol 2002;122:106Y16
49. Imitola J, Raddassi K, Park KI, et al. Directed migration of neural stemcells to sites of CNS injury by the stromal cell-derived factor1alpha/CXC chemokine receptor 4 pathway. Proc Natl Acad Sci U S A2004;101:18117Y22
50. Dziembowska M, Tham TN, Lau P, et al. A role for CXCR4 signalingin survival and migration of neural and oligodendrocyte precursors. Glia2005;50:258Y69
51. Segal BM, Logigian EL. Sublime diagnosis of Lyme neuroborreliosis.Neurology 2005;65:351Y52
52. Rupprecht TA, Pfister HW, Angele B, et al. The chemokine CXCL13(BLC): A putative diagnostic marker for neuroborreliosis. Neurology2005;65:448Y50
53. Pachner AR, Amemiya K, Delaney E, et al. Interleukin-6 is expressed athigh levels in the CNS in Lyme neuroborreliosis. Neurology 1997;49:147Y52
54. Fischer HG, Bonifas U, Reichmann G. Phenotype and functions of braindendritic cells emerging during chronic infection of mice withToxoplasma gondii. J Immunol 2000;164:4826Y34
55. Fischer HG, Reichmann G. Brain dendritic cells and macrophages/microgliain central nervous system inflammation. J Immunol 2001;166:2717Y26
56. O’Doherty U, Ignatius R, Bhardwaj N, et al. Generation of monocyte-derived dendritic cells from precursors in rhesus macaque blood.J Immunol Methods 1997;207:185Y94
57. Kokkinopoulos I, Jordan WJ, Ritter MA. Toll-like receptor mRNAexpression patterns in human dendritic cells and monocytes. MolImmunol 2005;42:957Y68
58. Suhonen J, Komi J, Soukka J, et al. Interaction between Borreliaburgdorferi and immature human dendritic cells. Scand J Immunol2003;58:67Y75
Cassiani-Ingoni et al J Neuropathol Exp Neurol � Volume 65, Number 6, June 2006
� 2006 American Association of Neuropathologists, Inc.548

Copyright @ 2006 by the American Association of Neuropathologists, Inc. Unauthorized reproduction of this article is prohibited.
Supplementary Figure 1.
J Neuropathol Exp Neurol � Volume 65, Number 6, June 2006 Cellular Response to Borrelia
� 2006 American Association of Neuropathologists, Inc. 549

Indicator-LFC-Monocyte Indicator-LFC-Microglia Number of Probe ID's Down Down 16 Down No Change 118 Down Up 3 No Change Down 40 No Change Up 46 Up No Change 121 Up Up 44 Up Down 6
Title Gene Symbol p (4 level ANOVA) LFC-MG/MC Group Homo sapiens cDNA FLJ26905 fis, clone RCT01427 --- 5.77E-08 -1.8925269 MC - 0 , MG - D Homo sapiens transcribed sequences --- 0.00124764 -0.2624357 MC - 0 , MG - D Homo sapiens LOC347025 (LOC347025), mRNA --- 0.00223043 0.17671549 MC - 0 , MG - D Homo sapiens hypothetical protein PRO2133 --- 0.00142349 0.4524973 MC - 0 , MG - D Homo sapiens cDNA FLJ13453 fis, clone PLACE1003205. --- 0.0010009 0.52696234 MC - 0 , MG - D hypothetical protein CG003 13CDNA73 0.00382702 -0.9573589 MC - 0 , MG - D ATP-binding cassette, sub-family B (MDR/TAP), member 11 ABCB11 0.00101418 0.67138969 MC - 0 , MG - D adenylate cyclase 9 ADCY9 0.00018567 -0.936658 MC - 0 , MG - D butyrobetaine (gamma), 2-oxoglutarate dioxygenase (gamma-butyrobetaine hydroxylase) 1 BBOX1 0.00204098 -0.363348 MC - 0 , MG - D chemokine binding protein 2 CCBP2 0.00303436 -0.3011484 MC - 0 , MG - D carboxylesterase 1 (monocyte/macrophage serine esterase 1) CES1 0.00359578 -0.7075256 MC - 0 , MG - D cysteine-rich protein 1 (intestinal) CRIP1 0.00002997 -1.0902271 MC - 0 , MG - D DNA segment on chromosome 12 (unique) 2489 expressed sequence D12S2489E 0.0000236 -0.9065316 MC - 0 , MG - D dipeptidase 1 (renal) DPEP1 0.00144025 -0.2877782 MC - 0 , MG - D
Table S1: Changes in gene expression in monocytes and microglia following stimulation with B. burgdorferi. Probe ID’s that met a statistical significant >2-fold change in expression were grouped by combination of logarithmic fold change (LFC) in monocytes (MC) and logarithmic fold change in microglia (MG). The top table summarizes the total number of probes identified for every group. The bottom list provides gene titles, gene symbols, statistical p-value, ratio of LFC-MG/LFC-MC and the group for each probe ID; U= up-regulated, 0= not changed, D= down-regulated. Within each group, gene symbols are listed in alphabetical order.
Copyright @ 2006 by the American Association of Neuropathologists, Inc. Unauthorized reproduction of this article is prohibited.

dipeptidylpeptidase 4 (CD26, adenosine deaminase complexing protein 2) DPP4 0.00012239 0.61719168 MC - 0 , MG - D endothelin receptor type A EDNRA 0.00270664 0.36550132 MC - 0 , MG - D family with sequence similarity 12, member A FAM12A 0.00080059 -0.3290031 MC - 0 , MG - D fibroblast growth factor receptor substrate 3 FRS3 0.00281435 -0.1063258 MC - 0 , MG - D glycophorin A (includes MN blood group) GYPA 0.00023914 0.30289671 MC - 0 , MG - D hydroxysteroid (17-beta) dehydrogenase 2 HSD17B2 0.00106545 0.45183952 MC - 0 , MG - D insulin-like growth factor 1 (somatomedin C) IGF1 0.00017283 1.33917402 MC - 0 , MG - D immunoglobulin lambda joining 3 IGLJ3 0.00000105 -1.4623561 MC - 0 , MG - D IGF-II mRNA-binding protein 2 IMP-2 0.00245742 -0.405917 MC - 0 , MG - D iroquois homeobox protein 5 IRX5 0.00273676 0.19569992 MC - 0 , MG - D integrin, alpha 4 (antigen CD49D, alpha 4 subunit of VLA-4 receptor) ITGA4 0.00002033 -1.1204005 MC - 0 , MG - D KIAA1102 protein KIAA1102 0.00162067 0.60484403 MC - 0 , MG - D lysosomal apyrase-like protein 1 LALP1 0.00317948 -0.283572 MC - 0 , MG - D lymphoid enhancer-binding factor 1 LEF1 0.00242489 0.43711777 MC - 0 , MG - D melanoma antigen, family A, 12 MAGEA12 0.00362535 -0.3257423 MC - 0 , MG - D myelin-associated oligodendrocyte basic protein MOBP 0.00242143 -0.1000405 MC - 0 , MG - D nucleosome assembly protein 1-like 2 NAP1L2 0.00140177 -0.3218116 MC - 0 , MG - D nuclear receptor subfamily 2, group E, member 1 NR2E1 0.0025455 0.04299233 MC - 0 , MG - D pellino homolog 2 (Drosophila) PELI2 0.00184669 -0.7165658 MC - 0 , MG - D placenta-specific 4 PLAC4 0.00002923 0.18340446 MC - 0 , MG - D perforin 1 (pore forming protein) PRF1 0.00192071 -0.6567171 MC - 0 , MG - D regulator of G-protein signalling 1 RGS1 0.0013057 1.06587441 MC - 0 , MG - D ring finger protein 128 RNF128 0.00268006 0.6826285 MC - 0 , MG - D solute carrier family 22 (organic cation transporter), member 17 SLC22A17 0.00101243 0.54067803 MC - 0 , MG - D T-cell leukemia/lymphoma 6 TCL6 0.00047069 0.35985764 MC - 0 , MG - D T cell receptor gamma locus TRG@ 0.00037555 -0.6064981 MC - 0 , MG - D Homo sapiens, clone IMAGE:5728597, mRNA --- 0.00021749 -0.7913305 MC - 0 , MG - U Homo sapiens clone H2-38 anti-oxidized LDL immunoglobulin light chain Fab mRNA --- 0.00007701 -1.4066914 MC - 0 , MG - U Homo sapiens hypothetical protein FLJ20234 --- 0.00005165 -1.057876 MC - 0 , MG - U HBG_HUMAN Hemoglobin gamma-A and gamma-G chains --- 0.00064235 -0.5437002 MC - 0 , MG - U Homo sapiens cDNA: FLJ20908 fis, clone ADSE00417 --- 0.00310798 0.67062164 MC - 0 , MG - U Homo sapiens hypothetical protein FLJ11267 [Homo sapiens] --- 0.00026127 -0.4094819 MC - 0 , MG - U B-cell CLL/lymphoma 7C BCL7C 0.00356744 -0.6335339 MC - 0 , MG - U chromosome 16 open reading frame 7 C16orf7 0.00125466 -0.2918126 MC - 0 , MG - U complement component 1, q subcomponent, beta polypeptide C1QB 0.0000338 1.4741688 MC - 0 , MG - U cyclin D1 (PRAD1: parathyroid adenomatosis 1) CCND1 0.00383324 0.86063086 MC - 0 , MG - U
Copyright @ 2006 by the American Association of Neuropathologists, Inc. Unauthorized reproduction of this article is prohibited

CD2 antigen (cytoplasmic tail) binding protein 2 CD2BP2 0.00157699 -0.3241037 MC - 0 , MG - U clathrin, heavy polypeptide (Hc) CLTC 0.00363635 -0.4520574 MC - 0 , MG - U crystallin, mu CRYM 0.00202517 -0.3425332 MC - 0 , MG - U chemokine (C-X-C motif) ligand 12 (stromal cell-derived factor 1) CXCL12 0.00264491 0.43812887 MC - 0 , MG - U chemokine (C-X-C motif) ligand 12 (stromal cell-derived factor 1) CXCL12 0.00010199 1.37352859 MC - 0 , MG - U hypothetical protein, estradiol-induced E2IG4 0.00151878 0.69637916 MC - 0 , MG - U EH-domain containing 1 EHD1 0.00134252 -0.2066672 MC - 0 , MG - U eukaryotic translation initiation factor 4A, isoform 1 EIF4A1 0.00154031 -0.3352194 MC - 0 , MG - U fibroblast growth factor 18 FGF18 0.00256249 0.02294072 MC - 0 , MG - U hypothetical protein FLJ35827 FLJ35827 0.00105274 -0.537032 MC - 0 , MG - U forkhead box M1 FOXM1 0.00038078 0.57195419 MC - 0 , MG - U G protein-coupled receptor kinase 6 GPRK6 0.00069154 -0.3804376 MC - 0 , MG - U KIAA0233 gene product KIAA0233 0.00035295 -0.5874706 MC - 0 , MG - U KIAA0540 protein KIAA0540 0.00049592 -1.0447935 MC - 0 , MG - U KIAA0763 gene product KIAA0763 0.00022611 -0.5718674 MC - 0 , MG - U KIAA0889 protein KIAA0889 0.00005049 -0.4926285 MC - 0 , MG - U kinesin family member 25 KIF25 0.00365427 0.05330912 MC - 0 , MG - U midkine (neurite growth-promoting factor 2) MDK 0.00335583 0.47087534 MC - 0 , MG - U hypothetical protein MGC29643 MGC29643 0.00195104 0.49633509 MC - 0 , MG - U nuclear factor of kappa light polypeptide gene enhancer in B-cells 2 (p49/p100) NFKB2 0.00187274 -0.699882 MC - 0 , MG - U nuclear factor of kappa light polypeptide gene enhancer in B-cells inhibitor, alpha NFKBIA 0.00120989 -0.2089059 MC - 0 , MG - U HCV NS3-transactivated protein 2 NS3TP2 0.00000956 1.3889657 MC - 0 , MG - U phosphodiesterase 9A PDE9A 0.00014411 0.91583536 MC - 0 , MG - U protein kinase C substrate 80K-H PRKCSH 0.00391104 -0.6586338 MC - 0 , MG - U proteasome (prosome, macropain) subunit, beta type, 8 PSMB8 0.00347777 -0.5075843 MC - 0 , MG - U polymerase I and transcript release factor PTRF 0.00001734 0.83480728 MC - 0 , MG - U RNA binding motif protein 10 RBM10 0.00010017 -0.4896896 MC - 0 , MG - U RuvB-like 1 (E. coli) RUVBL1 0.00356509 -0.4197543 MC - 0 , MG - U serum amyloid A2 SAA2 0.00065689 0.67805246 MC - 0 , MG - U SH3-domain binding protein 5 (BTK-associated) SH3BP5 0.00384229 -0.4713608 MC - 0 , MG - U solute carrier family 21 (organic anion transporter), member 11 SLC21A11 0.00083613 -0.9462162 MC - 0 , MG - U solute carrier family 25 (mitochondrial carrier: glutamate), member 22 SLC25A22 0.00190172 -0.3400105 MC - 0 , MG - U solute carrier family 35, member E1 SLC35E1 0.00388026 -0.4350679 MC - 0 , MG - U tuberous sclerosis 2 TSC2 0.00346356 -0.4842111 MC - 0 , MG - U vacuolar protein sorting 45A (yeast) VPS45A 0.00007307 0.27090742 MC - 0 , MG - U zyxin ZYX 0.00184693 -0.6202371 MC - 0 , MG - U
Copyright @ 2006 by the American Association of Neuropathologists, Inc. Unauthorized reproduction of this article is prohibited

Homo sapiens EST from clone 898903, full insert --- 0.00083509 -0.4460085 MC - D , MG - 0 Homo sapiens clone RI-34 thyroid peroxidase autoantibody variable region mRNA --- 0.00066272 -1.2232206 MC - D , MG - 0 Human unidentified mRNA, partial sequence. --- 0.00273167 -0.0843948 MC - D , MG - 0 alpha-2-macroglobulin A2M 0.00004144 1.18826268 MC - D , MG - 0 ATP-binding cassette, sub-family B (MDR/TAP), member 1 ABCB1 0.00009355 1.19749071 MC - D , MG - 0 ATP-binding cassette, sub-family C (CFTR/MRP), member 5 ABCC5 0.00178395 0.2596241 MC - D , MG - 0 ATP-binding cassette, sub-family G (WHITE), member 2 ABCG2 0.0024482 0.54483994 MC - D , MG - 0 asparaginase like 1 ASRGL1 0.00171947 -0.4322621 MC - D , MG - 0 5-aminoimidazole-4-carboxamide ribonucleotide formyltransferase/IMP cyclohydrolase ATIC 0.00115125 0.41603815 MC - D , MG - 0 ATPase, Na+/K+ transporting, beta 1 polypeptide ATP1B1 0.00023958 0.69941947 MC - D , MG - 0 ATPase, Na+/K+ transporting, beta 1 polypeptide ATP1B1 0.00001282 1.0280713 MC - D , MG - 0 AXL receptor tyrosine kinase AXL 0.00075057 0.5656772 MC - D , MG - 0 BAI1-associated protein 2 BAIAP2 0.00012535 0.39766611 MC - D , MG - 0 branched chain keto acid dehydrogenase E1, beta polypeptide (maple syrup urine disease) BCKDHB 0.00044974 0.38332908 MC - D , MG - 0 bullous pemphigoid antigen 1, 230/240kDa BPAG1 0.0028081 0.81986038 MC - D , MG - 0 CD74(invariant polypeptide, major histocompatibility complex, class II antigen-associated) CD74 0.00126423 -0.5571805 MC - D , MG - 0 CDW52 antigen (CAMPATH-1 antigen) CDW52 0.00008905 -1.5959293 MC - D , MG - 0 Charot-Leyden crystal protein CLC 9.96E-07 -2.0036492 MC - D , MG - 0 C-type lectin, superfamily member 13 (macrophage-derived) CLECSF13 0.00119258 -1.174893 MC - D , MG - 0 cysteine and glycine-rich protein 2 CSRP2 0.00003886 0.95015396 MC - D , MG - 0 CTP synthase CTPS 0.0002089 0.47409046 MC - D , MG - 0 chemokine (C-X3-C motif) receptor 1 CX3CR1 0.00193959 -0.9714056 MC - D , MG - 0 drebrin 1 DBN1 0.00107301 0.66167499 MC - D , MG - 0 D component of complement (adipsin) DF 0.00069455 -0.65679 MC - D , MG - 0 hepatitis delta antigen-interacting protein A DIPA 0.00127472 0.73347556 MC - D , MG - 0 docking protein 4 DOK4 0.00176188 0.16572436 MC - D , MG - 0 epidermal growth factor receptor (erythroblastic leukemia viral (v-erb-b) EGFR 0.0002336 0.55179266 MC - D , MG - 0 endothelial PAS domain protein 1 EPAS1 0.00018165 0.55391817 MC - D , MG - 0 epidermal growth factor receptor pathway substrate 8 EPS8 0.00149318 0.73358286 MC - D , MG - 0 FERM, RhoGEF (ARHGEF) and pleckstrin domain protein 1 (chondrocyte-derived) FARP1 0.00026315 0.91725336 MC - D , MG - 0 FERM, RhoGEF (ARHGEF) and pleckstrin domain protein 1 (chondrocyte-derived) FARP1 0.00013907 0.90789784 MC - D , MG - 0 fructose-1,6-bisphosphatase 1 FBP1 0.00003446 -0.9816397 MC - D , MG - 0 ficolin (collagen/fibrinogen domain containing) 1 FCN1 1.09E-07 -1.6948655 MC - D , MG - 0 hypothetical protein FLJ12584 FLJ12584 0.00016926 0.76155532 MC - D , MG - 0 hypothetical protein FLJ13110 FLJ13110 0.00041381 0.5047645 MC - D , MG - 0 putative NFkB activating protein 373 FLJ23091 0.00025278 0.66994303 MC - D , MG - 0
Copyright @ 2006 by the American Association of Neuropathologists, Inc. Unauthorized reproduction of this article is prohibited

growth associated protein 43 GAP43 0.00016401 0.64969693 MC - D , MG - 0 glutamate-cysteine ligase, catalytic subunit GCLC 0.00045229 0.57320674 MC - D , MG - 0 glutamate-cysteine ligase, catalytic subunit GCLC 0.00027678 0.83635581 MC - D , MG - 0 guanine nucleotide binding protein (G protein), gamma 11 GNG11 0.00251442 0.64584694 MC - D , MG - 0 G protein-coupled receptor 126 GPR126 0.00257959 0.55037728 MC - D , MG - 0 G protein-coupled receptor, family C, group 5, member B GPRC5B 0.00038876 0.54816618 MC - D , MG - 0 L-3-hydroxyacyl-Coenzyme A dehydrogenase, short chain HADHSC 0.00369993 0.49140299 MC - D , MG - 0 hemoglobin, alpha 1 HBA1 0.00000263 -2.0788735 MC - D , MG - 0 hemoglobin, alpha 1 HBA1 0.00000727 -1.8058066 MC - D , MG - 0 hemoglobin, alpha 1 HBA1 6.37E-07 -2.0543247 MC - D , MG - 0 hemoglobin, alpha 1 HBA1 1.53E-07 -1.8670227 MC - D , MG - 0 hemoglobin, beta HBB 0.00000177 -2.3228371 MC - D , MG - 0 hemoglobin, beta HBB 0.00000503 -1.7427576 MC - D , MG - 0 major histocompatibility complex, class II, DM alpha HLA-DMA 0.00320966 -0.5025173 MC - D , MG - 0 major histocompatibility complex, class II, DP alpha 1 HLA-DPA1 0.00321274 -0.7189745 MC - D , MG - 0 major histocompatibility complex, class II, DP alpha 1 HLA-DPA1 0.00004911 -0.9541136 MC - D , MG - 0 major histocompatibility complex, class II, DP beta 1 HLA-DPB1 0.00001204 -0.8336442 MC - D , MG - 0 major histocompatibility complex, class II, DQ alpha 1 HLA-DQA1 0.00292942 -1.1884326 MC - D , MG - 0 major histocompatibility complex, class II, DQ alpha 1 HLA-DQA1 0.00028943 -1.3890141 MC - D , MG - 0 major histocompatibility complex, class II, DQ beta 1 HLA-DQB1 0.00166327 -1.081308 MC - D , MG - 0 major histocompatibility complex, class II, DQ beta 1 HLA-DQB1 5.01E-08 -1.124174 MC - D , MG - 0 major histocompatibility complex, class II, DQ beta 1 HLA-DQB1 0.00179703 -0.7402938 MC - D , MG - 0 major histocompatibility complex, class II, DQ beta 2 HLA-DQB2 0.000121 -1.3134924 MC - D , MG - 0 major histocompatibility complex, class II, DR beta 3 HLA-DRB3 0.00003015 -0.8961618 MC - D , MG - 0 major histocompatibility complex, class II, DR beta 3 HLA-DRB3 0.0002507 -0.9170904 MC - D , MG - 0 major histocompatibility complex, class II, DR beta 3 HLA-DRB3 0.00009957 -1.034621 MC - D , MG - 0 major histocompatibility complex, class II, DR beta 3 HLA-DRB3 0.00007592 -1.1655578 MC - D , MG - 0 major histocompatibility complex, class II, DR beta 3 HLA-DRB3 0.00050215 -0.8284418 MC - D , MG - 0 hydroxymethylbilane synthase HMBS 0.00201883 -0.1974628 MC - D , MG - 0 heparan sulfate (glucosamine) 3-O-sulfotransferase 2 HS3ST2 0.00024689 -0.3728932 MC - D , MG - 0 immunoglobulin heavy constant gamma 3 (G3m marker) IGHG3 0.00000656 -2.254905 MC - D , MG - 0 immunoglobulin lambda locus IGL@ 3.71E-07 -1.8015584 MC - D , MG - 0 immunoglobulin lambda joining 3 IGLJ3 6.55E-08 -2.3831532 MC - D , MG - 0 immunoglobulin superfamily, member 4 IGSF4 0.00129754 1.1719131 MC - D , MG - 0 interleukin 13 receptor, alpha 2 IL13RA2 0.00054932 0.90714185 MC - D , MG - 0 IGF-II mRNA-binding protein 3 IMP-3 0.00027253 1.10748446 MC - D , MG - 0
Copyright @ 2006 by the American Association of Neuropathologists, Inc. Unauthorized reproduction of this article is prohibited

inositol polyphosphate-4-phosphatase, type II, 105kDa INPP4B 0.00294067 0.52133834 MC - D , MG - 0 potassium large conductance calcium-activated channel, subfamily M, alpha member 1 KCNMA1 0.00007182 0.89168592 MC - D , MG - 0 KH domain containing, RNA binding, signal transduction associated 3 KHDRBS3 0.00116987 0.7316471 MC - D , MG - 0 kinesin family member 23 KIF23 0.00343644 0.59062205 MC - D , MG - 0 leptin (obesity homolog, mouse) LEP 0.00048745 -0.8169255 MC - D , MG - 0 legumain LGMN 0.0010821 0.54250872 MC - D , MG - 0 lipase A, lysosomal acid, cholesterol esterase (Wolman disease) LIPA 0.00188557 0.38102183 MC - D , MG - 0 lymphocyte antigen 9 LY9 0.00212935 -0.464366 MC - D , MG - 0 hypothetical protein MAC30 MAC30 0.00267682 0.63759511 MC - D , MG - 0 mitogen-activated protein kinase kinase kinase kinase 1 MAP4K1 0.00219993 -0.4075711 MC - D , MG - 0 MADS box transcription enhancer factor 2, polypeptide C (myocyte enhancer factor 2C) MEF2C 0.00044431 0.38502338 MC - D , MG - 0 esophageal cancer associated protein MGC16824 0.00056605 0.49670462 MC - D , MG - 0 microsomal glutathione S-transferase 2 MGST2 0.00022408 0.59164542 MC - D , MG - 0 MHC class II transactivator MHC2TA 0.00029127 -0.4886218 MC - D , MG - 0 myeloid leukemia factor 1 MLF1 0.00008063 1.28468229 MC - D , MG - 0 mannose receptor, C type 1 MRC1 0.00001443 0.84720277 MC - D , MG - 0 mannose receptor, C type 2 MRC2 0.00012139 0.97113259 MC - D , MG - 0 membrane-spanning 4-domains, subfamily A, member 3 (hematopoietic cell-specific) MS4A3 0.00219203 -0.9375864 MC - D , MG - 0 neurofilament, heavy polypeptide 200kDa NEFH 0.00246112 0.98372453 MC - D , MG - 0 prostatic binding protein PBP 0.00303582 0.59778247 MC - D , MG - 0 phytanoyl-CoA hydroxylase (Refsum disease) PHYH 0.00200378 0.28544344 MC - D , MG - 0 polycystic kidney disease 2-like 1 PKD2L1 6.64E-07 0.66922238 MC - D , MG - 0 paraoxonase 2 PON2 0.00055905 0.67970881 MC - D , MG - 0 POU domain, class 2, associating factor 1 POU2AF1 0.00087823 -0.9192306 MC - D , MG - 0 phosphatidic acid phosphatase type 2B PPAP2B 0.00162568 -0.7505307 MC - D , MG - 0 protein kinase, cAMP-dependent, catalytic, beta PRKACB 0.00193854 0.12563276 MC - D , MG - 0 pleiotrophin (heparin binding growth factor 8, neurite growth-promoting factor 1) PTN 0.00109669 1.06909054 MC - D , MG - 0 quinolinate phosphoribosyltransferase (nicotinate-nucleotide pyrophosphorylase QPRT 0.0000229 1.54134661 MC - D , MG - 0 NADP-dependent retinol dehydrogenase/reductase RDHL 0.00115596 -0.1956371 MC - D , MG - 0 ribonuclease P1 RNASEP1 0.00113459 0.33944913 MC - D , MG - 0 sterile alpha motif domain containing 4 SAMD4 0.00000691 0.94540944 MC - D , MG - 0 sterile alpha motif domain containing 4 SAMD4 0.00039786 0.50779695 MC - D , MG - 0 stromal cell-derived factor 2-like 1 SDF2L1 0.00181154 -0.4470649 MC - D , MG - 0 semaphorin 4F SEMA4F 0.00276847 0.29085484 MC - D , MG - 0 selenoprotein P, plasma, 1 SEPP1 0.00002574 0.94246322 MC - D , MG - 0 serine (or cysteine) proteinase inhibitor, clade E nexin, plasminogen activator inhibitor 1 SERPINE1 0.00284799 0.76988111 MC - D , MG - 0
Copyright @ 2006 by the American Association of Neuropathologists, Inc. Unauthorized reproduction of this article is prohibited

sialic acid binding Ig-like lectin 8 SIGLEC8 0.0013343 1.32699491 MC - D , MG - 0 solute carrier family 25 (mitochondrial carrier; adenine nucleotide translocator) SLC25A5 0.00150383 0.38911873 MC - D , MG - 0 solute carrier family 28 (sodium-coupled nucleoside transporter), member 1 SLC28A1 0.00135938 0.17047844 MC - D , MG - 0 SMP3 mannosyltransferase SMP3 0.00080391 -0.1115424 MC - D , MG - 0 sorting nexin 7 SNX7 0.00240239 0.7611859 MC - D , MG - 0 stathmin 1/oncoprotein 18 STMN1 0.00036079 0.46107042 MC - D , MG - 0 sulfotransferase family, cytosolic, 1C, member 1 SULT1C1 0.00059207 1.04104201 MC - D , MG - 0 translocase of inner mitochondrial membrane 17 homolog A (yeast) TIMM17A 0.0001912 0.34464466 MC - D , MG - 0 transmembrane 4 superfamily member 10 TM4SF10 0.00012343 0.894098 MC - D , MG - 0 class I cytokine receptor WSX1 0.00074872 -1.2311147 MC - D , MG - 0 ankylosis, progressive homolog (mouse) ANKH 0.0015023 -0.1800579 MC - D , MG - D CDW52 antigen (CAMPATH-1 antigen) CDW52 0.00065473 -1.5468382 MC - D , MG - D coronin, actin binding protein, 2B CORO2B 0.00106216 0.38355254 MC - D , MG - D hypothetical protein FLJ20581 FLJ20581 0.00002679 1.35551729 MC - D , MG - D growth hormone 1 GH1 0.00092771 -0.0719208 MC - D , MG - D hemoglobin, alpha 1 HBA1 0.00000153 -2.4681509 MC - D , MG - D chromosome condensation protein G HCAP-G 0.00255094 0.60730403 MC - D , MG - D major histocompatibility complex, class II, DQ beta 1 HLA-DQB1 0.00131574 -1.157595 MC - D , MG - D major histocompatibility complex, class II, DQ beta 1 HLA-DQB1 0.00067709 -1.1507943 MC - D , MG - D hypothetical protein MGC27165 MGC27165 1.07E-07 -2.5482453 MC - D , MG - D macrophage scavenger receptor 1 MSR1 0.00010479 1.37976655 MC - D , MG - D phosphodiesterase 11A PDE11A 0.00229325 0.31496629 MC - D , MG - D prostaglandin D2 synthase, hematopoietic PGDS 0.00045056 1.12957094 MC - D , MG - D Rho-related BTB domain containing 1 RHOBTB1 0.00004196 1.08168333 MC - D , MG - D triggering receptor expressed on myeloid cells 2 TREM2 0.0002362 0.81373836 MC - D , MG - D tripartite motif-containing 2 TRIM2 0.00153486 0.24175799 MC - D , MG - D Fc fragment of IgE, high affinity I, receptor for; alpha polypeptide FCER1A 0.00003549 -1.2741277 MC - D , MG - U interleukin 1 receptor, type II IL1R2 0.00007644 -1.0578372 MC - D , MG - U syndecan 1 SDC1 0.00000294 0.83295653 MC - D , MG - U Homo sapiens transcribed sequences --- 0.00152295 0.36744648 MC - U , MG - 0 Homo sapiens mRNA, chromosome 1 specific transcript KIAA0500. --- 0.00050032 -0.9964484 MC - U , MG - 0 actin, alpha 2, smooth muscle, aorta ACTA2 0.00012457 0.34395204 MC - U , MG - 0 a disintegrin and metalloproteinase domain 28 ADAM28 0.00003769 0.59891417 MC - U , MG - 0 adenylate kinase 3 AK3 0.00101091 -0.720284 MC - U , MG - 0 adenylate kinase 3 AK3 0.00044206 -0.7927381 MC - U , MG - 0 aldolase C, fructose-bisphosphate ALDOC 0.00297454 -0.6499269 MC - U , MG - 0
Copyright @ 2006 by the American Association of Neuropathologists, Inc. Unauthorized reproduction of this article is prohibited
alanyl aminopeptidase ANPEP 0.0011957 -0.9233053 MC - U , MG - 0 arginase, type II ARG2 0.00006877 1.0932315 MC - U , MG - 0 activating transcription factor 5 ATF5 0.00023312 -0.4814143 MC - U , MG - 0 activating transcription factor 5 ATF5 0.00106797 -0.6859113 MC - U , MG - 0 B-cell CLL/lymphoma 3 BCL3 0.00049325 -0.2971643 MC - U , MG - 0 BRAF35/HDAC2 complex (80 kDa) BHC80 0.00077054 -0.2110392 MC - U , MG - 0 complement component 1, q subcomponent, receptor 1 C1QR1 0.00003273 -0.46027 MC - U , MG - 0 complement component 3 C3 0.00013626 1.51708461 MC - U , MG - 0 caldesmon 1 CALD1 0.00093446 0.9220844 MC - U , MG - 0 caveolin 1, caveolae protein, 22kDa CAV1 0.00068232 1.20962279 MC - U , MG - 0 chemokine (C-C motif) receptor 2 CCR2 0.00020548 -1.3123286 MC - U , MG - 0 chemokine (C-C motif) receptor 2 CCR2 0.00100727 -0.6014681 MC - U , MG - 0 CD44 antigen (homing function and Indian blood group system) CD44 0.00346497 -0.4458147 MC - U , MG - 0 cytidine deaminase CDA 0.00124354 -1.0488606 MC - U , MG - 0 CDC42 effector protein (Rho GTPase binding) 2 CDC42EP2 0.00066419 0.00462243 MC - U , MG - 0 CASP8 and FADD-like apoptosis regulator CFLAR 0.00220795 -0.268824 MC - U , MG - 0 CASP8 and FADD-like apoptosis regulator CFLAR 0.0009442 -0.3166975 MC - U , MG - 0 chloride channel 4 CLCN4 0.00014916 0.97496512 MC - U , MG - 0 chondroitin sulfate proteoglycan 2 (versican) CSPG2 0.00250936 -1.1595098 MC - U , MG - 0 chondroitin sulfate proteoglycan 2 (versican) CSPG2 0.00141785 -1.1723074 MC - U , MG - 0 chondroitin sulfate proteoglycan 2 (versican) CSPG2 0.00306579 -1.3703968 MC - U , MG - 0 chondroitin sulfate proteoglycan 2 (versican) CSPG2 0.00206361 -1.3315782 MC - U , MG - 0 cytochrome P450, family 39, subfamily A, polypeptide 1 CYP39A1 0.0003926 0.66839941 MC - U , MG - 0 hypothetical protein DKFZp434K1210 DKFZp434K1210 0.00098444 -1.0419332 MC - U , MG - 0 dickkopf homolog 3 (Xenopus laevis) DKK3 0.00366536 1.24326897 MC - U , MG - 0 dystrobrevin, beta DTNB 0.0004933 0.44024475 MC - U , MG - 0 diphtheria toxin receptor (heparin-binding epidermal growth factor-like growth factor) DTR 0.00007857 0.52743071 MC - U , MG - 0 endothelin receptor type B EDNRB 0.00000274 0.79918756 MC - U , MG - 0 endothelin receptor type B EDNRB 0.00232521 0.36720145 MC - U , MG - 0 likely ortholog of mouse embryonic epithelial gene 1 EEG1 0.0002572 -0.5319741 MC - U , MG - 0 ephrin-B2 EFNB2 0.00000485 0.81393085 MC - U , MG - 0 ERO1-like (S. cerevisiae) ERO1L 0.0031406 -0.1339116 MC - U , MG - 0 ets variant gene 5 (ets-related molecule) ETV5 0.00000322 0.69454289 MC - U , MG - 0 Fc fragment of IgA, receptor for FCAR 0.00357775 -0.6842739 MC - U , MG - 0 hypothetical protein FLJ10539 FLJ10539 0.0026246 0.83799807 MC - U , MG - 0 hypothetical protein FLJ12377 FLJ12377 0.00066297 0.6321724 MC - U , MG - 0
Copyright @ 2006 by the American Association of Neuropathologists, Inc. Unauthorized reproduction of this article is prohibited

hypothetical protein FLJ20701 FLJ20701 0.00012272 -1.5462029 MC - U , MG - 0 formyl peptide receptor-like 1 FPRL1 0.00245971 -0.4136035 MC - U , MG - 0 GABA(A) receptors associated protein like 3 GABARAPL3 0.00223779 0.21178371 MC - U , MG - 0 beta-galactose-3-O-sulfotransferase, 4 GAL3ST-4 0.00000837 1.4192731 MC - U , MG - 0 glycerol kinase GK 0.00244286 -0.0756302 MC - U , MG - 0 guanine nucleotide binding protein (G protein), alpha 15 (Gq class) GNA15 0.00021285 -0.2907258 MC - U , MG - 0 glutamate receptor, metabotropic 1 GRM1 0.00218037 0.43597237 MC - U , MG - 0 glycogen synthase 1 (muscle) GYS1 0.00063712 -0.310931 MC - U , MG - 0 heat shock 70kDa protein 6 (HSP70B') HSPA6 0.00026722 -0.6870426 MC - U , MG - 0 inhibitor of kappa light polypeptide gene enhancer in B-cells, kinase epsilon IKBKE 0.00114791 -0.1024103 MC - U , MG - 0 inhibitor of growth family, member 1 ING1 0.00028653 0.60583117 MC - U , MG - 0 integrin, b 1 (fibronectin receptor, beta polypeptide, antigen CD29 includes MDF2, MSK12) ITGB1 0.00357137 0.19303287 MC - U , MG - 0 jagged 1 (Alagille syndrome) JAG1 0.00022281 0.52813634 MC - U , MG - 0 potassium inwardly-rectifying channel, subfamily J, member 15 KCNJ15 0.0003342 -0.7933123 MC - U , MG - 0 potassium inwardly-rectifying channel, subfamily J, member 15 KCNJ15 0.00005539 -0.5164348 MC - U , MG - 0 KIAA0876 protein KIAA0876 0.00126027 -0.6916524 MC - U , MG - 0 kinesin family member 20A KIF20A 0.00001589 0.8607011 MC - U , MG - 0 laminin, beta 3 LAMB3 0.00256245 -0.1007989 MC - U , MG - 0 laminin, gamma 1 (formerly LAMB2) LAMC1 0.00003745 0.50804747 MC - U , MG - 0 lysosomal-associated membrane protein 3 LAMP3 0.00383632 -0.8962456 MC - U , MG - 0 lymphocyte cytosolic protein 1 (L-plastin) LCP1 0.0014927 -0.4562166 MC - U , MG - 0 leukocyte immunoglobulin-like receptor, subfamily B (with TM and ITIM domains), member 1 LILRB1 0.00124016 -0.570694 MC - U , MG - 0 leukocyte immunoglobulin-like receptor, subfamily B (with TM and ITIM domains), member 1 LILRB1 0.00136991 -0.5786955 MC - U , MG - 0 leukocyte Ig-like receptor 9 LIR9 0.00021564 -0.4606308 MC - U , MG - 0 stromal cell protein LOC55974 0.00098503 -0.1458599 MC - U , MG - 0 monoamine oxidase A MAOA 0.00187775 0.9726867 MC - U , MG - 0 monoamine oxidase A MAOA 0.00393337 0.94602773 MC - U , MG - 0 c-mer proto-oncogene tyrosine kinase MERTK 0.0031174 0.51695584 MC - U , MG - 0 met proto-oncogene (hepatocyte growth factor receptor) MET 0.00008193 0.05221977 MC - U , MG - 0 hypothetical protein MGC25062 MGC25062 0.00316572 1.34979502 MC - U , MG - 0 macrophage migration inhibitory factor (glycosylation-inhibiting factor) MIF 0.00085617 -0.5414905 MC - U , MG - 0 mitochondrial solute carrier protein MSCP 0.00154317 -0.3359498 MC - U , MG - 0 NACHT, LRR and PYD containing protein 2 NALP2 0.00057339 0.81998927 MC - U , MG - 0 N-myc downstream regulated gene 1 NDRG1 0.00009923 -0.5979941 MC - U , MG - 0 neurofibromin 1 (neurofibromatosis, von Recklinghausen disease, Watson disease) NF1 0.00157104 0.28951944 MC - U , MG - 0 nuclear receptor subfamily 2, group F, member 2 NR2F2 0.0031759 0.78418293 MC - U , MG - 0
Copyright @ 2006 by the American Association of Neuropathologists, Inc. Unauthorized reproduction of this article is prohibited
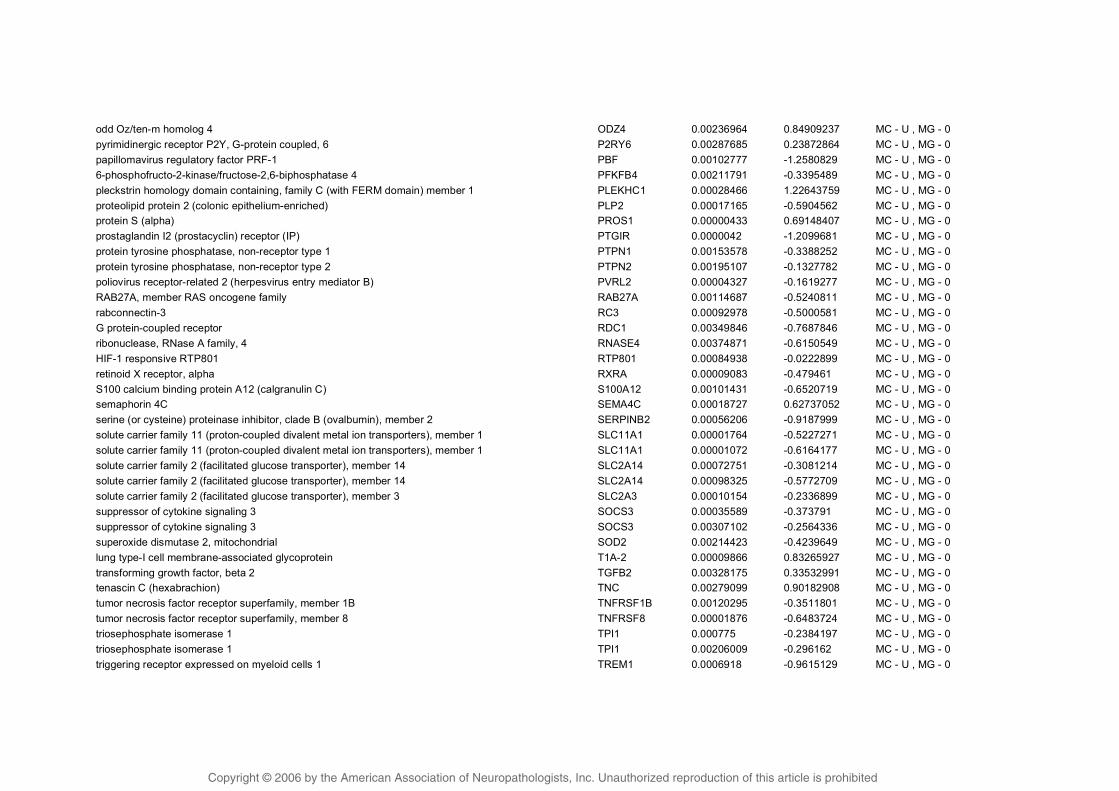
odd Oz/ten-m homolog 4 ODZ4 0.00236964 0.84909237 MC - U , MG - 0 pyrimidinergic receptor P2Y, G-protein coupled, 6 P2RY6 0.00287685 0.23872864 MC - U , MG - 0 papillomavirus regulatory factor PRF-1 PBF 0.00102777 -1.2580829 MC - U , MG - 0 6-phosphofructo-2-kinase/fructose-2,6-biphosphatase 4 PFKFB4 0.00211791 -0.3395489 MC - U , MG - 0 pleckstrin homology domain containing, family C (with FERM domain) member 1 PLEKHC1 0.00028466 1.22643759 MC - U , MG - 0 proteolipid protein 2 (colonic epithelium-enriched) PLP2 0.00017165 -0.5904562 MC - U , MG - 0 protein S (alpha) PROS1 0.00000433 0.69148407 MC - U , MG - 0 prostaglandin I2 (prostacyclin) receptor (IP) PTGIR 0.0000042 -1.2099681 MC - U , MG - 0 protein tyrosine phosphatase, non-receptor type 1 PTPN1 0.00153578 -0.3388252 MC - U , MG - 0 protein tyrosine phosphatase, non-receptor type 2 PTPN2 0.00195107 -0.1327782 MC - U , MG - 0 poliovirus receptor-related 2 (herpesvirus entry mediator B) PVRL2 0.00004327 -0.1619277 MC - U , MG - 0 RAB27A, member RAS oncogene family RAB27A 0.00114687 -0.5240811 MC - U , MG - 0 rabconnectin-3 RC3 0.00092978 -0.5000581 MC - U , MG - 0 G protein-coupled receptor RDC1 0.00349846 -0.7687846 MC - U , MG - 0 ribonuclease, RNase A family, 4 RNASE4 0.00374871 -0.6150549 MC - U , MG - 0 HIF-1 responsive RTP801 RTP801 0.00084938 -0.0222899 MC - U , MG - 0 retinoid X receptor, alpha RXRA 0.00009083 -0.479461 MC - U , MG - 0 S100 calcium binding protein A12 (calgranulin C) S100A12 0.00101431 -0.6520719 MC - U , MG - 0 semaphorin 4C SEMA4C 0.00018727 0.62737052 MC - U , MG - 0 serine (or cysteine) proteinase inhibitor, clade B (ovalbumin), member 2 SERPINB2 0.00056206 -0.9187999 MC - U , MG - 0 solute carrier family 11 (proton-coupled divalent metal ion transporters), member 1 SLC11A1 0.00001764 -0.5227271 MC - U , MG - 0 solute carrier family 11 (proton-coupled divalent metal ion transporters), member 1 SLC11A1 0.00001072 -0.6164177 MC - U , MG - 0 solute carrier family 2 (facilitated glucose transporter), member 14 SLC2A14 0.00072751 -0.3081214 MC - U , MG - 0 solute carrier family 2 (facilitated glucose transporter), member 14 SLC2A14 0.00098325 -0.5772709 MC - U , MG - 0 solute carrier family 2 (facilitated glucose transporter), member 3 SLC2A3 0.00010154 -0.2336899 MC - U , MG - 0 suppressor of cytokine signaling 3 SOCS3 0.00035589 -0.373791 MC - U , MG - 0 suppressor of cytokine signaling 3 SOCS3 0.00307102 -0.2564336 MC - U , MG - 0 superoxide dismutase 2, mitochondrial SOD2 0.00214423 -0.4239649 MC - U , MG - 0 lung type-I cell membrane-associated glycoprotein T1A-2 0.00009866 0.83265927 MC - U , MG - 0 transforming growth factor, beta 2 TGFB2 0.00328175 0.33532991 MC - U , MG - 0 tenascin C (hexabrachion) TNC 0.00279099 0.90182908 MC - U , MG - 0 tumor necrosis factor receptor superfamily, member 1B TNFRSF1B 0.00120295 -0.3511801 MC - U , MG - 0 tumor necrosis factor receptor superfamily, member 8 TNFRSF8 0.00001876 -0.6483724 MC - U , MG - 0 triosephosphate isomerase 1 TPI1 0.000775 -0.2384197 MC - U , MG - 0 triosephosphate isomerase 1 TPI1 0.00206009 -0.296162 MC - U , MG - 0 triggering receptor expressed on myeloid cells 1 TREM1 0.0006918 -0.9615129 MC - U , MG - 0
Copyright @ 2006 by the American Association of Neuropathologists, Inc. Unauthorized reproduction of this article is prohibited

thyroid hormone receptor interactor 10 TRIP10 0.00300765 -0.1803162 MC - U , MG - 0 vascular endothelial growth factor VEGF 0.00199755 -0.7262579 MC - U , MG - 0 vascular endothelial growth factor VEGF 0.00000774 -0.6164426 MC - U , MG - 0 vascular endothelial growth factor VEGF 0.00007463 -0.424073 MC - U , MG - 0 wingless-type MMTV integration site family, member 5A WNT5A 0.0004911 1.24383515 MC - U , MG - 0 zinc finger protein 36, C3H type-like 1 ZFP36L1 0.00093628 -0.7305477 MC - U , MG - 0 chondroitin sulfate proteoglycan 2 (versican) CSPG2 0.0010774 -1.5169779 MC - U , MG - D chemokine (C-X-C motif) ligand 13 (B-cell chemoattractant) CXCL13 0.00023891 -0.5870241 MC - U , MG - D dystrobrevin, alpha DTNA 0.00312839 -0.0822651 MC - U , MG - D egf-like module containing, mucin-like, hormone receptor-like sequence 2 EMR2 0.00023783 -0.9590764 MC - U , MG - D KIAA1199 protein KIAA1199 0.00160545 -0.5349299 MC - U , MG - D myeloperoxidase MPO 0.00081795 -0.5878718 MC - U , MG - D Homo sapiens mitochondrial ribosomal protein L4 --- 0.00003434 -0.1923318 MC - U , MG - U Homo sapiens PRO2275 mRNA, complete cds --- 0.00002888 -0.8564496 MC - U , MG - U Homo sapiens similar to neutrophil cytosolic factor 1 --- 0.00200554 -0.1138678 MC - U , MG - U adenosine deaminase ADA 0.00063906 -0.2279878 MC - U , MG - U adenosine deaminase ADA 0.0008161 -0.3527255 MC - U , MG - U adrenomedullin ADM 0.0015136 -0.2371905 MC - U , MG - U adenosine A2a receptor ADORA2A 0.00327037 -0.4588637 MC - U , MG - U chemokine (C-C motif) receptor 7 CCR7 0.0009183 -0.9122107 MC - U , MG - U EH-domain containing 1 EHD1 0.00020108 -0.0368307 MC - U , MG - U egf-like module containing, mucin-like, hormone receptor-like sequence 1 EMR1 0.00004244 0.09862715 MC - U , MG - U hypothetical protein FLJ23231 FLJ23231 0.00044998 -0.3588363 MC - U , MG - U putative lymphocyte G0/G1 switch gene G0S2 0.00024279 -0.788295 MC - U , MG - U hepatocellular carcinoma-associated antigen 112 HCA112 0.00079974 0.45044089 MC - U , MG - U hemopoietic cell kinase HCK 0.00001546 -0.1898823 MC - U , MG - U interleukin-1 receptor-associated kinase 3 IRAK3 0.00314088 -0.1885261 MC - U , MG - U leukocyte immunoglobulin-like receptor, subfamily A (without TM domain), member 3 LILRA3 0.00026193 -0.7493495 MC - U , MG - U leukocyte immunoglobulin-like receptor, subfamily B (with TM and ITIM domains), member 1 LILRB1 0.00032975 -0.8914426 MC - U , MG - U leukocyte immunoglobulin-like receptor, subfamily B (with TM and ITIM domains), member 1 LILRB1 0.00064164 -0.2432381 MC - U , MG - U leukocyte immunoglobulin-like receptor, subfamily B (with TM and ITIM domains), member 2 LILRB2 0.0004026 -0.2983453 MC - U , MG - U leukocyte immunoglobulin-like receptor, subfamily B (with TM and ITIM domains), member 3 LILRB3 0.00221035 -0.5185599 MC - U , MG - U leukocyte immunoglobulin-like receptor, subfamily B (with TM and ITIM domains), member 3 LILRB3 0.00355718 -0.268582 MC - U , MG - U leukocyte immunoglobulin-like receptor, subfamily B (with TM and ITIM domains), member 3 LILRB3 0.00120721 -0.2921946 MC - U , MG - U leukocyte immunoglobulin-like receptor, subfamily B (with TM and ITIM domains), member 3 LILRB3 0.00102466 -0.3216662 MC - U , MG - U LIM domain kinase 2 LIMK2 0.00149486 -0.0189591 MC - U , MG - U
Copyright @ 2006 by the American Association of Neuropathologists, Inc. Unauthorized reproduction of this article is prohibited
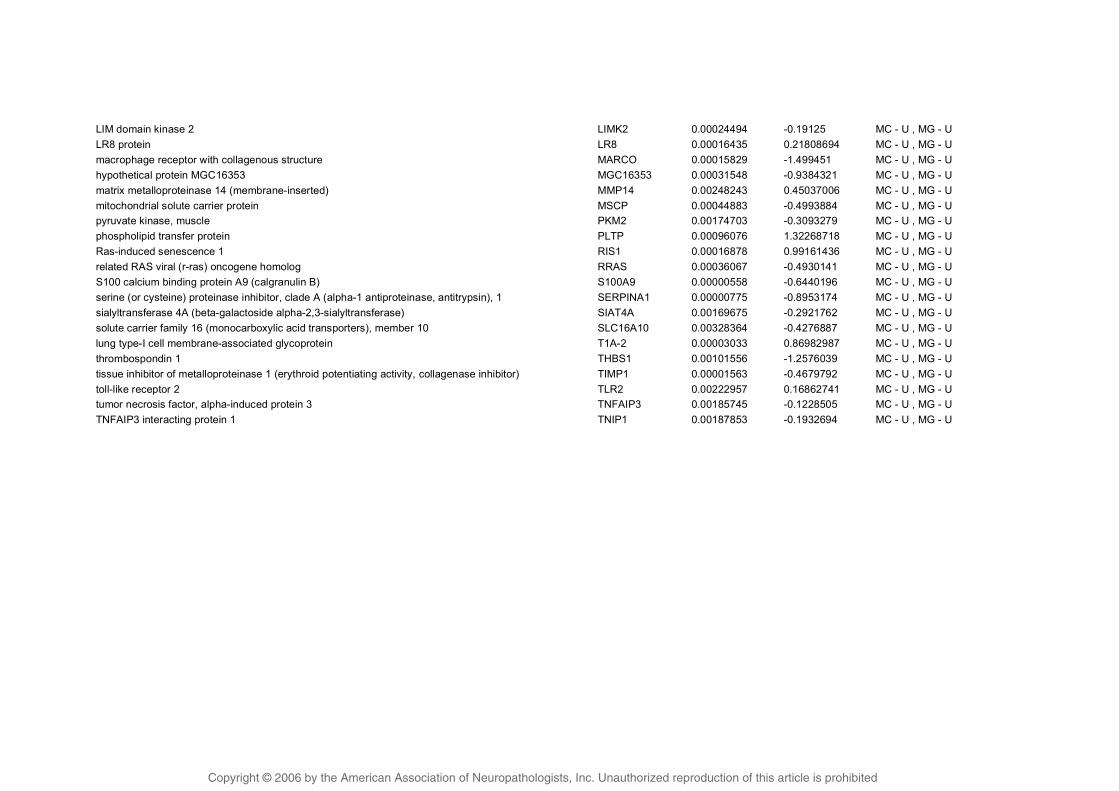
LIM domain kinase 2 LIMK2 0.00024494 -0.19125 MC - U , MG - U LR8 protein LR8 0.00016435 0.21808694 MC - U , MG - U macrophage receptor with collagenous structure MARCO 0.00015829 -1.499451 MC - U , MG - U hypothetical protein MGC16353 MGC16353 0.00031548 -0.9384321 MC - U , MG - U matrix metalloproteinase 14 (membrane-inserted) MMP14 0.00248243 0.45037006 MC - U , MG - U mitochondrial solute carrier protein MSCP 0.00044883 -0.4993884 MC - U , MG - U pyruvate kinase, muscle PKM2 0.00174703 -0.3093279 MC - U , MG - U phospholipid transfer protein PLTP 0.00096076 1.32268718 MC - U , MG - U Ras-induced senescence 1 RIS1 0.00016878 0.99161436 MC - U , MG - U related RAS viral (r-ras) oncogene homolog RRAS 0.00036067 -0.4930141 MC - U , MG - U S100 calcium binding protein A9 (calgranulin B) S100A9 0.00000558 -0.6440196 MC - U , MG - U serine (or cysteine) proteinase inhibitor, clade A (alpha-1 antiproteinase, antitrypsin), 1 SERPINA1 0.00000775 -0.8953174 MC - U , MG - U sialyltransferase 4A (beta-galactoside alpha-2,3-sialyltransferase) SIAT4A 0.00169675 -0.2921762 MC - U , MG - U solute carrier family 16 (monocarboxylic acid transporters), member 10 SLC16A10 0.00328364 -0.4276887 MC - U , MG - U lung type-I cell membrane-associated glycoprotein T1A-2 0.00003033 0.86982987 MC - U , MG - U thrombospondin 1 THBS1 0.00101556 -1.2576039 MC - U , MG - U tissue inhibitor of metalloproteinase 1 (erythroid potentiating activity, collagenase inhibitor) TIMP1 0.00001563 -0.4679792 MC - U , MG - U toll-like receptor 2 TLR2 0.00222957 0.16862741 MC - U , MG - U tumor necrosis factor, alpha-induced protein 3 TNFAIP3 0.00185745 -0.1228505 MC - U , MG - U TNFAIP3 interacting protein 1 TNIP1 0.00187853 -0.1932694 MC - U , MG - U
Copyright @ 2006 by the American Association of Neuropathologists, Inc. Unauthorized reproduction of this article is prohibited

Supplementary Table S2: Primers and probes.
TLR1
sense: 5’-CCACAACAAGTTGGTGAAGATTTCT-3’
antisense 5’-GCATATAGGCAGGGCATCAAATG-3’
probe: 5’-ACTGTGAACCTCAAGCACTTGGACCTGTCA-3’
TLR2
sense: 5’-TTCAGGATGTCCGCCTCTCG-3’
antisense: 5’-CCCGTGAGCAGGATCAGCA-3’
probe: 5’-ACAGAGCACAGCACATGCCAGACACCA-3’
TLR4
sense: 5’-AAAGCCGAAAGGTGATTGTTGTG-3’
antisense: 5’-TGCTCAGAAACTGCCAGGTCT-3’
probe: 5’-TGTCCCAGCACTTCATCCAGAGCCGC-3’
TLR6
sense: 5’-GAAGAAGAACAACCCTTTAGGATAGC-3’
antisense: 5’-GCTGGATTCTGTTATGGGAAAGTC-3’
probe: 5’-CAAAAAGACCTACCGCTGAAAACCAAAGTC-3’
MyD88
sense: 5’-CTCCTCCACATCCTCCCTTCC-3’
antisense: 5’-CGCACGTTCAAGAACAGAGACA-3’
probe: 5’CCGCACTCGCATGTTGAGAGCAGCCAG-3’
Copyright @ 2006 by the American Association of Neuropathologists, Inc. Unauthorized reproduction of this article is prohibited