Bone status of Indian women from a low-income group and its relationship to the …
9
ORIGINAL ARTICLE Bone status of Indian women from a low-income group and its relationship to the nutritional status Veena Shatrugna Bharati Kulkarni P. Ajay Kumar K. Usha Rani N. Balakrishna Received: 30 August 2004 / Accepted: 8 April 2005 / Published online: 15 June 2005 Ó International Osteoporosis Foundation and National Osteoporosis Foundation 2005 Abstract Indian women from low-income groups con- sume diets that have inadequate calcium coupled with too few calories, proteins and micronutrients. Hospital- based data suggest that these women have osteoporotic hip fractures at a much earlier age than Western women. Studies reporting bone parameters of the Indian popu- lation involving large sample sizes are not available. This study was therefore carried out with 289 women in the 30–60-year age group to estimate the prevalence of osteoporosis and measure the bone parameters by dual energy X-ray absorptiometry (DXA). Their mean (± SD) age was 41.0±8.60 years. Their mean (± SD) height, weight and body mass index (BMI) were 149.1±5.49 cm, 49.2±9.85 kg and 22.1±3.99, respec- tively. Dietary intake of calcium was estimated to be 270±57 mg/day. The prevalence of osteoporosis at the femoral neck was around 29%. Bone mineral density (BMD) and T scores at all the skeletal sites were much lower than the values reported from the developed countries and were indicative of a high prevalence of osteopenia and osteoporosis. BMD showed a decline after the age of 35 years in cases of the lumbar spine and femoral neck. This was largely due to a decrease of bone mineral content (BMC). The nutritional status of wo- men appears to be an important determinant of bone parameters. BMD and BMC at all the skeletal sites and whole body increased significantly with increasing body weight and BMI of women (P<0.05). However, bone area (BA) did not change with an increase in BMI. In the multiple regression analysis, apart from body weight, age, menopause and calcium intake were the other im- portant determinants of BMD (P<0.05). In addition to these, height was also an important determinant of WB- BMC. This study highlights the urgent need for mea- sures to improve the nutritional status, dietary calcium intake and thus the bone health of this population. Keywords Body weight Bone mineral density Calcium intake Indian women Nutrition Introduction The life expectancy of both men and women is increasing in India. However, this increased longevity is associated with an increased burden of age-related morbidities including osteoporosis. In the near future, developing countries like India may expect the occurrence of hip fractures in epidemic proportions at a time when it is still coping with the problems of malnutrition and infectious diseases. It has been projected that over half of the hip fractures in the world in the year 2050 will occur in Asia [1]. Osteoporotic fractures, especially hip fractures, are associated with considerable morbidity and mortality and increasingly high economic and social costs [2]. Analysis of hospital-based data from India of men and women belonging to the low socio-economic group shows that osteoporotic hip fractures occur at a much earlier age than those reported from the Western region. However, populations from the high-income group in India do not show this early age of fractures [3, 4, 5, 6]. A few studies from India have reported apparent bone density using the older methods of visual assessment of X-rays of the spine, femur or metacarpals [7, 8]. Their data suggest that os- teopenia and osteoporosis may occur at a relatively younger age in the Indian population, even though the radiological techniques for diagnosis of bone loss may be insensitive. However, the prevalence of fractures of the spine and forearm goes undetected in India because they are usually treated as out-patient cases. Osteoporos Int (2005) 16: 1827–1835 DOI 10.1007/s00198-005-1933-1 All the authors were affiliated with the National Institute of Nutrition during the study period. V. Shatrugna (&) B. Kulkarni P. A. Kumar K. U. Rani N. Balakrishna National Institute of Nutrition, Indian Council of Medical Research, Jamai Osmania P.O., 500 007 Hyderabad, India E-mail: [email protected] Tel.: +91-40-27018234 Fax: +91-40-27019074
-
Upload
independent -
Category
Documents
-
view
0 -
download
0
Transcript of Bone status of Indian women from a low-income group and its relationship to the …

ORIGINAL ARTICLE
Bone status of Indian women from a low-income groupand its relationship to the nutritional status
Veena Shatrugna Æ Bharati Kulkarni Æ P. Ajay Kumar
K. Usha Rani Æ N. Balakrishna
Received: 30 August 2004 / Accepted: 8 April 2005 / Published online: 15 June 2005� International Osteoporosis Foundation and National Osteoporosis Foundation 2005
Abstract Indian women from low-income groups con-sume diets that have inadequate calcium coupled withtoo few calories, proteins and micronutrients. Hospital-based data suggest that these women have osteoporotichip fractures at a much earlier age than Western women.Studies reporting bone parameters of the Indian popu-lation involving large sample sizes are not available. Thisstudy was therefore carried out with 289 women in the30–60-year age group to estimate the prevalence ofosteoporosis and measure the bone parameters bydual energy X-ray absorptiometry (DXA). Their mean(± SD) age was 41.0±8.60 years. Their mean (± SD)height, weight and body mass index (BMI) were149.1±5.49 cm, 49.2±9.85 kg and 22.1±3.99, respec-tively. Dietary intake of calcium was estimated to be270±57 mg/day. The prevalence of osteoporosis at thefemoral neck was around 29%. Bone mineral density(BMD) and T scores at all the skeletal sites were muchlower than the values reported from the developedcountries and were indicative of a high prevalence ofosteopenia and osteoporosis. BMD showed a declineafter the age of 35 years in cases of the lumbar spine andfemoral neck. This was largely due to a decrease of bonemineral content (BMC). The nutritional status of wo-men appears to be an important determinant of boneparameters. BMD and BMC at all the skeletal sites andwhole body increased significantly with increasing bodyweight and BMI of women (P<0.05). However, bonearea (BA) did not change with an increase in BMI. In themultiple regression analysis, apart from body weight,
age, menopause and calcium intake were the other im-portant determinants of BMD (P<0.05). In addition tothese, height was also an important determinant of WB-BMC. This study highlights the urgent need for mea-sures to improve the nutritional status, dietary calciumintake and thus the bone health of this population.
Keywords Body weight Æ Bone mineral density ÆCalcium intake Æ Indian women Æ Nutrition
Introduction
The life expectancy of both men and women is increasingin India. However, this increased longevity is associatedwith an increased burden of age-related morbiditiesincluding osteoporosis. In the near future, developingcountries like India may expect the occurrence of hipfractures in epidemic proportions at a time when it is stillcoping with the problems of malnutrition and infectiousdiseases. It has been projected that over half of the hipfractures in the world in the year 2050 will occur in Asia[1]. Osteoporotic fractures, especially hip fractures, areassociated with considerable morbidity and mortalityand increasingly high economic and social costs [2].
Analysis of hospital-based data from India of men andwomen belonging to the low socio-economic group showsthat osteoporotic hip fractures occur at amuch earlier agethan those reported from the Western region. However,populations from the high-income group in India do notshow this early age of fractures [3, 4, 5, 6]. A few studiesfrom India have reported apparent bone density using theolder methods of visual assessment of X-rays of the spine,femur or metacarpals [7, 8]. Their data suggest that os-teopenia and osteoporosis may occur at a relativelyyounger age in the Indian population, even though theradiological techniques for diagnosis of bone loss may beinsensitive. However, the prevalence of fractures of thespine and forearm goes undetected in India because theyare usually treated as out-patient cases.
Osteoporos Int (2005) 16: 1827–1835DOI 10.1007/s00198-005-1933-1
All the authors were affiliated with the National Institute ofNutrition during the study period.
V. Shatrugna (&) Æ B. Kulkarni Æ P. A. KumarK. U. Rani Æ N. BalakrishnaNational Institute of Nutrition, Indian Council of MedicalResearch, Jamai Osmania P.O., 500 007 Hyderabad, IndiaE-mail: [email protected].: +91-40-27018234Fax: +91-40-27019074

It is now well established that a low bone mineraldensity using advanced techniques such as dual energyX-ray absorptiometry (DXA) may be the most importantmeasurable determinant of osteoporosis, and it is anindispensable tool in the diagnosis of osteoporosis.However, studies reporting the bone density values of theIndian population involving a large sample size are notavailable. This is important because Indians from low-income groups subsist on diets that have inadequatecalcium coupled with too few calories, proteins and mi-cronutrients [9]. In addition, they have low body weights,and women attain menopause at an earlier age than theirWestern counterparts [10]. It is possible that these wo-men are at a risk of osteoporosis and fractures at an earlyage as reported by the earlier studies [3, 4, 5, 6].
This study was therefore carried out to measure thebone-related parameters by DXA in women belongingto the low-income group to assess the prevalence ofosteoporosis. In addition, attempts were made to relatethe bone parameters to their nutritional status.
Subjects and methods
Sample size
Assuming the prevalence of osteoporosis to be 25% inthe age group of 30–60 years, with 95% confidenceinterval and 20% relative precision, the sample sizeestimated was 288. It was therefore decided to recruit300 women from this age group.
Study participants
All adult women who were non-pregnant, non-lactatingresiding in a large urban slum (Addagutta) in Hydera-bad between the ages of 30 to 60 years were enumerated.The total number was 1,371. Of these, 300 women wererandomly selected for the study. Background informa-tion was collected about their occupations, chronic ill-nesses, reproductive history including the number ofchildren, duration of breast feeding, menopausal statusand age at menopause. Heights and weights were mea-sured using standard procedures.
Dietary intakes of energy, proteins and other nutri-ents were assessed by the 24-h recall method, which is awell-established tool. Long-term calcium intake wasassessed using the Food Frequency Questionnaire(FFQ) method, which is commonly used by nutritionists[11, 12]. It is a practical tool for the measurement ofnutrients from the usual food consumption patterns of ahomogenous population. Based on the frequency (daily,weekly or monthly) of intake of these foods, calciumintakes can be calculated. We built a FFQ taking intoconsideration the nutritional pattern of our populationand selecting 30 calcium-rich foods for the question-naire. This method was validated against a 24-h recallmethod.
A fasting blood sample was drawn, and estimationsfor hemoglobin, serum proteins, serum albumin, serumtartrate resistant acid phosphatase and serum bonespecific alkaline phosphatase were carried out on thesame day. Serum bone specific alkaline phosphatase wasmeasured by the heat inactivation method [13], andserum tartarate resistant acid phosphatase was measuredas described by Schele et al. [14].
The serum was preserved, and the estimation ofs. calcium, s. phosphorus, s. zinc and s. copper werecarried out at a later date. Urinary calcium and creati-nine were also estimated in a fasting sample.
Measurements of bone parameters
These measurements were carried out using DXA (Ho-logic 4,500 W, Waltham, Mass.) at three sites, namelythe anteroposterior lumbar spine (L1–L4) (LS), the hipincluding the femoral neck (FN), forearm and the wholebody (WB). All the scans and analyses were carried outaccording to the manufacturer’s instructions by atrained technician. The number of measurements ofthe forearm (200) and whole body (264) were less thanthe number (289) for other parameters because someof the women had metal jewelry, which interfered withthe measurements.
The scanner was calibrated daily using a controlphantom, and its performance was monitored as per thequality assurance protocol. No sign of scanner drift wasobserved during the study period. The in vivo precision(coefficient of variation) was 1–2% for all the bonedensity measurements. The manufacturer’s normativedata were used as a reference range.
Statistical analysis
Univariate statistics were computed for each continuousvariable, and percentages were calculated for categoricalvariables. The Kolmogorov-Smirnov test was used tocheck for normality of distributions. One-way analysis ofvariance (ANOVA) was used for group comparison withthe post hoc test of least significant difference (LSD)procedure. Relationships between variables were testedusing the Pearson correlation coefficient and stepwiseregression analysis. A value of P<0.05 was consideredstatistically significant. All analysis was performed withthe statistical package for social science (SPSS) statisticalsoftware for Windows 11.5 (SPSS Inc., III.).
Results
Background information
Of the 300 women who were randomly selected for thestudy, the data on 11 women were incomplete . There-fore, the results of a total of 289 women are presented inthe tables. Their mean (± SD) age was 41.0±8.60 years,
1828

with a range of 30 to 60 years. Their mean (± SD)height, weight and body mass index (BMI), which areimportant indicators of the nutritional status of popu-lations [15], were 149.1±5.49 cm, 49.2±9.85 kg and22.1±3.99, respectively. The mean (± SD) parity ofthese women was 3.3±1.38. Of these, 119 (41%) womenwere postmenopausal and 170 (59%) were premeno-pausal. The mean (± SD) age at menopause was40.8±5.86 years in postmenopausal women.
The intakes of foods and nutrients are given inTables 1 and 2. The diets were typically cereal-basedwith a very low intake of protective foods such as milkand milk products, flesh foods, fish, fruits and vege-tables. Intake of major nutrients such as energy andproteins were below the Recommended DietaryAllowance (RDA) for these women. There was grossinadequacy in the intakes of micronutrients such asiron, vitamin A, folate, etc. These results correspondto those reported by the National Nutrition Monitor-ing Bureau (NNMB) surveys, which are large-scalenational nutritional surveys in India [9, 17]. There wereno differences in the calcium intake of women in anyof the age groups from £ 40 years to ‡50 years, andthey were below the RDA, which itself is very low inIndia (Table 2). All the women were involved inoccupations such as piece-rate work, sweepers, con-struction workers and other home-based work. Theirdays of work, duration of work and wages were notregulated by the state, and therefore they were said tobelong to the non-formal sector. Based on the historyand clinical examination, six women had high bloodpressure, five were known diabetics, and seven sufferedfrom asthma. The use of drugs was irregular. But noneof them had received corticosteroids for a prolongedperiod or hormone replacement therapy (HRT). Sixwomen gave a history of wrist fractures, and nine hadfractures at other sites such as the leg, ankle, ribs,arms, elbow, etc., largely due to accidents.
Biochemical parameters
The mean values of all the biochemical parameters werewithin the normal range. But the serum tartrate resistant
acid phosphatase (mean ± SD) was markedly raised(6.0±2.54 IU/l; normal range 2.2–3.8 IU/l). However,the proportion of women having values of biochemicalparameters outside the normal range (given in paren-theses) were as follows: serum calcium: 22% (<8.4 mg/dl), hemoglobin: 25% (<12 gm/dl), serum albumin: 4%(<4 g/dl), serum phosphorus: 3% (<2.5 mg/dl), serummagnesium: 11% (<1.9 mg/dl), serum zinc: 45%(<80 mg/dl), serum bone specific alkaline phosphatase:27% (>40 IU/l) and serum bone specific acid phos-phatase: 84% (>3.8 IU/l).
Bone parameters (mean ± SD)
Table 3 gives the values of bone mineral content(BMC), bone area (BA), bone mineral density (BMD)and T score at following sites: the neck of the femur,total left hip, lumbar spine (L1–L4) and left forearm. Italso provides information on whole body bone param-eters along with body composition data of lean mass,fat mass and fat percentage, which could be measured inonly 264 women. All the values of BMC and BMD aremuch lower than those reported from the developedcountries [18, 19, 20, 21]. The mean WB-BMC in thispopulation is around 1.5 kg compared to the reportedvalue of 2–2.5 kg.
Using WHO criteria of a T score <)2.5, the pre-valence of osteoporosis and osteopenia appears to bevery high in this population. The mean T scores of theneck of the femur, hip, lumbar spine and forearm are inthe osteopenic range. At the femoral neck, almost 29% ofthe women had osteoporosis and 52% had osteopenia,with only19% of the women having ‘‘normal’’ density.At the lumbar spine, the prevalence of osteoporosis
Table 1 Food and nutrient
intakes (mean ± SD) of thestudy group
Food group Intake (g/day) Nutrients Intakes RDA
Cereals 360±114.9 Energy (Kcal) 1,776±368 2,225Millets 7±27.7 Proteins (g) 37.3±16.16 50Pulses 22.3±28.37 Fats (g) 26.0±14.2 20Oils 23±14.8 Calcium (mg) 270±54 400Milk and milk products 62±63.2 Phosphorus (mg) 842±204Green leafy vegetables 11±28.7 Vitamin A (retinol) (lg) 208±304 950Fruits 31±56.4 Thiamin (mg) 0.5±0.21 1.1Flesh foods 7±17.9 Riboflavin (mg) 0.5±0.16 1.3Fish 0.3±1.39 Niacin (mg) 9.2±2.36 14Sugar 26±14.6 Iron (mg) 6.8±2.57 30Other vegetables 57±60.3 Folate (lg) 35±19.9 100Roots 31±34.3Nuts 4±20.6Condiments 10.7±8.0
Table 2 Decade-wise calcium intakes (mg/d) (mean ± SD)
£ 40 years 264±54.540.1–50 years 276±60.1‡50.1 years 278±56.5Total 270±57
1829
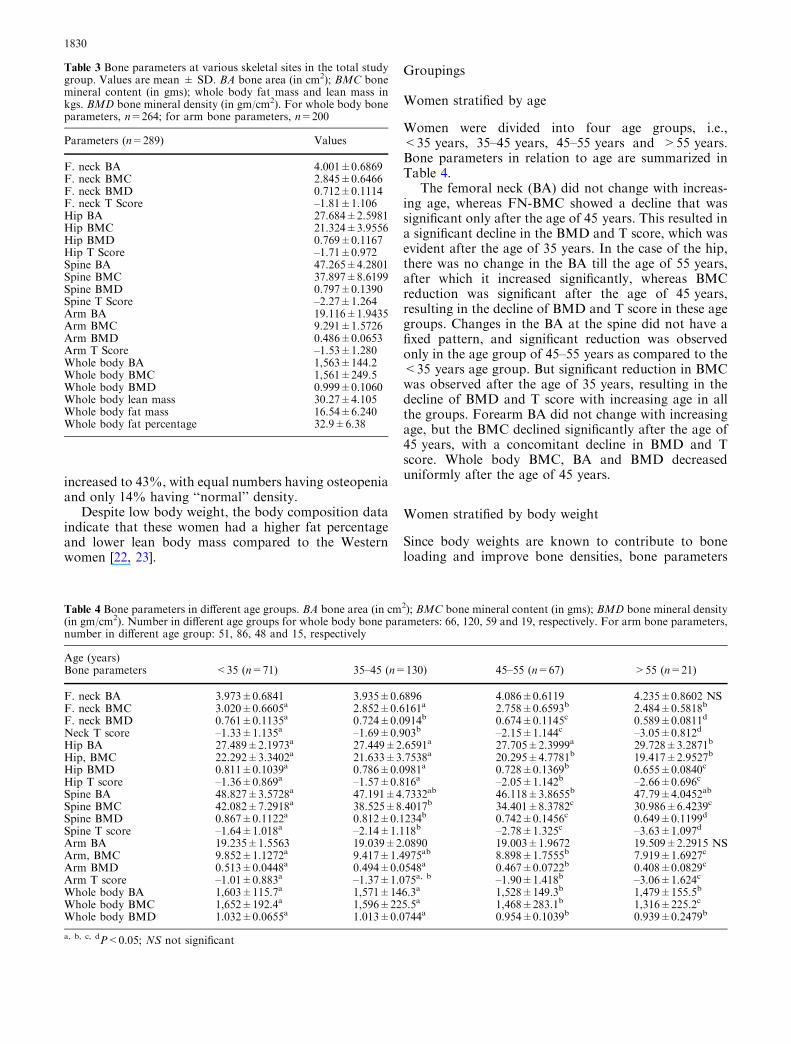
increased to 43%, with equal numbers having osteopeniaand only 14% having ‘‘normal’’ density.
Despite low body weight, the body composition dataindicate that these women had a higher fat percentageand lower lean body mass compared to the Westernwomen [22, 23].
Groupings
Women stratified by age
Women were divided into four age groups, i.e.,<35 years, 35–45 years, 45–55 years and >55 years.Bone parameters in relation to age are summarized inTable 4.
The femoral neck (BA) did not change with increas-ing age, whereas FN-BMC showed a decline that wassignificant only after the age of 45 years. This resulted ina significant decline in the BMD and T score, which wasevident after the age of 35 years. In the case of the hip,there was no change in the BA till the age of 55 years,after which it increased significantly, whereas BMCreduction was significant after the age of 45 years,resulting in the decline of BMD and T score in these agegroups. Changes in the BA at the spine did not have afixed pattern, and significant reduction was observedonly in the age group of 45–55 years as compared to the<35 years age group. But significant reduction in BMCwas observed after the age of 35 years, resulting in thedecline of BMD and T score with increasing age in allthe groups. Forearm BA did not change with increasingage, but the BMC declined significantly after the age of45 years, with a concomitant decline in BMD and Tscore. Whole body BMC, BA and BMD decreaseduniformly after the age of 45 years.
Women stratified by body weight
Since body weights are known to contribute to boneloading and improve bone densities, bone parameters
Table 3 Bone parameters at various skeletal sites in the total studygroup. Values are mean ± SD. BA bone area (in cm2); BMC bonemineral content (in gms); whole body fat mass and lean mass inkgs. BMD bone mineral density (in gm/cm2). For whole body boneparameters, n=264; for arm bone parameters, n=200
Parameters (n=289) Values
F. neck BA 4.001±0.6869F. neck BMC 2.845±0.6466F. neck BMD 0.712±0.1114F. neck T Score –1.81±1.106Hip BA 27.684±2.5981Hip BMC 21.324±3.9556Hip BMD 0.769±0.1167Hip T Score –1.71±0.972Spine BA 47.265±4.2801Spine BMC 37.897±8.6199Spine BMD 0.797±0.1390Spine T Score –2.27±1.264Arm BA 19.116±1.9435Arm BMC 9.291±1.5726Arm BMD 0.486±0.0653Arm T Score –1.53±1.280Whole body BA 1,563±144.2Whole body BMC 1,561±249.5Whole body BMD 0.999±0.1060Whole body lean mass 30.27±4.105Whole body fat mass 16.54±6.240Whole body fat percentage 32.9±6.38
Table 4 Bone parameters in different age groups. BA bone area (in cm2); BMC bone mineral content (in gms); BMD bone mineral density(in gm/cm2). Number in different age groups for whole body bone parameters: 66, 120, 59 and 19, respectively. For arm bone parameters,number in different age group: 51, 86, 48 and 15, respectively
Age (years)Bone parameters <35 (n=71) 35–45 (n=130) 45–55 (n=67) >55 (n=21)
F. neck BA 3.973±0.6841 3.935±0.6896 4.086±0.6119 4.235±0.8602 NSF. neck BMC 3.020±0.6605a 2.852±0.6161a 2.758±0.6593b 2.484±0.5818b
F. neck BMD 0.761±0.1135a 0.724±0.0914b 0.674±0.1145c 0.589±0.0811d
Neck T score –1.33±1.135a –1.69±0.903b –2.15±1.144c –3.05±0.812d
Hip BA 27.489±2.1973a 27.449±2.6591a 27.705±2.3999a 29.728±3.2871b
Hip, BMC 22.292±3.3402a 21.633±3.7538a 20.295±4.7781b 19.417±2.9527b
Hip BMD 0.811±0.1039a 0.786±0.0981a 0.728±0.1369b 0.655±0.0840c
Hip T score –1.36±0.869a –1.57±0.816a –2.05±1.142b –2.66±0.696c
Spine BA 48.827±3.5728a 47.191±4.7332ab 46.118±3.8655b 47.79±4.0452ab
Spine BMC 42.082±7.2918a 38.525±8.4017b 34.401±8.3782c 30.986±6.4239c
Spine BMD 0.867±0.1122a 0.812±0.1234b 0.742±0.1456c 0.649±0.1199d
Spine T score –1.64±1.018a –2.14±1.118b –2.78±1.325c –3.63±1.097d
Arm BA 19.235±1.5563 19.039±2.0890 19.003±1.9672 19.509±2.2915 NSArm, BMC 9.852±1.1272a 9.417±1.4975ab 8.898±1.7555b 7.919±1.6927c
Arm BMD 0.513±0.0448a 0.494±0.0548a 0.467±0.0722b 0.408±0.0829c
Arm T score –1.01±0.883a –1.37±1.075a, b –1.90±1.418b –3.06±1.624c
Whole body BA 1,603±115.7a 1,571±146.3a 1,528±149.3b 1,479±155.5b
Whole body BMC 1,652±192.4a 1,596±225.5a 1,468±283.1b 1,316±225.2c
Whole body BMD 1.032±0.0655a 1.013±0.0744a 0.954±0.1039b 0.939±0.2479b
a, b, c, dP<0.05; NS not significant
1830

were further analyzed in relation to the body weights(Table 5). Women were divided into five weight groupsof £ 40 kg, 40.1–45 kg, 45.1–50 kg, 50.1–55 kg and‡55.1 kg. Femoral neck BA did not change in any ofthe weight groups; however, BMC increased signifi-cantly in the weight groups of 45 kg and above,thereby increasing the BMD and T score in thesegroups.
There appears to be an increase in BA of the hip withincreasing body weight, but significance was reachedonly after attaining a weight of 50 kg. There was aclearer pattern of BMC increase with increasing weightresulting in increased BMD and T score in the weightgroups of 45 kg and above.
In the case of the spine, both BA and BMC had asimilar pattern of increase with increasing weight.There is a significant increase in BA and BMC be-tween the weight group <40 kg and 40.1–45 kg, afterwhich these two bone parameters plateau till theweight group of 55 kg. There is a second significantincrease in BA and BMC after 55 kg of weight. Thismay explain the gradual increase in spinal BMD andT score improvements in these weight groups. Fore-arm BA increases in the first three weight groups be-fore it plateaus, and BMC increases only after theweight group 45–50 kg, resulting in BMD increasedonly after the weight group >55 kg. Whole body BAshowed a significant increase in all the weight groups.But BMC increased gradually; thereby, the increase inwhole body BMD was significant only in the heaviestgroup.
Women stratified by body mass index
BMI is a well-known parameter that is used for theassessment of nutritional status. Based on the recom-mended healthy range of BMI for Asians, which is 18.5to 23 [24], the subjects were divided into three BMIgroups of <18.5, 18.5–22.9 and ‡23. When the boneparameters were analyzed in relation to the BMI, theclose association between nutritional status and bonehealth became obvious (Table 6). BAs of the femoralneck, hip, spine as well as forearm were not significantlydifferent in the three BMI groups. But the BMC in-creased significantly with increasing BMI at the femoralneck and whole body, whereas it increased only after aBMI of 23 in the case of the hip, spine and forearm. TheBMD of the femoral neck, hip and spine increased withincreasing BMI. The BMD of the forearm, however, didnot change with BMI, and the whole body BMD in-creased only in the last group. Changes in BMD weremore sensitive to the improved nutritional status whencompared to the BMC. The mean T score of the womenat the lumbar spine in the lowest BMI group (<18.5)was in the osteoporotic range, whereas the mean Tscores at the femoral neck, hip and forearm were in theosteopenic range.
Women stratified as per menopausal status
The bone parameters were next compared betweenpremenopausal and postmenopausal women aftercontrolling for body weight and age. The results are
Table 5 Bone parameters in different weight groups. Values are
expressed as mean ± SD. BMD bone mineral density (gm/cm2);BMC bone mineral content (gms); BA bone area (cm2). For whole
body BMC, numbers in different weight groups: 45, 50, 60, 41 and68, respectively. For arm BMD and T Score, numbers in differentweight groups: 27, 43, 47, 30 and 53, respectively
Weight (kg)Bone parameters £ 40 (n=48) 40.1–45 (n=52) 45.1–50 (n=67) 50.1–55 (n=46) ‡55.1 (n=76)
F. neck BA 3.801±0.6397 3.948±0.6867 4.068±0.7415 3.939±0.6789 4.143±0.6479 NSF. neck BMC 2.459±0.4987a 2.604±0.5131a 2.820±0.6132b 2.895±0.5869b 3.245±0.6581c
F. neck BMD 0.647±0.0902a 0.663±0.0949a, b 0.696±0.0977b 0.738±0.1026c 0.784±0.1074d
F. neck T score –2.45±0.888a –2.31±0.949a –1.93±0.964b –1.56±1.030b –1.11±1.072c
Hip BA 26.808±2.3299a 27.153±2.5044a, b 27.595±2.5933a, b 27.973±2.4295b, c 28.504±2.7144c
Hip BMC 18.883±3.2013a 19.391±3.1919a 20.784±3.4631b 22.269±2.8703c 24.091±4.0323d
Hip BMD 0.704±0.1061a 0.715±0.1078a 0.754±0.1032b 0.799±0.0947c 0.844±0.1069d
Hip T score –2.26±0.881a –2.17±0.899a –1.84±0.859b –1.47±0.794c –1.09±0.892d
Spine BA 44.638±3.5935a 46.912±4.6024b 47.611±4.4446b 47.225±3.6283b 48.883±3.9204c
Spine BMC 32.894±7.0174a 35.993±7.8245b 37.479±8.8177b 38.849±7.7927b 42.140±8.4059c
Spine BMD 0.733±0.1196a 0.764±0.1245a, b 0.785±0.1472b, c 0.821±0.1378c, d 0.857±0.1292d
Spine T score –2.85±1.095a –2.58±1.135a,b, –2.38±1.334b –2.06±1.253b,c –1.73±1.173c
Arm BA 17.802±1.6429a 18.604±1.9532b 19.425±1.8661c 19.131±2.0153b, c 19.918±1.6799c
Arm BMC 8.438±1.2614a 8.686±1.5143a 9.219±1.4223b 9.574±1.1739b, c 10.119±1.3989c
Arm BMD 0.474±0.0550a 0.468±0.0725a 0.477±0.0695a 0.499±0.0682a, b 0.508±0.0516b
Arm T score –1.77±1.084a –1.89±1.420a –1.72±1.359a –1.26±1.337a, b –1.11±1.016b
Whole body BA 1,412±101.9a 1,481±98.9b 1,559±105.4c 1,612±95.2d 1,696±112.9e
Whole body BMC 1,370±179.6a 1,451±205.1a 1,522±231.9b 1,633±220.4b 1,734±220.8c
Whole body BMD 0.972±0.0756a 0.976±0.0904a 0.992±0.0999a 1.010±0.0961a, b 1.034±0.1334b
a, b, c, d, eP<0.05
1831

summarized in Table 7. Except for the whole body BA,BAs at other sites were not affected by menopause. But asignificant decline in BMD was evident in menopausalwomen at all the skeletal sites due to a decrease in BMC.T score values were accordingly different in the twogroups (P<0.05).
Multiple regression results
To examine the relationship of bone density parameterswith anthropometric parameters, age, reproductivefactors like parity, duration of breastfeeding, menopauseand calcium intake stepwise regression models wereconstructed with BMD at various skeletal sites andWB-BMC as dependent variables and all the above-mentioned variables as independent ones. The resultsare presented in Table 8. The factors that showed
statistically significant association with hip BMD werebody weight, menopause, age and calcium intake [R2
(%)=42.2] (P<0.001). Femoral neck BMD showedsignificant relationships with weight, age and menopause[R2(%)=44.5] (P<0.001). Lumbar spine BMD showeda significant relationship with age, weight and meno-pause (R2 (%)=37.1) (P<0.001), whereas arm BMDwas related to menopause and weight (R2 (%)=34)(P<0.001). WB-BMC was related to weight, meno-pause, height and age [R2 (%)=57.1] (P<0.001).
Discussion
This is the first study on the bone-related parameters ofIndian women from the low socio-economic group usinga sensitive instrument like DXA and relating it to thenutritional status of the population. The nutritional
Table 6 Bone parameters in thedifferent BMI groups. Valuesare expressed as mean ±SD.BMDbone mineral density(gm/cm2); BMC bone mineralcontent (gms); BA bone area(cm2). For whole body BMC,numbers in the three BMIgroups: 45, 114 and 105,respectively. For arm BMD andT-score, numbers in the threeBMI groups: 31, 92 and 77,respectively
a, b, cP<0.05; NS not significant
BMIBone parameters <18.5 (n=48) 18.5–22.9 (n=126) ‡23 (n=115)
F. neck BA 3.953±0.6404 4.037±0.6771 3.982±0.7193 NSF. neck BMC 2.569±0.5650a 2.786±0.5833b 3.025±0.6948c
F. neck BMD 0.647±0.0910a 0.692±0.1008b 0.760±0.1107c
F. neck T score –2.45±0.895a –2.02±1.007b –1.31±1.083c
Hip BA 27.791±2.6219 27.581±2.6877 27.752±2.5053 NSHip BMC 19.564±3.5312a 20.559±3.6248a 22.895±3.9420b
Hip BMD 0.703±0.1095a 0.745±0.1055b 0.823±0.1086c
Hip T score –2.26±0.915a –1.92±0.877b –1.26±0.904c
Spine BA 46.869±4.1823 47.098±4.5623 47.609±4.0059 NSSpine BMC 34.997±7.9748a 37.141±8.7890a 39.919±8.2771b
Spine BMD 0.742±0.1289a 0.785±0.1407b 0.834±0.1319c
Spine T score –2.77±1.177a –2.39±1.278b –1.94±1.201c
Arm BA 18.553±2.1426 19.084±1.8915 19.379±1.8954 NSArm BMC 8.752±1.5343a 9.139±1.4979a 9.689±1.5976b
Arm BMD 0.472±0.0660 0.479±0.0685 0.499±0.0594 NSArm T score –1.81±1.298 –1.65±1.339 –1.28±1.167 NSWhole body BA 1456±134.1a 1543±126.9b 1630±132.3c
Whole body BMC 1,413±223.2a 1,536±230.9b 1,653±244.4c
Whole body BMD 0.971±0.0804a 0.992±0.0919a 1.019±0.1252b
Table 7 Effect of menopause onbone parameters (aftercontrolling for weight and age).Values are expressed as mean ±SD
a, bP<0.05. For arm BMD andT score, numbers in the twogroups: 112 and 88,respectively. For whole bodyBMC, numbers in the twogroups: 159 and 105,respectively
Bone parameters Women withoutmenopause (n=170)
Women withmenopause (n=119)
F. neck BA 3.969±0.058 4.112±0.073 NSF. neck BMC 2.895±0.048 2.819±0.060 NSF. neck BMD 0.733±0.0913a 0.682±0.0982b
F. neck T score –1.617±0.9389a –2.092±0.9819b
Hip BA 27.848±0.217 27.584±0.272 NSHip BMC 22.115±0.288a 20.410±0.361b
Hip BMD 0.795±0.1043a 0.736±0.1091b
Hip T score –1.498±0.8476a –1.993±0.8946b
Spine BA 47.554±0.352 46.874±0.443 NSSpine BMC 39.582±0.628a 35.495±0.791b
Spine BMD 0.830±0.1304 a 0.757±0.1309b
Spine T score –1.976±1.1606 a –2.612±1.2219b
Arm BA 19.001±0.192 19.333±0.225 NSArm BMC 9.674±0.137a 8.898±0.161b
Arm BMD 0.509±0.0655a 0.459±0.0671b
Arm T score –1.070±1.2001a –2.063±1.2275b
Whole body BA 1582.9±8.355a 1538.9±10.889b
Whole body BMC 1617.5±210.0a 1493.2±222.2b
Whole body BMD 1.022±0.008a 0.971±0.011b
1832

status of these women as indicated by their height,weight and BMI is similar to that reported by NNMBsurveys from India and thus is representative of the In-dian low socio-economic group [9, 17]. These womenwere stunted during childhood and reached normal BMIonly during the menopausal years when women tend toput on fat.
The mean age at menopause in this group of womenwas 40.8±5.86 years, which is early as compared to theWestern reports. Early menopause is known to increasethe risk of osteoporosis and cardiovascular disease andis also associated with a higher all-cause mortality [25].It was therefore not surprising that the overall preva-lence of osteoporosis was much higher when comparedto the Western reports. This is substantiated by the boneparameters, which were much lower than the values re-ported from the developed countries [17, 18, 19, 20].These values were also lower than the values of boneparameters reported in Asian women such as the Japa-nese [26] and Chinese [27] inspite of similar body framesize. Better calcium and dietary intakes may be one ofthe important factors responsible for this difference. Thecalcium intake of our study population was only270±57 mg/day as compared to the RDA of 800–1,000 mg/day, which is accepted worldwide. However,the RDA for calcium has not been established formenopausal women in India subsisting on a cereal-pulsediet, and therefore 400 mg/day of RDA for calcium isindicated in Table 1. The major part of this calciumintake came from plant sources, which are known tohave low bioavailability. The foods rich in calcium suchas milk, spices and dry fruits are expensive and notavailable to this population. The intake of other nutri-ents except fats was also substantially low, resulting inmultiple nutrient deficiencies. Another important factorcould be the ratio of dietary calcium:phosphorus, whichwas 1:4 because of low calcium intake. Low calcium andhigh phosphorus diets were found to cause persistentelevation of serum PTH levels in young women [28].Reports being generated from our institute suggest thatwomen with higher calcium and better dietary intakesfrom high-income groups have better bone densities [29].
Results of biochemical analysis highlight the fact thatover 25% of the women had low hemoglobin, serumcalcium and serum zinc levels partially representing thenutritional status of the population. A similar percent-age of women had raised serum levels of bone specificalkaline phosphatase, but a much larger proportion hadraised serum levels of bone specific acid phosphatase
providing some insight into the mechanism of boneresorption.
Body composition of these women indicates that theyhave a lower lean body mass and a higher fat percentagefor a given BMI than other ethnic groups [22, 23].However, it is similar to the pattern reported for otherAsian populations [30]. This may partially explain thelow BMDs in this population. Table 4 provides theevidence of early onset of osteoporosis. It was obviousthat the steep fall in T score to the osteoporotic rangeoccurred at the age of 55 years for hip, femoral neck andforearm. These changes occur by the age of 45 years inthe lumbar spine. It would be important to study theextent of vertebral fractures in these women. It is wellknown that back pain is a very common complaint inthis group. There is also a fall in WB-BMC by the age of45 years. These findings are further supported by themarkedly raised values of serum tartrate resistant acidphosphatase, which indicate the enhanced osteoclasticactivity.
In case of the lumbar spine, BA did not change withincreasing age. Hence, the loss of BMD may be attrib-uted to the loss of mineral that was evident after the ageof 45 years. A similar trend was noted for the femoralneck and forearm. However, in case of the hip, BA in-creased in the ‡55-year age group, whereas BMC de-creased after the age of 45 years, thereby reducing BMDprogressively after that age (Table 4). The significantloss of LS-BMD and FN-BMD observed in the agegroup 35–45 years may be related to menopause. It ispossible that inadequate calcium intake coupled withearly menopause hastened the onset of osteoporosis.
The relationship of body weight and BMI to theBMD has been well documented [31, 32]. When boneparameters were analyzed in relation to the nutritionalstatus of women in this study, it was obvious thatnutrition (i.e., body weight and BMI) was an importantdeterminant of bone health as the mean ages of thewomen were not different in the five weight groups(Table 5). Both BA and BMC increased with increasingweight at all the skeletal sites except the femoral neckBA. However, since BMC changes were greater, therewas an increase in BMD at all the sites. Weight increaseshelped in increasing the bone shell, but its contributionto mineral deposition appeared to be greater, resulting inbetter BMDs. Women below 40 kg of weight were nearto the osteoporotic range at the hip and femoral neck.Normal T score was reached only at ‡55 kg weight. Incase of the spine, even at the higher weight ranges
Table 8 Stepwise regression model of bone density parameters with anthropometric parameters, age, menopause and calcium intake
Dependent variable Variables included in the model R2 (%) P value
Hip BMD Body weight, (-) menopause, (-) age, Ca intake 42.2 <0.001Neck BMD Body weight, (-) age, (-) menopause 44.5 <0.001Spine BMD (-) Age, body weight, (-) menopause 37.1 <0.001Forearm BMD (-) Menopause, body weight 34.0 <0.001Whole body BMC Body weight, (-) menopause, height, (-) age 57.1 <0.001
1833
women were osteopenic. The role of hormones may bemore important in this region. There is a difference ofalmost 400 gm of whole body mineral between the £ 40and >55 kg weight groups. These observations suggestthat in developing countries with low dietary intake ofcalcium, it is important that women maintain a bodyweight of ‡55 kg to prevent bone thinning.
With increasing BMI of the subjects, BMD of theFN, hip, LS and WB improved significantly due to anincrease in BMC (Table 6). There were no differences inthe BA at all the sites. It is possible that since the effectof heights disappeared with BMI, BAs were not differ-ent.
Almost 18% of women in this group had a BMI<18.5, which can be considered as chronic energy de-ficiency (CED). Their BMD values and T scores at allskeletal sites were close to the osteoporotic range withthe forearm in the osteopenic range, putting them at arisk of fractures. In the BMI category of 18.5–23, whichis considered to be normal and desirable for Asians, eventhough the bone densities show improvement as com-pared to the <18.5 group, they can still be consideredosteopenic, with the spine close to the osteoporoticrange. Women in the BMI category of >23, which canbe considered as overweight in the context of cardio-vascular risk, were still in the osteopenic zone at all theskeletal sites. The recommendation to maintain the BMI<23 for Asians should be seen with caution as far asbone health is concerned.
The effect of menopause after controlling for weightand age is significant in this group of women at allskeletal sites (Table 7). Concerning the background ofpoor nutritional status and low dietary intake of cal-cium, menopause appears to act as a trigger to shift theosteopenic T scores of these women towards osteopo-rosis, especially at the spine. This is substantiated by theresults of the multiple regression analysis (Table 8).Despite the fact that up to 80% of the bone strength(including bone density and quality) might be geneticallydetermined [33], nutritional factors and the subject’sphysiological conditions—age and hormonal sta-tus—appear to be other important determinants of bonehealth. Body weight, age and menopause were the mostimportant determinants of the BMD at all the skeletalsites. In addition to these, height was an importantdeterminant of whole body BMC. Calcium intakes werean important determinant of BMD at the hip, but notother skeletal sites. Some of the earlier studies have alsofound that hip BMD (predominantly cortical bone), butnot spine BMD, correlated positively with dietary cal-cium intake [18, 34].
This study provides a data base of bone parametersof Indian women from the low income group. It alsoprovides convincing evidence of the role of nutrition inthis community. With increasing life expectancy andpoor nutritional status, the increase in morbidity due toosteoporosis might strain the already overworked healthcare system. It also provides guidelines in terms ofminimum weight and BMI required for favorable bone
health in resource-poor settings where facilities forBMD measurements do no exist. It would be importantto study the bone parameters of Indian women from thehigh-income group with better body weights and highercalcium intakes.
Acknowledgements The authors would like to acknowledge thesupport and encouragement of Dr. B. Sivakumar and Dr. Gha-foorunissa, Deputy Directors (senior grade) and officers in-chargeat the National Institute of Nutrition, Hyderabad. We are alsograteful to Mr. Chenna Krishna Reddy, Mr. Narsimha Rao,Mr. Sambasiva Rao, Ms. Suvarna and Ms. Padma Siromani fortheir help during the course of the study. This study would not havebeen possible without the unstinting cooperation of the womenfrom Addagutta, and we are grateful to them.
References
1. Cooper C, Campion G, Melton LJ III (1992) Hip fractures inthe elderly: a worldwide projection. Osteoporos Int 2:285–289
2. Gabriel SE, Tosteson ANA, Leibson CL, Crowson CS, PondGR, Hammond CS, Melton LJ III (2002) Direct medical costsattributable to osteoporotic fractures. Osteoporos Int 13:323–330
3. Gupta AK, Samuel KC, Kurian PM, Rallan RC (1967) Pre-liminary study of the incidence and aetiology of femoral neckfractures in Indians. Indian J Med Res 55:1341–1348
4. Vaishnava H, Rizvi SNA (1974) Frequency of osteomalaciaand osteoporosis in fractures of proximal femur. Lancet 1:676–677
5. Shatrugna V, Soundarrajan N, Sundariah P, Raman L (1990)Back pain: the feminine affliction. Econ Pol Wkly 25:WS2–WS6
6. Shatrugna V (1998) Osteoporosis in the Asian region: newerquestions. In: Shetty P, Gopalan C (eds) Diet, nutrition andchronic diseases. Smith-Gordon, UK, pp 81–83
7. Sridhar CB, Ahuja MMS, Bhargava S (1970) Is osteoporosis anutritional disease? J Assoc Phys India 18:671–676
8. Khanna P, Bhargava S (1971) Roentgen assessment of bonedensity in north Indian population. Indian J Med Res 59:1599–1609
9. National Nutrition Monitoring Bureau (2002) Diet and nutri-tional status of rural population. National Institute of Nutri-tion, Hyderabad, India
10. Bharadwaj JA, Kendurkar SM, Vaidya PR (1983) Age andsymptomatology of menopause in Indian women. J PostgradMed 29:218–222
11. Wilson P, Horwath C (1996) Validation of a short food fre-quency questionnaire for assessment of dietary calcium intakein women. Eur J Clin Nutr 50:220–228
12. Montomoli M, Gonnelli S, Giacchi M, Mattei R, Cuda C,Rassi S, Gennari C (2002) Validation of a food frequencyquestionnaire for nutritional calcium intake assessment inItalian women. Eur J Clin Nutr 56:21–30
13. Cadeau BJ, Malkin A (1973) A relative heat stability test forthe identification of serum alkaline phosphatase isoenzymes.Clin Chim Acta 45:235–242
14. Schele F, Artur Y, Floc’h AY, Slest G (1988) Total tartrate-resistant and tartrate-inhibited acid phosphatase in serum :biological variations and reference limits. Clin Chem 34:685–690
15. World Health Organization (1995) Physical status: the use andinterpretation of anthropometry. Technical Report Series 354.WHO, Geneva
16. National Institute of Nutrition (1989) Nutritive value of Indianfoods. Indian Council of Medical Research, Hyderabad, India
17. National Nutrition Monitoring Bureau (1994) Report of urbansurvey slums. National Institute of Nutrition, Hyderabad,India
1834
18. Ilich JZ, Brownbill RA, Tanborini L (2003) Bone and nutritionin elderly women: protein, energy and calcium as main deter-minants of bone mineral density. Eur J Clin Nutr 57:554–565
19. Warming L, Hassager C, Christiansen C (2002) Changes inbone mineral density with age in men and women: a longitu-dinal study. Osteoporos Int 13:105–112
20. Pedrazzon M, Girasole G, Bertoldo F, Bianchi G, Cepollaro C,Del Puente A, Giannini S, Gonnelli S, Maggio D, Marcocci c,Minisoli S, Palummeri E, Rossini M, Sartori L (2003) Defini-tion of a population specific DXA reference standard in Italianwomen: the Densitometric Italian Normative Study (DINS).Osteoporos Int 14:978–982
21. Going S, Lohman T, Houtkooper L, Metcalfe L, Flint-WagnerH, Blew R, Stanford V, Cussler E, Martin J, Teixeira P, HarrisM, Millikren L, Figueroa-Galvez A, Weber J (2003) Effects ofexercise on bone mineral density in calcium replete post-men-opausal women with and without hormone replacement ther-apy. Osteoporos Int 14:637–643
22. Gallagher D, Heymsfield SB, Heo M, Jebb SA, MurgatroydPR, Sakamoto Y (2000) Healthy percentage body fat ranges: anapproach for developing guidelines based on body mass index.Am J Clin Nutr 72:694–701
23. Deurenberg P, Deurenberg-Yap M, Guricci S (2002) Asians aredifferent from Caucasians and from each other in their bodymass index/body fat percent relationship. Obes Rev 3:141–146
24. World Health Organization (2000) The Asia Pacific perspec-tive—redefining obesity and its treatment. International Dia-betes Institute Health Communications Australia Pty Ltd
25. Snowdon DA, Kane RL, Beesan WL, Burke GL, Sprafka JM,Potter J, Iso H, Jacobs DR, Phillips RL (1989) Is early naturalmenopause a biologic marker of health and aging? Am J PublicHealth 79:709–714
26. Yoshimura N, Kinoshita H, Danjoh S, Takijiri T, Morioka S,Kasamatsu T, Sakata K, Hashmoto T (2002) Bone loss at thelumbar spine and the proximal femur in a rural Japanesecommunity, 1990–2000: the Miyama study. Osteoporos Int13:803–808
27. Lau EMC, Lynn H, Woo J, Melton LJIII (2003) Areal andvolumetric bone-density in Hong Kong, Chinese: a comparisonwith Caucasions living in the United States. Osteoporos Int14:583–588
28. Calvo MS, Kumar R, Health H III (1990) Persistently elevatedparathyroid hormone secretion and action in young womenafter 4 weeks of ingesting high phosphorus, low calcium diets.J Clin Endocrinol Metab 70:1334–1340
29. National Institute of Nutrition (2002) Annual Report. NationalInstitute of Nutrition, Hyderabad, India
30. He M, Li ETS, Kung AWC (1999) Dual-energy X-rayabsorptiometry for body composition estimation in Chinesewomen. Eur J Clin Nutr 53:933–937
31. Felson DT, Zhang YQ, Hannan MT, Anderson JJ (1993) Ef-fects of weight and body mass index on bone mineral density inmen and women: the Framingham study. J Bone Miner Res8:567–573
32. Stevenson JC, Lees B, Devenport M, Cust MP, Ganger KF(1989) Determinants of bone density in normal women: riskfactors for osteoporosis? BMJ 298:924–928
33. Pocock NA, Eisman JA, Hopper JL, Yeates MG, SambrookPN, Eberl S (1987) Genetic determinants of bone mass inadults. A twins study. J Clin Invest 80:706–710
34. Rubin LA, Hawker GA, Peltekova VD, Fielding LJ, Ridout R,Cole DE (1999) Determinants of peak bone mass: clinical andgenetic analysis in a young female Canadian cohort. J BoneMiner Res 14:633–643
1835