BOLD signal increase preceeds EEG spike activity—a dynamic penicillin induced focal epilepsy in...
10
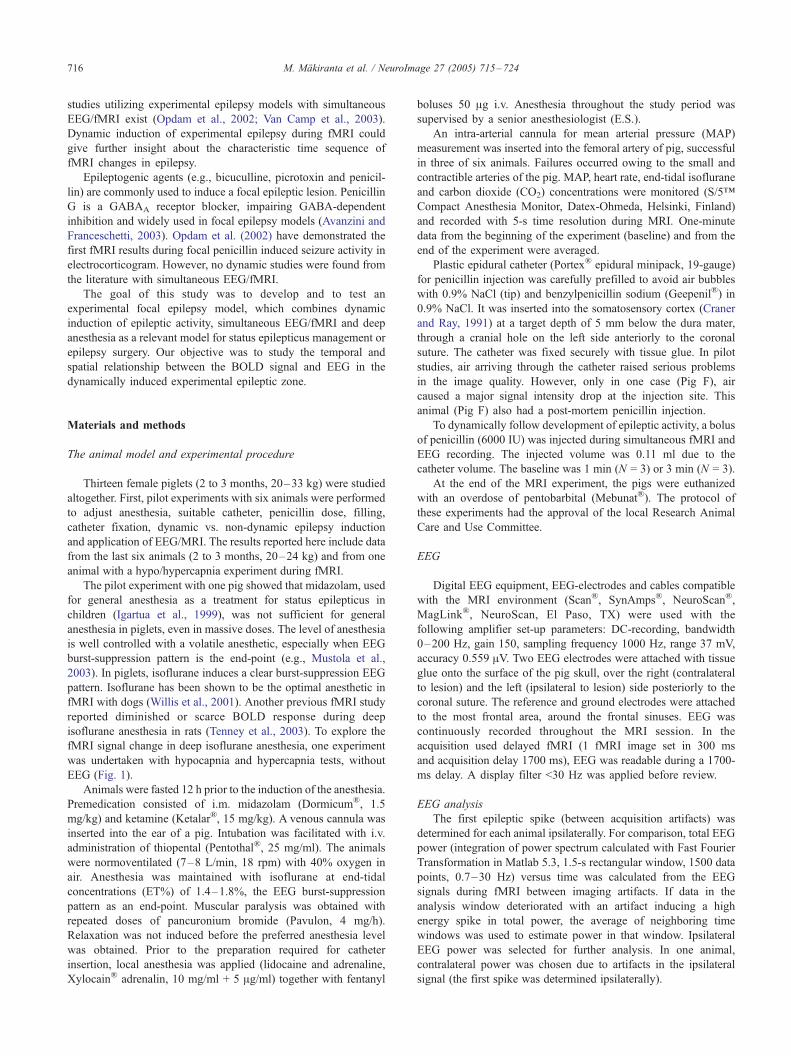
BOLD signal increase preceeds EEG spike activity—a dynamic penicillin induced focal epilepsy in deep anesthesia Minna Ma ¨kiranta, a,b, * Jyrki Ruohonen, a,f Kalervo Suominen, b Jaakko Niinima ¨ki, a Eila Sonkaja ¨rvi, c Vesa Kiviniemi, a Tapio Seppa ¨nen, d Seppo Alahuhta, c Ville Ja ¨ntti, e and Osmo Tervonen a a Department of Diagnostic Radiology, University of Oulu, Kajaanintie 50, 90220 Oulu, Finland b Department of Clinical Neurophysiology, Oulu University Hospital, Kajaanintie 50, 90220 Oulu, Finland c Department of Anesthesiology, University of Oulu, Kajaanintie 50, 90220 Oulu, Finland d Department of Electrical and Information Engineering, University of Oulu, Oulu, Finland e Ragnar Granit Institute, Tampere University of Technology, and Department of Clinical Neurophysiology, Tampere University Hospital, Tampere, Finland f NMR Research Group, Department of Physical Sciences, University of Oulu, P.O. Box 3000, 90014 Oulu, Finland Received 19 May 2004; revised 13 May 2005; accepted 14 May 2005 Available online 11 July 2005 In 40 – 60% of cases with interictal activity in EEG, fMRI cannot locate any focus or foci with simultaneous EEG/fMRI. In exper- imental focal epilepsy, a priori knowledge exists of the location of the epileptogenic area. This study aimed to develop and to test an experimental focal epilepsy model, which includes dynamic induction of epileptic activity, simultaneous EEG/fMRI, and deep anesthesia. Reported results are from seven pigs (23 T 2 kg) studied under isoflurane anesthesia (1.2 – 1.6 MAC, burst-suppression EEG) and muscle relaxant. Hypo- and hypercapnia were tested in one pig. Penicillin (6000 IU) was injected via a plastic catheter (inserted into the somatosensory cortex) during fMRI (GRE-EPI, TE = 40 ms, 300 ms/two slices, acquisition delay 1700 ms) in 1.5 T (N = 6). Epileptic spikes between acquisition artifacts were reviewed and EEG total power calculated. Cross-correlation between voxel time series and three model functions resembling induced spike activity were tested. Activation map averages were calculated. Development of penicillin induced focal epileptic activity was associated with linear increase and saturation up to approximately 10 – 20%, in BOLD activation map average. Its initial linear increase reached 2.5 – 10% at the appearance of the first distinguished spike in ipsilateral EEG in all six animals. Correlated voxels were located mainly in the vicinity of the penicillin injection site and midline, but few in the thalamus. In conclusion, development of focal epileptic activity can be detected as a BOLD signal change, even preceding the spike activity in scalp EEG. This experimental model contains potential for development and testing different localization methods and revealing the characteristic time sequence of epileptic activity with fMRI during deep anesthesia. D 2005 Elsevier Inc. All rights reserved. Keywords: Penicillin; Epilepsy; Anesthesia Introduction The important indication for the clinical application of combined simultaneous electroencephalography and functional magnetic resonance imaging (EEG/fMRI) is to find the exact location of the epileptic focus in medically refractory epilepsy. However, in 40– 60% of cases with interictal activity in EEG, fMRI cannot locate any focus or foci (Krakow et al., 1999; Al- Asmi et al., 2003). There is a need to obtain more understanding about the coupling between interictal spike activity in EEG and the blood-oxygen-level-dependent (BOLD) contrast changes localiz- ing the primary focus or foci. Such brain regions sometimes remain active although the activity of the rest of the brain is suppressed with anesthetics to treat status epilepticus or during epilepsy surgery (Fiol et al., 1993; Ja ¨ntti et al., 1994; Prasad et al., 2001; Igartua et al., 1999). Deep anesthesia may provide a mean to limit confounding baseline activity in the brain, and also inhibit the spread of epileptic activity. Otherwise, the impact of focal epilepsy can be widespread on the brain function (Witte and Bruehl, 1999). In experimental focal epilepsy a priori knowledge exists where the true epileptogenic area is located. This enables character- ization of the surrounding BOLD changes around the true primary focus region, comparison with EEG changes and further development of fMRI localization techniques. A few previous 1053-8119/$ - see front matter D 2005 Elsevier Inc. All rights reserved. doi:10.1016/j.neuroimage.2005.05.025 * Corresponding author. Department of Diagnostic Radiology, University of Oulu, Kajaanintie 50, 90220 Oulu, Finland. Fax: +358 8 3152112. E-mail address: [email protected]. (M. Ma ¨kiranta). Available online on ScienceDirect (www.sciencedirect.com). www.elsevier.com/locate/ynimg NeuroImage 27 (2005) 715 – 724
-
Upload
independent -
Category
Documents
-
view
2 -
download
0
Transcript of BOLD signal increase preceeds EEG spike activity—a dynamic penicillin induced focal epilepsy in...
www.elsevier.com/locate/ynimg
NeuroImage 27 (2005) 715 – 724
BOLD signal increase preceeds EEG spike activity—a dynamic
penicillin induced focal epilepsy in deep anesthesia
Minna Makiranta,a,b,* Jyrki Ruohonen,a,f Kalervo Suominen,b Jaakko Niinimaki,a
Eila Sonkajarvi,c Vesa Kiviniemi,a Tapio Seppanen,d Seppo Alahuhta,c
Ville Jantti,e and Osmo Tervonen a
aDepartment of Diagnostic Radiology, University of Oulu, Kajaanintie 50, 90220 Oulu, FinlandbDepartment of Clinical Neurophysiology, Oulu University Hospital, Kajaanintie 50, 90220 Oulu, FinlandcDepartment of Anesthesiology, University of Oulu, Kajaanintie 50, 90220 Oulu, FinlanddDepartment of Electrical and Information Engineering, University of Oulu, Oulu, FinlandeRagnar Granit Institute, Tampere University of Technology, and Department of Clinical Neurophysiology, Tampere University Hospital, Tampere, FinlandfNMR Research Group, Department of Physical Sciences, University of Oulu, P.O. Box 3000, 90014 Oulu, Finland
Received 19 May 2004; revised 13 May 2005; accepted 14 May 2005
Available online 11 July 2005
In 40–60% of cases with interictal activity in EEG, fMRI cannot
locate any focus or foci with simultaneous EEG/fMRI. In exper-
imental focal epilepsy, a priori knowledge exists of the location of
the epileptogenic area. This study aimed to develop and to test an
experimental focal epilepsy model, which includes dynamic induction
of epileptic activity, simultaneous EEG/fMRI, and deep anesthesia.
Reported results are from seven pigs (23 T 2 kg) studied under
isoflurane anesthesia (1.2–1.6 MAC, burst-suppression EEG) and
muscle relaxant. Hypo- and hypercapnia were tested in one pig.
Penicillin (6000 IU) was injected via a plastic catheter (inserted into
the somatosensory cortex) during fMRI (GRE-EPI, TE = 40 ms, 300
ms/two slices, acquisition delay 1700 ms) in 1.5 T (N = 6). Epileptic
spikes between acquisition artifacts were reviewed and EEG total
power calculated. Cross-correlation between voxel time series and
three model functions resembling induced spike activity were tested.
Activation map averages were calculated. Development of penicillin
induced focal epileptic activity was associated with linear increase
and saturation up to approximately 10–20%, in BOLD activation
map average. Its initial linear increase reached 2.5–10% at the
appearance of the first distinguished spike in ipsilateral EEG in all
six animals. Correlated voxels were located mainly in the vicinity of
the penicillin injection site and midline, but few in the thalamus. In
conclusion, development of focal epileptic activity can be detected as
a BOLD signal change, even preceding the spike activity in scalp
EEG. This experimental model contains potential for development
and testing different localization methods and revealing the
1053-8119/$ - see front matter D 2005 Elsevier Inc. All rights reserved.
doi:10.1016/j.neuroimage.2005.05.025
* Corresponding author. Department of Diagnostic Radiology, University
of Oulu, Kajaanintie 50, 90220 Oulu, Finland. Fax: +358 8 3152112.
E-mail address: [email protected]. (M. Makiranta).
Available online on ScienceDirect (www.sciencedirect.com).
characteristic time sequence of epileptic activity with fMRI during
deep anesthesia.
D 2005 Elsevier Inc. All rights reserved.
Keywords: Penicillin; Epilepsy; Anesthesia
Introduction
The important indication for the clinical application of
combined simultaneous electroencephalography and functional
magnetic resonance imaging (EEG/fMRI) is to find the exact
location of the epileptic focus in medically refractory epilepsy.
However, in 40–60% of cases with interictal activity in EEG,
fMRI cannot locate any focus or foci (Krakow et al., 1999; Al-
Asmi et al., 2003). There is a need to obtain more understanding
about the coupling between interictal spike activity in EEG and the
blood-oxygen-level-dependent (BOLD) contrast changes localiz-
ing the primary focus or foci. Such brain regions sometimes remain
active although the activity of the rest of the brain is suppressed
with anesthetics to treat status epilepticus or during epilepsy
surgery (Fiol et al., 1993; Jantti et al., 1994; Prasad et al., 2001;
Igartua et al., 1999). Deep anesthesia may provide a mean to limit
confounding baseline activity in the brain, and also inhibit the
spread of epileptic activity. Otherwise, the impact of focal epilepsy
can be widespread on the brain function (Witte and Bruehl, 1999).
In experimental focal epilepsy a priori knowledge exists where
the true epileptogenic area is located. This enables character-
ization of the surrounding BOLD changes around the true
primary focus region, comparison with EEG changes and further
development of fMRI localization techniques. A few previous
M. Makiranta et al. / NeuroImage 27 (2005) 715–724716
studies utilizing experimental epilepsy models with simultaneous
EEG/fMRI exist (Opdam et al., 2002; Van Camp et al., 2003).
Dynamic induction of experimental epilepsy during fMRI could
give further insight about the characteristic time sequence of
fMRI changes in epilepsy.
Epileptogenic agents (e.g., bicuculline, picrotoxin and penicil-
lin) are commonly used to induce a focal epileptic lesion. Penicillin
G is a GABAA receptor blocker, impairing GABA-dependent
inhibition and widely used in focal epilepsy models (Avanzini and
Franceschetti, 2003). Opdam et al. (2002) have demonstrated the
first fMRI results during focal penicillin induced seizure activity in
electrocorticogram. However, no dynamic studies were found from
the literature with simultaneous EEG/fMRI.
The goal of this study was to develop and to test an
experimental focal epilepsy model, which combines dynamic
induction of epileptic activity, simultaneous EEG/fMRI and deep
anesthesia as a relevant model for status epilepticus management or
epilepsy surgery. Our objective was to study the temporal and
spatial relationship between the BOLD signal and EEG in the
dynamically induced experimental epileptic zone.
Materials and methods
The animal model and experimental procedure
Thirteen female piglets (2 to 3 months, 20–33 kg) were studied
altogether. First, pilot experiments with six animals were performed
to adjust anesthesia, suitable catheter, penicillin dose, filling,
catheter fixation, dynamic vs. non-dynamic epilepsy induction
and application of EEG/MRI. The results reported here include data
from the last six animals (2 to 3 months, 20–24 kg) and from one
animal with a hypo/hypercapnia experiment during fMRI.
The pilot experiment with one pig showed that midazolam, used
for general anesthesia as a treatment for status epilepticus in
children (Igartua et al., 1999), was not sufficient for general
anesthesia in piglets, even in massive doses. The level of anesthesia
is well controlled with a volatile anesthetic, especially when EEG
burst-suppression pattern is the end-point (e.g., Mustola et al.,
2003). In piglets, isoflurane induces a clear burst-suppression EEG
pattern. Isoflurane has been shown to be the optimal anesthetic in
fMRI with dogs (Willis et al., 2001). Another previous fMRI study
reported diminished or scarce BOLD response during deep
isoflurane anesthesia in rats (Tenney et al., 2003). To explore the
fMRI signal change in deep isoflurane anesthesia, one experiment
was undertaken with hypocapnia and hypercapnia tests, without
EEG (Fig. 1).
Animals were fasted 12 h prior to the induction of the anesthesia.
Premedication consisted of i.m. midazolam (Dormicum\, 1.5
mg/kg) and ketamine (Ketalar\, 15 mg/kg). A venous cannula was
inserted into the ear of a pig. Intubation was facilitated with i.v.
administration of thiopental (Pentothal\, 25 mg/ml). The animals
were normoventilated (7–8 L/min, 18 rpm) with 40% oxygen in
air. Anesthesia was maintained with isoflurane at end-tidal
concentrations (ET%) of 1.4–1.8%, the EEG burst-suppression
pattern as an end-point. Muscular paralysis was obtained with
repeated doses of pancuronium bromide (Pavulon, 4 mg/h).
Relaxation was not induced before the preferred anesthesia level
was obtained. Prior to the preparation required for catheter
insertion, local anesthesia was applied (lidocaine and adrenaline,
Xylocain\ adrenalin, 10 mg/ml + 5 Ag/ml) together with fentanyl
boluses 50 Ag i.v. Anesthesia throughout the study period was
supervised by a senior anesthesiologist (E.S.).
An intra-arterial cannula for mean arterial pressure (MAP)
measurement was inserted into the femoral artery of pig, successful
in three of six animals. Failures occurred owing to the small and
contractible arteries of the pig. MAP, heart rate, end-tidal isoflurane
and carbon dioxide (CO2) concentrations were monitored (S/5iCompact Anesthesia Monitor, Datex-Ohmeda, Helsinki, Finland)
and recorded with 5-s time resolution during MRI. One-minute
data from the beginning of the experiment (baseline) and from the
end of the experiment were averaged.
Plastic epidural catheter (Portex\ epidural minipack, 19-gauge)
for penicillin injection was carefully prefilled to avoid air bubbles
with 0.9% NaCl (tip) and benzylpenicillin sodium (Geepenil\) in
0.9% NaCl. It was inserted into the somatosensory cortex (Craner
and Ray, 1991) at a target depth of 5 mm below the dura mater,
through a cranial hole on the left side anteriorly to the coronal
suture. The catheter was fixed securely with tissue glue. In pilot
studies, air arriving through the catheter raised serious problems
in the image quality. However, only in one case (Pig F), air
caused a major signal intensity drop at the injection site. This
animal (Pig F) also had a post-mortem penicillin injection.
To dynamically follow development of epileptic activity, a bolus
of penicillin (6000 IU) was injected during simultaneous fMRI and
EEG recording. The injected volume was 0.11 ml due to the
catheter volume. The baseline was 1 min (N = 3) or 3 min (N = 3).
At the end of the MRI experiment, the pigs were euthanized
with an overdose of pentobarbital (Mebunat\). The protocol of
these experiments had the approval of the local Research Animal
Care and Use Committee.
EEG
Digital EEG equipment, EEG-electrodes and cables compatible
with the MRI environment (Scan\, SynAmps\, NeuroScan\,
MagLink\, NeuroScan, El Paso, TX) were used with the
following amplifier set-up parameters: DC-recording, bandwidth
0–200 Hz, gain 150, sampling frequency 1000 Hz, range 37 mV,
accuracy 0.559 AV. Two EEG electrodes were attached with tissue
glue onto the surface of the pig skull, over the right (contralateral
to lesion) and the left (ipsilateral to lesion) side posteriorly to the
coronal suture. The reference and ground electrodes were attached
to the most frontal area, around the frontal sinuses. EEG was
continuously recorded throughout the MRI session. In the
acquisition used delayed fMRI (1 fMRI image set in 300 ms
and acquisition delay 1700 ms), EEG was readable during a 1700-
ms delay. A display filter <30 Hz was applied before review.
EEG analysis
The first epileptic spike (between acquisition artifacts) was
determined for each animal ipsilaterally. For comparison, total EEG
power (integration of power spectrum calculated with Fast Fourier
Transformation in Matlab 5.3, 1.5-s rectangular window, 1500 data
points, 0.7–30 Hz) versus time was calculated from the EEG
signals during fMRI between imaging artifacts. If data in the
analysis window deteriorated with an artifact inducing a high
energy spike in total power, the average of neighboring time
windows was used to estimate power in that window. Ipsilateral
EEG power was selected for further analysis. In one animal,
contralateral power was chosen due to artifacts in the ipsilateral
signal (the first spike was determined ipsilaterally).

Fig. 1. fMRI signal change during deep isoflurane anesthesia (1.6–1.8 ET%) in one pig. Hypocapnia (pETCO2 from 4.5 to 3%) and hypercapnia (from 4.3 to
7.1%) induced average changes in gray matter (GM) ROI (A) and white matter (WM) ROI (B). In the experiment, hypercapnia was followed by hypocapnia
after the recovery to baseline. The BOLD signals are showed overlapped for visualization purposes only, for GM and WM separately.
M. Makiranta et al. / NeuroImage 27 (2005) 715–724 717
Each EEG was also visually reviewed by an experienced
clinical neurophysiologist (V.J.) to confirm the results of signal
analysis. The search for the first spike of the epileptic activity after
penicillin injection was demanding and required careful attention,
i.e., in discerning distinct epileptiform spikes from burst-suppres-
sion. However, soon after epileptic spikes evolved further, they
were readily detected because of their high amplitude and sharp
waveform (Fig. 2).
MRI
The MRI was conducted with a GE Signa Infinity TwinSpeed
(GE Medical Systems, Milwaukee, WI, USA) 1.5 T scanner with a
flexible surface coil (GPFLEX; GE Medical Systems, Milwaukee,
WI, USA) wrapped around the pig’s head; the animals were lying
feet first in the prone position. The total imaging session lasted
2–3 h per animal.
fMRI was undertaken with a single-shot gradient-echo echo-
planar imaging (GRE-EPI) sequence (echo time (TE) 40 ms, flip
angle 90-, matrix 128 � 128, FOV 18 � 18 cm, slice thickness 5
mm, spacing 5 mm, 1 NEX, ramp sampling). Two coronal slices
with 5 mm spacing were obtained in 300 ms followed by an
acquisition delay of 1700 ms, i.e., the total repetition time (TR)
was 2000 ms. One slice was set to the point of the penicillin
catheter, which was localized by the help of inserted oil capsule
markers. To overcome the technical limitation of the number of
the slices (512) in one multiphase GRE-EPI scan, the fMRI scans
were immediately repeated without the prescan procedures, i.e.,
without any changes in transmitter or receiver gain or the
shimming. Thus, the one fMRI experiment consists of two 8-min
33-s parts, separated by about a 20-s technical delay between the
repeated scans.
High resolution T2-weighted fast spin echo (FSE) images
(matrix 256 � 256, 4 NEX) were obtained from the same locations
and with the same FOV as in the fMRI scans. Also high-resolution
T1-weighted images were collected with 3-dimensional SPGR (TE
5 ms, flip angle 30-, matrix 224 � 224, FOV 22 � 22 cm, slice
thickness 1.8 mm).
fMRI analysis. Muscular paralysis was maintained through the
imaging session to prevent the occurrence of movement. Also, the
coil used was closely wrapped around the head of the animal.
However, all fMRI scans were reviewed with cine loop to confirm
that data had not deteriorated because of movement.
We used the analysis software (Fantom) developed in-house for
manual segmentation and fMRI analysis (e.g., Kiviniemi et al.,
2004). First, intensity thresholds for global white matter and gray
matter were adjusted separately. To obtain the white matter (WM)
and gray matter (GM) region-of-interest (ROI), a line restricting
the ROI voxels inside the brain was drawn manually with different
thresholds on two coronal EPI slices. This ROI analysis was
applied in one pilot animal data, where the effect of hypercapnia
and hypocapnia was examined to explore the fMRI signal change
during isoflurane anesthesia. To estimate the linear drift and overall
signal stability due to gradients in fMRI data, approximately 50
GM voxels (background GM ROI) were selected from the non-
injection site slice, from the bilateral areas not activated in cross-
correlation analyses. Average BOLD responses of the voxel time
series of the segmented ROIs were calculated.
The two or three first images of each time-volume set were
excluded due to signal saturation. To obtain the exact injection
site location, artifacts occurring at the very moment of injection
were utilized to identify the injection site in the EPI images.
High resolution images and EPI location were compared to
confirm the injection site (Fig. 3) and catheter depth (Table 2).
Either micro-bubbles of air (large, transient signal decrease) or
injection of fluid (signal increase) as also shown in post-mortem
fMRI data located the exact injection site in EPI images.
Cross-correlation analysis was applied on the fMRI data with
three model functions: (1) step function convolved with hemody-
namic response function (i.e., hrf step), (2) EEG power with 6-s

Fig. 2. Development of interictal spike activity after the penicillin injection (6000 IU), an example (Pig F). Ipsilateral spikes are here clearly distinguishable
from 1 min after the injection and the waveform is developing from biphasic (3 min), double spikes (8 min) to high-amplitude monophasic spikes (13 min).
(Respective time points, arrowheads in Fig. 6).
M. Makiranta et al. / NeuroImage 27 (2005) 715–724718
hemodynamic delay (i.e., power), and (3) EEG power convolved
with hemodynamic response function (i.e., hrf power). Hemody-
namic response function parameters were: n1 = 8.0, t1 = 0.9 s,
n2 = 15.0, a2 = 0.35, t2 = 0.9 s (see Glover, 1999). Hrf step
approximates the ‘‘ON–OFF’’ type behavior, relevant to pre- and
post-spiking states. Here, the rise of the step was set on the
moment when change in EEG power or the appearance of first
spikes occurred as the BOLD signal change was assumed to
follow EEG spiking. Power (simply the delayed raw EEG power)
was selected as a one model function as the BOLD signal change
was assumed to follow spiking induced EEG power increase. Hrf
power was one model function as it was assumed that
convolution of EEG power with hemodynamic response function
would model better the actual hemodynamical change than the
original EEG power. Cross-correlation between each model
function and signal intensity time courses was calculated to
obtain activation maps. Our aim was to keep the correlation
coefficient threshold (cc) as 0.5 but in the case no activation was
seen, the threshold was lowered with 0.05 steps (0.45, 0.4, 0.35,
0.3, 0.25) until activation was visible, keeping value 0.25 as the
lowest limit. The voxel time courses were not detrended, as in the
all six animals the background GM ROI did not show any trend
(Fig. 6A).
Results
Burst-suppression level of isoflurane anesthesia was reached in
all six animals (1.4–1.7 ET%) (Table 1). Since the BOLD response
in isoflurane in pigs is not known, hyper- and hypocapnia tests were
applied (one animal) in deep isoflurane anesthesia (1.6–1.8 ET%)
(Fig. 1). Respectively, positive (3%) and negative (�2%) maximum

Fig. 3. Identification of the injection site. Comparison of high resolution images (T2-weighted, A; T1-weighted, B) and EPI location (C, E). Either
microbubbles of air (large, transient signal decrease, D) or injection of fluid (signal increase, F), shown also in post-mortem fMRI data, identified the injection
site.
M. Makiranta et al. / NeuroImage 27 (2005) 715–724 719
signal changes in GM and WM were detected in maximum
pETCO2 levels 7.1% (hypercapnia) and 3.0% (hypocapnia)
compared to baseline pETCO2 (4.3–4.5%).
In all of the six pigs, the first distinctive epileptic spikes appeared
in 49 s–2 min 44 s after the penicillin injection (Fig. 2, Table 2).
When the spike waveform developed further, simultaneously, the
background EEG bursts of the burst-suppression pattern either seem
to evolve more ‘‘epileptic’’ or they disappeared. Over several
Table 1
Physiological and anesthesia parameters before and after the penicillin
injection
Pig MAP (mm Hg) HR (1/min) ISOF (ET%) ET CO2 (%)
Average SD Average SD Averagea Averagea
A Baseline 72.0 0.2 100 0 1.7 3.9
After 62.7 0.2 98 1 1.7 4.0
B Baseline – 116 5 1.5 4.6
After – 117 5 1.5 4.7
C Baseline – 99 1 1.6 3.6
After – 98 1 1.6 3.7
D Baseline 96.0 0.4 117 0 1.6 3.9
After 90.2 0.5 116 1 1.6 4.0
E Baseline – 78 0 1.4 3.1
After – 78 1 1.4 3.1
F Baseline 89.5 0.4 125 1 1.5 4.4
After 96.2 0.8 136 1 1.5 4.7
Baseline = average of the data gathered during the first minute of scanning.
After = after the penicillin injection: average of the data gathered during
the last minute of scanning.
MAP = mean arterial pressure, HR = heart rate, ISOF = isoflurane, ET
CO2 = end-tidal CO2.a Standard deviation <0.06, not shown.
minutes, the amplitude of the spikes ipsilateral to the injection site
increased until a level of 200–1200 AVand spiking remained stable
or reduced slowly (in one animal). EEG total power detected the
spike activity and amplitude change (Figs. 6B,C). Also, DC level
changes occurred in a few cases (not shown).
Average values of physiological parameters (MAP, HR,
pETCO2) are shown for the baseline (1 min in the beginning,
preceding the injection) and during the last minute of scanning
(i.e., 14 min–16 min after penicillin injection) (Table 1). MAP
measurement was successful in three animals. In two animals,
MAP decrease was approximately 6 to 9 mm Hg, but in one
animal, MAP increase occurred (about 7 mm Hg), compared to
the baseline. HR and pETCO2 were quite stable.
Cross-correlation analysis of fMRI data with ‘‘hemodynamic’’
step function (hrf step), EEG total power (power) or hrf power
model functions identified positively or negatively the correlating
voxels near the injection site (in contact, around or midline) after the
first penicillin injection (Table 2, Fig. 4). Few negatively correlated
voxels were found, except in the case of large, air-induced signal
decrease (N = 1). Correlation with power and hrf power did not
indicate activation except with a very low correlation coefficient
threshold (�0.25) in three of six animals (Table 2). Positively with
the hrf step, correlated voxels were also spread into the neighboring
slice in five of six animals, mostly located closest to the injection
site (Fig. 5).
An example of a BOLD map (hrf step) average and
simultaneous EEG changes are shown in Fig. 6. The average
BOLD signal increased steadily following the penicillin injection,
and this BOLD response was present before any spikes in EEG
signal were evident (Fig. 6, Table 2). When the first spike was
identified in ipsilateral EEG, a 2.5–13.5% increase in BOLD map
average occurred. Spike activity developed further, while between

Table 2
Quantitative fMRI/EEG results
Pig Correlated voxels and location data for different
model functions
Depth of
catheter (mm)
Map (Hrf Step) mean average fMRI signal
change (%) at
Hrf Step Power Hrf Power 1st spike a Shoulder b Saturation
A Threshold 0.3 <0.25 <0.25 5.5 10.1 18.0 20.0
Voxels (+3) (0) – – 1 min 26 s 4 min 2 s
Location Around – –
B Threshold 0.5 0.4 0.4 5.4 13.5 19.1 21.3
Voxels (+10) (�1) (+13) (�4) (+9) (�2) 2 min 44 s 4 min 28 s
Location In contact In contact In contact
C Threshold 0.5 <0.25 <0.25 6.9 9.5 13.0 14.4
Voxels (+17) (�2) – – 1 min 31 s 2 min 44 s
Location Around – –
D Threshold 0.5 <0.25 0.25 6 6.6 14.4 16.0
Voxels (+47) (�6) – (+10) (0) 1 min 28 s 5 min 16 s
Location In contact,
midline
– Midline
E Threshold 0.5 0.35 0.35 7 2.4 10.8 12.0
Voxels (+34) (�3) (+5) (0) (+17) (�1) 54 s 4 min 24 s
Location In contact, Midline In contact,
midline midline
F Threshold 0.5 0.5 0.5 5.2 2.5 8.5 9.4
Voxels (+118) (af) (+45) (af) (+46) (af) 49 s 5 min 26 s
Location In contact,
midline
In contact,
midline
In contact,
midline
(+, positive correlation) (�, negative correlation), voxels with <0.25 correlation threshold not taken account.
Threshold = Correlation coefficient threshold; Hrf Step, Power and Hrf Power—see Materials and methods.
Saturation = Mean value of the period 7 min–14 min after penicillin injection, as indicated in Fig. 6.a Mean value of the period +/� 2-s (three fMRI signal points) at time after injection below.b 90% value of saturation.
M. Makiranta et al. / NeuroImage 27 (2005) 715–724720
2 min 44 s and 5 min 26 s, the average BOLD signal increase
reached 90% of the final saturation level of 9.4–21.3% positive
signal changes (Fig. 6, Table 2). Background GM ROI averages
did not show linear trends.
Discussion
An experimental focal epilepsy model was developed and
tested in this study. The model was successful in combining
dynamic induction of epileptic activity, simultaneous EEG/fMRI
and deep isoflurane anesthesia. This is to our knowledge, the
first successful experiment with high time resolution monitoring
of evolving epileptic activity with EEG and fMRI.
This study showed that development of penicillin induced focal
epileptic activity was associated with local fMRI signal increase in
the swine brain, even in deep isoflurane anesthesia. The most
exciting result was that initial continuous BOLD increase was
clear prior to the appearance of spike activity in scalp EEG.
The epileptic lesion was obtained by penicillin injection via
a carefully administered catheter in the present study. This was
a simplified and straightforward version of the chronic insertion
of more sophisticated transcranial port for penicillin instillation
(Opdam et al., 2002). It is practical to manage an acute model
which requires one 5–6 h session for the single experiment.
Localized administration allows development of ‘‘focus’’ due to
epileptogenic properties of penicillin.
With the selected penicillin dose, epileptic activity did not
developed into seizures during the fMRI monitored period of
14–16 min. Compared to the baseline, interictal spikes appeared
while the EEG bursts of burst-suppression pattern either
disappeared or deformed into a more ‘‘spiky’’ appearance, i.e.,
apparently more ‘‘epileptic’’ patterns. In this study, the first
distinctive epileptic spikes visible in EEG appeared in 49 s–2
min 44 s after the penicillin injection. It can be assumed that
electrocorticogram shows spiking faster than scalp EEG, but the
given penicillin dose also has to be taken into account in this
comparison. Recording from cortical surface in MRI environ-
ment is possible, as shown by Opdam et al. (2002). In their
recording, spikes evolved in 11.3 T 11.2 s after penicillin
administration with 8000–10000 IU dose (higher than in our
study with 6000 IU).
Penicillin G is a known GABAA receptor antagonist, impairing
the function of GABA-mediated inhibitory neurotransmission (see
Avanzini and Franceschetti, 2003). Respectively, isoflurane (a
GABAA receptor agonist) induces enhancement of GABAAergic
inhibition and a blockade of thalamocortical information transfer
in vivo (Detsch et al., 2002). This opposing effect of isoflurane to
penicillin did not cancel epileptogenic spike activity in this study.
This is in line with the finding that, on the thalamic level,
suppressive effects of isoflurane can be reversed by a local
administration of GABAA receptor antagonist (Vahle-Hinz et al.,
2001). However, when global administration of penicillin via
cisterna magna in cats was performed, induced repetitive epileptic
spikes in cats were fully suppressed with 1.6% isoflurane (Murao
et al., 2000). Isoflurane anesthesia may limit the spread of
epileptic activity and so enable the localization of the primary
epileptogenic zone better than in the awake condition. In humans,
isoflurane at anesthesia levels before the burst-suppression pattern
does not suppress epileptic spikes (Fiol et al., 1993).

Fig. 4. Comparison of different model functions in cross-correlation
analysis, an example (Pig E). Red spot corresponds the injection site, red
cross is for respective location in the control slice. CC is correlation
coefficient threshold. Hrf step, power, hrf power, see Materials and methods.
M. Makiranta et al. / NeuroImage 27 (2005) 715–724 721
In fMRI, isoflurane is assumed to decrease the available
BOLD signal increase range due to increase in cerebral blood
flow (CBF) and decrease in oxygen metabolism, i.e., local brain
tissue oxygenation is increased (Hoffman and Edelman, 2000).
Our pilot experiments showed that hyper- and hypocapnia
responses were reduced, but detectable, which is according to
the literature. Isoflurane has been found to be a useful anesthetic
in canine visual fMRI (Willis et al., 2001), but rejected in the rat
absence epilepsy model due to the modest fMRI response in the
brain (Tenney et al., 2003).
Cross-correlation with different model functions showed that
the ‘‘hemodynamic step function’’ produced the most consistent
results (Table 2). Step function convolved with hemodynamic
response function may provide the best results because of the
closer resemblance to BOLD changes with rise up and saturation,
in contrast to the high variance of both other model functions (the
EEG power and the EEG power convolved with hemodynamic
response function). Activated voxels were spread into the vicinity
of the injection site, and the corresponding ones are in the
neighboring slice, at 10 mm distance from the slice set over the
injection site (Fig. 5). With a longer baseline, more activating
voxels were found, as expected. Selection of a stricter threshold
limited the activated voxels close to the injection site (Fig. 4).
Average BOLD signal increase of the voxels adjacent to the
penicillin injection site was high, approximately 10–20%, with an
initial ramp phase and signal saturation which exceeds the usual
BOLD response in activation studies of 2–5% in 1.5 T (Ogawa et
al., 1998). Signal change because of movement was avoided in the
present study due to deep anesthesia and muscle relaxant. Nor can
pETCO2 changes explain this high change as they were much less
than in our hypercapnia experiment. One suspicion lie on the BOLD
change due to MAP changes of 6–10 mm Hg (Table 1). However,
in 7 T with much greater BOLD sensitivity, approximately only
0.2–0.4% BOLD signal changes were detected, corresponding to
approximately 7–12 mm Hg average change in MAP in 1.1% (0.8
MAC) isoflurane anesthetized rats (Kalisch et al., 2001).
In the human visual cortex, the theoretical maximum of BOLD
signal increase is 8%–22% in 1.5 T (Davis et al., 1998; Hoge et
al., 1999). A single interictal spike induced activation has been
reported to be approximately 1% (Lemieux et al., 2001; Benar et
al., 2002). However, when spatial smoothing of image data was
not used, rather high signal intensity changes (mean 15 T 9%,
range 3–31%) also in human data have been found in spike
triggered fMRI (Jager et al., 2002; see response to Lemieux et al.,
2003) and in the resting state fMRI of epileptic patients at 1.5 T
(Morgan et al., 2004).
We suggest that strong penicillin-induced epileptic activity is
behind the observed average signal intensity increases in fMRI.
Epileptic activity may induce very strong localized changes in
brain metabolism. Penicillin-induced epileptic activity can
induce a more than 200% increase in glucose uptake in the
centre of hypermetabolic primary focus in light anesthesia, with
a concomitant moderate increase in CBF (around 20–30%)
(Witte et al., 1994; Bruehl et al., 1998). This hypermetabolic
centre is surrounded by a hypometabolic area, without CBF
changes (Bruehl et al., 1998). However, a 60–80% CBV
decrease, presumed to relate epileptic activity, was found with
intravenous application of another epileptogenic agent, bicucul-
line (Mueggler et al., 2001).
Time-dependent changes preceding any distinguishable spik-
ing activity in EEG were interesting, despite the fact that the
original cross-correlation analysis was supposed to detect the
OFF–ON pattern parallel to the appearance of EEG spike
activity (ON state). Map mean average of voxels, which
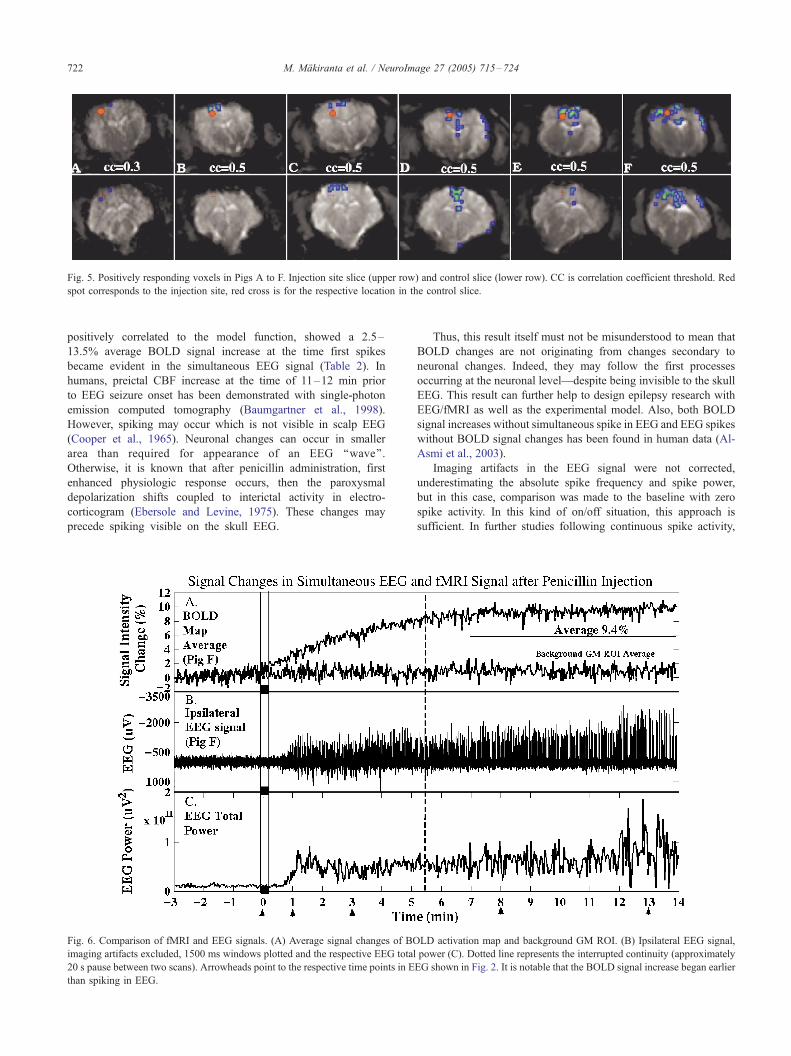
Fig. 5. Positively responding voxels in Pigs A to F. Injection site slice (upper row) and control slice (lower row). CC is correlation coefficient threshold. Red
spot corresponds to the injection site, red cross is for the respective location in the control slice.
M. Makiranta et al. / NeuroImage 27 (2005) 715–724722
positively correlated to the model function, showed a 2.5–
13.5% average BOLD signal increase at the time first spikes
became evident in the simultaneous EEG signal (Table 2). In
humans, preictal CBF increase at the time of 11–12 min prior
to EEG seizure onset has been demonstrated with single-photon
emission computed tomography (Baumgartner et al., 1998).
However, spiking may occur which is not visible in scalp EEG
(Cooper et al., 1965). Neuronal changes can occur in smaller
area than required for appearance of an EEG ‘‘wave’’.
Otherwise, it is known that after penicillin administration, first
enhanced physiologic response occurs, then the paroxysmal
depolarization shifts coupled to interictal activity in electro-
corticogram (Ebersole and Levine, 1975). These changes may
precede spiking visible on the skull EEG.
Fig. 6. Comparison of fMRI and EEG signals. (A) Average signal changes of BO
imaging artifacts excluded, 1500 ms windows plotted and the respective EEG total
20 s pause between two scans). Arrowheads point to the respective time points in E
than spiking in EEG.
Thus, this result itself must not be misunderstood to mean that
BOLD changes are not originating from changes secondary to
neuronal changes. Indeed, they may follow the first processes
occurring at the neuronal level—despite being invisible to the skull
EEG. This result can further help to design epilepsy research with
EEG/fMRI as well as the experimental model. Also, both BOLD
signal increases without simultaneous spike in EEG and EEG spikes
without BOLD signal changes has been found in human data (Al-
Asmi et al., 2003).
Imaging artifacts in the EEG signal were not corrected,
underestimating the absolute spike frequency and spike power,
but in this case, comparison was made to the baseline with zero
spike activity. In this kind of on/off situation, this approach is
sufficient. In further studies following continuous spike activity,
LD activation map and background GM ROI. (B) Ipsilateral EEG signal,
power (C). Dotted line represents the interrupted continuity (approximately
EG shown in Fig. 2. It is notable that the BOLD signal increase began earlier

M. Makiranta et al. / NeuroImage 27 (2005) 715–724 723
imaging artifact correction will be required. Ballistocardiogram
artifact correction was not performed. Epileptic spikes were
clearly distinguishable compared to ballistocardiogram artifacts
(Fig. 2). However, immediately after the injection, developing
spikes may have been so small that they have been covered
under the ballistocardiogram artefact.
The experimental model applied with simple, acute and
straightforward methodology contains the potential to provide
more insight for the localization of epileptic focus with fMRI.
Further adjustments of this model could include other epilepto-
genic agents or different dosage, other target areas with less
susceptibility artefacts, more sophisticated catheter and antiepi-
leptogenic drugs, longer follow-up or monitoring period. Only
two EEG electrodes were applied here which is considered to
be minimal but sufficient to follow epileptic spike activity in
this kind of experimental set-up. The electroencephalographic
data could be refined by using depth electrodes or subdural
strips (Opdam et al., 2002).
In conclusion, the experimental dynamic and focal epilepsy in
deep isoflurane anesthesia is feasible to study focal epilepsy with
fMRI. Development of focal epileptic activity can be detected as
BOLD signal change, even preceding the spike activity in scalp
EEG. This experimental model contains the potential for develop-
ment and testing different localization methods and revealing the
characteristic time sequence of epileptic activity with fMRI during
deep anesthesia.
Acknowledgments
This research was supported by the Emil Aaltonen Founda-
tion. The authors thank Ms. Seija Seljanpera, R.N. for her
excellent technical assistance. Advice and help for the preparation
of catheter insertion in the beginning of the study by Timo
Kaakinen and Janne Heikkinen is gratefully acknowledged.
References
Al-Asmi, A., Benar, C.G., Gross, D.W., Khani, Y.A., Andermann, F., Pike,
B., Dubeau, F., Gotman, J., 2003. fMRI activation in continuous and
spike-triggered EEG-fMRI studies of epileptic spikes. Epilepsia 44,
1328–1339.
Avanzini, G., Franceschetti, S., 2003. Cellular biology of epileptogenesis.
Lancet Neurol. 2, 33–42.
Baumgartner, C., Serles, W., Leutmezer, F., Pataraia, E., Aull, S., Czech, T.,
Pietrzyk, U., Relic, A., Podreka, I., 1998. Preictal SPECT in temporal
lobe epilepsy: regional cerebral blood flow is increased prior to
electroencephalography-seizure onset. J. Nucl. Med. 39, 978–982.
Benar, C.G., Gross, D.W., Wang, Y., Petre, V., Pike, B., Dubeau, F.,
Gotman, J., 2002. The BOLD response to interictal epileptiform
discharges. NeuroImage 17, 1182–1192.
Bruehl, C., Hagemann, G., Witte, O.W., 1998. Uncoupling of blood flow
and metabolism in focal epilepsy. Epilepsia 39, 1235–1242.
Craner, S.L., Ray, R.H., 1991. Somatosensory cortex of the neonatal pig: I.
Topographic organization of the primary somatosensory cortex (SI).
J. Comp. Neurol. 306, 24–38.
Cooper, R., Winter, A.L., Crow, H.J., Grey Walter, W., 1965.
Comparison of subcortical, cortical and scalp activity using chroni-
cally indwelling electrodes in man. Electroencephalogr. Clin. Neuro-
physiol. 18, 217–228.
Davis, T.L., Kwong, K.K., Weisskoff, R.M., Rosen, B.R., 1998. Calibrated
functional MRI: mapping the dynamics of oxidative metabolism. Proc.
Natl. Acad. Sci. U. S. A. 95, 1834–1839.
Ebersole, J.S., Levine, R.A., 1975. Ab normal neuronal responses during
evolution of a penicillin epileptic focus in cat visual cortex.
J. Neuropysiol. 38 (2), 250–256.
Fiol, M.E., Boening, J.A., Cruz-Rodriguez, R., Maxwell, R., 1993. Effect of
isoflurane (Forane) on intraoperative electrocorticogram. Epilepsia 34,
897–900.
Glover, G.H., 1999. Deconvolution of impulse response in event-related
BOLD fMRI. NeuroImage 9, 416–429.
Detsch, O., Kochs, E., Siemers, M., Bromm, B., Vahle-Hinz, C., 2002.
Differential effects of isoflurane on excitatory and inhibitory synaptic
inputs to thalamic neurones in vivo. Br. J. Anaesth. 89, 294–300.
Hoffman, W.E., Edelman, G., 2000. Enhancement of brain tissue oxygen-
ation during high dose isoflurane anesthesia in the dog. J. Neurosurg.
Anesthesiol. 12, 95–98.
Hoge, R.D., Atkinson, J., Gill, B., Crelier, G.R., Marrett, S., Pike, G.B.,
1999. Investigation of BOLD signal dependence on cerebral blood flow
and oxygen consumption: the deoxyhemoglobin dilution model. Magn.
Reson. Med. 42, 849–863.
Igartua, J., Silver, P., Maytal, J., Sagy, M., 1999. Midazolam coma
for refractory status epilepticus in children. Crit. Care Med. 27,
1982–1985.
Jager, L., Werhahn, K.J., Hoffmann, A., Berthold, S., Scholz, V., Weber, J.,
Noachtar, S., Reiser, M., 2002. Focal epileptiform activity in the brain:
detection with spike-related functional MR imaging—Preliminary
results. Radiology 223, 860–869.
Jantti, V., Eriksson, K., Hartikainen, K., Baer, G.A., 1994. Epileptic EEG
discharges during burst suppression. Neuropediatrics 25 (5), 271–273.
Kiviniemi, V., Kantola, J.H., Jauhiainen, J., Tervonen, O., 2004. Compar-
ison of methods for detecting nondeterministic BOLD fluctuation in
fMRI. Magn. Reson. Imaging 22, 197–203.
Kalisch, R., Elbel, G.K., Gossl, C., Czisch, M., Auer, D.P., 2001. Blood
pressure changes induced by arterial blood withdrawal influence bold
signal in anesthesized rats at 7 Tesla: implications for pharmacologic
MRI. NeuroImage 14, 891–898.
Krakow, K., Woermann, F.G., Symms, M.R., Allen, P.J., Lemieux, L.,
Barker, G.J., Duncan, J.S., Fish, D.R., 1999. EEG-triggered functional
MRI of interictal epileptiform activity in patients with partial seizures.
Brain 122 (Pt. 9), 1679–1688.
Lemieux, L., Salek-Haddadi, A., Josephs, O., Allen, P., Toms, N., Scott, C.,
Krakow, K., Turner, R., Fish, D.R., 2001. Event-related fMRI with
simultaneous and continuous EEG: description of the method and initial
case report. NeuroImage 14, 780–787.
Lemieux, L., Salek-Haddadi, A., Krakow, K., 2003. The nature of MR
signal changes. Radiology 226, 922–923 (author reply 923-5).
Morgan, V.L., Price, R.R., Arain, A., Modur, P., Abou-Khalil, B., 2004.
Resting functional MRI with temporal clustering analysis for local-
ization of epileptic activity without EEG. Neuroimage 21 (1), 473–481.
Mueggler, T., Baumann, D., Rausch, M., Rudin, M., 2001. Bicuculline-
induced brain activation in mice detected by functional magnetic
resonance imaging. Magn. Reson. Med. 46 (2), 292–298.
Murao, K., Shingu, K., Tsushima, K., Takahira, K., Ikeda, S., Matsumoto,
H., Nakao, S., Asai, T., 2000. The anticonvulsant effects of volatile
anesthetics on penicillin-induced status epilepticus in cats. Anesth.
Analg. 90, 142–147.
Mustola, S.T., Baer, G.A., Toivonen, J.K., Salomaki, A., Scheinin, M.,
Huhtala, H., Laippala, P., Jantti, V., 2003. Electroencephalographic burst
suppression versus loss of reflexes anesthesia with propofol or
thiopental: differences of variance in the catecholamine and cardiovas-
cular response to tracheal intubation. Anesth. Analg. 97, 1040–1045.
Ogawa, S., Menon, R.S., Kim, S.-G., Ugurbil, K., 1998. On the characte-
ristics of functional magnetic resonance imaging of the brain. Annu.
Rev. Biophys. Biomol. Struct. 27, 447–474.
Opdam, H.I., Federico, P., Jackson, G.D., Buchanan, J., Abbott, D.F.,
Fabinyi, G.C., Syngeniotis, A., Vosmansky, M., Archer, J.S., Wellard,
R.M., Bellomo, R., 2002. A sheep model for the study of focal epilepsy
with concurrent intracranial EEG and functional MRI. Epilepsia 43,
779–787.

M. Makiranta et al. / NeuroImage 27 (2005) 715–724724
Prasad, A., Worrall, B.B., Bertram, E.H., Bleck, T.P., 2001. Propofol and
midazolam in the treatment of refractory status epilepticus. Epilepsia 42,
380–386.
Tenney, J.R., Duong, T.Q., King, J.A., Ludwig, R., Ferris, C.F., 2003.
Corticothalamic modulation during absence seizures in rats: a functional
MRI assessment. Epilepsia 44, 1133–1140.
Vahle-Hinz, C., Detsch, O., Siemers, M., Kochs, E., Bromm, B.,
2001. Local GABA(A) receptor blockade reverses isoflurane’s
suppressive effects on thalamic neurons in vivo. Anesth. Analg.
92, 1578–1584.
Van Camp, N., D’Hooge, R., Verhoye, M., Peeters, R.R., De Deyn, P.P.,
Van der Linden, A., 2003. Simultaneous electroencephalographic
recording and functional magnetic resonance imaging during pentyle-
netetrazol-induced seizures in rat. NeuroImage 19, 627–636.
Willis, C.K., Quinn, R.P., McDonell, W.M., Gati, J., Parent, J., Nicolle, D.,
2001. Functional MRI as a tool to assess vision in dogs: the optimal
anesthetic. Vet. Ophthalmol. 4, 243–253.
Witte, O.W., Bruehl, C., 1999. Distant functional and metabolic disturban-
ces in focal epilepsy. Adv. Neurol. 81, 383–388.
Witte, O.W., Bruehl, C., Schlaug, G., Tuxhorn, I., Lahl, R., Villagran, R.,
Seitz, R.J., 1994. Dynamic changes of focal hypometabolism in relation
to epileptic activity. J. Neurol. Sci. 124, 188–197.