Board-Agenda-11-20-19-R.pdf - Community Action ...
285
COMMUNITY ACTION PARTNERSHIP of KERN BOARD OF DIRECTORS MEETING 5005 Business Park North, Bakersfield, CA November 20, 2019 12:00 pm AGENDA I. Call to Order a. Moment of Silence / Pledge of Allegiance (Please Stand) b. Reading of the “Promise of Community Action” (Please Stand) Community Action changes people’s lives, embodies the spirit of hope, improves communities, and makes America a better place to live. We care about the entire community, and we are dedicated to helping people help themselves and each other. c. Roll Call Janea Benton Nila Hogan Guadalupe Perez Jimmie Childress Mike Maggard Fred Plane Curtis Floyd Jonathan Mullings Ana Vigil Jose Gurrola Yolanda Ochoa Craig Henderson Marian Panos II. Approval of Agenda III. Approval of Meeting Minutes a. Minutes of October 30, 2019 Board of Directors Meeting – Action Item (p. 4-8) IV. Introduction of Guests / Public Forum The public may address the Board of Directors on items not on the agenda. Speakers are limited to 3 minutes. If more than one person wishes to address the same topic, the total group time for the topic will be 10 minutes. Please state your name before making your presentation. V. Special Presentation: a. No Special Presentation VI. New Business a. Resignation of Two Board Members, Warren Peterson (Private Sector) and Lorena Fernandez (Low-Income Sector) and Discussion to Fill Seats – Jeremy Tobias, Chief Executive Officer – Action Item (p. 9-18) b. Resolution to Approve the Submission of a General Child Care and Development Program Expansion Funding Application – Jerry Meade, Program Design & Management Administrator – Action Item (p. 19-20) c. Resolutions to Approve the Submission of the Community Development Block Grant (CDBG) Application to the City of Bakersfield and the County of Kern for Warehouse Capacity Expansion at the Food Bank – Pritika Ram, Director of Administration – Action Item (p. 21-23) 1
-
Upload
khangminh22 -
Category
Documents
-
view
2 -
download
0
Transcript of Board-Agenda-11-20-19-R.pdf - Community Action ...

COMMUNITY ACTION PARTNERSHIP of KERN BOARD OF DIRECTORS MEETING
5005 Business Park North, Bakersfield, CA November 20, 2019
12:00 pm
AGENDA
I. Call to Order
a. Moment of Silence / Pledge of Allegiance (Please Stand)
b. Reading of the “Promise of Community Action” (Please Stand)
Community Action changes people’s lives, embodies the spirit of hope, improves communities, and makesAmerica a better place to live. We care about the entire community, and we are dedicated to helping peoplehelp themselves and each other.
c. Roll Call
Janea Benton Nila Hogan Guadalupe Perez Jimmie Childress Mike Maggard Fred Plane Curtis Floyd Jonathan Mullings Ana Vigil Jose Gurrola Yolanda Ochoa Craig Henderson Marian Panos
II. Approval of Agenda
III. Approval of Meeting Minutes
a. Minutes of October 30, 2019 Board of Directors Meeting – Action Item (p. 4-8)
IV. Introduction of Guests / Public Forum
The public may address the Board of Directors on items not on the agenda. Speakers are limited to 3 minutes. Ifmore than one person wishes to address the same topic, the total group time for the topic will be 10 minutes.Please state your name before making your presentation.
V. Special Presentation:
a. No Special Presentation
VI. New Business
a. Resignation of Two Board Members, Warren Peterson (Private Sector) and Lorena Fernandez (Low-IncomeSector) and Discussion to Fill Seats – Jeremy Tobias, Chief Executive Officer – Action Item (p. 9-18)
b. Resolution to Approve the Submission of a General Child Care and Development Program Expansion FundingApplication – Jerry Meade, Program Design & Management Administrator – Action Item (p. 19-20)
c. Resolutions to Approve the Submission of the Community Development Block Grant (CDBG) Application to theCity of Bakersfield and the County of Kern for Warehouse Capacity Expansion at the Food Bank – Pritika Ram,Director of Administration – Action Item (p. 21-23)
1

Community Action Partnership of Kern Board of Directors Meeting Agenda November 20, 2019 Page 2 of 3
d. Funding Request – City of Bakersfield Public Safety & Vital Services Affordable Housing – Pritika Ram, Director
of Administration – Action Item (p. 24) e. Homeless Services Project Update and New Job Descriptions – Sheila Shegos, Outreach & Grants Administrator
/ CAPK Homeless Project Lead – Action Item (p. 25- )
VII. Committee Reports
a. PRE Committee Report – Pritika Ram, Director of Administration – Action Item i. Minutes from the November 6, 2019 Committee Meeting (p. )
ii. WIC Program Presentation iii. October 2019 Program & Division Reports (p. ) iv. Application Status Reports & Funding Requests for October 2019 (p. ) v. October 2019 Head Start / State Child Development Enrollment Update & September 2019 Meals
Report (p. ) b. Audit & Pension Committee Report – Tracy Webster, Chief Financial Officer – Action Item
i. Minutes from the November 7, 2019 Committee Meeting (p. ) ii. 3rd Quarter 2019 Pension Plan Update (p. )
iii. CAPK 403(b) and 401(a) Retirement Plan Re-Pricing (p. ) c. Budget & Finance Committee Report – Tracy Webster, Chief Financial Officer – Action Item
i. Minutes from the November 13, 2019 Committee Meeting (p. ) ii. Application Status Report & Funding Requests (p. )
iii. Head Start & Early Head Start Budget to Actual Reports (p. ) iv. Changes to Human Resource & Finance Job Descriptions (p. ) v. Federal Financial Report (p. )
vi. Proposed Budget & Finance Committee Agenda Restructure (p. ) vii. Resolution to Approve the Submission of the 2020 Community Service Block Grant (CSBG) Contract
Number 20F-3015 from the Department of Community Services and Development (p. ) viii. Resolution to Approve the Submission of the California Coastal Commission Whale Tail Application for
the Real-Life Eco-Column Project at the Friendship House Community Center and Shafter Youth Center (p. )
ix. Discretionary Fund Update (p. ) x. Financial Statements, October 2019 (p. )
VIII. Advisory Board Reports
a. Head Start Policy Council Report – Nila Hogan, Policy Council Representative – Action Item i. November 2019 Policy Council Report (p. )
ii. October 22, 2019 Policy Council Minutes (p. ) b. Friendship House Advisory Board Report – Carmen Segovia, Director of Health & Nutrition – Action Item
(Verbal Report)
2

Community Action Partnership of Kern Board of Directors Meeting Agenda November 20, 2019 Page 3 of 3
IX. Chief Executive Officer Report – Jeremy Tobias, Chief Executive Officer – Action Item
a. Board Retreat Report: Update on Creation of Foundation (Verbal Report) b. 2020 Board of Directors and Standing Committee Meeting Calendar (p. ) c. Certified Community Action Professional (CCAP) (p. )
X. Board Member Comments
XI. Closed Session
XII. Closed Session Report
XIII. Next Scheduled Meeting
Board of Directors Meeting Wednesday, January 29, 2020 (pending BOD approval) 12:00 pm 5005 Business Park North Bakersfield, CA 93309
XIV. Adjournment
This is to certify that this Agenda Notice was posted in the lobby of the CAPK Administrative Office at 5005 Business Park North, Bakersfield, CA and online at www.capk.org by 12:00 pm, November 15, 2019. Paula Daoutis, Administrative Coordinator.
3

COMMUNITY ACTION PARTNERSHIP of KERN BOARD OF DIRECTORS MEETING
5005 Business Park North | Bakersfield, CA 93309 October 30, 2019
MEETING MINUTES
I. Call to Order
Secretary Yolanda Ochoa called the meeting to order at 12:05 pm at the Community Action Partnership of Kern Administrative Building, located at 5005 Business Park North, Bakersfield, CA.
a. Moment of Silence / Pledge of Allegiance
b. Reading of the “Promise of Community Action”
c. Roll Call
Roll Call was taken with a quorum present:
Present: Jimmie Childress, Craig Henderson, Nila Hogan, Jonathan Mullings, Yolanda Ochoa, Marian Panos, Guadalupe Perez, Fred Plane, Ana Vigil
Absent: Janea Benton, Curtis Floyd, Mike Maggard, Warren Peterson
Others Present: Jeremy Tobias, Chief Executive Officer; Pritika Ram, Director of Administration; Carmen Segovia, Director of Health & Nutrition; Emilio Wagner, Director of Operations; Tracy Webster, Chief Financial Officer
II. Approval of Agenda
Motion was made and seconded to approve the Board of Directors meeting agenda for October 30, 2019. Carried by unanimous vote. (Henderson/Plane).
III. Approval of Meeting Minutes
a. Minutes of the September 25, 2019 Board of Directors Meeting.
Motion was made and seconded to approve the minutes of the September 25, 2019 meeting. Carried by unanimous vote. (Panos/Mullings).
IV. Introduction of Guests / Public Forum
No one addressed the Board.
V. Special Presentations
a. Presentation by Eben Schwartz, Marine Debris Program Manager with the California Coastal Commission provided a report on the beach clean-up event with the Friendship House Community Center and Shafter Youth Center youth participants on the third Saturday of September. Mr. Schwartz invited CAPK to reapply for the 2020 grant and stated the program is funded by the Whale Tale license plates.
b. Pritika Ram introduced the new VITA Program Manager, Jacqueline Guerra who came to CAPK from United Way of Kern as a Tax Preparer / Coordinator.
VI. New Business
a. Update and Direction of County & City Low Barrier Homeless Shelter – Sheila Shegos, Outreach & Grants Administrator – Action Item
4

Community Action Partnership of Kern Board of Director Meeting Minutes October 30, 2019 Page 2 of 5
Jeremy Tobias provided opening remarks and stated that the homeless shelters proposed by both the County & City are highly visible in the community. Both entities have recognized the urgent need to create low barrier shelters and CAPK has been asked to consider being the Operator of both shelters. At CAPK, staff recognizes this as a call to service and a call to action for the community we serve. The Board appointed an ad-hoc committee to provide assistance and guidance to staff. The County is moving quickly and recently approved an emergency declaration and they have expressed a strong desire for CAPK to be the sole operator. The emergency declaration allows for the County to bypass the normal RFP requirements, which will expedite the process. The City has reached an agreement to purchase a building on East Brundage. CAPK has had active discussions in operating their facility; however, it is not likely that they will move at the same pace as the County. Jeremy reminded the Board that Sheila Shegos has been named the Point Person for the homeless project and Sheila provided additional comments. Sheila stated that staff is meeting regularly with the County and the Office of Public Health is also involved to provide insight for public health and sanitary needs, meals, restroom areas, showers, etc. The County plan is to eventually house 150 beds; however, they propose to start smaller with 50 beds to logically work out all issues before expanding. Safety is a concern and the plan for the County is to budget $400,000 for 2 security guards 24/7 365 days per year and install security cameras throughout the facility and grounds. The Board addressed a variety of concerns about CAPK not having enough say in the management of the facility to the screening of participants. While those are valid concerns, Jeremy stated that Low Barrier does not mean “No” Barrier. Staff has been very involved with the planning, consulting with service providers, visiting other similar shelters across the state, and contractual matters. Jeremy and Fred Plane, a member of the ad-hoc committee, assured the Board that no contract will come before the Board if it does not make sense for CAPK. Fred also asked the Board to trust the staff to negotiate the details. Given the concerns addressed by the Board, Jeremy proposed revising the original recommendation to allow staff to continue to work with local officials from both the County and City and any proposed contracts will be brought before the Board for approval. Motion was made and seconded to amend the motion to authorize staff to continue negotiations and direct the CEO to provide the contract for Board review and approval. Carried by a vote of 8 in favor, 0 opposed, and 1 abstention (Vigil/Perez).
b. Ad Hoc Housing Committee Update – Pritika Ram, Director of Administration – Info Item
Pritika Ram provided an update from the Ad Hoc Housing Committee has been working with a Housing Advisor from California Community Economic Development Association (CCEDA) and has proposed that a housing needs assessment and competitive analysis through a MOU be completed. Staff and the Committee are also researching possible grant opportunities. The Committee will keep the Board apprised of any new developments.
c. Board Retreat Action Item: Capital Campaign / Fundraising – Pritika Ram, Director of Administration – Info Item
Pritika Ram provided an update on the Board Retreat Action Item for the Capital Campaign / Fundraising and stated that staff has investigated capital campaign options. Pritika has met with four individuals to gather information on a capital campaign for CAPK. We are currently at the assessment phase and a detailed
5

Community Action Partnership of Kern Board of Director Meeting Minutes October 30, 2019 Page 3 of 5
assessment is required. Upon completion of the assessment, the next step is to provide CAPK with the analysis which will be a temperature check on how CAPK is viewed in the community and what tools are needed to move forward. Pritika will reach out to partners and will seek proposals and will create an RFP to move forward. The second part is the foundation and the question remains, does CAPK want to move forward with a foundation? It does seem feasible to have a foundation to include a small foundation Board that will be tasked with outreach and fundraising and will look to philanthropists. Craig asked if the foundation would be under the CAPK board, and report to this board? Pritika will research and get a legal opinion. There are specific legal requirements and limitations but the best way to control the foundation is to seat good Board Members, and ensure that the Articles of Incorporation and Bylaws are well written.
d. Board Retreat Action Item: 2020 Board Governance Calendar – Pritika Ram, Director of Administration –
Action Item
Pritika Ram provided a copy of the 2020 Board Governance Calendar which was an action item from the Board
Retreat.
Motion was made and seconded to approve the 2020 Board Governance Calendar. Carried by unanimous
vote. (Plane/Panos).
e. Board Retreat Action Item: Update on Agency Customer Relations Management (CRM) Platform – Emilio Wagner, Director of Operations – Info Item
Emilio Wagner provided an update from the Board Retreat Action Item for the Agency Customer Relations Management (CRM) platform. Staff has selected Microsoft 365. The 211 and Energy programs are testing it now. Once testing is completed, we will have a better idea of the total cost. A cost estimate is expected by the end of November or early December.
VII. Committee Reports
a. Executive Committee Report – Jeremy Tobias, Chief Executive Officer – Action Item
Jeremy reported that the Executive Committee met on October 10 at the direction of the Board to review and approve the final Employee Health Insurance plan for next year. The final plan was approved by the Ad-Hoc Committee and Executive Committee. Motion was made and seconded to approve the Executive Committee Report and all action items. Carried by unanimous vote (Henderson/Perez).
b. PRE Committee Report – Pritika Ram, Director of Administration – Action Item
Pritika Ram reported that four Action Items were approved by the PRE Committee at the October meeting. Motion was made and seconded to approve the PRE Committee Report and all items. Carried by unanimous vote (Henderson/Childress).
6

Community Action Partnership of Kern Board of Director Meeting Minutes October 30, 2019 Page 4 of 5
c. Budget & Finance Committee Report – Tracy Webster, Chief Financial Officer – Action Item
Tracy reported that twelve Action Items were approved, and one was tabled with the recommendation to bring back to the Committee at the November meeting. Tracy reported that it was not necessary to utilize the line of credit for the month of September. Central Kitchen expenditures are at 48.7% as of September 30, 2019 and USDA revenue was at 49.9%. Expenditures ae below target at month 7 in the budget period. Agency expenditures are currently at 47% for the year. The Indirect Fund budget to actual report for month-end September 30, 2019 showed that revenue exceeded expenditures by $146,069 which is 28% of the budgeted indirect revenue. Overall expenditures are 53.6% of budget and is less than 58.233% at month 7 of the 12-month budget period. Motion was made and seconded to approve the Budget & Finance Committee Report and all items. Carried by unanimous vote (Henderson/Vigil).
VIII. Advisory Board Reports
a. Head Start Policy Council Report – Nila Hogan, Council Representative – Action Item
Nila Hogan provided the Head Start Policy Council Report for the month of October.
Motion was made and seconded to approve the Head Start Policy Council Report. Carried by unanimous vote. (Childress/Henderson).
b. Friendship House Community Center Advisory Board Report – Fuchsia Ward, Advisory Board Member – Action
Item
Fuchia Ward provided the Friendship House Community Center Advisory Board Report and stated that the gala event held on October 24, 2019 was a success. Early report is that $13,000 was raised to support the Center. Motion was made and seconded to approve the Friendship House Community Center Advisory Board Report. Carried by unanimous vote (Plane/Vigil).
IX. Chief Executive Officer Report
a. Jeremy Tobias reported that he spoke with Warren Peterson about resigning from the Board due to his out-
of-state employment. Warren agreed to resign effective October 31, 2019 and expressed his gratitude to the Board for allowing him to serve for so many years.
Yolanda Ochoa raised the issue of attendance for Lorena Fernandez and said that Lorena has not met the agreed upon attendance requirements and requested the Board take action to remove her. Jeremy asked the members of the Board if they wished to add any comments. Ana Vigil agreed that Lorena needs to be removed so we can ensure that the individuals in the South Kern Low-Income Sector are being served. Jeremy informed
7

Community Action Partnership of Kern Board of Director Meeting Minutes October 30, 2019 Page 5 of 5
the Board that staff will follow the Bylaws and issue a letter to Lorena to advise her of Board Action at the November meeting. Motion was made and seconded to approve the Chief Executive Officer’s Report. Carried by unanimous vote. (Plane/Vigil).
X. Board Member Comments
a. Ana Vigil praised the work of the Friendship House Advisory Board for a successful event. b. Marian Panos complimented the work of staff and the Policy Council for their year-end event. c. Yolanda Ochoa said she has met her 5-year commitment on the Policy Council and asked for others to step up
to be the Board Representative.
XI. Closed Session
a. Conference with Real Property Negotiations Property Address: 5005 Business Park North, Bakersfield, CA 93309 Agency Negotiator: Jeremy Tobias Negotiating Parties: Region IX Under Negotiation: Price & Authority
c. Reconvened into open session at 1:52 pm.
XII. Closed Session Report
Jeremy Tobias reported that the Board gave staff direction to proceed with property negotiations.
XIII. Next Scheduled Meeting
Board of Directors Meeting Wednesday, November 20, 2019 12:00 p.m. 5005 Business Park North Bakersfield, CA 93309
XIV. Adjournment
The meeting adjourned at 1:53 p.m.
8

COMMUNITY ACTION PARTNERSHIP OF KERN
MEMORANDUM
To: Board of Directors
From: Jeremy T. Tobias, CEO
Date: November 20, 2019
Subject: Agenda Item VI(a): Resignation of two Board members, Warren Peterson (Private Sector) and Lorena Fernandez (Low-Income Sector) and discussion on filling the positions – Action Item
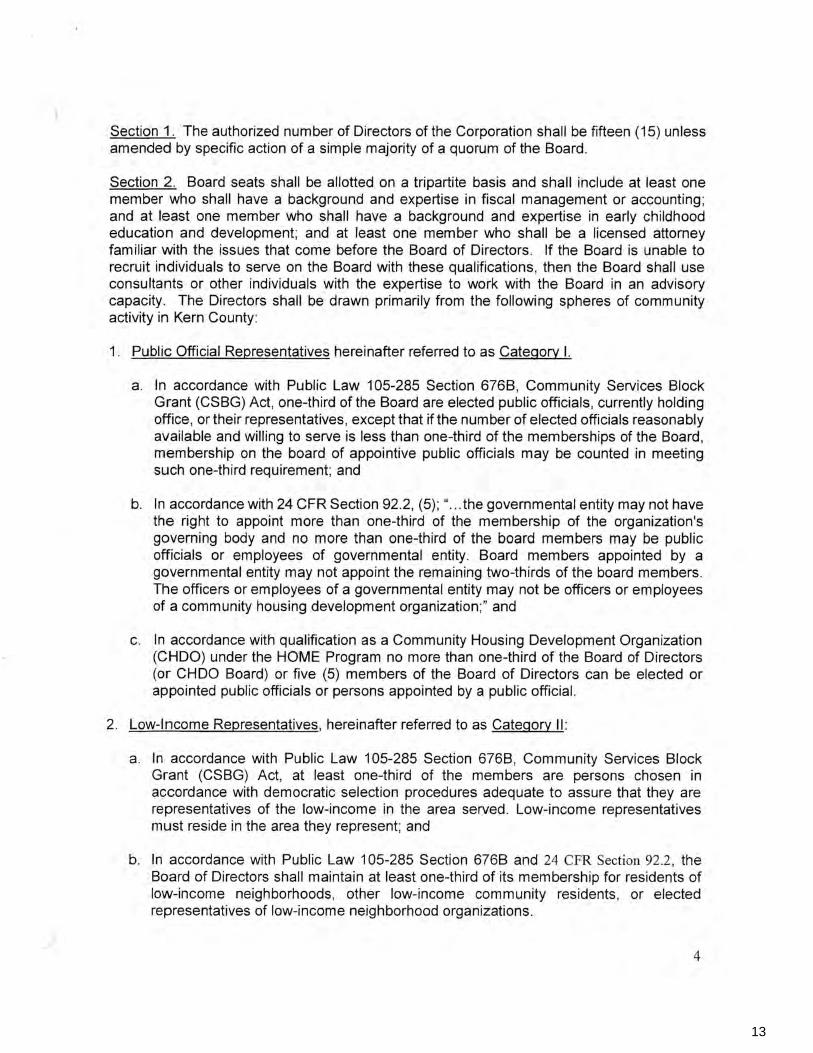
As the Board is aware, we have received the resignations of two Board members: Warren Peterson (Private Sector) and Lorena Fernandez (Low-Income Sector). Both resignations are effective immediately. The resignation letters are attached. Each of the two sectors carry different requirements for appointments to the Board. However, with these two resignations, there is an option to fill the seats simultaneously and effectively. The Community Action Partnership of Kern By-laws, Article I, Section 3, item B state that if a low-income representative fails to complete his/her term of office, the Board will have the option of appointing a successor to complete the remainder of the term (see attached by-law sections). This is in-lieu of the regular formalized election process which can be a much longer procedure. The term of the now vacant low-income seat is July 1, 2017 through July 1, 2022. The Private Sector selections process is the use of community notices, applications and a review of applicants by an Elections Committee and a recommendation to the full Board to make the appointment as described in Article I, Section 3, item C. Staff recommends following a similar procedure for both seats. Each seat would be advertised accordingly, and applications sought. An Elections Committee would be appointed to review and interview applicants and make a recommendation to the Board of Directors for final appointment to the open seat. Recommendation: Staff recommends the Board of Directors authorize the Chairperson to appoint a three person elections committee, direct staff to advertise and promote the two open Board seats, present all applications to the Elections Committee and present the committee recommendations to the Board of Directors for appointment. Attachments: Resignation letters form Warren Peterson and Lorena Fernandez
Excerpts of CAPK Bylaws, Article I
9

10

11

12
13
14

15

16

17

18

COMMUNITY ACTION PARTNERSHIP OF KERN
MEMORANDUM
To: Board of Directors From: Jerry Meade, Program Design and Management Administrator
Date: November 20, 2019
Subject: Agenda Item VI(b): Resolution to Approve the Submission of a General Child Care and Development Program Expansion Funding Application– Action Item
The California Department of Education (CDE) Early Learning and Care Division announced the availability of approximately $50 million for General Child Care and Development funds, commonly referred to as CCTR. The Head Start and State Child Development Division blends CCTR funding with Early Head Start (EHS) funds providing center-based services for children of families needing childcare in order to work, attend school, or job-training. CCTR expansion funding is rare and program is capitalizing on this opportunity for both our Kern and San Joaquin County EHS programs. The CCTR funds for our San Joaquin County program will significantly improve our ability to meet community needs.
The funds will be used to expand blended funding at EHS center-based slots by 170 in Kern, which will support the EHS Expansion awarded (146 slots) by the Office of Head Start in July 2019, as well as the EHS Child Care Partnership (24 slots) grant awarded in March 2019. Additionally, this CCTR application will request funds to expand services for 166 of our EHS slots in San Joaquin County using the blending methodology currently used in Kern.
The funding calculations estimated below are based on an annualized budget to serve 336 children no less than 245 days:
General Child Care and Development Kern County: $2,490,342 General Child Care and Development SJC County: $2,655,070 Total $5,145,412
Recommendation Staff recommends the Board of Directors approve with resolution, the submission of the California Department of Education General Child Care and Development Program Expansion Funding Application. Attachments: Resolution 2019-24 approving General Child Care and Development Program Expansion Funding Application.
19

RESOLUTION # 2019-24
A Resolution of the Board of Directors of the Community Action Partnership of Kern
Approving the Submission of the General Child Care and Development Program Expansion Funding Application
The Board of Directors, of Community Action Partnership of Kern located at 5005 Business Park North, Bakersfield, CA 93309, met on November 20, 2019, in Bakersfield, California at a scheduled Board meeting and resolved as follows: WHEREAS, Community Action Partnership of Kern (CAPK) is a private, non-profit 501(c)(3) corporation established as a result of the Economic Opportunity Act of 1964, and is the federally designated community action agency serving the low-income, elderly and disadvantaged residents of Kern County; and WHEREAS, CAPK is charged with the responsibility of continuing the battle to alleviate poverty in Kern County by developing and implementing creative and innovative programs, and has adopted the philosophical position of “Helping People, Changing Lives’ in its quest to assist people in need, and families with minimal or no resources; and WHEREAS, the California Department of Education has offered expansion dollars for the General Child Care and Development funds; and WHEREAS, the Head Start and State Child Development Division is requesting $5,145,412 to serve 336 children in Kern and San Joaquin Counties; and WHEREAS, the California Department of Education requires that an authorized signatory be named for the General Child Care and Development Application; and NOW, THEREFORE, be it resolved that the Executive Committee of the Board of Directors hereby authorizes Jeremy T. Tobias, Chief Executive Officer, to act on behalf of the Board as CAPK’s representative signatory with regard to the General Child Care and Development Application. APPROVED by a majority vote of the Board of Directors of Community Action Partnership of Kern, this 20th day of November 2019. __________________________ ____________________ Curtis Floyd, Chair Date CAPK Board of Directors
20

COMMUNITY ACTION PARTNERSHIP OF KERN
MEMORANDUM
To: Board of Directors
From: Pritika Ram, Director of Administration
Date: November 20, 2019
Subject: Agenda Item VI(c): Resolutions to Approve the Submission of the Community Development Block Grant (CDBG) Application to the City of Bakersfield and the County of Kern for Warehouse Capacity Expansion at the Food Bank– Action Item
Background Community Action Partnership of Kern (CAPK) is requesting up to $500,000 each from the City of Bakersfield and the County of Kern for the 2020-2021 Community Development Block Grant (CDBG) funding for the expansion of the CAPK Food Bank warehouse by 25,000 to 30,000 square feet. The remaining funds will be provided through CAPK activities, including a capital campaign. The increase in need for emergency food assistance in Kern County, along with the introduction of new food programs, require additional operating space. The CAPK Food Bank added the Senior Food Program to serve low-income senior residents aged 60 years and older resulting in an increased caseload from 3,500 to 4,100 participants a month. Currently, the senior food program is operating off-site on a leased property for additional space, which directly impacts costs and operational efficiencies. In addition to our communities’ increased reliance on our distribution partners, we are finding areas that are undeserved, but are limited due to space. For these reasons, an increase in space and improved workflow is imperative in growing the Food Bank. The CDBG applications are due to the City of Bakersfield by November 22, 2019, and the County of Kern by December 6, 2019. Recommendation
Staff recommends the Board of Directors approve the two Resolutions approving the submission of the Community Development Block Grant (CDBG) application to the City of Bakersfield and the County of Kern for Warehouse Capacity Expansion at the Food Bank. Attachments: Resolution Number 2019-25 Resolution Number 2019-26
21

RESOLUTION # 2019-25
A Resolution of the Board of Directors of the Community Action Partnership of Kern
Approving the Submission of Application for 2020-2021 City of Bakersfield Community Development Block Grant (CDBG) Funds
The Board of Directors of Community Action Partnership of Kern, located at 5005 Business Park North, Bakersfield, CA 93309 met on November 20, 2019 at a scheduled Board meeting located at 5005 Business Park North, Bakersfield, CA 93309, and resolved as follows: WHEREAS, Community Action Partnership of Kern (CAPK) is a private, non-profit 501(c)(3) corporation established as a result of the Economic Opportunity Act of 1964, and is the federally designated community action agency serving the low-income, elderly and disadvantaged residents of the City of Bakersfield; and WHEREAS, CAPK is charged with the responsibility of continuing the battle to alleviate poverty in Bakersfield by developing and implementing creative and innovative programs, and has adopted the philosophical position of “Helping People, Changing Lives,” in its quest to assist people in need, and families with minimal or no resources; and WHEREAS, CAPK Board of Directors has determined that there is a need for anti-poverty programs to meet the needs of the low-income residents of the City of Bakersfield; and NOW, THEREFORE, be it resolved that the CAPK Board of Directors hereby authorizes staff to submit an application to the City of Bakersfield, and hereby requests the City of Bakersfield provide financial assistance and the obligations that accompany said funds for the purpose of expansion of the CAPK Food Bank Warehouse facility. Be it further resolved that Jeremy T. Tobias, Chief Executive Officer, is hereby authorized to request this course of action by completing any and all application documents for submittal to the City of Bakersfield on behalf of Community Action Partnership of Kern. APPROVED by a majority vote of the Directors of the Community Action Partnership of Kern, this 20th day of November 2019.
__________________________ ____________________ Curtis Floyd, Chair Date CAPK Board of Directors
22

RESOLUTION # 2019-26
A Resolution of the Board of Directors of the Community Action Partnership of Kern
Approving the Submission of Application for 2020-2021 County of Kern Community Development Block Grant (CDBG) Funds
The Board of Directors of Community Action Partnership of Kern, located at 5005 Business Park North, Bakersfield, CA 93309 met on November 20, 2019 at a scheduled Board meeting located at 5005 Business Park North, Bakersfield, CA 93309, and resolved as follows: WHEREAS, Community Action Partnership of Kern (CAPK) is a private, non-profit 501(c)(3) corporation established as a result of the Economic Opportunity Act of 1964, and is the federally designated community action agency serving the low-income, elderly and disadvantaged residents of the County of Kern; and WHEREAS, CAPK is charged with the responsibility of continuing the battle to alleviate poverty in Bakersfield by developing and implementing creative and innovative programs, and has adopted the philosophical position of “Helping People, Changing Lives,” in its quest to assist people in need, and families with minimal or no resources; and WHEREAS, CAPK Board of Directors has determined that there is a need for anti-poverty programs to meet the needs of the low-income residents of the County of Kern; and NOW, THEREFORE, be it resolved that the CAPK Board of Directors hereby authorizes staff to submit an application to the County of Kern, and hereby requests the County of Kern provide financial assistance and the obligations that accompany said funds for the purpose of expansion of the CAPK Food Bank Warehouse facility. Be it further resolved that Jeremy T. Tobias, Chief Executive Officer, is hereby authorized to request this course of action by completing any and all application documents for submittal to the County of Kern on behalf of Community Action Partnership of Kern. APPROVED by a majority vote of the Directors of the Community Action Partnership of Kern, this 20th day of November 2019.
__________________________ ____________________ Curtis Floyd, Chair Date CAPK Board of Directors
23

24

Community Action Partnership of Kern Board of Directors Meeting
November 20, 2019
PLACE HOLDER Agenda Item VI(e): Homeless Services Project Update & New Job Descriptions – Sheila Shegos, Outreach & Grants Administrator / CAPK Homeless Project Lead – Action Item The job descriptions listed in Item VI (e) are set for a final review by staff on Tuesday, November 19th and are not included in the agenda packet. The memo and job descriptions will be emailed to you by end of day on Tuesday, November 19th and will be included in the agenda packet displayed on your iPads the day of the meeting.
25

COMMUNITY ACTION PARTNERSHIP of KERN BOARD OF DIRECTORS
PROGRAM REVIEW & EVALUATION COMMITTEE MEETING November 6, 2019
12:00 pm
MEETING MINUTES
1. Call to Order
Committee Chair Yolanda Ochoa called the meeting to order at 12:00 pm. 2. Roll Call
Roll Call was taken with a quorum present.
Present: Jose Gurrola, Nila Hogan, Yolanda Ochoa, Marian Panos
Absent: Jonathan Mullings
Others Present: Jeremy Tobias, Chief Executive Officer, Pritika Ram, Director of Administration; Carmen Segovia, Director of Health & Nutrition; and other CAPK staff.
3. Approval of Agenda
Motion was made and seconded to approve the Program Review & Evaluation Committee meeting agenda for November 6, 2019 as amended to include item 6b #4. Carried by unanimous vote. (Panos/Mullings).
4. Public Forum
No one addressed the Committee. 5. Program Presentation
Jacquelin Byrd, WIC Outreach & Public Relations Coordinator provided an overview of the program. On a monthly basis, CAPK WIC serves 16,160 participants from 23 locations throughout Kern County and the San Bernardino Mountains. The State of California has a total of 3,882 WIC vendors and 183 vendors are in Kern County. CAPK WIC is the only WIC agency in Kern County that provides breastfeeding peer counseling support 24/7. New WIC Cards will be arriving in Kern County on February 18, 2020 and will replace the vouchers. The cards will be a big improvement over the current system. Jacqueline played a video that showcased the WIC program and featured the WIC bus. The Committee requested that the WIC bus be brought to the BPN office on the date of a future Board Meeting so the Board can tour the bus.
26

Community Action Partnership of Kern Program Review & Evaluation Committee Minutes November 6, 2019 Page 2 of 3
6. New Business
a. October 2019 Program & Division Reports – Pritika Ram, Director of Administration – Action Item
Sheila Shegos provided a summary of each of the monthly program reports for October and stated that all had noteworthy accomplishments. However, Sheila highlighted the new CalFresh Healthy Living program, and said that staff has done an amazing job with the start-up and are busy filling the open positions, setting up offices, and working with program partners. Motion was made and seconded to approve the October 2019 Program & Division Reports. Carried by unanimous vote. (Hogan/Gurrola)
b. Application Status Reports & Funding Requests – Pritika Ram, Director of Administration
– Action Item 1. California Department of Social Services for CAPK’s CalFresh Healthy Living Program.
2. California Coastal Commission for Friendship House Community Center and Shafter
Youth Center Kids Ocean Day.
3. The Center at Sierra Health Foundation for CAPK Census 2020.
4. Department of Human Services for the Medi-CAL Outreach Grant.
Sheila Shegos provided the Application Status Report for October and summarized the
four funding requests presented in the agenda packet.
Motion was made and seconded to approve the Application Status Reports & Funding
Requests. Carried by unanimous vote. (Panos/Gurrola).
c. October 2019 Head Start / State Child Development Enrollment Update & Meals Report – Ginger Mendez, HS State Enrollment / Attendance Manager – Action Item
Ginger Mendez reported that HS Kern and EHS San Joaquin achieved 100% enrollment. EHS Kern was at 86% and EHS Partnerships was at 39%. Most of the under-enrollment issues are due to facility renovations. The Office of Head Start is aware of the issues and are very supportive of CAPK’s efforts to meet enrollment requirements. There were six recruitment events in October resulting in 23 applications and staff is hopeful that enrollment numbers will rise. Enrollment for children with disabilities is increasing with two programs exceeding the 10% requirement. HS Kern is at 8.6% and EHS Partnerships is at 4%. All programs met the goal of less than 10% in the over income category. Overall daily attendance is 98% and four sites achieved 100%. Ginger reported that Risk Assessments were completed that included 90 comprehensive child file reviews. Individualized trainings are being provided for staff that were identified as needing improvement.
27

Community Action Partnership of Kern Program Review & Evaluation Committee Minutes November 6, 2019 Page 3 of 3
A total of 85,587 meals were served in September to equal 87%
Motion was made and seconded to approve the October 2019 Head Start / State Child Development Enrollment Update & Meals Report. Carried by unanimous vote. (Hogan/Mullings).
7. Committee Member Comments
Pastor Jonathan Mullings said that he appreciates the Food Bank’s efforts to provide food in all areas of Kern County. Yolanda Ochoa reminded the Committee that the CAPK/KGET food drive is taking place outside of the KGET studios next Wednesday and encouraged volunteerism and donations.
8. Next Scheduled Meeting
Program Review & Evaluation Wednesday, January 15, 2019 (Pending Board Approval) 12:00 pm 5005 Business Park North Bakersfield, CA 93309
9. Adjournment
The meeting adjourned at 12:43 pm.
28

COMMUNITY ACTION PARTNERSHIP OF KERN DIVISION/PROGRAM MONTHLY ACTIVITY REPORT
Division/Director: Administration/Pritika Ram Month/Year: October 1- October 30, 2019
Program/Work Unit: 2-1-1 Kern County
Staffing: 22 (1 Vacancy) Program Manager: Irene Fonseca
Services: Provides 24/7 information and referral services via phone or CAPK’s website to residents of Kern. Also provides call handling services for Kings, Tulare, and Stanislaus Counties. 211 schedules appointments, provides status updates on pending applications and mailed applications to clients for the CAPK Energy Program utility assistance services. As of October 2018, the Kern County Coordinated Entry System initiated as a program within 2-1-1 Kern.
Activities Description
Information & Referral Services Incoming Answered Unanswered Referrals
Kern County 4,949 4,474 475(10%) 8,494
Kings County 204 185 19(9%) *
Tulare County 758 702 56(7%) *
Stanislaus County 1,062 963 99(9%) *
Total 6,973 6,324 649(9%)
*2-1-1 Kern does not have access to the iCarol database for these counties. Per the agreements, 2-1-1 Kern provides referrals butdoes not track them. The information goes directly to the iCarol databases for the individual counties.
Most Requested Services Food Pantries Homeless Shelter Utility Assistance
Top 3 Unmet Needs Rental Assistance Transportation Developmental Screenings
Other Services Month YTD
LIHEAP Calls Answered 5,459 40,513
Weatherization Calls Routed through 2-1-1 378 4,833
Mental Health Calls Answered 293 2,518
Website Visitors Visitors to CAPK’s 2-1-1 Kern web page 4,056 44,019
VITA Calls Routed through 2-1-1 N/A 6,944
CalFresh Enrollments Onsite enrollment into CalFresh (Supplemental Nutrition Assistance Program (SNAP/food stamps)
Submitted Approved Pending
24 8 16
Coordinated Entry System (CES)
Entry point for the homeless population in Kern County.
211 Homeless Calls
QRT Received
Assessments Completed
733 30 189
Outreach Activities Outcomes
- Veterans Stand Down Resource Fair- Good Neighbor Festival- Bridges Academy Back to School Night- Hart Park After Dark- Shafter Youth Center Fall Festival Resource Fair
− 211 Kern - informational cards: 250
− 211 Kern - informational cards: 150
− 211 Kern- informational cards: 100
− 211 Kern- informational cards: 150
− 211 Kern- informational cards: 150
Highlights: 211 Program Manager attended the Northwest AIRS Educational Conference in Portland Oregon. 211 CES Program Coordinator attended the Clarity Conference in Las Vegas Nevada and the Community Solutions Built for Zero Conference in Denver Colorado. All conferences attended provided educational information used to enhance our services.
29

COMMUNITY ACTION PARTNERSHIP OF KERN DIVISION/PROGRAM MONTHLY ACTIVITY REPORT
Division/Director: Nutrition Services/Carmen Segovia Month/Year: October / 2019
Program/Work Unit: CalFresh Healthy Living
Total Program Staffing: 8 Program Manager/Supervisor: Tammy Fisher
Program/Work Unit Description: CAPK with funded and unfunded community partners that reflect the geographic, cultural, and ethnic diversity of Kern County will implement strategies and/or interventions in communities to help establish healthy eating habits and a physically active lifestyle, in accordance with the Supplemental Nutrition Assistant Program Education (SNAP-Ed) guidance mandated by the Food and Nutrition Act under Section 28, with an interest in improving nutrition, physical activity, public health, the built environment, and health care where we work, live, shop, learn and play.
Activities Description Status
Month YTD
The lease was fully executed to house the CalFresh Healthy Living (CFHL) Program. The address is: 2323 16th Street, Suite 302 Bakersfield 93301 Phone: 661-439-3838 Fax: 661- 379-8437
Office space for this program was occupied by CAPK staff on 10/21/19
Recruitment for all positions started on October 1, 2019.
The Program Manager and Coordinator positions have been filled. Of the 5 Health Educator positions, 2 have been filled. Interviews for 3 Health Educators and the Program Assistant are in process.
Budget revision Staff submitted a budget revision to reflect the actual needs of the program. For example, now that the program has an actual office space, the occupancy costs will be projected more accurately.
Met with sub-contracted partners Reviewed process for submitting monthly claims reports to CAPK.
Other: 1. CAPK has three sub-contracted partners: Kern Superintendent of Schools (KCSOS), Lamont Elementary School
District/Lamont Weedpatch Family Resource Center (LESD/LWFRC), and Kernville Union School District (KUSD).The three school districts are using evidence-based education curriculums to engage students in nutritioneducation standards, implementing healthy eating/active lifestyle changes and sustainability measures in theircommunities.
2. Staff procured some office furniture and computers necessary to be operational and is in the process ofprocuring other office supplies such as file cabinets, a copier, and other items needed by the program.
3. In the future, staff will be reporting on direct and indirect education activities.
Staffing: Staffing for this program will include a Program Manager, a Program Coordinator, a Program Assistant, 5 Health Educators and an Accountant.
30

COMMUNITY ACTION PARTNERSHIP OF KERN DIVISION/PROGRAM MONTHLY ACTIVITY REPORT
Div./Director: Fiscal Administrator, Donna Holland Month/Year: October 2019
Program/Work Unit: Central Kitchen Staffing: 22 Staff Members Program Manager: Lorenzo Maldonado
Services: Preparation and delivery of meals and snacks for children enrolled in CAPK’s Head Start/Early Head Start and Home Base option. The program provides the meals for the H.S. /E.H.S and Home Base. The program also delivers food service and janitorial supplies to the Head Start/Early Head Start centers and Home Base locations.
• Total meals prepared are supported by the daily meal production sheets and food transport sheets.
• Home base meal totals are supported by meal request forms submitted by center and Home Base staff.
Activities Status
Meals & Snacks Total # Prepared Breakfast Lunch Snack
Central Kitchen prepared for the HS/EHS centers 81,189 29,221 25,720 26,248
Home Base Meals 100 46 29 25
Total 81,289 29,267 25,749 26,273
Other:
1. Food handlers’ cards were obtained by the Central Kitchen’s Food Production Drivers in the month of October. All eleven Food Production Drivers with the assistance of Olivia Kent were able to take the online course and test to obtain their food handlers’ card. Nine out of the eleven Food Production Drivers have passed the training with an average score of 85%.
2. Central Kitchen being under Head Start program the Central Kitchen staff will now do the staff development sessions with the Head Start team. The Central Kitchen staff is looking forward to meeting the rest of the team. The Central Kitchen is looking forward this year’s staff development and all the activities.
3. The Central Kitchen’s walk-in freezer had to be shut down for a few days to replace the flooring. United Refrigeration replaced the flooring in the walk-in freezer. The flooring was replaced with diamond cut metal sheet to add traction to the floor. The Central Kitchen management searched for a vendor who could replace the flooring. There were seven vendor that were called for service out of the seven United Refrigeration is the only vendor that can do the work. The flooring has become slippery with time and the use of it. The flooring is being redone in the freezer to make so that it is safer for staff to work inside the freezer without worry of injury.
4. In staying with compliance with safety the Central Kitchen has added an eye wash station that meets the Cal-OSHA requirements for an eyewash station. The eyewash station is centrally localized in the kitchen where in case of an emergency is easily accessible. The Central Kitchen staff have been given instruction on how to use the eyewash system in case of an emergency.
31

COMMUNITY ACTION PARTNERSHIP OF KERN DIVISION/PROGRAM MONTHLY ACTIVITY REPORT
Division/Director: Community Development/Pritika Ram Month/Year: October 2019
Program/Work Unit: Community Development Division
Total Staffing: 6 Program Manager/Supervisor: Sheila Shegos
Services: Grant research on funding resources and opportunities, proposal preparation, and special projects. Media and public relations, agency and program promotional materials, advocacy, social media and website management, special events and fundraising, English-Spanish translations. Community Development Team Activities
In October, the Outreach Team assisted the Friendship House Community Center Advisory Board in promoting the annual Friendship House Gala at the Bakersfield Museum of Art. We provided materials, press releases and media appearances for the event. We also promoted the donation of 400 winter jackets by Aera Energy and Assemblymember Salas to Head Start sites from Delano to Arvin. We attended the events and publicized it through social media. Team members also worked on messaging for the Kern County low-barrier shelter initiative. The Grants Team has been adding users to the new system, GrantHub and will be conducting training soon. The team held the 2nd annual Grants Day on October 3rd. The team hosted a two-day “Your Money Your Goals” Train the Trainer event October 17th and 18th, facilitated by the Consumer Financial Protection Bureau, for CAPK and outside partners.
Advocacy • Helped coordinate Congressman T.J. Cox tour of Friendship House Community Center.
• Attended the Downtown Business Association Block-to-Block luncheon.
• Shot, edited and released “Kids County Too” video for Kern Counts Census Partnership.
Outreach • Launched CalEITC and VITA marketing efforts for 2019-2020.
• Participated in meetings to develop plan for Kern County low barrier homeless shelter.
• Began work on CAPK and Head Start Annual Report.
• Promoted IKEA furniture build-up at the Friendship House Community Center.
• Shot video for Head Start Program.
Special Events
• Participated in the Veterans Stand Down Event on Oct. 10.
• Assisted in support of the Friendship House Community Center Gala on Oct. 24.
• Attended K.I.T.E. Committee event at Edwards Airforce Base.
Grants • Sierra Health Foundation, Census 2020 Outreach.
• CDBG City and County Applications: Exploring projects-Housing, Food Bank Expansion.
• Whale Tail: Youth Centers Beach trips.
Research • Complete Count Census.
• Capacity and program funding for East Kern Family Resource Center, VITA and Youth Centers.
• Affordable housing for low-to-moderate income families
• Funding for the Food Bank Expansion Project.
Projects • Homeless Low Barrier Shelters: City and County.
• 2020 Census, Kern County Census Committee.
• Completing certification for ROMA via review and taking test to become ROMA Certified
32

COMMUNITY ACTION PARTNERSHIP OF KERN DIVISION/PROGRAM MONTHLY ACTIVITY REPORT
Division/Director: Nutrition Services/Carmen Segovia Month/Year: October/ 2019
Program/Work Unit: East Kern Family Resource Center
Total Program Staffing: 5 Program Manager/Supervisor: Whitney Hughes
Program/Work Unit Description: Serves low-income individuals and families residing in East Kern County communities of Boron, California City, Mojave, North Edwards, Rosamond, and Tehachapi. Services include case managing families with children who are at risk of abuse and neglect (Differential Response); preparing children to enter kindergarten (School Readiness Initiative); parenting education; emergency supplies closet for immediate basic needs such as clothing, food, diapers, infant formula, bus passes, and gas vouchers.
Activities Description Status
Month YTD
Referrals for services Case Managed Families
Differential Response F5K School Readiness Economic Empowerment
39 1 0
234 34 47
Children enrolled in center-base program 3 21
Adults in Court Mandated Parenting Classes 23
Services to Walk-ins Services e.g., faxing and photocopying legal documents (such as such as birth certificates, Social Security cards, immigration status information needed to receive public assistance), food, clothing, referrals to other support services, and ongoing case management
82 688
Emergency Supplies Closet and Other Services Food (individuals) 13 113
Clothing (individuals) 17 206
Photocopies (individuals) HEAP Application Supporting Docs
468 71
5420 650
Other: Unfortunately, the EKFRC awarded the federal grant for a collaborative community center for East Kern. The parent meeting for the Friendship House that the Economic Empowerment program hosted was not well attended sadly. Good news, the EKFRC received a year extension on the Economic Empowerment program. Bad news is the case manager began looking for a new job in anticipation of the grant coming to an end in February and found a great opportunity out of state. The position became vacant on October 11, 2019.
33
COMMUNITY ACTION PARTNERSHIP OF KERN DIVISION/PROGRAM MONTHLY ACTIVITY REPORT
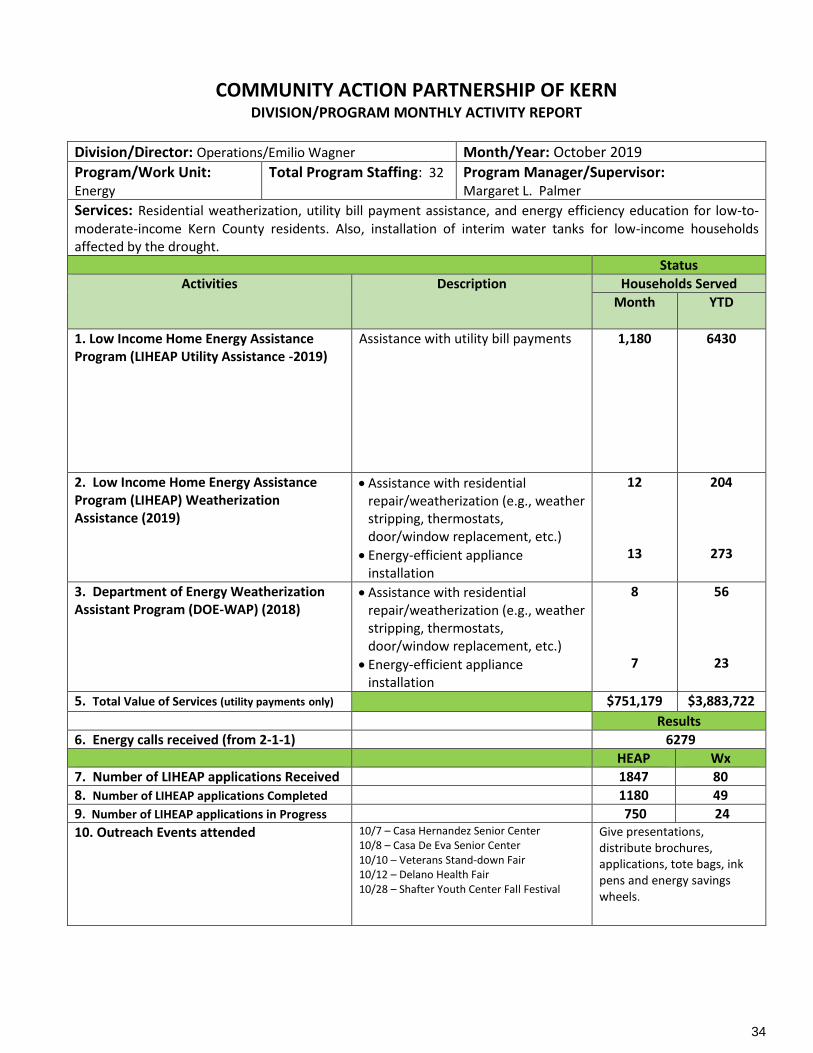
Division/Director: Operations/Emilio Wagner Month/Year: October 2019
Program/Work Unit: Energy
Total Program Staffing: 32 Program Manager/Supervisor: Margaret L. Palmer
Services: Residential weatherization, utility bill payment assistance, and energy efficiency education for low-to- moderate-income Kern County residents. Also, installation of interim water tanks for low-income households affected by the drought.
Status
Activities Description Households Served
Month YTD
1. Low Income Home Energy Assistance Program (LIHEAP Utility Assistance -2019)
Assistance with utility bill payments 1,180
6430
2. Low Income Home Energy Assistance Program (LIHEAP) Weatherization Assistance (2019)
• Assistance with residential repair/weatherization (e.g., weather stripping, thermostats, door/window replacement, etc.)
• Energy-efficient appliance installation
12
13
204
273
3. Department of Energy Weatherization Assistant Program (DOE-WAP) (2018)
• Assistance with residential repair/weatherization (e.g., weather stripping, thermostats, door/window replacement, etc.)
• Energy-efficient appliance installation
8
7
56
23
5. Total Value of Services (utility payments only) $751,179 $3,883,722
Results
6. Energy calls received (from 2-1-1) 6279
HEAP Wx
7. Number of LIHEAP applications Received 1847 80
8. Number of LIHEAP applications Completed 1180 49
9. Number of LIHEAP applications in Progress 750 24
10. Outreach Events attended 10/7 – Casa Hernandez Senior Center 10/8 – Casa De Eva Senior Center 10/10 – Veterans Stand-down Fair 10/12 – Delano Health Fair 10/28 – Shafter Youth Center Fall Festival
Give presentations, distribute brochures, applications, tote bags, ink pens and energy savings wheels.
34

COMMUNITY ACTION PARTNERSHIP OF KERN DIVISION/PROGRAM MONTHLY ACTIVITY REPORT
Division/Director: Nutrition Services/Carmen Segovia Month/Year: October 2019
Program/Work Unit: Food Bank
Total Staffing: 17 Program Manager: Jaime Orona
Services: Partners with 147 food distribution sites throughout Kern County to provide food assistance to low-income families and individuals.
Status
Activities Description Month YTD
USDA Commodities Individuals Served (September) 35.694 344,005
Poundage Received all Programs 1,735,071 17,110,916
Total Poundage Distributed, All Sites 1,780,647 16,898,403
Total Distributed pounds 2018 1,184,480 10,987,262
Food Sourcing Produce Received: 197,545 pounds of produce (donated or purchased) & 12 different produce items:
• Bolthouse: Carrots
• CAFB: Pears & watermelon
• Grapery: Table grapes
• Grimmway: Romaine, cabbage, potatoes, carrots, & leafy greens
• Target: Mixed produce
• Varsity Produce: Onions
• Walmart: Mixed produce
• Wonderful: Citrus
Food Drives:
Farmers Markets: Catholic Charities, FB distributed 12,000 pounds of fresh produce to 453 families 115,600 individuals.
Other:
• This month we continued our Backpack Buddies program; which provides breakfast and lunch items for children
on the weekend. We are delivering a total of 300 bags between Buttonwillow, Greenfield, and now Standard
School.
• On Oct. 2nd we provided a one-time donation to the Disability Movement and Resource Fair. We provided water
and several bins of miscellaneous dry goods.
• On Oct 7th we provided a one-time donation of 2 pallets of candy to the Bakersfield Rescue Mission.
• On Oct. 10th we participated in the annual Veteran’s Stand Down Event. We provided bags of canned goods, dry
goods, water and oranges.
• On Oct 15th we had a group of employees from Knighted Ventures come in and volunteer their time. The helped
us bag fresh produce for our upcoming Farmer’s Market.
• On Oct 16th and Oct 23rd, we had a group of volunteers from the Wonderful Citrus company come in to help us
sort through our canned goods that we received during our Feed the Need food drive.
• On Oct 17 a volunteer group from Aera came in to help us sort cans received from our Feed the Need food drive.
• On Oct 17th we provided a one-time donation of candy to the Salvation Army on Wilson.
• On Oct 18th we participated in the Health and Resource Fair at the swap meet. Providing bags of dry and canned
goods.
• On Oct 20th we provided a one-time donation of 1 pallet of candy to the Army Cadets Club.
• On Oct 23rd we provided a one-time donation of sweets, snacks and water to CAPK’s Child Development
program.
35
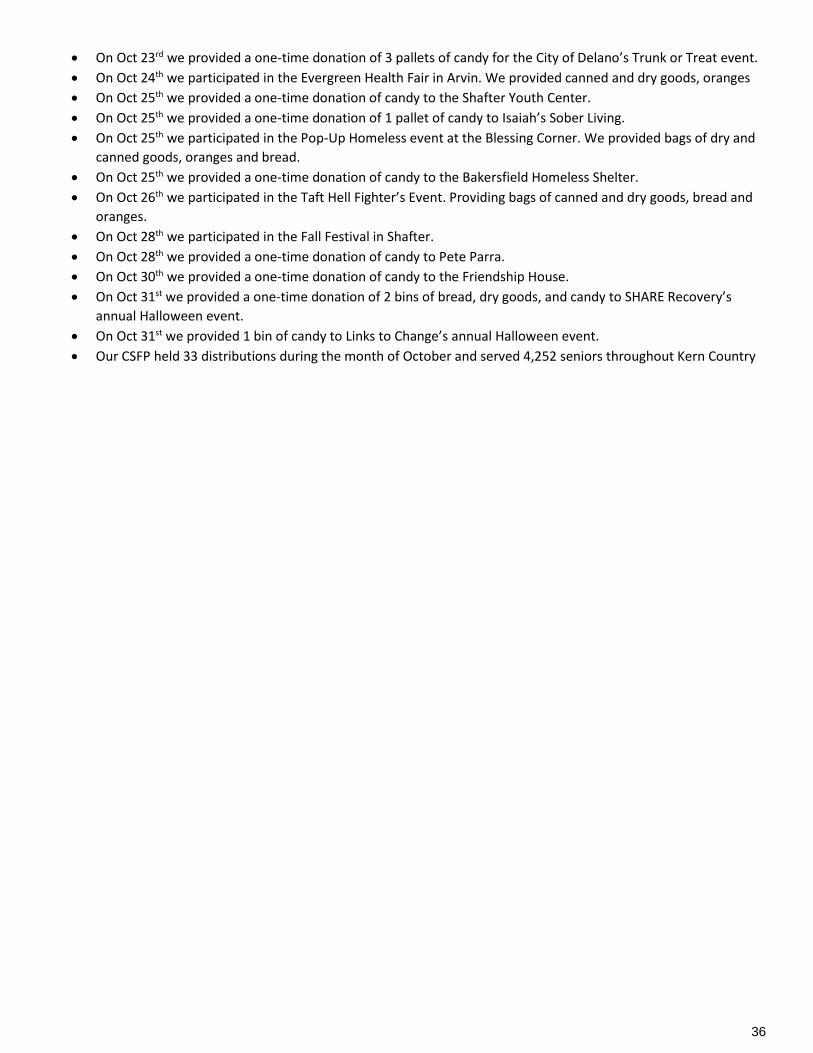
• On Oct 23rd we provided a one-time donation of 3 pallets of candy for the City of Delano’s Trunk or Treat event.
• On Oct 24th we participated in the Evergreen Health Fair in Arvin. We provided canned and dry goods, oranges
• On Oct 25th we provided a one-time donation of candy to the Shafter Youth Center.
• On Oct 25th we provided a one-time donation of 1 pallet of candy to Isaiah’s Sober Living.
• On Oct 25th we participated in the Pop-Up Homeless event at the Blessing Corner. We provided bags of dry and
canned goods, oranges and bread.
• On Oct 25th we provided a one-time donation of candy to the Bakersfield Homeless Shelter.
• On Oct 26th we participated in the Taft Hell Fighter’s Event. Providing bags of canned and dry goods, bread and
oranges.
• On Oct 28th we participated in the Fall Festival in Shafter.
• On Oct 28th we provided a one-time donation of candy to Pete Parra.
• On Oct 30th we provided a one-time donation of candy to the Friendship House.
• On Oct 31st we provided a one-time donation of 2 bins of bread, dry goods, and candy to SHARE Recovery’s
annual Halloween event.
• On Oct 31st we provided 1 bin of candy to Links to Change’s annual Halloween event.
• Our CSFP held 33 distributions during the month of October and served 4,252 seniors throughout Kern Country
36

COMMUNITY ACTION PARTNERSHIP OF KERN DIVISION/PROGRAM MONTHLY ACTIVITY REPORT
1
Division/Director: Health &Nutrition Services/Carmen Segovia
Month/Year: October 2019
Program/Work Unit: Friendship House
Total Program Staffing: 3 Program Manager/Supervisor: Lois Hannible
Services: After-school and summer programs, pre-employment program for youths, parenting classes, nutrition education, sports, gang prevention, and access to social services.
Activities Participants
Description Month YTD
After-School Program Tutoring, homework assistance, recreation. 14 74
Summer Program Recreational activities, educational games, and activities. 130
Gang Prevention Program Aggression Replacement Training (ART), Nurturing Parenting and Parents on Mission (POM) parenting classes are provided at local school sites, correctional facilities, at the Friendship House and other community centers, to prevent at-risk youths from joining gangs.
26
STEM (Science, Technology, Engineering, Math) Program Chevron STEM teaches robotics, coding, engineering, and mathematics to program youth, engaging them in hands-on science focused learning.
Mobile Mexican Consulate -Consular services are provided at FHCC every Tues. & every other Wed., providing passport renewals, assistance with obtaining important documents, and providing DACA & protection information.
250 3689
PREP Works Program Pre-employment program for at-risk youth that provides them with financial literacy; skills and knowledge to conduct job searches and plan for college/career; and an incentivized savings program. Participants also have an opportunity to gain paid work experience.
109
Positive Youth Development Services- Mentor program for at-risk youth. 60 60
Other:
• The Friendship House hosted a free Fall Carnival on Thursday, October 31 from 5pm-8pm.
• The Friendship House Advisory Board presented One Night on Bourbon Street Gala at the Bakersfield Museum of Art on Thursday, October 24. Proceeds from the event will benefit program youth at the CAPK Friendship House. Thank you to everyone who attended and/or supported this event!
• The Mexican Consulate will be providing Consulate services at Friendship House from Nov. 12-Nov. 15. Those interested should call (877) 639-4835 for an appointment.
• IKEA hosted a Build-up Event at Friendship House on Oct. 19, where approximately 12 IKEA employees spent Saturday morning at Friendship House putting new IKEA furniture together and decorating the computer lab & gym, to make sure that things were just right for the program participants. Thank you, IKEA!
37
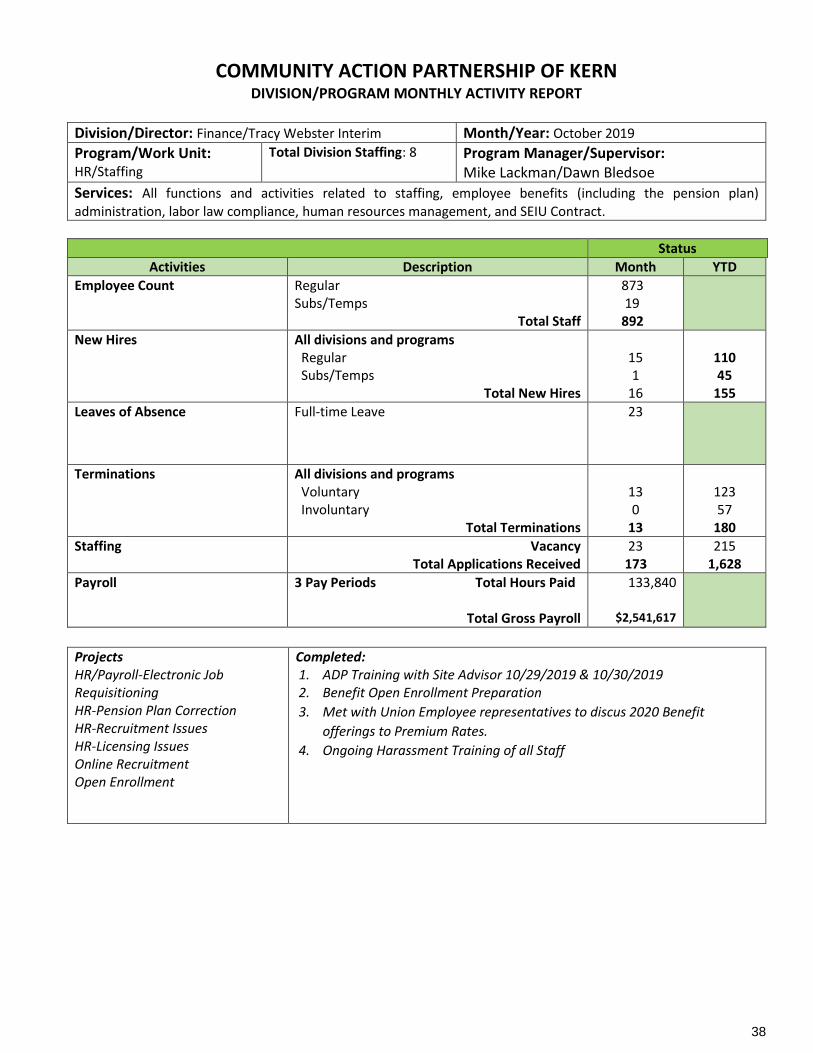
COMMUNITY ACTION PARTNERSHIP OF KERN DIVISION/PROGRAM MONTHLY ACTIVITY REPORT
Division/Director: Finance/Tracy Webster Interim Month/Year: October 2019
Program/Work Unit: HR/Staffing
Total Division Staffing: 8 Program Manager/Supervisor: Mike Lackman/Dawn Bledsoe
Services: All functions and activities related to staffing, employee benefits (including the pension plan) administration, labor law compliance, human resources management, and SEIU Contract.
Status
Activities Description Month YTD
Employee Count
Regular Subs/Temps
Total Staff
873 19 892
New Hires All divisions and programs Regular Subs/Temps
Total New Hires
15 1
16
110 45
155
Leaves of Absence Full-time Leave
23
Terminations All divisions and programs Voluntary Involuntary
Total Terminations
13 0
13
123 57
180
Staffing
Vacancy Total Applications Received
23 173
215 1,628
Payroll 3 Pay Periods Total Hours Paid
Total Gross Payroll
133,840
$2,541,617
Projects HR/Payroll-Electronic Job Requisitioning HR-Pension Plan Correction HR-Recruitment Issues HR-Licensing Issues Online Recruitment Open Enrollment
Completed: 1. ADP Training with Site Advisor 10/29/2019 & 10/30/2019 2. Benefit Open Enrollment Preparation
3. Met with Union Employee representatives to discus 2020 Benefit
offerings to Premium Rates.
4. Ongoing Harassment Training of all Staff
38

COMMUNITY ACTION PARTNERSHIP OF KERN DIVISION/PROGRAM MONTHLY ACTIVITY REPORT
Division/Director: Health & Nutrition Services/Carmen Segovia Month/Year: September 2019
Program/Work Unit: Migrant Childcare AP Program (MCAP)
Total Staffing: 19, Vacancies-2 SRS Specialist & Service Clerk
Program Manager/Supervisor: Susana Magana
Services: The Migrant Childcare Alternative Payment Program is a voucher-based childcare program for migrant agriculturally working families. The program has six entry counties: Kern, Kings, Madera, Merced, Tulare, and Fresno.
Once enrolled, families can continue childcare services as they migrate throughout the state following agricultural work. The program’s current Fiscal Year is July 1, 2019, to June 30, 2020.
*This report is for the service month of September 2019, which was processed in the month of October 2019.
Activities County Total % by County
Active Enrollments
Kern* 411 41%
Madera 93 9%
Merced 0 0
Tulare 223 22%
Kings 83 8%
Fresno 201 20%
Total 1011 100%
*Kern totals include services provided outside of the six entry counties. The case management for those families working and residing outside the six entry counties are handled by the regional office in Bakersfield.
Other: Current Activities: Staff continues to actively recruit in all entry counties for the program. We will begin to work on maintaining our current enrolled numbers in October and begin to work on a waitlist. On 8/29, Family Services staff attended a meeting held at the Tulare Office of Education. Updates were provided to staff regarding enrollment numbers and possible increase to the program budget that will require more enrollments. Staff conducted provider visits 9/26 and 9/30 throughout the central valley. They provided technical assistance to providers and reviewed attendance records to ensure compliance. All staff meeting was held on 9/27 to receive new updates regarding the increase in the program’s budget and updated projections for the remaining months of the fiscal year. Tom from the Standard also presented to staff regarding the agency retirement plan and met individually with staff employees to provide feedback and advice on personal retirement plans and goals. On 10/2 to 10/04, program manager along with 5 specialists attended the CAPPA conference in Sacramento. The workshops provided updates on the Office of Education policies and how to properly implement them as well as helpful strategies for effective time management. Upcoming Activities Staff will be attending the Train the Trainer meeting regarding open enrollment for the benefits plan for the upcoming year.
39
COMMUNITY ACTION PARTNERSHIP OF KERN DIVISION/PROGRAM MONTHLY ACTIVITY REPORT
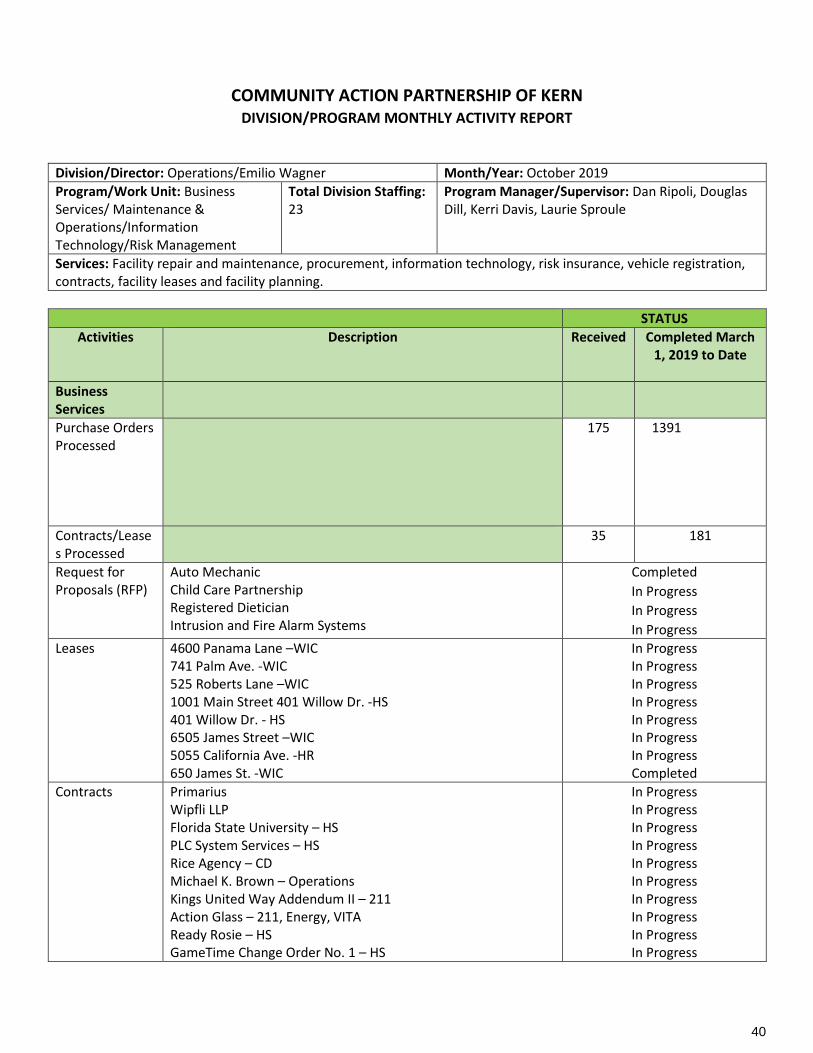
Division/Director: Operations/Emilio Wagner Month/Year: October 2019
Program/Work Unit: Business Services/ Maintenance & Operations/Information Technology/Risk Management
Total Division Staffing: 23
Program Manager/Supervisor: Dan Ripoli, Douglas Dill, Kerri Davis, Laurie Sproule
Services: Facility repair and maintenance, procurement, information technology, risk insurance, vehicle registration, contracts, facility leases and facility planning.
STATUS
Activities Description
Received Completed March 1, 2019 to Date
Business Services
Purchase Orders Processed
175
1391
Contracts/Leases Processed
35
181
Request for Proposals (RFP)
Auto Mechanic Child Care Partnership Registered Dietician Intrusion and Fire Alarm Systems
Completed
In Progress
In Progress
In Progress
Leases 4600 Panama Lane –WIC 741 Palm Ave. -WIC 525 Roberts Lane –WIC 1001 Main Street 401 Willow Dr. -HS 401 Willow Dr. - HS 6505 James Street –WIC 5055 California Ave. -HR 650 James St. -WIC
In Progress In Progress In Progress In Progress In Progress In Progress In Progress Completed
Contracts Primarius Wipfli LLP Florida State University – HS PLC System Services – HS Rice Agency – CD Michael K. Brown – Operations Kings United Way Addendum II – 211 Action Glass – 211, Energy, VITA Ready Rosie – HS GameTime Change Order No. 1 – HS
In Progress In Progress In Progress In Progress In Progress In Progress In Progress In Progress In Progress In Progress
40

Kings United Way Employment Contract – 211 Computer Linx – Shafter Youth Premiere Services – Energy Abila – Operations Sierra Sands Unified School District – HS United Refrigeration – CK Premiere Services – HS San Joaquin Fence – HS Game Time –San Diego St. -HS Game Time –E. California Ave. -HS Game Time –Cleo Foran –HS Cal-Kern construction – VITA, Energy, 211 Mojave Unified School District – HS Child 360 -HS Child & Psychology Family Clinic Pyramid Model Consortium Mail Finance -All M&S Security
In Progress In Progress In Progress In Progress In Progress In Progress In Progress Completed Completed Completed Completed Completed Completed Completed Completed Completed Completed Completed
Maintenance & Operations
Work in Progress
03/01/2019 to Date
Closed
Facility Work Orders Processed
Repair and maintenance of CAPK facilities and vehicles. 93 2657
Projects • Demolition is completed at the “Jewett” facility and we have started construction of the walls, plumbing and electrical. We are doing construction in two phases, phase one Head Start and Early Head Start and phase 2 Home Visiting Initiative (HVI)
• Cleo Foran Renovation: Interior construction has been completed to add EHS and includes restroom reconfiguration, addition of walls, kitchen FRP new flooring throughout. Exterior construction, new sheds, hardi-board siding (complete), concrete ramps, pour downplay surface (complete), paint of exterior building (complete) and wrought iron railings.
• East Cal: We are waiting on County permits to start EHS renovations.
In Progress
In Progress
In Progress
Information Technology
Received 03/01/2019 to Date
Closed
Help Desk Work Orders Processed
Technical assistance to employees, repairs, troubleshooting, coordination of services with IT services subcontractor
2255 2196
Projects • AT&T E-rate Category 1 Installation Completed: Alicante, Central Kitchen, Heritage, Harvey Hall,
Mojave, Primeros Pasos, Rosamond, San Diego
In Progress In Progress In Progress
41

• Mitel Upgrades Completed: CalFresh
• WIC Computer upgrades
• WIC Wise
• CalFresh new office
• Energy Computer upgrades
In Progress In Progress In Progress In Progress In Progress In Progress
Risk Management
Reported 01/01/2019 to Date
Workers Compensation Incidents
• For Report Only
• First Aid
• Medical Treatment
• Modified Duty
• Lost Time
• Non-Industrial (not work related)
• Under Investigation
8
4
0
0 1
0 0
80
27 5 7
3 4
1
General Liability 1 1
Property Incidents
5 19
Vehicle Incidents
6 18
Projects Charter for Operational Risk Mgmt Advisory Committee Safety & Security Policies for Front Desk Workplace Violence Prevention Program Operational Risk committee Update Vehicle Safety Program Safety Meetings Monthly Maintenance & Energy
In progress In progress In progress In progress In progress In progress
• Other: E-rate Program Year 2019-2020 was approved AT&T has completed Alicante, Central Kitchen, Heritage, Harvey Hall, Mojave, Primeros Pasos, Rosamond, and San Diego. We are continuing to install the internet service at sites and will continue to turn up sites as AT&T completes the install.
42

COMMUNITY ACTION PARTNERSHIP OF KERN DIVISION/PROGRAM MONTHLY ACTIVITY REPORT
Division/Director: Nutrition Services/Carmen Segovia Month/Year: October 2019
Program/Work Unit: Shafter Youth Center
Total Program Staffing: 2.5
Program Manager/Supervisor: Angelica Nelson
Services: Summer and after-school tutoring, homework assistance, educational, recreational, and social enrichment activities and services for children ages 6-18. Evening programming is offered Monday through Friday, 5:00 to 9:00 pm; activities include basketball, ancestry class, and various local groups who utilize the meeting space.
Activities Participants
Description Month YTD
After-School Program Tutoring, homework assistance, recreation, health & nutrition education. 4 new 35
Teen Pregnancy and Sexually Transmitted Infections Prevention (Information and Education) (#”s as of 7/1/2019) Informing and educating teens ages 12-19 years on preventing pregnancy and the spread of sexually transmitted infections.
GRANT ENDED June 30, 2019
109
Evening Program – Open Basketball, Zumba, Fitness Boot Camp, Mental Health Support Group Mtg
20 – 45 per
night
Summer Program Academics, sports, recreation, health & nutrition education, themed weeks with coordinated guest speakers.
92
Other:
• United Farm Workers Foundation held a workshop on citizenship papers and processes on October 5th. About 120 clients were pre-registered and served throughout the Saturday, as well as an estimated 60 people that did not have appointments. His event was set up in the gym, and was conducted in stations by the various staff and volunteers brought from UFW Foundation.
• Dignity Health Community Health Initiative held a community workshop in September, and it was such a success. Dignity is now holding Mental Health Support Group Sessions at SYC, twice per month.
• SYC kids took the pavement as they applied and were selected to participate in the 21st Via Arte Italian Street Festival held by Bakersfield Museum of Art at the Marketplace. Following the theme of “The World United”, the team of two girls replicated an art piece that was full of color against the black asphalt. The event provides the sponsored space, the chalk and even lunch! The girls had a great time using their creativity. The 4th and 7th grader are among the youngest artists to compete with high schools and independent art education studios. Even though they did not place, they still had lots of fun and developed some great memories.
• Shafter Youth Center held its annual Fall Festival from 6-8 pm on October 28th. Kids from all over came dressed in their Halloween outfits to have some fun and collect candy. Fall Festival was a
43

COMMUNITY ACTION PARTNERSHIP OF KERN DIVISION/PROGRAM MONTHLY ACTIVITY REPORT
joint event with Shafter Lions Club, which hosted the Trunk or Treat in the parking lot before the doors opened at SYC. We handed out just under 300 bags, but not everyone took a bag, with parents in tow, we had an estimated 450-500 people in attendance. CAPK Programs such as Energy, Food Bank, VITA, WIC, Head Start, Home Visit Program and 211 Kern were in attendance, holding the front line of resources as eager visitors arrived.
44

COMMUNITY ACTION PARTNERSHIP OF KERN DIVISION/PROGRAM MONTHLY ACTIVITY REPORT
Division/Director: Director of Administration, Pritika Ram
Month/Year October 2019
Program/Work Unit: VITA
Total Program Staffing: 4
Program Manager/Supervisor: Jackie Guerra
Services: Train and certify volunteers, provide free tax preparation and electronic filing for low- moderate income individuals and families and assist clients with ITIN (Individual Tax Identification Number) applications.
Results Activities Description Month YTD
Dollars # of Tax Returns
Dollars # of Tax Returns
Refunds Federal Refunds
$13,332 26 $4,679,891
Federal EITC $23,531 12 $3,108,836 1,584 Federal Total $36,863
$7,788,727
State Refunds $2,978 26 $683,341 California EITC $7,981 7 $319,801 1,429
State Total $10,959
$1,003,120 Total Credits &
Refunds State & Federal $47,822 55 $8,882,378
5,113
Additional Comment/Notes:
• No tax returns were done for the month of October due to transition in tax software.
• Currently interviewing for Site Coordinators and Outreach Specialist.
• Phased out of orientations and moving forward with volunteer trainings. 2 trainings will be held
for the month of November, both trainings are at capacity with over 17 new volunteers for each
training.
• CAA certifications in process for Jackie Guerra and Irene Alonzo. This will ensure all individuals in
need of an ITIN for tax purposes can be assisted through CAPK services
• Attended Shafter Youth Center and Ming Ave Swap meet (Health & Wellness fair) events to
inform public of new site opening in their area.
• Through DHS Work Experience programs, we are able to utilize their clients and train them as
tax preparers for this year’s tax season. We currently have one client.
• VITA staff attended Your Money Your Goals training
• Working with KSFCU & Self-Help Credit Union to be able to provide our tax clients with financial
education workshops this tax season such as credit repair & home buying workshops.
45

COMMUNITY ACTION PARTNERSHIP OF KERN
DIVISION/PROGRAM MONTHLY ACTIVITY REPORT
Division/Director: Nutrition Services/Carmen Segovia Month/Year: Oct 2019
Program/Work Unit: WIC Total Program Staffing: 72 staff 1 vacancies
Program Manager: Kathlyn Lujan
Services: Nutrition education, breastfeeding support, and food vouchers for families with infants, children up to age 5, and women who are pregnant, postpartum or breastfeeding. Services provided at 21 sites in Kern County, 5 sites in San Bernardino County.
Participation 10/1/18 – 9/30/19
Description Case Load
Month Central Valley Avg.
State Avg.
Total All services October 2019 16,160 15,225 (94.3%) ***
Participation by WIC site
Location Participants Location Participants
Note: The * indicates that the participants served at this site are included in the count for other sites. IT Equipment from other WIC site was used to issue food vouchers. *included in Ridgecrest number
Arvin Bakersfield E. California Niles Street Montclair Friendship House Panama Boron Buttonwillow California City Delano Edwards Air Force Lost Hills *** state ave unable to calculate
28 1531
1347* 354 88
1462* *
80 683 957
* 103
Mojave Oildale Ridgecrest Rosamond Shafter Tehachapi Wasco San Bernardino County Adelanto Big Bear Crestline Needles Phelan Mobile WIC
117 415 572 695
1269 1742 405
1849 226 316
181* Closed
803*
Projects
CAPK WIC continues to exceed the State average in participation. CAPK WIC received 52 eligibility requests through the CAPK website. Of those 31 new participants and 20 families were enrolled. We were unable to contact 15 of these requests and 7 had appointments but did not show. CAPK WIC continues to have a Facebook and Instagram presence. Facebook has 688 followers and Instagram has 590 followers. This is up from last month. The RBL and the WIC Program Manager attended the Central Valley RBL meeting as required by the State RBL action plan. This meeting finalized the work agreements between the agencies to complete curriculums that will be part of a Tool Kit to help train physician offices and other health care facilities on the support of breastfeeding. This satisfies part of the State action plan. The RBL continues to work on the “9 Steps to Breastfeeding Friendly” criteria and recognition. This is a State committee comprised of RBL’s from throughout the State. The Outreach and Public Relations Coordinator attended 5 outreach events: DisABILITY Movement Showcase, Kern County Veterans STAND DOWN, Bakersfield’s Good Neighbor Festival, KC Binational Health Week, and Hart Park After Dark. The Coordinator has made many contacts with television media such as Azteca TV and Univision. This will increase information to the community we serve. CAPK WIC continues to prepare for the “roll out” of eWIC on 2/18/20 when we change operating systems and begin issuing the WIC Card instead of food vouchers.
46

Co
mm
un
ity
De
velo
pm
en
t A
pp
licat
ion
Sta
tus
Re
po
rt O
cto
ber
20
19
Oct
ob
er
1, 2
01
9 –
Oct
ob
er 3
1, 2
01
9
*Do
es
no
t in
clu
de
the
Firs
t 5
Aw
ard
s-A
mo
un
t TB
D
Jan
uar
y 1
, 20
19
– O
cto
ber
31
, 20
19
(Y
TD)
*Do
es n
ot
incl
ud
e th
e Fi
rst
5 A
war
ds-
Am
ou
nt
TBD
Stat
us
Do
llars
C
ou
nt
Pen
din
g $
123,
000
5
Aw
ard
ed
* $8
65
,58
7
6
Den
ied
$
2,5
00
,00
0
1
Tota
l $
3,4
88
,58
7
12
W
in P
erce
nta
ge
80
%
Stat
us
Do
llars
C
ou
nt
Pen
din
g $
2,8
04
,91
3
22
Aw
ard
ed
$2
,40
8,2
27
2
4
Den
ied
$
5,5
64
,96
4
20
Tota
l $
10,7
78
,10
4
66
Win
Per
cen
tage
5
5%
47

Co
mm
un
ity
De
velo
pm
en
t A
pp
licat
ion
Sta
tus
Re
po
rt O
cto
ber
20
19
Ap
plic
atio
n S
tatu
s D
eta
il Fu
nd
er
CA
PK
Pro
gram
D
eci
sio
n
Dat
e
Am
ou
nt
Re
qu
est
ed
A
mo
un
t A
war
de
d
Dat
e
Sub
mit
ted
D
ue
Dat
e St
atu
s
CA
Dep
artm
ent
of
Soci
al S
ervi
ces,
O
ffic
e o
f C
hild
Ab
use
Pre
ven
tio
n
(OC
AP
)
EKFR
C
$
75,0
00
10/
25/2
019
1
1/1/
2019
P
end
ing
Cal
ifo
rnia
Co
asta
l Co
mm
issi
on
FH
CC
/SYC
$
8,0
00
10/
22/2
019
1
0/25
/201
9
Pen
din
g
Kai
ser
Per
man
ente
C
AP
K C
alFr
esh
H
ealt
hy
Livi
ng
$
30,0
00
10/
21/2
019
1
0/25
/201
9
Pen
din
g
Firs
t 5
Ke
rn
EKFR
C
10/
14/2
019
$
8
08,8
63
T
BD
7
/30/
2019
7
/30/
2019
A
war
ded
Firs
t 5
Ke
rn
211
Ker
n
10/
14/2
019
$
8
92,2
42
T
BD
7
/30/
2019
7
/30/
2019
A
war
ded
Firs
t 5
Ke
rn
211
Ker
n
10/
14/2
019
$
7
26,9
70
T
BD
7
/30/
2019
7
/30/
2019
A
war
ded
Nat
ion
al H
ead
Sta
rt A
sso
ciat
ion
H
ead
Sta
rt
$
5
,00
0
1
0/11
/201
9
10/
11/2
019
P
end
ing
Cal
ifo
rnia
Off
ice
of
the
Go
vern
or
Cal
ifo
rnia
Vo
lun
teer
s FH
CC
/SYC
1
0/2/
2019
$
75,0
00
$
7
3,2
91
10/
24/2
019
1
0/2/
2019
A
war
ded
Cal
ifo
rnia
Off
ice
of
the
Go
vern
or
Cal
ifo
rnia
Vo
lun
teer
s FH
CC
/SYC
1
0/2/
2019
$
7
81,0
00
$
670
,08
0
10/
24/2
019
1
0/2/
2019
A
war
ded
Cit
izen
s B
ank
FHC
C/S
YC
$
5
,00
0
1
0/2/
2019
1
0/4/
2019
P
end
ing
US
Inte
rnal
Rev
enu
e Se
rvic
e (I
RS)
V
ITA
1
0/2/
2019
$
1
22,2
16
$
122
,21
6
10/
2/20
19
10/
2/20
19
Aw
ard
ed
US
Dep
artm
ent
of
Hu
man
Se
rvic
es, A
CF
- C
B
EKFR
C
10/
2/20
19
$2
,50
0,0
00
$
-
6
/11/
2019
6
/11/
2019
D
enie
d
48

49

50

51

52

COMMUNITY ACTION PARTNERSHIP OF KERN DIVISION/PROGRAM MONTHLY ACTIVITY REPORT
Division/Director: Head Start/State Child Development/Yolanda Gonzales
Month/Year: October 2019
Program/Work Unit: Head Start/Early Head Start Program Manager/Supervisor: Ginger Mendez/Donna Holland
Services: Head Start and Early Head Start childhood education for low-moderate income children ages 0-5 in center-based, part-day or full-day environments and home-based options.
Program Enrollment Funded Actual
Head Start Kern 1317 100%
Early Head Start Kern 446 86%
Early Head Start Partnership 152 39%
Early Head Start San Joaquin 313 100%
TOTAL Funded Enrollment 2228
Children with Disabilities Goal Actual
Head Start Kern Identified as having an IEP 10% 8.6%
Early Head Start Kern Identified as having an IFSP 10% 10.8%
Early Head Start Partnership Identified as having an IFSP 10% 4.0%
Early Head Start San Joaquin Identified as having an IFSP 10% 17.9%
Over Income Goal Actual
Head Start Kern Within 100% and 130% of Federal Poverty Rate <10% 9.9%
Early Head Start Kern Within 100% and 130% of Federal Poverty Rate <10% 4.5%
Early Head Start Partnership Within 100% and 130% of Federal Poverty Rate <10% 1%
Early Head Start San Joaquin Within 100% and 130% of Federal Poverty Rate <10% 8.9%
Average Daily Attendance (Program Wide >85%)
98%
Enrollment Highlights:
Six Recruitment events were staffed during the month, with 23 interest applications taken. Four sites achieved 100% ADA.
DIVISON STAFFING:
Currently Employed Vacant Positions Continuous Family Leave Intermittent Family Leave
637 7 12 122
COMPLIANCE:
Risk Assessments were completed for the Head Start/State Child Development grant. 90 comprehensive child file reviews were completed. Individualized trainings are being provided for staff for any identified needs improvement.
53

CACFP September 2019
Total Meals Requested Meals Allocated % of Meals
Served Central Kitchen
Vendor Kitchen
Total Meals
CACFP/USDA HS/EHS September 2019
69,129 16,458 85,587 64,890 20,697 87%
54

COMMUNITY ACTION PARTNERSHIP of KERN BOARD OF DIRECTORS
AUDIT & PENSION COMMITTEE MEETING November 7, 2019
12:00 pm
MEETING MINUTES
1. Call to Order
Committee Chair Craig Henderson called the meeting to order at 12:00 pm at the Community Action Partnership of Kern administrative building, 5005 Business Park North, Bakersfield, CA.
2. Roll Call
Roll Call was taken with a quorum present.
Present: Craig Henderson, Fred Plane, Ana Vigil
Absent: Mike Maggard
Others Present: Jeremy Tobias, Chief Executive Officer; Lorraine Casillas, Controller; Pritika Ram, Director of Administration; and other CAPK staff.
3. Approval of Agenda
Motion was made and seconded to approve the Audit and Pension Committee meeting agenda for November 7, 2019. Carried by unanimous vote. (Plane/Henderson)
4. Public Forum
No one addressed the Committee. 5. New Business
a. 3rd Quarter 2019 Pension Plan Update – Lorraine Casillas, Controller and Tom Ming, Pensionmark – Info Item
Lorraine Casillas introduced Tom Ming from Pensionmark who provided the Committee with the 3rd quarter Pension Plan update. Tom reported that the total assets as of 9/30 was $23,771,000 vs $21,391,005 1 year ago, which is a 13.85% increase. Tom also reported of the 26 funds, 24 are passing, 1 is on watch and 1 is not scored. Overall, the funds for CAPK are performing well with very good diversification, which is essential for good plan management. The education calendar is not set for 2020, but Pensionmark staff is working with HR to set the schedule, which will likely be more web-based education. The education calendar will be prepared by the January 2020 meeting.
b. CAPK 403(b) and 401(a) Retirement Plan Re-Pricing – Lorraine Casillas, Controller and Scott
Harrison, The Standard – Info Item
55

Community Action Partnership of Kern Audit & Pension Committee Meeting Minutes November 7, 2019 Page 2 of 2
Tom Ming provided a generalized summary of the reasons for the plan price increase proposal from The Standard. Scott Harrison from The Standard stated that when the plan was first proposed, there were fewer employees enrolled in the plan. With the automatic enrollment and increase in participation, the cost has increased by nearly 600%. The headcount doubled when looking at both plans and The Standard needs to cover their costs for the required mailing of notices for both plans, fee disclosures, fund change notice, black-out notices, etc. Tom Ming said educational costs will be streamlined to help offset the other increases. The proposed increase is $12 per eligible employee per year. Currently, the employees are paying the fees. CAPK staff will work with Pensionmark to conduct internal research and pricing for today’s market. A full analysis and recommendation will be presented at the January Audit & Pension Committee meeting.
6. Committee Member Comments
No comments.
7. Next Scheduled Meeting
Audit & Committee Meeting Thursday, January 16, 2020 (pending BOD approval) 12:00 pm 5005 Business Park North Bakersfield, CA 93309
8. Adjournment
The meeting adjourned at 12:27 pm.
56

INVE
STM
ENT
REVI
EW
Com
mun
ity A
ctio
n Pa
rtne
rshi
p ER
ISA
403(
b)
For P
erio
d En
ding
09/
30/2
019
Pres
ente
d By
:Tom
Min
gM
anag
ing
Dire
ctor
tom
.min
g@pe
nsio
nmar
k.co
m(6
61) 3
02-4
950
FOR
PLAN
SPO
NSO
R U
SE O
NLY
- N
ot fo
r Use
with
Par
ticip
ants
or t
he G
ener
al P
ublic
.P e
nsio
nmar
k Fi
nanc
ial G
roup
, LLC
("Pe
nsio
nmar
k") i
s an
inve
stm
ent a
dvis
er re
gist
ered
und
er th
e In
vest
men
t Adv
iser
s Ac
t of 1
940.
Pen
sion
mar
k is
affl
iate
dth
roug
h co
mm
on o
wne
rshi
p w
ith P
ensi
onm
ark
Secu
ritie
s, LL
C (m
embe
r SIP
C).
57

TOPI
CS O
F DI
SCUS
SIO
N
For P
lan
Spon
sor U
se O
nly
Com
mun
ity A
ctio
n Pa
rtne
rshi
p ER
ISA
403(
b) In
vest
men
t Rev
iew
| Pe
riod
Endi
ng 0
9/30
/201
9
Pens
ionm
ark
Mar
ket &
Eco
nom
ic C
omm
enta
ry4
Exec
utiv
e Su
mm
ary
10
Exec
utiv
e Su
mm
ary
of In
vest
men
t Rec
omm
enda
tions
11
Port
folio
Rev
iew
12
Port
folio
Div
ersi
ficat
ion
13
Port
folio
| As
set A
lloca
tion
14
Port
folio
| To
p 10
Hol
ding
s/Se
ctor
Allo
catio
n18
Port
folio
| Re
gion
/Qua
lity
Allo
catio
n19
Port
folio
| Re
turn
s20
Port
folio
| Be
ta/S
tand
ard
Dev
iatio
n21
Port
folio
| Al
pha
22
Port
folio
| Sh
arpe
Rat
io23
Port
folio
| In
form
atio
n Ra
tio24
Port
folio
| Cu
mul
ativ
e Pe
rfor
man
ce25
Port
folio
| W
eigh
ted
Fee
Anal
ysis
26
Inve
stm
ent R
evie
w -
100
poi
nt29
Inve
stm
ent S
core
card
| Cu
rren
t & H
isto
rical
Sco
ring
30
Inve
stm
ent S
core
card
| Cr
iteria
Dat
a33
Inve
stm
ent S
core
card
| Cr
iteria
Sco
ring
40
Inve
stm
ent P
erfo
rman
ce v
s Ri
sk45
Inve
stm
ent S
core
card
| In
vest
men
t Per
form
ance
47
58

TOPI
CS O
F DI
SCUS
SIO
N
For P
lan
Spon
sor U
se O
nly
Com
mun
ity A
ctio
n Pa
rtne
rshi
p ER
ISA
403(
b) In
vest
men
t Rev
iew
| Pe
riod
Endi
ng 0
9/30
/201
9
Inve
stm
ent F
act S
heet
s -
100
poin
t53
Inve
stm
ent F
act S
heet
s54
Impo
rtan
t Dis
clos
ures
104
Impo
rtan
t Dis
clos
ures
105
Glo
ssar
y11
1
Inve
stm
ent S
corin
g M
etho
dolo
gy &
Glo
ssar
y -
100
Poin
t11
2
Glo
ssar
y of
Inve
stm
ent T
erm
s11
5
59

MAR
KET
& EC
ON
OM
ICRE
VIEW
For P
erio
d En
ding
9/3
0/20
19
Pens
ionm
ark
Fina
ncia
l Gro
up, L
LC (“
Pens
ionm
ark”
) is a
n in
vest
men
t adv
iser r
egist
ered
un
der t
he In
vest
men
t Adv
isers
Act
of 1
940.
Pens
ionm
ark
is af
filia
ted
thro
ugh
com
mon
ow
ners
hip
with
Pen
sionm
ark
Secu
ritie
s, LL
C (m
embe
r SIP
C).
Pag
e 4
|
60

For P
lan S
pons
or U
se O
nly
| Per
iod
Endi
ng 9
/30/
2019
EQU
ITY
REVI
EW
Sour
ce: I
ndex
Fac
tshe
ets a
s of 9
/30/
2019
from
the
follo
wing
inde
x pr
ovid
ers:
MSC
I Ind
ices (
www.
msc
i.com
), S&
P Do
w Jo
nes I
ndice
s (w
ww.u
s.spi
ndice
s.com
), FT
SE R
usse
ll In
dice
s ( w
ww.ft
se.co
m).
Dom
estic
Equ
ity•
S&P
500
post
ed a
1.7%
% g
ain
for t
he q
uarte
r.•
Larg
e Ca
p (R
usse
ll 10
00) o
utpe
rform
ed S
mal
l Cap
(Rus
sell
2000
).•
Grow
th (R
usse
ll 10
00 G
rowt
h) o
utpe
rform
ed V
alue
(Rus
sell
1000
Val
ue).
•Ut
ilitie
s, Re
al E
stat
e, a
nd C
onsu
mer
Def
ensiv
e we
re th
e be
st p
erfo
rmin
g se
ctor
s; wh
ile E
nerg
y, He
alth
care
, and
Con
sum
er C
yclic
al la
gged
.•
The
Dow
Jone
s exp
erie
nced
its l
arge
st o
ne-d
ay d
rop
of th
e ye
ar o
n Au
gust
5th
, fal
ling
over
700
poi
nts.
•Th
e S&
P 50
0 an
d Do
w Jo
nes e
xper
ienc
ed th
e be
st th
ree-
quar
ter s
tarts
to
the
year
sinc
e 19
97.
•Vo
latil
ity re
mai
ned
heig
hten
ed th
roug
hout
the
quar
ter,
as th
e sa
me
them
es fr
om Q
2 pe
rsist
ed in
Q3:
trad
e ta
lks b
etwe
en th
e U.
S. a
nd C
hina
an
d ac
tions
take
n by
the
Fede
ral R
eser
ve.
Inte
rnat
iona
l Equ
ity•
MSC
I Wor
ld e
x. US
pos
ted
a 0.
9% lo
ss fo
r the
qua
rter.
•Do
mes
tic e
quiti
es o
utpe
rform
ed in
tern
atio
nal e
quiti
es.
•De
velo
ped
mar
ket e
quiti
es o
utpe
rform
ed e
mer
ging
mar
ket e
quiti
es.
•In
tern
atio
nal m
arke
ts st
rugg
led
in Q
3 as
wea
k ec
onom
ic da
ta p
ersis
ted
and
the
stre
ngth
of t
he U
.S. d
olla
r wei
ghed
on
inte
rnat
iona
l ret
urns
.•
Japa
n wa
s the
bes
t per
form
er w
ithin
the
deve
lope
d m
arke
ts, r
ising
3.
1%, w
hile
Hon
g Ko
ng e
quiti
es fe
ll 12
% a
s the
ong
oing
pro
test
s hav
e we
ighe
d on
thei
r mar
kets
.•
In e
mer
ging
mar
kets
, Tai
wan
post
ed th
e st
rong
est r
etur
n dr
iven
by
thei
r sem
icond
ucto
r sec
tor,
while
Sou
th A
frica
fell
over
12%
ove
r co
ncer
ns a
roun
d ge
opol
itica
l and
eco
nom
ic tro
uble
.•
Chin
ese
equi
ties s
lum
ped
as th
e co
untry
’s ec
onom
ic da
ta c
ontin
ued
to
disa
ppoi
nt e
xpec
tatio
ns..
20.0
9
20.5
5
20.5
3
17.8
1
23.3
0
17.8
7
13.4
6
14.18
17.6
1
13.5
7
12.7
0
5.43
1.16 1.7
0
1.42
1.36
1.49
-0.0
9
-0.2
0
-2.4
0
0.53
-0.9
3
-0.9
8
-4.2
8
-10
-50
510
1520
25
Russ
ell 3
000
(Bro
ad U
S Eq
uity
)
S&P
500
(US
Larg
e Ca
p)
Russ
ell 1
000
(US
Larg
e Ca
p)
Russ
ell 1
000
Valu
e (L
arge
Cap
Val
ue)
Russ
ell 1
000
Grow
th (L
arge
Cap
Gro
wth)
S&P
400
(US
Mid
Cap
Equ
ity)
S&P
600
(US
Smal
l Cap
Equ
ity)
Russ
ell 2
000
(Sm
all C
ap)
MSC
I Wor
ld (
Glob
al E
quity
)
MSC
I Wor
ld e
x. US
A (I
nter
natio
nal E
quity
)
MSC
I EAF
E IM
I (De
velo
ped
Inte
rnat
iona
l)
MSC
I Em
ergi
ng M
arke
ts IM
I (Em
ergi
ng M
arke
ts)
Equi
ty In
dex R
etur
ns
YTD
Last
Qua
rter
Pag
e 5
|
61

For P
lan S
pons
or U
se O
nly
| Per
iod
Endi
ng 9
/30/
2019
6.32
5.60
6.75
11.5
0
12.9
4
7.58
8.52
0.711.3
71.58
1.22
3.07
1.35
2.27
02
46
810
1214
Barc
lays
Glo
bal A
ggre
gate
Bon
d (G
loba
l Bon
ds)
Barc
lays
Cap
ital U
S M
BS (M
ortg
age
Back
ed)
Barc
lays
Mun
icipa
l (M
unici
pal B
onds
)
BofA
/ML
US H
igh
Yiel
d M
aste
r II (
High
Yie
ld B
onds
)
BofA
/ML
US C
orpo
rate
Mas
ter (
Corp
orat
e Bo
nds)
Barc
lays
Cap
ital U
S TI
PS (I
nfla
tion-
Prot
ecte
d Bo
nds)
Barc
lays
Cap
ital U
S Ag
greg
ate
(US
Broa
d M
arke
t)
Fixe
d In
com
e In
dex R
etur
ns
Last
Qua
rter
YTD
3.33
25.5
5
19.3
8
30.5
1
14.9
5
3.13
16.6
7 18.0
9
11.0
8
3.38
7.59
3.45
3.16 4.
19
-1.8
4
-5.9
9
-6.6
3 -5.0
2
-10
-50
510
1520
2530
35
ICE
US D
olla
r Spo
t (US
Dol
lar)
FTSE
EPR
A/N
AREI
T US
(US
Real
Est
ate)
FTSE
EPR
A/N
AREI
T Gl
obal
(Glo
bal R
eal E
stat
e)
LPX5
0 (G
loba
l Priv
ate
Equi
ty)
S&P
GSCI
Gol
d Sp
ot (G
old)
Bloo
mbe
rg C
omm
odity
(Bro
ad C
omm
oditi
es)
Bloo
mbe
r Bre
nt C
rude
(Bre
nt C
rude
Oil)
Bloo
mbe
rg W
TI C
rude
(WTI
Cru
de O
il)
Aler
ian
MLP
(MLP
s)
Alte
rnat
ive In
vest
men
t Ind
ex R
etur
ns
YTD
Last
Qua
rter
Alte
rnat
ive In
vest
men
ts•
Com
mod
ities
fell
1.8%
dur
ing
the
quar
ter.
The
top
perfo
rmer
s wer
e N
ickel
(34.
8%),
Silve
r (9.
9%),
and
Gold
(3.3
%).
The
wors
t per
form
ing
com
mod
ities
wer
e Ka
nsas
Whe
at (-
13.7
%),
Coffe
e (-1
0.8%
), an
d Co
rn
(-10.
6%).
•Th
e US
dol
lar r
allie
d du
ring
the
quar
ter,
as th
e eu
ro fe
ll ov
er 4
% a
nd
the
Chin
ese
renm
inbi
fell
3.8%
aga
inst
the
dolla
r.
•In
spite
ofa
bom
bing
of S
audi
oil
facil
ities
whi
ch sp
iked
oil p
rices
du
ring
the
quar
ters
, Bre
nt c
rude
and
Wes
t Tex
as In
term
edia
te (W
TI)
crud
e oi
l fel
l aga
in th
is qu
arte
r, lo
sing
6% a
nd 6
.6%
resp
ectiv
ely.
•RE
ITs s
howe
d st
rong
gai
ns in
Q3,
risin
g 7.
6% in
the
U.S.
, and
ou
tper
form
ed th
e br
oade
r glo
bal R
EIT
mar
ket w
hich
gai
ned
3.5%
.
•Gl
obal
Priv
ate
Equi
ty n
otch
ed a
3.1%
gai
n du
ring
the
quar
ter,
while
M
LPs l
ost 5
%.
Fixe
d In
com
e•
Inte
rest
rate
s dec
reas
ed in
the
US T
reas
ury
fixed
inco
me
mar
ket d
urin
g th
e th
ird q
uarte
r, fu
rther
inve
rting
the
yield
cur
ve.
•Th
e yie
ld o
n th
e 10
-yea
r Tre
asur
y no
te fe
ll by
32
bps t
o 1.6
8%.
•Af
ter e
ndin
g th
e 2nd
quar
ter s
ugge
stin
g th
ere
woul
d be
no
rate
cut
s in
2019
, th
e Fe
dera
l Res
erve
cut
inte
rest
rate
s twi
ce, i
n Ju
ly an
d Se
ptem
ber.
•In
vest
men
t gra
de c
orpo
rate
and
hig
h yie
ld b
onds
ext
ende
d th
eir g
ains
for
the
year
pos
ting
3.1%
and
1.2%
gai
ns fo
r the
qua
rter,
resp
ectiv
ely.
•As
gro
wth
pros
pect
s con
tinue
d to
softe
n in
the
quar
ter,
cent
ral b
anks
ar
ound
the
world
beg
an re
ducin
g in
tere
st ra
tes a
nd th
e Eu
rope
an C
entra
l Ba
nk re
star
ted
its b
ond-
buyin
g st
imul
us p
rogr
am, b
oth
lead
ing
to a
bon
d m
arke
t ral
ly du
ring
the
quar
ter.
•Se
vera
l em
ergi
ng m
arke
t cou
ntrie
s lau
nche
d bo
nd o
fferin
gs a
s bor
rowi
ng
cost
s hav
e fa
llen.
FIXE
DIN
COM
E&
ALT
ERN
ATIV
ESRE
VIEW
Sour
ce: I
ndex
Fac
tshe
ets
as o
f 9/3
0/20
19 fr
om th
e fo
llow
ing
inde
x pr
ovid
ers:
Blo
ombe
rg B
arcl
ays
Indi
ces
(ww
w.b
loom
berg
.com
), Bo
fAM
erril
l Lyn
ch (w
ww
.bof
aml.c
om),
Inte
rcon
tinen
tal E
xcha
nge
( ww
w.th
eice
.com
), LP
X Gr
oup
(ww
w.lp
x-gr
oup.
com
), Cr
edit
Suiss
e (la
b.cr
edit-
Suiss
e.co
m),
FTSE
Rus
sell
Indi
ces
(ww
w.ft
se.c
om).
All o
ther
dat
a w
as s
ourc
ed fr
om M
orni
ngst
ar.
Pag
e 6
|
62

For P
lan S
pons
or U
se O
nly
| Per
iod
Endi
ng 9
/30/
2019
Mac
roec
onom
ic Re
view
•In
spite
ofw
eak
expo
rts a
nd U
.S. b
usin
ess i
nves
tmen
t con
tract
ing,
GD
P in
crea
sed
at a
n an
nual
ized
rate
of 2
.0%
in Q
2 20
19 a
s stro
ng
cons
umer
spen
ding
hel
ped
to b
olst
er c
ontin
ued
grow
th.
•He
adlin
e in
flatio
n ro
se 0
.1%, w
hile
cor
e in
flatio
n fo
r 0.3
%. I
nfla
tion
has r
un b
elow
the
Fede
ral R
eser
ve’s
2% ta
rget
for m
uch
of th
e ye
ar.
•Th
e un
empl
oym
ent r
ate
fell
0.2%
, to
3.5%
ove
r the
qua
rter,
while
th
e la
bor f
orce
par
ticip
atio
n ra
te c
ame
in a
t 63.
2. T
he 3
.5%
un
empl
oym
ent r
ate
is th
e lo
west
read
ing
in n
early
50
year
s.
•Se
ptem
ber m
arke
d th
e 10
8thco
nsec
utive
mon
th o
f job
gro
wth;
the
long
est i
n hi
stor
y.
•Av
erag
e ho
urly
earn
ings
rose
3.1%
ove
r the
last
12 m
onth
s, en
ding
Ju
ne a
t $27
.90
per h
our.
Mac
roec
onom
ic Va
riabl
eLa
test
Dat
aPr
evio
us
Qua
rter
Chan
ge
Real
U.S
. GDP
(% Q
/Q A
nnua
lized
)2.
0%(Q
2 20
19)
3.1%
(Q1 2
019)
1.1%
Head
line
Infla
tion
(% Y
/Y)
1.7%
(Sep
tem
ber 2
019)
1.6%
(June
201
9)0.
1%
Core
Infla
tion
(% Y
/Y)
2.4%
(Sep
tem
ber 2
019)
2.1%
(June
201
9)0.
3%
Unem
ploy
men
t(%
)3.
5%(S
epte
mbe
r 201
9)3.
7%(Ju
ne20
19)
0.2%
Hour
s Wor
ked
(Ave
rage
/Wee
k)34
.4(S
epte
mbe
r 201
9)34
.4(Ju
ne 2
019)
00.0
Aver
age
Hour
ly W
ages
($)
$28.
09(S
epte
mbe
r 201
9)$2
7.90
(June
201
9)$0
.19
Aver
age
Price
of G
as($
/Gal
lon
-Reg
ular
)$2
.592
(Sep
tem
ber 2
019)
$2.7
16(Ju
ne20
19)
$0.12
4
Dolla
r/Eu
ro($
/€)
1.090
5(S
epte
mbe
r 201
9)1.1
374
(June
2019
)0.
0469
Yen/
Dolla
r(¥
/$)
108.
11(S
epte
mbe
r 201
9)10
7.84
(June
2019
)0.
27
Yuan
/Dol
lar
(¥/$
)7.
1477
(Sep
tem
ber 2
019)
6.86
50(Ju
ne20
19)
0.28
27
Fed
Fund
s Rat
e(%
Ran
ge)
1.75
–2.
00%
(Sep
tem
ber 2
019)
2.25
–2.
50%
(June
2019
)0.
50%
S&P
500
(Pric
e Le
vel)
2,97
6.74
(Sep
tem
ber 2
019)
2,94
1.76
(June
2019
)34
.98
Ten
Year
Tre
asur
y Yi
eld
(%)
1.68
(Sep
tem
ber 2
019)
2.00
(June
2019
)0.
32%
Geop
oliti
cal R
evie
w•
Muc
h lik
e la
st q
uarte
r, th
e U.
S. a
nd C
hina
con
tinue
d to
exp
lore
way
s to
dee
scal
ate
trade
tens
ions
bet
ween
the
two
coun
tries
. Litt
le-t
o-no
su
bsta
ntive
pro
gres
s was
mad
e du
ring
the
quar
ter.
•Th
e U.
S. H
ouse
of R
epre
sent
ative
s ope
ned-
up a
n im
peac
hmen
t in
quiry
into
Pre
siden
t Tru
mp’
s int
erac
tions
with
the
pres
iden
t of
Ukra
ine.
Thi
s is o
nly
the
4thU.
S. P
resid
ent t
o fa
ce im
peac
hmen
t
•Bo
ris Jo
hnso
n be
cam
e th
e ne
w Pr
ime
Min
ister
of t
he U
nite
d Ki
ngdo
m a
nd th
e le
adin
g fo
rce
to n
egot
iate
a w
ithdr
awal
from
the
Euro
pean
Uni
on. A
fter v
owin
g th
at th
e U.
K. w
ould
leav
e by
Oct
ober
31
stev
en if
ther
e wa
s no
deal
in p
lace
, Par
liam
ent v
oted
that
the
U.K.
co
uld
not w
ithdr
aw w
ithou
t a d
eal.
•Te
nsio
ns in
the
mid
dle
east
rose
as o
il fa
ciliti
es in
Sau
di A
rabi
a ap
pear
to h
ave
been
bom
bed
by Ir
ania
n or
Iran
ian-
back
ed fo
rces
.
MAC
ROEC
ON
OM
IC&
GEO
POLI
TICA
LRE
VIEW
Sour
ce:
Bure
au o
f Eco
nom
ic A
naly
sis (w
ww
.bea
.gov
), Bu
reau
of L
abor
Sta
tistic
s (w
ww
.bls.
gov)
, U.S
. Ene
rgy
Info
rmat
ion
Adm
inist
ratio
n (w
ww
.eia
.gov
), FR
ED E
cono
mic
Dat
a (fr
ed.s
tloui
sfed
.gov
). Ar
row
s dep
ict t
he u
pwar
ds, l
ater
al,
or d
ownw
ard
chan
ge in
dire
ctio
n fo
r a g
iven
mac
roec
onom
ic v
aria
ble.
The
col
or o
f the
arr
ow d
enot
es th
e po
sitiv
e, n
eutr
al, o
r neg
ativ
e sig
nal P
ensio
nmar
kpe
rcei
ves f
or th
e ch
ange
in m
acro
econ
omic
var
iabl
e. It
is e
duca
tiona
l in
natu
re a
nd n
ot d
esig
ned
to b
e ta
ken
as a
dvic
e or
a re
com
men
datio
n fo
r any
spec
ific
inve
stm
ent p
rodu
ct, s
trat
egy,
pla
n fe
atur
e or
oth
er p
urpo
se in
any
juris
dict
ion.
Thi
s dat
a do
es n
ot c
onta
in su
ffici
enti
nfor
mat
ion
for a
ny
inve
stm
ent d
ecisi
on a
nd sh
ould
not
be
relie
d up
on w
hen
cons
ider
ing
an in
vest
men
t str
ateg
y.
Pag
e 7
|
63

For P
lan S
pons
or U
se O
nly
| Per
iod
Endi
ng 9
/30/
2019
LOO
KIN
GAH
EAD
Trea
sury
Yi
eld
Curv
e
Asth
eTr
easu
ryyie
ldcu
rve
cont
inue
sto
inve
rt,in
vest
ors
may
beco
me
incr
easin
gly
conc
erne
dab
out
anon
com
ing
rece
ssio
n.W
hile
man
yec
onom
icre
adin
gsre
mai
nst
rong
,th
epr
olon
ged
U.S.
/Chi
natra
dedi
sput
eor
Fed
inac
tion
may
weig
hon
that
data
.
Glob
al
Econ
omic
Unce
rtain
ty
Inde
x
Drive
npr
imar
ilyby
the
trade
disp
utes
betw
een
the
U.S.
,Chi
na,
and
othe
rm
ajor
tradi
ngpa
rtner
s,we
’vese
enan
incr
ease
ingl
obal
econ
omic
unce
rtain
ty.T
his
cont
inue
dun
certa
inty
woul
dlik
ely
cont
inue
todr
ivegl
obal
grow
thex
pect
atio
nslo
wer.
Sour
ce: F
eder
al R
eser
ve o
f St.
Loui
s (w
ww
.fred
.stlo
uisf
ed.o
rg),
ISM
Man
ufac
turin
g Su
rvey
(ww
w.in
stitu
tefo
rsup
plym
anag
emen
t.com
), M
arki
t (w
ww
.mar
ket.c
om),
U.S
. Tre
asur
y (w
ww
.trea
sury
.gov
). Th
is da
ta d
oes
not c
onta
in s
uffic
ient
info
rmat
ion
for a
ny in
vest
men
t dec
ision
and
sho
uld
not b
e re
lied
upon
whe
n co
nsid
erin
g an
inve
stm
ent s
trat
egy.
9/30
/201
8
6/30
/201
9
9/30
/201
9
0.00
1.00
2.00
3.00
4.00
U.S
. Tre
asur
y Yi
eld
Curv
e (%
)
1 Yr5 Yr
10 Yr30 Yr
Fede
ral
Rese
rve
Inte
rest
Rat
e D
ecisi
ons
Afte
r the
Fed
eral
Res
erve
cut
inte
rest
rate
s twi
ce in
Q3,
ther
e is
a ke
en fo
cus o
n wh
at th
ey m
ay d
o th
roug
h th
e en
d of
the
year
; wh
ethe
r the
y co
ntin
ue to
cut
rate
s to
supp
ort g
rowt
h or
dec
ide
to
hold
rate
s ste
ady
will
likel
y ha
ve a
sign
ifica
nt im
pact
on
mar
kets
.
0%1%2%3%4%5%6%7%199920002001200220022003200420052005200620072008200820092010201120112012201320142014201520162017201720182019
Effe
ctiv
e Fe
dera
l Fun
ds R
ate
Glob
al
Man
ufac
turin
g PM
I
Glob
alPM
Irea
ding
sha
vebe
entre
ndin
glo
wer(
are
adin
gbe
low
50m
eans
the
man
ufac
turin
gse
ctor
isco
ntra
ctin
g).
Ifth
em
anuf
actu
ring
sect
ors
cont
inue
toco
ntra
ctgl
obal
ly,th
atco
uld
bea
stro
ngin
dica
toro
fwor
seni
nggl
obal
grow
th.
Coun
tryM
anuf
actu
ring
PMI
Coun
tryM
anuf
actu
ring
PMI
Aust
ralia
54.7
Net
herla
nds
51.6
Braz
il53
.4Ru
ssia
46.3
Cana
da51
.0Sa
udi A
rabi
a57
.3
Chin
a51
.4Si
ngap
ore
49.5
Fran
ce50
.1So
uth
Afric
a41
.6
Germ
any
41.7
Sout
h Ko
rea
48.0
Indi
a51
.4Sp
ain
47.7
Indo
nesia
49.1
Switz
erla
nd44
.6
Italy
47.8
Turk
ey50
.0
Japa
n48
.9Un
ited
King
dom
48.3
Mex
ico49
.1Un
ited
Stat
es51
.1
0255075100
125
150
175
200
225
250
275
300
1998
1999
2000
2001
2002
2003
2004
2005
2006
2007
2008
2009
2010
2011
2012
2013
2014
2015
2016
2017
2018
2019
Glob
al U
ncer
tain
ty In
dex:
GDP
Wei
ghte
d Av
erag
e
Pag
e 8
|
64

For P
lan S
pons
or U
se O
nly
| Per
iod
Endi
ng 9
/30/
2019
THE
IMPO
RTAN
CEO
FD
IVER
SIFI
CATI
ON
Larg
eCa
p:S&
P50
0;Sm
allC
ap:R
usse
ll20
00;E
M:M
SCIE
M;C
omm
oditi
es:B
loom
berg
Com
mod
ity;H
igh
Yiel
d:Ba
rcla
ysGl
obal
High
Yiel
d;Fi
xed
Inco
me:
Barc
lays
US
Agg
Bond
;DM
:MSC
IEAF
E;Ca
sh:B
arcl
aysU
STr
easu
ryBi
ll1-
3M
onth
;REI
T:FT
SEN
AREI
T;“A
sset
Allo
catio
n”po
rtfo
lioas
sum
es25
%S&
P50
0,10
%Ru
ssel
l200
0,15
%M
SCIE
AFE,
5%M
SCIE
M,2
5%Ba
rcla
ysU
SAg
gBo
nd,5
%Ba
rcla
ysGl
obal
High
Yiel
d,5%
USTr
easu
ryBi
ll1-
3M
onth
,5%
Bloo
mbe
rgCo
mm
odity
,and
5%FT
SEN
AREI
T.So
urce
:Mor
ning
star
Dire
ct.P
leas
ese
eth
eIm
port
antD
isclo
sure
ssec
tion
ofth
isre
port
forI
ndex
Defin
ition
s.Th
isin
form
atio
nis
noti
nten
ded
asa
solic
itatio
nor
anof
fert
obu
yor
sell
any
secu
rity
orin
vest
men
tpro
duct
.Pa
stpe
rfor
man
ceis
not
indi
cativ
eof
futu
rere
turn
s.In
form
atio
nis
sole
lyin
tend
edfo
rre
cipi
ents
inju
risdi
ctio
nsw
here
the
nam
edad
viso
r(s)
are
licen
sed
toen
gage
the
inve
stin
gpu
blic
.In
vest
men
tsan
dst
rate
gies
men
tione
dm
ayno
tbe
suita
ble
fora
llin
vest
ors.
The
S&P
500
and
othe
rsuc
hin
dice
sare
unm
anag
ed,d
ono
tinc
urfe
esor
expe
nse,
cann
otbe
inve
sted
into
dire
ctly
and
indi
vidu
alin
vest
or’s
resu
ltsw
illva
ry.
Asw
ithal
lin
vest
men
ts,v
ario
usris
ksm
ayex
istan
dPe
nsio
nmar
kFi
nanc
ialG
roup
,LLC
reco
mm
ends
you
cons
ultw
ithyo
urfin
anci
alad
viso
rprio
rto
mak
ing
any
inve
stm
entd
ecisi
ons.
Pag
e 9
|
65

EXEC
UTI
VE S
UM
MAR
Y
Com
mun
ity A
ctio
n Pa
rtne
rshi
p ER
ISA
403(
b)
For P
erio
d En
ding
09/
30/2
019
66

EXEC
UTIV
E SU
MM
ARY
For P
lan
Spon
sor U
se O
nly
Com
mun
ity A
ctio
n Pa
rtne
rshi
p ER
ISA
403(
b) In
vest
men
t Rev
iew
| Pe
riod
Endi
ng 0
9/30
/201
9
Inve
stm
ent S
corin
g Su
mm
ary
Pass
ing
Wat
chRe
view
Not
Sco
red
Tota
l
241
01
26
Inve
stm
ent A
dditi
ons
Inve
stm
ent N
ame
Sta
tus
Mor
ning
star
Rat
ing
No
curr
ent i
nves
tmen
t add
ition
s
Inve
stm
ents
on
Wat
ch
Inve
stm
ent N
ame
# of
Par
ticip
ants
Plan
Ass
ets
% o
f tot
al p
lan
Sta
tus
Qua
rter
s Fa
iling
Crit
eria
Mor
ning
star
Rat
ing
Smal
l Val
ue
DFA
US
Smal
l Cap
Val
ue I
38$2
8,01
3.48
0.53
%W
atch
2**
*
Inve
stm
ents
Tar
gete
d fo
r Rev
iew
Inve
stm
ent N
ame
Sta
tus
Mor
ning
star
Rat
ing
No
inve
stm
ents
are
cur
rent
ly ta
rget
ed fo
r rev
iew
Revi
ew :
Wat
ch :
Addi
tion
:Fo
r sou
rce
info
rmat
ion,
ple
ase
see
the
"Im
port
ant D
iscl
osur
es"
sect
ion
of th
is re
port
.
Pag
e 11
|
67

PORT
FOLI
O R
EVIE
W
Com
mun
ity A
ctio
n Pa
rtne
rshi
p ER
ISA
403(
b)
For P
erio
d En
ding
09/
30/2
019
68

PORT
FOLI
O |
DIVE
RSIF
ICAT
ION
For P
lan
Spon
sor U
se O
nly
Com
mun
ity A
ctio
n Pa
rtne
rshi
p ER
ISA
403(
b) In
vest
men
t Rev
iew
| Pe
riod
Endi
ng 0
9/30
/201
9
Valu
eBl
end
Grow
th
Larg
e
MFS
Val
ue R
6iS
hare
s S&
P 50
0 In
dex
KTI
AA-C
REF
Larg
e-Ca
p G
row
thIn
st
Med
ium
Wel
ls F
argo
Spe
cial
Mid
Cap
Valu
e In
stVa
ngua
rd M
id C
ap In
dex
Adm
iral
Mas
sMut
ual S
elec
t Mid
Cap
Gro
wth
I
Smal
l
DFA
US
Smal
l Cap
Val
ue I
Janu
s H
ende
rson
Trit
on T
Inte
rnat
iona
lEq
uitie
sFi
xed
Inco
me
Har
tfor
d In
tern
atio
nal O
ppor
tuni
ties
R6Am
eric
an F
unds
New
Wor
ld R
6
Asse
t Allo
catio
n
Putn
am D
ynam
ic A
sset
Allo
catio
n Cn
srv
YPu
tnam
Dyn
amic
Ass
et A
lloca
tion
Bal Y
Putn
am D
ynam
ic A
sset
Allo
catio
n G
r YBl
ackR
ock
Life
Path
® In
dex
Retir
e K
Blac
kRoc
k Li
fePa
th®
Inde
x 20
20 K
Blac
kRoc
k Li
fePa
th®
Inde
x 20
25 K
Blac
kRoc
k Li
fePa
th®
Inde
x 20
30 K
Blac
kRoc
k Li
fePa
th®
Inde
x 20
35 K
Blac
kRoc
k Li
fePa
th®
Inde
x 20
40 K
Blac
kRoc
k Li
fePa
th®
Inde
x 20
45 K
Blac
kRoc
k Li
fePa
th®
Inde
x 20
50 K
Blac
kRoc
k Li
fePa
th®
Inde
x 20
55 K
Blac
kRoc
k Li
fePa
th®
Inde
x 20
60 K
Fixe
d In
com
eCa
sh/S
tabl
e Va
lue
Vang
uard
Tot
al B
ond
Mar
ket I
ndex
Adm
The
Stan
dard
Sta
ble
Asse
t A
Oth
er
Prin
cipa
l Rea
l Est
ate
Secu
ritie
s In
st
Revi
ew :
Wat
ch :
Addi
tion
:
Asse
t cla
sses
are
defi
ned
as b
road
, dis
tinct
type
s of
inve
stm
ents
that
beh
ave
sim
ilarly
and
are
sub
ject
to m
ost o
f the
sam
e m
arke
t for
ces.
Whe
n ev
alua
ting
the
dive
rsifi
catio
n of
ass
ets
inth
e in
vest
men
t por
tfol
io, i
t is
an im
port
ant f
acto
r in
asse
ssin
g ris
k an
d re
turn
. For
sou
rce
info
rmat
ion,
ple
ase
see
the
"Im
port
ant D
iscl
osur
es"
sect
ion
of th
is re
port
.
Pag
e 13
|
69

PORT
FOLI
O |
ASSE
T AL
LOCA
TIO
N
For P
lan
Spon
sor U
se O
nly
Com
mun
ity A
ctio
n Pa
rtne
rshi
p ER
ISA
403(
b) In
vest
men
t Rev
iew
| Pe
riod
Endi
ng 0
9/30
/201
9
Hist
oric
al A
lloca
tion
Stab
le V
alue
Inte
rmed
iate
Cor
e Bo
ndAl
loca
tion-
-30%
to 5
0% E
quity
Allo
catio
n--5
0% to
70%
Equ
ityAl
loca
tion-
-70%
to 8
5% E
quity
Targ
et-D
ate
Retir
emen
tTa
rget
-Dat
e 20
20Ta
rget
-Dat
e 20
25Ta
rget
-Dat
e 20
30Ta
rget
-Dat
e 20
35Ta
rget
-Dat
e 20
40Ta
rget
-Dat
e 20
45Ta
rget
-Dat
e 20
50Ta
rget
-Dat
e 20
55Ta
rget
-Dat
e 20
60+
Larg
e Va
lue
Larg
e Bl
end
Larg
e G
row
thM
id-C
ap V
alue
Mid
-Cap
Ble
ndM
id-C
ap G
row
thSm
all V
alue
Smal
l Gro
wth
Fore
ign
Larg
e Bl
end
Div
ersi
fied
Emer
ging
Mkt
sRe
al E
stat
e
100% 80%
60%
40%
20% 0%
Q3
2019
Q2
2019
Q1
2019
Q4
2018
Q3
2018
Q2
2018
Q1
2018
Q4
2017
Pag
e 14
|
70
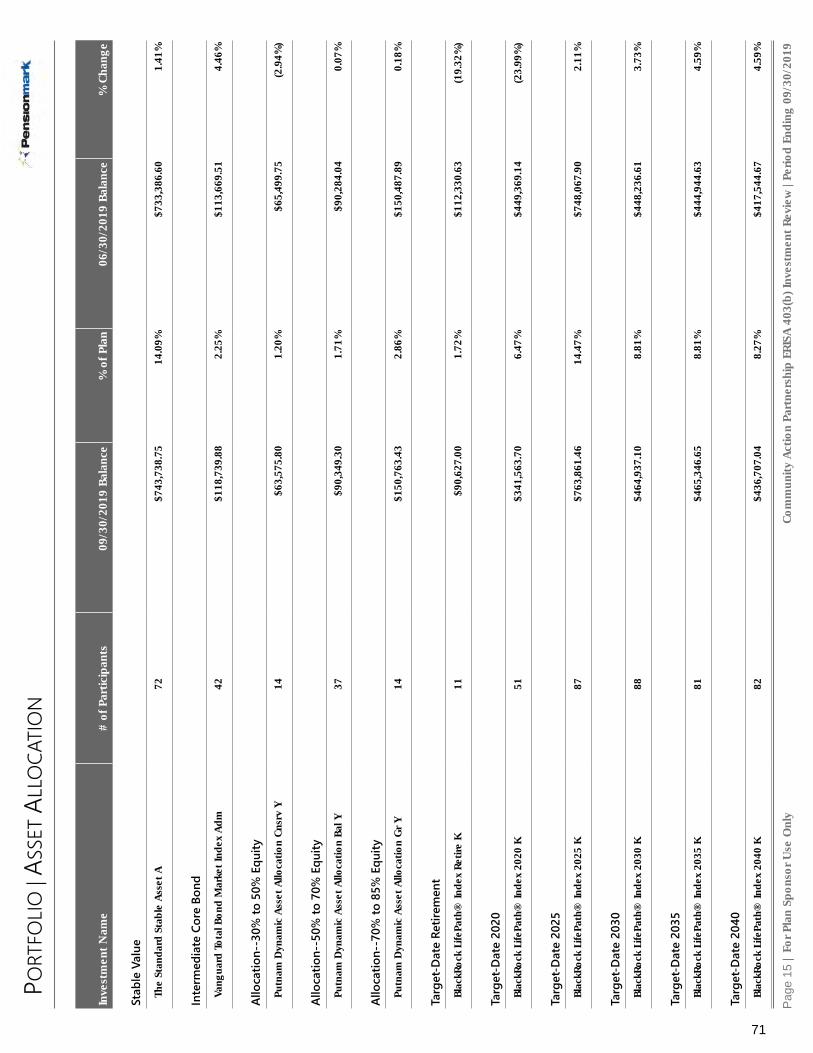
PORT
FOLI
O |
ASSE
T AL
LOCA
TIO
N
For P
lan
Spon
sor U
se O
nly
Com
mun
ity A
ctio
n Pa
rtne
rshi
p ER
ISA
403(
b) In
vest
men
t Rev
iew
| Pe
riod
Endi
ng 0
9/30
/201
9
Inve
stm
ent N
ame
# of
Par
ticip
ants
09/3
0/20
19 B
alan
ce%
of P
lan
06/3
0/20
19 B
alan
ce%
Cha
nge
Stab
le V
alue
The
Stan
dard
Sta
ble
Asse
t A72
$743
,738
.75
14.0
9%$7
33,3
86.6
01.
41%
Inte
rmed
iate
Cor
e Bo
nd
Vang
uard
Tot
al B
ond
Mar
ket I
ndex
Adm
42$1
18,7
39.8
82.
25%
$113
,669
.51
4.46
%
Allo
catio
n--3
0% to
50%
Equ
ity
Putn
am D
ynam
ic A
sset
Allo
catio
n Cn
srv
Y14
$63,
575.
801.
20%
$65,
499.
75(2
.94%
)
Allo
catio
n--5
0% to
70%
Equ
ity
Putn
am D
ynam
ic A
sset
Allo
catio
n Ba
l Y37
$90,
349.
301.
71%
$90,
284.
040.
07%
Allo
catio
n--7
0% to
85%
Equ
ity
Putn
am D
ynam
ic A
sset
Allo
catio
n G
r Y14
$150
,763
.43
2.86
%$1
50,4
87.8
90.
18%
Targ
et-D
ate
Retir
emen
t
Blac
kRoc
k Li
fePa
th®
Inde
x Re
tire
K11
$90,
627.
001.
72%
$112
,330
.63
(19.
32%
)
Targ
et-D
ate
2020
Blac
kRoc
k Li
fePa
th®
Inde
x 20
20 K
51$3
41,5
63.7
06.
47%
$449
,369
.14
(23.
99%
)
Targ
et-D
ate
2025
Blac
kRoc
k Li
fePa
th®
Inde
x 20
25 K
87$7
63,8
61.4
614
.47%
$748
,067
.90
2.11
%
Targ
et-D
ate
2030
Blac
kRoc
k Li
fePa
th®
Inde
x 20
30 K
88$4
64,9
37.1
08.
81%
$448
,236
.61
3.73
%
Targ
et-D
ate
2035
Blac
kRoc
k Li
fePa
th®
Inde
x 20
35 K
81$4
65,3
46.6
58.
81%
$444
,944
.63
4.59
%
Targ
et-D
ate
2040
Blac
kRoc
k Li
fePa
th®
Inde
x 20
40 K
82$4
36,7
07.0
48.
27%
$417
,544
.67
4.59
%
Pag
e 15
|
71
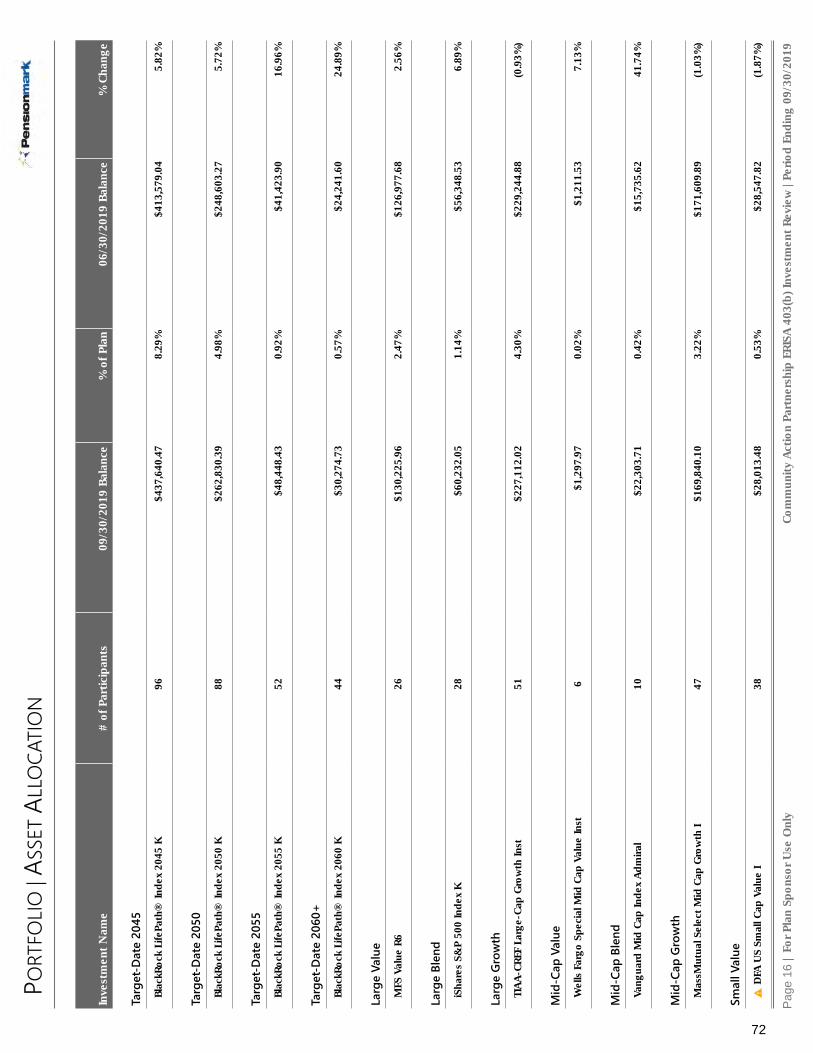
PORT
FOLI
O |
ASSE
T AL
LOCA
TIO
N
For P
lan
Spon
sor U
se O
nly
Com
mun
ity A
ctio
n Pa
rtne
rshi
p ER
ISA
403(
b) In
vest
men
t Rev
iew
| Pe
riod
Endi
ng 0
9/30
/201
9
Inve
stm
ent N
ame
# of
Par
ticip
ants
09/3
0/20
19 B
alan
ce%
of P
lan
06/3
0/20
19 B
alan
ce%
Cha
nge
Targ
et-D
ate
2045
Blac
kRoc
k Li
fePa
th®
Inde
x 20
45 K
96$4
37,6
40.4
78.
29%
$413
,579
.04
5.82
%
Targ
et-D
ate
2050
Blac
kRoc
k Li
fePa
th®
Inde
x 20
50 K
88$2
62,8
30.3
94.
98%
$248
,603
.27
5.72
%
Targ
et-D
ate
2055
Blac
kRoc
k Li
fePa
th®
Inde
x 20
55 K
52$4
8,44
8.43
0.92
%$4
1,42
3.90
16.9
6%
Targ
et-D
ate
2060
+
Blac
kRoc
k Li
fePa
th®
Inde
x 20
60 K
44$3
0,27
4.73
0.57
%$2
4,24
1.60
24.8
9%
Larg
e Va
lue
MFS
Val
ue R
626
$130
,225
.96
2.47
%$1
26,9
77.6
82.
56%
Larg
e Bl
end
iSha
res
S&P
500
Inde
x K
28$6
0,23
2.05
1.14
%$5
6,34
8.53
6.89
%
Larg
e Gr
owth
TIAA
-CRE
F La
rge-
Cap
Gro
wth
Inst
51$2
27,1
12.0
24.
30%
$229
,244
.88
(0.9
3%)
Mid
-Cap
Val
ue
Wel
ls F
argo
Spe
cial
Mid
Cap
Val
ue In
st6
$1,2
97.9
70.
02%
$1,2
11.5
37.
13%
Mid
-Cap
Ble
nd
Vang
uard
Mid
Cap
Inde
x Ad
mira
l10
$22,
303.
710.
42%
$15,
735.
6241
.74%
Mid
-Cap
Gro
wth
Mas
sMut
ual S
elec
t Mid
Cap
Gro
wth
I47
$169
,840
.10
3.22
%$1
71,6
09.8
9(1
.03%
)
Smal
l Val
ue
DFA
US
Smal
l Cap
Val
ue I
38$2
8,01
3.48
0.53
%$2
8,54
7.82
(1.8
7%)
Pag
e 16
|
72

PORT
FOLI
O |
ASSE
T AL
LOCA
TIO
N
For P
lan
Spon
sor U
se O
nly
Com
mun
ity A
ctio
n Pa
rtne
rshi
p ER
ISA
403(
b) In
vest
men
t Rev
iew
| Pe
riod
Endi
ng 0
9/30
/201
9
Inve
stm
ent N
ame
# of
Par
ticip
ants
09/3
0/20
19 B
alan
ce%
of P
lan
06/3
0/20
19 B
alan
ce%
Cha
nge
Smal
l Gro
wth
Janu
s H
ende
rson
Trit
on T
30$5
1,13
4.52
0.97
%$5
2,45
4.03
(2.5
2%)
Fore
ign
Larg
e Bl
end
Har
tfor
d In
tern
atio
nal O
ppor
tuni
ties
R66
$841
.63
0.02
%$6
10.1
637
.94%
Div
ersifi
ed E
mer
ging
Mkt
s
Amer
ican
Fun
ds N
ew W
orld
R6
44$6
8,35
1.03
1.29
%$6
9,15
3.98
(1.1
6%)
Real
Est
ate
Prin
cipa
l Rea
l Est
ate
Secu
ritie
s In
st5
$11,
512.
360.
22%
$10,
947.
645.
16%
Tota
l:$5
,280
,268
.96
$5,2
64,5
10.9
40.
30%
Revi
ew :
Wat
ch :
Addi
tion
:D
enot
es p
oten
tial a
dditi
on o
r rep
lace
men
t opt
ion(
s). O
ptio
n(s)
are
sub
ject
to fi
nal a
ppro
val a
s pl
atfo
rms
may
dis
cont
inue
opt
ion
avai
labi
lity.
For s
ourc
e in
for m
atio
n, p
leas
e se
e th
e "I
mpo
rtan
t Dis
clos
ures
" se
ctio
n of
this
repo
rt.
Pag
e 17
|
73

PORT
FOLI
O |
HOLD
INGS
& S
ECTO
R AL
LOCA
TIO
N
For P
lan
Spon
sor U
se O
nly
Com
mun
ity A
ctio
n Pa
rtne
rshi
p ER
ISA
403(
b) In
vest
men
t Rev
iew
| Pe
riod
Endi
ng 0
9/30
/201
9
Top
10 H
oldi
ngs
Sect
or A
lloca
tion
For s
ourc
e in
form
atio
n, p
leas
e se
e th
e "I
mpo
rtan
t Dis
clos
ures
" se
ctio
n of
this
repo
rt.
Pag
e 18
|
74

PORT
FOLI
O |
REGI
ON
& Q
UALI
TY A
LLO
CATI
ON
For P
lan
Spon
sor U
se O
nly
Com
mun
ity A
ctio
n Pa
rtne
rshi
p ER
ISA
403(
b) In
vest
men
t Rev
iew
| Pe
riod
Endi
ng 0
9/30
/201
9
Regi
on A
lloca
tion
Qua
lity
Allo
catio
n
For s
ourc
e in
form
atio
n, p
leas
e se
e th
e "I
mpo
rtan
t Dis
clos
ures
" se
ctio
n of
this
repo
rt.
Pag
e 19
|
75

PORT
FOLI
O |
RETU
RNS
For P
lan
Spon
sor U
se O
nly
Com
mun
ity A
ctio
n Pa
rtne
rshi
p ER
ISA
403(
b) In
vest
men
t Rev
iew
| Pe
riod
Endi
ng 0
9/30
/201
9
Annu
aliz
ed R
etur
ns
Peer
Gro
up A
vera
geBe
nchm
ark
Inde
xCu
rren
t Lin
eup
Return16 14 12 10 8 6 4 2 010
Yea
rs5
Year
s3
Year
s1
Year
YTD
Cale
ndar
Yea
r Ret
urns
Peer
Gro
up A
vera
geBe
nchm
ark
Inde
xCu
rren
t Lin
eup
Return18 16 14 12 10 8 6 4 2 0 -2 -4 -6 -8YT
D20
1820
1720
1620
1520
14
Trai
ling
Retu
rns
YTD
1 Ye
ar3
Year
s5
Year
s10
Yea
rsN
etEx
p.Ra
tioCu
rren
t Lin
eup
13.5
84.
267.
836.
466.
370.
20
Benc
hmar
k In
dex
13.7
14.
227.
916.
226.
35N
A
Peer
Gro
up A
vera
ge12
.77
3.15
7.44
5.87
6.10
0.82
Cale
ndar
Yea
r Ret
urns
2014
2015
2016
2017
2018
YTD
Net
Exp.
Ratio
Curr
ent L
ineu
p6.
400.
276.
3315
.59
-4.6
313
.58
0.20
Benc
hmar
k In
dex
5.73
-1.5
98.
2615
.23
-4.8
513
.71
NA
Peer
Gro
up A
vera
ge5.
27-0
.92
6.85
15.1
7-5
.15
12.7
70.
82
The
perf
orm
ance
dat
a qu
oted
rep
rese
nts
past
per
form
ance
. Pas
t pe
rfor
man
ce d
oes
not
guar
ante
e fu
ture
res
ults
. Inv
estm
ent
retu
rn a
nd p
rinci
pal v
alue
will
fluc
tuat
e so
tha
t an
inve
stor
's sh
ares
, whe
nre
deem
ed, m
ay b
e w
orth
mor
e or
less
than
thei
r or
igin
al c
ost.
Curr
ent p
erfo
rman
ce m
ay b
e lo
wer
or
high
er th
an th
e pe
rfor
man
ce in
form
atio
n qu
oted
. The
per
form
ance
quo
ted
refle
cts
the
rein
vest
men
t of
divi
dend
s an
d ca
pita
l gai
ns a
nd is
net
of a
ll ex
pens
es. T
o ob
tain
cur
rent
mon
th-e
nd p
erfo
rman
ce in
form
atio
n, p
leas
e co
ntac
t the
pho
ne n
umbe
r loc
ated
in th
e "I
mpo
rtan
t Dis
clos
ures
" se
ctio
n of
this
repo
rt.
The
Benc
hmar
k In
dex
is c
onst
ruct
ed u
tiliz
ing
the
unde
rlyin
g in
dexe
s of
the
Plan
's in
vest
men
t opt
ions
wei
ghte
d in
pro
port
ion
to th
e as
set a
lloca
tion
of th
e Pl
an. T
he u
nder
lyin
g in
dexe
s ar
e ill
ustr
ated
on
the
stan
dard
ized
per
form
ance
pag
es o
f the
repo
rt. F
or s
ourc
e in
form
atio
n, p
leas
e se
e th
e "I
mpo
rtan
t Dis
clos
ures
" se
ctio
n of
this
repo
rt.
Pag
e 20
|
76

PORT
FOLI
O |
BETA
/STA
NDA
RD D
EVIA
TIO
N
For P
lan
Spon
sor U
se O
nly
Com
mun
ity A
ctio
n Pa
rtne
rshi
p ER
ISA
403(
b) In
vest
men
t Rev
iew
| Pe
riod
Endi
ng 0
9/30
/201
9
Annu
aliz
ed B
eta
Peer
Gro
up A
vera
geCu
rren
t Lin
eup
Beta2 1 010
Yea
rs5
Year
s3
Year
s1
Year
Annu
aliz
ed S
tand
ard
Dev
iatio
n
Peer
Gro
up A
vera
geBe
nchm
ark
Inde
xCu
rren
t Lin
eup
Std Dev13 12 11 10 9 8 7 6 5 4 3 2 1 010
Yea
rs5
Year
s3
Year
s1
Year
Trai
ling
Beta
1 Ye
ar3
Year
s5
Year
s10
Yea
rsCu
rren
t Lin
eup
0.98
0.99
0.99
0.96
Peer
Gro
up A
vera
ge0.
980.
980.
980.
98
Trai
ling
Stan
dard
Dev
iatio
n
1 Ye
ar3
Year
s5
Year
s10
Yea
rsCu
rren
t Lin
eup
11.6
17.
447.
517.
37
Benc
hmar
k In
dex
11.8
07.
517.
587.
64
Peer
Gro
up A
vera
ge11
.57
7.38
7.45
7.49
Cale
ndar
Yea
r Bet
a
2014
2015
2016
2017
2018
Curr
ent L
ineu
p0.
901.
010.
970.
931.
01
Peer
Gro
up A
vera
ge0.
971.
000.
950.
931.
00
Cale
ndar
Yea
r Sta
ndar
d D
evia
tion
2014
2015
2016
2017
2018
Curr
ent L
ineu
p5.
778.
357.
481.
838.
89
Benc
hmar
k In
dex
6.37
8.23
7.68
1.91
8.82
Peer
Gro
up A
vera
ge6.
218.
237.
351.
828.
86
For s
ourc
e in
form
atio
n, p
leas
e se
e th
e "I
mpo
rtan
t Dis
clos
ures
" se
ctio
n of
this
repo
rt.
Pag
e 21
|
77

PORT
FOLI
O |
ALPH
A
For P
lan
Spon
sor U
se O
nly
Com
mun
ity A
ctio
n Pa
rtne
rshi
p ER
ISA
403(
b) In
vest
men
t Rev
iew
| Pe
riod
Endi
ng 0
9/30
/201
9
Annu
aliz
ed A
lpha
Peer
Gro
up A
vera
geCu
rren
t Lin
eup
Alpha
1 0 -1 -210
Yea
rs5
Year
s3
Year
s1
Year
Cale
ndar
Yea
r Alp
ha
Peer
Gro
up A
vera
geCu
rren
t Lin
eup
Alpha
3 2 1 0 -1 -220
1820
1720
1620
1520
14
Trai
ling
Alph
a
1 Ye
ar3
Year
s5
Year
s10
Yea
rsCu
rren
t Lin
eup
0.06
-0.0
10.
300.
24
Peer
Gro
up A
vera
ge-1
.01
-0.3
4-0
.24
-0.1
2
Cale
ndar
Yea
r Alp
ha
2014
2015
2016
2017
2018
Curr
ent L
ineu
p1.
191.
89-1
.57
1.20
0.28
Peer
Gro
up A
vera
ge-0
.28
0.67
-0.9
70.
90-0
.29
For s
ourc
e in
form
atio
n, p
leas
e se
e th
e "I
mpo
rtan
t Dis
clos
ures
" se
ctio
n of
this
repo
rt.
Pag
e 22
|
78
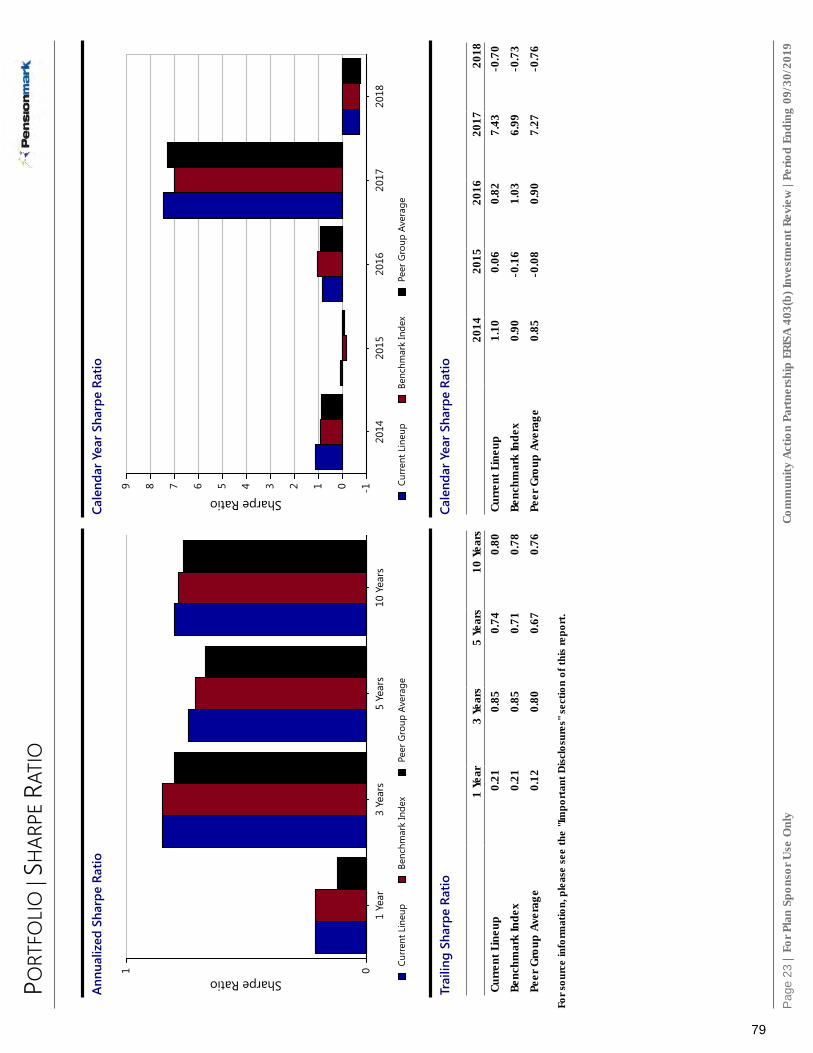
PORT
FOLI
O |
SHAR
PE R
ATIO
For P
lan
Spon
sor U
se O
nly
Com
mun
ity A
ctio
n Pa
rtne
rshi
p ER
ISA
403(
b) In
vest
men
t Rev
iew
| Pe
riod
Endi
ng 0
9/30
/201
9
Annu
aliz
ed S
harp
e Ra
tio
Peer
Gro
up A
vera
geBe
nchm
ark
Inde
xCu
rren
t Lin
eup
Sharpe Ratio1 010
Yea
rs5
Year
s3
Year
s1
Year
Cale
ndar
Yea
r Sha
rpe
Ratio
Peer
Gro
up A
vera
geBe
nchm
ark
Inde
xCu
rren
t Lin
eup
Sharpe Ratio
9 8 7 6 5 4 3 2 1 0 -120
1820
1720
1620
1520
14
Trai
ling
Shar
pe R
atio
1 Ye
ar3
Year
s5
Year
s10
Yea
rsCu
rren
t Lin
eup
0.21
0.85
0.74
0.80
Benc
hmar
k In
dex
0.21
0.85
0.71
0.78
Peer
Gro
up A
vera
ge0.
120.
800.
670.
76
Cale
ndar
Yea
r Sha
rpe
Ratio
2014
2015
2016
2017
2018
Curr
ent L
ineu
p1.
100.
060.
827.
43-0
.70
Benc
hmar
k In
dex
0.90
-0.1
61.
036.
99-0
.73
Peer
Gro
up A
vera
ge0.
85-0
.08
0.90
7.27
-0.7
6
For s
ourc
e in
form
atio
n, p
leas
e se
e th
e "I
mpo
rtan
t Dis
clos
ures
" se
ctio
n of
this
repo
rt.
Pag
e 23
|
79

PORT
FOLI
O |
INFO
RMAT
ION
RAT
IO
For P
lan
Spon
sor U
se O
nly
Com
mun
ity A
ctio
n Pa
rtne
rshi
p ER
ISA
403(
b) In
vest
men
t Rev
iew
| Pe
riod
Endi
ng 0
9/30
/201
9
Rolli
ng In
form
atio
n Ra
tio(T
raili
ng 3
Yea
r)
Peer
Gro
up A
vera
geCu
rren
t Lin
eup
Tim
e Pe
riod:
10/
31/2
017
to 0
9/30
/201
9
Information Ratio (arith)
1 0 -1 -2
09 19
08 19
07 19
06 19
05 19
04 19
03 19
02 19
01 19
12 18
11 18
10 18
09 18
08 18
07 18
06 18
05 18
04 18
03 18
02 18
01 18
12 17
11 17
10 17
Annu
aliz
ed In
form
atio
n Ra
tios
Peer
Gro
up A
vera
geCu
rren
t Lin
eup
Information Ratio (arith)
1 0 -1 -2 -3 -410
Yea
rs5
Year
s3
Year
s1
Year
Rolli
ng In
form
atio
n Ra
tio (R
ollin
g - 3
Yea
r)
YTD
1 Ye
ar3
Year
s5
Year
s10
Yea
rsCu
rren
t Lin
eup
-0.3
9-0
.42
0.01
0.08
0.07
Peer
Gro
up A
vera
ge-0
.90
-0.9
0-0
.49
-0.4
00.
09
Cale
ndar
Yea
r Inf
orm
atio
n Ra
tio 2014
2015
2016
2017
2018
Curr
ent L
ineu
p0.
711.
62-2
.25
0.78
0.74
Peer
Gro
up A
vera
ge-0
.77
0.90
-1.6
1-0
.12
-1.0
3
Trai
ling
Info
rmat
ion
Ratio
1 Ye
ar3
Year
s5
Year
s10
Yea
rsCu
rren
t Lin
eup
0.08
-0.1
60.
300.
02
Peer
Gro
up A
vera
ge-2
.53
-1.0
8-0
.57
-0.4
3
For s
ourc
e in
form
atio
n, p
leas
e se
e th
e "I
mpo
rtan
t Dis
clos
ures
" se
ctio
n of
this
repo
rt.
Pag
e 24
|
80

PORT
FOLI
O |
CUM
ULAT
IVE
PERF
ORM
ANCE
For P
lan
Spon
sor U
se O
nly
Com
mun
ity A
ctio
n Pa
rtne
rshi
p ER
ISA
403(
b) In
vest
men
t Rev
iew
| Pe
riod
Endi
ng 0
9/30
/201
9
Tim
e pe
riod
: Sep
tem
ber 2
009
- Se
ptem
ber 2
019
Plan
Cat
egor
yBe
nchm
ark
Inde
xCu
rren
t Lin
eup
Growth of $100
195
184
173
162
151
140
128
117
106 95 84
09/2
019
01/2
018
01/2
016
01/2
014
01/2
012
09/2
009
1 YR
3 YR
5 YR
10 Y
R
Curr
ent L
ineu
p4.
26%
25.3
8%36
.73%
85.4
6%Be
nchm
ark
Inde
x4.
22%
25.6
6%35
.24%
85.1
2%Pl
an C
ateg
ory
3.15
%24
.00%
32.9
9%80
.81%
Gro
wth
of $
100
is c
alcu
late
d at
NAV
and
ass
umes
that
all
divi
dend
and
cap
ital g
ain
dist
ribut
ions
wer
e re
inve
sted
. It d
oes
not t
ake
into
acc
ount
sal
es c
harg
es o
r the
effe
ct o
f tax
es. R
esul
ts a
re n
ot in
dica
tive
offu
ture
per
for m
ance
. For
sou
rce
info
rmat
ion,
ple
ase
see
the
"Im
port
ant D
iscl
osur
es"
sect
ion
of th
is re
port
.
Pag
e 25
|
81

PORT
FOLI
O |
WEI
GHTE
D FE
E AN
ALYS
IS
For P
lan
Spon
sor U
se O
nly
Com
mun
ity A
ctio
n Pa
rtne
rshi
p ER
ISA
403(
b) In
vest
men
t Rev
iew
| Pe
riod
Endi
ng 0
9/30
/201
9
Tota
l Pla
n As
sets
Wei
ghte
d In
vest
men
tCo
stW
eigh
ted
Inve
stm
ent
Expe
nse
$5,2
80,2
68.9
6$1
0,44
5.33
0.20
%
Inve
stm
ent
#of P
artic
ipan
ts20
19-0
9-30
Bal
ance
% o
f Tot
al P
lan
Fund
Exp
ense
Wei
ghte
d Co
st
Stab
le V
alue
The
Stan
dard
Sta
ble
Asse
t A72
$743
,738
.75
14.0
9%0.
10%
$743
.74
Inte
rmed
iate
Cor
e Bo
nd
Vang
uard
Tot
al B
ond
Mar
ket I
ndex
Adm
- V
BTLX
42$1
18,7
39.8
82.
25%
0.05
%$5
9.37
Allo
catio
n--3
0% to
50%
Equ
ity
Putn
am D
ynam
ic A
sset
Allo
catio
n Cn
srv
Y -
PACY
X14
$63,
575.
801.
20%
0.74
%$4
70.4
6
Allo
catio
n--5
0% to
70%
Equ
ity
Putn
am D
ynam
ic A
sset
Allo
catio
n Ba
l Y -
PAB
YX37
$90,
349.
301.
71%
0.72
%$6
50.5
1
Allo
catio
n--7
0% to
85%
Equ
ity
Putn
am D
ynam
ic A
sset
Allo
catio
n G
r Y -
PAG
YX14
$150
,763
.43
2.86
%0.
82%
$1,2
36.2
6
Targ
et-D
ate
Retir
emen
t
Blac
kRoc
k Li
fePa
th®
Inde
x Re
tire
K -
LIRK
X11
$90,
627.
001.
72%
0.10
%$9
0.63
Targ
et-D
ate
2020
Blac
kRoc
k Li
fePa
th®
Inde
x 20
20 K
- L
IMKX
51$3
41,5
63.7
06.
47%
0.10
%$3
41.5
6
Targ
et-D
ate
2025
Blac
kRoc
k Li
fePa
th®
Inde
x 20
25 K
- L
IBKX
87$7
63,8
61.4
614
.47%
0.10
%$7
63.8
6
Pag
e 26
|
82

PORT
FOLI
O |
WEI
GHTE
D FE
E AN
ALYS
IS
For P
lan
Spon
sor U
se O
nly
Com
mun
ity A
ctio
n Pa
rtne
rshi
p ER
ISA
403(
b) In
vest
men
t Rev
iew
| Pe
riod
Endi
ng 0
9/30
/201
9
Inve
stm
ent
#of P
artic
ipan
ts20
19-0
9-30
Bal
ance
% o
f Tot
al P
lan
Fund
Exp
ense
Wei
ghte
d Co
st
Targ
et-D
ate
2030
Blac
kRoc
k Li
fePa
th®
Inde
x 20
30 K
- L
INKX
88$4
64,9
37.1
08.
81%
0.10
%$4
64.9
4
Targ
et-D
ate
2035
Blac
kRoc
k Li
fePa
th®
Inde
x 20
35 K
- L
IJKX
81$4
65,3
46.6
58.
81%
0.10
%$4
65.3
5
Targ
et-D
ate
2040
Blac
kRoc
k Li
fePa
th®
Inde
x 20
40 K
- L
IKKX
82$4
36,7
07.0
48.
27%
0.10
%$4
36.7
1
Targ
et-D
ate
2045
Blac
kRoc
k Li
fePa
th®
Inde
x 20
45 K
- L
IHKX
96$4
37,6
40.4
78.
29%
0.10
%$4
37.6
4
Targ
et-D
ate
2050
Blac
kRoc
k Li
fePa
th®
Inde
x 20
50 K
- L
IPKX
88$2
62,8
30.3
94.
98%
0.10
%$2
62.8
3
Targ
et-D
ate
2055
Blac
kRoc
k Li
fePa
th®
Inde
x 20
55 K
- L
IVKX
52$4
8,44
8.43
0.92
%0.
09%
$43.
60
Targ
et-D
ate
2060
+
Blac
kRoc
k Li
fePa
th®
Inde
x 20
60 K
- L
IZKX
44$3
0,27
4.73
0.57
%0.
10%
$30.
27
Larg
e Va
lue
MFS
Val
ue R
6 -
MEI
KX26
$130
,225
.96
2.47
%0.
48%
$625
.08
Larg
e Bl
end
iSha
res
S&P
500
Inde
x K
- W
FSPX
28$6
0,23
2.05
1.14
%0.
03%
$18.
07
Larg
e Gr
owth
TIAA
-CRE
F La
rge-
Cap
Gro
wth
Inst
- T
ILG
X51
$227
,112
.02
4.30
%0.
41%
$931
.16
Pag
e 27
|
83

PORT
FOLI
O |
WEI
GHTE
D FE
E AN
ALYS
IS
For P
lan
Spon
sor U
se O
nly
Com
mun
ity A
ctio
n Pa
rtne
rshi
p ER
ISA
403(
b) In
vest
men
t Rev
iew
| Pe
riod
Endi
ng 0
9/30
/201
9
Inve
stm
ent
#of P
artic
ipan
ts20
19-0
9-30
Bal
ance
% o
f Tot
al P
lan
Fund
Exp
ense
Wei
ghte
d Co
st
Mid
-Cap
Val
ue
Wel
ls F
argo
Spe
cial
Mid
Cap
Val
ue In
st -
WFM
IX6
$1,2
97.9
70.
02%
0.83
%$1
0.77
Mid
-Cap
Ble
nd
Vang
uard
Mid
Cap
Inde
x Ad
mira
l - V
IMAX
10$2
2,30
3.71
0.42
%0.
05%
$11.
15
Mid
-Cap
Gro
wth
Mas
sMut
ual S
elec
t Mid
Cap
Gro
wth
I -
MEF
ZX47
$169
,840
.10
3.22
%0.
71%
$1,2
05.8
6
Smal
l Val
ue
DFA
US
Smal
l Cap
Val
ue I
- D
FSVX
38$2
8,01
3.48
0.53
%0.
52%
$145
.67
Smal
l Gro
wth
Janu
s H
ende
rson
Trit
on T
- JA
TTX
30$5
1,13
4.52
0.97
%0.
91%
$465
.32
Fore
ign
Larg
e Bl
end
Har
tfor
d In
tern
atio
nal O
ppor
tuni
ties
R6 -
IHO
VX6
$841
.63
0.02
%0.
71%
$5.9
8
Div
ersifi
ed E
mer
ging
Mkt
s
Amer
ican
Fun
ds N
ew W
orld
R6
- RN
WG
X44
$68,
351.
031.
29%
0.62
%$4
23.7
8
Real
Est
ate
Prin
cipa
l Rea
l Est
ate
Secu
ritie
s In
st -
PIR
EX5
$11,
512.
360.
22%
0.91
%$1
04.7
6
Revi
ew :
Wat
ch :
Addi
tion
:
Den
otes
pot
entia
l add
ition
or r
epla
cem
ent o
ptio
n(s)
. Opt
ion(
s) a
re s
ubje
ct to
fina
l app
rova
l as
plat
form
s m
ay d
isco
ntin
ue o
ptio
n av
aila
bilit
y.Fo
r sou
rce
info
rmat
ion,
ple
ase
see
the
"Im
por t
ant D
iscl
osur
es"
sect
ion
of th
is re
port
.
Pag
e 28
|
84
INVE
STM
ENT
REVI
EW -
100
PO
INT
Com
mun
ity A
ctio
n Pa
rtne
rshi
p ER
ISA
403(
b)
For P
erio
d En
ding
09/
30/2
019
85

INVE
STM
ENT
SCO
RECA
RD |
C URR
ENT
& H
ISTO
RICA
L SC
ORI
NG
For P
lan
Spon
sor U
se O
nly
Com
mun
ity A
ctio
n Pa
rtne
rshi
p ER
ISA
403(
b) In
vest
men
t Rev
iew
| Pe
riod
Endi
ng 0
9/30
/201
9
Inve
stm
ent N
ame
Curr
ent
Stat
us#
of P
artic
ipan
tsAs
sets
% o
f Pla
nQ
2/19
Q1/
19Q
4/18
Q3/
18Q
2/18
Q1/
18Q
4/17
Inte
rmed
iate
Cor
e Bo
nd
Vang
uard
Tot
al B
ond
Mar
ket I
ndex
Adm
- V
BTLX
7842
$118
,739
.88
2.25
%70
100
100
100
100
100
100
Allo
catio
n--3
0% to
50%
Equ
ity
Putn
am D
ynam
ic A
sset
Allo
catio
n Cn
srv
Y -
PACY
X76
14$6
3,57
5.80
1.20
%82
8282
8586
8288
Allo
catio
n--5
0% to
70%
Equ
ity
Putn
am D
ynam
ic A
sset
Allo
catio
n Ba
l Y -
PAB
YX72
37$9
0,34
9.30
1.71
%79
8280
9093
9098
Allo
catio
n--7
0% to
85%
Equ
ity
Putn
am D
ynam
ic A
sset
Allo
catio
n G
r Y -
PAG
YX82
14$1
50,7
63.4
32.
86%
8892
8698
9696
100
Targ
et-D
ate
Retir
emen
t
Blac
kRoc
k Li
fePa
th®
Inde
x Re
tire
K -
LIRK
X92
11$9
0,62
7.00
1.72
%92
9290
9696
9496
Targ
et-D
ate
2020
Blac
kRoc
k Li
fePa
th®
Inde
x 20
20 K
- L
IMKX
8851
$341
,563
.70
6.47
%86
8388
8485
7682
Targ
et-D
ate
2025
Blac
kRoc
k Li
fePa
th®
Inde
x 20
25 K
- L
IBKX
8687
$763
,861
.46
14.4
7%90
8890
8488
7682
Targ
et-D
ate
2030
Blac
kRoc
k Li
fePa
th®
Inde
x 20
30 K
- L
INKX
8888
$464
,937
.10
8.81
%88
9090
8687
7779
Targ
et-D
ate
2035
Blac
kRoc
k Li
fePa
th®
Inde
x 20
35 K
- L
IJKX
8881
$465
,346
.65
8.81
%90
9292
8687
7979
Targ
et-D
ate
2040
Blac
kRoc
k Li
fePa
th®
Inde
x 20
40 K
- L
IKKX
9382
$436
,707
.04
8.27
%93
9392
8889
8384
Targ
et-D
ate
2045
Blac
kRoc
k Li
fePa
th®
Inde
x 20
45 K
- L
IHKX
9696
$437
,640
.47
8.29
%93
9392
8893
8387
Pag
e 30
|
86

INVE
STM
ENT
SCO
RECA
RD |
C URR
ENT
& H
ISTO
RICA
L SC
ORI
NG
For P
lan
Spon
sor U
se O
nly
Com
mun
ity A
ctio
n Pa
rtne
rshi
p ER
ISA
403(
b) In
vest
men
t Rev
iew
| Pe
riod
Endi
ng 0
9/30
/201
9
Inve
stm
ent N
ame
Curr
ent
Stat
us#
of P
artic
ipan
tsAs
sets
% o
f Pla
nQ
2/19
Q1/
19Q
4/18
Q3/
18Q
2/18
Q1/
18Q
4/17
Targ
et-D
ate
2050
Blac
kRoc
k Li
fePa
th®
Inde
x 20
50 K
- L
IPKX
9688
$262
,830
.39
4.98
%93
9592
9493
8391
Targ
et-D
ate
2055
Blac
kRoc
k Li
fePa
th®
Inde
x 20
55 K
- L
IVKX
9552
$48,
448.
430.
92%
9393
9294
9383
93
Targ
et-D
ate
2060
+
Blac
kRoc
k Li
fePa
th®
Inde
x 20
60 K
- L
IZKX
8644
$30,
274.
730.
57%
7682
7272
7268
72
Larg
e Va
lue
MFS
Val
ue R
6 -
MEI
KX93
26$1
30,2
25.9
62.
47%
9186
7875
7891
93
Larg
e Bl
end
iSha
res
S&P
500
Inde
x K
- W
FSPX
100
28$6
0,23
2.05
1.14
%10
010
010
010
010
010
010
0
Larg
e Gr
owth
TIAA
-CRE
F La
rge-
Cap
Gro
wth
Inst
- T
ILG
X85
51$2
27,1
12.0
24.
30%
9296
9096
9294
88
Mid
-Cap
Val
ue
Wel
ls F
argo
Spe
cial
Mid
Cap
Val
ue In
st -
WFM
IX96
6$1
,297
.97
0.02
%92
9179
7878
8790
Mid
-Cap
Ble
nd
Vang
uard
Mid
Cap
Inde
x Ad
mira
l - V
IMAX
100
10$2
2,30
3.71
0.42
%10
010
010
010
010
010
010
0
Mid
-Cap
Gro
wth
Mas
sMut
ual S
elec
t Mid
Cap
Gro
wth
I -
MEF
ZX95
47$1
69,8
40.1
03.
22%
9192
9589
9097
97
Smal
l Val
ue
DFA
US
Smal
l Cap
Val
ue I
- D
FSVX
6538
$28,
013.
480.
53%
6972
7477
7675
72
Smal
l Gro
wth
Janu
s H
ende
rson
Trit
on T
- JA
TTX
9630
$51,
134.
520.
97%
9291
9193
9190
90
Pag
e 31
|
87

INVE
STM
ENT
SCO
RECA
RD |
C URR
ENT
& H
ISTO
RICA
L SC
ORI
NG
For P
lan
Spon
sor U
se O
nly
Com
mun
ity A
ctio
n Pa
rtne
rshi
p ER
ISA
403(
b) In
vest
men
t Rev
iew
| Pe
riod
Endi
ng 0
9/30
/201
9
Inve
stm
ent N
ame
Curr
ent
Stat
us#
of P
artic
ipan
tsAs
sets
% o
f Pla
nQ
2/19
Q1/
19Q
4/18
Q3/
18Q
2/18
Q1/
18Q
4/17
Fore
ign
Larg
e Bl
end
Har
tfor
d In
tern
atio
nal O
ppor
tuni
ties
R6 -
IHO
VX74
6$8
41.6
30.
02%
8075
5872
8591
88
Div
ersifi
ed E
mer
ging
Mkt
s
Amer
ican
Fun
ds N
ew W
orld
R6
- RN
WG
X96
44$6
8,35
1.03
1.29
%96
9688
9598
9292
Real
Est
ate
Prin
cipa
l Rea
l Est
ate
Secu
ritie
s In
st -
PIR
EX96
5$1
1,51
2.36
0.22
%96
9593
9696
9694
Revi
ew :
Wat
ch :
Addi
tion
:
Den
otes
pot
entia
l add
ition
or r
epla
cem
ent o
ptio
n(s)
. Opt
ion(
s) a
re s
ubje
ct to
fina
l app
rova
l as
plat
form
s m
ay d
isco
ntin
ue o
ptio
n av
aila
bilit
y.Fo
r sou
rce
info
rmat
ion,
ple
ase
see
the
"Im
port
ant D
iscl
osur
es"
sect
ion
of th
is re
port
. Ple
ase
see
furt
her d
etai
ls o
n th
e sc
orin
g m
etho
dolo
gy in
the
"Inv
estm
ent S
corin
g M
etho
dolo
gy"
sect
ion
of th
is re
port
.
Pag
e 32
|
88

INVE
STM
ENT
SCO
RECA
RD |
C RIT
ERIA
DAT
A
For P
lan
Spon
sor U
se O
nly
Com
mun
ity A
ctio
n Pa
rtne
rshi
p ER
ISA
403(
b) In
vest
men
t Rev
iew
| Pe
riod
Endi
ng 0
9/30
/201
9
Inve
stm
ent N
ame
IPS
Scor
eRe
turn
1Yr
Retu
rn3Y
rRe
turn
5Yr
Shar
pe3Y
rSh
arpe
5Yr
Info
Ratio
3Yr
Info
Ratio
5Yr
Man
ager
Tenu
r eEx
pens
eRa
tioSt
yle
Cons
iste
ncy
(RBS
A)
Up/
Dow
nCa
ptur
e5Y
r
Allo
catio
n--3
0% to
50%
Equ
ityPu
tnam
Dyn
amic
Ass
et A
lloca
tion
Cnsr
v Y
-PA
CYX
764.
20%
(65)
4.90
%(6
2)4.
61%
(37)
0.74
(44)
0.80
(16)
-0.8
6(7
6)-0
.87
(61)
17.3
3(5
)0.
74%
(26)
3.31
(12)
0.91
(23)
DJ U
S M
oder
atel
y Co
nser
vativ
e TR
USD
6.19
%6.
22%
5.83
%0.
921.
00-
--
--
-
Mor
ning
star
Allo
catio
n--3
0% to
50%
Equ
ity4.
52%
5.15
%4.
18%
0.67
0.60
-0.5
0-0
.72
8.11
1.10
%5.
910.
81
Allo
catio
n--5
0% to
70%
Equ
ityPu
tnam
Dyn
amic
Ass
et A
lloca
tion
Bal Y
-PA
BYX
721.
32%
(82)
7.37
%(4
2)6.
24%
(32)
0.73
(53)
0.68
(40)
-0.4
5(5
4)-0
.55
(44)
17.3
3(1
2)0.
72%
(26)
5.81
(57)
0.92
(45)
DJ U
S M
oder
ate
TR U
SD4.
52%
8.17
%7.
23%
0.85
0.84
--
--
--
Mor
ning
star
Allo
catio
n--5
0% to
70%
Equ
ity3.
53%
7.13
%5.
60%
0.73
0.62
-0.3
7-0
.59
9.94
1.10
%6.
190.
90
Allo
catio
n--7
0% to
85%
Equ
ityPu
tnam
Dyn
amic
Ass
et A
lloca
tion
Gr Y
-PA
GYX
82-0
.99%
(82)
8.49
%(2
9)6.
82%
(22)
0.68
(47)
0.59
(40)
0.00
(29)
0.02
(22)
17.3
3(9
)0.
82%
(29)
7.33
(36)
0.97
(43)
DJ M
oder
atel
y Ag
gres
sive
TR
USD
2.06
%8.
49%
6.77
%0.
730.
63-
--
--
-
Mor
ning
star
Allo
catio
n--7
0% to
85%
Equ
ity1.
33%
7.55
%5.
67%
0.64
0.52
-0.3
1-0
.36
9.66
1.18
%9.
130.
94
Larg
e Va
lue
MFS
Val
ue R
6 -
MEI
KX93
7.52
%(1
1)10
.54%
(30)
9.25
%(1
5)0.
75(2
8)0.
72(1
9)0.
43(2
6)0.
61 (6)
17.6
6(1
4)0.
48%
(14)
10.6
7(3
7)1.
11(2
1)
Russ
ell 1
000
Valu
e TR
USD
4.00
%9.
43%
7.79
%0.
670.
61-
--
--
-
Mor
ning
star
Lar
ge V
alue
1.92
%9.
43%
7.30
%0.
660.
570.
02-0
.15
9.77
0.95
%14
.21
1.02
Larg
e Gr
owth
TIAA
-CRE
F La
rge-
Cap
Gro
wth
Inst
- T
ILG
X85
0.27
%(6
8)16
.35%
(27)
13.0
4%(2
2)1.
06(3
0)0.
89(2
6)-0
.18
(28)
-0.1
1(2
2)13
.50
(35)
0.41
%(7
)8.
92(3
0)0.
94(3
5)
Russ
ell 1
000
Gro
wth
TR
USD
3.71
%16
.89%
13.3
9%1.
130.
97-
--
--
-
Mor
ning
star
Lar
ge G
row
th1.
86%
14.6
0%11
.00%
0.96
0.78
-0.6
6-0
.65
10.8
61.
05%
13.3
80.
90
Pag
e 33
|
89

INVE
STM
ENT
SCO
RECA
RD |
C RIT
ERIA
DAT
A
For P
lan
Spon
sor U
se O
nly
Com
mun
ity A
ctio
n Pa
rtne
rshi
p ER
ISA
403(
b) In
vest
men
t Rev
iew
| Pe
riod
Endi
ng 0
9/30
/201
9
Inve
stm
ent N
ame
IPS
Scor
eRe
turn
1Yr
Retu
rn3Y
rRe
turn
5Yr
Shar
pe3Y
rSh
arpe
5Yr
Info
Ratio
3Yr
Info
Ratio
5Yr
Man
ager
Tenu
r eEx
pens
eRa
tioSt
yle
Cons
iste
ncy
(RBS
A)
Up/
Dow
nCa
ptur
e5Y
r
Mid
-Cap
Val
ueW
ells
Far
go S
peci
al M
id C
ap V
alue
Inst
-W
FMIX
968.
17%
(2)
9.18
%(1
5)8.
77%
(10)
0.63 (8)
0.68 (8)
0.45
(16)
0.39
(10)
10.6
6(4
0)0.
83%
(30)
12.7
5(3
1)1.
13 (9)
Russ
ell M
id C
ap V
alue
TR
USD
1.60
%7.
82%
7.55
%0.
510.
56-
--
--
-
Mor
ning
star
Mid
-Cap
Val
ue-2
.14%
7.04
%6.
26%
0.44
0.45
-0.1
2-0
.25
9.63
1.05
%15
.99
0.94
Mid
-Cap
Gro
wth
Mas
sMut
ual S
elec
t Mid
Cap
Gro
wth
I -
MEF
ZX95
6.66
%(2
4)14
.42%
(35)
12.6
9%(1
5)0.
97(2
3)0.
92(1
3)-0
.03
(36)
0.60 (9)
19.3
3(1
1)0.
71%
(13)
11.7
7(3
8)1.
13(1
6)
Russ
ell M
id C
ap G
row
th T
R U
SD5.
20%
14.5
0%11
.12%
0.91
0.77
--
--
--
Mor
ning
star
Mid
-Cap
Gro
wth
1.10
%13
.10%
9.89
%0.
810.
68-0
.40
-0.3
510
.80
1.15
%14
.88
0.97
Smal
l Val
ue
DFA
US
Smal
l Cap
Val
ue I
- D
FSVX
65-1
3.74
%(8
4)4.
24%
(67)
4.43
%(6
3)0.
23(6
9)0.
28(6
4)-0
.69
(77)
-0.8
6(8
7)7.
58(5
5)0.
52%
(8)
0.52
(11)
0.88
(67)
Russ
ell 2
000
Valu
e TR
USD
-8.2
4%6.
54%
7.17
%0.
360.
45-
--
--
-
Mor
ning
star
Sm
all V
alue
-9.3
8%4.
92%
5.03
%0.
270.
33-0
.33
-0.3
99.
701.
19%
9.27
0.93
Smal
l Gro
wth
Janu
s H
ende
rson
Trit
on T
- JA
TTX
96-2
.52%
(19)
13.7
8%(3
2)12
.43%
(13)
0.81
(21)
0.80 (8)
1.06
(16)
0.88 (7)
6.33
(66)
0.91
%(2
4)5.
91(1
7)1.
25(1
1)
Russ
ell 2
000
Gro
wth
TR
USD
-9.6
3%9.
79%
9.08
%0.
530.
54-
--
--
-
Mor
ning
star
Sm
all G
row
th-7
.52%
11.4
4%9.
55%
0.62
0.58
0.30
0.11
10.8
01.
21%
11.7
21.
07
Fore
ign
Larg
e Bl
end
Har
tfor
d In
tern
atio
nal O
ppor
tuni
ties
R6 -
IHO
VX74
-1.8
4%(4
8)4.
73%
(73)
3.40
%(2
8)0.
30(7
6)0.
25(2
8)-0
.47
(68)
0.03
(29)
12.7
5(1
6)0.
71%
(30)
8.63
(61)
1.02
(27)
MSC
I EAF
E N
R U
SD-1
.34%
6.48
%3.
27%
0.48
0.24
--
--
--
Mor
ning
star
For
eign
Lar
ge B
lend
-2.0
4%5.
55%
2.93
%0.
400.
22-0
.29
-0.1
07.
320.
97%
8.46
1.00
Pag
e 34
|
90
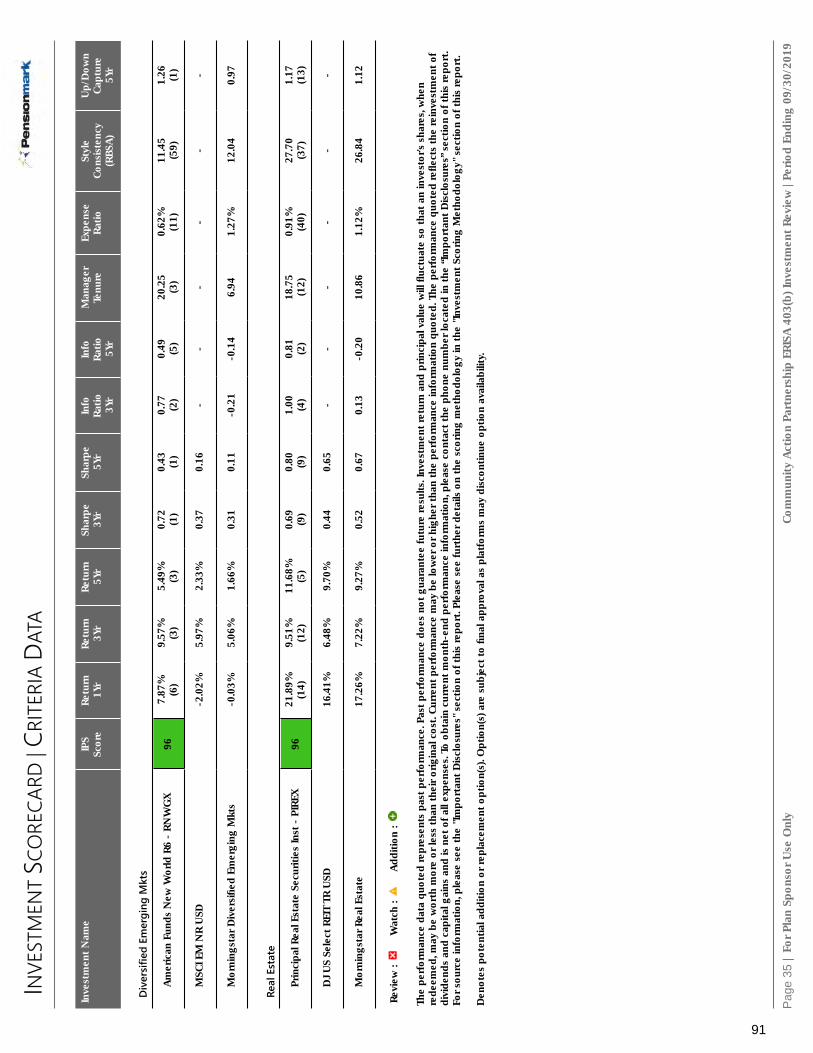
INVE
STM
ENT
SCO
RECA
RD |
C RIT
ERIA
DAT
A
For P
lan
Spon
sor U
se O
nly
Com
mun
ity A
ctio
n Pa
rtne
rshi
p ER
ISA
403(
b) In
vest
men
t Rev
iew
| Pe
riod
Endi
ng 0
9/30
/201
9
Inve
stm
ent N
ame
IPS
Scor
eRe
turn
1Yr
Retu
rn3Y
rRe
turn
5Yr
Shar
pe3Y
rSh
arpe
5Yr
Info
Ratio
3Yr
Info
Ratio
5Yr
Man
ager
Tenu
r eEx
pens
eRa
tioSt
yle
Cons
iste
ncy
(RBS
A)
Up/
Dow
nCa
ptur
e5Y
r
Div
ersifi
ed E
mer
ging
Mkt
s
Amer
ican
Fun
ds N
ew W
orld
R6
- RN
WG
X96
7.87
%(6
)9.
57%
(3)
5.49
%(3
)0.
72 (1)
0.43 (1)
0.77 (2)
0.49 (5)
20.2
5(3
)0.
62%
(11)
11.4
5(5
9)1.
26 (1)
MSC
I EM
NR
USD
-2.0
2%5.
97%
2.33
%0.
370.
16-
--
--
-
Mor
ning
star
Div
ersi
fied
Emer
ging
Mkt
s-0
.03%
5.06
%1.
66%
0.31
0.11
-0.2
1-0
.14
6.94
1.27
%12
.04
0.97
Real
Est
ate
Prin
cipa
l Rea
l Est
ate
Secu
ritie
s In
st -
PIR
EX96
21.8
9%(1
4)9.
51%
(12)
11.6
8%(5
)0.
69 (9)
0.80 (9)
1.00 (4)
0.81 (2)
18.7
5(1
2)0.
91%
(40)
27.7
0(3
7)1.
17(1
3)
DJ U
S Se
lect
REI
T TR
USD
16.4
1%6.
48%
9.70
%0.
440.
65-
--
--
-
Mor
ning
star
Rea
l Est
ate
17.2
6%7.
22%
9.27
%0.
520.
670.
13-0
.20
10.8
61.
12%
26.8
41.
12
Revi
ew :
Wat
ch :
Addi
tion
:
The
perf
orm
ance
dat
a qu
oted
repr
esen
ts p
ast p
erfo
rman
ce. P
ast p
erfo
rman
ce d
oes
not g
uara
ntee
futu
re re
sults
. Inv
estm
ent r
etur
n an
d pr
inci
pal v
alue
will
fluc
tuat
e so
that
an
inve
stor
's sh
ares
, whe
nre
deem
ed, m
ay b
e w
orth
mor
e or
less
than
thei
r orig
inal
cos
t. Cu
rren
t per
form
ance
may
be
low
er o
r hig
her t
han
the
perf
orm
ance
info
rmat
ion
quot
ed. T
he p
erfo
rman
ce q
uote
d re
flect
s th
e re
inve
stm
ent o
fdi
vide
nds
and
capi
tal g
ains
and
is n
et o
f all
expe
nses
. To
obta
in c
urre
nt m
onth
-end
per
form
ance
info
rmat
ion,
ple
ase
cont
act t
he p
hone
num
ber l
ocat
ed in
the
“Impo
rtan
t Dis
clos
ures
” sec
tion
of th
is re
port
.Fo
r sou
rce
info
rmat
ion,
ple
ase
see
the
"Im
port
ant D
iscl
osur
es"
sect
ion
of th
is re
port
. Ple
ase
see
furt
her d
etai
ls o
n th
e sc
orin
g m
etho
dolo
gy in
the
"Inv
estm
ent S
corin
g M
etho
dolo
gy"
sect
ion
of th
is re
port
.
Den
otes
pot
entia
l add
ition
or r
epla
cem
ent o
ptio
n(s)
. Opt
ion(
s) a
re s
ubje
ct to
fina
l app
rova
l as
plat
form
s m
ay d
isco
ntin
ue o
ptio
n av
aila
bilit
y.
Pag
e 35
|
91

INVE
STM
ENT
SCO
RECA
RD |
C RIT
ERIA
DAT
A
For P
lan
Spon
sor U
se O
nly
Com
mun
ity A
ctio
n Pa
rtne
rshi
p ER
ISA
403(
b) In
vest
men
t Rev
iew
| Pe
riod
Endi
ng 0
9/30
/201
9
Inde
x Fu
nds
Inve
stm
ent N
ame
IPS
Scor
eTr
acki
ngEr
r or
1Yr
Trac
king
Err o
r3Y
r
Trac
king
Err o
r5Y
r
Expe
nse
Ratio
AUM
Expe
nse
adj.
1Yr
Out
perf .
Inde
x
Expe
nse
adj.
3Yr
Out
perf .
Inde
x
Expe
nse
adj.
5Yr
Out
perf .
Inde
x
Inte
rmed
iate
Cor
e Bo
ndVa
ngua
rd T
otal
Bon
d M
arke
t Ind
ex A
dm -
VBTL
X78
0.21
%(8
)0.
27%
(14)
0.26
%(1
3)0.
05%
(6)
$241
,308
,555
,975
10.4
8%(1
4)2.
95%
(29)
3.40
%(1
9)
BBgB
arc
US
Agg
Floa
t Adj
TR
USD
--
--
-10
.44%
2.96
%3.
40%
Mor
ning
star
Inte
rmed
iate
Cor
e Bo
nd0.
90%
0.74
%0.
78%
0.65
%-
--
-
Larg
e Bl
end
iSha
res
S&P
500
Inde
x K
- W
FSPX
100
0.04
%(3
)0.
03%
(2)
0.03
%(2
)0.
03%
(2)
$20,
097,
601,
400
4.31
%(3
2)13
.40%
(17)
10.8
4%(1
2)
S&P
500
TR U
SD-
--
--
4.25
%13
.39%
10.8
4%
Mor
ning
star
Lar
ge B
lend
3.36
%2.
88%
2.92
%0.
89%
--
--
Mid
-Cap
Ble
nd
Vang
uard
Mid
Cap
Inde
x Ad
mira
l - V
IMAX
100
0.02
%(2
)0.
02%
(2)
0.02
%(2
)0.
05%
(3)
$105
,404
,435
,536
3.70
%(1
9)10
.72%
(19)
9.25
%(1
5)
CRSP
US
Mid
Cap
TR
USD
--
--
-3.
70%
10.7
0%9.
24%
Mor
ning
star
Mid
-Cap
Ble
nd4.
76%
4.68
%4.
71%
1.00
%-
--
-
Revi
ew :
Wat
ch :
Addi
tion
:
The
perf
orm
ance
dat
a qu
oted
repr
esen
ts p
ast p
erfo
rman
ce. P
ast p
erfo
rman
ce d
oes
not g
uara
ntee
futu
re re
sults
. Inv
estm
ent r
etur
n an
d pr
inci
pal v
alue
will
fluc
tuat
e so
that
an
inve
stor
's sh
ares
, whe
nre
deem
ed, m
ay b
e w
orth
mor
e or
less
than
thei
r orig
inal
cos
t. Cu
rren
t per
form
ance
may
be
low
er o
r hig
her t
han
the
perf
orm
ance
info
rmat
ion
quot
ed. T
he p
erfo
rman
ce q
uote
d re
flect
s th
e re
inve
stm
ent o
fdi
vide
nds
and
capi
tal g
ains
and
is n
et o
f all
expe
nses
. To
obta
in c
urre
nt m
onth
-end
per
form
ance
info
rmat
ion,
ple
ase
cont
act t
he p
hone
num
ber l
ocat
ed in
the
“Impo
rtan
t Dis
clos
ures
” sec
tion
of th
is re
port
.Fo
r sou
rce
info
rmat
ion,
ple
ase
see
the
"Im
port
ant D
iscl
osur
es"
sect
ion
of th
is re
port
. Ple
ase
see
furt
her d
etai
ls o
n th
e sc
orin
g m
etho
dolo
gy in
the
"Inv
estm
ent S
corin
g M
etho
dolo
gy"
sect
ion
of th
is re
port
.
Den
otes
pot
entia
l add
ition
or r
epla
cem
ent o
ptio
n(s)
. Opt
ion(
s) a
re s
ubje
ct to
fina
l app
rova
l as
plat
form
s m
ay d
isco
ntin
ue o
ptio
n av
aila
bilit
y.
Pag
e 36
|
92
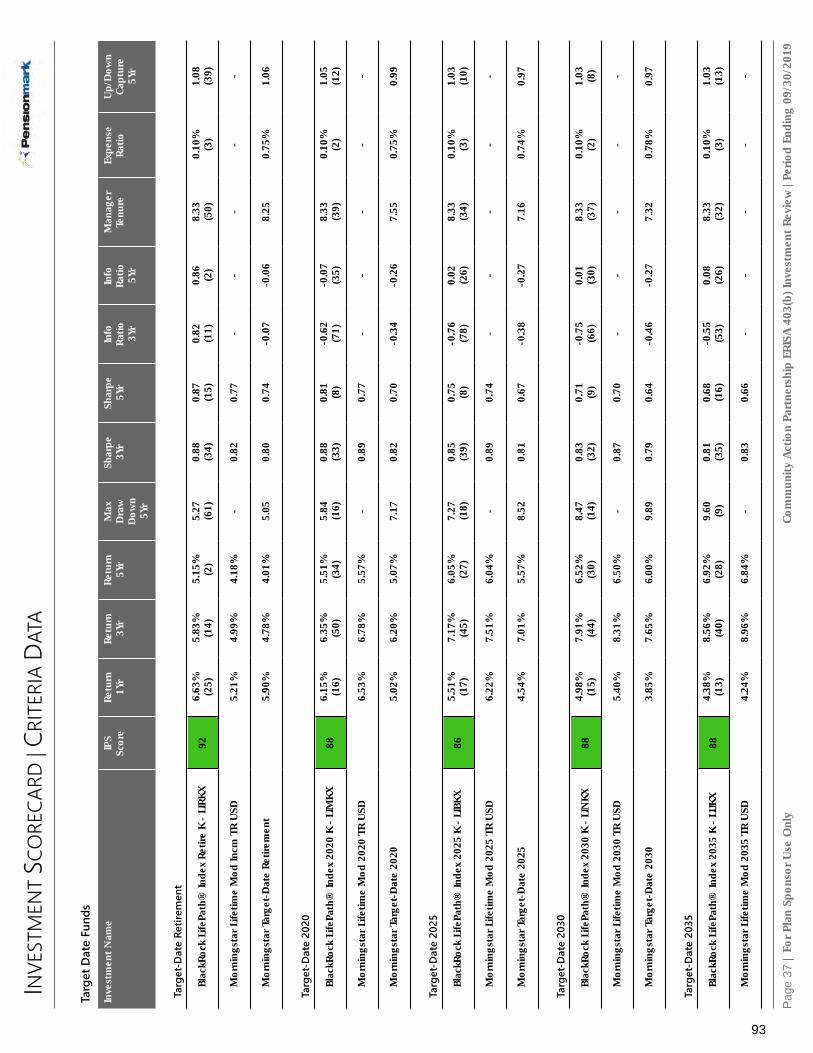
INVE
STM
ENT
SCO
RECA
RD |
C RIT
ERIA
DAT
A
For P
lan
Spon
sor U
se O
nly
Com
mun
ity A
ctio
n Pa
rtne
rshi
p ER
ISA
403(
b) In
vest
men
t Rev
iew
| Pe
riod
Endi
ng 0
9/30
/201
9
Targ
et D
ate
Fund
s
Inve
stm
ent N
ame
IPS
Scor
eRe
turn
1Yr
Retu
rn3Y
rRe
turn
5Yr
Max
Dra
wD
own
5Yr
Shar
pe3Y
rSh
arpe
5Yr
Info
Ratio
3Yr
Info
Ratio
5Yr
Man
ager
T enu
reEx
pens
eRa
tioU
p/D
own
Capt
ure
5Yr
Targ
et-D
ate
Retir
emen
t
Blac
kRoc
k Li
fePa
th®
Inde
x Re
tire
K -
LIRK
X92
6.63
%(2
5)5.
83%
(14)
5.15
%(2
)5.
27(6
1)0.
88(3
4)0.
87(1
5)0.
82(1
1)0.
86 (2)
8.33
(50)
0.10
%(3
)1.
08(3
9)
Mor
ning
star
Life
time
Mod
Incm
TR
USD
5.21
%4.
99%
4.18
%-
0.82
0.77
--
--
-
Mor
ning
star
Tar
get-
Dat
e Re
tirem
ent
5.90
%4.
78%
4.01
%5.
050.
800.
74-0
.07
-0.0
68.
250.
75%
1.06
Targ
et-D
ate
2020
Blac
kRoc
k Li
fePa
th®
Inde
x 20
20 K
- L
IMKX
886.
15%
(16)
6.35
%(5
0)5.
51%
(34)
5.84
(16)
0.88
(33)
0.81 (8)
-0.6
2(7
1)-0
.07
(35)
8.33
(39)
0.10
%(2
)1.
05(1
2)
Mor
ning
star
Life
time
Mod
202
0 TR
USD
6.53
%6.
78%
5.57
%-
0.89
0.77
--
--
-
Mor
ning
star
Tar
get-
Dat
e 20
205.
02%
6.20
%5.
07%
7.17
0.82
0.70
-0.3
4-0
.26
7.55
0.75
%0.
99
Targ
et-D
ate
2025
Blac
kRoc
k Li
fePa
th®
Inde
x 20
25 K
- L
IBKX
865.
51%
(17)
7.17
%(4
5)6.
05%
(27)
7.27
(18)
0.85
(39)
0.75 (8)
-0.7
6(7
8)0.
02(2
6)8.
33(3
4)0.
10%
(3)
1.03
(10)
Mor
ning
star
Life
time
Mod
202
5 TR
USD
6.22
%7.
51%
6.04
%-
0.89
0.74
--
--
-
Mor
ning
star
Tar
get-
Dat
e 20
254.
54%
7.01
%5.
57%
8.52
0.81
0.67
-0.3
8-0
.27
7.16
0.74
%0.
97
Targ
et-D
ate
2030
Blac
kRoc
k Li
fePa
th®
Inde
x 20
30 K
- L
INKX
884.
98%
(15)
7.91
%(4
4)6.
52%
(30)
8.47
(14)
0.83
(32)
0.71 (9)
-0.7
5(6
6)0.
01(3
0)8.
33(3
7)0.
10%
(2)
1.03 (8)
Mor
ning
star
Life
time
Mod
203
0 TR
USD
5.40
%8.
31%
6.50
%-
0.87
0.70
--
--
-
Mor
ning
star
Tar
get-
Dat
e 20
303.
85%
7.65
%6.
00%
9.89
0.79
0.64
-0.4
6-0
.27
7.32
0.78
%0.
97
Targ
et-D
ate
2035
Blac
kRoc
k Li
fePa
th®
Inde
x 20
35 K
- L
IJKX
884.
38%
(13)
8.56
%(4
0)6.
92%
(28)
9.60 (9)
0.81
(35)
0.68
(16)
-0.5
5(5
3)0.
08(2
6)8.
33(3
2)0.
10%
(3)
1.03
(13)
Mor
ning
star
Life
time
Mod
203
5 TR
USD
4.24
%8.
96%
6.84
%-
0.83
0.66
--
--
-
Pag
e 37
|
93

INVE
STM
ENT
SCO
RECA
RD |
C RIT
ERIA
DAT
A
For P
lan
Spon
sor U
se O
nly
Com
mun
ity A
ctio
n Pa
rtne
rshi
p ER
ISA
403(
b) In
vest
men
t Rev
iew
| Pe
riod
Endi
ng 0
9/30
/201
9
Inve
stm
ent N
ame
IPS
Scor
eRe
turn
1Yr
Retu
rn3Y
rRe
turn
5Yr
Max
Dra
wD
own
5Yr
Shar
pe3Y
rSh
arpe
5Yr
Info
Ratio
3Yr
Info
Ratio
5Yr
Man
ager
Tenu
r eEx
pens
eRa
tioU
p/D
own
Capt
ure
5Yr
Mor
ning
star
Tar
get-
Dat
e 20
353.
09%
8.32
%6.
37%
11.1
70.
770.
61-0
.50
-0.2
77.
120.
77%
0.98
Targ
et-D
ate
2040
Blac
kRoc
k Li
fePa
th®
Inde
x 20
40 K
- L
IKKX
933.
81%
(16)
9.10
%(3
2)7.
28%
(12)
10.6
8(1
1)0.
79(3
2)0.
66(2
1)-0
.23
(34)
0.23
(14)
8.33
(38)
0.10
%(3
)1.
04(1
7)
Mor
ning
star
Life
time
Mod
204
0 TR
USD
3.23
%9.
30%
6.98
%-
0.80
0.62
--
--
-
Mor
ning
star
Tar
get-
Dat
e 20
402.
50%
8.58
%6.
56%
12.0
00.
740.
60-0
.49
-0.2
17.
500.
80%
1.00
Targ
et-D
ate
2045
Blac
kRoc
k Li
fePa
th®
Inde
x 20
45 K
- L
IHKX
963.
41%
(14)
9.46
%(2
4)7.
52%
(7)
11.4
1(1
2)0.
77(3
1)0.
65(2
1)0.
10(2
3)0.
40 (9)
8.33
(32)
0.10
%(3
)1.
05(1
3)
Mor
ning
star
Life
time
Mod
204
5 TR
USD
2.62
%9.
37%
6.97
%-
0.77
0.60
--
--
-
Mor
ning
star
Tar
get-
Dat
e 20
452.
10%
8.91
%6.
72%
12.7
30.
740.
59-0
.37
-0.1
37.
070.
77%
1.01
Targ
et-D
ate
2050
Blac
kRoc
k Li
fePa
th®
Inde
x 20
50 K
- L
IPKX
963.
23%
(15)
9.54
%(2
3)7.
60%
(7)
11.7
7(1
6)0.
76(3
4)0.
64(2
1)0.
22(1
5)0.
50 (9)
8.33
(38)
0.10
%(3
)1.
06(1
9)
Mor
ning
star
Life
time
Mod
205
0 TR
USD
2.39
%9.
32%
6.89
%-
0.76
0.59
--
--
-
Mor
ning
star
Tar
get-
Dat
e 20
501.
99%
8.88
%6.
76%
12.8
90.
720.
59-0
.29
-0.0
47.
150.
80%
1.02
Targ
et-D
ate
2055
Blac
kRoc
k Li
fePa
th®
Inde
x 20
55 K
- L
IVKX
953.
18%
(15)
9.55
%(2
6)7.
64%
(9)
11.7
8(8
)0.
76(3
8)0.
64(1
8)0.
30(1
8)0.
56 (7)
8.33
(23)
0.09
%(2
)1.
07(1
4)
Mor
ning
star
Life
time
Mod
205
5 TR
USD
2.29
%9.
26%
6.81
%-
0.75
0.58
--
--
-
Mor
ning
star
Tar
get-
Dat
e 20
551.
84%
9.04
%6.
84%
13.0
40.
730.
59-0
.17
0.03
5.90
0.78
%1.
02
Targ
et-D
ate
2060
+
Blac
kRoc
k Li
fePa
th®
Inde
x 20
60 K
- L
IZKX
863.
30%
(12)
9.58
%(2
9)-
-0.
76(4
3)-
0.41
(18)
-3.
58(3
9)0.
10%
(4)
-
Mor
ning
star
Life
time
Mod
206
0 TR
USD
2.22
%9.
18%
6.71
%-
0.74
0.57
--
--
-
Pag
e 38
|
94

INVE
STM
ENT
SCO
RECA
RD |
C RIT
ERIA
DAT
A
For P
lan
Spon
sor U
se O
nly
Com
mun
ity A
ctio
n Pa
rtne
rshi
p ER
ISA
403(
b) In
vest
men
t Rev
iew
| Pe
riod
Endi
ng 0
9/30
/201
9
Inve
stm
ent N
ame
IPS
Scor
eRe
turn
1Yr
Retu
rn3Y
rRe
turn
5Yr
Max
Dra
wD
own
5Yr
Shar
pe3Y
rSh
arpe
5Yr
Info
Ratio
3Yr
Info
Ratio
5Yr
Man
ager
Tenu
r eEx
pens
eRa
tioU
p/D
own
Capt
ure
5Yr
Mor
ning
star
Tar
get-
Dat
e 20
60+
1.89
%9.
20%
7.20
%12
.89
0.74
0.62
0.01
0.32
2.96
0.78
%1.
06
Revi
ew :
Wat
ch :
Addi
tion
:
The
perf
orm
ance
dat
a qu
oted
repr
esen
ts p
ast p
erfo
rman
ce. P
ast p
erfo
rman
ce d
oes
not g
uara
ntee
futu
re re
sults
. Inv
estm
ent r
etur
n an
d pr
inci
pal v
alue
will
fluc
tuat
e so
that
an
inve
stor
's sh
ares
, whe
nre
deem
ed, m
ay b
e w
orth
mor
e or
less
than
thei
r orig
inal
cos
t. Cu
rren
t per
form
ance
may
be
low
er o
r hig
her t
han
the
perf
orm
ance
info
rmat
ion
quot
ed. T
he p
erfo
rman
ce q
uote
d re
flect
s th
e re
inve
stm
ent o
fdi
vide
nds
and
capi
tal g
ains
and
is n
et o
f all
expe
nses
. To
obta
in c
urre
nt m
onth
-end
per
form
ance
info
rmat
ion,
ple
ase
cont
act t
he p
hone
num
ber l
ocat
ed in
the
“Impo
rtan
t Dis
clos
ures
” sec
tion
of th
is re
port
.Fo
r sou
rce
info
rmat
ion,
ple
ase
see
the
"Im
port
ant D
iscl
osur
es"
sect
ion
of th
is re
port
. Ple
ase
see
furt
her d
etai
ls o
n th
e sc
orin
g m
etho
dolo
gy in
the
"Inv
estm
ent S
corin
g M
etho
dolo
gy"
sect
ion
of th
is re
port
.
Den
otes
pot
entia
l add
ition
or r
epla
cem
ent o
ptio
n(s)
. Opt
ion(
s) a
re s
ubje
ct to
fina
l app
rova
l as
plat
form
s m
ay d
isco
ntin
ue o
ptio
n av
aila
bilit
y.
Pag
e 39
|
95

INVE
STM
ENT
SCO
RECA
RD |
C RIT
ERIA
SCO
RIN
G
For P
lan
Spon
sor U
se O
nly
Com
mun
ity A
ctio
n Pa
rtne
rshi
p ER
ISA
403(
b) In
vest
men
t Rev
iew
| Pe
riod
Endi
ng 0
9/30
/201
9
Inve
stm
ent N
ame
IPS
Scor
eRe
turn
1Yr
Retu
rn3Y
rRe
turn
5Yr
Shar
pe3Y
rSh
arpe
5Yr
Info
Ratio
3Yr
Info
Ratio
5Yr
Man
ager
Tenu
r eEx
pens
eRa
tioSt
yle
Cons
iste
ncy
(RBS
A)
Up/
Dow
nCa
ptur
e5Y
r
Allo
catio
n--3
0% to
50%
Equ
ityPu
tnam
Dyn
amic
Ass
et A
lloca
tion
Cnsr
v Y
-PA
CYX
763.
64.
88
6.4
103.
26
108
106
Allo
catio
n--5
0% to
70%
Equ
ityPu
tnam
Dyn
amic
Ass
et A
lloca
tion
Bal Y
-PA
BYX
722.
46.
48
4.8
84.
88
108
66
Allo
catio
n--7
0% to
85%
Equ
ityPu
tnam
Dyn
amic
Ass
et A
lloca
tion
Gr Y
-PA
GYX
822.
46.
410
6.4
86.
410
108
86
Larg
e Va
lue
MFS
Val
ue R
6 -
MEI
KX93
66.
410
6.4
106.
410
1010
810
Larg
e Gr
owth
TIAA
-CRE
F La
rge-
Cap
Gro
wth
Inst
- T
ILG
X85
3.6
6.4
106.
48
6.4
1010
108
6
Mid
-Cap
Val
ueW
ells
Far
go S
peci
al M
id C
ap V
alue
Inst
-W
FMIX
966
810
810
810
108
810
Mid
-Cap
Gro
wth
Mas
sMut
ual S
elec
t Mid
Cap
Gro
wth
I -
MEF
ZX95
66.
410
810
6.4
1010
108
10
Smal
l Val
ue
DFA
US
Smal
l Cap
Val
ue I
- D
FSVX
652.
44.
86
4.8
63.
24
1010
104
Smal
l Gro
wth
Janu
s H
ende
rson
Trit
on T
- JA
TTX
966
6.4
108
108
108
1010
10
Fore
ign
Larg
e Bl
end
Har
tfor
d In
tern
atio
nal O
ppor
tuni
ties
R6 -
IHO
VX74
4.8
4.8
83.
28
4.8
810
86
8
Pag
e 40
|
96

INVE
STM
ENT
SCO
RECA
RD |
C RIT
ERIA
SCO
RIN
G
For P
lan
Spon
sor U
se O
nly
Com
mun
ity A
ctio
n Pa
rtne
rshi
p ER
ISA
403(
b) In
vest
men
t Rev
iew
| Pe
riod
Endi
ng 0
9/30
/201
9
Inve
stm
ent N
ame
IPS
Scor
eRe
turn
1Yr
Retu
rn3Y
rRe
turn
5Yr
Shar
pe3Y
rSh
arpe
5Yr
Info
Ratio
3Yr
Info
Ratio
5Yr
Man
ager
Tenu
r eEx
pens
eRa
tioSt
yle
Cons
iste
ncy
(RBS
A)
Up/
Dow
nCa
ptur
e5Y
r
Div
ersifi
ed E
mer
ging
Mkt
s
Amer
ican
Fun
ds N
ew W
orld
R6
- RN
WG
X96
68
108
108
1010
106
10
Real
Est
ate
Prin
cipa
l Rea
l Est
ate
Secu
ritie
s In
st -
PIR
EX96
68
108
108
1010
88
10
Revi
ew :
Wat
ch :
Addi
tion
:
The
perf
orm
ance
dat
a qu
oted
repr
esen
ts p
ast p
erfo
rman
ce. P
ast p
erfo
rman
ce d
oes
not g
uara
ntee
futu
re re
sults
. Inv
estm
ent r
etur
n an
d pr
inci
pal v
alue
will
fluc
tuat
e so
that
an
inve
stor
's sh
ares
, whe
nre
deem
ed, m
ay b
e w
orth
mor
e or
less
than
thei
r orig
inal
cos
t. Cu
rren
t per
form
ance
may
be
low
er o
r hig
her t
han
the
perf
orm
ance
info
rmat
ion
quot
ed. T
he p
erfo
rman
ce q
uote
d re
flect
s th
e re
inve
stm
ent o
fdi
vide
nds
and
capi
tal g
ains
and
is n
et o
f all
expe
nses
. To
obta
in c
urre
nt m
onth
-end
per
form
ance
info
rmat
ion,
ple
ase
cont
act t
he p
hone
num
ber l
ocat
ed in
the
“Impo
rtan
t Dis
clos
ures
” sec
tion
of th
is re
port
.Fo
r sou
rce
info
rmat
ion,
ple
ase
see
the
"Im
port
ant D
iscl
osur
es"
sect
ion
of th
is re
port
. Ple
ase
see
furt
her d
etai
ls o
n th
e sc
orin
g m
etho
dolo
gy in
the
"Inv
estm
ent S
corin
g M
etho
dolo
gy"
sect
ion
of th
is re
port
.
Den
otes
pot
entia
l add
ition
or r
epla
cem
ent o
ptio
n(s)
. Opt
ion(
s) a
re s
ubje
ct to
fina
l app
rova
l as
plat
form
s m
ay d
isco
ntin
ue o
ptio
n av
aila
bilit
y.
Pag
e 41
|
97

INVE
STM
ENT
SCO
RECA
RD |
C RIT
ERIA
SCO
RIN
G
For P
lan
Spon
sor U
se O
nly
Com
mun
ity A
ctio
n Pa
rtne
rshi
p ER
ISA
403(
b) In
vest
men
t Rev
iew
| Pe
riod
Endi
ng 0
9/30
/201
9
Inde
x Fu
nds
Inve
stm
ent N
ame
IPS
Scor
eTr
acki
ngEr
r or
1Yr
Trac
king
Err o
r3Y
r
Trac
king
Err o
r5Y
r
Expe
nse
Ratio
AUM
Expe
nse
adj.
1Yr
Out
perf .
Inde
x
Expe
nse
adj.
3Yr
Out
perf .
Inde
x
Expe
nse
adj.
5Yr
Out
perf .
Inde
x
Inte
rmed
iate
Cor
e Bo
nd
Vang
uard
Tot
al B
ond
Mar
ket I
ndex
Adm
- V
BTLX
788
00
3010
810
12
Larg
e Bl
end
iSha
res
S&P
500
Inde
x K
- W
FSPX
100
810
1230
108
1012
Mid
-Cap
Ble
nd
Vang
uard
Mid
Cap
Inde
x Ad
mira
l - V
IMAX
100
810
1230
108
1012
Revi
ew :
Wat
ch :
Addi
tion
:
The
perf
orm
ance
dat
a qu
oted
repr
esen
ts p
ast p
erfo
rman
ce. P
ast p
erfo
rman
ce d
oes
not g
uara
ntee
futu
re re
sults
. Inv
estm
ent r
etur
n an
d pr
inci
pal v
alue
will
fluc
tuat
e so
that
an
inve
stor
's sh
ares
, whe
nre
deem
ed, m
ay b
e w
orth
mor
e or
less
than
thei
r orig
inal
cos
t. Cu
rren
t per
form
ance
may
be
low
er o
r hig
her t
han
the
perf
orm
ance
info
rmat
ion
quot
ed. T
he p
erfo
rman
ce q
uote
d re
flect
s th
e re
inve
stm
ent o
fdi
vide
nds
and
capi
tal g
ains
and
is n
et o
f all
expe
nses
. To
obta
in c
urre
nt m
onth
-end
per
form
ance
info
rmat
ion,
ple
ase
cont
act t
he p
hone
num
ber l
ocat
ed in
the
“Impo
rtan
t Dis
clos
ures
” sec
tion
of th
is re
port
.Fo
r sou
rce
info
rmat
ion,
ple
ase
see
the
"Im
port
ant D
iscl
osur
es"
sect
ion
of th
is re
port
. Ple
ase
see
furt
her d
etai
ls o
n th
e sc
orin
g m
etho
dolo
gy in
the
"Inv
estm
ent S
corin
g M
etho
dolo
gy"
sect
ion
of th
is re
port
.
Den
otes
pot
entia
l add
ition
or r
epla
cem
ent o
ptio
n(s)
. Opt
ion(
s) a
re s
ubje
ct to
fina
l app
rova
l as
plat
form
s m
ay d
isco
ntin
ue o
ptio
n av
aila
bilit
y.
Pag
e 42
|
98

INVE
STM
ENT
SCO
RECA
RD |
C RIT
ERIA
SCO
RIN
G
For P
lan
Spon
sor U
se O
nly
Com
mun
ity A
ctio
n Pa
rtne
rshi
p ER
ISA
403(
b) In
vest
men
t Rev
iew
| Pe
riod
Endi
ng 0
9/30
/201
9
Targ
et D
ate
Fund
s
Inve
stm
ent N
ame
IPS
Scor
eRe
turn
1Yr
Retu
rn3Y
rRe
turn
5Yr
Max
Dra
wD
own
5Yr
Shar
pe3Y
rSh
arpe
5Yr
Info
Ratio
3Yr
Info
Ratio
5Yr
Man
ager
T enu
reEx
pens
eRa
tioU
p/D
own
Capt
ure
5Yr
Targ
et-D
ate
Retir
emen
t
Blac
kRoc
k Li
fePa
th®
Inde
x Re
tire
K -
LIRK
X92
68
106
6.4
108
1010
108
Targ
et-D
ate
2020
Blac
kRoc
k Li
fePa
th®
Inde
x 20
20 K
- L
IMKX
886
6.4
810
6.4
104.
88
1010
8
Targ
et-D
ate
2025
Blac
kRoc
k Li
fePa
th®
Inde
x 20
25 K
- L
IBKX
866
6.4
810
6.4
103.
28
1010
8
Targ
et-D
ate
2030
Blac
kRoc
k Li
fePa
th®
Inde
x 20
30 K
- L
INKX
886
6.4
810
6.4
104.
88
1010
8
Targ
et-D
ate
2035
Blac
kRoc
k Li
fePa
th®
Inde
x 20
35 K
- L
IJKX
886
6.4
810
6.4
104.
88
1010
8
Targ
et-D
ate
2040
Blac
kRoc
k Li
fePa
th®
Inde
x 20
40 K
- L
IKKX
936
6.4
1010
6.4
106.
410
1010
8
Targ
et-D
ate
2045
Blac
kRoc
k Li
fePa
th®
Inde
x 20
45 K
- L
IHKX
966
810
106.
410
810
1010
8
Targ
et-D
ate
2050
Blac
kRoc
k Li
fePa
th®
Inde
x 20
50 K
- L
IPKX
966
810
106.
410
810
1010
8
Targ
et-D
ate
2055
Blac
kRoc
k Li
fePa
th®
Inde
x 20
55 K
- L
IVKX
956
6.4
1010
6.4
108
1010
108
Pag
e 43
|
99

INVE
STM
ENT
SCO
RECA
RD |
C RIT
ERIA
SCO
RIN
G
For P
lan
Spon
sor U
se O
nly
Com
mun
ity A
ctio
n Pa
rtne
rshi
p ER
ISA
403(
b) In
vest
men
t Rev
iew
| Pe
riod
Endi
ng 0
9/30
/201
9
Inve
stm
ent N
ame
IPS
Scor
eRe
turn
1Yr
Retu
rn3Y
rRe
turn
5Yr
Max
Dra
wD
own
5Yr
Shar
pe3Y
rSh
arpe
5Yr
Info
Ratio
3Yr
Info
Ratio
5Yr
Man
ager
Tenu
r eEx
pens
eRa
tioU
p/D
own
Capt
ure
5Yr
Targ
et-D
ate
2060
+
Blac
kRoc
k Li
fePa
th®
Inde
x 20
60 K
- L
IZKX
866
6.4
--
6.4
-8
-6
10-
Revi
ew :
Wat
ch :
Addi
tion
:
The
perf
orm
ance
dat
a qu
oted
repr
esen
ts p
ast p
erfo
rman
ce. P
ast p
erfo
rman
ce d
oes
not g
uara
ntee
futu
re re
sults
. Inv
estm
ent r
etur
n an
d pr
inci
pal v
alue
will
fluc
tuat
e so
that
an
inve
stor
's sh
ares
, whe
nre
deem
ed, m
ay b
e w
orth
mor
e or
less
than
thei
r orig
inal
cos
t. Cu
rren
t per
form
ance
may
be
low
er o
r hig
her t
han
the
perf
orm
ance
info
rmat
ion
quot
ed. T
he p
erfo
rman
ce q
uote
d re
flect
s th
e re
inve
stm
ent o
fdi
vide
nds
and
capi
tal g
ains
and
is n
et o
f all
expe
nses
. To
obta
in c
urre
nt m
onth
-end
per
form
ance
info
rmat
ion,
ple
ase
cont
act t
he p
hone
num
ber l
ocat
ed in
the
“Impo
rtan
t Dis
clos
ures
” sec
tion
of th
is re
port
.Fo
r sou
rce
info
rmat
ion,
ple
ase
see
the
"Im
port
ant D
iscl
osur
es"
sect
ion
of th
is re
port
. Ple
ase
see
furt
her d
etai
ls o
n th
e sc
orin
g m
etho
dolo
gy in
the
"Inv
estm
ent S
corin
g M
etho
dolo
gy"
sect
ion
of th
is re
port
.
Den
otes
pot
entia
l add
ition
or r
epla
cem
ent o
ptio
n(s)
. Opt
ion(
s) a
re s
ubje
ct to
fina
l app
rova
l as
plat
form
s m
ay d
isco
ntin
ue o
ptio
n av
aila
bilit
y.
Pag
e 44
|
100

INVE
STM
ENT
PERF
ORM
ANCE
VS
RISK
For P
lan
Spon
sor U
se O
nly
Com
mun
ity A
ctio
n Pa
rtne
rshi
p ER
ISA
403(
b) In
vest
men
t Rev
iew
| Pe
riod
Endi
ng 0
9/30
/201
9
3 Ye
ar
Prin
cipa
l Rea
l Est
ate
Secu
ritie
s In
stAm
eric
an F
unds
New
Wor
ld R
6H
artf
ord
Inte
rnat
iona
l Opp
ortu
nitie
s R6
Janu
s H
ende
rson
Trit
on T
DFA
US
Smal
l Cap
Val
ue I
Mas
sMut
ual S
elec
t Mid
Cap
Gro
wth
IVa
ngua
rd M
id C
ap In
dex
Adm
iral
Wel
ls F
argo
Spe
cial
Mid
Cap
Val
ue In
stTI
AA-C
REF
Larg
e-Ca
p G
row
th In
stiS
hare
s S&
P 50
0 In
dex
KM
FS V
alue
R6
Putn
am D
ynam
ic A
sset
Allo
catio
n G
r YPu
tnam
Dyn
amic
Ass
et A
lloca
tion
Bal Y
Putn
am D
ynam
ic A
sset
Allo
catio
n Cn
srv
YVa
ngua
rd T
otal
Bon
d M
arke
t Ind
ex A
dmPe
er G
roup
Ave
rage
Total Annualized Return %30 25 20 15 10 5 0 -5 -10
Tota
l Ann
ualiz
ed S
tdD
ev %
3025
2015
105
0
Peer
Gro
up A
vera
ge
For s
ourc
e in
form
atio
n, p
leas
e se
e th
e "I
mpo
rtan
t Dis
clos
ures
" se
ctio
n of
this
repo
rt.
Pag
e 45
|
101

INVE
STM
ENT
PERF
ORM
ANCE
VS
RISK
For P
lan
Spon
sor U
se O
nly
Com
mun
ity A
ctio
n Pa
rtne
rshi
p ER
ISA
403(
b) In
vest
men
t Rev
iew
| Pe
riod
Endi
ng 0
9/30
/201
9
5 Ye
ar
Prin
cipa
l Rea
l Est
ate
Secu
ritie
s In
stAm
eric
an F
unds
New
Wor
ld R
6H
artf
ord
Inte
rnat
iona
l Opp
ortu
nitie
s R6
Janu
s H
ende
rson
Trit
on T
DFA
US
Smal
l Cap
Val
ue I
Mas
sMut
ual S
elec
t Mid
Cap
Gro
wth
IVa
ngua
rd M
id C
ap In
dex
Adm
iral
Wel
ls F
argo
Spe
cial
Mid
Cap
Val
ue In
stTI
AA-C
REF
Larg
e-Ca
p G
row
th In
stiS
hare
s S&
P 50
0 In
dex
KM
FS V
alue
R6
Putn
am D
ynam
ic A
sset
Allo
catio
n G
r YPu
tnam
Dyn
amic
Ass
et A
lloca
tion
Bal Y
Putn
am D
ynam
ic A
sset
Allo
catio
n Cn
srv
YVa
ngua
rd T
otal
Bon
d M
arke
t Ind
ex A
dmPe
er G
roup
Ave
rage
Total Annualized Return %25 20 15 10 5 0 -5 -10
Tota
l Ann
ualiz
ed S
tdD
ev %
3025
2015
105
0
Peer
Gro
up A
vera
ge
For s
ourc
e in
form
atio
n, p
leas
e se
e th
e "I
mpo
rtan
t Dis
clos
ures
" se
ctio
n of
this
repo
rt.
Pag
e 46
|
102

INVE
STM
ENT
SCO
REC A
RD |
INVE
STM
ENT
PERF
ORM
ANCE
For P
lan
Spon
sor U
se O
nly
Com
mun
ity A
ctio
n Pa
rtne
rshi
p ER
ISA
403(
b) In
vest
men
t Rev
iew
| Pe
riod
Endi
ng 0
9/30
/201
9
Inve
stm
ent N
ame
Annu
aliz
ed R
etur
nsCa
lend
ar Y
ear R
etur
ns
Last
Qtr
YTD
1 Yea
r3
Year
5Yea
r10
Yea
rIT
DIn
cept
ion
Dat
e20
1820
1720
1620
1520
14
Stab
le V
alue
The
Stan
dard
Sta
ble
Asse
t A-
--
--
--
--
--
--
USTR
EAS
T-Bi
ll Sec
Mkt
3 M
on0.
58%
1.84%
2.35%
1.44%
0.90
%-
--
1.69%
0.71
%0.
25%
0.03
%0.
04%
Mor
ning
star U
S SA
Sta
ble
Valu
e0.
54%
1.57%
2.08%
1.77%
1.61%
1.84%
--
1.85%
1.55%
1.44%
1.38%
1.28%
Inte
rmed
iate
Cor
e Bo
nd
Vang
uard
Tot
al B
ond
Mar
ket I
ndex
Adm
2.43
%8.
68%
10.4
3%2.
90%
3.35
%3.
69%
5.96
%12
/11/
1986
(0.0
3%)
3.56
%2.
60%
0.40
%5.
89%
BBgB
arc U
S Ag
g Flo
at A
dj T
R US
D2.3
3%8.
72%
10.4
4%2.9
6%3.
40%
3.79
%-
-(0
.08%
)3.
63%
2.75%
0.44
%5.8
5%
Mor
ning
star I
nter
med
iate
Cor
e Bo
nd1.9
9%7.8
9%9.
35%
2.58%
2.95%
3.59
%-
-(0
.29%
)3.
16%
2.50%
0.35
%5.1
3%
Allo
catio
n--3
0% to
50%
Equ
ity
Putn
am D
ynam
ic A
sset
Allo
catio
n Cn
srv
Y1.
05%
10.0
3%4.
20%
4.90
%4.
61%
6.59
%6.
04%
02/0
7/19
94(4
.55%
)10
.04%
4.84
%0.
51%
8.55
%
DJ U
S M
oder
ately
Con
serv
ative
TR
USD
1.39%
12.0
4%6.
19%
6.22
%5.8
3%7.4
6%-
-(2
.26%
)9.
55%
6.96
%0.
24%
7.93%
Mor
ning
star A
lloca
tion-
-30%
to 5
0% E
quity
1.19%
11.16
%4.
52%
5.15%
4.18
%6.
16%
--
(5.0
1%)
10.0
1%6.
92%
(2.26
%)
4.77
%
Allo
catio
n--5
0% to
70%
Equ
ity
Putn
am D
ynam
ic A
sset
Allo
catio
n Ba
l Y0.
60%
12.9
9%1.
32%
7.37
%6.
24%
8.94
%7.
25%
02/0
7/19
94(6
.95%
)15
.44%
6.99
%0.
55%
9.70
%
DJ U
S M
oder
ate
TR U
SD1.1
0%14
.77%
4.52
%8.
17%
7.23%
9.35
%-
-(3
.92%
)13
.12%
9.26
%(0
.13%
)9.
08%
Mor
ning
star A
lloca
tion-
-50%
to 7
0% E
quity
0.92
%13
.42%
3.53
%7.1
3%5.6
0%7.8
0%-
-(5
.72%
)13
.65%
7.71%
(1.80
%)
6.46
%
Allo
catio
n--7
0% to
85%
Equ
ity
Putn
am D
ynam
ic A
sset
Allo
catio
n G
r Y0.
00%
14.2
5%(0
.99%
)8.
49%
6.82
%9.
60%
7.90
%02
/08/
1994
(9.4
1%)
20.0
8%8.
14%
(0.0
6%)
9.26
%
DJ M
oder
ately
Agg
ress
ive T
R US
D0.
08%
14.6
9%2.0
6%8.
49%
6.77
%8.
84%
--
(7.3
3%)
19.0
8%9.
31%
(1.89
%)
5.90%
Pag
e 47
|
103

INVE
STM
ENT
SCO
REC A
RD |
INVE
STM
ENT
PERF
ORM
ANCE
For P
lan
Spon
sor U
se O
nly
Com
mun
ity A
ctio
n Pa
rtne
rshi
p ER
ISA
403(
b) In
vest
men
t Rev
iew
| Pe
riod
Endi
ng 0
9/30
/201
9
Inve
stm
ent N
ame
Annu
aliz
ed R
etur
nsCa
lend
ar Y
ear R
etur
ns
Last
Qtr
YTD
1 Yea
r3
Year
5Yea
r10
Yea
rIT
DIn
cept
ion
Dat
e20
1820
1720
1620
1520
14
Mor
ning
star A
lloca
tion-
-70%
to 8
5% E
quity
0.53
%14
.33%
1.33%
7.55%
5.67%
8.26
%-
-(7
.82%
)16
.38%
8.29
%(2
.69%
)5.4
9%
Targ
et-D
ate
Retir
emen
t
Blac
kRoc
k Li
fePa
th®
Inde
x Re
tire
K1.
52%
12.0
2%6.
63%
5.83
%5.
15%
-5.
49%
05/3
1/20
11(3
.50%
)10
.75%
5.82
%(0
.31%
)5.
78%
Mor
ning
star L
ifetim
e M
od In
cm T
R US
D0.
87%
9.73
%5.2
1%4.
99%
4.18
%-
--
(2.20
%)
8.55
%5.9
8%(1.
30%
)4.
09%
Mor
ning
star T
arge
t-Dat
e Re
tirem
ent
1.31%
10.11
%5.9
0%4.
78%
4.01
%5.2
8%-
-(3
.13%
)8.
67%
5.16%
(1.11
%)
4.32
%
Targ
et-D
ate
2020
Blac
kRoc
k Li
fePa
th®
Inde
x 20
20 K
1.33
%12
.30%
6.15
%6.
35%
5.51
%-
6.01
%05
/31/
2011
(3.9
6%)
12.3
4%6.
32%
(0.4
2%)
6.15
%
Mor
ning
star L
ifetim
e M
od 2
020
TR U
SD1.4
1%13
.28%
6.53
%6.
78%
5.57%
--
-(4
.16%
)12
.79%
7.66%
(1.88
%)
5.87%
Mor
ning
star T
arge
t-Dat
e 20
201.0
4%11
.83%
5.02%
6.20
%5.0
7%6.
91%
--
(4.4
0%)
12.4
9%6.
37%
(1.12
%)
5.13%
Targ
et-D
ate
2025
Blac
kRoc
k Li
fePa
th®
Inde
x 20
25 K
1.15
%13
.43%
5.51
%7.
17%
6.05
%-
6.53
%05
/31/
2011
(4.7
8%)
14.4
3%6.
87%
(0.4
5%)
6.47
%
Mor
ning
star L
ifetim
e M
od 2
025
TR U
SD1.3
8%14
.23%
6.22
%7.5
1%6.
04%
--
-(4
.90%
)14
.54%
8.39
%(2
.06%
)6.
04%
Mor
ning
star T
arge
t-Dat
e 20
250.
93%
12.9
1%4.
54%
7.01%
5.57%
7.66%
--
(5.28
%)
14.6
3%6.
86%
(1.27
%)
5.32%
Targ
et-D
ate
2030
Blac
kRoc
k Li
fePa
th®
Inde
x 20
30 K
1.02
%14
.42%
4.98
%7.
91%
6.52
%-
6.97
%05
/31/
2011
(5.5
6%)
16.3
6%7.
29%
(0.5
0%)
6.64
%
Mor
ning
star L
ifetim
e M
od 2
030
TR U
SD1.2
2%15
.11%
5.40%
8.31
%6.
50%
--
-(5
.82%
)16
.59%
9.26
%(2
.30%
)6.
01%
Mor
ning
star T
arge
t-Dat
e 20
300.
76%
13.8
3%3.
85%
7.65%
6.00
%7.9
9%-
-(6
.18%
)16
.56%
7.42%
(1.40
%)
5.46%
Targ
et-D
ate
2035
Blac
kRoc
k Li
fePa
th®
Inde
x 20
35 K
0.82
%15
.27%
4.38
%8.
56%
6.92
%-
7.36
%05
/31/
2011
(6.3
6%)
18.2
9%7.
74%
(0.5
6%)
6.82
%
Pag
e 48
|
104

INVE
STM
ENT
SCO
REC A
RD |
INVE
STM
ENT
PERF
ORM
ANCE
For P
lan
Spon
sor U
se O
nly
Com
mun
ity A
ctio
n Pa
rtne
rshi
p ER
ISA
403(
b) In
vest
men
t Rev
iew
| Pe
riod
Endi
ng 0
9/30
/201
9
Inve
stm
ent N
ame
Annu
aliz
ed R
etur
nsCa
lend
ar Y
ear R
etur
ns
Last
Qtr
YTD
1 Yea
r3
Year
5Yea
r10
Yea
rIT
DIn
cept
ion
Dat
e20
1820
1720
1620
1520
14
Mor
ning
star L
ifetim
e M
od 2
035
TR U
SD0.
93%
15.76
%4.
24%
8.96
%6.
84%
--
-(6
.82%
)18
.52%
10.0
7%(2
.58%
)5.8
0%
Mor
ning
star T
arge
t-Dat
e 20
350.
56%
14.6
8%3.
09%
8.32
%6.
37%
8.57
%-
-(7
.01%
)18
.47%
7.69%
(1.52
%)
5.47%
Targ
et-D
ate
2040
Blac
kRoc
k Li
fePa
th®
Inde
x 20
40 K
0.64
%16
.10%
3.81
%9.
10%
7.28
%-
7.72
%05
/31/
2011
(7.0
8%)
19.9
5%8.
10%
(0.5
6%)
6.90
%
Mor
ning
star L
ifetim
e M
od 2
040
TR U
SD0.
66%
16.11
%3.
23%
9.30
%6.
98%
--
-(7
.65%
)19
.87%
10.6
1%(2
.83%
)5.5
1%
Mor
ning
star T
arge
t-Dat
e 20
400.
37%
15.14
%2.5
0%8.
58%
6.56
%8.
64%
--
(7.6
8%)
19.54
%8.
04%
(1.57
%)
5.66%
Targ
et-D
ate
2045
Blac
kRoc
k Li
fePa
th®
Inde
x 20
45 K
0.47
%16
.59%
3.41
%9.
46%
7.52
%-
7.97
%05
/31/
2011
(7.5
0%)
21.0
7%8.
28%
(0.6
4%)
7.10
%
Mor
ning
star L
ifetim
e M
od 2
045
TR U
SD0.
46%
16.18
%2.6
2%9.
37%
6.97
%-
--
(8.17
%)
20.53
%10
.84%
(3.0
3%)
5.25%
Mor
ning
star T
arge
t-Dat
e 20
450.
27%
15.6
5%2.1
0%8.
91%
6.72
%8.
94%
--
(8.14
%)
20.53
%8.
09%
(1.59
%)
5.53%
Targ
et-D
ate
2050
Blac
kRoc
k Li
fePa
th®
Inde
x 20
50 K
0.46
%16
.87%
3.23
%9.
54%
7.60
%-
8.13
%05
/31/
2011
(7.8
2%)
21.4
3%8.
41%
(0.6
7%)
7.28
%
Mor
ning
star L
ifetim
e M
od 2
050
TR U
SD0.
37%
16.11
%2.3
9%9.
32%
6.89
%-
--
(8.4
1%)
20.78
%10
.89%
(3.19
%)
5.00%
Mor
ning
star T
arge
t-Dat
e 20
500.
22%
15.74
%1.9
9%8.
88%
6.76
%8.
86%
--
(8.3
8%)
20.6
9%8.
30%
(1.61
%)
5.73%
Targ
et-D
ate
2055
Blac
kRoc
k Li
fePa
th®
Inde
x 20
55 K
0.39
%16
.84%
3.18
%9.
55%
7.64
%-
8.26
%05
/31/
2011
(7.8
5%)
21.5
1%8.
38%
(0.6
0%)
7.50
%
Mor
ning
star L
ifetim
e M
od 2
055
TR U
SD0.
31%
16.0
2%2.2
9%9.
26%
6.81
%-
--
(8.57
%)
20.9
5%10
.90%
(3.3
4%)
4.74
%
Mor
ning
star T
arge
t-Dat
e 20
550.
20%
15.8
6%1.8
4%9.
04%
6.84
%9.
09%
--
(8.4
4%)
21.11
%8.
16%
(1.61
%)
5.60%
Pag
e 49
|
105

INVE
STM
ENT
SCO
REC A
RD |
INVE
STM
ENT
PERF
ORM
ANCE
For P
lan
Spon
sor U
se O
nly
Com
mun
ity A
ctio
n Pa
rtne
rshi
p ER
ISA
403(
b) In
vest
men
t Rev
iew
| Pe
riod
Endi
ng 0
9/30
/201
9
Inve
stm
ent N
ame
Annu
aliz
ed R
etur
nsCa
lend
ar Y
ear R
etur
ns
Last
Qtr
YTD
1 Yea
r3
Year
5Yea
r10
Yea
rIT
DIn
cept
ion
Dat
e20
1820
1720
1620
1520
14
Targ
et-D
ate
2060
+
Blac
kRoc
k Li
fePa
th®
Inde
x 20
60 K
0.45
%16
.95%
3.30
%9.
58%
--
12.2
5%02
/29/
2016
(7.8
4%)
21.5
1%-
--
Mor
ning
star L
ifetim
e M
od 2
060
TR U
SD0.
26%
15.9
1%2.2
2%9.
18%
6.71
%-
--
(8.6
9%)
21.0
6%10
.88%
(3.4
8%)
4.53
%
Mor
ning
star T
arge
t-Dat
e 20
60+
0.18
%16
.09%
1.89%
9.20
%7.2
0%-
--
(8.4
8%)
21.22
%8.
06%
(1.00
%)
5.25%
Larg
e Va
lue
MFS
Val
ue R
62.
50%
21.5
4%7.
52%
10.5
4%9.
25%
11.6
7%10
.15%
01/0
2/19
96(9
.78%
)17
.86%
14.2
5%(0
.42%
)10
.68%
Russ
ell 10
00 V
alue
TR
USD
1.36%
17.8
1%4.
00%
9.43
%7.7
9%11
.46%
--
(8.27
%)
13.6
6%17
.34%
(3.8
3%)
13.4
5%
Mor
ning
star L
arge
Val
ue1.5
2%16
.43%
1.92%
9.43
%7.3
0%10
.67%
--
(8.53
%)
16.15
%15
.24%
(3.52
%)
11.0
2%
Larg
e Bl
end
iSha
res
S&P
500
Inde
x K
1.71
%20
.53%
4.28
%13
.37%
10.8
1%13
.16%
9.47
%07
/30/
1993
(4.3
8%)
21.7
7%11
.92%
1.35
%13
.61%
S&P
500
TR U
SD1.7
0%20
.55%
4.25
%13
.39%
10.8
4%13
.24%
--
(4.3
8%)
21.8
3%11
.96%
1.38%
13.6
9%
Mor
ning
star L
arge
Blen
d1.4
5%18
.99%
3.02
%11
.69%
8.96
%11
.76%
--
(6.17
%)
20.53
%10
.86%
(0.6
5%)
11.55
%
Larg
e Gr
owth
TIAA
-CRE
F La
rge-
Cap
Gro
wth
Inst
(0.9
0%)
20.0
8%0.
27%
16.3
5%13
.04%
14.7
2%9.
99%
03/3
1/20
060.
04%
34.5
1%(0
.85%
)9.
20%
11.2
2%
Russ
ell 10
00 G
rowt
h TR
USD
1.49%
23.3
0%3.
71%
16.8
9%13
.39%
14.9
4%-
-(1.
51%
)30
.21%
7.08%
5.67%
13.0
5%
Mor
ning
star L
arge
Gro
wth
(0.4
7%)
20.53
%1.8
6%14
.60%
11.0
0%13
.08%
--
(2.21
%)
27.76
%3.
65%
3.61
%10
.65%
Mid
-Cap
Val
ue
Wel
ls F
argo
Spe
cial
Mid
Cap
Val
ue In
st2.
60%
25.4
2%8.
17%
9.18
%8.
77%
13.0
4%11
.85%
04/0
8/20
05(1
3.10
%)
11.1
6%21
.59%
(2.7
3%)
12.0
4%
Russ
ell M
id C
ap V
alue
TR
USD
1.22%
19.4
7%1.6
0%7.8
2%7.5
5%12
.29%
--
(12.29
%)
13.3
4%20
.00%
(4.78
%)
14.75
%
Pag
e 50
|
106

INVE
STM
ENT
SCO
REC A
RD |
INVE
STM
ENT
PERF
ORM
ANCE
For P
lan
Spon
sor U
se O
nly
Com
mun
ity A
ctio
n Pa
rtne
rshi
p ER
ISA
403(
b) In
vest
men
t Rev
iew
| Pe
riod
Endi
ng 0
9/30
/201
9
Inve
stm
ent N
ame
Annu
aliz
ed R
etur
nsCa
lend
ar Y
ear R
etur
ns
Last
Qtr
YTD
1 Yea
r3
Year
5Yea
r10
Yea
rIT
DIn
cept
ion
Dat
e20
1820
1720
1620
1520
14
Mor
ning
star M
id-C
ap V
alue
0.41
%16
.26%
(2.14
%)
7.04%
6.26
%10
.65%
--
(13.0
4%)
13.4
4%18
.86%
(5.24
%)
9.60
%
Mid
-Cap
Ble
nd
Vang
uard
Mid
Cap
Inde
x Ad
mira
l0.
61%
22.6
0%3.
65%
10.6
7%9.
20%
13.0
5%9.
92%
05/2
1/19
98(9
.23%
)19
.25%
11.2
2%(1
.34%
)13
.76%
CRSP
US
Mid
Cap
TR
USD
0.62
%22
.66%
3.70
%10
.70%
9.24
%13
.14%
--
(9.22
%)
19.3
0%11
.25%
(1.28
%)
13.8
3%
Mor
ning
star M
id-C
ap B
lend
0.08
%17
.69%
(1.39
%)
8.47
%6.
61%
10.9
4%-
-(11
.11%
)16
.01%
14.76
%(4
.44%
)8.
26%
Mid
-Cap
Gro
wth
Mas
sMut
ual S
elec
t Mid
Cap
Gro
wth
I(0
.64%
)23
.56%
6.66
%14
.42%
12.6
9%14
.62%
9.77
%05
/31/
2000
(3.1
0%)
24.6
6%6.
19%
5.95
%13
.00%
Russ
ell M
id C
ap G
rowt
h TR
USD
(0.6
7%)
25.23
%5.2
0%14
.50%
11.12
%14
.08%
--
(4.75
%)
25.27
%7.3
3%(0
.20%
)11
.90%
Mor
ning
star M
id-C
ap G
rowt
h(1.
80%
)22
.76%
1.10%
13.10
%9.
89%
12.56
%-
-(6
.19%
)24
.24%
6.94
%(0
.43%
)7.1
7%
Smal
l Val
ue
DFA
US
Smal
l Cap
Val
ue I
(2.1
3%)
8.19
%(1
3.74
%)
4.24
%4.
43%
10.0
3%10
.82%
03/0
2/19
93(1
5.13
%)
7.21
%28
.26%
(7.8
1%)
3.48
%
Russ
ell 2
000
Valu
e TR
USD
(0.57
%)
12.8
2%(8
.24%
)6.
54%
7.17%
10.0
6%-
-(12
.86%
)7.8
4%31
.74%
(7.4
7%)
4.22
%
Mor
ning
star S
mal
l Val
ue(0
.57%
)12
.30%
(9.3
8%)
4.92
%5.0
3%9.
36%
--
(15.4
7%)
8.60
%26
.66%
(7.50
%)
3.46
%
Smal
l Gro
wth
Janu
s H
ende
rson
Trit
on T
(3.1
4%)
21.4
1%(2
.52%
)13
.78%
12.4
3%15
.08%
12.5
8%02
/25/
2005
(5.2
6%)
26.9
0%10
.42%
1.21
%9.
45%
Russ
ell 2
000
Grow
th T
R US
D(4
.17%
)15
.34%
(9.6
3%)
9.79
%9.
08%
12.25
%-
-(9
.31%
)22
.17%
11.3
2%(1.
38%
)5.6
0%
Mor
ning
star S
mal
l Gro
wth
(4.17
%)
16.8
0%(7
.52%
)11
.44%
9.55
%12
.28%
--
(5.57
%)
21.6
7%11
.84%
(2.0
8%)
2.63%
Fore
ign
Larg
e Bl
end
Har
tfor
d In
tern
atio
nal O
ppor
tuni
ties
R6(2
.49%
)15
.72%
(1.8
4%)
4.73
%3.
40%
5.56
%5.
47%
07/2
2/19
96(1
8.61
%)
24.7
7%1.
15%
1.49
%(4
.10%
)
Pag
e 51
|
107

INVE
STM
ENT
SCO
REC A
RD |
INVE
STM
ENT
PERF
ORM
ANCE
For P
lan
Spon
sor U
se O
nly
Com
mun
ity A
ctio
n Pa
rtne
rshi
p ER
ISA
403(
b) In
vest
men
t Rev
iew
| Pe
riod
Endi
ng 0
9/30
/201
9
Inve
stm
ent N
ame
Annu
aliz
ed R
etur
nsCa
lend
ar Y
ear R
etur
ns
Last
Qtr
YTD
1 Yea
r3
Year
5Yea
r10
Yea
rIT
DIn
cept
ion
Dat
e20
1820
1720
1620
1520
14
MSC
I EAF
E N
R US
D(1.
07%
)12
.80%
(1.34
%)
6.48
%3.
27%
4.90
%-
-(13
.79%
)25
.03%
1.00%
(0.8
1%)
(4.9
0%)
Mor
ning
star F
oreig
n La
rge
Blen
d(1.
28%
)12
.12%
(2.0
4%)
5.55%
2.93%
4.55
%-
-(14
.53%
)25
.30%
1.63%
(1.21
%)
(4.74
%)
Div
ersifi
ed E
mer
ging
Mkt
s
Amer
ican
Fun
ds N
ew W
orld
R6
(0.7
5%)
17.3
7%7.
87%
9.57
%5.
49%
6.40
%7.
99%
06/1
7/19
99(1
1.97
%)
33.0
6%4.
31%
(5.6
2%)
(3.2
9%)
MSC
I EM
NR
USD
(4.25
%)
5.89%
(2.0
2%)
5.97%
2.33%
3.37
%-
-(14
.57%
)37
.28%
11.19
%(14
.92%
)(2
.19%
)
Mor
ning
star D
ivers
ified
Emer
ging
Mkt
s(3
.64%
)7.9
9%(0
.03%
)5.0
6%1.6
6%3.
39%
--
(16.0
1%)
34.57
%9.
09%
(13.6
6%)
(2.3
3%)
Real
Est
ate
Prin
cipa
l Rea
l Est
ate
Secu
ritie
s In
st7.
74%
30.4
5%21
.89%
9.51
%11
.68%
13.7
6%11
.80%
12/0
6/20
00(4
.31%
)9.
03%
5.93
%4.
22%
32.3
6%
DJ U
S Se
lect R
EIT
TR U
SD6.
83%
24.6
4%16
.41%
6.48
%9.
70%
12.6
9%-
-(4
.22%
)3.
76%
6.68
%4.
48%
32.0
0%
Mor
ning
star R
eal E
state
6.89
%26
.43%
17.26
%7.2
2%9.
27%
12.15
%-
-(6
.02%
)6.
93%
7.70%
1.97%
27.8
9%
Revi
ew :
Wat
ch :
Addi
tion
:
The
perf
orm
ance
dat
a qu
oted
repr
esen
ts p
ast p
erfo
rman
ce. P
ast p
erfo
rman
ce d
oes
not g
uara
ntee
futu
re re
sults
. Inv
estm
ent r
etur
n an
d pr
inci
pal v
alue
will
fluc
tuat
e so
that
an
inve
stor
's sh
ares
, whe
nre
deem
ed, m
ay b
e w
orth
mor
e or
less
than
thei
r orig
inal
cos
t. Cu
rren
t per
form
ance
may
be
low
er o
r hig
her t
han
the
perf
orm
ance
info
rmat
ion
quot
ed. T
he p
erfo
rman
ce q
uote
d re
flect
s th
e re
inve
stm
ent o
fdi
vide
nds
and
capi
tal g
ains
and
is n
et o
f all
expe
nses
. To
obta
in c
urre
nt m
onth
-end
per
form
ance
info
rmat
ion,
ple
ase
cont
act t
he p
hone
num
ber l
ocat
ed in
the
“Impo
rtan
t Dis
clos
ures
” sec
tion
of th
is re
port
.Fo
r sou
rce
info
rmat
ion,
ple
ase
see
the
"Im
port
ant D
iscl
osur
es"
sect
ion
of th
is re
port
. Ple
ase
see
furt
her d
etai
ls o
n th
e sc
orin
g m
etho
dolo
gy in
the
"Inv
estm
ent S
corin
g M
etho
dolo
gy"
sect
ion
of th
is re
port
.
Den
otes
pot
entia
l add
ition
or r
epla
cem
ent o
ptio
n(s)
. Opt
ion(
s) a
re s
ubje
ct to
fina
l app
rova
l as
plat
form
s m
ay d
isco
ntin
ue o
ptio
n av
aila
bilit
y.
Pag
e 52
|
108

INVE
STM
ENT
FACT
SH
EETS
- 1
00 P
OIN
T
Com
mun
ity A
ctio
n Pa
rtne
rshi
p ER
ISA
403(
b)
For P
erio
d En
ding
09/
30/2
019
109
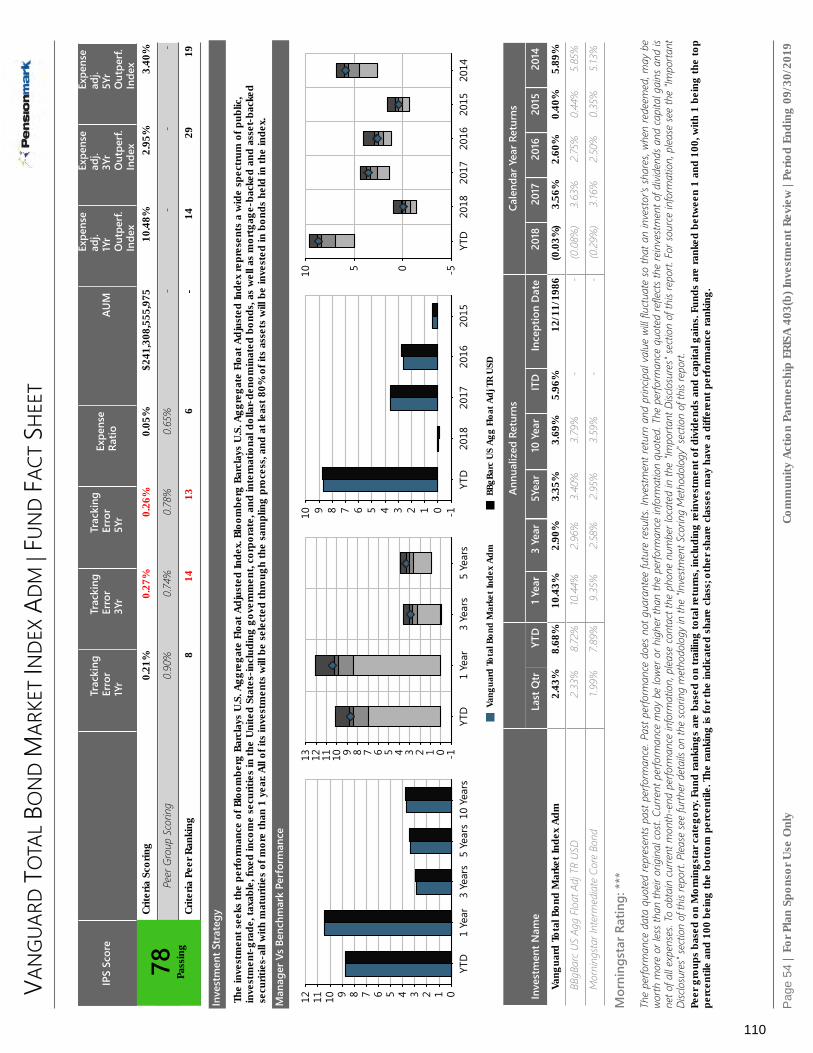
VAN
GUAR
D TO
TAL
BON
D M
ARKE
T IN
DEX
ADM
| FU
ND
FACT
SHE
ET
For P
lan
Spon
sor U
se O
nly
Com
mun
ity A
ctio
n Pa
rtne
rshi
p ER
ISA
403(
b) In
vest
men
t Rev
iew
| Pe
riod
Endi
ng 0
9/30
/201
9
IPS
Scor
eTr
acki
ngEr
ror
1Yr
Trac
king
Erro
r3Y
r
Trac
king
Erro
r5Y
rEx
pens
eRa
tioAU
M
Expe
nse
adj.
1Yr
Out
per f.
Inde
x
Expe
nse
adj.
3Yr
Out
per f.
Inde
x
Expe
nse
adj.
5Yr
Out
per f.
Inde
x
78 Pass
ing
Crite
ria S
corin
g0.
21%
0.27
%0.
26%
0.05
%$2
41,3
08,5
55,9
7510
.48%
2.95
%3.
40%
Peer
Gro
up S
corin
g0.
90%
0.74
%0.
78%
0.65
%-
--
-
Crite
ria P
eer R
anki
ng8
1413
6-
1429
19
Inve
stm
ent S
trat
egy
The
inve
stm
ent s
eeks
the
perf
orm
ance
of B
loom
berg
Bar
clay
s U
.S. A
ggre
gate
Flo
at A
djus
ted
Inde
x. B
loom
berg
Bar
clay
s U
.S. A
ggre
gate
Flo
at A
djus
ted
Inde
x re
pres
ents
a w
ide
spec
trum
of p
ublic
,in
vest
men
t-gr
ade,
taxa
ble,
fixe
d in
com
e se
curit
ies
in th
e U
nite
d St
ates
-incl
udin
g go
vern
men
t, co
rpor
ate,
and
inte
rnat
iona
l dol
lar-
deno
min
ated
bon
ds, a
s w
ell a
s m
ortg
age-
back
ed a
nd a
sset
-bac
ked
secu
ritie
s-al
l with
mat
uriti
es o
f mor
e th
an 1
yea
r. Al
l of i
ts in
vest
men
ts w
ill b
e se
lect
ed th
roug
h th
e sa
mpl
ing
proc
ess,
and
at le
ast 8
0% o
f its
ass
ets
will
be
inve
sted
in b
onds
hel
d in
the
inde
x.
Man
ager
Vs
Benc
hmar
k Pe
rfor
man
ce
12 11 10 9 8 7 6 5 4 3 2 1 010
Yea
rs5
Year
s3
Year
s1
Year
YTD
13 12 11 10 9 8 7 6 5 4 3 2 1 0 -15
Year
s3
Year
s1
Year
YTD
10 9 8 7 6 5 4 3 2 1 0 -12015
2016
2017
2018
YTD
10 5 0 -52014
2015
2016
2017
2018
YTD
Vang
uard
Tot
al B
ond
Mar
ket I
ndex
Adm
BBgB
arc
US
Agg
Floa
t Adj
TR
USD
Inve
stm
ent N
ame
Annu
aliz
ed R
etur
nsCa
lend
ar Y
ear R
etur
ns
Last
Qtr
YTD
1 Yea
r3
Year
5Yea
r10
Yea
rIT
DIn
cept
ion
Dat
e20
1820
1720
1620
1520
14
Vang
uard
Tot
al B
ond
Mar
ket I
ndex
Adm
2.43
%8.
68%
10.4
3%2.
90%
3.35
%3.
69%
5.96
%12
/11/
1986
(0.0
3%)
3.56
%2.
60%
0.40
%5.
89%
BBgB
arc U
S Ag
g Flo
at A
dj T
R US
D2.3
3%8.
72%
10.4
4%2.9
6%3.
40%
3.79
%-
-(0
.08%
)3.
63%
2.75%
0.44
%5.8
5%
Mor
ning
star I
nter
med
iate
Cor
e Bo
nd1.9
9%7.8
9%9.
35%
2.58%
2.95%
3.59
%-
-(0
.29%
)3.
16%
2.50%
0.35
%5.1
3%
Mor
ning
star
Rat
ing:
***
The
perfo
rman
ce d
ata
quot
ed re
pres
ents
pas
t per
form
ance
. Pas
t per
form
ance
doe
s no
t gua
rant
ee fu
ture
resu
lts. I
nves
tmen
t ret
urn
and
prin
cipal
val
ue w
ill flu
ctua
te so
that
an
inve
stor's
shar
es, w
hen
rede
emed
, may
be
worth
mor
e or
less
than
their
orig
inal
cost.
Cur
rent
per
form
ance
may
be
lowe
r or h
ighe
r tha
n th
e pe
rform
ance
info
rmat
ion
quot
ed. T
he p
erfo
rman
ce q
uote
d re
flect
s the
rein
vestm
ent o
f divi
dend
s and
capi
tal g
ains
and
isne
t of a
ll ex
pens
es. T
o ob
tain
curre
nt m
onth
-end
per
form
ance
info
rmat
ion,
plea
se co
ntac
t the
pho
ne n
umbe
r loc
ated
in th
e "Im
porta
nt D
isclo
sure
s" se
ctio
n of
this
repo
rt. F
or so
urce
info
rmat
ion,
plea
se se
e th
e "Im
porta
ntDi
sclo
sure
s" se
ctio
n of
this
repo
rt. P
lease
see
furth
er d
etai
ls on
the
scor
ing
met
hodo
logy
in th
e "In
vestm
ent S
corin
g M
etho
dolo
gy" s
ectio
n of
this
repo
rt.Pe
er g
roup
s ba
sed
on M
orni
ngst
ar c
ateg
ory.
Fund
rank
ings
are
bas
ed o
n tr
ailin
g to
tal r
etur
ns, i
nclu
ding
rein
vest
men
t of d
ivid
ends
and
cap
ital g
ains
. Fun
ds a
re ra
nked
bet
wee
n 1
and
100,
with
1 b
eing
the
top
perc
entil
e an
d 10
0 be
ing
the
bott
om p
erce
ntile
. The
rank
ing
is fo
r the
indi
cate
d sh
are
clas
s; ot
her s
hare
cla
sses
may
hav
e a
diffe
rent
per
form
ance
rank
ing.
Pag
e 54
|
110

VAN
GUAR
D TO
TAL
BON
D M
ARKE
T IN
DEX
ADM
| FU
ND
FACT
SHE
ET
For P
lan
Spon
sor U
se O
nly
Com
mun
ity A
ctio
n Pa
rtne
rshi
p ER
ISA
403(
b) In
vest
men
t Rev
iew
| Pe
riod
Endi
ng 0
9/30
/201
9
Asse
t Allo
catio
n
Oth
er (0
.00%
)
Conv
ertib
le B
ond
(0.5
0%)
Pref
erre
d St
ocks
(0.0
0%)
Fore
ign
Bond
(7.3
4%)
Dom
estic
Bon
d (9
0.18
%)
Fore
ign
Stoc
k (0
.00%
)
Dom
estic
Sto
ck (0
.00%
)
Cash
(1.9
8%)
Mat
urity
Dist
ribut
ion
Fund
Less
than
1 Y
r0.
35
1 to
3 Y
rs21
.59
3 to
5 Y
rs15
.47
5 to
7 Y
rs11
.22
7 to
10
Yrs
9.78
10 Y
rs o
r mor
e41
.60
Regi
onal
Dist
ribut
ion
Uni
ted
Stat
es92
.47
Supr
anat
iona
l1.
40
Cana
da1.
11
Uni
ted
King
dom
0.77
Japa
n0.
58
Ger
man
y0.
57
Mex
ico
0.54
Net
herla
nds
0.44
Aust
ralia
0.27
Colo
mbi
a0.
19
Sect
or D
istrib
utio
n
Fund
Inde
x
Gov
ernm
ent
47.1
8-
Corp
orat
e26
.44
-
Secu
ritiz
ed23
.75
-
Mun
icip
al-
-
Cash
& E
quiv
alen
ts1.
98-
Oth
er0.
65-
Cred
it Q
ualit
y
Fund
Inde
x
AAA
67.6
8-
AA3.
45-
A11
.15
-
BBB
17.7
2-
BB0.
00-
B0.
00-
Belo
w B
0.00
-
Not
Rat
ed0.
00-
Styl
e An
alys
is
Mortgages - Corp/Gov
2 1 0 -1 -2
Corp
orat
e -
Gov
ernm
ent
21
0-1
-21 0 -1
-11
0
Gov
t.Bon
dsCo
rp.B
onds
Mor
tgag
es
Risk
/Ret
urn
vs P
eer G
roup
Standard Deviation
5 4 3 2 1 010
yea
rs5
year
s3
year
s1
year
YTD
Sharpe Ratio
3 2 1 0 -110
yea
rs5
year
s3
year
s1
year
YTD
Information Ratio
3 2 1 0 -1 -2 -310
yea
rs5
year
s3
year
s1
year
YTD
Vang
uard
Tot
al B
ond
Mar
ket I
ndex
Adm
BBgB
arc
US
Agg
Floa
t Adj
TR
USD
Fund
Bas
ics
Tick
erVB
TLX
Cate
gory
Inte
rmed
iate
Cor
e Bo
nd
Net
Ass
ets(
This
Cla
ss $
mn)
241,
309
m
Net
Ass
ets(
All C
lass
es $
mn)
-
Man
ager
Josh
ua B
arric
kman
Man
ager
Ten
ure
6.58
Fund
Ince
ptio
nD
ec 1
1,19
86
Avg
Mat
urity
8.30
Avg
Dur
atio
n6.
20
Fee
And
Expe
nses
Expe
nse
Ratio
0.05
Gro
ss E
xpen
se R
atio
0.05
Pros
pect
us N
et E
xpen
se R
atio
0.05
Pros
pect
us G
ross
Exp
ense
Rat
io0.
05
Actu
al 1
2b1
0.00
Man
agem
ent F
ee0.
04
Top
10 H
oldi
ngs
(%)
Fede
ral N
atio
nal M
ortg
a...
0.44
Uni
ted
Stat
es T
reas
ury
...0.
43
Uni
ted
Stat
es T
reas
ury
...0.
41
Uni
ted
Stat
es T
reas
ury
...0.
41
Uni
ted
Stat
es T
reas
ury
...0.
41
Uni
ted
Stat
es T
reas
ury
...0.
40
Uni
ted
Stat
es T
reas
ury
...0.
40
Uni
ted
Stat
es T
reas
ury
...0.
39
Uni
ted
Stat
es T
reas
ury
...0.
37
Uni
ted
Stat
es T
reas
ury
...0.
37
Cum
ulat
ive
Perf
orm
ance
Tim
e Pe
riod:
01/
30/2
014
- 09
/30/
2019
Growth of $100
129
129
125
121
117
113
109
106
102 98 94 90
09/1
901
/19
07/1
801
/18
07/1
701
/17
07/1
601
/16
07/1
509
/14
Vang
uard
Tot
al B
ond
Mar
ket I
ndex
Adm
BBgB
arc
US
Agg
Floa
t Adj
TR
USD
Gro
wth
of $
100
is c
alcu
late
d at
NAV
and
ass
umes
that
all
divi
dend
and
cap
ital g
ain
dist
ribut
ions
wer
e re
inve
sted
.It
does
not
take
into
acc
ount
sal
es c
harg
es o
r the
effe
ct o
f tax
es. R
esul
ts a
re n
ot in
dica
tive
of fu
ture
per
form
ance
.
Pag
e 55
|
111

PUTN
AM D
YNAM
IC A
SSET
ALL
OCA
TIO
N C
NSR
V Y
| FUN
D FA
CT S
HEET
For P
lan
Spon
sor U
se O
nly
Com
mun
ity A
ctio
n Pa
rtne
rshi
p ER
ISA
403(
b) In
vest
men
t Rev
iew
| Pe
riod
Endi
ng 0
9/30
/201
9
IPS
Scor
eRe
turn
1Yr
Retu
rn3Y
rRe
turn
5Yr
Shar
pe3Y
rSh
arpe
5Yr
Info
Ratio
3Yr
Info
Ratio
5Yr
Man
ager
Tenu
reEx
pens
eRa
tioSt
yle
Cons
isten
cy(R
BSA)
Up/
Dow
nCa
ptur
e5Y
r
76 Pass
ing
Crite
ria S
corin
g4.
20%
4.90
%4.
61%
0.74
0.80
-0.8
6-0
.87
17.3
30.
74%
3.31
0.91
Peer
Gro
up S
corin
g4.
52%
5.15%
4.18
%0.
670.
60-0
.50-0
.728.
111.1
0%5.9
10.
81
Crite
ria P
eer R
anki
ng65
6237
4416
7661
526
1223
Inve
stm
ent S
trat
egy
The
inve
stm
ent s
eeks
tota
l ret
urn
cons
iste
nt w
ith p
rese
rvat
ion
of c
apita
l. Th
e fu
nd a
lloca
tes
15%
to 4
5% o
f its
ass
ets
in e
quiti
es a
nd 5
5% to
85%
in fi
xed
inco
me
secu
ritie
s. It
inve
sts
mai
nly
in fi
xed-
inco
me
inve
stm
ents
, inc
ludi
ng U
.S. a
nd fo
reig
n go
v ern
men
t obl
igat
ions
, cor
pora
te o
blig
atio
ns a
nd s
ecur
itize
d de
bt in
stru
men
ts. T
he fu
nd a
lso
inve
sts,
to a
less
er e
xten
t, in
equ
ity s
ecur
ities
(gro
wth
or v
alue
sto
cks
or b
oth)
of U
.S. a
nd fo
reig
n co
mpa
nies
of a
ny s
ize.
Man
ager
Vs
Benc
hmar
k Pe
rfor
man
ce
14 13 12 11 10 9 8 7 6 5 4 3 2 1 010
Yea
rs5
Year
s3
Year
s1
Year
YTD
20 15 10 5 0 -5 -10
-15
-20
-25
5 Ye
ars
3 Ye
ars
1 Ye
arYT
D
14 12 10 8 6 4 2 0 -2 -4 -62015
2016
2017
2018
YTD
20 10 0
-10
2014
2015
2016
2017
2018
YTD
Putn
am D
ynam
ic A
sset
Allo
catio
n Cn
srv
YD
J US
Mod
erat
ely
Cons
erva
tive
TR U
SD
Inve
stm
ent N
ame
Annu
aliz
ed R
etur
nsCa
lend
ar Y
ear R
etur
ns
Last
Qtr
YTD
1 Yea
r3
Year
5Yea
r10
Yea
rIT
DIn
cept
ion
Dat
e20
1820
1720
1620
1520
14
Putn
am D
ynam
ic A
sset
Allo
catio
n Cn
srv
Y1.
05%
10.0
3%4.
20%
4.90
%4.
61%
6.59
%6.
04%
02/0
7/19
94(4
.55%
)10
.04%
4.84
%0.
51%
8.55
%
DJ U
S M
oder
ately
Con
serv
ative
TR
USD
1.39%
12.0
4%6.
19%
6.22
%5.8
3%7.4
6%-
-(2
.26%
)9.
55%
6.96
%0.
24%
7.93%
Mor
ning
star A
lloca
tion-
-30%
to 5
0% E
quity
1.19%
11.16
%4.
52%
5.15%
4.18
%6.
16%
--
(5.0
1%)
10.0
1%6.
92%
(2.26
%)
4.77
%
Mor
ning
star
Rat
ing:
***
*
The
perfo
rman
ce d
ata
quot
ed re
pres
ents
pas
t per
form
ance
. Pas
t per
form
ance
doe
s no
t gua
rant
ee fu
ture
resu
lts. I
nves
tmen
t ret
urn
and
prin
cipal
val
ue w
ill flu
ctua
te so
that
an
inve
stor's
shar
es, w
hen
rede
emed
, may
be
worth
mor
e or
less
than
their
orig
inal
cost.
Cur
rent
per
form
ance
may
be
lowe
r or h
ighe
r tha
n th
e pe
rform
ance
info
rmat
ion
quot
ed. T
he p
erfo
rman
ce q
uote
d re
flect
s the
rein
vestm
ent o
f divi
dend
s and
capi
tal g
ains
and
isne
t of a
ll ex
pens
es. T
o ob
tain
curre
nt m
onth
-end
per
form
ance
info
rmat
ion,
plea
se co
ntac
t the
pho
ne n
umbe
r loc
ated
in th
e "Im
porta
nt D
isclo
sure
s" se
ctio
n of
this
repo
rt. F
or so
urce
info
rmat
ion,
plea
se se
e th
e "Im
porta
ntDi
sclo
sure
s" se
ctio
n of
this
repo
rt. P
lease
see
furth
er d
etai
ls on
the
scor
ing
met
hodo
logy
in th
e "In
vestm
ent S
corin
g M
etho
dolo
gy" s
ectio
n of
this
repo
rt.Pe
er g
roup
s ba
sed
on M
orni
ngst
ar c
ateg
ory.
Fund
rank
ings
are
bas
ed o
n tr
ailin
g to
tal r
etur
ns, i
nclu
ding
rein
vest
men
t of d
ivid
ends
and
cap
ital g
ains
. Fun
ds a
re ra
nked
bet
wee
n 1
and
100,
with
1 b
eing
the
top
perc
entil
e an
d 10
0 be
ing
the
bott
om p
erce
ntile
. The
rank
ing
is fo
r the
indi
cate
d sh
are
clas
s; ot
her s
hare
cla
sses
may
hav
e a
diffe
rent
per
form
ance
rank
ing.
Pag
e 56
|
112

PUTN
AM D
YNAM
IC A
SSET
ALL
OCA
TIO
N C
NSR
V Y
| FUN
D FA
CT S
HEET
For P
lan
Spon
sor U
se O
nly
Com
mun
ity A
ctio
n Pa
rtne
rshi
p ER
ISA
403(
b) In
vest
men
t Rev
iew
| Pe
riod
Endi
ng 0
9/30
/201
9
Port
folio
Com
posit
ion
Tim
e Pe
riod:
10/
30/2
014
- 09
/30/
2019
100% 80%
60%
40%
20% 0%
09/19
03/19
03/18
03/17
03/16
03/15
Stoc
kBo
ndCa
shO
ther
Bond
Dist
ribut
ion
Tim
e Pe
riod:
10/
30/2
014
- 09
/30/
2019
100 80 60 40 20 0
09/19
03/19
03/18
03/17
03/16
03/15
Dom
estic
Bon
dFo
reig
n Bo
ndPr
efer
red
Stoc
ks
Conv
ertib
le B
ond
Oth
er
Equi
ty R
egio
nal D
istrib
utio
n
Tim
e Pe
riod:
10/
30/2
014
- 09
/30/
2019
100 80 60 40 20 0
09/19
03/19
03/18
03/17
03/16
03/15
Nor
th A
mer
ica
%La
tin A
mer
ica
%U
nite
d Ki
ngdo
m %
Euro
pe d
ev %
Euro
pe e
mrg
%Af
rica/
Mid
dle
East
%
Asia
%
Sect
or D
istrib
utio
n
Tim
e Pe
riod:
10/
30/2
014
- 09
/30/
2019
100 80 60 40 20 0
09/19
03/19
03/18
03/17
03/16
03/15
Tech
nolo
gyCo
mm
unic
atio
n Se
rvic
esCo
nsum
er C
yclic
al
Cons
umer
Def
ensi
veO
ther
Styl
e An
alys
is
Small - Large
2 1 0 -1 -2
Valu
e -
Gro
wth
21
0-1
-21 0 -1
-11
0
Smal
l Gro
wth
Smal
l Val
ue
Mid
Gro
wth
Mid
Val
ue
Top
Gro
wth
Top
Valu
e
Risk
/Ret
urn
vs P
eer G
roup
Standard Deviation
10 9 8 7 6 5 4 3 2 1 010
yea
rs5
year
s3
year
s1
year
YTD
Sharpe Ratio
3 2 1 0 -110
yea
rs5
year
s3
year
s1
year
YTD
Information Ratio
2 1 0 -1 -2 -310
yea
rs5
year
s3
year
s1
year
YTD
Putn
am D
ynam
ic A
sset
Allo
catio
n Cn
srv
YD
J US
Mod
erat
ely
Cons
erva
tive
TR U
SD
Fund
Bas
ics
Tick
erPA
CYX
Cate
gory
Allo
catio
n--3
0% to
50%
Equ
ity
Net
Ass
ets(
This
Cla
ss $
mn)
1,08
7 m
Net
Ass
ets(
All C
lass
es $
mn)
0 m
Man
ager
Robe
rt S
choe
n
Man
ager
Ten
ure
17.3
3
Fund
Ince
ptio
nFe
b 07
,199
4
Fee
And
Expe
nses
Expe
nse
Ratio
0.74
Gro
ss E
xpen
se R
atio
0.74
Pros
pect
us N
et E
xpen
se R
atio
0.74
Pros
pect
us G
ross
Exp
ense
Rat
io0.
74
Actu
al 1
2b1
0.00
Man
agem
ent F
ee0.
52
Top
10 H
oldi
ngs
(%)
E-m
ini S
&P
500
Sept
19-1
1.91
2 Ye
ar U
S Tr
easu
ry N
ote.
..8.
66
US
5 Ye
ar N
ote
(CBT
) Se.
..8.
63
US
10 Y
ear N
ote
(CBT
) S...
-6.3
2
Cgpu
tql2
R U
s000
3m P
11.
..4.
09
US
Ultr
a Bo
nd (C
BT) S
ept1
93.
92
Gov
ernm
ent N
atio
nal M
or...
3.78
Ru10
intr
P U
s000
3m R
11.
..-3
.57
Fede
ral H
ome
Loan
Mor
tg...
3.01
min
i MSC
I EAF
E In
dex
Fu...
-2.9
6
Cum
ulat
ive
Perf
orm
ance
Tim
e Pe
riod:
01/
30/2
014
- 09
/30/
2019
Growth of $100
143
137
132
127
122
116
111
106
101 95 90
09/1
901
/19
07/1
801
/18
07/1
701
/17
07/1
601
/16
07/1
509
/14
Putn
am D
ynam
ic A
sset
Allo
catio
n Cn
srv
Y
DJ U
S M
oder
atel
y Co
nser
vativ
e TR
USD
Gro
wth
of $
100
is c
alcu
late
d at
NAV
and
ass
umes
that
all
divi
dend
and
cap
ital g
ain
dist
ribut
ions
wer
e re
inve
sted
.It
does
not
take
into
acc
ount
sal
es c
harg
es o
r the
effe
ct o
f tax
es. R
esul
ts a
re n
ot in
dica
tive
of fu
ture
perf
orm
ance
.
Pag
e 57
|
113

PUTN
AM D
YNAM
IC A
SSET
ALL
OCA
TIO
N B
AL Y
| FU
ND
FACT
SHE
ET
For P
lan
Spon
sor U
se O
nly
Com
mun
ity A
ctio
n Pa
rtne
rshi
p ER
ISA
403(
b) In
vest
men
t Rev
iew
| Pe
riod
Endi
ng 0
9/30
/201
9
IPS
Scor
eRe
turn
1Yr
Retu
rn3Y
rRe
turn
5Yr
Shar
pe3Y
rSh
arpe
5Yr
Info
Ratio
3Yr
Info
Ratio
5Yr
Man
ager
Tenu
reEx
pens
eRa
tioSt
yle
Cons
isten
cy(R
BSA)
Up/
Dow
nCa
ptur
e5Y
r
72 Pass
ing
Crite
ria S
corin
g1.
32%
7.37
%6.
24%
0.73
0.68
-0.4
5-0
.55
17.3
30.
72%
5.81
0.92
Peer
Gro
up S
corin
g3.
53%
7.13%
5.60%
0.73
0.62
-0.3
7-0
.599.
941.1
0%6.
190.
90
Crite
ria P
eer R
anki
ng82
4232
5340
5444
1226
5745
Inve
stm
ent S
trat
egy
The
inve
stm
ent s
eeks
tota
l ret
urn.
The
fund
allo
cate
s 45
% to
75%
of i
ts a
sset
s in
equ
ities
and
25%
to 5
5% in
fixe
d in
com
e se
curit
ies.
It in
vest
s m
ainl
y in
equ
ity s
ecur
ities
(gro
wth
or v
alue
sto
cks
or b
oth)
of
both
U.S
. and
fore
ign
com
pani
es o
f any
siz
e. T
he fu
nd a
lso
inve
sts
in fi
xed-
inco
me
inve
stm
ents
, inc
ludi
ng U
.S. a
nd fo
reig
n go
vern
men
t obl
igat
ions
, cor
pora
te o
blig
atio
ns a
nd s
ecur
itize
d de
bt in
stru
men
ts(s
uch
as m
ortg
age-
back
ed in
vest
men
ts).
Man
ager
Vs
Benc
hmar
k Pe
rfor
man
ce
18 16 14 12 10 8 6 4 2 010
Yea
rs5
Year
s3
Year
s1
Year
YTD
20 15 10 5 0 -5 -10
-15
5 Ye
ars
3 Ye
ars
1 Ye
arYT
D
20 15 10 5 0 -5 -10
2015
2016
2017
2018
YTD
20 10 0
-10
-20
2014
2015
2016
2017
2018
YTD
Putn
am D
ynam
ic A
sset
Allo
catio
n Ba
l YD
J US
Mod
erat
e TR
USD
Inve
stm
ent N
ame
Annu
aliz
ed R
etur
nsCa
lend
ar Y
ear R
etur
ns
Last
Qtr
YTD
1 Yea
r3
Year
5Yea
r10
Yea
rIT
DIn
cept
ion
Dat
e20
1820
1720
1620
1520
14
Putn
am D
ynam
ic A
sset
Allo
catio
n Ba
l Y0.
60%
12.9
9%1.
32%
7.37
%6.
24%
8.94
%7.
25%
02/0
7/19
94(6
.95%
)15
.44%
6.99
%0.
55%
9.70
%
DJ U
S M
oder
ate
TR U
SD1.1
0%14
.77%
4.52
%8.
17%
7.23%
9.35
%-
-(3
.92%
)13
.12%
9.26
%(0
.13%
)9.
08%
Mor
ning
star A
lloca
tion-
-50%
to 7
0% E
quity
0.92
%13
.42%
3.53
%7.1
3%5.6
0%7.8
0%-
-(5
.72%
)13
.65%
7.71%
(1.80
%)
6.46
%
Mor
ning
star
Rat
ing:
***
*
The
perfo
rman
ce d
ata
quot
ed re
pres
ents
pas
t per
form
ance
. Pas
t per
form
ance
doe
s no
t gua
rant
ee fu
ture
resu
lts. I
nves
tmen
t ret
urn
and
prin
cipal
val
ue w
ill flu
ctua
te so
that
an
inve
stor's
shar
es, w
hen
rede
emed
, may
be
worth
mor
e or
less
than
their
orig
inal
cost.
Cur
rent
per
form
ance
may
be
lowe
r or h
ighe
r tha
n th
e pe
rform
ance
info
rmat
ion
quot
ed. T
he p
erfo
rman
ce q
uote
d re
flect
s the
rein
vestm
ent o
f divi
dend
s and
capi
tal g
ains
and
isne
t of a
ll ex
pens
es. T
o ob
tain
curre
nt m
onth
-end
per
form
ance
info
rmat
ion,
plea
se co
ntac
t the
pho
ne n
umbe
r loc
ated
in th
e "Im
porta
nt D
isclo
sure
s" se
ctio
n of
this
repo
rt. F
or so
urce
info
rmat
ion,
plea
se se
e th
e "Im
porta
ntDi
sclo
sure
s" se
ctio
n of
this
repo
rt. P
lease
see
furth
er d
etai
ls on
the
scor
ing
met
hodo
logy
in th
e "In
vestm
ent S
corin
g M
etho
dolo
gy" s
ectio
n of
this
repo
rt.Pe
er g
roup
s ba
sed
on M
orni
ngst
ar c
ateg
ory.
Fund
rank
ings
are
bas
ed o
n tr
ailin
g to
tal r
etur
ns, i
nclu
ding
rein
vest
men
t of d
ivid
ends
and
cap
ital g
ains
. Fun
ds a
re ra
nked
bet
wee
n 1
and
100,
with
1 b
eing
the
top
perc
entil
e an
d 10
0 be
ing
the
bott
om p
erce
ntile
. The
rank
ing
is fo
r the
indi
cate
d sh
are
clas
s; ot
her s
hare
cla
sses
may
hav
e a
diffe
rent
per
form
ance
rank
ing.
Pag
e 58
|
114

PUTN
AM D
YNAM
IC A
SSET
ALL
OCA
TIO
N B
AL Y
| FU
ND
FACT
SHE
ET
For P
lan
Spon
sor U
se O
nly
Com
mun
ity A
ctio
n Pa
rtne
rshi
p ER
ISA
403(
b) In
vest
men
t Rev
iew
| Pe
riod
Endi
ng 0
9/30
/201
9
Port
folio
Com
posit
ion
Tim
e Pe
riod:
10/
30/2
014
- 09
/30/
2019
100% 80%
60%
40%
20% 0%
09/19
03/19
03/18
03/17
03/16
03/15
Stoc
kBo
ndCa
shO
ther
Bond
Dist
ribut
ion
Tim
e Pe
riod:
10/
30/2
014
- 09
/30/
2019
100 80 60 40 20 0
09/19
03/19
03/18
03/17
03/16
03/15
Dom
estic
Bon
dFo
reig
n Bo
ndPr
efer
red
Stoc
ks
Conv
ertib
le B
ond
Oth
er
Equi
ty R
egio
nal D
istrib
utio
n
Tim
e Pe
riod:
10/
30/2
014
- 09
/30/
2019
100 80 60 40 20 0
09/19
03/19
03/18
03/17
03/16
03/15
Nor
th A
mer
ica
%La
tin A
mer
ica
%U
nite
d Ki
ngdo
m %
Euro
pe d
ev %
Euro
pe e
mrg
%Af
rica/
Mid
dle
East
%
Asia
%
Sect
or D
istrib
utio
n
Tim
e Pe
riod:
10/
30/2
014
- 09
/30/
2019
100 80 60 40 20 0
09/19
03/19
03/18
03/17
03/16
03/15
Tech
nolo
gyCo
mm
unic
atio
n Se
rvic
esCo
nsum
er C
yclic
al
Cons
umer
Def
ensi
veO
ther
Styl
e An
alys
is
Small - Large
2 1 0 -1 -2
Valu
e -
Gro
wth
21
0-1
-21 0 -1
-11
0
Smal
l Gro
wth
Smal
l Val
ue
Mid
Gro
wth
Mid
Val
ue
Top
Gro
wth
Top
Valu
e
Risk
/Ret
urn
vs P
eer G
roup
Standard Deviation
14 13 12 11 10 9 8 7 6 5 4 3 2 1 010
yea
rs5
year
s3
year
s1
year
YTD
Sharpe Ratio
3 2 1 0 -110
yea
rs5
year
s3
year
s1
year
YTD
Information Ratio
2 1 0 -1 -2 -3 -410
yea
rs5
year
s3
year
s1
year
YTD
Putn
am D
ynam
ic A
sset
Allo
catio
n Ba
l YD
J US
Mod
erat
e TR
USD
Fund
Bas
ics
Tick
erPA
BYX
Cate
gory
Allo
catio
n--5
0% to
70%
Equ
ity
Net
Ass
ets(
This
Cla
ss $
mn)
2,74
0 m
Net
Ass
ets(
All C
lass
es $
mn)
0 m
Man
ager
Robe
rt S
choe
n
Man
ager
Ten
ure
17.3
3
Fund
Ince
ptio
nFe
b 07
,199
4
Fee
And
Expe
nses
Expe
nse
Ratio
0.72
Gro
ss E
xpen
se R
atio
0.72
Pros
pect
us N
et E
xpen
se R
atio
0.72
Pros
pect
us G
ross
Exp
ense
Rat
io0.
72
Actu
al 1
2b1
0.00
Man
agem
ent F
ee0.
52
Top
10 H
oldi
ngs
(%)
US
10 Y
ear N
ote
(CBT
) S...
-8.1
7
Cgpu
tql2
R U
s000
3m P
11.
..5.
02
US
5 Ye
ar N
ote
(CBT
) Se.
..4.
72
Ru10
intr
P U
s000
3m R
11.
..-4
.39
E-m
ini R
usse
ll 20
00 In
d...
4.06
2 Ye
ar U
S Tr
easu
ry N
ote.
..3.
91
US
Ultr
a Bo
nd (C
BT) S
ept1
92.
11
Gov
ernm
ent N
atio
nal M
or...
1.92
Alph
abet
Inc
A1.
69
E-m
ini S
&P
500
Sept
19-1
.54
Cum
ulat
ive
Perf
orm
ance
Tim
e Pe
riod:
01/
30/2
014
- 09
/30/
2019
Growth of $100
152
146
139
133
127
121
115
108
102 96 90
09/1
901
/19
07/1
801
/18
07/1
701
/17
07/1
601
/16
07/1
509
/14
Putn
am D
ynam
ic A
sset
Allo
catio
n Ba
l Y
DJ U
S M
oder
ate
TR U
SD
Gro
wth
of $
100
is c
alcu
late
d at
NAV
and
ass
umes
that
all
divi
dend
and
cap
ital g
ain
dist
ribut
ions
wer
e re
inve
sted
.It
does
not
take
into
acc
ount
sal
es c
harg
es o
r the
effe
ct o
f tax
es. R
esul
ts a
re n
ot in
dica
tive
of fu
ture
perf
orm
ance
.
Pag
e 59
|
115

PUTN
AM D
YNAM
IC A
SSET
ALL
OCA
TIO
N G
R Y
| FUN
D FA
CT S
HEET
For P
lan
Spon
sor U
se O
nly
Com
mun
ity A
ctio
n Pa
rtne
rshi
p ER
ISA
403(
b) In
vest
men
t Rev
iew
| Pe
riod
Endi
ng 0
9/30
/201
9
IPS
Scor
eRe
turn
1Yr
Retu
rn3Y
rRe
turn
5Yr
Shar
pe3Y
rSh
arpe
5Yr
Info
Ratio
3Yr
Info
Ratio
5Yr
Man
ager
Tenu
reEx
pens
eRa
tioSt
yle
Cons
isten
cy(R
BSA)
Up/
Dow
nCa
ptur
e5Y
r
82 Pass
ing
Crite
ria S
corin
g-0
.99%
8.49
%6.
82%
0.68
0.59
0.00
0.02
17.3
30.
82%
7.33
0.97
Peer
Gro
up S
corin
g1.3
3%7.5
5%5.6
7%0.
640.
52-0
.31
-0.3
69.
661.1
8%9.
130.
94
Crite
ria P
eer R
anki
ng82
2922
4740
2922
929
3643
Inve
stm
ent S
trat
egy
The
inve
stm
ent s
eeks
cap
ital a
ppre
ciat
ion.
The
fund
allo
cate
s 65
% to
95%
of i
ts a
sset
s in
equ
ities
and
5%
to 3
5% in
fixe
d in
com
e se
curit
ies.
It in
vest
s m
ainl
y in
equ
ity s
ecur
ities
(gro
wth
or v
alue
sto
cks
orbo
th) o
f bot
h U
.S. a
nd fo
reig
n co
mp a
nies
of a
ny s
ize.
The
fund
als
o in
vest
s, to
a le
sser
ext
ent,
in fi
xed-
inco
me
inve
stm
ents
, inc
ludi
ng U
.S. a
nd fo
reig
n go
vern
men
t obl
igat
ions
, cor
pora
te o
blig
atio
ns a
ndse
curit
ized
deb
t ins
trum
ents
(suc
h as
mor
tgag
e-ba
cked
inve
stm
ents
).
Man
ager
Vs
Benc
hmar
k Pe
rfor
man
ce
18 16 14 12 10 8 6 4 2 0 -210
Yea
rs5
Year
s3
Year
s1
Year
YTD
25 20 15 10 5 0 -5 -10
-15
5 Ye
ars
3 Ye
ars
1 Ye
arYT
D
25 20 15 10 5 0 -5 -10
-15
2015
2016
2017
2018
YTD
40 20 0
-20
2014
2015
2016
2017
2018
YTD
Putn
am D
ynam
ic A
sset
Allo
catio
n G
r YD
J Mod
erat
ely
Aggr
essi
ve T
R U
SD
Inve
stm
ent N
ame
Annu
aliz
ed R
etur
nsCa
lend
ar Y
ear R
etur
ns
Last
Qtr
YTD
1 Yea
r3
Year
5Yea
r10
Yea
rIT
DIn
cept
ion
Dat
e20
1820
1720
1620
1520
14
Putn
am D
ynam
ic A
sset
Allo
catio
n G
r Y0.
00%
14.2
5%(0
.99%
)8.
49%
6.82
%9.
60%
7.90
%02
/08/
1994
(9.4
1%)
20.0
8%8.
14%
(0.0
6%)
9.26
%
DJ M
oder
ately
Agg
ress
ive T
R US
D0.
08%
14.6
9%2.0
6%8.
49%
6.77
%8.
84%
--
(7.3
3%)
19.0
8%9.
31%
(1.89
%)
5.90%
Mor
ning
star A
lloca
tion-
-70%
to 8
5% E
quity
0.53
%14
.33%
1.33%
7.55%
5.67%
8.26
%-
-(7
.82%
)16
.38%
8.29
%(2
.69%
)5.4
9%
Mor
ning
star
Rat
ing:
***
*
The
perfo
rman
ce d
ata
quot
ed re
pres
ents
pas
t per
form
ance
. Pas
t per
form
ance
doe
s no
t gua
rant
ee fu
ture
resu
lts. I
nves
tmen
t ret
urn
and
prin
cipal
val
ue w
ill flu
ctua
te so
that
an
inve
stor's
shar
es, w
hen
rede
emed
, may
be
worth
mor
e or
less
than
their
orig
inal
cost.
Cur
rent
per
form
ance
may
be
lowe
r or h
ighe
r tha
n th
e pe
rform
ance
info
rmat
ion
quot
ed. T
he p
erfo
rman
ce q
uote
d re
flect
s the
rein
vestm
ent o
f divi
dend
s and
capi
tal g
ains
and
isne
t of a
ll ex
pens
es. T
o ob
tain
curre
nt m
onth
-end
per
form
ance
info
rmat
ion,
plea
se co
ntac
t the
pho
ne n
umbe
r loc
ated
in th
e "Im
porta
nt D
isclo
sure
s" se
ctio
n of
this
repo
rt. F
or so
urce
info
rmat
ion,
plea
se se
e th
e "Im
porta
ntDi
sclo
sure
s" se
ctio
n of
this
repo
rt. P
lease
see
furth
er d
etai
ls on
the
scor
ing
met
hodo
logy
in th
e "In
vestm
ent S
corin
g M
etho
dolo
gy" s
ectio
n of
this
repo
rt.Pe
er g
roup
s ba
sed
on M
orni
ngst
ar c
ateg
ory.
Fund
rank
ings
are
bas
ed o
n tr
ailin
g to
tal r
etur
ns, i
nclu
ding
rein
vest
men
t of d
ivid
ends
and
cap
ital g
ains
. Fun
ds a
re ra
nked
bet
wee
n 1
and
100,
with
1 b
eing
the
top
perc
entil
e an
d 10
0 be
ing
the
bott
om p
erce
ntile
. The
rank
ing
is fo
r the
indi
cate
d sh
are
clas
s; ot
her s
hare
cla
sses
may
hav
e a
diffe
rent
per
form
ance
rank
ing.
Pag
e 60
|
116

PUTN
AM D
YNAM
IC A
SSET
ALL
OCA
TIO
N G
R Y
| FUN
D FA
CT S
HEET
For P
lan
Spon
sor U
se O
nly
Com
mun
ity A
ctio
n Pa
rtne
rshi
p ER
ISA
403(
b) In
vest
men
t Rev
iew
| Pe
riod
Endi
ng 0
9/30
/201
9
Port
folio
Com
posit
ion
Tim
e Pe
riod:
10/
30/2
014
- 09
/30/
2019
100% 80%
60%
40%
20% 0%
09/19
03/19
03/18
03/17
03/16
03/15
Stoc
kBo
ndCa
shO
ther
Bond
Dist
ribut
ion
Tim
e Pe
riod:
10/
30/2
014
- 09
/30/
2019
100 80 60 40 20 0
09/19
03/19
03/18
03/17
03/16
03/15
Dom
estic
Bon
dFo
reig
n Bo
ndPr
efer
red
Stoc
ks
Conv
ertib
le B
ond
Oth
er
Equi
ty R
egio
nal D
istrib
utio
n
Tim
e Pe
riod:
10/
30/2
014
- 09
/30/
2019
100 80 60 40 20 0
09/19
03/19
03/18
03/17
03/16
03/15
Nor
th A
mer
ica
%La
tin A
mer
ica
%U
nite
d Ki
ngdo
m %
Euro
pe d
ev %
Euro
pe e
mrg
%Af
rica/
Mid
dle
East
%
Asia
%
Sect
or D
istrib
utio
n
Tim
e Pe
riod:
10/
30/2
014
- 09
/30/
2019
100 80 60 40 20 0
09/19
03/19
03/18
03/17
03/16
03/15
Tech
nolo
gyCo
mm
unic
atio
n Se
rvic
esCo
nsum
er C
yclic
al
Cons
umer
Def
ensi
veO
ther
Styl
e An
alys
is
Small - Large
2 1 0 -1 -2
Valu
e -
Gro
wth
21
0-1
-21 0 -1
-11
0
Smal
l Gro
wth
Smal
l Val
ue
Mid
Gro
wth
Mid
Val
ue
Top
Gro
wth
Top
Valu
e
Risk
/Ret
urn
vs P
eer G
roup
Standard Deviation
20 18 16 14 12 10 8 6 4 2 010
yea
rs5
year
s3
year
s1
year
YTD
Sharpe Ratio
2 1 0 -110
yea
rs5
year
s3
year
s1
year
YTD
Information Ratio
2 1 0 -1 -2 -310
yea
rs5
year
s3
year
s1
year
YTD
Putn
am D
ynam
ic A
sset
Allo
catio
n G
r YD
J Mod
erat
ely
Aggr
essi
ve T
R U
SD
Fund
Bas
ics
Tick
erPA
GYX
Cate
gory
Allo
catio
n--7
0% to
85%
Equ
ity
Net
Ass
ets(
This
Cla
ss $
mn)
2,77
7 m
Net
Ass
ets(
All C
lass
es $
mn)
0 m
Man
ager
Robe
rt S
choe
n
Man
ager
Ten
ure
17.3
3
Fund
Ince
ptio
nFe
b 08
,199
4
Fee
And
Expe
nses
Expe
nse
Ratio
0.82
Gro
ss E
xpen
se R
atio
0.82
Pros
pect
us N
et E
xpen
se R
atio
0.82
Pros
pect
us G
ross
Exp
ense
Rat
io0.
82
Actu
al 1
2b1
0.00
Man
agem
ent F
ee0.
59
Top
10 H
oldi
ngs
(%)
US
10 Y
ear N
ote
(CBT
) S...
-8.8
0
Cgpu
tql2
R U
s000
3m P
11.
..5.
12
E-m
ini R
usse
ll 20
00 In
d...
4.88
E-m
ini S
&P
500
Sept
194.
81
Ru10
intr
P U
s000
3m R
11.
..-4
.47
E-m
ini S
&P
400
Sept
192.
19
Alph
abet
Inc
A1.
76
JPM
orga
n Ch
ase
& C
o1.
39
Amaz
on.c
om In
c1.
37
Cisc
o Sy
stem
s In
c1.
16
Cum
ulat
ive
Perf
orm
ance
Tim
e Pe
riod:
01/
30/2
014
- 09
/30/
2019
Growth of $100
150
144
137
131
124
118
111
105 98 92 85
09/1
901
/19
07/1
801
/18
07/1
701
/17
07/1
601
/16
07/1
509
/14
Putn
am D
ynam
ic A
sset
Allo
catio
n G
r Y
DJ M
oder
atel
y Ag
gres
sive
TR
USD
Gro
wth
of $
100
is c
alcu
late
d at
NAV
and
ass
umes
that
all
divi
dend
and
cap
ital g
ain
dist
ribut
ions
wer
e re
inve
sted
.It
does
not
take
into
acc
ount
sal
es c
harg
es o
r the
effe
ct o
f tax
es. R
esul
ts a
re n
ot in
dica
tive
of fu
ture
perf
orm
ance
.
Pag
e 61
|
117
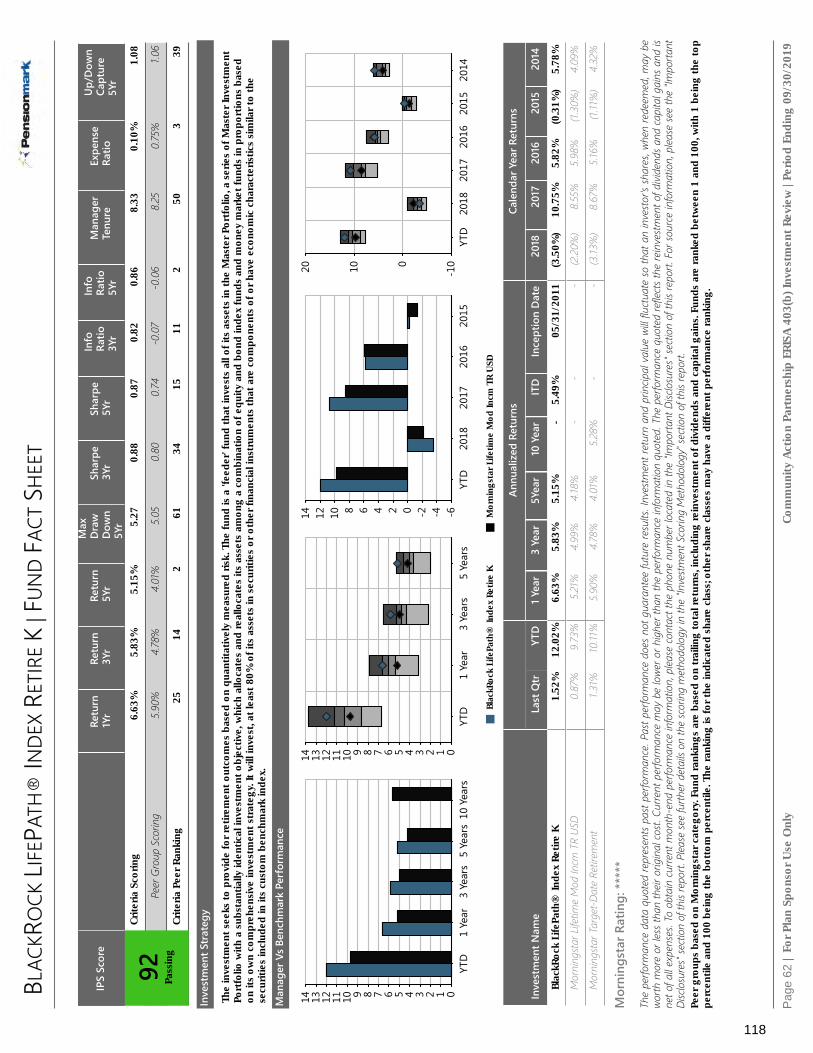
BLAC
KRO
CK LI
FEPA
TH®
INDE
X RE
TIRE
K |
FUN
D FA
CT S
HEET
For P
lan
Spon
sor U
se O
nly
Com
mun
ity A
ctio
n Pa
rtne
rshi
p ER
ISA
403(
b) In
vest
men
t Rev
iew
| Pe
riod
Endi
ng 0
9/30
/201
9
IPS
Scor
eRe
turn
1Yr
Retu
rn3Y
rRe
turn
5Yr
Max
Dra
wD
own
5Yr
Shar
pe3Y
rSh
arpe
5Yr
Info
Ratio
3Yr
Info
Ratio
5Yr
Man
ager
Tenu
reEx
pens
eRa
tioU
p/D
own
Capt
ure
5Yr
92 Pass
ing
Crite
ria S
corin
g6.
63%
5.83
%5.
15%
5.27
0.88
0.87
0.82
0.86
8.33
0.10
%1.
08
Peer
Gro
up S
corin
g5.9
0%4.
78%
4.01
%5.0
50.
800.
74-0
.07
-0.0
68.
250.
75%
1.06
Crite
ria P
eer R
anki
ng25
142
6134
1511
250
339
Inve
stm
ent S
trat
egy
The
inve
stm
ent s
eeks
to p
rovi
de fo
r ret
irem
ent o
utco
mes
bas
ed o
n qu
antit
ativ
ely
mea
sure
d ris
k. T
he fu
nd is
a 'f
eede
r' fu
nd th
at in
vest
s al
l of i
ts a
sset
s in
the
Mas
ter P
ortf
olio
, a s
erie
s of
Mas
ter I
nves
tmen
tPo
rtfo
lio w
ith a
sub
stan
tially
iden
tical
inve
stm
ent o
bjec
tive,
whi
ch a
lloca
tes
and
real
loca
tes
its a
sset
s am
ong
a co
mbi
natio
n of
equ
ity a
nd b
ond
inde
x fu
nds
and
mon
ey m
arke
t fun
ds in
pro
port
ions
bas
edon
its
own
com
preh
ensi
ve in
vest
men
t str
ateg
y. It
will
inve
st, a
t lea
st 8
0% o
f its
ass
ets
in s
ecur
ities
or o
ther
fina
ncia
l ins
trum
ents
that
are
com
pone
nts
of o
r hav
e ec
onom
ic c
hara
cter
istic
s si
mila
r to
the
secu
ritie
s in
clud
ed in
its
cust
om b
ench
mar
k in
dex.
Man
ager
Vs
Benc
hmar
k Pe
rfor
man
ce
14 13 12 11 10 9 8 7 6 5 4 3 2 1 010
Yea
rs5
Year
s3
Year
s1
Year
YTD
14 13 12 11 10 9 8 7 6 5 4 3 2 1 05
Year
s3
Year
s1
Year
YTD
14 12 10 8 6 4 2 0 -2 -4 -62015
2016
2017
2018
YTD
20 10 0
-10
2014
2015
2016
2017
2018
YTD
Blac
kRoc
k Li
fePa
th®
Inde
x Re
tire
KM
orni
ngst
ar L
ifetim
e M
od In
cm T
R U
SD
Inve
stm
ent N
ame
Annu
aliz
ed R
etur
nsCa
lend
ar Y
ear R
etur
ns
Last
Qtr
YTD
1 Yea
r3
Year
5Yea
r10
Yea
rIT
DIn
cept
ion
Dat
e20
1820
1720
1620
1520
14
Blac
kRoc
k Li
fePa
th®
Inde
x Re
tire
K1.
52%
12.0
2%6.
63%
5.83
%5.
15%
-5.
49%
05/3
1/20
11(3
.50%
)10
.75%
5.82
%(0
.31%
)5.
78%
Mor
ning
star L
ifetim
e M
od In
cm T
R US
D0.
87%
9.73
%5.2
1%4.
99%
4.18
%-
--
(2.20
%)
8.55
%5.9
8%(1.
30%
)4.
09%
Mor
ning
star T
arge
t-Dat
e Re
tirem
ent
1.31%
10.11
%5.9
0%4.
78%
4.01
%5.2
8%-
-(3
.13%
)8.
67%
5.16%
(1.11
%)
4.32
%
Mor
ning
star
Rat
ing:
***
**
The
perfo
rman
ce d
ata
quot
ed re
pres
ents
pas
t per
form
ance
. Pas
t per
form
ance
doe
s no
t gua
rant
ee fu
ture
resu
lts. I
nves
tmen
t ret
urn
and
prin
cipal
val
ue w
ill flu
ctua
te so
that
an
inve
stor's
shar
es, w
hen
rede
emed
, may
be
worth
mor
e or
less
than
their
orig
inal
cost.
Cur
rent
per
form
ance
may
be
lowe
r or h
ighe
r tha
n th
e pe
rform
ance
info
rmat
ion
quot
ed. T
he p
erfo
rman
ce q
uote
d re
flect
s the
rein
vestm
ent o
f divi
dend
s and
capi
tal g
ains
and
isne
t of a
ll ex
pens
es. T
o ob
tain
curre
nt m
onth
-end
per
form
ance
info
rmat
ion,
plea
se co
ntac
t the
pho
ne n
umbe
r loc
ated
in th
e "Im
porta
nt D
isclo
sure
s" se
ctio
n of
this
repo
rt. F
or so
urce
info
rmat
ion,
plea
se se
e th
e "Im
porta
ntDi
sclo
sure
s" se
ctio
n of
this
repo
rt. P
lease
see
furth
er d
etai
ls on
the
scor
ing
met
hodo
logy
in th
e "In
vestm
ent S
corin
g M
etho
dolo
gy" s
ectio
n of
this
repo
rt.Pe
er g
roup
s ba
sed
on M
orni
ngst
ar c
ateg
ory.
Fund
rank
ings
are
bas
ed o
n tr
ailin
g to
tal r
etur
ns, i
nclu
ding
rein
vest
men
t of d
ivid
ends
and
cap
ital g
ains
. Fun
ds a
re ra
nked
bet
wee
n 1
and
100,
with
1 b
eing
the
top
perc
entil
e an
d 10
0 be
ing
the
bott
om p
erce
ntile
. The
rank
ing
is fo
r the
indi
cate
d sh
are
clas
s; ot
her s
hare
cla
sses
may
hav
e a
diffe
rent
per
form
ance
rank
ing.
Pag
e 62
|
118

BLAC
KRO
CK LI
FEPA
TH®
INDE
X RE
TIRE
K |
FUN
D FA
CT S
HEET
For P
lan
Spon
sor U
se O
nly
Com
mun
ity A
ctio
n Pa
rtne
rshi
p ER
ISA
403(
b) In
vest
men
t Rev
iew
| Pe
riod
Endi
ng 0
9/30
/201
9
Hist
oric
al G
lidep
ath
Tim
e Pe
riod:
10/
30/2
014
- 09
/30/
2019
100% 80%
60%
40%
20% 0%
09/19
03/19
03/18
03/17
03/16
03/15
Stoc
kBo
ndCa
shO
ther
Equi
ty R
egio
nal D
istrib
utio
n
Tim
e Pe
riod:
10/
30/2
014
- 09
/30/
2019
100 80 60 40 20 0
09/19
03/19
03/18
03/17
03/16
03/15
Nor
th A
mer
ica
%La
tin A
mer
ica
%U
nite
d Ki
ngdo
m %
Euro
pe d
ev %
Euro
pe e
mrg
%Af
rica/
Mid
dle
East
%
Asia
%
Sect
or D
istrib
utio
n
Tim
e Pe
riod:
10/
30/2
014
- 09
/30/
2019
100 80 60 40 20 0
09/19
03/19
03/18
03/17
03/16
03/15
Tech
nolo
gyCo
mm
unic
atio
n Se
rvic
esCo
nsum
er C
yclic
al
Cons
umer
Def
ensi
veO
ther
Bond
Dist
ribut
ion
Tim
e Pe
riod:
10/
30/2
014
- 09
/30/
2019
100 80 60 40 20 0
09/19
03/19
03/18
03/17
03/16
03/15
Dom
estic
Bon
dFo
reig
n Bo
ndPr
efer
red
Stoc
ks
Conv
ertib
le B
ond
Oth
er
Risk
/Ret
urn
vs P
eer G
roup
Standard Deviation
9 8 7 6 5 4 3 2 1 010
yea
rs5
year
s3
year
s1
year
YTD
Sharpe Ratio
3 2 1 05
year
s3
year
s1
year
YTD
Information Ratio
3 2 1 0 -15
year
s3
year
s1
year
YTD
Blac
kRoc
k Li
fePa
th®
Inde
x Re
tire
KM
orni
ngst
ar L
ifetim
e M
od In
cm T
R U
SD
Fund
Bas
ics
Tick
erLI
RKX
Cate
gory
Targ
et-D
ate
Retir
emen
t
Net
Ass
ets(
This
Cla
ss $
mn)
2,62
6 m
Net
Ass
ets(
All C
lass
es $
mn)
0 m
Man
ager
Alan
Mas
on
Man
ager
Ten
ure
8.33
Fund
Ince
ptio
nM
ay 3
1,20
11
Fee
And
Expe
nses
Expe
nse
Ratio
0.09
Gro
ss E
xpen
se R
atio
0.14
Pros
pect
us N
et E
xpen
se R
atio
0.10
Pros
pect
us G
ross
Exp
ense
Rat
io0.
16
Actu
al 1
2b1
0.00
Man
agem
ent F
ee0.
05
Cum
ulat
ive
Perf
orm
ance
Tim
e Pe
riod:
01/
30/2
014
- 09
/30/
2019
Growth of $100
139
139
134
128
123
118
113
108
103 98 93 88
09/1
901
/19
07/1
801
/18
07/1
701
/17
07/1
601
/16
07/1
509
/14
Blac
kRoc
k Li
fePa
th®
Inde
x Re
tire
KM
orni
ngst
ar L
ifetim
e M
od In
cm T
R U
SD
Gro
wth
of $
100
is c
alcu
late
d at
NAV
and
ass
umes
that
all
divi
dend
and
cap
ital g
ain
dist
ribut
ions
wer
e re
inve
sted
. It d
oes
not t
ake
into
acc
ount
sal
esch
arge
s or
the
effe
ct o
f tax
es. R
esul
ts a
re n
ot in
dica
tive
of fu
ture
per
form
ance
.
Pag
e 63
|
119
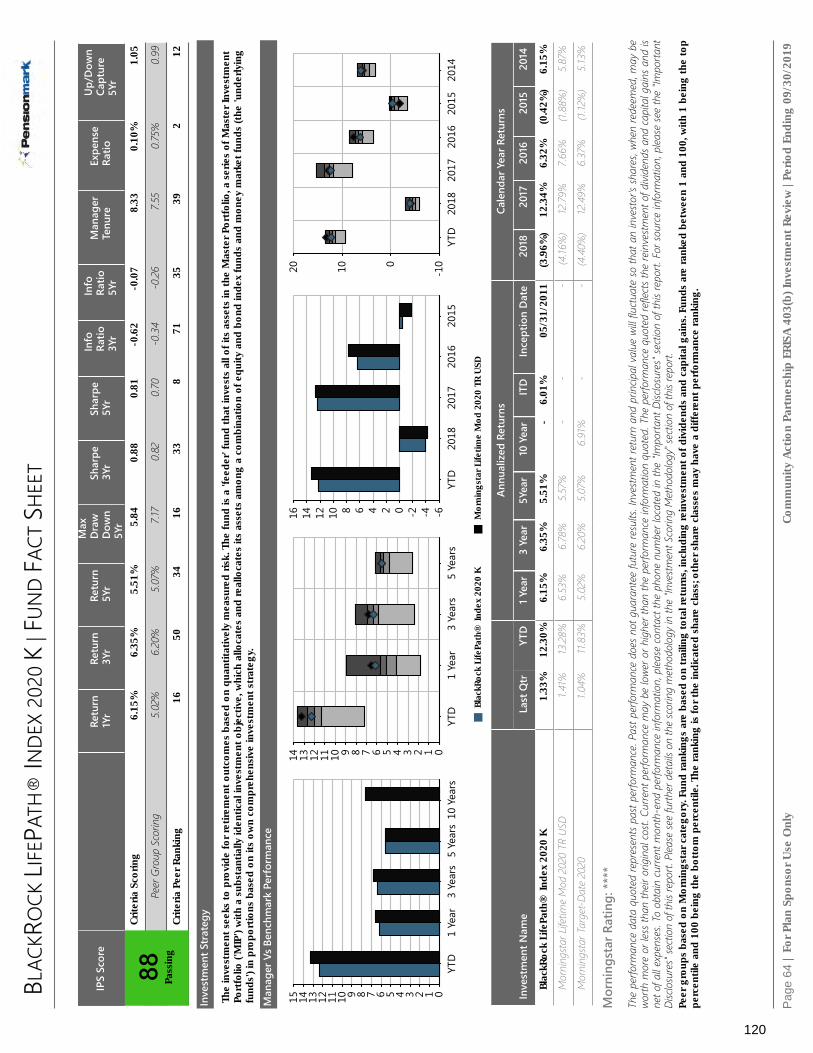
BLAC
KRO
CK LI
FEPA
TH®
INDE
X 20
20 K
| FU
ND
FACT
SHE
ET
For P
lan
Spon
sor U
se O
nly
Com
mun
ity A
ctio
n Pa
rtne
rshi
p ER
ISA
403(
b) In
vest
men
t Rev
iew
| Pe
riod
Endi
ng 0
9/30
/201
9
IPS
Scor
eRe
turn
1Yr
Retu
rn3Y
rRe
turn
5Yr
Max
Dra
wD
own
5Yr
Shar
pe3Y
rSh
arpe
5Yr
Info
Ratio
3Yr
Info
Ratio
5Yr
Man
ager
Tenu
reEx
pens
eRa
tioU
p/D
own
Capt
ure
5Yr
88 Pass
ing
Crite
ria S
corin
g6.
15%
6.35
%5.
51%
5.84
0.88
0.81
-0.6
2-0
.07
8.33
0.10
%1.
05
Peer
Gro
up S
corin
g5.0
2%6.
20%
5.07%
7.17
0.82
0.70
-0.3
4-0
.267.5
50.
75%
0.99
Crite
ria P
eer R
anki
ng16
5034
1633
871
3539
212
Inve
stm
ent S
trat
egy
The
inve
stm
ent s
eeks
to p
rovi
de fo
r ret
irem
ent o
utco
mes
bas
ed o
n qu
antit
ativ
ely
mea
sure
d ris
k. T
he fu
nd is
a 'f
eede
r' fu
nd th
at in
vest
s al
l of i
ts a
sset
s in
the
Mas
ter P
ortf
olio
, a s
erie
s of
Mas
ter I
nves
tmen
tPo
rtfo
lio ('
MIP
') w
ith a
sub
stan
tially
iden
tical
inve
stm
ent o
bjec
tive,
whi
ch a
lloca
tes
and
real
loca
tes
its a
sset
s am
ong
a co
mbi
natio
n of
equ
ity a
nd b
ond
inde
x fu
nds
and
mon
ey m
arke
t fun
ds (t
he 'u
nder
lyin
gfu
nds'
) in
prop
ortio
ns b
ased
on
its o
wn
com
preh
ensi
ve in
vest
men
t str
ateg
y.
Man
ager
Vs
Benc
hmar
k Pe
rfor
man
ce
15 14 13 12 11 10 9 8 7 6 5 4 3 2 1 010
Yea
rs5
Year
s3
Year
s1
Year
YTD
14 13 12 11 10 9 8 7 6 5 4 3 2 1 05
Year
s3
Year
s1
Year
YTD
16 14 12 10 8 6 4 2 0 -2 -4 -62015
2016
2017
2018
YTD
20 10 0
-10
2014
2015
2016
2017
2018
YTD
Blac
kRoc
k Li
fePa
th®
Inde
x 20
20 K
Mor
ning
star
Life
time
Mod
202
0 TR
USD
Inve
stm
ent N
ame
Annu
aliz
ed R
etur
nsCa
lend
ar Y
ear R
etur
ns
Last
Qtr
YTD
1 Yea
r3
Year
5Yea
r10
Yea
rIT
DIn
cept
ion
Dat
e20
1820
1720
1620
1520
14
Blac
kRoc
k Li
fePa
th®
Inde
x 20
20 K
1.33
%12
.30%
6.15
%6.
35%
5.51
%-
6.01
%05
/31/
2011
(3.9
6%)
12.3
4%6.
32%
(0.4
2%)
6.15
%
Mor
ning
star L
ifetim
e M
od 2
020
TR U
SD1.4
1%13
.28%
6.53
%6.
78%
5.57%
--
-(4
.16%
)12
.79%
7.66%
(1.88
%)
5.87%
Mor
ning
star T
arge
t-Dat
e 20
201.0
4%11
.83%
5.02%
6.20
%5.0
7%6.
91%
--
(4.4
0%)
12.4
9%6.
37%
(1.12
%)
5.13%
Mor
ning
star
Rat
ing:
***
*
The
perfo
rman
ce d
ata
quot
ed re
pres
ents
pas
t per
form
ance
. Pas
t per
form
ance
doe
s no
t gua
rant
ee fu
ture
resu
lts. I
nves
tmen
t ret
urn
and
prin
cipal
val
ue w
ill flu
ctua
te so
that
an
inve
stor's
shar
es, w
hen
rede
emed
, may
be
worth
mor
e or
less
than
their
orig
inal
cost.
Cur
rent
per
form
ance
may
be
lowe
r or h
ighe
r tha
n th
e pe
rform
ance
info
rmat
ion
quot
ed. T
he p
erfo
rman
ce q
uote
d re
flect
s the
rein
vestm
ent o
f divi
dend
s and
capi
tal g
ains
and
isne
t of a
ll ex
pens
es. T
o ob
tain
curre
nt m
onth
-end
per
form
ance
info
rmat
ion,
plea
se co
ntac
t the
pho
ne n
umbe
r loc
ated
in th
e "Im
porta
nt D
isclo
sure
s" se
ctio
n of
this
repo
rt. F
or so
urce
info
rmat
ion,
plea
se se
e th
e "Im
porta
ntDi
sclo
sure
s" se
ctio
n of
this
repo
rt. P
lease
see
furth
er d
etai
ls on
the
scor
ing
met
hodo
logy
in th
e "In
vestm
ent S
corin
g M
etho
dolo
gy" s
ectio
n of
this
repo
rt.Pe
er g
roup
s ba
sed
on M
orni
ngst
ar c
ateg
ory.
Fund
rank
ings
are
bas
ed o
n tr
ailin
g to
tal r
etur
ns, i
nclu
ding
rein
vest
men
t of d
ivid
ends
and
cap
ital g
ains
. Fun
ds a
re ra
nked
bet
wee
n 1
and
100,
with
1 b
eing
the
top
perc
entil
e an
d 10
0 be
ing
the
bott
om p
erce
ntile
. The
rank
ing
is fo
r the
indi
cate
d sh
are
clas
s; ot
her s
hare
cla
sses
may
hav
e a
diffe
rent
per
form
ance
rank
ing.
Pag
e 64
|
120

BLAC
KRO
CK LI
FEPA
TH®
INDE
X 20
20 K
| FU
ND
FACT
SHE
ET
For P
lan
Spon
sor U
se O
nly
Com
mun
ity A
ctio
n Pa
rtne
rshi
p ER
ISA
403(
b) In
vest
men
t Rev
iew
| Pe
riod
Endi
ng 0
9/30
/201
9
Hist
oric
al G
lidep
ath
Tim
e Pe
riod:
10/
30/2
014
- 09
/30/
2019
100% 80%
60%
40%
20% 0%
09/19
03/19
03/18
03/17
03/16
03/15
Stoc
kBo
ndCa
shO
ther
Equi
ty R
egio
nal D
istrib
utio
n
Tim
e Pe
riod:
10/
30/2
014
- 09
/30/
2019
100 80 60 40 20 0
09/19
03/19
03/18
03/17
03/16
03/15
Nor
th A
mer
ica
%La
tin A
mer
ica
%U
nite
d Ki
ngdo
m %
Euro
pe d
ev %
Euro
pe e
mrg
%Af
rica/
Mid
dle
East
%
Asia
%
Sect
or D
istrib
utio
n
Tim
e Pe
riod:
10/
30/2
014
- 09
/30/
2019
100 80 60 40 20 0
09/19
03/19
03/18
03/17
03/16
03/15
Tech
nolo
gyCo
mm
unic
atio
n Se
rvic
esCo
nsum
er C
yclic
al
Cons
umer
Def
ensi
veO
ther
Bond
Dist
ribut
ion
Tim
e Pe
riod:
10/
30/2
014
- 09
/30/
2019
100 80 60 40 20 0
09/19
03/19
03/18
03/17
03/16
03/15
Dom
estic
Bon
dFo
reig
n Bo
ndPr
efer
red
Stoc
ks
Conv
ertib
le B
ond
Oth
er
Risk
/Ret
urn
vs P
eer G
roup
Standard Deviation
10 9 8 7 6 5 4 3 2 1 010
yea
rs5
year
s3
year
s1
year
YTD
Sharpe Ratio
3 2 1 05
year
s3
year
s1
year
YTD
Information Ratio
2 1 0 -1 -25
year
s3
year
s1
year
YTD
Blac
kRoc
k Li
fePa
th®
Inde
x 20
20 K
Mor
ning
star
Life
time
Mod
202
0 TR
USD
Fund
Bas
ics
Tick
erLI
MKX
Cate
gory
Targ
et-D
ate
2020
Net
Ass
ets(
This
Cla
ss $
mn)
4,89
2 m
Net
Ass
ets(
All C
lass
es $
mn)
0 m
Man
ager
Alan
Mas
on
Man
ager
Ten
ure
8.33
Fund
Ince
ptio
nM
ay 3
1,20
11
Fee
And
Expe
nses
Expe
nse
Ratio
0.09
Gro
ss E
xpen
se R
atio
0.13
Pros
pect
us N
et E
xpen
se R
atio
0.10
Pros
pect
us G
ross
Exp
ense
Rat
io0.
15
Actu
al 1
2b1
0.00
Man
agem
ent F
ee0.
05
Cum
ulat
ive
Perf
orm
ance
Tim
e Pe
riod:
01/
30/2
014
- 09
/30/
2019
Growth of $100
141
136
130
125
119
114
109
103 98 92 87
09/1
901
/19
07/1
801
/18
07/1
701
/17
07/1
601
/16
07/1
509
/14
Blac
kRoc
k Li
fePa
th®
Inde
x 20
20 K
Mor
ning
star
Life
time
Mod
202
0 TR
USD
Gro
wth
of $
100
is c
alcu
late
d at
NAV
and
ass
umes
that
all
divi
dend
and
cap
ital g
ain
dist
ribut
ions
wer
e re
inve
sted
. It d
oes
not t
ake
into
acc
ount
sal
esch
arge
s or
the
effe
ct o
f tax
es. R
esul
ts a
re n
ot in
dica
tive
of fu
ture
per
form
ance
.
Pag
e 65
|
121

BLAC
KRO
CK LI
FEPA
TH®
INDE
X 20
25 K
| FU
ND
FACT
SHE
ET
For P
lan
Spon
sor U
se O
nly
Com
mun
ity A
ctio
n Pa
rtne
rshi
p ER
ISA
403(
b) In
vest
men
t Rev
iew
| Pe
riod
Endi
ng 0
9/30
/201
9
IPS
Scor
eRe
turn
1Yr
Retu
rn3Y
rRe
turn
5Yr
Max
Dra
wD
own
5Yr
Shar
pe3Y
rSh
arpe
5Yr
Info
Ratio
3Yr
Info
Ratio
5Yr
Man
ager
Tenu
reEx
pens
eRa
tioU
p/D
own
Capt
ure
5Yr
86 Pass
ing
Crite
ria S
corin
g5.
51%
7.17
%6.
05%
7.27
0.85
0.75
-0.7
60.
028.
330.
10%
1.03
Peer
Gro
up S
corin
g4.
54%
7.01%
5.57%
8.52
0.81
0.67
-0.3
8-0
.277.1
60.
74%
0.97
Crite
ria P
eer R
anki
ng17
4527
1839
878
2634
310
Inve
stm
ent S
trat
egy
The
inve
stm
ent s
eeks
to p
rovi
de fo
r ret
irem
ent o
utco
mes
bas
ed o
n qu
antit
ativ
ely
mea
sure
d ris
k. T
he fu
nd is
a 'f
eede
r' fu
nd th
at in
vest
s al
l of i
ts a
sset
s in
the
Mas
ter P
ortf
olio
, a s
erie
s of
Mas
ter I
nves
tmen
tPo
rtfo
lio ('
MIP
') w
ith a
sub
stan
tially
iden
tical
inve
stm
ent o
bjec
tive,
whi
ch a
lloca
tes
and
real
loca
tes
its a
sset
s am
ong
a co
mbi
natio
n of
equ
ity a
nd b
ond
inde
x fu
nds
and
mon
ey m
arke
t fun
ds (t
he 'u
nder
lyin
gfu
nds'
) in
prop
ortio
ns b
ased
on
its o
wn
com
preh
ensi
ve in
vest
men
t str
ateg
y.
Man
ager
Vs
Benc
hmar
k Pe
rfor
man
ce
16 14 12 10 8 6 4 2 010
Yea
rs5
Year
s3
Year
s1
Year
YTD
15 14 13 12 11 10 9 8 7 6 5 4 3 2 1 05
Year
s3
Year
s1
Year
YTD
16 14 12 10 8 6 4 2 0 -2 -4 -62015
2016
2017
2018
YTD
20 10 0
-10
2014
2015
2016
2017
2018
YTD
Blac
kRoc
k Li
fePa
th®
Inde
x 20
25 K
Mor
ning
star
Life
time
Mod
202
5 TR
USD
Inve
stm
ent N
ame
Annu
aliz
ed R
etur
nsCa
lend
ar Y
ear R
etur
ns
Last
Qtr
YTD
1 Yea
r3
Year
5Yea
r10
Yea
rIT
DIn
cept
ion
Dat
e20
1820
1720
1620
1520
14
Blac
kRoc
k Li
fePa
th®
Inde
x 20
25 K
1.15
%13
.43%
5.51
%7.
17%
6.05
%-
6.53
%05
/31/
2011
(4.7
8%)
14.4
3%6.
87%
(0.4
5%)
6.47
%
Mor
ning
star L
ifetim
e M
od 2
025
TR U
SD1.3
8%14
.23%
6.22
%7.5
1%6.
04%
--
-(4
.90%
)14
.54%
8.39
%(2
.06%
)6.
04%
Mor
ning
star T
arge
t-Dat
e 20
250.
93%
12.9
1%4.
54%
7.01%
5.57%
7.66%
--
(5.28
%)
14.6
3%6.
86%
(1.27
%)
5.32%
Mor
ning
star
Rat
ing:
***
*
The
perfo
rman
ce d
ata
quot
ed re
pres
ents
pas
t per
form
ance
. Pas
t per
form
ance
doe
s no
t gua
rant
ee fu
ture
resu
lts. I
nves
tmen
t ret
urn
and
prin
cipal
val
ue w
ill flu
ctua
te so
that
an
inve
stor's
shar
es, w
hen
rede
emed
, may
be
worth
mor
e or
less
than
their
orig
inal
cost.
Cur
rent
per
form
ance
may
be
lowe
r or h
ighe
r tha
n th
e pe
rform
ance
info
rmat
ion
quot
ed. T
he p
erfo
rman
ce q
uote
d re
flect
s the
rein
vestm
ent o
f divi
dend
s and
capi
tal g
ains
and
isne
t of a
ll ex
pens
es. T
o ob
tain
curre
nt m
onth
-end
per
form
ance
info
rmat
ion,
plea
se co
ntac
t the
pho
ne n
umbe
r loc
ated
in th
e "Im
porta
nt D
isclo
sure
s" se
ctio
n of
this
repo
rt. F
or so
urce
info
rmat
ion,
plea
se se
e th
e "Im
porta
ntDi
sclo
sure
s" se
ctio
n of
this
repo
rt. P
lease
see
furth
er d
etai
ls on
the
scor
ing
met
hodo
logy
in th
e "In
vestm
ent S
corin
g M
etho
dolo
gy" s
ectio
n of
this
repo
rt.Pe
er g
roup
s ba
sed
on M
orni
ngst
ar c
ateg
ory.
Fund
rank
ings
are
bas
ed o
n tr
ailin
g to
tal r
etur
ns, i
nclu
ding
rein
vest
men
t of d
ivid
ends
and
cap
ital g
ains
. Fun
ds a
re ra
nked
bet
wee
n 1
and
100,
with
1 b
eing
the
top
perc
entil
e an
d 10
0 be
ing
the
bott
om p
erce
ntile
. The
rank
ing
is fo
r the
indi
cate
d sh
are
clas
s; ot
her s
hare
cla
sses
may
hav
e a
diffe
rent
per
form
ance
rank
ing.
Pag
e 66
|
122

BLAC
KRO
CK LI
FEPA
TH®
INDE
X 20
25 K
| FU
ND
FACT
SHE
ET
For P
lan
Spon
sor U
se O
nly
Com
mun
ity A
ctio
n Pa
rtne
rshi
p ER
ISA
403(
b) In
vest
men
t Rev
iew
| Pe
riod
Endi
ng 0
9/30
/201
9
Hist
oric
al G
lidep
ath
Tim
e Pe
riod:
10/
30/2
014
- 09
/30/
2019
100% 80%
60%
40%
20% 0%
09/19
03/19
03/18
03/17
03/16
03/15
Stoc
kBo
ndCa
shO
ther
Equi
ty R
egio
nal D
istrib
utio
n
Tim
e Pe
riod:
10/
30/2
014
- 09
/30/
2019
100 80 60 40 20 0
09/19
03/19
03/18
03/17
03/16
03/15
Nor
th A
mer
ica
%La
tin A
mer
ica
%U
nite
d Ki
ngdo
m %
Euro
pe d
ev %
Euro
pe e
mrg
%Af
rica/
Mid
dle
East
%
Asia
%
Sect
or D
istrib
utio
n
Tim
e Pe
riod:
10/
30/2
014
- 09
/30/
2019
100 80 60 40 20 0
09/19
03/19
03/18
03/17
03/16
03/15
Tech
nolo
gyCo
mm
unic
atio
n Se
rvic
esCo
nsum
er C
yclic
al
Cons
umer
Def
ensi
veO
ther
Bond
Dist
ribut
ion
Tim
e Pe
riod:
10/
30/2
014
- 09
/30/
2019
100 80 60 40 20 0
09/19
03/19
03/18
03/17
03/16
03/15
Dom
estic
Bon
dFo
reig
n Bo
ndPr
efer
red
Stoc
ks
Conv
ertib
le B
ond
Oth
er
Risk
/Ret
urn
vs P
eer G
roup
Standard Deviation
12 11 10 9 8 7 6 5 4 3 2 1 010
yea
rs5
year
s3
year
s1
year
YTD
Sharpe Ratio
3 2 1 05
year
s3
year
s1
year
YTD
Information Ratio
1 0 -1 -25
year
s3
year
s1
year
YTD
Blac
kRoc
k Li
fePa
th®
Inde
x 20
25 K
Mor
ning
star
Life
time
Mod
202
5 TR
USD
Fund
Bas
ics
Tick
erLI
BKX
Cate
gory
Targ
et-D
ate
2025
Net
Ass
ets(
This
Cla
ss $
mn)
4,04
1 m
Net
Ass
ets(
All C
lass
es $
mn)
0 m
Man
ager
Alan
Mas
on
Man
ager
Ten
ure
8.33
Fund
Ince
ptio
nM
ay 3
1,20
11
Fee
And
Expe
nses
Expe
nse
Ratio
0.01
Gro
ss E
xpen
se R
atio
0.12
Pros
pect
us N
et E
xpen
se R
atio
0.10
Pros
pect
us G
ross
Exp
ense
Rat
io0.
16
Actu
al 1
2b1
0.00
Man
agem
ent F
ee0.
05
Cum
ulat
ive
Perf
orm
ance
Tim
e Pe
riod:
01/
30/2
014
- 09
/30/
2019
Growth of $100
144
138
133
127
121
115
109
104 98 92 86
09/1
901
/19
07/1
801
/18
07/1
701
/17
07/1
601
/16
07/1
509
/14
Blac
kRoc
k Li
fePa
th®
Inde
x 20
25 K
Mor
ning
star
Life
time
Mod
202
5 TR
USD
Gro
wth
of $
100
is c
alcu
late
d at
NAV
and
ass
umes
that
all
divi
dend
and
cap
ital g
ain
dist
ribut
ions
wer
e re
inve
sted
. It d
oes
not t
ake
into
acc
ount
sal
esch
arge
s or
the
effe
ct o
f tax
es. R
esul
ts a
re n
ot in
dica
tive
of fu
ture
per
form
ance
.
Pag
e 67
|
123

BLAC
KRO
CK LI
FEPA
TH®
INDE
X 20
30 K
| FU
ND
FACT
SHE
ET
For P
lan
Spon
sor U
se O
nly
Com
mun
ity A
ctio
n Pa
rtne
rshi
p ER
ISA
403(
b) In
vest
men
t Rev
iew
| Pe
riod
Endi
ng 0
9/30
/201
9
IPS
Scor
eRe
turn
1Yr
Retu
rn3Y
rRe
turn
5Yr
Max
Dra
wD
own
5Yr
Shar
pe3Y
rSh
arpe
5Yr
Info
Ratio
3Yr
Info
Ratio
5Yr
Man
ager
Tenu
reEx
pens
eRa
tioU
p/D
own
Capt
ure
5Yr
88 Pass
ing
Crite
ria S
corin
g4.
98%
7.91
%6.
52%
8.47
0.83
0.71
-0.7
50.
018.
330.
10%
1.03
Peer
Gro
up S
corin
g3.
85%
7.65%
6.00
%9.
890.
790.
64-0
.46
-0.27
7.32
0.78
%0.
97
Crite
ria P
eer R
anki
ng15
4430
1432
966
3037
28
Inve
stm
ent S
trat
egy
The
inve
stm
ent s
eeks
to p
rovi
de fo
r ret
irem
ent o
utco
mes
bas
ed o
n qu
antit
ativ
ely
mea
sure
d ris
k. T
he fu
nd is
a 'f
eede
r' fu
nd th
at in
vest
s al
l of i
ts a
sset
s in
the
Mas
ter P
ortf
olio
, a s
erie
s of
Mas
ter I
nves
tmen
tPo
rtfo
lio ('
MIP
') w
ith a
sub
stan
tially
iden
tical
inve
stm
ent o
bjec
tive,
whi
ch a
lloca
tes
and
real
loca
tes
its a
sset
s am
ong
a co
mbi
natio
n of
equ
ity a
nd b
ond
inde
x fu
nds
and
mon
ey m
arke
t fun
ds (t
he 'u
nder
lyin
gfu
nds'
) in
prop
ortio
ns b
ased
on
its o
wn
com
preh
ensi
ve in
vest
men
t str
ateg
y.
Man
ager
Vs
Benc
hmar
k Pe
rfor
man
ce
18 16 14 12 10 8 6 4 2 010
Yea
rs5
Year
s3
Year
s1
Year
YTD
16 14 12 10 8 6 4 2 0 -25
Year
s3
Year
s1
Year
YTD
20 15 10 5 0 -5 -10
2015
2016
2017
2018
YTD
20 10 0
-10
2014
2015
2016
2017
2018
YTD
Blac
kRoc
k Li
fePa
th®
Inde
x 20
30 K
Mor
ning
star
Life
time
Mod
203
0 TR
USD
Inve
stm
ent N
ame
Annu
aliz
ed R
etur
nsCa
lend
ar Y
ear R
etur
ns
Last
Qtr
YTD
1 Yea
r3
Year
5Yea
r10
Yea
rIT
DIn
cept
ion
Dat
e20
1820
1720
1620
1520
14
Blac
kRoc
k Li
fePa
th®
Inde
x 20
30 K
1.02
%14
.42%
4.98
%7.
91%
6.52
%-
6.97
%05
/31/
2011
(5.5
6%)
16.3
6%7.
29%
(0.5
0%)
6.64
%
Mor
ning
star L
ifetim
e M
od 2
030
TR U
SD1.2
2%15
.11%
5.40%
8.31
%6.
50%
--
-(5
.82%
)16
.59%
9.26
%(2
.30%
)6.
01%
Mor
ning
star T
arge
t-Dat
e 20
300.
76%
13.8
3%3.
85%
7.65%
6.00
%7.9
9%-
-(6
.18%
)16
.56%
7.42%
(1.40
%)
5.46%
Mor
ning
star
Rat
ing:
***
*
The
perfo
rman
ce d
ata
quot
ed re
pres
ents
pas
t per
form
ance
. Pas
t per
form
ance
doe
s no
t gua
rant
ee fu
ture
resu
lts. I
nves
tmen
t ret
urn
and
prin
cipal
val
ue w
ill flu
ctua
te so
that
an
inve
stor's
shar
es, w
hen
rede
emed
, may
be
worth
mor
e or
less
than
their
orig
inal
cost.
Cur
rent
per
form
ance
may
be
lowe
r or h
ighe
r tha
n th
e pe
rform
ance
info
rmat
ion
quot
ed. T
he p
erfo
rman
ce q
uote
d re
flect
s the
rein
vestm
ent o
f divi
dend
s and
capi
tal g
ains
and
isne
t of a
ll ex
pens
es. T
o ob
tain
curre
nt m
onth
-end
per
form
ance
info
rmat
ion,
plea
se co
ntac
t the
pho
ne n
umbe
r loc
ated
in th
e "Im
porta
nt D
isclo
sure
s" se
ctio
n of
this
repo
rt. F
or so
urce
info
rmat
ion,
plea
se se
e th
e "Im
porta
ntDi
sclo
sure
s" se
ctio
n of
this
repo
rt. P
lease
see
furth
er d
etai
ls on
the
scor
ing
met
hodo
logy
in th
e "In
vestm
ent S
corin
g M
etho
dolo
gy" s
ectio
n of
this
repo
rt.Pe
er g
roup
s ba
sed
on M
orni
ngst
ar c
ateg
ory.
Fund
rank
ings
are
bas
ed o
n tr
ailin
g to
tal r
etur
ns, i
nclu
ding
rein
vest
men
t of d
ivid
ends
and
cap
ital g
ains
. Fun
ds a
re ra
nked
bet
wee
n 1
and
100,
with
1 b
eing
the
top
perc
entil
e an
d 10
0 be
ing
the
bott
om p
erce
ntile
. The
rank
ing
is fo
r the
indi
cate
d sh
are
clas
s; ot
her s
hare
cla
sses
may
hav
e a
diffe
rent
per
form
ance
rank
ing.
Pag
e 68
|
124

BLAC
KRO
CK LI
FEPA
TH®
INDE
X 20
30 K
| FU
ND
FACT
SHE
ET
For P
lan
Spon
sor U
se O
nly
Com
mun
ity A
ctio
n Pa
rtne
rshi
p ER
ISA
403(
b) In
vest
men
t Rev
iew
| Pe
riod
Endi
ng 0
9/30
/201
9
Hist
oric
al G
lidep
ath
Tim
e Pe
riod:
10/
30/2
014
- 09
/30/
2019
100% 80%
60%
40%
20% 0%
09/19
03/19
03/18
03/17
03/16
03/15
Stoc
kBo
ndCa
shO
ther
Equi
ty R
egio
nal D
istrib
utio
n
Tim
e Pe
riod:
10/
30/2
014
- 09
/30/
2019
100 80 60 40 20 0
09/19
03/19
03/18
03/17
03/16
03/15
Nor
th A
mer
ica
%La
tin A
mer
ica
%U
nite
d Ki
ngdo
m %
Euro
pe d
ev %
Euro
pe e
mrg
%Af
rica/
Mid
dle
East
%
Asia
%
Sect
or D
istrib
utio
n
Tim
e Pe
riod:
10/
30/2
014
- 09
/30/
2019
100 80 60 40 20 0
09/19
03/19
03/18
03/17
03/16
03/15
Tech
nolo
gyCo
mm
unic
atio
n Se
rvic
esCo
nsum
er C
yclic
al
Cons
umer
Def
ensi
veO
ther
Bond
Dist
ribut
ion
Tim
e Pe
riod:
10/
30/2
014
- 09
/30/
2019
100 80 60 40 20 0
09/19
03/19
03/18
03/17
03/16
03/15
Dom
estic
Bon
dFo
reig
n Bo
ndPr
efer
red
Stoc
ks
Conv
ertib
le B
ond
Oth
er
Risk
/Ret
urn
vs P
eer G
roup
Standard Deviation
14 13 12 11 10 9 8 7 6 5 4 3 2 1 010
yea
rs5
year
s3
year
s1
year
YTD
Sharpe Ratio
2 1 05
year
s3
year
s1
year
YTD
Information Ratio
1 0 -1 -25
year
s3
year
s1
year
YTD
Blac
kRoc
k Li
fePa
th®
Inde
x 20
30 K
Mor
ning
star
Life
time
Mod
203
0 TR
USD
Fund
Bas
ics
Tick
erLI
NKX
Cate
gory
Targ
et-D
ate
2030
Net
Ass
ets(
This
Cla
ss $
mn)
7,05
5 m
Net
Ass
ets(
All C
lass
es $
mn)
0 m
Man
ager
Alan
Mas
on
Man
ager
Ten
ure
8.33
Fund
Ince
ptio
nM
ay 3
1,20
11
Fee
And
Expe
nses
Expe
nse
Ratio
0.07
Gro
ss E
xpen
se R
atio
0.12
Pros
pect
us N
et E
xpen
se R
atio
0.10
Pros
pect
us G
ross
Exp
ense
Rat
io0.
15
Actu
al 1
2b1
0.00
Man
agem
ent F
ee0.
05
Cum
ulat
ive
Perf
orm
ance
Tim
e Pe
riod:
01/
30/2
014
- 09
/30/
2019
Growth of $100
147
141
135
129
122
116
110
104 98 91 85
09/1
901
/19
07/1
801
/18
07/1
701
/17
07/1
601
/16
07/1
509
/14
Blac
kRoc
k Li
fePa
th®
Inde
x 20
30 K
Mor
ning
star
Life
time
Mod
203
0 TR
USD
Gro
wth
of $
100
is c
alcu
late
d at
NAV
and
ass
umes
that
all
divi
dend
and
cap
ital g
ain
dist
ribut
ions
wer
e re
inve
sted
. It d
oes
not t
ake
into
acc
ount
sal
esch
arge
s or
the
effe
ct o
f tax
es. R
esul
ts a
re n
ot in
dica
tive
of fu
ture
per
form
ance
.
Pag
e 69
|
125

BLAC
KRO
CK LI
FEPA
TH®
INDE
X 20
35 K
| FU
ND
FACT
SHE
ET
For P
lan
Spon
sor U
se O
nly
Com
mun
ity A
ctio
n Pa
rtne
rshi
p ER
ISA
403(
b) In
vest
men
t Rev
iew
| Pe
riod
Endi
ng 0
9/30
/201
9
IPS
Scor
eRe
turn
1Yr
Retu
rn3Y
rRe
turn
5Yr
Max
Dra
wD
own
5Yr
Shar
pe3Y
rSh
arpe
5Yr
Info
Ratio
3Yr
Info
Ratio
5Yr
Man
ager
Tenu
reEx
pens
eRa
tioU
p/D
own
Capt
ure
5Yr
88 Pass
ing
Crite
ria S
corin
g4.
38%
8.56
%6.
92%
9.60
0.81
0.68
-0.5
50.
088.
330.
10%
1.03
Peer
Gro
up S
corin
g3.
09%
8.32
%6.
37%
11.17
0.77
0.61
-0.50
-0.27
7.12
0.77
%0.
98
Crite
ria P
eer R
anki
ng13
4028
935
1653
2632
313
Inve
stm
ent S
trat
egy
The
inve
stm
ent s
eeks
to p
rovi
de fo
r ret
irem
ent o
utco
mes
bas
ed o
n qu
antit
ativ
ely
mea
sure
d ris
k. T
he fu
nd is
a 'f
eede
r' fu
nd th
at in
vest
s al
l of i
ts a
sset
s in
the
Mas
ter P
ortf
olio
, a s
erie
s of
Mas
ter I
nves
tmen
tPo
rtfo
lio ('
MIP
') w
ith a
sub
stan
tially
iden
tical
inve
stm
ent o
bjec
tive,
whi
ch a
lloca
tes
and
real
loca
tes
its a
sset
s am
ong
a co
mbi
natio
n of
equ
ity a
nd b
ond
inde
x fu
nds
and
mon
ey m
arke
t fun
ds (t
he 'u
nder
lyin
gfu
nds'
) in
prop
ortio
ns b
ased
on
its o
wn
com
preh
ensi
ve in
vest
men
t str
ateg
y.
Man
ager
Vs
Benc
hmar
k Pe
rfor
man
ce
18 16 14 12 10 8 6 4 2 010
Yea
rs5
Year
s3
Year
s1
Year
YTD
18 16 14 12 10 8 6 4 2 0 -25
Year
s3
Year
s1
Year
YTD
25 20 15 10 5 0 -5 -10
2015
2016
2017
2018
YTD
30 20 10 0
-10
2014
2015
2016
2017
2018
YTD
Blac
kRoc
k Li
fePa
th®
Inde
x 20
35 K
Mor
ning
star
Life
time
Mod
203
5 TR
USD
Inve
stm
ent N
ame
Annu
aliz
ed R
etur
nsCa
lend
ar Y
ear R
etur
ns
Last
Qtr
YTD
1 Yea
r3
Year
5Yea
r10
Yea
rIT
DIn
cept
ion
Dat
e20
1820
1720
1620
1520
14
Blac
kRoc
k Li
fePa
th®
Inde
x 20
35 K
0.82
%15
.27%
4.38
%8.
56%
6.92
%-
7.36
%05
/31/
2011
(6.3
6%)
18.2
9%7.
74%
(0.5
6%)
6.82
%
Mor
ning
star L
ifetim
e M
od 2
035
TR U
SD0.
93%
15.76
%4.
24%
8.96
%6.
84%
--
-(6
.82%
)18
.52%
10.0
7%(2
.58%
)5.8
0%
Mor
ning
star T
arge
t-Dat
e 20
350.
56%
14.6
8%3.
09%
8.32
%6.
37%
8.57
%-
-(7
.01%
)18
.47%
7.69%
(1.52
%)
5.47%
Mor
ning
star
Rat
ing:
***
*
The
perfo
rman
ce d
ata
quot
ed re
pres
ents
pas
t per
form
ance
. Pas
t per
form
ance
doe
s no
t gua
rant
ee fu
ture
resu
lts. I
nves
tmen
t ret
urn
and
prin
cipal
val
ue w
ill flu
ctua
te so
that
an
inve
stor's
shar
es, w
hen
rede
emed
, may
be
worth
mor
e or
less
than
their
orig
inal
cost.
Cur
rent
per
form
ance
may
be
lowe
r or h
ighe
r tha
n th
e pe
rform
ance
info
rmat
ion
quot
ed. T
he p
erfo
rman
ce q
uote
d re
flect
s the
rein
vestm
ent o
f divi
dend
s and
capi
tal g
ains
and
isne
t of a
ll ex
pens
es. T
o ob
tain
curre
nt m
onth
-end
per
form
ance
info
rmat
ion,
plea
se co
ntac
t the
pho
ne n
umbe
r loc
ated
in th
e "Im
porta
nt D
isclo
sure
s" se
ctio
n of
this
repo
rt. F
or so
urce
info
rmat
ion,
plea
se se
e th
e "Im
porta
ntDi
sclo
sure
s" se
ctio
n of
this
repo
rt. P
lease
see
furth
er d
etai
ls on
the
scor
ing
met
hodo
logy
in th
e "In
vestm
ent S
corin
g M
etho
dolo
gy" s
ectio
n of
this
repo
rt.Pe
er g
roup
s ba
sed
on M
orni
ngst
ar c
ateg
ory.
Fund
rank
ings
are
bas
ed o
n tr
ailin
g to
tal r
etur
ns, i
nclu
ding
rein
vest
men
t of d
ivid
ends
and
cap
ital g
ains
. Fun
ds a
re ra
nked
bet
wee
n 1
and
100,
with
1 b
eing
the
top
perc
entil
e an
d 10
0 be
ing
the
bott
om p
erce
ntile
. The
rank
ing
is fo
r the
indi
cate
d sh
are
clas
s; ot
her s
hare
cla
sses
may
hav
e a
diffe
rent
per
form
ance
rank
ing.
Pag
e 70
|
126

BLAC
KRO
CK LI
FEPA
TH®
INDE
X 20
35 K
| FU
ND
FACT
SHE
ET
For P
lan
Spon
sor U
se O
nly
Com
mun
ity A
ctio
n Pa
rtne
rshi
p ER
ISA
403(
b) In
vest
men
t Rev
iew
| Pe
riod
Endi
ng 0
9/30
/201
9
Hist
oric
al G
lidep
ath
Tim
e Pe
riod:
10/
30/2
014
- 09
/30/
2019
100% 80%
60%
40%
20% 0%
09/19
03/19
03/18
03/17
03/16
03/15
Stoc
kBo
ndCa
shO
ther
Equi
ty R
egio
nal D
istrib
utio
n
Tim
e Pe
riod:
10/
30/2
014
- 09
/30/
2019
100 80 60 40 20 0
09/19
03/19
03/18
03/17
03/16
03/15
Nor
th A
mer
ica
%La
tin A
mer
ica
%U
nite
d Ki
ngdo
m %
Euro
pe d
ev %
Euro
pe e
mrg
%Af
rica/
Mid
dle
East
%
Asia
%
Sect
or D
istrib
utio
n
Tim
e Pe
riod:
10/
30/2
014
- 09
/30/
2019
100 80 60 40 20 0
09/19
03/19
03/18
03/17
03/16
03/15
Tech
nolo
gyCo
mm
unic
atio
n Se
rvic
esCo
nsum
er C
yclic
al
Cons
umer
Def
ensi
veO
ther
Bond
Dist
ribut
ion
Tim
e Pe
riod:
10/
30/2
014
- 09
/30/
2019
100 80 60 40 20 0
09/19
03/19
03/18
03/17
03/16
03/15
Dom
estic
Bon
dFo
reig
n Bo
ndPr
efer
red
Stoc
ks
Conv
ertib
le B
ond
Oth
er
Risk
/Ret
urn
vs P
eer G
roup
Standard Deviation
16 14 12 10 8 6 4 2 010
yea
rs5
year
s3
year
s1
year
YTD
Sharpe Ratio
2 1 0 -15
year
s3
year
s1
year
YTD
Information Ratio
1 0 -1 -25
year
s3
year
s1
year
YTD
Blac
kRoc
k Li
fePa
th®
Inde
x 20
35 K
Mor
ning
star
Life
time
Mod
203
5 TR
USD
Fund
Bas
ics
Tick
erLI
JKX
Cate
gory
Targ
et-D
ate
2035
Net
Ass
ets(
This
Cla
ss $
mn)
3,60
5 m
Net
Ass
ets(
All C
lass
es $
mn)
0 m
Man
ager
Alan
Mas
on
Man
ager
Ten
ure
8.33
Fund
Ince
ptio
nM
ay 3
1,20
11
Fee
And
Expe
nses
Expe
nse
Ratio
0.08
Gro
ss E
xpen
se R
atio
0.12
Pros
pect
us N
et E
xpen
se R
atio
0.10
Pros
pect
us G
ross
Exp
ense
Rat
io0.
17
Actu
al 1
2b1
0.00
Man
agem
ent F
ee0.
05
Cum
ulat
ive
Perf
orm
ance
Tim
e Pe
riod:
01/
30/2
014
- 09
/30/
2019
Growth of $100
150
143
137
130
124
117
110
104 97 91 84
09/1
901
/19
07/1
801
/18
07/1
701
/17
07/1
601
/16
07/1
509
/14
Blac
kRoc
k Li
fePa
th®
Inde
x 20
35 K
Mor
ning
star
Life
time
Mod
203
5 TR
USD
Gro
wth
of $
100
is c
alcu
late
d at
NAV
and
ass
umes
that
all
divi
dend
and
cap
ital g
ain
dist
ribut
ions
wer
e re
inve
sted
. It d
oes
not t
ake
into
acc
ount
sal
esch
arge
s or
the
effe
ct o
f tax
es. R
esul
ts a
re n
ot in
dica
tive
of fu
ture
per
form
ance
.
Pag
e 71
|
127

BLAC
KRO
CK LI
FEPA
TH®
INDE
X 20
40 K
| FU
ND
FACT
SHE
ET
For P
lan
Spon
sor U
se O
nly
Com
mun
ity A
ctio
n Pa
rtne
rshi
p ER
ISA
403(
b) In
vest
men
t Rev
iew
| Pe
riod
Endi
ng 0
9/30
/201
9
IPS
Scor
eRe
turn
1Yr
Retu
rn3Y
rRe
turn
5Yr
Max
Dra
wD
own
5Yr
Shar
pe3Y
rSh
arpe
5Yr
Info
Ratio
3Yr
Info
Ratio
5Yr
Man
ager
Tenu
reEx
pens
eRa
tioU
p/D
own
Capt
ure
5Yr
93 Pass
ing
Crite
ria S
corin
g3.
81%
9.10
%7.
28%
10.6
80.
790.
66-0
.23
0.23
8.33
0.10
%1.
04
Peer
Gro
up S
corin
g2.5
0%8.
58%
6.56
%12
.00
0.74
0.60
-0.4
9-0
.217.5
00.
80%
1.00
Crite
ria P
eer R
anki
ng16
3212
1132
2134
1438
317
Inve
stm
ent S
trat
egy
The
inve
stm
ent s
eeks
to p
rovi
de fo
r ret
irem
ent o
utco
mes
bas
ed o
n qu
antit
ativ
ely
mea
sure
d ris
k. T
he fu
nd is
a 'f
eede
r' fu
nd th
at in
vest
s al
l of i
ts a
sset
s in
the
Mas
ter P
ortf
olio
, a s
erie
s of
Mas
ter I
nves
tmen
tPo
rtfo
lio ('
MIP
') w
ith a
sub
stan
tially
iden
tical
inve
stm
ent o
bjec
tive,
whi
ch a
lloca
tes
and
real
loca
tes
its a
sset
s am
ong
a co
mbi
natio
n of
equ
ity a
nd b
ond
inde
x fu
nds
and
mon
ey m
arke
t fun
ds (t
he 'u
nder
lyin
gfu
nds'
) in
prop
ortio
ns b
ased
on
its o
wn
com
preh
ensi
ve in
vest
men
t str
ateg
y.
Man
ager
Vs
Benc
hmar
k Pe
rfor
man
ce
18 16 14 12 10 8 6 4 2 010
Yea
rs5
Year
s3
Year
s1
Year
YTD
20 18 16 14 12 10 8 6 4 2 0 -2 -45
Year
s3
Year
s1
Year
YTD
25 20 15 10 5 0 -5 -10
2015
2016
2017
2018
YTD
40 20 0
-20
2014
2015
2016
2017
2018
YTD
Blac
kRoc
k Li
fePa
th®
Inde
x 20
40 K
Mor
ning
star
Life
time
Mod
204
0 TR
USD
Inve
stm
ent N
ame
Annu
aliz
ed R
etur
nsCa
lend
ar Y
ear R
etur
ns
Last
Qtr
YTD
1 Yea
r3
Year
5Yea
r10
Yea
rIT
DIn
cept
ion
Dat
e20
1820
1720
1620
1520
14
Blac
kRoc
k Li
fePa
th®
Inde
x 20
40 K
0.64
%16
.10%
3.81
%9.
10%
7.28
%-
7.72
%05
/31/
2011
(7.0
8%)
19.9
5%8.
10%
(0.5
6%)
6.90
%
Mor
ning
star L
ifetim
e M
od 2
040
TR U
SD0.
66%
16.11
%3.
23%
9.30
%6.
98%
--
-(7
.65%
)19
.87%
10.6
1%(2
.83%
)5.5
1%
Mor
ning
star T
arge
t-Dat
e 20
400.
37%
15.14
%2.5
0%8.
58%
6.56
%8.
64%
--
(7.6
8%)
19.54
%8.
04%
(1.57
%)
5.66%
Mor
ning
star
Rat
ing:
***
*
The
perfo
rman
ce d
ata
quot
ed re
pres
ents
pas
t per
form
ance
. Pas
t per
form
ance
doe
s no
t gua
rant
ee fu
ture
resu
lts. I
nves
tmen
t ret
urn
and
prin
cipal
val
ue w
ill flu
ctua
te so
that
an
inve
stor's
shar
es, w
hen
rede
emed
, may
be
worth
mor
e or
less
than
their
orig
inal
cost.
Cur
rent
per
form
ance
may
be
lowe
r or h
ighe
r tha
n th
e pe
rform
ance
info
rmat
ion
quot
ed. T
he p
erfo
rman
ce q
uote
d re
flect
s the
rein
vestm
ent o
f divi
dend
s and
capi
tal g
ains
and
isne
t of a
ll ex
pens
es. T
o ob
tain
curre
nt m
onth
-end
per
form
ance
info
rmat
ion,
plea
se co
ntac
t the
pho
ne n
umbe
r loc
ated
in th
e "Im
porta
nt D
isclo
sure
s" se
ctio
n of
this
repo
rt. F
or so
urce
info
rmat
ion,
plea
se se
e th
e "Im
porta
ntDi
sclo
sure
s" se
ctio
n of
this
repo
rt. P
lease
see
furth
er d
etai
ls on
the
scor
ing
met
hodo
logy
in th
e "In
vestm
ent S
corin
g M
etho
dolo
gy" s
ectio
n of
this
repo
rt.Pe
er g
roup
s ba
sed
on M
orni
ngst
ar c
ateg
ory.
Fund
rank
ings
are
bas
ed o
n tr
ailin
g to
tal r
etur
ns, i
nclu
ding
rein
vest
men
t of d
ivid
ends
and
cap
ital g
ains
. Fun
ds a
re ra
nked
bet
wee
n 1
and
100,
with
1 b
eing
the
top
perc
entil
e an
d 10
0 be
ing
the
bott
om p
erce
ntile
. The
rank
ing
is fo
r the
indi
cate
d sh
are
clas
s; ot
her s
hare
cla
sses
may
hav
e a
diffe
rent
per
form
ance
rank
ing.
Pag
e 72
|
128
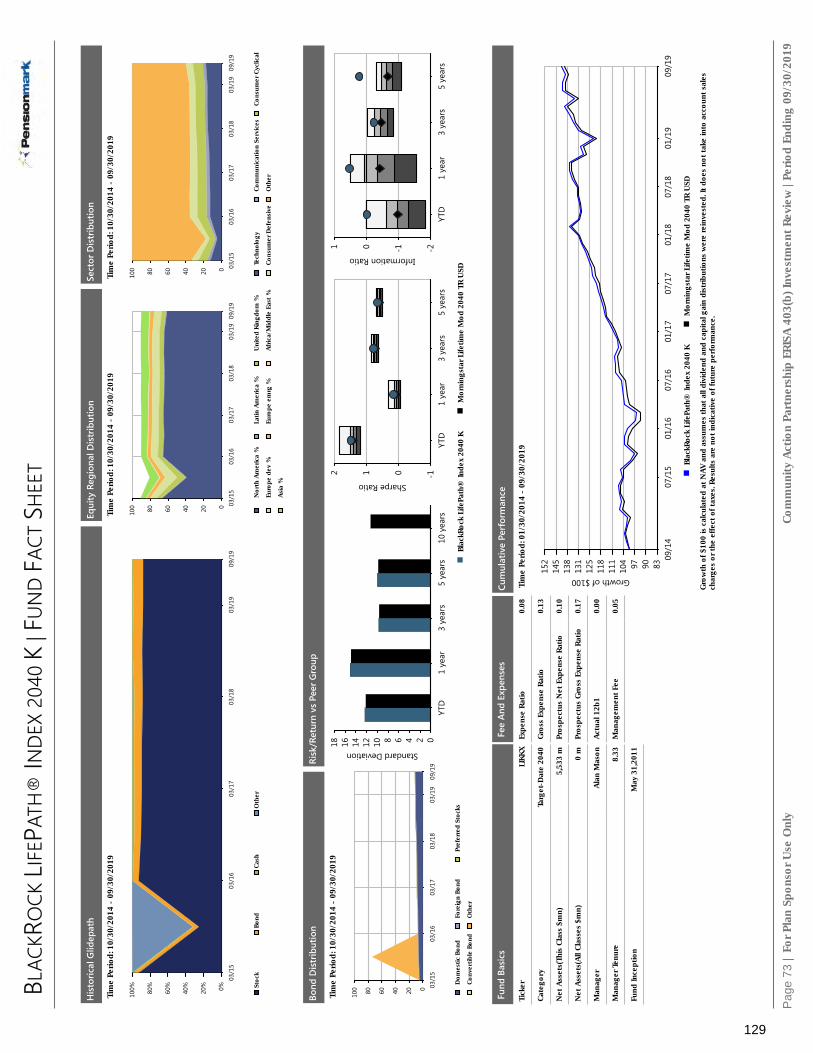
BLAC
KRO
CK LI
FEPA
TH®
INDE
X 20
40 K
| FU
ND
FACT
SHE
ET
For P
lan
Spon
sor U
se O
nly
Com
mun
ity A
ctio
n Pa
rtne
rshi
p ER
ISA
403(
b) In
vest
men
t Rev
iew
| Pe
riod
Endi
ng 0
9/30
/201
9
Hist
oric
al G
lidep
ath
Tim
e Pe
riod:
10/
30/2
014
- 09
/30/
2019
100% 80%
60%
40%
20% 0%
09/19
03/19
03/18
03/17
03/16
03/15
Stoc
kBo
ndCa
shO
ther
Equi
ty R
egio
nal D
istrib
utio
n
Tim
e Pe
riod:
10/
30/2
014
- 09
/30/
2019
100 80 60 40 20 0
09/19
03/19
03/18
03/17
03/16
03/15
Nor
th A
mer
ica
%La
tin A
mer
ica
%U
nite
d Ki
ngdo
m %
Euro
pe d
ev %
Euro
pe e
mrg
%Af
rica/
Mid
dle
East
%
Asia
%
Sect
or D
istrib
utio
n
Tim
e Pe
riod:
10/
30/2
014
- 09
/30/
2019
100 80 60 40 20 0
09/19
03/19
03/18
03/17
03/16
03/15
Tech
nolo
gyCo
mm
unic
atio
n Se
rvic
esCo
nsum
er C
yclic
al
Cons
umer
Def
ensi
veO
ther
Bond
Dist
ribut
ion
Tim
e Pe
riod:
10/
30/2
014
- 09
/30/
2019
100 80 60 40 20 0
09/19
03/19
03/18
03/17
03/16
03/15
Dom
estic
Bon
dFo
reig
n Bo
ndPr
efer
red
Stoc
ks
Conv
ertib
le B
ond
Oth
er
Risk
/Ret
urn
vs P
eer G
roup
Standard Deviation
18 16 14 12 10 8 6 4 2 010
yea
rs5
year
s3
year
s1
year
YTD
Sharpe Ratio
2 1 0 -15
year
s3
year
s1
year
YTD
Information Ratio
1 0 -1 -25
year
s3
year
s1
year
YTD
Blac
kRoc
k Li
fePa
th®
Inde
x 20
40 K
Mor
ning
star
Life
time
Mod
204
0 TR
USD
Fund
Bas
ics
Tick
erLI
KKX
Cate
gory
Targ
et-D
ate
2040
Net
Ass
ets(
This
Cla
ss $
mn)
5,53
3 m
Net
Ass
ets(
All C
lass
es $
mn)
0 m
Man
ager
Alan
Mas
on
Man
ager
Ten
ure
8.33
Fund
Ince
ptio
nM
ay 3
1,20
11
Fee
And
Expe
nses
Expe
nse
Ratio
0.08
Gro
ss E
xpen
se R
atio
0.13
Pros
pect
us N
et E
xpen
se R
atio
0.10
Pros
pect
us G
ross
Exp
ense
Rat
io0.
17
Actu
al 1
2b1
0.00
Man
agem
ent F
ee0.
05
Cum
ulat
ive
Perf
orm
ance
Tim
e Pe
riod:
01/
30/2
014
- 09
/30/
2019
Growth of $100
152
145
138
131
125
118
111
104 97 90 83
09/1
901
/19
07/1
801
/18
07/1
701
/17
07/1
601
/16
07/1
509
/14
Blac
kRoc
k Li
fePa
th®
Inde
x 20
40 K
Mor
ning
star
Life
time
Mod
204
0 TR
USD
Gro
wth
of $
100
is c
alcu
late
d at
NAV
and
ass
umes
that
all
divi
dend
and
cap
ital g
ain
dist
ribut
ions
wer
e re
inve
sted
. It d
oes
not t
ake
into
acc
ount
sal
esch
arge
s or
the
effe
ct o
f tax
es. R
esul
ts a
re n
ot in
dica
tive
of fu
ture
per
form
ance
.
Pag
e 73
|
129

BLAC
KRO
CK LI
FEPA
TH®
INDE
X 20
45 K
| FU
ND
FACT
SHE
ET
For P
lan
Spon
sor U
se O
nly
Com
mun
ity A
ctio
n Pa
rtne
rshi
p ER
ISA
403(
b) In
vest
men
t Rev
iew
| Pe
riod
Endi
ng 0
9/30
/201
9
IPS
Scor
eRe
turn
1Yr
Retu
rn3Y
rRe
turn
5Yr
Max
Dra
wD
own
5Yr
Shar
pe3Y
rSh
arpe
5Yr
Info
Ratio
3Yr
Info
Ratio
5Yr
Man
ager
Tenu
reEx
pens
eRa
tioU
p/D
own
Capt
ure
5Yr
96 Pass
ing
Crite
ria S
corin
g3.
41%
9.46
%7.
52%
11.4
10.
770.
650.
100.
408.
330.
10%
1.05
Peer
Gro
up S
corin
g2.1
0%8.
91%
6.72
%12
.730.
740.
59-0
.37
-0.13
7.07
0.77
%1.0
1
Crite
ria P
eer R
anki
ng14
247
1231
2123
932
313
Inve
stm
ent S
trat
egy
The
inve
stm
ent s
eeks
to p
rovi
de fo
r ret
irem
ent o
utco
mes
bas
ed o
n qu
antit
ativ
ely
mea
sure
d ris
k. T
he fu
nd is
a 'f
eede
r' fu
nd th
at in
vest
s al
l of i
ts a
sset
s in
the
Mas
ter P
ortf
olio
, a s
erie
s of
Mas
ter I
nves
tmen
tPo
rtfo
lio ('
MIP
') w
ith a
sub
stan
tially
iden
tical
inve
stm
ent o
bjec
tive,
whi
ch a
lloca
tes
and
real
loca
tes
its a
sset
s am
ong
a co
mbi
natio
n of
equ
ity a
nd b
ond
inde
x fu
nds
and
mon
ey m
arke
t fun
ds (t
he 'u
nder
lyin
gfu
nds'
) in
prop
ortio
ns b
ased
on
its o
wn
com
preh
ensi
ve in
vest
men
t str
ateg
y.
Man
ager
Vs
Benc
hmar
k Pe
rfor
man
ce
20 18 16 14 12 10 8 6 4 2 010
Yea
rs5
Year
s3
Year
s1
Year
YTD
20 18 16 14 12 10 8 6 4 2 0 -2 -45
Year
s3
Year
s1
Year
YTD
25 20 15 10 5 0 -5 -10
2015
2016
2017
2018
YTD
40 20 0
-20
2014
2015
2016
2017
2018
YTD
Blac
kRoc
k Li
fePa
th®
Inde
x 20
45 K
Mor
ning
star
Life
time
Mod
204
5 TR
USD
Inve
stm
ent N
ame
Annu
aliz
ed R
etur
nsCa
lend
ar Y
ear R
etur
ns
Last
Qtr
YTD
1 Yea
r3
Year
5Yea
r10
Yea
rIT
DIn
cept
ion
Dat
e20
1820
1720
1620
1520
14
Blac
kRoc
k Li
fePa
th®
Inde
x 20
45 K
0.47
%16
.59%
3.41
%9.
46%
7.52
%-
7.97
%05
/31/
2011
(7.5
0%)
21.0
7%8.
28%
(0.6
4%)
7.10
%
Mor
ning
star L
ifetim
e M
od 2
045
TR U
SD0.
46%
16.18
%2.6
2%9.
37%
6.97
%-
--
(8.17
%)
20.53
%10
.84%
(3.0
3%)
5.25%
Mor
ning
star T
arge
t-Dat
e 20
450.
27%
15.6
5%2.1
0%8.
91%
6.72
%8.
94%
--
(8.14
%)
20.53
%8.
09%
(1.59
%)
5.53%
Mor
ning
star
Rat
ing:
***
*
The
perfo
rman
ce d
ata
quot
ed re
pres
ents
pas
t per
form
ance
. Pas
t per
form
ance
doe
s no
t gua
rant
ee fu
ture
resu
lts. I
nves
tmen
t ret
urn
and
prin
cipal
val
ue w
ill flu
ctua
te so
that
an
inve
stor's
shar
es, w
hen
rede
emed
, may
be
worth
mor
e or
less
than
their
orig
inal
cost.
Cur
rent
per
form
ance
may
be
lowe
r or h
ighe
r tha
n th
e pe
rform
ance
info
rmat
ion
quot
ed. T
he p
erfo
rman
ce q
uote
d re
flect
s the
rein
vestm
ent o
f divi
dend
s and
capi
tal g
ains
and
isne
t of a
ll ex
pens
es. T
o ob
tain
curre
nt m
onth
-end
per
form
ance
info
rmat
ion,
plea
se co
ntac
t the
pho
ne n
umbe
r loc
ated
in th
e "Im
porta
nt D
isclo
sure
s" se
ctio
n of
this
repo
rt. F
or so
urce
info
rmat
ion,
plea
se se
e th
e "Im
porta
ntDi
sclo
sure
s" se
ctio
n of
this
repo
rt. P
lease
see
furth
er d
etai
ls on
the
scor
ing
met
hodo
logy
in th
e "In
vestm
ent S
corin
g M
etho
dolo
gy" s
ectio
n of
this
repo
rt.Pe
er g
roup
s ba
sed
on M
orni
ngst
ar c
ateg
ory.
Fund
rank
ings
are
bas
ed o
n tr
ailin
g to
tal r
etur
ns, i
nclu
ding
rein
vest
men
t of d
ivid
ends
and
cap
ital g
ains
. Fun
ds a
re ra
nked
bet
wee
n 1
and
100,
with
1 b
eing
the
top
perc
entil
e an
d 10
0 be
ing
the
bott
om p
erce
ntile
. The
rank
ing
is fo
r the
indi
cate
d sh
are
clas
s; ot
her s
hare
cla
sses
may
hav
e a
diffe
rent
per
form
ance
rank
ing.
Pag
e 74
|
130

BLAC
KRO
CK LI
FEPA
TH®
INDE
X 20
45 K
| FU
ND
FACT
SHE
ET
For P
lan
Spon
sor U
se O
nly
Com
mun
ity A
ctio
n Pa
rtne
rshi
p ER
ISA
403(
b) In
vest
men
t Rev
iew
| Pe
riod
Endi
ng 0
9/30
/201
9
Hist
oric
al G
lidep
ath
Tim
e Pe
riod:
10/
30/2
014
- 09
/30/
2019
100% 80%
60%
40%
20% 0%
09/19
03/19
03/18
03/17
03/16
03/15
Stoc
kBo
ndCa
shO
ther
Equi
ty R
egio
nal D
istrib
utio
n
Tim
e Pe
riod:
10/
30/2
014
- 09
/30/
2019
100 80 60 40 20 0
09/19
03/19
03/18
03/17
03/16
03/15
Nor
th A
mer
ica
%La
tin A
mer
ica
%U
nite
d Ki
ngdo
m %
Euro
pe d
ev %
Euro
pe e
mrg
%Af
rica/
Mid
dle
East
%
Asia
%
Sect
or D
istrib
utio
n
Tim
e Pe
riod:
10/
30/2
014
- 09
/30/
2019
100 80 60 40 20 0
09/19
03/19
03/18
03/17
03/16
03/15
Tech
nolo
gyCo
mm
unic
atio
n Se
rvic
esCo
nsum
er C
yclic
al
Cons
umer
Def
ensi
veO
ther
Bond
Dist
ribut
ion
Tim
e Pe
riod:
10/
30/2
014
- 09
/30/
2019
100 80 60 40 20 0
09/19
03/19
03/18
03/17
03/16
03/15
Dom
estic
Bon
dFo
reig
n Bo
ndPr
efer
red
Stoc
ks
Conv
ertib
le B
ond
Oth
er
Risk
/Ret
urn
vs P
eer G
roup
Standard Deviation
18 16 14 12 10 8 6 4 2 010
yea
rs5
year
s3
year
s1
year
YTD
Sharpe Ratio
2 1 0 -15
year
s3
year
s1
year
YTD
Information Ratio
1 0 -1 -2 -35
year
s3
year
s1
year
YTD
Blac
kRoc
k Li
fePa
th®
Inde
x 20
45 K
Mor
ning
star
Life
time
Mod
204
5 TR
USD
Fund
Bas
ics
Tick
erLI
HKX
Cate
gory
Targ
et-D
ate
2045
Net
Ass
ets(
This
Cla
ss $
mn)
2,55
4 m
Net
Ass
ets(
All C
lass
es $
mn)
0 m
Man
ager
Alan
Mas
on
Man
ager
Ten
ure
8.33
Fund
Ince
ptio
nM
ay 3
1,20
11
Fee
And
Expe
nses
Expe
nse
Ratio
0.08
Gro
ss E
xpen
se R
atio
0.13
Pros
pect
us N
et E
xpen
se R
atio
0.10
Pros
pect
us G
ross
Exp
ense
Rat
io0.
19
Actu
al 1
2b1
0.00
Man
agem
ent F
ee0.
05
Cum
ulat
ive
Perf
orm
ance
Tim
e Pe
riod:
01/
30/2
014
- 09
/30/
2019
Growth of $100
154
154
147
140
132
125
118
111
104 97 90 83
09/1
901
/19
07/1
801
/18
07/1
701
/17
07/1
601
/16
07/1
509
/14
Blac
kRoc
k Li
fePa
th®
Inde
x 20
45 K
Mor
ning
star
Life
time
Mod
204
5 TR
USD
Gro
wth
of $
100
is c
alcu
late
d at
NAV
and
ass
umes
that
all
divi
dend
and
cap
ital g
ain
dist
ribut
ions
wer
e re
inve
sted
. It d
oes
not t
ake
into
acc
ount
sal
esch
arge
s or
the
effe
ct o
f tax
es. R
esul
ts a
re n
ot in
dica
tive
of fu
ture
per
form
ance
.
Pag
e 75
|
131

BLAC
KRO
CK LI
FEPA
TH®
INDE
X 20
50 K
| FU
ND
FACT
SHE
ET
For P
lan
Spon
sor U
se O
nly
Com
mun
ity A
ctio
n Pa
rtne
rshi
p ER
ISA
403(
b) In
vest
men
t Rev
iew
| Pe
riod
Endi
ng 0
9/30
/201
9
IPS
Scor
eRe
turn
1Yr
Retu
rn3Y
rRe
turn
5Yr
Max
Dra
wD
own
5Yr
Shar
pe3Y
rSh
arpe
5Yr
Info
Ratio
3Yr
Info
Ratio
5Yr
Man
ager
Tenu
reEx
pens
eRa
tioU
p/D
own
Capt
ure
5Yr
96 Pass
ing
Crite
ria S
corin
g3.
23%
9.54
%7.
60%
11.7
70.
760.
640.
220.
508.
330.
10%
1.06
Peer
Gro
up S
corin
g1.9
9%8.
88%
6.76
%12
.89
0.72
0.59
-0.29
-0.0
47.1
50.
80%
1.02
Crite
ria P
eer R
anki
ng15
237
1634
2115
938
319
Inve
stm
ent S
trat
egy
The
inve
stm
ent s
eeks
to p
rovi
de fo
r ret
irem
ent o
utco
mes
bas
ed o
n qu
antit
ativ
ely
mea
sure
d ris
k. T
he fu
nd is
a 'f
eede
r' fu
nd th
at in
vest
s al
l of i
ts a
sset
s in
the
Mas
ter P
ortf
olio
, a s
erie
s of
Mas
ter I
nves
tmen
tPo
rtfo
lio ('
MIP
') w
ith a
sub
stan
tially
iden
tical
inve
stm
ent o
bjec
tive,
whi
ch a
lloca
tes
and
real
loca
tes
its a
sset
s am
ong
a co
mbi
natio
n of
equ
ity a
nd b
ond
inde
x fu
nds
and
mon
ey m
arke
t fun
ds (t
he 'u
nder
lyin
gfu
nds'
) in
prop
ortio
ns b
ased
on
its o
wn
com
preh
ensi
ve in
vest
men
t str
ateg
y.
Man
ager
Vs
Benc
hmar
k Pe
rfor
man
ce
20 18 16 14 12 10 8 6 4 2 010
Yea
rs5
Year
s3
Year
s1
Year
YTD
22 20 18 16 14 12 10 8 6 4 2 0 -2 -45
Year
s3
Year
s1
Year
YTD
25 20 15 10 5 0 -5 -10
-15
2015
2016
2017
2018
YTD
40 20 0
-20
2014
2015
2016
2017
2018
YTD
Blac
kRoc
k Li
fePa
th®
Inde
x 20
50 K
Mor
ning
star
Life
time
Mod
205
0 TR
USD
Inve
stm
ent N
ame
Annu
aliz
ed R
etur
nsCa
lend
ar Y
ear R
etur
ns
Last
Qtr
YTD
1 Yea
r3
Year
5Yea
r10
Yea
rIT
DIn
cept
ion
Dat
e20
1820
1720
1620
1520
14
Blac
kRoc
k Li
fePa
th®
Inde
x 20
50 K
0.46
%16
.87%
3.23
%9.
54%
7.60
%-
8.13
%05
/31/
2011
(7.8
2%)
21.4
3%8.
41%
(0.6
7%)
7.28
%
Mor
ning
star L
ifetim
e M
od 2
050
TR U
SD0.
37%
16.11
%2.3
9%9.
32%
6.89
%-
--
(8.4
1%)
20.78
%10
.89%
(3.19
%)
5.00%
Mor
ning
star T
arge
t-Dat
e 20
500.
22%
15.74
%1.9
9%8.
88%
6.76
%8.
86%
--
(8.3
8%)
20.6
9%8.
30%
(1.61
%)
5.73%
Mor
ning
star
Rat
ing:
***
*
The
perfo
rman
ce d
ata
quot
ed re
pres
ents
pas
t per
form
ance
. Pas
t per
form
ance
doe
s no
t gua
rant
ee fu
ture
resu
lts. I
nves
tmen
t ret
urn
and
prin
cipal
val
ue w
ill flu
ctua
te so
that
an
inve
stor's
shar
es, w
hen
rede
emed
, may
be
worth
mor
e or
less
than
their
orig
inal
cost.
Cur
rent
per
form
ance
may
be
lowe
r or h
ighe
r tha
n th
e pe
rform
ance
info
rmat
ion
quot
ed. T
he p
erfo
rman
ce q
uote
d re
flect
s the
rein
vestm
ent o
f divi
dend
s and
capi
tal g
ains
and
isne
t of a
ll ex
pens
es. T
o ob
tain
curre
nt m
onth
-end
per
form
ance
info
rmat
ion,
plea
se co
ntac
t the
pho
ne n
umbe
r loc
ated
in th
e "Im
porta
nt D
isclo
sure
s" se
ctio
n of
this
repo
rt. F
or so
urce
info
rmat
ion,
plea
se se
e th
e "Im
porta
ntDi
sclo
sure
s" se
ctio
n of
this
repo
rt. P
lease
see
furth
er d
etai
ls on
the
scor
ing
met
hodo
logy
in th
e "In
vestm
ent S
corin
g M
etho
dolo
gy" s
ectio
n of
this
repo
rt.Pe
er g
roup
s ba
sed
on M
orni
ngst
ar c
ateg
ory.
Fund
rank
ings
are
bas
ed o
n tr
ailin
g to
tal r
etur
ns, i
nclu
ding
rein
vest
men
t of d
ivid
ends
and
cap
ital g
ains
. Fun
ds a
re ra
nked
bet
wee
n 1
and
100,
with
1 b
eing
the
top
perc
entil
e an
d 10
0 be
ing
the
bott
om p
erce
ntile
. The
rank
ing
is fo
r the
indi
cate
d sh
are
clas
s; ot
her s
hare
cla
sses
may
hav
e a
diffe
rent
per
form
ance
rank
ing.
Pag
e 76
|
132

BLAC
KRO
CK LI
FEPA
TH®
INDE
X 20
50 K
| FU
ND
FACT
SHE
ET
For P
lan
Spon
sor U
se O
nly
Com
mun
ity A
ctio
n Pa
rtne
rshi
p ER
ISA
403(
b) In
vest
men
t Rev
iew
| Pe
riod
Endi
ng 0
9/30
/201
9
Hist
oric
al G
lidep
ath
Tim
e Pe
riod:
10/
30/2
014
- 09
/30/
2019
100% 80%
60%
40%
20% 0%
09/19
03/19
03/18
03/17
03/16
03/15
Stoc
kBo
ndCa
shO
ther
Equi
ty R
egio
nal D
istrib
utio
n
Tim
e Pe
riod:
10/
30/2
014
- 09
/30/
2019
100 80 60 40 20 0
09/19
03/19
03/18
03/17
03/16
03/15
Nor
th A
mer
ica
%La
tin A
mer
ica
%U
nite
d Ki
ngdo
m %
Euro
pe d
ev %
Euro
pe e
mrg
%Af
rica/
Mid
dle
East
%
Asia
%
Sect
or D
istrib
utio
n
Tim
e Pe
riod:
10/
30/2
014
- 09
/30/
2019
100 80 60 40 20 0
09/19
03/19
03/18
03/17
03/16
03/15
Tech
nolo
gyCo
mm
unic
atio
n Se
rvic
esCo
nsum
er C
yclic
al
Cons
umer
Def
ensi
veO
ther
Bond
Dist
ribut
ion
Tim
e Pe
riod:
10/
30/2
014
- 09
/30/
2019
100 80 60 40 20 0
09/19
03/19
03/18
03/17
03/16
03/15
Dom
estic
Bon
dFo
reig
n Bo
ndPr
efer
red
Stoc
ks
Conv
ertib
le B
ond
Oth
er
Risk
/Ret
urn
vs P
eer G
roup
Standard Deviation
20 18 16 14 12 10 8 6 4 2 010
yea
rs5
year
s3
year
s1
year
YTD
Sharpe Ratio
2 1 0 -15
year
s3
year
s1
year
YTD
Information Ratio
1 0 -1 -25
year
s3
year
s1
year
YTD
Blac
kRoc
k Li
fePa
th®
Inde
x 20
50 K
Mor
ning
star
Life
time
Mod
205
0 TR
USD
Fund
Bas
ics
Tick
erLI
PKX
Cate
gory
Targ
et-D
ate
2050
Net
Ass
ets(
This
Cla
ss $
mn)
2,70
2 m
Net
Ass
ets(
All C
lass
es $
mn)
0 m
Man
ager
Alan
Mas
on
Man
ager
Ten
ure
8.33
Fund
Ince
ptio
nM
ay 3
1,20
11
Fee
And
Expe
nses
Expe
nse
Ratio
0.08
Gro
ss E
xpen
se R
atio
0.14
Pros
pect
us N
et E
xpen
se R
atio
0.10
Pros
pect
us G
ross
Exp
ense
Rat
io0.
18
Actu
al 1
2b1
0.00
Man
agem
ent F
ee0.
05
Cum
ulat
ive
Perf
orm
ance
Tim
e Pe
riod:
01/
30/2
014
- 09
/30/
2019
Growth of $100
154
154
147
140
133
126
118
111
104 97 90 83
09/1
901
/19
07/1
801
/18
07/1
701
/17
07/1
601
/16
07/1
509
/14
Blac
kRoc
k Li
fePa
th®
Inde
x 20
50 K
Mor
ning
star
Life
time
Mod
205
0 TR
USD
Gro
wth
of $
100
is c
alcu
late
d at
NAV
and
ass
umes
that
all
divi
dend
and
cap
ital g
ain
dist
ribut
ions
wer
e re
inve
sted
. It d
oes
not t
ake
into
acc
ount
sal
esch
arge
s or
the
effe
ct o
f tax
es. R
esul
ts a
re n
ot in
dica
tive
of fu
ture
per
form
ance
.
Pag
e 77
|
133

BLAC
KRO
CK LI
FEPA
TH®
INDE
X 20
55 K
| FU
ND
FACT
SHE
ET
For P
lan
Spon
sor U
se O
nly
Com
mun
ity A
ctio
n Pa
rtne
rshi
p ER
ISA
403(
b) In
vest
men
t Rev
iew
| Pe
riod
Endi
ng 0
9/30
/201
9
IPS
Scor
eRe
turn
1Yr
Retu
rn3Y
rRe
turn
5Yr
Max
Dra
wD
own
5Yr
Shar
pe3Y
rSh
arpe
5Yr
Info
Ratio
3Yr
Info
Ratio
5Yr
Man
ager
Tenu
reEx
pens
eRa
tioU
p/D
own
Capt
ure
5Yr
95 Pass
ing
Crite
ria S
corin
g3.
18%
9.55
%7.
64%
11.7
80.
760.
640.
300.
568.
330.
09%
1.07
Peer
Gro
up S
corin
g1.8
4%9.
04%
6.84
%13
.04
0.73
0.59
-0.17
0.03
5.90
0.78
%1.0
2
Crite
ria P
eer R
anki
ng15
269
838
1818
723
214
Inve
stm
ent S
trat
egy
The
inve
stm
ent s
eeks
to p
rovi
de fo
r ret
irem
ent o
utco
mes
bas
ed o
n qu
antit
ativ
ely
mea
sure
d ris
k. T
he fu
nd is
a 'f
eede
r' fu
nd th
at in
vest
s al
l of i
ts a
sset
s in
the
Mas
ter P
ortf
olio
, a s
erie
s of
Mas
ter I
nves
tmen
tPo
rtfo
lio ('
MIP
') w
ith a
sub
stan
tially
iden
tical
inve
stm
ent o
bjec
tive,
whi
ch a
lloca
tes
and
real
loca
tes
its a
sset
s am
ong
a co
mbi
natio
n of
equ
ity a
nd b
ond
inde
x fu
nds
and
mon
ey m
arke
t fun
ds (t
he 'u
nder
lyin
gfu
nds'
) in
prop
ortio
ns b
ased
on
its o
wn
com
preh
ensi
ve in
vest
men
t str
ateg
y.
Man
ager
Vs
Benc
hmar
k Pe
rfor
man
ce
20 18 16 14 12 10 8 6 4 2 010
Yea
rs5
Year
s3
Year
s1
Year
YTD
22 20 18 16 14 12 10 8 6 4 2 0 -2 -45
Year
s3
Year
s1
Year
YTD
25 20 15 10 5 0 -5 -10
-15
2015
2016
2017
2018
YTD
40 20 0
-20
2014
2015
2016
2017
2018
YTD
Blac
kRoc
k Li
fePa
th®
Inde
x 20
55 K
Mor
ning
star
Life
time
Mod
205
5 TR
USD
Inve
stm
ent N
ame
Annu
aliz
ed R
etur
nsCa
lend
ar Y
ear R
etur
ns
Last
Qtr
YTD
1 Yea
r3
Year
5Yea
r10
Yea
rIT
DIn
cept
ion
Dat
e20
1820
1720
1620
1520
14
Blac
kRoc
k Li
fePa
th®
Inde
x 20
55 K
0.39
%16
.84%
3.18
%9.
55%
7.64
%-
8.26
%05
/31/
2011
(7.8
5%)
21.5
1%8.
38%
(0.6
0%)
7.50
%
Mor
ning
star L
ifetim
e M
od 2
055
TR U
SD0.
31%
16.0
2%2.2
9%9.
26%
6.81
%-
--
(8.57
%)
20.9
5%10
.90%
(3.3
4%)
4.74
%
Mor
ning
star T
arge
t-Dat
e 20
550.
20%
15.8
6%1.8
4%9.
04%
6.84
%9.
09%
--
(8.4
4%)
21.11
%8.
16%
(1.61
%)
5.60%
Mor
ning
star
Rat
ing:
***
**
The
perfo
rman
ce d
ata
quot
ed re
pres
ents
pas
t per
form
ance
. Pas
t per
form
ance
doe
s no
t gua
rant
ee fu
ture
resu
lts. I
nves
tmen
t ret
urn
and
prin
cipal
val
ue w
ill flu
ctua
te so
that
an
inve
stor's
shar
es, w
hen
rede
emed
, may
be
worth
mor
e or
less
than
their
orig
inal
cost.
Cur
rent
per
form
ance
may
be
lowe
r or h
ighe
r tha
n th
e pe
rform
ance
info
rmat
ion
quot
ed. T
he p
erfo
rman
ce q
uote
d re
flect
s the
rein
vestm
ent o
f divi
dend
s and
capi
tal g
ains
and
isne
t of a
ll ex
pens
es. T
o ob
tain
curre
nt m
onth
-end
per
form
ance
info
rmat
ion,
plea
se co
ntac
t the
pho
ne n
umbe
r loc
ated
in th
e "Im
porta
nt D
isclo
sure
s" se
ctio
n of
this
repo
rt. F
or so
urce
info
rmat
ion,
plea
se se
e th
e "Im
porta
ntDi
sclo
sure
s" se
ctio
n of
this
repo
rt. P
lease
see
furth
er d
etai
ls on
the
scor
ing
met
hodo
logy
in th
e "In
vestm
ent S
corin
g M
etho
dolo
gy" s
ectio
n of
this
repo
rt.Pe
er g
roup
s ba
sed
on M
orni
ngst
ar c
ateg
ory.
Fund
rank
ings
are
bas
ed o
n tr
ailin
g to
tal r
etur
ns, i
nclu
ding
rein
vest
men
t of d
ivid
ends
and
cap
ital g
ains
. Fun
ds a
re ra
nked
bet
wee
n 1
and
100,
with
1 b
eing
the
top
perc
entil
e an
d 10
0 be
ing
the
bott
om p
erce
ntile
. The
rank
ing
is fo
r the
indi
cate
d sh
are
clas
s; ot
her s
hare
cla
sses
may
hav
e a
diffe
rent
per
form
ance
rank
ing.
Pag
e 78
|
134

BLAC
KRO
CK LI
FEPA
TH®
INDE
X 20
55 K
| FU
ND
FACT
SHE
ET
For P
lan
Spon
sor U
se O
nly
Com
mun
ity A
ctio
n Pa
rtne
rshi
p ER
ISA
403(
b) In
vest
men
t Rev
iew
| Pe
riod
Endi
ng 0
9/30
/201
9
Hist
oric
al G
lidep
ath
Tim
e Pe
riod:
10/
30/2
014
- 09
/30/
2019
100% 80%
60%
40%
20% 0%
09/19
03/19
03/18
03/17
03/16
03/15
Stoc
kBo
ndCa
shO
ther
Equi
ty R
egio
nal D
istrib
utio
n
Tim
e Pe
riod:
10/
30/2
014
- 09
/30/
2019
100 80 60 40 20 0
09/19
03/19
03/18
03/17
03/16
03/15
Nor
th A
mer
ica
%La
tin A
mer
ica
%U
nite
d Ki
ngdo
m %
Euro
pe d
ev %
Euro
pe e
mrg
%Af
rica/
Mid
dle
East
%
Asia
%
Sect
or D
istrib
utio
n
Tim
e Pe
riod:
10/
30/2
014
- 09
/30/
2019
100 80 60 40 20 0
09/19
03/19
03/18
03/17
03/16
03/15
Tech
nolo
gyCo
mm
unic
atio
n Se
rvic
esCo
nsum
er C
yclic
al
Cons
umer
Def
ensi
veO
ther
Bond
Dist
ribut
ion
Tim
e Pe
riod:
10/
30/2
014
- 09
/30/
2019
100 80 60 40 20 0
09/19
03/19
03/18
03/17
03/16
03/15
Dom
estic
Bon
dFo
reig
n Bo
ndPr
efer
red
Stoc
ks
Conv
ertib
le B
ond
Oth
er
Risk
/Ret
urn
vs P
eer G
roup
Standard Deviation
20 18 16 14 12 10 8 6 4 2 010
yea
rs5
year
s3
year
s1
year
YTD
Sharpe Ratio
2 1 0 -15
year
s3
year
s1
year
YTD
Information Ratio
1 0 -1 -2 -35
year
s3
year
s1
year
YTD
Blac
kRoc
k Li
fePa
th®
Inde
x 20
55 K
Mor
ning
star
Life
time
Mod
205
5 TR
USD
Fund
Bas
ics
Tick
erLI
VKX
Cate
gory
Targ
et-D
ate
2055
Net
Ass
ets(
This
Cla
ss $
mn)
1,26
0 m
Net
Ass
ets(
All C
lass
es $
mn)
0 m
Man
ager
Alan
Mas
on
Man
ager
Ten
ure
8.33
Fund
Ince
ptio
nM
ay 3
1,20
11
Fee
And
Expe
nses
Expe
nse
Ratio
0.08
Gro
ss E
xpen
se R
atio
0.15
Pros
pect
us N
et E
xpen
se R
atio
0.09
Pros
pect
us G
ross
Exp
ense
Rat
io0.
20
Actu
al 1
2b1
0.00
Man
agem
ent F
ee0.
05
Cum
ulat
ive
Perf
orm
ance
Tim
e Pe
riod:
01/
30/2
014
- 09
/30/
2019
Growth of $100
154
147
140
133
126
118
111
104 97 89 82
09/1
901
/19
07/1
801
/18
07/1
701
/17
07/1
601
/16
07/1
509
/14
Blac
kRoc
k Li
fePa
th®
Inde
x 20
55 K
Mor
ning
star
Life
time
Mod
205
5 TR
USD
Gro
wth
of $
100
is c
alcu
late
d at
NAV
and
ass
umes
that
all
divi
dend
and
cap
ital g
ain
dist
ribut
ions
wer
e re
inve
sted
. It d
oes
not t
ake
into
acc
ount
sal
esch
arge
s or
the
effe
ct o
f tax
es. R
esul
ts a
re n
ot in
dica
tive
of fu
ture
per
form
ance
.
Pag
e 79
|
135

BLAC
KRO
CK LI
FEPA
TH®
INDE
X 20
60 K
| FU
ND
FACT
SHE
ET
For P
lan
Spon
sor U
se O
nly
Com
mun
ity A
ctio
n Pa
rtne
rshi
p ER
ISA
403(
b) In
vest
men
t Rev
iew
| Pe
riod
Endi
ng 0
9/30
/201
9
IPS
Scor
eRe
turn
1Yr
Retu
rn3Y
rRe
turn
5Yr
Max
Dra
wD
own
5Yr
Shar
pe3Y
rSh
arpe
5Yr
Info
Ratio
3Yr
Info
Ratio
5Yr
Man
ager
Tenu
reEx
pens
eRa
tioU
p/D
own
Capt
ure
5Yr
86 Pass
ing
Crite
ria S
corin
g3.
30%
9.58
%-
-0.
76-
0.41
-3.
580.
10%
-
Peer
Gro
up S
corin
g1.8
9%9.
20%
7.20%
12.8
90.
740.
620.
010.
322.9
60.
78%
1.06
Crite
ria P
eer R
anki
ng12
29-
-43
-18
-39
4-
Inve
stm
ent S
trat
egy
The
inve
stm
ent s
eeks
to p
rovi
de fo
r ret
irem
ent o
utco
mes
bas
ed o
n qu
antit
ativ
ely
mea
sure
d ris
k. T
he fu
nd is
a 'f
eede
r' fu
nd th
at in
vest
s al
l of i
ts a
sset
s in
the
Mas
ter P
ortf
olio
, a s
erie
s of
Mas
ter I
nves
tmen
tPo
rtfo
lio ('
MIP
') w
ith a
sub
stan
tially
iden
tical
inve
stm
ent o
bjec
tive,
whi
ch a
lloca
tes
and
real
loca
tes
its a
sset
s am
ong
a co
mbi
natio
n of
equ
ity a
nd b
ond
inde
x fu
nds
and
mon
ey m
arke
t fun
ds (t
he 'u
nder
lyin
gfu
nds'
) in
prop
ortio
ns b
ased
on
its o
wn
com
preh
ensi
ve in
vest
men
t str
ateg
y.
Man
ager
Vs
Benc
hmar
k Pe
rfor
man
ce
20 18 16 14 12 10 8 6 4 2 010
Yea
rs5
Year
s3
Year
s1
Year
YTD
22 20 18 16 14 12 10 8 6 4 2 0 -2 -43
Year
s1
Year
YTD
25 20 15 10 5 0 -5 -10
-15
2015
2016
2017
2018
YTD
40 20 0
-20
2017
2018
YTD
Blac
kRoc
k Li
fePa
th®
Inde
x 20
60 K
Mor
ning
star
Life
time
Mod
206
0 TR
USD
Inve
stm
ent N
ame
Annu
aliz
ed R
etur
nsCa
lend
ar Y
ear R
etur
ns
Last
Qtr
YTD
1 Yea
r3
Year
5Yea
r10
Yea
rIT
DIn
cept
ion
Dat
e20
1820
1720
1620
1520
14
Blac
kRoc
k Li
fePa
th®
Inde
x 20
60 K
0.45
%16
.95%
3.30
%9.
58%
--
12.2
5%02
/29/
2016
(7.8
4%)
21.5
1%-
--
Mor
ning
star L
ifetim
e M
od 2
060
TR U
SD0.
26%
15.9
1%2.2
2%9.
18%
6.71
%-
--
(8.6
9%)
21.0
6%10
.88%
(3.4
8%)
4.53
%
Mor
ning
star T
arge
t-Dat
e 20
60+
0.18
%16
.09%
1.89%
9.20
%7.2
0%-
--
(8.4
8%)
21.22
%8.
06%
(1.00
%)
5.25%
Mor
ning
star
Rat
ing:
***
*
The
perfo
rman
ce d
ata
quot
ed re
pres
ents
pas
t per
form
ance
. Pas
t per
form
ance
doe
s no
t gua
rant
ee fu
ture
resu
lts. I
nves
tmen
t ret
urn
and
prin
cipal
val
ue w
ill flu
ctua
te so
that
an
inve
stor's
shar
es, w
hen
rede
emed
, may
be
worth
mor
e or
less
than
their
orig
inal
cost.
Cur
rent
per
form
ance
may
be
lowe
r or h
ighe
r tha
n th
e pe
rform
ance
info
rmat
ion
quot
ed. T
he p
erfo
rman
ce q
uote
d re
flect
s the
rein
vestm
ent o
f divi
dend
s and
capi
tal g
ains
and
isne
t of a
ll ex
pens
es. T
o ob
tain
curre
nt m
onth
-end
per
form
ance
info
rmat
ion,
plea
se co
ntac
t the
pho
ne n
umbe
r loc
ated
in th
e "Im
porta
nt D
isclo
sure
s" se
ctio
n of
this
repo
rt. F
or so
urce
info
rmat
ion,
plea
se se
e th
e "Im
porta
ntDi
sclo
sure
s" se
ctio
n of
this
repo
rt. P
lease
see
furth
er d
etai
ls on
the
scor
ing
met
hodo
logy
in th
e "In
vestm
ent S
corin
g M
etho
dolo
gy" s
ectio
n of
this
repo
rt.Pe
er g
roup
s ba
sed
on M
orni
ngst
ar c
ateg
ory.
Fund
rank
ings
are
bas
ed o
n tr
ailin
g to
tal r
etur
ns, i
nclu
ding
rein
vest
men
t of d
ivid
ends
and
cap
ital g
ains
. Fun
ds a
re ra
nked
bet
wee
n 1
and
100,
with
1 b
eing
the
top
perc
entil
e an
d 10
0 be
ing
the
bott
om p
erce
ntile
. The
rank
ing
is fo
r the
indi
cate
d sh
are
clas
s; ot
her s
hare
cla
sses
may
hav
e a
diffe
rent
per
form
ance
rank
ing.
Pag
e 80
|
136

BLAC
KRO
CK LI
FEPA
TH®
INDE
X 20
60 K
| FU
ND
FACT
SHE
ET
For P
lan
Spon
sor U
se O
nly
Com
mun
ity A
ctio
n Pa
rtne
rshi
p ER
ISA
403(
b) In
vest
men
t Rev
iew
| Pe
riod
Endi
ng 0
9/30
/201
9
Hist
oric
al G
lidep
ath
Tim
e Pe
riod:
03/
31/2
016
- 09
/30/
2019
100% 80%
60%
40%
20% 0%
09/19
03/19
03/18
03/17
03/16
03/15
Stoc
kBo
ndCa
shO
ther
Equi
ty R
egio
nal D
istrib
utio
n
Tim
e Pe
riod:
03/
31/2
016
- 09
/30/
2019
100 80 60 40 20 0
09/19
03/19
03/18
03/17
03/16
03/15
Nor
th A
mer
ica
%La
tin A
mer
ica
%U
nite
d Ki
ngdo
m %
Euro
pe d
ev %
Euro
pe e
mrg
%Af
rica/
Mid
dle
East
%
Asia
%
Sect
or D
istrib
utio
n
Tim
e Pe
riod:
03/
31/2
016
- 09
/30/
2019
100 80 60 40 20 0
09/19
03/19
03/18
03/17
03/16
03/15
Tech
nolo
gyCo
mm
unic
atio
n Se
rvic
esCo
nsum
er C
yclic
al
Cons
umer
Def
ensi
veO
ther
Bond
Dist
ribut
ion
Tim
e Pe
riod:
03/
31/2
016
- 09
/30/
2019
100 80 60 40 20 0
09/19
03/19
03/18
03/17
03/16
03/15
Dom
estic
Bon
dFo
reig
n Bo
ndPr
efer
red
Stoc
ks
Conv
ertib
le B
ond
Oth
er
Risk
/Ret
urn
vs P
eer G
roup
Standard Deviation
20 18 16 14 12 10 8 6 4 2 010
yea
rs5
year
s3
year
s1
year
YTD
Sharpe Ratio
2 1 0 -13
year
s1
year
YTD
Information Ratio
2 1 0 -1 -23
year
s1
year
YTD
Blac
kRoc
k Li
fePa
th®
Inde
x 20
60 K
Mor
ning
star
Life
time
Mod
206
0 TR
USD
Fund
Bas
ics
Tick
erLI
ZKX
Cate
gory
Targ
et-D
ate
2060
+
Net
Ass
ets(
This
Cla
ss $
mn)
314
m
Net
Ass
ets(
All C
lass
es $
mn)
0 m
Man
ager
Alan
Mas
on
Man
ager
Ten
ure
3.58
Fund
Ince
ptio
nFe
b 29
,201
6
Fee
And
Expe
nses
Expe
nse
Ratio
0.12
Gro
ss E
xpen
se R
atio
0.32
Pros
pect
us N
et E
xpen
se R
atio
0.10
Pros
pect
us G
ross
Exp
ense
Rat
io0.
37
Actu
al 1
2b1
0.00
Man
agem
ent F
ee0.
05
Cum
ulat
ive
Perf
orm
ance
Tim
e Pe
riod:
03/
31/2
016
- 09
/30/
2019
Growth of $100
161
154
147
140
133
126
119
111
104 97 90
09/1
901
/19
07/1
801
/18
07/1
701
/17
02/1
6
Blac
kRoc
k Li
fePa
th®
Inde
x 20
60 K
Mor
ning
star
Life
time
Mod
206
0 TR
USD
Gro
wth
of $
100
is c
alcu
late
d at
NAV
and
ass
umes
that
all
divi
dend
and
cap
ital g
ain
dist
ribut
ions
wer
e re
inve
sted
. It d
oes
not t
ake
into
acc
ount
sal
esch
arge
s or
the
effe
ct o
f tax
es. R
esul
ts a
re n
ot in
dica
tive
of fu
ture
per
form
ance
.
Pag
e 81
|
137

MFS
VAL
UE R
6 | F
UND
FACT
SHE
ET
For P
lan
Spon
sor U
se O
nly
Com
mun
ity A
ctio
n Pa
rtne
rshi
p ER
ISA
403(
b) In
vest
men
t Rev
iew
| Pe
riod
Endi
ng 0
9/30
/201
9
IPS
Scor
eRe
turn
1Yr
Retu
rn3Y
rRe
turn
5Yr
Shar
pe3Y
rSh
arpe
5Yr
Info
Ratio
3Yr
Info
Ratio
5Yr
Man
ager
Tenu
reEx
pens
eRa
tioSt
yle
Cons
isten
cy(R
BSA)
Up/
Dow
nCa
ptur
e5Y
r
93 Pass
ing
Crite
ria S
corin
g7.
52%
10.5
4%9.
25%
0.75
0.72
0.43
0.61
17.6
60.
48%
10.6
71.
11
Peer
Gro
up S
corin
g1.9
2%9.
43%
7.30%
0.66
0.57
0.02
-0.15
9.77
0.95
%14
.211.0
2
Crite
ria P
eer R
anki
ng11
3015
2819
266
1414
3721
Inve
stm
ent S
trat
egy
The
inve
stm
ent s
eeks
cap
ital a
ppre
ciat
ion.
The
fund
nor
mal
ly in
vest
s th
e fu
nd's
asse
ts p
rimar
ily in
equ
ity s
ecur
ities
. Equ
ity s
ecur
ities
incl
ude
com
mon
sto
cks
and
othe
r sec
uriti
es th
at re
pres
ent a
n ow
ners
hip
inte
rest
(or r
ight
t o a
cqui
re a
n ow
ners
hip
inte
rest
) in
a co
mpa
ny o
r oth
er is
suer
. MFS
focu
ses
on in
vest
ing
the
fund
's as
sets
in th
e st
ocks
of c
ompa
nies
it b
elie
ves
are
unde
rval
ued
com
pare
d to
thei
rpe
rcei
ved
wor
th (v
alue
com
pani
es).
Man
ager
Vs
Benc
hmar
k Pe
rfor
man
ce
24 22 20 18 16 14 12 10 8 6 4 2 010
Yea
rs5
Year
s3
Year
s1
Year
YTD
25 20 15 10 5 0 -5 -10
-15
-20
-25
5 Ye
ars
3 Ye
ars
1 Ye
arYT
D
25 20 15 10 5 0 -5 -10
-15
2015
2016
2017
2018
YTD
40 20 0
-20
2014
2015
2016
2017
2018
YTD
MFS
Val
ue R
6Ru
ssel
l 100
0 Va
lue
TR U
SD
Inve
stm
ent N
ame
Annu
aliz
ed R
etur
nsCa
lend
ar Y
ear R
etur
ns
Last
Qtr
YTD
1 Yea
r3
Year
5Yea
r10
Yea
rIT
DIn
cept
ion
Dat
e20
1820
1720
1620
1520
14
MFS
Val
ue R
62.
50%
21.5
4%7.
52%
10.5
4%9.
25%
11.6
7%10
.15%
01/0
2/19
96(9
.78%
)17
.86%
14.2
5%(0
.42%
)10
.68%
Russ
ell 10
00 V
alue
TR
USD
1.36%
17.8
1%4.
00%
9.43
%7.7
9%11
.46%
--
(8.27
%)
13.6
6%17
.34%
(3.8
3%)
13.4
5%
Mor
ning
star L
arge
Val
ue1.5
2%16
.43%
1.92%
9.43
%7.3
0%10
.67%
--
(8.53
%)
16.15
%15
.24%
(3.52
%)
11.0
2%
Mor
ning
star
Rat
ing:
***
*
The
perfo
rman
ce d
ata
quot
ed re
pres
ents
pas
t per
form
ance
. Pas
t per
form
ance
doe
s no
t gua
rant
ee fu
ture
resu
lts. I
nves
tmen
t ret
urn
and
prin
cipal
val
ue w
ill flu
ctua
te so
that
an
inve
stor's
shar
es, w
hen
rede
emed
, may
be
worth
mor
e or
less
than
their
orig
inal
cost.
Cur
rent
per
form
ance
may
be
lowe
r or h
ighe
r tha
n th
e pe
rform
ance
info
rmat
ion
quot
ed. T
he p
erfo
rman
ce q
uote
d re
flect
s the
rein
vestm
ent o
f divi
dend
s and
capi
tal g
ains
and
isne
t of a
ll ex
pens
es. T
o ob
tain
curre
nt m
onth
-end
per
form
ance
info
rmat
ion,
plea
se co
ntac
t the
pho
ne n
umbe
r loc
ated
in th
e "Im
porta
nt D
isclo
sure
s" se
ctio
n of
this
repo
rt. F
or so
urce
info
rmat
ion,
plea
se se
e th
e "Im
porta
ntDi
sclo
sure
s" se
ctio
n of
this
repo
rt. P
lease
see
furth
er d
etai
ls on
the
scor
ing
met
hodo
logy
in th
e "In
vestm
ent S
corin
g M
etho
dolo
gy" s
ectio
n of
this
repo
rt.Pe
er g
roup
s ba
sed
on M
orni
ngst
ar c
ateg
ory.
Fund
rank
ings
are
bas
ed o
n tr
ailin
g to
tal r
etur
ns, i
nclu
ding
rein
vest
men
t of d
ivid
ends
and
cap
ital g
ains
. Fun
ds a
re ra
nked
bet
wee
n 1
and
100,
with
1 b
eing
the
top
perc
entil
e an
d 10
0 be
ing
the
bott
om p
erce
ntile
. The
rank
ing
is fo
r the
indi
cate
d sh
are
clas
s; ot
her s
hare
cla
sses
may
hav
e a
diffe
rent
per
form
ance
rank
ing.
Pag
e 82
|
138

MFS
VAL
UE R
6 | F
UND
FACT
SHE
ET
For P
lan
Spon
sor U
se O
nly
Com
mun
ity A
ctio
n Pa
rtne
rshi
p ER
ISA
403(
b) In
vest
men
t Rev
iew
| Pe
riod
Endi
ng 0
9/30
/201
9
Port
folio
Com
posit
ion
Tim
e Pe
riod:
10/
30/2
014
- 09
/30/
2019
100% 80%
60%
40%
20% 0%
09/19
03/19
03/18
03/17
03/16
03/15
Stoc
kBo
ndCa
shO
ther
Bond
Dist
ribut
ion
Tim
e Pe
riod:
10/
30/2
014
- 09
/30/
2019
100 80 60 40 20 0
09/19
03/19
03/18
03/17
03/16
03/15
Dom
estic
Bon
dFo
reig
n Bo
ndPr
efer
red
Stoc
ks
Conv
ertib
le B
ond
Oth
er
Equi
ty R
egio
nal D
istrib
utio
n
Tim
e Pe
riod:
10/
30/2
014
- 09
/30/
2019
100 80 60 40 20 0
09/19
03/19
03/18
03/17
03/16
03/15
Nor
th A
mer
ica
%La
tin A
mer
ica
%U
nite
d Ki
ngdo
m %
Euro
pe d
ev %
Euro
pe e
mrg
%Af
rica/
Mid
dle
East
%
Asia
%
Sect
or D
istrib
utio
n
Tim
e Pe
riod:
10/
30/2
014
- 09
/30/
2019
100 80 60 40 20 0
09/19
03/19
03/18
03/17
03/16
03/15
Tech
nolo
gyCo
mm
unic
atio
n Se
rvic
esCo
nsum
er C
yclic
al
Cons
umer
Def
ensi
veO
ther
Styl
e An
alys
is
Small - Large
2 1 0 -1 -2
Valu
e -
Gro
wth
21
0-1
-21 0 -1
-11
0
Smal
l Gro
wth
Smal
l Val
ue
Mid
Gro
wth
Mid
Val
ue
Top
Gro
wth
Top
Valu
e
Risk
/Ret
urn
vs P
eer G
roup
Standard Deviation
22 20 18 16 14 12 10 8 6 4 2 010
yea
rs5
year
s3
year
s1
year
YTD
Sharpe Ratio
2 1 0 -110
yea
rs5
year
s3
year
s1
year
YTD
Information Ratio
2 1 0 -1 -2 -310
yea
rs5
year
s3
year
s1
year
YTD
MFS
Val
ue R
6Ru
ssel
l 100
0 Va
lue
TR U
SD
Fund
Bas
ics
Tick
erM
EIKX
Cate
gory
Larg
e Va
lue
Net
Ass
ets(
This
Cla
ss $
mn)
48,9
27 m
Net
Ass
ets(
All C
lass
es $
mn)
0 m
Man
ager
Stev
en G
orha
m
Man
ager
Ten
ure
17.6
6
Fund
Ince
ptio
nJa
n 02
,199
6
Fee
And
Expe
nses
Expe
nse
Ratio
0.47
Gro
ss E
xpen
se R
atio
0.47
Pros
pect
us N
et E
xpen
se R
atio
0.48
Pros
pect
us G
ross
Exp
ense
Rat
io0.
48
Actu
al 1
2b1
0.00
Man
agem
ent F
ee0.
46
Top
10 H
oldi
ngs
(%)
JPM
orga
n Ch
ase
& C
o4.
43
John
son
& Jo
hnso
n3.
24
Acce
ntur
e PL
C Cl
ass
A3.
01
Med
tron
ic P
LC3.
00
Com
cast
Cor
p Cl
ass
A3.
00
Aon
PLC
2.38
Nor
thro
p G
rum
man
Cor
p2.
28
Texa
s In
stru
men
ts In
c2.
24
Duk
e En
ergy
Cor
p2.
20
U.S
. Ban
corp
2.12
Cum
ulat
ive
Perf
orm
ance
Tim
e Pe
riod:
01/
30/2
014
- 09
/30/
2019
Growth of $100
166
166
158
150
142
134
126
118
110
102 94 86
09/1
901
/19
07/1
801
/18
07/1
701
/17
07/1
601
/16
07/1
509
/14
MFS
Val
ue R
6
Russ
ell 1
000
Valu
e TR
USD
Gro
wth
of $
100
is c
alcu
late
d at
NAV
and
ass
umes
that
all
divi
dend
and
cap
ital g
ain
dist
ribut
ions
wer
e re
inve
sted
.It
does
not
take
into
acc
ount
sal
es c
harg
es o
r the
effe
ct o
f tax
es. R
esul
ts a
re n
ot in
dica
tive
of fu
ture
per
form
ance
.
Pag
e 83
|
139

ISHA
RES
S &
P 5
00 IN
DEX
K | F
UND
FACT
SHE
ET
For P
lan
Spon
sor U
se O
nly
Com
mun
ity A
ctio
n Pa
rtne
rshi
p ER
ISA
403(
b) In
vest
men
t Rev
iew
| Pe
riod
Endi
ng 0
9/30
/201
9
IPS
Scor
eTr
acki
ngEr
ror
1Yr
Trac
king
Erro
r3Y
r
Trac
king
Erro
r5Y
rEx
pens
eRa
tioAU
M
Expe
nse
adj.
1Yr
Out
per f.
Inde
x
Expe
nse
adj.
3Yr
Out
per f.
Inde
x
Expe
nse
adj.
5Yr
Out
per f.
Inde
x
100
Pass
ing
Crite
ria S
corin
g0.
04%
0.03
%0.
03%
0.03
%$2
0,09
7,60
1,40
04.
31%
13.4
0%10
.84%
Peer
Gro
up S
corin
g3.
36%
2.88%
2.92%
0.89
%-
--
-
Crite
ria P
eer R
anki
ng3
22
2-
3217
12
Inve
stm
ent S
trat
egy
The
inve
stm
ent s
eeks
to p
rovi
de in
vest
men
t res
ults
that
cor
resp
ond
to th
e to
tal r
etur
n pe
rfor
man
ce o
f pub
licly
-tra
ded
com
mon
sto
cks
in th
e ag
greg
ate,
as
repr
esen
ted
by th
e St
anda
rd &
Poo
r's 5
00®
Inde
x. T
he fu
nd is
a 'f
eede
r' fu
nd th
at in
vest
s al
l of i
ts a
sset
s in
the
Mas
ter P
ortf
olio
of M
IP, w
hich
has
the
sam
e in
vest
men
t obj
ectiv
e an
d st
rate
gies
as
the
fund
. At l
east
90%
of t
he v
alue
of t
he fu
nd's
asse
tsis
inve
sted
in s
ecur
ities
com
pris
ing
the
S&P
500
Inde
x. T
he p
erce
ntag
e of
the
fund
's as
sets
inve
sted
in a
giv
en s
tock
is a
ppro
xim
atel
y th
e sa
me
as th
e pe
rcen
tage
suc
h st
ock
repr
esen
ts in
the
S&P
500
Inde
x.
Man
ager
Vs
Benc
hmar
k Pe
rfor
man
ce
24 22 20 18 16 14 12 10 8 6 4 2 010
Yea
rs5
Year
s3
Year
s1
Year
YTD
30 25 20 15 10 5 0 -5 -10
-15
-20
-25
-30
5 Ye
ars
3 Ye
ars
1 Ye
arYT
D
25 20 15 10 5 0 -5 -10
2015
2016
2017
2018
YTD
40 20 0
-20
2014
2015
2016
2017
2018
YTD
iSha
res
S&P
500
Inde
x K
S&P
500
TR U
SD
Inve
stm
ent N
ame
Annu
aliz
ed R
etur
nsCa
lend
ar Y
ear R
etur
ns
Last
Qtr
YTD
1 Yea
r3
Year
5Yea
r10
Yea
rIT
DIn
cept
ion
Dat
e20
1820
1720
1620
1520
14
iSha
res
S&P
500
Inde
x K
1.71
%20
.53%
4.28
%13
.37%
10.8
1%13
.16%
9.47
%07
/30/
1993
(4.3
8%)
21.7
7%11
.92%
1.35
%13
.61%
S&P
500
TR U
SD1.7
0%20
.55%
4.25
%13
.39%
10.8
4%13
.24%
--
(4.3
8%)
21.8
3%11
.96%
1.38%
13.6
9%
Mor
ning
star L
arge
Blen
d1.4
5%18
.99%
3.02
%11
.69%
8.96
%11
.76%
--
(6.17
%)
20.53
%10
.86%
(0.6
5%)
11.55
%
Mor
ning
star
Rat
ing:
***
**
The
perfo
rman
ce d
ata
quot
ed re
pres
ents
pas
t per
form
ance
. Pas
t per
form
ance
doe
s no
t gua
rant
ee fu
ture
resu
lts. I
nves
tmen
t ret
urn
and
prin
cipal
val
ue w
ill flu
ctua
te so
that
an
inve
stor's
shar
es, w
hen
rede
emed
, may
be
worth
mor
e or
less
than
their
orig
inal
cost.
Cur
rent
per
form
ance
may
be
lowe
r or h
ighe
r tha
n th
e pe
rform
ance
info
rmat
ion
quot
ed. T
he p
erfo
rman
ce q
uote
d re
flect
s the
rein
vestm
ent o
f divi
dend
s and
capi
tal g
ains
and
isne
t of a
ll ex
pens
es. T
o ob
tain
curre
nt m
onth
-end
per
form
ance
info
rmat
ion,
plea
se co
ntac
t the
pho
ne n
umbe
r loc
ated
in th
e "Im
porta
nt D
isclo
sure
s" se
ctio
n of
this
repo
rt. F
or so
urce
info
rmat
ion,
plea
se se
e th
e "Im
porta
ntDi
sclo
sure
s" se
ctio
n of
this
repo
rt. P
lease
see
furth
er d
etai
ls on
the
scor
ing
met
hodo
logy
in th
e "In
vestm
ent S
corin
g M
etho
dolo
gy" s
ectio
n of
this
repo
rt.Pe
er g
roup
s ba
sed
on M
orni
ngst
ar c
ateg
ory.
Fund
rank
ings
are
bas
ed o
n tr
ailin
g to
tal r
etur
ns, i
nclu
ding
rein
vest
men
t of d
ivid
ends
and
cap
ital g
ains
. Fun
ds a
re ra
nked
bet
wee
n 1
and
100,
with
1 b
eing
the
top
perc
entil
e an
d 10
0 be
ing
the
bott
om p
erce
ntile
. The
rank
ing
is fo
r the
indi
cate
d sh
are
clas
s; ot
her s
hare
cla
sses
may
hav
e a
diffe
rent
per
form
ance
rank
ing.
Pag
e 84
|
140

ISHA
RES
S &
P 5
00 IN
DEX
K | F
UND
FACT
SHE
ET
For P
lan
Spon
sor U
se O
nly
Com
mun
ity A
ctio
n Pa
rtne
rshi
p ER
ISA
403(
b) In
vest
men
t Rev
iew
| Pe
riod
Endi
ng 0
9/30
/201
9
Port
folio
Com
posit
ion
Tim
e Pe
riod:
10/
30/2
014
- 09
/30/
2019
100% 80%
60%
40%
20% 0%
09/19
03/19
03/18
03/17
03/16
03/15
Stoc
kBo
ndCa
shO
ther
Bond
Dist
ribut
ion
Tim
e Pe
riod:
10/
30/2
014
- 09
/30/
2019
100 80 60 40 20 0
09/19
03/19
03/18
03/17
03/16
03/15
Dom
estic
Bon
dFo
reig
n Bo
ndPr
efer
red
Stoc
ks
Conv
ertib
le B
ond
Oth
er
Equi
ty R
egio
nal D
istrib
utio
n
Tim
e Pe
riod:
10/
30/2
014
- 09
/30/
2019
100 80 60 40 20 0
09/19
03/19
03/18
03/17
03/16
03/15
Nor
th A
mer
ica
%La
tin A
mer
ica
%U
nite
d Ki
ngdo
m %
Euro
pe d
ev %
Euro
pe e
mrg
%Af
rica/
Mid
dle
East
%
Asia
%
Sect
or D
istrib
utio
n
Tim
e Pe
riod:
10/
30/2
014
- 09
/30/
2019
100 80 60 40 20 0
09/19
03/19
03/18
03/17
03/16
03/15
Tech
nolo
gyCo
mm
unic
atio
n Se
rvic
esCo
nsum
er C
yclic
al
Cons
umer
Def
ensi
veO
ther
Styl
e An
alys
is
Small - Large
2 1 0 -1 -2
Valu
e -
Gro
wth
21
0-1
-21 0 -1
-11
0
Smal
l Gro
wth
Smal
l Val
ue
Mid
Gro
wth
Mid
Val
ue
Top
Gro
wth
Top
Valu
e
Risk
/Ret
urn
vs P
eer G
roup
Standard Deviation
22 20 18 16 14 12 10 8 6 4 2 010
yea
rs5
year
s3
year
s1
year
YTD
Sharpe Ratio
3 2 1 0 -110
yea
rs5
year
s3
year
s1
year
YTD
Information Ratio
2 1 0 -1 -2 -310
yea
rs5
year
s3
year
s1
year
YTD
iSha
res
S&P
500
Inde
x K
S&P
500
TR U
SD
Fund
Bas
ics
Tick
erW
FSPX
Cate
gory
Larg
e Bl
end
Net
Ass
ets(
This
Cla
ss $
mn)
20,0
98 m
Net
Ass
ets(
All C
lass
es $
mn)
0 m
Man
ager
Gre
g Sa
vage
Man
ager
Ten
ure
11.6
6
Fund
Ince
ptio
nJu
l 30,
1993
Fee
And
Expe
nses
Expe
nse
Ratio
0.04
Gro
ss E
xpen
se R
atio
0.04
Pros
pect
us N
et E
xpen
se R
atio
0.03
Pros
pect
us G
ross
Exp
ense
Rat
io0.
03
Actu
al 1
2b1
0.00
Man
agem
ent F
ee0.
01
Top
10 H
oldi
ngs
(%)
Mic
roso
ft C
orp
4.25
Appl
e In
c3.
67
Amaz
on.c
om In
c2.
96
Face
book
Inc
A1.
80
Berk
shire
Hat
haw
ay In
c B
1.59
Alph
abet
Inc
Clas
s C
1.47
Alph
abet
Inc
A1.
44
JPM
orga
n Ch
ase
& C
o1.
44
John
son
& Jo
hnso
n1.
37
Visa
Inc
Clas
s A
1.27
Cum
ulat
ive
Perf
orm
ance
Tim
e Pe
riod:
01/
30/2
014
- 09
/30/
2019
Growth of $100
177
168
160
151
142
133
125
116
107 98 89
09/1
901
/19
07/1
801
/18
07/1
701
/17
07/1
601
/16
07/1
509
/14
iSha
res
S&P
500
Inde
x K
S&P
500
TR U
SD
Gro
wth
of $
100
is c
alcu
late
d at
NAV
and
ass
umes
that
all
divi
dend
and
cap
ital g
ain
dist
ribut
ions
wer
e re
inve
sted
.It
does
not
take
into
acc
ount
sal
es c
harg
es o
r the
effe
ct o
f tax
es. R
esul
ts a
re n
ot in
dica
tive
of fu
ture
per
form
ance
.
Pag
e 85
|
141

TIAA
-CRE
F LAR
GE-C
AP G
ROW
TH IN
ST |
FUN
D FA
CT S
HEET
For P
lan
Spon
sor U
se O
nly
Com
mun
ity A
ctio
n Pa
rtne
rshi
p ER
ISA
403(
b) In
vest
men
t Rev
iew
| Pe
riod
Endi
ng 0
9/30
/201
9
IPS
Scor
eRe
turn
1Yr
Retu
rn3Y
rRe
turn
5Yr
Shar
pe3Y
rSh
arpe
5Yr
Info
Ratio
3Yr
Info
Ratio
5Yr
Man
ager
Tenu
reEx
pens
eRa
tioSt
yle
Cons
isten
cy(R
BSA)
Up/
Dow
nCa
ptur
e5Y
r
85 Pass
ing
Crite
ria S
corin
g0.
27%
16.3
5%13
.04%
1.06
0.89
-0.1
8-0
.11
13.5
00.
41%
8.92
0.94
Peer
Gro
up S
corin
g1.8
6%14
.60%
11.0
0%0.
960.
78-0
.66
-0.6
510
.86
1.05%
13.3
80.
90
Crite
ria P
eer R
anki
ng68
2722
3026
2822
357
3035
Inve
stm
ent S
trat
egy
The
inve
stm
ent s
eeks
a fa
vora
ble
long
-ter
m re
turn
, mai
nly
thro
ugh
capi
tal a
ppre
ciat
ion,
prim
arily
from
equ
ity s
ecur
ities
. Und
er n
orm
al c
ircum
stan
ces,
the
fund
inve
sts
at le
ast 8
0% o
f its
ass
ets
in la
rge-
cap
equi
ty s
ecur
ities
. It w
ill in
vest
prim
arily
in la
rge-
cap
equi
ty s
ecur
ities
that
the
fund
' s in
vest
men
t adv
iser
bel
ieve
s pr
esen
t the
opp
ortu
nity
for g
row
th. T
he fu
nd a
lso
seek
s to
inve
st in
com
pani
es e
xpec
ted
tobe
nefit
from
pro
spec
tive
acqu
isiti
ons,
reor
gani
zatio
ns, c
orpo
rate
rest
ruct
urin
gs o
r oth
er s
peci
al s
ituat
ions
. It m
ay in
vest
up
to 2
0% o
f its
ass
ets
in fo
reig
n in
vest
men
ts.
Man
ager
Vs
Benc
hmar
k Pe
rfor
man
ce
30 25 20 15 10 5 010
Yea
rs5
Year
s3
Year
s1
Year
YTD
35 30 25 20 15 10 5 0 -5 -10
-15
-20
-25
-30
5 Ye
ars
3 Ye
ars
1 Ye
arYT
D
40 35 30 25 20 15 10 5 0 -52015
2016
2017
2018
YTD
40 20 0
-20
2014
2015
2016
2017
2018
YTD
TIAA
-CRE
F La
rge-
Cap
Gro
wth
Inst
Russ
ell 1
000
Gro
wth
TR
USD
Inve
stm
ent N
ame
Annu
aliz
ed R
etur
nsCa
lend
ar Y
ear R
etur
ns
Last
Qtr
YTD
1 Yea
r3
Year
5Yea
r10
Yea
rIT
DIn
cept
ion
Dat
e20
1820
1720
1620
1520
14
TIAA
-CRE
F La
rge-
Cap
Gro
wth
Inst
(0.9
0%)
20.0
8%0.
27%
16.3
5%13
.04%
14.7
2%9.
99%
03/3
1/20
060.
04%
34.5
1%(0
.85%
)9.
20%
11.2
2%
Russ
ell 10
00 G
rowt
h TR
USD
1.49%
23.3
0%3.
71%
16.8
9%13
.39%
14.9
4%-
-(1.
51%
)30
.21%
7.08%
5.67%
13.0
5%
Mor
ning
star L
arge
Gro
wth
(0.4
7%)
20.53
%1.8
6%14
.60%
11.0
0%13
.08%
--
(2.21
%)
27.76
%3.
65%
3.61
%10
.65%
Mor
ning
star
Rat
ing:
***
*
The
perfo
rman
ce d
ata
quot
ed re
pres
ents
pas
t per
form
ance
. Pas
t per
form
ance
doe
s no
t gua
rant
ee fu
ture
resu
lts. I
nves
tmen
t ret
urn
and
prin
cipal
val
ue w
ill flu
ctua
te so
that
an
inve
stor's
shar
es, w
hen
rede
emed
, may
be
worth
mor
e or
less
than
their
orig
inal
cost.
Cur
rent
per
form
ance
may
be
lowe
r or h
ighe
r tha
n th
e pe
rform
ance
info
rmat
ion
quot
ed. T
he p
erfo
rman
ce q
uote
d re
flect
s the
rein
vestm
ent o
f divi
dend
s and
capi
tal g
ains
and
isne
t of a
ll ex
pens
es. T
o ob
tain
curre
nt m
onth
-end
per
form
ance
info
rmat
ion,
plea
se co
ntac
t the
pho
ne n
umbe
r loc
ated
in th
e "Im
porta
nt D
isclo
sure
s" se
ctio
n of
this
repo
rt. F
or so
urce
info
rmat
ion,
plea
se se
e th
e "Im
porta
ntDi
sclo
sure
s" se
ctio
n of
this
repo
rt. P
lease
see
furth
er d
etai
ls on
the
scor
ing
met
hodo
logy
in th
e "In
vestm
ent S
corin
g M
etho
dolo
gy" s
ectio
n of
this
repo
rt.Pe
er g
roup
s ba
sed
on M
orni
ngst
ar c
ateg
ory.
Fund
rank
ings
are
bas
ed o
n tr
ailin
g to
tal r
etur
ns, i
nclu
ding
rein
vest
men
t of d
ivid
ends
and
cap
ital g
ains
. Fun
ds a
re ra
nked
bet
wee
n 1
and
100,
with
1 b
eing
the
top
perc
entil
e an
d 10
0 be
ing
the
bott
om p
erce
ntile
. The
rank
ing
is fo
r the
indi
cate
d sh
are
clas
s; ot
her s
hare
cla
sses
may
hav
e a
diffe
rent
per
form
ance
rank
ing.
Pag
e 86
|
142

TIAA
-CRE
F LAR
GE-C
AP G
ROW
TH IN
ST |
FUN
D FA
CT S
HEET
For P
lan
Spon
sor U
se O
nly
Com
mun
ity A
ctio
n Pa
rtne
rshi
p ER
ISA
403(
b) In
vest
men
t Rev
iew
| Pe
riod
Endi
ng 0
9/30
/201
9
Port
folio
Com
posit
ion
Tim
e Pe
riod:
10/
30/2
014
- 09
/30/
2019
100% 80%
60%
40%
20% 0%
09/19
03/19
03/18
03/17
03/16
03/15
Stoc
kBo
ndCa
shO
ther
Bond
Dist
ribut
ion
Tim
e Pe
riod:
10/
30/2
014
- 09
/30/
2019
100 80 60 40 20 0
09/19
03/19
03/18
03/17
03/16
03/15
Dom
estic
Bon
dFo
reig
n Bo
ndPr
efer
red
Stoc
ks
Conv
ertib
le B
ond
Oth
er
Equi
ty R
egio
nal D
istrib
utio
n
Tim
e Pe
riod:
10/
30/2
014
- 09
/30/
2019
100 80 60 40 20 0
09/19
03/19
03/18
03/17
03/16
03/15
Nor
th A
mer
ica
%La
tin A
mer
ica
%U
nite
d Ki
ngdo
m %
Euro
pe d
ev %
Euro
pe e
mrg
%Af
rica/
Mid
dle
East
%
Asia
%
Sect
or D
istrib
utio
n
Tim
e Pe
riod:
10/
30/2
014
- 09
/30/
2019
100 80 60 40 20 0
09/19
03/19
03/18
03/17
03/16
03/15
Tech
nolo
gyCo
mm
unic
atio
n Se
rvic
esCo
nsum
er C
yclic
al
Cons
umer
Def
ensi
veO
ther
Styl
e An
alys
is
Small - Large
2 1 0 -1 -2
Valu
e -
Gro
wth
21
0-1
-21 0 -1
-11
0
Smal
l Gro
wth
Smal
l Val
ue
Mid
Gro
wth
Mid
Val
ue
Top
Gro
wth
Top
Valu
e
Risk
/Ret
urn
vs P
eer G
roup
Standard Deviation
24 22 20 18 16 14 12 10 8 6 4 2 010
yea
rs5
year
s3
year
s1
year
YTD
Sharpe Ratio
3 2 1 0 -110
yea
rs5
year
s3
year
s1
year
YTD
Information Ratio
2 1 0 -1 -2 -310
yea
rs5
year
s3
year
s1
year
YTD
TIAA
-CRE
F La
rge-
Cap
Gro
wth
Inst
Russ
ell 1
000
Gro
wth
TR
USD
Fund
Bas
ics
Tick
erTI
LGX
Cate
gory
Larg
e G
row
th
Net
Ass
ets(
This
Cla
ss $
mn)
5,58
0 m
Net
Ass
ets(
All C
lass
es $
mn)
0 m
Man
ager
Susa
n H
irsch
Man
ager
Ten
ure
13.5
0
Fund
Ince
ptio
nM
ar 3
1,20
06
Fee
And
Expe
nses
Expe
nse
Ratio
0.41
Gro
ss E
xpen
se R
atio
0.41
Pros
pect
us N
et E
xpen
se R
atio
0.41
Pros
pect
us G
ross
Exp
ense
Rat
io0.
41
Actu
al 1
2b1
0.00
Man
agem
ent F
ee0.
40
Top
10 H
oldi
ngs
(%)
Mic
roso
ft C
orp
7.24
Amaz
on.c
om In
c5.
43
Mas
terc
ard
Inc
A3.
97
Face
book
Inc
A3.
78
Alph
abet
Inc
Clas
s C
2.85
Alph
abet
Inc
A2.
85
Appl
e In
c2.
84
Intu
it In
c2.
54
PayP
al H
oldi
ngs
Inc
2.46
Nik
e In
c B
2.42
Cum
ulat
ive
Perf
orm
ance
Tim
e Pe
riod:
01/
30/2
014
- 09
/30/
2019
Growth of $100
199
188
177
166
156
145
134
123
112
101 90
09/1
901
/19
07/1
801
/18
07/1
701
/17
07/1
601
/16
07/1
509
/14
TIAA
-CRE
F La
rge-
Cap
Gro
wth
Inst
Russ
ell 1
000
Gro
wth
TR
USD
Gro
wth
of $
100
is c
alcu
late
d at
NAV
and
ass
umes
that
all
divi
dend
and
cap
ital g
ain
dist
ribut
ions
wer
e re
inve
sted
.It
does
not
take
into
acc
ount
sal
es c
harg
es o
r the
effe
ct o
f tax
es. R
esul
ts a
re n
ot in
dica
tive
of fu
ture
per
form
ance
.
Pag
e 87
|
143

WEL
LS FA
RGO
SPE
CIAL
MID
CAP
VAL
UE IN
ST |
FUN
D FA
CT S
HEET
For P
lan
Spon
sor U
se O
nly
Com
mun
ity A
ctio
n Pa
rtne
rshi
p ER
ISA
403(
b) In
vest
men
t Rev
iew
| Pe
riod
Endi
ng 0
9/30
/201
9
IPS
Scor
eRe
turn
1Yr
Retu
rn3Y
rRe
turn
5Yr
Shar
pe3Y
rSh
arpe
5Yr
Info
Ratio
3Yr
Info
Ratio
5Yr
Man
ager
Tenu
reEx
pens
eRa
tioSt
yle
Cons
isten
cy(R
BSA)
Up/
Dow
nCa
ptur
e5Y
r
96 Pass
ing
Crite
ria S
corin
g8.
17%
9.18
%8.
77%
0.63
0.68
0.45
0.39
10.6
60.
83%
12.7
51.
13
Peer
Gro
up S
corin
g-2
.14%
7.04%
6.26
%0.
440.
45-0
.12-0
.259.
631.0
5%15
.99
0.94
Crite
ria P
eer R
anki
ng2
1510
88
1610
4030
319
Inve
stm
ent S
trat
egy
The
inve
stm
ent s
eeks
long
-ter
m c
apita
l app
reci
atio
n. T
he fu
nd n
orm
ally
inve
sts
at le
ast 8
0% o
f its
net
ass
ets
in e
quity
sec
uriti
es o
f med
ium
-cap
italiz
atio
n co
mpa
nies
. It i
nves
ts p
rinci
pally
in e
quity
sec
uriti
esof
med
ium
-cap
italiz
atio
n co
mpa
nies
, whi
ch th
e m
anag
er d
efine
s as
sec
uriti
es o
f com
pani
es w
ith m
arke
t cap
italiz
atio
ns w
ithin
the
rang
e of
the
Russ
ell M
idca
p® In
dex
at th
e tim
e of
pur
chas
e.
Man
ager
Vs
Benc
hmar
k Pe
rfor
man
ce
30 25 20 15 10 5 010
Yea
rs5
Year
s3
Year
s1
Year
YTD
30 25 20 15 10 5 0 -5 -10
-15
-20
-25
5 Ye
ars
3 Ye
ars
1 Ye
arYT
D
30 25 20 15 10 5 0 -5 -10
-15
-20
2015
2016
2017
2018
YTD
40 20 0
-20
2014
2015
2016
2017
2018
YTD
Wel
ls F
argo
Spe
cial
Mid
Cap
Val
ue In
stRu
ssel
l Mid
Cap
Val
ue T
R U
SD
Inve
stm
ent N
ame
Annu
aliz
ed R
etur
nsCa
lend
ar Y
ear R
etur
ns
Last
Qtr
YTD
1 Yea
r3
Year
5Yea
r10
Yea
rIT
DIn
cept
ion
Dat
e20
1820
1720
1620
1520
14
Wel
ls F
argo
Spe
cial
Mid
Cap
Val
ue In
st2.
60%
25.4
2%8.
17%
9.18
%8.
77%
13.0
4%11
.85%
04/0
8/20
05(1
3.10
%)
11.1
6%21
.59%
(2.7
3%)
12.0
4%
Russ
ell M
id C
ap V
alue
TR
USD
1.22%
19.4
7%1.6
0%7.8
2%7.5
5%12
.29%
--
(12.29
%)
13.3
4%20
.00%
(4.78
%)
14.75
%
Mor
ning
star M
id-C
ap V
alue
0.41
%16
.26%
(2.14
%)
7.04%
6.26
%10
.65%
--
(13.0
4%)
13.4
4%18
.86%
(5.24
%)
9.60
%
Mor
ning
star
Rat
ing:
***
**
The
perfo
rman
ce d
ata
quot
ed re
pres
ents
pas
t per
form
ance
. Pas
t per
form
ance
doe
s no
t gua
rant
ee fu
ture
resu
lts. I
nves
tmen
t ret
urn
and
prin
cipal
val
ue w
ill flu
ctua
te so
that
an
inve
stor's
shar
es, w
hen
rede
emed
, may
be
worth
mor
e or
less
than
their
orig
inal
cost.
Cur
rent
per
form
ance
may
be
lowe
r or h
ighe
r tha
n th
e pe
rform
ance
info
rmat
ion
quot
ed. T
he p
erfo
rman
ce q
uote
d re
flect
s the
rein
vestm
ent o
f divi
dend
s and
capi
tal g
ains
and
isne
t of a
ll ex
pens
es. T
o ob
tain
curre
nt m
onth
-end
per
form
ance
info
rmat
ion,
plea
se co
ntac
t the
pho
ne n
umbe
r loc
ated
in th
e "Im
porta
nt D
isclo
sure
s" se
ctio
n of
this
repo
rt. F
or so
urce
info
rmat
ion,
plea
se se
e th
e "Im
porta
ntDi
sclo
sure
s" se
ctio
n of
this
repo
rt. P
lease
see
furth
er d
etai
ls on
the
scor
ing
met
hodo
logy
in th
e "In
vestm
ent S
corin
g M
etho
dolo
gy" s
ectio
n of
this
repo
rt.Pe
er g
roup
s ba
sed
on M
orni
ngst
ar c
ateg
ory.
Fund
rank
ings
are
bas
ed o
n tr
ailin
g to
tal r
etur
ns, i
nclu
ding
rein
vest
men
t of d
ivid
ends
and
cap
ital g
ains
. Fun
ds a
re ra
nked
bet
wee
n 1
and
100,
with
1 b
eing
the
top
perc
entil
e an
d 10
0 be
ing
the
bott
om p
erce
ntile
. The
rank
ing
is fo
r the
indi
cate
d sh
are
clas
s; ot
her s
hare
cla
sses
may
hav
e a
diffe
rent
per
form
ance
rank
ing.
Pag
e 88
|
144

WEL
LS FA
RGO
SPE
CIAL
MID
CAP
VAL
UE IN
ST |
FUN
D FA
CT S
HEET
For P
lan
Spon
sor U
se O
nly
Com
mun
ity A
ctio
n Pa
rtne
rshi
p ER
ISA
403(
b) In
vest
men
t Rev
iew
| Pe
riod
Endi
ng 0
9/30
/201
9
Port
folio
Com
posit
ion
Tim
e Pe
riod:
10/
30/2
014
- 09
/30/
2019
100% 80%
60%
40%
20% 0%
09/19
03/19
03/18
03/17
03/16
03/15
Stoc
kBo
ndCa
shO
ther
Bond
Dist
ribut
ion
Tim
e Pe
riod:
10/
30/2
014
- 09
/30/
2019
100 80 60 40 20 0
09/19
03/19
03/18
03/17
03/16
03/15
Dom
estic
Bon
dFo
reig
n Bo
ndPr
efer
red
Stoc
ks
Conv
ertib
le B
ond
Oth
er
Equi
ty R
egio
nal D
istrib
utio
n
Tim
e Pe
riod:
10/
30/2
014
- 09
/30/
2019
100 80 60 40 20 0
09/19
03/19
03/18
03/17
03/16
03/15
Nor
th A
mer
ica
%La
tin A
mer
ica
%U
nite
d Ki
ngdo
m %
Euro
pe d
ev %
Euro
pe e
mrg
%Af
rica/
Mid
dle
East
%
Asia
%
Sect
or D
istrib
utio
n
Tim
e Pe
riod:
10/
30/2
014
- 09
/30/
2019
100 80 60 40 20 0
09/19
03/19
03/18
03/17
03/16
03/15
Tech
nolo
gyCo
mm
unic
atio
n Se
rvic
esCo
nsum
er C
yclic
al
Cons
umer
Def
ensi
veO
ther
Styl
e An
alys
is
Small - Large
2 1 0 -1 -2
Valu
e -
Gro
wth
21
0-1
-21 0 -1
-11
0
Smal
l Gro
wth
Smal
l Val
ue
Mid
Gro
wth
Mid
Val
ue
Top
Gro
wth
Top
Valu
e
Risk
/Ret
urn
vs P
eer G
roup
Standard Deviation
30 25 20 15 10 5 010
yea
rs5
year
s3
year
s1
year
YTD
Sharpe Ratio
2 1 0 -110
yea
rs5
year
s3
year
s1
year
YTD
Information Ratio
3 2 1 0 -1 -2 -310
yea
rs5
year
s3
year
s1
year
YTD
Wel
ls F
argo
Spe
cial
Mid
Cap
Val
ue In
stRu
ssel
l Mid
Cap
Val
ue T
R U
SD
Fund
Bas
ics
Tick
erW
FMIX
Cate
gory
Mid
-Cap
Val
ue
Net
Ass
ets(
This
Cla
ss $
mn)
9,23
1 m
Net
Ass
ets(
All C
lass
es $
mn)
0 m
Man
ager
Brya
nt V
anCr
onkh
ite
Man
ager
Ten
ure
10.6
6
Fund
Ince
ptio
nAp
r 08,
2005
Fee
And
Expe
nses
Expe
nse
Ratio
0.82
Gro
ss E
xpen
se R
atio
0.82
Pros
pect
us N
et E
xpen
se R
atio
0.83
Pros
pect
us G
ross
Exp
ense
Rat
io0.
83
Actu
al 1
2b1
0.00
Man
agem
ent F
ee0.
67
Top
10 H
oldi
ngs
(%)
Brow
n &
Bro
wn
Inc
3.04
Amer
ican
Wat
er W
orks
Co.
..2.
84
Kans
as C
ity S
outh
ern
2.84
Jaco
bs E
ngin
eerin
g G
rou.
..2.
80
Amdo
cs L
td2.
77
Amer
en C
orp
2.70
Amer
ican
Ele
ctric
Pow
er...
2.55
Repu
blic
Ser
vice
s In
c C.
..2.
53
Arch
Cap
ital G
roup
Ltd
2.31
CBRE
Gro
up In
c Cl
ass
A2.
23
Cum
ulat
ive
Perf
orm
ance
Tim
e Pe
riod:
01/
30/2
014
- 09
/30/
2019
Growth of $100
162
155
147
139
132
124
116
108
101 93 85
09/1
901
/19
07/1
801
/18
07/1
701
/17
07/1
601
/16
07/1
509
/14
Wel
ls F
argo
Spe
cial
Mid
Cap
Val
ue In
st
Russ
ell M
id C
ap V
alue
TR
USD
Gro
wth
of $
100
is c
alcu
late
d at
NAV
and
ass
umes
that
all
divi
dend
and
cap
ital g
ain
dist
ribut
ions
wer
e re
inve
sted
.It
does
not
take
into
acc
ount
sal
es c
harg
es o
r the
effe
ct o
f tax
es. R
esul
ts a
re n
ot in
dica
tive
of fu
ture
per
form
ance
.
Pag
e 89
|
145

VAN
GUAR
D M
ID C
AP IN
DEX
ADM
IRAL
| FU
ND
FACT
SHE
ET
For P
lan
Spon
sor U
se O
nly
Com
mun
ity A
ctio
n Pa
rtne
rshi
p ER
ISA
403(
b) In
vest
men
t Rev
iew
| Pe
riod
Endi
ng 0
9/30
/201
9
IPS
Scor
eTr
acki
ngEr
ror
1Yr
Trac
king
Erro
r3Y
r
Trac
king
Erro
r5Y
rEx
pens
eRa
tioAU
M
Expe
nse
adj.
1Yr
Out
per f.
Inde
x
Expe
nse
adj.
3Yr
Out
per f.
Inde
x
Expe
nse
adj.
5Yr
Out
per f.
Inde
x
100
Pass
ing
Crite
ria S
corin
g0.
02%
0.02
%0.
02%
0.05
%$1
05,4
04,4
35,5
363.
70%
10.7
2%9.
25%
Peer
Gro
up S
corin
g4.
76%
4.68
%4.
71%
1.00%
--
--
Crite
ria P
eer R
anki
ng2
22
3-
1919
15
Inve
stm
ent S
trat
egy
The
inve
stm
ent s
eeks
to tr
ack
the
perf
orm
ance
of a
ben
chm
ark
inde
x th
at m
easu
res
the
inve
stm
ent r
etur
n of
mid
-cap
italiz
atio
n st
ocks
. The
fund
em
ploy
s an
inde
inve
stm
ent a
ppro
ach
desi
gned
totr
ack
the
perf
orm
ance
of t
he C
RSP
US
Mid
Cap
Inde
x, a
bro
adly
div
ersi
fied
inde
x of
sto
cks
of m
id-s
ize
U.S
. com
pani
es. T
he a
dvis
or a
ttem
pts
to re
plic
ate
the
targ
et in
dex
by in
vest
ing
all,
or s
ubst
antia
lly a
ll,of
its
asse
ts in
the
stoc
ks th
at m
ake
up th
e in
dex,
hol
ding
eac
h st
ock
in a
ppro
xim
atel
y th
e sa
me
prop
ortio
n as
its
wei
ghtin
g in
the
inde
x.
Man
ager
Vs
Benc
hmar
k Pe
rfor
man
ce
26 24 22 20 18 16 14 12 10 8 6 4 2 010
Yea
rs5
Year
s3
Year
s1
Year
YTD
30 25 20 15 10 5 0 -5 -10
-15
-20
-25
5 Ye
ars
3 Ye
ars
1 Ye
arYT
D
25 20 15 10 5 0 -5 -10
-15
2015
2016
2017
2018
YTD
40 20 0
-20
2014
2015
2016
2017
2018
YTD
Vang
uard
Mid
Cap
Inde
x Ad
mira
lCR
SP U
S M
id C
ap T
R U
SD
Inve
stm
ent N
ame
Annu
aliz
ed R
etur
nsCa
lend
ar Y
ear R
etur
ns
Last
Qtr
YTD
1 Yea
r3
Year
5Yea
r10
Yea
rIT
DIn
cept
ion
Dat
e20
1820
1720
1620
1520
14
Vang
uard
Mid
Cap
Inde
x Ad
mira
l0.
61%
22.6
0%3.
65%
10.6
7%9.
20%
13.0
5%9.
92%
05/2
1/19
98(9
.23%
)19
.25%
11.2
2%(1
.34%
)13
.76%
CRSP
US
Mid
Cap
TR
USD
0.62
%22
.66%
3.70
%10
.70%
9.24
%13
.14%
--
(9.22
%)
19.3
0%11
.25%
(1.28
%)
13.8
3%
Mor
ning
star M
id-C
ap B
lend
0.08
%17
.69%
(1.39
%)
8.47
%6.
61%
10.9
4%-
-(11
.11%
)16
.01%
14.76
%(4
.44%
)8.
26%
Mor
ning
star
Rat
ing:
***
**
The
perfo
rman
ce d
ata
quot
ed re
pres
ents
pas
t per
form
ance
. Pas
t per
form
ance
doe
s no
t gua
rant
ee fu
ture
resu
lts. I
nves
tmen
t ret
urn
and
prin
cipal
val
ue w
ill flu
ctua
te so
that
an
inve
stor's
shar
es, w
hen
rede
emed
, may
be
worth
mor
e or
less
than
their
orig
inal
cost.
Cur
rent
per
form
ance
may
be
lowe
r or h
ighe
r tha
n th
e pe
rform
ance
info
rmat
ion
quot
ed. T
he p
erfo
rman
ce q
uote
d re
flect
s the
rein
vestm
ent o
f divi
dend
s and
capi
tal g
ains
and
isne
t of a
ll ex
pens
es. T
o ob
tain
curre
nt m
onth
-end
per
form
ance
info
rmat
ion,
plea
se co
ntac
t the
pho
ne n
umbe
r loc
ated
in th
e "Im
porta
nt D
isclo
sure
s" se
ctio
n of
this
repo
rt. F
or so
urce
info
rmat
ion,
plea
se se
e th
e "Im
porta
ntDi
sclo
sure
s" se
ctio
n of
this
repo
rt. P
lease
see
furth
er d
etai
ls on
the
scor
ing
met
hodo
logy
in th
e "In
vestm
ent S
corin
g M
etho
dolo
gy" s
ectio
n of
this
repo
rt.Pe
er g
roup
s ba
sed
on M
orni
ngst
ar c
ateg
ory.
Fund
rank
ings
are
bas
ed o
n tr
ailin
g to
tal r
etur
ns, i
nclu
ding
rein
vest
men
t of d
ivid
ends
and
cap
ital g
ains
. Fun
ds a
re ra
nked
bet
wee
n 1
and
100,
with
1 b
eing
the
top
perc
entil
e an
d 10
0 be
ing
the
bott
om p
erce
ntile
. The
rank
ing
is fo
r the
indi
cate
d sh
are
clas
s; ot
her s
hare
cla
sses
may
hav
e a
diffe
rent
per
form
ance
rank
ing.
Pag
e 90
|
146

VAN
GUAR
D M
ID C
AP IN
DEX
ADM
IRAL
| FU
ND
FACT
SHE
ET
For P
lan
Spon
sor U
se O
nly
Com
mun
ity A
ctio
n Pa
rtne
rshi
p ER
ISA
403(
b) In
vest
men
t Rev
iew
| Pe
riod
Endi
ng 0
9/30
/201
9
Port
folio
Com
posit
ion
Tim
e Pe
riod:
10/
30/2
014
- 09
/30/
2019
100% 80%
60%
40%
20% 0%
09/19
03/19
03/18
03/17
03/16
03/15
Stoc
kBo
ndCa
shO
ther
Bond
Dist
ribut
ion
Tim
e Pe
riod:
10/
30/2
014
- 09
/30/
2019
100 80 60 40 20 0
09/19
03/19
03/18
03/17
03/16
03/15
Dom
estic
Bon
dFo
reig
n Bo
ndPr
efer
red
Stoc
ks
Conv
ertib
le B
ond
Oth
er
Equi
ty R
egio
nal D
istrib
utio
n
Tim
e Pe
riod:
10/
30/2
014
- 09
/30/
2019
100 80 60 40 20 0
09/19
03/19
03/18
03/17
03/16
03/15
Nor
th A
mer
ica
%La
tin A
mer
ica
%U
nite
d Ki
ngdo
m %
Euro
pe d
ev %
Euro
pe e
mrg
%Af
rica/
Mid
dle
East
%
Asia
%
Sect
or D
istrib
utio
n
Tim
e Pe
riod:
10/
30/2
014
- 09
/30/
2019
100 80 60 40 20 0
09/19
03/19
03/18
03/17
03/16
03/15
Tech
nolo
gyCo
mm
unic
atio
n Se
rvic
esCo
nsum
er C
yclic
al
Cons
umer
Def
ensi
veO
ther
Styl
e An
alys
is
Small - Large
2 1 0 -1 -2
Valu
e -
Gro
wth
21
0-1
-21 0 -1
-11
0
Smal
l Gro
wth
Smal
l Val
ue
Mid
Gro
wth
Mid
Val
ue
Top
Gro
wth
Top
Valu
e
Risk
/Ret
urn
vs P
eer G
roup
Standard Deviation
26 24 22 20 18 16 14 12 10 8 6 4 2 010
yea
rs5
year
s3
year
s1
year
YTD
Sharpe Ratio
2 1 0 -110
yea
rs5
year
s3
year
s1
year
YTD
Information Ratio
2 1 0 -1 -2 -310
yea
rs5
year
s3
year
s1
year
YTD
Vang
uard
Mid
Cap
Inde
x Ad
mira
lCR
SP U
S M
id C
ap T
R U
SD
Fund
Bas
ics
Tick
erVI
MAX
Cate
gory
Mid
-Cap
Ble
nd
Net
Ass
ets(
This
Cla
ss $
mn)
105,
404
m
Net
Ass
ets(
All C
lass
es $
mn)
0 m
Man
ager
Don
ald
Butle
r
Man
ager
Ten
ure
21.3
3
Fund
Ince
ptio
nM
ay 2
1,19
98
Fee
And
Expe
nses
Expe
nse
Ratio
0.05
Gro
ss E
xpen
se R
atio
0.05
Pros
pect
us N
et E
xpen
se R
atio
0.05
Pros
pect
us G
ross
Exp
ense
Rat
io0.
05
Actu
al 1
2b1
0.00
Man
agem
ent F
ee0.
04
Top
10 H
oldi
ngs
(%)
New
mon
t Gol
dcor
p Co
rp0.
78
Twitt
er In
c0.
75
Adva
nced
Mic
ro D
evic
es In
c0.
73
Fise
rv In
c0.
73
WEC
Ene
rgy
Gro
up In
c0.
72
SBA
Com
mun
icat
ions
Cor
p0.
71
Mot
orol
a So
lutio
ns In
c0.
71
ON
EOK
Inc
0.70
Ball
Corp
0.64
Xilin
x In
c0.
63
Cum
ulat
ive
Perf
orm
ance
Tim
e Pe
riod:
01/
30/2
014
- 09
/30/
2019
Growth of $100
167
159
151
143
135
127
119
111
103 95 87
09/1
901
/19
07/1
801
/18
07/1
701
/17
07/1
601
/16
07/1
509
/14
Vang
uard
Mid
Cap
Inde
x Ad
mira
l
CRSP
US
Mid
Cap
TR
USD
Gro
wth
of $
100
is c
alcu
late
d at
NAV
and
ass
umes
that
all
divi
dend
and
cap
ital g
ain
dist
ribut
ions
wer
e re
inve
sted
.It
does
not
take
into
acc
ount
sal
es c
harg
es o
r the
effe
ct o
f tax
es. R
esul
ts a
re n
ot in
dica
tive
of fu
ture
per
form
ance
.
Pag
e 91
|
147

MAS
SMUT
UAL
S ELE
CT M
ID C
AP G
ROW
TH I |
FUN
D FA
CT S
HEET
For P
lan
Spon
sor U
se O
nly
Com
mun
ity A
ctio
n Pa
rtne
rshi
p ER
ISA
403(
b) In
vest
men
t Rev
iew
| Pe
riod
Endi
ng 0
9/30
/201
9
IPS
Scor
eRe
turn
1Yr
Retu
rn3Y
rRe
turn
5Yr
Shar
pe3Y
rSh
arpe
5Yr
Info
Ratio
3Yr
Info
Ratio
5Yr
Man
ager
Tenu
reEx
pens
eRa
tioSt
yle
Cons
isten
cy(R
BSA)
Up/
Dow
nCa
ptur
e5Y
r
95 Pass
ing
Crite
ria S
corin
g6.
66%
14.4
2%12
.69%
0.97
0.92
-0.0
30.
6019
.33
0.71
%11
.77
1.13
Peer
Gro
up S
corin
g1.1
0%13
.10%
9.89
%0.
810.
68-0
.40
-0.3
510
.80
1.15%
14.8
80.
97
Crite
ria P
eer R
anki
ng24
3515
2313
369
1113
3816
Inve
stm
ent S
trat
egy
The
inve
stm
ent s
eeks
gro
wth
of c
apita
l ove
r the
long
-ter
m. T
he fu
nd in
vest
s pr
imar
ily in
equ
ity s
ecur
ities
of m
id-c
apita
lizat
ion
com
pani
es th
at th
e fu
nd's
suba
dvis
ers
belie
ve o
ffer t
he p
oten
tial f
or lo
ng-
term
gr o
wth
. It i
nves
ts a
t lea
st 8
0% o
f its
net
ass
ets
(plu
s th
e am
ount
of a
ny b
orro
win
gs fo
r inv
estm
ent p
urpo
ses)
in a
bro
adly
div
ersi
fied
port
folio
of c
omm
on s
tock
s of
mid
-cap
com
pani
es w
hose
ear
ning
sth
e su
badv
iser
s ex
pect
to g
row
at a
fast
er ra
te th
an th
e av
erag
e co
mpa
ny.
Man
ager
Vs
Benc
hmar
k Pe
rfor
man
ce
30 25 20 15 10 5 010
Yea
rs5
Year
s3
Year
s1
Year
YTD
35 30 25 20 15 10 5 0 -5 -10
-15
-20
-25
5 Ye
ars
3 Ye
ars
1 Ye
arYT
D
30 25 20 15 10 5 0 -5 -10
2015
2016
2017
2018
YTD
40 20 0
-20
2014
2015
2016
2017
2018
YTD
Mas
sMut
ual S
elec
t Mid
Cap
Gro
wth
IRu
ssel
l Mid
Cap
Gro
wth
TR
USD
Inve
stm
ent N
ame
Annu
aliz
ed R
etur
nsCa
lend
ar Y
ear R
etur
ns
Last
Qtr
YTD
1 Yea
r3
Year
5Yea
r10
Yea
rIT
DIn
cept
ion
Dat
e20
1820
1720
1620
1520
14
Mas
sMut
ual S
elec
t Mid
Cap
Gro
wth
I(0
.64%
)23
.56%
6.66
%14
.42%
12.6
9%14
.62%
9.77
%05
/31/
2000
(3.1
0%)
24.6
6%6.
19%
5.95
%13
.00%
Russ
ell M
id C
ap G
rowt
h TR
USD
(0.6
7%)
25.23
%5.2
0%14
.50%
11.12
%14
.08%
--
(4.75
%)
25.27
%7.3
3%(0
.20%
)11
.90%
Mor
ning
star M
id-C
ap G
rowt
h(1.
80%
)22
.76%
1.10%
13.10
%9.
89%
12.56
%-
-(6
.19%
)24
.24%
6.94
%(0
.43%
)7.1
7%
Mor
ning
star
Rat
ing:
***
*
The
perfo
rman
ce d
ata
quot
ed re
pres
ents
pas
t per
form
ance
. Pas
t per
form
ance
doe
s no
t gua
rant
ee fu
ture
resu
lts. I
nves
tmen
t ret
urn
and
prin
cipal
val
ue w
ill flu
ctua
te so
that
an
inve
stor's
shar
es, w
hen
rede
emed
, may
be
worth
mor
e or
less
than
their
orig
inal
cost.
Cur
rent
per
form
ance
may
be
lowe
r or h
ighe
r tha
n th
e pe
rform
ance
info
rmat
ion
quot
ed. T
he p
erfo
rman
ce q
uote
d re
flect
s the
rein
vestm
ent o
f divi
dend
s and
capi
tal g
ains
and
isne
t of a
ll ex
pens
es. T
o ob
tain
curre
nt m
onth
-end
per
form
ance
info
rmat
ion,
plea
se co
ntac
t the
pho
ne n
umbe
r loc
ated
in th
e "Im
porta
nt D
isclo
sure
s" se
ctio
n of
this
repo
rt. F
or so
urce
info
rmat
ion,
plea
se se
e th
e "Im
porta
ntDi
sclo
sure
s" se
ctio
n of
this
repo
rt. P
lease
see
furth
er d
etai
ls on
the
scor
ing
met
hodo
logy
in th
e "In
vestm
ent S
corin
g M
etho
dolo
gy" s
ectio
n of
this
repo
rt.Pe
er g
roup
s ba
sed
on M
orni
ngst
ar c
ateg
ory.
Fund
rank
ings
are
bas
ed o
n tr
ailin
g to
tal r
etur
ns, i
nclu
ding
rein
vest
men
t of d
ivid
ends
and
cap
ital g
ains
. Fun
ds a
re ra
nked
bet
wee
n 1
and
100,
with
1 b
eing
the
top
perc
entil
e an
d 10
0 be
ing
the
bott
om p
erce
ntile
. The
rank
ing
is fo
r the
indi
cate
d sh
are
clas
s; ot
her s
hare
cla
sses
may
hav
e a
diffe
rent
per
form
ance
rank
ing.
Pag
e 92
|
148

MAS
SMUT
UAL
S ELE
CT M
ID C
AP G
ROW
TH I |
FUN
D FA
CT S
HEET
For P
lan
Spon
sor U
se O
nly
Com
mun
ity A
ctio
n Pa
rtne
rshi
p ER
ISA
403(
b) In
vest
men
t Rev
iew
| Pe
riod
Endi
ng 0
9/30
/201
9
Port
folio
Com
posit
ion
Tim
e Pe
riod:
10/
30/2
014
- 09
/30/
2019
100% 80%
60%
40%
20% 0%
09/19
03/19
03/18
03/17
03/16
03/15
Stoc
kBo
ndCa
shO
ther
Bond
Dist
ribut
ion
Tim
e Pe
riod:
10/
30/2
014
- 09
/30/
2019
100 80 60 40 20 0
09/19
03/19
03/18
03/17
03/16
03/15
Dom
estic
Bon
dFo
reig
n Bo
ndPr
efer
red
Stoc
ks
Conv
ertib
le B
ond
Oth
er
Equi
ty R
egio
nal D
istrib
utio
n
Tim
e Pe
riod:
10/
30/2
014
- 09
/30/
2019
100 80 60 40 20 0
09/19
03/19
03/18
03/17
03/16
03/15
Nor
th A
mer
ica
%La
tin A
mer
ica
%U
nite
d Ki
ngdo
m %
Euro
pe d
ev %
Euro
pe e
mrg
%Af
rica/
Mid
dle
East
%
Asia
%
Sect
or D
istrib
utio
n
Tim
e Pe
riod:
10/
30/2
014
- 09
/30/
2019
100 80 60 40 20 0
09/19
03/19
03/18
03/17
03/16
03/15
Tech
nolo
gyCo
mm
unic
atio
n Se
rvic
esCo
nsum
er C
yclic
al
Cons
umer
Def
ensi
veO
ther
Styl
e An
alys
is
Small - Large
2 1 0 -1 -2
Valu
e -
Gro
wth
21
0-1
-21 0 -1
-11
0
Smal
l Gro
wth
Smal
l Val
ue
Mid
Gro
wth
Mid
Val
ue
Top
Gro
wth
Top
Valu
e
Risk
/Ret
urn
vs P
eer G
roup
Standard Deviation
30 25 20 15 10 5 010
yea
rs5
year
s3
year
s1
year
YTD
Sharpe Ratio
3 2 1 0 -110
yea
rs5
year
s3
year
s1
year
YTD
Information Ratio
2 1 0 -1 -2 -310
yea
rs5
year
s3
year
s1
year
YTD
Mas
sMut
ual S
elec
t Mid
Cap
Gro
wth
IRu
ssel
l Mid
Cap
Gro
wth
TR
USD
Fund
Bas
ics
Tick
erM
EFZX
Cate
gory
Mid
-Cap
Gro
wth
Net
Ass
ets(
This
Cla
ss $
mn)
8,60
5 m
Net
Ass
ets(
All C
lass
es $
mn)
0 m
Man
ager
Bria
n Be
rghu
is
Man
ager
Ten
ure
19.3
3
Fund
Ince
ptio
nM
ay 3
1,20
00
Fee
And
Expe
nses
Expe
nse
Ratio
0.71
Gro
ss E
xpen
se R
atio
0.71
Pros
pect
us N
et E
xpen
se R
atio
0.71
Pros
pect
us G
ross
Exp
ense
Rat
io0.
71
Actu
al 1
2b1
0.00
Man
agem
ent F
ee0.
69
Top
10 H
oldi
ngs
(%)
Tele
flex
Inc
2.17
Ball
Corp
2.02
The
Coop
er C
ompa
nies
Inc
2.00
Dol
lar G
ener
al C
orp
1.69
L3H
arris
Tec
hnol
ogie
s In
c1.
54
Wor
kday
Inc
Clas
s A
1.48
Mic
roch
ip T
echn
olog
y In
c1.
47
Glo
bal P
aym
ents
Inc
1.43
Hol
ogic
Inc
1.33
Rope
r Tec
hnol
ogie
s In
c1.
25
Cum
ulat
ive
Perf
orm
ance
Tim
e Pe
riod:
01/
30/2
014
- 09
/30/
2019
Growth of $100
195
195
185
174
163
152
142
131
120
109 98 88
09/1
901
/19
07/1
801
/18
07/1
701
/17
07/1
601
/16
07/1
509
/14
Mas
sMut
ual S
elec
t Mid
Cap
Gro
wth
I
Russ
ell M
id C
ap G
row
th T
R U
SD
Gro
wth
of $
100
is c
alcu
late
d at
NAV
and
ass
umes
that
all
divi
dend
and
cap
ital g
ain
dist
ribut
ions
wer
e re
inve
sted
.It
does
not
take
into
acc
ount
sal
es c
harg
es o
r the
effe
ct o
f tax
es. R
esul
ts a
re n
ot in
dica
tive
of fu
ture
per
form
ance
.
Pag
e 93
|
149
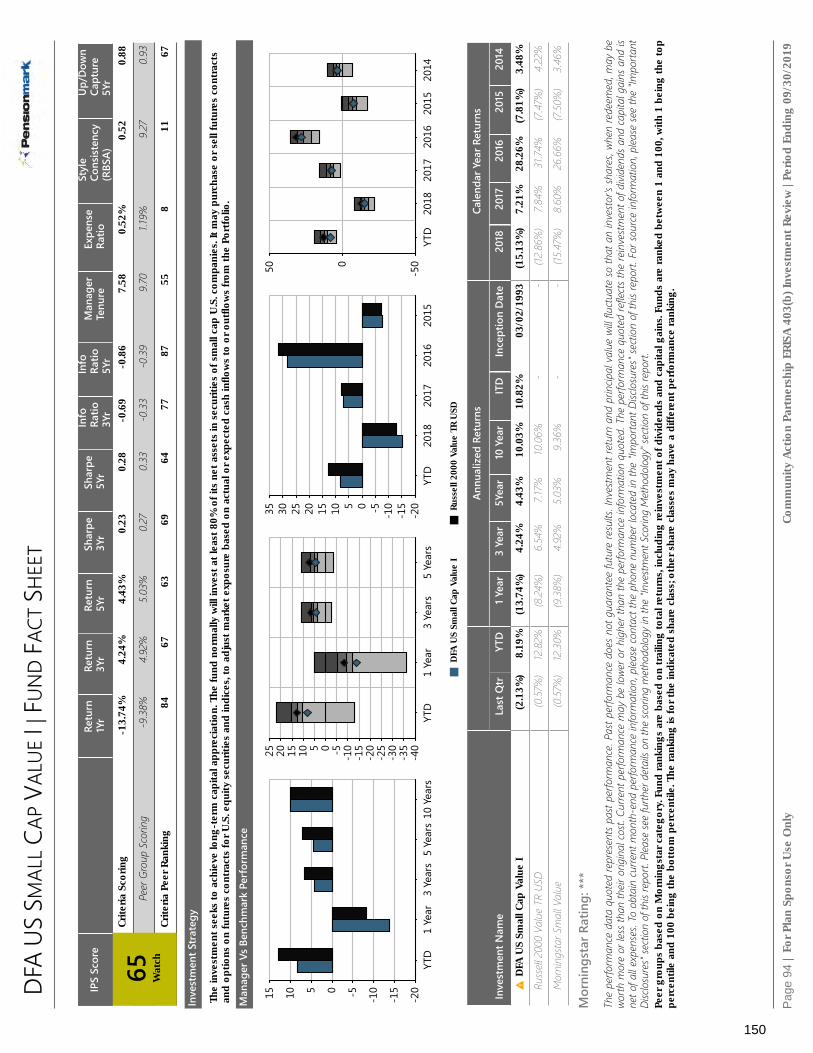
DFA
US S
MAL
L CA
P VA
LUE
I | FU
ND
FACT
SHE
ET
For P
lan
Spon
sor U
se O
nly
Com
mun
ity A
ctio
n Pa
rtne
rshi
p ER
ISA
403(
b) In
vest
men
t Rev
iew
| Pe
riod
Endi
ng 0
9/30
/201
9
IPS
Scor
eRe
turn
1Yr
Retu
rn3Y
rRe
turn
5Yr
Shar
pe3Y
rSh
arpe
5Yr
Info
Ratio
3Yr
Info
Ratio
5Yr
Man
ager
Tenu
reEx
pens
eRa
tioSt
yle
Cons
isten
cy(R
BSA)
Up/
Dow
nCa
ptur
e5Y
r
65 Wat
ch
Crite
ria S
corin
g-1
3.74
%4.
24%
4.43
%0.
230.
28-0
.69
-0.8
67.
580.
52%
0.52
0.88
Peer
Gro
up S
corin
g-9
.38%
4.92
%5.0
3%0.
270.
33-0
.33
-0.3
99.
701.1
9%9.
270.
93
Crite
ria P
eer R
anki
ng84
6763
6964
7787
558
1167
Inve
stm
ent S
trat
egy
The
inve
stm
ent s
eeks
to a
chie
ve lo
ng-t
erm
cap
ital a
ppre
ciat
ion.
The
fund
nor
mal
ly w
ill in
vest
at l
east
80%
of i
ts n
et a
sset
s in
sec
uriti
es o
f sm
all c
ap U
.S. c
ompa
nies
. It m
ay p
urch
ase
or s
ell f
utur
es c
ontr
acts
and
optio
ns o
n fu
ture
s co
ntra
cts
for U
.S. e
quity
sec
uriti
es a
nd in
dice
s, to
adj
ust m
ark e
t exp
osur
e ba
sed
on a
ctua
l or e
xpec
ted
cash
inflo
ws
to o
r out
flow
s fro
m th
e Po
rtfo
lio.
Man
ager
Vs
Benc
hmar
k Pe
rfor
man
ce
15 10 5 0 -5 -10
-15
-20
10 Y
ears
5 Ye
ars
3 Ye
ars
1 Ye
arYT
D
25 20 15 10 5 0 -5 -10
-15
-20
-25
-30
-35
-40
5 Ye
ars
3 Ye
ars
1 Ye
arYT
D
35 30 25 20 15 10 5 0 -5 -10
-15
-20
2015
2016
2017
2018
YTD
50 0
-50
2014
2015
2016
2017
2018
YTD
DFA
US
Smal
l Cap
Val
ue I
Russ
ell 2
000
Valu
e TR
USD
Inve
stm
ent N
ame
Annu
aliz
ed R
etur
nsCa
lend
ar Y
ear R
etur
ns
Last
Qtr
YTD
1 Yea
r3
Year
5Yea
r10
Yea
rIT
DIn
cept
ion
Dat
e20
1820
1720
1620
1520
14
DFA
US
Smal
l Cap
Val
ue I
(2.1
3%)
8.19
%(1
3.74
%)
4.24
%4.
43%
10.0
3%10
.82%
03/0
2/19
93(1
5.13
%)
7.21
%28
.26%
(7.8
1%)
3.48
%
Russ
ell 2
000
Valu
e TR
USD
(0.57
%)
12.8
2%(8
.24%
)6.
54%
7.17%
10.0
6%-
-(12
.86%
)7.8
4%31
.74%
(7.4
7%)
4.22
%
Mor
ning
star S
mal
l Val
ue(0
.57%
)12
.30%
(9.3
8%)
4.92
%5.0
3%9.
36%
--
(15.4
7%)
8.60
%26
.66%
(7.50
%)
3.46
%
Mor
ning
star
Rat
ing:
***
The
perfo
rman
ce d
ata
quot
ed re
pres
ents
pas
t per
form
ance
. Pas
t per
form
ance
doe
s no
t gua
rant
ee fu
ture
resu
lts. I
nves
tmen
t ret
urn
and
prin
cipal
val
ue w
ill flu
ctua
te so
that
an
inve
stor's
shar
es, w
hen
rede
emed
, may
be
worth
mor
e or
less
than
their
orig
inal
cost.
Cur
rent
per
form
ance
may
be
lowe
r or h
ighe
r tha
n th
e pe
rform
ance
info
rmat
ion
quot
ed. T
he p
erfo
rman
ce q
uote
d re
flect
s the
rein
vestm
ent o
f divi
dend
s and
capi
tal g
ains
and
isne
t of a
ll ex
pens
es. T
o ob
tain
curre
nt m
onth
-end
per
form
ance
info
rmat
ion,
plea
se co
ntac
t the
pho
ne n
umbe
r loc
ated
in th
e "Im
porta
nt D
isclo
sure
s" se
ctio
n of
this
repo
rt. F
or so
urce
info
rmat
ion,
plea
se se
e th
e "Im
porta
ntDi
sclo
sure
s" se
ctio
n of
this
repo
rt. P
lease
see
furth
er d
etai
ls on
the
scor
ing
met
hodo
logy
in th
e "In
vestm
ent S
corin
g M
etho
dolo
gy" s
ectio
n of
this
repo
rt.Pe
er g
roup
s ba
sed
on M
orni
ngst
ar c
ateg
ory.
Fund
rank
ings
are
bas
ed o
n tr
ailin
g to
tal r
etur
ns, i
nclu
ding
rein
vest
men
t of d
ivid
ends
and
cap
ital g
ains
. Fun
ds a
re ra
nked
bet
wee
n 1
and
100,
with
1 b
eing
the
top
perc
entil
e an
d 10
0 be
ing
the
bott
om p
erce
ntile
. The
rank
ing
is fo
r the
indi
cate
d sh
are
clas
s; ot
her s
hare
cla
sses
may
hav
e a
diffe
rent
per
form
ance
rank
ing.
Pag
e 94
|
150

DFA
US S
MAL
L CA
P VA
LUE
I | FU
ND
FACT
SHE
ET
For P
lan
Spon
sor U
se O
nly
Com
mun
ity A
ctio
n Pa
rtne
rshi
p ER
ISA
403(
b) In
vest
men
t Rev
iew
| Pe
riod
Endi
ng 0
9/30
/201
9
Port
folio
Com
posit
ion
Tim
e Pe
riod:
10/
30/2
014
- 09
/30/
2019
100% 80%
60%
40%
20% 0%
09/19
03/19
03/18
03/17
03/16
03/15
Stoc
kBo
ndCa
shO
ther
Bond
Dist
ribut
ion
Tim
e Pe
riod:
10/
30/2
014
- 09
/30/
2019
100 80 60 40 20 0
09/19
03/19
03/18
03/17
03/16
03/15
Dom
estic
Bon
dFo
reig
n Bo
ndPr
efer
red
Stoc
ks
Conv
ertib
le B
ond
Oth
er
Equi
ty R
egio
nal D
istrib
utio
n
Tim
e Pe
riod:
10/
30/2
014
- 09
/30/
2019
100 80 60 40 20 0
09/19
03/19
03/18
03/17
03/16
03/15
Nor
th A
mer
ica
%La
tin A
mer
ica
%U
nite
d Ki
ngdo
m %
Euro
pe d
ev %
Euro
pe e
mrg
%Af
rica/
Mid
dle
East
%
Asia
%
Sect
or D
istrib
utio
n
Tim
e Pe
riod:
10/
30/2
014
- 09
/30/
2019
100 80 60 40 20 0
09/19
03/19
03/18
03/17
03/16
03/15
Tech
nolo
gyCo
mm
unic
atio
n Se
rvic
esCo
nsum
er C
yclic
al
Cons
umer
Def
ensi
veO
ther
Styl
e An
alys
is
Small - Large
2 1 0 -1 -2
Valu
e -
Gro
wth
21
0-1
-21 0 -1
-11
0
Smal
l Gro
wth
Smal
l Val
ue
Mid
Gro
wth
Mid
Val
ue
Top
Gro
wth
Top
Valu
e
Risk
/Ret
urn
vs P
eer G
roup
Standard Deviation
35 30 25 20 15 10 5 010
yea
rs5
year
s3
year
s1
year
YTD
Sharpe Ratio
2 1 0 -110
yea
rs5
year
s3
year
s1
year
YTD
Information Ratio
2 1 0 -1 -210
yea
rs5
year
s3
year
s1
year
YTD
DFA
US
Smal
l Cap
Val
ue I
Russ
ell 2
000
Valu
e TR
USD
Fund
Bas
ics
Tick
erD
FSVX
Cate
gory
Smal
l Val
ue
Net
Ass
ets(
This
Cla
ss $
mn)
13,6
73 m
Net
Ass
ets(
All C
lass
es $
mn)
0 m
Man
ager
Jed
Fogd
all
Man
ager
Ten
ure
7.58
Fund
Ince
ptio
nM
ar 0
2,19
93
Fee
And
Expe
nses
Expe
nse
Ratio
0.52
Gro
ss E
xpen
se R
atio
0.52
Pros
pect
us N
et E
xpen
se R
atio
0.52
Pros
pect
us G
ross
Exp
ense
Rat
io0.
52
Actu
al 1
2b1
0.00
Man
agem
ent F
ee0.
50
Top
10 H
oldi
ngs
(%)
S+p5
00 E
min
i Fut
Sep
19 ..
.0.
87
FTI C
onsu
lting
Inc
0.80
Tech
Dat
a Co
rp0.
79
Dar
ling
Ingr
edie
nts
Inc
0.78
CACI
Inte
rnat
iona
l Inc
...
0.78
Was
hing
ton
Fede
ral I
nc0.
76
SkyW
est I
nc0.
75
Aaro
n's
Inc
0.75
Tayl
or M
orris
on H
ome
Co...
0.74
Wor
ld F
uel S
ervi
ces
Corp
0.74
Cum
ulat
ive
Perf
orm
ance
Tim
e Pe
riod:
01/
30/2
014
- 09
/30/
2019
Growth of $100
168
168
159
151
142
133
125
116
107 99 90 81
09/1
901
/19
07/1
801
/18
07/1
701
/17
07/1
601
/16
07/1
509
/14
DFA
US
Smal
l Cap
Val
ue I
Russ
ell 2
000
Valu
e TR
USD
Gro
wth
of $
100
is c
alcu
late
d at
NAV
and
ass
umes
that
all
divi
dend
and
cap
ital g
ain
dist
ribut
ions
wer
e re
inve
sted
.It
does
not
take
into
acc
ount
sal
es c
harg
es o
r the
effe
ct o
f tax
es. R
esul
ts a
re n
ot in
dica
tive
of fu
ture
per
form
ance
.
Pag
e 95
|
151

JAN
US H
ENDE
RSO
N T
RITO
N T
| FU
ND
FACT
SHE
ET
For P
lan
Spon
sor U
se O
nly
Com
mun
ity A
ctio
n Pa
rtne
rshi
p ER
ISA
403(
b) In
vest
men
t Rev
iew
| Pe
riod
Endi
ng 0
9/30
/201
9
IPS
Scor
eRe
turn
1Yr
Retu
rn3Y
rRe
turn
5Yr
Shar
pe3Y
rSh
arpe
5Yr
Info
Ratio
3Yr
Info
Ratio
5Yr
Man
ager
Tenu
reEx
pens
eRa
tioSt
yle
Cons
isten
cy(R
BSA)
Up/
Dow
nCa
ptur
e5Y
r
96 Pass
ing
Crite
ria S
corin
g-2
.52%
13.7
8%12
.43%
0.81
0.80
1.06
0.88
6.33
0.91
%5.
911.
25
Peer
Gro
up S
corin
g-7
.52%
11.4
4%9.
55%
0.62
0.58
0.30
0.11
10.8
01.2
1%11
.721.0
7
Crite
ria P
eer R
anki
ng19
3213
218
167
6624
1711
Inve
stm
ent S
trat
egy
The
inve
stm
ent s
eeks
long
-ter
m g
row
th o
f cap
ital.
The
fund
pur
sues
its
inve
stm
ent o
bjec
tive
by in
vest
ing
at le
ast 5
0% o
f its
equ
ity a
sset
s in
sm
all-
and
med
ium
-siz
ed c
ompa
nies
. It m
ay a
lso
inve
st in
larg
erco
mpa
nies
with
str
ong
grow
th p
oten
tial.
Smal
l- an
d m
ediu
m-s
ized
com
pani
es a
re d
efine
d by
the
port
folio
man
ager
s as
thos
e co
mpa
nies
who
se m
arke
t cap
italiz
atio
n fa
lls w
ithin
the
rang
e of
com
pani
es in
the
Russ
ell 2
500®
Gro
wth
Inde
x at
the
time
of in
itial
pur
chas
e. T
he fu
nd m
ay a
lso
inve
st in
fore
ign
secu
ritie
s, w
hich
may
incl
ude
inve
stm
ents
in e
mer
ging
mar
kets
.
Man
ager
Vs
Benc
hmar
k Pe
rfor
man
ce
25 20 15 10 5 0 -5 -10
-15
10 Y
ears
5 Ye
ars
3 Ye
ars
1 Ye
arYT
D
30 25 20 15 10 5 0 -5 -10
-15
-20
-25
-30
-35
-40
-45
5 Ye
ars
3 Ye
ars
1 Ye
arYT
D
30 25 20 15 10 5 0 -5 -10
-15
2015
2016
2017
2018
YTD
50 0
-50
2014
2015
2016
2017
2018
YTD
Janu
s H
ende
rson
Trit
on T
Russ
ell 2
000
Gro
wth
TR
USD
Inve
stm
ent N
ame
Annu
aliz
ed R
etur
nsCa
lend
ar Y
ear R
etur
ns
Last
Qtr
YTD
1 Yea
r3
Year
5Yea
r10
Yea
rIT
DIn
cept
ion
Dat
e20
1820
1720
1620
1520
14
Janu
s H
ende
rson
Trit
on T
(3.1
4%)
21.4
1%(2
.52%
)13
.78%
12.4
3%15
.08%
12.5
8%02
/25/
2005
(5.2
6%)
26.9
0%10
.42%
1.21
%9.
45%
Russ
ell 2
000
Grow
th T
R US
D(4
.17%
)15
.34%
(9.6
3%)
9.79
%9.
08%
12.25
%-
-(9
.31%
)22
.17%
11.3
2%(1.
38%
)5.6
0%
Mor
ning
star S
mal
l Gro
wth
(4.17
%)
16.8
0%(7
.52%
)11
.44%
9.55
%12
.28%
--
(5.57
%)
21.6
7%11
.84%
(2.0
8%)
2.63%
Mor
ning
star
Rat
ing:
***
**
The
perfo
rman
ce d
ata
quot
ed re
pres
ents
pas
t per
form
ance
. Pas
t per
form
ance
doe
s no
t gua
rant
ee fu
ture
resu
lts. I
nves
tmen
t ret
urn
and
prin
cipal
val
ue w
ill flu
ctua
te so
that
an
inve
stor's
shar
es, w
hen
rede
emed
, may
be
worth
mor
e or
less
than
their
orig
inal
cost.
Cur
rent
per
form
ance
may
be
lowe
r or h
ighe
r tha
n th
e pe
rform
ance
info
rmat
ion
quot
ed. T
he p
erfo
rman
ce q
uote
d re
flect
s the
rein
vestm
ent o
f divi
dend
s and
capi
tal g
ains
and
isne
t of a
ll ex
pens
es. T
o ob
tain
curre
nt m
onth
-end
per
form
ance
info
rmat
ion,
plea
se co
ntac
t the
pho
ne n
umbe
r loc
ated
in th
e "Im
porta
nt D
isclo
sure
s" se
ctio
n of
this
repo
rt. F
or so
urce
info
rmat
ion,
plea
se se
e th
e "Im
porta
ntDi
sclo
sure
s" se
ctio
n of
this
repo
rt. P
lease
see
furth
er d
etai
ls on
the
scor
ing
met
hodo
logy
in th
e "In
vestm
ent S
corin
g M
etho
dolo
gy" s
ectio
n of
this
repo
rt.Pe
er g
roup
s ba
sed
on M
orni
ngst
ar c
ateg
ory.
Fund
rank
ings
are
bas
ed o
n tr
ailin
g to
tal r
etur
ns, i
nclu
ding
rein
vest
men
t of d
ivid
ends
and
cap
ital g
ains
. Fun
ds a
re ra
nked
bet
wee
n 1
and
100,
with
1 b
eing
the
top
perc
entil
e an
d 10
0 be
ing
the
bott
om p
erce
ntile
. The
rank
ing
is fo
r the
indi
cate
d sh
are
clas
s; ot
her s
hare
cla
sses
may
hav
e a
diffe
rent
per
form
ance
rank
ing.
Pag
e 96
|
152

JAN
US H
ENDE
RSO
N T
RITO
N T
| FU
ND
FACT
SHE
ET
For P
lan
Spon
sor U
se O
nly
Com
mun
ity A
ctio
n Pa
rtne
rshi
p ER
ISA
403(
b) In
vest
men
t Rev
iew
| Pe
riod
Endi
ng 0
9/30
/201
9
Port
folio
Com
posit
ion
Tim
e Pe
riod:
10/
30/2
014
- 09
/30/
2019
100% 80%
60%
40%
20% 0%
09/19
03/19
03/18
03/17
03/16
03/15
Stoc
kBo
ndCa
shO
ther
Bond
Dist
ribut
ion
Tim
e Pe
riod:
10/
30/2
014
- 09
/30/
2019
100 80 60 40 20 0
09/19
03/19
03/18
03/17
03/16
03/15
Dom
estic
Bon
dFo
reig
n Bo
ndPr
efer
red
Stoc
ks
Conv
ertib
le B
ond
Oth
er
Equi
ty R
egio
nal D
istrib
utio
n
Tim
e Pe
riod:
10/
30/2
014
- 09
/30/
2019
100 80 60 40 20 0
09/19
03/19
03/18
03/17
03/16
03/15
Nor
th A
mer
ica
%La
tin A
mer
ica
%U
nite
d Ki
ngdo
m %
Euro
pe d
ev %
Euro
pe e
mrg
%Af
rica/
Mid
dle
East
%
Asia
%
Sect
or D
istrib
utio
n
Tim
e Pe
riod:
10/
30/2
014
- 09
/30/
2019
100 80 60 40 20 0
09/19
03/19
03/18
03/17
03/16
03/15
Tech
nolo
gyCo
mm
unic
atio
n Se
rvic
esCo
nsum
er C
yclic
al
Cons
umer
Def
ensi
veO
ther
Styl
e An
alys
is
Small - Large
2 1 0 -1 -2
Valu
e -
Gro
wth
21
0-1
-21 0 -1
-11
0
Smal
l Gro
wth
Smal
l Val
ue
Mid
Gro
wth
Mid
Val
ue
Top
Gro
wth
Top
Valu
e
Risk
/Ret
urn
vs P
eer G
roup
Standard Deviation
30 25 20 15 10 5 010
yea
rs5
year
s3
year
s1
year
YTD
Sharpe Ratio
2 1 0 -110
yea
rs5
year
s3
year
s1
year
YTD
Information Ratio
3 2 1 0 -1 -210
yea
rs5
year
s3
year
s1
year
YTD
Janu
s H
ende
rson
Trit
on T
Russ
ell 2
000
Gro
wth
TR
USD
Fund
Bas
ics
Tick
erJA
TTX
Cate
gory
Smal
l Gro
wth
Net
Ass
ets(
This
Cla
ss $
mn)
11,7
03 m
Net
Ass
ets(
All C
lass
es $
mn)
0 m
Man
ager
Jona
than
Col
eman
Man
ager
Ten
ure
6.33
Fund
Ince
ptio
nFe
b 25
,200
5
Fee
And
Expe
nses
Expe
nse
Ratio
0.91
Gro
ss E
xpen
se R
atio
0.91
Pros
pect
us N
et E
xpen
se R
atio
0.91
Pros
pect
us G
ross
Exp
ense
Rat
io0.
91
Actu
al 1
2b1
0.00
Man
agem
ent F
ee0.
64
Top
10 H
oldi
ngs
(%)
Cata
lent
Inc
2.73
Hei
co C
orp
Clas
s A
2.41
Euro
net W
orld
wid
e In
c2.
29
Broa
drid
ge F
inan
cial
So.
..2.
10
LPL
Fina
ncia
l Hol
ding
s In
c2.
03
Serv
iceM
aste
r Glo
bal H
o...
2.03
Blac
kbau
d In
c1.
94
SS&
C Te
chno
logi
es H
oldi
...1.
86
Crow
n H
oldi
ngs
Inc
1.80
Sens
ient
Tec
hnol
ogie
s Co
rp1.
72
Cum
ulat
ive
Perf
orm
ance
Tim
e Pe
riod:
01/
30/2
014
- 09
/30/
2019
Growth of $100
198
186
175
164
153
142
131
120
108 97 86
09/1
901
/19
07/1
801
/18
07/1
701
/17
07/1
601
/16
07/1
509
/14
Janu
s H
ende
rson
Trit
on T
Russ
ell 2
000
Gro
wth
TR
USD
Gro
wth
of $
100
is c
alcu
late
d at
NAV
and
ass
umes
that
all
divi
dend
and
cap
ital g
ain
dist
ribut
ions
wer
e re
inve
sted
.It
does
not
take
into
acc
ount
sal
es c
harg
es o
r the
effe
ct o
f tax
es. R
esul
ts a
re n
ot in
dica
tive
of fu
ture
per
form
ance
.
Pag
e 97
|
153
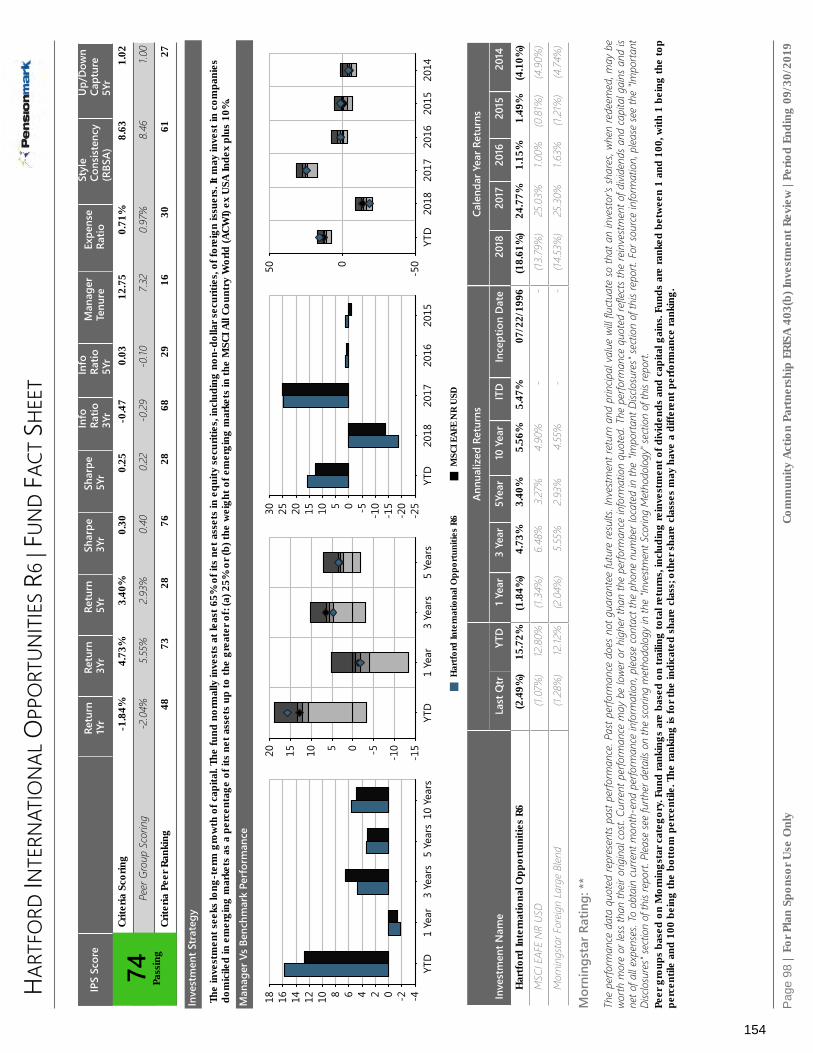
HART
FORD
INTE
RNAT
ION
AL O
PPO
RTUN
ITIE
S R6
| FU
ND
FACT
SHE
ET
For P
lan
Spon
sor U
se O
nly
Com
mun
ity A
ctio
n Pa
rtne
rshi
p ER
ISA
403(
b) In
vest
men
t Rev
iew
| Pe
riod
Endi
ng 0
9/30
/201
9
IPS
Scor
eRe
turn
1Yr
Retu
rn3Y
rRe
turn
5Yr
Shar
pe3Y
rSh
arpe
5Yr
Info
Ratio
3Yr
Info
Ratio
5Yr
Man
ager
Tenu
reEx
pens
eRa
tioSt
yle
Cons
isten
cy(R
BSA)
Up/
Dow
nCa
ptur
e5Y
r
74 Pass
ing
Crite
ria S
corin
g-1
.84%
4.73
%3.
40%
0.30
0.25
-0.4
70.
0312
.75
0.71
%8.
631.
02
Peer
Gro
up S
corin
g-2
.04%
5.55%
2.93%
0.40
0.22
-0.29
-0.10
7.32
0.97
%8.
461.0
0
Crite
ria P
eer R
anki
ng48
7328
7628
6829
1630
6127
Inve
stm
ent S
trat
egy
The
inve
stm
ent s
eeks
long
-ter
m g
row
th o
f cap
ital.
The
fund
nor
mal
ly in
vest
s at
leas
t 65%
of i
ts n
et a
sset
s in
equ
ity s
ecur
ities
, inc
ludi
ng n
on-d
olla
r sec
uriti
es, o
f for
eign
issu
ers.
It m
ay in
vest
in c
ompa
nies
dom
icile
d in
em
ergi
ng m
arke
ts a
s a
per c
enta
ge o
f its
net
ass
ets
up to
the
grea
ter o
f: (a
) 25%
or (
b) th
e w
eigh
t of e
mer
ging
mar
kets
in th
e M
SCI A
ll Co
untr
y W
orld
(ACW
I) ex
USA
Inde
x pl
us 1
0%.
Man
ager
Vs
Benc
hmar
k Pe
rfor
man
ce
18 16 14 12 10 8 6 4 2 0 -2 -410
Yea
rs5
Year
s3
Year
s1
Year
YTD
20 15 10 5 0 -5 -10
-15
5 Ye
ars
3 Ye
ars
1 Ye
arYT
D
30 25 20 15 10 5 0 -5 -10
-15
-20
-25
2015
2016
2017
2018
YTD
50 0
-50
2014
2015
2016
2017
2018
YTD
Har
tfor
d In
tern
atio
nal O
ppor
tuni
ties
R6M
SCI E
AFE
NR
USD
Inve
stm
ent N
ame
Annu
aliz
ed R
etur
nsCa
lend
ar Y
ear R
etur
ns
Last
Qtr
YTD
1 Yea
r3
Year
5Yea
r10
Yea
rIT
DIn
cept
ion
Dat
e20
1820
1720
1620
1520
14
Har
tfor
d In
tern
atio
nal O
ppor
tuni
ties
R6(2
.49%
)15
.72%
(1.8
4%)
4.73
%3.
40%
5.56
%5.
47%
07/2
2/19
96(1
8.61
%)
24.7
7%1.
15%
1.49
%(4
.10%
)
MSC
I EAF
E N
R US
D(1.
07%
)12
.80%
(1.34
%)
6.48
%3.
27%
4.90
%-
-(13
.79%
)25
.03%
1.00%
(0.8
1%)
(4.9
0%)
Mor
ning
star F
oreig
n La
rge
Blen
d(1.
28%
)12
.12%
(2.0
4%)
5.55%
2.93%
4.55
%-
-(14
.53%
)25
.30%
1.63%
(1.21
%)
(4.74
%)
Mor
ning
star
Rat
ing:
**
The
perfo
rman
ce d
ata
quot
ed re
pres
ents
pas
t per
form
ance
. Pas
t per
form
ance
doe
s no
t gua
rant
ee fu
ture
resu
lts. I
nves
tmen
t ret
urn
and
prin
cipal
val
ue w
ill flu
ctua
te so
that
an
inve
stor's
shar
es, w
hen
rede
emed
, may
be
worth
mor
e or
less
than
their
orig
inal
cost.
Cur
rent
per
form
ance
may
be
lowe
r or h
ighe
r tha
n th
e pe
rform
ance
info
rmat
ion
quot
ed. T
he p
erfo
rman
ce q
uote
d re
flect
s the
rein
vestm
ent o
f divi
dend
s and
capi
tal g
ains
and
isne
t of a
ll ex
pens
es. T
o ob
tain
curre
nt m
onth
-end
per
form
ance
info
rmat
ion,
plea
se co
ntac
t the
pho
ne n
umbe
r loc
ated
in th
e "Im
porta
nt D
isclo
sure
s" se
ctio
n of
this
repo
rt. F
or so
urce
info
rmat
ion,
plea
se se
e th
e "Im
porta
ntDi
sclo
sure
s" se
ctio
n of
this
repo
rt. P
lease
see
furth
er d
etai
ls on
the
scor
ing
met
hodo
logy
in th
e "In
vestm
ent S
corin
g M
etho
dolo
gy" s
ectio
n of
this
repo
rt.Pe
er g
roup
s ba
sed
on M
orni
ngst
ar c
ateg
ory.
Fund
rank
ings
are
bas
ed o
n tr
ailin
g to
tal r
etur
ns, i
nclu
ding
rein
vest
men
t of d
ivid
ends
and
cap
ital g
ains
. Fun
ds a
re ra
nked
bet
wee
n 1
and
100,
with
1 b
eing
the
top
perc
entil
e an
d 10
0 be
ing
the
bott
om p
erce
ntile
. The
rank
ing
is fo
r the
indi
cate
d sh
are
clas
s; ot
her s
hare
cla
sses
may
hav
e a
diffe
rent
per
form
ance
rank
ing.
Pag
e 98
|
154

HART
FORD
INTE
RNAT
ION
AL O
PPO
RTUN
ITIE
S R6
| FU
ND
FACT
SHE
ET
For P
lan
Spon
sor U
se O
nly
Com
mun
ity A
ctio
n Pa
rtne
rshi
p ER
ISA
403(
b) In
vest
men
t Rev
iew
| Pe
riod
Endi
ng 0
9/30
/201
9
Port
folio
Com
posit
ion
Tim
e Pe
riod:
10/
30/2
014
- 09
/30/
2019
100% 80%
60%
40%
20% 0%
09/19
03/19
03/18
03/17
03/16
03/15
Stoc
kBo
ndCa
shO
ther
Bond
Dist
ribut
ion
Tim
e Pe
riod:
10/
30/2
014
- 09
/30/
2019
100 80 60 40 20 0
09/19
03/19
03/18
03/17
03/16
03/15
Dom
estic
Bon
dFo
reig
n Bo
ndPr
efer
red
Stoc
ks
Conv
ertib
le B
ond
Oth
er
Equi
ty R
egio
nal D
istrib
utio
n
Tim
e Pe
riod:
10/
30/2
014
- 09
/30/
2019
100 80 60 40 20 0
09/19
03/19
03/18
03/17
03/16
03/15
Nor
th A
mer
ica
%La
tin A
mer
ica
%U
nite
d Ki
ngdo
m %
Euro
pe d
ev %
Euro
pe e
mrg
%Af
rica/
Mid
dle
East
%
Asia
%
Sect
or D
istrib
utio
n
Tim
e Pe
riod:
10/
30/2
014
- 09
/30/
2019
100 80 60 40 20 0
09/19
03/19
03/18
03/17
03/16
03/15
Tech
nolo
gyCo
mm
unic
atio
n Se
rvic
esCo
nsum
er C
yclic
al
Cons
umer
Def
ensi
veO
ther
Styl
e An
alys
is
Small - Large
2 1 0 -1 -2
Euro
pe -
Asi
a
21
0-1
-21 0 -1
-11
0
Asia
Pac
Sm
Asia
Pac
Lg
Euro
pe S
m
Euro
pe L
g
Risk
/Ret
urn
vs P
eer G
roup
Standard Deviation
22 20 18 16 14 12 10 8 6 4 2 010
yea
rs5
year
s3
year
s1
year
YTD
Sharpe Ratio
2 1 0 -110
yea
rs5
year
s3
year
s1
year
YTD
Information Ratio
2 1 0 -1 -210
yea
rs5
year
s3
year
s1
year
YTD
Har
tfor
d In
tern
atio
nal O
ppor
tuni
ties
R6M
SCI E
AFE
NR
USD
Fund
Bas
ics
Tick
erIH
OVX
Cate
gory
Fore
ign
Larg
e Bl
end
Net
Ass
ets(
This
Cla
ss $
mn)
3,49
9 m
Net
Ass
ets(
All C
lass
es $
mn)
0 m
Man
ager
Nic
olas
Cho
umen
kovi
tch
Man
ager
Ten
ure
12.7
5
Fund
Ince
ptio
nJu
l 22,
1996
Fee
And
Expe
nses
Expe
nse
Ratio
0.70
Gro
ss E
xpen
se R
atio
0.70
Pros
pect
us N
et E
xpen
se R
atio
0.71
Pros
pect
us G
ross
Exp
ense
Rat
io0.
71
Actu
al 1
2b1
0.00
Man
agem
ent F
ee0.
65
Top
10 H
oldi
ngs
(%)
Nes
tle S
A3.
52
Tenc
ent H
oldi
ngs
Ltd
2.87
Nov
artis
AG
2.32
Safr
an S
A2.
28
Tota
l SA
2.20
Cana
dian
Nat
iona
l Rai
lw...
2.09
Airb
us S
E1.
86
Roya
l Phi
lips
NV
1.82
Alco
n In
c1.
80
Ping
An
Insu
ranc
e (G
rou.
..1.
78
Cum
ulat
ive
Perf
orm
ance
Tim
e Pe
riod:
01/
30/2
014
- 09
/30/
2019
Growth of $100
144
138
131
124
117
111
104 97 91 84 77
09/1
901
/19
07/1
801
/18
07/1
701
/17
07/1
601
/16
07/1
509
/14
Har
tfor
d In
tern
atio
nal O
ppor
tuni
ties
R6
MSC
I EAF
E N
R U
SD
Gro
wth
of $
100
is c
alcu
late
d at
NAV
and
ass
umes
that
all
divi
dend
and
cap
ital g
ain
dist
ribut
ions
wer
e re
inve
sted
.It
does
not
take
into
acc
ount
sal
es c
harg
es o
r the
effe
ct o
f tax
es. R
esul
ts a
re n
ot in
dica
tive
of fu
ture
per
form
ance
.
Pag
e 99
|
155

AMER
ICAN
FUN
DS N
EW W
ORL
D R6
| FU
ND
FACT
SHE
ET
For P
lan
Spon
sor U
se O
nly
Com
mun
ity A
ctio
n Pa
rtne
rshi
p ER
ISA
403(
b) In
vest
men
t Rev
iew
| Pe
riod
Endi
ng 0
9/30
/201
9
IPS
Scor
eRe
turn
1Yr
Retu
rn3Y
rRe
turn
5Yr
Shar
pe3Y
rSh
arpe
5Yr
Info
Ratio
3Yr
Info
Ratio
5Yr
Man
ager
Tenu
reEx
pens
eRa
tioSt
yle
Cons
isten
cy(R
BSA)
Up/
Dow
nCa
ptur
e5Y
r
96 Pass
ing
Crite
ria S
corin
g7.
87%
9.57
%5.
49%
0.72
0.43
0.77
0.49
20.2
50.
62%
11.4
51.
26
Peer
Gro
up S
corin
g-0
.03%
5.06%
1.66%
0.31
0.11
-0.21
-0.14
6.94
1.27%
12.0
40.
97
Crite
ria P
eer R
anki
ng6
33
11
25
311
591
Inve
stm
ent S
trat
egy
The
inve
stm
ent s
eeks
long
-ter
m c
apita
l app
reci
atio
n. T
he fu
nd in
vest
s pr
imar
ily in
com
mon
sto
cks
of c
ompa
nies
with
sig
nific
ant e
xpos
ure
to c
ount
ries
with
dev
elop
ing
econ
omie
s an
d/or
mar
kets
. Und
erno
rmal
mar
ket c
ondi
tions
, the
fund
will
inv e
st a
t lea
st 3
5% o
f its
ass
ets
in e
quity
and
deb
t sec
uriti
es o
f iss
uers
prim
arily
bas
ed in
qua
lified
cou
ntrie
s th
at h
ave
deve
lopi
ng e
cono
mie
s an
d/or
mar
kets
.
Man
ager
Vs
Benc
hmar
k Pe
rfor
man
ce
20 18 16 14 12 10 8 6 4 2 0 -2 -410
Yea
rs5
Year
s3
Year
s1
Year
YTD
25 20 15 10 5 0 -5 -10
-15
-20
5 Ye
ars
3 Ye
ars
1 Ye
arYT
D
45 40 35 30 25 20 15 10 5 0 -5 -10
-15
-20
2015
2016
2017
2018
YTD
50 0
-50
2014
2015
2016
2017
2018
YTD
Amer
ican
Fun
ds N
ew W
orld
R6
MSC
I EM
NR
USD
Inve
stm
ent N
ame
Annu
aliz
ed R
etur
nsCa
lend
ar Y
ear R
etur
ns
Last
Qtr
YTD
1 Yea
r3
Year
5Yea
r10
Yea
rIT
DIn
cept
ion
Dat
e20
1820
1720
1620
1520
14
Amer
ican
Fun
ds N
ew W
orld
R6
(0.7
5%)
17.3
7%7.
87%
9.57
%5.
49%
6.40
%7.
99%
06/1
7/19
99(1
1.97
%)
33.0
6%4.
31%
(5.6
2%)
(3.2
9%)
MSC
I EM
NR
USD
(4.25
%)
5.89%
(2.0
2%)
5.97%
2.33%
3.37
%-
-(14
.57%
)37
.28%
11.19
%(14
.92%
)(2
.19%
)
Mor
ning
star D
ivers
ified
Emer
ging
Mkt
s(3
.64%
)7.9
9%(0
.03%
)5.0
6%1.6
6%3.
39%
--
(16.0
1%)
34.57
%9.
09%
(13.6
6%)
(2.3
3%)
Mor
ning
star
Rat
ing:
***
**
The
perfo
rman
ce d
ata
quot
ed re
pres
ents
pas
t per
form
ance
. Pas
t per
form
ance
doe
s no
t gua
rant
ee fu
ture
resu
lts. I
nves
tmen
t ret
urn
and
prin
cipal
val
ue w
ill flu
ctua
te so
that
an
inve
stor's
shar
es, w
hen
rede
emed
, may
be
worth
mor
e or
less
than
their
orig
inal
cost.
Cur
rent
per
form
ance
may
be
lowe
r or h
ighe
r tha
n th
e pe
rform
ance
info
rmat
ion
quot
ed. T
he p
erfo
rman
ce q
uote
d re
flect
s the
rein
vestm
ent o
f divi
dend
s and
capi
tal g
ains
and
isne
t of a
ll ex
pens
es. T
o ob
tain
curre
nt m
onth
-end
per
form
ance
info
rmat
ion,
plea
se co
ntac
t the
pho
ne n
umbe
r loc
ated
in th
e "Im
porta
nt D
isclo
sure
s" se
ctio
n of
this
repo
rt. F
or so
urce
info
rmat
ion,
plea
se se
e th
e "Im
porta
ntDi
sclo
sure
s" se
ctio
n of
this
repo
rt. P
lease
see
furth
er d
etai
ls on
the
scor
ing
met
hodo
logy
in th
e "In
vestm
ent S
corin
g M
etho
dolo
gy" s
ectio
n of
this
repo
rt.Pe
er g
roup
s ba
sed
on M
orni
ngst
ar c
ateg
ory.
Fund
rank
ings
are
bas
ed o
n tr
ailin
g to
tal r
etur
ns, i
nclu
ding
rein
vest
men
t of d
ivid
ends
and
cap
ital g
ains
. Fun
ds a
re ra
nked
bet
wee
n 1
and
100,
with
1 b
eing
the
top
perc
entil
e an
d 10
0 be
ing
the
bott
om p
erce
ntile
. The
rank
ing
is fo
r the
indi
cate
d sh
are
clas
s; ot
her s
hare
cla
sses
may
hav
e a
diffe
rent
per
form
ance
rank
ing.
Pag
e 10
0 |
156

AMER
ICAN
FUN
DS N
EW W
ORL
D R6
| FU
ND
FACT
SHE
ET
For P
lan
Spon
sor U
se O
nly
Com
mun
ity A
ctio
n Pa
rtne
rshi
p ER
ISA
403(
b) In
vest
men
t Rev
iew
| Pe
riod
Endi
ng 0
9/30
/201
9
Port
folio
Com
posit
ion
Tim
e Pe
riod:
10/
30/2
014
- 09
/30/
2019
100% 80%
60%
40%
20% 0%
09/19
03/19
03/18
03/17
03/16
03/15
Stoc
kBo
ndCa
shO
ther
Bond
Dist
ribut
ion
Tim
e Pe
riod:
10/
30/2
014
- 09
/30/
2019
100 80 60 40 20 0
09/19
03/19
03/18
03/17
03/16
03/15
Dom
estic
Bon
dFo
reig
n Bo
ndPr
efer
red
Stoc
ks
Conv
ertib
le B
ond
Oth
er
Equi
ty R
egio
nal D
istrib
utio
n
Tim
e Pe
riod:
10/
30/2
014
- 09
/30/
2019
100 80 60 40 20 0
09/19
03/19
03/18
03/17
03/16
03/15
Nor
th A
mer
ica
%La
tin A
mer
ica
%U
nite
d Ki
ngdo
m %
Euro
pe d
ev %
Euro
pe e
mrg
%Af
rica/
Mid
dle
East
%
Asia
%
Sect
or D
istrib
utio
n
Tim
e Pe
riod:
10/
30/2
014
- 09
/30/
2019
100 80 60 40 20 0
09/19
03/19
03/18
03/17
03/16
03/15
Tech
nolo
gyCo
mm
unic
atio
n Se
rvic
esCo
nsum
er C
yclic
al
Cons
umer
Def
ensi
veO
ther
Styl
e An
alys
is
Small - Large
2 1 0 -1 -2
Euro
pe -
Asi
a
21
0-1
-21 0 -1
-11
0
Asia
Pac
Sm
Asia
Pac
Lg
Euro
pe S
m
Euro
pe L
g
Risk
/Ret
urn
vs P
eer G
roup
Standard Deviation
20 18 16 14 12 10 8 6 4 2 010
yea
rs5
year
s3
year
s1
year
YTD
Sharpe Ratio
2 1 0 -110
yea
rs5
year
s3
year
s1
year
YTD
Information Ratio
3 2 1 0 -1 -210
yea
rs5
year
s3
year
s1
year
YTD
Amer
ican
Fun
ds N
ew W
orld
R6
MSC
I EM
NR
USD
Fund
Bas
ics
Tick
erRN
WG
X
Cate
gory
Div
ersi
fied
Emer
ging
Mkt
s
Net
Ass
ets(
This
Cla
ss $
mn)
40,4
78 m
Net
Ass
ets(
All C
lass
es $
mn)
0 m
Man
ager
Robe
rt L
ovel
ace
Man
ager
Ten
ure
20.2
5
Fund
Ince
ptio
nJu
n 17
,199
9
Fee
And
Expe
nses
Expe
nse
Ratio
0.62
Gro
ss E
xpen
se R
atio
0.62
Pros
pect
us N
et E
xpen
se R
atio
0.62
Pros
pect
us G
ross
Exp
ense
Rat
io0.
62
Actu
al 1
2b1
0.00
Man
agem
ent F
ee0.
53
Top
10 H
oldi
ngs
(%)
Relia
nce
Indu
strie
s Lt
d1.
78
Alib
aba
Gro
up H
oldi
ng L
...1.
73
AIA
Gro
up L
td1.
66
Taiw
an S
emic
ondu
ctor
Ma.
..1.
56
HD
FC B
ank
Ltd
1.53
Kota
k M
ahin
dra
Bank
Ltd
1.53
Mic
roso
ft C
orp
1.49
Tenc
ent H
oldi
ngs
Ltd
1.45
Mas
terc
ard
Inc
A1.
31
Alph
abet
Inc
Clas
s C
1.15
Cum
ulat
ive
Perf
orm
ance
Tim
e Pe
riod:
01/
30/2
014
- 09
/30/
2019
Growth of $100
144
137
129
121
113
105 97 89 82 74 66
09/1
901
/19
07/1
801
/18
07/1
701
/17
07/1
601
/16
07/1
509
/14
Amer
ican
Fun
ds N
ew W
orld
R6
MSC
I EM
NR
USD
Gro
wth
of $
100
is c
alcu
late
d at
NAV
and
ass
umes
that
all
divi
dend
and
cap
ital g
ain
dist
ribut
ions
wer
e re
inve
sted
.It
does
not
take
into
acc
ount
sal
es c
harg
es o
r the
effe
ct o
f tax
es. R
esul
ts a
re n
ot in
dica
tive
of fu
ture
per
form
ance
.
Pag
e 10
1 |
157

PRIN
CIPA
L RE
AL E
STAT
E SE
CURI
TIES
INST
| FU
ND
FACT
SHE
ET
For P
lan
Spon
sor U
se O
nly
Com
mun
ity A
ctio
n Pa
rtne
rshi
p ER
ISA
403(
b) In
vest
men
t Rev
iew
| Pe
riod
Endi
ng 0
9/30
/201
9
IPS
Scor
eRe
turn
1Yr
Retu
rn3Y
rRe
turn
5Yr
Shar
pe3Y
rSh
arpe
5Yr
Info
Ratio
3Yr
Info
Ratio
5Yr
Man
ager
Tenu
reEx
pens
eRa
tioSt
yle
Cons
isten
cy(R
BSA)
Up/
Dow
nCa
ptur
e5Y
r
96 Pass
ing
Crite
ria S
corin
g21
.89%
9.51
%11
.68%
0.69
0.80
1.00
0.81
18.7
50.
91%
27.7
01.
17
Peer
Gro
up S
corin
g17
.26%
7.22%
9.27
%0.
520.
670.
13-0
.2010
.86
1.12%
26.8
41.1
2
Crite
ria P
eer R
anki
ng14
125
99
42
1240
3713
Inve
stm
ent S
trat
egy
The
inve
stm
ent s
eeks
to g
ener
ate
a to
tal r
etur
n. U
nder
nor
mal
circ
umst
ance
s, th
e fu
nd in
vest
s at
leas
t 80%
of i
ts n
et a
sset
s, pl
us a
ny b
orro
win
gs fo
r inv
estm
ent p
urpo
ses,
in e
quity
sec
uriti
es o
f com
pani
espr
inci
pally
eng
aged
in th
e re
al e
stat
e in
dust
ry a
t the
tim
e of
pur
chas
e. It
inve
sts
in v
alue
equ
ity s
ecur
ities
, an
inve
stm
ent s
trat
egy
that
em
phas
izes
buy
ing
secu
ritie
s th
at a
ppea
r to
be u
nder
valu
ed. T
he fu
ndco
ncen
trat
es it
s in
vest
men
ts (i
nves
t mor
e th
an 2
5% o
f its
net
ass
ets)
in s
ecur
ities
in th
e re
al e
stat
e in
dust
ry. I
t is
non-
dive
rsifi
ed.
Man
ager
Vs
Benc
hmar
k Pe
rfor
man
ce
35 30 25 20 15 10 5 010
Yea
rs5
Year
s3
Year
s1
Year
YTD
45 40 35 30 25 20 15 10 5 0 -55
Year
s3
Year
s1
Year
YTD
35 30 25 20 15 10 5 0 -5 -10
2015
2016
2017
2018
YTD
40 20 0
-20
2014
2015
2016
2017
2018
YTD
Prin
cipa
l Rea
l Est
ate
Secu
ritie
s In
stD
J US
Sele
ct R
EIT
TR U
SD
Inve
stm
ent N
ame
Annu
aliz
ed R
etur
nsCa
lend
ar Y
ear R
etur
ns
Last
Qtr
YTD
1 Yea
r3
Year
5Yea
r10
Yea
rIT
DIn
cept
ion
Dat
e20
1820
1720
1620
1520
14
Prin
cipa
l Rea
l Est
ate
Secu
ritie
s In
st7.
74%
30.4
5%21
.89%
9.51
%11
.68%
13.7
6%11
.80%
12/0
6/20
00(4
.31%
)9.
03%
5.93
%4.
22%
32.3
6%
DJ U
S Se
lect R
EIT
TR U
SD6.
83%
24.6
4%16
.41%
6.48
%9.
70%
12.6
9%-
-(4
.22%
)3.
76%
6.68
%4.
48%
32.0
0%
Mor
ning
star R
eal E
state
6.89
%26
.43%
17.26
%7.2
2%9.
27%
12.15
%-
-(6
.02%
)6.
93%
7.70%
1.97%
27.8
9%
Mor
ning
star
Rat
ing:
***
**
The
perfo
rman
ce d
ata
quot
ed re
pres
ents
pas
t per
form
ance
. Pas
t per
form
ance
doe
s no
t gua
rant
ee fu
ture
resu
lts. I
nves
tmen
t ret
urn
and
prin
cipal
val
ue w
ill flu
ctua
te so
that
an
inve
stor's
shar
es, w
hen
rede
emed
, may
be
worth
mor
e or
less
than
their
orig
inal
cost.
Cur
rent
per
form
ance
may
be
lowe
r or h
ighe
r tha
n th
e pe
rform
ance
info
rmat
ion
quot
ed. T
he p
erfo
rman
ce q
uote
d re
flect
s the
rein
vestm
ent o
f divi
dend
s and
capi
tal g
ains
and
isne
t of a
ll ex
pens
es. T
o ob
tain
curre
nt m
onth
-end
per
form
ance
info
rmat
ion,
plea
se co
ntac
t the
pho
ne n
umbe
r loc
ated
in th
e "Im
porta
nt D
isclo
sure
s" se
ctio
n of
this
repo
rt. F
or so
urce
info
rmat
ion,
plea
se se
e th
e "Im
porta
ntDi
sclo
sure
s" se
ctio
n of
this
repo
rt. P
lease
see
furth
er d
etai
ls on
the
scor
ing
met
hodo
logy
in th
e "In
vestm
ent S
corin
g M
etho
dolo
gy" s
ectio
n of
this
repo
rt.Pe
er g
roup
s ba
sed
on M
orni
ngst
ar c
ateg
ory.
Fund
rank
ings
are
bas
ed o
n tr
ailin
g to
tal r
etur
ns, i
nclu
ding
rein
vest
men
t of d
ivid
ends
and
cap
ital g
ains
. Fun
ds a
re ra
nked
bet
wee
n 1
and
100,
with
1 b
eing
the
top
perc
entil
e an
d 10
0 be
ing
the
bott
om p
erce
ntile
. The
rank
ing
is fo
r the
indi
cate
d sh
are
clas
s; ot
her s
hare
cla
sses
may
hav
e a
diffe
rent
per
form
ance
rank
ing.
Pag
e 10
2 |
158

PRIN
CIPA
L RE
AL E
STAT
E SE
CURI
TIES
INST
| FU
ND
FACT
SHE
ET
For P
lan
Spon
sor U
se O
nly
Com
mun
ity A
ctio
n Pa
rtne
rshi
p ER
ISA
403(
b) In
vest
men
t Rev
iew
| Pe
riod
Endi
ng 0
9/30
/201
9
Port
folio
Com
posit
ion
Tim
e Pe
riod:
10/
30/2
014
- 09
/30/
2019
100% 80%
60%
40%
20% 0%
09/19
03/19
03/18
03/17
03/16
03/15
Stoc
kBo
ndCa
shO
ther
Bond
Dist
ribut
ion
Tim
e Pe
riod:
10/
30/2
014
- 09
/30/
2019
Insu
ffici
ent d
ata
to d
ispl
ay g
raph
Equi
ty R
egio
nal D
istrib
utio
n
Tim
e Pe
riod:
10/
30/2
014
- 09
/30/
2019
100 80 60 40 20 0
09/19
03/19
03/18
03/17
03/16
03/15
Nor
th A
mer
ica
%La
tin A
mer
ica
%U
nite
d Ki
ngdo
m %
Euro
pe d
ev %
Euro
pe e
mrg
%Af
rica/
Mid
dle
East
%
Asia
%
Sect
or D
istrib
utio
n
Tim
e Pe
riod:
10/
30/2
014
- 09
/30/
2019
100 80 60 40 20 0
09/19
03/19
03/18
03/17
03/16
03/15
Tech
nolo
gyCo
mm
unic
atio
n Se
rvic
esCo
nsum
er C
yclic
al
Cons
umer
Def
ensi
veO
ther
Styl
e An
alys
is
Small - Large
2 1 0 -1 -2
Valu
e -
Gro
wth
21
0-1
-21 0 -1
-11
0
Smal
l Gro
wth
Smal
l Val
ue
Mid
Gro
wth
Mid
Val
ue
Top
Gro
wth
Top
Valu
e
Risk
/Ret
urn
vs P
eer G
roup
Standard Deviation
18 16 14 12 10 8 6 4 2 010
yea
rs5
year
s3
year
s1
year
YTD
Sharpe Ratio
4 3 2 1 010
yea
rs5
year
s3
year
s1
year
YTD
Information Ratio
3 2 1 0 -1 -210
yea
rs5
year
s3
year
s1
year
YTD
Prin
cipa
l Rea
l Est
ate
Secu
ritie
s In
stD
J US
Sele
ct R
EIT
TR U
SD
Fund
Bas
ics
Tick
erPI
REX
Cate
gory
Real
Est
ate
Net
Ass
ets(
This
Cla
ss $
mn)
4,97
8 m
Net
Ass
ets(
All C
lass
es $
mn)
0 m
Man
ager
Kelly
Rus
h
Man
ager
Ten
ure
18.7
5
Fund
Ince
ptio
nD
ec 0
6,20
00
Fee
And
Expe
nses
Expe
nse
Ratio
0.91
Gro
ss E
xpen
se R
atio
0.00
Pros
pect
us N
et E
xpen
se R
atio
0.91
Pros
pect
us G
ross
Exp
ense
Rat
io0.
91
Actu
al 1
2b1
0.00
Man
agem
ent F
ee0.
81
Top
10 H
oldi
ngs
(%)
Prol
ogis
Inc
7.21
Equi
nix
Inc
6.46
Aval
onBa
y Co
mm
uniti
es In
c6.
06
Wel
ltow
er In
c5.
38
Invi
tatio
n H
omes
Inc
4.86
Esse
x Pr
oper
ty T
rust
Inc
4.33
Alex
andr
ia R
eal E
stat
e ...
3.89
Sim
on P
rope
rty
Gro
up In
c3.
40
Hea
lthca
re T
rust
of A
me.
..3.
30
STO
RE C
apita
l Cor
p3.
21
Cum
ulat
ive
Perf
orm
ance
Tim
e Pe
riod:
01/
30/2
014
- 09
/30/
2019
Growth of $100
184
184
174
165
156
146
137
127
118
109 99 90
09/1
901
/19
07/1
801
/18
07/1
701
/17
07/1
601
/16
07/1
509
/14
Prin
cipa
l Rea
l Est
ate
Secu
ritie
s In
st
DJ U
S Se
lect
REI
T TR
USD
Gro
wth
of $
100
is c
alcu
late
d at
NAV
and
ass
umes
that
all
divi
dend
and
cap
ital g
ain
dist
ribut
ions
wer
e re
inve
sted
.It
does
not
take
into
acc
ount
sal
es c
harg
es o
r the
effe
ct o
f tax
es. R
esul
ts a
re n
ot in
dica
tive
of fu
ture
per
form
ance
.
Pag
e 10
3 |
159

IMPO
RTAN
T D
ISCL
OSU
RES
Com
mun
ity A
ctio
n Pa
rtne
rshi
p ER
ISA
403(
b)
For P
erio
d En
ding
09/
30/2
019
160

FOR
PLAN
SPO
NSOR
USE
ONL
Y -N
ot for
Use
with
Par
ticipa
nts o
r the
Gen
eral
Publi
c. Pe
nsion
mark
Finan
cial G
roup
, LLC
(“Pe
nsion
mark
”) is
an in
vestm
ent a
dvise
r reg
ister
ed u
nder
the I
nves
tmen
t Adv
isers
Act o
f 194
0. Pe
nsion
mark
is aff
iliated
thro
ugh
comm
on o
wner
ship
with
Pens
ionma
rk Se
curiti
es, L
LC (m
embe
r SIP
C).
IMPO
RTAN
TDI
SCLO
SURE
S, SO
URCE
INFO
RMAT
ION
, &
INDE
XDE
FIN
ITIO
NS
Pag
e 10
5 |
161

IMPO
RTAN
TD
ISCL
OSU
RES
& S
OU
RCE
INFO
RMAT
ION
The
perfo
rman
ce d
ata
quot
ed re
pres
ents
pas
t per
form
ance
. Pas
t per
form
ance
doe
s no
t gua
rant
ee fu
ture
resu
lts. I
nves
tmen
t ret
urn
and
prin
cipal
val
ue w
ill flu
ctua
te so
that
an
inve
stor
's sh
ares
, whe
n re
deem
ed, m
ay b
e w
orth
mor
e or
less
than
thei
r orig
inal
cos
t. Cu
rrent
per
form
ance
may
be
low
er o
r hig
her t
han
the
perfo
rman
cein
form
atio
n qu
oted
. To
obta
in c
urre
nt m
onth
-end
per
form
ance
in
form
atio
n, p
leas
e ca
ll 88
8-20
1-54
88.
The
perfo
rman
ce q
uote
d re
flect
s the
rein
vest
men
t of d
ivide
nds
and
capi
tal g
ains
and
is n
et o
f all
expe
nses
. Inv
estin
g in
mut
ual f
unds
invo
lves r
isk, i
nclu
ding
pos
sible
loss
of p
rincip
al. A
ll in
dice
s are
un
man
aged
and
can
not b
e in
vest
ed in
to d
irect
ly. U
nman
aged
inde
x re
turn
s do
not r
efle
ct fe
es, e
xpen
ses,
or s
ales
cha
rges
. Ind
ex p
erfo
rman
ce is
not
indi
cativ
e of
the
perfo
rman
ce o
f any
inve
stm
ent.
Inve
stor
s sho
uld
cons
ider
the
inve
stm
ent o
bjec
tives
, risk
s, ch
arge
s and
exp
ense
s of t
he in
vest
men
t com
pany
car
eful
ly be
fore
inve
stin
g. T
he p
rosp
ectu
s an
d, if
ava
ilabl
e, th
e su
mm
ary
pros
pect
us c
onta
in th
is an
d ot
her i
mpo
rtant
info
rmat
ion
abou
t the
inve
stm
ent c
ompa
ny. Y
ou c
an o
btai
n a
pros
pect
us a
nd su
mm
ary
pros
pect
us fr
om y
our f
inan
cial r
epre
sent
ative
. Rea
d ca
refu
lly b
efor
e in
vest
ing.
Risk
Disc
losu
res:
Bond
Fun
ds-A
n in
crea
se in
inte
rest
rate
s may
cau
se th
e pr
ice o
f bon
ds a
nd b
ond
mut
ual f
unds
to d
eclin
e.Go
vern
men
t Bon
d Fu
nds-
An in
vest
or c
an lo
se m
oney
whe
n in
vest
ing
in g
over
nmen
t bon
d fu
nds.
Fund
itse
lf is
not g
uara
ntee
d an
d fu
nd's
perfo
rman
ce w
illva
ry.
Inte
rnat
iona
l/Em
ergi
ng M
arke
ts F
unds
-Int
erna
tiona
l and
em
ergi
ng m
arke
t inv
estin
g in
volve
s spe
cial r
isks s
uch
as c
urre
ncy
fluct
uatio
n an
d po
litica
l ins
tabi
lity
and
may
not
be
suita
ble
for a
ll in
vest
ors.
Real
Est
ate
Fund
s-In
vest
ing
in re
al e
stat
e in
volve
s spe
cial r
isks s
uch
as p
oten
tial i
lliqui
dity
and
may
not
be
suita
ble
for a
ll in
vest
ors.
Ther
e is
no a
ssur
ance
that
the
inve
stm
ent o
bjec
tives
of t
he fu
nd w
ill be
at
tain
ed.
Smal
l and
Mid
Cap
Fun
ds-T
he p
rices
of s
mal
l and
mid
-cap
sto
cks a
re g
ener
ally
mor
e vo
latil
e th
an la
rge
cap
stoc
ks.
Targ
et D
ate
Fund
s-Th
e ta
rget
dat
e is
the
appr
oxim
ate
date
whe
n in
vest
ors p
lan
to st
art w
ithdr
awin
g th
eir m
oney
. The
glid
epat
h is
how
the
asse
t allo
catio
n of
the
fund
cha
nges
ove
r tim
e. T
he p
rincip
al
valu
e of
a ta
rget
fund
is n
ot g
uara
ntee
d at
any
tim
e, in
cludi
ng a
t the
targ
et d
ate.
Mor
ning
star
Rat
ings
:Fo
r eac
h fu
nd w
ith a
t lea
st a
thre
e ye
ar h
istor
y, M
orni
ngst
ar c
alcu
late
s a M
orni
ngst
ar R
atin
g ba
sed
on a
Mor
ning
star
Risk
-Adj
uste
d Re
turn
mea
sure
that
acc
ount
s for
varia
tions
in a
fund
's m
onth
ly pe
rform
ance
(inc
ludi
ng th
e ef
fect
s of s
ales
cha
rges
, loa
ds, a
nd re
dem
ptio
n fe
es),
plac
ing
mor
eem
phas
is on
dow
nwar
d va
riatio
ns a
ndre
war
ding
con
siste
nt p
erfo
rman
ce. T
he to
p 10
% o
f fun
ds in
eac
h ca
tego
ry re
ceive
five
star
s, th
e ne
xt 2
2.5%
rece
ive fo
ur st
ars,
the
next
35%
rece
ive th
ree
star
s, th
ene
xt 2
2.5%
rece
ive tw
o st
ars a
nd th
e bo
ttom
10%
rece
ive o
ne st
ar. T
he o
vera
ll M
orni
ngst
ar R
atin
g fo
r a fu
nd is
der
ived
from
aw
eigh
ted-
aver
age
of th
e pe
rform
ance
figur
es a
ssoc
iate
d w
ith it
s thr
ee-,
five-
and
ten-
year
(if a
pplic
able
) Mor
ning
star
Rat
ings
met
rics.
Sour
ce In
form
atio
n:Ex
ecut
ive S
umm
ary:
Reco
mm
enda
tions
bas
ed o
n qu
alita
tive
and/
or q
uant
itativ
e in
vest
men
t met
hodo
logy
of P
ensio
nmar
k Fi
nanc
ial G
roup
Portf
olio
| Di
vers
ifica
tion:
Ass
ets a
ggre
gate
d fro
m re
cord
keep
er d
ata
as o
f qua
rter-
end
and
com
pile
d by
Env
estn
et R
etire
men
t Sol
utio
ns.
Portf
olio
| As
set A
lloca
tion:
Ass
ets a
ggre
gate
d fro
m re
cord
keep
er d
ata
as o
f qua
rter-
end
and
com
pile
d by
Env
estn
et R
etire
men
t Sol
utio
ns.
Portf
olio
| Ho
ldin
gs &
Sec
tor A
lloca
tion:
Ass
ets a
ggre
gate
d fro
m re
cord
keep
er d
ata
as o
f qua
rter-
end
and
com
pile
d by
Env
estn
et R
etire
men
t Sol
utio
ns.
Portf
olio
| Re
gion
& Q
ualit
y Al
loca
tion:
Ass
ets a
ggre
gate
d fro
m re
cord
keep
er d
ata
as o
f qua
rter-
end
and
com
pile
d by
Env
estn
et R
etire
men
t Sol
utio
ns.
Portf
olio
| Re
turn
s : A
sset
s agg
rega
ted
from
reco
rdke
eper
dat
a as
of q
uarte
r-en
d an
d co
mpi
led
by E
nves
tnet
Ret
irem
ent S
olut
ions
.Po
rtfol
io |
Beta
/Sta
ndar
d De
viatio
n: A
sset
s agg
rega
ted
from
reco
rdke
eper
dat
a as
of q
uarte
r-en
d an
d co
mpi
led
by E
nves
tnet
Ret
irem
ent S
olut
ions
.Po
rtfol
io |
Alph
a: A
sset
s agg
rega
ted
from
reco
rdke
eper
dat
a as
of q
uarte
r-en
d an
d co
mpi
led
by E
nves
tnet
Ret
irem
ent S
olut
ions
.Po
rtfol
io |
Shar
pe R
atio
: Ass
ets a
ggre
gate
d fro
m re
cord
keep
er d
ata
as o
f qua
rter-
end
and
com
pile
d by
Env
estn
et R
etire
men
t Sol
utio
ns.
Portf
olio
| In
form
atio
n Ra
tio: A
sset
s agg
rega
ted
from
reco
rdke
eper
dat
a as
of q
uarte
r-en
d an
d co
mpi
led
by E
nves
tnet
Ret
irem
ent S
olut
ions
.Po
rtfol
io |
Cum
ulat
ive P
erfo
rman
ce: A
sset
s agg
rega
ted
from
reco
rdke
eper
dat
a as
of q
uarte
r-en
d an
d co
mpi
led
by E
nves
tnet
Ret
irem
ent S
olut
ions
.Po
rtfol
io |
Wei
ghte
d Fe
e An
alys
is: A
sset
s agg
rega
ted
from
reco
rdke
eper
dat
a as
of q
uarte
r-en
d an
d co
mpi
led
by E
nves
tnet
Ret
irem
ent S
olut
ions
.In
vest
men
t Sco
reca
rd |
Curre
nt &
Hist
orica
l Sco
ring
Inve
stm
ent P
erfo
rman
ce v
s. Ri
sk: M
orni
ngst
ar/E
nves
tnet
Ret
irem
ent S
olut
ions
Inve
stm
ent S
core
card
| In
vest
men
t Per
form
ance
: Mor
ning
star
and
Enve
stne
tRet
irem
ent S
olut
ions
Fund
Fac
t She
ets:
Mor
ning
star
, Env
estn
et R
etire
men
t Sol
utio
ns, a
nd P
ensio
nmar
k Fi
nanc
ial G
roup
Inve
stm
ent S
corin
g M
etho
dolo
gy: P
ensio
nmar
k Fi
nanc
ial G
roup
Pag
e 10
6 |
162

Inde
x N
ame
Inde
x D
escr
iptio
n
Ale
rian
ML
P T
R U
SDTh
e in
dex
mea
sure
s the
per
form
ance
of e
nerg
y se
gmen
t US
equi
ty se
curit
ies.
It is
a c
ompo
site
of t
he 5
0 m
ost p
rom
inen
t ene
rgy
Mas
ter L
imite
d Pa
rtner
ship
s ('M
LPs')
. Th
e in
dex
is c
alcu
late
d us
ing
a flo
at-a
djus
ted,
capi
taliz
atio
n-w
eigh
ted
met
hodo
logy
.
Blo
ombe
rg C
omm
odity
TR
USD
The
inde
x m
easu
res t
he p
erfo
rman
ce o
f fut
ure c
ontra
cts o
n ph
ysic
al c
omm
oditi
es w
hich
trad
ed o
n U
S ec
hang
esan
d Lo
ndon
Met
al E
xcha
nge.
The
com
mod
ity w
eigh
tings
ar
e ba
sed
on p
rodu
ctio
n an
d liq
uidi
ty, s
ubje
ct to
wei
ghtin
g re
stric
tions
app
lied
annu
ally
.
Blo
ombe
rg S
ub B
rent
Cru
de T
R U
SDTh
e in
dex
is a
sing
le c
omm
odity
inde
x co
mpo
sed
of fu
ture
s con
tract
s on
Bre
nt c
rude
. The
inde
x is
par
t of t
he B
loom
berg
CIT
R fa
mily
. It r
efle
cts t
he re
turn
on
fully
co
llate
raliz
ed fu
ture
s pos
ition
s and
is q
uote
d in
USD
.
Blo
ombe
rg S
ub W
TI C
rude
Oil
TR
USD
The
inde
x is
a si
ngle
com
mod
ity su
bind
ex o
f the
Blo
ombe
rg C
I com
pose
d of
futu
res c
ontra
cts o
n cr
ude o
il. It
refle
cts t
he re
turn
of u
nder
lyin
g co
mm
odity
futu
res p
rice
mov
emen
ts o
nly
and
is q
uote
d in
USD
.
BB
gBar
c US
Tre
asur
y B
ill 1
-3 M
on T
R U
SDTh
e in
dex
mea
sure
s the
per
form
ance
of p
ublic
obl
igat
ions
of t
he U
.S. T
reas
ury
with
mat
uriti
es o
f 1-3
mon
th, i
nclu
ding
secu
ritie
srol
l up
to th
e U
.S. A
ggre
gate
, U.S
. U
nive
rsal
, and
Glo
bal A
ggre
gate
Indi
ces.
BB
gBar
cCre
dit 1
-5 Y
rT
R U
SDTh
e in
dex
mea
sure
s the
per
form
ance
of t
he in
vest
men
t gra
de, U
S do
llar d
enom
inat
ed, f
ixed
-rate
, tax
able
cor
pora
te a
nd g
over
nmen
t rel
ated
bon
ds w
ith m
atur
ity o
f 1-5
ye
ars.
It is
com
pris
ed o
f the
US
Cor
pora
te In
dex
and
a no
n-co
rpor
ate c
ompo
nent
that
incl
udes
fore
ign
agen
cies
, sov
erei
gns,
supr
anat
iona
ls an
d lo
cal a
utho
ritie
s.
BB
gBar
cGlo
bal A
ggre
gate
TR
USD
The
inde
x m
easu
res t
he p
erfo
rman
ce o
f glo
bal i
nves
tmen
t gra
de fi
xed-
rate
deb
t mar
kets
, inc
ludi
ng th
e U
.S. A
ggre
gate
, the
Pan
-Eur
opea
n A
ggre
gate
, the
Asi
an-P
acifi
c A
ggre
gate
, Glo
bal T
reas
ury,
Eur
odol
lar,
Euro
-Yen
, Can
adia
n, an
d In
vest
men
t Gra
de 1
44A
inde
x-el
igib
le se
curit
ies.
BB
gBar
c Glo
bal H
igh
Yie
ld T
R U
SDTh
e in
dex
mea
sure
s the
per
form
ance
of t
he g
loba
l hig
h-yi
eld
fixed
inco
me m
arke
ts. I
t rep
rese
nts t
he u
nion
of t
he U
.S. H
igh-
Yie
ld, P
an-E
urop
ean
Hig
h-Y
ield
, U.S
. Em
ergi
ng M
arke
ts H
igh-
Yie
ld, a
nd P
an-E
urop
ean
Emer
ging
Mar
ket H
igh-
Yie
ld In
dice
s. Th
e in
dex
is a
com
pone
nt o
f the
Mul
tiver
se In
dex,
alo
ng w
ith th
e G
loba
l A
ggre
gate
Inde
x.
BB
gBar
cMun
icip
al T
R U
SDTh
is in
dex
mea
sure
s the
per
form
ance
of t
he B
loom
berg
Bar
clay
s U.S
. Mun
icip
al b
ond,
whi
ch c
over
s the
USD
-den
omin
ated
Lon
g-Te
rm ta
x ex
empt
bon
d m
arke
t with
fo
ur m
ain
sect
ors:
stat
e and
loca
l gen
eral
obl
igat
ion
bond
s, re
venu
e bo
nds,
insu
red
bond
s and
pre
refu
nded
bon
ds.
BB
gBar
c US
1-5Y
Gov
Cre
dit F
lAdj
TR
USD
The
inde
x m
easu
res t
he p
erfo
rman
ce o
f the
non
-sec
uriti
zed
com
pone
nt o
f the
US
Agg
rega
te in
dex
with
mat
uriti
es o
f 1-5
yea
rs. I
t use
s alte
rnat
ive w
eigh
ting
sche
mes
in
stea
d of
mar
ket v
alue
wei
ghts
.
BB
gBar
c US
5-10
Y G
ovC
redi
t FlA
dj T
R U
SDTh
e in
dex
mea
sure
s the
per
form
ance
of t
he n
on-s
ecur
itize
d co
mpo
nent
of t
he U
S A
ggre
gate
inde
x w
ith m
atur
ities
of 5
-10
year
s. It
uses
alte
rnat
ive w
eigh
ting
sche
mes
in
stea
d of
mar
ket v
alue
wei
ghts
.
BB
gBar
c US
Agg
Bon
d T
R U
SDTh
e in
dex
mea
sure
s the
per
form
ance
of i
nves
tmen
t gra
de, U
.S. d
olla
r-den
omin
ated
, fix
ed-ra
te ta
xabl
e bon
d m
arke
t, in
clud
ing
Trea
surie
s, go
vern
men
t-rel
ated
and
co
rpor
ate s
ecur
ities
, MB
S (a
genc
y fix
ed-ra
te a
nd h
ybrid
AR
M p
asst
hrou
ghs)
, AB
S, a
nd C
MB
S. It
rolls
up
into
oth
er B
arcl
ays f
lags
hip
indi
ces,
such
as t
he m
ulti-
curre
ncy
Glo
bal A
ggre
gate
Inde
x an
d th
e U
.S. U
nive
rsal
Inde
x, w
hich
incl
udes
hig
h yi
eld
and
emer
ging
mar
kets
deb
t.
BB
gBar
c US
Cre
dit 5
-10
Yr
TR
USD
The
inde
x m
easu
res t
he p
erfo
rman
ce o
f the
US
Cor
pora
te a
nd a
non
-cor
pora
te co
mpo
nent
with
mat
uriti
es o
f 5-1
0 ye
ar th
at in
clud
es fo
reig
n ag
enci
es, s
over
eign
s, su
pran
atio
nals
and
loca
l aut
horit
ies.
It is
a su
bset
of t
he U
S G
over
nmen
t/Cre
dit I
ndex
and
the
US
Agg
rega
te In
dex.
BB
gBar
c US
Gov
t/Cre
dit L
ong
TR
USD
The
inde
x m
easu
res t
he p
erfo
rman
ce o
f non
-sec
uriti
zed
com
pone
nt o
f the
U.S
. Agg
rega
te In
dex
with
mat
uriti
es o
f 10
year
s and
gre
ater
, inc
ludi
ng T
reas
urie
s, go
vern
men
t-rel
ated
issu
es a
nd c
orpo
rate
s. It
is a
subs
et o
f the
U.S
. Agg
rega
te In
dex.
BB
gBar
cUS
MB
S T
R U
SDTh
e in
dex
mea
sure
s the
per
form
ance
of t
he a
genc
y m
ortg
age-
back
ed p
ass-
thro
ugh
secu
ritie
s (bo
th fi
xed-
rate
and
hyb
rid A
RM
) iss
ued
by G
inni
e M
ae (G
NM
A),
Fann
ie
Mae
(FN
MA
), an
d Fr
eddi
e M
ac (F
HLM
C).
BB
gBar
cUS
Tre
asur
y U
S T
IPS
TR
USD
The
inde
x m
easu
res t
he p
erfo
rman
ce o
f rul
es-b
ased
, mar
ket v
alue
-wei
ghte
d in
flatio
n-pr
otec
ted
secu
ritie
s iss
ued
by th
e U
.S. T
reas
ury.
It is
a su
bset
of t
he G
loba
l In
flatio
n-Li
nked
Inde
x (S
erie
s-L)
.
CR
SP U
S L
arge
Cap
Gro
wth
TR
USD
The
inde
x m
easu
res t
he p
erfo
rman
ce o
f US
secu
ritie
s whi
ch a
re a
ssig
ned
to th
e la
rge
cap
inde
x an
d cl
assi
fied
as g
row
th se
curit
ies b
y us
ing
CR
SP's
mul
tifac
tor m
odel
. C
RSP
cla
ssifi
es g
row
th se
curit
ies u
sing
the
follo
win
g fa
ctor
s: fu
ture
long
-term
gro
wth
in e
arni
ngs p
er sh
are
(EPS
), fu
ture
shor
t-ter
m g
row
th in
EPS
, 3-y
ear h
isto
rical
gr
owth
in E
PS, 3
-yea
r his
toric
al g
row
th in
sale
s per
shar
e, c
urre
nt in
vest
men
t-to-
asse
ts ra
tio, a
nd re
turn
on
asse
ts.
CR
SP U
S L
arge
Cap
Val
ue T
R U
SDTh
e in
dex
mea
sure
s the
per
form
ance
of U
S se
curit
ies w
hich
are
ass
igne
d to
the
larg
e ca
p in
dex
and
clas
sifie
d as
val
ue se
curit
iesb
y us
ing
CR
SP's
mul
tifac
tor m
odel
. C
RSP
cla
ssifi
es v
alue
secu
ritie
s usi
ng th
e fo
llow
ing
fact
ors:
book
to p
rice,
forw
ard
earn
ings
to p
rice,
his
toric
al ea
rnin
gs to
pric
e, d
ivid
end-
to-p
rice r
atio
and
sale
s-to
-pr
ice r
atio
.
CR
SP U
S T
otal
Mar
ket T
R U
SDTh
e in
dex
mea
sure
s the
per
form
ance
of b
road
US
secu
ritie
s tha
t tra
ded
on N
YSE
, NY
SE M
arke
t, N
AN
ASD
AD
AQ
or A
RC
A. I
t cap
ture
s nea
rly 1
00%
of t
he U
S in
vest
able
equi
ty m
arke
t with
aro
und
4000
cons
titue
nts a
cros
s meg
a, la
rge,
smal
l and
mic
ro c
apita
lizat
ions
.
Inde
x D
escr
iptio
ns
Pag
e 10
7 |
163
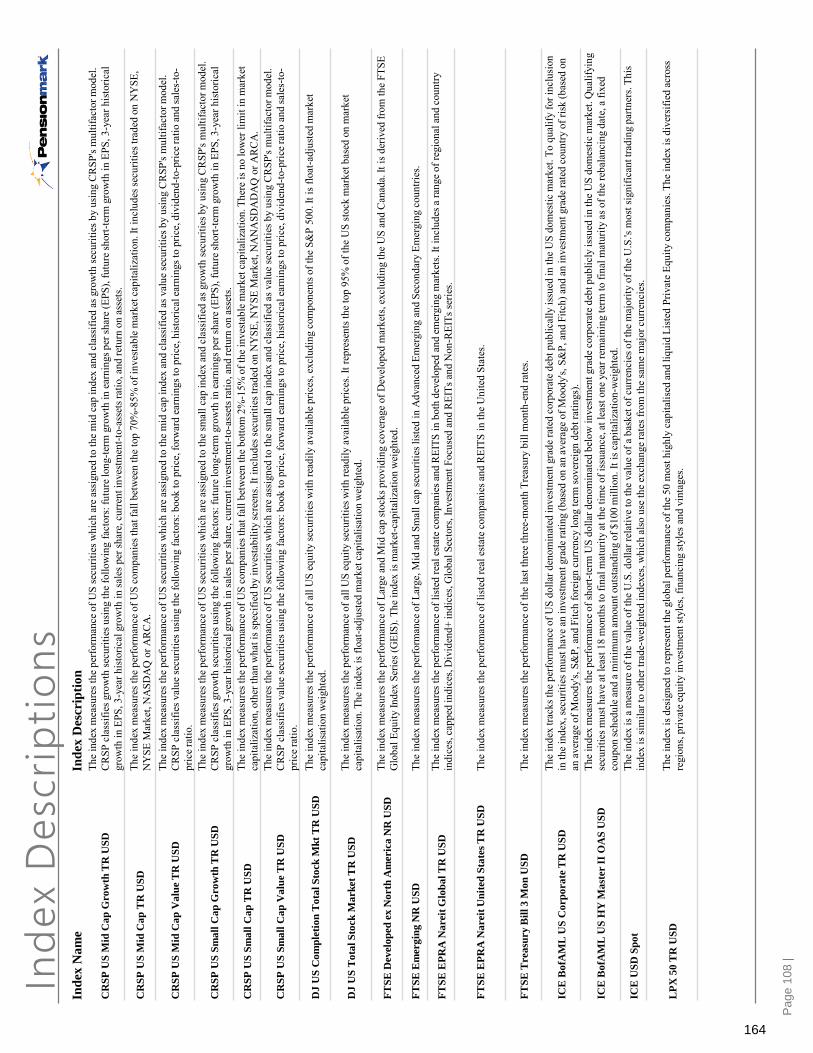
Inde
x N
ame
Inde
x D
escr
iptio
n
CR
SP U
S M
id C
ap G
row
th T
R U
SDTh
e in
dex
mea
sure
s the
per
form
ance
of U
S se
curit
ies w
hich
are
ass
igne
d to
the
mid
cap
inde
x an
d cl
assi
fied
as g
row
th se
curit
ies b
y us
ing
CR
SP's
mul
tifac
tor m
odel
. C
RSP
cla
ssifi
es g
row
th se
curit
ies u
sing
the
follo
win
g fa
ctor
s: fu
ture
long
-term
gro
wth
in e
arni
ngs p
er sh
are
(EPS
), fu
ture
shor
t-ter
m g
row
th in
EPS
, 3-y
ear h
isto
rical
gr
owth
in E
PS, 3
-yea
r his
toric
al g
row
th in
sale
s per
shar
e, c
urre
nt in
vest
men
t-to-
asse
ts ra
tio, a
nd re
turn
on
asse
ts.
CR
SP U
S M
id C
ap T
R U
SDTh
e in
dex
mea
sure
s the
per
form
ance
of U
S co
mpa
nies
that
fall
betw
een
the
top
70%
-85%
of i
nves
tabl
e m
arke
t cap
italiz
atio
n. It
incl
udes
secu
ritie
s tra
ded
on N
YSE
, N
YSE
Mar
ket,
NA
SDA
Q o
r AR
CA
.
CR
SP U
S M
id C
ap V
alue
TR
USD
The
inde
x m
easu
res t
he p
erfo
rman
ce o
f US
secu
ritie
s whi
ch a
re a
ssig
ned
to th
e m
id c
ap in
dex
and
clas
sifie
d as
val
ue se
curit
ies b
y us
ing
CR
SP's
mul
tifac
tor m
odel
. C
RSP
cla
ssifi
es v
alue
secu
ritie
s usi
ng th
e fo
llow
ing
fact
ors:
book
to p
rice,
forw
ard
earn
ings
to p
rice,
his
toric
al ea
rnin
gs to
pric
e, d
ivid
end-
to-p
rice r
atio
and
sale
s-to
-pr
ice r
atio
.
CR
SP U
S Sm
all C
ap G
row
th T
R U
SDTh
e in
dex
mea
sure
s the
per
form
ance
of U
S se
curit
ies w
hich
are
ass
igne
d to
the
smal
l cap
inde
x an
d cl
assi
fied
as g
row
th se
curit
ies b
y us
ing
CR
SP's
mul
tifac
tor m
odel
. C
RSP
cla
ssifi
es g
row
th se
curit
ies u
sing
the
follo
win
g fa
ctor
s: fu
ture
long
-term
gro
wth
in e
arni
ngs p
er sh
are
(EPS
), fu
ture
shor
t-ter
m g
row
th in
EPS
, 3-y
ear h
isto
rical
gr
owth
in E
PS, 3
-yea
r his
toric
al g
row
th in
sale
s per
shar
e, c
urre
nt in
vest
men
t-to-
asse
ts ra
tio, a
nd re
turn
on
asse
ts.
CR
SP U
S Sm
all C
ap T
R U
SDTh
e in
dex
mea
sure
s the
per
form
ance
of U
S co
mpa
nies
that
fall
betw
een
the
botto
m 2
%-1
5% o
f the
inve
stab
le m
arke
t cap
italiz
atio
n. T
here
is n
o lo
wer
lim
it in
mar
ket
capi
taliz
atio
n, o
ther
than
wha
t is s
peci
fied
by in
vest
abili
tysc
reen
s. It
incl
udes
secu
ritie
s tra
ded
on N
YSE
, NY
SE M
arke
t, N
AN
ASD
AD
AQ
or A
RC
A.
CR
SP U
S Sm
all C
ap V
alue
TR
USD
The
inde
x m
easu
res t
he p
erfo
rman
ce o
f US
secu
ritie
s whi
ch a
re a
ssig
ned
to th
e sm
all c
ap in
dex
and
clas
sifie
d as
val
ue se
curit
iesb
y us
ing
CR
SP's
mul
tifac
tor m
odel
. C
RSP
cla
ssifi
es v
alue
secu
ritie
s usi
ng th
e fo
llow
ing
fact
ors:
book
to p
rice,
forw
ard
earn
ings
to p
rice,
his
toric
al ea
rnin
gs to
pric
e, d
ivid
end-
to-p
rice r
atio
and
sale
s-to
-pr
ice r
atio
.
DJ
US
Com
plet
ion
Tot
al S
tock
Mkt
TR
USD
The
inde
x m
easu
res t
he p
erfo
rman
ce o
f all
US
equi
ty se
curit
ies w
ith re
adily
ava
ilabl
e pric
es, e
xclu
ding
com
pone
nts o
f the
S&
P50
0. It
is fl
oat-a
djus
ted
mar
ket
capi
talis
atio
n w
eigh
ted.
DJ
US
Tot
al S
tock
Mar
ket T
R U
SDTh
e in
dex
mea
sure
s the
per
form
ance
of a
ll U
S eq
uity
secu
ritie
s with
read
ily a
vaila
ble p
rices
. It r
epre
sent
s the
top
95%
of t
he U
S st
ock
mar
ket b
ased
on
mar
ket
capi
talis
atio
n. T
he in
dex
is fl
oat-a
djus
ted
mar
ket c
apita
lisat
ion
wei
ghte
d.
FTSE
Dev
elop
ed e
x N
orth
Am
eric
a N
R U
SDTh
e in
dex
mea
sure
s the
per
form
ance
of L
arge
and
Mid
cap
stoc
ks p
rovi
ding
cov
erag
e of
Dev
elop
ed m
arke
ts, e
xclu
ding
the
US
and
Can
ada.
It is
der
ived
from
the
FTSE
G
loba
l Equ
ity In
dex
Serie
s (G
EIS)
. The
inde
x is
mar
ket-c
apita
lizat
ion
wei
ghte
d.
FTSE
Em
ergi
ng N
R U
SDTh
e in
dex
mea
sure
s the
per
form
ance
of L
arge
, Mid
and
Sm
all c
ap se
curit
ies l
iste
d in
Adv
ance
d Em
ergi
ng a
nd S
econ
dary
Em
ergi
ng c
ount
ries.
FTSE
EPR
A N
arei
t Glo
bal T
R U
SDTh
e in
dex
mea
sure
s the
per
form
ance
of l
iste
d re
al e
stat
e co
mpa
nies
and
REI
TS in
bot
h de
velo
ped
and
emer
ging
mar
kets
. It i
nclu
desa
rang
e of r
egio
nal a
nd c
ount
ry
indi
ces,
capp
ed in
dice
s, D
ivid
end+
indi
ces,
Glo
bal S
ecto
rs, I
nves
tmen
t Foc
used
and
REI
Ts a
nd N
on-R
EITs
serie
s.
FTSE
EPR
A N
arei
t Uni
ted
Stat
es T
R U
SDTh
e in
dex
mea
sure
s the
per
form
ance
of l
iste
d re
al e
stat
e co
mpa
nies
and
REI
TS in
the
Uni
ted
Stat
es.
FTSE
Tre
asur
y B
ill 3
Mon
USD
The
inde
x m
easu
res t
he p
erfo
rman
ce o
f the
last
thre
e th
ree-
mon
th T
reas
ury
bill
mon
th-e
nd ra
tes.
ICE
Bof
AM
LU
S C
orpo
rate
TR
USD
The
inde
x tra
cks t
he p
erfo
rman
ce o
f US
dolla
r den
omin
ated
inve
stm
ent g
rade
rate
d co
rpor
ate d
ebt p
ublic
ally
issu
ed in
the
US
dom
estic
mar
ket.
To q
ualif
y fo
r inc
lusi
on
in th
e in
dex,
secu
ritie
s mus
t hav
e an
inve
stm
ent g
rade
ratin
g (b
ased
on
an a
vera
ge o
f Moo
dy's,
S&
P, a
nd F
itch)
and
an in
vest
men
tgra
de ra
ted
coun
try o
f ris
k (b
ased
on
an a
vera
ge o
f Moo
dy's,
S&
P, a
nd F
itch
fore
ign
curre
ncy
long
term
sove
reig
n de
bt ra
tings
).
ICE
Bof
AM
L U
S H
Y M
aste
r II O
AS
USD
The
inde
x m
easu
res t
he p
erfo
rman
ce o
f sho
rt-te
rm U
S do
llar d
enom
inat
ed b
elow
inve
stm
ent g
rade
cor
pora
te d
ebt p
ublic
ly is
sued
in th
e U
S do
mes
tic m
arke
t. Q
ualif
ying
se
curit
ies m
ust h
ave a
t lea
st 1
8 m
onth
s to
final
mat
urity
at t
he ti
me
of is
suan
ce, a
t lea
st o
ne y
ear r
emai
ning
term
to fi
nal m
atur
ity a
s of t
he re
bala
ncin
g da
te, a
fixe
d co
upon
sche
dule
and
a m
inim
um a
mou
nt o
utst
andi
ng o
f $10
0 m
illio
n. It
is c
apita
lizat
ion-
wei
ghte
d.
ICE
USD
Spo
tTh
e in
dex
is a
mea
sure
of t
he v
alue
of t
he U
.S. d
olla
r rel
ativ
e to
the
valu
e of
a b
aske
t of c
urre
ncie
s of t
he m
ajor
ity o
f the
U.S
.'s m
ost s
igni
fican
t tra
ding
par
tner
s. Th
is
inde
x is
sim
ilar t
o ot
her t
rade
-wei
ghte
d in
dexe
s, w
hich
also
use
the
exch
ange
rate
s fro
m th
e sa
me
maj
or c
urre
ncie
s.
LPX
50
TR
USD
The
inde
x is
des
igne
d to
repr
esen
t the
glo
bal p
erfo
rman
ce o
f the
50
mos
t hig
hly
capi
talis
edan
d liq
uid
List
ed P
rivat
e Eq
uity
com
pani
es. T
he in
dex
is d
iver
sifie
d ac
ross
re
gion
s, pr
ivat
e equ
ity in
vest
men
t sty
les,
finan
cing
styl
es a
nd v
inta
ges.
Inde
x D
escr
iptio
ns
Pag
e 10
8 |
164

Inde
x N
ame
Inde
x D
escr
iptio
n
MSC
I AC
WI E
x U
SA N
R U
SDTh
e in
dex
mea
sure
s the
per
form
ance
of t
he la
rge
and
mid
cap
segm
ents
of t
he p
artic
ular
regi
ons,
excl
udin
g U
SA e
quity
secu
ritie
s,in
clud
ing
deve
lope
d an
d em
ergi
ng
mar
ket.
It is
free
floa
t-adj
uste
d m
arke
t-cap
italiz
atio
n w
eigh
ted.
MSC
I EA
FE N
R U
SDTh
e in
dex
mea
sure
s the
per
form
ance
of t
he la
rge
and
mid
cap
segm
ents
of d
evel
oped
mar
kets
, exc
ludi
ng th
e U
S &
Can
ada e
quity
secu
ritie
s. It
is fr
ee fl
oat-a
djus
ted
mar
ket-c
apita
lizat
ion
wei
ghte
d.
MSC
I EA
FE IM
I NR
USD
The
inde
x m
easu
res t
he p
erfo
rman
ce o
f the
larg
e, m
id a
nd sm
all c
ap eq
uity
repr
esen
tatio
n ac
ross
Dev
elop
ed M
arke
ts co
untri
es a
roun
d th
e w
orld
, exc
ludi
ng th
e U
S an
d C
anad
a. T
he in
dex
is fr
ee-a
djus
ted
mar
ket c
apita
lizat
ion
wei
ghte
d.
MSC
I EM
IMI N
R U
SDTh
e in
dex
mea
sure
s the
per
form
ance
of t
he la
rge,
mid
and
smal
l cap
equi
ty re
pres
enta
tion
acro
ss E
mer
ging
Mar
kets
(EM
) cou
ntrie
s.It
is fr
ee-a
djus
ted
mar
ket
capi
taliz
atio
n w
eigh
ted.
MSC
I EM
NR
USD
The
inde
x m
easu
res t
he p
erfo
rman
ce o
f the
larg
e an
d m
id c
ap se
gmen
ts o
f em
ergi
ng m
arke
t equ
ity se
curit
ies.
It is
free
floa
t-adj
uste
d m
arke
t-cap
italiz
atio
n w
eigh
ted.
MSC
I US
RE
IT G
R U
SDTh
e in
dex
mea
sure
s the
per
form
ance
of t
he la
rge,
mid
and
smal
l cap
segm
ents
of t
he U
S eq
uity
secu
ritie
s. It
is c
ompr
ised
of E
quity
REI
Ts se
curit
ies a
nd b
ased
on
the
MSC
I USA
Inve
stab
le M
arke
t Ind
ex, w
ith th
e ex
cept
ion
of M
ortg
age
REI
T an
d se
lect
ed S
peci
aliz
ed R
EITs
. The
inde
x re
pres
ents
app
roxi
mat
ely
mos
t of t
he U
S R
EIT
univ
erse
and
secu
ritie
s are
cla
ssifi
ed in
the
REI
T se
ctor
acc
ordi
ng to
the
Glo
bal I
ndus
try C
lass
ifica
tion
Stan
dard
. It i
s a fr
eeflo
at m
arke
t cap
italiz
atio
n w
eigh
ted
inde
x.
MSC
I US
Smal
l Cap
Gro
wth
GR
USD
The
inde
x m
easu
res t
he p
erfo
rman
ce o
f the
gro
wth
smal
l cap
segm
ents
of U
S eq
uity
secu
ritie
s. It
is fr
ee fl
oat-a
djus
ted
mar
ket-c
apita
lizat
ion
wei
ghte
d.
MSC
I Wor
ld e
x U
SA N
R U
SDTh
e in
dex
mea
sure
s the
per
form
ance
of t
he la
rge
and
mid
cap
segm
ents
of w
orld
, exc
ludi
ng U
S eq
uity
secu
ritie
s. It
is fr
ee fl
oat-a
djus
ted
mar
ket-c
apita
lizat
ion
wei
ghte
d.
MSC
I Wor
ld N
R U
SDTh
e in
dex
mea
sure
s the
per
form
ance
of t
he la
rge
and
mid
cap
segm
ents
of w
orld
equ
ity se
curit
ies.
It is
free
floa
t-adj
uste
d m
arke
t-cap
italiz
atio
n w
eigh
ted.
Rus
sell
1000
Gro
wth
TR
USD
The
inde
x m
easu
res t
he p
erfo
rman
ce o
f the
larg
e-ca
p gr
owth
segm
ent o
f the
US
equi
ty se
curit
ies.
It in
clud
es th
e R
usse
ll 10
00 in
dex
com
pani
es w
ith h
ighe
r pric
e-to
-boo
k ra
tios a
nd h
ighe
r for
ecas
ted
grow
th v
alue
s. It
is m
arke
t-cap
italiz
atio
n w
eigh
ted.
Rus
sell
Inve
stm
ent G
roup
is th
e so
urce
and
ow
ner o
f the
trad
emar
ks, s
ervi
ce m
arks
and
co
pyrig
hts r
elat
ed to
the R
usse
ll In
dexe
s. R
usse
ll® is
a tr
adem
ark
of R
usse
ll In
vest
men
t Gro
up.
Rus
sell
1000
TR
USD
The
inde
x m
easu
res t
he p
erfo
rman
ce o
f the
larg
e-ca
p se
gmen
t of t
he U
S eq
uity
secu
ritie
s. It
is a
subs
et o
f the
Rus
sell
3000
inde
x an
d in
clud
es ap
prox
imat
ely
1000
of t
he
larg
est s
ecur
ities
bas
ed o
n a
com
bina
tion
of th
eir m
arke
t cap
and
curre
nt in
dex
mem
bers
hip.
Rus
sell
1000
Val
ue T
R U
SDTh
e in
dex
mea
sure
s the
per
form
ance
of t
he la
rge-
cap
valu
e se
gmen
t of t
he U
S eq
uity
secu
ritie
s. It
incl
udes
the R
usse
ll 10
00 in
dex
com
pani
es w
ith lo
wer
pric
e-to
-boo
k ra
tios a
nd lo
wer
exp
ecte
d gr
owth
val
ues.
It is
mar
ket-c
apita
lizat
ion
wei
ghte
d.R
usse
ll In
vest
men
t Gro
up is
the
sour
ce a
nd o
wne
r of t
he tr
adem
arks
, ser
vice
mar
ks a
nd
copy
right
s rel
ated
to th
e Rus
sell
Inde
xes.
Rus
sell®
is a
trad
emar
k of
Rus
sell
Inve
stm
ent G
roup
.
Rus
sell
2000
TR
USD
The
inde
x m
easu
res t
he p
erfo
rman
ce o
f the
smal
l-cap
segm
ent o
f the
US
equi
ty u
nive
rse.
It is
a su
bset
of t
he R
usse
ll 30
00 an
d in
clud
es ap
prox
imat
ely
2000
of t
he
smal
lest
secu
ritie
s bas
ed o
n a
com
bina
tion
of th
eir m
arke
t cap
and
curre
nt in
dex
mem
bers
hip.
Rus
sell
Inve
stm
ent G
roup
is th
e sou
rce
and
owne
r of t
he tr
adem
arks
, se
rvic
e m
arks
and
cop
yrig
hts r
elat
ed to
the
Rus
sell
Inde
xes.
Rus
sell®
is a
trad
emar
k of
Rus
sell
Inve
stm
ent G
roup
.
Rus
sell
2000
Val
ue T
R U
SDTh
e in
dex
mea
sure
s the
per
form
ance
of s
mal
l-cap
val
ue se
gmen
t of t
he U
S eq
uity
uni
vers
e. It
incl
udes
thos
e R
usse
ll 20
00 co
mpa
nies
with
low
er p
rice-
to-b
ook
ratio
s and
lo
wer
fore
cast
ed g
row
th v
alue
s. It
is m
arke
t-cap
italiz
atio
n w
eigh
ted.
Rus
sell
Inve
stm
ent G
roup
is th
e so
urce
and
ow
ner o
f the
trad
emar
ks, s
ervi
ce m
arks
and
cop
yrig
hts
rela
ted
to th
e R
usse
ll In
dexe
s. R
usse
ll® is
a tr
adem
ark
of R
usse
ll In
vest
men
t Gro
up.
Rus
sell
3000
TR
USD
The
inde
x m
easu
res t
he p
erfo
rman
ce o
f the
larg
est 3
000
US
com
pani
es re
pres
entin
g ap
prox
imat
ely
98%
of t
he in
vest
able
US
equi
ty m
arke
t. It
is m
arke
t-cap
italiz
atio
n w
eigh
ted.
Rus
sell
Mid
Cap
Gro
wth
TR
USD
The
inde
x m
easu
res t
he p
erfo
rman
ce o
f the
mid
-cap
gro
wth
segm
ent o
f the
US
equi
ty u
nive
rse.
It in
clud
es R
usse
ll m
idca
p in
dex
com
pani
es w
ith h
ighe
r pric
e-to
-boo
k ra
tios a
nd h
ighe
r for
ecas
ted
grow
th v
alue
s. It
is m
arke
t-cap
italiz
atio
n w
eigh
ted.
Rus
sell
Inve
stm
ent G
roup
is th
e so
urce
and
ow
ner o
f the
trad
emar
ks, s
ervi
ce m
arks
and
co
pyrig
hts r
elat
ed to
the R
usse
ll In
dexe
s. R
usse
ll® is
a tr
adem
ark
of R
usse
ll In
vest
men
t Gro
up.
Rus
sell
Mid
Cap
TR
USD
The
inde
x m
easu
res t
he p
erfo
rman
ce o
f the
mid
-cap
segm
ent o
f the
US
equi
ty u
nive
rse.
It is
a su
bset
of R
usse
ll 10
00 in
dex
and
incl
udes
appr
oxim
atel
y 80
0 of
the
smal
lest
secu
ritie
s bas
ed o
n a
com
bina
tion
of th
eir m
arke
t cap
and
curre
nt in
dex
mem
bers
hip.
The
inde
x re
pres
ents
app
roxi
mat
ely
31%
of t
he to
tal m
arke
t cap
italiz
atio
n of
the
Rus
sell
1000
com
pani
es.
Rus
sell
Mid
Cap
Val
ue T
R U
SDTh
e in
dex
mea
sure
s the
per
form
ance
of t
he m
id-c
ap v
alue
segm
ent o
f the
US
equi
ty u
nive
rse.
It in
clud
es R
usse
ll m
idca
p in
dex
com
pani
es w
ith lo
wer
pric
e-to
-boo
k ra
tios a
nd lo
wer
fore
cast
ed g
row
th v
alue
s. It
is m
arke
t-cap
italiz
atio
n w
eigh
ted.
Inde
x D
escr
iptio
ns
Pag
e 10
9 |
165

Inde
x N
ame
Inde
x D
escr
iptio
n
S&P
Mid
Cap
400
TR
The
inde
x m
easu
res t
he p
erfo
rman
ce o
f mid
-siz
ed U
S co
mpa
nies
, ref
lect
ing
the d
istin
ctiv
e ris
k an
d re
turn
cha
ract
eris
tics o
f thi
smar
ket s
egm
ent.
It co
mpr
ises
stoc
ks in
th
e m
iddl
e ca
pita
lizat
ion
rang
e, c
over
ing
appr
oxim
atel
y 7%
of t
he o
f US
equi
ty m
arke
t.
S&P
500
TR
USD
The
inde
x m
easu
res t
he p
erfo
rman
ce o
f 500
wid
ely
held
stoc
ks in
US
equi
ty m
arke
t. St
anda
rd an
d Po
or's
choo
ses m
embe
r com
pani
es fo
r the
inde
x ba
sed
on m
arke
t siz
e,
liqui
dity
and
indu
stry
gro
up re
pres
enta
tion.
Incl
uded
are
the
stoc
ks o
f ind
ustri
al, f
inan
cial
, util
ity, a
nd tr
ansp
orta
tion
com
pani
es. S
ince
mid
198
9, th
is c
ompo
sitio
n ha
s be
en m
ore
flexi
ble
and
the
num
ber o
f iss
ues i
n ea
ch se
ctor
has
var
ied.
It is
mar
ket c
apita
lizat
ion-
wei
ghte
d.
S&P
GSC
I Gol
d Sp
otTh
e In
dex,
a su
b-in
dex
of th
e S&
P G
SCI,
prov
ides
inve
stor
s with
a re
liabl
e an
d pu
blic
ly a
vaila
ble b
ench
mar
k tra
ckin
g th
e C
OM
EX g
old
futu
re. T
he in
dex
is d
esig
ned
to
be tr
adab
le, r
eadi
ly a
cces
sibl
e to
mar
ket p
artic
ipan
ts, a
nd c
ost e
ffici
ent t
o im
plem
ent.
S&P
Smal
lCap
600
TR
USD
The
inde
x m
easu
res t
he p
erfo
rman
ce o
f sm
all c
ap se
gmen
t of U
S eq
uity
mar
ket.
It co
nsis
ts o
f 600
dom
estic
stoc
ks c
hose
n fo
r mar
ket s
ize,
liqu
idity
, and
indu
stry
gro
up
repr
esen
tatio
n an
d co
vers
app
roxi
mat
ely
3% o
f the
dom
estic
equi
ties m
arke
t.
S&P
Tar
get D
ate
2010
TR
USD
The
inde
x m
easu
res t
he p
erfo
rman
ce o
f a p
ortfo
lio o
f mul
ti-as
set i
nclu
ding
equi
ties,
fixed
inco
me
and
com
mod
ities
. The
inde
x ha
star
get r
etire
men
t dat
e of 2
010,
and
belo
ngs t
o S&
P Ta
rget
Dat
e In
dex
Serie
s whi
ch c
ompr
ises
elev
en in
dexe
s with
diff
eren
t tar
get r
etire
men
t dat
e. E
ach
inde
x in
this
serie
s is d
eter
min
ed o
nce
a ye
ar
thro
ugh
surv
ey o
f lar
ge fu
nd m
anag
emen
t com
pani
es th
at o
ffer t
arge
t dat
e pro
duct
s.
S&P
Tar
get D
ate
2015
TR
USD
The
inde
x m
easu
res t
he p
erfo
rman
ce o
f a p
ortfo
lio o
f mul
ti-as
set i
nclu
ding
equi
ties,
fixed
inco
me
and
com
mod
ities
. The
inde
x ha
star
get r
etire
men
t dat
e of 2
015,
and
belo
ngs t
o S&
P Ta
rget
Dat
e In
dex
Serie
s whi
ch c
ompr
ises
elev
en in
dexe
s with
diff
eren
t tar
get r
etire
men
t dat
e. E
ach
inde
x in
this
serie
s is d
eter
min
ed o
nce
a ye
ar
thro
ugh
surv
ey o
f lar
ge fu
nd m
anag
emen
t com
pani
es th
at o
ffer t
arge
t dat
e pro
duct
s.
S&P
Tar
get D
ate
2020
TR
USD
The
inde
x m
easu
res t
he p
erfo
rman
ce o
f a p
ortfo
lio o
f mul
ti-as
set i
nclu
ding
equi
ties,
fixed
inco
me
and
com
mod
ities
. The
inde
x ha
star
get r
etire
men
t dat
e of 2
020,
and
belo
ngs t
o S&
P Ta
rget
Dat
e In
dex
Serie
s whi
ch c
ompr
ises
elev
en in
dexe
s with
diff
eren
t tar
get r
etire
men
t dat
e. E
ach
inde
x in
this
serie
s is d
eter
min
ed o
nce
a ye
ar
thro
ugh
surv
ey o
f lar
ge fu
nd m
anag
emen
t com
pani
es th
at o
ffer t
arge
t dat
e pro
duct
s.
S&P
Tar
get D
ate
2025
TR
USD
The
inde
x m
easu
res t
he p
erfo
rman
ce o
f a p
ortfo
lio o
f mul
ti-as
set i
nclu
ding
equi
ties,
fixed
inco
me
and
com
mod
ities
. The
inde
x ha
star
get r
etire
men
t dat
e of 2
025,
and
belo
ngs t
o S&
P Ta
rget
Dat
e In
dex
Serie
s whi
ch c
ompr
ises
elev
en in
dexe
s with
diff
eren
t tar
get r
etire
men
t dat
e. E
ach
inde
x in
this
serie
s is d
eter
min
ed o
nce
a ye
ar
thro
ugh
surv
ey o
f lar
ge fu
nd m
anag
emen
t com
pani
es th
at o
ffer t
arge
t dat
e pro
duct
s.
S&P
Tar
get D
ate
2030
TR
USD
The
inde
x m
easu
res t
he p
erfo
rman
ce o
f a p
ortfo
lio o
f mul
ti-as
set i
nclu
ding
equi
ties,
fixed
inco
me
and
com
mod
ities
. The
inde
x ha
star
get r
etire
men
t dat
e of 2
030,
and
belo
ngs t
o S&
P Ta
rget
Dat
e In
dex
Serie
s whi
ch c
ompr
ises
elev
en in
dexe
s with
diff
eren
t tar
get r
etire
men
t dat
e. E
ach
inde
x in
this
serie
s is d
eter
min
ed o
nce
a ye
ar
thro
ugh
surv
ey o
f lar
ge fu
nd m
anag
emen
t com
pani
es th
at o
ffer t
arge
t dat
e pro
duct
s.
S&P
Tar
get D
ate
2035
TR
USD
The
inde
x m
easu
res t
he p
erfo
rman
ce o
f a p
ortfo
lio o
f mul
ti-as
set i
nclu
ding
equi
ties,
fixed
inco
me
and
com
mod
ities
. The
inde
x ha
star
get r
etire
men
t dat
e of 2
035,
and
belo
ngs t
o S&
P Ta
rget
Dat
e In
dex
Serie
s whi
ch c
ompr
ises
elev
en in
dexe
s with
diff
eren
t tar
get r
etire
men
t dat
e. E
ach
inde
x in
this
serie
s is d
eter
min
ed o
nce
a ye
ar
thro
ugh
surv
ey o
f lar
ge fu
nd m
anag
emen
t com
pani
es th
at o
ffer t
arge
t dat
e pro
duct
s.
S&P
Tar
get D
ate
2040
TR
USD
The
inde
x m
easu
res t
he p
erfo
rman
ce o
f a p
ortfo
lio o
f mul
ti-as
set i
nclu
ding
equi
ties,
fixed
inco
me
and
com
mod
ities
. The
inde
x ha
star
get r
etire
men
t dat
e of 2
040,
and
belo
ngs t
o S&
P Ta
rget
Dat
e In
dex
Serie
s whi
ch c
ompr
ises
elev
en in
dexe
s with
diff
eren
t tar
get r
etire
men
t dat
e. E
ach
inde
x in
this
serie
s is d
eter
min
ed o
nce
a ye
ar
thro
ugh
surv
ey o
f lar
ge fu
nd m
anag
emen
t com
pani
es th
at o
ffer t
arge
t dat
e pro
duct
s.
S&P
Tar
get D
ate
2045
TR
USD
The
inde
x m
easu
res t
he p
erfo
rman
ce o
f a p
ortfo
lio o
f mul
ti-as
set i
nclu
ding
equi
ties,
fixed
inco
me
and
com
mod
ities
. It h
as ta
rget
retir
emen
t dat
e of 2
045,
and
belo
ngs t
o S&
P Ta
rget
Dat
e In
dex
Serie
s whi
ch c
ompr
ises
ele
ven
inde
xes w
ith d
iffer
ent t
arge
t ret
irem
ent d
ate.
Eac
h in
dex
in th
is se
ries i
s det
erm
ined
onc
e a y
ear t
hrou
gh su
rvey
of
larg
e fu
nd m
anag
emen
t com
pani
es th
at o
ffer t
arge
t dat
e pro
duct
s.
S&P
Tar
get D
ate
2050
TR
USD
The
inde
x m
easu
res t
he p
erfo
rman
ce o
f a p
ortfo
lio o
f mul
ti-as
set i
nclu
ding
equi
ties,
fixed
inco
me
and
com
mod
ities
. The
inde
x ha
star
get r
etire
men
t dat
e of 2
050,
and
belo
ngs t
o S&
P Ta
rget
Dat
e In
dex
Serie
s whi
ch c
ompr
ises
elev
en in
dexe
s with
diff
eren
t tar
get r
etire
men
t dat
e. E
ach
inde
x in
this
serie
s is d
eter
min
ed o
nce
a ye
ar
thro
ugh
surv
ey o
f lar
ge fu
nd m
anag
emen
t com
pani
es th
at o
ffer t
arge
t dat
e pro
duct
s.
S&P
Tar
get D
ate
2055
TR
USD
The
inde
x m
easu
res t
he p
erfo
rman
ce o
f a p
ortfo
lio o
f mul
ti-as
set i
nclu
ding
equi
ties,
fixed
inco
me
and
com
mod
ities
. The
inde
x ha
star
get r
etire
men
t dat
e of 2
055,
and
belo
ngs t
o S&
P Ta
rget
Dat
e In
dex
Serie
s whi
ch c
ompr
ises
elev
en in
dexe
s with
diff
eren
t tar
get r
etire
men
t dat
e. E
ach
inde
x in
this
serie
s is d
eter
min
ed o
nce
a ye
ar
thro
ugh
surv
ey o
f lar
ge fu
nd m
anag
emen
t com
pani
es th
at o
ffer t
arge
t dat
e pro
duct
s.
S&P
Tar
get D
ate
2060
+ T
R U
SDTh
e S&
P Ta
rget
Dat
e Se
ries c
ompr
ises
elev
en m
ulti-
asse
t cla
ss in
dice
s,eac
hco
rresp
ondi
ng to
a p
artic
ular
trag
etre
tirem
ent d
ate.
Eac
h in
dex
prov
ides
var
ying
leve
ls of
ex
posu
re to
equ
ities
and
fixe
d in
com
e. E
ach
targ
et d
ata
allo
catio
n is
cre
ated
and
retir
ed a
ccor
ding
to a
pre
-det
erm
ined
sche
dule
rela
ted
to th
e re
spec
tive t
arge
t dat
e.
S&P
Tar
get D
ate
Ret
irem
ent I
ncom
e T
R U
SDTh
e in
dex
mea
sure
s the
per
form
ance
of a
por
tfolio
of m
ulti-
asse
t inc
ludi
ng eq
uitie
s, fix
ed in
com
e an
d co
mm
oditi
es. T
he in
dex
belo
ngs t
o S&
P Ta
rget
Dat
e In
dex
Serie
s w
hich
com
pris
es e
leve
n in
dexe
s with
diff
eren
t tar
get r
etire
men
t dat
e. E
ach
inde
x in
this
serie
s is d
eter
min
ed o
nce
a ye
ar th
roug
h su
rvey
of l
arge
fund
man
agem
ent
com
pani
es th
at o
ffer t
arge
t dat
e pro
duct
s.
Ben
chm
ark:
A st
anda
rd ag
ains
t whi
ch th
e pe
rform
ance
of a
mut
ual f
und
can
be m
easu
red.
Inde
x: a
n im
agin
ary
portf
olio
of s
ecur
ities
repr
esen
ting
a pa
rticu
lar m
arke
t or a
por
tion
of it
. Eac
h in
dex
has i
ts o
wn
calc
ulat
ion
met
hodo
logy
and
is u
sual
ly e
xpre
ssed
in te
rms o
f a c
hang
e fro
m a
bas
e val
ue.
Inde
x D
escr
iptio
ns
Pag
e 11
0 |
166

GLO
SSAR
Y
Com
mun
ity A
ctio
n Pa
rtne
rshi
p ER
ISA
403(
b)
For P
erio
d En
ding
09/
30/2
019
167
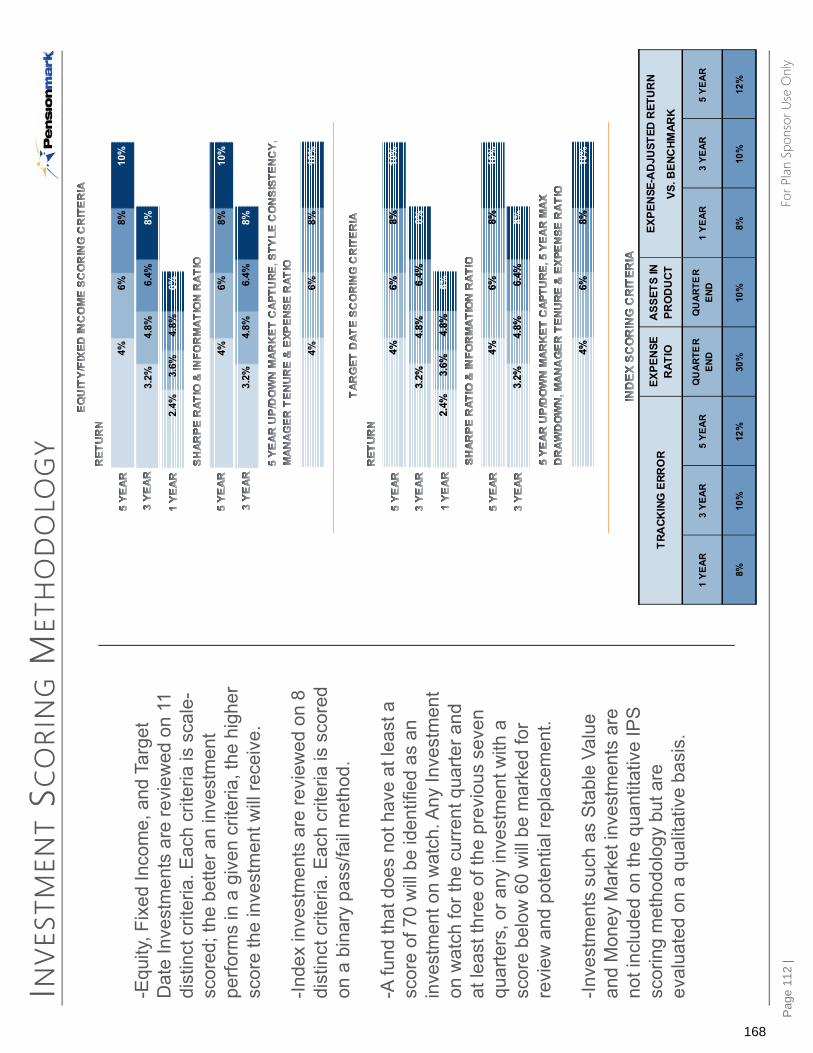
For P
lan S
pons
or U
se O
nly
INVE
STM
ENT
SCO
RIN
GM
ETH
OD
OLO
GY
TRA
CKIN
G E
RRO
R EX
PEN
SE
RAT
IO
ASS
ETS
IN
PRO
DU
CT
1 YE
AR
3 YE
AR
5 YE
AR
QU
ARTE
R EN
D
QU
ARTE
R EN
D
1 YE
AR
3 YE
AR
5 YE
AR
8%
10%
12
%
30%
10
%
8%
10%
12
%
EXPE
NSE
-AD
JUST
ED R
ETU
RN
VS. B
ENC
HMAR
K
4%
6%
8%
10%
4%
6%
8%
10%
4%
6%
8%
10%
3.2%
4.
8%
6.4%
8%
3.2%
4.
8%
6.4%
8%
2.4%
3.
6%
4.8%
6%
4%
6%
8%
10%
4%
6%
8%
10%
4%
6%
8%
10%
3.2%
4.
8%
6.4%
8%
3.2%
4.
8%
6.4%
8%
2.4%
3.
6%
4.8%
6%
4%
6%
8%
10%
4%
6%
8%
10%
4%
6%
8%
10%
3.2%
4.
8%
6.4%
8%
3.2%
4.
8%
6.4%
8%
2.4%
3.
6%
4.8%
6%
-Equ
ity, F
ixed
Inco
me,
and
Tar
get
Dat
e In
vest
men
ts a
re re
view
ed o
n 11
di
stin
ct c
riter
ia. E
ach
crite
ria is
sca
le-
scor
ed; t
he b
ette
r an
inve
stm
ent
perfo
rms
in a
giv
en c
riter
ia, t
he h
ighe
r sc
ore
the
inve
stm
ent w
ill re
ceiv
e.
-Inde
x in
vest
men
ts a
re re
view
ed o
n 8
dist
inct
crit
eria
. Eac
h cr
iteria
is s
core
d on
a b
inar
y pa
ss/fa
il m
etho
d.
-A fu
nd th
at d
oes
not h
ave
at le
ast a
sc
ore
of 7
0 w
ill be
iden
tifie
d as
an
inve
stm
ent o
n w
atch
. Any
Inve
stm
ent
on w
atch
for t
he c
urre
nt q
uarte
r and
at
leas
t thr
ee o
f the
pre
viou
s se
ven
quar
ters
, or a
ny in
vest
men
t with
a
scor
e be
low
60
will
be m
arke
d fo
r re
view
and
pot
entia
l rep
lace
men
t.
-Inve
stm
ents
suc
h as
Sta
ble
Valu
e an
d M
oney
Mar
ket i
nves
tmen
ts a
re
not i
nclu
ded
on th
e qu
antit
ativ
e IP
S sc
orin
g m
etho
dolo
gy b
ut a
re
eval
uate
d on
a q
ualit
ativ
e ba
sis.
Pag
e 11
2 |
168

For P
lan S
pons
or U
se O
nly
ACTI
VESC
ORI
NG
-G
LOSS
ARY
1, 3, &
5 Yea
r Re
turn
Whe
n selecting an
investmen
t, you wan
t to kn
ow th
at it has dem
onstrated an
ability to outpe
rform
relativ
e to its pe
ers. The
highe
r the
return an investmen
t experiences in
a given
period compa
red to
peers, th
e high
er th
e value assig
ned to its score.
3 & 5 Yea
r Sh
arpe
Ratio
Whe
n selecting an
investmen
t, the Sh
arpe
ratio
is a way to
com
pare th
e return of p
ortfo
lios on
a risk‐
adjusted
basis rather th
an a less in
form
ative, pure return basis. The
highe
r the
Sha
rpe Ra
tio an
investmen
t experiences in
a given
period compa
red to pee
rs, the
highe
r the
value
assigne
d to its score.
3 & 5 Yea
r Inform
ation
Ratio
Whe
n selecting an
investmen
t, you wan
t to kn
ow how
its returns compa
re to
the inde
x an
d to th
e am
ount of risk
it to
ok to
gen
erate those returns. The
highe
r the
Inform
ation Ra
tio an investmen
t expe
riences in
a given
period compa
red to pee
rs, the
highe
r the
value
assigne
d to its score.
5 Year Upside/
Dow
nside
Capture
Whe
n selecting an
investmen
t, you wan
t to kn
ow th
at it "captures" more than
100
% of m
arket returns
in up markets and
helps "cushion" th
e loss in
dow
n markets by capturing less th
an 100
% of the
fall. A
ratio
of g
reater th
an 1 im
plies that th
e investmen
t cap
tures more whe
n the market is u
p than
whe
n it
is do
wn. The
highe
r the
ratio
the high
er th
e value assig
ned to it’s score.
Style
Consistency
(Equ
ity & Fixed
Income Only)
Whe
n selecting an
investmen
t, you wan
t to kn
ow how
con
sistency that fu
nd’s style (Value
vs.
Growth/Large vs. M
id vs. Small) is compa
red to it’s catego
ry. Investm
ents with
low sc
ores are
considered
more consisten
t, while investmen
ts with
high scores are con
sidered
less con
sistent. T
he
lower th
e Style Co
nsisten
cy score com
pared to pee
rs, the
highe
r the
value
assigne
d to its score.
Man
ager Ten
ure
Whe
n selecting an
investmen
t, you wan
t to kn
ow th
at th
e track record being
review
ed is prim
arily one
from
the curren
t man
agem
ent tea
m. The
long
er a m
anager has m
anaged
the specific investmen
t being
evalua
ted the high
er th
e value assig
ned to its score.
Expe
nse Ra
tioWhe
n selecting an
investmen
t, you wan
t to kn
ow how
much it costs a
s total fe
es re
duce th
e total return
captured
by the investor. T
he lo
wer th
e Expe
nse Ra
tio has com
pared to pee
rs, the
highe
r the
value
assig
ned to its score.
5 Year M
ax
Drawdo
wn
(Target D
ate
Only)
Whe
n selecting an
investmen
t, Max Drawdo
wn is the maxim
um lo
ss, from peak to trou
gh, tha
t a
portfolio
experiences in
a given
period an
d is a measuremen
t of d
ownside risk over th
at period. The
lower th
e max drawdo
wn a po
rtfolio
experiences, com
pared to pee
rs, the
highe
r the
value
assigne
d to
its score.
Pag
e 11
3 |
169

For P
lan S
pons
or U
se O
nly
PASS
IVE
SCO
RIN
G-
GLO
SSAR
Y1,
3, &
5 Y
ear
Retu
rn –
Expe
nse
Adju
sted
Whe
n se
lect
ing
an in
dex
inve
stm
ent,
you
wan
t to
know
that
it h
as d
emon
stra
ted
an a
bilit
y to
pe
rform
in-li
ne w
ith th
e in
dex
it is
mea
nt to
trac
k. T
o pa
ss, a
n in
vest
men
t mus
t not
und
erpe
rform
it’
s sta
ted
inde
x by
mor
e th
an 2
0 ba
sis p
oint
(-0.
20%
).
Expe
nse
Ratio
Whe
n se
lect
ing
an in
vest
men
t, yo
u w
ant t
o kn
ow h
ow m
uch
it co
sts a
s tot
al fe
es re
duce
the
tota
l re
turn
cap
ture
d by
the
inve
stor
. If t
he In
dex
fund
is ra
nked
in th
e to
p qu
artil
e (lo
wes
t 25%
of
expe
nse
ratio
s) of
it’s
peer
gro
up, i
t pas
ses t
his c
riter
ia.
1, 3,
& 5
Yea
r Tr
ackin
g Er
ror
Whe
n se
lect
ing
a pa
ssive
inve
stm
ent,
the
track
ing
erro
r sho
ws t
he in
vest
men
t's c
onsis
tenc
y co
mpa
red
to it
s ben
chm
ark
over
a g
iven
perio
d of
tim
e. T
he lo
wer t
he tr
ackin
g er
ror,
the
mor
e co
nsist
ent t
he p
assiv
e in
vest
men
t is p
erfo
rmin
g lik
e its
stat
ed in
dex.
To p
ass,
the
track
ing
erro
r m
ust b
e in
the
lowe
st 10
% o
f its
pee
r gro
up.
Asse
ts
Man
aged
in
Prod
uct
Whe
n se
lect
ing
a pa
ssive
inve
stm
ent,
the
asse
ts m
anag
ed in
that
pro
duct
hav
e an
effe
ct o
n tra
ding
cos
ts. S
ince
pas
sive
inve
stm
ents
tend
to h
ave
a fa
r gre
ater
num
ber o
f hol
ding
s and
tra
ding
cos
ts c
an h
urt r
etur
ns a
n in
vest
men
t with
mor
e as
sets
are
bet
ter a
ble
to e
fficie
ntly
trade
se
curit
ies
with
out s
igni
fican
tly h
urtin
g pe
rform
ance
. To
pass
, a fu
nd m
ust h
ave
at le
ast 5
00 m
illion
do
llars
man
aged
with
in th
at p
rodu
ct.
Pag
e 11
4 |
170

GLO
SSAR
Y O
F IN
VEST
MEN
T TE
RMS
For P
lan
Spon
sor U
se O
nly
Com
mun
ity A
ctio
n Pa
rtne
rshi
p ER
ISA
403(
b) In
vest
men
t Rev
iew
| Pe
riod
Endi
ng 0
9/30
/201
9
ALPH
A
Mea
sure
s ris
k-ad
just
ed p
erfo
rman
ce, f
acto
ring
in th
e ris
k du
e to
the
spec
ific
man
ager
rath
er th
an th
e ov
eral
l mar
ket.
A hi
gh v
alue
for a
lpha
impl
ies
that
the
man
ager
has
per f
orm
ed b
ett e
r tha
n w
ould
hav
e be
en e
xpec
ted,
giv
en it
s be
ta (v
olat
ility
). In
con
tras
t, a
nega
tive
alph
a in
dica
tes
the
man
ager
has
und
er p
erfo
rmed
, giv
en th
eex
pect
atio
ns e
stab
lishe
d by
bet
a.
WH
Y IT
'S IM
PORT
ANT
Alph
a ca
n be
use
d to
dire
ctly
mea
sure
the
valu
e ad
ded
or s
ubtr
acte
d by
a m
anag
er. A
lpha
dep
ends
on
two
fact
ors:
(1) t
he a
ssum
ptio
n th
at m
arke
t ris
k, a
s m
easu
red
by b
eta,
is th
e on
ly ri
sk m
easu
r e n
eces
sary
, and
(2) t
he s
tren
gth
of th
e lin
ear r
elat
ions
hip
betw
een
the
man
ager
and
the
inde
x, a
s it
has
been
mea
sure
d by
R-
Squa
red.
In a
dditi
on, a
neg
ativ
e al
pha
can
som
etim
es re
sult
from
the
addi
tiona
l exp
ense
s th
at a
re p
rese
nt in
a m
anag
er's
retu
rns
as c
ompa
red
to th
e be
nchm
ark
inde
x.
BETA
Show
s th
e vo
latil
ity o
f a m
anag
er a
s co
mpa
red
to th
e vo
latil
ity o
f the
ben
chm
ark;
spe
cific
ally
, the
per
form
ance
the
fund
, or p
ortf
olio
has
exp
erie
nced
in a
giv
enpe
riod
o f ti
me
as th
e in
dex
mov
ed 1
% u
p or
dow
n. A
bet
a ab
ove
1 is
mor
e vo
latil
e th
an th
e in
dex,
whi
le a
bet
a be
low
1 is
less
vol
atile
.
WH
Y IT
'S IM
PORT
ANT
Beta
can
be
used
to s
how
how
sen
sitiv
e a
man
ager
is to
mov
emen
ts in
the
mar
kets
. It i
s im
port
ant t
o no
te th
at a
low
bet
a fo
r a m
anag
er d
oes
not n
eces
saril
y im
ply
that
the
man
ager
has
a lo
w le
vel o
f vol
atili
ty. A
low
bet
a si
gnifi
es o
nly
that
the
man
ager
's m
arke
t-re
late
d ris
k is
low
. (St
anda
rd d
evia
tion
is a
mea
sure
of a
fund
'sab
solu
te v
olat
ility
.) R-
Squa
red
is a
nec
essa
ry s
tatis
tic to
fact
or in
to th
e eq
uatio
n be
caus
e it
refle
cts
the
perc
enta
ge o
f a m
anag
er's
mov
emen
ts th
at a
re e
xpla
ined
by
mov
emen
ts in
its
benc
hmar
k in
dex,
and
thus
whe
ther
it is
an
appr
opria
te b
ench
mar
k.
STAN
DAR
D D
EVIA
TIO
N
The
stat
istic
al m
easu
rem
ent o
f dis
pers
ion
of re
turn
s sp
read
aro
und
thei
r his
toric
al a
vera
ge, o
r in
othe
r wor
ds, h
ow w
idel
y a
fund
's or
por
tfol
io's
retu
rns
varie
d ov
er a
cer t
ain
perio
d or
tim
e.
WH
Y IT
'S IM
PORT
ANT
Inve
stor
s us
e th
e st
anda
rd d
evia
tion
of h
isto
rical
per
form
ance
to tr
y to
pre
dict
the
rang
e of
retu
rns
that
are
mos
t lik
ely
for a
giv
en in
vest
men
t. W
hen
a fu
nd o
rpo
rtfo
lio h
as a
hig
h st
anda
rd d
evia
tion,
the
pred
icte
d ra
nge
of p
erfo
rman
ce is
wid
e, im
plyi
ng g
reat
er v
olat
ility
.
SHAR
PE R
ATIO
A ris
k-ad
just
ed m
easu
re d
evel
oped
by
Will
iam
F. S
harp
e, c
alcu
late
d us
ing
stan
dard
dev
iatio
n an
d ex
cess
retu
rn to
det
erm
ine
rew
ard
per u
nit o
f ris
k -t
he h
ighe
r the
Shar
pe ra
tio, t
he b
ett e
r the
man
ager
's hi
stor
ical
risk
-adj
uste
d pe
rfor
man
ce.
WH
Y IT
'S IM
PORT
ANT
Shar
pe ra
tio is
a m
easu
re o
f inv
estm
ent e
ffici
ency
exp
ress
ed a
s th
e am
ount
of r
etur
n ea
rned
per
uni
t of a
ssoc
iate
d ris
k. It
can
be
used
to c
ompa
re tw
o m
anag
ers
dire
ctly
on
how
muc
h ex
cess
r etu
rn e
ach
man
ager
ach
ieve
d fo
r a c
erta
in le
vel o
f ris
k.
Pag
e 11
5 |
171

GLO
SSAR
Y O
F IN
VEST
MEN
T TE
RMS
For P
lan
Spon
sor U
se O
nly
Com
mun
ity A
ctio
n Pa
rtne
rshi
p ER
ISA
403(
b) In
vest
men
t Rev
iew
| Pe
riod
Endi
ng 0
9/30
/201
9
INFO
RMAT
ION
RAT
IO
Is d
eter
min
ed b
y ta
king
the
annu
aliz
ed e
xces
s re
turn
ove
r a b
ench
mar
k an
d di
vidi
ng it
by
the
stan
dard
dev
iatio
n of
exc
ess
retu
rn (t
rack
ing
erro
r). T
his
mea
sure
r ela
tes
the
mag
nitu
de a
nd c
onsi
sten
cy w
ith w
hich
an
inve
stm
ent o
utpe
rfor
med
its
benc
hmar
k. T
he h
ighe
r the
info
rmat
ion
ratio
, the
bet
ter.
WH
Y IT
'S IM
PORT
ANT
The
info
rmat
ion
ratio
is a
risk
-adj
uste
d m
easu
re, w
hich
cap
ture
s ex
cess
or a
ctiv
e re
turn
s an
d re
late
s th
em to
exc
ess
or a
ctiv
e ris
k. T
he in
form
atio
n ra
tio is
use
d as
aw
ay t o
com
par e
mor
e-an
d le
ss-a
ggre
ssiv
e m
anag
ers
at th
e sa
me
time.
A c
onve
nien
t way
to th
ink
of th
e in
form
atio
n ra
tio is
a m
easu
re o
f how
wel
l one
was
rew
arde
d fo
r eac
h in
crem
enta
l "un
it" o
f ris
k. T
he in
form
atio
n ra
tio c
an b
e a
very
val
uabl
e to
ol in
eva
luat
ing
a m
anag
er's
abili
ty to
add
incr
emen
tal v
alue
rela
tive
toin
crem
enta
l ris
k. T
his
tool
is o
nly
valu
able
, how
ever
, whe
n th
e be
nchm
ark
is c
aref
ully
cho
sen
and
appr
opria
te.
Pag
e 11
6 |
172

FOR
PLAN
SPO
NSO
R U
SE O
NLY
- N
ot fo
r Use
with
Par
ticip
ants
or t
he G
ener
al P
ublic
.Pe
nsio
nmar
k Fi
nanc
ial G
roup
, LLC
("Pe
nsio
nmar
k") i
s an
inve
stm
ent a
dvis
er re
gist
ered
und
er th
e In
vest
men
t Adv
iser
s Ac
t of 1
940.
Pen
sion
mar
k is
affl
iate
dth
roug
h co
mm
on o
wne
rshi
p w
ith P
ensi
onm
ark
Secu
ritie
s, LL
C (m
embe
r SIP
C).
173

CAPK 403(b) and 401(a) Retirement Plans Repricing
The number of participants and eligible employees between the two plans was far greater than the pricing that our underwriting team created for the CAPK 401(a) and 403(b) Plans.
Provided during the RFP Actual numbers as of 10/18 Difference 401(a) Plan 401(a) Plan 677 Eligible employees 1036 Eligible Employees 359 53% Increase 677 Participants 1011 Participants 334 49% Increase 403(b) Plan 403(b) Plan 800 Eligible employees 1012 Eligible Employees 212 27% Increase 85 Participants 581 Participants 496 584% Increase 1477 Total Eligible Employees 2048 Eligible Employees 571 39% Increase 762 Total Participants 1592 Participants 830 109% Increase
Current Pricing Option 1 Option 2 Option 3 $0.00 Base $0.00 Base $0.00 Base $0.00 Base $0.00 Per Participant $0.00 Per Participant $0.00 Per Participant $0.00 Per Participant
$0.00 Per Eligible $12.00 Per Eligible $0.00 Per Eligible $0.00 Per Eligible X 2048 Eligible = $24,576 0.32% Asset Charge 0.32% Asset Charge 0.42% Asset Charge 0.32% Asset Charge (Remove Mailing of Notices)
Option 1 Billed to the organization at $3/eligible employee/quarter (approximately $24,576 per year) The first billed fee of approximately $6,134 would be billed at the end of the first quarter. This can be paid by the organization or pulled from the plan assets. If the committee and board preferred to cover the fee for the first quarter of 2020 for $6,134, then we will not need to notify the participants until the end of February, for a fee increase that will take place effective 4/1. This will allow the organization to cover the first quarter expenses, and then decide if the fee is to be paid for by the plan assets or as a billed fee, for the second quarter and moving forward. If the fee is pulled from the plan assets, we will need to update the fee disclosures and distribute to all eligible employees, as well as terminated participants with account balances.
Option 2 Increase the asset charge by 0.10%. I checked with our team, and we can make this fee change effective 2/1/2020. This will allow more time to run through both the committee and board, and then notify the employees of the fee change. We would need to proceed forward with a decision on this by the 2nd week of December to allow time for the notices to be distributed before year end. Option 3 Turn off the mailing of the notices, which would mean that The Standard would not change any of the fees, just remove the delivery of the required notices. (This would not be my recommendation with such a large population, and the distribution of notices will fall back on your HR team.)
174
CAPK Summary of Service Deliverables Since Transition
• 2018 Administrative Support
o Audit support – estimated 25% to 30% additional time required due to the greater number of participants
o 401(a) Participant distribution support – 2 days of resources required Related to having to verify vesting for each distribution
o 401(a) Plan - 2,575 required notices mailed o 403(b) Plan – 2,928 required notices mailed o Testing and Compliance Support – estimated 25 to 30% additional time required due to the greater
number of participants • Education Support
o December 2017 6 days of education Customized transition video
o 2018 Calendar Year 14 days of education
o 2019 Calendar Year 8 days of education
• 2019 Administrative Support o Participant distribution report - 1.5 days of resources required
Related to having to verify vesting for each distribution
We value you as a client and have partnered with your organization to provide your employees with greatly improved, and far more visible, as well as compliant 401(a) and 403(b) plans. Through our partnership with your organization, we have mailed a total of 5,503 notices to participants, that, prior to coming to The Standard, were handled by your HR team. We have conducted a total of 28 days of education since December 2017. We look forward to continuing our partnership.
175

COMMUNITY ACTION PARTNERSHIP of KERN BOARD OF DIRECTORS
BUDGET & FINANCE COMMITTEE MEETING 5005 Business Park North, Bakersfield, CA
November 13, 2019 12:00 pm
MEETING MINUTES
1. Call to Order
Committee Chair Janea Benton called the meeting to order at 12:01 pm at the Community Action Partnership of Kern administrative building, located at 5005 Business Park North, Bakersfield, CA.
2. Roll Call
Roll Call was taken with a quorum present. Present: Janea Benton, Jimmie Childress, Guadalupe Perez, Ana Vigil (arrived at
12:09 pm) Absent: None Others Present: Jeremy Tobias, Chief Executive Officer; Pritika Ram, Director of Administration; Carmen Segovia; Director of Health & Nutrition; Tracy Webster, Chief Financial Officer; and other CAPK staff.
3. Approval of Agenda
Motion was made and seconded to approve the Budget & Finance Committee Meeting Agenda. Carried by unanimous vote. (Childress/Perez).
4. Public Forum
No one addressed the Committee. 5. New Business
a. Application Status Report & Funding Requests – Pritika Ram, Director of Administration – Action Item.
1. California Department of Social Services for CAPK’s CalFresh Healthy Living Program.
2. California Coastal Commission for Friendship House Community Center & Shafter Youth Center Kids Ocean Day.
3. The Center at Sierra Health Foundation for CAPK Census 2020. 4. Department of Human Services for Medi-CAL Outreach Grant.
176

Community Action Partnership of Kern Budget & Finance Committee Minutes November 13, 2019 Page 2 of 6
Pritika Ram provided the Application Status Report for October and summarized the four funding requests presented in the agenda packet. Motion was made and seconded to approve the Application Status Report and Funding Requests. Carried by unanimous vote (Perez/Childress).
b. Head Start & Early Head Start Budget to Actual Reports – Info Item 1. Kern Head Start Budget to Actual for the Period Ended October 31, 2019. 2. Kern Early Head Start Budget to Actual for the Period Ended October 31, 2019. 3. San Joaquin Early Head Start Budget to Actual for the Period Ended October 31,
2019. 4. Early Head Start Child Care Partnerships & Expansion Budget to Actual for the
Period Ended October 31, 2019.
Donna Holland provided the Head Start Kern Budget to Actual Report for the Period Ended October 31, 2019. Four months (50%) of the eight-month budget period has elapsed and overall Base Fund expenditures are at 45% of budget. Training & Technical Assistance Funds (T&TA) are at 36% of budget and Non-Federal Share is at 49% of budget. Classroom construction and conversion work was delayed and it is anticipated that a request for carryover funds will be submitted for approval. Donna Holland provided the Early Head Start Kern Budget to Actual Report for the Period Ended October 31, 2019. Four months (50%) of the eight-month budget period has elapsed and overall Base Funds are at 30% of budget, T&TA expenditures are at 49% of budget. Donna reported that the CAPK was awarded additional funds for the purpose of converting 4 pre-k classrooms to 6 toddler classrooms and constructing and furnishing additional modular classrooms at 4 CAPK facilities. The start-up activities began immediately following the issue of funds on July 27, 2019 and the overall expenditures are at 5% of budget, and a carryover request will be made. Donna Holland provided the San Joaquin Early Head Start budget to Actual Report for the Period Ended October 31, 2019. Nine months (75%) of the 12-month budget period have elapsed and overall Base Fund expenditures are at 69% of budget. T&TA Funds are at 71% of budget and the Non-Federal Share is at 68% of budget. We anticipate that the Non-Federal Share will be met and fully expend the grant. Donna Holland provided the Early Head Start Child Care Partnerships & Expansion Budget to Actual Report for the period ended October 31, 2019. Effective September 1, 2019, funds formerly awarded under Early Head Start Child Care Partnerships were rolled into Early Head Start Child Care Expansion. The Budget to Actual period is from March 1, 2019 through September 30, 2019. Eight months (67%) of the 12-month budget period have elapsed. Overall Base Fund expenditures are at 5% of budget due to 24 expansion slots at the Jewett facility that has not been completed. Another
177
Community Action Partnership of Kern Budget & Finance Committee Minutes November 13, 2019 Page 3 of 6
provider RFP has gone out. A request to carryover funds will be requested. T&TA funds are incurred as needed and are currently at 9% of budget. The Non-Federal Share is at 8% of budget. We do anticipate requesting a waiver for the Non-Federal Share.
c. Changes to Human Resource and Finance Job Descriptions – Tracy Webster, Chief Financial Officer – Action Item
Tracy Webster proposed the adoption of a new job description of Human Resource Generalist and changes to the existing job descriptions in the Human Resource and Finance Divisions. Tracy stated that the HR Generalist position is budgeted and required to meet the needs of the growth of the agency with an emphasis on staff development to meet the requirements of the Strategic Plan. Additional modifications are proposed to the existing HR Manager position to be renamed as a HR Administrator and the job description has been modified with a greater focus on staff development and retention to align with the agency’s strategic plan. The HR budget has the capacity to accommodate the requested change. It is also proposed that the benefit management responsibilities be moved from HR to Finance as they better align with the requirements and accountability under Payroll/HRIS. Additionally, the Payroll/HRIS Manager’s job description is proposed to change to Payroll/HRIS Administrator as the assumption of new tasks, greater supervision, and responsibilities changes the overall scope of the job. Due to the increase in the number of grants and contracts, the Finance budget has the capacity to accommodate this change. Staff recommends approval of all proposals. Motion was made and seconded to approve to implement the proposed job description for Human Resource Generalist and changes to the job descriptions of Human Resources Administrator and Payroll/HRIS Administrator. Carried by unanimous vote (Vigil/Perez).
d. Federal Financial Report – Tracy Webster, Chief Financial Officer – Info Item
Tracy Webster reported that the semi-annual Federal Financial Report (FFR) for San Joaquin EHS and the annual FFR for EHS Partnership Kern was uploaded to the Grant Solutions system before the October 30, 2019 deadline.
e. Proposed Budget & Finance Committee Agenda Restructure – Tracy Webster, Chief Financial Officer – Action Item
Tracy Webster stated that the recommendation from the Committee at the October meeting was to incorporate a Consent section and a Special Presentation section be brought to the Board as a template for all committee agendas. Staff has drafted the proposed restructure of the Budget & Finance Committee agenda, with the Special Presentation used to review individual programs and their budgets. The Consent section would include other items from the agenda and Committee Members would approve all
178

Community Action Partnership of Kern Budget & Finance Committee Minutes November 13, 2019 Page 4 of 6
items listed in one motion, unless one or more items is requested to be moved off Consent by the Committee or members of the public. Staff recommends approval of the revised agenda format. Janea Benton said that the Committee is also open to hear from other programs not on the agenda if they feel the need to present to the committee before their designated presentation date. Janea also requested the governance calendar be added to the agenda packet. Motion was made and seconded to table this item and bring it before the Executive Committee in December. Carried by unanimous vote (Benton/Perez).
f. Resolution to Approve the Submission of the 2020 Community Service Block Grant (CSBG) Contract Number 20F-3015 from the Department of Community Services and Development – Pritika Ram, Director of Administration – Action Item
Pritika Ram reported that the 2020 CSBG grant, contract number 20F-3015 was received in the amount of $1,489,531. CSBG funds are CAPK’s only funding source that allows the flexibility to support multiple low-income programs as well as administration. The required Resolution authorizes CEO Jeremy T. Tobias to complete any and all application documents for submittal to the State of California Department of Community Services and Development on behalf of CAPK. Staff recommends approval. Motion was made and seconded to approve the submittal of CSBG Grant Number 20F-3015 with Resolution to authorize CEO, Jeremy T. Tobias, to execute all application documents, and to present the itemized budget to the Executive Committee in December. Carried by unanimous vote (Perez/Vigil).
g. Resolution to Approve the Submission of the California Coastal Commission Whales Tale Application for the Marine Studies Program at Friendship House Community Center and Shafter Youth Center – Carmen Segovia, Director of Health & Nutrition – Action Item
Carmen Segovia requested approval to submit the $15,000 grant application with Resolution for the California Coastal Commission Whales Tale program to provide after school marine studies at Friendship House Community Center and Shafter Youth Center. Motion was made and seconded to approve the submission of the California Coastal Commission Whale Tale Application with Resolution for the Youth Centers After School Marine Studies program. Carried by unanimous vote (Vigil/Perez).
6. Chief Financial Officer Reports
a. Discretionary Fund Update – Info Item
179

Community Action Partnership of Kern Budget & Finance Committee Minutes November 13, 2019 Page 5 of 6
Tracy Webster provided a copy of the Discretionary Fund Report and reported that the unrestricted cash balance is $539,829 as of October 31, 2019. There was a net decrease of $2,420 in the month of October, primarily due to payment of property taxes. Jeremy Tobias advised the Committee that the Indirect Fund balance has grown over the past few years and staff proposes moving those funds to the Discretionary Fund. Staff has consulted with OMB specialists, who stated that we are allowed to transfer and combine the funds. Staff plans to transfer prior year indirect savings into the Discretionary Fund at the end of the calendar year. Janea Benton asked if there is a written policy for Board adoption. Jeremy stated that there is no policy in place, the Indirect Funds are unrestricted. Janea requested that this item be added to the Executive Committee agenda in December and should be titled, “Movement of Funds from Indirect Fund Account to the Discretionary Fund Account.”
b. Financial Statements for October 2019 – Action Item
Tracy Webster presented a copy of the Financial Statements for October 2019 and reported that we did not require a cash draw from the line of credit. The Central Kitchen expenditures are at 56.5% at October 31, 2019. USDA revenue is at 59.6%. Expenditures are below the target of 66.7% at month 8 of the 12-month period. CMAP received increase of $1,126,877 over the prior year and a second increase is expected this year, which will open up additional slots to serve more families. The Finance Division is fully staffed with 19 positions. Tracy introduced the newest addition, Kristen Rubio, who is the Administrative Assistant to the CFO. The agency expenditures are at 54% for the year, which is less than the 66.7% budgeted. The Indirect Fund budget to actual report for June month end showed that revenue exceeded expenditures by $320,757, which is 61.5% of the budgeted indirect surplus. Overall expenditures are at 59.3% of budget and less than 66.67% at month 8 of the 12-nonth budget period. Motion was made and seconded to approve the Financial Statements for October 2019. Carried by unanimous vote (Vigil/Childress).
7. Committee Member Comments
Ana Vigil asked why the Shafter Youth Center does not have a Fundraising Event like the Friendship House. It was explained that Friendship House has an Advisory Board and they organize the annual event, not staff. Ana said she would like to see some sort of fundraiser.
180

Community Action Partnership of Kern Budget & Finance Committee Minutes November 13, 2019 Page 6 of 6
It was suggested that a fundraising Committee be formed and Ana was advised to work directly with Carmen Segovia and Angie Nelson. The Committee welcomed Kristen Rubio, Administrative Assistant to the CFO.
8. Next Scheduled Meeting
Budget & Finance Committee Meeting Wednesday, January 22, 2020 (pending BPD approval) 12:00 pm 5005 Business Park North Bakersfield, CA 93309
9. Adjournment
The meeting was adjourned at 12:51 pm.
181

Co
mm
un
ity
De
velo
pm
en
t A
pp
licat
ion
Sta
tus
Re
po
rt O
cto
ber
20
19
Oct
ob
er
1, 2
01
9 –
Oct
ob
er 3
1, 2
01
9
*Do
es
no
t in
clu
de
the
Firs
t 5
Aw
ard
s-A
mo
un
t TB
D
Jan
uar
y 1
, 20
19
– O
cto
ber
31
, 20
19
(Y
TD)
*Do
es n
ot
incl
ud
e th
e Fi
rst
5 A
war
ds-
Am
ou
nt
TBD
Stat
us
Do
llars
C
ou
nt
Pen
din
g $
123,
000
5
Aw
ard
ed
* $8
65
,58
7
6
Den
ied
$
2,5
00
,00
0
1
Tota
l $
3,4
88
,58
7
12
W
in P
erce
nta
ge
80
%
Stat
us
Do
llars
C
ou
nt
Pen
din
g $
2,8
04
,91
3
22
Aw
ard
ed
$2
,40
8,2
27
2
4
Den
ied
$
5,5
64
,96
4
20
Tota
l $
10,7
78
,10
4
66
Win
Per
cen
tage
5
5%
182

Co
mm
un
ity
De
velo
pm
en
t A
pp
licat
ion
Sta
tus
Re
po
rt O
cto
ber
20
19
Ap
plic
atio
n S
tatu
s D
eta
il Fu
nd
er
CA
PK
Pro
gram
D
eci
sio
n
Dat
e
Am
ou
nt
Re
qu
est
ed
A
mo
un
t A
war
de
d
Dat
e
Sub
mit
ted
D
ue
Dat
e St
atu
s
CA
Dep
artm
ent
of
Soci
al S
ervi
ces,
O
ffic
e o
f C
hild
Ab
use
Pre
ven
tio
n
(OC
AP
)
EKFR
C
$
75,0
00
10/
25/2
019
1
1/1/
2019
P
end
ing
Cal
ifo
rnia
Co
asta
l Co
mm
issi
on
FH
CC
/SYC
$
8,0
00
10/
22/2
019
1
0/25
/201
9
Pen
din
g
Kai
ser
Per
man
ente
C
AP
K C
alFr
esh
H
ealt
hy
Livi
ng
$
30,0
00
10/
21/2
019
1
0/25
/201
9
Pen
din
g
Firs
t 5
Ke
rn
EKFR
C
10/
14/2
019
$
8
08,8
63
T
BD
7
/30/
2019
7
/30/
2019
A
war
ded
Firs
t 5
Ke
rn
211
Ker
n
10/
14/2
019
$
8
92,2
42
T
BD
7
/30/
2019
7
/30/
2019
A
war
ded
Firs
t 5
Ke
rn
211
Ker
n
10/
14/2
019
$
7
26,9
70
T
BD
7
/30/
2019
7
/30/
2019
A
war
ded
Nat
ion
al H
ead
Sta
rt A
sso
ciat
ion
H
ead
Sta
rt
$
5
,00
0
1
0/11
/201
9
10/
11/2
019
P
end
ing
Cal
ifo
rnia
Off
ice
of
the
Go
vern
or
Cal
ifo
rnia
Vo
lun
teer
s FH
CC
/SYC
1
0/2/
2019
$
75,0
00
$
7
3,2
91
10/
24/2
019
1
0/2/
2019
A
war
ded
Cal
ifo
rnia
Off
ice
of
the
Go
vern
or
Cal
ifo
rnia
Vo
lun
teer
s FH
CC
/SYC
1
0/2/
2019
$
7
81,0
00
$
670
,08
0
10/
24/2
019
1
0/2/
2019
A
war
ded
Cit
izen
s B
ank
FHC
C/S
YC
$
5
,00
0
1
0/2/
2019
1
0/4/
2019
P
end
ing
US
Inte
rnal
Rev
enu
e Se
rvic
e (I
RS)
V
ITA
1
0/2/
2019
$
1
22,2
16
$
122
,21
6
10/
2/20
19
10/
2/20
19
Aw
ard
ed
US
Dep
artm
ent
of
Hu
man
Se
rvic
es, A
CF
- C
B
EKFR
C
10/
2/20
19
$2
,50
0,0
00
$
-
6
/11/
2019
6
/11/
2019
D
enie
d
183
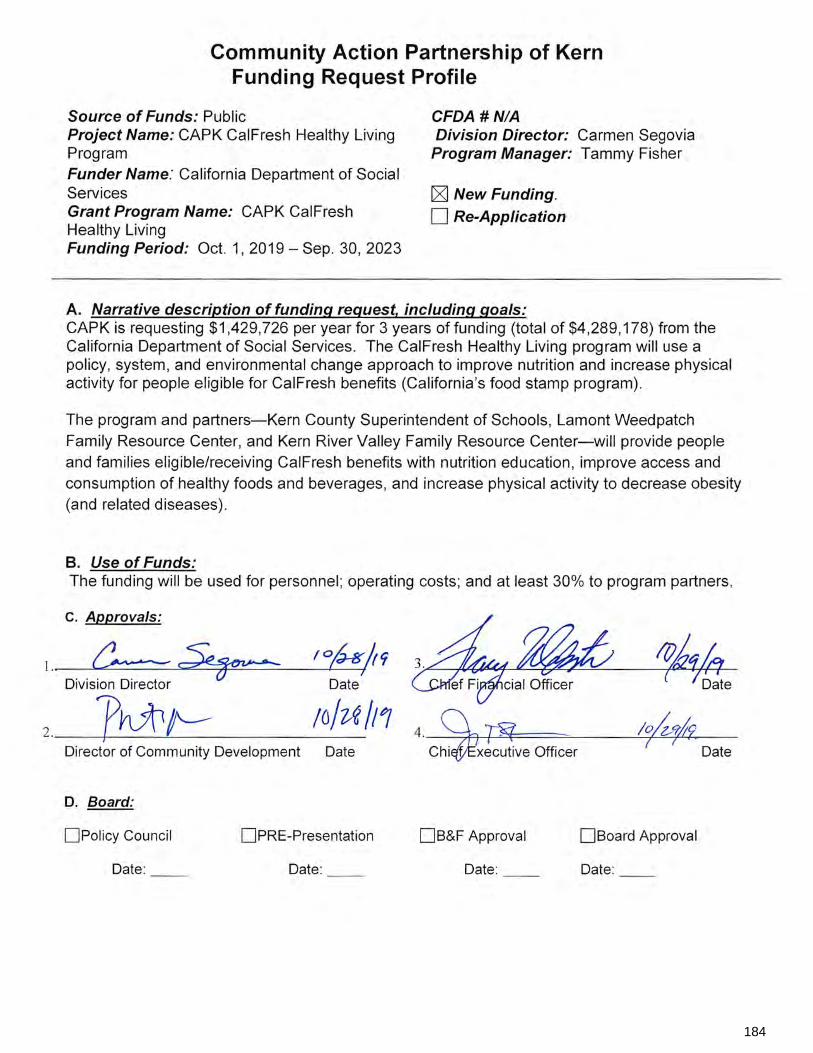
184

185

186

187

COMMUNITY ACTION PARTNERSHIP OF KERN MEMORANDUM
To: Budget & Finance Committee
From: Donna Holland, Fiscal Administrator Subject: Agenda Item 5b: Head Start - Kern
Budget to Actual Report for the Period Ended October 31, 2019 – Info Item Date: November 13, 2019 The Office of Head Start has awarded CAPK the full amount of its Head Start and Early Head Start grant for a five-year project period. The first-year budget period is July 1, 2019 through February 29, 2020. The Budget to Actual Report for this grant reflects the prorated award. The following are highlights of the Kern Head Start Budget to Actual Report for the period July 1, 2019 through October 31, 2019. Four months (50%) of the eight-month budget period have elapsed. Base Funds Overall expenditures are at 45% of the budget, which is on trend with expenditures at this point in the prior budget period. Training & Technical Assistance Funds Overall expenditures are at 36% of the budget. Staff have identified most training costs for the eight-month budget period, which will fully exhaust these funds Non-Federal Share (Head Start and Early Head Start Combined) Non-Federal share is at 49% of the budget. Start-up CAPK was awarded additional funds for the purpose of:
• Converting 4 pre-k classrooms to 6 toddler classrooms; • Constructing and furnishing additional modular classrooms at 4 CAPK facilities.
The funding award was issued on July 27, 2019. Start-up activities began immediately and are in progress. Overall expenditures are at 3% of the budget.
188

Prepared 11/08/2019
BASE FUNDSBUDGET ACTUAL REMAINING % SPENT
%
REMAINING
PERSONNEL 6,054,933 2,544,323 3,510,610 42% 58%FRINGE BENEFITS 2,052,975 957,257 1,095,719 47% 53%TRAVEL 0 0 0EQUIPMENT 0 0 0SUPPLIES 413,860 151,251 262,609 37% 63%CONTRACTUAL 51,529 37,502 14,027 73% 27%CONSTRUCTION 0 0 0OTHER 1,934,691 1,034,248 900,443 53% 47%INDIRECT 1,012,616 472,346 540,270 47% 53%TOTAL BASE FUNDING 11,520,604 5,196,928 6,323,676 45% 55%
TRAINING & TECHNICAL ASSISTANCE
TRAVEL 24,336 15,294 9,042 63% 37%SUPPLIES 17,206 2,231 14,975 13% 87%CONTRACTUAL 5,657 0 5,657 0% 100%OTHER 60,429 21,302 39,127 35% 65%INDIRECT 10,763 3,883 6,880 36% 64%TOTAL TRAINING & TECHNICAL ASSISTANCE 118,391 42,710 75,681 36% 64%
START-UP
SUPPLIES 0 0 0CONSTRUCTION 1,812,348 0 1,812,348 0% 100%OTHER 0 56,252 (56,252)INDIRECT 0 5,586 (5,586)TOTAL CARRYOVER 1,812,348 61,838 1,750,510 3% 97%
GRAND TOTAL HS FEDERAL FUNDS 13,451,343 5,301,476 8,149,867 39% 61%
HEAD START and EARLY HEAD START KERN NON-FEDERAL SHARE
SOURCE BUDGET ACTUAL REMAINING % SPENT%
REMAINING
IN-KIND 1,319,728 668,213 651,515 51% 49%CALIF DEPT OF ED 2,953,796 1,425,669 1,528,127 48% 52%
TOTAL NON-FEDERAL 4,273,524 2,093,882 2,179,642 49% 51%
Budget reflects Notice of Award #09CH011132-01-01 (adjusted for Child Care Food Subsidy).Award is prorated for eight months (07/01/2019 - 02/29/2019)
Actual expenditures include posted expenditures and estimated adjustments through 10/31/2019.Administrative Cost for HS and EHS Kern 10.6%
CURRENT 1 TO 30 31 TO 60 61 TO 90 TOTAL
STATEMENT
DATE
Wells Fargo 33,614 33,614 10/31/2019Lowe's 11,632 9,660 21,292 10/25/2019Smart & Final 354 354 11/1/2019Save Mart 0 N/AChevron & Texaco Business Card 12,258 12,258 11/6/2019Home Depot 0 N/A
57,859 9,660 0 0 67,518
Report Period: July 1, 2019 - October 31, 2019Month 4 of 8 (50%)
Agency-Wide Credit Card Report
Community Action Partnership of Kern
Head Start - Kern
Budget to Actual Report
Budget Period: July 1, 2019 - February 29, 2020
189

5%
19%
33%
45%
0%
20%
40%
60%
80%
100%
120%
JULY AUGUST SEPTEMBER OCTOBER NOVEMBER DECEMBER JANUARY FEBRUARY
Head Start KernPercent Expended Compared to Percent of Budget Period Elapsed
Percent Expended Percent of Budget Period Elapsed
5%
19%
33%
45%
0%
20%
40%
60%
80%
100%
120%
JULY AUGUST SEPTEMBER OCTOBER NOVEMBER DECEMBER JANUARY FEBRUARY
Head Start KernPercent Expended Compared to Prior Year
Percent Expended 2019-20 Percent Expended 2018-19
190

COMMUNITY ACTION PARTNERSHIP OF KERN MEMORANDUM
To: Budget & Finance Committee
From: Donna Holland, Fiscal Administrator Subject: Agenda Item 5b: Early Head Start – Kern
Budget to Actual Report for the Period Ended October 31, 2019 – Info Item Date: November 13, 2019 The Office of Head Start has awarded CAPK the full amount of its Head Start and Early Head Start grant for a five-year project period. The first-year budget period is July 1, 2019 through February 29, 2020. The Budget to Actual Report for this grant reflects the prorated award. The following are highlights of the Kern Head Start Budget to Actual Report for the period July 1, 2019 through October 31, 2019. Four months (50%) of the eight-month budget period have elapsed. Base Funds Overall expenditures are at 30% of the budget, which is on trend with expenditures at this point in the prior budget period. Training & Technical Assistance Funds Overall expenditures are at 49% of the budget. Staff have identified most training costs for the eight-month budget period, which will fully exhaust these funds. Start-up CAPK was awarded additional funds for the purpose of:
• Converting 4 pre-k classrooms to 6 toddler classrooms; • Constructing and furnishing additional modular classrooms at 4 CAPK facilities.
The funding award was issued on July 27, 2019. Start-up activities began immediately and are in progress. Overall expenditures are at 5% of the budget.
191
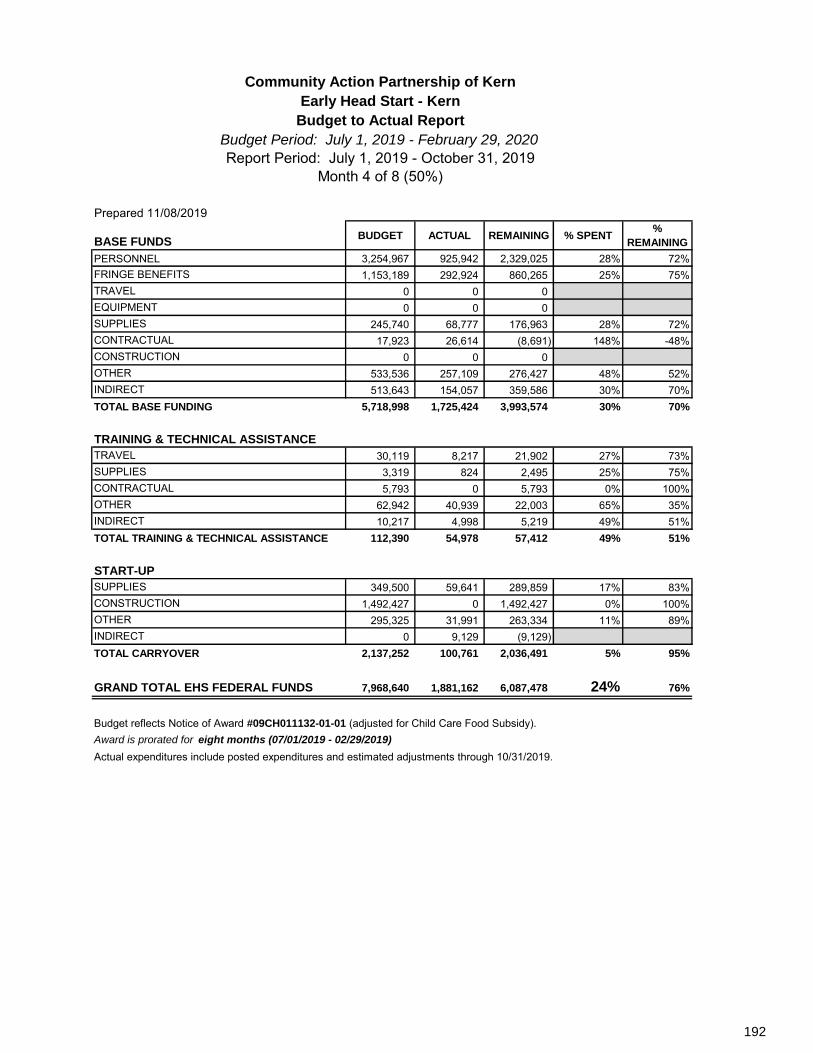
Prepared 11/08/2019
BASE FUNDSBUDGET ACTUAL REMAINING % SPENT
%
REMAINING
PERSONNEL 3,254,967 925,942 2,329,025 28% 72%FRINGE BENEFITS 1,153,189 292,924 860,265 25% 75%TRAVEL 0 0 0EQUIPMENT 0 0 0SUPPLIES 245,740 68,777 176,963 28% 72%CONTRACTUAL 17,923 26,614 (8,691) 148% -48%CONSTRUCTION 0 0 0OTHER 533,536 257,109 276,427 48% 52%INDIRECT 513,643 154,057 359,586 30% 70%TOTAL BASE FUNDING 5,718,998 1,725,424 3,993,574 30% 70%
TRAINING & TECHNICAL ASSISTANCE
TRAVEL 30,119 8,217 21,902 27% 73%SUPPLIES 3,319 824 2,495 25% 75%CONTRACTUAL 5,793 0 5,793 0% 100%OTHER 62,942 40,939 22,003 65% 35%INDIRECT 10,217 4,998 5,219 49% 51%TOTAL TRAINING & TECHNICAL ASSISTANCE 112,390 54,978 57,412 49% 51%
START-UP
SUPPLIES 349,500 59,641 289,859 17% 83%CONSTRUCTION 1,492,427 0 1,492,427 0% 100%OTHER 295,325 31,991 263,334 11% 89%INDIRECT 0 9,129 (9,129)TOTAL CARRYOVER 2,137,252 100,761 2,036,491 5% 95%
GRAND TOTAL EHS FEDERAL FUNDS 7,968,640 1,881,162 6,087,478 24% 76%
Budget reflects Notice of Award #09CH011132-01-01 (adjusted for Child Care Food Subsidy).Award is prorated for eight months (07/01/2019 - 02/29/2019)
Actual expenditures include posted expenditures and estimated adjustments through 10/31/2019.
Community Action Partnership of Kern
Early Head Start - Kern
Budget to Actual Report
Budget Period: July 1, 2019 - February 29, 2020
Report Period: July 1, 2019 - October 31, 2019Month 4 of 8 (50%)
192

3%
15%
24%30%
0%
20%
40%
60%
80%
100%
120%
JULY AUGUST SEPTEMBER OCTOBER NOVEMBER DECEMBER JANUARY FEBRUARY
Early Head Start KernPercent Expended Compared to Percent of Budget Period Elapsed
Percent Expended Percent of Budget Period Elapsed
3%
15%
24%30%
0%
20%
40%
60%
80%
100%
120%
JULY AUGUST SEPTEMBER OCTOBER NOVEMBER DECEMBER JANUARY FEBRUARY
Early Head Start KernPercent Expended Compared to Prior Year
Percent Expended 2019-20 Percent Expended 2018-19
193

Page 1 of 1Community Action Partnership of Kern
Head Start and Early Head Start
Non-Federal Share and In-Kind Year-to-Date Report
Budget Period: July 1, 2019 through February 28, 2020
Report for period ending October 31, 2019 (Month 4 of 8)
Percent of year elapsed: 50.0%
LOCATION
Enroll-
ment July Aug Sep Oct
YTD
Totals
IN-KIND
GOAL
% OF
GOAL
MET
Shafter 20 3,439 9,391 9,544 166 22,541 14,889 151%Sunrise Villa 20 0 1,729 8,119 12,367 22,216 14,889 149%Broadway 40 0 5,037 12,489 15,299 32,826 29,779 110%Heritage 40 0 2,979 11,975 15,657 30,612 29,779 103%Planz 20 0 2,549 6,267 6,263 15,079 14,889 101%Virginia 40 0 2,575 11,651 14,359 28,585 29,779 96%Fairfax 40 0 4,362 11,644 9,124 25,131 29,779 84%Delano 76 0 7,546 16,320 22,221 46,088 56,579 81%Shafter HS/EHS 26 3,464 4,378 2,820 3,777 14,439 19,356 75%Wesley 60 0 5,804 9,435 17,381 32,620 44,668 73%Willow 55 0 2,994 10,035 15,721 28,750 40,946 70%Martha J. Morgan 44 0 2,851 8,037 9,337 20,225 32,756 62%East California 56 0 3,020 9,812 12,099 24,930 41,690 60%Harvey L. Hall 156 14,027 15,171 19,169 10,773 59,140 116,136 51%Alicante 20 1,832 1,534 1,977 1,812 7,155 14,889 48%Alberta Dillard 80 0 8,218 18,514 202 26,934 59,557 45%Seibert 40 0 0 6,592 6,226 12,819 29,779 43%San Diego Street 40 2,269 1,761 4,746 3,896 12,672 29,779 43%Sterling 124 11,837 12,270 13,241 366 37,713 92,313 41%Taft 66 0 5,094 14,576 0 19,670 49,135 40%Rosamond 80 0 6,131 17,498 182 23,810 59,557 40%Fairview 40 0 1,733 9,287 233 11,253 29,779 38%Oasis 57 0 2,520 5,399 6,747 14,667 42,434 35%Pete H. Parra 128 11,208 14,041 7,267 366 32,881 95,291 35%Primeros Pasos 80 4,041 8,164 7,548 245 19,998 59,557 34%Lamont 40 0 1,156 8,549 124 9,830 29,779 33%Tehachapi 34 0 1,148 3,028 3,006 7,182 25,312 28%California City 34 0 3,043 2,668 153 5,863 25,312 23%McFarland 20 0 0 2,983 133 3,116 14,889 21%Home Base 124 3,164 1,881 2,419 535 7,998 46,157 17%Vineland 20 0 595 1,278 257 2,130 14,889 14%Cleo Foran 23 0 0 0 718 718 17,123 4%Mojave 20 0 0 125 70 195 14,889 1%Administrative Services 0 0 0 0 0 0 NAProgram Services 1,372 6,661 23 0 8,056 26,302 31%Policy Council and RPC 0 0 81 290 372 27,093 1%SUBTOTAL IN-KIND 1,763 56,653 146,336 275,118 190,106 668,213 1,319,728 51%
State General Child Care* 164,884 149,146 142,941 209,463 666,434 1,181,518 56%State Preschool* 94,393 98,908 160,287 359,757 713,346 1,654,126 43%State Migrant Child Care* 14,766 12,732 11,317 7,073 45,889 118,152 39%SUBTOTAL CA DEPT of ED 274,043 260,787 314,546 576,293 1,425,669 2,953,796 48%
GRAND TOTAL 330,696 407,123 589,664 766,399 2,093,882 4,273,524 49%
*May include estimates
194
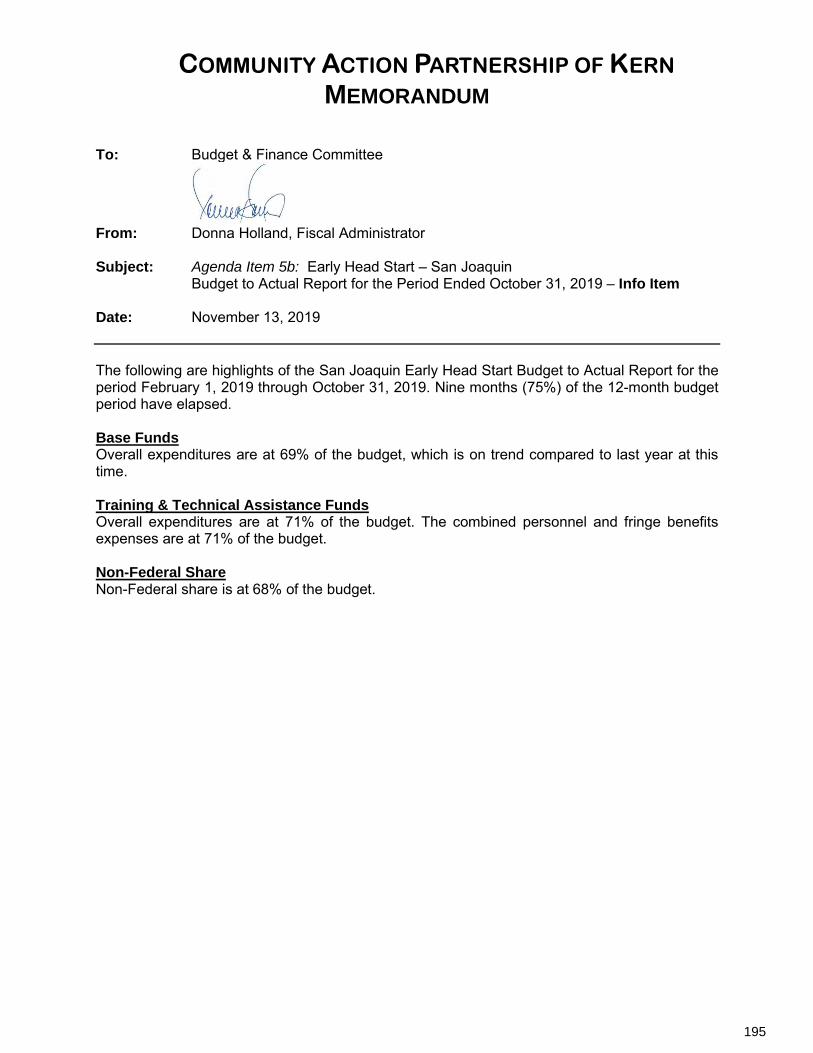
COMMUNITY ACTION PARTNERSHIP OF KERN MEMORANDUM
To: Budget & Finance Committee
From: Donna Holland, Fiscal Administrator Subject: Agenda Item 5b: Early Head Start – San Joaquin
Budget to Actual Report for the Period Ended October 31, 2019 – Info Item Date: November 13, 2019 The following are highlights of the San Joaquin Early Head Start Budget to Actual Report for the period February 1, 2019 through October 31, 2019. Nine months (75%) of the 12-month budget period have elapsed. Base Funds Overall expenditures are at 69% of the budget, which is on trend compared to last year at this time. Training & Technical Assistance Funds Overall expenditures are at 71% of the budget. The combined personnel and fringe benefits expenses are at 71% of the budget. Non-Federal Share Non-Federal share is at 68% of the budget.
195

Prepared 11/08/2019
BASE FUNDSBUDGET ACTUAL REMAINING % SPENT
%
REMAINING
PERSONNEL 3,114,932 2,192,320 922,612 70% 30%FRINGE BENEFITS 923,567 605,735 317,832 66% 34%TRAVEL 20,232 16,060 4,172 79% 21%SUPPLIES 140,925 106,230 34,695 75% 25%CONTRACTUAL 12,078 5,286 6,792 44% 56%OTHER 600,638 384,751 215,887 64% 36%INDIRECT 456,781 320,243 136,538 70% 30%TOTAL 5,269,153 3,630,625 1,638,528 69% 31%
TRAINING & TECHNICAL ASSISTANCE FUNDS
PERSONNEL 39,312 19,397 19,915 49% 51%FRINGE BENEFITS 11,534 10,577 957 92% 8%TRAVEL 15,673 11,447 4,226 73% 27%SUPPLIES 7,900 0 7,900 0% 100%CONTRACTUAL 3,500 7,680 (4,180) 219% -119%OTHER 30,423 28,367 2,056 93% 7%INDIRECT 10,833 7,742 3,091 71% 29%TOTAL 119,175 85,210 33,965 71% 29%
GRAND TOTAL EHS FEDERAL FUNDS 5,388,328 3,715,835 1,672,493 69% 31%
NON-FEDERAL SHAREBUDGET ACTUAL REMAINING % SPENT
%
REMAINING
IN-KIND 1,347,083 914,123 432,960 68% 32%TOTAL NON-FEDERAL FUNDS 1,347,083 914,123 432,960 68% 32%
Centralized Administrative Cost 7.1%Program Administrative Cost 2.5%
Total Administrative Cost 9.6%
Budget reflects Notice of Award #09CH010071-05-01Actual expenditures include posted expenditures and estimated adjustments through 10/31/2019
Community Action Partnership of Kern
Early Head Start - San Joaquin County
Budget to Actual Report
Budget Period: February 1, 2019 - January 31, 2020Report Period: February 1, 2019 - October 31, 2019
Month 9 of 12 (75%)
196

8%
15%
23%
31%
37%41%
53%
61%
69%
0%
20%
40%
60%
80%
100%
120%
Feb Mar Apr May Jun Jul Aug Sept Oct Nov Dec Jan
Early Head Start San JoaquinPercent Expended Compared to Prior Year
Percent Expended 2018-19 Percent Expended 2018-19
8%15%
23%
31%37%
41%
53%
61%
69%
0%
20%
40%
60%
80%
100%
120%
Feb ReportPeriod:
February 1,2019 -
October 31,2019
Month 9 of12 (75%)
Prepared11/07/2019
Jun Jul Aug Sept Oct Nov Dec Jan
Early Head Start San JoaquinPercent Expended Compared to Percent of Year Elapsed
Percent Expended Percent of Year Elapsed
197

Co
mm
un
ity A
cti
on
Part
ners
hip
of
Kern
San
Jo
aq
uin
Earl
y H
ead
Sta
rt
No
n-F
ed
era
l S
hare
an
d In
-Kin
d Y
ear-
to-D
ate
Rep
ort
Bu
dg
et
Peri
od
: F
eb
ruary
1, 2019 t
hro
ug
h J
an
uary
31, 2020
Rep
ort
fo
r p
eri
od
en
din
g O
cto
ber
31, 2019 (
Mo
nth
9 o
f 12)
Perc
en
t o
f year
ela
ps
ed
:75%
LO
CA
TIO
N
FU
ND
ED
EN
RO
LL
-
ME
NT
Fe
bM
arc
hA
pri
lM
ay
Ju
ne
Ju
lyA
ug
Sep
Oct
YT
D
To
tals
IN-K
IND
GO
AL
% O
F
GO
AL
ME
T
Hom
e Ba
se -
Lodi
3512
,150
16,3
2016
,251
16,9
042,
077
10,4
2410
,550
9,56
50
94,2
4097
,040
97%
Hom
e Ba
se -
Man
teca
123,
172
5,47
24,
045
5,24
92,
063
3,39
54,
433
3,42
617
31,2
7233
,271
94%
Wal
nut
2411
,221
13,0
0512
,719
10,1
749,
667
11,5
5613
,927
13,0
3731
695
,621
133,
083
72%
Hom
e Ba
se -
Stoc
kton
9018
,088
24,8
4420
,686
23,4
0012
,149
18,3
7018
,728
14,8
690
151,
133
249,
531
61%
Lodi
UC
C30
11,3
7211
,887
12,8
3010
,884
8,82
110
,755
14,0
8012
,824
266
93,7
2016
6,35
456
%C
hris
man
3012
,312
16,7
8511
,548
8,60
63,
809
8,60
614
,242
12,8
0811
688
,832
166,
354
53%
Cal
iforn
ia S
treet
249,
349
9,97
39,
716
7,54
55,
825
6,34
610
,529
9,53
250
68,8
6513
3,08
352
%Ke
nned
y16
7,18
05,
402
7,18
14,
740
2,06
35,
560
6,83
15,
897
100
44,9
5388
,722
51%
St. M
ary'
s16
5,14
46,
702
5,92
74,
858
3,21
05,
422
5,99
46,
580
043
,837
88,7
2249
%M
arci
Mas
sei
245,
173
6,05
06,
373
5,05
54,
171
6,33
313
,332
11,0
6583
57,6
3613
3,08
343
%H
ome
Base
- Tr
acy
1223
31,
607
1,68
92,
025
068
350
42,
083
08,
825
33,2
7127
%Ad
min
istra
tive
Serv
ices
251
1,67
80
00
00
00
1,92
80
Prog
ram
Ser
vice
s11
,721
11,5
7522
,146
31,2
028,
655
13,1
0412
,925
11,0
7810
,388
132,
793
21,8
5860
8%Po
licy
Cou
ncil
5718
70
175
480
00
046
72,
713
17%
SU
BT
OT
AL
IN
-KIN
D313
107,4
21
131,4
85
131,1
11
130,8
17
62,5
58
100,5
53
126,0
77
112,7
64
11,3
36
914,1
23
1,3
47,0
83
68%
198

COMMUNITY ACTION PARTNERSHIP OF KERN MEMORANDUM
To: Budget & Finance Committee
From: Donna Holland, Fiscal Administrator Subject: Agenda Item 5b: Early Head Start Child Care Partnerships + Expansion
Budget to Actual Report for the Period Ended October 31, 2019 – Info Item Date: November 13, 2019 Effective September 1, 2019, funds formerly awarded under Early Head Start Child Care Partnerships (grant #09HP0036) were rolled into Early Head Start Child Care Expansion (grant #09HP000163). The following are highlights of the Early Head Start Child Care Partnerships & Expansion Budget to Actual Report for the period March 1, 2018 through October 31, 2019. Eight months (67%) of the 12-month budget period have elapsed. Base Funds Overall expenditures are at 5% of the budget. Training & Technical Assistance (T&TA) Overall expenditures are at 9% of the budget. Start-Up Start-up funds were awarded for the purpose of preparing and furnishing 12 new classrooms for CAPK and Partnership locations. Overall expenditures are at 2% of the budget. Non-Federal Share Non-Federal share is at 8% of the budget.
199

Prepared 11/08/2019
BASE FUNDSBUDGET ACTUAL REMAINING % SPENT
%
REMAINING
PERSONNEL 608,125 56,441 551,684 9% 91%FRINGE BENEFITS 192,825 13,532 179,293 7% 93%SUPPLIES 46,656 1,351 45,305 3% 97%CONTRACTUAL 766,959 17,224 749,735 2% 98%OTHER 153,605 7,911 145,694 5% 95%INDIRECT 167,944 8,036 159,908 5% 95%TOTAL BASE FUNDING 1,936,114 104,495 1,831,619 5% 95%
TRAINING & TECHNICAL ASSISTANCE
TRAVEL 3,088 2,362 726 76% 24%SUPPLIES 14,930 0 14,930 0% 100%OTHER 26,696 1,580 25,116 6% 94%INDIRECT 4,471 394 4,077 9% 91%TOTAL TRAINING & TECHNICAL ASSISTANCE 49,185 4,335 44,850 9% 91%
START UP
SUPPLIES 258,000 9,333 248,667 4% 96%OTHER 196,545 0 196,545 0% 100%INDIRECT 45,455 470 44,985 1% 99%TOTAL START UP 500,000 9,802 490,198 2% 98%
GRAND TOTAL EHS FEDERAL FUNDS 2,485,299 118,633 2,366,666 5% 95%
NON-FEDERAL SHARE
SOURCE BUDGET ACTUAL REMAINING % SPENT%
REMAINING
IN-KIND 528,694 40,775 487,919 8% 92%TOTAL NON-FEDERAL 528,694 40,775 487,919 8% 92%
Budget reflects Notice of Award #09HP000163-01-01
Actual expenditures include posted expenditures and estimated adjustments through 10/31/2019.
Report Period: March 1, 2019 - October 31, 2019Month 8 of 12 (67%)
Community Action Partnership of Kern
Early Head Start Child Care Partnerships + Expansion
Budget to Actual Report
Budget Period: March 1, 2019 - February 29, 2020
200
MEMORANDUM
TO: Budget & Finance Committee
FROM: Tracy Webster, Chief Financial Officer
DATE: November 13, 2019
RE: Agenda Item 5c: Changes to Human Resource and Finance Job Descriptions – Action Item
We are proposing the adoption of a new job description for Human Resource Generalist and changes to existing job descriptions in the Human Resource and Finance Divisions.
First, the Human Resource Division has budgeted the position of Human Resource Generalist for the current fiscal year. However, a job description was not brought before the Board for approval.
A job description for the position of Human Resource Generalist was written in collaboration with the Human Resource team. The position was pointed by the Human Resource Manager and Chief Financial Officer at a Grade 9.
The staffing of the agency is approximately 900 individuals. The complexity of the organization continues to grow as we are currently operating 72 different sources of funding. Our scope, influence and staffing levels continue to expand. Accordingly, the Human Resource Division requires additional support at a Human Resource Generalist level. The additional staff will allow us to continue pursuing the human resource related strategic objectives of maintaining an adequate work force.
Second, we are proposing modifications to the existing Human Resource Manager position to be renamed to a Human Resource Administrator. The scope of the position will significantly change. The job description has been modified with a greater focus on staff development and retention to align with the agency’s strategic plan. The Human Resource budget has capacity to accommodate this change.
Finally, we are proposing to remove the benefit management responsibilities from the Human Resource Administrator. These responsibilities will be moved the payroll department. This is a natural administrative fit for these functions and the align with the requirements of accountability and accuracy. We are proposing a modification the Payroll/HRIS Manager’s job description to be
201
a Payroll/HRIS Administrator as the assumption of new tasks, greater supervision, and responsibilities changes the overall scope of the job. Due to the increase in the number of grants and contracts, the Finance budget has capacity to accommodate this change. Recommendation: Staff recommends approval to implement the proposed job description for Human Resource Generalist and changes to the job descriptions of Human Resources Administrator and Payroll/HRIS Administrator Attachment: Human Resource Division Org Chart
Human Resource Generalist Job Description Human Resources Administrator Job Description Finance Division Org Chart Payroll/HRIS Administrator Description
202

Hum
an R
esou
rces
Dir
ec
tor
of
Hu
ma
n
Re
so
urc
es
Vaca
nt
HR
Ge
nera
list/
Recru
itin
g S
up
erv
iso
r
Daw
n Bl
edso
e
HR
Ad
min
istr
ato
r
Prop
osed
-Vac
ant
Sta
ffin
g S
pecia
list
Mau
ra S
ando
val
HR
Te
ch
nic
ian
Del
ia M
oren
o
PRO
POSA
L 11
/201
9
HR
Ge
nera
list
Vaca
nt
HR
Sp
ecia
list
San
Jo
aq
uin
Cha
“Jol
ene”
Van
g
HR
Te
ch
nic
ian
Auro
ra H
erna
ndez
203

Human Resource Generalist 1
COMMUNITY ACTION PARTNERSHIP of KERN HUMAN RESOURCE Generalist
Disclaimer: Job descriptions are written as a representative list of the ADA essential duties performed by a job class. They cannot include nor are they intended to include all duties performed by all positions occupying a class. Salary Range: Grade 9 FLSA Status: Non-Exempt Date Approved: 11/20/19 SUMMARY Performs human resources duties at a professional level and may carry out responsibility in some or all of the following functional areas: employee relations, training, employment, compensation, affirmative action and state and federal laws. Helps organize the implementation and administration of the Human Resource Department functions and carries out policies and procedures relating to all phases of activities. SUPERVISION RECEIVED: Receives direct supervision from the Director of Human Resources. SUPERVISION EXERCISED: None DUTIES AND RESPONSIBILITIES: Disclaimer – This list is meant to be representative, not exhaustive. Some incumbents may not perform all the duties listed or may perform related duties as assigned. Reasonable accommodations may be made to enable individuals with disabilities to perform essential functions. A. Essential Job Specific Duties: 1. Partners with employees and management to communicate various human resource
policies, procedures, laws, standards and government regulations. 2. Prepare and conduct human resources related employee training as required 3. Conduct and coordinate the orientation, training, and separation of personnel for the
Agency and activities involved in staff development and training. Assist in establishing and maintaining related timelines and priorities. Assure related activities comply with established standards, requirements, laws, codes, regulations, policies and procedures.
4. Assists management with corrective action and disciplinary documentation. 5. Assists with employee relation issues such as employee complaints, harassment
allegations and civil rights complaints. Ensure proper steps are taken to address employee concerns.
6. Ensures compliance with regulations and procedures by providing advice and guidance to employee by checking data/resources including the Employee Policy Manual, internal resource documents and by seeking advice from the HR Director.
7. Represents the company for assigned unemployment claims. Responds to unemployment claims as needed and in accordance to the unemployment insurance program.
8. Provide and support staff training and development, including onsite consultation, coaching, and mentoring to supervisory staff.
204

Human Resource Generalist 2
9. Interpret policies, procedures, and regulations; prepare reports, correspondence, and a variety of written materials
10. Assist in conducting investigations as required 11. Monitor and prepare appropriate employee status changes 12. Conducts exit interviews, analyzes data 13. Assist in providing office training programs in areas related to personnel management.
Coordinate and conduct training sessions for employees concerning office policies and procedures and other personnel functions. Prepare and deliver oral presentations.
14. Provide support in the assessment of organizational training needs through surveys, employee interviews, and consultations with management staff.
15. Assist in the design and creation of training manuals, online learning modules, course materials, and in the review and selection of training materials from different vendors.
16. Assist in the monitoring and evaluation of training programs for relevance and effectiveness, and in the reporting of metrics to the organization.
17. Provide information and assistance to new employees including following up post hire to ensure understanding of information including policies, procedures, and fringe benefits.
18. Serve as contact for employees regarding benefit related issues and questions. 19. Receive and prioritize claims, questionnaires and other unemployment related data. 20. Use details regarding employee separation to interpret and apply state laws and
regulations in response to unemployment documents. 21. Represent the office in unemployment hearings as needed. 22. Travel to worksites to provide information and meet with employees on various matters. 23. Assist with special projects
B. Other Job Specific Duties: 1. Works on special projects as assigned 2. Conducts and attends meetings, trainings and professional growth activities, as required. 3. Works alternative hours as required. 4. Performs any other like duties as assigned MINIMUM QUALIFICATIONS: The requirements listed below are representative of the knowledge, skills, and abilities required to satisfactorily perform the essential duties and responsibilities. Knowledge of: Agency policies and procedures Applicable federal, state, and local laws, codes, and regulations Departmental policies and procedures Current problems of socially and economically challenged families Modern office procedures and equipment including computers Word processing and other related software applications. Ability to: Plan, organize, and allocate resources. Work independently. Prepare clear, concise reports. Exercise sound, independent judgment within general policy guidelines. Provide guidance and interpret and explain policies and procedures. Analyze problems; identify alternative solutions. Communicate effectively verbally and in writing.
205

Human Resource Generalist 3
Work with accuracy and attention to detail. Operate and use modern office equipment. Effectively organize and prioritize assigned work. Establish and maintain effective working relationships with other people. EDUCATION AND EXPERIENCE: The following requirements generally demonstrate possession of the minimum requisite knowledge and ability necessary to perform the duties of the position.
Four-year degree from college or university in Public or Business Administration,
Personnel Administration, Education Administration, or closely related field. Demonstrated experience as a Human Resources Specialist may be substituted for the education requirement on a year for year basis.
Three years’ experience in human resources; emphasis on experience as a Human Resources generalist, one (1) year of which in a supervisory experience.
SPHR (Senior Professional in Human Resources) or PHR (Professional in Human Resources) is desired.
OTHER REQUIRMENTS:
Must be fingerprinted and have records filed with the State Department of Social Services, Community Care Licensing. Completion of a physical and substance abuse screening upon offer of employment.
Successful completion TB screening upon employment and annually thereafter.
Drive vehicle to conduct work WORK ENVIRONMENT: The work environment characteristics described are representative of those an employee encounters in performing the essential functions of this job. Work is primarily performed indoors. Noise level is quiet to moderately quiet. Hazards are minimal. ESSENTIAL PHYSICAL DEMANDS: The physical demands described here are representative of those that must be met by an employee to successfully perform the essential functions of the job. Reasonable accommodations may be made to enable employees with disabilities to perform the essential duties.
POSITION TITLE Human Resources Generalist
ACTIVITY
(HOURS PER DAY)
NEVER 0
HOURS
OCCASIONALLY
UP TO 4 HOURS
FREQUENTLY
4-8 HOURS
Sitting x
Walking x
Standing x
Bending (neck) x
206

Human Resource Generalist 4
Bending (waist) x
Squatting x
Climbing x
Kneeling x
Crawling x
Twisting (neck) x
Twisting Waist x
Is repetitive use of hand required? x
Simple Grasping (right hand) x
Simple Grasping (left hand) x
Power Grasping (right hand) x
Power Grasping (left hand) x
Fine Manipulation (right hand) x
Fine Manipulation (left hand) x
Pushing & Pulling (right hand) x
Pushing &Pulling (left hand) x
Reaching (above shoulder level) x
Reaching (below shoulder level) x
LIFTING CARRYING
NEVER 0
HOURS
OCCASIONALLY
UP TO 4 HOURS
FREQUENTLY
4-8 HOURS
NEVER 0
HOURS
OCCASIONALLY
UP TO 4 HOURS
FREQUENTLY
4-8 HOURS
0-10 lbs x x
11-25 lbs x x
26-50 lbs x x
51-75lbs x x
76-100lb x x
100lbs+ x x
207

1
COMMUNITY ACTION PARTNERSHIP of KERN Human Resources Administrator
Disclaimer: Job descriptions are written as a representative list
of the ADA essential duties performed by a job class. They cannot include nor are they intended to include all duties performed by all positions occupying a class. Salary Range: Grade 12 FLSA Status: Exempt Date Approved: SUMMARY:
Maintains and enhances the organization's human resources by planning, implementing, and evaluating employee relations and human resources policies, programs, and practices. Assist the HR Director with strategic leadership, implementation and coordination of Human Resources and Internal Communications to ensure a positive culture and work environment, as well as a highly engaged and well-equipped workforce.
SUPERVISION RECEIVED: Receives supervision from the Director of Human Resources. SUPERVISION EXERCISED: Assist with the supervision of HR staff in the absence of the HR Director. HR staff includes: , Human Resources Technicians, Human Resource Generalist, Human Resource Specialist, Staffing Specialist, and HR Generalist/Recruiter Supervisor DUTIES AND RESPONSIBILITIES: Disclaimer – This list is meant to be representative, not exhaustive. Some incumbents may not perform all the duties listed or may perform related duties as assigned. Reasonable accommodations may be made to enable individuals with disabilities to perform essential functions. Essential Job Specific Duties: Human Resources Responsibilities 1. Assists Director in strategic planning and implementation of HR best practices and processes;
position is a hands-on leadership role. 2. Provide technical support, assistance and training, and supervise the work of professional,
technical and clerical personnel engaged in activities such as o Reviewing transcripts and professional certifications o Employment processing o Posting personnel information and maintaining records and files o Classification and compensation, staff development, special projects and other
operational services o Determine workload, priorities and adjust assignments as needed to meet established
timelines 3. Plan, design and coordinate administrative procedures to ensure effective and efficient
service delivery. Review, evaluate and conduct procedural studies of existing personnel work methods and operations, recommend proposals for improvements and implement modifications for work simplification.
208

2
4. Ensures legal compliance by monitoring and implementing applicable human resource federal and state requirements; assists in conducting investigations; maintaining records; representing the organization at EDD hearings.
5. Coordinate and participate in conducting classification and compensation studies. Recommend allocation of positions to classifications and salary ranges. Coordinate the writing of job descriptions.
6. Coordinates recruitment to include: job announcements and advertisements, applicant screening and interviewing; evaluating work history and education to ensure applications are complete and that applicant meets minimum qualifications for the position; schedule and conduct interviews with department representative. Oversee reference checks and ensure all phases of the recruitment and selection procedures meet applicable federal, state and local laws and regulations.
7. Assist and provide guidance to HR staff in trainings such as new hire orientation, benefits, safety, etc. Assist and conduct human resources related employee and supervisory training as required.
8. Assist with employee status changes, new hire and terminations and ensure ADP compliance. Work with Payroll to ensure employee status changes are finalized.
9. Support management by interpreting policies, procedures and regulations; providing human resources advice and counsel.
10. Assists with Coordinating and conducting employee investigations when needed. Makes recommendations as to appropriate actions to be taken in regards to the outcome of employee investigations.
11. Oversees the preparation and administration of corrective employee actions in cooperation with Supervisors.
12. Assist in the administration of termination processes advising management on Partnership policies and practices.
13. Provide technical human resource expertise to all levels of organization staff and public regarding human resource matters. Interpret and explain rules, regulations, policies, procedures, collective bargaining agreements, employee benefits, leave usage and performance evaluation. Justify decisions, negotiate or resolve significant and /or controversial issues related to human resources management, including discipline, organizational matters and personnel programs.
14. Act as liaison to Union representatives to assist Director in communications, negotiations and implementation of Union Agreements.
15. Assist HR Director in guiding management and employee actions by researching, developing, writing, and updating policies, procedures, methods, and guidelines; communicate and enforce organizational values.
16. Assists Director in the administration and tracking of Employee Performance Evaluations. 17. Assists with the DMV Pull Notice program 18. Prepare and/or review reports, recommendations and proposals as requested. 19. Plan and conduct administrative studies relative to present and future human resource needs
of the Organization and conduct other studies as directed. 20. Attend and participate in professional group meetings; stay abreast of new trends and
innovations in the field of human resources. Internal Communications Responsibilities 1. Implement internal Human Resources communications elements of agency strategic
communications plan. 2. Assists in maintaining current and accurate Employee Handbook. 3. Develop, or consult with others as requested, internal communications including position
descriptions, reminders, memos, executive emails, sponsorships, other.
209

3
4. Set goals, in consultation with Executive Director, regarding effectiveness of internal communications; develop metrics; gather data and report results.
Staff Development Responsibilities 1. Produce organizational strategy and plans to meet training and development needs for
managers. 2. Develop, implement and maintain a leadership and management training program. 3. Develop, deliver, and support the execution of talent development and training initiatives for
all staff. 4. Orchestrate cultural development and change initiatives that foster organizational learning
and improvement. 5. Establish, implement and maintain a process for measuring the success of training efforts
both individually and organizationally. 6. Identify individual groups and organizational development opportunities. MINIMUM QUALIFICATIONS: The requirements listed below are representative of the knowledge, skills, and abilities required to satisfactorily perform the essential duties and responsibilities. Knowledge of:
Agency policies and procedures Applicable federal, state, and local laws, codes, and regulations critical to HR functions and
personnel management Modern office practices, methods, procedures and equipment including computers Word processing, spreadsheet, database, and other related software applications Ability to:
Communicate both orally and in written form with individuals at all levels of the organization, with vendor and partner organizations.
Strong and effective verbal presentation skills appropriate for a variety of staff and other professional audiences.
Ability to add, subtract, multiply and divide in all units of measure, using whole numbers, common fractions and decimals and use basic statistical methods.
Ability to understand and interpret program revenue and expense budgets. Operate as a member of the Leadership Team Work closely with the HR Director and management to monitor and manage organizational
development to ensure the alignment of resources and strategy. EDUCATION AND EXPERIENCE: The following requirements generally demonstrate possession of the minimum requisite knowledge and ability necessary to perform the duties of the position. Bachelor's degree in Human Resources or related field preferred. p Two years of experience in a management position requiring supervision of staff preferred Must have a demonstrated experience capacity to work well with others, be well organized,
and have above average language, writing and public relations skill Proficiency with Microsoft products, HR and benefits administration programs Experience may substitute for education at the discretion of the Executive Director.
210

4
SPHR (Senior Professional in Human Resources) or PHR (Professional in Human Resources) is desired.
OTHER REQUIREMENTS Possession of a valid California Driver’s License and State automobile insurance, and
acceptable driving record substantiated by a DMV printout. Completion of a fingerprint background check, physical and substance abuse screening upon
offer of employment. WORK ENVIRONMENT: The work environment characteristics described are representative of those an employee encounters in performing the essential functions of this job.
Work is primarily performed indoors. Noise level is quiet to moderately quiet. Hazards are minimal.
ESSENTIAL PHYSICAL DEMANDS: The physical demands described here are representative of those that must be met by an employee to successfully perform the essential functions of the job. Reasonable accommodations may be made to enable employees with disabilities to perform the essential duties.
POSITION TITLE Human Resources Administrator
ACTIVITY
(HOURS PER DAY)
NEVER 0 HOURS
OCCASIONALLY UP TO 4 HOURS
FREQUENTLY 4-8 HOURS
Sitting x Walking x Standing x Bending (neck) x Bending (waist) x Squatting X Climbing x Kneeling X Crawling x Twisting (neck) x Twisting Waist x Is repetitive use of hand required? x Simple Grasping (right hand) x Simple Grasping (left hand) x Power Grasping (right hand) X Power Grasping (left hand) X Fine Manipulation (right hand) x Fine Manipulation (left hand) x
211

5
Pushing & Pulling (right hand) x Pushing &Pulling (left hand) x Reaching (above shoulder level) x Reaching (below shoulder level) x
LIFTING CARRYING
NEVER 0 HOURS
OCCASIONALLY UP TO 4 HOURS
FREQUENTLY 4-8 HOURS
NEVER 0 HOURS
OCCASIONALLY UP TO 4 HOURS
FREQUENTLY 4-8 HOURS
0-10 lbs x x 11-25 lbs x x 26-50 lbs x x 51-75 lbs x x
76-100 lbs x x 100 lbs+ x
212

Ch
ief
Fin
an
cia
l O
ffic
er
Trac
y W
ebst
er
Ac
co
un
tin
g T
ec
hn
icia
nR
osem
ary
Albi
tre
Ac
co
un
tin
g M
an
ag
er
Gab
rielle
Ale
xand
er
Co
ntr
oll
er
Lorra
ine
Cas
illas
Ac
co
un
tin
g T
ec
hn
icia
n
Phay
thou
ne K
ham
phan
ith
Fina
nce
Div
isio
n
Ac
co
un
tin
g T
ec
hn
icia
nJe
nnife
r Dav
is
Ac
co
un
tin
g S
pe
cia
lis
t Sy
lvia
Sal
azar
Fin
an
ce
Ma
na
ge
rH
eath
er M
cCar
ley
Ac
co
un
tin
g T
ec
hn
icia
nLu
z G
uerre
ro
PROPO
SAL 11
/201
9
Sta
ff A
cco
un
tan
t –
Ba
nk
ing
an
d F
oo
d B
an
kVe
roni
ca Ip
atzi
Pa
yro
ll/H
RIS
Ma
na
ge
rEr
ic K
elle
y
Pa
yro
ll S
pecia
list
Step
hani
e N
erio
Pa
yro
ll S
pecia
list
Adria
na A
rredo
ndo
Accounts PayableA
cc
ou
nti
ng
Te
ch
nic
ian
(Sh
are
d b
y P
ayro
ll
an
d A
P)
Rei
naAm
aya
Fis
cal
Sp
ecia
list
–
HS
Sa
n J
oa
qu
inBe
lvin
derB
iring
Sta
ff A
cco
un
tan
t –
Nu
trit
ion
Se
rvic
es
Loui
s R
odrig
uez
Sta
ff A
cco
un
tan
t –
En
erg
yTi
m B
eale
ssio
Sta
ff A
cco
un
tan
t –
Co
mm
un
ity S
erv
ices
Nao
mi I
barra
Fis
cal
Tech
nic
ian
–H
SM
arib
el B
orja
-Cha
vez
Fis
cal
Tech
nic
ian
–H
SM
aria
Cas
tro R
uiz
Ad
min
Assis
tan
t to
Dir
ecto
rKr
iste
nR
ubio
HS Fiscal Services
Be
nefi
ts S
pecia
list
Lupe
Flo
res
Ben
efi
ts T
ech
nic
ian
Vale
rie S
erna
213

1
COMMUNITY ACTION PARTNERSHIP of KERN Payroll/HRIS Administrator
Disclaimer: Job descriptions are written as a representative list of the ADA essential duties performed by a job class. They cannot include nor are they intended to include all duties performed by
all positions occupying a class. Salary Range: Grade 12 FLSA Status: Exempt Date Approved:
SUMMARY: Manages the Payroll function for the CAPK bi-weekly payroll which includes timely and accurate payments to CAPK employees. Ensures proper time recording procedures are in place. Manages time and attendance system and transfer of data to payroll. Responsible for proper accrual tracking and pay-outs of vacation time, sick leave and/or floating holiday when required. Manage payroll adjustments. Acts as primary Administrator for all ADP Payroll and Human Resources (HRIS) systems. This position is the primary point of contact and subject matter expert ensuring data integrity, testing of ADP system changes/upgrades, testing, report writing and analyzing data flows for process improvement opportunities. Prepares a variety of reports and reviews system specifications and data interfaces to identify irregularities and troubleshoot issues. Acts as systems/technical point-of-contact for the HR and Payroll team. Focuses on initiatives to automate and streamline system analysis, data integration and reporting capabilities. Responsible to be current on Payroll and HR law.
SUPERVISION RECEIVED: Receives supervision from the Chief Financial Officer SUPERVISION EXERCISED: Payroll Specialists, Benefits Specialist, and Benefits Technician DUTIES AND RESPONSIBILITIES: Disclaimer – This list is meant to be representative, not exhaustive. Some incumbents may not perform all the duties listed or may perform related duties as assigned. Reasonable accommodations may be made to enable individuals with disabilities to perform essential functions. A. Essential Job Specific Duties:
Payroll/HRIS Responsibilities 1. Manages the Payroll function for the CAPK bi-weekly payroll which includes timely and
accurate payments to CAPK employees. Ensures proper time recording procedures are in place. Manages time and attendance system and transfer of data to payroll. Manage payroll adjustments.
2. Responsible for proper accrual tracking and pay-outs of vacation time, sick leave and/or floating holiday when required. Ensures timely processing of termination checks. Ensures accurate payroll deductions including state and federal taxes, benefit deductions, garnishments etc.
3. Ensure that all local, state, and government laws relating to the payment of employees are followed. Responsible for payroll tax reports and paying the employer’s share of applicable taxes.
214

2
4. Acts as primary Administrator for all HR software systems and is the primary point of contact for the HRIS/ADP systems.
5. Responsible for all ADP software integration of the HRIS system: Benefits, Time & Attendance, Recruitment, Background Checks, Compensation, Performance Evaluations, Organizational Structure in ADP and other applications that may be added.
6. Assists in the review, testing and implementation of HRIS/ADP system upgrades or patches. Collaborates with functional and technical staff to coordinate application of upgrades or fix. Maintain HRIS/ADP system tables.
7. Researches and resolves HRIS/ADP problems, unexpected results or process flaws; perform scheduled activities; recommends solutions or alternate methods to meet requirements.
8. Guides and trains staff in tasks, data entry and HRIS/ADP system functions. Trains and guides users in utilizing HRIS/ADP and Time and Attendance. Documents processes/procedures for department use. Creates training documents for ADP Time & Attendance, Performance Evaluation tool and other documentation that employees are required to use.
9. Liaison with third parties and other stakeholders, e.g. payroll, benefit vendors, etc. Works to resolve any billing issues in regards to payroll and benefits. Maintain awareness of current trends in HRIS/ADP with a focus on product and service development, delivery and support, and applying key technologies.
10. Ensure confidentiality of employee, business, HRIS and other sensitive data. Represents CAPK at required trainings/meetings as requested.
11. Special projects as assigned.
Other Job Specific Duties: ADP HRIS 1. Ensures that key metric reports are developed and implemented in a timely manner and
ensures that high quality data is presented in a logical and understandable format for the user.
2. Manages day-to-day reporting requests, while maintaining various tables/codes in the system.
3. Ensures data integrity and identifies opportunities for improvement. 4. Detects, troubleshoots, and resolves data anomalies in a time critical environment. 5. Identifies issues and initiates resolution. Generates reports from HRIS/ADP and/or other
systems to assist in compensation analysis. 6. Supports the annual performance management program including annual merit increases
and tracking of performance reviews. 7. Recommends process/customer service improvements, innovative solutions, policy changes
and/or major variations from established policy that must be approved by appropriate leadership prior to implementation.
8. Assists with various surveys by retrieving the appropriate data, completes survey questionnaires, and coordinates with survey vendors.
9. Special projects, as assigned. Benefits Management 1. Administers employee medical, dental, vision, life and AD&D insurance plans and
retirement. Acts as an information resource on employee benefits and coverage. 2. Review enrollments, changes, cancellations and COBRA notifications. Ensures employees
pay proper insurance premiums based on employee status. Ensure reminder notices for insurance premiums to employees on leave are submitted. Ensure regular communication with employees on leave regarding insurance contribution obligations.
3. Manages all tasks related to employee leaves including tracking leaves, determining
215
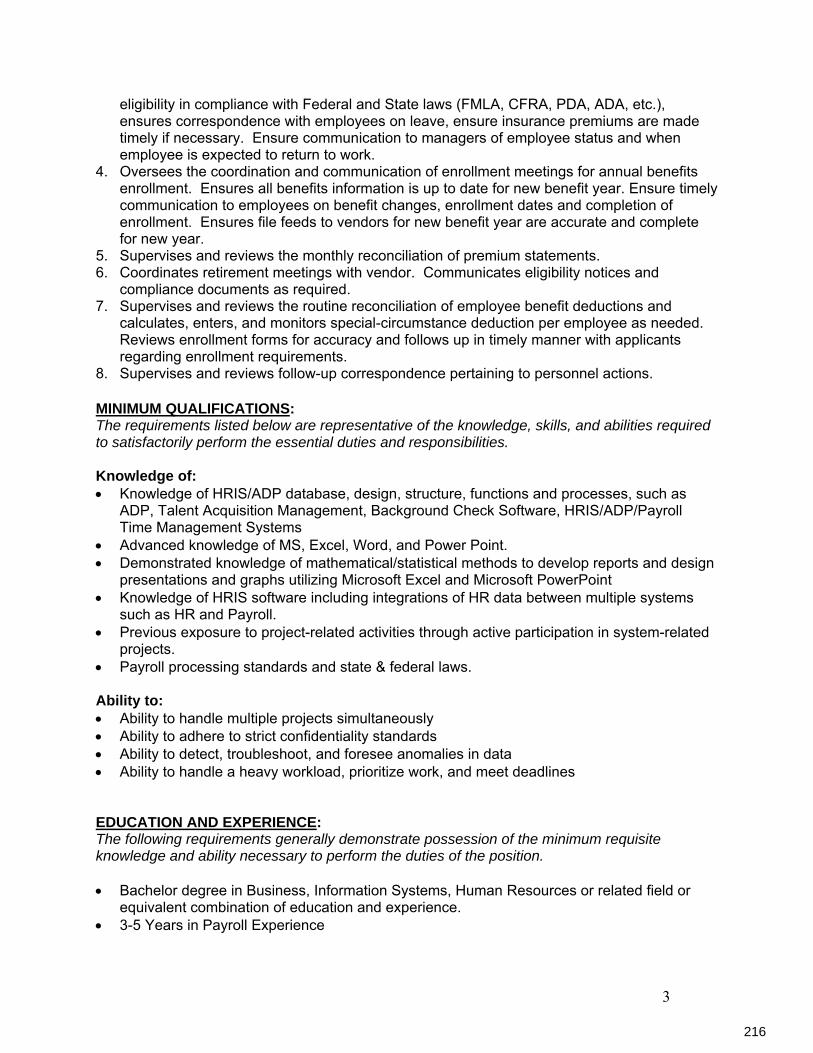
3
eligibility in compliance with Federal and State laws (FMLA, CFRA, PDA, ADA, etc.), ensures correspondence with employees on leave, ensure insurance premiums are made timely if necessary. Ensure communication to managers of employee status and when employee is expected to return to work.
4. Oversees the coordination and communication of enrollment meetings for annual benefits enrollment. Ensures all benefits information is up to date for new benefit year. Ensure timely communication to employees on benefit changes, enrollment dates and completion of enrollment. Ensures file feeds to vendors for new benefit year are accurate and complete for new year.
5. Supervises and reviews the monthly reconciliation of premium statements. 6. Coordinates retirement meetings with vendor. Communicates eligibility notices and
compliance documents as required. 7. Supervises and reviews the routine reconciliation of employee benefit deductions and
calculates, enters, and monitors special-circumstance deduction per employee as needed. Reviews enrollment forms for accuracy and follows up in timely manner with applicants regarding enrollment requirements.
8. Supervises and reviews follow-up correspondence pertaining to personnel actions. MINIMUM QUALIFICATIONS: The requirements listed below are representative of the knowledge, skills, and abilities required to satisfactorily perform the essential duties and responsibilities. Knowledge of:
Knowledge of HRIS/ADP database, design, structure, functions and processes, such as ADP, Talent Acquisition Management, Background Check Software, HRIS/ADP/Payroll Time Management Systems
Advanced knowledge of MS, Excel, Word, and Power Point. Demonstrated knowledge of mathematical/statistical methods to develop reports and design
presentations and graphs utilizing Microsoft Excel and Microsoft PowerPoint Knowledge of HRIS software including integrations of HR data between multiple systems
such as HR and Payroll. Previous exposure to project-related activities through active participation in system-related
projects. Payroll processing standards and state & federal laws. Ability to:
Ability to handle multiple projects simultaneously
Ability to adhere to strict confidentiality standards
Ability to detect, troubleshoot, and foresee anomalies in data
Ability to handle a heavy workload, prioritize work, and meet deadlines
EDUCATION AND EXPERIENCE: The following requirements generally demonstrate possession of the minimum requisite knowledge and ability necessary to perform the duties of the position. Bachelor degree in Business, Information Systems, Human Resources or related field or
equivalent combination of education and experience. 3-5 Years in Payroll Experience
216

4
Minimum of three years of functional experience in Human Resources HRIS software and/or Three years’ experience with ADP HRIS System is required
2-3 Years of Benefits Management Experience Five years experience with progressive responsibility, including personnel functions and
supervision Certified Payroll Professional (CPP) is desired OTHER REQUIREMENTS Possession of a valid California Driver’s License and State automobile insurance, and
acceptable driving record substantiated by a DMV printout. Completion of a physical and substance abuse screening upon offer of employment. WORK ENVIRONMENT: The work environment characteristics described are representative of those an employee encounters in performing the essential functions of this job. Work is primarily performed indoors. Noise level is quiet to moderately quiet. Hazards are minimal. ESSENTIAL PHYSICAL DEMANDS: The physical demands described here are representative of those that must be met by an employee to successfully perform the essential functions of the job. Reasonable accommodations may be made to enable employees with disabilities to perform the essential duties.
POSITION TITLE Payroll/HRIS Administrator
ACTIVITY
(HOURS PER DAY)
NEVER 0 HOURS
OCCASIONALLY UP TO 4 HOURS
FREQUENTLY 4-8 HOURS
Sitting x Walking x Standing x Bending (neck) x Bending (waist) x Squatting X Climbing x Kneeling X Crawling x Twisting (neck) x Twisting Waist x Is repetitive use of hand required? x Simple Grasping (right hand) x
217

5
Simple Grasping (left hand) x Power Grasping (right hand) X Power Grasping (left hand) X Fine Manipulation (right hand) x Fine Manipulation (left hand) x Pushing & Pulling (right hand) x Pushing &Pulling (left hand) x Reaching (above shoulder level) x Reaching (below shoulder level) x
LIFTING CARRYING
NEVER 0 HOURS
OCCASIONALLY UP TO 4 HOURS
FREQUENTLY 4-8 HOURS
NEVER 0 HOURS
OCCASIONALLY UP TO 4 HOURS
FREQUENTLY 4-8 HOURS
0-10 lbs x x 11-25 lbs x x 26-50 lbs x x 51-75 lbs x x
76-100 lbs x x 100lbs+ x
218

MEMORANDUM
TO:
FROM:
DATE:
RE:
Budget & Finance Committee
Tracy Webster, Chief Financial Officer
November 13, 2019
Agenda Item 5d: Federal Financial Report – Info Item
Head Start guidelines require that Standard SF-425 – Federal Financial Report (FFR) be used by grantees to report financial data at three intervals (semi-annual, annual, and final).
The following semi-annual FFR was filed:
San Joaquin EHS : #09CH010071-05 (2/1/19 – 1/31/20)
The following annual FFR was filed:
EHS Partnership – Kern : #09HP0036-04 (9/1/18 – 8/31/19)
Attached is the annual and final Federal Financial Report that was uploaded to the Grant Solutions system before the October 30, 2019, deadline.
Attachment: SF-425 Federal Financial Report – San Joaquin EHS – (Semi-Annual) SF-425 Federal Financial Report – EHS Partnership – Kern (Annual)
219

220

221

222

MEMORANDUM
TO: Budget & Finance Committee
FROM: Tracy Webster, Chief Financial Officer
DATE: November 13, 2019
RE: Agenda Item 5x: Proposed Budget & Finance Committee Agenda Restructure – Action Item
During the prior Budget & Finance Committee meeting, it was requested that the agenda be formatted to add a Consent section and a Special Presentation section. Accordingly, staff has drafted a proposed restructure of the Budget & Finance Committee agenda. The Special Presentation section would be utilized to review individual programs and their budgets. For the Consent Section, Committee Members would be asked to approve all the items listed in Consent. However, if a member of the Committee or of the public asks that an item be removed from the consent agenda the items must be considered and discussed separately. The proposed schedule for Special Presentation would be as follows:
1. 2-1-1 Services 2. Coordinated Entry Services 3. Energy Department (LIHEAP, DOE, and DAP) 4. CSBG 5. VITA 6. Shafter Youth Center 7. Friendship House 8. Food Bank 9. Women, Infants & Children (WIC) 10. Central Kitchen (CACFP) 11. Head Start 12. CDE funded childcare (CSPP, CCTR, CMIG, CMSS) 13. Migrant Alternative Payment (CMAP) 14. Americorps 15. Cal Fresh Healthy Living 16. East Kern Family Resource Center
223

Items that are proposed to remain in New Business will include the following:
1. Head Start and Early Head Start Budget to Actual 2. Resolutions to approved submissions of new funding 3. Resolutions to approved continued funding of existing programs 4. Revisions to the Accounting and Financial Policies and Procedures 5. Chief Financial Officer Report
a. Discretionary Fund Update b. Financial Statements
Items that are proposed to move to Consent include the following:
1. Application status reports and funding requests 2. Awards of contract based on competitive RFP 3. Consultant agreements
Recommendation:
Staff recommends the revised agenda format and committee recommendation is submitted to the Board for review and discussion.
Attachment: Proposed Budget & Finance Committee Meeting Agenda format
224

COMMUNITY ACTION PARTNERSHIP of KERN BOARD OF DIRECTORS
BUDGET & FINANCE COMMITTEE MEETING 5005 Business Park North, Bakersfield, CA
DATE 12:00 pm
AGENDA
1. Call to Order
2. Roll Call
Board Member Names
3. Approval of Agenda 4. Public Forum: (The public may address the committee on items not on the agenda. Speakers are limited to
3 minutes. If more than one person wishes to address the same topic, the total group time for the topic will be 10 minutes. Please state your name before making your presentation.)
5. New Business
a. Head Start and Early Head Start Budget to Actual Reports – Info Item
b. Resolution to Approve the Submission of the New Funding – Action Item c. Application for Continued Funding of Existing Program with Resolution – Action Item
d. Chief Financial Officer Report:
i. Discretionary Fund Update – Info Item
ii. Financial Statements, August 2019 - Action Item
7. Consent: (The Board will be asked to approve all of the following items by a single vote, unless a member
of the Board or of the public asks that an item be removed from the consent agenda and considered and discussed separately.)
a. Application Status Report and Funding Requests
b. Award of Contracts Based on Competitive RFP
c. Consultant Agreements
8. Committee Member Comments
9. Next Scheduled Meeting
Budget & Finance Committee Meeting DATE 12:00 p.m. 5005 Business Park North Bakersfield, California 93309
225

Community Action Partnership of Kern Budget & Finance Committee Meeting Agenda DATE Page 2 of 2 10. Adjournment
This is to certify that this Agenda notice was posted in the lobby of the CAPK Administrative Office at 5005 Business Park North, Bakersfield, and online at www.capk.org by 9:00 am on DATE. Paula Daoutis, Administrative Coordinator.
226
COMMUNITY ACTION PARTNERSHIP OF KERN
MEMORANDUM
To: Budget & Finance Committee
From: Pritika Ram, Director of Administration
Date: November 13, 2019
Subject: Agenda Item 5f: Resolution to Approve the Submission of the 2020 Community
Service Block Grant (CSBG) Contract Number 20F-3015 from the Department of
Community Services and Development – Action Item
Attached is the Community Services Block Grant (CSBG) Resolution and Contract. The contract term is January 1, 2020 through December 31, 2021. The 2020 estimated CSBG award for CAPK is $1,489,531. The contract was received on November 7, 2019 and staff is currently working on the 2020 budget detail to be submitted with the contract, which is due thirty (30) calendar days from the date of the letter (November 7, 2019), for private non-profit agencies. A comprehensive budget will be submitted to the full Board of Directors once it is completed. CSBG is CAPK’s only funding source that allows the flexibility to support multiple low-income programs as well as administration. As with contracts in previous years, our 2020 CSBG contract will be used to support programs that serve areas of great need, but that have significant program and administrative funding gaps, such as Food Bank, VITA, Friendship House Community Center, Shafter Youth Center, and 2-1-1. The attached Resolution #2019-22 provides authority to Chief Executive Officer, Jeremy T. Tobias, to sign the 2020 CSBG contract on behalf of the agency and to execute any amendments to the contract over the contract term. Recommendation: Staff recommends the Board of Directors approve Resolution Number 2019-22 to approve the 2020 Community Service Block Grant (CSBG) Contract (20F-3015) from the Department of Community Services and Development. Attachments: Resolution Number 2019-22 CSBG Contract #20F-3015
227

RESOLUTION # 2019-22
A Resolution of the Board of Directors of Community Action Partnership of Kern
Approving the Submission of the 2020 CSBG Contract The Board of Directors of Community Action Partnership of Kern located at 5005 Business Park North, Bakersfield, CA 93309, met on November 20, 2019 in Bakersfield, California at a scheduled Board meeting and resolved as follows: WHEREAS, Community Action Partnership of Kern (CAPK) is a private, non-profit corporation established as a result of the Economic Opportunity Act of 1964, and is the federally designated community action agency serving the low-income, elderly and disadvantaged residents of Kern County; and WHEREAS, CAPK is charged with the responsibility of continuing the battle to alleviate poverty in Kern County by developing and implementing creative and innovative programs, and has adopted the philosophical position of “Helping People, Changing Lives” in its quest to assist people in need, and families with minimal or no resources; and WHEREAS, CAPK Board of Directors has determined that there is a need for anti-poverty programs to meet the needs of the low-income residents in the County of Kern; and WHEREAS, the State of California Department of Community Services and Development has offered a 2020 CSBG Contract to the Partnership; and WHEREAS, the State of California Department of Community Services and Development requires that an authorized signatory be named for the 2020 CSBG Contract and the CAPK Board of Directors has designated Jeremy T. Tobias, Chief Executive Officer, as the official representative and signatory of CAPK; and NOW, THEREFORE, be it resolved that the CAPK Board of Directors hereby authorizes staff to submit an application to the State of California Department of Community Services and Development, and hereby requests the State of California Department of Community Services and Development provide financial assistance and the obligations that accompany said funds for the purpose of poverty fighting programs in Kern County. Be it further resolved that Jeremy T. Tobias, Chief Executive Officer, is hereby authorized to request this course of action by completing any and all application documents for submittal to the State of California Department of Community Services and Development on behalf of Community Action Partnership of Kern. APPROVED by a majority vote of the Board of Directors of Community Action Partnership of Kern, this 20th day of November 2019. __________________________ ____________________ Curtis Floyd, Chair Date CAPK Board of Directors
228

COMMUNITY ACTION PARTNERSHIP OF KERN
MEMORANDUM
To: Budget & Finance Committee
From: Carmen Segovia, Director of Health & Nutrition
Date: November 13, 2019
Subject: Agenda Item 5g: Resolution to Approve the Submission of the California Coastal Commission Whale Tail Application for the Real-Life Eco-Column Project at the Friendship House Community Center and Shafter Youth Center – Action Item
Background CAPK is requesting $15,000 from the California Coastal Commission to provide youth at the Friendship House Community Center and Shafter Youth Center with education pertaining to the eco-system. Staff will implement the Real-Life Eco-Column Project which will educate youth on how organisms interact with one another in their environments through an 11-lesson course. The program will provide fun educational activities and interactive experiences to teach children and youth the importance of the ocean in maintaining the eco-system. The children and youth will then continue with a visit to Hearst Castle located 5 miles away from the beach cleanup site at San Simeon, CA and learn its history and the Castle’s restoration initiatives and how a clean ocean helps support them and our environment.
Recommendation
Staff recommends the Board of Directors approve with resolution, the submission of the California Coastal Commission Whale Tail Application for the Youth Centers Real-Life Eco Column Project. Attachment: Resolution Number 2019-23
229

RESOLUTION # 2019-23
A Resolution of the Board of Directors of the Community Action Partnership of Kern
Approving the Submission of Application for the 2019-2020 California Coastal Commission Whale Tail Program
The Board of Directors of Community Action Partnership of Kern, located at 5005 Business Park North, Bakersfield, CA 93309 met on November 29, 2019 at a scheduled Board meeting located at 5005 Business Park North, Bakersfield, CA 93309, and resolved as follows: WHEREAS, Community Action Partnership of Kern (CAPK) is a private, non-profit 501(c)(3) corporation established as a result of the Economic Opportunity Act of 1964, and is the federally designated community action agency serving the low-income, elderly and disadvantaged residents of the City of Bakersfield; and WHEREAS, CAPK is charged with the responsibility of continuing the battle to alleviate poverty in Bakersfield by developing and implementing creative and innovative programs, and has adopted the philosophical position of “Helping People, Changing Lives,” in its quest to assist people in need, and families with minimal or no resources; and WHEREAS, CAPK Board of Directors has determined that there is a need for anti-poverty programs to meet the needs of the low-income residents of the City of Bakersfield, and WHEREAS, CAPK is requesting $15,000 from the California Coastal Commission to provide education to youth from Friendship House Community Center and Shafter Youth Center about the importance of maintaining the ocean eco-system, a field trip to participate in a beach cleanup event, and a visit to Hearst Castle to learn about the history and restoration initiatives; and NOW, THEREFORE, be it resolved that the CAPK Board of Directors hereby authorizes staff to submit an application to the California Coastal Commission and authorize Jeremy T. Tobias, Chief Executive Officer, to complete any and all application documents for submittal to the California Coastal Commission Whale Tail Program on behalf of Community Action Partnership of Kern. APPROVED by a majority vote of the Directors of the Community Action Partnership of Kern, this 20th day of November 2019.
__________________________ ____________________ Curtis Floyd, Chair Date CAPK Board of Directors
230

03/01/19- 10/01/19 - 09/30/19 10/31/19 TOTAL
BEGINNING BALANCE (NOTE 1) 525,604.38$ -$ 525,604.38$
CASH RECEIPTS
2019 Awards Banquet Donations 49,981.86 - 49,981.86 aDonations 1,779.41 60.00 1,839.41 Misc. Rev enue 2,770.08 80.00 2,850.08 Interest Income/Union Administrativ e Fee 697.97 - 697.97
TOTAL CASH RECEIPTS 55,229.32 140.00 55,369.32
CASH DISBURSEMENTS
Line of Credit Interest Expense - - - Line of Credit Unused Commitment Fee 3,763.85 - 3,763.85 b2019 Awards Banquet Expenses 26,648.61 - 26,648.61 aSupplies 1,563.81 - 1,563.81 Volunteer Appreciation - - - cFundraising Expenses - - - Property Taxes - Campus Vacant Parcels - 2,250.35 2,250.35 Miscellaneous Expenses 6,181.50 84.15 6,265.65 Indirect 427.40 225.04 652.44
TOTAL CASH DISBURSEMENTS 38,585.17 2,559.54 41,144.71
CASH PROVIDED (USED) 16,644.15 (2,419.54) 14,224.61
ENDING BALANCE 542,248.53$ 539,828.99$
Discretionary Cash 206,248.00$ Fund Raising Cash 333,580.99
539,828.99 Add: Prepaid -
Less: AP539,828.99$
NOTES
1. For the y ear ended 2/28/19, the net increase to the Discretionary /Fund Raising Funds was $48,148.08.
a. As of 08/31/19, net 2019 awards banquet gain is $28,833.25 (FYE 2/28/19 = $5,500.00 + $49,981.86 - $26,648.61 expenses f or 2019/20).
b. Commitment f ee f or the period 12/31/18 to 9/30/19 that the $2 million line of credit is equal to one-quarter percent (0.25%) per annum based on a 360 day y ear.
c. Annual appreciation expense f or the VITA v olunteers.
Date Prepared: 11/04/2019
COMMUNITY ACTION PARTNERSHIP OF KERN
DISCRETIONARY AND FUND RAISING FUNDS
FOR THE MONTH ENDED OCTOBER 31, 2019
231

COMMUNITY ACTION PARTNERSHIP OF KERN
BUDGET AND FINANCE COMMITTEE
NOVEMBER 13, 2019
FINANCIAL REPORT
TABLE OF CONTENTS
Pages (s)
A. Schedule of Programs for the period March 1, 2019 through February 29, 2020 A1 ‐ A5
B. Functional Classification by Fund B1 ‐ B2
C. Line of Credit Summary C1
D. ‐ Cash Summary as of October 31, 2019 D1
‐ Bank Reconciliations D2 ‐ D6
E. Wells Fargo Visa Summary and Statements E1 ‐ E17
F. Central Kitchen Budget to Actual October 31, 2019 F1
G. State Department of Education Contract ‐ Earned Revenue G1 ‐ G2
H. Finance Division Monthly Report H1
I. Financial Statements as of February 28, 2019 I1
J. Financial Statements as of October 31, 2019 J1
K. Agency‐wide Budget to Actual as of October 31, 2019 K1 ‐ K7
L. Indirect Fund Budget To Actual as of October 31, 2019 L1
SECTION
232
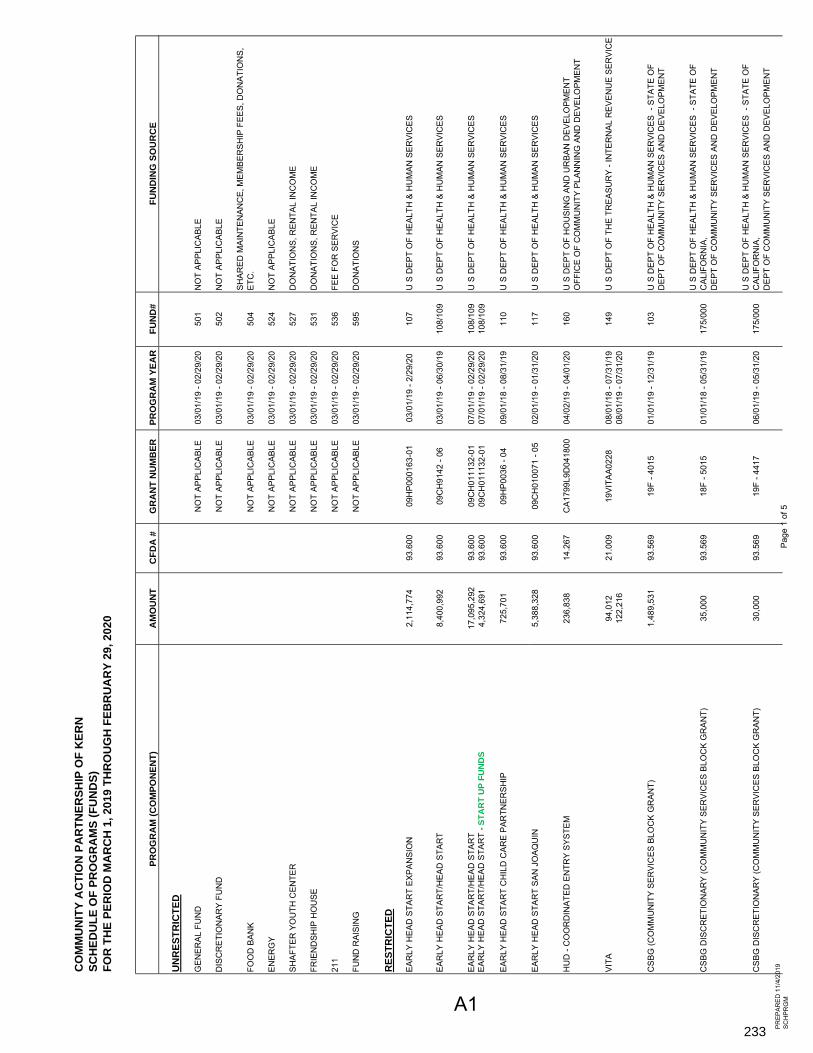
CO
MM
UN
ITY
AC
TIO
N P
AR
TN
ER
SH
IP O
F K
ER
N
SC
HE
DU
LE
OF
PR
OG
RA
MS
(F
UN
DS
)
FO
R T
HE
PE
RIO
D M
AR
CH
1,
20
19
TH
RO
UG
H F
EB
RU
AR
Y 2
9,
20
20
PR
OG
RA
M (
CO
MP
ON
EN
T)
AM
OU
NT
CF
DA
#G
RA
NT
NU
MB
ER
PR
OG
RA
M Y
EA
RF
UN
D#
FU
ND
ING
SO
UR
CE
UN
RE
ST
RIC
TE
D
GEN
ERAL
FU
ND
NO
T AP
PLIC
ABLE
03/0
1/19
- 02
/29/
2050
1N
OT
APPL
ICAB
LE
DIS
CR
ETIO
NAR
Y FU
ND
NO
T AP
PLIC
ABLE
03/0
1/19
- 02
/29/
2050
2N
OT
APPL
ICAB
LE
FOO
D B
ANK
NO
T AP
PLIC
ABLE
03/0
1/19
- 02
/29/
2050
4SH
ARED
MAI
NTE
NAN
CE,
MEM
BER
SHIP
FEE
S, D
ON
ATIO
NS,
ET
C.
ENER
GY
NO
T AP
PLIC
ABLE
03/0
1/19
- 02
/29/
2052
4N
OT
APPL
ICAB
LE
SHAF
TER
YO
UTH
CEN
TER
NO
T AP
PLIC
ABLE
03/0
1/19
- 02
/29/
2052
7D
ON
ATIO
NS,
REN
TAL
INC
OM
E
FRIE
ND
SHIP
HO
USE
NO
T AP
PLIC
ABLE
03/0
1/19
- 02
/29/
2053
1D
ON
ATIO
NS,
REN
TAL
INC
OM
E
211
NO
T AP
PLIC
ABLE
03/0
1/19
- 02
/29/
2053
6FE
E FO
R S
ERVI
CE
FUN
D R
AISI
NG
NO
T AP
PLIC
ABLE
03/0
1/19
- 02
/29/
2059
5D
ON
ATIO
NS
RE
ST
RIC
TE
D
EAR
LY H
EAD
STA
RT
EXPA
NSI
ON
2,11
4,77
493
.600
09H
P000
163-
0103
/01/
19 -
2/29
/20
107
U S
DEP
T O
F H
EALT
H &
HU
MAN
SER
VIC
ES
EAR
LY H
EAD
STA
RT/
HEA
D S
TAR
T8,
400,
992
93.6
0009
CH
9142
- 06
03/0
1/19
- 06
/30/
1910
8/10
9U
S D
EPT
OF
HEA
LTH
& H
UM
AN S
ERVI
CES
EAR
LY H
EAD
STA
RT/
HEA
D S
TAR
T17
,095
,292
93.6
0009
CH
0111
32-0
107
/01/
19 -
02/2
9/20
108/
109
U S
DEP
T O
F H
EALT
H &
HU
MAN
SER
VIC
ES
EAR
LY H
EAD
STA
RT/
HEA
D S
TAR
T - S
TA
RT
UP
FU
ND
S4,
324,
691
93.6
0009
CH
0111
32-0
107
/01/
19 -
02/2
9/20
108/
109
EAR
LY H
EAD
STA
RT
CH
ILD
CAR
E PA
RTN
ERSH
IP
725,
701
93.6
0009
HP0
036
- 04
09/0
1/18
- 08
/31/
1911
0U
S D
EPT
OF
HEA
LTH
& H
UM
AN S
ERVI
CES
EAR
LY H
EAD
STA
RT
SAN
JO
AQU
IN5,
388,
328
93.6
0009
CH
0100
71 -
0502
/01/
19 -
01/3
1/20
117
U S
DEP
T O
F H
EALT
H &
HU
MAN
SER
VIC
ES
HU
D -
CO
OR
DIN
ATED
EN
TRY
SYST
EM23
6,83
814
.267
CA1
799L
9D04
1800
04/0
2/19
- 04
/01/
2016
0U
S D
EPT
OF
HO
USI
NG
AN
D U
RBA
N D
EVEL
OPM
ENT
OFF
ICE
OF
CO
MM
UN
ITY
PLAN
NIN
G A
ND
DEV
ELO
PMEN
T
VITA
94,0
1221
.009
19VI
TAA0
228
08/0
1/18
- 07
/31/
1914
9U
S D
EPT
OF
THE
TREA
SUR
Y - I
NTE
RN
AL R
EVEN
UE
SER
VIC
E12
2,21
608
/01/
19 -
07/3
1/20
CSB
G (C
OM
MU
NIT
Y SE
RVI
CES
BLO
CK
GR
ANT)
1,48
9,53
193
.569
19F
- 401
501
/01/
19 -
12/3
1/19
103
U S
DEP
T O
F H
EALT
H &
HU
MAN
SER
VIC
ES -
STA
TE O
F D
EPT
OF
CO
MM
UN
ITY
SER
VIC
ES A
ND
DEV
ELO
PMEN
T
CSB
G D
ISC
RET
ION
ARY
(CO
MM
UN
ITY
SER
VIC
ES B
LOC
K G
RAN
T)35
,000
93.5
6918
F - 5
015
01/0
1/18
- 05
/31/
1917
5/00
0U
S D
EPT
OF
HEA
LTH
& H
UM
AN S
ERVI
CES
- S
TATE
OF
CAL
IFO
RN
IA,
DEP
T O
F C
OM
MU
NIT
Y SE
RVI
CES
AN
D D
EVEL
OPM
ENT
CSB
G D
ISC
RET
ION
ARY
(CO
MM
UN
ITY
SER
VIC
ES B
LOC
K G
RAN
T)30
,000
93.5
6919
F - 4
417
06/0
1/19
- 05
/31/
2017
5/00
0U
S D
EPT
OF
HEA
LTH
& H
UM
AN S
ERVI
CES
- S
TATE
OF
CAL
IFO
RN
IA,
DEP
T O
F C
OM
MU
NIT
Y SE
RVI
CES
AN
D D
EVEL
OPM
ENT
A1
PREP
ARED
11/
4/20
19SC
HPR
GM
Page
1 o
f 5
233

CO
MM
UN
ITY
AC
TIO
N P
AR
TN
ER
SH
IP O
F K
ER
N
SC
HE
DU
LE
OF
PR
OG
RA
MS
(F
UN
DS
)
FO
R T
HE
PE
RIO
D M
AR
CH
1,
20
19
TH
RO
UG
H F
EB
RU
AR
Y 2
9,
20
20
PR
OG
RA
M (
CO
MP
ON
EN
T)
AM
OU
NT
CF
DA
#G
RA
NT
NU
MB
ER
PR
OG
RA
M Y
EA
RF
UN
D#
FU
ND
ING
SO
UR
CE
CSB
G D
ISC
RET
ION
ARY
RID
GEC
RES
T EA
RTH
QU
AKE
RES
PON
SE17
7,01
893
.569
19F
- 446
309
/01/
19-0
3/31
/20
175/
032
U S
DEP
T O
F H
EALT
H &
HU
MAN
SER
VIC
ES -
STA
TE O
F C
ALIF
OR
NIA
, (C
OM
MU
NIT
Y SE
RVI
CES
BLO
CK
GR
ANT)
DEP
T O
F C
OM
MU
NIT
Y SE
RVI
CES
AN
D D
EVEL
OPM
ENT
LIH
EAP
(LO
W-IN
CO
ME
HO
ME
ENER
GY
ASSI
STAN
CE
PRO
GR
AM)
3,72
1,75
093
.568
18B
- 401
210
/01/
17 -
07/3
1/19
122-
38U
S D
EPT
OF
HEA
LTH
& H
UM
AN S
ERVI
CES
- S
TATE
OF
9,61
5,84
919
B - 5
012
10/0
1/18
- 06
/30/
2012
2-39
DEP
T O
F C
OM
MU
NIT
Y SE
RVI
CES
AN
D D
EVEL
OPM
ENT
4,41
5,99
120
B - 2
012
10/0
1/19
- 06
/30/
2112
2-30
DO
E 1,
364,
399
81.0
4217
C-4
010
06/0
1/18
- 06
/30/
2012
3-65
U S
DEP
T O
F H
EALT
H &
HU
MAN
SER
VIC
ES -
STA
TE O
F C
ALIF
OR
NIA
, D
EPT
OF
CO
MM
UN
ITY
SER
VIC
ES A
ND
DEV
ELO
PMEN
T
GEN
ERAL
CEN
TER
CH
ILD
CAR
E60
0,08
593
.575
CC
TR -
8049
07/0
1/18
- 06
/30/
1925
3U
S D
EPT
OF
HEA
LTH
& H
UM
AN S
ERVI
CES
- ST
ATE
OF
CAL
IFO
RN
IA,
600,
085
93.5
75C
CTR
- 90
5007
/01/
19 -
06/3
0/20
DEP
T O
F ED
UC
ATIO
N
GEN
ERAL
CEN
TER
CH
ILD
CAR
E27
5,85
593
.596
CC
TR -
8049
07/0
1/18
- 06
/30/
1925
3U
S D
EPT
OF
HEA
LTH
& H
UM
AN S
ERVI
CES
- ST
ATE
OF
CAL
IFO
RN
IA,
275,
855
93.5
96C
CTR
- 90
5007
/01/
19 -
06/3
0/20
DEP
T O
F ED
UC
ATIO
N
MIG
RAN
T AL
TER
NAT
IVE
PAYM
ENT
5,41
1,00
093
.575
CM
AP -
8000
07/0
1/18
- 06
/30/
1926
1U
S D
EPT
OF
HEA
LTH
& H
UM
AN S
ERVI
CES
- ST
ATE
OF
CAL
IFO
RN
IA,
5,41
1,00
093
.575
CM
AP -
9000
07/0
1/19
- 06
/30/
20D
EPT
OF
EDU
CAT
ION
CAL
IFO
RN
IA S
TATE
PR
ESC
HO
OL
PRO
GR
AM16
4,08
193
.575
CSP
P - 8
120
07/0
1/18
- 06
/30/
1925
8U
S D
EPT
OF
HEA
LTH
& H
UM
AN S
ERVI
CES
- ST
ATE
OF
CAL
IFO
RN
IA,
164,
081
93.5
75C
SPP
- 912
107
/01/
19 -
06/3
0/20
DEP
T O
F ED
UC
ATIO
N
CAL
IFO
RN
IA S
TATE
PR
ESC
HO
OL
PRO
GR
AM35
7,24
793
.596
CSP
P - 8
120
07/0
1/18
- 06
/30/
1925
8U
S D
EPT
OF
HEA
LTH
& H
UM
AN S
ERVI
CES
- ST
ATE
OF
CAL
IFO
RN
IA,
357,
247
93.5
96C
SPP
- 912
107
/01/
19 -
06/3
0/20
DEP
T O
F ED
UC
ATIO
N
NEO
PB C
AL F
RES
H H
EALT
HY
LIVI
NG
1,49
1,99
810
.561
19-1
0324
10/0
1/19
- 09
/30/
2014
5U
S D
EPT
OF
AGR
ICU
LTU
RE
- STA
TE O
F C
ALIF
OR
NIA
DEP
T O
F PU
BLIC
HEA
LTH
, NU
TRIT
ION
ED
UC
ATIO
N A
ND
O
BESI
TY P
REV
ENTI
ON
BRAN
CH
ECO
NO
MIC
EM
POW
ERM
ENT
85,6
5593
.590
EE -
KER
N -
17 -
2007
/01/
18 -
06/3
0/19
171
U S
DEP
T O
F H
EALT
H &
HU
MAN
SER
VIC
ES -
STAT
E O
F C
ALIF
OR
NIA
,D
EPT
OF
SOC
IAL
SER
VIC
ES, O
FFIC
E O
F C
HIL
D A
BUSE
PR
EVEN
TIO
N
211
HO
SPIT
AL P
REP
ARED
NES
S PR
OG
RAM
- EM
ERG
ENC
Y R
ESPO
NSE
& S
UR
GE
10,0
0093
.074
659
- 201
7PE
ND
ING
186
U S
DEP
T O
F H
EALT
H &
HU
MAN
SER
VIC
ES -
STAT
E O
F C
ALIF
OR
NIA
,D
EPT
OF
HEA
LTH
SER
VIC
ES, C
OU
NTY
OF
KER
N, D
EPT
OF
PUBL
IC H
EALT
H
EFAP
(EM
ERG
ENC
Y FO
OD
ASS
ISTA
NC
E PR
OG
RAM
)12
1,90
610
.568
/.569
15 -
MO
U -
0011
810
/01/
18 -
09/3
0/19
105/
111
U S
DEP
T O
F AG
RIC
ULT
UR
E -
STAT
E O
F C
ALIF
OR
NIA
, D
EPT
OF
SOC
IAL
SER
VIC
ES
A2
PREP
ARED
11/
4/20
19SC
HPR
GM
Page
2 o
f 5
234

CO
MM
UN
ITY
AC
TIO
N P
AR
TN
ER
SH
IP O
F K
ER
N
SC
HE
DU
LE
OF
PR
OG
RA
MS
(F
UN
DS
)
FO
R T
HE
PE
RIO
D M
AR
CH
1,
20
19
TH
RO
UG
H F
EB
RU
AR
Y 2
9,
20
20
PR
OG
RA
M (
CO
MP
ON
EN
T)
AM
OU
NT
CF
DA
#G
RA
NT
NU
MB
ER
PR
OG
RA
M Y
EA
RF
UN
D#
FU
ND
ING
SO
UR
CE
TRAD
E M
ITIG
ATIO
N B
ON
US
OFF
ERIN
G$2
,000
PER
TR
UC
K10
/1/1
8 - 0
9/30
/19
106
U S
DEP
T O
F AG
RIC
ULT
UR
E -
STAT
E O
F C
ALIF
OR
NIA
, LO
ADD
EPT
OF
SOC
IAL
SER
VIC
ES
CSF
P (C
OM
MO
DIT
Y SU
PPLE
MEN
TAL
FOO
D P
RO
GR
AM)
306,
543
10.5
6516
- 60
1710
/01/
18 -
09/3
0/19
147
U S
DEP
T O
F AG
RIC
ULT
UR
E - S
TATE
OF
CAL
IFO
RN
IA,
DEP
T O
F SO
CIA
L SE
RVI
CES
CH
ILD
AN
D A
DU
LT C
ARE
FOO
D P
RO
GR
AM (C
ACFP
) - K
ERN
& S
AN J
OAQ
UIN
BASE
D O
N
10.5
5815
- 12
48 -
OJ
10/0
1/18
- 09
/30/
1911
2/13
9U
S D
EPT
OF
AGR
ICU
LTU
RE
- STA
TE O
F C
ALIF
OR
NIA
, M
EALS
SER
VED
DEP
T O
F ED
UC
ATIO
N
WIC
(WO
MEN
, IN
FAN
TS &
CH
ILD
REN
)4,
154,
816
10.5
5715
- 10
064
10/0
1/18
- 09
/30/
1911
5U
S D
EPT
OF
AGR
ICU
LTU
RE
- STA
TE O
F C
ALIF
OR
NIA
, 4,
001,
061
19 -
1013
910
/01/
19 -
09/3
0/20
DEP
T O
F PU
BLIC
HEA
LTH
SUPP
LEM
ENTA
L N
UTR
ITIO
N A
SSIS
TAN
CE
PRO
GR
AM (S
NAP
) AKA
CAL
FRES
H P
R46
,817
10.5
6116
- SU
B - 0
0876
10/0
1/18
- 09
/30/
1916
4U
S D
EPT
OF
AGR
ICU
LTU
RE
- STA
TE O
F C
ALIF
OR
NIA
, D
EPT
OF
SOC
IAL
SER
VIC
ES, I
NFO
LIN
E O
F SA
N D
IEG
Odb
a 21
1 SA
N D
IEG
O
CO
OR
DIN
ATED
EN
TRY
SER
VIC
ES10
5,00
014
.267
N/A
10/1
/201
8-7/
31/1
942
8-24
0U
S D
EPT
OF
HO
USI
NG
& U
RBA
N D
EVEL
OPM
ENT
- KER
N
BEH
AVIO
RAL
HEA
LTH
UN
ITED
WAY
OF
KER
N C
OU
NTY
QU
ALIT
Y R
ATIN
G A
ND
IMPR
OVE
MEN
T SY
STEM
(QR
IS) -
SAN
JO
AQU
IN20
,000
84.4
12N
/A07
/01/
18 -
06/3
0/19
117-
005
U.S
. DEP
T O
F ED
UC
ATIO
N -
STAT
E O
F C
ALIF
OR
NIA
,D
EPT
OF
EDU
CAT
ION
- FI
RST
5 C
ALIF
OR
NIA
, CO
UN
TY O
F SA
N J
OAQ
UIN
,FI
RST
5 S
AN J
OAQ
UIN
, RAC
E TO
TH
E TO
P
CSP
P Q
RIS
BLO
CK
GR
ANT
17,9
90N
/A07
/01/
18 -
06/3
0/19
258-
005
STAT
E O
F C
ALIF
OR
NIA
, DEP
T O
F ED
UC
ATIO
N -
KER
N C
OU
NTY
SU
PER
INTE
ND
ENT
OF
SCH
OO
LS, K
ERN
EA
RLY
STA
RS
MIG
RAN
T AL
TER
NAT
IVE
PAYM
ENT
3,04
6,80
5C
MAP
- 80
0007
/01/
18 -
06/3
0/19
261
STAT
E O
F C
ALIF
OR
NIA
, DEP
T O
F ED
UC
ATIO
N4,
173,
682
CM
AP -
9000
07/0
1/19
- 06
/30/
20
GEN
ERAL
CEN
TER
CH
ILD
CAR
E2,
067,
088
CC
TR -
8049
07/0
1/18
- 06
/30/
1925
3ST
ATE
OF
CAL
IFO
RN
IA, D
EPT
OF
EDU
CAT
ION
2,65
9,08
2C
CTR
- 90
5007
/01/
19 -
06/3
0/20
CAL
IFO
RN
IA S
TATE
PR
ESC
HO
OL
PRO
GR
AM3,
731,
472
CSP
P - 8
120
07/0
1/18
- 06
/30/
1925
8ST
ATE
OF
CAL
IFO
RN
IA, D
EPT
OF
EDU
CAT
ION
3,84
6,36
9C
SPP
- 912
107
/01/
19 -
06/3
0/20
MIG
RAN
T C
HIL
D C
ARE
254,
377
CM
IG -
8004
07/0
1/18
- 06
/30/
1925
0ST
ATE
OF
CAL
IFO
RN
IA, D
EPT
OF
EDU
CAT
ION
262,
661
CM
IG -
9004
07/0
1/19
- 06
/30/
20
MIG
RAN
T SP
ECIA
LIZE
D S
ERVI
CES
38,1
56C
MSS
- 80
0407
/01/
18 -
06/3
0/19
252
STAT
E O
F C
ALIF
OR
NIA
, DEP
T O
F ED
UC
ATIO
N39
,399
CM
SS -
9004
07/0
1/19
- 06
/30/
20
CAL
EIT
C F
REE
TAX
PR
EPAR
ATIO
N A
SSIS
TAN
CE
GR
ANT
175,
000
18T
- 801
210
/15/
18 -
06/3
0/19
234
STAT
E O
F C
ALIF
OR
NIA
, DEP
T O
F C
OM
MU
NIT
Y SE
RVI
CES
AN
D D
EVEL
OPM
ENT
174,
000
19T
- 901
110
/01/
19 -
06/3
0/20
HO
ME
VISI
T IN
ITIA
TIVE
(CO
UN
TY O
F KE
RN
)43
5,98
0N
/A04
/01/
19 -
06/3
0/19
270
STAT
E O
F C
ALIF
OR
NIA
, DEP
T O
F H
UM
AN S
ERVI
CES
, C
OU
NTY
OF
KER
N1,
877,
011
N/A
07/0
1/19
- 06
/30/
20
A3
PREP
ARED
11/
4/20
19SC
HPR
GM
Page
3 o
f 5
235

CO
MM
UN
ITY
AC
TIO
N P
AR
TN
ER
SH
IP O
F K
ER
N
SC
HE
DU
LE
OF
PR
OG
RA
MS
(F
UN
DS
)
FO
R T
HE
PE
RIO
D M
AR
CH
1,
20
19
TH
RO
UG
H F
EB
RU
AR
Y 2
9,
20
20
PR
OG
RA
M (
CO
MP
ON
EN
T)
AM
OU
NT
CF
DA
#G
RA
NT
NU
MB
ER
PR
OG
RA
M Y
EA
RF
UN
D#
FU
ND
ING
SO
UR
CE
POSI
TIVE
YO
UTH
DEV
ELO
PMEN
T SE
RVI
CES
(CO
UN
TY O
F KE
RN
)35
,000
509-
2019
08/1
3/19
- 06
/30/
2027
1ST
ATE
OF
CAL
IFO
RN
IA, D
EPT
OF
HU
MAN
SER
VIC
ES,
CO
UN
TY O
F KE
RN
35,0
00
CAL
IFO
RN
IA E
MER
GEN
CY
SOLU
TIO
NS
AND
HO
USI
NG
PR
OG
RAM
57,0
0018
-CES
H-1
2453
10/3
/19
- 7/2
4/24
272
STAT
E O
F C
ALIF
OR
NIA
, DEP
T O
F G
ENER
AL S
ERVI
CES
, U
NIT
ED W
AY O
F KE
RN
INFO
RM
ATIO
N &
ED
UC
ATIO
N80
,000
16 -
1020
607
/01/
18 -
06/3
0/19
120
STAT
E O
F C
ALIF
OR
NIA
, DEP
T O
F PU
BLIC
HEA
LTH
FOO
D B
ANK
CAP
ACIT
Y PR
OG
RA M
101,
490
SGR
T-19
-001
27/
01/1
7 - 0
6/30
/20
215
STAT
E O
F C
ALIF
OR
NIA
, DEP
T O
F SO
CIA
L SE
RVI
CES
TAX
CH
ECK
- OFF
(FO
OD
BAN
K)15
,442
15 M
OU
- 00
118
07/
01/1
8 - 0
6/30
/19
216-
000
STAT
E O
F C
ALIF
OR
NIA
, DEP
T O
F SO
CIA
L SE
RVI
CES
STAT
E EM
ERG
ENC
Y FO
OD
ASS
ISTA
NC
E (F
OO
D B
ANK)
264,
704
N/A
07/
01/1
8 - 0
6/30
/19
216-
087
STAT
E O
F C
ALIF
OR
NIA
, DEP
T O
F SO
CIA
L SE
RVI
CES
CAL
FO
OD
DIF
FER
ENTI
AL R
ESPO
NSE
SER
VIC
ES21
9,00
6N
/A 0
7/01
/18
- 06/
30/1
928
0C
OU
NTY
OF
KER
N,
SUPE
RIN
TEN
DEN
T O
F SC
HO
OLS
, CH
ILD
AN
D F
AMIL
Y SE
RVI
CES
AG
ENC
Y,N
ETW
OR
K FO
R C
HIL
DR
EN
FIR
ST 5
KER
N -
HEL
PLIN
E 21
110
0,35
020
15.2
.507
/01/
18 -
06/3
0/19
288
KER
N,
FIR
ST 5
KER
N
FIR
ST 5
KER
N E
AST
KER
N F
AMIL
Y R
ESO
UR
CE
CEN
TER
137,
493
2015
.2.6
07/0
1/18
- 06
/30/
1928
1ST
ATE
OF
CAL
IFO
RN
IA, F
IRST
5 C
ALIF
OR
NIA
, CO
UN
TY O
F KE
RN
, FI
RST
5 K
ERN
FIR
ST 5
KER
N -
HEL
P M
E G
RO
W50
,921
2017
.2.0
107
/01/
18 -
06/3
0/19
284
STAT
E O
F C
ALIF
OR
NIA
, FIR
ST 5
CAL
IFO
RN
IA, C
OU
NTY
OF
KER
FIR
ST 5
KER
N
CO
UN
TY O
F KE
RN
HEL
PLIN
E 21
144
,738
105
- 201
807
/01/
18 -
06/3
0/19
389
CO
UN
TY O
F KE
RN
45,0
0007
/01/
19 -
06/3
0/20
GAN
G P
REV
ENTI
ON
ED
UC
ATIO
N S
ERVI
CES
71,4
0623
0 - 2
017
07/0
1/18
- 06
/30/
1933
5C
OU
NTY
OF
KER
N, D
EPT
OF
HU
MAN
SER
VIC
ES
REA
DY
KER
N1,
126
N/A
7/1/
18 -
6/30
/19
366
CO
UN
TY O
F KE
RN
, FIR
E D
EPT
- OFF
ICE
OF
EMER
GEN
CY
SER
V
EAST
KER
N H
EALT
H L
INK
- RES
OU
RC
E FA
IRS
3,00
0N
/A6/
01/1
9 - 5
/31/
20
501-
005
BOR
AX V
ISIT
OR
CEN
TER
FO
UN
DAT
ION
EAST
KER
N F
AMIL
Y R
ESO
UR
CE
CEN
TER
EM
ERG
ENC
Y SU
PPLI
ES C
LOSE
T2,
000
N/A
5/20
/19
- 12/
31/1
9 50
1-00
5KE
RN
HEA
LTH
SYS
TEM
S
SHAF
TER
YO
UTH
CEN
TER
- M
AKE
BAKE
RSF
IELD
2,00
0N
/A5/
20/1
9 - 1
2/31
/19
527-
260
KER
N H
EALT
H S
YSTE
MS
A.R
.T C
UR
RIC
ULU
M10
,125
N/A
9/10
/18
- 6/3
0/19
531-
070
KER
N C
OU
NTY
SU
PER
INTE
ND
ENT
OF
SCH
OO
LS
A4
PREP
ARED
11/
4/20
19SC
HPR
GM
Page
4 o
f 5
236
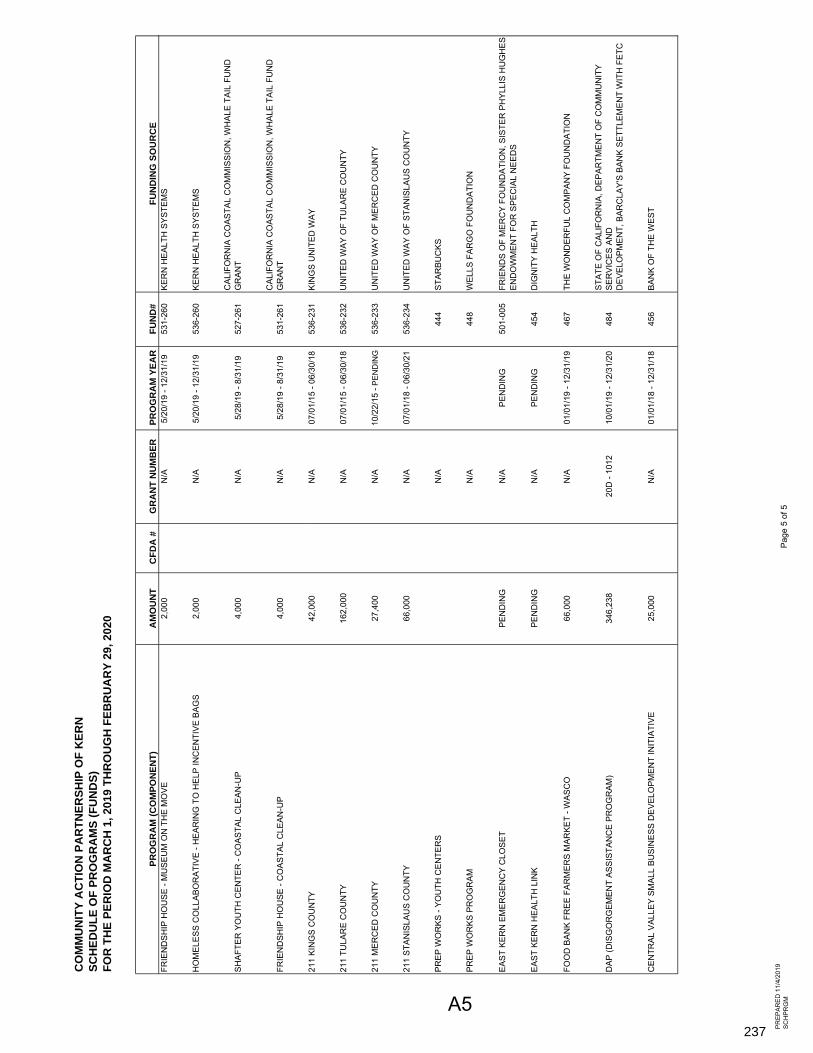
CO
MM
UN
ITY
AC
TIO
N P
AR
TN
ER
SH
IP O
F K
ER
N
SC
HE
DU
LE
OF
PR
OG
RA
MS
(F
UN
DS
)
FO
R T
HE
PE
RIO
D M
AR
CH
1,
20
19
TH
RO
UG
H F
EB
RU
AR
Y 2
9,
20
20
PR
OG
RA
M (
CO
MP
ON
EN
T)
AM
OU
NT
CF
DA
#G
RA
NT
NU
MB
ER
PR
OG
RA
M Y
EA
RF
UN
D#
FU
ND
ING
SO
UR
CE
FRIE
ND
SHIP
HO
USE
- M
USE
UM
ON
TH
E M
OVE
2,00
0N
/A5/
20/1
9 - 1
2/31
/19
531-
260
KER
N H
EALT
H S
YSTE
MS
HO
MEL
ESS
CO
LLAB
OR
ATIV
E - H
EAR
ING
TO
HEL
P IN
CEN
TIVE
BAG
S2,
000
N/A
5/20
/19
- 12/
31/1
9 53
6-26
0KE
RN
HEA
LTH
SYS
TEM
S
SHAF
TER
YO
UTH
CEN
TER
- C
OAS
TAL
CLE
AN-U
P4,
000
N/A
5/28
/19
- 8/3
1/19
527-
261
CAL
IFO
RN
IA C
OAS
TAL
CO
MM
ISSI
ON
, WH
ALE
TAIL
FU
ND
G
RAN
T
FRIE
ND
SHIP
HO
USE
- C
OAS
TAL
CLE
AN-U
P4,
000
N/A
5/28
/19
- 8/3
1/19
531-
261
CAL
IFO
RN
IA C
OAS
TAL
CO
MM
ISSI
ON
, WH
ALE
TAIL
FU
ND
G
RAN
T
211
KIN
GS
CO
UN
TY42
,000
N/A
07/0
1/15
- 06
/30/
1853
6-23
1KI
NG
S U
NIT
ED W
AY
211
TULA
RE
CO
UN
TY16
2,00
0N
/A07
/01/
15 -
06/3
0/18
536-
232
UN
ITED
WAY
OF
TULA
RE
CO
UN
TY
211
MER
CED
CO
UN
TY27
,400
N/A
10/2
2/15
- PE
ND
ING
536-
233
UN
ITED
WAY
OF
MER
CED
CO
UN
TY
211
STAN
ISLA
US
CO
UN
TY66
,000
N/A
07/0
1/18
- 06
/30/
2153
6-23
4U
NIT
ED W
AY O
F ST
ANIS
LAU
S C
OU
NTY
PREP
WO
RKS
- YO
UTH
CEN
TER
SN
/A44
4ST
ARBU
CKS
PREP
WO
RKS
PR
OG
RAM
N/A
448
WEL
LS F
ARG
O F
OU
ND
ATIO
N
EAST
KER
N E
MER
GEN
CY
CLO
SET
PEN
DIN
GN
/APE
ND
ING
501-
005
FRIE
ND
S O
F M
ERC
Y FO
UN
DAT
ION
, SIS
TER
PH
YLLI
S H
UG
HES
END
OW
MEN
T FO
R S
PEC
IAL
NEE
DS
EAST
KER
N H
EALT
H L
INK
PEN
DIN
GN
/APE
ND
ING
454
DIG
NIT
Y H
EALT
H
FOO
D B
ANK
FREE
FAR
MER
S M
ARKE
T - W
ASC
O66
,000
N/A
01/0
1/19
- 12
/31/
1946
7TH
E W
ON
DER
FUL
CO
MPA
NY
FOU
ND
ATIO
N
DAP
(DIS
GO
RG
EMEN
T AS
SIST
ANC
E PR
OG
RAM
)34
6,23
820
D -
1012
10/0
1/19
- 12
/31/
2048
4ST
ATE
OF
CAL
IFO
RN
IA, D
EPAR
TMEN
T O
F C
OM
MU
NIT
Y SE
RVI
CES
AN
D
DEV
ELO
PMEN
T, B
ARC
LAY'
S BA
NK
SETT
LEM
ENT
WIT
H F
ETC
CEN
TRAL
VAL
LEY
SMAL
L BU
SIN
ESS
DEV
ELO
PMEN
T IN
ITIA
TIVE
25,0
00N
/A01
/01/
18 -
12/3
1/18
456
BAN
K O
F TH
E W
EST
A5
PREP
ARED
11/
4/20
19SC
HPR
GM
Page
5 o
f 5
237

Abila Energy Community Discretionary/ General & Fund # Fund Name Education Nutrition Conservation Services Fund Raising Admin103 Community Services Block Grant (CSBG) X X X X501 General Fund X X800 GAAP Fund X910 Community Development Pool X915 Operations Pool X X X920 Facilities Pool X925 Health & Nutrition Pool X X X999 Indirect Fund X502 Discretionary Fund X595 Fund Raising X107 EHS Expansion X108 Early Head Start X109 Head Start X110 Early Head Start Child Care Partnership X117 Early Head Start San Joaquin X
117‐005 EHS San Joaquin QRIS X250.0 Migrant Child Care X252 Migrant Specialized X253 General Child Care X
253‐005 CCTR ‐ QRIS X258 California State Preschool (CSPP) X
258‐005 CSPP QRIS X260 Child Care Facilities X261 Migrant Alternative Payment X
262/265 Child Development Reserve X270 Home Visit Initiative X112 Child Care Food Program (CACFP) X115 Women, Infants & Children X145 NEOPB Cal Fresh X139 CACFP ‐ San Joaquin X
Food Bank X105 Emergency Food Assistance X111 USDA Commodities X114 Emergency Food & Shelter X147 Commodity Supplemental Food Program X215 Food Bank Capacity Project X
216‐000 Food Bank Tax Check‐Off X216‐087 State Emergency Food Assistance X413 Resnick Foundation X485 Southern California Gas Company (Solar) X467 Wonderful Company Foundation X504 Food Bank X
Energy122 Low Income Home Energy Assistance X123 Dept of Energy Weatherization X241 LIWP Solar PV Pilot X245 LIWP Single Family X
COMMUNITY ACTION PARTNERSHIP OF KERN
FUNCTIONAL CLASSIFICATIONS BY FUND
FISCAL YEAR 2019/20
PROGRAM SERVICES SUPPORT SERVICES
B1238

Abila Energy Community Discretionary/ General & Fund # Fund Name Education Nutrition Conservation Services Fund Raising Admin
COMMUNITY ACTION PARTNERSHIP OF KERN
FUNCTIONAL CLASSIFICATIONS BY FUND
FISCAL YEAR 2019/20
PROGRAM SERVICES SUPPORT SERVICES
484 DAP (Disgorgement Assistance Program) X494 PG&E X524 Energy X
VITA (Volunteer Income Tax Assistance)149 Internal Revenue Service ‐ VITA X234 CalEITC X
Small Business Development456 Bank of the West X
East Kern Family Resource Center171 Economic Empowerment X280 Differential Response X281 First 5 East Kern Family Resource X454 Dignity Health East Kern Health Link X
501‐005 EKFRC: KHS Emergency Closet XYouth Services
120 Information & Education X242 Youth Authority X246 Realignment for Success X271 Positive Youth Development Svcs X335 Gang Prevention X444 Starbucks Foundation X448 Wells Fargo Foundation X527 Shafter Youth Center X
527‐068 SYC ‐ Robotics/STEM X527‐260 SYC ‐ KHS Make Bakersfield X531 Friendship House Community Center X
531‐068 FHCC ‐ Robotics/STEM X531‐070 FHCC ‐ Aggression Replacement Training X531‐260 FHCC ‐ KHS Museum on the Move X
2‐1‐1160 HUD Coordinated Entry System X164 Cal Fresh X186 2‐1‐1 Hospital Preparedness Program X272 United Way ‐ CESH X284 First 5 Kern Help Me Grow X288 First 5 Kern 2‐1‐1 X366 ReadyKern X389 County of Kern 2‐1‐1 X428 2‐1‐1 United Way X
428‐240 United Way ‐ Coordinate Entry System X536‐231 2‐1‐1: Kings County X536‐232 2‐1‐1: Tulare County X536‐233 2‐1‐1: Merced County X536‐234 2‐1‐1: Stanislaus County X536‐260 2‐1‐1: KHS Homeless Collaborative X
B2239

Advance Repayment No. of Days Interest Interest Date Amount Amount Borrowed Expense Rate
02/28/19 n/a03/29/19 235,000$ 235,000$ 304/30/19 n/a05/31/19 n/a06/30/19 n/a07/31/19 1,200,000$ 1,200,000$ 208/31/19 n/a09/30/19 n/a10/31/19 n/a
Note 1: Line of Credit agreement was entered into with Wells Fargo Bank as of January 11, 2019 for$2 million and will terminate on January 15, 2020.
Note 2: Interest expense is calculated at 3.75% above daily one month LIBOR. Note 3: Line of credit was not required for the month of October 2019.
LINE OF CREDIT COMMITMENT FEE (Based on the daily unused amount of the line of credit calculated quarterly)
No. of Days Commitment Interestin Period Fee Rate90 days 1,243.75$ 0.25%90 days 1,258.99$ 0.25%90 days 1,261.11$ 0.25%
Note 3: The interest expense and commitment fee are automatically deducted from CAPK's operating bank account at Wells Fargo Bank.
C1
COMMUNITY ACTION PARTNERSHIP OF KERNLINE OF CREDIT ADVANCES AND REPAYMENTS
FISCAL YEAR 2019/20
Period12/31/18 ‐ 3/30/193/31/19 ‐ 6/29/196/30/19 ‐ 9/30/19
240

COMMUNITY ACTION PARTNERSHIP OF KERN
OPERATING CASH SUMMARY AS OF OCTOBER 31, 2019
PROGRAM (FUND) CASH BALANCE
CHILD AND ADULT CARE FOOD PROGRAM (302,937.67) HEAD START/EARLY HEAD START (13,580.74)
SUBTOTAL (316,518.41)
CHILD DEVELOPMENT RESERVE No. 1 (0.30)CHILD DEVELOPMENT RESERVE No. 2 0.00GENERAL CHILD CARE 291,966.49MIGRANT A/P 1,933,887.70MIGRANT CHILD CARE 69,594.01MIGRANT SPECIALIZED SERVICES (328.99)STATE PRESCHOOL 1,484,343.08
SUBTOTAL 3,779,461.99
COMMODITY SUPPLEMENTAL FOOD PROGRAM (116,481.92)EF&S 39,799.00EFAP 175,666.41FOOD BANK 188,012.71FOOD BANK CAPACITY PROGRAM 18,115.48FOOD BANK - STATE (138,965.91)SOCAL GAS 2,305.66WONDERFUL FOUNDATION 14,537.67
SUBTOTAL 182,989.10
ENERGY (133,887.36)DOE WAP (25,309.97)LIHEAP (221,010.57)LIWP SOLAR PV (100.32)LIWP SINGLE FAMILY (200.72)PG&E (11,099.75)WATER TANK 0.00 TRANSFER NEGATIVE BALANCE 391,608.69
SUBTOTAL 0.00
CALIFORNIA ENDOWMENTCENTRAL VALLEY SMALL BUSINESS DEVELOPMENT 2,000.00
SUBTOTAL 2,000.00
211 (56,255.34)211 HOSPITAL PREPAREDNESS (381.32)BANK OF THE WEST 23,400.30CAL FRESH (15,761.41) CALEITC (9,079.38) COST POOLS 59,656.72COUNTY OF KERN - 2-1-1 0.00CSBG 69,036.70 CSBG DISCRETIONARY (14,332.25)DIFFERENTIAL RESPONSE (32,907.98)DIGNITY HEALTH 4,677.72DISCRETIONARY FUND 202,714.44ECONOMIC EMPOWERMENT (18,909.96) FIRST 5 KERN 211 (18,498.72)FIRST 5 KERN EAST KERN FAMILY RESOURCE CENTER (10,638.98)FIRST 5 HELP ME GROW 7,964.18FRIENDSHIP HOUSE (26,902.02)FUNDRAISING 333,612.70GANG PREVENTION (37.75)GENERAL FUND 56,171.97HOME VISIT INITIATIVE (CO OF KERN) (135,556.12)HUD-COORDINATED ENTRY SYSTEM (38,110.32)INDIRECT FUND 1,869,648.03IRS - VITA (10,576.04)INFORMATION & EDUCATION (14,282.42)NEOPB CAL FRESH HEALTHY LIVING (17,233.33)POSITIVE YOUTH DEV SVC (4,955.77)REALIGNMENT FOR SUCCESS (2,640.92)SHAFTER YOUTH CENTER (32,378.43)STARBUCKS FOUNDATION 0.00TRADE MITIGATION 0.00UNITED WAY 211 (17,322.68)WELLS FARGO FOUNDATION 11,285.00WIC (1,114,629.19)
LESS: ENERGY NEGATIVE BALANCE (391,608.69)ADD: LINE OF CREDIT 0.00
SUBTOTAL 655,168.74
TOTAL OPERATING CASH 4,303,101.42
D1241
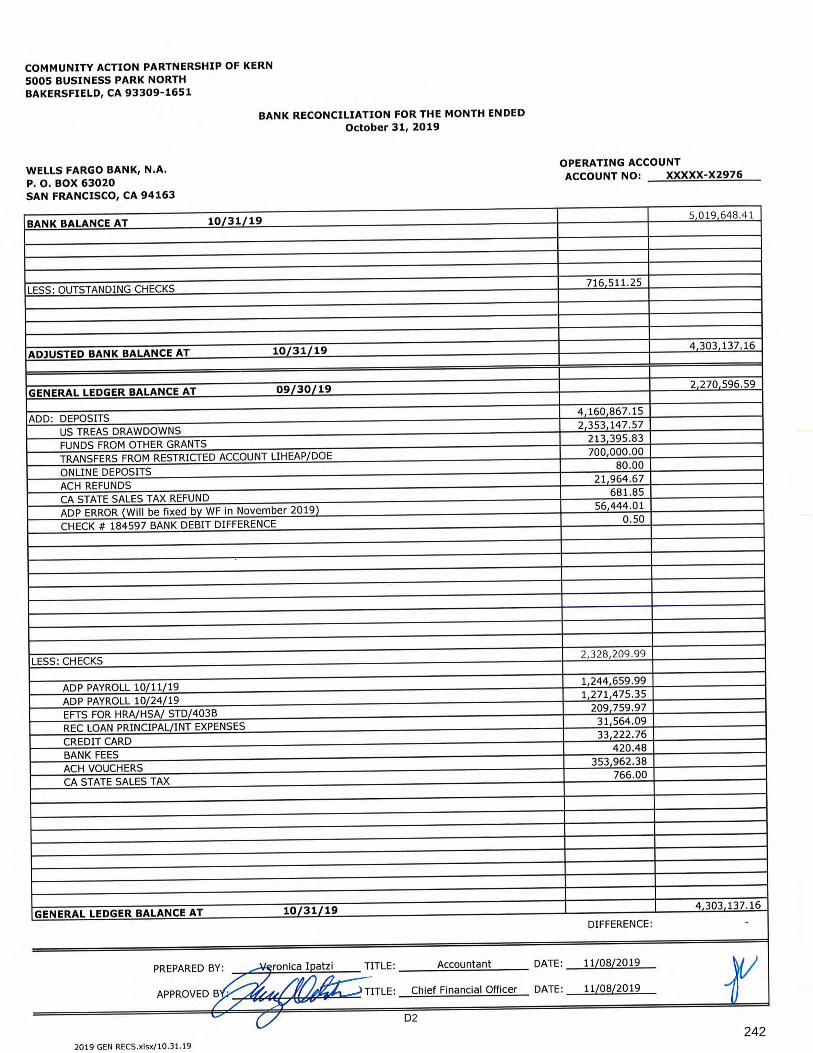
D2242

D3
243

D4
244

D5
245

D6
246

AmountCardholder Position Charged
CAPK Accounts Payable -$
Gloria Barbero Administrator - EHS San Joaquin 1,517.50
Yolanda Gonzales Director of Head Start/State Child Development Programs 9,913.18
Donna Holland Fiscal Administrator 9,769.73
Pritika Ram Director of Administration 2,172.27
Carmen Segovia Director of Health & Nutrition Services 6,699.62
Jeremy Tobias Chief Executive Officer 784.11
Emilio Wagner Director of Operations 2,732.80
Tracy Webster Chief Financial Officer 25.00
Total 33,614.21$
COMMUNITY ACTION PARTNERSHIP OF KERN
WELLS FARGO VISA SUMMARY
STATEMENTS DATED October 1, 2019 - October 31, 2019
E1
247

Home | About Wells Fargo | Security Guarantee | Privacy, Security & Legal© Copyright 2000 - 2019 Wells Fargo. All rights reserved.
11/01/2019 02:29 PM PTRequested By: ALBITRE, ROSEMARY
Statement Expenses
Cardholder Summary
Charges
There are no results.
---End of Report---
Cardholder Name: AP, CAPKCard Number: xxxx-xxxx-xxxx-7017Status: OpenCharges: 0.00 USDOut-of-pocket: 0.00 USDTotal Amount: 0.00 USD
Start Date: 10/01/2019End Date: 10/31/2019Reminder Period:11/01/2019 through 11/03/2019Grace Period:11/04/2019 through 11/06/2019Approval Period:11/07/2019 through 11/10/2019Download Period:11/11/2019 through 11/28/2019
Page 1 of 1Commercial Card Expense Reporting
11/1/2019https://wellsonecard.ceo.wellsfargo.com/ccer/ksoPrintTransactionsPopup.spring
E2
248

Home | About Wells Fargo | Security Guarantee | Privacy, Security & Legal© Copyright 2000 - 2019 Wells Fargo. All rights reserved.
11/01/2019 02:31 PM PTRequested By: ALBITRE, ROSEMARY
Statement Expenses
Cardholder Summary
Charges
1. TransactionDate
Posting Date Merchant
General Ledger Code Unit
Receipt Submitted ‡
Amount / Original Currency
10/15/2019 10/16/2019 Sheraton Hotel Waikiki Honolulu,HI
CAPK Pcard(CAPL Pcard)
No 1,517.50 USD / 1,517.50
Total Charges: 1,517.50 USD
‡ - The Receipt Submitted column indicates that a receipt was submitted via fax, email, at the statement level, or using a system other than the Commercial Card Expense Reporting service.
---End of Report---
Cardholder Name: BARBERO, GLORIACard Number: xxxx-xxxx-xxxx-7058Status: OpenCharges: 1,517.50 USDOut-of-pocket: 0.00 USDTotal Amount: 1,517.50 USD
Start Date: 10/01/2019End Date: 10/31/2019Reminder Period:11/01/2019 through 11/03/2019Grace Period:11/04/2019 through 11/06/2019Approval Period:11/07/2019 through 11/10/2019Download Period:11/11/2019 through 11/28/2019
Page 1 of 1Commercial Card Expense Reporting
11/1/2019https://wellsonecard.ceo.wellsfargo.com/ccer/ksoPrintTransactionsPopup.spring
E3
249

11/01/2019 02:32 PM PTRequested By: ALBITRE, ROSEMARY
Statement Expenses
Cardholder Summary
Charges
1.Transaction Date
Posting Date Merchant
General Ledger Code Unit
Receipt Submitted ‡
Amount / Original Currency
09/30/2019 10/01/2019 Smore.com - Educator Www.smore.com,NY
CAPK Pcard(CAPL Pcard)
No 79.00 USD / 79.00
2.Transaction Date
Posting Date Merchant
General Ledger Code Unit
Receipt Submitted ‡
Amount / Original Currency
10/04/2019 10/07/2019 Barnes & Noble #2851 Bakersfield,CA
CAPK Pcard(CAPL Pcard)
No 61.70 USD / 61.70
3.Transaction Date
Posting Date Merchant
General Ledger Code Unit
Receipt Submitted ‡
Amount / Original Currency
10/07/2019 10/08/2019 Allianz Travel Ins Allianzins.us,VA
CAPK Pcard(CAPL Pcard)
No 49.40 USD / 49.40
4.Transaction Date
Posting Date Merchant
General Ledger Code Unit
Receipt Submitted ‡
Amount / Original Currency
10/09/2019 10/10/2019 The Toll Roads Of Oc 949-727-4800,CA
CAPK Pcard(CAPL Pcard)
No 11.62 USD / 11.62
5.Transaction Date
Posting Date Merchant
General Ledger Code Unit
Receipt Submitted ‡
Amount / Original Currency
10/15/2019 10/16/2019 Sheraton Hotel Waikiki Honolulu,HI
CAPK Pcard(CAPL Pcard)
No 1,821.00 USD / 1,821.00
6.Transaction Date
Posting Date Merchant
General Ledger Code Unit
Receipt Submitted ‡
Amount / Original Currency
10/15/2019 10/16/2019 Sheraton Hotel Waikiki Honolulu,HI
CAPK Pcard(CAPL Pcard)
No 1,821.00 USD / 1,821.00
7.Transaction Date
Posting Date Merchant
General Ledger Code Unit
Receipt Submitted ‡
Amount / Original Currency
Cardholder Name: GONZALES, YOLANDACard Number: xxxx-xxxx-xxxx-7009Status: OpenCharges: 9,913.18 USDOut-of-pocket: 0.00 USDTotal Amount: 9,913.18 USD
Start Date: 10/01/2019End Date: 10/31/2019Reminder Period:11/01/2019 through 11/03/2019Grace Period:11/04/2019 through 11/06/2019Approval Period:11/07/2019 through 11/10/2019Download Period:11/11/2019 through 11/28/2019
Page 1 of 2Commercial Card Expense Reporting
11/1/2019https://wellsonecard.ceo.wellsfargo.com/ccer/ksoPrintTransactionsPopup.spring
E4
250

Home | About Wells Fargo | Security Guarantee | Privacy, Security & Legal© Copyright 2000 - 2019 Wells Fargo. All rights reserved.
10/15/2019 10/16/2019 Sheraton Hotel Waikiki Honolulu,HI
CAPK Pcard(CAPL Pcard)
No 1,821.00 USD / 1,821.00
8.Transaction Date
Posting Date Merchant
General Ledger Code Unit
Receipt Submitted ‡
Amount / Original Currency
10/15/2019 10/16/2019 Sheraton Hotel Waikiki Honolulu,HI
CAPK Pcard(CAPL Pcard)
No 1,517.50 USD / 1,517.50
9.Transaction Date
Posting Date Merchant
General Ledger Code Unit
Receipt Submitted ‡
Amount / Original Currency
10/18/2019 10/21/2019 Hyatt Regency Sacramento 8885884384,CA
CAPK Pcard(CAPL Pcard)
No 787.38 USD / 787.38
10.Transaction Date
Posting Date Merchant
General Ledger Code Unit
Receipt Submitted ‡
Amount / Original Currency
10/22/2019 10/23/2019 Smore.com - Educator Www.smore.com,NY
CAPK Pcard(CAPL Pcard)
No 79.00 USD / 79.00
11.Transaction Date
Posting Date Merchant
General Ledger Code Unit
Receipt Submitted ‡
Amount / Original Currency
10/22/2019 10/23/2019 Smore.com - Educator Www.smore.com,NY
CAPK Pcard(CAPL Pcard)
No 79.00 USD / 79.00
12.Transaction Date
Posting Date Merchant
General Ledger Code Unit
Receipt Submitted ‡
Amount / Original Currency
10/22/2019 10/24/2019 The Mark 661-3227665,CA
CAPK Pcard(CAPL Pcard)
No 1,639.56 USD / 1,639.56
13.Transaction Date
Posting Date Merchant
General Ledger Code Unit
Receipt Submitted ‡
Amount / Original Currency
10/26/2019 10/28/2019 Springhill Suites Ridg Ridgecrest,CA
CAPK Pcard(CAPL Pcard)
No 146.02 USD / 146.02
Total Charges: 9,913.18 USD
‡ - The Receipt Submitted column indicates that a receipt was submitted via fax, email, at the statement level, or using a system other than the Commercial Card Expense Reporting service.
---End of Report---
Page 2 of 2Commercial Card Expense Reporting
11/1/2019https://wellsonecard.ceo.wellsfargo.com/ccer/ksoPrintTransactionsPopup.spring
E5
251

11/01/2019 02:34 PM PTRequested By: ALBITRE, ROSEMARY
Statement Expenses
Cardholder Summary
Charges
1.Transaction Date
Posting Date Merchant
General Ledger Code Unit
Receipt Submitted ‡
Amount / Original Currency
10/02/2019 10/04/2019 Food Safety Training 818-889-8799,CA
CAPK Pcard(CAPL Pcard)
No 109.45 USD / 109.45
2.Transaction Date
Posting Date Merchant
General Ledger Code Unit
Receipt Submitted ‡
Amount / Original Currency
10/15/2019 10/16/2019 Sheraton Hotel Waikiki Honolulu,HI
CAPK Pcard(CAPL Pcard)
No 1,821.00 USD / 1,821.00
3.Transaction Date
Posting Date Merchant
General Ledger Code Unit
Receipt Submitted ‡
Amount / Original Currency
10/15/2019 10/16/2019 Sheraton Hotel Waikiki Honolulu,HI
CAPK Pcard(CAPL Pcard)
No 1,517.50 USD / 1,517.50
4.Transaction Date
Posting Date Merchant
General Ledger Code Unit
Receipt Submitted ‡
Amount / Original Currency
10/15/2019 10/16/2019 Sheraton Hotel Waikiki Honolulu,HI
CAPK Pcard(CAPL Pcard)
No 1,517.50 USD / 1,517.50
5.Transaction Date
Posting Date Merchant
General Ledger Code Unit
Receipt Submitted ‡
Amount / Original Currency
10/18/2019 10/21/2019 Hyatt Regency Sacramento 8885884384,CA
CAPK Pcard(CAPL Pcard)
No 787.38 USD / 787.38
6.Transaction Date
Posting Date Merchant
General Ledger Code Unit
Receipt Submitted ‡
Amount / Original Currency
10/18/2019 10/21/2019 Hyatt Regency Sacramento
No 827.38 USD / 827.38
Cardholder Name: HOLLAND, DONNACard Number: xxxx-xxxx-xxxx-7033Status: OpenCharges: 9,769.73 USDOut-of-pocket: 0.00 USDTotal Amount: 9,769.73 USD
Start Date: 10/01/2019End Date: 10/31/2019Reminder Period:11/01/2019 through 11/03/2019Grace Period:11/04/2019 through 11/06/2019Approval Period:11/07/2019 through 11/10/2019Download Period:11/11/2019 through 11/28/2019
Page 1 of 2Commercial Card Expense Reporting
11/1/2019https://wellsonecard.ceo.wellsfargo.com/ccer/ksoPrintTransactionsPopup.spring
E6
252

Home | About Wells Fargo | Security Guarantee | Privacy, Security & Legal© Copyright 2000 - 2019 Wells Fargo. All rights reserved.
8885884384,CA CAPK Pcard(CAPL Pcard)
7.Transaction Date
Posting Date Merchant
General Ledger Code Unit
Receipt Submitted ‡
Amount / Original Currency
10/18/2019 10/21/2019 Hyatt Regency Sacramento 8885884384,CA
CAPK Pcard(CAPL Pcard)
No 787.38 USD / 787.38
8.Transaction Date
Posting Date Merchant
General Ledger Code Unit
Receipt Submitted ‡
Amount / Original Currency
10/18/2019 10/21/2019 Hyatt Regency Sacramento 8885884384,CA
CAPK Pcard(CAPL Pcard)
No 787.38 USD / 787.38
9.Transaction Date
Posting Date Merchant
General Ledger Code Unit
Receipt Submitted ‡
Amount / Original Currency
10/18/2019 10/21/2019 Hyatt Regency Sacramento 8885884384,CA
CAPK Pcard(CAPL Pcard)
No 827.38 USD / 827.38
10.Transaction Date
Posting Date Merchant
General Ledger Code Unit
Receipt Submitted ‡
Amount / Original Currency
10/18/2019 10/21/2019 Hyatt Regency Sacramento 8885884384,CA
CAPK Pcard(CAPL Pcard)
No 787.38 USD / 787.38
11.Transaction Date
Posting Date Merchant
General Ledger Code Unit
Receipt Submitted ‡
Amount / Original Currency
10/18/2019 10/24/2019 Hyatt Regency Sacramento 8885884384,CA
CAPK Pcard(CAPL Pcard)
No 40.00 USD / 40.00
12.Transaction Date
Posting Date Merchant
General Ledger Code Unit
Receipt Submitted ‡
Amount / Original Currency
10/24/2019 10/25/2019 Hyatt Regency Sacramento Sacramento,CA
CAPK Pcard(CAPL Pcard)
No (40.00) USD / (40.00)
Total Charges: 9,769.73 USD
‡ - The Receipt Submitted column indicates that a receipt was submitted via fax, email, at the statement level, or using a system other than the Commercial Card Expense Reporting service.
---End of Report---
Page 2 of 2Commercial Card Expense Reporting
11/1/2019https://wellsonecard.ceo.wellsfargo.com/ccer/ksoPrintTransactionsPopup.spring
E7
253

11/01/2019 02:36 PM PTRequested By: ALBITRE, ROSEMARY
Statement Expenses
Cardholder Summary
Charges
1.Transaction Date
Posting Date Merchant
General Ledger Code Unit
Receipt Submitted ‡
Amount / Original Currency
09/30/2019 10/01/2019 Beatty Group 800-285-6215,OR
CAPK Pcard(CAPL Pcard)
No 200.00 USD / 200.00
Description Registration Fee - I. Fonseca for AIRS Conf.
2.Transaction Date
Posting Date Merchant
General Ledger Code Unit
Receipt Submitted ‡
Amount / Original Currency
09/30/2019 10/02/2019 United 0162475141094 800-932-2732,TX
CAPK Pcard(CAPL Pcard)
No 261.60 USD / 261.60
Description Irene Fonseca - AIRS Conf. in Portland
3.Transaction Date
Posting Date Merchant
General Ledger Code Unit
Receipt Submitted ‡
Amount / Original Currency
10/03/2019 10/04/2019 Food-ex Bakersfield,CA
CAPK Pcard(CAPL Pcard)
No 349.81 USD / 349.81
Description Lunch for Grants Day - Comm Dev.
4.Transaction Date
Posting Date Merchant
General Ledger Code Unit
Receipt Submitted ‡
Amount / Original Currency
10/05/2019 10/07/2019 Corner Bakery Cafe 1616 818-657-6066,CA
CAPK Pcard(CAPL Pcard)
No 131.95 USD / 131.95
Description Lunch for Employee Health Ins. Ad-Hoc Committee
5.Transaction Date
Posting Date Merchant
General Ledger Code Unit
Receipt Submitted ‡
Amount / Original Currency
10/08/2019 10/10/2019 Mandalay - Adv Dep 8552755733,NV
CAPK Pcard(CAPL Pcard)
No 400.00 USD / 400.00
Cardholder Name: RAM, PRITIKACard Number: xxxx-xxxx-xxxx-7074Status: OpenCharges: 2,172.27 USDOut-of-pocket: 0.00 USDTotal Amount: 2,172.27 USD
Start Date: 10/01/2019End Date: 10/31/2019Reminder Period:11/01/2019 through 11/03/2019Grace Period:11/04/2019 through 11/06/2019Approval Period:11/07/2019 through 11/10/2019Download Period:11/11/2019 through 11/28/2019
Page 1 of 2Commercial Card Expense Reporting
11/1/2019https://wellsonecard.ceo.wellsfargo.com/ccer/ksoPrintTransactionsPopup.spring
E8
254

Home | About Wells Fargo | Security Guarantee | Privacy, Security & Legal© Copyright 2000 - 2019 Wells Fargo. All rights reserved.
6. TransactionDate
Posting Date
Merchant General Ledger Code
Unit Receipt Submitted ‡
Amount / Original Currency
10/12/2019 10/14/2019 Mandalay - Adv Dep 8552755733,NV
CAPK Pcard(CAPL Pcard)
No (460.00) USD / (460.00)
7.Transaction Date
Posting Date Merchant
General Ledger Code Unit
Receipt Submitted ‡
Amount / Original Currency
10/14/2019 10/16/2019 Hilton Hotels 303-8971300,CO
CAPK Pcard(CAPL Pcard)
No 677.13 USD / 677.13
Description Advance hotel payment for Rebecca Moreno - Built for Zero Conference
8.Transaction Date
Posting Date Merchant
General Ledger Code Unit
Receipt Submitted ‡
Amount / Original Currency
10/22/2019 10/24/2019 Embassy Suites Dwntwn 503-2799000,OR
CAPK Pcard(CAPL Pcard)
No 412.78 USD / 412.78
9.Transaction Date
Posting Date Merchant
General Ledger Code Unit
Receipt Submitted ‡
Amount / Original Currency
10/24/2019 10/25/2019 Nna Services Llc 800-876-6827,CA
CAPK Pcard(CAPL Pcard)
No 199.00 USD / 199.00
Total Charges: 2,172.27 USD
‡ - The Receipt Submitted column indicates that a receipt was submitted via fax, email, at the statement level, or using a system other than the Commercial Card Expense Reporting service.
---End of Report---
Page 2 of 2Commercial Card Expense Reporting
11/1/2019https://wellsonecard.ceo.wellsfargo.com/ccer/ksoPrintTransactionsPopup.spring
E9
255

11/01/2019 02:37 PM PTRequested By: ALBITRE, ROSEMARY
Statement Expenses
Cardholder Summary
Charges
1.Transaction Date
Posting Date Merchant
General Ledger Code Unit
Receipt Submitted ‡
Amount / Original
Currency
09/30/2019 10/01/2019 Amzn Mktp Us G22kh2uv3 Amzn.com/bill,WA
CAPK Pcard(CAPL Pcard)
No 164.52 USD / 164.52
2.Transaction Date
Posting Date Merchant
General Ledger Code Unit
Receipt Submitted ‡
Amount / Original
Currency
09/30/2019 10/01/2019 Helm Publishing Inc 940-4973558,TX
CAPK Pcard(CAPL Pcard)
No 1,176.00 USD / 1,176.00
3.Transaction Date
Posting Date Merchant
General Ledger Code Unit
Receipt Submitted ‡
Amount / Original
Currency
09/30/2019 10/01/2019 Fredpryor Careertrack 800-5563012,KS
CAPK Pcard(CAPL Pcard)
No 1,990.00 USD / 1,990.00
4.Transaction Date
Posting Date Merchant
General Ledger Code Unit
Receipt Submitted ‡
Amount / Original
Currency
09/30/2019 10/02/2019 Jim Charlon Ford Inc Ridgecrest,CA
CAPK Pcard(CAPL Pcard)
No 273.63 USD / 273.63
5.Transaction Date
Posting Date Merchant
General Ledger Code Unit
Receipt Submitted ‡
Amount / Original
Currency
10/01/2019 10/02/2019 Amzn Mktp Us Oo7ts7vz3 Amzn.com/bill,WA
CAPK Pcard(CAPL Pcard)
No 59.98 USD / 59.98
6.Transaction Date
Posting Date Merchant
General Ledger Code Unit
Receipt Submitted ‡
Amount / Original
Currency
10/02/2019 10/03/2019 CAPK Pcard
No 185.83 USD / 185.83
Cardholder Name: SEGOVIA, CARMENCard Number: xxxx-xxxx-xxxx-7025Status: OpenCharges: 6,699.62 USDOut-of-pocket: 0.00 USDTotal Amount: 6,699.62 USD
Start Date: 10/01/2019End Date: 10/31/2019Reminder Period:11/01/2019 through 11/03/2019Grace Period:11/04/2019 through 11/06/2019Approval Period:11/07/2019 through 11/10/2019Download Period:11/11/2019 through 11/28/2019
Page 1 of 3Commercial Card Expense Reporting
11/1/2019https://wellsonecard.ceo.wellsfargo.com/ccer/ksoPrintTransactionsPopup.spring
E10
256

Hotelscom8082695508423 Hotels.com,NV
(CAPL Pcard)
7.Transaction Date
Posting Date Merchant
General Ledger Code Unit
Receipt Submitted ‡
Amount / Original
Currency
10/03/2019 10/04/2019 Hotelscom8078815967328 Hotels.com,NV
CAPK Pcard(CAPL Pcard)
No 191.04 USD / 191.04
8.Transaction Date
Posting Date Merchant
General Ledger Code Unit
Receipt Submitted ‡
Amount / Original
Currency
10/01/2019 10/08/2019 Helm Publishing Inc Lake Dallas,TX
CAPK Pcard(CAPL Pcard)
No (176.40) USD / (176.40)
9.Transaction Date
Posting Date Merchant
General Ledger Code Unit
Receipt Submitted ‡
Amount / Original
Currency
10/09/2019 10/10/2019 Ucsd Extn 858-534-3116 858-534-3116,CA
CAPK Pcard(CAPL Pcard)
No 695.00 USD / 695.00
10.Transaction Date
Posting Date Merchant
General Ledger Code Unit
Receipt Submitted ‡
Amount / Original
Currency
10/10/2019 10/14/2019 Double Tree Sacramento,CA
CAPK Pcard(CAPL Pcard)
No 220.02 USD / 220.02
11.Transaction Date
Posting Date Merchant
General Ledger Code Unit
Receipt Submitted ‡
Amount / Original
Currency
10/10/2019 10/14/2019 Double Tree Sacramento,CA
CAPK Pcard(CAPL Pcard)
No 220.02 USD / 220.02
12.Transaction Date
Posting Date Merchant
General Ledger Code Unit
Receipt Submitted ‡
Amount / Original
Currency
10/18/2019 10/21/2019 Hyatt Regency Sacramento 8885884384,CA
CAPK Pcard(CAPL Pcard)
No 437.62 USD / 437.62
13.Transaction Date
Posting Date Merchant
General Ledger Code Unit
Receipt Submitted ‡
Amount / Original
Currency
10/18/2019 10/21/2019 Hyatt Regency Sacramento 8885884384,CA
CAPK Pcard(CAPL Pcard)
No 397.62 USD / 397.62
14.Transaction Date
Posting Date Merchant
General Ledger Code Unit
Receipt Submitted ‡
Amount / Original
Currency
10/21/2019 10/23/2019 Victorville Chevrolet 760-955-8200,CA
CAPK Pcard(CAPL Pcard)
No 561.61 USD / 561.61
15.Transaction Date
Posting Date Merchant
General Ledger Code Unit
Receipt Submitted ‡
Amount / Original
Currency
10/21/2019 10/24/2019 Office Depot #952 Bakersfield,CA
CAPK Pcard(CAPL Pcard)
No 114.04 USD / 114.04
Page 2 of 3Commercial Card Expense Reporting
11/1/2019https://wellsonecard.ceo.wellsfargo.com/ccer/ksoPrintTransactionsPopup.spring
E11
257

Home | About Wells Fargo | Security Guarantee | Privacy, Security & Legal© Copyright 2000 - 2019 Wells Fargo. All rights reserved.
16.Transaction Date
Posting Date Merchant
General Ledger Code Unit
Receipt Submitted ‡
Amount / Original
Currency
10/23/2019 10/25/2019 Office Depot #952 Bakersfield,CA
CAPK Pcard(CAPL Pcard)
No 89.09 USD / 89.09
17.Transaction Date
Posting Date Merchant
General Ledger Code Unit
Receipt Submitted ‡
Amount / Original
Currency
10/25/2019 10/28/2019 Target 00027151 Bakersfield,CA
CAPK Pcard(CAPL Pcard)
No 100.00 USD / 100.00
Total Charges: 6,699.62 USD
‡ - The Receipt Submitted column indicates that a receipt was submitted via fax, email, at the statement level, or using a system other than the Commercial Card Expense Reporting service.
---End of Report---
Page 3 of 3Commercial Card Expense Reporting
11/1/2019https://wellsonecard.ceo.wellsfargo.com/ccer/ksoPrintTransactionsPopup.spring
E12
258

11/01/2019 02:37 PM PTRequested By: ALBITRE, ROSEMARY
Statement Expenses
Cardholder Summary
Charges
1.Transaction Date
Posting Date Merchant
General Ledger Code Unit
Receipt Submitted ‡
Amount / Original Currency
10/03/2019 10/04/2019 Paypal Californiac 402-935-7733,CA
CAPK Pcard(CAPL Pcard)
No 50.00 USD / 50.00
2.Transaction Date
Posting Date Merchant
General Ledger Code Unit
Receipt Submitted ‡
Amount / Original Currency
10/16/2019 10/17/2019 Sheraton Gateway Los Ang Los Angeles,CA
CAPK Pcard(CAPL Pcard)
No 207.09 USD / 207.09
3.Transaction Date
Posting Date Merchant
General Ledger Code Unit
Receipt Submitted ‡
Amount / Original Currency
10/15/2019 10/17/2019 Abm Skyview Center 4808 Los Angeles,CA
CAPK Pcard(CAPL Pcard)
No 17.55 USD / 17.55
4.Transaction Date
Posting Date Merchant
General Ledger Code Unit
Receipt Submitted ‡
Amount / Original Currency
10/22/2019 10/23/2019 Sq Bakersfield Dow 877-417-4551,CA
CAPK Pcard(CAPL Pcard)
No 220.00 USD / 220.00
5.Transaction Date
Posting Date Merchant
General Ledger Code Unit
Receipt Submitted ‡
Amount / Original Currency
10/26/2019 10/28/2019 San Fernando Valley Bu 323-549-5225,CA
CAPK Pcard(CAPL Pcard)
No 49.95 USD / 49.95
6.Transaction Date
Posting Date Merchant
General Ledger Code Unit
Receipt Submitted ‡
Amount / Original Currency
10/30/2019 10/31/2019 Food-ex Bakersfield,CA
CAPK Pcard(CAPL Pcard)
No 239.52 USD / 239.52
Cardholder Name: TOBIAS, JEREMYCard Number: xxxx-xxxx-xxxx-7066Status: OpenCharges: 784.11 USDOut-of-pocket: 0.00 USDTotal Amount: 784.11 USD
Start Date: 10/01/2019End Date: 10/31/2019Reminder Period:11/01/2019 through 11/03/2019Grace Period:11/04/2019 through 11/06/2019Approval Period:11/07/2019 through 11/10/2019Download Period:11/11/2019 through 11/28/2019
Page 1 of 2Commercial Card Expense Reporting
11/1/2019https://wellsonecard.ceo.wellsfargo.com/ccer/ksoPrintTransactionsPopup.spring
E13
259

Home | About Wells Fargo | Security Guarantee | Privacy, Security & Legal© Copyright 2000 - 2019 Wells Fargo. All rights reserved.
Total Charges: 784.11 USD
‡ - The Receipt Submitted column indicates that a receipt was submitted via fax, email, at the statement level, or using a system other than the Commercial Card Expense Reporting service.
---End of Report---
Page 2 of 2Commercial Card Expense Reporting
11/1/2019https://wellsonecard.ceo.wellsfargo.com/ccer/ksoPrintTransactionsPopup.spring
E14
260

11/01/2019 02:38 PM PTRequested By: ALBITRE, ROSEMARY
Statement Expenses
Cardholder Summary
Charges
1.Transaction Date
Posting Date Merchant
General Ledger Code Unit
Receipt Submitted ‡
Amount / Original Currency
10/07/2019 10/09/2019 United 0162476198055 800-932-2732,TX
CAPK Pcard(CAPL Pcard)
Yes 749.80 USD / 749.80
2.Transaction Date
Posting Date Merchant
General Ledger Code Unit
Receipt Submitted ‡
Amount / Original Currency
10/07/2019 10/09/2019 United 0162476198057 800-932-2732,TX
CAPK Pcard(CAPL Pcard)
Yes 749.80 USD / 749.80
3.Transaction Date
Posting Date Merchant
General Ledger Code Unit
Receipt Submitted ‡
Amount / Original Currency
10/09/2019 10/10/2019 Ring Multicam Yearly Httpsring.com,CA
CAPK Pcard(CAPL Pcard)
Yes 100.00 USD / 100.00
4.Transaction Date
Posting Date Merchant
General Ledger Code Unit
Receipt Submitted ‡
Amount / Original Currency
10/10/2019 10/14/2019 Holiday Inn Express Sacr Sacramento,CA
CAPK Pcard(CAPL Pcard)
Yes 220.39 USD / 220.39
5.Transaction Date
Posting Date Merchant
General Ledger Code Unit
Receipt Submitted ‡
Amount / Original Currency
10/16/2019 10/18/2019 United 0161541791506 800-932-2732,TX
CAPK Pcard(CAPL Pcard)
Yes 200.00 USD / 200.00
6.Transaction Date
Posting Date Merchant
General Ledger Code Unit
Receipt Submitted ‡
Amount / Original Currency
10/20/2019 10/21/2019 Yes 445.40 USD / 445.40
Cardholder Name: WAGNER, EMILIOCard Number: xxxx-xxxx-xxxx-7041Status: Cardholder ReviewedCharges: 2,732.80 USDOut-of-pocket: 0.00 USDTotal Amount: 2,732.80 USD
Start Date: 10/01/2019End Date: 10/31/2019Reminder Period:11/01/2019 through 11/03/2019Grace Period:11/04/2019 through 11/06/2019Approval Period:11/07/2019 through 11/10/2019Download Period:11/11/2019 through 11/28/2019
Page 1 of 2Commercial Card Expense Reporting
11/1/2019https://wellsonecard.ceo.wellsfargo.com/ccer/ksoPrintTransactionsPopup.spring
E15
261

Home | About Wells Fargo | Security Guarantee | Privacy, Security & Legal© Copyright 2000 - 2019 Wells Fargo. All rights reserved.
Mindbody, Inc 805-4762700,CA
CAPK Pcard(CAPL Pcard)
7.Transaction Date
Posting Date Merchant
General Ledger Code Unit
Receipt Submitted ‡
Amount / Original Currency
10/20/2019 10/21/2019 Onestepgpscom 181-865-9203,CA
CAPK Pcard(CAPL Pcard)
Yes 209.25 USD / 209.25
8.Transaction Date
Posting Date Merchant
General Ledger Code Unit
Receipt Submitted ‡
Amount / Original Currency
10/28/2019 10/29/2019 Chevron 0098109 Bakersfield,CA
CAPK Pcard(CAPL Pcard)
Yes 58.16 USD / 58.16
Total Charges: 2,732.80 USD
‡ - The Receipt Submitted column indicates that a receipt was submitted via fax, email, at the statement level, or using a system other than the Commercial Card Expense Reporting service.
---End of Report---
Page 2 of 2Commercial Card Expense Reporting
11/1/2019https://wellsonecard.ceo.wellsfargo.com/ccer/ksoPrintTransactionsPopup.spring
E16
262

Home | About Wells Fargo | Security Guarantee | Privacy, Security & Legal© Copyright 2000 - 2019 Wells Fargo. All rights reserved.
11/01/2019 02:39 PM PTRequested By: ALBITRE, ROSEMARY
Statement Expenses
Cardholder Summary
Charges
1. TransactionDate
Posting Date Merchant
General Ledger Code Unit
Receipt Submitted ‡
Amount / Original Currency
10/09/2019 10/10/2019 Paypal Kerncountyc 402-935-7733,CA
CAPK Pcard(CAPL Pcard)
No 25.00 USD / 25.00
Total Charges: 25.00 USD
‡ - The Receipt Submitted column indicates that a receipt was submitted via fax, email, at the statement level, or using a system other than the Commercial Card Expense Reporting service.
---End of Report---
Cardholder Name: WEBSTER, TRACYCard Number: xxxx-xxxx-xxxx-6993Status: OpenCharges: 25.00 USDOut-of-pocket: 0.00 USDTotal Amount: 25.00 USD
Start Date: 10/01/2019End Date: 10/31/2019Reminder Period:11/01/2019 through 11/03/2019Grace Period:11/04/2019 through 11/06/2019Approval Period:11/07/2019 through 11/10/2019Download Period:11/11/2019 through 11/28/2019
Page 1 of 1Commercial Card Expense Reporting
11/1/2019https://wellsonecard.ceo.wellsfargo.com/ccer/ksoPrintTransactionsPopup.spring
E17
263

2019/20 3/1/19 - 10/31/19 % AvailableBudget Actual Expended Budget
USDA Revenue (Note A) 1,472,134 877,861 59.6% 594,273 Head Start Subsidy 709,204 566,313 79.9% 142,891
Total Revenue 2,181,338 1,444,174 66.2% 737,164 Expenditures (Note B)
Salaries 650,054 416,202 64.0% 233,852 Benefits 214,518 143,642 67.0% 70,876 Vehicle Gasoline, Repair/Maintenance 70,000 33,116 47.3% 36,884 Space Costs 101,200 93,812 92.7% 7,388 Supplies - Office & Food Service 114,900 86,057 74.9% 28,843 Equipment Repair/Maintenance & Lease 6,000 12,202 203.4% (6,202) Communication 13,000 7,554 58.1% 5,446 Risk Insurance 12,700 11,428 90.0% 1,272 Printing 1,700 415 24.4% 1,285 Hiring & Employee Costs 1,800 25 1.4% 1,775 First Aid 2,600 1,016 39.1% 1,584 Other Miscellaneous Costs - 28 - Not budgetedRaw Food/Vended Meals 1,047,490 447,095 42.7% 600,395
Sub Total 2,235,962 1,252,592 56.0% 983,370
Adult Meals Prepared 188,000 108,520 57.7% 79,480
Indirect 133,376 83,062 62.3% 50,314
Total Expenditures 2,557,338 1,444,174 56.5% 1,113,164
Prior Period October 2019 CumulativeTotal Meals Prepared and Vended (Note C) 449,432 86,837 536,269 Total Meals Claimed 325,016 68,467 393,483
Difference 124,416 18,370 142,786
Percentage Claimed to Prepared/Vended 78.8% 73.4%
Note A: Source of USDA revenue is monthly report submitted to California Department of Education by Head Start/State Child Development Program Division. Revenue is reimbursement for meals claimed.Note B: Expenditures are for meals prepared, including vended meals.Note C: Total number of meals delivered to the centers and homebase excluding adult prepared and adult meals vended. The total represents the number of meals available to be served to center and homebase children.
COMMUNITY ACTION PARTNERSHIP OF KERNCENTRAL KITCHEN - BUDGET TO ACTUAL
FOR THE PERIOD MARCH 1, 2019 TO FEBRUARY 29, 2020 (7 OF 12 MONTHS OR 66.66%)
Line Item
F1
264

% Earne
dCo
ntract CMAP
‐700
0July 201
9Au
g 20
19Sept 201
9Oct 201
9Nov
201
9De
c 20
19Jan 20
20Feb 20
20Mar 202
0Ap
r 20
20May 202
0June
202
0To
tal
%to M
RA
Provider Paymen
ts46
3,47
4$
624,23
6$
547,76
8$
‐$
‐$
‐$
‐$
‐$
‐$
‐$
‐$
‐$
1,63
5,47
8$
Add: Fam
ily Fees
7,02
0
9,94
8
10,000
‐
‐
‐
‐
‐
‐
‐
‐
‐
26,968
$
Net Provide
r Paymen
ts47
0,49
5$
634,18
4$
557,76
8$
‐$
‐$
‐$
‐$
‐$
‐$
‐$
‐$
‐$
1,66
2,44
7$
83.38%
Maxim
um Reimbu
rseable Am
ount (M
RA)
for P
rovide
r Paymen
ts7,907,363
21.02%
Administratio
n & Sup
port Services R
even
ueProvider Paymen
ts47
0,49
5$
634,18
4$
557,76
8$
‐$
‐$
‐$
‐$
‐$
‐$
‐$
‐$
‐$
1,66
2,44
7$
Reim
bursem
ent R
ate
x 21.21
21%
x 21.21
21%
x 21.21
21%
x 21.21
21%
x 21.21
21%
x 21.21
21%
x 21.21
21%
x 21.21
21%
x 21.21
21%
x 21.21
21%
x 21.21
21%
x 21.21
21%
x 21.21
21%
Revenu
e Earned
99,802
$
134,52
4$
118,31
4$
‐$
‐$
‐$
‐$
‐$
‐$
‐$
‐$
‐$
352,64
0$
Program Adm
inistratio
n/Supp
ort S
ervices C
osts
44,434
95,913
59,514
‐
‐
‐
‐
‐
‐
‐
‐
‐
199,86
1
10.02%
Indirect (1
0% x M
TDC) Costs
50,744
72,175
61,911
‐
‐
‐
‐
‐
‐
‐
‐
‐
184,83
0
6.60
%Transfer Indirect to
CSBG
‐
‐
(53,27
6)
‐
‐
‐
‐
‐
‐
‐
‐
‐
(53,27
6)
Total O
peratin
g Co
sts
95,178
$
168,08
8$
68,149
$
‐$
‐$
‐$
‐$
‐$
‐$
‐$
‐$
‐
331,41
5
16.62%
Re
venu
e Earned
Over/(Und
er) C
osts
4,62
4$
(33,56
4)$
50,165
$
‐$
‐$
‐$
‐$
‐$
‐$
‐$
‐$
‐
21,225
TOTA
L CO
STS ‐ N
ET OF FA
MILY FEES
565,67
3$
802,27
2$
625,91
7$
‐$
‐$
‐$
‐$
‐$
‐$
‐$
‐$
‐$
1,99
3,86
1
100.00
%
Note 1: Adm
inistratio
n and Supp
ort S
ervices reven
ue is earne
d based on
the am
ount of p
rovide
r paymen
ts incurred
. Exam
ple:
Provider paymen
t s1,66
2,44
7 Re
imbu
rsem
ent R
ate (17.5%
/ 82
.5%)
x 21
.212
1% Re
venu
e Earned
352,64
0
Note 2: The
maxim
um re
imbu
rseable am
ount per th
e 20
17/18 State contract is as follows:
Provider Paymen
t s7,90
7,36
382
.50%
Ad
ministratio
n 1,43
7,70
215
.00%
Supp
ort S
ervices
239,61
72.50
% Maxim
um Reimbu
rsable Amou
nt (M
RA)
9,58
4,68
210
0.00
%
Note 3: The
MRA
for 2
019/20
is $1,12
6,87
7 greater than 20
18/19
COMMUNITY ACTION PARTN
ERSH
IP OF KER
N
STATE
DEP
ARTM
ENT OF ED
UCATION CONTR
ACT ‐ MIGRANT ALTER
NATIVE PAYMEN
T
FOR THE PER
IOD 7/1/19 ‐ 6/30/20 (3 OF 12 M
ONTH
S = 25.0%)
G1
265

% Earne
dJul‐1
9Au
g‐19
Sep‐19
Oct‐19
Nov
‐19
Dec‐19
Jan‐20
Feb‐20
Mar‐20
Apr‐20
May‐20
Jun‐20
TOTA
Lto M
RA
GEN
ERAL
CHILD
CAR
E (CCT
R‐90
50)
Adjusted
Days o
f Enrollm
ent ‐ Certified
5,07
1
4,59
7
4,40
8
5,62
1
‐
‐
‐
‐
‐
‐
‐
‐
19,698
Reim
bursem
ent R
ate pe
r Child per Da y
X $49
.54
X $49
.54
X $49
.54
X $49
.54
X $49
.54
X $49
.54
X $49
.54
X $49
.54
X $49
.54
X $49
.54
X $49
.54
X $49
.54
X $49
.54
Revenu
e Earned
251,24
0$
227,73
6$
218,37
9$
278,46
3$
‐$
‐$
‐$
‐$
‐$
‐$
‐$
‐$
975,81
7$
27.60%
Maxim
um Reimbu
rseable Am
ount (M
RA)
$3,535,022
CALIFO
RNIA STA
TE PRE
SCHO
OL (CSPP‐91
21)
Adjusted
Days o
f Enrollm
ent ‐ Certified
1,90
5
1,99
5
3,21
9
7,21
7
‐
‐
‐
‐
‐
‐
‐
‐
14,335
Reim
bursem
ent R
ate pe
r Child per Da y
X $49
.85
X $49
.85
X $49
.85
X $49
.85
X $49
.85
X $49
.85
X $49
.85
X $49
.85
X $49
.85
X $49
.85
X $49
.85
X $49
.85
X $49
.85
Revenu
e Earned
94,952
$
99,451
$
160,45
7$
359,75
7$
‐$
‐$
‐$
‐$
‐$
‐$
‐$
‐$
714,61
7$
16.36%
Maxim
um Reimbu
rseable Am
ount (M
RA)
$4,367,697
MIGRA
NT CH
ILD CA
RE (C
MIG‐900
4)Ad
justed
Days o
f Enrollm
ent ‐ Certified
298
257
228
143
‐
‐
‐
‐
‐
‐
‐
‐
926
Reim
bursem
ent R
ate pe
r Child per Da y
X $49
.54
X $49
.54
X $49
.54
X $49
.54
X $49
.54
X $49
.54
X $49
.54
X $49
.54
X $49
.54
X $49
.54
X $49
.54
X $49
.54
X $49
.54
Revenu
e Earned
14,766
$
12,732
$
11,317
$
7,07
3$
‐$
‐$
‐$
‐$
‐$
‐$
‐$
‐$
45,889
$
18.04%
Maxim
um Reimbu
rseable Am
ount (M
RA)
$254,377
Note 1: Sou
rce of adjusted days of e
nrollm
ent for certified children is the mon
thly atten
dance repo
rt prepared by
the Fiscal
De
pt. of the
Head Start/State Ch
ild Develop
men
t Division
.
Note 2: Sou
rce of re
imbu
rsem
ent rate pe
r child per day and
maxim
um re
imbu
rseable am
ount is per th
e 20
19/20 State contracts.
COMMUNITY ACTION PARTN
ERSH
IP OF KER
N
STATE
DEP
ARTM
ENT OF ED
UCATION 2019/20 CONTR
ACTS ‐ EARNED
REV
ENUE
FOR THE PER
IOD 7/1/19 ‐ 6/30/20 (4 OF 12 M
ONTH
S = 33.3%)
G2
266

H1
Other: Total Division Staffing: 18 positions, 1 vacancy (Administrative Assistant to CFO)
CFO Controller Accounting Manager Finance Manager Payroll Manager Payroll Specialists (2) Accountant (4) Accounting Specialist Accounting Technician (5) Administrative Assistant to CFO
Division/CFO: Tracy Webster, CFO Month/Year: OCTOBER 2019 Program/Work Unit: Not Applicable Controller: Lorraine Casillas Services: Overall financial and accounting functions of the organization
Activities OCTOBER 2019 Year to Date (3/1/19 ‐10/31/19)
Description Number Amount Number Amount
Bank Deposits 10 4,160,867 71 21,462,197 Wire Deposits 5 213,396 29 1,117,383 Head Start/IRS Drawdowns 6 2,353,148 41 20,663,797 Vendor Checks Issued 1126 2,636,986 7,625 19,849,438
Payroll Disbursed 2,516,135 19,849,438 Grant Reports Prepared in October 2019 24 123
Cal Fresh Outreach CCTR CMAP CMIG CMSS CSPP CSBG Discretionary Commodity Supplemental Food Program Differential Response DOE Economic Empowerment First 5 Kern – Help Me Grow First 5 East Kern Family Resource Center Head Start/ Early Head Start Kern SF‐425 Head Start Partnership SF‐425 Hospital Preparedness Program ‐ 211 HUD – Coordinated Entry System Home Visit Initiative LIHEAP 2019 Positive Youth Development Services TEFAP Emergency Food Assist VITA WIC
267
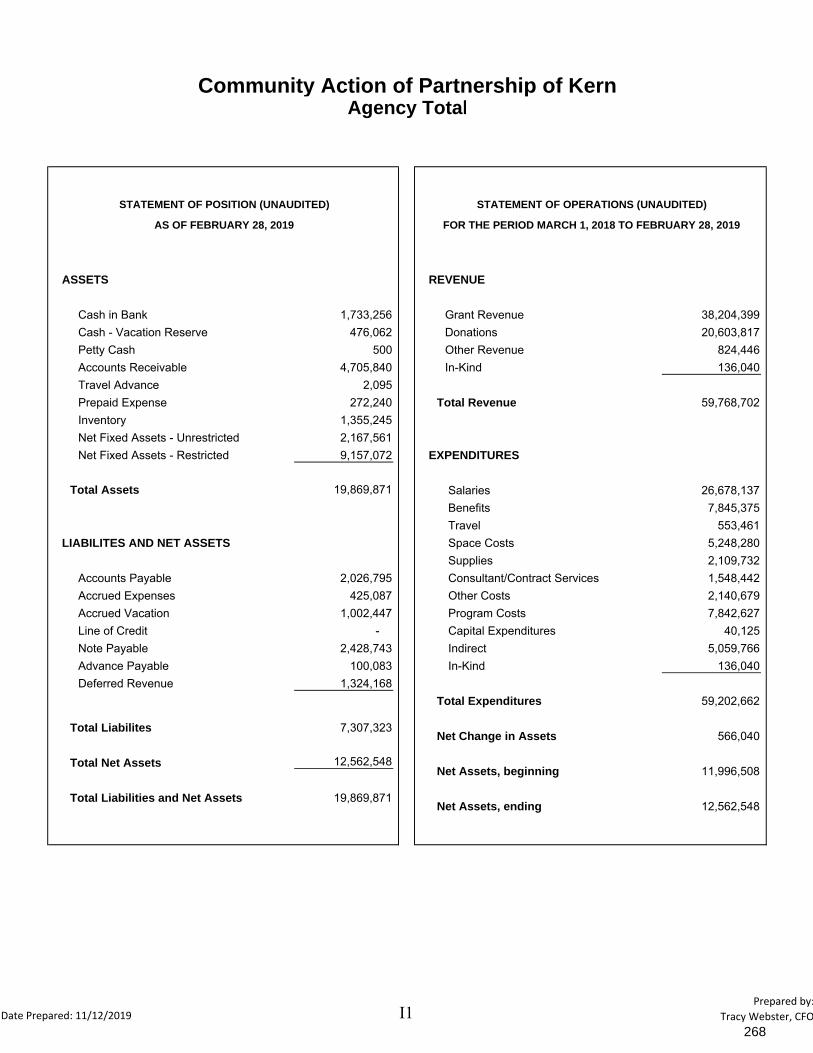
Community Action of Partnership of KernAgency Total
ASSETS REVENUE
Cash in Bank 1,733,256 Grant Revenue 38,204,399 Cash - Vacation Reserve 476,062 Donations 20,603,817 Petty Cash 500 Other Revenue 824,446 Accounts Receivable 4,705,840 In-Kind 136,040 Travel Advance 2,095 Prepaid Expense 272,240 Total Revenue 59,768,702 Inventory 1,355,245 Net Fixed Assets - Unrestricted 2,167,561 Net Fixed Assets - Restricted 9,157,072 EXPENDITURES
Salaries 26,678,137 Benefits 7,845,375 Travel 553,461 Space Costs 5,248,280 Supplies 2,109,732
Accounts Payable 2,026,795 Consultant/Contract Services 1,548,442 Accrued Expenses 425,087 Other Costs 2,140,679 Accrued Vacation 1,002,447 Program Costs 7,842,627 Line of Credit - Capital Expenditures 40,125 Note Payable 2,428,743 Indirect 5,059,766 Advance Payable 100,083 In-Kind 136,040 Deferred Revenue 1,324,168
Total Expenditures 59,202,662
Net Change in Assets 566,040
Net Assets, beginning 11,996,508
Net Assets, ending 12,562,548 Total Liabilities and Net Assets 19,869,871
Total Liabilites 7,307,323
Total Net Assets 12,562,548
Total Assets 19,869,871
LIABILITES AND NET ASSETS
STATEMENT OF POSITION (UNAUDITED) STATEMENT OF OPERATIONS (UNAUDITED)
AS OF FEBRUARY 28, 2019 FOR THE PERIOD MARCH 1, 2018 TO FEBRUARY 28, 2019
Date Prepared: 11/12/2019 I1Prepared by:
Tracy Webster, CFO268

Community Action of Partnership of KernAgency Total
ASSETS REVENUE
Cash in Bank 5,090,369 Grant Revenue 41,682,522 Cash - Vacation Reserve 645,505 Donations 302,533 Petty Cash 500 Other Revenue 1,136,475 Accounts Receivable (1,408,886) In-Kind 5,312,291 Travel Advance 10,260 Prepaid Expense 339,484 Total Revenue 48,433,821 Inventory 1,357,274 Net Fixed Assets - Unrestricted 1,668,794 Net Fixed Assets - Restricted 8,464,652 EXPENDITURES
Salaries 18,703,955 Benefits 5,621,148 Travel 471,261 Space Costs 4,140,634 Supplies 1,693,009
Accounts Payable 830,340 Consultant/Contract Services 1,804,066 Accrued Expenses (61,364) Other Costs 1,659,500 Accrued Vacation 632,370 Program Costs 5,547,309 Line of Credit - Capital Expenditures 154,587 Note Payable 1,954,721 Indirect 3,464,831 Advance Payable 3,185 In-Kind 5,312,291 Deferred Revenue 384,923
Total Expenditures 48,572,593
Net Change in Assets (138,772)
Net Assets, beginning 12,562,548
Net Assets, ending 12,423,776
STATEMENT OF POSITION (UNAUDITED) STATEMENT OF OPERATIONS (UNAUDITED)
AS OF OCTOBER 31, 2019 FOR THE PERIOD MARCH 1, 2019 TO OCTOBER 31, 2019
Total Assets 16,167,951
LIABILITES AND NET ASSETS
Total Liabilities and Net Assets 16,167,951
Total Liabilites 3,744,175
Total Net Assets 12,423,776
Date Prepared: 11/12/2019 J2Prepared by:
Tracy Webster, CFO269

CO
MM
UN
ITY
AC
TIO
N P
AR
TN
ER
SH
IP O
F K
ER
NB
UD
GE
T T
O A
CT
UA
LF
OR
TH
E P
ER
IOD
03-
01-1
8 T
O 1
0-31
-19
(66.
67%
)
AG
EN
CY
TO
TA
L
AN
NU
AL
BU
DG
ET
EX
PE
ND
ITU
RE
SB
UD
GE
T
AV
AIL
AB
LEP
ER
CE
NT
AG
E
EX
PE
ND
ED
E
XP
EN
DIT
UR
ES
SA
LAR
IES
30,8
16,9
89
17
,017
,247
13,7
99,7
42
55
%
BE
NE
FIT
S9,
792,
653
5,
193,
010
4,
599,
643
53
%
TR
AV
EL
604,
666
389,
683
214,
983
64%
SP
AC
E C
OS
T7,
859,
253
3,
140,
183
4,
719,
070
40
%
SU
PP
LIE
S2,
343,
556
1,
591,
637
75
1,91
9
68
%
EQ
UIP
ME
NT
99,0
00
101,
668
(2,6
68)
10
3%
CO
NS
ULT
AN
T/C
ON
TR
AC
T S
ER
VIC
ES
2,76
5,70
4
1,31
3,51
3
1,45
2,19
1
47%
OT
HE
R C
OS
TS
2,88
8,00
1
1,42
6,92
4
1,46
1,07
7
49%
PR
OG
RA
M C
OS
TS
9,51
3,50
8
5,46
6,04
2
4,04
7,46
6
57%
IND
IRE
CT
5,71
7,62
5
3,45
2,05
6
2,26
5,56
9
60%
TO
TA
L72
,400
,955
39,0
91,9
64
33
,308
,991
54%
DA
TE
PR
EP
AR
ED
: 11
/7/2
019
PA
GE
1 O
F 7
P
RE
PA
RE
D B
Y: T
racy
Web
ster
, CF
O
270

CO
MM
UN
ITY
AC
TIO
N P
AR
TN
ER
SH
IP O
F K
ER
NB
UD
GE
T T
O A
CT
UA
LF
OR
TH
E P
ER
IOD
03-
01-1
8 T
O 1
0-31
-19
(66.
67%
)
E
XP
EN
DIT
UR
ES
SA
LAR
IES
BE
NE
FIT
S
TR
AV
EL
SP
AC
E C
OS
T
SU
PP
LIE
S
EQ
UIP
ME
NT
CO
NS
ULT
AN
T/C
ON
TR
AC
T S
ER
VIC
ES
OT
HE
R C
OS
TS
PR
OG
RA
M C
OS
TS
IND
IRE
CT
TO
TA
L
ED
UC
AT
ION
AN
NU
AL
BU
DG
ET
EX
PE
ND
ITU
RE
SB
UD
GE
T
AV
AIL
AB
LEP
ER
CE
NT
AG
E
EX
PE
ND
ED
24,0
84,2
09
13
,073
,601
11,0
10,6
08
54
%
7,85
6,78
8
4,14
6,73
3
3,71
0,05
5
53%
323,
485
232,
111
91,3
74
72%
6,81
1,54
0
2,37
3,26
9
4,43
8,27
1
35%
1,97
4,00
4
1,22
7,13
6
746,
868
62%
-
-
-
0%
1,21
9,18
0
452,
918
766,
262
37%
1,37
7,99
8
813,
193
564,
805
59%
7,12
0,30
5
4,32
8,83
4
2,79
1,47
1
61%
4,11
9,10
8
2,62
9,43
7
1,48
9,67
1
64%
54,8
86,6
17
29
,277
,231
25,6
09,3
86
53
%
DA
TE
PR
EP
AR
ED
: 11
/7/2
019
PA
GE
2 O
F 7
P
RE
PA
RE
D B
Y: T
racy
Web
ster
, CF
O
271

CO
MM
UN
ITY
AC
TIO
N P
AR
TN
ER
SH
IP O
F K
ER
NB
UD
GE
T T
O A
CT
UA
LF
OR
TH
E P
ER
IOD
03-
01-1
8 T
O 1
0-31
-19
(66.
67%
)
E
XP
EN
DIT
UR
ES
SA
LAR
IES
BE
NE
FIT
S
TR
AV
EL
SP
AC
E C
OS
T
SU
PP
LIE
S
EQ
UIP
ME
NT
CO
NS
ULT
AN
T/C
ON
TR
AC
T S
ER
VIC
ES
OT
HE
R C
OS
TS
PR
OG
RA
M C
OS
TS
IND
IRE
CT
TO
TA
L
NU
TR
ITIO
N
AN
NU
AL
BU
DG
ET
EX
PE
ND
ITU
RE
SB
UD
GE
T
AV
AIL
AB
LEP
ER
CE
NT
AG
E
EX
PE
ND
ED
3,64
8,57
9
2,00
9,69
4
1,63
8,88
5
55%
1,11
5,93
5
558,
726
557,
209
50%
118,
450
99,9
88
18,4
62
84%
573,
934
453,
635
120,
299
79%
213,
074
219,
326
(6,2
52)
10
3%
98,0
00
97,8
89
111
10
0%
8,98
5
2,
207
6,77
8
25
%
599,
558
260,
373
339,
185
43%
1,68
5,55
1
774,
854
910,
697
46%
625,
888
381,
425
244,
463
61%
8,68
7,95
4
4,85
8,11
7
3,82
9,83
7
56%
DA
TE
PR
EP
AR
ED
: 11
/7/2
019
PA
GE
3 O
F 7
P
RE
PA
RE
D B
Y: T
racy
Web
ster
, CF
O
272

CO
MM
UN
ITY
AC
TIO
N P
AR
TN
ER
SH
IP O
F K
ER
NB
UD
GE
T T
O A
CT
UA
LF
OR
TH
E P
ER
IOD
03-
01-1
8 T
O 1
0-31
-19
(66.
67%
)
E
XP
EN
DIT
UR
ES
SA
LAR
IES
BE
NE
FIT
S
TR
AV
EL
SP
AC
E C
OS
T
SU
PP
LIE
S
EQ
UIP
ME
NT
CO
NS
ULT
AN
T/C
ON
TR
AC
T S
ER
VIC
ES
OT
HE
R C
OS
TS
PR
OG
RA
M C
OS
TS
IND
IRE
CT
TO
TA
L
EN
ER
GY
CO
NS
ER
VA
TIO
N
AN
NU
AL
BU
DG
ET
EX
PE
ND
ITU
RE
SB
UD
GE
T
AV
AIL
AB
LEP
ER
CE
NT
AG
E
EX
PE
ND
ED
1,59
2,18
6
1,03
8,52
5
553,
661
65%
416,
928
235,
040
181,
888
56%
106,
561
37,5
14
69,0
47
35%
252,
069
131,
443
120,
626
52%
82,2
22
93,7
28
(11,
506)
11
4%
-
3,78
0
(3
,780
)
Not
bud
get
ed
1,44
6,73
9
828,
406
618,
333
57%
730,
217
275,
803
454,
414
38%
683,
802
351,
205
332,
597
51%
435,
584
292,
602
142,
982
67%
5,74
6,30
8
3,28
8,04
5
2,45
8,26
3
57%
DA
TE
PR
EP
AR
ED
: 11
/7/2
019
PA
GE
4 O
F 7
P
RE
PA
RE
D B
Y: T
racy
Web
ster
, CF
O
273

CO
MM
UN
ITY
AC
TIO
N P
AR
TN
ER
SH
IP O
F K
ER
NB
UD
GE
T T
O A
CT
UA
LF
OR
TH
E P
ER
IOD
03-
01-1
8 T
O 1
0-31
-19
(66.
67%
)
E
XP
EN
DIT
UR
ES
SA
LAR
IES
BE
NE
FIT
S
TR
AV
EL
SP
AC
E C
OS
T
SU
PP
LIE
S
EQ
UIP
ME
NT
CO
NS
ULT
AN
T/C
ON
TR
AC
T S
ER
VIC
ES
OT
HE
R C
OS
TS
PR
OG
RA
M C
OS
TS
IND
IRE
CT
TO
TA
L
CO
MM
UN
ITY
SE
RV
ICE
S
AN
NU
AL
BU
DG
ET
EX
PE
ND
ITU
RE
SB
UD
GE
T
AV
AIL
AB
LEP
ER
CE
NT
AG
E
EX
PE
ND
ED
807,
941
482,
120
325,
821
60%
221,
237
110,
560
110,
677
50%
39,3
80
13,1
99
26,1
81
34%
94,3
85
84,5
78
9,80
7
90
%
55,4
81
38,0
24
17,4
58
69%
1,00
0
-
1,
000
0%
88,5
50
9,97
4
78
,576
11
%
95,4
17
48,7
97
46,6
20
51%
17,3
50
8,28
9
9,
061
48%
128,
571
77,2
74
51,2
97
60%
1,54
9,31
2
872,
813
676,
499
56%
DA
TE
PR
EP
AR
ED
: 11
/7/2
019
PA
GE
5 O
F 7
P
RE
PA
RE
D B
Y: T
racy
Web
ster
, CF
O
274

CO
MM
UN
ITY
AC
TIO
N P
AR
TN
ER
SH
IP O
F K
ER
NB
UD
GE
T T
O A
CT
UA
LF
OR
TH
E P
ER
IOD
03-
01-1
8 T
O 1
0-31
-19
(66.
67%
)
E
XP
EN
DIT
UR
ES
SA
LAR
IES
BE
NE
FIT
S
TR
AV
EL
SP
AC
E C
OS
T
SU
PP
LIE
S
EQ
UIP
ME
NT
CO
NS
ULT
AN
T/C
ON
TR
AC
T S
ER
VIC
ES
OT
HE
R C
OS
TS
PR
OG
RA
M C
OS
TS
IND
IRE
CT
TO
TA
L
CS
BG
AN
NU
AL
BU
DG
ET
EX
PE
ND
ITU
RE
SB
UD
GE
T
AV
AIL
AB
LEP
ER
CE
NT
AG
E
EX
PE
ND
ED
680,
074
412,
102
267,
972
61%
180,
940
141,
807
39,1
33
78%
16,7
90
6,84
8
9,
942
41%
123,
125
93,3
86
29,7
39
76%
16,5
75
10,6
84
5,89
1
64
%
-
-
-
0%
2,25
0
21
8
2,03
2
10
%
58,5
51
18,4
48
40,1
03
32%
6,50
0
2,
861
3,63
9
44
%
404,
726
68,2
32
336,
494
17%
1,48
9,53
1
754,
585
734,
946
51%
DA
TE
PR
EP
AR
ED
: 11
/7/2
019
PA
GE
6 O
F 7
P
RE
PA
RE
D B
Y: T
racy
Web
ster
, CF
O
275

CO
MM
UN
ITY
AC
TIO
N P
AR
TN
ER
SH
IP O
F K
ER
NB
UD
GE
T T
O A
CT
UA
LF
OR
TH
E P
ER
IOD
03-
01-1
8 T
O 1
0-31
-19
(66.
67%
)
E
XP
EN
DIT
UR
ES
SA
LAR
IES
BE
NE
FIT
S
TR
AV
EL
SP
AC
E C
OS
T
SU
PP
LIE
S
EQ
UIP
ME
NT
CO
NS
ULT
AN
T/C
ON
TR
AC
T S
ER
VIC
ES
OT
HE
R C
OS
TS
PR
OG
RA
M C
OS
TS
IND
IRE
CT
TO
TA
L
DIS
CR
ET
ION
AR
Y &
FU
ND
RA
ISIN
G
AN
NU
AL
BU
DG
ET
EX
PE
ND
ITU
RE
SB
UD
GE
T
AV
AIL
AB
LEP
ER
CE
NT
AG
E
EX
PE
ND
ED
4,00
0
1,
206
2,79
4
30
%
825
14
4
681
17
%
0
23
(23)
N
ot b
udg
eted
4,20
0
3,
872
328
92
%
2,20
0
2,
739
(539
)
12
4%
0
-
0
0%
0
19
,791
(1
9,79
1)
Not
bud
get
ed
26,2
60
10,3
10
15,9
50
39%
0
-
0
0%
3,74
8
3,
086
662
82
%
41,2
33
41,1
72
61
10
0%
DA
TE
PR
EP
AR
ED
: 11
/7/2
019
PA
GE
7 O
F 7
P
RE
PA
RE
D B
Y: T
racy
Web
ster
, CF
O
276

%Earned/ Available
Budget Actual Expended Balance
Revenue 5,799,844$ 3,452,056$ 59.5% 2,347,788$
ExpendituresSalaries 3,070,550 1,786,564 58.2% 1,283,986
Benefits @ 24.11% actual 756,241 422,658 55.9% 333,583
Total Personnel Costs 3,826,791 2,209,222 57.7% 1,617,569
Operating Costs Travel 93,650 57,672 61.6% 35,978 Space Costs 186,800 142,220 76.1% 44,580 Supplies 166,500 128,756 77.3% 37,744 Consultant/Contract 659,100 381,720 57.9% 277,380 Other Operating Costs 345,050 211,709 61.4% 133,341
Total Operating Costs 1,451,100 922,077 63.5% 529,023
Total Expenditures 5,277,891$ 3,131,299$ 59.3% 2,146,592$
Excess Indirect Revenue 521,953$ 320,757$
Revised % AvailableBudget Actual Expended Balance
HR 1,034,632$ 543,481$ 52.5% 491,151$ Operations 1,361,350 854,883 62.8% 506,467Executive 612,204 382,675 62.5% 229,529Community Development 705,930 371,705 52.7% 334,225Finance 1,563,775 978,554 62.6% 585,221
5,277,891$ 3,131,299$ 59.3% 2,146,592$
Prepared Date: 11/07/2019
COMMUNITY ACTION PARTNERSHIP OF KERNINDIRECT FUND - FY 2019/2020
BUDGET TO ACTUAL - 3/1/19 TO 10/31/19 (8 OF 12 MONTHS =66.67%)
RECAP BY SUPPORT DIVISION
277

COMMUNITY ACTION PARTNERSHIP OF KERN
MEMORANDUM
To: Board of Directors
From: Lisa Price, Program Governance Coordinator
Date: November 20, 2019
Subject: Agenda Item VIII(a): November Policy Council Report – Action Item
The Policy Council met on October 22, 2019 at The Mark Restaurant for its member
recognition banquet and final meeting of the 2018-2019 term. Quorum was established as all
members were in attendance.
Members were recognized by Jeremy Tobias and Yolanda Gonzales for their commitment,
time and dedication in serving on the Council. Gratitude was expressed for all they do which
benefit the children and families enrolled in our program as well as our entire community. It
was expressed that Policy Council members are the foundation of the program and are the
epitome of the Promise of Community Action.
Two action items were presented to the Council by Jerry Meade, Program Design &
Management Administrator; the items were as follows:
• Head Start/Early Head Start Kern Continued Funding Application 2020-2021
• Early Head Start Child Care Partnerships and Expansion Continued Funding
Application 2020-2021
Information specific to each action item was shared, separate from one another. Upon
conclusion of each presentation a motion was made, and subsequent approval obtained for
submission of each of the respective applications to the Office of Head Start.
The first meeting of the 2019-2020 Policy Council term with new Council members will be held
on Tuesday, November 26, 2019.
278

COMMUNITY ACTION PARTNERSHIP OF KERN POLICY COUNCIL MEETING MINUTES
October 22, 2019 The Mark Restaurant 1623 19th Street, Bakersfield CA 93301
1. Call to Order – Chairperson, Amber Dunlap, called the meeting to order at 6:35 p.m.
a. Moment of Silence, Pledge of Allegiance b. Reading of The Promise of Community Action
“Community Action changes people’s lives, embodies the spirit of hope, improves communities, and makes America a better place to live. We care about the entire community, and we are dedicated to helping people help themselves and each other.”
2. Roll Call/Set Quorum – Secretary, Yolanda Mefford Quorum was established. Policy Council Members Present: Amber Dunlap, Daisy Valencia, Jacqueline Boykin, Yolanda Mefford, Isabelle Diaz, Nila Hogan, Andrea Martinez, Diana Reyes, Destiny Thompson Butler, Estela Corrales, Ana Lester, Lindsay Harrison and Yolanda Ochoa.
3. Approval of Agenda – Chairperson (**ACTION) a. A motion to approve the October 22, 2019 meeting agenda was made by Nila Hogan; Yolanda Mefford seconded. Motion
carried unanimously. 4. Approval of Minutes – Chairperson (**ACTION)
A motion to approve the September 24, 2019, Policy Council minutes was made by Diana Reyes; Jacqueline Boykin seconded. Motion carried unanimously.
5. Presentation of Guests/Public Forum The following guests were in attendance: Jeremy Tobias, CAPK CEO; Yolanda Gonzales, Director Head Start/State Child Development; Donna Holland, Fiscal Administrator; Esperanza Contreras, Partnership Administrator; Gloria Barbero, Program Administrator; Jerry Meade, Program Design & Management Administrator; Leslie Mitchell, Education & Support Services Administrator; Carolyn Coffey, Education Coordinator; Rosa Del Toro, Program Manager; Letisha Brooks, Program Manager; Mary Ann Mooney, Program Manager; Elizabeth Williams, Program Manager; Nicole Niño, Family Engagement Specialist & Home Base Supervisor; Lisa Price, Program Governance Coordinator; Leticia Villegas, Program Assistant/Translator; Silvia Ortega, Quality Assurance Manager; Elsa, Navarrete, Quality Assurance Specialist; Mayra Martinez, Assistant to Head Start Director; Ricardo Diaz; Malachi Alas; Ryan Harrison; Marian Panos; Gil Panos; Jaime Reyes; Ana Vigil; Preston Hogan and Angelina Martinez
a. (The public wishing to address the full Policy Council may do so at this time. Policy Council members may respond briefly to statements made or questions posed. However, the PC will take no action other than referring the item(s) to staff for study and analysis. Speakers are limited to five minutes each. If more than one person wishes to address the same topic, total group time for the topic will be 10 minutes. Please state your name before making your presentation. Thank you.)
6. Standing Committee Reports (five minutes each) a. School Readiness Committee – Yolanda Mefford shared that the School Readiness Committee met on three occasions.
Members learned about DRPD and other measures used to assess children in the program and how the data results help to create the school readiness goals. They also learned about new health requirements and how health and nutrition play an important role in school readiness. During the meeting which focused on family engagement, the importance of parents as their first child’s teacher and their children's advocate was emphasized.
b. Planning Committee – Diana Reyes reported that the Planning Committee met on October 1, 2019; quorum was established. Enrollment and attendance reports were reviewed for September. Early Head Start and Head Start of Kern reported 99.8 % and 85% enrollment respectively. San Joaquin EHS and Early Head Start Partnership reported full enrollment. The average daily attendance throughout the program was at 98% during this reporting period. The Child & Adult Care Food Program reported that more than 46,000 meals were prepared by the Central Kitchen during September. It was shared that staff participated in 2 recruitment events. Approval for the submission of the annual applications for Early Head Start and Head Start Kern as well as Early Head Start Child Care Partnership were reviewed and approved for the 2020 – 2021 budget year.
c. Finance Committee – Destiny Thompson Buttler, reported that as a member of the committee she has learned a lot. Destiny plans on returning to Policy Council with the hope of continuing to learn more and plans to have additional information to report in the future.
d. By-Laws Committee – Jacqueline Boykin shared that the Bylaws Committee met three times. At the beginning of the term members were provided a copy of the bylaws for review. When the committee met, there was found to be some areas of the current bylaws that could be revised. Those changes were made, and a final revision of the document took place before submitting to administrative staff for review and recommendations.
279

7. Presentations a. Recognition of 2018 – 2019 Policy Council Members ~ Yolanda Gonzales, Head Start/State Child Development Director
Ms. Gonzales & Jeremy Tobias, CAPK CEO expressed words of gratitude and presented certificates of appreciation to each Policy Council member with photographs taken by Community Development staff.
8. New Business – Chairperson (**ACTION) a. Head Start/Early Head Start Continued Funding Application 2020-2021 ~ Jerry Meade, Program Design & Management
Administrator Jerry Meade, shared information regarding a request to approve submission of the 2020-2021 continued funding application of the Head Start and Early Head Start Kern Grant. He also noted that this information was shared with members of the Policy Council Planning Committee as an action item at the October meeting and was subsequently approved. Jerry stated the Head Start/Early Head Start Kern continued funding application will describe the program design, goals and approach to delivery for the funding period March 1, 2020 – February 28, 2021. Upon conclusion of this presentation Ana Lester made a motion to approve submission of the application for continued funding of the Head Start and Early Head Start Kern Grant for the 2020-2021 budget period; Diana Reyes seconded. Motion carried unanimously.
b. Early Head Start Child Care Partnerships and Expansion Continued Funding Application 2020-2021 ~ Jerry Meade Program Design & Management Administrator Information was shared by Jerry Meade, regarding a request for approval to submit the application for the 2020-2021 continued funding of the Early Head Start Child Care Partnerships Kern Grant. A budgetary overview was shared, and it was also noted that there will be no changes requested to the program delivery options for this grant. The Early Head Start Child Care Partnership application to be submitted will describe the program design, goals and approach to delivery for the funding period March 1, 2020 – February 28, 2021. Upon conclusion of this presentation, Diana Reyes made a motion to approve the submission of the continued funding application for the Early Head Start Child Care Partnership grant for the 2020-2021 budget period; Destiny Thompson Butler seconded. Motion carried unanimously.
9. Communications a. Kern Head Start and Early Head Start Budget vs. Actual Expenditures, July 1, 2019, through September 30, 2019
b. San Joaquin Early Head Start Budget vs. Actual Expenditures, February 1, 2019, through September 30, 2019 c. Early Head Start Child Care Partnerships and Expansion Budget vs. Actual Expenditures, March 1, 2018, through
September 30, 2019 d. Parent Local Travel & Child Care through September 30, 2019 e. Parent Activity Funds through September 30, 2019 f. Funding Guidance for Head Start and Early Head Start Kern for 2020 – 2021 g. Funding Guidance for Early Head Start Child Care Partnerships and Expansion for 2020 – 2021 h. Kern Head Start and Early Head Start Non-Federal Share and In-Kind Report, March 1, 2019, through September 30,
2019 i. San Joaquin Early Head Start Non-Federal and In-Kind Report, February 1, 2019, through September 30, 2019 j. Policy Council Planning Committee Minutes ~ September 10, 2019 (English/Spanish) k. Policy Council Budget & Finance Minutes ~ September 17, 2019 (English) l. Policy Council Planning Committee Minutes ~ October 1, 2019 (English/Spanish) m. Kern County Superintendent of Schools Parent Café – Larry Reider Education Center (English/Spanish) n. Children’s Mobile Immunization Clinic ~ November 2019 (English/Spanish) o. 2019 Annual Safe Trunk or Treat – October 25, 2019, Kern County Sheriff’s Office (East Bakersfield Substation) p. Fall Festival – October 26, 2019, New Covenant Church, Bakersfield q. CAPK Head Start Selection Criteria Committee Save the Date – November 15, 2019 r. CAPK Head Start School Readiness Meeting Dates
The Chairperson called for a motion to receive and file Communication items (a)-(r). Motion was made by Yolanda Ochoa to receive and file.
10. School Readiness Report – Leslie Mitchell, Education & Support Services Administrator Ms. Mitchell thanked and praised all the members of the council for their commitment and service. She shared that school readiness is reaching the end of its first cycle, which concludes on November 4, 2019. She added that the Family Engagement Team is training Family Service Workers on a program entitled, Your Money Your Goals so that they may assist the families at their centers. She also shared that the health team has been performing hearing and vision tests for the children. So far, the team has performed 400 screenings within the last 45 days. On the Head Start side, they are working on investigations; children are being introduced to simple machines, something which is very exciting for them. This is a part of STEAM, Science, Technology, Engineering, and Mathematics. Ms. Mitchell also reported that the Disabilities, Mentor Coaches and the Wellness teams are conducting a social-emotional checklist in classrooms. They are making sure that the Pyramid curriculum is in place. Some of the areas being monitored are whether everybody that walks into the classroom is acknowledged, if there are classroom rules in place, etc. In summary, staff are making sure that the climate in the classroom is well set, to ensure children have a good day at school.
280

11. Program Governance Report/Training – Lisa Price, Governance Coordinator Ms. Price expressed her profound appreciation for members’ time and commitment. She went on to thank staff sponsors for supporting and sharing their knowledge with the participants and members of their respective subcommittees. Ms. Price gave special recognition to select members: Yolanda Ochoa was recognized for five years of service, Nila Hogan and Andrea Martinez received recognition for their perfect attendance during the 2018-2019 Policy Council term. They attended all Policy Council meetings as well as all their individual subcommittees.
12. Community Representative Report – Ana Lester/Lindsay Harrison Ana Lester expressed her appreciation for the opportunity given to serve on the Policy Council. Ana stated she will still be available and accessible as she shared her heartfelt commitment to CAPK. Lindsay Harrison stated ever since she was in high school, she has had a desire to serve the community; through CAPK she has been able to do that. She gave a special thank you to Jerry and Yolanda for giving her an opportunity to fulfill her purpose. Lindsay expressed her deep gratitude to Ms. Lester, for taking Lindsay under her wing and sharing her knowledge with her.
13. Early Head Start San Joaquin Report – Nicole Niño, Family Engagement Specialist & Home Base Supervisor Policy Council member Estela Corrales reported that the father engagement activity was a success. Many fathers and families attended the center and home base socializations. Families were very excited about the event and are already looking forward to their next event in January. The program reached full enrollment in September and are expecting the same for October. In closing, Estela talked about her Policy Council experience; how much she has learned and how grateful she was for the opportunity.
14. Early Head Start Partnership Report – Esperanza Contreras, Partnership Administrator Ms. Contreras and family advocates participated in the Taft College Child Development Center Parent Meeting. Information about the CAPK/Taft College Partnership was shared as well as the EHS application requirements. The Region IX Head Start T&TA representative, Stacy McFarren, visited Taft College to see the new partnership contract site. Garden Pathways has added 3 infant slots to their existing contract. HVP had 71 families enrolled in September and has a current enrollment of 90 children. Recruitment for an additional 7 Home Visitors is now open and employment applications are being accepted. The program is scheduled to meet full enrollment at the beginning of 2020.
15. Board of Directors Representatives Report – Yolanda Ochoa, Board of Directors Representative Yolanda shared that the information presented today by Jerry Meade, was the same information presented at the Board meeting. Ms. Ochoa added that she’s impressed with the amount of money that was awarded and the impact that will have on the families within the community. She closed by expressing her appreciation to the agency for allowing her to participate one more year.
16. Director’s Report (HS/State Child Development) – Yolanda Gonzales, Director Head Start/State Child Development Ms. Gonzales expressed her profound appreciation to the Council members, she pointed out that by participating in the Policy Council, members have built relationships and have learned and provided support to each other. Ms. Gonzales stated that she felt that all staff who have interacted with Policy Council members are better because of it. The passion and commitment members have is apparent. Ms. Gonzales ended by thanking members for being passionate not only about their children and families but about the program as well.
17. Policy Council Chairperson/Announcements – Amber Dunlap, Chairperson Ms. Dunlap expressed her appreciation for the opportunity to be part of the Policy Council for the past two years. She shared that she had a parent conference for her son, and he was praised for his word recognition. Amber added that everything that her son has accomplished so far has been due to his participation in Head Start and she's very grateful for it.
18. Adjournment –Chairperson The meeting was adjourned at 7:15 p.m. by the chairperson. The next Policy Council Meeting will be held on November 26, 2019 at the CAPK Administrative Office. There will be a light dinner at 5:00 p.m. with the meeting to begin promptly at 5:30 p.m.
281

BOARD OF DIRECTORS 2020 BOARD & STANDING COMMITTEE MEETING CALENDAR
MONTH PRE
COMMITTEE B & F
COMMITTEE PERSONNEL COMMITTEE
AUDIT & PENSION
COMMITTEE
EXECUTIVE COMMITTEE
BOARD MEETINGS
January 1/15 1/22 1/16 1/29
February 2/12 2/19 2/26
March 3/11 3/18 3/25
April 4/15 4/22 4/16 4/29
May 5/13 5/20 5/27
June 6/10 6/17 6/24
July 7/22
August 8/5 8/12 8/6 8/19
September 9/16 9/23 9/30
October 10/14 10/21 10/28
November 11/4 11/11 11/5 11/18
December 12/16
❖ Board of Director Meetings and Committee Meetings are generally held at the Community Action Partnership or Kern Administrative Building, located at 5005 Business Park North, Bakersfield, CA. Notice of change in meeting location will be given in advance.
❖ Executive and Personnel / Affirmative Action Committees generally meet on an as needed basis – Dates and times to be determined.
❖ Community Action Partnership of Kern follows the meeting guidelines of the Ralph M. Brown Act. All meetings are open to the public.
Notes:
❖ August meetings are held one week earlier due to the National Community Action Partnership Annual Convention.
❖ November meetings are held one week early due to the Thanksgiving Holiday.
❖ No Standing Committee or Board meetings are scheduled in July & December. All items will be heard at the Executive Committee meetings.
282

COMMUNITY ACTION PARTNERSHIP OF KERN
MEMORANDUM
To: Board of Directors
From: Esperanza Contreras, Partnership Administrator
Date: November 20, 2019, 2019
Subject: Agenda Item IX(c): Certified Community Action Professional (CCAP) – Info Item
National Community Action Partnership provides certification for current and emerging managers or leaders in the Community Action Profession. To achieve certification, employment in either a Community Action Agency (CAA), a delegate agency or sub-grantee of a CAA, a CSBG eligible entity, a state or regional association office, or a state community services program office is required. CCAP is based on two pillars:
1. The Community Action Body of Knowledge Outline: A five section list of the knowledge and skills which community action managers and leaders need in order to function in a position of leadership in their community and agency. The sections are: History of the Community Action Movement, Vision and Value of Community Action, Traditional Community Action Management Skills, Leadership, Theories about causes of Poverty and Strategies to address them.
2. The Community Action Code of Ethics:
a. Standard for professional behavior that guides the decisions a community action
leader makes. The CCAP process includes the initial application and data form, portfolio submission and an exam. CAPK would like to encourage staff to participate in the 2020 CCAP. This includes the Chief Executive Officer which would require signature from the Board of Director Chair. Attachment: Earn Your CCAP
283

BE
CO
MIN
G A
CC
AP
VA
LID
AT
ED
MY
CO
MM
ITM
EN
T T
O
CO
MM
UN
ITY
AC
TIO
N.
De
velo
pm
en
t C
oo
rdin
ato
rM
ain
e
Earn
Y
our
CC
AP
10
20
19
th S
t N
W,
Su
ite
70
0
Wa
sh
ing
ton
, D
C 2
00
36
ww
w.c
om
mu
nit
ya
cti
on
pa
rtn
ers
hip
.co
m
If y
ou
are
a d
ed
ica
ted
Co
mm
un
ity
Act
ion
lea
de
r w
ho
wa
nts
to
cre
ate
mo
re o
pp
ort
un
itie
s fo
r yo
ur
ag
en
cy
an
d e
nh
an
ce y
ou
r le
ad
ers
hip
ski
lls,
you
sh
ou
ld e
arn
yo
ur
CC
AP
!
Le
t's
talk
!H
ave
qu
est
ion
s?
20
2.8
60
.10
16
cc
ap
@c
om
mu
nit
ya
cti
on
pa
rtn
ers
hip
.co
m
co
mm
un
ity
ac
tio
np
art
ne
rsh
ip.c
om
/cc
ap
DID
YO
U K
NO
W?
On
ce y
ou
ea
rn y
ou
r C
CA
P,
you
ca
n
rece
rtify
it e
very
fo
ur
year
s b
y
sub
mitt
ing
a s
imp
le f
orm
an
d p
ayi
ng
a s
ma
ll fe
e (
$1
75
).
284
Wha
t we
do
BE
CO
ME
A C
CA
P S
ub
mit
enro
llmen
t fo
rm a
nd
fee
Co
mp
lete
a C
and
idat
e D
ata
Fo
rm
De
velo
p a
n E
xecu
tive
Ski
lls P
ort
folio
Pa
ss th
e W
ritt
en E
xam
1.
2.
3.
4.
TH
E C
CA
P A
DV
AN
TA
GE
Ga
in n
atio
na
l re
cog
niti
on
fo
r yo
ur
Co
mm
un
ity
Act
ion
ach
ieve
me
nts
.
En
ha
nce
yo
ur
cre
dib
ility
as
an
exp
erie
nce
d
Co
mm
un
ity A
ctio
n le
ad
er.
Incr
ea
se y
ou
r a
dva
nta
ge
as
you
co
mp
ete
fo
r
hig
he
r p
osi
tion
s in
th
e C
om
mu
nity
Act
ion
fie
ld.
EL
IGIB
ILIT
Y
Yo
u h
ave
he
ld a
lea
de
rsh
ip r
ole
at
you
r
org
an
iza
tion
fo
r a
t le
ast
2 y
ea
rs.
Yo
u a
re e
mp
loye
d b
y a
qu
alif
yin
g o
rga
niz
atio
n:
a C
AA
, d
ele
ga
te a
ge
ncy
or
sub
-gra
nte
e o
f a
CA
A,
a C
SB
G e
ligib
le e
ntit
y, a
sta
te o
r re
gio
na
l
CA
A a
sso
cia
tion
, o
r a
sta
te c
om
mu
nity
se
rvic
es
off
ice
.
GE
T S
UP
PO
RT
Me
et
with
yo
ur
Exe
cutiv
e D
ire
cto
r o
r B
oa
rd
Ch
air t
o d
ete
rmin
e t
he
leve
l of
sup
po
rt y
ou
ca
n
exp
ect
fro
m y
ou
r o
rga
niz
atio
n.
CC
AP
EL
EV
AT
ES
YO
U
AB
OV
E T
HE
CO
MP
ET
ITIO
N
FO
R P
RO
MO
TIO
NS
,
FU
ND
ING
, A
ND
NE
W
OP
PO
RT
UN
ITIE
S F
OR
PR
OF
ES
SIO
NA
L G
RO
WT
H.
Exe
cutiv
e D
ire
cto
rV
irg
inia
FIN
D A
ME
NT
OR
Fin
d a
CC
AP
me
nto
r. B
y e
sta
blis
hin
g a
wo
rkin
g
rela
tion
ship
with
a m
en
tor
in y
ou
r a
rea
, yo
u w
ill
ha
ve p
ers
on
aliz
ed
su
pp
ort
an
d e
nco
ura
ge
me
nt
eve
ry s
tep
of
the
wa
y to
wa
rds
you
r C
CA
P.
ST
AR
T Y
OU
R J
OU
RN
EY
Ske
tch
in y
ou
r C
an
did
ate
Da
ta F
orm
to
se
e w
he
re
you
ne
ed
ext
ra p
oin
ts o
r e
xpe
rie
nce
, jo
in a
loca
l or
on
line
stu
dy
gro
up
, a
nd
sta
rt s
tud
yin
g t
he
Co
mm
un
ity A
ctio
n B
od
y o
f K
no
wle
dg
e!
EN
RO
LL
ME
NT
FE
E
$6
00
(C
AP
me
mb
er)
$6
35
(C
AP
no
nm
em
be
r)D
isco
un
ts a
vaila
ble
fo
r g
rou
p e
nro
llme
nt
HO
W I
T W
OR
KS
Wh
en
yo
u e
nro
ll, y
ou
ha
ve t
hre
e ye
ars
to
com
ple
te y
ou
r C
an
did
ate
Da
ta F
orm
(C
DF
),
sub
mit
you
r E
xecu
tive
Ski
lls P
ort
folio
(E
SP
),
an
d p
ass
th
e w
ritte
n e
xam
.
If y
ou
do
no
t co
mp
lete
th
e C
DF
or
ES
P,
or
you
do
no
t p
ass
th
e e
xam
, yo
u w
ill n
ee
d t
o
pu
rch
ase
an
oth
er
thre
e y
ea
r ca
nd
ida
cy.
Th
e
exa
m is
off
ere
d o
nce
pe
r ye
ar.
285