Building forward better - Action to strengthen the 2030 Agenda ...
188
Building forward better Action to strengthen the 2030 Agenda for Sustainable Development SUSTAINABLE DEVELOPMENT Forum of the Countries of Latin America and the Caribbean on 2021 Virtual meeting 15 – 18 March Fourth report on regional progress and challenges in relation to the 2030 Agenda for Sustainable Development in Latin America and the Caribbean
-
Upload
khangminh22 -
Category
Documents
-
view
0 -
download
0
Transcript of Building forward better - Action to strengthen the 2030 Agenda ...

Building forward better Action to strengthen the 2030 Agenda for Sustainable Development
SUSTAINABLEDEVELOPMENT
Forum of the Countries of Latin America and t h e C a r i b b e a n o n
2021Virtual meeting15 – 18 March
Fourth report on regional progress and challenges in relation to the 2030 Agenda for Sustainable Development in Latin America and the Caribbean

ECLACPublications
Thank you for your interest in
this ECLAC publication
Please register if you would like to receive information on our editorial
products and activities. When you register, you may specify your particular
areas of interest and you will gain access to our products in other formats.
www.cepal.org/en/publications
Publicaciones www.cepal.org/apps

Alicia Bárcena Executive Secretary
Mario Cimoli Deputy Executive Secretary
Raúl García-BuchacaDeputy Executive Secretary
for Management and Programme Analysis
Sally Shaw Officer-in-Charge of the Documents and Publications Division
Work on this document was coordinated by Alicia Bárcena, Executive Secretary of the Economic Commission for Latin America and the Caribbean (ECLAC), with the collaboration of Mario Cimoli, Deputy Executive Secretary, and Luis Yáñez, Secretary of the Commission. The drafting committee comprised Wilson Peres, Gabriel Porcile, Daniel Taccari and Zebulun Kreiter, with the collaboration of Romain Zivy, Vianka Aliaga, Vera Kiss and María Ortiz, all of ECLAC.The following chiefs of ECLAC substantive divisions, subregional headquarters and country offices participated in the preparation of this document: Daniel Titelman, Chief of the Economic Development Division; Rolando Ocampo, Chief of the Statistics Division; Simone Cecchini, Officer-in-Charge of the Social Development Division; Paulo Saad; Chief of the Latin American and Caribbean Demographic Centre (CELADE)-Population Division of ECLAC; Cielo Morales, Chief of the Latin American and Caribbean Institute for Economic and Social Planning (ILPES); Giovanni Stumpo, Officer-in-Charge of the Division of Production, Productivity and Management; Joseluis Samaniego, Chief of the Sustainable Development and Human Settlements Division; Jeannette Sánchez, Chief of the Natural Resources Division; Ana Güezmes, Chief of the Division for Gender Affairs; Mario Castillo, Chief of the Division of International Trade and Integration; Miguel Torres, Editor of the CEPAL Review; Hugo Beteta, Chief of the ECLAC subregional headquarters in Mexico; Diane Quarless, Chief of the ECLAC subregional headquarters for the Caribbean; Gabriel Porcile, Chief of the ECLAC office in Montevideo; Martín Abeles, Chief of the ECLAC office in Buenos Aires; Olga Lucía Acosta, Officer-in-Charge of the ECLAC office in Bogotá; Carlos Mussi, Chief of the ECLAC office in Brasilia; and Inés Bustillo, Chief of the ECLAC office in Washington, D.C. The authors are particularly grateful for the collaboration of the following staff members of ECLAC: Abdullahi Abdulkadri, Mónica Aguayo, José Eduardo Alatorre, Dillon Alleyne, Dante Arenas, Bernardo Atuesta, Diego Aulestia, Guiomar Bay, Amelia Bleeker, Alejandro Bustamante, Catarina Camarinhas, Georgina Cipoletta, Rubén Contreras, Helena Cruz Castanheira, Carlos de Miguel, Fabiana Del Popolo, Artie Dubrie, Mareike Eberz, Ernesto Espíndola, Álvaro Fuentes, Lydia Gény, Nicolo Gligo, Candice Gonzales, Camila Gramkow, Michael Hanni, Sebastián Herreros, Francis Jones, Alberto Malmierca, Xavier Mancero, Sandra Manuelito, Karina Martínez, Rodrigo Martínez, Sheldon McLean, Beatriz Morales, Enrique Oviedo, Machel Pantin, Esteban Pérez, Noel Pérez, Willard Phillips, Ramón Pineda, Laura Poveda, Claudia Robles, Mónica Rodrigues, Adrián Rodríguez, Jorge Rodríguez, Sebastián Rovira, Lucía Scuro, Zulma Sosa, Pauline Stockins, Valeria Torres, Marcia Tambutti, Daniela Trucco, Iliana Vaca Trigo, Helvia Velloso, Cecilia Vera, Francisco Villarreal, Lucy Winchester and Sheng Zhao.The following ECLAC consultants also provided input for the preparation of the document: Tarek Abdo, Raúl Holz, Nicolás Grinblatt, Carlos Pérez Verdía and Alynn Sánchez.The boundaries and names shown on the maps included in this publication do not imply official endorsement or acceptance by the United Nations.
Explanatory notes - Three dots (…) indicate that data are missing, are not available or are not separately reported. - A dash (-) indicates that the amount is nil or negligible. - A full stop (.) is used to indicate decimals.- The word “dollars” refers to United States dollars unless otherwise specified. - A slash (/) between years (e.g. 2013/2014) indicates a 12-month period falling between the two years. - Individual figures and percentages in tables may not always add up to the corresponding total due to rounding.
United Nations publication
LC/FDS.4/3/Rev.1
Distribution: G
Copyright © United Nations, 2021
All rights reserved
Printed at United Nations, Santiago
S.21-00124
This publication should be cited as: Economic Commission for Latin America and the Caribbean (ECLAC), Building forward better: action to strengthen the 2030 Agenda for Sustainable Development (LC/FDS.4/3/Rev.1), Santiago, 2021.Applications for authorization to reproduce this work in whole or in part should be sent to the Economic Commission for Latin America and the Caribbean (ECLAC), Documents and Publications Division, [email protected]. Member States and their governmental institutions may reproduce this work without prior authorization, but are requested to mention the source and to inform ECLAC of such reproduction.

3
Contents
Foreword ............................................................................................................................................................................................................9
CHAPTER I Latin America and the Caribbean before the outbreak of COVID-19 ....................................................................................................11
Introduction ..................................................................................................................................................................................................13A. A halting recovery from the 2008 crisis: the limits of monetary policy and debt ................................................................................13B. Inequality as a barrier to global recovery and stability ........................................................................................................................16C. The climate and environmental emergency ..........................................................................................................................................18D. The crisis of multilateralism and the need for developing economies to speak with one voice .........................................................23E. Concluding observations .......................................................................................................................................................................25Bibliography ..................................................................................................................................................................................................26
CHAPTER II The worst health crisis in over a century ...................................................................................................................................................27
A. The region in times of pandemic...........................................................................................................................................................29B. Effects on life expectancy .....................................................................................................................................................................31C. Risk factors ............................................................................................................................................................................................33D. Weak, fragmented and unequal health systems ..................................................................................................................................38
1. Working women are on the front line of care ................................................................................................................................39
2. Reduction in women’s sexual and reproductive health services ...................................................................................................40E. Policy responses ....................................................................................................................................................................................41
1. Physical distancing .........................................................................................................................................................................41
2. Strengthening health systems........................................................................................................................................................41
3. Vaccination progress ......................................................................................................................................................................43Bibliography ..................................................................................................................................................................................................47
CHAPTER III The economic, social and environmental effects of the pandemic: additional obstacles to achieving the Sustainable Development Goals ...........................................................................................................................................................51
A. Another lost decade ..............................................................................................................................................................................53
1. Macroeconomic policies to address the pandemic .......................................................................................................................54
2. Expected growth in 2021 and the rest of the decade ....................................................................................................................56B. The social inequality matrix determines the effects of the pandemic .................................................................................................58
1. Worsening labour market indicators ..............................................................................................................................................58
2. Poverty, extreme poverty and hunger ............................................................................................................................................59
3. A deterioration in income distribution ...........................................................................................................................................61
4. Social protection gaps and responses ...........................................................................................................................................62
5. The most vulnerable social groups.................................................................................................................................................63C. A production structure with more and more weaknesses ....................................................................................................................65
1. MSMEs, the enterprises hit hardest by the crisis .........................................................................................................................65
2. Changes in business operations and organization favour enterprises that develop new capabilities .........................................69D. The rise of digital technologies.............................................................................................................................................................70
1. The progress and limitations of digitalization ...............................................................................................................................70
2. Digitalization to increase productivity ...........................................................................................................................................75E. The persistent environmental crisis ......................................................................................................................................................77
1. Climate change and emissions.......................................................................................................................................................77

Economic Commission for Latin America and the Caribbean (ECLAC)
4
2. Vulnerability: extreme events and disasters ..................................................................................................................................78
3. Deterioration of forests, biodiversity and oceans ..........................................................................................................................79
4. Waste management .......................................................................................................................................................................81
5. Cities: a source of problems and solutions ....................................................................................................................................82Bibliography ..................................................................................................................................................................................................84
Chapter IV The pandemic is putting the comprehensive nature of the 2030 Agenda for Sustainable Development at heightened risk .................87
A. Inadequate progress towards the Sustainable Development Goals (SDGs) ........................................................................................89
1. Only a third of the targets are on course to be met .......................................................................................................................89
2. Policies to confront the pandemic are contributing to the 2030 Agenda ......................................................................................91
3. Projections for selected indicators .................................................................................................................................................93B. Strengthening institutions to cope with greater challenges ................................................................................................................98
1. Mechanisms for implementing and monitoring the 2030 Agenda ................................................................................................98
2. Incorporation of the 2030 Agenda and SDGs into planning ........................................................................................................100
3. Voluntary national and local reviews are on the increase ..........................................................................................................108
4. ECLAC subsidiary bodies and intergovernmental meetings are furthering the 2030 Agenda ....................................................111
5. Reform of the United Nations development system and implementation of the 2030 Agenda .................................................115
6. A space for sharing knowledge: the Regional Knowledge Management Platform for the Sustainable Development Goals in Latin America and the Caribbean (SDG Gateway) ..................................................................................119
Bibliography ................................................................................................................................................................................................124Annex IV.A1 ................................................................................................................................................................................................126Annex IV.A2 ................................................................................................................................................................................................142Annex IV.A3 ................................................................................................................................................................................................143
CHAPTER V Transformative recovery: from a new paradigm to new policies .........................................................................................................153
A. Crisis response: urgent action, keeping sight of the long term ..........................................................................................................155
1. Crises are an opportunity for redefining ideas, alliances and policies .......................................................................................155
2. A new development model calls for a new relationship between the State, the market and society .......................................156B. The three dimensions of sustainability ...............................................................................................................................................157
1. The three growth rates of sustainable development ...................................................................................................................157
2. The rates must converge towards the minimum rate of growth required for equality ...............................................................158C. One possible scenario: end poverty by 2030 and meet conditional nationally determined contributions (NDCs) ............................159
1. Estimation of the three growth rates ...........................................................................................................................................159
2. There are forces that lead to external balance but do not close social and environmental gaps ..............................................161
3. Combining policies to close gaps: a big push for sustainability in its three dimensions ............................................................165D. The sectors driving the big push for sustainability .............................................................................................................................166
1. The energy transition: renewable energies and reduction in the use of fossil fuels ..................................................................167
2. Sustainable mobility and urban space .........................................................................................................................................167
3. The digital revolution: universalizing access ...............................................................................................................................168
4. The health-care manufacturing industry ......................................................................................................................................169
5. The bioeconomy: sustainable development based on biological resources and natural ecosystems ........................................169
6. Valuing and expanding the care economy ...................................................................................................................................170
7. Developing the circular economy .................................................................................................................................................171
8. Sustainable recovery in the tourism sector .................................................................................................................................171

Building forward better: action to strengthen the 2030 Agenda for Sustainable Development
5
E. General macroeconomic, social and environmental policies .............................................................................................................172
1. A new role for fiscal policy...........................................................................................................................................................172
2. Recovery and international financial cooperation .......................................................................................................................173
3. Social policies: the overdue construction of a welfare state ......................................................................................................176
4. Environmental policies .................................................................................................................................................................178F. Conclusion: towards a sustainable global economy with national policies for a big push and multilateral
coordination in the international system ............................................................................................................................................182Bibliography ................................................................................................................................................................................................184
Concluding remarks......................................................................................................................................................................................185
Tables
II.1 Latin America and the Caribbean (14 countries): share of women in the health sector and wage gap between men and women employed in the sector, around 2019 ........................................................................................................39
II.2 Characteristics and status of the main COVID-19 vaccines, 27 January 2021 ....................................................................................43III.1 Latin America (weighted average of 18 countries): participation rate and unemployment rate, total and by sex,
2019 and 2020 .......................................................................................................................................................................................58III.2 Latin America and the Caribbean (27 countries): number of enterprises affected by the coronavirus disease
(COVID-19) pandemic crisis, by size and type of effect, 2020 ..............................................................................................................67III.3 Latin America (4 countries): industrial production, January–September 2020 compared with the same period in 2019 .......................69III.4 The Caribbean (10 countries and territories): government policies to support distance education strategies in schools, 2020 ...................72IV.1 Latin America and the Caribbean: number of SDG indicator statistical series analysed, by prospect of the targets
they refer to being met by 2030 ............................................................................................................................................................90IV.2 Latin America: coordination mechanisms for implementation and follow-up of the 2030 Agenda for Sustainable
Development, 2020 ...............................................................................................................................................................................98IV.3 The Caribbean: coordination mechanisms for implementation and follow-up of the 2030 Agenda for Sustainable
Development, 2020 ...............................................................................................................................................................................99IV.4 Latin America and the Caribbean: new national development plans, December 2020 .....................................................................101IV.5 Latin America and the Caribbean (countries forming part of the Open Government Partnership): evolution
in the production of open government action plans, 2011–January 2021 .........................................................................................106IV.6 Latin America and the Caribbean: voluntary national reviews, 2016–2021 ......................................................................................108IV.7 Latin America and the Caribbean: voluntary national reviews and presidential elections, 2016–2021 ...........................................110IV.A1.1 Indicators analysed to assess the achievement of the 2030 Agenda for Sustainable Development ................................................126IV.A2.1 Issues and measures to address the coronavirus disease (COVID-19) pandemic, published in the COVID-19
Observatory in Latin America and the Caribbean of ECLAC ...............................................................................................................142IV.A3.1 Relationship between the measures taken at the national level in Latin America and the Caribbean to address
the COVID-19 pandemic and the targets of the 2030 Agenda for Sustainable Development ...........................................................144V.1 Foreign trade elasticities, by region 1993–2017 ................................................................................................................................161V.2 Latin America and the Caribbean: estimates and scenarios for growth, equality and ecological and environmental
sustainability to 2030 ..........................................................................................................................................................................165
Figures
I.1 World trade and GDP growth, 1990–2020 ...........................................................................................................................................14I.2 Global debt, by economic sector, 1997–2019 ......................................................................................................................................15I.3 The elephant curve: annual real income growth per adult, by income percentile in the global income distribution, 1980–2016 ................16I.4 The giraffe curve: annual real income growth per adult, by income decile and percentile in the global income
distribution, 1990–2016 ........................................................................................................................................................................17I.5 Atmospheric concentrations of carbon (CO2) emissions and rising land and ocean surface temperatures ........................................19I.6 Rising sea levels and the thawing Arctic .............................................................................................................................................21

Economic Commission for Latin America and the Caribbean (ECLAC)
6
I.7 The “empty box” of growth and environmental protection: per capita GDP and per capita greenhouse gas emissions around the world, by national income level, 2017 .................................................................................................................................22
I.8 The upward trend in R&D investment in the Chinese economy as compared with other selected countries and regions, 2000–2017 ..............................................................................................................................................................................................23
II.1 Selected countries and regions: observed crude and indirectly age-and-sex standardized COVID-19 death rates .............................29II.2 Latin America (9 countries): number of deaths classified as COVID-19 deaths and monthly differences in total deaths
between 2020 and 2019, 1 January–31 October 2020 ..........................................................................................................................30II.3 Brazil, Chile, Colombia and Peru: COVID-19 mortality rate by age group, up to 31 October 2020 ........................................................34II.4 Latin America (17 countries): weight of the major administrative division (MAD) in the total population, COVID-19 cases
and COVID-19 deaths, 2020 ...................................................................................................................................................................35II.5 Latin America (11 countries): overcrowded urban households for three overcrowding thresholds, by number of persons
per bedroom, total and degree of poverty, 2019 ....................................................................................................................................36II.6 Latin America (5 countries): indigenous and non-indigenous population and municipal vulnerability index, 2015–2018 ...................36II.7 Latin America and the Caribbean (33 countries): hospital beds and medical and nursing personnel, latest year available ...............38II.8 Latin America and the Caribbean (14 countries): government measures adopted in the area of women’s health
during the pandemic, April–June 2020 ..................................................................................................................................................42II.9 Latin America (14 countries): coverage of the population over 18 years of age, by the number of COVID-19 vaccines
that laboratories have committed to delivering to each country, 22 January 2021 ..............................................................................45III.1 Latin America and the Caribbean (33 countries): projected GDP growth rate, 2020 .............................................................................53III.2 Latin America and the Caribbean (21 countries): central government public debt, December 2019 and September 2020 .................55III.3 Latin America and the Caribbean (33 countries): projected GDP growth rate, 2021 .............................................................................57III.4 Latin America and the Caribbean (33 countries): level of GDP in real terms, 2008–2025 ....................................................................58III.5 Latin America (18 countries): people living in poverty and extreme poverty, 2014–2020 ....................................................................60III.6 Latin America and the Caribbean (28 countries): persons in households receiving emergency cash and in-kind transfers,
to address the effects of the pandemic and through conditional transfer programmes, simple average by subregion, 2020 and latest available year ...............................................................................................................................................................62
III.7 Latin America and the Caribbean (27 countries): share of GDP and employment by intensity of expected sectoral impact of the pandemic, 2020 ................................................................................................................................................................66
III.8 Latin America (8 countries): share of industrial production of groups of sectors according to the intensity of the expected impact of the crisis, 2020 .............................................................................................................................................68
III.9 Latin America (12 countries): households with and without an Internet connection, by income quintile, 2018 ..................................71III.10 Latin America (12 countries): children in households without Internet access, by income quintile, 2018 ...........................................72III.11 Latin America (11 countries): affordability of fixed and mobile Internet by income quintile, 2019 ......................................................73III.12 Latin America and the Caribbean (13 countries): employed persons able to telework, 2018 ...............................................................74III.13 Latin America: (6 countries): employed persons who can work remotely based on teleworking feasibility
and average wage quintile, 2018 ...........................................................................................................................................................74III.14 Latin America (8 countries): use of digital technologies in the supply and distribution chains of companies, 2018 ...........................76III.15 Latin America and the Caribbean: extreme hydrometeorological events and disasters, 1990–2020 ...................................................78III.16 Latin America and the Caribbean: proportion of forest area within legally established protected areas, 2000–2020 ........................79III.17 Latin America and the Caribbean: consumption of household material per capita, 2000–2017 ..........................................................81III.18 Latin America and the Caribbean: electronic waste generated per capita, 2000–2019 .......................................................................82IV.1 Latin America (18 countries): extreme poverty rate under different scenarios for annual changes in income distribution
and annual per capita GDP growth, 2002–2020 and projections to 2030 .............................................................................................94IV.2 Latin America and the Caribbean: unemployment rate in the population aged 15–24 years, 2000–2030 ...........................................96IV.3 Latin America and the Caribbean: domestic material consumption, 2000–2030 ..................................................................................97IV.4 Latin America and the Caribbean: time frames of long-term development plans, December 2020 ...................................................100IV.5 Latin America and the Caribbean (countries forming part of the Open Government Partnership): changes in the total number
of commitments by open government pillar and action plan generation (first to fourth plans), 2011–January 2021 .............................107

Building forward better: action to strengthen the 2030 Agenda for Sustainable Development
7
IV.6 Latin America and the Caribbean and the world: voluntary local reviews, 2016–2020 ......................................................................111V.1 Latin America and the Caribbean: persons living in poverty following the implementation of redistribution policies, 2020–2030 .............160V.2 Latin America and the Caribbean and the rest of the world: level of emissions in different scenarios, 2000–2030 .........................163V.3 Latin America and the Caribbean and the rest of the world: technical progress and environmentally sustainable
GDP growth, 2020–2030 ......................................................................................................................................................................164
Boxes
II.1 Latin America and the Caribbean: vaccine research and production ....................................................................................................45IV.1 The functions of the regional collaborative platforms .........................................................................................................................117IV.2 Objectives of the Regional Knowledge Management Platform for the Sustainable Development Goals in Latin America
and the Caribbean (SDG Gateway) .......................................................................................................................................................121V.1 Financing the response to the COVID-19 crisis Caribbean ..................................................................................................................175V.2 An anti-hunger grant ............................................................................................................................................................................177V.3 Building trust and encouraging fair treatment to streamline the implementation of the 2030 Agenda .............................................180
Diagrams
III.1 Latin America and the Caribbean (33 countries): intensity of the expected impact of the pandemic by sectors of economic activity, 2020 ......................................................................................................................................................................66
V.1 Policies to close sustainable development gaps .................................................................................................................................159
Maps
I.1 World: land and ocean surface temperature percentiles, January–December 2020 ............................................................................20II.1 Latin America and the Caribbean: simulation of the impact of COVID-19 on life expectancy at birth (e0)
with annual prevalence rates of 5% and 10% .......................................................................................................................................32III.1 Latin America and the Caribbean: coverage of marine protected areas in relation to the exclusive economic zones (EEZ),
by country, 2020 .....................................................................................................................................................................................80IV.1 Latin America and the Caribbean: Sustainable Development Goal (SDG) territorialization modalities identified, 2019 ........................105IV.2 Latin America and the Caribbean: voluntary national reviews, 2016–2021 ........................................................................................109
Images
IV.1 Home page of the Regional Knowledge Management Platform for the Sustainable Development Goals in Latin America and the Caribbean ...............................................................................................................................................................................122
IV.2 Statistical elements of the Regional Knowledge Management Platform for the Sustainable Development Goals in Latin America and the Caribbean....................................................................................................................................................123

8

9
ForewordThe fourth meeting of the Forum of the Countries of Latin America and the Caribbean on Sustainable Development finds our region in a very different world from that envisaged when the 2030 Agenda for Sustainable Development and the Sustainable Development Goals (SDGs) were formulated almost six years ago. Not only have adverse trends in growth, investment, employment, inequality and environmental sustainability sharpened, but the coronavirus disease (COVID-19) pandemic has had catastrophic effects on our societies. Unemployment, poverty and extreme poverty (with the consequent risk of hunger) and inequality have all increased, while the emissions reductions of the early months of the pandemic are tending to be lost as growth recovers with no changes having been made to the development model.
As long as uncertainty remains about the intensity and duration of the pandemic, intermittent shutdowns will continue to affect economies and societies. Progress in vaccination is insufficient and reflects great inequalities between countries by level of economic and social development and, above all, by financial and negotiating capacity to access vaccines. Once again, the need to move forward with regional integration is on the table.
However, the difficulty of 2020 and 2021 should not opaque the fact that many of the determinants now worsening the effects of the pandemic were already present in the global and regional context, and at the national level as well. For that reason, the response to the health crisis should be accompanied by decisive steps to correct the unsustainable courses of action pursued until now.
These issues are at the heart of the reflections in this report, in which we analyse the major trends under way in economies and societies globally, explore in detail the health effects of the pandemic and highlight its economic, social and environmental impacts in our region. On that basis, we propose a strategy for action: a big push for sustainability based on the core elements of the 2030 Agenda and its 17 SDGs.
The strategy for a decade of action must be realistic, building on progress made and recognizing the challenges of implementing the 2030 Agenda, to which we devote a chapter of the document. We note with concern that the indications that the comprehensive nature of the Agenda was already in jeopardy, as highlighted in previous versions of this report, have been exacerbated by the pandemic, and nearly two thirds of the targets we analysed will be unattainable without a substantial change in the development model. Faced with this reality, the countries of the region have intensified their efforts to strengthen the institutional framework for the implementation of the Agenda, as evidenced by the growing number of voluntary national reviews. At the same time, the United Nations development system has embarked upon a profound reform process that is intensifying work between agencies, funds and programmes to respond more effectively and flexibly to countries’ needs.
Dealing with difficult pending tasks —an effort in which governments, civil society, the private sector and other stakeholders must all engage— we reiterate the need for “accelerating action to address systemic gaps in implementation, as we embark on a decisive decade for the 2030 Agenda,” as demanded in the political declaration of the high-level political forum on sustainable development convened under the auspices of the General Assembly in 2019.1
1 United Nations, Political declaration of the high-level political forum on sustainable development convened under the auspices of the General Assembly (A/RES/74/4), 2019.

Economic Commission for Latin America and the Caribbean (ECLAC)
10
The goal of prioritizing the poorest and most vulnerable to leave no one behind can only be achieved through international solidarity in the distribution of vaccines to contain the pandemic, progress in regional integration, mobilization of resources to finance the SDGs, better implementation of the 2030 Agenda at national and local levels, the strengthening of institutions, the resolution of problems through international cooperation, and the uptake of science and technology. Moreover, this is the only way to prevent our region from returning to the paths that have led it to suffer devastating effects from the pandemic, which have now lasted for a year and which hinder progress towards rapid recovery and sustainable development with equality at its heart.
Alicia BárcenaExecutive Secretary
Economic Commission for Latin America and the Caribbean (ECLAC)

11
Building forward better: action to strengthen the 2030 Agenda for Sustainable Development
CHAPTER I
Introduction
A. A halting recovery from the 2008 crisis: the limits of monetary policy and debt
B. Inequality as a barrier to global recovery and stability
C. The climate and environmental emergency
D. The crisis of multilateralism and the need for developing economies to speak with one voice
E. Concluding observations
Bibliography
Latin America and the Caribbean before the outbreak of COVID-19


13I
IntroductionThe crisis triggered by the COVID-19 pandemic overtook the world economy at a time when structural problems were already jeopardizing its growth and stability. The outbreak sent a huge shockwave through a world that was already grappling with mounting economic, political and environmental challenges. The world’s response to the crisis must therefore take the form of an effort to rebuild development patterns in a way that will overcome the problems that were plaguing it before the pandemic, rather than an effort to restore what came before.
The global system is beset by growing imbalances that are heightening political and geopolitical tensions. Uncertainty and rivalries are prevailing over respect for rules and cooperation. At the international level, the form of governance that will emerge out of the countries’ evolving military, technological and production capacities is unclear; at the national level, political systems are being shaken by protests and demands emanating from a long backlog of unresolved problems, not least of which is persistent and even increasing inequality. This situation has given rise to three structural crises which have only grown more severe over the last five years and which are finding expression in the slower growth of world trade and the global economy; increasing inequalities in a majority of the world’s countries; and the threat posed by current production and consumption patterns to the stability of the Earth’s ecosystems.
One of the outcomes —and, at the same time, an aggravating factor— of these three crises is that the rules around which the international system is organized are being eroded while national political systems are becoming polarized and fragmented. Both systems are being destabilized as uncertainty grows and conflicts escalate. Demands for thorough-going changes are mounting, but governments have either not known how to respond to those demands or have been incapable of doing so. These crises are a consequence of decisions that have led to a limitation of the scope of State action and to an increasing tolerance of inequality, poverty and environmental degradation.
An integrated analytical framework is essential in order to understand these three crises and to see how they are interconnected and how to resolve them by employing mutually reinforcing policy tools in each of these different areas. The structuralist tradition in development economics provides a scaffolding for the construction of just such an analytical framework.
A. A halting recovery from the 2008 crisis: the limits of monetary policy and debt
The following section will explore some of the structural problems that confronted the world economy in the aftermath of the 2008 financial crisis. These issues have been examined in detail in other ECLAC publications (see, for example, ECLAC, 2020), so this discussion will touch on only those aspects of the situation that are most relevant to the Sustainable Development Goals and the sustainable development of Latin America and the Caribbean as a whole.
The great recession of 2008 called into question the idea that an unregulated expansion of credit, the creation of sophisticated financial instruments and the securitization of assets would enable the world economy to function more efficiently. That crisis was generated by the financial system itself as it ramped up operations that rested on a shaky foundation of securities, notably subprime mortgages in the United States market. The collapse of these speculative spirals had enormous impacts on the productive sector both in the United States itself and in the rest of the world as the collapse reverberated through the complex interconnected network of global financial agents.

Economic Commission for Latin America and the Caribbean (ECLAC)
14 I
Although the United States Federal Reserve’s intervention on an unprecedented scale averted an even deeper crisis, the economy’s subsequent recovery was weak. As can be seen in figure I.1, during the post-2009 recovery, trade expanded very slowly, and its linkage with GDP growth (measured in terms of GDP growth as a percentage of the growth of trade) was more tenuous than before. Between 1990 and 2007, the volume of world trade in goods rose at an average annual rate of 6.2%, but between 2012 and 2019, it did so at an annual average of just 2.3%. This trend is also reflected in the fact that, even though exports of goods and services reached an all-time high of 31% of global GDP in 2008, at the start of the global financial crisis, since 2015 that share has hovered around 28% (ECLAC, 2021, pp. 38-39).
Figure I.1 World trade and GDP growth, 1990–2020
-2.5
-2.0
-1.5
-1.0
-0.5
0
0.5
1.0
1.5
2.0
2.5
-15
-10
-5
0
5
10
15
1990
1991
1992
1993
1994
1995
1996
1997
1998
1999
2000
2001
2002
2003
2004
2005
2006
2007
2008
2009
2010
2011
2012
2013
2014
2015
2016
2017
2018
2019
2020
GDP
Trade
Elasticity of growth to trade (right axis)
Source: Economic Commission for Latin America and the Caribbean (ECLAC).
The quantitative easing policy used by a number of central banks provided much-needed —but partial— relief from the effects of the crisis, since the money supply influences investment decisions only indirectly. In a world where the private sector is seeking to rebalance its balance sheets and where the size of household debt and government debt is generating uncertainty, near-zero interest rates are not enough to induce the necessary investment response. It thus became necessary to introduce expansionary fiscal policies as a direct stimulus for aggregate demand in order to spur the economic recovery. Later, when the pandemic hit in 2020, the ascendency of fiscal policies over monetary policies became even more evident. As discussed in chapter V of this document, fiscal expansion can help not only to reactivate aggregate demand but also to steer investment in the direction of sustainability.
Although the crisis had its origins in the financial system itself, sharp imbalances in various countries’ current accounts heightened its impact. Imbalances of this sort are associated with debt overhangs in deficit countries and swelling reserves in surplus ones (prior to 2008). What was referred to at the time as a “dollar glut” generated a flow of funds from surplus countries to the United States which fed into the already highly speculative operations being conducted in that country’s real estate and financial markets, inflating a housing and financial bubble that eventually burst, giving rise to the subprime mortgage crisis.
One of the more conspicuous features of the world economy in the years following the global financial crisis of 2008–2009 and before the COVID-19 crisis was its mounting accumulation of debt. The global debt stock exceeded US$ 255 trillion by the end of 2019, or more than 322% of world GDP. Between 2007, just before the outbreak of the global financial crisis, and 2019, worldwide debt soared

15I
Building forward better: action to strengthen the 2030 Agenda for Sustainable Development
by US$ 93 trillion (see figure I.2). Estimates put world debt for 2020 at US$ 277 trillion (365% of world GDP). The most heavily indebted economies as a percentage of their GDP at end-2019 included the Hong Kong Special Administrative Region of China (374.7% of GDP), Lebanon (306.7% of GDP), Singapore (296.7% of GDP), China (258.3% of GDP), Chile (242.3% of GDP), Republic of Korea (239.5% of GDP), Brazil (203.3% of GDP), Malaysia (190.4% of GDP), Israel (181.1% of GDP) and Hungary (170.4% of GDP).
Figure I.2 Global debt, by economic sector, 1997–2019(Trillions of dollars)
1534 44 4814
5358 63
19
33
6370
22
42
6874
0
50
100
150
200
250
300
1997 2007 2017 2019
Non-financialcorporationsGeneral government
Financial sector
Households
Source: Economic Commission for Latin America and the Caribbean (ECLAC), on the basis of the Institute of International Finance (IIF), Global Debt Monitor: COVID-19 Lights a Fuse”, 6 April 2020 [online] https://www.iif.com/Portals/0/Files/content/Research/Global%20Debt%20Monitor_April2020.pdf and ECLAC (2019), Economic Survey of Latin America and the Caribbean, 2019 (LC/PUB.2019/12-P), Santiago, 2019.
Debt levels rose in all sectors of economic activity but especially in the non-financial corporate sector and the government sector. This was a distinct departure from the pre-crisis sectoral pattern of debt distribution, when the bulk of the debt had been held by the financial sector (see figure I.2). A sectoral-level analysis reveals that, in the developed economies, government debt was the largest and fastest-growing component of the total debt, accounting for 28.8% of that total in 2019, whereas household debt and financial-sector debt were declining. The financial sector was also less leveraged than it had been before the global financial crisis.1 In the emerging and developing economies as a group, the largest share of debt is held in the non-financial corporate sector, followed by the government sector (42% and 23.9% of the total, respectively, as of the fourth quarter of 2019).
An increase in debt burdens in emerging economies during an economic contraction (the GDP of all the developing regions of the world was smaller in 2020 than it had been in 2019) may not only give rise to a liquidity squeeze but may actually push them into insolvency. Even if that does not happen, high debt levels may entail a heavier debt servicing burden. The available estimates indicate that sovereign debt service for emerging and developing economies will have climbed from 7% of public revenues in 2019 to 10% in 2020 (IIF, 2020), which may hinder efforts to use public investment as a tool for furthering economic and social development.
1 Empirical evidence for 35 countries of the Organization for Economic Cooperation and Development (OECD) in 2001–2018 shows that the gearing ratio (selected financial assets to capital ratio) rose from 10.9 in 2001 to 19.5 in 2008 and then fell to 12.4 in 2018 (see OECD, 2020).

Economic Commission for Latin America and the Caribbean (ECLAC)
16 I
B. Inequality as a barrier to global recovery and stabilityThere is some debate as to how much overall inequality, defined as inequality among the citizens of the world (i.e. among the planet’s inhabitants, without regard to the countries in which they live) was reduced between 1988 and 2008. The classic Lakner-Milanovic “elephant chart” indicates that the groups whose incomes rose the most during this period were the emerging middle class in the poorest countries and the top 1% (the elephant’s raised trunk), while those whose income rose the least were the poorest (the elephant’s tail) and the middle class in the developed world (see figure I.3). The rapid growth achieved by some countries with large poor populations translated into a significant drop in global poverty (from 36% of the world’s population in 1990 to 19% in 2008 (Ravallion and Chen, 2013, p. 7).
Figure I.3 The elephant curve: annual real income growth per adult, by income percentile in the global income distribution, 1980–2016(Percentages)
10 13 16 19 22 25 28 31 34 37 40 43 46 49 52 55 58 61 64 67 70 73 76 79 82 85 88 91 94 9799
.199
.499
.799
.91
99.9
499
.97
99.9
9199
.994
99.9
97
Cumulative income growth, percentiles 10-99
Cumulative income growth, percentile 990
50
100
150
200
250
Source: Economic Commission for Latin America and the Caribbean (ECLAC), on the basis of F. Alvaredo and others, World Inequality Report 2018, World Inequality Lab, 2018 [online] http://wir2018.wid.world/files/download/wir2018-full-report-english.pdf.
The Lakner-Milanovic elephant chart has been put forward as evidence of the reason for the growing rejection of globalization policies observed since 2016 (after the election of Donald Trump in the United States and the Brexit referendum in the United Kingdom). According to this explanation, the fact that the middle class in the more advanced countries has benefited less while the richest 1% of the population has benefited the most is the reason for the prevailing discontent with globalization, and people —who are, after all, not global citizens but rather citizens of their countries— vote and hold their national government responsible for improvements or a deterioration in their level of well-being. Although inequality between countries declined, it has tended to increase within most countries since the late 1980s. This helps to explain why there have been growing social protests against a development pattern that is seen as being incapable of providing a share of the benefits of growth to a large part of the population.
The belief that politicians are not representing the people and that they lack the capacity for action needed to live up to the population’s expectations can give rise to political polarization and can discredit democratic institutions. Increasing political instability, xenophobia and racism are being seen even in

17I
Building forward better: action to strengthen the 2030 Agenda for Sustainable Development
tolerant societies with a strong liberal tradition that might have been thought to be immune to these phenomena. The pledge made by the United Nations in the 2030 Agenda to “leave no one behind” is a wake-up call about the seriousness of this problem and the need to tackle it.
Another way of picturing the trend in inequality is to look at how the absolute, rather than relative, value of income in each percentile has changed. Doing so results in the curve known as “Ravallion’s giraffe” (Ravallion, 2018, p. 624), which depicts how income is concentrated among the richest 1% (the giraffe’s neck) while the increases for the other percentiles in the global income distribution are very small (see figure I.4). By graphing these trends in absolute values, the intensity of the income concentration process becomes much more evident.
Figure I.4 The giraffe curve: annual real income growth per adult, by income decile and percentile in the global income distribution, 1990–2016(Dollars at 2018 prices)
0
5 000
10 000
15 000
20 000
25 000
0
10.0
20.0
30.0
40.0
60.0
70.0
80.0
90.0
99.0
99.1
99.2
99.3
99.4
99.5
99.6
99.7
99.8
99.9
100.
0
Source: Economic Commission for Latin America and the Caribbean (ECLAC), on the basis of World Inequality Database [online] https://wid.world/data/.
The debate surrounding the Lakner-Milanovic elephant and Ravallion’s giraffe prompts some observations that are particularly relevant to this discussion, since the purpose of this document is to propose policies for altering the current development pattern, which has given rise to such stark inequalities and the resulting economic instability.
First, the relationship between globalization and inequality is not as straightforward as the graphs might suggest. If the term “globalization” is understood as referring to financial globalization and the predominance of market rules in international economic relations, then this term is not really applicable to China. China plays a key role in accounting for the decline in the percentage of poor people in the world and the reduction in inequality between countries, yet this is a country that has kept its capital account under tight control and has adopted a very active industrial policy aimed at buoying the competitiveness of Chinese firms and the diversification and technological upgrading of its economy.2
2 The impact of China’s low-cost labour supply on employment in the United States (especially employment in manufacturing) is another source of tension in a world of capital mobility.

Economic Commission for Latin America and the Caribbean (ECLAC)
18 I
However, if globalization is understood as involving a bigger role in world trade and having exports account for a larger share of GDP, then China can, in fact, be seen as taking part in the globalization process. It has based its actions on policies that are clearly quite different from those espoused by neoliberal economists that advocate keeping government intervention to a minimum through what has come to be known as “hyperglobalization”. This divergence between China’s industrial, commercial and foreign-exchange policies and the rules set down by the orthodoxy in economics is one of the sources of trade tensions between China and the United States. None of the most successful cases of convergence in the post-war period has followed the rules of hyperglobalization.
Second, some of the political and technological factors that are intertwined with the globalization process and that have played a part in increasing inequality include the ascendancy of orthodox monetary policy formulas over fiscal policy, increasingly less progressive taxation policies in some countries, the weakening of trade unions and labour (partly as a result of the greater bargaining power attained by capital owing to its greater mobility in today’s more free-market world) and the effect of technical progress, which has shifted labour demand towards more highly skilled workers.
Third, the macroeconomic disequilibria discussed earlier have also led to greater inequality in a number of countries. On the one hand, external-sector imbalances that set off balance-of-payments crises are associated with slower, less stable growth and to devaluations that result in lower real wages and higher unemployment, all of which produces greater inequality. On the other, inequality depresses aggregate demand, since richer groups have a lower propensity to consume than poorer groups do. At the same time, when aggregate demand growth is slow, the higher savings levels of richer segments of the population translate into financial speculation and the rising prices of non-reproducible assets (such as real estate) rather than promoting productive investment.
In sum, inequality, external crises and financialization converge in a complex and mutually reinforcing web of interrelationships that add to the world’s growing political and economic instability. The pandemic has added fuel to this fire, making the adoption of policies to overcome this situation all the more urgent.
C. The climate and environmental emergencyThe current development path has brought the world to a point where the very survival of the environmental system that sustains it is in jeopardy. Markets are incapable of internalizing these environmental costs and therefore endogenously reproduce an unsustainable growth pattern. The planet’s ecosystems and biodiversity are being eroded at an alarming speed, and there are already over a million species that are heading towards extinction (IPBES, 2019).
As a result of modern-day fossil-fuel-based production and consumption patterns, CO2 concentrations in the atmosphere are continually increasing. In 2020, atmospheric CO2 reached 415 parts per million (see figure I.5), a level unprecedented in the last 800,000 years or possibly in the last 3 million years (Willeit and others, 2019). Even though the pandemic has brought about a decline in CO2 emissions, at the global level these emissions are still climbing at a rate that is consistent with an increase in average global temperatures of over 3°C during this century. This greatly exceeds the goal set in the Paris Agreement of limiting the rise in temperature to far below 2°C and the more ambitious target of holding the increase to less than 1.5°C (UNEP, 2020).

19I
Building forward better: action to strengthen the 2030 Agenda for Sustainable Development
Figure I.5 Atmospheric concentrations of carbon (CO2) emissions and rising land and ocean surface temperatures
300
320
340
360
380
400
420
1958
1960
1962
1964
1966
1968
1970
1972
1974
1976
1978
1980
1982
1984
1986
1988
1990
1992
1994
1996
1998
2000
2002
2004
2006
2008
2010
2012
2014
2016
2018
2020
CO2 concentrations
A. Atmospheric concentrations of CO2, 1958–2020(parts per million)
Five-year moving average
Land and oceansurface temperatures
B. Land and ocean surface temperatures, 1880–2020(deviations from the 1880–1900 average)
Moving average(LOESS local regression)-0,4
-0,2
0
0,2
0,4
0,6
0,8
1,0
1,2
1,4
1880
1884
1888
1892
1896
1900
1904
1908
1912
1916
1920
1924
1928
1932
1936
1940
1944
1948
1952
1956
1960
1964
1968
1972
1976
1980
1984
1988
1992
1996
2000
2004
2008
2012
2016
2020
Source: Economic Commission for Latin America and the Caribbean (ECLAC), on the basis of data from the National Oceanic and Atmospheric Administration (NOAA) (for atmospheric concentrations of CO2) and Goddard Institute for Space Studies (GISS), “GISS Surface Temperature Analysis (GISTEMP v4)” [online] data.giss.nasa.gov/gistemp/ [accessed on: 25 January 2021] (for temperature).

Economic Commission for Latin America and the Caribbean (ECLAC)
20 I
The impacts of this increase in atmospheric CO2 are clear for all to see. The years since 2015 have been the six hottest years on record,3 with 2016 and 2020 being the hottest of all (average temperatures of 1.2°C above the average for 1880–1900) (WMO, 2021) (see figure I.5, panel B). In 2020, all-time heat records were registered in various locations around the planet (map I.1), even though temperature increases were attenuated by La Niña, which is associated with a widespread cooling of ocean temperatures.
Map I.1 World: land and ocean surface temperature percentiles, January–December 2020(Average temperatures in 2020 relative to average temperatures in 1901–2000)
Record coldestMuch cooler than averageCooler than averageNear averageWarmer than averageMuch warmer than averageRecord warmest
Source: National Oceanic and Atmospheric Administration (NOAA), “State of the Climate: Global Climate Report for Annual 2020”, National Centers for Environmental Information (NCEI), January 2021 [online] https://www.ncdc.noaa.gov/sotc/global/202013 [accessed on: 25 January 2021].
Along with these higher temperatures, mean sea levels are on the rise as a consequence of melting ice sheets and thermal expansion. Sea levels have climbed by between 21 cm and 24 cm since 1880 (see figure I.6). In the past few years, the pace of this phenomenon has accelerated to 3.3 mm per year, but more recently sea levels have been rising even faster owing in part to the increased rate of glacier melt in Greenland and Antarctica (WMO, 2021). The amount of area covered by sea ice in the Arctic reaches its yearly low each September; in September 2020, it was the second-lowest ever registered (see figure I.6, panel B), and record lows for the extent of sea ice were observed in the months of July and October. The extent of Arctic sea ice in September is shrinking at a rate of 13% per decade relative to the average for 1981–2010 (WMO, 2020).
In 2020, there were 30 named storms (defined as storms with maximum sustained windspeeds of 39 miles per hour or more) during the Atlantic Ocean hurricane season; 13 of these storms reached hurricane strength (sustained windspeeds of 74 mph or more) and 6 of them were major hurricanes (sustained windspeeds of 111 mph or more). This was the highest number of storms ever recorded, surpassing the 28 storms of 2005, and the second-highest number of hurricanes on record; 2020 was the fifth consecutive year with an above-normal Atlantic hurricane season and the eighteenth above-normal season out of the past 26.
3 Instrument-based records began to be kept in 1880.

21I
Building forward better: action to strengthen the 2030 Agenda for Sustainable Development
Figure I.6 Rising sea levels and the thawing Arctic
A. World: rising sea levels, 1880–2020(difference from the 1993–2008 average in millimeters)
Estimated rise in sea level: 1880–1993 Estimated rise in sea level: 1993-2020
-250
-200
-150
-100
-50
0
50
100
Apr 1
880
Oct 1
882
Apr 1
885
Oct 1
887
Apr 1
890
Oct 1
892
Apr 1
895
Oct 1
897
Apr 1
900
Oct 1
902
Apr 1
905
Oct 1
907
Apr 1
910
Oct 1
912
Apr 1
915
Oct 1
917
Apr 1
919
Oct 1
922
Apr 1
925
Oct 1
927
Apr 1
930
Oct 1
932
Apr 1
935
Oct 1
937
Apr 1
940
Oct 1
942
Apr 1
945
Oct 1
947
Apr 1
950
Oct 1
952
Apr 1
955
Oct 1
957
Apr 1
960
Oct 1
962
Apr 1
965
Oct 1
967
Apr 1
970
Oct 1
972
Apr 1
975
Oct 1
977
Apr 1
980
Oct 1
982
Apr 1
985
Oct 1
987
Apr 1
990
Oct 1
992
Apr 1
995
Oct 1
997
Apr 2
000
Oct 2
002
Apr 2
005
Oct 2
007
Apr 2
010
Oct 2
012
Apr 2
015
Oct 2
017
Apr 2
020
B. September minimums for the extent of sea ice, 1979–2020(millions of square kilometers)
0
1
2
3
4
5
6
7
8
9
1979
1980
1981
1982
1983
1984
1985
1986
1987
1988
1989
1990
1991
1992
1993
1994
1995
1996
1997
1998
1999
2000
2001
2002
2003
2004
2005
2006
2007
2008
2009
2010
2011
2012
2013
2014
2015
2016
2017
2018
2019
2020
Source: Economic Commission for Latin America and the Caribbean (ECLAC), on the basis of data from the National Oceanic and Atmospheric Administration (NOAA) and the National Snow and Ice Data Center (NSIDC).

Economic Commission for Latin America and the Caribbean (ECLAC)
22 I
These changes jeopardize the chances of success of efforts to combat poverty and inequality. Climate change impacts crop yields and the water supply and subjects the world’s population to extreme weather events such as heatwaves, droughts, fierce storms and flooding. It also has substantial impacts on marine and terrestrial ecosystems. Chapter V presents a discussion of measures for enhancing community resilience, using renewable energy to reduce greenhouse gas emissions, protecting forests and changing production and consumption patterns.
Figure I.7 illustrates the fact that, within the context of prevailing development patterns, no country has achieved a high level of income without radically increasing its emissions of the greenhouse gases that are driving climate change. The combination of a high GDP with environmental sustainability is an “empty box”. Altering the present growth path will require making radical changes in existing production, distribution and consumption patterns along with a major sustainability-focused technological effort.
Figure I.7 The “empty box” of growth and environmental protection: per capita GDP and per capita greenhouse gas emissions around the world, by national income level, 2017(Dollars at 2010 prices and tons of CO2 equivalent)
Low income Lower-middle income Upper-middle income High income
500 1 000 2 000 3 000 4 000 3 000 6 000 9 000 12 000 50 000 100 000 150 000
5
10
15
20
Per capita GDP (constant dollars at 2010 prices)
Per c
apita
gre
enho
use
gas
emis
sion
s (to
ns)
East Asia and the PacificEurope and Central Asia
Latin America and the CaribbeanMiddle East and North Africa
North America South Asia
Sub-Saharan Africa
Compatible with an increase in global
average temperature of up to 2°C
Compatible with an increase in global average temperature of up to 1.5°C
Empty box representingenvironmental sustainability
Source: Economic Commission for Latin America and the Caribbean (ECLAC), on the basis of J. Gütschow and others, “The PRIMAP-hist national historical emissions time series (1850-2017)”, German Research Centre for Geosciences (GFZ), GFZ Data Services [online] http://dataservices.gfz-potsdam.de/pik/showshort.php?id=escidoc:4736895; and World Bank, World Development Indicators, 2019, Washington, D.C. [online database] http://data.worldbank.org/data-catalog/world-development-indicators.
The pandemic can be regarded as a sign of human beings’ growing presence and invasion of the planet’s ecosystems. Emerging zoonotic diseases, as COVID-19 appears to be, are just one of the possible negative consequences of the increasing pressure being exerted by human beings on the natural world. The frequency with which pathogenic microorganisms are jumping from other animals to humans has increased as people harvest forestry and agricultural resources and as ecosystems are degraded.

23I
Building forward better: action to strengthen the 2030 Agenda for Sustainable Development
D. The crisis of multilateralism and the need for developing economies to speak with one voice
The overhaul of China’s production structure and the narrowing of the technological gaps separating it from advanced countries have been associated with a reconfiguration of the international division of labour. When capacities, interests and power relations change, so do international relations. This gives rise to a period of negotiation and a search for new rules that often go hand in hand with increased geopolitical instability.
In the area of international trade, multilateralism is weakening and the World Trade Organization (WTO) is becoming less influential as a forum for the negotiation and discussion of trade rules. The United States’ decision to block the appointment of two judges to the WTO appellate body that has been resolving trade disputes since 1995 and that had continued to do so until December 2019 has prevented it from doing its job since that time. This means that there is no longer an accepted mechanism for settling international trade disputes, although one group of countries (led by the European Union and China) has set up some alternative mechanisms on a temporary basis to serve this purpose.4
The ascent of China on the back of its technological convergence drive, increasingly strong competitive position in high-technology sectors and its large shares of world GDP and trade has sparked various disputes with other economic powers, particularly the United States. China’s convergence is another example of the successful efforts deployed by some Asian countries to change their production structures and narrow the technology gap between them and certain other nations. Figure I.8 illustrates the growing importance of Chinese investment in R&D over the last two decades, and the world share and composition of Chinese exports and imports have both changed in line with this trend as well. The ongoing technological revolution confronts countries with a definite challenge, and their response to that challenge will determine their international positions in the coming decades. This topic will be explored further in chapter V.
Figure I.8 The upward trend in R&D investment in the Chinese economy as compared with other selected countries and regions, 2000–2017(Millions of dollars)
Rest of the worldLatin Americaand the Caribbean
China
United States0
200
400
600
800
1 000
1 200
1 400
1 600
1 800
2000 2001 2002 2003 2004 2005 2006 2007 2008 2009 2010 2011 2012 2013 2014 2015 2016 2017
Source: Economic Commission for Latin America and the Caribbean (ECLAC), on the basis of data from the United Nations Educational, Scientific and Cultural Organization (UNESCO) and the Ibero-American Network of Science and Technology Indicators (RICYT).
4 The difficulties being experienced by WTO have been compounded by the resignation of its Director General, Roberto Azevêdo, who announced his early departure in May 2020 and stepped down in August 2020, a year before his term in office was to end.

Economic Commission for Latin America and the Caribbean (ECLAC)
24 I
Between January 2018 and October 2019, trade tensions between China and the United States led to an escalation of tariffs by the United States that was then matched by China, with the end result being a nearly 21% increase in the average tariff imposed by each country on the other. The signing of what was called a “phase one” agreement in January 2020 sparked some optimism about the possibility of these trade tensions coming to an end (ECLAC, 2021, pp. 42), but the slowdown in the Chinese economy’s growth made it impossible for China to fulfil its pledge to raise the value of its imports of goods from the United States in 2020 by at least 41% over their 2017 level.
In addition, in May the United States tightened its controls on the sale of sophisticated microprocessors to the Chinese telecommunications multinational Huawei. This step, which has been justified on the grounds of national security, came on top of restrictions introduced in 2019 on the use of the Android operating system and Google applications for mobile phones manufactured by Huawei.
The Chinese government has criticized these new restrictions and said that it is considering reprisals. This situation is further complicated by moves by the United States to relocate some of its firms that are now sited in China and to revoke trade preferences given to Hong Kong (Special Administrative Region of China), as well as by frequent confrontations between the two countries at WTO and the controversy about possible risks posed by the Chinese TikTok and WeChat applications.
Meanwhile, other conflicts around investment and trade have also been arising. The European Union’s efforts to tax large digital platforms has been viewed in the United States as a move against large United States firms such as Google, Apple, Facebook and Netflix. In June 2020, the United States government launched an investigation under section 301 of the 1974 Trade Act into digital service taxation mechanisms being applied or under consideration in nine countries and the European Union. In that same month, the United States also announced that it was withdrawing —temporarily, in principle— from the talks concerning the Organization for Economic Cooperation and Development (OECD)/G20 Inclusive Framework on Base Erosion and Profit Shifting (BEPS) that began in 2018. This decision was based on its perception that the talks were focusing too much on the taxation of United States Internet firms.
Mounting tensions in the area of international trade have fed fears that conflicts will intensify under the influence of the struggle for predominance between a rising star (China) and a waning one (the United States). Some thinkers have reasoned that periods of transition between one hegemonic power and another are times of great instability because the international discipline imposed by the once-dominant power gradually breaks down (Gilpin, 1992). This is, they argue, what happened in the 1930s as the United Kingdom’s ascendancy faded and the United States had not yet stepped into the breach and taken up a leadership role.
Other analysts contend that stability and peace can be maintained through multilateral cooperation in a transitioning world in which a number of different powers, none of which is dominant, are competing (Nye, 2020). It is impossible to predict what type of international system will emerge in the next few decades: a bipolar structure in which the United States holds sway at one end of the spectrum and China at the other, or a multipolar one in which the European Union, China and the United States are influential in the global economy. While China has become extremely influential in world trade and has been active in financing infrastructure projects and expanding its presence in countries that are rich in natural resources, the United States maintains its technological leadership, and the dollar continues to be the foremost medium of exchange for most international transactions and the preeminent international reserve currency.
Europe, for its part, is a major player in the international system at all levels and has been working hard to prevent the collapse of the multilateral system and the fragmentation of the world economy. Both the European Union and the United States want to revive their transatlantic partnership on a foundation of multilateralism and to restore the role of WTO (see European Union, 2020; Financial Times, 2020).

25I
Building forward better: action to strengthen the 2030 Agenda for Sustainable Development
A rules-based multilateral system that reins in the bilateral exercise of power is the kind of system that would best serve the interests of developing countries because it would shield them, to some extent, from the pressures exerted by the most powerful nations. There is also a need for greater cooperation among the peripheral economies in order to enlarge their scope for political action and defend their development agenda in international negotiations.
Is it possible for the voice of the periphery to make itself heard more forcefully in a multipolar system? Despite the tensions of recent years, there appears to be a growing consensus that hyperglobalization does not offer a viable way forward for either the central or the peripheral economies and that the foundations for international cooperation accordingly need to be redefined. Ironically, many of the problems that once seemed to affect only the peripheral countries (inequality, growing balance-of-payments disequilibria, the need for greater political scope for promoting welfare-State policies) are now being keenly felt in the countries of the centre. The periphery’s proposals and approaches to the international economy and development may —if the peripheral economies speak with one voice— therefore find a more attentive audience in an international system in which the main actors are searching for new answers. The Sustainable Development Goals and the Decade of Action serve to bolster the importance and legitimacy of the developing world’s demands.
E. Concluding observationsThe 2008 crisis, which was caused by factors endogenous to the financial system and was amplified by global current account disequilibria, undercut the efficient market hypothesis and discredited the idea, which had prevailed since the 1980s, that hyperglobalization was the best way forward for the integration of the international economy. At the time that the pandemic burst on the scene, the global economy’s dominant growth pattern was already being sharply criticized and was already exhibiting diminished vitality and greater instability.
A number of proposed approaches for replacing that pattern have been put on the table. Some of them would lead to the fragmentation of the world economy into blocs and to unilateralism that would perpetuate inequalities and aggravate existing domestic and external conflicts. The 2030 Agenda and the Sustainable Development Goals offer a different path, a path based on democracy on the national front and a new type of multilateralism in the international arena based on a development path founded on environmental sustainability and equality. This proposal, which will be at the centre of the discussion presented throughout this document, is designed to leave the former growth pattern behind, not to restore it or to close off national economies from global trade flows.
The preceding analysis focuses on the existence of two types of asymmetries in the international economy that are especially significant for Latin America and the Caribbean and that will be explored in greater depth in the following chapters.
The first are the technological and productive asymmetries which are becoming all the sharper as the technological revolution continues to unfold. These asymmetries are what underlies the intractable current account deficits registered by developing economies when those economies start to experience rapid growth. Although the external constraint eased somewhat during what became known as the “commodity super cycle”, it remains a threat and may once again make itself felt if growth rates rebound in the coming years.

Economic Commission for Latin America and the Caribbean (ECLAC)
26 I
The Latin American and Caribbean region needs to be capable of absorbing technology so that it can make use of the advances that are pushing back the international technology frontier in the area of environmental conservation. Competitive positions in the future will be closely tied to technologies for reducing emissions and preserving ecosystems, and commitments now being made in the area of international cooperation are leading in that direction. The threat of an environmental disaster is an issue that is now high up on the international agenda, and denialism is in retreat.
The second type of asymmetry that is of key importance for the region has to do with the operation of the world’s monetary system. Since none of the countries in the Latin American and Caribbean region issues an international reserve currency, all of them must finance their external deficit by borrowings denominated in foreign currencies. Some countries are having more and more difficulty in borrowing from the international financial system, and this exerts an unremitting downward pressure on growth, since they need to reduce their imports and generate enough foreign exchange to meet their debt servicing obligations. The fact that this debt often ends up becoming public debt places an additional constraint on countries’ ability to use fiscal policy as a development tool.
Bibliography
ECLAC (Economic Commission for Latin America and the Caribbean) (2021), International Trade Outlook for Latin America and the Caribbean, 2020 (LC/PUB.2020/21-P), Santiago.(2020), Building a New Future: Transformative Recovery with Equality and Sustainability (LC/SES.38/3-P/Rev.1), Santiago.(2018), The Inefficiency of Inequality (LC/SES.37/3-P), Santiago.
Gilpin, R. (1987), The Political Economy of International Relations, Princeton, Princeton University Press.Lakner, C. and B. Milanovic (2016), “Global income distribution: from the fall of the Berlin Wall to the Great Recession”,
The World Bank Economic Review, vol. 30, No. 2. Nye, J. Jr. (2020), “The other global power shift”, Project Syndicate, 6 August [online] https://www.project-syndicate.
org/commentary/new-technology-threats-to-us-national-security-by-joseph-s-nye-2020-08?barrier=accesspaylog.OECD (Organization for Economic Cooperation and Development) (2020), “Banking sector leverage” [online]
https://doi.org/10.1787/027a0800-en [accessed on: 7 June 2020].Ravallion, M. (2018), “Inequality and globalization: a review essay”, Journal of Economic Literature, vol. 56,
No. 2, June. UNEP (United Nations Environment Programme) (2020), Emmissions Gap Report 2020, Nairobi.Willeit, M. and others (2019), “Mid-Pleistocene transition in glacial cycles explained by declining CO2 and regolith
removal”, Science Advances, vol. 5, No. 4, April.WMO (World Meteorological Organization) (2021), “State of the Global Climate 2020: provisional report” [online]
https://library.wmo.int/doc_num.php?explnum_id=10444.(2020), “United in Science 2020” [online] https://public.wmo.int/en/resources/united_in_science.

27
Building forward better: action to strengthen the 2030 Agenda for Sustainable Development
The worst health crisis in over a century
A. The region in times of pandemic
B. Effects on life expectancy
C. Risk factors
D. Weak, fragmented and unequal health systems
E. Policy responses
Bibliography
CHAPTER II


29II
A. The region in times of pandemic The pandemic has had a huge health impact in Latin America and the Caribbean. Since the first case of coronavirus infection was reported to the World Health Organization (WHO) in early 2020, all the countries in the region have reported cases, and, with the exception of Dominica and Saint Kitts and Nevis, all countries or territories have had COVID-19-related deaths. As of the first week of February 2021, a little less than a year since the start of the pandemic, the region has recorded almost 19 million cases and nearly 600,000 related deaths. These figures mean that the region accounts for more than 18% of all infections and 27% of deaths in the world, which represents a marked contrast with its 8% share of the world population (WHO, 2020).
A different panorama emerges when the number of deaths from COVID-19 is analysed in relation to the number of inhabitants. Although the situation is very uneven in the region, in aggregate terms the crude death rate from COVID-19 is lower than in many developed countries that have consolidated health systems (see figure II.1). However, this result is heavily influenced by the differences in age structure between the region and the developed countries analysed; in particular, by the smaller proportions of people in the parts of the region’s population pyramid corresponding to older persons who, as will be seen later, are the age group worst hit by the pandemic. Figure II.1 illustrates this situation: as well as the crude death rate from COVID-19 observed in the region and in selected countries, it shows the indirectly age-and-sex standardized COVID-19 death rate in the United States as a benchmark.1 In this case, controlling for the effect of the age structure, the mortality from COVID-19 in the region is significantly higher than in the other countries selected.
Figure II.1 Selected countries and regions: observed crudea and indirectly age-and-sex standardizedb COVID-19 death rates(Per million inhabitants)
Latin
Am
eric
a an
dth
e Ca
ribbe
an
Latin
Am
eric
a
The
Carib
bean
Belg
ium
Italy
Unite
d Ki
ngdo
m
Unite
d St
ates
Spai
n
Fran
ce
Swed
en
Germ
any
New
Zea
land
0
200
400
600
800
1 000
1 200
1 400
1 600
1 800
Cum
ulat
ive
deat
hs p
er m
illio
n in
habi
tant
s
Observed crude COVID-19 death rate Indirectly age-and-sex standardized COVID-19 death rate
Source: Economic Commission for Latin America and the Caribbean (ECLAC), on the basis of P. Heuveline and M. Tzen, “Beyond deaths per capita: comparative COVID-19 mortality indicators”, PubMed Central (PMC), 21 January 2021 [online] https://www.ncbi.nlm.nih.gov/pmc/articles/PMC7273293/.
a Rate refers to cumulative COVID-19 deaths from the start of the pandemic up to 29 January 2021.b The indirectly age-and-sex standardized rate was calculated on the basis of COVID-19 morality patterns in the United States.
1 See Heuveline and Tzen (2021) for methodological details.

Economic Commission for Latin America and the Caribbean (ECLAC)
30 II
From another analytical perspective, there was a substantial increase in total deaths in 2020 relative to the previous year in nine countries in the region, and the monthly pattern of this excess mortality was in line with the total number of deaths per month attributed to the pandemic.2 This suggests considerable excess mortality associated with the disease. Figure II.2 shows the increase or decrease in total deaths in 2020 relative to the same month in 2019.
Figure II.2 Latin America (9 countries): number of deaths classified as COVID-19 deaths and monthly differences in total deaths between 2020 and 2019, 1 January–31 October 2020(Thousands)
G. Honduras H. Mexico I. Peru
D. Costa Rica E. Cuba F. Ecuador
A. Brazil B. Chile C. Colombia
Confirmed COVID-19 deaths Suspected COVID-19 deaths
−2.0
−1.2
−0.4
0.4
1.2
2.0
Jan Feb Mar Apr May Jun Jul Aug Sep Oct
−6.0
1.6
9.2
16.8
24.4
32.0
Jan Feb Mar Apr May Jun Jul Aug Sep Oct
0
4
8
12
16
20
Jan Feb Mar Apr May Jun Jul Aug Sep Oct
−2.0
0.8
3.6
6.4
9.2
12.0
Jan Feb Mar Apr May Jun Jul Aug Sep Oct
−0.7
−0.4
−0.2
0.1
0.3
0.6
Jan Feb Mar Apr May Jun Jul Aug Sep Oct
−0.7
−0.3
0.1
0.6
1.0
1.4
Jan Feb Mar Apr May Jun Jul Aug Sep Oct
0
1.3
2.6
3.9
5.2
6.5
Jan Feb Mar Apr May Jun Jul Aug Sep Oct0
6
12
18
24
30
Jan Feb Mar Apr May Jun Jul Aug Sep Oct
0
3
6
9
12
15
Jan Feb Mar Apr May Jun Jul Aug Sep Oct
Difference, 2020–2019
Source: Economic Commission for Latin America and the Caribbean (ECLAC), Demographic Observatory, 2020 (LC/PUB.2020/20-P), Santiago, 2021.
Total deaths clearly increased in Brazil, Chile and Colombia and paralleled the trend of total deaths attributed to COVID-19, an indication that the excess mortality is associated with the pandemic. Deaths also increased in Mexico, Ecuador and Peru, but the higher numbers for the year-on-year differences are somewhat out of phase with the monthly trend in deaths attributed to COVID-19. This could reflect, for example, the quality of information on cause of death, lower testing or diagnosis of the disease or the overloading of the health system during the crisis, which leads to an increase in deaths from other causes that are not directly related to the pandemic.
2 Data are available for Brazil, Chile, Colombia, Costa Rica, Cuba, Ecuador, Honduras, Mexico and Peru.

31
Building forward better: action to strengthen the 2030 Agenda for Sustainable Development
II
In Costa Rica, Cuba and Honduras, total deaths in 2020 relative to 2019 slowed significantly in some months, although Honduras recorded excess mortality in the same month in which it reported the most COVID-19 deaths. In Costa Rica and Cuba, both of which have low mortality and better health systems and death registries, the decline in mortality suggests that the adopted measures successfully offset the effects of the pandemic. However, there is as yet insufficient evidence to fully assess these impacts, owing to factors such as the difficulty of data collection and recording during the pandemic.
With regard to the relative magnitude of the monthly change (rise or fall) in total deaths in the nine countries analysed, in Ecuador, Honduras and Peru total deaths tripled in the months with the largest increases. They also increased significantly in Brazil, Chile, Colombia and Mexico, albeit to a lesser degree. In Chile, for example, comparing monthly deaths in 2020 relative to 2019, there were 4% more deaths in April, 22% more in May, 54% more in June and 18% more in July (Ministry of Health, 2020). In contrast, Costa Rica and Cuba recorded relatively fewer deaths in May and June compared with the same months in 2019.
These comparative analyses should be taken with caution, since they are based on preliminary data. The countries have probably not yet accounted for all the deaths in the respective months of 2020; likewise, the quality of death registration may have worsened during the lockdown in some cases. If so, the excess mortality in 2020 relative to the same months in 2019 could be underestimated. On the other hand, quarantine and social isolation may have contributed to reducing deaths from other causes, including external factors (accidents, violence and other causes), so the comparison of total deaths may not fully reflect the excess mortality associated, directly or indirectly, with the pandemic. Overcoming these limitations requires a detailed analysis of the epidemiological profiles and causes of death in each country, which is beyond the scope of this document. Nevertheless, the majority of the countries analysed demonstrate excess mortality.
B. Effects on life expectancy The fact that the health crisis is ongoing impedes a precise estimation of the impact, in particular with regard to the life expectancy of someone born in 2020. On the one hand, the virus especially kills older people, so the years of life lost in terms of life expectancy at birth may not be significant. On the other, the high case fatality and fast spread of the disease may cause sufficiently high excess mortality to have a substantial effect on a country’s life expectancy at birth. The duration of the crisis also affects the impact: the trend observed in the early months could be offset if countries intervene effectively with preventive measures to contain the spread of the virus. It is also difficult to estimate the long-term effect, which depends on factors such as the disease prevalence rate in each country (the number of cases as a percentage of the population), access to health services and when the vaccine becomes available. In general, years of life lost during a mortality crisis are recovered in subsequent periods.
The Economic Commission for Latin America and the Caribbean (ECLAC) has estimated the pandemic’s effect on life expectancy at birth assuming that the case fatality rate by age is the same among countries and defining four scenarios for the prevalence rate in one year (Marois, Muttarak and Scherbov, 2020). In this counterfactual exercise, the prevalence rates considered were 5% (relatively little spread of the virus), 10%, 25% and 50% (extensive spread) (see map II.1, which illustrates the first two scenarios). The 50% scenario—in which the virus spreads freely with no significant public intervention—is highly unlikely since all countries have implemented actions to contain the pandemic; however, it highlights the need to maintain and strengthen these measures. In contrast, the scenarios with 5% to 10% prevalence are not far from the regional experience, where some countries and territories, such as Argentina, Brazil, Colombia, Chile, Costa Rica, Guadeloupe, Panama, Peru and Sint Marteen, have accumulated case rates between 2% and 3% of their total population; while Aruba

Economic Commission for Latin America and the Caribbean (ECLAC)
32 II
and French Guiana are around 4%.3 As mentioned, these rates could be underestimating the actual prevalence of the virus, because asymptomatic people do not necessarily get tested and because the different countries have varying capacities to carry out testing throughout their territory. Finally, there are exceptions to these patterns. For example, Cuba, a country with an ageing population and a universal health system, has recorded very low mortality and a contagion rate of less than 0.5%; if the rate were to reach 1%, it could cause a slight reduction in life expectancy at birth.
Map II.1 Latin America and the Caribbean: simulation of the impact of COVID-19 on life expectancy at birth (e0) with annual prevalence rates of 5% and 10%(Years)
Central America The Caribbean South America
Belize
Costa Rica
El SalvadorGuatemala Honduras
Mexico
Nicaragua
Panama
Antigua and Barbuda
Bahamas
Barbados
Cuba Dominican Rep.
Grenada
HaitiJamaica
Curaçao
Aruba
Puerto Rico
Saint LuciaSaint Vincent andthe Grenadines
Trinidad and Tobago
United StatesVirgin Islands
A. Years of life expectancy lost at 5% annual prevalence
0.30–0.44 0.45–0.49 0.50–0.54 0.55–0.64 0.65–0.74
Argentina
Bolivia(Plur. State of) Brazil
Chile
Colombia
Ecuador
FrenchGuiana
Guyana
Paraguay
Peru
Suriname
Uruguay
Venezuela (Bol. Rep. of)
B. Years of life expecntancy lost at 10% annual prevalence
0.65–0.89 0.90–0.99 1.00–1.09 1.10–1.19 1.20–1.49
Belize
Costa Rica
El SalvadorGuatemala
Honduras
Mexico
Nicaragua
Panama
Antigua and Barbuda
Bahamas
Barbados
Cuba Dominican Rep.
Grenada
HaitiJamaica
Curaçao
Aruba
Puerto Rico
Saint LuciaSaint Vincent andthe Grenadines
Trinidad and Tobago
United StatesVirgin Islands
Argentina
Bolivia(Plur. State of) Brazil
Chile
Colombia
Ecuador
FrenchGuiana
Guyana
Paraguay
Peru
Suriname
Uruguay
Venezuela (Bol. Rep. of)
Central America The Caribbean South America
Source: Economic Commission for Latin America and the Caribbean (ECLAC), Demographic Observatory, 2020 (LC/PUB.2020/20-P), Santiago, 2021, forthcoming.
3 Rates calculated using data from PAHO (2021) and 2020 population estimates from United Nations (2019b).
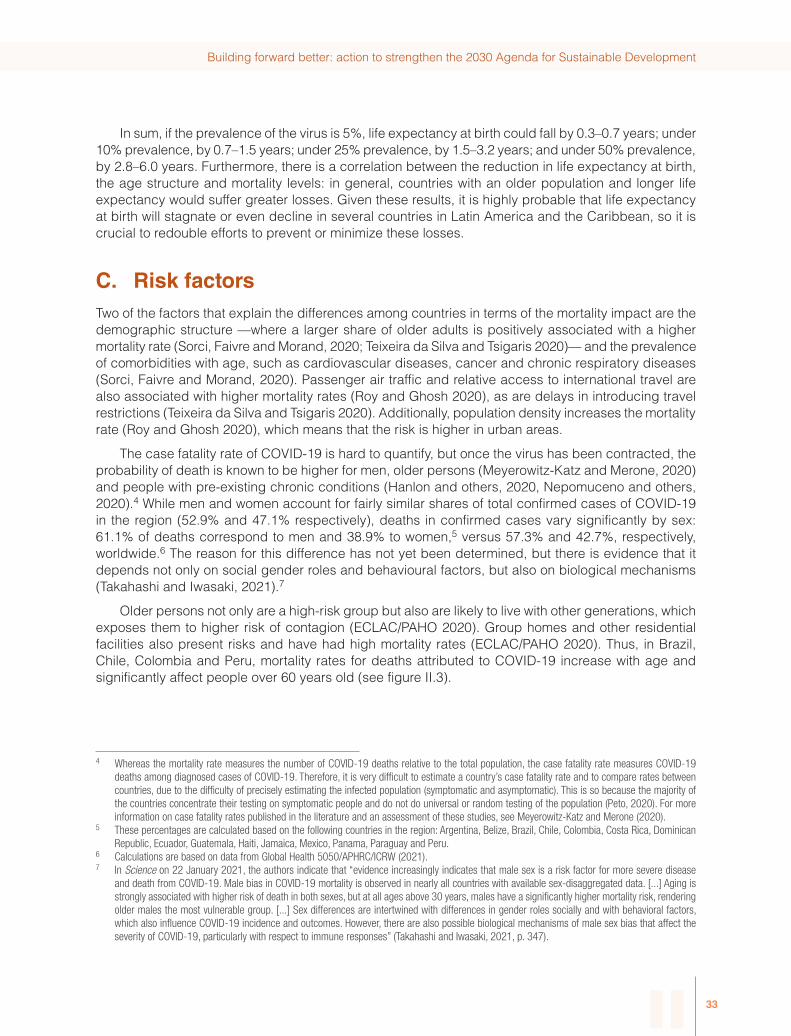
33
Building forward better: action to strengthen the 2030 Agenda for Sustainable Development
II
In sum, if the prevalence of the virus is 5%, life expectancy at birth could fall by 0.3–0.7 years; under 10% prevalence, by 0.7–1.5 years; under 25% prevalence, by 1.5–3.2 years; and under 50% prevalence, by 2.8–6.0 years. Furthermore, there is a correlation between the reduction in life expectancy at birth, the age structure and mortality levels: in general, countries with an older population and longer life expectancy would suffer greater losses. Given these results, it is highly probable that life expectancy at birth will stagnate or even decline in several countries in Latin America and the Caribbean, so it is crucial to redouble efforts to prevent or minimize these losses.
C. Risk factorsTwo of the factors that explain the differences among countries in terms of the mortality impact are the demographic structure —where a larger share of older adults is positively associated with a higher mortality rate (Sorci, Faivre and Morand, 2020; Teixeira da Silva and Tsigaris 2020)— and the prevalence of comorbidities with age, such as cardiovascular diseases, cancer and chronic respiratory diseases (Sorci, Faivre and Morand, 2020). Passenger air traffic and relative access to international travel are also associated with higher mortality rates (Roy and Ghosh 2020), as are delays in introducing travel restrictions (Teixeira da Silva and Tsigaris 2020). Additionally, population density increases the mortality rate (Roy and Ghosh 2020), which means that the risk is higher in urban areas.
The case fatality rate of COVID-19 is hard to quantify, but once the virus has been contracted, the probability of death is known to be higher for men, older persons (Meyerowitz-Katz and Merone, 2020) and people with pre-existing chronic conditions (Hanlon and others, 2020, Nepomuceno and others, 2020).4 While men and women account for fairly similar shares of total confirmed cases of COVID-19 in the region (52.9% and 47.1% respectively), deaths in confirmed cases vary significantly by sex: 61.1% of deaths correspond to men and 38.9% to women,5 versus 57.3% and 42.7%, respectively, worldwide.6 The reason for this difference has not yet been determined, but there is evidence that it depends not only on social gender roles and behavioural factors, but also on biological mechanisms (Takahashi and Iwasaki, 2021).7
Older persons not only are a high-risk group but also are likely to live with other generations, which exposes them to higher risk of contagion (ECLAC/PAHO 2020). Group homes and other residential facilities also present risks and have had high mortality rates (ECLAC/PAHO 2020). Thus, in Brazil, Chile, Colombia and Peru, mortality rates for deaths attributed to COVID-19 increase with age and significantly affect people over 60 years old (see figure II.3).
4 Whereas the mortality rate measures the number of COVID-19 deaths relative to the total population, the case fatality rate measures COVID-19 deaths among diagnosed cases of COVID-19. Therefore, it is very difficult to estimate a country’s case fatality rate and to compare rates between countries, due to the difficulty of precisely estimating the infected population (symptomatic and asymptomatic). This is so because the majority of the countries concentrate their testing on symptomatic people and do not do universal or random testing of the population (Peto, 2020). For more information on case fatality rates published in the literature and an assessment of these studies, see Meyerowitz-Katz and Merone (2020).
5 These percentages are calculated based on the following countries in the region: Argentina, Belize, Brazil, Chile, Colombia, Costa Rica, Dominican Republic, Ecuador, Guatemala, Haiti, Jamaica, Mexico, Panama, Paraguay and Peru.
6 Calculations are based on data from Global Health 5050/APHRC/ICRW (2021).7 In Science on 22 January 2021, the authors indicate that “evidence increasingly indicates that male sex is a risk factor for more severe disease
and death from COVID-19. Male bias in COVID-19 mortality is observed in nearly all countries with available sex-disaggregated data. [...] Aging is strongly associated with higher risk of death in both sexes, but at all ages above 30 years, males have a significantly higher mortality risk, rendering older males the most vulnerable group. [...] Sex differences are intertwined with differences in gender roles socially and with behavioral factors, which also influence COVID-19 incidence and outcomes. However, there are also possible biological mechanisms of male sex bias that affect the severity of COVID-19, particularly with respect to immune responses” (Takahashi and Iwasaki, 2021, p. 347).

Economic Commission for Latin America and the Caribbean (ECLAC)
34 II
Figure II.3 Brazil, Chile, Colombia and Peru: COVID-19 mortality rate by age group, up to 31 October 2020a
(Number of deaths per 1,000 inhabitants)
0
2
4
6
8
10
12
Brazil
ChileColombia
Peru
0–9years
10–19years
20–29years
30–39years
40–49years
50 a59 años
50–59years
60–69years
80 yearsor more
Source: Latin American and Caribbean Demographic Centre (CELADE)-Population Division of ECLAC, on the basis of official information from the countries, and United Nations, World Population Prospects 2019, New York, 2019 [online] https://population.un.org/wpp/ for the population by age group.
In Latin America and the Caribbean, 81% of the population lives in areas classified as urban under the national definition, making it the most urbanized developing region in the world (United Nations, 2019a).8 The region further stands out for the level of metropolization: 35% of the population lives in cities of a million or more, and there are five megacities with over 10 million residents (Buenos Aires, Mexico City, Lima, Rio de Janeiro and São Paulo) (United Nations, 2019a; ECLAC, 2016). This constitutes an important risk factor, since COVID-19 is transmitted faster under high population density, as in urban and metropolitan areas. As of July 2020, it was estimated that more than 90% of the reported cases of coronavirus in the world were in urban areas (United Nations, 2020).
There is a pattern of overconcentration of COVID-19 contagion and death in the region’s metropolitan areas, albeit with exceptions. Figure II.4 illustrates that there is a much more than proportional concentration of contagion and death in the major administrative divisions (MADs), where the most populous Latin American cities are located. This pattern is especially notable in countries in which at least 30% of the population lives in a major administrative division, such as Argentina, Chile, Costa Rica, Guatemala, Paraguay and Peru, although there are also exceptions, such as Panama and Uruguay.
The region’s cities and megacities are characterized by a number of deficiencies that constitute important risk factors for COVID-19, such as overcrowding; lack of access to water, sanitation, electricity and Internet services; and the scarcity and saturation of public transportation. Due to the high degree of residential segregation in Latin American cities, these deficiencies are unevenly distributed between rich and poor neighbourhoods and, therefore, between high- and low-income residents. The combination of high urbanization and significant deficiencies in health care and basic services influences not only the magnitude and impact of the pandemic, but also its heterogeneous effects on different population groups, since it hits the low- and medium-low-income population the hardest, as analysed in detail in the next chapter.
8 If an urban area is defined as having a population of 20,000 or more, the percentage is around 70% in 15 Latin American countries (ECLAC, 2016).

35
Building forward better: action to strengthen the 2030 Agenda for Sustainable Development
II
Figure II.4 Latin America (17 countries): weight of the major administrative division (MAD) in the total population, COVID-19 cases and COVID-19 deaths, 2020(Percentages)
45
29
22
42
22
33
1925
27
21 21
53
38 36
28
56
17
85
35
21
66
38
56 59
18
34
54
29
50 48 49
21
47
21
84
39
25
75
31
66
45
20
40
29
4943
21
60
14
0
10
20
30
40
50
60
70
80
90
Arge
ntin
a
Boliv
ia(P
lur.
Stat
e of
)
Braz
il
Chile
Colo
mbi
a
Cost
a Ri
ca
Cuba
Ecua
dor
El S
alva
dor
Guat
emal
a
Mex
ico
Pana
ma
Para
guay
Peru
Dom
inic
an R
ep.
Urug
uay
Vene
zuel
a(B
ol. R
ep. o
f)
Population Cases Deaths
Source: Economic Commission for Latin America and the Caribbean (ECLAC), on the basis of official data from the countries, received and systematized by the Pan American Health Organization (PAHO).
Note: The figure includes the following major administrative divisions of the indicated countries: Argentina: Autonomous City of Buenos Aires and Buenos Aires Province; Bolivia (Plurinational State of): Santa Cruz Department; Brazil: State of São Paulo; Chile: Santiago Metropolitan Region; Colombia: Capital District of Bogotá and Cundinamarca Department; Costa Rica: San José Province; Cuba: La Habana Province; Ecuador: Guayas Province; El Salvador: San Salvador; Guatemala: Guatemala Department; Mexico: Mexico City and State of Mexico; Panama: Panama Province; Paraguay: Central Department and Capital District of Asunción; Peru: Lima Department; Dominican Rep.: Santo Domingo Province; Uruguay: Montevideo and Canelones Departments; Venezuela (Rep. Bol. de): Capital District and State of Miranda.
Overcrowding is closely related to the spread of the pandemic due to the contagion risk associated with sharing a room, the difficulty of complying with lockdown and quarantine measures and the marked socioeconomic gradient. In 2019, 30% of urban households in the region were overcrowded based on a threshold of more than two people per bedroom, with over 50% of poor households exceeding the threshold (see figure II.5).
Deficiencies in living conditions and access to services, which prevent a more effective response to the pandemic, intersect with and exacerbate the axes of the social inequality matrix, in particular disadvantaging 58 million indigenous people (ECLAC/FILAC, 2020) and 134 million people of African descent in the region (ECLAC/UNFPA, 2020a).
The structural political, economic, social, environmental and health inequalities affecting indigenous peoples create a scenario of heightened vulnerability and risk to COVID-19 and its socioeconomic impact in traditional communities and in the large indigenous groups living in urban areas. In the five countries that account for 80% of the indigenous population in the region and for which recent census data are available (Chile, Colombia, Guatemala, Mexico and Peru), more than eight million indigenous people do not have access to potable water in their home, making it impossible to practice frequent hand washing, an essential measure for preventing contagion. Moreover, large segments of the indigenous population have limited access to basic sanitation services in the home.9 There is also a high level of overcrowding in these communities, which imposes severe difficulties for adopting preventive quarantine measures under safe conditions. These
9 This situation affects 70% of indigenous people in Guatemala, 60% in Peru, 50% in Colombia and 20% in Mexico, which is much higher than the share of non-indigenous people in each of these countries.

Economic Commission for Latin America and the Caribbean (ECLAC)
36 II
three key variables for preventing contagion were used to estimate a municipal-level vulnerability index, which systematically shows the inequality affecting indigenous peoples. In the five countries analysed, the share of indigenous people living in municipalities characterized by high or critical vulnerability is much larger than the share of the non-indigenous population, especially in Colombia and Guatemala (see figure II.6).
Figure II.5 Latin America (11 countries):a overcrowded urban households for three overcrowding thresholds, by number of persons per bedroom, total and degree of poverty, 2019(Percentages)
Households inextreme povertyHouseholds innon-extreme povertyNon-poor householdsTotal
55.4
47.9
39.2
55.1
45.5
34.8
24.8
20.1
14.2
30.2
24.9
18.4
0
10
20
30
40
50
60
More than 2 people More than 2.5 people More than 3 people
Source: Economic Commission for Latin America and the Caribbean (ECLAC), on the basis of Household Survey Data Bank (BADEHOG).a Includes Argentina (urban areas), Brazil, Costa Rica, Ecuador, El Salvador, Honduras, Panama, Peru, Paraguay, Dominican Republic and Uruguay.
Figure II.6 Latin America (5 countries): indigenous and non-indigenous population and municipal vulnerability index, 2015–2018a
(Percentages)
0 10 20 30 40 50 60 70 80 90 100
Indigenous
Non-indigenous
Indigenous
Non-indigenous
Indigenous
Non-indigenous
Indigenous
Non-indigenous
Indigenous
Non-indigenous
Chile 2017
Colombia 2018
Guatemala 2018
Mexico 2015
Peru 2017
Critical High Medium Low
Source: Economic Commission for Latin America and the Caribbean (ECLAC), on the basis of special processing of census microdata.a The municipal vulnerability index is based on the following three variables: access to drinking water in the home, access to basic sanitation services
and overcrowding.

37
Building forward better: action to strengthen the 2030 Agenda for Sustainable Development
II
Although information is not available for determining how these vulnerabilities interact with the spread of contagion in indigenous communities, the data for Brazil, Chile, Colombia, Mexico and Peru indicate a strong relation. For example, in Brazil, the data for 34 indigenous health districts indicate that, as of October 2020, some of these districts had prevalence and case fatality rates that were much higher than the national average. In Mexico in the same period, the case fatality rate among indigenous-language speakers was 17.5%, which is much higher than the rate for the rest of the population (10.4%) (ECLAC and others, 2020). Indigenous territories remained relatively free of contagion during the first months of the pandemic, but the disease soon spread to their communities. Thus, as of 30 September, 238 indigenous peoples in the Pan-Amazon region had been affected (REPAM/COICA, 2020).
Given this situation, indigenous communities have carried out actions to address the pandemic, including the generation of data on cases and deaths in their communities; information and awareness campaigns on COVID-19 prevention; containment and mitigation measures, such as cordons sanitaires, community access prohibitions, patrols, community supervision, the creation of circulation protocols and isolation; utilization and promotion of traditional medicine; and the adoption of measures to ensure food security.
The Afrodescendent population is also facing the pandemic from a position of deep social inequality defined by structural and institutional racism, expressed, for example, in high levels of poverty, unequal access to education, precarious living conditions, lower access to health services, greater informal employment, and so forth. These pre-existing socioeconomic conditions make it highly difficult for the Afrodescendent population to follow physical distancing recommendations. Moreover, the high prevalence in this population of unfavourable health conditions, such as hypertension and diabetes, exacerbates the effects of the pandemic.
The absence of data on the Afrodescendent population is even worse than in the case of indigenous peoples; disaggregated data are available only for Brazil and Colombia. In Brazil, at the beginning of the pandemic, the disease primarily affected non-Afrodescendent people, but this changed starting in May. Between that month and July, 60% of COVID-19 deaths corresponded to people of African descent, which exceeds their relative weight in the national population (51%, according to the 2010 census). Moreover, the pandemic has also reached traditional Afrodescendent communities (quilombos). In Colombia, as of 6 July 2020, of the 9 municipalities with the largest number of Afrodescendants, 7 ranked among the 10 municipalities with the highest number of COVID-19 cases at the national level and 6 ranked among those with the most deaths (ECLAC, 2021c).
While mortality is the most dramatic result associated with COVID-19, little is known as yet about the long-term health effects for people who recover from the disease.10 Moreover, the health effects of the pandemic are not limited to those directly related to the virus. The pandemic has hindered the control of transmissible and non-transmissible diseases: in the region’s health systems, which are weak and underfunded, treatment has been postponed or interrupted due to the need to reallocate health-care workers and budgets to deal with the onslaught of the pandemic. Additionally, when they can, many people choose not to seek out medical services out of fear of being infected in the health centres. Consequently, the control of chronic non-transmissible diseases, such as diabetes and hypertension, has been especially affected (ECLAC/PAHO, 2020), and access to sexual and reproductive, maternal and child, and mental health services has also been restricted. Thus, the pandemic has indirect repercussions, with potentially lasting effects on population health and the attainment of Sustainable Development Goal (SDG) 3, namely, to ensure healthy lives and promote well-being for all at all ages.
10 Carfi, Bernabei and Landi (2020) and Yelin and others (2020) report evidence of neurological, cardiovascular, respiratory and psychiatric sequela effects.

Economic Commission for Latin America and the Caribbean (ECLAC)
38 II
D. Weak, fragmented and unequal health systems Public spending on health care in the region remains far from the goal of 6% of GDP recommended by the Pan American Health Organization (PAHO) and the allocation of resources is problematic. Primary care funding does not meet the recommended level of at least 30% of public health-care spending, and in countries that do reach that level, the absolute amount is extremely low (Cid and others, 2020). This hinders efficiency and quality, and excessive financial risk impoverishes households, which face high direct payments when they use the health-care system (ECLAC/PAHO, 2020).
The pandemic is fought both outside hospitals, through community containment and mitigation measures and outpatient care, and inside hospitals, which must be prepared and supplied with adequate personnel, infrastructure and supplies. While important efforts have been made in recent decades to strengthen the health systems of the countries in the region, they remain weak, and their capacity for facing the pandemic varies widely (Burki, 2020). The challenges range from access to potable water and personal protective equipment to the availability of respirators or beds in intensive care units (ECLAC, 2020a). There are still important barriers to access to health services and restrictions on the availability of both human resources (PAHO, 2017) and health-care infrastructure (see figure II.7). The countries with fewer beds and health-care workers per capita have a lower capacity to treat severe cases and little margin for reorganizing the resources they have.
Figure II.7 Latin America and the Caribbean (33 countries): hospital beds and medical and nursing personnel, latest year available(Number of beds per 1,000 inhabitants and average number of personnel per 10,000 inhabitants)
0.5
1.0
2.0
4.0
8.0
0 10 20 30 40 50 60 70 80 90
Hosp
ital b
eds
Medical and nursing personnel
More beds andfewer personnel
Fewer beds andmore personnel
More beds andmore personnel
Fewer beds andfewer personnelGTM
HTI HNDVEN
NIC
BOL
BLZSLV
PRY MEX
ECUPER
COL
DOMJAM
GUY
CRI
LCA
SUR
PAN
ARG
ATGGRD
TTOVCT
URY
KNA
BHS
BRA CHL
CUB
BRB
DMA
Source: S. Möller, “Intervenciones sociosanitarias y uso de las tecnologías de la industria 4.0 para enfrentar la enfermedad por coronavirus (COVID-19) en América Latina y el Caribe”, Social Policy series, No. 234 (LC/TS.2020/87), Santiago, Economic Commission for Latin America and the Caribbean (ECLAC), 2020.

39
Building forward better: action to strengthen the 2030 Agenda for Sustainable Development
II
1. Working women are on the front line of care
The pressure on the health system has a significant impact on women, who represented 73.2% of all health sector employees in 2019 (see table II.1). The increased demand for health care in response to the crisis has translated into extreme working conditions for all workers in the sector, including long workdays and constant exposure to stressfull situations, in addition to the higher contagion risk of health-care workers. However, women who work in this sector continue to be responsible for dependents or houshehold members in need of care. While these women respond to the increased demands of their paid work, their responsibilities in terms of unpaid labour have not changed, which subjects them to a work overload and a higher stress level. This situation has unfolded in a regional context characterized by job insecurity—one out of five women in the sector does not have or pay social security—and gender wage discrimination, to the extent that the labour income of women who work in health care is around 25% lower than that of men in the same sector (ECLAC/UN-Women, 2020).
Table II.1 Latin America and the Caribbean (14 countries): share of women in the health sector and wage gap between men and women employed in the sector, around 2019a
(Percentages)
Country Share of women employed in the health sector Wage gap
Argentina, 2019 69.3 18.5
Bolivia (Plurinational State of), 2018 70.2 2.8
Brazil, 2019 75.7 27.3
Chile, 2017 73.6 26.9
Colombia, 2018 78.3 24.6
Costa Rica, 2019 65.6 10.2
Dominican Republic, 2019 80.2 –0.5
Ecuador, 2019 70.4 20.2
El Salvador, 2019 63.9 1.5
Honduras, 2019 62.6 19.9
Mexico, 2018 67.5 21.0
Panama, 2019 74.7 32.9
Peru, 2019 69.1 5.0
Uruguay, 2019 77.4 17.0
Latin Americab 73.2 23.7
Source: Economic Commission for Latin America and the Caribbean (ECLAC), on the basis of household surveys of the respective countries.a The wage gap is calculated based on differences in the median income of men and women employed in the sector over the median income of men.b Weighted average.
ECLAC has highlighted the complexity of organizing health care and how families attend to the health needs of their members. This implies, among other tasks, purchasing medicines, acquiring services and directly caring for sick people (with both temporary and chronic conditions). This happens for a variety of reasons, including the high cost of health services, which makes access to medical care difficult, especially for people in lower-income segments. Even before the pandemic, the time spent on unpaid care work by women was triple that of men in Latin America and the Caribbean; this situation has been aggravated by the growing demand for care and the reduction in the supply of education and health services caused by the lockdown and social distancing measures.

Economic Commission for Latin America and the Caribbean (ECLAC)
40 II
In this scenario, in which health systems are operating at full capacity, much of the health care has been transferred to households: this increases the pressure on people’s time, which, in the absence of shared responsibility policies, affects women in particular. High-risk groups, such as older persons, need support to carry out basic everyday tasks, like buying food and medicine or going to the doctor. At the same time, online schooling has been imposed for children and adolescents, which in the majority of cases requires support and supervision from the adults in the household.
2. Reduction in women’s sexual and reproductive health services
The effects of the pandemic on women’s sexual and reproductive health, which constitutes a key factor for their autonomy, can be particularly detrimental for the exercise of sexual and reproductive rights. Both hospitals and primary care centres have had to prioritize the prevention of contagion or the direct care of infected patients with varying degrees of severity, in a context in which the health systems are known to be weak in terms of adequately addressing the needs of the population (ECLAC/PAHO (2020), quoted in ECLAC/UNFPA (2020b)). In times of crisis such as the current pandemic, the resources allocated to health services are usually concentrated on response measures, which in this case could result in a reduction of resources earmarked for sexual and reproductive health (Care/UN-Women, 2020) and for essential programmes and preventive actions in this area. This could translate into difficulties in terms of women’s access to health centre services and the purchase of the necessary supplies.
Pre-pandemic data show that adolescent fertility represents an important social and public health problem in Latin America and the Caribbean: the number of teenage pregnancies is still high (around 60 per 1,000)— much higher than would be expected based on the total fertility rate —and they are mostly unwanted pregnancies. Even today, around 2 out of 10 adolescent girls in the region are mothers, and given the enormous social inequality asociated with early fertility, the share is substantially higher among girls with a lower income and education level and in indigenous or Afrodescendent communities (ECLAC/UNFPA, 2020b).
According to ECLAC/UNFPA (2020b), the pandemic and the measures taken to contain it could lead to an increase in the adolescent fertility rate, from 61 to 65 live births per 1,000 adolescents aged 15–19. This increase represents a five-year setback in the reduction of that rate and is attributable to a number factors, including:
(i) The difficulties and barriers to accessing contraception and sexual and reproductive health services. Adolescents could potentially see 20% greater restriction on access to birth control; the resulting increase in early pregnancies would raise their fertility rate by 6 to 11 percentage points (2.2 million additional pregnancies) and could lead to 3,900 more maternal deaths (UNFPA (2020) quoted in ECLAC/UNFPA (2020b)).
(ii) The greater exposure of girls and adolescents to sexual violence and abuse within the family during lockdowns, which can increase unwanted pregnancies (UNFPA (2020) quoted in ECLAC/UNFPA (2020b)).
(iii) Delays in the launch of comprehensive sexuality education (CSE) programmes, a commitment assumed by 38 countries that signed the Montevideo Consensus on Population and Development of 2013, which constitutes a central measure in the prevention of adolescent pregnancy (ECLAC/UNFPA, 2020b).

41
Building forward better: action to strengthen the 2030 Agenda for Sustainable Development
II
E. Policy responses
1. Physical distancing
Starting in January 2020, the countries in the region implemented restrictions on movement within and across their borders and applied physical distancing measures to contain the spread of the virus: 96% of the countries put in place restrictions or prohibitions on the entry of foreign travellers, limited access or closed public places and imposed restrictions on large gatherings (ECLAC, 2021b). However, the intensity of the measures has varied considerably among countries and subnational territories, particularly in federal states, with the resulting conflicts among national, state and municipal authorities.
Border controls were tightened, and several countries closed their borders or imposed specific restrictions on foreign travellers, including mandatory quarantines, COVID-19 test requirements and health exams in ports of entry. Travel restrictions, which at the start of the pandemic were limited to visitors from areas with a high infection rate, were later expanded into more general border controls. With the appearance of new strains of the virus, country-specific travel restrictions have become more common.
Many countries instituted general quarantines and mandatory curfews. To reinforce social distancing, restrictions were imposed on public meetings; activities like religious services and sports and entertainment events were prohibited; and in some cases legal limits were established on the number of people that could gather. Eight of the 10 countries that imposed the strictest lockdowns between March and October were in Latin America (Schijman, Correa Caro and Vera-Cossio, 2021). Mobility data show that as the countries intensified their social distancing measures, activity declined markedly in workplaces, supermarkets, pharmacies, parks, transport hubs, retail stores and recreation facilities (Zhu and others, 2020). Nevertheless, compliance varied and was sometimes short-lived.
The strict national lockdowns that were implemented at the initial outbreak of the pandemic have in many cases been relaxed, due to the strong socioeconomic impact and what has been called “lockdown fatigue,” understood as the exhaustion associated with the new restrictive lifestyle that was adopted to slow the spread of the virus. Some countries opted, instead, to apply more specific methods and to gradually reopen areas with lower infection rates. Chile, for example, designed a programme for phased reopening by municipality.11
These public health measures did not manage to prevent the spread of the virus due to the risk factors analysed earlier. Nevertheless, the measures gave the governments more time to prepare for the impact that the pandemic would have on the health system. By flattening the curve, the movement restrictions, lockdowns and curfews allowed governments to reallocate resources, purchase critical supplies and implement the necessary institutional adjustments to address the urgent needs of the health system.
2. Strengthening health systems
Governments augmented the resources allocated to the health system via laws, executive decrees and ministerial regulations. Public health emergency declarations allowed them to implement extraordinary measures to free up additional resources, as well as to make institutional changes to address the health crisis. In countries like the Bahamas, Belize, Brazil, Costa Rica, El Salvador and Honduras, the budget was quickly redirected to allocate additional funds to the health sector. In Brazil, this included a substantial transfer of funds to the subnational governments.
11 Of 127 government actions applied in the region related to mandatory general quarantine, 66 were level changes in public health restrictions in Chile (ECLAC, 2021b).

Economic Commission for Latin America and the Caribbean (ECLAC)
42 II
The capacity of the health systems was strengthened through the conversion of existing clinics, the construction of temporary facilities and the purchase and donation of equipment and supplies. To facilitate the fast acquisition of the necessary inputs to slow the pandemic, some countries modified their procurement procedures. In Brazil and the Plurinational State of Bolivia, for example, public tender requirements were eliminated for purchasing health materials and equipment (ECLAC, 2021b).
In the area of women’s health, since the start of social distancing periods, governments have adopted measures such as the publication of general guidelines for avoiding gender discrimination, protocols for prenatal care and psychosocial care actions (see figure II.8).
Figure II.8 Latin America and the Caribbean (14 countries): government measures adopted in the area of women’s health during the pandemic, April–June 2020(Percentages)
Designation of sexual and reproductive health services
as essential services (Suriname)(6)
General guidelines for avoiding gender discrimination (Argentina,
Chile, Costa Rica, Ecuador, Mexico, Peru, Uruguay)
(44)
Telephone helpline for sexual and reproductive
health services (Suriname)(6)
Psychosocial care (Chile, Dominica,
Saint Kitts and Nevis)(19)
Prenatal care protocols (Belize, Plur. State of Bolivia,
Brazil, Colombia)(25)
Source: Economic Commission for Latin America and the Caribbean (ECLAC), “COVID-19 Observatory in Latin America and the Caribbean: economic and social impact”, 2021 [online] https://www.cepal.org/en/topics/covid-19.
Some countries provided universal coverage to guarantee that everyone who needed medical attention would receive it. In some cases, this meant making tests available for everyone with COVID-19 symptoms and providing free medical care. At least six countries in the region offered free tests, and others imposed price caps on tests conducted by private laboratories. In other cases, some of the additional actions had to be offset by reductions in other important areas, due to resource scarcity. Some countries limited tests to patients with symptoms, while others redirected the limited health sector resources to COVID-19 care at the expense of other medical problems. In El Salvador, for example, the Ministry of Health announced in March that the public health network would only provide emergency services and medical care to patients with chronic diseases (ECLAC, 2021b).
The pandemic response demonstrated the capacity of some firms to adapt and thereby compensate for the weaknesses of the health system through combined public and private efforts. As stated in ECLAC (2020b), “individual and collective initiatives, sometimes coordinated by business chambers, public institutions and academic centres, have enabled production to be adapted and equipment, inputs and essential services to be provided to the health system to address the health crisis” (p. 15).
The response measures reinforced the region’s weak and fragmented health systems during the emergency, often exhausting the available fiscal resources and increasing the public debt. In this framework, the acquisition, distribution and administration of vaccines is the next obstacle that will have to be faced in Latin America and the Caribbean to overcome the pandemic.

43
Building forward better: action to strengthen the 2030 Agenda for Sustainable Development
II
3. Vaccination progress
Whether countries in the region will be able to vaccinate their populations in 2021 will depend on both supply in the laboratories producing the vaccines and the countries’ financial capacity and negotiations to procure them.
Throughout 2020, there was strong competition between firms and between governments to develop a COVID-19 vaccine. Substantial efforts were made, resulting in the achievement of unprecedented results in a very short time. As of late January 2021, according to WHO, more than 230 research projects are underway, 63 of which are in some phase of human clinical trials (22 in phase 3 or in phases 2 and 3 combined). In particular, 10 projects have already resulted in a vaccine that has been approved in some country for massive or limited administration; that is, some vaccines have been given preliminary approval for certain age groups only.12 In the region, Argentina, Chile, Costa Rica and Mexico started vaccination before the end of 2020.
While it would seem that the problem of having an effective vaccine has been successfully resolved, there are still questions regarding whether the laboratories will be able to produce and distribute it fast enough and in sufficient quantities to achieve global immunity.
Considering 8 of the 10 vaccines that have been approved in some countries, the available information indicates that the laboratories expect to produce a total of 7.4 billion doses in 2021, with another 3.1 billion potentially coming from other projects currently in phase 3 (see table II.2). Assuming two-dose vaccines, this implies that global production would cover 67.4% of the world population (without differentiating by age). Reaching that percentage will require a huge effort to overcome the problems associated with the necessary investment, planning, production, global distribution, and country negotiations, a highly unpredictable situation that changes daily.
Table II.2 Characteristics and status of the main COVID-19 vaccines, 27 January 2021
Laboratory/name of vaccine CountryTechnology and number of doses
Status Production capacity (in millions of doses per year)
Pfizer-BioNTech/Comirnaty
United States – Germany
mRNA2 doses
Approved in Canada, Switzerland and the Persian Gulf countries.Emergency approval in Argentina, Chile, Costa Rica, Ecuador, Mexico and Panama, as well as the United States, the European Union, Australia and others.
50 in 20201 300 in 2021
Moderna/mRNA-1273
United States mRNA2 doses
Approved in Canada.Emergency approval in the United States, the European Union and Israel.
20 in 2020600 to 1,000 in 2021
Gamaleya National Research Centre of Epidemiology and Microbiology/ Sputnik V
Russian Federation
Adenovirus2 doses
Limited approval in Argentina, Bolivia (Plurinational State of), Paraguay and Venezuela (Bolivarian Republic of), as well as the Russian Federation, Belarus, Serbia, Hungary and Algeria and others.
The Gamaleya Centre is trying to sign production agreements in different regions to expand capacity.
CanSino Biologics/Convidecia o Ad5-nCoV
China Adenovirus1 dose
Limited use in China. 300 in 2021
12 Authorization to use the vaccines depends on the regulatory agencies in each country, so each vaccine has gone through a different process according to the country in which it will be administered. Furthermore, a given vaccine may have been approved for massive use in one country but only limited use in another.

Economic Commission for Latin America and the Caribbean (ECLAC)
44 II
Laboratory/name of vaccine CountryTechnology and number of doses
Status Production capacity (in millions of doses per year)
State Research Centre of Virology and Biotechnology VECTOR/EpiVacCorona
Russian Federation
Protein2 doses
Limited use in the Russian Federation. Information not available
Sinovac Biotech/CoronaVac
China Inactivated2 doses
Limited approval in Brazil and Chile, as well as China, Indonesia and Turkey.
600 in 2021
Sinopharm-Beijing Bio-Institute of Biological Products (BBIBP)/BBIBP-CorV
China Inactivated2 doses
Approved in China, Bahrain and the United Arab Emirates.Emergency approval in Egypt.
1,000 in 2021 between the two vaccines
Sinopharm-Wuhan Institute of Biological Products
China Inactivated2 doses
Limited approval in China and the United Arab Emirates.
Oxford-AstraZeneca/AZD1222
United Kingdom – Sweden
Adenovirus2 doses
Emergency approval in Argentina, Brazil, El Salvador, Mexico and the Dominican Republic, as well as the United Kingdom and India.
3,000 in 2021
Janssen (Johnson & Johnson)/JNJ-78436735 or Ad26.COV2.S
United States – Belgium
Adenovirus1 dose
Phase 3 1,000 in 2021
Novavax/NVX-CoV2373
United States Protein2 doses
Phase 3 1,000 to 2,000 in 2021
Bharat Biotech/COVAXIN
India Inactivated virus2 doses
Emergency approval in India. 300 to 500 in 2021
CureVac/CVnCoV
Germany – United States
mRNA2 doses
Phase 3 300 in 2021
Chongqing Zhifei Biological Products/RBD-Dimer or ZF2001
China Protein3 doses
Phase 3 300 in 2021
Source: Economic Commission for Latin America and the Caribbean (ECLAC), on the basis of C. Zimmer, J. Corum and S. Wee, “Coronavirus vaccine tracker”, The New York Times, January 2021 [online] https://www.nytimes.com/interactive/2020/science/coronavirus-vaccine-tracker.html, and Financial Times, “Covid vaccine development: the shots available and the doses administered”, January 2021 [online] https://www.ft.com/content/ac5e5ef8-bccb-482b-9f8d-0dab5cac6f9a.
A country can acquire the vaccines through three mechanisms: direct agreements between the government and producers; aggregation of purchases among countries; and participation in the COVID-19 Vaccines Global Access (COVAX) Facility.
As of mid-January 2021, at least 14 countries in the region had made advance purchase commitments directly between the government and private laboratories. The most commonly considered vaccines were the AZD1222 from Oxford-AstraZeneca, CoronaVac from Sinovac, Comirnaty from Pfizer-BioNTech and Sputnik V from the Gamaleya Centre, with which vaccination began in Argentina, Brazil, Chile, Costa Rica and Mexico. The CoronaVac vaccine from Sinovac accounts for a significant share, mainly due to an agreement with Chile. In some countries in the region, research is underway to develop new vaccines, and in others there are agreements to produce existing vaccines in collaboration with international laboratories (see box II.1).
WHO has indicated that over 70% of the world population needs to be vaccinated to achieve global immunity (EFE Salud, 2020). In the region, however, purchase commitments with laboratories do not cover the population over 18 years of age, with the exception of Chile (see figure II.9). This implies a considerable gap with more developed countries. For example, Australia, Canada, the United States, Japan and the United Kingdom have commitments that would cover 292, 620, 254, 135 and 186% of people over 18, respectively.
Table II.2 (concluded)

45
Building forward better: action to strengthen the 2030 Agenda for Sustainable Development
II
Box II.1 Latin America and the Caribbean: vaccine research and production
The only laboratories in the region that have presented a vaccine for human clinical trials are the Finlay Vaccine Institute (IFV) and the Centre for Genetic Engineering and Biotechnology (CIGB), both in Cuba. IFV began phase 2 trials on the Soberana 2 vaccine on 18 December and has announced the start of phase 3 in March 2021. In early February, a second Cuban vaccine (ABADALA, from CIGB) began phase 2 trials. Cuba plans to produce 100 million doses of Soberana 2 in 2021. Other laboratories that have developed vaccines that are in preclinical phases are the University of São Paulo (USP) in Brazil, the National Autonomous University of Mexico (UNAM), the National University of San Martín, Argentina (UNSAM), and the Catholic University of Chile.
Agreements have been reached to produce some of the more advanced vaccines developed by laboratories outside the region. AstraZeneca signed an agreement with the Carlos Slim Foundation, according to which the Argentine biotechnology firm mAbxience will produce the vaccine reagent, while the Mexican laboratory Liomont will complete the process of stabilization, production, and packaging the vaccine for distribution in Latin America. Following the approval of this vaccine, first in Argentina and then in Mexico, production could begin during the first half of 2021. Production capacity is 150 million to 200 million doses a year. The Oswaldo Cruz Foundation would produce the doses for Brazil.
The Brazilian pharmaceutical company União Quimica and the Bolivarian Republic of Venezuela could produce their own doses of the Sputnik V vaccine (Gamaleya), whose production has already started in the Russian Federation. Finally, the government of the State of São Paulo is in talks with Sinovac to produce 46 million doses of the CoronaVac vaccine locally.
Source: Economic Commission for Latin America and the Caribbean (ECLAC), on the basis of press information, and C. Zimmer, J. Corum and S. Wee, “Coronavirus vaccine tracker”, The New York Times, January 2021 [online] https://www.nytimes.com/interactive/2020/science/coronavirus-vaccine-tracker.html.
Figure II.9 Latin America (14 countries): coverage of the population over 18 years of age, by the number of COVID-19 vaccines that laboratories have committed to delivering to each country, 22 January 2021a
(Percentages)
0 50 100 150 200 250 300 350
El SalvadorVenezuela (Bol. Rep. of)
EcuadorPanama
Bolivia (Plur. State of)Colombia
Costa RicaBrazil
UruguayArgentina
MexicoPeru
Rep. DominicanaChile
Oxford-AstraZeneca (AZD1222) Pfizer-BioNTech (Comirnaty)Janssen (Ad26.COV2.S)Gamaleya (Sputnik-V) Bharat Biotech (COVAXIN)
Sinovac (CoronaVac)Covaxx (UB-162)Sinopharm
Source: Economic Commission for Latin America and the Caribbean (ECLAC), on the basis of Duke Global Health Innovation Center, “Launch & Scale Speedometer”, 2020 [online] https://launchandscalefaster.org/covid-19 [accessed on: 29 January 2021], and United Nations, “World Population Prospects 2019”, 2019 [online] https://population.un.org/wpp/.
a Calculated based on confirmed one- or two-dose vaccines per capita.

Economic Commission for Latin America and the Caribbean (ECLAC)
46 II
Countries will also be able to access vaccines through the COVAX Facility—led by WHO, the Gavi Vaccine Alliance and the Coalition for Epidemic Preparedness Innovations (CEPI)—which brings together governments, international organizations, the manufacturing industry, scientists and philanthropists in an effort to provide equal and innovative access to COVID-19 diagnosis, treatment and vaccination. COVAX aims to provide equal access to two billion vaccine doses by the end of 2021, to protect health-care workers and high-risk groups in all countries.
COVAX has the participation of 190 countries, including 92 low- and medium-low-income countries. Higher-income countries are self-financed; they commit to purchasing vaccines for 10%–50% of their population through COVAX, with advance payment (McAdams and others, 2020). Lower-income countries can access the vaccines they need through COVAX. No country will receive doses for more than 20% of their population until all the rest have received the necessary doses to cover that share. The majority of the countries in the region are participating in the initiative, and low- and medium-low-income countries and countries that meet the conditions to receive favourable financing (including Haiti, the Plurinational State of Bolivia, El Salvador, Honduras, Nicaragua, Dominica, Grenada, Guyana, Santa Lucia and Saint Vincent and the Grenadines) are eligible to receive the required doses free of charge (Gavi Alliance, 2020a).
In December 2020, COVAX had advance purchase commitments and memorandums of understanding with the Serum Institute of India, AstraZeneca/Oxford and Johnson & Johnson and an expression of intent with Sanofi/ GlaxoSmithKline (GSK), for a total of almost two billion doses. As these agreements come to fruition, participating countries should be able to access the vaccine in the first half of 2021, and 1.3 billion doses should be distributed to 92 lower-income countries toward the end of the year. The initiative faces a considerable funding gap, however, over and above the difficulties related to signing the agreements, the production capacity of the vaccine manufacturers and the efficiency of the national vaccine approval processes. Although COVAX collected US$ 2 billion in donations in 2020, meeting its objectives will require an additional US$ 6.8 billion in 2021: namely, US$ 800 million for research and development, US$ 4.6 billion for funding vaccines for low-income countries and US$ 1.4 billion for supporting distribution (Gavi Alliance, 2020b).
In addition to the above two strategies—that is, individual negotiation and participation in the COVAX Facility (individually or through the PAHO Revolving Fund, which offers regional representation)—there is a third alternative that has not been exploited in the region: namely, for countries to join forces to aggregate their demand and negotiate directly as a bloc.
With regard to vaccine availability and access, there are, on the one hand, market forces and individual negotiation and, on the other, humanitarianism and the common good, which promote fair and equal access. In the former, the region has a weak position; in the latter, it is a spectator waiting to receive help. Consequently, Latin American countries should take a proactive attitude in favour of regional integration and bloc negotiations.
The problems facing the region in relation to the COVID-19 vaccine are not limited to access. There are other bottlenecks related to the vaccination process, which will make it difficult to reach the goal of vaccinating 70% of the population in 2021. Countries will have to solve the following difficulties: internal distribution problems, in some cases complicated by the country’s geography and in others by the technological complexity of vaccines that require extremely low storage temperatures; supply problems for complementary resources such as syringes, needles or other ancillary supplies; and problems related to the availability of qualified health personnel in sufficient numbers.

47
Building forward better: action to strengthen the 2030 Agenda for Sustainable Development
II
BibliographyAdsera, A. and A. Menéndez (2011), “Fertility changes in Latin America in periods of economic uncertainty”,
Population Studies, vol. 65, No. 1.Baqui, P. and others (2020), “Ethnic and regional variations in hospital mortality from COVID-19 in Brazil: a cross-
sectional observational study”, The Lancet Global Health, vol. 8, No. 8.Burki, T. (2020), “COVID-19 in Latin America”, The Lancet Infectious Diseases, vol. 20, No. 5.Care/UN-Women (Care International/United Nations Entity for Gender Equality and the Empowerment of Women)
(2020), “Latin America and the Caribbean rapid gender analysis for COVID-19”, New York [online] https://lac.unwomen.org/en/digiteca/publicaciones/2020/05/analisis-rapido-de-genero-de-america-latina-y-el-caribe.
Carfi, A., R. Bernabei and F. Landi (2020), “Persistent symptoms in patients after acute COVID-19”, JAMA, vol. 324, No. 6, July.
Castro, M. and others (2018), “Implications of Zika virus and congenital Zika syndrome for the number of live births in Brazil”, Proceedings of the National Academy of Sciences (PNAS), vol. 115, No. 24, Washington, D.C., National Academy of Sciences (NAS).
Cid, C. and others (2020), “How much do countries spend on primary care in the Americas?”, Tracking Resources for Primary Health Care: a Framework and Practices in Low- and Middle-Income Countries, H. Wang and P. Berman (eds.), World Scientific Series in Global Health Economics and Public Policy, vol. 8, Hackensack, World Scientific Publishing.
ECLAC (Economic Commission for Latin America and the Caribbean) (2021a), Demographic Observatory, 2020 (LC/PUB.2020/20-P), Santiago, forthcoming.(2021b), COVID-19 Observatory in Latin America and the Caribbean [online] https://www.cepal.org/en/topics/covid-19 [accessed on: 22 January 2021].(2021c), “People of African descent and COVID-19: unveiling structural inequalities in Latin America”, Informes COVID-19, Santiago, January.(2020a), “Día Mundial de la Población 2020: las huellas de la pandemia en las tendencias demográficas en la región”, 10 July [online] https://www.cepal.org/es/notas/dia-mundial-la-poblacion-2020-huellas-la-pandemia-tendencias-demograficas-la-region.(2020b), “Sectors and businesses facing COVID-19: emergency and reactivation”, COVID-19 Special Report, No. 4, 2 July [online] https://repositorio.cepal.org/bitstream/handle/11362/45736/5/S2000437_en.pdf.(2019a), Women’s Autonomy in Changing Economic Scenarios (LC/CRM.14/3), Santiago.(2019b), “Latin America and the Caribbean: population estimates and projections” [online] https://www.cepal.org/en/topics/demographic-projections/latin-america-and-caribbean-population-estimates-and-projections.(2016), Spatial distribution and urbanization in Latin America and the Caribbean (DEPUALC) [online database] https://celade.cepal.org/bdcelade/depualc/.
ECLAC/FILAC (Economic Commission for Latin America and the Caribbean/Fund for the Development of the Indigenous Peoples of Latin America and the Caribbean) (2020), “Los pueblos indígenas de América Latina - Abya Yala y la Agenda 2030 para el Desarrollo Sostenible: tensiones y desafíos desde una perspectiva territorial”, Project Documents (LC/TS.2020/47), Santiago.
ECLAC/PAHO (Economic Commission for Latin America and the Caribbean/Pan American Health Organization) (2020), “Health and the economy: a convergence needed to address COVID-19 and retake the path of sustainable development in Latin America and the Caribbean”, COVID-19 Report ECLAC-PAHO, Santiago, 30 July [online] https://repositorio.cepal.org/bitstream/handle/11362/45841/4/S2000461_en.pdf.
ECLAC/UNFPA (Economic Commission for Latin America and the Caribbean/United Nations Population Fund) (2020a), “Afrodescendientes y la matriz de la desigualdad social en América Latina: retos para la inclusión”, Project Documents (LC/PUB.2020/14), Santiago.(2020b), “Risks of the COVID-19 pandemic for the exercise of women’s sexual and reproductive rights”, December [online] https://repositorio.cepal.org/bitstream/handle/11362/46508/1/S2000905_en.pdf.
ECLAC/UN-Women (Economic Commission for Latin America and the Caribbean/United Nations Entity for Gender Equality and the Empowerment of Women) (2020), “Care in Latin America and the Caribbean during the COVID-19: towards comprehensive systems to strengthen response and recovery”, August [online] https://repositorio.cepal.org/bitstream/handle/11362/45917/190820_en.pdf.

Economic Commission for Latin America and the Caribbean (ECLAC)
48 II
ECLAC and others (Economic Commission for Latin America and the Caribbean and others) (2020), “El impacto del COVID-19 en los pueblos indígenas de América Latina - Abya Yala: entre la invisibilización y la resistencia colectiva”, Project Documents (LC/TS.2020/171), Santiago, Economic Commission for Latin America and the Caribbean (ECLAC).
EFE Salud (2020), “OMS: Para acabar con la pandemia la vacunación debe llegar al 70% de la humanidad”, Agencia EFE, 12 November [online] https://www.efesalud.com/oms-vacunacion-pandemia-fin-humanidad.
Gavi Alliance (2020a), “92 low- and middle-income economies eligible to get access to COVID-19 vaccines through Gavi COVAX AMC”, 31 July [online] https://www.gavi.org/news/media-room/92-low-middle-income-economies-eligible-access-covid-19-vaccines-gavi-covax-amc [accessed on: 21 January 2021].(2020b), “COVAX announces additional deals to access promising COVID-19 vaccine candidates; plans global rollout starting Q1 2021”, 18 December [online] https://www.gavi.org/news/media-room/covax-announces-additional-deals-access-promising-covid-19-vaccine-candidates-plans.
Global Health 5050/APHRC (African Population and Health Research Center)/ICRW (International Center for Research on Women) (2021), “The Sex, Gender and COVID-19 Project” [online database] https://globalhealth5050.org/the-sex-gender-and-covid-19-project/the-data-tracker/.
Hanlon, P. and others (2020), “COVID-19 – exploring the implications of long-term condition type and extent of multimorbidity on years of life lost: a modelling study”, Wellcome Open Research, vol. 5, No. 75 [online] https://wellcomeopenresearch.org/articles/5-75.
Heuveline P. and M. Tzen (2021), “Beyond deaths per capita: comparative COVID-19 mortality indicators”, PubMed Central (PMC), 21 January [online] https://www.ncbi.nlm.nih.gov/pmc/articles/PMC7273293/.
Lee, R. (1990), “The demographic response to economic crsis in historical and contemporary populations”, Population Bulletin of the United Nations, No. 29 (ST/ESA/SER.N/29), New York, United Nations.
Marois, G., R. Muttarak and S. Scherbov (2020), “Assessing the potential impact of COVID-19 on life expectancy”, PLOS ONE, vol. 15, No. 9, September.
Marteleto, L. and others (2020), “Live births and fertility amid the Zika epidemic in Brazil”, Demography, vol. 57, No. 3.McAdams, D. and others (2020), “Incentivising wealthy nations to participate in the COVID-19 Vaccine Global
Access Facility (COVAX): a game theory perspective”, BMJ Global Health, vol. 5, No. 11. Meyerowitz-Katz, G. and L. Merone (2020), “A systematic review and meta-analysis of published research data
on COVID-19 infection-fatality rates”, medRxiv, 7 July [online] https://www.medrxiv.org/content/10.1101/2020. 05.03.20089854v4.
Ministry of Health (2020), “Defunciones según mes y año de la defunción” [online database] https://public.tableau.com/profile/deis4231#!/vizhome/HechosVitalesdesdeel2000/NotaTcnica?publish=yes.
Möller, S. (2020), “Intervenciones sociosanitarias y uso de las tecnologías de la industria 4.0 para enfrentar la enfermedad por coronavirus (COVID-19) en América Latina y el Caribe”, Social Policy series, No. 234 (LC/TS.2020/87), Santiago, Economic Commission for Latin America and the Caribbean (ECLAC).
Nepomuceno, M. and others (2020), “Besides population age structure, health and other demographic factors can contribute to understanding the COVID-19 burden”, Proceedings of the National Academy of Sciences (PNAS), vol. 117, No. 25, Washington, D.C., National Academy of Sciences (NAS).
PAHO (Pan American Health Organization) (2021), “Geo-Hub COVID-19 - Information System for the Region of the Americas” [online database] https://paho-covid19-response-who.hub.arcgis.com/ [accessed on: 8 November 2020].(2017), Health in the Americas+, 2017 Edition. Summary: Regional Outlook and Country Profiles, Washington, D.C.
Peto, J. (2020), “Covid-19 mass testing facilities could end the epidemic rapidly”, BMJ, No. 368, March.REPAM/COICA (Red Eclesial Panamazónica/Coordinadora de las Organizaciones Indígenas de la Cuenca Amazónica)
(2020), “Boletín del impacto del COVID-19 en los pueblos indígenas de la Panamazonía”, 15 May [online] https://redamazonica.org/2020/05/boletin-del-impacto-del-covid-19-en-los-pueblos-indigenas-de-la-panamazonia/.
Roy, S. and P. Ghosh (2020), “Factors affecting COVID-19 infected and death rates inform lockdown-related policymaking”, PLoS ONE, vol. 15, No. 10, October.
Schijman, A., C. Correa Caro and D. Vera-Cossio (2021), “COVID-19: containment measures and trust”, Ideas Matter, Inter-American Development Bank (IDB), 22 January [online] https://blogs.iadb.org/ideas-matter/en/covid-19-containment-measures-and-trust/.
Sorci, G., B. Faivre and S. Morand (2020), “Explaining among-country variation in COVID-19 case fatality rate”, Scientific Reports, vol. 10, No. 18909 [online] https://doi.org/10.1038/s41598-020-75848-2.

49
Building forward better: action to strengthen the 2030 Agenda for Sustainable Development
II
Soteras, A. (2020), “OMS: para acabar con la pandemia la vacunación debe llegar al 70% de la humanidad”, EFESalud, 12 November [online] https://www.efesalud.com/oms-vacunacion-pandemia-fin-humanidad.
Stone, L. (2020), “Short-run fertility responses to mortality events: a look to the past”, Applied Demography, vol. 32, No. 1, 1 April.
Takahashi, T. and A. Iwasaki (2021), “Sex differences in immune responses”, Science, vol. 371, No. 6527, 22 January.Teixeira da Silva, J. and P. Tsigaris (2020), “Policy determinants of COVID-19 pandemic-induced fatality rates
across nations”, Public Health, vol. 187, October.UNFPA (United Nations Population Fund) (2020), Socioeconomic Consequences of Adolescent Pregnancy in
Six Latin American Countries: Implementation of the Milena Methodology in Argentina, Colombia, Ecuador, Guatemala, Mexico and Paraguay, Panama City.
United Nations (2020), “COVID-19 in an urban world”, Policy Brief, July [online] https://unsdg.un.org/sites/default/files/2020-07/sg_policy_brief_covid_urban_world.pdf.(2019a), World Urbanization Prospects: the 2018 Revision (ST/ESA/SER.A/420), New York.(2019b), “World Population Prospects 2019” [online] https://population.un.org/wpp/.
WHO (World Health Organization) (2021), “WHO Coronavirus Disease (COVID-19) Dashboard” [online database] https://covid19.who.int/ [accessed on: 2 February 2021].(2020), “WHO Coronavirus Disease (COVID-19) Dashboard” [online database] https://covid19.who.int/ [accessed on: 3 November 2020].
Yelin, D. and others (2020), “Long-term consequences of COVID-19: research needs”, The Lancet Infectious Diseases, vol. 20, No. 10.
Zhu, D. and others (2020), “Social distancing in Latin America during the COVID-19 pandemic: an analysis using the Stringency Index and Google Comm.


51
Building forward better: action to strengthen the 2030 Agenda for Sustainable Development
CHAPTER III
The economic, social and environmental effects of the pandemic: additional obstacles to achieving the Sustainable Development Goals
A. Another lost decade
B. The social inequality matrix determines the effects of the pandemic
C. A production structure with more and more weaknesses
D. The rise of digital technologies
E. The persistent environmental crisis
Bibliography


53III
A. Another lost decadeIn the emerging world, Latin America and the Caribbean is the region hit hardest by the economic, social and environmental effects of the COVID-19 pandemic (IMF, 2020b). Characteristics such as the region’s persistent structural gaps, limited fiscal space, poor access to social protection —and its low coverage— high levels of labour informality, heterogenous production structure and low productivity are crucial to understanding the magnitude of the impact of the pandemic. These characteristics are also key to comprehending the difficulties the region encounters in implementing policies to mitigate the effects and to generate a sustainable and inclusive economic recovery, which would drive progress towards achieving Sustainable Development Goal (SDG) 8 (Promote sustained, inclusive and sustainable economic growth, full and productive employment and decent work for all).
Before the pandemic, the region’s economic growth was already slow, having averaged 0.3% in 2014–2019, and the rate was even slower in 2019. In addition to this slow growth, in 2020 there were negative external and internal supply and demand shocks owing to the need for lockdowns, physical distancing and closure of productive activities. Therefore, the health crisis has led to the worst economic, social and production crisis that the region has experienced in 120 years, with a 7.7% drop in regional gross domestic product (GDP) in 2020 (see figure III.1). In this situation, the GDP of the Caribbean, excluding Guyana, is estimated to have shrunk by 7.9%, with decreases in hours worked of 22% in the second quarter of 2020 and 13% in the third quarter. The tourism sector has been particularly affected, with severe repercussions for agriculture, catering and transport.
Figure III.1 Latin America and the Caribbean (33 countries): projected GDP growth rate, 2020(Percentages)
-30.0-12.9
-11.0-10.5
-9.0-9.0-8.6-8.5-8.5-8.0-8.0
-7.7-7.7-7.3-7.0-6.5-6.0-5.5-5.3-4.8-4.5-4.0-3.0
-2.5-1.6
-35 -30 -25 -20 -15 -10 -5 0
Venezuela (Bol. Rep. of)
Peru
Panama
Argentina
Ecuador
Mexico
El Salvador
Cuba
Central America and Mexico
Bolivia (Plur. State of)
Honduras
Latin America and the Caribbean
Latin America
South America
Colombia
Central America
Chile
Dominican Rep.
Brazil
Costa Rica
Uruguay
Nicaragua
Haiti
Guatemala
Paraguay
-26.6
-18.3
-16.0
-15.5
-15.4
-15.1
-14.5
-12.6
-10.1
-9.0
-7.9
-6.8
-5.5
30.9
-30 -20 -10 0 10 20 30 40
Saint Lucia
Antigua and Barbuda
Barbados
Belize
Dominica
Saint Kittsand Nevis
Bahamas
Grenada
Suriname
Jamaica
The Caribbean
Trinidad and Tobago
Saint Vincent andthe Grenadines
Guyana
Source: Economic Commission for Latin America and the Caribbean (ECLAC), on the basis of official figures.Note: Central America includes Cuba, the Dominican Republic and Haiti.

54 III
Economic Commission for Latin America and the Caribbean (ECLAC)
1. Macroeconomic policies to address the pandemic
In 2020, fiscal and monetary policies were the most widely used tools for addressing the social and economic effects of the pandemic. This has been reflected in significant increases in public spending in most of the countries of the region, accompanied by tax and monetary measures, all of which has driven the trends in public accounts in the year.
Fiscal efforts have aimed to strengthen health systems, support household income and safeguard production capacity through public spending and tax relief measures and government-backed liquidity instruments. In the region, these fiscal efforts have averaged around 4.3% of GDP and State guarantees have been equivalent to around 2.5% of GDP, although there are substantial differences between countries. In the Caribbean countries, government actions to provide financial support to businesses and households were limited by high levels of public debt.
The structures of these packages of measures have strongly influenced patterns in expenditure. Current transfers were the most frequently implemented measure in 2020 and consisted of special grants for families, assistance for companies to cover payrolls and financial support for subnational governments and other public institutions, to address the crisis.
Government revenues have been affected by the economic crisis and fell to an average of 13.1% of GDP for the period from January to September 2020, compared to 13.6% in the same period of 2019. The decline was larger in the Caribbean, where total revenue for the first six months of 2020 was equivalent to 12.4% of GDP, down from 13.2% of GDP for the first half of 2019.
The crisis has not affected different sources of income to the same extent: tax revenues have been hit particularly hard and their downturn —caused by a standstill in economic activity and the sharp drop in private consumption— is the main cause of the overall decline in central government revenue in both Latin America and the Caribbean. This pattern was accentuated in some countries by tax relief measures to shore up the liquidity of households and businesses.
These trends had an impact on the fiscal position of the countries. In the case of Latin America, the total central government deficit increased to an average of 5.0% of GDP for the first nine months of the year, compared to 1.6% of GDP in the same period of 2019. The Caribbean followed the same course, with central governments posting an average total deficit of 2.4% of GDP for the first half of the year, whereas in the first six months of 2019, they had recorded an average surplus of 0.5% of GDP. In both subregions, substantial primary deficits were incurred.
The worsening of fiscal accounts put huge pressure on the financing needs of most countries, resulting in public debt trending upward. By September 2020, the average gross public debt of central governments in Latin America had reached 53.4% of GDP, 7.4 percentage points higher than at the end of 2019 (see figure III.2).
The central banks of the countries of the region have also strengthened conventional and unconventional measures to support aggregate demand and maintain macrofinancial stability. Conventional actions have included interest rate cuts, revised legal reserve ratios and strengthening of mechanisms to promote financial intermediation. Two examples of unconventional measures are purchases by central banks of private and public securities held by financial institutions and transfers of resources directly to the public sector. These policies have led to significant expansion in liquidity and an increase in lending to the private sector, but especially a rise in lending by central banks to the public sector. In addition, some Caribbean countries have taken measures to limit demand for foreign currency.

55III
Building forward better: action to strengthen the 2030 Agenda for Sustainable Development
Figure III.2 Latin America and the Caribbean (21 countries): central government public debt, December 2019 and September 2020a
(Percentages of GDP)
A. Latin America
90.275.8
58.548.6 48.8 53.8 48.8 47.8 39.6 46.0 46.4 42.3 36.4
26.6 27.9 24.8 19.6
95.490.6
66.2 61.0 59.6 58.1 57.6 54.9 53.7 53.450.5
43.5 42.632.4 32.2
28.0 27.6
0
20
40
60
80
100
120
Arge
ntin
a
Braz
il
Cost
a Ri
ca
Colo
mbi
a
El S
alva
dor
Urug
uay
Hond
uras
Ecua
dor
Dom
inic
an R
ep.
Latin
Am
eric
a
Pana
ma
Nic
arag
ua
Mex
ico
Guat
emal
a
Chile
Peru
Para
guay
B. The Caribbean
119.4
95.075.2 63.8 56.1
130.5
121.9
106.8
77.7
59.7
0
20
40
60
80
100
120
140
160
Barbados Belize Suriname Bahamas Trinidad and Tobago
December 2019September 2020
Source: Economic Commission for Latin America and the Caribbean (ECLAC), on the basis of official figures.Note: In the case of Brazil, these are general government figures. For Honduras, the figures are for August 2020, and for Argentina, Chile, Nicaragua, Peru
and Uruguay, they are for June 2020.
With regard to external shocks, it is estimated that the value of the region’s exports fell by 13% in 2020. Although commodity prices sank at the start of the year, they recovered over the remainder, particularly metals and food. However, hydrocarbons remain below pre-crisis levels. In November 2020, food prices were 9% higher than in December 2019, while metals were up 17%. Energy products, in contrast, were still 29% below pre-crisis levels.

56 III
Economic Commission for Latin America and the Caribbean (ECLAC)
Remittances, which are a key component of net current transfers in the balance of payments, performed differently from country to country. In Mexico, the main recipient economy (accounting for more than a third of total flows received in the region), remittances grew by 9% up to August 2020 compared to the first eight months of the previous year, and it is estimated that they totalled an unprecedented US$ 40 billion for the year. Remittances also rose in Jamaica (18%), the Dominican Republic (11%), Nicaragua (9%), Guatemala (4%) and El Salvador (1%), while in other countries they fell, for example in the Plurinational State of Bolivia (-26%), Peru (-22%), Paraguay (-16%), Costa Rica (-10%), Ecuador (-10%), Honduras (-2%) and Colombia (-1%).
The pattern of financial flows to the region was driven by increases in global liquidity. The leading indicator of financial flows prepared by the Economic Commission for Latin America and the Caribbean (ECLAC) shows that, in the third quarter of the year, these flows to the region continued to recover, in line with the performance of bond issues on international markets by the region’s countries. Financial inflows during 2020 are estimated to have been sufficient to cover current account deficits and accumulate international reserves, although access to these flows was very varied from country to country.
Consequently, 19% more debt was issued by the countries of the region on international markets in the first 10 months of 2020 than in the prior-year period. Sovereign bonds accounted for 40% of the total issued up to October, followed by private corporate sector debt (27% of the total) and quasi-sovereign bonds (20%). Cumulative issuance of sovereign bonds was 45% higher in October 2020 compared to October 2019. Mexico issued a sustainable sovereign bond linked to achievement of the SDGs, making it the first country to do so. The 750-million-euro bond was issued with a yield of 1.35%, the second lowest in the country´s history. In the last week of November, for the first time in its history, Peru issued a 100-year bond, for a total of US$ 1 billion. Quasi-sovereign bond issuance from the region grew 24%, primarily driven by a US$ 1.5 billion bond issuance by Petróleos Mexicanos (PEMEX) and another from Brazil’s Petrobras, for US$ 1 billion, both in October.
Although the region has continued to enjoy unimpaired access to international debt markets owing to abundant liquidity, a worsening of the financial outlook for emerging countries leading to an abrupt halt in new financing would cause severe problems for many economies, as their debt ratios have risen because of the response to the pandemic. The region’s non-financial corporate sector has seen a decline in profitability, liquidity restrictions and a decrease in repayment capacity. Since late 2019, the credit rating agency Standard & Poor’s has downgraded its credit ratings for the long-term foreign-currency debt of around a third of the companies it covers in the region (IMF, 2020a). The crisis threatens to cause prolonged economic stagnation if it triggers a wave of insolvencies or situations whereby some companies cannot service debt with profits and rely on creditors to continue operating (zombie companies).
2. Expected growth in 2021 and the rest of the decade
The growth patterns of Latin America and the Caribbean in 2021 must be understood not only in the context of trends in the global economy, but also in relation to the sharp decline in 2020, the spread of the pandemic —considering factors such as the availability and administration of vaccines— and the ability of countries to maintain fiscal and monetary stimulus measures to support aggregate demand and the productive sectors.
Although ECLAC projects average growth of 3.7% for 2021 (see figure III.3), this is due to a significant base effect and would only recoup 44% of the economic activity lost in 2020.

57III
Building forward better: action to strengthen the 2030 Agenda for Sustainable Development
Figure III.3 Latin America and the Caribbean (33 countries): projected GDP growth rate, 2021(Percentages)
-7.01.01.32.0
3.03.03.23.53.53.53.73.73.73.83.83.84.04.5
4.95.05.05.05.15.5
9.0
-8 -6 -4 -2 0 2 4 6 8 10
Venezuela (Bol. Rep. of)Ecuador
NicaraguaHaiti
Costa RicaCubaBrazil
ParaguayEl SalvadorGuatemala
South AmericaLatin America
Latin America and the CaribbeanMexico
Central America and MexicoCentral America
UruguayHondurasArgentina
ChileColombia
Dominican Rep.Bolivia (Plur. State of)
PanamaPeru
2.0
2.0
3.3
3.4
3.9
4.2
4.5
5.7
6.0
6.4
7.5
7.5
8.1
13.4
0 2 4 6 8 10 12 14 16
Jamaica
Suriname
Trinidad and Tobago
Dominica
Saint Vincent and the Grenadines
The Caribbean
Bahamas
Grenada
Barbados
Saint Kittsand Nevis
Belize
Saint Lucia
Guyana
Antigua and Barbuda
Source: Economic Commission for Latin America and the Caribbean (ECLAC), on the basis of official figures.Note: Central America includes Cuba, the Dominican Republic and Haiti.
Given the region’s weak growth in the years prior to the pandemic, the projected growth rate for 2021 is unlikely to be maintained in subsequent years. This is particularly serious since, in a scenario with 3.7% growth in 2021 and subsequent growth in line with the average for the preceding decade (1.8% per year), there would only be a return to the 2019 GDP level (which was almost equal to that of 2013) by 2024. However, with a growth rate of 3.7% in 2021 and growth in line with the past 6 years (0.3%) in the subsequent years, there would not be a return to the GDP levels of 2019 in the next 10 years (see figure III.4). Naturally, these figures point toward an even worse situation in terms of per capita GDP.

58 III
Economic Commission for Latin America and the Caribbean (ECLAC)
Figure III.4 Latin America and the Caribbean (33 countries): level of GDP in real terms, 2008–2025(Index: 2008=100)
95
100
105
110
115
120
125
2008 2009 2010 2011 2012 2013 2014 2015 2016 2017 2018 2019 2020 2021 2022 2023 2024 2025
Scenario with a growth rate of 3.7% in 2021 and average growth for 2010–2019 of 1.8%Scenario with a growth rate of 3.7% in 2021 and average growth for 2014–2019 of 0.3%
GDP level 2019
Source: Economic Commission for Latin America and the Caribbean (ECLAC), on the basis of official figures.
B. The social inequality matrix determines the effects of the pandemic
1. Worsening labour market indicatorsThe contraction in economic activity has been accompanied by a large upswing in the unemployment rate —which is expected to have reached 10.7% in 2020 (a rise of 2.6 percentage points)— a sharp fall in the labour force participation rate and considerable increases in poverty and inequality (ECLAC, 2020a). Specifically, the participation rate fell by 5.4 percentage points, from 62.6% in the first three quarters of 2019 to 57.2% in the same period of 2020 (ILO, 2020a): 23 million people —just over half of whom (12.2 million) were women— dropped out of the labour force and stopped looking for work, owing to a lack of opportunities (see table III.1). The decline in labour force participation has softened the rise in the unemployment rate: if participation had remained at 2019 levels, the unemployment rate would have topped 18%. All these trends reduce the possibility of progress towards Goals 1 (End poverty in all its forms everywhere), 8 (Promote sustained, inclusive and sustainable economic growth, full and productive employment and decent work for all) and 10 (Reduce inequality within and among countries).
Table III.1 Latin America (weighted average of 18 countries):a participation rate and unemployment rate, total and by sex, 2019 and 2020(Percentages)
2019 2020Participation rate 62.5 57.2
Women 52.0 46.0Men 73.6 69.0
Unemployment rate 8.1 10.7Women 9.6 12.0Men 7.0 9.7
Unemployment rate if participation rate had remained at 2019 level 18.5Women 22.2Men 15.3
Source: Economic Commission for Latin America and the Caribbean (ECLAC), on the basis of official figures.a Argentina, Bolivarian Republic of Venezuela, Brazil, Chile, Colombia, Costa Rica, the Dominican Republic, Ecuador, El Salvador, Guatemala, Honduras, Mexico,
Nicaragua, Panama, Paraguay, Peru, Plurinational State of Bolivia and Uruguay.

59III
Building forward better: action to strengthen the 2030 Agenda for Sustainable Development
Lockdown and physical distancing measures to contain the pandemic have caused informal employment to deteriorate more than formal employment in 2020, resulting in a decline in informality indicators, in contrast to what usually occurs in crises of economic origin. Measures to contain the pandemic limited opportunities for informal self-employment, which is generally face-to-face and lacks the infrastructure and conditions needed for telework. Furthermore, while for many formal jobs it was possible to maintain employment links through furlough systems with some kind of benefit or subsidy, this option does not exist for informal jobs (ILO, 2020a).
Job losses have hit certain population groups hardest: informal workers, young people, people with less formal education, women and migrants. The most significant drop in employment was among women, owing to their greater participation in some of the most affected economic sectors (commerce, manufacturing, paid domestic work). In addition, women face greater difficulties in rejoining the labour market because they have had to take on additional care tasks in their homes. As a result, gender gaps in labour markets have widened (ECLAC/UN-Women, 2020; ILO, 2020b and 2020c). In addition, young people, and in particular young women, have been severely affected. Of the 23 million people who left the workforce in 2020, 6 million were young women and men between the ages of 15 and 24. In addition, the youth unemployment rate rose by 2.7 percentage points to 23.2% in the first three quarters of 2020, compared to the first nine months of 2019 (ILO, 2020a). Lastly, in the future the labour market may offer fewer opportunities for older persons, whose inclusion in the job market is crucial to their well-being when there are no universal social protection systems (ECLAC, 2021a).
The fall in employment and the declines in the income of many of those who remained employed has led to widespread loss of labour income, which eased only slightly in the third quarter. The fall in labour income is estimated to be equivalent to 10.1% of regional GDP (ILO, 2020), and has led to serious subsistence problems for many households, accompanied by a marked weakening of domestic demand and supply shocks.
2. Poverty, extreme poverty and hunger
In the five years prior to the pandemic, there was a gradual increase in the percentage of the population living in extreme poverty, from 7.8% to 11.3%, and in poverty, from 27.8% to 30.5% (see figure III.5). Also, the Gini index declined at an annual rate of just 0.5% in 2014–2019, compared with an average of 1.1% for 2002–2014. Owing to the effects of the pandemic, and despite emergency social protection measures, in 2020 poverty and extreme poverty in the region reached levels not seen in 12 and 20 years, respectively. In addition, income distribution has worsened in most countries. For 2020, the extreme poverty rate is estimated to have reached 12.5% while the poverty rate rose to 33.7%. This would result in a total of 209 million people living in poverty by the end of 2020, 22 million more than the previous year. Of these people, 78 million would be living in extreme poverty, 8 million more than in 2019 (ECLAC, 2021a). This pattern makes it even more difficult to achieve Goals 1 (End poverty in all its forms everywhere) and 2 (End hunger, achieve food security and improved nutrition and promote sustainable agriculture) by 2030.
The increase in poverty and extreme poverty would have been even larger without measures to transfer emergency income to households. Projections that only take into account the impact of the pandemic on employment and labour income show that the poverty rate would have risen by 6.7 percentage points in 2020, to 37.2% of all people, while 15.8% would be living in extreme poverty, an increase of 4.4 percentage points.

60 III
Economic Commission for Latin America and the Caribbean (ECLAC)
Figure III.5 Latin America (18 countries): people living in poverty and extreme poverty, 2014–2020a (Percentages)
51.2
47.5 45.5 45.643.9 45.4
42.640.0
35.833.5
31.628.8 28.6 27.8 29.1 29.9 29.8 29.8 30.5
33.7
15.5 14.0 13.1 12.8 12.4 12.2 10.2 9.4 8.4 9.1 8.7 8.2 8.3 7.8 8.7 9.9 10.2 10.4 11.3 12.5
0
10
20
30
40
50
60
1990 1994 1997 1999 2000 2002 2004 2005 2006 2008 2010 2012 2013 2014 2015 2016 2017 2018 2019 2020b
Poverty Extreme poverty
Source: Economic Commission for Latin America and the Caribbean (ECLAC), on the basis of Household Survey Data Bank (BADEHOG).a Weighted average for the following countries: Argentina, Bolivarian Republic of Venezuela, Brazil, Chile, Colombia, Costa Rica, the Dominican Republic,
Ecuador, El Salvador, Guatemala, Honduras, Mexico, Nicaragua, Panama, Paraguay, Peru, Plurinational State of Bolivia and Uruguay.b The figures for 2020 are projections that take into account the effect of emergency transfer programmes.
The increase in extreme poverty has worsened the food situation in the region. Although figures are not available for the full-year of 2020, data from the Hunger Monitoring Unit of the World Food Programme (WFP), based on the Food Consumption Score (FCS), shows significant.1 In the 10 countries of the region for which information is available,2 insufficient food intake was affecting 27 million people (about 16% of their population) at the end of December 2020. In the last quarter of 2020, there was some improvement, owing to the trends in Colombia, Guatemala and Haiti. In this situation, 38% of households in the countries that supplied information reported adopting food intake strategies, such as switching to less expensive foods, limiting portion size, reducing the number of meals, asking other households for food, or limiting food for adults in favour of children.
The increase in hunger in Latin America and the Caribbean is also reflected in the data on food assistance provided by food banks in the region from the Global FoodBanking Network, both in terms of tons of food and people served. The total volume of food assistance mobilized in the region increased by almost 50% between 2019 and 2020, while the number of beneficiaries doubled to 9.5 million, compared to 4.7 million in 2019. During the pandemic, all food banks reported higher demand for food assistance, especially from people who had lost their source of income.
In Brazil, Colombia, Mexico, Nicaragua, the Plurinational State of Bolivia and Uruguay, the amount of food delivered per person was lower than in 2019, as the increase in demand outstripped food supply. In the other countries (Argentina, Chile, Costa Rica, Dominican Republic, Ecuador, El Salvador, Guatemala, Honduras and Panama) the quantity of food delivered increased, not only because of greater availability of food, but also because of the need to deliver a larger quantity to comply with biosafety and isolation protocols and reduce circulation; it remains a possibility that these factors may have contributed to
1 See World Food Programmme, HungerMap [online] https://hungermap.wfp.org/.2 Colombia, Dominican Republic, Ecuador, El Salvador, Guatemala, Haiti, Honduras, Nicaragua, Peru and the Plurinational State of Bolivia.

61III
Building forward better: action to strengthen the 2030 Agenda for Sustainable Development
lower demand. In some of the countries where the quantity of food delivered has increased, there are also major public food aid programmes (for example in Argentina, Chile, Costa Rica and Ecuador), suggesting that public policy and private actions are complementary.
Furthermore, in most countries the food price index has risen more than the consumer price index (CPI) (ECLAC/FAO, 2020). The gap between the trajectories of the two indices widened in March, during the start of the pandemic in the region, when stay-at-home measures were implemented, driving up demand and causing uncertainty over supply. Growth slowed from May to June onward, as uncertainty subsided and countries rolled out or stepped up food distribution programmes; however, the upswing that began during the second quarter of 2020 has not dissipated. By the end of October 2020, the Harmonized Index of Consumer Prices (HICP) had risen twice as much as the overall consumer price index (weighted average of 15 countries).3
In the Caribbean countries, despite declines in income, short-lived shortages of staple foods and increased difficulty in obtaining them, food security was maintained in the first year of the pandemic because reductions in commercial shipping were limited and brief, and disruption of food chains was minimal. In addition, there was a drop in tourism, which reduced demand for food, and governments made efforts to increase agricultural production in the short term. The Caribbean Community (CARICOM) has formulated a COVID-19 Response Agri-Food Plan, and some governments, such as Barbados, Belize, Jamaica, Saint Kitts and Nevis, and Trinidad and Tobago, have launched programmes to stimulate agriculture and food production. Despite this progress, the situation could be reversed if the pandemic continues for longer than expected, for example because of a drawn-out vaccination campaign.
3. A deterioration in income distribution
The contraction in economic activity because of the pandemic, with job losses and reductions in labour income, will result in larger low-income strata (poor and non-poor low-income population), and downward mobility from the middle-income strata. This is because middle-income and upper low-income strata families obtain their income primarily from work —mostly wage employment— and they are not usually beneficiaries of social protection policies or programmes.
From 2019 to 2020, the low-income strata are estimated to have expanded by 4.4 percentage points (around 27 million more people), while the middle-income strata contracted by a similar proportion (-4.1 percentage points). Of the total of around 59 million people who were in the middle-income strata in 2019 and who in 2020 are expected to have descended into a lower stratum, just over 25 million are estimated to have remained in middle-income strata, while a little more than 3 million are estimated to have fallen into poverty or extreme poverty. The remainder are estimated to have moved into low-income strata, but above the poverty line (ECLAC, 2021a).
Regarding the effects of the pandemic on the distribution of household income, the first impact is loss of labour income owing to interruption of employment. The proportion of people who no longer receive labour income in the lowest income quintile is estimated to have increased by 5.7 percentage points, substantially more than in the subsequent quintiles. In the highest income quintile, the proportion of people with no income is expected to increase by 0,7 percentage points. The second impact is a decline in labour income for those who have remained in employment during the pandemic. The significant decline in demand and in the feasibility of performing usual occupational tasks is estimated to have led to a 15% fall in average labour income per employed person. As a result of these trends, for people in the lowest income quintile, the fall in labour income is projected to have been 42%, while for those in the highest income quintile, the expected average fall is around 7%.
3 Argentina, Brazil, Chile, Colombia, Costa Rica, the Dominican Republic, Ecuador, El Salvador, Guatemala, Honduras, Mexico, Nicaragua, Paraguay, Peru, Plurinational State of Bolivia and Uruguay.

62 III
Economic Commission for Latin America and the Caribbean (ECLAC)
Because of these two effects, total per capita income inequality is estimated to have increased in 2020, resulting in an average Gini index 5.6% higher than that recorded for 2019. Including government transfers to mitigate the loss of labour income —which tend to be primarily to low- and middle-income groups— the expected increase in the average Gini index for the region is 2.9% (ECLAC, 2021b).
4. Social protection gaps and responses
The pandemic has exposed the fragmentation and inequalities of social protection systems and the weakness of the welfare state in the region. Prior to the crisis, owing to high levels of labour informality, only 47.2% of the employed were affiliated with or contributed to pension systems, and just 60.5% were affiliated with or contributed to health systems. Moreover, in 2019, a quarter of people aged 65 and over were not receiving pensions. In the same year, conditional transfer programmes covered an average of 18.5% of the population in the countries of Latin America and the Caribbean (ECLAC, 2021a).
In the absence of universal social protection systems, governments have responded to the pandemic with an unprecedented set of emergency social protection programmes aimed primarily at households in poverty or at greater risk of poverty, such as those with informal workers. During 2020, 263 non-contributory social protection measures were adopted in 32 countries —by adapting existing programmes, such as conditional transfers, or the creating new ones— including cash transfers, distribution of food and medicine, and guaranteed provision of basic services. Cash and in-kind transfers are estimated to reach, on average, 49.4% of the population in the countries of the region (see figure III.6) (ECLAC, 2020d and 2021a).
Figure III.6 Latin America and the Caribbean (28 countries):a persons in households receiving emergency cash and in-kind transfers, to address the effects of the pandemic and through conditional transfer programmes, simple average by subregion, 2020 and latest available year(Percentages of the total population)
49.4
60.866.1
54.2
31.5
18.5 20.5 24.5
16.0
7.3
0
10
20
30
40
50
60
70
Latin America and the Caribbean
Latin America South America Central America, Haiti, Mexico and
the Dominican Rep.
The Caribbean
Emergency cash transfers and in-kind transfersConditional transfer programmes
Source: Economic Commission for Latin America and the Caribbean (ECLAC), Social Panorama of Latin America, 2020, Santiago, 2021, forthcoming, on the basis of official information from the countries; COVID-19 Observatory in Latin America and the Caribbean [online] https://www.cepal.org/en/topics/covid-19; and “Social Development and COVID-19 in Latin America and the Caribbean” [online] https://dds.cepal.org/observatorio/socialcovid19/en/.
Note: Based on coverage of conditional transfer programmes or other permanent cash transfer programmes in the latest year for which information is available in the Non-contributory Social Protection Programmes Database - Latin America and the Caribbean [online] https://dds.cepal.org/bpsnc/cct. For emergency cash and in-kind transfers to address the effects of the COVID-19 pandemic, the data refer to 2020.
a South America includes Argentina, Bolivarian Republic of Venezuela, Brazil, Chile, Colombia, Ecuador, Paraguay, Peru, Plurinational State of Bolivia and Uruguay; Central America includes Costa Rica, Dominican Republic, El Salvador, Guatemala, Haiti, Honduras, Mexico and Panama; the Caribbean includes Antigua and Barbuda, Bahamas, Barbados, Belize, Guyana, Jamaica, Saint Kitts and Nevis, Saint Lucia, Saint Vincent and the Grenadines and Trinidad and Tobago.

63III
Building forward better: action to strengthen the 2030 Agenda for Sustainable Development
These measures drove up spending on non-contributory social protection, and of earmarked resources, 73% of which were disbursed between March and August in response to the urgent need to protect the income and consumption of affected families. Efforts by the countries to finance these measures raised around US$ 86.214 billion in 2020. The simple average for this expenditure is equivalent to US$ 78 per capita and represents1.25% of 2019 per capita, although there are significant differences between subregions. Spending was highest in South America (US$ 105.2 per capita), followed by Central America, the Dominican Republic, Haiti and Mexico (US$ 97.6) and the Caribbean (US$ 44.6).
5. The most vulnerable social groups
The pandemic has impacted a region characterized by a matrix of social inequality whose axes —such as socioeconomic stratum, gender, stage in the life cycle, ethnicity and race, territory, disability, and immigration status— create multiple, often concurrent, situations of exclusion and discrimination, resulting in greater vulnerability to the socioeconomic repercussions of the pandemic.
Women are particularly vulnerable as they have more precarious labour situations and their participation in informal work is high. Female paid domestic workers (11.4% of employed women), many of whom are migrant, indigenous or Afrodescendent, find themselves in a particularly difficult situation, as they are unable to work remotely. Few have access to social security, and they have less protection in situations of long-term unemployment. In a context of lockdowns, school closures and a need for care if any household members become infected, there have been significant increases in the burden of unpaid domestic work assumed by women and girls, and in cases of violence against them (ECLAC/UN-Women, 2020).
Since the COVID-19 pandemic began, there has been a rise in gender-based violence against women and girls, which has been aggravated by lockdowns, physical distancing and movement restrictions, leaving women more isolated from support networks and creating additional barriers to access to essential services. This violence prevents effective enjoyment of human rights, with physical, psychological, social and economic effects on the lives of thousands of women and girls and their communities, and it directly undermines SDG 5, which aims to achieve gender equality and empower all women and girls. Data from before the crisis already showed the extent of violence against women and girls at the global and regional levels (a “shadow pandemic”): one in three women (one in two in the Caribbean) have been subjected to or are experiencing physical, psychological or sexual violence inflicted by a former or current partner, which always carries the risk of lethal violence, which is to say feminicide or femicide, measurement of which is an indicator in the regional indicator framework for monitoring the SDGs in Latin America and the Caribbean.
The increase in gender-based violence against women and girls led governments in the region to adopt more than 90 measures to address the situation, adapting services to address violence against women to remote formats and declaring them essential (ECLAC, 2020b). However, governments’ efforts to prevent and respond to this violence have been mixed; the cases of Argentina, Colombia, the Dominican Republic, Honduras and Mexico stand out, where all or part of the services for violence against women have been declared essential. In some countries (such as Paraguay and Uruguay), instructions or decrees were issued for operating certain judicial services and automatically extending precautionary or protective measures.
The pandemic could have a catastrophic impact on the overall development of children and adolescents. In 2020, 32 countries in the region closed their educational institutions to stop the spread of the disease, affecting more than 165 million students at all levels (2.3 million of them in the Caribbean4) between March and June. Despite a gradual reopening, in November the figure was still above 120 million. Although most
4 Estimate based on data from the UNESCO Institute for Statistics. Includes students from 26 Caribbean countries.

64 III
Economic Commission for Latin America and the Caribbean (ECLAC)
of these countries established means to continue education through distance learning, this may widen learning gaps, especially between students in public and private schools, to the detriment of those in the lowest-income households, who have limited or no access to digital devices or the Internet and live in overcrowded conditions, with fewer cultural resources in the home.
The pandemic has also hampered achievement of SDG 4 on ensuring inclusive and equitable quality education and promoting lifelong learning opportunities for all, as the negative effects on learning are expected to be greatest for children under 8 years of age, who do not yet have the skills to be able to adapt to distance learning.5 Likewise, disruption or interruption of curricula and of education processes widens progress gaps throughout education, and gaps in terms of level of education completed. Prolonged school closures could thus trigger a learning crisis and a “generational catastrophe”, jeopardizing decades of progress and deepening existing inequalities (United Nations, 2020). Around 3 million students at all levels of education in Latin America and the Caribbean are at risk of not returning to education, with the greatest impacts in proportional terms for students at the tertiary level because of the associated costs and at the pre-primary level because of the difficulty of maintaining distance learning for these ages (UNESCO, 2020). The children of the poorest families may also be forced to enter the labour market. This would increase child labour by between 1 and 3 percentage points, meaning that at least between 109,000 and 326,000 children and adolescents could be added to the 10.5 million who were already in child labour before the pandemic (ECLAC/ILO, 2020b).
For all these reasons, the healthy development of children and adolescents is at risk, both because of the risk of increased undernutrition and malnutrition owing to overweight and because of the risk to mental health posed by lockdowns and family stress. The suspension of classes has had repercussions for school feeding programmes (even though 21 of the 33 countries in the region maintained them in various formats), mental health programmes and comprehensive sexual education programmes, as well as on the provision of sexual and reproductive health services, including the distribution of contraceptives (ECLAC/UNICEF, 2020).
In addition to women and youth, other population groups have suffered disproportionately from the effects of the crisis. Many people over 60 have had to live in increased isolation, which can affect their mental health and, together with the economic crisis, jeopardize their food security. Stay-at-home orders can increase the barriers faced by the more than 70 million persons with disabilities to accessing the education system and decent work with sufficient income and social protection. This is especially serious for those whose economic situation precludes having devices on which to continue educational or work activities from home (ECLAC, 2020c).
The crisis is also deepening the inequalities and social and labour exclusion suffered by indigenous peoples (60 million people) and Afrodescendants (134 million people), whose participation in unskilled self-employment is disproportionately high, and in the case of women, with sizeable wage gaps with respect to men who are neither indigenous nor Afrodescendent. The structural inequalities, discrimination and racism that affect indigenous peoples and Afrodescendants are the main factor in their vulnerability to the pandemic and the crisis, with a greater impact on women, youth and children. While indigenous peoples have formulated collective responses to the health and economic crisis, State responses have been weak, and there have been further sharp rises in tension and conflicts arising from a lack of guarantees of territorial rights, and threats from companies, illicit groups and land speculators (ECLAC/PAHO, 2020; ECLAC and others, 2020; ECLAC, 2018).
Migrants are affected by border closures, difficulties with movement, and increases in unemployment. Their access to health systems and social protection is inadequate because of the scarce resources available for migrants, and because of their fear of being identified when these resources are available. These problems are more severe in the case of migrant children who are internally displaced —whether or not they are accompanied— and given the possible increase in xenophobia and discrimination and racism against migrants (UNICEF, 2020).
5 In Brazil, the loss of one quarter of the school year could increase the proportion of 10-year-olds with learning poverty by 6% (World Bank, 2020).

65III
Building forward better: action to strengthen the 2030 Agenda for Sustainable Development
C. A production structure with more and more weaknessesAchieving targets 8.2 and 8.3 of SDG 8 poses major challenges for the region in terms of increasing productivity through diversification (higher value-added activities), technological modernization and innovation, and also with regard to the strengthening and growth of micro-, small and medium-sized enterprises (MSMEs). The region’s production structure has weaknesses accumulated over decades. Over the past 20 years, Latin America’s growth has been mainly come from adding jobs. For the region as a whole, only 19.5% of GDP growth between 2000 and 2019 is explained by productivity gains, compared with 81.5% explained by employment gains. This is in stark contrast not only with in China, India and the United States, or the averages for the members of the European Union and the Organization for Economic Cooperation and Development (OECD), but also with the global average, with 62.4% of global GDP growth attributable to increases in productivity and 37.6% to increased employment (ECLAC, 2021b).
Following a long period of decline, Latin America’s productivity is just 19% of that of the United States. This pattern is a result of structural problems in economies that are based on a small number of natural resource production and processing activities and some capital-intensive services (electricity, telecommunications and banking) that have high levels of productivity but account for just 8% of employment. The remaining sectors (including manufacturing) are characterized by low or very low productivity. This makes it clear that within the production structure, linkages are poor between sectors and activities, but also between companies. Indeed, there are significant differences between the productivity levels of the different types of productive units (MSMEs and large enterprises).
In all economic systems, performance varies from enterprise to enterprise (in terms of productivity). However, the differences are much more marked in Latin America, where the labour productivity of a medium-sized enterprise is, on average, less than half that of a large company. Productivity in small enterprises is just 23% of the productivity of large enterprises and labour productivity in microenterprises is only 6% of that of large companies. These percentages are much lower than in economies where smaller firms are a key part of production systems (such as the countries of the European Union). In Latin America, MSMEs —and particularly micro- and small enterprises— operate in segments with lower productivity, few barriers to entry, standardized production and low knowledge intensity, where they compete directly with large-scale production or with large trading houses (Dini and Stumpo, 2019).
This shows the difficulties that the economies of the region face when making changes to production systems and enterprises, in a period characterized by major technological transformations that have been seized upon by other countries. Slow productivity growth poses serious challenges to the ability to improve wages, international positioning in higher value added product markets and, more generally, the welfare of populations. This is related to long-standing characteristics of the region’s production and business structure. In this context, MSMEs have been relegated to providing inferior quality, unstable and poorly paid employment. Although this ensures that there is some growth in employment during macroeconomic expansion, it also facilitates a transfer of workers (and companies) from the formal to the informal economy during crises. Furthermore, the situation hinders sustained and widespread increases in productivity.
1. MSMEs, the enterprises hit hardest by the crisis
The crisis of 2020 has caused a setback compared to the start of 2019. In this regard, although the crisis is affecting all economic activities and agents, it has a different impact on each productive sector and type of company (see diagram III.1). ECLAC estimates that 34.2% of formal employment and 24.6% of the region’s GDP correspond to sectors that have been severely affected by the crisis resulting from the pandemic. Moreover, sectors that are expected to be moderately affected account for less than one fifth of jobs and GDP (see figure III.7).

66 III
Economic Commission for Latin America and the Caribbean (ECLAC)
Diagram III.1 Latin America and the Caribbean (33 countries): intensity of the expected impact of the pandemic by sectors of economic activity, 2020
Severe
Tourism
Traditional cultural industry
Commerce
Reparation of goods
Hotels and restaurants
Transport
Fashion
Automotive
Significant
Mining
Electricity, gas and water
Construction and construction materials
Business services
Financial activities
Beverages
Furniture and wood
Chemicals
Electronics – machinery and equipment
Moderate
Agriculture and fisheries
Production of food for the domestic market
Medical inputs and equipment
Medicines
Telecommunications
Packaging
Source: Economic Commission for Latin America and the Caribbean (ECLAC).
Figure III.7 Latin America and the Caribbean (27 countries): share of GDP and employment by intensity of expected sectoral impact of the pandemic, 2020(Percentages)
EmploymentGDP
24.6
61.3
14.1
34.2
47.6
18.2
0
10
20
30
40
50
60
70
Severe Significant Moderate
Source: Economic Commission for Latin America and the Caribbean (ECLAC), on the basis of official information.

67III
Building forward better: action to strengthen the 2030 Agenda for Sustainable Development
With the current business and sectoral structures, 63% of microenterprises operate in activities that are highly exposed to the economic and health crisis, such as commerce and hotels and restaurants (see table III.2). In contrast, a much smaller percentage of large companies are in this situation. The fact that resilience to the same sectoral impact is proportional to the size of the firm has important implications regarding the effects of the crisis on the ability of firms to continue operating, hindering achievement of sustained, inclusive and sustainable economic growth, full and productive employment and decent work for all (SDG 8).
Table III.2 Latin America and the Caribbean (27 countries): number of enterprises affected by the coronavirus disease (COVID-19) pandemic crisis, by size and type of effect, 2020(Number of enterprises and percentages)
Effects Microenterprises Percentage Small enterprises Percentage Medium-sized
enterprises Percentage Large enterprises Percentage Total
Moderate 812 424 6 118 352 9 19 811 9 5 906 9 956 495
Significant 3 946 182 31 641 553 46 126 197 59 42 739 63 4 756 673
Severe 8 071 916 63 630 793 45 68 385 32 19 224 28 8 790 319
Total 12 830 523 100 1 390 699 100 214 393 100 67 869 100 14 503 487
Source: Economic Commission for Latin America and the Caribbean (ECLAC), on the basis of official information.
Therefore, although the crisis is affecting all companies, the impact will be much greater for MSMEs, with widespread closures and job losses. Based on the characteristics of companies and the effects of the crisis on the different sectors, ECLAC estimates that, between April and December 2020, more than 2.7 million formal companies may have closed in the region, with a loss of more than 8 million jobs, not including the job cuts made by businesses that continued to operate.
The 2020 business demographics study for Mexico ("EDN 2020. Estudio sobre la demografía de los negocios 2020. Primer conjunto de resultados") produced some important results in this regard (INEGI, 2020). Although it covers a period that began before the ongoing crisis (17 months from May 2019 to September 2020), the trends it identifies are in all likelihood greatly influenced by the crisis; this is particularly true for closures of companies: just over 1 million fewer microenterprises and SMEs were recorded than in the 2019 economic censuses.6 7 The microenterprises and SMEs that were created in the period employ 32.3% fewer workers per company than those that closed. This does not necessarily mean that they are smaller than those that closed, as size is determined by turnovers (for which data are not yet available). Three conclusions can be drawn from the study on the patterns that are affecting the business structure: net destruction of companies (619,443 companies were created compared to the 1,010,857 that closed); the businesses that have been created have fewer workers on average than those that closed; and there has been a decline in employment in the companies that have continued to operate.
The crisis is also changing the productive structure, as its impact varies according to sector of activity. For the manufacturing industry, ECLAC has estimated the different effects that the crisis may have on three groups of sectors.8 More than 92% of the branches of industry that are most technology-intensive are facing a crisis with effects that can be classified as “significant” or “severe” (figure III.8). These branches
6 The 2020 business demographics study does not record data on large companies.7 See [online] https://www.jornada.com.mx/notas/2020/12/02/economia/desaparecieron-un-millon-10-mil-empresas-hasta-agosto-inegi/.8 Industrial activities have been grouped into three sets of sectors based on the classification proposed by Katz and Stumpo (2001). Automotive and
auto parts, other transport equipment, electronics (finished products and components), industrial machinery, medical and scientific instruments, and pharmaceuticals have been included in the group of technology-intensive sectors. The resource-intensive sectors include metal smelting, wood, pulp and paper, chemicals, construction materials, and food, beverages and tobacco. Lastly, the labour-intensive sectors include textiles, garments, leather, footwear, plastic products and cleaning products.

68 III
Economic Commission for Latin America and the Caribbean (ECLAC)
bring together the most learning- and innovation-intensive activities, which are vital to the diversification and increased value added needed to close productivity gaps and enter a path of long-term sustainable growth. In this regard, the industrial sectors that have the greatest potential for technological growth are being hit hardest by the crisis, thus exacerbating the structural problems of the region’s economies. This means that, if appropriate policies are not implemented to strengthen these productive sectors, a regressive structural change is very likely to take place, leading to reprimarization of the region’s economies.
Figure III.8 Latin America (8 countries):a share of industrial production of groups of sectors according to the intensity of the expected impact of the crisis, 2020(Percentages)
ModerateSignificantSevere
39.4
14.9
53.552.6
43.2
9.38.0
42.037.3
0
10
20
30
40
50
60
Technology-intensive Natural-resource-intensive Labour-intensive
Source: Economic Commission for Latin America and the Caribbean (ECLAC), on the basis of official information.a Argentina, Brazil, Chile, Colombia, Ecuador, Mexico, Peru and Uruguay.
The official data released shows the performance of the sectors of industry in the largest industrial economies of the region over the first three quarters of 2020. The sharpest falls in industrial production occurred between March and June, although there has been a downward trend since 2019 (2017 in the case of Argentina). This pattern, coupled with the COVID-19 crisis, led to extensive declines in the first half of 2020. In the case of technology-intensive sectors, the most significant decline was in the automotive and auto parts industry. From June 2020 onward, there were signs of recovery, largely reflecting a statistical rebound effect, owing to a reduction in health measures. For the first three quarters of the year, there was a sharp decline in cumulative output compared to the prior-year period (see table III.3) and the sectors with the highest technological content continued to be significantly affected. In the third quarter, the most significant recoveries were in the automotive and auto parts sector (180% in Argentina, 63% in Colombia, 14% in Mexico, 11% in Brazil), albeit with output levels still well below those of 2019.
It is difficult to estimate the short-term impact on productivity of changes in the sectoral structure of industry. Preliminary information indicates that technology-intensive activities are shrinking in relative terms and that, although statistics show a recovery —slower than the industry average— the decline in productive activity has been accompanied by closures of companies and plants. These are trends that have been in place for years, which have been magnified by the current crisis, for example in the auto parts industry in Argentina.9 Even with a return to 2019 GDP levels, the destruction of capacities will severely affect the activities with the greatest potential to diversify production and to achieve the necessary productivity increases.
9 See [online] http://www.afac.org.ar/imagenes/noticias/4136_adjunto_CP_GRAVEDADSECTORIALAUTOPARTES.pdf.

69III
Building forward better: action to strengthen the 2030 Agenda for Sustainable Development
Table III.3 Latin America (4 countries): industrial production, January–September 2020 compared with the same period in 2019 (Percentages)
Industrial production Technology-intensive sectors
Natural-resource-intensive sectors Labour-intensive sectors
Argentina -11.0 -18.6 -7.0 -21.6Brazila -5.8 -10.9 -0.6 -15.8Colombia -11.4 -16.6 -7.4 -23.3Mexico -13.1 -19.7 -5.8 -20.6
Source: Economic Commission for Latin America and the Caribbean (ECLAC), on the basis of official information.a For Brazil, the information refers to the first 11 months of the year.
2. Changes in business operations and organization favour enterprises that develop new capabilities
ECLAC estimates that the vast majority of the enterprises that have gone out of business are microenterprises, and that many are in commerce (1.4 million microenterprises, more than half of the total), a sector with low productivity and low barriers to entry. Therefore, this type of business is more likely to see a rapid rise in the entry rate (creation of new enterprises) if GDP starts to grow again. However, there are two factors to consider. The first relates to GDP growth forecasts. The most optimistic projections from ECLAC are of a return to 2019 GDP levels by 2024 at the earliest, in national and international contexts of great economic and health-related uncertainty. This outlook incentivizes an increase in informal activities, particularly for the smallest production units, and delays to formalization processes, even if there is economic growth. This is what can be expected in 2021, with GDP growth forecast at 3.7%, much of which, as noted, is because of a statistical effect. Therefore, entry rates for microenterprises are unlikely to be high, as they were in the recoveries from other global and national crises —topping 15% per year— for example in Argentina in 2003 (Yoguel and others, 2004).
Following the first stage of the economic emergency (March to May 2020), reactivation has entailed significant changes in companies’ operations, improving safety conditions for workers, suppliers and clients through daily disinfection of work environments, use of personal protection equipment and temperature scanning devices, changes in the infrastructure of workplaces and shared spaces, and reorganization of work shifts to reduce the number of people in workplaces. The reactivation has also transformed the way companies organize their workforces, through a combination of face-to-face and teleworking activities, implementation of online decision-making processes, and new forms of internal logistics to ensure that information and material flows can be managed remotely. Lastly, in this context of rapid change and heightened uncertainty, business models have been changed to: improve monitoring of demand; increase interaction with customers and suppliers in order to adapt products and services to consumer preferences; reorganize supply chains to prevent shortages of inputs and products; and include health security as a distinguishing feature of goods, services and processes that is valued by customers.
These changes increase fixed and variable costs relating to inputs for the health security of workers, suppliers and customers, staff training, adaptation of workplaces, and incorporation of digital technologies into companies’ internal management and their relations with suppliers and customers. In addition, inclusion of digital interconnection devices in production processes has accelerated, as has use of robotics to increase efficiency, especially considering that health security needs may lead to the use of fewer workers in some production phases. The vast majority of these changes lead to greater incorporation of digital technologies into the region’s companies and, therefore, to their modernization,

70 III
Economic Commission for Latin America and the Caribbean (ECLAC)
in line with the major transformations being driven by the digital economy. However, with a partial recovery in economic activity in the second half of 2020 and weak growth thereafter, the impact on employment would be negative, at least in the short and medium term, even if governments were to implement measures to protect employment.
The combination of higher variable and fixed costs, and lower output, will lead to different responses from companies. In the short term, “defensive” responses are likely to prevail, especially among companies with fewer capabilities and financial resources with which to respond to the crisis and with worse prospects for a recovery in demand in the medium term. In contrast, companies with greater capabilities can formulate medium-term responses in areas such as energy efficiency, big data and the Internet of things.
In this context, antitrust policy plays a key role in helping the productive sector to adapt to the new conditions. In Mexico, for example, to support the continuity of supply chains, the Federal Commission for Economic Competition (COFECE) has agreed not to pursue collusion among competitors during the pandemic, provided certain conditions are met (Navarro, 2021). These actions to promote cooperation among businesses to ensure a supply of the inputs needed in the fight against the pandemic have pooled expertise and resources that could support production reconfiguration during the recovery. In particular, it would prevent adjustment to new demand conditions from leading to price wars or predatory behaviour.
D. The rise of digital technologies
1. The progress and limitations of digitalization
In the current complex situation, marked by the COVID-19 pandemic, digital technologies have emerged as crucial tools to address the effects of the pandemic, and have demonstrated their importance for achieving the 2030 Agenda; this is particularly true for Goal 9, which calls for building resilient infrastructure, promoting inclusive and sustainable industrialization and fostering innovation. However, the benefits are neither automatic nor equal throughout the population. In recent years, it has become clear that the potential benefits of these technologies are not within the reach of everyone. Indeed, the benefits are greatly restricted by structural factors linked to the different economic and social vulnerabilities of the countries of Latin America and the Caribbean. These vulnerabilities are related to meagre technological and productive modernization and to the limited skills of people, among other factors, originating from high levels of inequality.
The gaps in access, usage and skills, as well as in opportunities for inclusion in an increasingly digitalized world —which have become more apparent in the pandemic— are repeated along the axes of the matrix of social inequality in the region. Among other dimensions, the matrix includes socioeconomic level, stage in the life cycle, territorial location, ethnicity or race, gender inequalities and digital connectivity, understood as access to a broadband service that is fast enough and the possession of Internet-ready devices, and the use that is made of these technologies.
The ECLAC Regional Broadband Observatory shows that two thirds of the region’s inhabitants used the Internet in 2019. The remaining third have limited or no access to digital technologies owing to their economic and social status, particularly their age and geographical location. This limits or prevents access to teleworking, distance learning and telemedicine, and to other goods and services offered by public platforms and institutions, thereby widening pre-existing gaps.
In 12 countries of the region, an average of 81% of households in the highest income quintile (quintile V) have an Internet connection; for households in the first and second quintiles the figures are

71III
Building forward better: action to strengthen the 2030 Agenda for Sustainable Development
38% and 53%, respectively, with significant differences between countries. In Brazil and Chile, more than 60% of households in the first income quintile have an Internet connection, while in Paraguay, Peru and the Plurinational State of Bolivia, only 3% do (see figure III.9). Moreover, connectivity gaps between urban and rural areas are still significant in Latin America and the Caribbean. While 67% of urban households are connected to the Internet, only 23% of rural ones are. In some countries, such as El Salvador, Paraguay, Peru and the Plurinational State of Bolivia, more than 90% of rural households do not have an Internet connection. Even in better positioned countries such as Chile, Costa Rica and Uruguay, only around half of rural households are connected to the Internet.
Figure III.9 Latin America (12 countries): households with and without an Internet connection, by income quintile, 2018(Percentages)
Households with Internet connection Households without an Internet connection
0
10
20
30
40
50
60
70
80
90
100
Quin
tile
IQu
intil
e II
Quin
tile
IIIQu
intil
e IV
Quin
tile
VQu
intil
e I
Quin
tile
IIQu
intil
e III
Quin
tile
IVQu
intil
e V
Quin
tile
IQu
intil
e II
Quin
tile
IIIQu
intil
e IV
Quin
tile
VQu
intil
e I
Quin
tile
IIQu
intil
e III
Quin
tile
IVQu
intil
e V
Quin
tile
IQu
intil
e II
Quin
tile
IIIQu
intil
e IV
Quin
tile
VQu
intil
e I
Quin
tile
IIQu
intil
e III
Quin
tile
IVQu
intil
e V
Quin
tile
IQu
intil
e II
Quin
tile
IIIQu
intil
e IV
Quin
tile
VQu
intil
e I
Quin
tile
IIQu
intil
e III
Quin
tile
IVQu
intil
e V
Quin
tile
IQu
intil
e II
Quin
tile
IIIQu
intil
e IV
Quin
tile
VQu
intil
e I
Quin
tile
IIQu
intil
e III
Quin
tile
IVQu
intil
e V
Quin
tile
IQu
intil
e II
Quin
tile
IIIQu
intil
e IV
Quin
tile
VQu
intil
e I
Quin
tile
IIQu
intil
e III
Quin
tile
IVQu
intil
e V
Bolivia(Plur. State of)
DominicanRep.
El Salvador Ecuador Peru Paraguay Mexico Colombia Uruguay Chile Brazil Costa Rica
Source: Economic Commission for Latin America and the Caribbean (ECLAC), “Universalizing access to digital technologies to address the consequences of COVID-19”, COVID-19 Special Report, No. 7, Santiago, August 2020.
Note: Statistics for Brazil, Chile, Costa Rica, Ecuador, El Salvador, Paraguay and Uruguay include mobile Internet. Data are for 2018 for all countries, except Chile and Ecuador, for which data are for 2017.
Regarding differences between age groups, young people and older persons are the least connected in percentage terms: 42% of those under 25 years and 54% of those over 66 are not connected to the Internet. The lowest levels of connectivity are above all for children aged 5 to 12 years, particularly those in lower-income households (see figure III.10). This has not only reduced the feasibility of maintaining distance learning during lockdowns in response to the pandemic, but has also undermined these children’s future possibilities of obtaining work that requires higher skills and therefore generally offers higher wages. Faced with this, governments have adopted mitigating measures to support distance learning, some of them based on long-term efforts, such as Plan Ceibal in Uruguay. In the Caribbean, for example, the most frequent measure has been distribution of digital devices, while the least frequent has been provision of Internet connections at home (see table III.4). Despite this, schools in areas with limited Internet access have been forced to use WhatsApp to send materials and videos, complementing it with physical distribution of educational materials.

72 III
Economic Commission for Latin America and the Caribbean (ECLAC)
Figure III.10 Latin America (12 countries): children in households without Internet access, by income quintile, 2018(Percentages)
0
10
20
3030
40
50
60
70
80
90
100
Paraguay El Salvador Bolivia(Plur. State of)
Peru Mexico DominicanRep.
Ecuadora Colombia Uruguay Brazil Costa Rica Argentinab Chilea
Quintile I Quintile II Quintile III Quintile IV Quintile V Average for Latin America
Source: Economic Commission for Latin America and the Caribbean (ECLAC), “Universalizing access to digital technologies to address the consequences of COVID-19”, COVID-19 Special Report, No. 7, Santiago, August 2020.
Note: In the survey on which the information is based, “households with Internet access” means that the Internet is generally available for use by all members of the household at any time; the connection and devices may or may not be owned by the family, but should be considered as household assets; and the household Internet connection must be working at the time of the survey. The calculation is made on the basis of the total number of children aged between 5 and 12 years old in each income quintile of each country.
a Data are for 2017.b Includes only urban areas.
Table III.4 The Caribbean (10 countries and territories): government policies to support distance education strategies in schools, 2020
Country or territory Distribution of digital devices
Household Internet
connections
Online platforms to access educational
material
Educational programmes on
television or radioOther
Bahamas • • • • Preparation of packages of educational material for all levels to complement distance education
Belize • • • Videos to address socioemotional needsGrenada • • Distance learning guides for teachers,
parents and studentsMathematics programme
Guyana • Distribution of printed materials to indigenous groups
Martinique • • • •Montserrat •Saint Kitts and Nevis • • • No response Framework for continuity of learning
with parameters and expectations of distance education
Saint Vincent and the Grenadines • • • •Suriname • • •Turks and Caicos Islands • • • Formulation of distance education
guidelinesTotal 9 5 7 7
Source: Economic Commission for Latin America and the Caribbean (ECLAC), on the basis of survey responses.

73III
Building forward better: action to strengthen the 2030 Agenda for Sustainable Development
Moreover, slow Internet connection speeds exacerbate exclusion by preventing the simultaneous use of advanced digital solutions. In June 2020, 44% of countries in the region did not have the download speeds required to perform several online activities simultaneously.10
In a world where access to and use of digital technologies are increasingly important, it is essential that these technologies do not become a source of greater inequality and polarization, and that they drive creation of new and better jobs, thus contributing to achievement of the SDGs. In that regard, the main prerequisite for effective participation in the digital age is high-speed broadband access (ECLAC, 2020e). The costs associated with connecting households and acquiring necessary devices are barriers to digital inclusion and to bridging the digital divide. For the population in the first income quintile, the cost of mobile broadband is equivalent to 14% of their income and fixed broadband is equal to 12%. In the worst cases, these costs represent about six times the reference threshold of 2% of income recommended by the Broadband Commission for Sustainable Development for Internet service to be classified as affordable (see figure III.11).
Figure III.11 Latin America (11 countries): affordability of fixed and mobile Internet by income quintile, 2019(Percentages of household income)
Paraguay
El Salvador
Bolivia (Plur. State of)
Peru
Mexico
Ecuador
Colombia
Uruguay
Brazil
Costa Rica
Chile
Mobile Fixed
0 5 10 15 20 25 30 35
Quintile IQuintile II
Quintile IQuintile II
Quintile IQuintile II
Quintile IQuintile II
Quintile IQuintile II
Quintile IQuintile II
Quintile IQuintile II
Quintile IQuintile II
Quintile IQuintile II
Quintile IQuintile II
Quintile IQuintile II
Source: Economic Commission for Latin America and the Caribbean (ECLAC), “Universalizing access to digital technologies to address the consequences of COVID-19”, COVID-19 Special Report, No. 7, Santiago, August 2020.
Note: The affordability of fixed and mobile broadband Internet is calculated on the basis of average broadband service costs in the country.
A lack of connectivity, a production structure that is focused on low-quality services, and high levels of informality greatly limit opportunities to develop online activities. Telework, which has proved to be essential for maintaining activity during the pandemic, is not equally prevalent in all countries and in all sectors of the economy. In some more developed countries and regions, such as the United States and the European Union, the percentage of people who can telework is as high as 40%, while in Latin America and the Caribbean it is just 21%, and they are mainly people with higher income, which is an additional source of inequality (see figures III.12 and III.13).
10 Download speeds of around 18.5 Mb/s allow two basic activities, such as checking email, to be performed simultaneously with one high-demand activity, such as videoconferencing, forcing users to choose between, for example, distance education and telework. When the download speed is less than 5.5 Mb/s, users can simultaneously perform only basic activities, such as browsing websites or checking email.

74 III
Economic Commission for Latin America and the Caribbean (ECLAC)
Figure III.12 Latin America and the Caribbean (13 countries): employed persons able to telework, 2018(Percentages)
14 14 15 16 17 18 1820 21 22
25 26 26
31
0
5
10
15
20
25
30
35
Guat
emal
a
Hond
uras
Boliv
ia(P
lur.
Stat
e of
)
Ecua
dor
Mex
ico
Beliz
e
El S
alva
dor
Guya
na
Latin
Am
eric
a an
d th
e Ca
ribbe
an
Dom
inic
an R
ep.
Pana
ma
Chile
Braz
il
Urug
uay
Source: Economic Commission for Latin America and the Caribbean (ECLAC), “Universalizing access to digital technologies to address the consequences of COVID-19”, COVID-19 Special Report, No. 7, Santiago, August 2020.
Note: Figures for Ecuador, Mexico, El Salvador, the Dominican Republic and Chile are estimated on the basis of four-digit national occupational classifications. Figures for the other countries are estimated on the basis of the two-digit International Standard Classification of Occupations (ISCO) of the International Labour Organization (ILO). Data are for 2018 or the most recent year available.
Figure III.13 Latin America: (6 countries):a employed persons who can work remotely based on teleworking feasibility and average wage quintile, 2018(Percentages)
0
10
20
30
40
50
60
70
80
90
100
Quintile I Quintile II Quintile III Quintile IV Quintile VCannot teleworkCan telework
Source: Economic Commission for Latin America and the Caribbean (ECLAC), “Universalizing access to digital technologies to address the consequences of COVID-19”, COVID-19 Special Report, No. 7, Santiago, August 2020.
a Weighted average of Chile, Dominican Republic, Ecuador, El Salvador, Mexico and Uruguay.

75III
Building forward better: action to strengthen the 2030 Agenda for Sustainable Development
2. Digitalization to increase productivity
The ability to profitably adopt new technologies is determined by the capabilities and factor endowments of enterprises and countries. Production structure, technological intensity in industry and companies’ dynamics are all key to making the most of digital technologies, especially considering the ongoing technological revolution (Industry 4.0). Given the structure and limited level of technological sophistication of the productive sector and the business structure in the countries of Latin America and the Caribbean, it is not enough to merely promote and facilitate the adoption of technologies; to boost the digital ecosystem, structural policies are needed to support technological progress, innovation and productivity (OECD and others, 2020).
Although the impact of digital technologies on productivity is determined by the production structure and the structural characteristics of companies, digital transformation drives critical changes in the organization of companies and market dynamics. Disruptive changes in enterprises and in the business environment fuelled by advances in digitalization have accelerated owing to the COVID-19 pandemic and the resulting more widespread use of digital technologies. The adoption of digital technologies has become even more of a priority to boost productivity and quality employment. As noted, investments in this area can contribute to achievement of Goal 9 (Build resilient infrastructure, promote inclusive and sustainable industrialization and foster innovation).
Aside from its direct effects on companies, digitalization drives major changes in competition patterns in value chains and among consumers. New business models are leading to increased participation by new digital natives, with multiple impacts on market dynamics and the economy in general. In some sectors, such as retail, there is direct competition between traditional offerings and digital disruption. The increased prominence of digital channels may displace certain traditional players and channels and create a need for them to adapt, develop their own digital channels or integrate into the digital platforms of other players. Thus, in some activities, the level of digital disruption may reach a point where, given the demands of “new consumers”, digitalization becomes a matter of survival, for example in intermediation of tourism services, particularly in the context of the pandemic.
Digital transformation can also lead to larger companies and greater concentration of profits owing to economies of scope and winner-takes-all business models. The combination of these factors, together with changes in consumer habits (preference for digital channels and speed of delivery) has led to the rise of digital platforms and the dependence of many companies offering goods and services on them (Da Silva, De Furquim and Núñez, 2021). This pattern has become clear in the region in the pandemic: the Argentine digital platform Mercado Libre for buying, selling and paying online has become one of the companies with the highest market value in the region, with a capitalization of more than US$ 90 billion at the beginning of February 2021.
In Latin America and the Caribbean, digital transformation has been moderate. Digitalization of production processes is lagging behind and average growth in digital adoption for productive transformation has been slower than in other emerging countries. Between 2014 and 2016, growth in digital adoption by businesses in the region averaged 4.5%, as opposed to the strong performance of the countries of South-East Asia (13.1%) and China (16.4%) (ECLAC, 2021b). Although many enterprises in Latin America have Internet access (over 90% coverage), many do not use it in their supply chain or distribution channels (see figure III.14).
The limited progress with digital transformation is linked to uneven adoption across businesses and households. While some businesses, especially larger ones, have managed to seize upon the benefits of digital technologies, many are lagging behind digitally —especially MSMEs and those engaged in traditional and vulnerable activities, typically associated with lower productivity and higher informality— often increasing the structural heterogeneity of the region’s economies.

76 III
Economic Commission for Latin America and the Caribbean (ECLAC)
Figure III.14 Latin America (8 countries): use of digital technologies in the supply and distribution chains of companies, 2018(Percentages)
0
10
20
30
40
50
60
70
80
90
100
Argentina Brazil Chile Colombia Ecuador Mexico Peru Uruguay
Internet connection Use of electronic banking Procurement of supplies onlineWebsite Digital sales channel
Source: Economic Commission for Latin America and the Caribbean (ECLAC), Digital technologies for a new future, Santiago, 2021, in press.
In Latin America and the Caribbean, the digital transformation of the productive sector is still in the early stages and is mainly focused on e-commerce. During the COVID-19 pandemic, companies have understood that having an online presence to reach consumers is an opportunity. This has been reflected by a significant rise in the number of business websites in Brazil, Chile, Colombia and Mexico between March and August 2020 compared to the prior year. During April alone, the number of active company websites grew by 800% in Colombia and Mexico, and by around 360% in Brazil and Chile, compared to the same month in 2019.
During the pandemic, commerce and delivery platforms have become particularly widely used by both consumers and those who offer products and services, who have been able to keep their premises operating, generate income and not lay off employees or delivery staff. The exponential growth in use of these platforms, which appears to be irreversible, creates an opportunity for digitalization of the supply chain and poses new challenges for countries, such as the need to strengthen payment systems (which are key to secure and efficient remote interaction), regulatory and policy frameworks, and antitrust policies, to prevent market concentration and overcharging.
Another problem that hinders full participation by the region in the fourth industrial revolution relates to the training of its population. The low quality of many educational processes is an obstacle to adoption of new technologies. Specifically, systems for managing transitions in response to technological change are underdeveloped. Although the coverage of and access to basic, secondary, and technical-vocational education has increased in most countries of the region, improvement in quality is not evident. Therefore, opportunities for better appropriation of the benefits of new technologies are limited and concentrated in a small number of people.
In short, the economic and social crisis triggered by the pandemic and physical distancing measures has caused many of the changes in the digital world, by prioritizing online channels in an attempt to maintain some commercial activity. This acceleration of the digital transformation of production and

77III
Building forward better: action to strengthen the 2030 Agenda for Sustainable Development
consumption seems irreversible. While Latin American economies have made great strides in their digital transformation processes, they have yet to create value at scale and in an inclusive manner. The patterns of digitalization in the region reflect the marked inequality in productivity and income. This digital divide has become even larger and worsened during the COVID-19 pandemic.
The pandemic has increased the urgency of the need to close the productive, digital and capacity gaps, and the importance of new technologies for the recovery and the transformation of the development strategies of the countries of the region. To move forward with the recovery, digital technologies must be used to build a new future through economic growth, job creation, reductions in inequality and greater sustainability. This is a path towards the Sustainable Development Goals of the 2030 Agenda.
E. The persistent environmental crisisGlobal environmental degradation is increasingly evident, and the COVID-19 pandemic is one of the manifestations of the harmful relationship between human activities and nature. Latin America and the Caribbean is no exception: destruction and degradation of ecosystems because of economic and social activities reduces biodiversity, generates greenhouse gas emissions and reduces the capacity to absorb carbon dioxide (Bárcena and others, 2020). Not only have terrestrial ecosystems been affected, but also marine ecosystems, which are overexploited and have high levels of pollution and acidification. In this regard, progress on protecting ecosystems has been insufficient to maintain a healthy environment and advance the Climate Agenda, as required by Goal 13 (Take urgent action to combat climate change and its impacts), in particular with regard to financing (indicator 13.a.1 of the global Sustainable Development Goal indicator framework), which is the responsibility of developed countries.
1. Climate change and emissions
Until the onset of the pandemic, global greenhouse gas emissions had been on an upward trend, reaching 51 gigatons of carbon dioxide equivalent (Gt CO2 equivalent) in 2019. In Latin America and the Caribbean, these emissions also followed a rising trend, hitting 4.3 Gt CO2 equivalent in 2019.11 In 2020 alone, the economic slowdown caused by the pandemic resulted in a significant reduction in emissions. While global emissions have dropped by around 7% (Friedlingstein and others, 2020), in the region they appear to have fallen even further, owing to the sharp decline in its output relative to the rest of the world. As discussed in detail in chapter V, containment measures that have reduced economic activity are expected to result in lower emissions in 2030 than in 2019, even in the business-as-usual scenario, with very low economic growth rates (2.5% per year). However, this result is not acceptable, as such slow growth would lead to even more serious problems with employment, poverty and inequality. Therefore, change must focus on transforming the key elements of high-emission processes.
Faced with this, the countries of the region have signed emission reduction commitments and, in 2020, Argentina and Suriname submitted their second nationally determined contributions (NDCs), while Brazil, Chile, Colombia, Costa Rica, Cuba, the Dominican Republic, Jamaica, Mexico, Nicaragua, Panama and the Dominican Republic have updated their first NDCs. The post-pandemic economic recovery is an opportunity to promote growth in line with the emission reduction targets in NDCs and to prevent emissions from surpassing pre-pandemic levels.
11 Globally and regionally, most emissions are generated by the burning of fossil fuels to produce electricity, use in transport, and energy use in buildings. However, agriculture, livestock and land-use change are also important factors in the region. Moreover, commercial farming accounted for 70% of deforestation between 2000 and 2010 (FAO/UNEP, 2020).

78 III
Economic Commission for Latin America and the Caribbean (ECLAC)
2. Vulnerability: extreme events and disasters
The global average temperature has already risen by 1.1°C, the cryosphere is shrinking at a worrying rate, sea level rises are accelerating and disasters such as forest fires and extreme hydrometeorological events are becoming more frequent. Disasters have short-term effects on the welfare of the population: they destroy capital assets, increase nutritional problems, reduce school attendance and performance, diminish income available for non-food expenditure, drive up child labour and increase morbidity. Between 1990 and 2020, 1,412 extreme events were recorded (see figure III.15A), 87% of which were climate-related (storms, floods, wet mass movements, extreme temperatures, droughts and fires) and 13% of which were geophysical (volcanic eruptions, earthquakes or dry mass movements). Floods were the most frequent event, affecting 49 million people. Droughts, although less frequent, affected 70 million people (see figure III.15B). Climate change is expected to increase the frequency and magnitude of such events.
Figure III.15 Latin America and the Caribbean: extreme hydrometeorological events and disasters, 1990–2020(Number)
665
289
105 7848 44
0
100
200
300
400
500
600
700
Floods Storms Wet mass displacement Droughts Extreme temperatures Wildfires
A. Extreme hydrometeorological events and climate-related disasters
B. People directly affected by extreme hydrometeorological events and climate-related disasters
70.0
50.0 49.0
6.00.7 0.2
0
10
20
30
40
50
60
70
80
Droughts Storms Floods Extreme temperatures
Wet mass displacement
Wildfires
Source: Economic Commission for Latin America and the Caribbean (ECLAC), CEPALSTAT [online database] https://estadisticas.cepal.org/cepalstat/portada.html?idioma=english.

79III
Building forward better: action to strengthen the 2030 Agenda for Sustainable Development
Extreme hydrometeorological events have lasting effects on the economies and societies of the region, especially in Central America and the Caribbean. Among other things, they lead to increased unemployment and poverty, additional fiscal expenditure and increased indebtedness, hindering achievement of the SDGs at the local and national levels. It is in these subregions that the double asymmetry that characterizes the region’s climate change situation is most starkly apparent: the countries and social groups that generate the least emissions suffer the most from the effects of the environmental emergency (Bárcena and others, 2020).
3. Deterioration of forests, biodiversity and oceans
In the region, ecosystems are deteriorating, and biodiversity is declining at alarming rates, contrary to Goal 15 (Protect, restore and promote sustainable use of terrestrial ecosystems, sustainably manage forests, combat desertification, and halt and reverse land degradation and halt biodiversity loss). According to the 2020 Living Planet Index, which tracks nearly 21,000 populations of mammals, birds, fish, reptiles and amphibians around the globe, between 1970 and 2016, there was an average decline in biodiversity of 68%. This pattern is especially marked in the tropics of the Americas, where the decline was equivalent to 94% of the populations studied. This is the largest recorded decline in any biogeographic area in the world (WWF, 2020).
Between 1990 and 2020, 150 million hectares of natural woodland were lost in Latin America and the Caribbean and the area of man-made forest doubled. In total, forest cover shrank by 7% (ECLAC, 2020g). The loss of tropical and subtropical forests has a major impact on the biodiversity and hydrology on which economic systems depend, so protecting them is vital. In aggregate terms, the region has made progress in terms of the proportion of woodland that is legally protected, which rose from 25% in 2000 to over 31% in 2020, despite a decline in Central America (see figure III.16).
Figure III.16 Latin America and the Caribbean: proportion of forest area within legally established protected areas, 2000–2020(Percentages)
20002020Percentage change
57.2
24.7
14.1
25.0
44.7
31.2
19.8
31.3
0 10 20 30 40 50 60 70
Central America
South America
The Caribbean
Latin America andthe Caribbean
-21.9
26.5
40.3
25.2
Source: Economic Commission for Latin America and the Caribbean (ECLAC), Regional Knowledge Platform on the 2030 Agenda in Latin America and the Caribbean, “SDGs in Latin America and the Caribbean: statistical knowledge management hub” [online] https://agenda2030lac.org/estadisticas/regional-sdg-statistical-profiles-target-1.html?lang=en [accessed on: 4 January 2021].

80 III
Economic Commission for Latin America and the Caribbean (ECLAC)
Forests transport atmospheric humidity and affect rainfall at the regional level. Therefore, farming and rainfall in some areas depend on other zones that are geographically distant, for example the pampas of the Southern Cone are reliant on the Amazon. In the region, water is available in abundant quantities, but it is distributed unevenly among and within countries. In addition, water resources are at risk of severe pathogenic contamination, mainly from domestic sewage, and of saline or nutrient pollution related to unsuitable agricultural practices. In the Andean region, the surface area of glaciers is shrinking, and several have already disappeared (WGMS, 2020), affecting large urban and rural areas. Climate change and ineffective management are leading to the loss of strategic freshwater reserves.
The oceans are also at-risk major ecosystems. In Latin America and the Caribbean, 23 countries have more marine area than land area within their territory, and more than 27% of the region’s population lives in coastal areas. The region is one of the world’s richest in marine ecoregions (47 of the 258 proposed by Spalding and others, 2007). These include vulnerable ecosystems such as coral reefs, which are threatened by global warming, rising average marine acidity and nutrient pollution, especially in the Caribbean (SDG 14, target 14.3), and mangroves, which are especially important because of their ecosystem services, but which shrank by 20.2% between 2001 and 2018 (SDG 14, target 14.2).
Of the four targets of Goal 14 (Conserve and sustainably use the oceans, seas and marine resources for sustainable development) set for 2020, only target 14.5 (conserve at least 10% of coastal and marine areas) has been met at the regional level: the area covered by the various protection mechanisms has doubled to 20% of the total.12 However, the differences between countries are substantial: 20 are still far from meeting the target of having 10% of the area protected (see map III.1). In terms of eliminating subsidies for overfishing, the region accounts for just 5.6% of global subsidies, most of which do not reach artisanal fisheries. The subregion whose situation is most worrying, with more than 50% of fisheries biologically unsustainable, is the South-East Pacific.
Map III.1 Latin America and the Caribbean: coverage of marine protected areas in relation to the exclusive economic zones (EEZ), by country, 2020(Percentages)
<45–8
8–1010–20>20
Source: M. Tambutti and J. J. Gómez (eds.), “The outlook for oceans, seas and marine resources in Latin American and the Caribbean: conservation, sustainable development and climate change mitigation”, Project Documents (LC/TS.2020/167), Santiago, Economic Commission for Latin America and the Caribbean (ECLAC), 2020.
12 Broadly speaking, these four targets are to manage, protect and restore marine ecosystems; effectively regulate fishing and promote sustainable fisheries; conserve at least 10% of marine and coastal areas; and end subsidies that contribute to overfishing.

81III
Building forward better: action to strengthen the 2030 Agenda for Sustainable Development
An additional problem is marine pollution, both of chemical origin owing to discharges from inland sources —which have created 19 dead zones and 31 zones of eutrophication on coasts— and from macro- and microplastics. Only the Pacific coast of the Southern Cone and the southernmost part of the Atlantic coast have below-average levels of plastic pollution.
4. Waste management
Consumption of materials increased by almost 29% in the region between 2001 and 2017 (see figure III.17): nearly one kilogram of solid household waste is generated per person per day, more than half of which is organic waste; this figure is lower than for developed countries, but above the global average. Three quarters of waste is deposited in landfills, although open dumps, illegal dumps and rubbish heaps still exist, and the infrastructure cannot keep pace with the speed at which waste is generated. Waste collection coverage is around 85% in urban areas but is significantly lower in rural areas.
Figure III.17 Latin America and the Caribbean: consumption of household material per capita, 2000–2017 (Tons per capita)
20002017Percentage change
Central America
South America
Latin America andthe Caribbean
8.1
11.5
10.2
9.0
15.8
13.2
0 5 10 15 20
11.5
36.8
28.9
Source: Economic Commission for Latin America and the Caribbean (ECLAC), Regional Knowledge Platform on the 2030 Agenda in Latin America and the Caribbean, “SDGs in Latin America and the Caribbean: statistical knowledge management hub” [online] https://agenda2030lac.org/estadisticas/regional-sdg-statistical-profiles-target-1.html?lang=en [accessed on: 4 January 2021].
Plastic waste continues to grow despite stricter regulations and more bans in the region. The Caribbean Sea is the second most polluted with plastics in the world and the health effects of microplastics are a growing concern. Health-care waste —which contains a high proportion of hazardous material and non-recyclable plastic— has increased significantly owing to the COVID-19 pandemic, triggering warnings about the importance of hospital infrastructure and management of the waste they produce, including its traceability. Waste of electrical and electronic equipment has also continued to grow (more than 150% between 2000 and 2019) as income levels rise; only one fifth of the devices produced worldwide are properly collected and processed (see figure III.18), even though they contain valuable metal components.

82 III
Economic Commission for Latin America and the Caribbean (ECLAC)
Figure III.18 Latin America and the Caribbean: electronic waste generated per capita, 2000–2019(Kilograms)
3.7
3.4
3.4
8.3
9.1
8.8
0 2 4 6 8 10
20002019
124.4
170.2
156.1
Percentage change
Central America
South America
Latin America andthe Caribbean
Source: Economic Commission for Latin America and the Caribbean (ECLAC), Regional Knowledge Platform on the 2030 Agenda in Latin America and the Caribbean, “SDGs in Latin America and the Caribbean: statistical knowledge management hub” [online] https://agenda2030lac.org/estadisticas/regional-sdg-statistical-profiles-target-1.html?lang=en [accessed on: 4 January 2021.
As highlighted in ECLAC (2020g) the direct backward and forward linkages of the waste and recycling sector are stronger than average, as the purchases and sales of this sector are closely related to the rest of the national economy. For this reason, if its development were bolstered to make it a key sector —as part of a big push for sustainability— with municipal waste recycling rates in line with those of developed countries such as Germany, this would contribute significantly to a sustainable economic recovery, creating almost 450,000 jobs.
5. Cities: a source of problems and solutions
The clustering of economic activities in urban areas offers enormous potential for economic growth and human development. Wealth, political power, professional talent, skilled labour, health care, education, infrastructure and other social services are concentrated in these settlements. Cities contribute significantly to GDP, and there is a positive relationship between urban population growth and per capita GDP (OECD, 2015). Specifically, cities account for 55% of total GDP in low-income countries, 73% in middle-income countries and 85% in high-income countries (UN-Habitat, 2016).
However, cities face environmental and socioeconomic problems that hinder achievement of Goal 11 (Make cities and human settlements inclusive, safe, resilient and sustainable). Moreover, as discussed in chapter II, these problems been major sources of infection and death in the COVID-19 pandemic. In large cities and metropolises, sizeable groups of people live in poverty and with overcrowding. Although the proportion of the population living in slums declined from 29% in 2000 to 21% in 2014, this progress subsequently stalled in percentage terms. In absolute terms, the number of slum-dwellers increased from 104.6 million to 114.2 million between 2014 and 2018 (UN-Habitat, 2020).

83III
Building forward better: action to strengthen the 2030 Agenda for Sustainable Development
Air quality in cities tends to be low, as reflected —conversely— by the rapid falls in concentrations of key pollutants such as NO2 and SO2 during lockdowns and the restrictions on activity at the start of the pandemic (ECLAC, 2020d). Based on a sample of 15 cities in the region, it is estimated that the health impacts of air pollution cost city-dwellers 15% of their income (Hidalgo and Huizenga, 2013). Emissions of air pollutants are largely caused by greater use of private transport, which has increased congestion, travel times, accidents and energy consumption, and has had significant effects on mortality, morbidity, productivity and well-being. The time lost and fuel used because of urban congestion results in costs estimated at between 2% and 5% of GDP depending on the country (Lefèvre and others, 2016). A complete transition to electromobility based on clean energy in the region would save US$ 30 billion in public health-care costs by 2050, owing to the reduction in air pollution (UNEP, 2019).
The pandemic may accelerate the rise in the region’s already high motorization rate, as well as putting pressure on the finances of transport companies during health restrictions, if people try to limit their exposure by reducing use of public transport. In this context, it is more important than before to transition to electromobility and improve infrastructure for non-motorized mobility (cycling and walking).
The concentration of capital and people in urban areas results in high dependence on infrastructure networks, communications and transport systems, supply chains and public service connections to safeguard the well-being of the population. The lack of land-use planning has hindered progress on decisions about the best location of key infrastructure, both to reduce its exposure to natural disasters and to promote sustainable and resilient growth. A dense city model can limit uncontrolled urban sprawl and unplanned exponential growth of the sprawl, which tends to be on the periphery, eating into agricultural land or exposing it to different risks.
In most of the region’s large cities, growth has taken place without planning: it has been driven by migratory flows, informal land use, poorly regulated and often informal residential growth, and public programmes in peripheral areas, resulting in high rates of segregation of residential areas according to socioeconomic factors. Growing urbanization and its complexities, combined with those generated by the pandemic, create opportunities for investment in new models of urban development, such as green and smart cities (ECLAC, 2020g).
Cities can be mechanisms of redistribution and inclusion, acting as a regulator and guarantor of equality for all segments of society, by providing access to the benefits of urban life through the management of the externalities generated by city development. The New Urban Agenda, adopted by the Member States of the United Nations in 2016, provides the framework for a new pattern of urban development that aims to change the paradigm that guides policies, programmes and projects, and chart a path for sustainable urban development.
In short, despite countries’ efforts, commitments on emissions reductions still fall short of climate goals, unless there is very slow economic growth, which increases the risk of exposure to extreme events and disasters. Although protected areas have increased, ecosystem degradation continues. Problems persist with conservation and protection of the environment; it is therefore important to develop and adopt technologies and behaviours to reduce the environmental footprint. Cities can play an important role in such initiatives through their mobility, energy efficiency and waste management policies, as discussed in chapter V. Responding to the challenge of climate change in Latin America and the Caribbean represents a financial, economic, social, cultural, distributive and innovation effort, but it also provides an opportunity for the region to move towards more sustainable and inclusive development.

84 III
Economic Commission for Latin America and the Caribbean (ECLAC)
BibliographyAFAC (Association of Argentine Component Manufacturers) (2020), “Que la emergencia no oculte la decadencia”
[online] http://www.afac.org.ar/imagenes/noticias/4136_adjunto_CP_GRAVEDADSECTORIALAUTOPARTES.pdf.Bárcena, A. (2020), “Digital technologies for a new future”, paper presented at the seventh Ministerial Conference
on the Information Society in Latin America and the Caribbean, Economic Commission for Latin America and the Caribbean (ECLAC), November.
Bárcena, A. and others (2020), The climate emergency in Latin America: the path ahead – resignation or action?, ECLAC Books, No. 160 (LC/PUB.2019/23-P), Santiago, Economic Commission for Latin America and the Caribbean (ECLAC).
Cavallo, A. (2020), “Inflation with COVID consumption baskets”, NBER Working Paper, No. 27352, Cambridge, National Bureau of Economic Research (NBER).
Da Silva, F., J. de Furquim and G. Núñez (2020), “La libre concurrencia en la economía digital: las micro, pequeñas y medianas empresas (mipymes) en América Latina y el impacto del COVID-19”, Project Documents (LC/TS.2020/142), Santiago, Economic Commission for Latin America and the Caribbean (ECLAC).
Del Popolo, F. (2017), Los pueblos indígenas en América (Abya Yala): desafíos para la igualdad en la diversidad, ECLAC Books, No. 151 (LC/PUB.2017/26), Santiago, Economic Commission for Latin America and the Caribbean (ECLAC).
Dini, M. and G. Stumpo (coords.) (2019), “Mipymes en América Latina: un frágil desempeño y nuevos desafíos para las políticas de fomento. Síntesis”, Project Documents (LC/TS.2019/20), Santiago, Economic Commission for Latin America and the Caribbean (ECLAC).
ECLAC (Economic Commission for Latin America and the Caribbean) (2021a), Social Panorama of Latin America, 2020, Santiago, in press.(2021b), Digital technologies for a new future, Santiago, in press.(2020a), Preliminary Overview of the Economies of Latin America and the Caribbean, 2020 (LC/PUB.2020/17-P), Santiago.(2020b), “Addressing violence against women and girls during and after the COVID-19 pandemic requires financing, responses, prevention and data compilation”, November [online] https://repositorio.cepal.org/bitstream/handle/11362/46425/1/S2000874_en.pdf.(2020c), “Persons with disabilities and coronavirus disease (COVID-19) in Latin America and the Caribbean: status and guidelines”, COVID-19 Report, April.(2020d), “Social challenge in times of COVID-19”, COVID-19 Special Report, No. 3, Santiago, May.(2020e), “Universalizing access to digital technologies to address the consequences of COVID-19”, COVID-19 Special Report, No. 7, Santiago, August.(2020f), “Effects of the quarantines and activity restrictions related to the coronavirus disease (COVID-19) on air quality in Latin America’s cities”, COVID-19 Report, July.(2020g), Building a New Future: Transformative Recovery with Equality and Sustainability (LC/SES.38/3-P/Rev.1), Santiago.(2020h), “Sectors and businesses facing COVID-19: emergency and reactivation”, COVID-19 Special Report, No. 4, Santiago, July.(2020i), The 2030 Agenda for Sustainable Development in the New Global and Regional Context: Scenarios and Projections in the Current Crisis (LC/PUB.2020/5), Santiago.(2019), Social Panorama of Latin America, 2019 (LC/PUB.2019/22-P/Rev.1), Santiago.(2018a), Data, algorithms and policies: redefining the digital world (LC/CMSI.6/4), Santiago.(2018b), Regional Action Plan for the Implementation of the New Urban Agenda in Latin America and the Caribbean, 2016-2036 (LC/TS.2017/77/Rev.2), Santiago.
ECLAC/FAO (2020), “Preventing the COVID-19 crisis from becoming a food crisis: urgent measures against hunger in Latin America and the Caribbean”, COVID-19 Report, Santiago, June.
ECLAC/ILO (Economic Commission for Latin America and the Caribbean/International Labour Organization) (2020a), “Work in times of pandemic: the challenges of the coronavirus disease (COVID-19)”, Employment Situation in Latin America and the Caribbean, No. 22 (LC/TS.2020/46), Santiago.(2020b) “The COVID-19 pandemic could increase child labor in Latin America and the Caribbean”, Technical Note, No. 1 [online] https://www.ilo.org/wcmsp5/groups/public/---americas/---ro-lima/documents/publication/wcms_747662.pdf.
85III
Building forward better: action to strengthen the 2030 Agenda for Sustainable Development
ECLAC/PAHO (Economic Commission for Latin America and the Caribbean/Pan-American Health Organization) (2020), “Health and the economy: a convergence needed to address COVID-19 and retake the path of sustainable development in Latin America and the Caribbean”, COVID-19 Report, Santiago, July
ECLAC/UN-Women (Economic Commission for Latin America and the Caribbean/United Nations Entity for Gender Equality and the Empowerment of Women) (2020), Care in Latin America and the Caribbean during the COVID-19: towards comprehensive systems to strengthen response and recovery, Santiago, August.
ECLAC/UNICEF (Economic Commission for Latin America and the Caribbean/United Nations Children’s Fund) (2020), “Llamado a la acción inmediata para poner fin a la violencia en el hogar contra niñas, niños y adolescentes, en el marco de la respuesta a la crisis por COVID-19 en América Latina y el Caribe”, Special Representative on Violence against Children.
ECLAC/UNESCO (Economic Commission for Latin America and the Caribbean/United Nations Educational, Scientific and Cultural Organization) (2020), “Education in the time of COVID-19”, COVID-19 Report, Santiago, August.
ECLAC (Economic Commission for Latin America and the Caribbean) and others (2020), “El impacto del COVID-19 en los pueblos indígenas de América Latina-Abya Yala: entre la invisibilización y la resistencia colectiva”, Project Documents (LC/TS.2020/171), Santiago.
FAO/ECLAC (Food and Agriculture Organization of the United Nations/Economic Commission for Latin America and the Caribbean) (2020a), “Trade performance during the crisis”, Food Systems and COVID-19 in Latin America and the Caribbean, No. 12, Santiago.(2020b), “Labour market response”, Food Systems and COVID-19 in Latin America and the Caribbean, No. 14, Santiago.(2020c), “Recovery with transformation: a mid-term overview”, Food Systems and COVID-19 in Latin America and the Caribbean, No. 17, Santiago.
FAO/UNEP (Food and Agriculture Organization of the United Nations/United Nations Environment Programme) (2020), The State of the World’s Forests 2020: Forests, Biodiversity and People, Rome.
FAO (Food and Agriculture Organization of the United Nations) and others (2020), Panorama de la seguridad alimentaria y nutrición en América Latina y el Caribe 2020, Santiago.
Friedlingstein, P. and others (2020), “Global carbon budget 2020”, Earth System Science Data, vol. 12, No. 4, 11 December.Hidalgo, D. and C. Huizenga (2013), “Implementation of sustainable urban transport in Latin America”, Research
in Transportation Economics, vol. 40, No. 1, Amsterdam, Elsevier.IFC (International Finance Corporation) (2020), Green Buildings: A Finance and Policy Blueprint for Emerging
Markets, Washington, D.C.ILO (International Labour Organization) (2020a), Panorama Laboral 2020. América Latina y el Caribe”, Lima, ILO
Regional Office for Latin America and the Caribbean.(2020b), “The COVID-19 response: getting gender equality right for a better future for women at work”, Policy Brief, Geneva, May.(2020c) ILO Monitor: Covid-19 and the World of Work. Fifth Edition. Updated Estimates and Analysis, 30 June.(2020d), ILO Monitor: COVID-19 and the World of Work. 6th Edition, 23 September.(2018), Women and Men in the Informal Economy: A Statistical Picture, Geneva.
IMF (International Monetary Fund) (2020a), Global Financial Stability Report: Bridge to Recovery, Washington, D.C., October.(2020b), Regional Economic Outlook. Western Hemisphere Pandemic: Persistence Clouds the Recovery, Washington, D.C.
INEGI (National Institute of Statistics and Geography) (2020), “EDN 2020. Estudio sobre la demografía de los negocios 2020. Primer conjunto de resultados” [online] https://www.inegi.org.mx/contenidos/programas/edn/2020/doc/EDN2020Pres.pdf.
Jordán, R., L. Riffo and A. Prado (coords.) (2017), Desarrollo sostenible, urbanización y desigualdad en América Latina y el Caribe: dinámicas y desafíos para el cambio estructural (LC/PUB.2017/19), Santiago, Economic Commission for Latin America and the Caribbean (ECLAC).
Katz, J. and G. Stumpo (2001), “Sectoral regimes, productivity and international competitiveness”, CEPAL Review, No. 75 (LC/G.2150-P), Santiago, Economic Commission for Latin America and the Caribbean (ECLAC), December.
La Jornada (2020), “Quiebra 8% de empresas en 15 meses, reporta INEGI”, 2 December [online] https://www.jornada.com.mx/notas/2020/12/02/economia/desaparecieron-un-millon-10-mil-empresas-hasta-agosto-inegi/.

86 III
Economic Commission for Latin America and the Caribbean (ECLAC)
Lefèvre, B. and others (2016), “Save money and time by reducing greenhouse gas emissions from urban transport”, LEDS in Practice, May.
Montero, L. and J. García (2017), “Panorama multidimensional del desarrollo urbano en América Latina y el Caribe”, Project Documents (LC/TS.2017/67), Santiago, Economic Commission for Latin America and the Caribbean (ECLAC).
Navarro, I. (2021), “Las instituciones de competencia en México ante el COVID-19 y la recuperación económica”, Project Documents (LC/TS.2021/14), Santiago, Economic Commission for Latin America and the Caribbean (ECLAC).
OECD (Organization for Economic Cooperation and Development) (2015), The Metropolitan Century: Understanding Urbanisation and its Consequences, Paris.
OECD (Organization for Economic Cooperation and Development) and others (2020), Latin American Economic Outlook 2020: Digital Transformation for Building Back Better (LC/PUB.2020/10), Paris, OECD Publishing.
Spalding, M. D. and others (2007). “Marine ecoregions of the world: a bioregionalization of coastal and shelf areas”, BioScience, vol. 57. No. 7.
UN-Habitat (United Nations Human Settlements Programme) (2020), World Cities Report 2020, Nairobi.(2016), World Cities Report 2016: Urbanization and Development. Emerging Futures, Nairobi.
UNEP (United Nations Environment Programme) (2019), “Latin America and the Caribbean could save US$ 621 billion by 2050 through the decarbonization of energy transport sectors”, 12 December [online] https://www.unenvironment.org/news-and-stories/press-release/latin-america-and-caribbean-could-save-us-621-billion-2050-through.
UNESCO (United Nations Educational, Scientific and Cultural Organization) (2020), “How many students are at risk of not returning to school?”, Advocacy Paper, UNESCO COVID-19 Education Response, 30 July.
UNICEF (United Nations Children’s Fund) (2020), “COVID-19 pandemic could devastate refugee, migrant and internally displaced populations without urgent international action”, 1 April [online] https://www.unicef.org/press-releases/covid-19-pandemic-could-devastate-refugee-migrant-and-internally-displaced.
UNISDR/CRED (United Nations Office for Disaster Risk Reduction/Center for Research on the Epidemiology of Disasters) (2018), Economic Losses, Poverty and Disasters.
United Nations (2020), Policy Brief: Education during COVID-19 and Beyond [online] https://www.un.org/development/desa/dspd/wp-content/uploads/sites/22/2020/08/sg_policy_brief_covid-19_and_education_august_2020.pdf.(2018), “World Urbanization Prospects”, Department of Economic and Social Affairs [online] https://population.un.org/wup/#:~:text=World%20Urbanization%20Prospects%202018&text=The%20Population%20Division%20of%20the,of%20their%20major%20urban%20agglomerations.
WFP (World Food Programme) (2008), “Food consumption analysis: calculation and use of the food consumption score in food security analysis”, Rome [online] https://documents.wfp.org/stellent/groups/public/documents/manual _guide_proced/wfp197216.pdf.
WGMS (World Glacier Monitoring Service) (2020), Global Glacier Change Bulletin, No. 3 (2016-2017), Zurich.World Bank (2020), COVID-19 Pandemic: Shocks to Education and Policy Responses [online] https://openknowledge.
worldbank.org/bitstream/handle/10986/33696/148198.pdf?sequence=4&isAllowed=y.WWF (2020), Living Planet Report 2020: Bending the Curve of Biodiversity Loss. Summary, R. E. A. Almond, M. Grooten
and T. Petersen (eds.), Gland.Yoguel, G. and others (2004), “Patrones básicos de rotación de empresas en Argentina hacia el final de la
convertibilidad”, Buenos Aires, Economic Commission for Latin America and the Caribbean (ECLAC)/Ministry of Labour, Employment and Social Security, unpublished.

87
Building forward better: action to strengthen the 2030 Agenda for Sustainable Development
The pandemic is putting the comprehensive nature of the 2030 Agenda for Sustainable Development at heightened risk
CHAPTER IV
A. Inadequate progress towards the Sustainable Development Goals (SDGs)
B. Strengthening institutions to cope with greater challenges
Bibliography
Annex IV.A1
Annex IV.A2
Annex IV.A3


89IV
A. Inadequate progress towards the Sustainable Development Goals (SDGs)
1. Only a third of the targets are on course to be met
The analyses presented in the previous chapters on the health crisis caused by the coranavirus (COVID-19) pandemic and its economic, social and environmental effects should alert the international community to the risk that the targets of the 2030 Agenda for Sustainable Development may not be met in the medium and long term. The data available can be used to analyse the evolution and project the dynamics of a set of statistical series from the United Nations Global SDG Indicators Database, including some additional indicators prioritized for the region by the Statitical Coordination Group for the 2030 Agenda in Latin America and the Caribbean of the United Nations Economic Commission for Latin America and the Caribbean (ECLAC) Statistical Conference of the Americas,1 accessible through the Regional Knowledge Platform on the 2030 Agenda in Latin America and the Caribbean.2
As in 2019 and 2020, when ECLAC presented exercises in scenario simulations and trend projections to 2030 for a selection of SDG indicators,3 new results are presented below for a larger number of statistical series with information available for the region. These results allow the series analysed to be classified according to the likelihood of the targets being met by 2030 on current trends, with and without policy interventions. The analysis is performed at the level of statistical series for the indicators and not the Goals; thus, for a given SDG, there may be indicators and series in different situations depending on the thresholds set in the 2030 targets.
Although there are still gaps in the data that preclude an exhaustive analysis of all the targets of the 2030 Agenda, the efforts made by the international and regional statistical community, and more specifically by member States’ national statistical systems, have increased the availability of data for producing the SDG indicators and allowed the analysis to be extended to a larger number of targets than were covered by previous exercises. This effort has yielded the following findings:
• The number of series analysed increased from 72 in 2020 to 177 in 2021, with the analysis expanding from 67 indicators in 2020 (26% of the total) to 110 indicators (42% of the total) with sufficient information available in 2021.
• Of the 177 series analysed, 119 were among the 150 indicators prioritized for the region. This represents 53% of the indicators in the regional framework of SDG follow-up indicators for Latin America and the Caribbean that were able to be projected with the information available.
• All SDGs are covered by at least one of the series studied. Only two Goals, SDG 11 (sustainable cities and communities) and SDG 13 (climate action), are covered by just one series.
• The exercise allowed trends to be assessed for 86 targets. Of these, 60 are targets covered by the indicators prioritized for the region, of which they represent 65%.
Different types of situations have been categorized: (i) statistical series in the “green” group relate to targets that have already been met or will be by 2030 on current trends, and (ii) series in the “yellow” and “red” groups relate to targets which, on observed trends and considering the impact of the pandemic on GDP growth, will not be met by 2030 without public policy interventions to accelerate the pace of progress towards the target (yellow) or to reverse the observed trend (red).
1 See ECLAC (2019a).2 See ECLAC (2021a).3 See ECLAC (2019b and 2020a).

Economic Commission for Latin America and the Caribbean (ECLAC)
90 IV
The results at the regional level show marked heterogeneity between the dynamics of the 177 series analysed (see table IV.1). These dynamics can be divided into three thirds of roughly similar size. The trend is positive for 32% of the series; in the case of another 32%, policy action is essential for the targets to be met; and for the remaining 36%, the trend is one of stagnation or regression, making it imperative to implement corrective actions to reverse it.4
Table IV.1 Latin America and the Caribbean: number of SDG indicator statistical series analysed, by prospect of the targets they refer to being met by 2030
Total
The target has been reached or is likely to be reached
on the current trend
The target will be met only with public policy interventionThe trend is in the right
direction, but progress is too slow for the target to be met
The trend is moving away from the target
SDG 1 15 2 7 6
SDG 2 11 1 2 8
SDG 3 36 18 9 9
SDG 4 15 5 10 0
SDG 5 4 1 3 0
SDG 6 14 4 5 5
SDG 7 5 3 2 0
SDG 8 14 3 4 7
SDG 9 8 3 1 4
SDG 10 16 3 2 11
SDG 11 1 0 1 0
SDG 12 10 3 1 6
SDG 13 1 0 0 1
SDG 14 2 1 1 0
SDG 15 7 3 3 1
SDG 16 4 0 2 2
SDG 17 14 6 3 5
Total 177 56 56 65
Source: Economic Commission for Latin America and the Caribbean (ECLAC).Note: Fourteen additional statistical series relating to the indicators prioritized for the region have been included.
The effects of the pandemic are influencing the projections and scenarios proposed for most of the series studied. The large negative change in GDP projected for 2020 will mean checks or reverses that slow the pace of progress towards the targets set for 2030. Although pre-pandemic trends are expected to reassert themselves in many cases over the coming years, this will not always be enough to make up lost ground. Moreover, there is still great uncertainty about the long-term impacts of the pandemic in all areas of development, meaning that this scenario may change in a way that makes the targets less likely to be met. An initial qualitative approach to the issue is to analyse the measures implemented by the countries of the region during 2020 to overcome the problems arising from the pandemic. The new global situation makes it necessary to take urgent measures and assess the impacts of these actions. To support the follow-up and
4 See annex IV.A1 for a list of the series studied.

91
Building forward better: action to strengthen the 2030 Agenda for Sustainable Development
IV
monitoring of progress in the medium and long term, and in response to the request made by the Community of Latin American and Caribbean States (CELAC), ECLAC has launched the COVID-19 Observatory in Latin America and the Caribbean,5 which compiles and presents information on the public policies that the 33 countries of the region have implemented to limit the impact of the COVID-19 pandemic and analyses the economic and social effects that the pandemic will have at the national and sectoral levels.
2. Policies to confront the pandemic are contributing to the 2030 Agenda
These public policies are having a direct impact on efforts to meet the targets of the 2030 Agenda, in some cases facilitating their achievement and in others slowing down the dynamics and national mechanisms implemented by the countries of the region. To analyse the impact of these measures on the SDGs, ECLAC and the think tank CEPEI (Centro de Pensamiento Estratégico Internacional) have assessed the relationship between the type of measures implemented by the countries and the SDG targets in order to provide a perspective that takes greater account of the situation caused by the pandemic.
The information on the measures was collected and analysed at the national and sectoral levels by ECLAC through the COVID-19 Observatory in Latin America and the Caribbean. A joint effort was undertaken with CEPEI to analyse the relationship of the pandemic-related measures taken in the region with the 169 Goals of the 2030 Agenda and their effect on them.6 The analysis included the 7 subject areas and 45 types of measures identified by the COVID-19 Observatory in Latin America and the Caribbean7 to classify the actions taken by the countries of the region. Conceptual definitions taking account of theoretical elements of the 2030 Agenda and the practical cases recorded by the countries in the Observatory were also prepared.8 This provided the means of establishing how the 2030 Agenda targets linked in with the different measures, classified by the thematic scope of each of these measures and the time horizon of the expected impact and systematized according to their possible effect, positive or negative, on the prospects of each of the targets being met.
Overall, the results show a strong relationship between the measures taken by the countries and the whole of the 2030 Agenda, with an impact on an estimated 85% or more of the targets. Of the 45 types of measures implemented, only 7 are restrictive measures aimed at reducing infections, while 38 seek to reduce the social and economic harm caused by these restrictions, mainly in the economic, educational, social protection and gender spheres. This suggests that, in some cases, mitigation measures will tend to have a positive impact on the likelihood of attaining the 2030 Agenda targets, while restrictive measures will slow down the attainment of these targets, at least in the short term. In some cases, a measure may have positive effects on one target and negative ones on another in the context of a single Goal.9
Measures associated with restrictions (closure of public places, border closures and controls, mandatory quarantines, school shutdowns, restrictions on economic activities) are linked to 94 of the 2030 Agenda Goals and may negatively affect 47.3% of them. The measures with the greatest impact are those requiring isolation across entire countries, i.e., mandatory general lockdown measures that have restricted inhabitants’ physical contact, mobility and activities in order to prevent the spread of the disease, which have negatively affected 41% of the 2030 Agenda targets. The greatest impact has been on the targets related to the eradication of monetary and multidimensional poverty and on efforts to sustain steady economic growth, as they are hindering the creation of full-time and productive
5 See [online] https://www.cepal.org/en/topics/covid-19.6 The analysis was conducted by a multidisciplinary group between April and August 2020 and considered the 45 measures under which the actions
taken by the 33 countries in the region to address the COVID-19 pandemic are classified, as published in the ECLAC COVID-19 Observatory.7 See “Measures and actions at the national level” [online] https://www.cepal.org/en/topics/covid-19.8 For the methodology used, see [online] https://agenda2030lac.org/sites/default/files/2020-12/methodology.pdf.9 One example is general lockdown, which has a possible positive impact on target 14.1 (marine pollution) and a possible negative effect on target 14.b
(small-scale artisanal fisheries).

Economic Commission for Latin America and the Caribbean (ECLAC)
92 IV
employment and reducing the options for generating decent work for all (targets 8.1, 8.2 and 8.5 of SDG 8). Restrictive measures are also having a negative effect on targets relating to universal access to basic services (targets 11.1 of SDG 11 and 1.4 of SDG 1) and those concerned with food security, as they are reducing the agricultural productivity of small farms and disrupting the smooth functioning of markets for basic foodstuffs and their derivatives (targets 2.1, 2.3 and 2.c of SDG 2). Moreover, targets that have to do with better implementation of the 2030 Agenda, such as those relating to the improvement of countries’ statistical capabilities (target 17.19 of SDG 17), will also be affected by lockdown measures and mobility restrictions, which prevent, for example, the usual statistical information collection procedures from being carried out face to face.
As discussed in previous chapters, in addition to these restrictive measures, and as a way of dealing with one of the worst economic contractions in the last 100 years, a large number of countries have implemented mitigation measures that seek to reduce the indirect effects of the pandemic on supply and demand and respond to the serious structural problems it has exposed, such as inequality, low productivity and fragmentation of access to health and social protection. Most countries have increased public investment and redirected fiscal spending, which has had a positive impact on 71 of the 2030 Agenda targets. For example, fiscal measures such as the deferral of tax payments and reductions in the corporate tax base are expected to limit the ground lost on 17 targets concerned with increasing the productive activities of micro, small and medium-sized enterprises. Likewise, measures to increase employment protection and flexibility should help to prevent serious setbacks with 29 targets relating to the goal of full and productive employment and a reduction in informal working. At the same time, various social protection measures such as cash and food transfers to vulnerable populations, guaranteed basic services and gender policies aimed at generating employment and income will have a positive influence on 87 of the 2030 Agenda targets insofar as they aim at the reduction of inequality, poverty and economic and social vulnerability and the narrowing of gender and ethnic and racial divides, which have widened as a result of the pandemic.
The results of the exercise also show that it is not only mitigation measures that can have a positive effect on the 2030 Agenda, but that some restrictive measures could also have a positive impact on the likelihood of some targets being met, particularly those related to the environmental SDGs. Thus, the decline in production activities and consumption may lead to lower levels of greenhouse gas emissions and waste production and even improve the natural balance of saturated ecosystems. At least 27 of the 2030 Agenda targets could be positively affected by environmental measures designed to curb negative impacts on urban air quality (target 11.6 of SDG 11), reduce waste (target 12.5 of SDG 12), raise awareness of the effects of climate change mitigation (SDG 13), reduce marine pollution from land-based economic activities (target 14.1 of SDG 14) and promote the sustainable use of terrestrial ecosystems by preventing the introduction of alien species and the trafficking and poaching of protected species (targets 15.7 and 15.8 of SDG 15). Many of these restrictive measures correlate positively with reduced exposure and vulnerability to economic, social and even some environmental disasters (target 1.5 of SDG 1) and the management of national and global health risks (target 3.d of SDG 3). The fact that some measures may correlate positively with the 2030 Agenda targets does not lessen the negative effects of the pandemic in different areas and for sustainable development generally. However, it does indicate that timely policy decisions can protect and strengthen actions that help prevent progress towards some SDGs from being reversed.
Given the potential effects of the COVID-19 pandemic on progress towards implementing the 2030 Agenda across all dimensions of sustainability, the Inter-Agency and Expert Group on Sustainable Development Goal Indicators agreed to analyse the global indicator framework in the context of the pandemic to examine areas of high impact. It conducted the analysis at the indicator level, noting a list of 73 unique indicators (out of the 231 in the global indicator framework) that are likely to be heavily

93
Building forward better: action to strengthen the 2030 Agenda for Sustainable Development
IV
impacted by the pandemic. As indicated in that study, it is too early to tell whether the changes brought about by the pandemic are short-term or whether they will have a longer time horizon and thus a sustained impact on the evolution of the SDG indicators and hence progress towards the 2030 Agenda targets. Nevertheless, it is important to closely monitor a number of aspects of the 2030 Agenda in the region, not only to determine how the pandemic has affected different areas but, even more importantly, to use this information to address areas where progress may have stalled or there may have been a negative impact.
While this section presents only some results of the analysis conducted, the exercise as a whole serves as an open-ended tool for countries and decision-makers to develop their own relationship tables dealing with more specific measures that have been or are being implemented to address the pandemic.10 This exercise can be used as a guide to determine how socioeconomic pandemic recovery efforts can be oriented in such a way that they promote equity, resilience, sustainability and progress towards the SDGs.
In summary, the results and analyses presented in this section reveal a worrying outlook for 2030, with greater challenges than were identified a year ago. Although the statistical series studied appear to be recovering, resuming trends consistent with the pre-pandemic scenario, the short-term setbacks appear to be affecting the prospects for achieving the targets, making them unattainable in some cases. For more than two thirds of the series, progress is inadequate to achieve the hoped-for results, and efforts to date have been insufficient to ensure that the 2030 targets are met. This indicates a need to advocate and implement public policies that address these issues in the time that remains. The risk of the commitments deriving from the 2030 Agenda not being met highlights the urgency of implementing public policies that respond to the demands created by these Goals in the difficult socioeconomic context of the pandemic, as analysed in detail in chapter V.
3. Projections for selected indicators
Following a review of the trend of the whole set of SDG indicator series, the results for three selected series are presented below.11 The projection models used are associated with the nature of the indicator, the availability of secondary information that could be used to generate the scenarios and the robustness of the available data. The projections of these indicators were arrived at using a panel data econometric model, autoregressive models or models of the average annual percentage change in the indicator, based on a review of the literature dealing with the phenomenon measured, descriptive statistics and the selection of statistical significance tests. The methodology used allows a COVID-19 pandemic effect to be introduced, with the impact on economic growth, measured by the GDP growth rate, being taken as an explanatory variable. For this purpose, a drop of 7.7% in regional GDP was assumed for 2020, as indicated in chapter III, with this rate then being adjusted until the level of GDP is restored by 2030 (IMF, 2020). The evolution of extreme poverty is given special treatment, with various scenarios analysed on the basis of assumptions about economic growth and inequality.
(a) The impact of the pandemic on extreme poverty and the outlook for 2030
As discussed in chapter III, ECLAC projects an extreme poverty rate of 12.5% and a poverty rate of 33.7% in 2020. This would mean 209 million poor people by the end of 2020, 22 million more than a year earlier. Of this total, 78 million people would be in extreme poverty, 8 million more than in 2019. The increase in extreme poverty and poverty due to the pandemic have consequences not only in the short term (2020–2021) but also for the prospects of achieving the Goals of the 2030 Agenda.
10 See ECLAC (2020b).11 The dynamics of a fourth indicator, greenhouse gas emissions, are analysed in chapter V.

Economic Commission for Latin America and the Caribbean (ECLAC)
94 IV
It is possible to estimate the level of extreme poverty in the region in 2030 by applying different combinations of average household income growth and distributional change to the 2020 projections. In a first scenario, in which per capita income grows by 1% per year and there is no change in income concentration, extreme poverty would only fall back to 11.5%, an even higher rate than in 2019.
If the same annual per capita GDP growth rate (1%) is assumed but inequality is projected to fall by the equivalent of a 1% annual decline in the Gini coefficient, the incidence of extreme poverty in 2030 would be 9.6%. This shows the importance of adopting policies that improve income distribution to help reduce poverty, as a small reduction in the Gini coefficient translates into a fall of almost 2 percentage points in the extreme poverty rate projected for 2030.
In contrast to what was observed until 2019, when a scenario of 5% annual per capita GDP growth and a 1.5% annual fall in the Gini coefficient would have been sufficient to reach the 2030 target (which for the practical purposes of the simulation is assumed to be 3%), in the post-pandemic environment this scenario would leave the extreme poverty rate at 5.7% (see figure IV.1).
Figure IV.1 Latin America (18 countries): extreme poverty rate under different scenarios for annual changes in income distribution and annual per capita GDP growth, 2002–2020 and projections to 2030(Percentages)
12.2
9.18.2
11.3
12.5
11.5
8.79.6
8.1
7.2
5.7
0
2
4
6
8
10
12
14
2002
2003
2004
2005
2006
2007
2008
2009
2010
2011
2012
2013
2014
2015
2016
2017
2018
2019
2020
2021
2022
2023
2024
2025
2026
2027
2028
2029
2030
No distributive change and 1% per capita GDP growth
1.5% drop in the Gini coefficient and 2% per capita GDP growth1.5% drop in the Gini coefficient and 3% per capita GDP growth1.5% drop in the Gini coefficient and 5% per capita GDP growth
1% drop in the Gini coefficient and 1% per capita GDP growth
Source: Economic Commission for Latin America and the Caribbean (ECLAC), on the basis of Household Survey Data Bank (BADEHOG).Note: Weighted average of figures for the following countries: Argentina, the Bolivarian Republic of Venezuela, Brazil, Chile, Colombia, Costa Rica, the
Dominican Republic, Ecuador, El Salvador, Guatemala, Honduras, Mexico, Nicaragua, Panama, Paraguay, Peru, the Plurinational State of Bolivia and Uruguay.

95
Building forward better: action to strengthen the 2030 Agenda for Sustainable Development
IV
If even before the pandemic the goal of eradicating extreme poverty required higher GDP growth and a faster decline in income inequality than have characterized the region in recent years, the current situation has greatly increased the challenge. However, the positive impact of direct cash transfer programmes in recent months shows the potential of this type of public policy action. If, as proposed in chapter V, a policy of direct transfer of income (equivalent to one poverty line) from the richest decile to the poor were implemented, poverty would be reduced even faster than if the historically observed trajectory were to be maintained.
(b) Inadequate declines in unemployment by 2030
Given the importance of employment for poverty eradication, a simulation exercise for the dynamics of the unemployment rate up to 2030 is presented below. The unemployment rate for persons aged 15 and over (SDG indicator 8.5.2) is the indicator adopted to monitor the target of full and productive employment and decent work for all women and men, including for young people and persons with disabilities, and equal pay for work of equal value.
The target value for this indicator is between 3% and 5%, which matches what is commonly understood as the natural rate of unemployment consistent with the frictional aspects of the labour market. The evolution of employment is closely related to the behaviour of output and investment. In addition, the unemployment rate is a function of these and of the labour supply, represented by the economically active population. Accordingly, the unemployment rate projections analysed consider these three variables in different GDP growth scenarios: annual growth similar to that observed in the period 2011–2015; a growth rate 10% higher or 10% lower than that rate; and a growth rate 20% higher or 20% lower than that rate.12 As a consequence of the pandemic, a 7.7% decline in regional GDP in 2020 was considered for the projections that include economic growth as an explanatory variable. For the following years, this rate was adjusted to restore the level of GDP by 2030. This decline will be followed by an increase in unemployment in the early 2020s, making the 2030 targets more difficult to meet.
Because growth was already too low before the sharp downturn in 2020 due to the pandemic, an unemployment rate of around 5% by 2030 does not seem achievable. If current conditions continue, it is unlikely that the unemployment rate for the population aged 15 and over will fall below 8%. This could happen only if growth performance were to improve substantially and sustainably from recent years’ figures. The situation is particularly serious in the case of the younger population (aged 15 to 24), since under current conditions the unemployment rate for this group would be around 18% by 2030, far above target (see figure IV.2).
In sum, bringing the unemployment rate closer to the target will require a much improved performance in terms of per capita GDP and investment growth. Growth policies should therefore be strengthened, as should active labour market policies, as a way to improve the employment prospects of the active population. These efforts could also help foster a more rapid recovery from the consequences of the pandemic. In the case of women, policies should also seek to reduce the excessive burden of unpaid work seen during the pandemic so that they can participate fully in the labour market.
12 Per capita GDP grew at a very low rate of 0.5% a year in this period, which meant that projections varied very little. This does not imply that this variable has no influence on unemployment, but rather that if these levels of growth continued, the change in unemployment over the next decade would be very small.

Economic Commission for Latin America and the Caribbean (ECLAC)
96 IV
Figure IV.2 Latin America and the Caribbean: unemployment rate in the population aged 15–24 years, 2000–2030(Percentages)
Growth rate 10% below rate used for projectionGrowth rate 20% below rate used for projectionProjectionGrowth rate 10% above rate used for projectionGrowth rate 20% above rate used for projectionAutoregressive integrated moving average (ARIMA) modelThreshold
0123456789
1011121314151617181920
2000
2001
2002
2003
2004
2005
2006
2007
2008
2009
2010
2011
2012
2013
2014
2015
2016
2017
2018
2019
2020
2021
2022
2023
2024
2025
2026
2027
2028
2029
2030
Historical data Projections
Source: Economic Commission for Latin America and the Caribbean (ECLAC), on the basis of United Nations, Global SDG Indicators Database [online] http://unstats.un.org/sdgs/indicators/database/.
(c) The (in)efficient use of natural resources
The dominant “take, produce, consume and dispose of” linear production model is not conducive to the efficient use of natural resources. This problem must be addressed before it becomes irreversible and the resources that drive the region’s economies are depleted.
Domestic material consumption (DMC), which includes the raw materials a country extracts plus imports minus exports of these materials, is a relevant indicator for monitoring the efficient use of available natural resources. DMC describes the physical dimension of the economy’s processes and interactions. It represents the amount of materials used within the economy that are transformed into emissions or waste or accumulated as stocks, and is an indicator of local pressures in terms of materials used within the economy itself. With regard to total DMC, figure IV.3 shows that Latin America and the Caribbean experienced a significant increase between 2000 and 2017, when the figure rose from 5.374 billion tons to 8.505 billion tons. This represents growth of 58% in total DMC.

97
Building forward better: action to strengthen the 2030 Agenda for Sustainable Development
IV
Figure IV.3 Latin America and the Caribbean: domestic material consumption, 2000–2030(Millions of tons)
0
1 000
2 000
3 000
4 000
5 000
6 000
7 000
8 000
9 000
10 000
11 000
12 000
2000
2001
2002
2003
2004
2005
2006
2007
2008
2009
2010
2011
2012
2013
2014
2015
2016
2017
2018
2019
2020
2021
2022
2023
2024
2025
2026
2027
2028
2029
2030
Threshold
Autoregressive integrated moving average (ARIMA) model
Growth rate 10% above rate used for projection
Growth rate 10% below rate used for projectionProjectionGrowth rate 20% below rate used for projection
Growth rate 20% above rate used for projection
Source: Economic Commission for Latin America and the Caribbean (ECLAC), on the basis of United Nations, Global SDG Indicators Database [online] http://unstats.un.org/sdgs/indicators/database/.
To estimate the likely level of DMC per capita in 2030, a projection was made specifying some alternative scenarios up to that year on the basis of the official historical data available for monitoring this target. The model includes the GDP growth rate as an argument variable; this reflects the impact of the COVID-19 pandemic in the form of a contraction in economic activity of around 7.7% for 2020, and a gradual adjustment is assumed so that the level forecast is restored by 2030.
Regarding the estimates, figure IV.3 shows that no significant changes in DMC levels are forecast for the period 2017–2019, but that direct extraction is expected to have decreased in 2020 because of the effects of the pandemic, leading to a 4% contraction in the pressure on materials. In the period 2021-2030, however, DMC levels for the region maintain the rising trend seen before the economic downturn. According to the projection, DMC will reach around 9.4 billion tonnes by 2030, an increase of 76% from the year 2000. It should be noted that this trend remains unchanged in additional scenarios in which the growth of the explanatory variable is 10% and 20% above and below the forecast.
It can be concluded from the projection that, if the pressure on natural resources continues at this rate, it will be impossible to achieve a sustainable economic development model as proposed in the 2030 Agenda. Tracking and analysing the behaviour of this indicator during a period of economic contraction in which consumption patterns, national economies and international trade have altered makes it easier to develop tools for informed decision-making in order to formulate public policies that promote a transformative recovery.
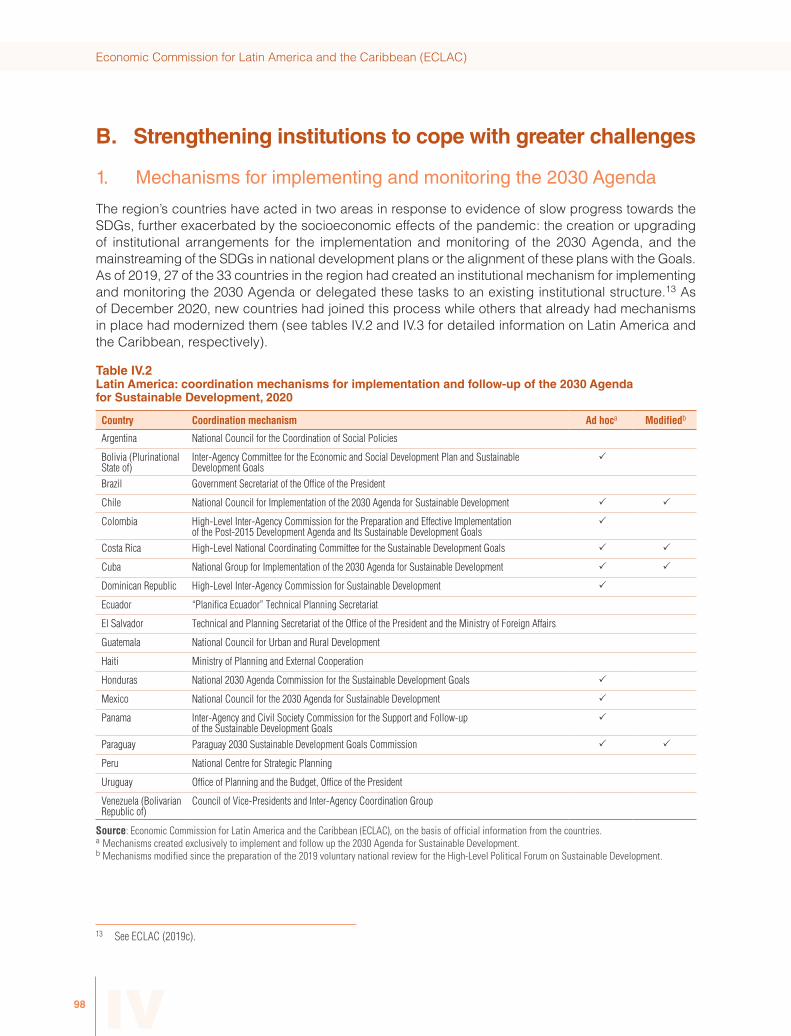
Economic Commission for Latin America and the Caribbean (ECLAC)
98 IV
B. Strengthening institutions to cope with greater challenges
1. Mechanisms for implementing and monitoring the 2030 Agenda
The region’s countries have acted in two areas in response to evidence of slow progress towards the SDGs, further exacerbated by the socioeconomic effects of the pandemic: the creation or upgrading of institutional arrangements for the implementation and monitoring of the 2030 Agenda, and the mainstreaming of the SDGs in national development plans or the alignment of these plans with the Goals. As of 2019, 27 of the 33 countries in the region had created an institutional mechanism for implementing and monitoring the 2030 Agenda or delegated these tasks to an existing institutional structure.13 As of December 2020, new countries had joined this process while others that already had mechanisms in place had modernized them (see tables IV.2 and IV.3 for detailed information on Latin America and the Caribbean, respectively).
Table IV.2 Latin America: coordination mechanisms for implementation and follow-up of the 2030 Agenda for Sustainable Development, 2020
Country Coordination mechanism Ad hoca Modifiedb
Argentina National Council for the Coordination of Social Policies
Bolivia (Plurinational State of)
Inter-Agency Committee for the Economic and Social Development Plan and Sustainable Development Goals
Brazil Government Secretariat of the Office of the President
Chile National Council for Implementation of the 2030 Agenda for Sustainable Development
Colombia High-Level Inter-Agency Commission for the Preparation and Effective Implementation of the Post-2015 Development Agenda and Its Sustainable Development Goals
Costa Rica High-Level National Coordinating Committee for the Sustainable Development Goals
Cuba National Group for Implementation of the 2030 Agenda for Sustainable Development
Dominican Republic High-Level Inter-Agency Commission for Sustainable Development
Ecuador “Planifica Ecuador” Technical Planning Secretariat
El Salvador Technical and Planning Secretariat of the Office of the President and the Ministry of Foreign Affairs
Guatemala National Council for Urban and Rural Development
Haiti Ministry of Planning and External Cooperation
Honduras National 2030 Agenda Commission for the Sustainable Development Goals
Mexico National Council for the 2030 Agenda for Sustainable Development
Panama Inter-Agency and Civil Society Commission for the Support and Follow-up of the Sustainable Development Goals
Paraguay Paraguay 2030 Sustainable Development Goals Commission
Peru National Centre for Strategic Planning
Uruguay Office of Planning and the Budget, Office of the President
Venezuela (Bolivarian Republic of)
Council of Vice-Presidents and Inter-Agency Coordination Group
Source: Economic Commission for Latin America and the Caribbean (ECLAC), on the basis of official information from the countries.a Mechanisms created exclusively to implement and follow up the 2030 Agenda for Sustainable Development.b Mechanisms modified since the preparation of the 2019 voluntary national review for the High-Level Political Forum on Sustainable Development.
13 See ECLAC (2019c).

99
Building forward better: action to strengthen the 2030 Agenda for Sustainable Development
IV
Table IV.3 The Caribbean: coordination mechanisms for implementation and follow-up of the 2030 Agenda for Sustainable Development, 2020
País Mecanismo de coordinación Ad hoca Modificadob
Antigua and Barbuda Ministry of Foreign Affairs, International Trade and Immigration
Bahamas Sustainable Development Goals Unit, Office of the Prime Minister
Barbados Ministry of Finance, Economic Affairs and Investment
Belize Ministry of Sustainable Development, Climate Change and Disaster Risk Management
Dominica Ministry of Economic Affairs, Planning, Resilience and Sustainable Development, Telecommunications and Broadcasting
Grenada Technical Working Group, National Sustainable Development Plan 2020–2035c
Guyana Ministry of Finance
Jamaica National 2030 Agenda Oversight Committee
Saint Kitts and Nevis Ministry of Sustainable Development
Saint Lucia National Coordinating Mechanism for implementing the 2030 Agenda and the 17 SDGs
Saint Vincent and the Grenadines
Ministry of Finance, Economic Planning, Sustainable Development and Information Technology
Suriname NR
Trinidad and Tobago Ministry of Planning and Development
Source: Economic Commission for Latin America and the Caribbean (ECLAC), on the basis of Regional Observatory on Planning for Development in Latin America and the Caribbean [online] https://observatorioplanificacion.cepal.org/en and Caribbean Development Portal [online] https://caribbean.eclac.org/.
Note: NR: not reported.a Mechanisms created exclusively to implement and follow up the 2030 Agenda for Sustainable Development.b Mechanisms modified since the preparation of the 2019 voluntary national review for the High-Level Political Forum on Sustainable Development.c The Government has proposed the creation of a Sustainable Development Institute with responsibility for overseeing the 2030 Agenda.
In the first area, the Plurinational State of Bolivia warrants mention, having established an Inter-Agency Committee for the Economic and Social Development Plan and Sustainable Development Goals (CIMPDS), coordinated by the Ministry of Development Planning. This Committee is responsible for action to move towards attainment of the goals of the Economic and Social Development Plan and the SDGs. As regards the modernization of institutional arrangements, there have been major changes in Chile, Costa Rica and Paraguay, for example, where the changes have been aimed at incorporating new actors into the mechanisms and promoting the creation of inter-agency and multi-stakeholder working groups to advance the implementation of the 2030 Agenda. In Chile, the institutional framework has been redesigned to make it stronger and expand its impact;14 the most important changes include the incorporation into the coordination mechanism of the Ministry of the General Secretariat of the Office of the President (SEGPRES), given its role as interministerial coordinator; the creation of an intersectoral group; the mandate for this mechanism to propose a 2030 Agenda implementation strategy to be approved by the country’s President; and the creation of a National 2030 Agenda Network that is establishing contact points in each State body. In the same vein, Paraguay has updated its mechanism to broaden and strengthen it; in particular, it has created a High-Level Steering Council that includes the legislative and judicial branches and two companies, Itaipú Binacional and Entidad Binacional Yaciretá. The country has also mandated the creation of a multisectoral working committee with the participation of civil society, academia, the private sector and international cooperation agencies, a strategic planning committee, a monitoring committee and, lastly, a committee for the localization of the SDGs. In Costa Rica, the Ministry of Human Development and Social Inclusion has been incorporated into the High-Level National Coordinating Committee for the Sustainable Development Goals. For its
14 Decree No. 67 of 2 May 2019.

Economic Commission for Latin America and the Caribbean (ECLAC)
100 IV
part, Brazil has dissolved the National Committee for the Sustainable Development Goals set up in 2016 and given responsibility for monitoring this and other processes to the Government Secretariat of the Office of the President.15
2. Incorporation of the 2030 Agenda and SDGs into planning
(a) National development plans and the 2030 Agenda
Since mid-2019, eight countries have produced new development plans, some of them medium-term, owing to the start of cycles of government, and others long-term. With regard to long-term planning, the region has continued to make progress in the development of visions and plans, and 18 countries had long-term development plans as of December 2020, many of them running up to 2030 to match the time frame of the 2030 Agenda, but others looking as far ahead as 2050 (see figure IV.4). In Uruguay, for example, the Office of Planning and the Budget coordinated the document Aportes para una Estrategia de Desarrollo 2050 (“Contributions for a Development Strategy to 2050”), launched in late 2019, which sets out to provide an overview of the country’s development until the middle of this century; this instrument includes the creation of the mechanisms necessary for society as a whole to take ownership of its objectives.16 Other long-term instruments developed in this recent period include Guyana’s Green State Development Strategy and Grenada’s National Sustainable Development Plan 2020–2035. All three refer to the 2030 Agenda and the SDGs as part of the development process.
Figure IV.4 Latin America and the Caribbean: time frames of long-term development plans, December 2020
205020402040
20352032
203020302030203020302030203020302030
20252025
20212020
Uruguay
2020 2030 2040 2050
GuyanaBahamasGrenada
GuatemalaJamaica
Dominican Rep.Honduras
BelizeHaiti
ParaguayTrinidad and Tobago
PanamaDominica
Bolivia (Plur. State of)Saint Vincent and the Grenadines
PeruBarbados
Source: Economic Commission for Latin America and the Caribbean (ECLAC), on the basis of Regional Observatory on Planning for Development in Latin America and the Caribbean [online] https://observatorioplanificacion.cepal.org/en.
15 After the Committee was dissolved, Decree No. 9980 of 2019 made coordinating actions to implement the 2030 Agenda one of the functions of the Government Secretariat of the Office of the President (article 15). This was subsequently repealed and replaced by Decree No. 10591 of 2020, which grants new responsibilities to the Government Secretariat of the Office of the President; however, this new decree makes no mention of the 2030 Agenda or the SDGs.
16 See OPP (2019).

101
Building forward better: action to strengthen the 2030 Agenda for Sustainable Development
IV
The Bolivarian Republic of Venezuela, Brazil, Mexico, Panama and Saint Lucia formulated medium-term plans (instruments associated with new periods in the cycle of government) during this stage (see table IV.4). The planning instruments of the Bolivarian Republic of Venezuela, Panama and Saint Lucia recognize the 2030 Agenda and the SDGs as the framework for development and also include exercises linking their strategic objectives or guidelines to the SDGs. Saint Lucia’s plan explicitly states that the development of the instrument was influenced by the SDGs and, accordingly, the targets set as key result areas show how national goals align with the global ones. Furthermore, this alignment allows targets and associated indicators to be integrated into the monitoring and evaluation framework of the strategy. The Bolivarian Republic of Venezuela’s plan sets goals aimed at building partnerships for the attainment of the SDGs and at strengthening the statistical system for the purpose of monitoring these global Goals. In addition, its plan incorporates the SDG targets and indicators that are part of the national statistical system. In the cases of Brazil (Pluriannual Plan 2020–2023) and Mexico (National Development Plan 2019–2024), on the other hand, there is no explicit mention of the 2030 Agenda or exercises linking the plans to the SDGs.
Table IV.4 Latin America and the Caribbean: new national development plans, December 2020
Country PlanMention of the 2030 Agenda for Sustainable Development
and the Sustainable Development Goals (SDGs)
Linkage of goals to the SDGs
Linkage of goals to SDG targets and indicators
Brazil Pluriannual Plan 2020–2023 - - -Grenada National Sustainable Development Plan
2020–2035 -
Guyana Green State Development Strategy -Mexico National Development Plan 2019–2024 - - -Panama Strategic Plan of Government
2020–2024 -
Saint Lucía Medium Term Development Strategy 2020–2023
Uruguay Contributions for a Development Strategy to 2050
- -
Venezuela (Bolivarian Republic of)
Homeland Plan 2019–2025
Source: Economic Commission for Latin America and the Caribbean (ECLAC), on the basis of Regional Observatory on Planning for Development in Latin America and the Caribbean [online] https://observatorioplanificacion.cepal.org/en.
(b) Planning and lead planning institutions in the formulation of pandemic response measures
The effects of the pandemic in Latin America and the Caribbean and the world have revealed weaknesses in the ability not only of health-care systems but of the entire public apparatus to anticipate and respond comprehensively to social needs and deliver public goods and services with the flexibility, immediacy, effectiveness, relevance, openness and transparency that the emergency has required. Notwithstanding that the role of the State has been recognized and that it is primarily in the public sphere that the response to the emergency and the impetus for post-pandemic recovery has to originate, public action to deal with the emergency has revealed limited coordination between institutions, sectors and levels of the State, a lack of interoperability between public information systems and disconnection from statistics, a failure to pursue a comprehensive policy approach, and a lack of spaces for citizen participation in the design and implementation of policies to respond to the emergency. All this has led citizens to question public leadership and the actions of State institutions, further undermining already depleted trust and limiting, in some cases, the effectiveness of measures.

Economic Commission for Latin America and the Caribbean (ECLAC)
102 IV
Faced with the levels of complexity in the global and regional environment generated by the pandemic, the challenge for planning is to anticipate and provide for actions to solve public problems flexibly and innovatively within a long-term time frame by means of actions that are coordinated between sectors and between different levels of government and with strong participation by all development actors and adequate levels of transparency and systematic public accountability. Essentially, the challenge is for institutions, instruments and practices to be flexible enough to adapt and respond quickly and effectively to the volatility and dynamism of economic, social and environmental phenomena without losing sight of development objectives and without allowing short-term economic difficulties to derail structural changes.
It is urgent for these challenges to be overcome, since the implementation of post-pandemic recovery measures could come up against similar difficulties if planning systems and public management are not strengthened with increased prospective and strategic planning capacities, the ability to produce interoperable and up-to-date statistical and administrative information, results-based budget management and a systematic practice of evaluating State interventions, with efforts to foster innovation and collaboration between institutions, sectors and social actors in order to anticipate needs and solve public problems.
A recent study on Central America, “Centroamérica frente a la COVID-19: lecciones y desafíos para la planificación, el gobierno digital y la gobernanza” (Enriquez Villacorta, 2020), concludes that, in general, the institutions in charge of planning have not played a central role in the design of measures to respond to the emergency. Measures have been designed by particular sectors (health, the economy and finance, social development) in their own areas of responsibility; comprehensive actions have been lacking. Furthermore, the study points out, neither have the lead planning institutions played a role in monitoring measures or in providing feedback on decision-making processes. This conclusion refers to the creation of ad hoc mechanisms for following up on measures without any coordinating role being assigned to the lead planning authorities, and to planning systems whose capacities have been weakened and which are vulnerable to changes deriving from cycles of government, precluding continuity in policies aimed at achieving long-term development goals.
In the Central American Integration System (SICA) subregion, with the exception of Costa Rica, the Dominican Republic and Panama, the lead institutions for planning do not have ministerial rank, but are attached to the Ministry of the Presidency or Office of the President in the form of a secretariat (Guatemala), a council (Nicaragua), a directorate (Honduras) and a technical secretariat (El Salvador). In South America, the lead planning institutions have also undergone changes in the last five years, particularly in Ecuador (the current Technical Planning Secretariat, “Planifica Ecuador”, comes under the Office of the President), Brazil (the planning function is split between the Ministry of the Economy, under the Secretariat of Public Policy Evaluation, Planning, Energy and the Lottery, and the Ministry of Regional Development) and Argentina (the current Department of Planning and Territorial Coordination of Public Works comes under the Ministry of Public Works).
Another of the issues brought out by this study is the lack of coordination between sectors and levels of the State, which was plain to see when national authorities took measures (quarantines, the introduction and lifting of partial and total lockdowns, social protection measures and the provision of food supplies for the subsistence of the most vulnerable) and formulated policies without consulting with subnational governments. In some cases, these measures actually ran counter to what had been requested by these governments, resulting in tensions and a failure to take advantage of local perspectives and capabilities. The result was citizen protests and mobilizations in Brazil, Chile, Colombia, El Salvador, Mexico, Panama and the Plurinational State of Bolivia, among other countries.
Lastly, citizen participation has been neglected. Most measures have been designed and implemented without arrangements for involving business associations, academia or the private sector that could have provided information, innovation and financial resources and, above all, lent legitimacy to the process,

103
Building forward better: action to strengthen the 2030 Agenda for Sustainable Development
IV
supporting an effective strategy of communication with citizens, as happened in New Zealand, where social networks were used extensively and youth was involved as a form of support.
Development planning is a powerful tool available to the State to coordinate a resilient and sustainable post-pandemic transformation process, aligning sectors, actors and levels of government around a collective long-term vision for the country. Accordingly, it is essential to maintain the planning and public management capabilities and leadership of the State and to ensure that the institutions forming part of national planning systems play an active role in the design and implementation of public policies to achieve this objective.
(c) Aligning national budgets and the 2030 Agenda
The public budget is an essential development tool, as it is the financial expression of the strategic choices made in State management. To achieve the objectives of a planning process, it is necessary to estimate the budget required for it to be feasible and to identify the sources of financing. This is called plan-budget linkage. The countries of the region are aware of the importance of this linkage, since in their voluntary national reviews a number of them have presented exercises associating the SDGs with the national budget. In all cases, however, these exercises have been subsequent to budget allocations, and they do not describe mechanisms that would allow the SDGs to be considered in budgeting.
A noteworthy case is that of Uruguay, where, since 2010, the process of preparing the national budget has involved the identification of 18 programme areas including budget programmes disaggregated into institutional objectives and then into objectives of executing units (OPP, 2018). In 2016, the Office of Planning and the Budget (OPP) identified the SDG targets that fell within the different levels of objectives indicated and developed a matrix of relationships that allows programme areas to be associated with the SDGs and their targets, creating a basis for estimating the expenditure associated with the attainment of each of the SDGs. These results provide useful inputs for greater linkage between the SDGs and national planning and budgeting, and in the incorporation of the SDGs into the strategic planning of ministries and other public bodies.
In general, association exercises carried out by the countries have varied considerably in the progress made and the approaches adopted, and have employed different methodologies and criteria. They involve difficulties such as the double counting that arises when policies contribute to more than one SDG, the existence of public expenditure that is not included in the national budget and the subjective nature of the links established. Nevertheless, these exercises are a positive part of a learning process involving the linkage of planning, budgeting and the SDGs and providing a greater understanding of the contribution of public resources to development objectives.
Achieving a real link between national plans, the SDGs and budgets requires legal and institutional changes to enable existing budget systems to be reformed (as has happened in Uruguay) and endowed with linkage mechanisms, budget information systems incorporating the SDGs and the use of information about progress on the indicators when budgeting decisions are made. Technical changes in planning processes and in the use of budgeting techniques are also required.
Linking budgets to national planning instruments makes it possible to implement national objectives, which will contribute to the overall objectives of the 2030 Agenda. This linkage is still weak in the region, as only 13 countries17 mention in their plans some kind of budget estimate or projection related to their implementation, sometimes in the form of macroeconomic analyses or projections, or as partial estimates of the cost of the plan, focusing especially on investments.
17 Barbados, Brazil, Colombia, Costa Rica, Dominica, Ecuador, El Salvador, Guatemala, Haiti, Honduras, Nicaragua, Panama and the Plurinational State of Bolivia.

Economic Commission for Latin America and the Caribbean (ECLAC)
104 IV
Mismatches of timing are another difficulty for linking purposes, as development plans are medium- and long-term while budgets are generally annual, which makes it difficult to harmonize planning and budgeting processes. While 16 countries in the region have medium-term expenditure frameworks,18 only Uruguay has a multi-year budget, which means it can be harmonized with a medium-term plan (ECLAC, 2018a).
Lastly, results-based budgeting is essential if plans and budgets are to be successfully linked. Results-based budgeting is the integration and use of performance information in budgetary decision-making. This information should include the identification of gaps in the relationship between spending and attainment of the SDGs, drawing performance information from monitoring and evaluation systems. The performance information that countries incorporate into their budget programming usually concerns financing and only more rarely results, mainly because the indicators and targets monitored by the systems usually measure output levels and seldom intermediate or final results (ECLAC, 2018a).
There needs to be progress with the development of budgetary mechanisms, techniques and tools that facilitate this linkage, such as multi-year budgets, programme budgeting and budgeting by results, and this process must go hand in hand with capacity-building for those working in the areas of planning, budgeting and evaluation, as well as the development of information systems. This requires political will for countries to embark on reforms to budget systems that incorporate technical elements and guide the necessary process of change, especially as regards the mechanisms and criteria used when negotiating and setting budgets.
(d) Strategies and actions for territorializing the 2030 Agenda
The territorial manifestations of the COVID-19 pandemic, and its economic and social impacts, show the need to move towards a transformation of the current configuration of national spaces, characterized as it is by heavy spatial concentration of population and economic activity and by major inequalities in living conditions in different places within a given country.
To achieve the 2030 Agenda and the SDGs, there needs to be greater awareness of the territorial dimension in order to reverse the concentration of resources and services, particularly in large cities, to the detriment of rural and hard-to-reach territories. The territorial challenges of Latin America and the Caribbean must be addressed on the basis of territorial plans and policies that take an integrated approach to their different dimensions, scales and actors. Considering this, territorialization of the 2030 Agenda would allow a more comprehensive approach to be taken to public policies, facilitating the understanding of the interrelationships between social inclusion, economic development and environmental protection and at the same time promoting intersectoral and multi-stakeholder dialogue that contributes to a collective definition of the priorities of subnational governments.
The Regional Observatory on Planning for Development in Latin America and the Caribbean of the Latin American and Caribbean Institute for Economic and Social Planning (ILPES) has gone some way towards identifying the different methods that countries have used to territorialize the SDGs. To this end, their voluntary national reviews have been consulted, the institutional 2030 Agenda websites created by the countries or the United Nations have been visited, and use has been made of information available on platforms such as Local2030: Localizing the SDGs (created by the United Nations Development Programme (UNDP), the United Nations Human Settlements Programme (UN-Habitat) and the Global Task Force of Local and Regional Governments) and the Sustainable Development Knowledge Platform (created by the United Nations). On the basis of this material, seven territorialization methods implemented by 23 countries in the region were identified: (i) documents with general guidelines; (ii) institutionalization for the mainstreaming, monitoring and implementation of the 2030 Agenda at
18 Argentina, the Bolivarian Republic of Venezuela, Brazil, Chile, Colombia, Costa Rica, the Dominican Republic, Ecuador, El Salvador, Guatemala, Mexico, Panama, Paraguay, Peru, the Plurinational State of Bolivia and Uruguay.

105
Building forward better: action to strengthen the 2030 Agenda for Sustainable Development
IV
subnational levels; (iii) socialization, training or collective dialogue; (iv) diagnosis, monitoring and follow-up; (v) instruments or tools for the incorporation of the 2030 Agenda into local plans; (vi) initiatives promoted by civil society, the private sector and other actors; and (vii) mechanisms to raise awareness of good practices (see map IV.1). In 15 of these countries, two or more methods have been combined.
Map IV.1 Latin America and the Caribbean: Sustainable Development Goal (SDG) territorialization modalities identified, 2019
Countries with more than one SDG territorialization method Countries that have progressed with socialization of the SDGs in territories
No data
Bahamas Jamaica
Dominican Rep.
Paraguay
Uruguay
Ecuador
Mexico
Colombia
Bolivia (Plur. State of)
Chile
Peru
Argentina
Brazil
Cuba
Guatemala Honduras
Suriname
Venezuela (Bol. Rep. of)
El Salvador
Document with guidelines
Socialization, training or dialogue
Institutionalization
Diagnosis, monitoring and follow-up
Instruments or tools
Initiatives by civil society and other stakeholders
Publicization of good practices
Costa Rica
Trinidad and Tobago
Guyana
Grenada
Source: Economic Commission for Latin America and the Caribbean (ECLAC), on the basis of Regional Observatory on Planning for Development in Latin America and the Caribbean [online] https://observatorioplanificacion.cepal.org/en.
(e) Progress with multi-stakeholder participation: open government and the 2030 Agenda
In the context of the 2020 pandemic, open government has provided the countries in the region with tools to address the challenges of the health crisis by means of various instruments, such as open data and accountability portals and investment and public procurement portals. Since 2011, these countries have channelled their efforts into building more open governments by formulating and implementing open government action plans. Their main mechanisms are action commitments that are designed to be implemented within two years. These plans reflect the commitment made by those countries that opted to join the Open Government Partnership. The formulation and subsequent management of open government action plans is an example of how to put into practice the open and participatory governance proposed by the 2030 Agenda.
This model of public management has been important in the region. As of January 2021, there were 57 action plans with a total of 1,156 commitments (see table IV.5). Thirteen of the current plans represent the fourth generation of action plans (Argentina, Brazil, Chile, Colombia, Costa Rica, Dominican Republic,

Economic Commission for Latin America and the Caribbean (ECLAC)
106 IV
El Salvador, Guatemala, Honduras, Mexico, Paraguay, Peru and Uruguay). In the decade over which these plans have been designed and implemented, the countries have progressively opened up their institutional structures, enhancing links with civil society and citizen participation, designing solutions to different public problems jointly with citizens, using open data for innovation and strengthening their mechanisms in pursuit of public integrity and probity.
Table IV.5 Latin America and the Caribbean (countries forming part of the Open Government Partnership): evolution in the production of open government action plans, 2011–January 2021
2011 2012 2013 2014 2015 2016 2017 2018 2019 2020 2021 2022Argentinaa
BrazilChileColombiaCosta Ricaa
Dominican RepublicEcuadorEl SalvadorGuatemalaHondurasJamaica
Sin plan de acción
MexicoPanamaParaguayPeruTrinidad and TobagoUruguay
Entry into the Open Government Partnership First plan Second plan Third plan Fourth plan
Source: Economic Commission for Latin America and the Caribbean (ECLAC), on the basis of Regional Observatory on Planning for Development in Latin America and the Caribbean [online] https://observatorioplanificacion.cepal.org/en [accessed on 21 January 2021] and Open Government Partnership [online] https://www.opengovpartnership.org/ [accessed on 15 February 2021].
a Fourth Plan updated in 2020.
The process of constructing open government action plans and their content has evolved in a number of ways. The third generation of action plans (2016–2019) shows that the countries have started to make efforts to decentralize the co-creation process. Argentina, Chile and Honduras undertook actions to generate arrangements for the co-creation of initiatives at the subnational level. In addition, 8 of the 13 fourth-generation plans show some subnational prioritization with respect to the content of commitments, the process of co-creating the plan, or both.
Another increasingly widespread practice for monitoring and following up implementation of the commitments contained in action plans is the creation of web portals known as “citizen’s dashboards”, which provide detailed information on the state of progress of actions, compliance milestones and the governmental and civil society institutions in charge of carrying out the different commitments.
Figure IV.5 shows the evolution of the number of commitments for each open government pillar of action plans, from the first to the fourth generation of plans. The pillar with the largest number of commitments is access to public information (711), followed by participation and collaboration between actors (528), institutional capacity-building (420) and public integrity and accountability (325). Each

107
Building forward better: action to strengthen the 2030 Agenda for Sustainable Development
IV
pillar has evolved differently, with no clear trend or pattern in common. In general, the number of commitments decreases from the first to the third plans, while the content of commitments in the fourth generation is more precise.
Figure IV.5 Latin America and the Caribbean (countries forming part of the Open Government Partnership): changes in the total number of commitments by open government pillar and action plan generation (first to fourth plans), 2011–January 2021
0
50
100
150
200
250
Access to public information Public integrity and accountability
Participation and collaboration between actors
Enhancement of institutional capabilities
First plan Second plan Third plan Fourth plan
Source: Economic Commission for Latin America and the Caribbean (ECLAC), on the basis of Regional Observatory on Planning for Development in Latin America and the Caribbean [online] https://observatorioplanificacion.cepal.org/en [accessed on 21 January 2021] and Open Government Partnership [online] https://www.opengovpartnership.org/ [accessed on 21 January 2021].
There are at least three approaches to linking open government action plans to the 2030 Agenda (ECLAC, 2021c): (i) recognizing a shared vision and principles, (ii) establishing priority areas for the co-creation of commitments and (iii) directly linking action commitments to the SDGs and their targets. Using the first approach, some countries have explicitly recognized the overlap between the 2030 Agenda and their national open government policies in terms of vision and principles, highlighting the contribution of open government action plans to the attainment of SDG 16 (Promote just, peaceful and inclusive societies) and the way these plans help to build the governance model proposed by the 2030 Agenda. With the second approach, action commitments are the result of a multi-stage process in which actors from all sectors (academia, public institutions, civil society organizations, citizens, etc.) decide together what actions they will take to open up government, institutions and State authorities. With the third approach, lastly, some countries have identified links between each action commitment in the plan and the Goals and targets of the 2030 Agenda as part of the co-creation process.
Many innovations and reforms linked to the promotion of open government occur at subnational territorial scales. This is where governments can collaborate and engage in dialogue with citizens most directly and closely, and the creation of spaces and mechanisms for participation, transparency and accountability allows the inhabitants of territories to have a greater impact on the public policies, programmes and projects that affect their daily lives (ECLAC, 2018a). In 2016, the Open Government Partnership created a pilot project with the aim of bringing subnational governments into global efforts to promote open government and strengthen democracies. Of the 20 participants in the global pilot project, 5 are Latin American subnational governments: Jalisco (Mexico), Buenos Aires (Argentina),

Economic Commission for Latin America and the Caribbean (ECLAC)
108 IV
Nariño (Colombia), La Libertad (Peru) and São Paulo (Brazil), while the municipality of Renca (Chile) has formulated its first open government action plan (2019–2021).
3. Voluntary national and local reviews are on the increase
(a) Voluntary national reviews
In adopting the resolution “Transforming our world: the 2030 Agenda for Sustainable Development in 2015”, the United Nations General Assembly called on Member States to undertake “regular and inclusive reviews of progress at the national and sub-national levels which are country-led and country-driven” (United Nations, 2015). Between 2016 and 2020, 24 of the 33 countries in Latin America and the Caribbean reported on their progress in taking ownership of and implementing the 2030 Agenda and its 17 SDGs by submitting their voluntary national reviews to the High-Level Political Forum on Sustainable Development, and four more have committed to doing so in 2021 (see table IV.6).
Table IV.6 Latin America and the Caribbean: voluntary national reviews, 2016–2021
2016 2017a 2018 2019 2020 2021b
Colombia Argentina Bahamas Chilec Argentinac Antigua and BarbudaMexico Belize Colombiac Guatemalac Barbados Bahamasc
Venezuela (Bolivarian Republic of)
Brazil Dominican Republic Guyana Bolivia (Plurinational State of)
EcuadorChile Jamaica Saint Lucia Colombiad
Costa Rica Mexicoc Costa Ricac CubaEl Salvador Paraguay Ecuadorc Dominican Republicc
Guatemalad
Honduras Hondurasc Mexicod
Guatemala Uruguayc Panamac NicaraguaPanama Peruc Paraguayc
Peru Saint Vincent and the Grenadines
Uruguay Trinidad and Tobago Uruguayd
Annual total 3 11 8 4 9 11Total reviews submitted
3 14 22 26 35 46
Total countries 3 14 19 21 24 28Total countries as a proportion of the 33 in the region(percentages)
9 42 58 64 73 85
Total voluntary national reviews as a proportion of the global total(percentages)
14 (of 22) 26 (of 43) 17 (of 46) 9 (of 47) 19 (of 47) 26 (of 43)
Total countries that have submitted more than one review
3 5 11 14
Source: Economic Commission for Latin America and the Caribbean (ECLAC).a In 2017, Aruba, Curaçao and Sint Maarten (Netherlands) reported on their progress in the voluntary national review of the Netherlands.b Country commitment (the review will be carried out in July 2021).c Presenting for the second time.d Presenting for the third time.

109
Building forward better: action to strengthen the 2030 Agenda for Sustainable Development
IV
Of the 24 countries in the region that had submitted at least one voluntary national review by 2020, 11 had done so more than once (Argentina, Chile, Colombia, Costa Rica, Ecuador, Guatemala, Honduras, Mexico, Panama, Peru and Uruguay). In 2021, new reviews are expected from 11 countries,19 with three of them (the Bahamas, the Dominican Republic and Paraguay) submitting their second voluntary national review and four (Colombia, Guatemala, Mexico and Uruguay) their third. By 2021, therefore, one third of all the countries in the world that will have submitted their reviews to the international community for the third time (4 out of 12) will be from the region.20 The five countries in the region that will not have submitted their voluntary national reviews to the High-Level Political Forum on Sustainable Development between 2016 and 2021 belong to the Caribbean subregion. South-South cooperation and technical assistance should play an ever more preponderant role in this context, to ensure that “no one is left behind” (see map IV.2).
Map IV.2 Latin America and the Caribbean: voluntary national reviews, 2016–2021
CUBA
Mexico
Ecuador
Colombia
Brazil
GuyanaVenezuela
(Rep. Bol. de)
Bolivia(Plur. State of)
Suriname
Peru
Paraguay
UruguayArgentinaChile
El Salvador
Costa RicaPanama French Guiana
GuatemalaBelize
Honduras
Nicaragua
Trinidad and Tobago
JamaicaHaiti
Dominican Rep.
Puerto Rico Anguilla
Antigua and BarbudaSint Maarten
Saint Kittsand Nevis
Montserrat
Saint Vincentand the Granadines
Grenada
BarbadosSaint Lucia
DominicaGuadeloupe
Martinique
Cuba
Aruba
Curaçao
Bahamas
Cayman Islands
Turks and Caicos Islands
British Virgin Islands
United StatesVirgin Islands
First voluntary national reviewSecond voluntary national reviewThird voluntary national review
Source: Economic Commission for Latin America and the Caribbean (ECLAC).
19 According to statements made by the countries to the Secretariat of the High-Level Political Forum on Sustainable Development as of January 2021 and confirmed by the President of the Economic and Social Council (ECOSOC).
20 A list of countries submitting their voluntary national reviews to the High-Level Political Forum can be found on the Sustainable Development Knowledge Platform [online] https://sustainabledevelopment.un.org/vnrs/.

Economic Commission for Latin America and the Caribbean (ECLAC)
110 IV
The countries of Latin America and the Caribbean have taken ownership of the 2030 Agenda for Sustainable Development as a State commitment. A number of those that have produced their voluntary national reviews more than once have done so under the leadership of different governments. Table IV.7 lists the countries in the region that have reported more than once and the year in which presidential elections took place. Nine countries will present or will have presented their voluntary national reviews to the High-Level Political Forum on Sustainable Development after a presidential election: Argentina (2020), Chile (2019), Colombia (2021), Costa Rica (2020), the Dominican Republic (2021), Guatemala (2021), Panama (2020), Paraguay (2021) and Uruguay (2021). In particular, Chile (2017), Colombia (2018), Guatemala (2019), Honduras (2017), Mexico (2018) and Paraguay (2018) submitted their voluntary national reviews during the election year, thus leaving an accounting of national efforts regarding the implementation of the 2030 Agenda and its 17 SDGs for the incoming administration.
Table IV.7 Latin America and the Caribbean: voluntary national reviews and presidential elections, 2016–2021
2016 2017 2018 2019 2020 2021Argentina Presidential electionBahamas Presidential electionChile Presidential election Presidential electionColombia Presidential electionCosta Rica Presidential electionDominican Republic Presidential election
Ecuador Presidential election Presidential electionGuatemala Presidential electionHonduras Presidential election Presidential electionMexico Presidential electionPanama Presidential electionParaguay Presidential electionPeru Presidential election Presidential electionUruguay Presidential election
First time Second time Third time
Source: Economic Commission for Latin America and the Caribbean (ECLAC).
The 35 voluntary national reviews submitted by countries in the region between 2016 and 2020 provide a wealth of information, good practices and lessons learned in the implementation of the 2030 Agenda. Each review is different, as each country is reporting on its progress, priorities and national experience at a specific point in time. As they are voluntary, the reviews are not a monitoring and evaluation exercise in the same way as an accountability exercise vis-à-vis a national audit body would be. Therefore, the nature of each review depends on the specific message that each country chooses to present to the international community in a given year. Because they are not homogenous, it is difficult to make comparative analyses between them.
However, the commitment of the region’s governments and the sustained effort they have made, in collaboration with multiple stakeholders, to report their progress on the 2030 Agenda and its 17 SDGs send a clear message about ownership of the 2030 Agenda in the region and allows each country’s trajectory to be tracked over time, especially that of those reporting more than once. Within countries, the reviews provide new administrations with clear guidance on national efforts regarding the 2030 Agenda, and at the regional level, as the 2030 Agenda itself states,21 voluntary national reviews offer opportunities for peer learning and the sharing of experiences with the implementation, follow-up and monitoring of
21 “Follow-up and review at the regional and sub-regional levels can, as appropriate, provide useful opportunities for peer learning, including through voluntary reviews, sharing of best practices and discussion on shared targets” (United Nations, 2015).

111
Building forward better: action to strengthen the 2030 Agenda for Sustainable Development
IV
the 2030 Agenda that have worked in other contexts. They also contribute to joint reflection and action to address challenges that transcend borders, such as climate change (SDG 13), international trade and finance (SDG 17) and public health (SDG 3), among others.
(b) Voluntary local reviews
Since 2017, voluntary local reviews have also been produced in Latin America and the Caribbean as an expression of the commitment of different stakeholders at the subnational and local level to the 2030 Agenda. These innovative exercises are a tool for taking ownership of the 2030 Agenda at the subnational level and complement national monitoring and review efforts. At both the global and regional levels, these reports have aroused greater and greater interest in the contribution of subnational and local actors in achieving the 2030 Agenda. In the region, 10 local and subnational governments have carried out this exercise in Argentina, Brazil, Mexico, the Plurinational State of Bolivia and Uruguay (United Nations, 2020) (see figure IV.6).
Figure IV.6 Latin America and the Caribbean and the world: voluntary local reviews, 2016–2020(Number of reviews)
0
2
4
6
8
10
12
2016 2017 2018 2019 2020
Latin America and the CaribbeanWorld
Source: Economic Commission for Latin America and the Caribbean (ECLAC).
4. ECLAC subsidiary bodies and intergovernmental meetings are furthering the 2030 Agenda
In 2020, the subsidiary bodies working on the 2030 Agenda adapted to the crisis caused by the COVID-19 pandemic and its economic and social effects by switching from face-to-face to virtual meetings in order to keep a channel of dialogue open with sectoral authorities and to make participation as broad and active as possible. Among those invited to share lessons learned, share experiences and identify areas for mutual technical assistance and international cooperation on urgent issues and aspects identified by governments, as is traditional, have been high-level authorities, delegates from the countries of the region, representatives

Economic Commission for Latin America and the Caribbean (ECLAC)
112 IV
of United Nations agencies, funds and programmes, United Nations Resident Coordinators, international experts, academics and representatives of the private sector and civil society, among others.22
Discussions in the framework of the Caribbean Development and Cooperation Committee (CDCC) in 2020 focused on the way the pandemic has exacerbated the problems of the subregion’s middle-income countries, which are heavily indebted and exposed to natural disasters and climate change. The near-total contraction of the main business sectors, including tourism and related services, has increased pressure on the debt and liquidity of these economies, making it difficult to implement the countercyclical measures needed to reduce uncertainty and undermining their ability to respond effectively to the impact of the pandemic. The importance of adopting urgent solutions to support financing for the development of nations in the subregion in the era of COVID-19 and beyond was underscored at the CDCC meetings in 2020. In this context, ECLAC has made proposals such as, for example, a special dispensation for the Caribbean so it can access concessional funding, debt relief and an enhanced Debt Service Suspension Initiative; the issuance and reallocation of special drawing rights (SDRs); negotiations with bilateral creditors, including the Paris Club; the establishment of a Caribbean Resilience Fund; and the involvement of the Green Climate Fund (GCF) in the ECLAC Debt for Climate Adaptation Swap Initiative.
In 2018, the Committee on South-South Cooperation endorsed the project of the Network for the implementation of the 2030 Agenda and follow-up to the Sustainable Development Goals in Latin America and the Caribbean aimed at strengthening the institutional and technical capacities of governments in the region that are establishing or seeking to establish national mechanisms for the implementation of the 2030 Agenda and follow-up to the SDGs. In 2019, Network meetings were held to analyse the statistical, institutional and South-South cooperation capacities of the region’s countries and to identify strengths and gaps on which countries could cooperate in order to enhance the institutional and technical capacities of the region’s governments. Setting out from this analysis, the Network drafted a work programme that will start to be implemented in 2021. The Committee on South-South Cooperation is of the view that the importance of South-South and triangular cooperation for the region needs to be considered in the current pandemic context, as well as in the recovery phase. This is because global and local challenges will increasingly require greater international cooperation reoriented towards overcoming their severe economic and social effects.
The meeting of the Executive Committee of the Conference on Science, Innovation and Information and Communications Technologies held in July 2020 addressed the challenges arising within the framework of the COVID-19 crisis with the objective of strengthening regional integration of the health industry and digital ecosystems. Three areas of action were highlighted: (i) the coordination of research and development (R&D) efforts, (ii) the reduction of gaps in access to and use of digital platforms and (iii) the strengthening of the health industry at national and regional level. The Conference on Science, Innovation and Information and Communications Technologies is working with member countries to foster development of the capacities needed for health-care autonomy in the region through industrial policy measures, strategic integration partnerships and the creation of exchange networks for those engaged in R&D.
The 2020 edition of the Regional Conference on Population and Development in Latin America and the Caribbean held virtual dialogues to analyse the sociodemographic situation in the countries of the region in the context of the crisis and its possible short-, medium- and long-term impacts on the most
22 The work of ECLAC subsidiary bodies and intergovernmental meetings takes into account the contributions of United Nations agencies, funds and programmes. For example, the Regional Conference on Women in Latin America and the Caribbean has been jointly organized by the United Nations Entity for Gender Equality and the Empowerment of Women (UN-Women), as the Regional Conference on Population and Development in Latin America and the Caribbean has been by the United Nations Population Fund (UNFPA). In addition, the Regional Conference on Social Development in Latin America and the Caribbean is held in coordination with the UNDP Forum of Ministers for Social Development in Latin America and the Caribbean.
113
Building forward better: action to strengthen the 2030 Agenda for Sustainable Development
IV
vulnerable population groups, in the light of the priority measures of the Montevideo Consensus on Population and Development and the Goals and targets of the 2030 Agenda. The dialogues provided an opportunity to share information, experiences and lessons learned on the main difficulties and challenges faced by governments in their efforts to mitigate the effects of the health crisis on the population, to share the different initiatives and best practices implemented, and to promote mechanisms for cooperation between countries that can provide coordinated responses to the crisis.
The third meeting of the Regional Conference on Social Development in Latin America and the Caribbean, held in October 2019, adopted the Regional Agenda for Inclusive Social Development, a technical and political instrument aimed at implementing the social dimension of the 2030 Agenda. In 2020, the Conference carried out important activities aimed at implementing the 2030 Agenda and providing joint spaces for discussion on the social impact of the pandemic in the region. In this framework, two digital collaboration tools were created: (i) the Social Development and COVID-19 in Latin America and the Caribbean portal,23 designed to provide a space for discussing social policies to address the pandemic, with a focus on non-contributory social protection initiatives and the dissemination of information on the virtual meetings held as part of the Conference; and (ii) a virtual social development community to facilitate the joint work of the countries in the implementation of the pillars of the Regional Agenda for Inclusive Social Development.24
The fourteenth Regional Conference on Women in Latin America and the Caribbean, held in January 2020, addressed the subject of women’s autonomy in changing economic scenarios and adopted the Santiago Commitment, whereby the countries undertook to take all necessary measures to accelerate the effective implementation of the Beijing Platform for Action and the Regional Gender Agenda, strengthen gender institutions and architecture and mainstream gender at the different levels of the State. In particular, the Santiago Commitment includes agreements to eradicate gender-based violence, promote the care economy through the design and implementation of comprehensive care systems, implement countercyclical policies sensitive to gender inequalities in order to mitigate the effects of crises on women’s lives, reduce the wage gap, promote women’s labour participation in the areas of science, technology, engineering and mathematics, and increase their representation in decision-making processes in order to achieve parity democracy. At the fourteenth Conference, government representatives highlighted the importance of taking all necessary measures to end gender-based violence against women and girls, with special attention to the areas of prevention and access to justice at times of lockdown and pandemic.
The seventeenth meeting of the Regional Council for Planning of the Latin American and Caribbean Institute for Economic and Social Planning (ILPES), held in August 2019, stated that fulfilling the 2030 Agenda meant rethinking the development model, carrying out long-term planning, giving priority to territorialization, achieving broad citizen participation and strengthening multilateralism. It also argued that territorial issues could not be resolved solely through territorial development policies and, consequently, recommended moving towards the construction of an ecosystem of policies for territorial development by identifying all public policies affecting it. In 2020, the twenty-eighth meeting of its Presiding Officers examined the scope and challenges of planning for the implementation of the 2030 Agenda given the impact of COVID-19 and concluded that the State had a more important role to play than ever in leading response and recovery processes in the face of the crisis, and that comprehensive, flexible and open planning was therefore essential to anticipate events, strengthen citizen participation and collaboration and public leadership, coordinate different sectors and actors and enhance territorial intelligence.
23 See [online] https://dds.cepal.org/observatorio/socialcovid19/en/.24 See [online] https://comunidades.cepal.org/desarrollosocial/en.
Economic Commission for Latin America and the Caribbean (ECLAC)
114 IV
In 2020, against the backdrop of the pandemic, the Knowledge Transfer Network of the Statistical Conference of the Americas held more than a dozen virtual meetings to share experiences and recommendations concerning the challenges faced and solutions adopted by countries in their efforts to continue producing statistics during the pandemic; these meetings acknowledged the role of official statistics in the development of public policies aimed at mitigating the effects of the health emergency and in the post-pandemic economic recovery. The Statistical Conference of the Americas has encouraged agencies producing official statistics to build on the good practices implemented during this period in order to strengthen statistical operations and the quality of official statistics. It has also warned how important it is for countries to secure the resources needed for the continuity of statistical production and, in particular, to ensure proper implementation of the 2020 round of population censuses, given how crucial they are for public policies and for other statistical operations. The Conference encouraged countries to use the Regional Knowledge Management Platform for the Sustainable Development Goals in Latin America and the Caribbean (SDG Gateway) analysed below.
Between 2018 and 2020, the Regional Intergovernmental Conference on Ageing and the Rights of Older Persons in Latin America and the Caribbean held expert meetings, forums and international seminars on public policies related to older persons in the framework of the 2030 Agenda for Sustainable Development. In 2020, in the context of the pandemic, it held virtual dialogues with the aim of sharing information, lessons learned and experiences relating to the main difficulties and challenges that governments are facing as they seek to mitigate the effects of the health crisis and meet the needs and requirements of older persons.
At the seventh Ministerial Conference on the Information Society in Latin America and the Caribbean, held in November 2020, the countries affirmed that digitalization was set to play a key role in the reconstruction and recovery of Latin America and the Caribbean. At the event, the countries adopted the Digital Agenda for Latin America and the Caribbean (eLAC2022), which identifies 8 areas of action and 39 specific goals for implementation in the next two years, and also includes a section on the fight against the pandemic and economic recovery and reactivation. Although digital technologies have been essential tools for social and economic resilience in the face of the pandemic, problems of access, use and affordability were also exposed during the crisis. During these months of pandemic, the region has witnessed a sharp acceleration of digitalization and digital transformation; for this to be inclusive and sustainable, however, there is a need to universalize broadband access, boost productive digital transformation, promote trust and security, strengthen regional digital cooperation and pursue the creation of a digital welfare state.
2020 marked the second anniversary of the adoption of the Regional Agreement on Access to Information, Public Participation and Justice in Environmental Matters in Latin America and the Caribbean (Escazú Agreement). The objective of what is the first binding environmental treaty for the countries of Latin America and the Caribbean is to ensure the full and effective implementation of rights of access to environmental information, public participation in environmental decision-making, access to environmental justice and the creation and strengthening of capabilities and cooperation, contributing to the protection of the right of every person of present and future generations to live in a healthy environment and to sustainable development. Besides being an agreement that confirms the value of regional multilateralism and reflects the ambitions, priorities and specificities of the region, it is an essential instrument for the implementation of the 2030 Agenda for Sustainable Development. The access rights enshrined in the Escazú Agreement are at the heart of the 2030 Agenda and permeate and are manifested in all the SDGs.
The General Assembly of Ministers and High-level Authorities on Housing and Urban Development in Latin America and the Caribbean (MINURVI) is connected through the New Urban Agenda to the 2030 Agenda for Sustainable Development, and in particular SDG 11 dealing with sustainable cities

115
Building forward better: action to strengthen the 2030 Agenda for Sustainable Development
IV
and communities, as it takes the position that well-planned and managed urbanization can be a very useful tool for achieving sustainable development. In 2019, MINURVI supported the creation of a regional urban observatory (Latin American and Caribbean Urban and Cities Platform) to follow up the New Urban Agenda in a manner consistent with other regional and global initiatives of a similar nature. The Platform was designed as a resource for training and for the identification of methodologies and indicators aimed at setting specific targets for the region and securing the cooperation of the national statistics offices of each member State. MINURVI continued its work with the Cities Platform during 2020. The pandemic led it to adopt virtual methods to continue with its work, and it included the effects of COVID-19 on the region’s cities among the topics to be dealt with.
At the thirty-fifth session of the ECLAC Committee of the Whole, held in 2020, the representatives of Latin American and Caribbean countries called for a paradigm shift in international financing so as to respond immediately to the effects of the pandemic and achieve sustainable development. The meeting identified the region’s priorities when it came to addressing the most pressing challenges related to the pandemic and emphasized that the crisis was an opportunity to work towards the transformational changes needed for progress on the region’s development agendas.
ECLAC held its session virtually for the first time in 2020, and member countries endorsed its proposals for a transformed style of development in the region post-COVID-19. These proposals were presented in the document Building a New Future: Transformative Recovery with Equality and Sustainability, which calls for a new future to be built in the region through a transformative recovery in development, with greater equality and sustainability (see ECLAC, 2020c). This requires social and political compacts to ensure that the Goals become State policies, with the participation of communities, businesses, women and youth. In turn, new forms of global governance are needed to provide global public goods, such as universal health care (coronavirus vaccines for all), climate security and atmospheric protection, financial stability, peace and the protection of human rights. Multilateralism, solidarity and international cooperation, which must be at the heart of what is done, were highlighted as the only real way out of this unprecedented crisis. The 2030 Agenda goal of leaving no one behind must continue to inspire the decisions taken by countries in the implementation of the SDGs.
At the session, the foreign ministers of the region’s countries adopted the Political Declaration on a Sustainable, Inclusive and Resilient Recovery in Latin America and the Caribbean, which reflects a broad consensus that the pandemic has exposed the inequalities and fragilities of the region’s countries, and that the international community must take account of the specific problems of the region’s middle-income countries and the small island developing States (SIDS) of the Caribbean.
5. Reform of the United Nations development system and implementation of the 2030 Agenda
The reform of the United Nations development system (UNDS) involves far-reaching changes to the way the system works and its efforts to help countries achieve the SDGs. The reform started in 2018 and has a mandate from the United Nations General Assembly in the form of resolution 72/279, reflecting Secretary-General António Guterres’s vision and proposals for repositioning the system and reviewing the regional architecture to this end (see United Nations, 2018 and 2020b). The Secretary-General’s five recommendations guiding the new positioning of the United Nations development system are as follows (United Nations, 2019):
I. Creation of United Nations regional collaborative platforms that would absorb existing duplicative coordination mechanisms and foster collaboration on sustainable development among United Nations development system entities operating at the regional level;

Economic Commission for Latin America and the Caribbean (ECLAC)
116 IV
II. Establishment of strong knowledge management hubs in each region by pooling policy expertise currently scattered across various entities;
III. Enhanced transparency and results-based management at the regional level, including through annual reporting on United Nations system-wide results at the regional level in support of the 2030 Agenda;
IV. Launch of a region-by-region change management process to consolidate existing capacities with regard to data and statistics;
V. Identification of administrative services that could be provided more efficiently to regional offices through common back offices (e.g. human resources, procurement and common premises), similar to efforts that have been made at the country level.
In 2020, the quadrennial comprehensive policy review of operational activities for development of the United Nation system saw Member States adopt ambitious reforms involving a new positioning of the United Nations development system, which is being operationalized. The Regional Collaborative Platform for Latin America and the Caribbean was created, just as new similar collaborative platforms were created in other regions, with the intention that this should be the main internal mechanism for the joint work of the United Nations development system at the regional level. The new platforms, which are results-oriented and driven by the demands and priorities of member countries, replace the previous United Nations coordination mechanisms, in particular the regional United Nations Sustainable Development Groups (UNSDGs) and the regional coordination mechanisms (RCMs).
The five new regional collaborative platforms for Africa, Asia and the Pacific, the Arab States, Europe and Central Asia and Latin America and the Caribbean aim to provide strategic direction for decision-making regarding each region’s activities and common regional, subregional or cross-border priorities, and to ensure coordination, collaboration and better use of the experience, expertise and assets of all United Nations entities dealing with development at the regional level so as to provide Member States and United Nations country teams with enhanced support in implementing the 2030 Agenda and achieving the SDGs.
To ensure consistency among the five regions, the regional collaborative platforms have common roles, responsibilities and functions; however, each mechanism has flexibility to take specific regional characteristics into account. Among their aspects in common, these platforms have 12 main functions (see box IV.1) whose purpose is to foster collaboration among United Nations entities operating at the regional and subregional levels and to promote joint actions to deal with gaps in SDG implementation, including those identified through the regional sustainable development forums and the High-Level Political Forum on Sustainable Development, among others.
The five regional collaborative platforms will bring leadership, accountability and clarity to the goals, activities and outcomes of the system as a whole in the regions, so as to enhance the support provided to countries and to the United Nations country teams (United Nations, 2020b).
With regard to working arrangements and structures, it may be mentioned that the regional collaborative platforms are chaired by the Deputy Secretary-General of the United Nations, with the Executive Secretary of the relevant regional commission and the relevant UNDP Regional Director as Vice-Chairs.
The Regional Collaborative Platform for Latin America and the Caribbean was formally established in November 2020; it is chaired by the Deputy Secretary-General of the United Nations and the Executive Secretary of ECLAC and the UNDP Regional Director for Latin America and the Caribbean are Vice-Chairs. It comprises all regional directors of United Nations agencies, funds and programmes, as well as the Regional Director of the United Nations Development Coordination Office. A joint secretariat between ECLAC, UNDP and the United Nations Development Coordination Office was also established to support the Vice-Chairs and members of the platform in their work.

117
Building forward better: action to strengthen the 2030 Agenda for Sustainable Development
IV
Box IV.1 The functions of the regional collaborative platforms
The regional collaborative platforms will be focused on the following 12 key functions, as set out by the internal review team on management reform, coordinated by the the Secretary-General’s Special Advisor on Reforms: 1. Foster collaboration on sustainable development across United Nations development system entities operating
at the regional and subregional levels, including by promoting and facilitating time-bound issue-based coalitions to respond to regional, subregional or cross-border or common development issues.
2. Promote joint actions to address gaps in SDG implementation, including those identified through the regional forums on sustainable development and the High-Level Political Forum on Sustainable Development.
3. Discuss major regional strategic developments and issues and pathways to addressing them, and align regional and global agendas accordingly.
4. Promote regional coherence with the policies agreed by the High-Level Committee on Programmes of the United Nations System Chief Executives Board for Coordination, the High-Level Committee on Management and the United Nations Sustainable Development Group.
5. Promote inter-agency joint actions, strategies, coalitions, and exchange of staff and expertise across entities, in support of regional integration and collaboration, regional and subregional initiatives and programmes, and transboundary and common issues.
6. Foster inter-agency cooperation and collaboration on sustainable development to ensure or improve implementation of internationally and regionally agreed frameworks, norms and standards.
7. Promote coherent regional policy dialogues and responses to challenges related to SDG achievement (regional public goods, agreements, norms, visions and strategies as well as common policy positions).
8. Facilitate demand-driven integrated policy advice, normative support and technical capacity to regional and subregional organizations, Resident Coordinators and United Nations country teams, including the Common Country Analysis and the United Nations Sustainable Development Cooperation Framework, and align and strengthen entities’ country programme documents or strategic notes as relevant.
9. Promote a region-by-region change management process that will seek to consolidate existing capacities for data and statistics, as well as other relevant analytical functions that may be currently duplicative.
10. Coordinate and transparently share policy-relevant tools and knowledge products. 11. Facilitate development of regional common back office plans and effective and efficient management at the regional
level, on the basis of the global project document, but with maximum flexibility to reflect regional specificities and progress made in the regions.
12. Provide criteria and guidelines to prepare the Regional UNDS System-Wide Results Report, which will be prepared and presented by each region.
Source: United Nations, “Regional Collaborative Platforms (RCP): functioning and working arrangements”, Executive Office of the Secretary-General, November 2020.
The Regional Collaborative Platform for Latin America and the Caribbean is structured around five issue-based coalitions inherited from one of the previous regional coordination mechanisms (the United Nations Sustainable Development Group for Latin America and the Caribbean), which are currently being updated and revised. They are intended to facilitate inter-agency work in the region on priority issues requiring a joint approach to benefit from synergies between different entities in the United Nations development system. The issues on which these coalitions are based are: (i) climate change and resilience; (ii) equitable growth; (iii) crime and violence; (iv) governance and institutions; and (v) human mobility. There are also two cross-cutting working groups: one on youth and the other on gender equality and the empowerment of women and girls. One on financing for development is also being proposed. ECLAC co-chairs two of the above-mentioned issue-based coalitions (equitable growth, jointly with UNDP and the International Labour Organization (ILO), and human mobility, jointly with the Office of the United Nations High Commissioner for Refugees (UNHCR) and the International Organization for Migration (IOM)) and, together with the other United Nations entities in the region, is a member of other groups such as those on climate change and resilience, governance and institutions, and youth. A consultation among member States in the region on the issue-based coalitions will be held as part of the fourth meeting of the Forum of the Countries of Latin America and the Caribbean

Economic Commission for Latin America and the Caribbean (ECLAC)
118 IV
on Sustainable Development to seek their views on the overall priority topics that are being covered before they are deemed to have been finalized in the new structure.
In addition, the Regional Collaborative Platform includes groups and mechanisms aimed at facilitating the implementation of the Secretary-General’s five recommendations: (i) the regional operations management teams, whose role is to support coordination strategies for administrative and recruitment issues at the regional level; (ii) the Peer Support Group, whose function is to ensure the quality of the common country assessments and the United Nations Sustainable Development Cooperation Framework, which are the two strategic documents guiding the joint work of the Resident Coordinators and the United Nations country teams; (iii) the Partnership and Communications Working Group, whose role is to strengthen inter-agency cooperation and make the work of the Regional Collaborative Platform more visible; (iv) the SDG Data and Statistics Group, which has a mandate to develop and strengthen statistical capacities and data on the SDGs; and (v) the Knowledge Management Hub Steering Committee, whose objectives and operations are presented in part 6 of this section.
The Regional Collaborative Platform also benefits from other working and collaboration methods successfully employed by entities of the United Nations development system in the region that are not explicitly reflected in its current structure. They include some implemented in 2020, such as the collaboration between ECLAC and different United Nations entities on the joint organization of regional intergovernmental conferences (the Regional Conference on Women in Latin America and the Caribbean, the Regional Conference on Population and Development in Latin America and the Caribbean and the Regional Conference on Social Development in Latin America and the Caribbean, with the United Nations Entity for Gender Equality and the Empowerment of Women (UN-Women), the United Nations Population Fund (UNFPA) and UNDP, respectively) and the Comprehensive Development Plan for El Salvador, Guatemala, Honduras and south and southeast Mexico, coordinated by the Executive Secretary of ECLAC as Chair of the Special Coordination Mechanism to support implementation of the United Nations Comprehensive Development Plan of the Northern Countries of Central America and Mexico. The initiative has benefited from constant inter-agency consultation and support from national authorities and contributions from a number of entities, in particular 19 United Nations agencies, funds and programmes (Office of the United Nations High Commissioner for Refugees (UNHCR), Office of the United Nations High Commissioner for Human Rights (OHCHR), International Labour Organization (ILO), International Fund for Agricultural Development (IFAD), United Nations Entity for Gender Equality and the Empowerment of Women (UN-Women), United Nations Children’s Fund (UNICEF), Food and Agriculture Organization of the United Nations (FAO), Pan American Health Organization (PAHO), Joint United Nations Programme on HIV/AIDS (UNAIDS), United Nations Environment Programme (UNEP), United Nations Industrial Development Organization (UNIDO), United Nations Development Programme (UNDP), United Nations Office for Project Services (UNOPS), International Organization for Migration (IOM), United Nations Human Settlements Programme (UN-Habitat), United Nations Office on Drugs and Crime (UNODC), United Nations Educational, Scientific and Cultural Organization (UNESCO), United Nations Office for Disaster Risk Reduction (UNDRR) and World Food Programme (WFP)), the United Nations Development Coordination Office and the Resident Coordinators in the four countries covered by the Comprehensive Development Plan.
Another noteworthy initiative is the COVID-19 Observatory in Latin America and the Caribbean, whose mission is to provide information and analysis on the economic and social impacts of the pandemic, in addition to monitoring the evolution of the crisis and the short-, medium- and long-term measures adopted by the governments of the 33 countries in the region. It is a regional communication platform designed to disseminate analyses of the economic and social effects, at both national and regional level, on the situation of health systems, the structure of the labour market, employment, education, gender equality, industry, trade and macroeconomic policy, and more recently on access to vaccines. The COVID-19

119
Building forward better: action to strengthen the 2030 Agenda for Sustainable Development
IV
Observatory is coordinated by ECLAC, with the support of subregional headquarters and national offices, the United Nations Resident Coordinators and UN-Women. Another example of successful collaboration has been the damage and loss assessments (DaLAs) carried out after the disasters caused by hurricanes Eta and Iota in Honduras and Guatemala, in order for these to serve as inputs for recovery and reconstruction plans. These assessments are carried out jointly with the Resident Coordinators’ offices in these countries, different United Nations entities (such as FAO, UNHCR, ILO, IOM, UN-Women, PAHO, UNDP, UNESCO, UNFPA, UNICEF, UNOPS and WFP), the Inter-American Development Bank (IDB), the World Bank and the Central American Bank for Economic Integration (CABEI).
Once a year, this Regional Collaborative Platform has to notify member countries of its activities and results in a regional results report. In particular, the report, which will be presented during the fourth meeting of the Forum of Latin American and Caribbean Countries on Sustainable Development, will focus on the collective achievements of the United Nations development system at the regional level that have contributed to the advancement of the 2030 Agenda and the SDGs, along with other regional development agendas, goals and priorities. The document will also serve to inform the Economic and Social Council (ECOSOC) of the joint results of the United Nations development system at the regional level and will be made public on the websites of the United Nations development system entities’ platforms and on the global UNSDG website.
The Regional Collaborative Platform for Latin America and the Caribbean has developed a work plan for 2021 that has been endorsed by all its members. In addition, it has held four meetings with all its members in a short period, as well as one with all the United Nations Resident Coordinators in the region and two of a technical nature with the focal points of the issue-based coalitions and working groups. This effort is making it possible to continue with the reforms to respond to the current needs and new demands of the countries as they confront a crisis unprecedented in the history of the region, and one which has lasted longer than initially expected.
6. A space for sharing knowledge: the Regional Knowledge Management Platform for the Sustainable Development Goals in Latin America and the Caribbean (SDG Gateway)
In the context of the 2030 Agenda for Sustainable Development, the reform of the United Nations set in motion by the Secretary-General has identified support for member countries as they strive towards the proposed 2030 Goals, through collaboration and integration of all possible capacities and efforts at the global, regional and national levels, as a central objective of the United Nations development pillar.
In this spirit, the United Nations in Latin America and the Caribbean is making the Regional Knowledge Management Platform for the Sustainable Development Goals in Latin America and the Caribbean available to Member States, their governments, academia, civil society organizations and the general public.25 It is a virtual space for communicating and sharing knowledge, designed to showcase the experiences, actions and information resources available in the region as part of the support elements for implementing the 2030 Agenda and monitoring the SDGs.
One of the main functions of ECLAC is to prepare and disseminate analyses, diagnoses and situation reports for the region as a whole in all areas of development. During the period of the Millennium Summit of the United Nations, ECLAC produced regional follow-up and progress reports on the efforts of the countries of the region to achieve the Millennium Development Goals (MDGs). Within this framework, ECLAC developed a website for the statistical monitoring of the MDGs and made available to users
25 See [online] https://agenda2030lac.org/en.

Economic Commission for Latin America and the Caribbean (ECLAC)
120 IV
documentation on the institutional aspects surrounding global and regional statistical mechanisms, databases, dynamic online graphic solutions, regional and national profiles, statistical infographics and measures of progress towards the millennium targets, among other things. In addition, ECLAC is the United Nations agency with the largest and most comprehensive repository of regionally comparable statistics and indicators for the Latin American and Caribbean countries, with expertise in online dissemination using appropriate statistical solutions and tools.26
These two elements, together with the natural role of the regional commissions as coordinating hubs for the efforts of the United Nations system to promote the sustainable development of Member States, and given the need for a web-based solution that could provide an account of the region’s progress towards the SDGs, made ECLAC the right place for the development of a mechanism with these characteristics that would contribute to the description and knowledge of the degree of progress being made towards the implementation of the 2030 Agenda and the attainment of its Goals.
Once work had begun on the design of a web-based solution, the Secretary-General’s recommendations on restructuring United Nations regional assets in support of the 2030 Agenda as part of the reform of the United Nations development pillar were presented in April 2019. These recommendations include an explicit reference to the need to develop regional knowledge management platforms that meet the national needs arising from the 2030 Agenda, prompting consideration of a possible comprehensive strategic repositioning of this mechanism to serve these purposes.
In consideration of the Secretary-General’s recommendations regarding the creation of knowledge management platforms, ECLAC and UNDP in its capacity as Chair of the former United Nations Sustainable Development Group for Latin America and the Caribbean, and in close consultation with the agencies, funds and programmes of the United Nations system and the United Nations Development Coordination Office in Latin America and the Caribbean, then moved forward with the design and implementation of a web-based knowledge platform, building on the Regional Knowledge Management Platform for the Sustainable Development Goals in Latin America and the Caribbean, to make it a key platform covering the coordination and availability of United Nations assets in the region.
A Steering Committee co-chaired by ECLAC and UNDP and composed additionally of the United Nations Development Coordination Office and three representatives of the regional agencies, funds and programmes of the United Nations, with ECLAC as the technical coordinator, was established to implement this regional virtual platform. This Steering Committee provides strategic guidance and oversees the development and regular updating of the SDG portal to ensure that it meets the proposed objective and addresses the needs of countries with regard to the implementation of the 2030 Agenda, through regional intergovernmental forums and United Nations mechanisms operating on the ground at the country level.
ECLAC presented an initial working pilot of the proposed portal to the Regional Directors of the United Nations agencies, funds and programmes in August 2019, and focal points have been appointed in each entity of the system in the region with a view to there being a process of participatory design and development and co-creation. The Regional Knowledge Management Platform for the Sustainable Development Goals in Latin America and the Caribbean was launched in the first half of 2020, and it was presented in various settings and forums for dissemination among actors involved in the 2030 Agenda.
The Regional Knowledge Management Platform for the Sustainable Development Goals in Latin America and the Caribbean (SDG Gateway) is a meeting and reference point for all regional information related to the SDGs, including activities, regional architecture, information resources, statistics, regional data and specific analytical tools developed and provided by the United Nations in response to the needs of member countries (see box IV.2). It is a digital portal that provides up-to-date information on the
26 See CEPALSTAT database [online] https://estadisticas.cepal.org/cepalstat/portada.html?idioma=english.

121
Building forward better: action to strengthen the 2030 Agenda for Sustainable Development
IV
implementation of the 2030 Agenda at global, regional and national levels, and on progress towards the SDGs. It includes links to the SDG-related knowledge products of the United Nations country teams, relevant information on global, regional and national institutional processes, monitoring mechanisms and countries’ progress in implementing the 2030 Agenda at the national level (including activities highlighted on their respective websites and important information on the institutional processes and monitoring mechanisms put in place by the countries themselves).
Box IV.2Objectives of the Regional Knowledge Management Platform for the Sustainable Development Goals in Latin America and the Caribbean (SDG Gateway)
• Reflect the joint effort of the United Nations system in Latin America and the Caribbean in response to the Secretary-General’s recommendations for reform of the system in the regional setting, with more than 1,500 information resources from 23 United Nations agencies, funds and programmes in Latin America and the Caribbean and ECLAC.
• Enable the countries and the United Nations country teams to obtain specialized knowledge to respond to national needs relating to the 2030 Agenda for Sustainable Development.
• Facilitate monitoring and statistical follow-up of progress towards the SDGs at the regional and national levels, with overviews of each Goal, challenges and opportunities for implementation, and key messages from the region.
• Include references to the region’s institutional architecture for the implementation of the 2030 Agenda at regional and national level.
• Provide reports on the activities carried out by the United Nations system in the region to support the measurement, use and dissemination of indicators, as well as providing assistance for statistical operations and strengthening statistical institutions.
• Foster collaboration on sustainable development across all entities of the United Nations development system operating at the regional level and be a reference point for all information related to the 2030 Agenda and the SDGs in Latin America and the Caribbean.
• Link to national SDG data portals and include aspects of national statistical monitoring and statistical country profiles based on national data.
Source: Economic Commission for Latin America and the Caribbean (ECLAC).
The portal is accessible to Member States, United Nations country teams, academic institutions, civil society organizations and the general public. This allows information resources to be widely disseminated and facilitates the task of planning actions for the implementation and monitoring of the 2030 Agenda on the basis of reliable and up-to-date information to respond to specific regional and subregional or cross-border demands and to coordinate the support of the United Nations development system on the ground.
This online knowledge management hub is a one-stop shop for all SDG-related tools and data in the region, and is closely linked to the information available through the global arrangements for monitoring the 2030 Agenda, which are headed by the United Nations Development Coordination Office, and to the data available from all United Nations entities, thus avoiding duplication of efforts.
The structure of the portal has two complementary components:
• An area providing general information on the 2030 Agenda in Latin America and the Caribbean which compiles, among other things, information on activities, news, publications and information resources, national reports and institutional arrangements related to the implementation of the 2030 Agenda and work associated with the 17 SDGs in the United Nations system and governments in the region. This component has the following sections (see image IV.1):

Economic Commission for Latin America and the Caribbean (ECLAC)
122 IV
– A section on reference information for the 2030 Agenda globally, with access to background material, information on the High-Level Political Forum on Sustainable Development, voluntary national reviews and reports of the Secretary-General, among other things.
– A section on the regional architecture, with information from the Forum of the Countries of Latin America and the Caribbean on Sustainable Development, subsidiary bodies and government agencies, as well as key resolutions at the regional level.
– An overview of each of the SDGs and their targets, challenges and opportunities, lessons learned, good practices and recommendations, including key takeaways from the region.
– A dedicated space for member States to showcase institutional mechanisms and publications, as well as a selection of important indicators, activities, new items and information resources related to the 2030 Agenda.
– A section dedicated to the United Nations system in the region, with a special file for each agency, fund or programme of the system, including global statistical databases, statistical technical assistance actions and regional issue-based coalitions in Latin America and the Caribbean, among other things.
– A space for other actors, such as civil society, local governments, parliaments, the private sector and youth.
– An information tools section with a compilation of activities, publications, news, infographics, videos, courses, campaigns and more.
Image IV.1 Home page of the Regional Knowledge Management Platform for the Sustainable Development Goals in Latin America and the Caribbean
Source: United Nations, Regional Knowledge Management Platform for the Sustainable Development Goals in Latin America and the Caribbean [online] https://agenda2030lac.org/en.
• A section dedicated to statistical follow-up and monitoring of progress on the 2030 Agenda, including information on institutional aspects, indicator frameworks, databases, statistical profiles and links to external bodies related to the 2030 Agenda at global, regional and national levels (see image IV.2). This section has the following components:

123
Building forward better: action to strengthen the 2030 Agenda for Sustainable Development
IV
– Global statistical monitoring, with access to the global institutional architecture for SDG statistical follow-up, the global indicator framework for the SDGs, the global SDG indicators database, annual global reports, other related statistical databases and a link to the United Nations Statistical Commission.
– Regional statistical monitoring, with access to the regional architecture for statistical follow-up to the SDGs, the indicators prioritized for SDG follow-up in the region, national capacities for the production of global indicators, the Regional data bank for statistical follow-up to the SDGs in Latin America and the Caribbean, regional SDG statistical profiles by target, regional progress towards SDG targets, reports on progress towards and challenges with the 2030 Agenda at the regional level, SDG-related indicator initiatives and the Statistical Conference of the Americas.
– National statistical monitoring, including, among other things, the statistics portals for the national SDGs, national 2030 Agenda implementation mechanisms and voluntary national reviews submitted by the countries of the region.
– Data and indicators, bringing together information such as that of the Regional data bank for statistical follow-up to the SDGs in Latin America and the Caribbean, regional statistical profiles, related statistical databases, and statistical databases and publications (such as the CEPALSTAT database).
– Support for SDG monitoring and reporting, with actions and activities to improve the measurement, use and dissemination of indicators, support statistical operations and strengthen the statistical institutional framework by area.
– Methodologies and information resources, with access to metadata by indicator and their custodian agencies and partner agencies.
Image IV.2 Statistical elements of the Regional Knowledge Management Platform for the Sustainable Development Goals in Latin America and the Caribbean
Source: United Nations, Regional Knowledge Management Platform for the Sustainable Development Goals in Latin America and the Caribbean [online] https://agenda2030lac.org/en.

Economic Commission for Latin America and the Caribbean (ECLAC)
124 IV
The establishment of regional knowledge management platforms has brought about a major change in the way United Nations agencies, funds and programmes identify synergies and potential collaborations to produce relevant information in support of national public policies. From a user perspective, regional platforms will bring information closer and make it more accessible, allowing appropriate comparisons to be made and resulting in greater citizen participation.
The Regional Knowledge Management Platform for the Sustainable Development Goals in Latin America and the Caribbean contributes to the fulfilment of the Secretary-General’s recommendations in relation to the creation of knowledge management platforms, the coordination and availability of the assets of the United Nations system in the region, and regional coordination to enhance regional data and statistics capabilities within the framework of the 2030 Agenda in Latin America and the Caribbean. It is not only a potential information tool, but also an instrument that facilitates decision-making (e.g., for the design of joint strategies to strengthen national capacities for the production of SDG indicators with a focus on the real needs of Member States in Latin America and the Caribbean). In this way, the Platform fosters collaboration and integration of all capabilities and efforts at the regional and national levels. This multi-agency regional initiative shows the potential results of joint cooperation and collaboration with a view to progressing with the implementation of the 2030 Agenda in the region.
In summary, the Regional Knowledge Management Platform for the Sustainable Development Goals in Latin America and the Caribbean is a one-stop shop for all information resources, publications, methodological guides, analytical reports, data, statistics and tools related to the SDGs in the region, and is closely linked to the information ecosystem available globally through existing institutional architectures, led by the United Nations Development Coordination Office. It plays a key role in the convergence of initiatives under way in the region to ensure that national governments, civil society and stakeholders involved with the 2030 Agenda are kept informed. The Secretary-General’s recommendation has resulted in an instrument without precedent in the region, based on collaborative work whose focus has been on addressing country demands deriving from the challenges posed by the implementation of the 2030 Agenda at the national level.
Bibliography
CLAD (Latin American Centre for Development Administration) (2016), Carta Iberoamericana de Gobierno Abierto, Bogotá, July.
ECLAC (Economic Commission for Latin America and the Caribbean) (2021a), “Regional data bank for statistical follow-up to the SDGs in Latin America and the Caribbean” [online] https://agenda2030lac.org/estadisticas/regional-data-bank-statistical-follow-up-sdg-1.html?lang=en.
(2021b), COVID-19 Observatory in Latin America and the Caribbean [online] https://www.cepal.org/en/topics/covid-19.
(2021c), Regional Observatory on Planning for Development in Latin America and the Caribbean [online] https://observatorioplanificacion.cepal.org/en.
(2021d), CEPALSTAT [online database] https://estadisticas.cepal.org/cepalstat/portada.html?idioma=english. (2021e), Regional Knowledge Platform on the 2030 Agenda in Latin America and the Caribbean [online] https://
agenda2030lac.org/en. (2020a), The 2030 Agenda for Sustainable Development in the new global and regional context: scenarios and
projections in the current crisis (LC/PUB.2020/5), Santiago, April. (2020b), “National measures in response to the COVID-19 and its effect on the SDGs”, Santiago [online] https://
agenda2030lac.org/es/medidas-nacionales-ante-la-covid-19-y-su-efecto-en-los-ods. (2020c), Building a New Future: Transformative Recovery with Equality and Sustainability (LC/SES.38/3-P/Rev.1),
Santiago. (2019a), Report on the Activities of the Statistical Coordination Group for the 2030 Agenda in Latin America
and the Caribbean (LC/CEA.10/6), Santiago, November.

125
Building forward better: action to strengthen the 2030 Agenda for Sustainable Development
IV
(2019b), “Simulation exercise for SDG attainment in Latin America and the Caribbean”, Santiago, unpublished. (2019c), Quadrennial report on regional progress and challenges in relation to the 2030 Agenda for Sustainable
Development in Latin America and the Caribbean (LC/FDS.3/3/Rev.1), Santiago, June. (2018a), “Panorama de la gestión pública en América Latina y el Caribe: un gobierno abierto centrado en el
ciudadano”, Project Documents (LC/TS.2017/98/Rev.1), Santiago, January. (2018b), Data, algorithms and policies: redefining the digital world (LC/CMSI.6/4), Santiago. (2010), Time for equality: closing gaps, opening trails (LC/G.2432(SES.33/3)), Santiago, May.ECLAC/FAO (Economic Commission for Latin America and the Caribbean/Food and Agriculture Organization of
the United Nations) (2018), “Ruralidad, hambre y pobreza en América Latina y el Caribe”, Project Documents (LC/TS.2018/119), Santiago, December.
Enríquez Villacorta, A. (2020), “Centroamérica frente a la COVID-19: lecciones y desafíos para la planificación, el gobierno digital y la gobernanza”, November, unpublished.
Ibarra, P. (2017), “El papel de la sociedad civil en la auditoria social y el fortalecimiento de las instituciones democráticas”, Desde el gobierno abierto al Estado abierto en América Latina y el Caribe, ECLAC Books, No. 144 (LC/PUB.2017/9-P), A. Naser, Á. Ramírez-Alujas and D. Rosales (eds.), Santiago, Economic Commission for Latin America and the Caribbean (ECLAC), April.
IMF (International Monetary Fund) (2020), World Economic Outlook, April 2020: The Great Lockdown, Washington, D.C.Naser, A., V. Fideleff and J. Tognoli (2020), “Gestión de planes de acción locales de gobierno abierto: herramientas
para la cocreación, el seguimiento y la evaluación”, Project Documents (LC/TS.2020/78), Santiago, Economic Commission for Latin America and the Caribbean (ECLAC).
Naser, A., Á. Ramírez-Alujas and D. Rosales (eds.) (2017), Desde el gobierno abierto al Estado abierto en América Latina y el Caribe, ECLAC Books, No. 144 (LC.PUB.2017/9-P), Santiago, Economic Commission for Latin America and the Caribbean (ECLAC).
OECD/IDB (Organization for Economic Cooperation and Development/Inter-American Development Bank) (2014), Panorama de las Administraciones Públicas: América Latina y el Caribe 2014, Paris, June.
OPP (Office of Planning and the Budget) (2019), Aportes para una Estrategia de Desarrollo 2050, Montevideo. (2018), “Rendición de cuentas y balance de ejecución presupuestal” [online] https://www.opp.gub.uy/sites/
default/files/documentos/2018-10/A%C3%B1o%202017.%20Tomo%20II.%20Parte%201.%20Contexto%20y%20resultados%20en%20%C3%A1reas%20program%C3%A1ticas.pdf.
United Nations (2021), Voluntary National Reviews Database [online] https://sustainabledevelopment.un.org/vnrs/. (2020), “Voluntary Local Reviews” [online] https://sdgs.un.org/topics/voluntary-local-reviews. (2019), Implementation of General Assembly resolution 71/243 on the quadrennial comprehensive policy review
of operational activities for development of the United Nations system, 2019. Report of the Secretary-General (A/74/73-E/2019/14), New York, April.
(2018), Repositioning of the United Nations development system in the context of the quadrennial comprehensive policy review of operational activities for development of the United Nations system (A/RES/72/279), New York, June.
(2015), Transforming our world: the 2030 Agenda for Sustainable Development (A/RES/70/1), New York, September.

Economic Commission for Latin America and the Caribbean (ECLAC)
126 IV
Annex IV.A1Table IV.A1.1 Indicators analysed to assess the achievement of the 2030 Agenda for Sustainable Development
Target already reached or likely to be reached on the current trend
Target likely to be reached only with public policy interventionThe trend is moving in the right directionThe trend is moving in the wrong direction
Sustainable Development Goal (SDG)
Target Indicator Series
1 1.1 By 2030, eradicate extreme poverty for all people everywhere, currently measured as people living on less than $1.25 a day
1.1.1 Proportion of population below the international poverty line, by sex, age, employment status and geographical location (urban/rural)
Employed population below international poverty line (percentage). Total
1 1.1 By 2030, eradicate extreme poverty for all people everywhere, currently measured as people living on less than $1.25 a day
1.1.1 Proportion of population below the international poverty line, by sex, age, employment status and geographical location (urban/rural)
Employed population below international poverty line (percentage). Women
1 1.1 By 2030, eradicate extreme poverty for all people everywhere, currently measured as people living on less than $1.25 a day
1.1.1 Proportion of population below the international poverty line, by sex, age, employment status and geographical location (urban/rural)
Employed population below international poverty line (percentage). Men
1 1.1 By 2030, eradicate extreme poverty for all people everywhere, currently measured as people living on less than $1.25 a day
1.1.1 Proportion of population below the international poverty line, by sex, age, employment status and geographical location (urban/rural)
Population living on less than $1.90 a day (percentage). Total
1 1.2 By 2030, reduce at least by half the proportion of men, women and children of all ages living in poverty in all its dimensions according to national definitions
1.1.1 Proportion of population below the international poverty line, by sex, age, employment status and geographical location (urban/rural)
Proportion of population living below the national poverty line (percentage). Total
1 1.1 By 2030, eradicate extreme poverty for all people everywhere, currently measured as people living on less than $1.25 a day
P-1.1.1 Proportion of population living below the regional extreme poverty line, by sex, age, employment status, geographical location (urban or rural) and ethnicity
Population living in poverty (percentage). Total
1 1.1 By 2030, eradicate extreme poverty for all people everywhere, currently measured as people living on less than $1.25 a day
P-1.1.1 Proportion of population living below the regional extreme poverty line, by sex, age, employment status, geographical location (urban or rural) and ethnicity
Population living in extreme poverty (percentage). Total
1 1.3 Implement nationally appropriate social protection systems and measures for all, including floors, and by 2030 achieve substantial coverage of the poor and the vulnerable
1.3.1 Proportion of population covered by social protection floors/systems, by sex, distinguishing children, unemployed persons, older persons, persons with disabilities, pregnant women, newborns, work-injury victims and the poor and the vulnerable
Proportion of population covered by social insurance programmes (percentage). Total
1 1.4 By 2030, ensure that all men and women, in particular the poor and the vulnerable, have equal rights to economic resources, as well as access to basic services, ownership and control over land and other forms of property, inheritance, natural resources, appropriate new technology and financial services, including microfinance
1.4.1 Proportion of population living in households with access to basic services
Proportion of population using basic drinking water services, by location (percentage). Total
1 1.4 By 2030, ensure that all men and women, in particular the poor and the vulnerable, have equal rights to economic resources, as well as access to basic services, ownership and control over land and other forms of property, inheritance, natural resources, appropriate new technology and financial services, including microfinance
1.4.1 Proportion of population living in households with access to basic services
Proportion of population using basic drinking water services, by location (percentage). Urban
1 1.4 By 2030, ensure that all men and women, in particular the poor and the vulnerable, have equal rights to economic resources, as well as access to basic services, ownership and control over land and other forms of property, inheritance, natural resources, appropriate new technology and financial services, including microfinance
1.4.1 Proportion of population living in households with access to basic services
Proportion of population using basic drinking water services, by location (percentage). Rural

127
Building forward better: action to strengthen the 2030 Agenda for Sustainable Development
IV
Sustainable Development Goal (SDG)
Target Indicator Series
1 1.4 By 2030, ensure that all men and women, in particular the poor and the vulnerable, have equal rights to economic resources, as well as access to basic services, ownership and control over land and other forms of property, inheritance, natural resources, appropriate new technology and financial services, including microfinance
1.4.1 Proportion of population living in households with access to basic services
Proportion of population using sanitation services, by location (percentage). Total
1 1.4 By 2030, ensure that all men and women, in particular the poor and the vulnerable, have equal rights to economic resources, as well as access to basic services, ownership and control over land and other forms of property, inheritance, natural resources, appropriate new technology and financial services, including microfinance
1.4.1 Proportion of population living in households with access to basic services
Proportion of population using sanitation services, by location (percentage). Urban
1 1.4 By 2030, ensure that all men and women, in particular the poor and the vulnerable, have equal rights to economic resources, as well as access to basic services, ownership and control over land and other forms of property, inheritance, natural resources, appropriate new technology and financial services, including microfinance
1.4.1 Proportion of population living in households with access to basic services
Proportion of population using sanitation services, by location (percentage). Rural
1 1.a Ensure significant mobilization of resources from a variety of sources, including through enhanced development cooperation, in order to provide adequate and predictable means for developing countries, in particular least developed countries, to implement programmes and policies to end poverty in all its dimensions
1.a.2 Proportion of total government spending on essential services (education, health and social protection)
Proportion of total government spending on essential services, education (percentage)
2 2.1 By 2030, end hunger and ensure access by all people, in particular the poor and people in vulnerable situations, including infants, to safe, nutritious and sufficient food all year round
2.1.1 Prevalence of undernourishment Prevalence of chronic malnutrition (percentage)
2 2.2 By 2030, end all forms of malnutrition, including achieving, by 2025, the internationally agreed targets on stunting and wasting in children under 5 years of age, and address the nutritional needs of adolescent girls, pregnant and lactating women and older persons
2.2.1 Prevalence of stunting (height for age <-2 standard deviation from the median of the World Health Organization (WHO) Child Growth Standards) among children under 5 years of age
Proportion of children moderately or severely stunted (percentage)
2 2.2 By 2030, end all forms of malnutrition, including achieving, by 2025, the internationally agreed targets on stunting and wasting in children under 5 years of age, and address the nutritional needs of adolescent girls, pregnant and lactating women and older persons
2.2.2 Prevalence of malnutrition (weight for height >+2 or <-2 standard deviation from the median of the WHO Child Growth Standards) among children under 5 years of age, by type (wasting and overweight)
Proportion of children moderately or severely overweight (percentage)
2 2.4 By 2030, ensure sustainable food production systems and implement resilient agricultural practices that increase productivity and production, that help maintain ecosystems, that strengthen capacity for adaptation to climate change, extreme weather, drought, flooding and other disasters and that progressively improve land and soil quality
C-2.4.a Intensity of fertilizer use (apparent consumption by cultivated area)
Intensity of fertilizer use (apparent consumption by cultivated area)
2 2.4 By 2030, ensure sustainable food production systems and implement resilient agricultural practices that increase productivity and production, that help maintain ecosystems, that strengthen capacity for adaptation to climate change, extreme weather, drought, flooding and other disasters and that progressively improve land and soil quality
C-2.4.b Apparent consumption of pesticides by type (herbicides, insecticides or fungicides)
Consumption of pesticides by type (tons). Fungicides and bactericides
Table IV.A1.1 (continued)

Economic Commission for Latin America and the Caribbean (ECLAC)
128 IV
Sustainable Development Goal (SDG)
Target Indicator Series
2 2.4 By 2030, ensure sustainable food production systems and implement resilient agricultural practices that increase productivity and production, that help maintain ecosystems, that strengthen capacity for adaptation to climate change, extreme weather, drought, flooding and other disasters and that progressively improve land and soil quality
C-2.4.b Apparent consumption of pesticides by type (herbicides, insecticides or fungicides)
Consumption of pesticides by type (tons). Herbicides
2 2.4 By 2030, ensure sustainable food production systems and implement resilient agricultural practices that increase productivity and production, that help maintain ecosystems, that strengthen capacity for adaptation to climate change, extreme weather, drought, flooding and other disasters and that progressively improve land and soil quality
C-2.4.b Apparent consumption of pesticides by type (herbicides, insecticides or fungicides)
Consumption of pesticides by type (tons). Insecticides
2 2.5 By 2020, maintain the genetic diversity of seeds, cultivated plants and farmed and domesticated animals and their related wild species, including through soundly managed and diversified seed and plant banks at the national, regional and international levels, and promote access to and fair and equitable sharing of benefits arising from the utilization of genetic resources and associated traditional knowledge, as internationally agreed
2.5.1 Number of plant and animal genetic resources for food and agriculture secured in either medium- or long-term conservation facilities
Number of plant genetic resources for food and agriculture secured in either medium- or long-term conservation facilities
2 2.a Increase investment, including through enhanced international cooperation, in rural infrastructure, agricultural research and extension services, technology development and plant and livestock gene banks in order to enhance agricultural productive capacity in developing countries, in particular least developed countries
2.a.1 The agriculture orientation index for government expenditures
Agriculture value added as a share of GDP (percentage)
2 2.a Increase investment, including through enhanced international cooperation, in rural infrastructure, agricultural research and extension services, technology development and plant and livestock gene banks in order to enhance agricultural productive capacity in developing countries, in particular least developed countries
2.a.2 Total official flows (official development assistance plus other official flows) to the agriculture sector
Total official flows (disbursements) with respect to the agriculture sector, by recipient country (millions of dollars at constant 2018 prices)
2 2.b Correct and prevent trade restrictions and distortions in world agricultural markets, including through the parallel elimination of all forms of agricultural export subsidies and all export measures with equivalent effect, in accordance with the mandate of the Doha Development Round
2.b.1 Agricultural export subsidies Agricultural export subsidies (millions of dollars at current prices)
3 3.1 By 2030, reduce the global maternal mortality ratio to less than 70 per 100,000 live births
3.1.1 Maternal mortality rate Maternal mortality ratio (maternal deaths per 100,000 live births)
3 3.1 By 2030, reduce the global maternal mortality ratio to less than 70 per 100,000 live births
3.1.2 Proportion of births attended by skilled health personnel
Proportion of births attended by skilled health personnel (percentage)
3 3.2 By 2030, end preventable deaths of newborns and children under 5 years of age, with all countries aiming to reduce neonatal mortality to at least as low as 12 per 1,000 live births and under-5 mortality to at least as low as 25 per 1,000 live births
3.2.1 Under-5 mortality rate Under-5 mortality rate, by sex (deaths per 1,000 live births) Total
3 3.2 By 2030, end preventable deaths of newborns and children under 5 years of age, with all countries aiming to reduce neonatal mortality to at least as low as 12 per 1,000 live births and under-5 mortality to at least as low as 25 per 1,000 live births
3.2.1 Under-5 mortality rate Under-5 mortality rate, by sex (deaths per 1,000 live births) Women
Table IV.A1.1 (continued)

129
Building forward better: action to strengthen the 2030 Agenda for Sustainable Development
IV
Sustainable Development Goal (SDG)
Target Indicator Series
3 3.2 By 2030, end preventable deaths of newborns and children under 5 years of age, with all countries aiming to reduce neonatal mortality to at least as low as 12 per 1,000 live births and under-5 mortality to at least as low as 25 per 1,000 live births
3.2.1 Under-5 mortality rate Under-5 mortality rate, by sex (deaths per 1,000 live births) Men
3 3.2 By 2030, end preventable deaths of newborns and children under 5 years of age, with all countries aiming to reduce neonatal mortality to at least as low as 12 per 1,000 live births and under-5 mortality to at least as low as 25 per 1,000 live births
3.2.2 Neonatal mortality rate Neonatal mortality rate (deaths per 1,000 newborns)
3 3.3 By 2030, end the epidemics of AIDS, tuberculosis, malaria and neglected tropical diseases and combat hepatitis, water-borne diseases and other communicable diseases
3.3.1 Number of new HIV infections per 1,000 uninfected population, by sex, age and key populations
Number of new HIV infections by sex and age (per 1,000 uninfected population). Total
3 3.3 By 2030, end the epidemics of AIDS, tuberculosis, malaria and neglected tropical diseases and combat hepatitis, waterborne diseases and other communicable diseases
3.3.1 Number of new HIV infections per 1,000 uninfected population, by sex, age and key populations
Number of new HIV infections by sex and age (per 1,000 uninfected population). Women
3 3.3 By 2030, end the epidemics of AIDS, tuberculosis, malaria and neglected tropical diseases and combat hepatitis, waterborne diseases and other communicable diseases
3.3.1 Number of new HIV infections per 1,000 uninfected population, by sex, age and key populations
Number of new HIV infections by sex and age (per 1,000 uninfected population). Men
3 3.3 By 2030, end the epidemics of AIDS, tuberculosis, malaria and neglected tropical diseases and combat hepatitis, waterborne diseases and other communicable diseases
C-3.3.a HIV/AIDS prevalence among population aged 15–49 years
HIV/AIDS prevalence among population aged 15–49 years (percentage)
3 3.3 By 2030, end the epidemics of AIDS, tuberculosis, malaria and neglected tropical diseases and combat hepatitis, waterborne diseases and other communicable diseases
3.3.2 Tuberculosis incidence per 100,000 population Tuberculosis incidence (per 100,000 population)
3 3.3 By 2030, end the epidemics of AIDS, tuberculosis, malaria and neglected tropical diseases and combat hepatitis, waterborne diseases and other communicable diseases
3.3.3 Malaria incidence per 1,000 population Malaria incidence (per 1,000 population)
3 3.3 By 2030, end the epidemics of AIDS, tuberculosis, malaria and neglected tropical diseases and combat hepatitis, waterborne diseases and other communicable diseases
3.3.5 Number of people requiring interventions against neglected tropical diseases
Number of people requiring interventions against neglected tropical diseases
3 3.4 By 2030, reduce by one third premature mortality from non-communicable diseases through prevention and treatment and promote mental health and well-being
3.4.1 Mortality rate attributed to cardiovascular disease, cancer, diabetes or chronic respiratory disease
Mortality rate attributed to cardiovascular disease, cancer, diabetes or chronic respiratory disease (percentage)
3 3.4 By 2030, reduce by one third premature mortality from non-communicable diseases through prevention and treatment and promote mental health and well-being
3.4.1 Mortality rate attributed to cardiovascular disease, cancer, diabetes or chronic respiratory disease
Number of deaths attributed to non-communicable diseases, by type of disease and sex. Cardiovascular
3 3.4 By 2030, reduce by one third premature mortality from non-communicable diseases through prevention and treatment and promote mental health and well-being
3.4.1 Mortality rate attributed to cardiovascular disease, cancer, diabetes or chronic respiratory disease
Number of deaths attributed to non-communicable diseases, by type of disease and sex. Cancer
3 3.4 By 2030, reduce by one third premature mortality from non-communicable diseases through prevention and treatment and promote mental health and well-being
3.4.1 Mortality rate attributed to cardiovascular disease, cancer, diabetes or chronic respiratory disease
Number of deaths attributed to non-communicable diseases, by type of disease and sex. Diabetes mellitus
3 3.4 By 2030, reduce by one third premature mortality from non-communicable diseases through prevention and treatment and promote mental health and well-being
3.4.1 Mortality rate attributed to cardiovascular disease, cancer, diabetes or chronic respiratory disease
Number of deaths attributed to non-communicable diseases, by type of disease and sex. Chronic respiratory
3 3.4 By 2030, reduce by one third premature mortality from non-communicable diseases through prevention and treatment and promote mental health and well-being
3.4.2 Suicide mortality rate Suicide mortality rate, by sex (deaths per 100,000 population). Total
Table IV.A1.1 (continued)

Economic Commission for Latin America and the Caribbean (ECLAC)
130 IV
Sustainable Development Goal (SDG)
Target Indicator Series
3 3.5 Strengthen the prevention and treatment of substance abuse, including narcotic drug abuse and harmful use of alcohol
3.5.2 Per capita alcohol consumption (aged 15 years and older) during a calendar year in litres of pure alcohol
Per capita alcohol consumption (aged 15 years and older) in a calendar year (litres of pure alcohol)
3 3.6 By 2020, halve the number of global deaths and injuries from road traffic accidents
3.6.1 Death rate due to road traffic injuries Death rate due to road traffic injuries (per 100,000 population)
3 3.7 By 2030, ensure universal access to sexual and reproductive health-care services, including for family planning, information and education, and the integration of reproductive health into national strategies and programmes
3.7.1 Proportion of women of reproductive age (aged 15–49 years) who have their need for family planning satisfied with modern methods
Proportion of women of reproductive age (aged 15–49 years) who have their need for family planning satisfied with modern methods (percentage)
3 3.7 By 2030, ensure universal access to sexual and reproductive health-care services, including for family planning, information and education, and the integration of reproductive health into national strategies and programmes
3.7.2 Adolescent birth rate (aged 10–14 years; aged 15–19 years) per 1,000 women in that age group
Adolescent birth rate (per 1,000 women aged 15–19 years)
3 3.8 Achieve universal health coverage, including financial risk protection, access to quality essential health-care services and access to safe, effective, quality and affordable essential medicines and vaccines for all
3.8.1 Coverage of essential health services (defined as the average coverage of essential services based on tracer interventions that include reproductive, maternal, newborn and child health, infectious diseases, non-communicable diseases and service capacity and access, among the general and the most disadvantaged population)
Universal health coverage (UHC) service coverage index
3 3.8 Achieve universal health coverage, including financial risk protection, access to quality essential health-care services and access to safe, effective, quality and affordable essential medicines and vaccines for all
3.8.2 Proportion of population with large household expenditures on health as a share of total household expenditure or income
Proportion of population with large household expenditures on health (greater than 10%) as a share of total household expenditure or income (percentage)
3 3.9 By 2030, substantially reduce the number of deaths and illnesses from hazardous chemicals and air, water and soil pollution and contamination
3.9.3 Mortality rate attributed to unintentional poisoning Mortality rate attributed to unintentional poisoning, by sex (deaths per 100,000 population). Total
3 3.a Strengthen the implementation of the World Health Organization Framework Convention on Tobacco Control in all countries, as appropriate
3.a.1 Age-standardized prevalence of current tobacco use among persons aged 15 years and older
Age-standardized prevalence of current tobacco use among persons aged 15 years and older, by sex (percentage). Total
3 3.b Support the research and development of vaccines and medicines for the communicable and non-communicable diseases that primarily affect developing countries, provide access to affordable essential medicines and vaccines, in accordance with the Doha Declaration on the TRIPS Agreement and Public Health, which affirms the right of developing countries to use to the full the provisions in the Agreement on Trade-Related Aspects of Intellectual Property Rights regarding flexibilities to protect public health, and, in particular, provide access to medicines for all
3.b.1 Proportion of the target population covered by all vaccines included in their national programme
Proportion of the target population with access to three doses of diphtheria-tetanus-pertussis (percentage)
3 3.b Support the research and development of vaccines and medicines for the communicable and non-communicable diseases that primarily affect developing countries, provide access to affordable essential medicines and vaccines, in accordance with the Doha Declaration on the TRIPS Agreement and Public Health, which affirms the right of developing countries to use to the full the provisions in the Agreement on Trade-Related Aspects of Intellectual Property Rights regarding flexibilities to protect public health, and, in particular, provide access to medicines for all
3.b.1 Proportion of the target population covered by all vaccines included in their national programme
Proportion of the target population with access to the second dose of the measles vaccine, MCV2 (percentage)
Table IV.A1.1 (continued)

131
Building forward better: action to strengthen the 2030 Agenda for Sustainable Development
IV
Sustainable Development Goal (SDG)
Target Indicator Series
3 3.b Support the research and development of vaccines and medicines for the communicable and non-communicable diseases that primarily affect developing countries, provide access to affordable essential medicines and vaccines, in accordance with the Doha Declaration on the TRIPS Agreement and Public Health, which affirms the right of developing countries to use to the full the provisions in the Agreement on Trade-Related Aspects of Intellectual Property Rights regarding flexibilities to protect public health, and, in particular, provide access to medicines for all
3.b.1 Proportion of the target population covered by all vaccines included in their national programme
Proportion of the target population with access to the third dose of the pneumococcal conjugate vaccine, PCV3 (percentage)
3 3.b Support the research and development of vaccines and medicines for the communicable and non-communicable diseases that primarily affect developing countries, provide access to affordable essential medicines and vaccines, in accordance with the Doha Declaration on the TRIPS Agreement and Public Health, which affirms the right of developing countries to use to the full the provisions in the Agreement on Trade-Related Aspects of Intellectual Property Rights regarding flexibilities to protect public health, and, in particular, provide access to medicines for all
3.b.1 Proportion of the target population covered by all vaccines included in their national programme
Proportion of the target population with sustainable access to medicines and vaccines for human papillomavirus, HPV (percentage)
3 3.b Support the research and development of vaccines and medicines for the communicable and non-communicable diseases that primarily affect developing countries, provide access to affordable essential medicines and vaccines, in accordance with the Doha Declaration on the TRIPS Agreement and Public Health, which affirms the right of developing countries to use to the full the provisions in the Agreement on Trade-Related Aspects of Intellectual Property Rights regarding flexibilities to protect public health, and, in particular, provide access to medicines for all
3.b.2 Total net official development assistance to medical research and basic health sectors
Total net official development assistance to medical research and basic health sectors, by recipient country (millions of dollars at constant 2018 prices)
3 3.c Substantially increase health financing and the recruitment, development, training and retention of the health workforce in developing countries, especially in least developed countries and small island developing States
3.c.1 Health worker density and distribution Health worker density, by type of occupation (per 10,000 population). Doctors
3 3.c Substantially increase health financing and the recruitment, development, training and retention of the health workforce in developing countries, especially in least developed countries and small island developing States
3.c.1 Health worker density and distribution Health worker distribution, by sex and type of occupation (percentage). Doctors. Women
3 3.c Substantially increase health financing and the recruitment, development, training and retention of the health workforce in developing countries, especially in least developed countries and small island developing States
3.c.1 Health worker density and distribution Health worker distribution, by sex and type of occupation (percentage). Doctors. Men
3 3.d Strengthen the capacity of all countries, in particular developing countries, for early warning, risk reduction and management of national and global health risks
3.d.1 International Health Regulations (IHR) capacity and health emergency preparedness
International Health Regulations (IHR) capacity, by type of capacity (percentage). National legislation, policy and financing
4 4.1 By 2030, ensure that all girls and boys complete free, equitable and quality primary and secondary education leading to relevant and effective learning outcomes
4.1.1 Proportion of children and young people (a) in grades 2/3; (b) at the end of primary; and (c) at the end of lower secondary achieving at least a minimum proficiency level in (i) reading and (ii) mathematics, by sex
Proportion of children and young people at the end of lower secondary achieving at least a minimum proficiency level in mathematics (percentage)
Table IV.A1.1 (continued)

Economic Commission for Latin America and the Caribbean (ECLAC)
132 IV
Sustainable Development Goal (SDG)
Target Indicator Series
4 4.2 By 2030, ensure that all girls and boys have access to quality early childhood development, care and pre-primary education so that they are ready for primary education
4.2.2 Gross rate of enrolment in higher education, by sex
Participation rate in organized learning (one year before the official primary entry age), by sex (percentage). Total
4 4.3 By 2030, ensure equal access for all women and men to affordable and quality technical, vocational and tertiary education, including university
4.3.1 Participation rate of youth and adults in formal and non-formal education and training in the previous 12 months, by sex
Participation rate in formal and non-formal education and training, by sex (percentage). Total
4 4.3 By 2030, ensure equal access for all women and men to affordable and quality technical, vocational and tertiary education, including university
C-4.3 Gross rate of enrolment in higher education, by sex
Gross rate of enrolment in tertiary education, by sex (percentage). Total
4 4.5 By 2030, eliminate gender disparities in education and ensure equal access to all levels of education and vocational training for the vulnerable, including persons with disabilities, indigenous peoples and children in vulnerable situations
4.5.1 Parity indices (female/male, rural/urban, bottom/top wealth quintile and others such as disability status, indigenous peoples and conflict-affected, as data become available) for all education indicators on this list that can be disaggregated
Gender parity index of trained teachers, by education level. Primary
4 4.5 By 2030, eliminate gender disparities in education and ensure equal access to all levels of education and vocational training for the vulnerable, including persons with disabilities, indigenous peoples and children in vulnerable situations
Gender parity index of trained teachers, by education level. Secondary
4 4.6 By 2030, ensure that all youth and a substantial proportion of adults, both men and women, achieve literacy and numeracy
C-4.6 Literacy rate in persons aged 15–24 years and 15 years and older, by sex
Literacy rate in persons aged 15 and older, by sex (percentage). Total
4 4.a Build and upgrade education facilities that are child, disability and gender sensitive and provide safe, non-violent, inclusive and effective learning environments for all
4.a.1 Proportion of schools providing basic services, by type of service
Schools with access to the Internet for pedagogical purposes, by education level (percentage). Primary
4 4.a Build and upgrade education facilities that are child, disability and gender sensitive and provide safe, non-violent, inclusive and effective learning environments for all
4.a.1 Proportion of schools providing basic services, by type of service
Schools with access to the Internet for pedagogical purposes, by education level (percentage). Lower secondary
4 4.a Build and upgrade education facilities that are child, disability and gender sensitive and provide safe, non-violent, inclusive and effective learning environments for all
4.a.1 Proportion of schools providing basic services, by type of service
Schools with access to the Internet for pedagogical purposes, by education level (percentage). Upper secondary
4 4.a Build and upgrade education facilities that are child, disability and gender sensitive and provide safe, non-violent, inclusive and effective learning environments for all
4.a.1 Proportion of schools providing basic services, by type of service
Schools with access to electricity, by education level (percentage). Primary
4 4.a Build and upgrade education facilities that are child, disability and gender sensitive and provide safe, non-violent, inclusive and effective learning environments for all
4.a.1 Proportion of schools providing basic services, by type of service
Schools with access to electricity, by education level (percentage). Lower secondary
4 4.a Build and upgrade education facilities that are child, disability and gender sensitive and provide safe, non-violent, inclusive and effective learning environments for all
4.a.1 Proportion of schools providing basic services, by type of service
Schools with access to electricity, by education level (percentage). Upper secondary
4 4.b By 2020, substantially expand globally the number of scholarships available to developing countries, in particular least developed countries, small island developing States and African countries, for enrolment in higher education, including vocational training and information and communications technology, technical, engineering and scientific programmes, in developed countries and other developing countries
4.b.1 Volume of official development assistance flows for scholarships, by sector and type of study
Total official assistance for scholarships, by recipient country (millions of dollars at constant 2018 prices)
Table IV.A1.1 (continued)

133
Building forward better: action to strengthen the 2030 Agenda for Sustainable Development
IV
Sustainable Development Goal (SDG)
Target Indicator Series
4 4.c By 2030, substantially increase the supply of qualified teachers, including through international cooperation for teacher training in developing countries, especially least developed countries and small island developing States
4.c.1 Proportion of teachers with the minimum qualifications required, by education level
Proportion of teachers who have received at least the minimum organized teacher training (e.g. pedagogical training) pre-service or in-service required for teaching at the relevant level in a given country, by sex and education level. Total. Lower secondary
5 5.2 Eliminate all forms of violence against all women and girls in the public and private spheres, including trafficking and sexual and other types of exploitation
C-5.2 Rates of femicide or feminicide (gender-related killings of women aged 15 years and older per 100,000 women)
Femicide or feminicide rate (per 100,000 women)
5 5.5 Ensure women’s full and effective participation and equal opportunities for leadership at all levels of decision-making in political, economic and public life
5.5.1 Proportion of seats held by women in (a) national parliaments and (b) local governments
Proportion of seats held by women in national parliaments (percentage of total seats)
5 5.5 Ensure women’s full and effective participation and equal opportunities for leadership at all levels of decision-making in political, economic and public life
5.5.2 Proportion of women in managerial positions Proportion of women in managerial positions (percentage)
5 5.5 Ensure women’s full and effective participation and equal opportunities for leadership at all levels of decision-making in political, economic and public life
5.5.2 Proportion of women in managerial positions Proportion of women in senior and middle management (percentage)
6 6.1 By 2030, achieve universal and equitable access to safe and affordable drinking water for all
6.1.1 Proportion of population using safely managed drinking water services
Proportion of population using safely managed drinking water services, by urban/rural area (percentage). Total
6 6.1 By 2030, achieve universal and equitable access to safe and affordable drinking water for all
6.1.1 Proportion of population using safely managed drinking water services
Proportion of population using safely managed drinking water services, by urban/rural area (percentage). Urban
6 6.1 By 2030, achieve universal and equitable access to safe and affordable drinking water for all
6.1.1 Proportion of population using safely managed drinking water services
Proportion of population using safely managed drinking water services, by urban/rural area (percentage). Rural
6 6.2 By 2030, achieve access to adequate and equitable sanitation and hygiene for all and end open defecation, paying special attention to the needs of women and girls and those in vulnerable situations
6.2.1 Proportion of population using: (a) safely managed sanitation services and (b) handwashing facilities with soap and water
Proportion of population using safely managed sanitation services, by urban/rural area (percentage). Total
6 6.2 By 2030, achieve access to adequate and equitable sanitation and hygiene for all and end open defecation, paying special attention to the needs of women and girls and those in vulnerable situations
6.2.1 Proportion of population using: (a) safely managed sanitation services and (b) handwashing facilities with soap and water
Proportion of population using safely managed sanitation services, by urban/rural area (percentage). Urban
6 6.2 By 2030, achieve access to adequate and equitable sanitation and hygiene for all and end open defecation, paying special attention to the needs of women and girls and those in vulnerable situations
6.2.1 Proportion of population using: (a) safely managed sanitation services and (b) handwashing facilities with soap and water
Proportion of population using safely managed sanitation services, by urban/rural area (percentage). Rural
6 6.2 By 2030, achieve access to adequate and equitable sanitation and hygiene for all and end open defecation, paying special attention to the needs of women and girls and those in vulnerable situations
6.2.1 Proportion of population using: (a) safely managed sanitation services and (b) handwashing facilities with soap and water
Proportion of population practising open defecation, by urban/rural area (percentage). Total
6 6.2 By 2030, achieve access to adequate and equitable sanitation and hygiene for all and end open defecation, paying special attention to the needs of women and girls and those in vulnerable situations
6.2.1 Proportion of population using: (a) safely managed sanitation services and (b) handwashing facilities with soap and water
Proportion of population practising open defecation, by urban/rural area (percentage). Urban
Table IV.A1.1 (continued)

Economic Commission for Latin America and the Caribbean (ECLAC)
134 IV
Sustainable Development Goal (SDG)
Target Indicator Series
6 6.2 By 2030, achieve access to adequate and equitable sanitation and hygiene for all and end open defecation, paying special attention to the needs of women and girls and those in vulnerable situations
6.2.1 Proportion of population using: (a) safely managed sanitation services and (b) handwashing facilities with soap and water
Proportion of population practising open defecation, by urban/rural area (percentage). Rural
6 6.4 By 2030, substantially increase water-use efficiency across all sectors and ensure sustainable withdrawals and supply of freshwater to address water scarcity and substantially reduce the number of people suffering from water scarcity
6.4.1 Change in water-use efficiency over time Water-use efficiency (dollars per cubic meter)
6 6.4 By 2030, substantially increase water-use efficiency across all sectors and ensure sustainable withdrawals and supply of freshwater to address water scarcity and substantially reduce the number of people suffering from water scarcity
6.4.2 Level of water stress: freshwater withdrawal as a proportion of available freshwater resources
Level of water stress: freshwater withdrawal as a proportion of available freshwater resources (percentage)
6 6.6 By 2020, protect and restore water-related ecosystems, including mountains, forests, wetlands, rivers, aquifers and lakes
6.6.1 Change in the extent of water-related ecosystems over time
Extent of water body (permanent and possibly permanent) (percent of total land area)
6 6.6 By 2020, protect and restore water-related ecosystems, including mountains, forests, wetlands, rivers, aquifers and lakes
6.6.1 Change in the extent of water-related ecosystems over time
Extent of water body (permanent) (percentage of total land area)
6 6.a By 2030, expand international cooperation and capacity-building support to developing countries in water- and sanitation-related activities and programmes, including water harvesting, desalination, water efficiency, wastewater treatment, recycling and reuse technologies
6.a.1 Amount of water- and sanitation-related official development assistance that is part of a government-coordinated spending plan
Total official development assistance (gross disbursement) for water supply and sanitation, by recipient country (millions of dollars at constant 2018 prices)
7 7.1 By 2030, ensure universal access to affordable, reliable and modern energy services
7.1.1 Proportion of population with access to electricity Proportion of population with access to electricity, by rural/urban area (percentage) Total
7 7.1 By 2030, ensure universal access to affordable, reliable and modern energy services
7.1.2 Proportion of population with primary reliance on clean fuels and technology
Proportion of population with primary reliance on clean fuels and technology (percentage)
7 7.2 By 2030, increase substantially the share of renewable energy in the global energy mix
7.2.1 Renewable energy share in total final energy consumption
Renewable energy share in total final energy consumption (percentage)
7 7.3 By 2030, double the global rate of improvement in energy efficiency
7.3.1 Energy intensity measured in terms of primary energy and GDP
Energy intensity level of primary energy (megajoules /2011 purchasing power parity GDP)
7 7.a By 2030, enhance international cooperation to facilitate access to clean energy research and technology, including renewable energy, energy efficiency and advanced and cleaner fossil-fuel technology, and promote investment in energy infrastructure and clean energy technology
7.a.1 International financial flows to developing countries in support of clean energy research and development and renewable energy production, including in hybrid systems
International financial flows to developing countries in support of clean energy research and development and renewable energy production, including in hybrid systems (millions of dollars at constant 2017 prices)
8 8.1 Sustain per capita economic growth in accordance with national circumstances and, in particular, at least 7% gross domestic product growth per annum in the least developed countries
8.1.1 Annual growth rate of real GDP per capita Annual growth rate of real GDP per capita (percentage)
8 8.2 Achieve higher levels of economic productivity through diversification, technological upgrading and innovation, including through a focus on high-value added and labour-intensive sectors
8.2.1 Annual growth rate of real GDP per employed person
Annual growth rate of real GDP per employed person (percentage)
Table IV.A1.1 (continued)

135
Building forward better: action to strengthen the 2030 Agenda for Sustainable Development
IV
Sustainable Development Goal (SDG)
Target Indicator Series
8 8.3 Promote development-oriented policies that support productive activities, decent job creation, entrepreneurship, creativity and innovation, and encourage the formalization and growth of micro-, small- and medium-sized enterprises, including through access to financial services
8.3.1 Proportion of informal employment in total employment, by sector and sex
Proportion of informal employment in non-agriculture employment, by sex (percentage). Total. All sectors
8 8.5 By 2030, achieve full and productive employment and decent work for all women and men, including for young people and persons with disabilities, and equal pay for work of equal value
8.5.1 Average hourly earnings of female and male employees, by occupation, age and persons with disabilities
Average hourly earnings of managers, by gender and occupation (local currency). Total. All occupations
8 8.5 By 2030, achieve full and productive employment and decent work for all women and men, including for young people and persons with disabilities, and equal pay for work of equal value
8.5.2 Unemployment rate, by sex, age and persons with disabilities
Unemployment rate, by age and sex (percentage). 15 years of age and older. Total
8 8.5 By 2030, achieve full and productive employment and decent work for all women and men, including for young people and persons with disabilities, and equal pay for work of equal value
8.5.2 Unemployment rate, by sex, age and persons with disabilities
Unemployment rate, by age and sex (percentage). 15 years of age and older. Women
8 8.5 By 2030, achieve full and productive employment and decent work for all women and men, including for young people and persons with disabilities, and equal pay for work of equal value
8.5.2 Unemployment rate, by sex, age and persons with disabilities
Unemployment rate, by age and sex (percentage). 15 years of age and older. Men
8 8.5 By 2030, achieve full and productive employment and decent work for all women and men, including for young people and persons with disabilities, and equal pay for work of equal value
8.5.2 Unemployment rate, by sex, age and persons with disabilities
Unemployment rate, by age and sex (percentage). 15 - 24 years of age. Total
8 8.5 By 2030, achieve full and productive employment and decent work for all women and men, including for young people and persons with disabilities, and equal pay for work of equal value
8.5.2 Unemployment rate, by sex, age and persons with disabilities
Unemployment rate, by age and sex (percentage). 25 years of age and older. Total
8 8.6 By 2020, substantially reduce the proportion of youth not in employment, education or training
C-8.6 Proportion of young people (aged 15–24 years) not in education, employment or training, and not working exclusively in the home, unpaid, by sex
Proportion of young people neither studying nor working, by age, sex and reason (percentage). 15–24 years. Total
8 8.8 Protect labour rights and promote safe and secure working environments for all workers, including migrant workers, in particular women migrants, and those in precarious employment
8.8.1 Frequency rates of fatal and non-fatal occupational injuries, by sex and migrant status
Fatal occupational injuries of employees, by sex and migrant status (per 100,000 employees). Total
8 8.10 Strengthen the capacity of domestic financial institutions to encourage and expand access to banking, insurance and financial services for all
8.10.2 Proportion of adults (15 years and older) with an account at a bank or other financial institution or with a mobile-money-service provider
Proportion of adults (15 years and older) with an account at a bank or other financial institution or with a mobile-money-service provider, by sex (percentage). Total
8 8.a Increase Aid for Trade support for developing countries, in particular least developed countries, including through the Enhanced Integrated Framework for Trade-related Technical Assistance to Least Developed Countries
8.a.1 Aid for Trade commitments and disbursements Total official aid-for-trade flows (commitments), by recipient country (millions of dollars at constant 2018 prices)
8 8.a Increase Aid for Trade support for developing countries, in particular least developed countries, including through the Enhanced Integrated Framework for Trade-related Technical Assistance to Least Developed Countries
8.a.1 Aid for Trade commitments and disbursements Total official flows (disbursements) of aid for trade, by recipient country (millions of dollars at constant 2018 prices)
Table IV.A1.1 (continued)

Economic Commission for Latin America and the Caribbean (ECLAC)
136 IV
Sustainable Development Goal (SDG)
Target Indicator Series
9 9.2 Promote inclusive and sustainable industrialization and, by 2030, significantly raise industry’s share of employment and gross domestic product, in line with national circumstances, and double its share in least developed countries
9.2.1 Manufacturing value added as a proportion of GDP and per capita
Manufacturing value added as a proportion of GDP (percentage)
9 9.2 Promote inclusive and sustainable industrialization and, by 2030, significantly raise industry’s share of employment and gross domestic product, in line with national circumstances, and double its share in least developed countries
9.2.2 Manufacturing employment as a proportion of total employment
Manufacturing employment as a proportion of total employment (percentage)
9 9.4 By 2030, upgrade infrastructure and retrofit industries to make them sustainable, with increased resource-use efficiency and greater adoption of clean and environmentally sound technologies and industrial processes, with all countries taking action in accordance with their respective capabilities
9.4.1 CO2 emissions per unit of value added CO2 emissions from fossil fuel combustion (million tons)
9 9.5 Enhance scientific research, upgrade the technological capabilities of industrial sectors in all countries, in particular developing countries, including, by 2030, encouraging innovation and substantially increasing the number of research and development workers per 1 million people and public and private research and development spending
9.5.1 Research and development expenditure as a proportion of GDP
Research and development expenditure as a proportion of GDP (percentage)
9 9.5 Enhance scientific research, upgrade the technological capabilities of industrial sectors in all countries, in particular developing countries, including, by 2030, encouraging innovation and substantially increasing the number of research and development workers per 1 million people and public and private research and development spending
9.5.2 Researchers (in full-time equivalent) per 1,000,000 population
Researchers (in full-time equivalent) (per 1,000,000 population)
9 9.a Facilitate sustainable and resilient infrastructure development in developing countries through enhanced financial, technological and technical support to African countries, least developed countries, landlocked developing countries and small island developing States
9.a.1 Total official international support (official development assistance plus other official flows) to infrastructure
Total official flows for infrastructure, by recipient country (millions of dollars at constant 2018 prices)
9 9.b Support domestic technology development, research and innovation in developing countries, including by ensuring a conducive policy environment for, inter alia, industrial diversification and value addition to commodities
9.b.1 Proportion of medium and high-tech industry value added in total value added
Proportion of medium and high-tech industry value added in total value added (percentage)
9 9.c Significantly increase access to information and communications technology and strive to provide universal and affordable access to the Internet in least developed countries by 2021
9.c.1 Proportion of population covered by a mobile network, by technology
Proportion of population covered by a 2G or more advanced mobile network (percentage)
10 10.4 Adopt policies, especially fiscal, wage and social protection policies, and progressively achieve greater equality
10.4.1 Labour share of GDP, comprising wages and social protection transfers
Employment share of GDP (percentage)
10 10.5 Improve the regulation and monitoring of global financial markets and institutions and strengthen the implementation of such regulations
10.5.1 Financial soundness indicators Non-performing loans as a proportion of total gross loans (percentage)
10 10.5 Improve the regulation and monitoring of global financial markets and institutions and strengthen the implementation of such regulations
10.5.1 Financial soundness indicators Regulatory Tier 1 Capital as a proportion of risk-weighted assets (percentage)
Table IV.A1.1 (continued)

137
Building forward better: action to strengthen the 2030 Agenda for Sustainable Development
IV
Sustainable Development Goal (SDG)
Target Indicator Series
10 10.5 Improve the regulation and monitoring of global financial markets and institutions and strengthen the implementation of such regulations
10.5.1 Financial soundness indicators Regulatory capital as a proportion of assets (percentage)
10 10.6 Ensure enhanced representation and voice for developing countries in decision-making in global international economic and financial institutions in order to deliver more effective, credible, accountable and legitimate institutions
10.6.1 Proportion of members and voting rights of developing countries in international organizations
Proportion of members of developing countries in international organizations, by organization (percentage). Total
10 10.6 Ensure enhanced representation and voice for developing countries in decision-making in global international economic and financial institutions in order to deliver more effective, credible, accountable and legitimate institutions
Proportion of voting rights of developing countries in international organizations, by organization (percentage). Total
10 10.a Implement the principle of special and differential treatment for developing countries, in particular least developed countries, in accordance with World Trade Organization agreements
10.a.1 Proportion of tariff lines applied to imports from least developed countries and developing countries with zero-tariff
Proportion of tariff lines applied to imports with zero-tariff (percentage). Total
10 10.a Implement the principle of special and differential treatment for developing countries, in particular least developed countries, in accordance with World Trade Organization agreements
10.a.1 Proportion of tariff lines applied to imports from least developed countries and developing countries with zero-tariff
Proportion of tariff lines applied to imports with zero-tariff (percentage). Clothing
10 10.a Implement the principle of special and differential treatment for developing countries, in particular least developed countries, in accordance with World Trade Organization agreements
10.a.1 Proportion of tariff lines applied to imports from least developed countries and developing countries with zero-tariff
Proportion of tariff lines applied to imports with zero-tariff (percentage). Arms
10 10.a Implement the principle of special and differential treatment for developing countries, in particular least developed countries, in accordance with World Trade Organization agreements
10.a.1 Proportion of tariff lines applied to imports from least developed countries and developing countries with zero-tariff
Proportion of tariff lines applied to imports with zero-tariff (percentage). Industrial
10 10.a Implement the principle of special and differential treatment for developing countries, in particular least developed countries, in accordance with World Trade Organization agreements
10.a.1 Proportion of tariff lines applied to imports from least developed countries and developing countries with zero-tariff
Proportion of tariff lines applied to imports with zero-tariff (percentage). Agricultural
10 10.a Implement the principle of special and differential treatment for developing countries, in particular least developed countries, in accordance with World Trade Organization agreements
10.a.1 Proportion of tariff lines applied to imports from least developed countries and developing countries with zero-tariff
Proportion of tariff lines applied to imports with zero-tariff (percentage). Oil
10 10.a Implement the principle of special and differential treatment for developing countries, in particular least developed countries, in accordance with World Trade Organization agreements
10.a.1 Proportion of tariff lines applied to imports from least developed countries and developing countries with zero-tariff
Proportion of tariff lines applied to imports with zero-tariff (percentage). Textiles
10 10.b Encourage official development assistance and financial flows, including foreign direct investment, to States where the need is greatest, in particular least developed countries, African countries, small island developing States and landlocked developing countries, in accordance with their national plans and programmes
10.b.1 Total resource flows for development, by recipient and donor countries and type of flow (e.g. official development assistance, foreign direct investment and other flows)
Total development assistance, by recipient country (millions of current dollars)
10 10.b Encourage official development assistance and financial flows, including foreign direct investment, to States where the need is greatest, in particular least developed countries, African countries, small island developing States and landlocked developing countries, in accordance with their national plans and programmes
Total development flows, by recipient and donor countries (millions of current dollars)
Table IV.A1.1 (continued)

Economic Commission for Latin America and the Caribbean (ECLAC)
138 IV
Sustainable Development Goal (SDG)
Target Indicator Series
10 10.c By 2030, reduce to less than 3 per cent the transaction costs of migrant remittances and eliminate remittance corridors with costs higher than 5 per cent
10.c.1 Remittance costs as a proportion of the amount remitted
Remittance costs as a proportion of the amount remitted (percentage)
11 11.1 By 2030, ensure access for all to adequate, safe and affordable housing and basic services and upgrade slums
11.1.1 Proportion of urban population living in slums, informal settlements or inadequate housing
Proportion of urban population living in slums (percentage)
12 12.2 By 2030, achieve the sustainable management and efficient use of natural resources
12.2.2 Domestic material consumption, domestic material consumption per capita, and domestic material consumption per GDP
Domestic material consumption per capita, by raw material (tons). Total
12 12.2 By 2030, achieve the sustainable management and efficient use of natural resources
12.2.2 Domestic material consumption, domestic material consumption per capita, and domestic material consumption per GDP
Domestic material consumption per capita, by raw material (tons). Biomass
12 12.2 By 2030, achieve the sustainable management and efficient use of natural resources
12.2.2 Domestic material consumption, domestic material consumption per capita, and domestic material consumption per GDP
Domestic material consumption per capita, by raw material (tons). Fossil fuels
12 12.2 By 2030, achieve the sustainable management and efficient use of natural resources
12.2.2 Domestic material consumption, domestic material consumption per capita, and domestic material consumption per GDP
Domestic material consumption per capita, by raw material (tons). Metallic minerals
12 12.2 By 2030, achieve the sustainable management and efficient use of natural resources
12.2.2 Domestic material consumption, domestic material consumption per capita, and domestic material consumption per GDP
Domestic material consumption per capita, by raw material (tons). Non-metallic minerals
12 12.4 By 2020, achieve the environmentally sound management of chemicals and all wastes throughout their life cycle, in accordance with agreed international frameworks, and significantly reduce their release to air, water and soil in order to minimize their adverse impacts on human health and the environment
12.4.2 Hazardous waste generated per capita and proportion of hazardous waste treated, by type of treatment
Electronic waste generated (tons)
12 12.5 By 2030, substantially reduce waste generation through prevention, reduction, recycling and reuse
12.5.1 National recycling rate, tons of material recycled Recycling of electronic waste (tons)
12 12.c Rationalize inefficient fossil-fuel subsidies that encourage wasteful consumption by removing market distortions, in accordance with national circumstances, including by restructuring taxation and phasing out those harmful subsidies, where they exist, to reflect their environmental impacts, taking fully into account the specific needs and conditions of developing countries and minimizing the possible adverse impacts on their development in a manner that protects the poor and the affected communities
12.c.1 Amount of fossil-fuel subsidies per unit of GDP (production and consumption) and as a proportion of total national expenditure on fossil fuels
Amount of pre-tax fossil fuel subsidies (billions of current dollars)
12 12.c Rationalize inefficient fossil-fuel subsidies that encourage wasteful consumption by removing market distortions, in accordance with national circumstances, including by restructuring taxation and phasing out those harmful subsidies, where they exist, to reflect their environmental impacts, taking fully into account the specific needs and conditions of developing countries and minimizing the possible adverse impacts on their development in a manner that protects the poor and the affected communities
12.c.1 Amount of fossil-fuel subsidies per unit of GDP (production and consumption) and as a proportion of total national expenditure on fossil fuels
Amount of pre-tax fossil fuel subsidies per capita (current dollars)
Table IV.A1.1 (continued)

139
Building forward better: action to strengthen the 2030 Agenda for Sustainable Development
IV
Sustainable Development Goal (SDG)
Target Indicator Series
12 12.c Rationalize inefficient fossil-fuel subsidies that encourage wasteful consumption by removing market distortions, in accordance with national circumstances, including by restructuring taxation and phasing out those harmful subsidies, where they exist, to reflect their environmental impacts, taking fully into account the specific needs and conditions of developing countries and minimizing the possible adverse impacts on their development in a manner that protects the poor and the affected communities
12.c.1 Amount of fossil-fuel subsidies per unit of GDP (production and consumption) and as a proportion of total national expenditure on fossil fuels
Amount of pre-tax fossil fuel subsidies as a proportion of GDP (percentage)
13 13.3 Improve education, awareness-raising and human and institutional capacity on climate change mitigation, adaptation, impact reduction and early warning
C-13.3 Greenhouse gas (GHG) emissions by sector (economic activity)
Greenhouse gas emissions by sector (MtCO2e) Total
14 14.2 By 2020, sustainably manage and protect marine and coastal ecosystems to avoid significant adverse impacts, including by strengthening their resilience, and take action for their restoration in order to achieve healthy and productive oceans
C-14.2 Mangrove area Mangrove area (thousands of hectares)
14 14.5 By 2020, conserve at least 10 per cent of coastal and marine areas, consistent with national and international law and based on the best available scientific information
14.5.1 Coverage of protected areas in relation to marine areas
Average proportion of marine Key Biodiversity Areas (KBAs) covered by protected areas (percentage)
15 15.1 By 2020, ensure the conservation, restoration and sustainable use of terrestrial and inland freshwater ecosystems and their services, in particular forests, wetlands, mountains and drylands, in line with obligations under international agreements
15.1.1 Forest area as a proportion of total land area Forest area as a percentage of total land area (percentage)
15 15.1 By 2020, ensure the conservation, restoration and sustainable use of terrestrial and inland freshwater ecosystems and their services, in particular forests, wetlands, mountains and drylands, in line with obligations under international agreements
C-15.1.b Area of wetland included in the Convention on Wetlands of International Importance especially as Waterfowl Habitat (Ramsar Convention)
Area of wetland included in the Convention on Wetlands of International Importance especially as Waterfowl Habitat (Ramsar Convention) (hectares)
15 15.1 By 2020, ensure the conservation, restoration and sustainable use of terrestrial and inland freshwater ecosystems and their services, in particular forests, wetlands, mountains and drylands, in line with obligations under international agreements
15.1.2 Proportion of important sites for terrestrial and freshwater biodiversity that are covered by protected areas, by ecosystem type
Average proportion of terrestrial Key Biodiversity Areas (KBAs) covered by protected areas (percentage)
15 15.1 By 2020, ensure the conservation, restoration and sustainable use of terrestrial and inland freshwater ecosystems and their services, in particular forests, wetlands, mountains and drylands, in line with obligations under international agreements
Average proportion of freshwater Key Biodiversity Areas (KBAs) covered by protected areas (percentage)
15 15.4 By 2030, ensure the conservation of mountain ecosystems, including their biodiversity, in order to enhance their capacity to provide benefits that are essential for sustainable development
15.4.1 Coverage by protected areas of important sites for mountain biodiversity
Average proportion of mountainous Key Biodiversity Areas (KBAs) covered by protected areas (percentage)
15 15.5 Take urgent and significant action to reduce the degradation of natural habitats, halt the loss of biodiversity and, by 2020, protect and prevent the extinction of threatened species
15.5.1 Red List Index Red List Index
Table IV.A1.1 (continued)

Economic Commission for Latin America and the Caribbean (ECLAC)
140 IV
Sustainable Development Goal (SDG)
Target Indicator Series
15 15.a Mobilize and significantly increase financial resources from all sources to conserve and sustainably use biodiversity and ecosystems
15.a.1 (a) Official development assistance on conservation and sustainable use of biodiversity; and (b) revenue generated and finance mobilized from biodiversity-relevant economic instruments
Official development assistance for biodiversity, by recipient country (millions of constant 2018 United States dollars)
16 16.1 Significantly reduce all forms of violence and related death rates everywhere
16.1.1 Number of victims of intentional homicide per 100,000 population, by sex and age
Number of victims of intentional homicide, by sex (victims per 100,000 population). Women
16 16.1 Significantly reduce all forms of violence and related death rates everywhere
Number of victims of intentional homicide, by sex (victims per 100,000 population). Men
16 16.2 End abuse, exploitation, trafficking and all forms of violence against and torture of children
16.2.2 Number of victims of human trafficking per 100,000 population, by sex, age and form of exploitation
Detected victims of human trafficking, by age and sex (number) Total. Both sexes
16 16.3 Promote the rule of law at the national and international levels and ensure equal access to justice for all
16.3.2 Unsentenced detainees as a proportion of overall prison population
Unsentenced detainees as a proportion of overall prison population (percentage)
17 17.1 Strengthen domestic resource mobilization, including through international support to developing countries, to improve domestic capacity for tax and other revenue collection
17.1.1 Total government revenue as a proportion of GDP, by source
Total government revenue (central government budget) as a proportion of GDP (percentage)
17 17.1 Strengthen domestic resource mobilization, including through international support to developing countries, to improve domestic capacity for tax and other revenue collection
17.1.2 Proportion of domestic budget funded by domestic taxes
Proportion of domestic budget funded by domestic taxes (percentage of GDP)
17 17.3 Mobilize additional financial resources for developing countries from multiple sources
17.3.1 Foreign direct investment (FDI), official development assistance and South-South cooperation as a proportion of gross national income
Foreign direct investment inflows (millions of current dollars)
17 17.4 Assist developing countries in attaining long-term debt sustainability through coordinated policies aimed at fostering debt financing, debt relief and debt restructuring, as appropriate, and address the external debt of highly indebted poor countries to reduce debt distress
17.4.1 Debt service as a proportion of exports of goods and services
Debt service as a proportion of exports of goods and services (percentage)
17 17.6 Enhance North-South, South-South and triangular regional and international cooperation on and access to science, technology and innovation and enhance knowledge-sharing on mutually agreed terms, including through improved coordination among existing mechanisms, in particular at the United Nations level, and through a global technology facilitation mechanism
17.6.1 Fixed Internet broadband subscriptions per 100 inhabitants, by speed
Number of fixed broadband Internet subscribers, by speed (per 100 inhabitants). Any speed
17 17.8 Fully operationalize the technology bank and science, technology and innovation capacity-building mechanism for least developed countries by 2017 and enhance the use of enabling technology, in particular information and communications technology
17.8.1 Proportion of individuals using the Internet Internet users per 100 inhabitants (number)
17 17.10 Promote a universal, rules-based, open, non-discriminatory and equitable multilateral trading system under the World Trade Organization, including through the conclusion of negotiations under its Doha Development Agenda
17.10.1 Worldwide weighted tariff-average Worldwide weighted tariff-average, most-favoured-nation status, by product type (percentage). Total
Table IV.A1.1 (continued)

141
Building forward better: action to strengthen the 2030 Agenda for Sustainable Development
IV
Sustainable Development Goal (SDG)
Target Indicator Series
17 17.10 Promote a universal, rules-based, open, non-discriminatory and equitable multilateral trading system under the World Trade Organization, including through the conclusion of negotiations under its Doha Development Agenda
17.10.1 Worldwide weighted tariff-average Worldwide weighted tariff-average, preferential status, by product type (percentage). Total
17 17.11 Significantly increase the exports of developing countries, in particular with a view to doubling the least developed countries’ share of global exports by 2020
17.11.1 Developing countries’ and least developed countries’ share of global exports
Developing countries’ and least developed countries’ share of global goods exports (percentage)
17 17.11 Significantly increase the exports of developing countries, in particular with a view to doubling the least developed countries’ share of global exports by 2020
17.11.1 Developing countries’ and least developed countries’ share of global exports
Developing countries’ and least developed countries’ share of global goods imports (percentage)
17 17.11 Significantly increase the exports of developing countries, in particular with a view to doubling the least developed countries’ share of global exports by 2020
17.11.1 Developing countries’ and least developed countries’ share of global exports
Developing countries’ and least developed countries’ share of global service exports (percentage)
17 17.11 Significantly increase the exports of developing countries, in particular with a view to doubling the least developed countries’ share of global exports by 2020
17.11.1 Developing countries’ and least developed countries’ share of global exports
Developing countries’ and least developed countries’ share of global service imports (percentage)
17 17.12 Realize timely implementation of duty-free and quota-free market access on a lasting basis for all least developed countries, consistent with World Trade Organization decisions, including by ensuring that preferential rules of origin applicable to imports from least developed countries are transparent and simple, and contribute to facilitating market access
17.12.1 Average tariffs faced by developing countries, least developed countries and small island developing States
Tariff-average applied by developed countries, most-favoured-nation status, by product type (percentage)
17 17.12 Realize timely implementation of duty-free and quota-free market access on a lasting basis for all least developed countries, consistent with World Trade Organization decisions, including by ensuring that preferential rules of origin applicable to imports from least developed countries are transparent and simple, and contribute to facilitating market access
17.12.1 Average tariffs faced by developing countries, least developed countries and small island developing States
Tariff-average applied by developed countries, preferential status, by product type (percentage)
Source: Economic Commission for Latin America and the Caribbean (ECLAC).
Table IV.A1.1 (concluded)
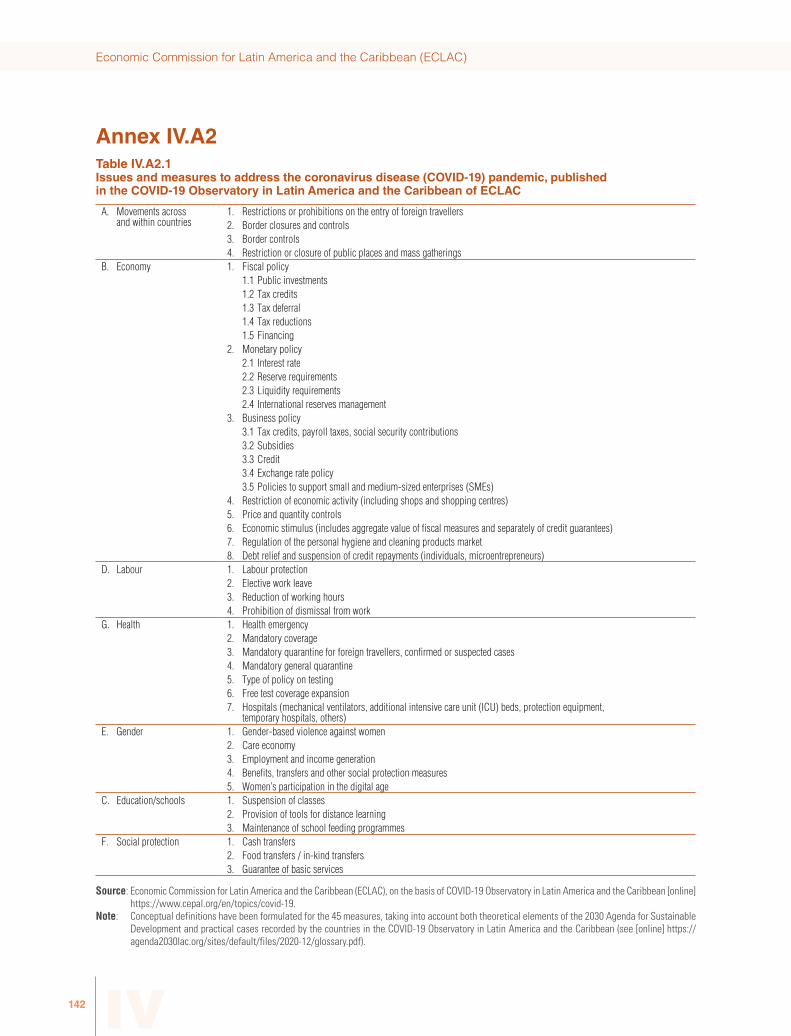
Economic Commission for Latin America and the Caribbean (ECLAC)
142 IV
Annex IV.A2Table IV.A2.1 Issues and measures to address the coronavirus disease (COVID-19) pandemic, published in the COVID-19 Observatory in Latin America and the Caribbean of ECLAC
A. Movements across and within countries
1. Restrictions or prohibitions on the entry of foreign travellers2. Border closures and controls3. Border controls4. Restriction or closure of public places and mass gatherings
B. Economy 1. Fiscal policy1.1 Public investments1.2 Tax credits1.3 Tax deferral1.4 Tax reductions1.5 Financing
2. Monetary policy2.1 Interest rate2.2 Reserve requirements2.3 Liquidity requirements2.4 International reserves management
3. Business policy3.1 Tax credits, payroll taxes, social security contributions3.2 Subsidies3.3 Credit3.4 Exchange rate policy3.5 Policies to support small and medium-sized enterprises (SMEs)
4. Restriction of economic activity (including shops and shopping centres)5. Price and quantity controls6. Economic stimulus (includes aggregate value of fiscal measures and separately of credit guarantees)7. Regulation of the personal hygiene and cleaning products market8. Debt relief and suspension of credit repayments (individuals, microentrepreneurs)
D. Labour 1. Labour protection2. Elective work leave3. Reduction of working hours4. Prohibition of dismissal from work
G. Health 1. Health emergency2. Mandatory coverage3. Mandatory quarantine for foreign travellers, confirmed or suspected cases4. Mandatory general quarantine5. Type of policy on testing 6. Free test coverage expansion7. Hospitals (mechanical ventilators, additional intensive care unit (ICU) beds, protection equipment,
temporary hospitals, others)E. Gender 1. Gender-based violence against women
2. Care economy3. Employment and income generation4. Benefits, transfers and other social protection measures5. Women’s participation in the digital age
C. Education/schools 1. Suspension of classes2. Provision of tools for distance learning 3. Maintenance of school feeding programmes
F. Social protection 1. Cash transfers 2. Food transfers / in-kind transfers3. Guarantee of basic services
Source: Economic Commission for Latin America and the Caribbean (ECLAC), on the basis of COVID-19 Observatory in Latin America and the Caribbean [online] https://www.cepal.org/en/topics/covid-19.
Note: Conceptual definitions have been formulated for the 45 measures, taking into account both theoretical elements of the 2030 Agenda for Sustainable Development and practical cases recorded by the countries in the COVID-19 Observatory in Latin America and the Caribbean (see [online] https://agenda2030lac.org/sites/default/files/2020-12/glossary.pdf).

143
Building forward better: action to strengthen the 2030 Agenda for Sustainable Development
IV
Annex IV.A3
National measures in response to coronavirus disease (COVID-19) and its impact on achievement of the Sustainable Development Goals (SDGs)
Table IV.A3.1 in this annex shows the relationship between the measures taken at the national level in Latin America and the Caribbean to address the COVID-19 pandemic and the targets of the 2030 Agenda for Sustainable Development.
How should the results be read?
The relationships and potential impacts identified between the actions against COVID-19 (classified according to the types of measures included in Annex IV.A2) and the 2030 Agenda targets are presented in matrices by theme: the 169 targets are shown in the rows and the measures in the columns. Where they intersect, the possible effect and the relationship (direct, partial or indirect) between the measures and the goal can be identified by means of different colours and their shades:
RELATIONSHIP EFFECT
IndirectPartialDirectPossible
positive effectPotential
negative effect
Positive direct relationship
Positive partial relationship
Positive indirect relationship
Negative indirect relationship
Negative partial relationship
Negative direct relationship
Green indicates measures that have a possible positive effect and red those that have a possible negative effect on the target. Each colour shade indicates the type of relationship between the measure and the goal (the darker the tone the more direct the relationship).

Economic C
omm
ission for Latin Am
erica and the Caribbean (EC
LAC
)
144IV Table IV.A3.1 Relationship between the measures taken at the national level in Latin America and the Caribbean to address the COVID-19 pandemic and the targets of the 2030 Agenda for Sustainable Development
Movement Economy Labour Health Gender Education Social Protection
1 2 3 4 1.1 1.2 1.3 1.4 1.5 2.1 2.2 2.3 2.4 3.1 3.2 3.3 3.4 3.5 4 5 6 7 8 1 2 3 4 1 2 3 4 5 6 7 1 2 3 4 5 1 2 3 1 2 3
SDG 1 1 2 3 4 1.1 1.2 1.3 1.4 1.5 2.1 2.2 2.3 2.4 3.1 3.2 3.3 3.4 3.5 4 5 6 7 8 1 2 3 4 1 2 3 4 5 6 7 1 2 3 4 5 1 2 3 1 2 3
1.1 International poverty
1.2 National poverty
1.3 Social protection
1.4 Access to basic services
1.5 Disaster resilience
1.a Resources for poverty programmes
1.b Poverty eradication policies
SDG 2 1 2 3 4 1.1 1.2 1.3 1.4 1.5 2.1 2.2 2.3 2.4 3.1 3.2 3.3 3.4 3.5 4 5 6 7 8 1 2 3 4 1 2 3 4 5 6 7 1 2 3 4 5 1 2 3 1 2 3
2.1 Undernutrition and food security
2.2 Malnutrition
2.3 Small-scale food producers
2.4 Sustainable agriculture
2.5 Genetic resources for agriculture
2.a Investment in agriculture
2.b Agricultural export subsidies
2.c Food price volatility
SDG 3 1 2 3 4 1.1 1.2 1.3 1.4 1.5 2.1 2.2 2.3 2.4 3.1 3.2 3.3 3.4 3.5 4 5 6 7 8 1 2 3 4 1 2 3 4 5 6 7 1 2 3 4 5 1 2 3 1 2 3
3.1 Maternal mortality
3.2 Child mortality
3.3 Communicable diseases
3.4 Non-communicable diseases and mental health
3.5 Abuse of addictive substances
3.6 Traffic accidents
3.7 Sexual and reproductive health

145
Building forw
ard better: action to strengthen the 2030 Agenda for Sustainable D
evelopment
IV
Movement Economy Labour Health Gender Education Social Protection
1 2 3 4 1.1 1.2 1.3 1.4 1.5 2.1 2.2 2.3 2.4 3.1 3.2 3.3 3.4 3.5 4 5 6 7 8 1 2 3 4 1 2 3 4 5 6 7 1 2 3 4 5 1 2 3 1 2 33.8 Universal health coverage
3.9 Health impacts of pollution
3.a Tobacco control
3.b Research and development for health
3.c Health financing and health workers
3.d Health risk management
SDG 4 1 2 3 4 1.1 1.2 1.3 1.4 1.5 2.1 2.2 2.3 2.4 3.1 3.2 3.3 3.4 3.5 4 5 6 7 8 1 2 3 4 1 2 3 4 5 6 7 1 2 3 4 5 1 2 3 1 2 3
4.1 Effective learning outcomes
4.2 Early childhood development
4.3 Quality technical, vocational and tertiary education and training
4.4 Skills for employment
4.5 Equal access to education
4.6 Adult literacy and numeracy
4.7 Education for sustainable development
4.a Education facilities
4.b Scholarships
4.c Qualified teachers
SDG 5 1 2 3 4 1.1 1.2 1.3 1.4 1.5 2.1 2.2 2.3 2.4 3.1 3.2 3.3 3.4 3.5 4 5 6 7 8 1 2 3 4 1 2 3 4 5 6 7 1 2 3 4 5 1 2 3 1 2 3
5.1 Discrimination against women and girls
5.2 Violence against women and girls
5.3 Child marriage
5.4 Unpaid care and domestic work
5.5 Women in leadership
5.6 Right to access to sexual and reproductive health
5.a Equal rights to economic resources
Table IV.A3.1 (continued)

Economic C
omm
ission for Latin Am
erica and the Caribbean (EC
LAC
)
146IV Movement Economy Labour Health Gender Education Social Protection
1 2 3 4 1.1 1.2 1.3 1.4 1.5 2.1 2.2 2.3 2.4 3.1 3.2 3.3 3.4 3.5 4 5 6 7 8 1 2 3 4 1 2 3 4 5 6 7 1 2 3 4 5 1 2 3 1 2 35.b Technology for the
empowerment of women
5.c Gender equality policies
SDG 6 1 2 3 4 1.1 1.2 1.3 1.4 1.5 2.1 2.2 2.3 2.4 3.1 3.2 3.3 3.4 3.5 4 5 6 7 8 1 2 3 4 1 2 3 4 5 6 7 1 2 3 4 5 1 2 3 1 2 3
6.1 Access to safe water
6.2 Access to sanitation and hygiene services
6.3 Water quality
6.4 Water-use efficiency
6.5 Transboundary cooperation on water resources
6.6 Water-related ecosystems
6.a International cooperation on water and sanitation
6.b Participatory water and sanitation management
SDG 7 1 2 3 4 1.1 1.2 1.3 1.4 1.5 2.1 2.2 2.3 2.4 3.1 3.2 3.3 3.4 3.5 4 5 6 7 8 1 2 3 4 1 2 3 4 5 6 7 1 2 3 4 5 1 2 3 1 2 3
7.1 Universal access to energy services
7.2 Share of renewable energy
7.3 Energy efficiency
7.a International cooperation on energy
7.b Investment in energy infrastructure
SDG 8 1 2 3 4 1.1 1.2 1.3 1.4 1.5 2.1 2.2 2.3 2.4 3.1 3.2 3.3 3.4 3.5 4 5 6 7 8 1 2 3 4 1 2 3 4 5 6 7 1 2 3 4 5 1 2 3 1 2 3
8.1 Per capita economic growth
8.2 Economic productivity and innovation
8.3 Formalization of small and medium-sized enterprises (SMEs)
8.4 Material resource efficiency
8.5 Full employment and decent work
8.6 Youth not in employment, education or training
8.7 Child labour and forced labour
Table IV.A3.1 (continued)

147
Building forw
ard better: action to strengthen the 2030 Agenda for Sustainable D
evelopment
IV
Movement Economy Labour Health Gender Education Social Protection
1 2 3 4 1.1 1.2 1.3 1.4 1.5 2.1 2.2 2.3 2.4 3.1 3.2 3.3 3.4 3.5 4 5 6 7 8 1 2 3 4 1 2 3 4 5 6 7 1 2 3 4 5 1 2 3 1 2 38.8 Labour rights and safe
and secure working environment
8.9 Sustainable tourism
8.10 Access to financial services
8.a Aid for Trade
8.b Youth employment strategy
SDG 9 1 2 3 4 1.1 1.2 1.3 1.4 1.5 2.1 2.2 2.3 2.4 3.1 3.2 3.3 3.4 3.5 4 5 6 7 8 1 2 3 4 1 2 3 4 5 6 7 1 2 3 4 5 1 2 3 1 2 3
9.1 Infrastructure development
9.2 Inclusive and sustainable industrialization
9.3 Access to finance for small-scale industries
9.4 Sustainable and clean industries
9.5 Research and Development
9.a Resilient infrastructure
9.b Domestic technology development
9.c Access to information and communications technology (ICT) and the Internet
SDG 10 1 2 3 4 1.1 1.2 1.3 1.4 1.5 2.1 2.2 2.3 2.4 3.1 3.2 3.3 3.4 3.5 4 5 6 7 8 1 2 3 4 1 2 3 4 5 6 7 1 2 3 4 5 1 2 3 1 2 3
10.1 Income growth (poorest 40 per cent)
10.2 Inclusion (social, economic, political)
10.3 Elimination of discrimination
10.4 Fiscal and social protection policies
10.5 Regulation of financial markets
10.6 Inclusive global governance
10.7 Safe migration and mobility
10.a Special and differential treatment (World Trade Organization)
Table IV.A3.1 (continued)

Economic C
omm
ission for Latin Am
erica and the Caribbean (EC
LAC
)
148IV Movement Economy Labour Health Gender Education Social Protection
1 2 3 4 1.1 1.2 1.3 1.4 1.5 2.1 2.2 2.3 2.4 3.1 3.2 3.3 3.4 3.5 4 5 6 7 8 1 2 3 4 1 2 3 4 5 6 7 1 2 3 4 5 1 2 3 1 2 310.b Financial flows
for development
10.c Remittance costs
SDG 11 1 2 3 4 1.1 1.2 1.3 1.4 1.5 2.1 2.2 2.3 2.4 3.1 3.2 3.3 3.4 3.5 4 5 6 7 8 1 2 3 4 1 2 3 4 5 6 7 1 2 3 4 5 1 2 3 1 2 3
11.1 Housing and basic services
11.2 Public transport systems
11.3 Sustainable urbanization
11.4 Cultural and natural heritage
11.5 Disaster resilience
11.6 Air quality and municipal waste management
11.7 Green areas and urban public spaces
11.a Urban planning
11.b Disaster management policies
11.c Sustainable and resilient buildings
SDG 12 1 2 3 4 1.1 1.2 1.3 1.4 1.5 2.1 2.2 2.3 2.4 3.1 3.2 3.3 3.4 3.5 4 5 6 7 8 1 2 3 4 1 2 3 4 5 6 7 1 2 3 4 5 1 2 3 1 2 3
12.1 Programmes on Sustainable Consumption and Production Patterns
12.2 Sustainable use of natural resources
12.3 Food waste and loss
12.4 Management of chemicals and waste
12.5 Reduction of waste generation
12.6 Sustainable corporate practices
12.7 Public procurement practices
12.8 Awareness of sustainable development
12.a Support to developing countries on research and development for sustainable consumption
Table IV.A3.1 (continued)

149
Building forw
ard better: action to strengthen the 2030 Agenda for Sustainable D
evelopment
IV
Movement Economy Labour Health Gender Education Social Protection
1 2 3 4 1.1 1.2 1.3 1.4 1.5 2.1 2.2 2.3 2.4 3.1 3.2 3.3 3.4 3.5 4 5 6 7 8 1 2 3 4 1 2 3 4 5 6 7 1 2 3 4 5 1 2 3 1 2 312.b Monitoring of
sustainable tourism
12.c Fossil-fuel subsidies
SDG 13 1 2 3 4 1.1 1.2 1.3 1.4 1.5 2.1 2.2 2.3 2.4 3.1 3.2 3.3 3.4 3.5 4 5 6 7 8 1 2 3 4 1 2 3 4 5 6 7 1 2 3 4 5 1 2 3 1 2 3
13.1 Resilience and adaptive capacity
13.2 Climate change policies
13.3 Climate change awareness
13.a Commitments to the United Nations Framework Convention on Climate Change
13.b Climate change-related planning and management
SDG 14 1 2 3 4 1.1 1.2 1.3 1.4 1.5 2.1 2.2 2.3 2.4 3.1 3.2 3.3 3.4 3.5 4 5 6 7 8 1 2 3 4 1 2 3 4 5 6 7 1 2 3 4 5 1 2 3 1 2 3
14.1 Marine pollution
14.2 Marine and coastal ecosystems
14.3 Ocean acidification
14.4 Sustainable fisheries
14.5 Conservation of coastal and marine areas
14.6 Fisheries subsidies
14.7 Marine resources for small island developing States (SIDS) and least developed countries
14.a Marine research and technology capacity
14.b Small-scale artisanal fishers
14.c Implement United Nations Convention on the Law of the Sea
SDG 15 1 2 3 4 1.1 1.2 1.3 1.4 1.5 2.1 2.2 2.3 2.4 3.1 3.2 3.3 3.4 3.5 4 5 6 7 8 1 2 3 4 1 2 3 4 5 6 7 1 2 3 4 5 1 2 3 1 2 3
15.1 Terrestrial and freshwater ecosystems
Table IV.A3.1 (continued)

Economic C
omm
ission for Latin Am
erica and the Caribbean (EC
LAC
)
150IV Movement Economy Labour Health Gender Education Social Protection
1 2 3 4 1.1 1.2 1.3 1.4 1.5 2.1 2.2 2.3 2.4 3.1 3.2 3.3 3.4 3.5 4 5 6 7 8 1 2 3 4 1 2 3 4 5 6 7 1 2 3 4 5 1 2 3 1 2 315.2 Sustainable forest
management
15.3 Desertification and land degradation
15.4 Conservation of mountain ecosystems
15.5 Biodiversity loss
15.6 Utilization of genetic resources
15.7 Trafficking of protected species
15.8 Invasive alien species
15.9 Biodiversity in national and local planning
15.a Resources for biodiversity and ecosystems
15.b Forest management resources
15.c Trafficking of protected species (global)
SDG 16 1 2 3 4 1.1 1.2 1.3 1.4 1.5 2.1 2.2 2.3 2.4 3.1 3.2 3.3 3.4 3.5 4 5 6 7 8 1 2 3 4 1 2 3 4 5 6 7 1 2 3 4 5 1 2 3 1 2 3
16.1 Reduction in violence and related deaths
16.2 Trafficking in children
16.3 Justice for all
16.4 Illicit financial and arms flows
16.5 Corruption and bribery
16.6 Effective institutions
16.7 Inclusive decision-making
16.8 Inclusive global governance
16.9 Legal identity
16.10 Public access to information
16.a Capacity to prevent violence
16.b Non-discriminatory policies
Table IV.A3.1 (continued)

151
Building forw
ard better: action to strengthen the 2030 Agenda for Sustainable D
evelopment
IV
Movement Economy Labour Health Gender Education Social Protection
1 2 3 4 1.1 1.2 1.3 1.4 1.5 2.1 2.2 2.3 2.4 3.1 3.2 3.3 3.4 3.5 4 5 6 7 8 1 2 3 4 1 2 3 4 5 6 7 1 2 3 4 5 1 2 3 1 2 3
SDG 17 1 2 3 4 1.1 1.2 1.3 1.4 1.5 2.1 2.2 2.3 2.4 3.1 3.2 3.3 3.4 3.5 4 5 6 7 8 1 2 3 4 1 2 3 4 5 6 7 1 2 3 4 5 1 2 3 1 2 3
17.1 Collection of tax and other revenue
17.2 Official development assistance commitments by developed countries
17.3 Additional financial resources
17.4 Debt sustainability
17.5 Investment promotion for least developed countries
17.6 International cooperation on science and technology
17.7 Technology transfer
17.8 Capacity-building for information and communications technology (ICT)
17.9 Capacity-building for SDGs
17.10 Universal multilateral trading system
17.11 Exports from developing countries
17.12 Duty-free market access for least developed countries
17.13 Global macroeconomic stability
17.14 Policy coherence for sustainable development
17.15 Respect for the policy space of each country
17.16 Global Partnership for Sustainable Development
17.17 Effective partnerships (public, private, civil society)
17.18 National data availability
17.19 Statistical capacity-building
Source: Economic Commission for Latin America and the Caribbean (ECLAC), on the basis of Regional Knowledge Platform on the 2030 Agenda in Latin America and the Caribbean, “National measures in response to the COVID-19 and its effect on the SDGs”, 2021 [online] https://agenda2030lac.org/en/national-measures-response-covid-19-and-its-effect-sdgs.
Table IV.A3.1 (concluded)


153
Building forward better: action to strengthen the 2030 Agenda for Sustainable Development
Transformative recovery: from a new paradigm to new policies
A. Crisis response: urgent action, keeping sight of the long term
B. The three dimensions of sustainability
C. One possible scenario: end poverty by 2030 and meet conditional nationally determined contributions (NDCs)
D. The sectors driving the big push for sustainability
E. General macroeconomic, social and environmental policies
F. Conclusion: towards a sustainable global economy with national policies for a big push and multilateral coordination in the international system
Bibliography
CHAPTER V


155V
A. Crisis response: urgent action, keeping sight of the long term
1. Crises are an opportunity for redefining ideas, alliances and policies
Crises open up space for reshaping the ideas and political alliances that underpin development strategies. They demand urgent responses and break down the ideological and political barriers to the transformation of the economy and society.
There is no single response to crises, but there are competing visions of which model would be best suited to overcoming them.1 Crises are often preceded by opposing ideas and debates on strategies; at the same time, they act as catalysts to effect action and a paradigm shift. This is precisely why the international community and the United Nations have called for the 2020s to be a decade of action. Demand for change has been brewing for a long time and is manifest in social unrest and political tensions. The pandemic has shown that an immediate response is imperative.
The paths that countries take are not predetermined. There are periods of trial and error, of progress and setbacks driven by social demands and conflict, and from these a new pattern emerges.
This chapter aims to offer a way out of the crisis that combines the strengthening of democracy (at the national level) and multilateral cooperation (at the international level) with sustainable growth and equality.
The strategy involves achieving the objectives of the 2030 Agenda for Sustainable Development and takes up the challenge of the decade of action through global efforts to improve leadership, resources and solutions to achieve the Sustainable Development Goals (SDGs); national efforts to transform public policies, budgets, institutions, and legal frameworks at all levels of government; and citizen action, with young people, civil society, the media, the private sector, trade unions, academia and other stakeholders mobilizing to drive the necessary changes, including more equal and environmentally sustainable societies in a global system in which peace and cooperation prevail.
The proposal for a transformative recovery is based on the following considerations (see ECLAC, 2020a). First, the impact of the pandemic must be examined in the context of the structural problems that were already affecting the international economy and that led to the 2008 crisis. These problems reflect the shortcomings of the development model (hyperglobalization) prevailing since the late 1970s and the early 1980s. Second, the response to the crisis must combine short-term measures for overcoming the emergency and long-term measures to address the structural issues inherent in the previous growth pattern. Third, there is a technological-productive component and a sectoral dimension to both the crisis and its exit strategy that must be fully incorporated in the analysis and design of policies. Lastly, policies to transform the development pattern must take into account the complex and multiple interlinkages between the social, economic and environmental dimensions of development. The Economic Commission for Latin America and the Caribbean (ECLAC) has highlighted the existence of a virtuous interaction between the construction of a welfare state, technical change and the transformation of production, with an expansion of formal employment and endogenous capacity-building (ECLAC, 2020a). This is the foundation of the ECLAC proposal for a transformative recovery, which is discussed in the sections below.
1 This was the case in the Great Depression and the responses thereto that emerged in the 1930s, such as the New Deal in the United States or authoritarian nationalist regimes in Western Europe. During the 2008 crisis, Europe was caught between austerity measures and proposals for expansionary fiscal and monetary policies; austerity was only abandoned when its enormous social, political and economic costs could no longer be overlooked.

Economic Commission for Latin America and the Caribbean (ECLAC)
156 V
2. A new development model calls for a new relationship between the State, the market and society
While the 2008 crisis and the COVID-19 pandemic opened up space for ideas and policy, the strategy to be adopted will depend heavily on the partnerships that are forged. By and large, there are three types of response: the business-as-usual (BAU) response, in which the old model is kept alive but with some modifications to alleviate its structural problems; the confrontational or rivalry response in which major economies resort to beggar-thy-neighbour policies, abandoning multilateralism and increasing geopolitical competition (in a scenario reminiscent of the 1930s); and a response that seeks to overcome the crisis through domestic and international cooperation agreements —strengthening democracy and institutional mechanisms for multilateral cooperation— with a view to addressing the structural problems of the old model.
Each of the responses mentioned above (business-as-usual, rivalry and cooperation) assumes a certain relationship between State, market and civil society. In the business-as-usual response model, the expansion of the State is seen as barrier to market development. In the rivalry model, the expansion of one State’s powers limits that of other States and is seen as a threat. However, when multilateral cooperation in a democratic context is sought, building State capacity makes markets more stable and predictable, corrects external constraints and offsets imbalances, thus helping the economy to function efficiently. Increasing the capacity of a State helps the international system as a whole to achieve goals ranging from peace to protection of the biosphere that, by their very nature, can only be achieved through a global effort and cooperation among several countries.
With regard to compacts, the relationship between State, market and society is not a zero-sum game. This is the point made by Sunkel when he speaks of the need to overcome the dichotomy between State-centric and market-centric styles of development. As he emphasizes, what is required is a neo-structuralist approach and a sociocentric perspective, in which the State must respond to citizens and strategically guide and regulate the market (Sunkel, 2006).
The business-as-usual model presupposes the continuation of the market-centric pattern of hyperglobalization, meaning that the structural problems mentioned above will only worsen over time. The model marked by geopolitical competition and unilateralism harks back to an era of clashes between nation States. In this scenario, major powers opt to build power blocs in a more fragmented world, rather than seek a coordinated multilateral response to global problems. Unilateralism and beggar-thy-neighbour rivalry make for a world that is more unstable, both politically (as democracy and peace come under increasing threat) and economically. At the domestic level, exclusionary attitudes and a loss of confidence in democracy become entrenched. One scenario that could emerge is a mixture of increased military spending and regressive tax policies, often supported by a xenophobic discourse against diversity and pluralism.
ECLAC proposes a win-win situation in which society and markets do not fear the capacities of the State, because it is these capacities that help civil society to achieve its goals more effectively. If they are to provide stability, promote societal goals and ensure that the necessary agreements among stakeholders are concluded, States must jump-start their technological and public policy management capabilities, all the more so in a world of accelerating technical progress with companies whose strategies and competitiveness are rapidly evolving.
In the same vein, Evans (1992) argues that the State is the “problem and solution”, as it is an agent that must have the independence to define strategies without being co-opted by corporate interests, and at the same time, be capable of cooperating with the worlds of business and labour in order to implement said strategies. More recently, Acemoglu and Robinson (2019) draw on the longue durée 2 perspective to argue that successful examples of development move through a narrow corridor in which
2 This is the classic term used by Braudel (1980).
157
Building forward better: action to strengthen the 2030 Agenda for Sustainable Development
V
there is a mutually reinforcing process of the State building its capacity to intervene and provide public goods while society builds its capacity to control and demand accountability from the State.
In its analysis of the political bases for a development strategy based on the SDGs, ECLAC (2014a) posits that compacts play a vital role in a democratic context, highlighting the importance of fiscal compacts, compacts for natural resource governance, industrial policy and the search for equality as an objective and an instrument of development. Compacts should be instruments that create transparency and guide States’ actions, ensuring compliance and preventing them from serving only the narrow interests of powerful groups. At the same time, the decade of action must serve to consolidate democracy and multilateralism.
To summarize, in all the analyses above, the traditional view of a zero-sum game between the State, the market and civil society is replaced (under certain conditions) by a game in which the capacities of each of these stakeholders are positively reinforced around democratically defined and monitored objectives.
B. The three dimensions of sustainabilityAgainst the backdrop of the region’s structural problems, the response to the crisis must be capable of integrating the three dimensions of sustainable development —economic, social and environmental. To this end, ECLAC (2020a) has proposed a three-gap model combining these three dimensions, which is discussed below.
1. The three growth rates of sustainable development
In order to integrate the three dimensions of sustainable development —social, technological-productive and environmental— into a single analytical framework, the three growth rates and their determinants must first be defined.
The first is the growth rate compatible with external equilibrium, yE, which maintains equilibrium in the basic balance (the current account plus long-term financial flows) of the balance of payments. This rate depends on growth in the rest of the world (as this increases demand for exports from Latin America and the Caribbean) and on genuine competitiveness, which is achieved through structural change and technical progress. Genuine competitiveness determines how much of the domestic and effective external demand is captured by a given country based on the development of its technological and innovation capacities and narrowing of the gap in relation to the international technological frontier. Without these technological capabilities, the country’s growth will be limited by the onset of current account imbalances, high indebtedness and exchange-rate crises.3 While commodity price booms may temporarily alleviate the external constraint on growth, in the long run there must be a shift in the pattern of specialization and an acceleration in the diffusion of technology for yE to increase.
The external constraint in Latin America and the Caribbean is a manifestation of the existence of persistent asymmetries in a centre-periphery system. The first asymmetry is on the technological and production front: Latin America and the Caribbean is less diversified and lags behind in technology. The second is financial: the countries of the region (and the periphery, in general) do not issue an international reserve currency and must therefore finance their external deficits in foreign currency. When these deficits widen in relation to the periphery’s ability to pay (which hinges on exports and the terms of trade), it becomes increasingly difficult for the periphery to access financing on international markets. This increases the pressure on the indebted country to devalue its currency and reduce its rate
3 For more details, see Blecker and Setterfield (2019a) and Botta (2018).

Economic Commission for Latin America and the Caribbean (ECLAC)
158 V
of growth and investment. Increased commodity price volatility is another factor that links the pattern of specialization to greater uncertainty and lower investment.
The second rate defined in the model is the minimum growth rate necessary to reduce inequality, yS. This is the rate required to reduce structural heterogeneity and absorb workers who are unemployed and underemployed into formal jobs with increasing productivity; it is also the rate required to finance social policies and income transfer programmes. While purely redistributive policies can do much to reduce inequality, the creation of formal jobs —achieved through growth and productive diversification— must complement these policies if inequality is to fall significantly over time. Redistribution and rapid creation of jobs with increasing productivity must go hand in hand in the construction of a welfare state, which has always been short-lived in the economic history of Latin America and the Caribbean.
Lastly, these growth rates must be compatible with environmental protection. The rate of growth consistent with environmental sustainability, yA, is the rate that respects planetary boundaries and protects the planet for the development of future generations. This rate is determined by global growth and by the speed and direction of technical progress. In simple terms, it can be viewed from the perspective of a fixed carbon budget that can be shared among different countries. If the rest of the world grows faster (and emits more carbon dioxide (CO2)), the rate yA will fall as there will be less room for growth and emissions in Latin America and the Caribbean. Conversely, technical progress towards decarbonization increases yA, because it increases the carbon budget available given the growth of the rest of the world. The same is true when technical progress leads to less intensive use of natural resources and/or lower impacts on biodiversity and global common goods, or when consumption patterns shift towards less polluting goods.
2. The rates must converge towards the minimum rate of growth required for equality
In the rates yA and yS, two dimensions of equality intersect: (a) intergenerational equality, which takes into account the right of future generations to the same environmental services for their development as the present generation; (b) intragenerational equality (affecting the current generation), which involves the right of the poorest countries (and the poorest in each country) to improve their levels of income and well-being at a faster rate than the richest countries (and the richest in each country).
For there to be sustainable development, these three growth rates must be equal, yS = yE = yA. Considering the inequality and the weight of informality and underemployment in Latin America and the Caribbean, the minimum growth rate for equality tends to be higher than the rate consistent with external balance. In addition, the accumulation of environmental problems means that the rate consistent with external balance is often higher than the maximum rate compatible with environmental protection objectives. The great challenge in terms of long-term policies is then to make the other two rates converge with the minimum growth necessary to reduce inequality. Diagram V.1 illustrates how the three rates interact and how to achieve them with a combination of social, industrial and environmental policies.
The three growth rates can be represented by a triangle, with one vertex being the minimum growth rate to reduce inequality, one the rate consistent with external equilibrium and one the maximum rate compatible with environmental protection. The vertical arrow denotes social and redistributive policies to reduce inequality. At the same time, decarbonization and environmental innovations are the key for yA to converge towards yS; and genuine competitiveness is the key to convergence between yE and yS. At the base of the triangle, linking yA and yE, is the co-evolution between technical progress and environmentally friendly structural change. This relationship is at the base of the triangle because technical progress underpins genuine competitiveness and decarbonization (or more broadly, the transition to cleaner energy and production patterns). For the economy to be competitive, technical progress must be intense and it must be directed towards environmental innovations to ensure that increased production does not put the planet at risk.

159
Building forward better: action to strengthen the 2030 Agenda for Sustainable Development
V
Diagram V.1 Policies to close sustainable development gaps
Redi
stri
butio
n
Deca
rbon
izatio
n Structural change
Growth limit in line with Paris Agreement
Minimum target for growth with equality
Growth limit consistentwith external equilibrium
1.4%2.6%
4%
1.2% Technical progress
Source: Economic Commission for Latin America and the Caribbean (ECLAC).
Important synergies can be generated by efforts to achieve these three rates, as progress in one dimension feeds progress in the others. Thus, equality and genuine competitiveness are mutually reinforcing: societies that are more egalitarian and that successfully universalize access to health and education tend to promote and accept technical change more easily, which has a positive impact on productivity. Consequently, development policies are less likely to be captured by concentrated economic power. Similarly, genuine competitiveness and environmental sustainability can also be mutually reinforcing. Without endogenous technological capabilities, it is impossible to respond adequately to environmental challenges; in turn, environmental innovations can foster competitiveness in innovating firms as consumers make increasingly educated choices in favour of goods produced with less environmental impact. All these dimensions come together to form what ECLAC (2020a) has called policies for a big push for sustainability.
C. One possible scenario: end poverty by 2030 and meet conditional nationally determined contributions (NDCs)
1. Estimation of the three growth rates
This section updates the exercise described in the ECLAC position document (ECLAC, 2020a), which presented some quantitative results by combining the objectives of the technology-production, social and environmental dimensions of sustainable development. To this end, estimates are made of the three growth rates presented in the previous section: the rate necessary to reduce inequality, the rate compatible with external equilibrium and the rate consistent with environmental balance, and the combination of distributive policies and productive transformation that would allow these rates to be aligned is discussed.
As a quantitative indicator of the growth rate needed to reduce inequality, the target used is the eradication of income poverty. This is an ambitious target, given that the pandemic has significantly increased poverty rates. The region’s GDP is expected to fall by -7.7% compared with 2019 (ECLAC, 2020b), while global GDP is projected to contract by -4.4% (IMF, 2020). These projections would bring the number of people living in poverty in Latin America and the Caribbean in 2020 to 209 million (33.7% of the population).

Economic Commission for Latin America and the Caribbean (ECLAC)
160 V
The exercise below assumes the following redistribution policy: for the first year (2021), the government redirects 1.5% of GDP to the poorest households in the form of an emergency basic income consisting of a cash transfer equivalent to the poverty line, increasing the amount of the transfer by 0.5 points of GDP annually to reach 3.0% of GDP in 2024, whereupon it would remain constant until 2030. The number of poor will decrease over time; on the one hand, GDP growth creates jobs which reduce poverty and, on the other, basic income transfers lift more and more people out of poverty. The latter effect is explained by the increase in the share of GDP allocated to transfers between 2021 and 2024, and the fact that the increase in GDP means that while the same percentage is transferred, the monetary amount received is higher.
Distributive policies are likely to reduce inequality significantly. If the income transfer to the poorest 10% of the population were financed by taxes levied on the richest 10%, the ratio of the income of the richest 10% relative to the poorest 10% would shrink from 20 to 9, the Palma ratio would fall from 2.6 to 1.9, and the Gini index would drop from 0.46 to 0.40, bringing the region’s Gini into line with that of Uruguay by 2030. Such reductions in inequality are not unattainable: while inequality would remain higher than the average for the Organization for Economic Cooperation and Development (OECD), it would be significantly reduced and poverty virtually eradicated (ECLAC, 2020a).
Figure V.1 shows the changes in the number living in poverty in Latin America and the Caribbean under two scenarios, both within a context of robust distributive policies mentioned above. The first scenario puts the region’s annual GDP growth rate at 2.5% and the second at 4%. Only in the second scenario does the region eradicate poverty by 2030.
Figure V.1 Latin America and the Caribbean: persons living in poverty following the implementation of redistribution policies, 2020–2030(Millions of people)
0
50
100
150
200
250
2020 2021 2022 2023 2024 2025 2026 2027 2028 2029 2030
Scenario of GDP growth of 2.5%
Scenario of GDP growth of 4%
Source: Economic Commission for Latin America and the Caribbean (ECLAC).
In sum, it can be said that, in the framework of a heavily redistributive process, the growth rate necessary to reduce inequality would be 4%.

161
Building forward better: action to strengthen the 2030 Agenda for Sustainable Development
V
2. There are forces that lead to external balance but do not close social and environmental gaps
Is the growth rate necessary to reduce inequality compatible with the external balance? One way of estimating it is through the ratio of income elasticities of exports and imports, and the growth of the rest of the world. Table V.1 shows the results of the estimation of the elasticities ratio. While the results vary significantly by country, only in the case of Panama is the ratio close to 2. In all the others, values are below 1.5, apart from Costa Rica, which has a ratio of 1.6. The average ratio of income elasticity of exports to imports (ε/π) for South America is approximately 0.7. This means that if global growth were to reach 2% in the next few years, this subregion could grow by 1.4% without increasing its external debt.4 This is far short of the growth required to eradicate poverty, even with the implementation of robust redistribution policies. The above values differ greatly from those of the most successful Asian countries, which show elasticities ratios greater than 2. For example, with hypothetical global growth of 2%, China could grow by as much as 6% without being affected by the external constraint (ECLAC, 2020a).
Table V.1 Foreign trade elasticities, by region 1993–2017
Income elasticityof exports a
Income elasticityof imports Ratio
South America Argentina 0.9 1.5 0.6
Bolivia (Plurinational State of) 1.7 1.3 1.3
Brazil 1.0 1.7 0.6
Chile 2.1 1.5 1.4
Colombia 1.7 1.6 1.0
Ecuador 1.1 1.2 0.9
Paraguay 1.0 1.0 1.0
Peru 2.0 1.4 1.4
Uruguay 1.5 1.3 1.1
Venezuela (Bolivarian Republic of) 0.4 2.4 0.2
Central America and Mexico Costa Rica 1.8 1.1 1.6
El Salvador 1.3 1.1 1.1
Guatemala 2.0 2.2 0.9
Honduras 1.3 0.9 1.4
Mexico 1.8 2.3 0.8
Nicaragua 2.9 2.0 1.4
Panama 1.5 0.8 1.9
Asia China 4.5 1.6 2.8
Republic of Korea 3.7 1.5 2.5
Viet Nam 5.0 2.1 2.3
South America 1.1 1.5 0.7
Central America 1.7 1.4 1.3
Central America and Mexico 1.7 1.4 1.3
Source: Economic Commission for Latin America and the Caribbean (ECLAC), on the basis institutional data, data from the World Bank and the International Monetary Fund (IMF).
a Estimates of the income elasticity of exports were based on exports and global GDP at constant prices, and estimates of the income elasticity of imports were based on imports and each country’s GDP at constant prices. The real exchange rate was used as a control variable for both equations. All variables were expressed in logarithmic levels.
4 Quantitative exercises carried out for the countries of the Caribbean Community (CARICOM) during the period 1990–2005 estimate that the average rate of growth compatible with external balance is approximately 3%. However, high levels of external debt in many CARICOM economies indicate that this rate would be difficult to achieve as it does not take into account the impact of debt service (ECLAC, 2020a).

Economic Commission for Latin America and the Caribbean (ECLAC)
162 V
In short, the growth rate compatible with external balance is lower than the growth rate needed to reduce inequality (yS > yE). This is what ECLAC has called the social gap.
Market forces (notably the increasing difficulty of financing external deficits in international markets) are such that the rate of growth compatible with external balance is likely to dominate in the long run. This rate is insufficient to address the serious problems of poverty and poor income distribution in Latin America and the Caribbean, and the social gap persists. At the same time, the rate is too high for achieving environmental goals, as discussed below.
In order to estimate the rate of growth consistent with environmental protection, greenhouse gas emission reduction targets will be used as a benchmark. This is only one of many environmental variables that would need to be considered, so the exercise should be taken as a very imperfect approximation of the challenge of decoupling growth from environmental degradation. It is based on the principle of common but differentiated responsibilities. Latin America and the Caribbean only has to meet nationally determined contributions (NDCs), while the rest of the world —particularly those countries with the highest per capita income— makes the necessary adjustments to achieve the science-driven targets and avoid the potentially catastrophic effects of climate change. These targets are to hold the increase in the global temperature below 2°C and pursue efforts to limit the temperature increase to 1.5°C.
Under the Paris Agreement, countries are required to define and implement their nationally determined contributions and to progressively increase their targets. These contributions are a frame of reference for linking national policies that support the big push for sustainability and efforts under the international agenda to keep the world within the environmental sustainability frontier. Mere compliance with conditional NDCs is clearly inadequate as an emissions reduction target for Latin America and the Caribbean, even if it is accepted that the region bears less responsibility than the rest of the world for the environmental crisis. ECLAC (2020a) is in favour of a significant strengthening of NDCs in the next few years and maintains that environmental policy must be a main focus of economic recovery. With this proviso, the NDC criteria are used in the numerical exercises as a first attempt to estimate the scale of the decarbonization effort and technical shift towards sustainability needed in the region over the next decade.5
Figure V.2 shows the emissions pathway for Latin American and Caribbean countries and the rest of the world to 2030 under different scenarios for meeting their conditional and unconditional NDCs. The impact of the pandemic on emissions has given Latin America and the Caribbean three to four years in which to make the necessary investments to change its growth pattern in order to meet conditional NDCs.
In the left panel of figure V.3, we assume average growth of 2.5% and a faster pace of technical progress to meet the decarbonization rates needed to achieve emission-reduction objectives. In the BAU scenario, decarbonization in Latin America and the Caribbean would occur at a rate of 1.9% per year. The region would have to increase its decarbonization rate to 2.2% to comply with unconditional NDCs, while decarbonization at an annual rate of 3.4% would be required to meet conditional commitments.
The rest of the world would decarbonize at an annual rate of 1.4% in the BAU scenario. This rate is sufficient to meet unconditional commitments but would have to increase to 1.8% for conditional NDCs to be met. These rates are notoriously insufficient: if the targets of keeping the temperature rise below 1.5°C and 2°C are to be met, the rest of the world would need to achieve a decarbonization rate of 6.1% and 9.5% per year, respectively.
5 NDCs can be found [online] at http://www4.unfccc.int/ndcregistry/Pages/All.aspx.

163
Building forward better: action to strengthen the 2030 Agenda for Sustainable Development
V
Figure V.2 Latin America and the Caribbean and the rest of the world: level of emissions in different scenarios, 2000–2030(Gigatons of CO2 equivalent)
2.0
2.5
3.0
3.5
4.0
4.5
5.0
2000
2001
2002
2003
2004
2005
2006
2007
2008
2009
2010
2011
2012
2013
2014
2015
2016
2017
2018
2019
2020
2021
2022
2023
2024
2025
2026
2027
2028
2029
2030
A. Latin America and the Caribbean
B. Rest of world
20
25
30
35
40
45
50
55
2005
2006
2007
2008
2009
2010
2011
2012
2013
2014
2015
2016
2017
2018
2019
2020
2021
2022
2023
2024
2025
2026
2027
2028
2029
2030
BAU scenario(includes the effect of the pandemic
Without COVID-19Unconditional NDCConditional NDC2°C rise based on science
1.5°C rise based on science
Source: Economic Commission for Latin America and the Caribbean (ECLAC), on the basis of J. Gütschow and others, “The PRIMAP-hist national historical emissions time series (1850-2017)”, version 2.1, 2019 [online database] https://doi.org/10.5880/pik.2019.018; Economic Commission for Latin America and the Caribbean (ECLAC), CEPALSTAT, 2021 [online database] https://estadisticas.cepal.org/cepalstat/portada.html?idioma=english; World Bank, World development indicators, 2020 [online database] https://databank.worldbank.org/reports.aspx?source=world-development-indicators, and Food and Agriculture Organization of the United Nations (FAO), Corporate Database for Substantive Statistical Data (FAOSTAT), 2021 [online] http://www.fao.org/faostat/en/#home.
Note: The sources of greenhouse gas emissions are the energy, agriculture and livestock, waste, industrial processes and land-use change and forestry sectors, according to the Intergovernmental Panel on Climate Change (IPCC) classification. Comprises 133 countries. Antigua and Barbuda, Argentina, Bahamas, Barbados, Belize, Brazil, Bolivarian Republic of Venezuela, Chile, Colombia, Costa Rica, Cuba, Dominica, Dominican Republic, Ecuador, El Salvador, Grenada, Guatemala, Guyana, Haiti, Honduras, Jamaica, Mexico, Nicaragua, Panama, Paraguay, Peru, Plurinational State of Bolivia, Saint Kitts and Nevis, Saint Lucia, Saint Vincent and the Grenadines, Suriname, Trinidad and Tobago and Uruguay.

Economic Commission for Latin America and the Caribbean (ECLAC)
164 V
Figure V.3 Latin America and the Caribbean and the rest of the world: technical progress and environmentally sustainable GDP growth, 2020–2030(Percentages)
2.5 2.82.2
2.8
1.0
2.3
1.0 1.0
-12
-10
-8
-6
-4
-2
0
2
4
Latin America andthe Caribbean
Rest of the world Latin America andthe Caribbean
Rest of the world
Decabornization required(technological change, fixed growth)
Growth required(technical progress)
BAU scenarioUnconditional NDCsConditional NDCsConsistent with 2°C targetConsistent with 1.5°C target
-1.9 -1.4-2.2 -1.4
-3.4
-1.8
-3.4
-6.1
-3.4
-9.5
-1.9
-5.3
A. Decarbonization rates required if there is no change in the trend rate of GDP growth
B. Maximum possible rates of GDP growth if there is no change in the rate of technical progress
Source: Economic Commission for Latin America and the Caribbean (ECLAC), on the basis of J. Gütschow and others, “The PRIMAP-hist national historical emissions time series (1850-2017)”, version 2.1, 2019 [online database] https://doi.org/10.5880/pik.2019.018; Economic Commission for Latin America and the Caribbean (ECLAC), CEPALSTAT, 2021 [online database] https://estadisticas.cepal.org/cepalstat/portada.html?idioma=english; World Bank, World development indicators, 2020 [online database] https://databank.worldbank.org/reports.aspx?source=world-development-indicators, and Food and Agriculture Organization of the United Nations (FAO), Corporate Database for Substantive Statistical Data (FAOSTAT), 2021 [online] http://www.fao.org/faostat/en/#home.
Note: The sources of greenhouse gas emissions are the energy, agriculture and livestock, waste, industrial processes and land-use change and forestry sectors, according to the Intergovernmental Panel on Climate Change (IPCC) classification. Comprises 133 countries. Antigua and Barbuda, Argentina, Bahamas, Barbados, Belize, Brazil, Bolivarian Republic of Venezuela, Chile, Colombia, Costa Rica, Cuba, Dominica, Dominican Republic, Ecuador, El Salvador, Grenada, Guatemala, Guyana, Haiti, Honduras, Jamaica, Mexico, Nicaragua, Panama, Paraguay, Peru, Plurinational State of Bolivia, Saint Kitts and Nevis, Saint Lucia, Saint Vincent and the Grenadines, Suriname, Trinidad and Tobago and Uruguay.
The right panel of figure V.3 shows compliance with emission reduction commitments as a constraint on growth. It is assumed that technical change maintains the trend it showed in 1990–2019, but the economic growth rates are adjusted for emission reductions in each scenario. The projected annual growth rate for Latin America and the Caribbean for 2021–2030 (2.5%) would have to be 0.3 percentage point lower for unconditional NDC targets to be met and more than 1 percentage point lower (annual growth of approximately 1.0%) for conditional NDC targets to be met.
In sum, in the absence of an acceleration of the technical shift towards decarbonization, the growth rate corresponding to the conditional NDCs and BAU in technical progress (1.0%) will be considered to be the environmentally sustainable rate. This shows that the growth rate consistent with external balance exceeds the rate of growth consistent with environmental preservation (yE > yA). This is called the environmental gap, while the difference between the social gap and the environmental gap (yS – yA), which is the sum of the social gap and the environmental gap, will be called the sustainability gap.

165
Building forward better: action to strengthen the 2030 Agenda for Sustainable Development
V
3. Combining policies to close gaps: a big push for sustainability in its three dimensions
Table V.2 summarizes the main results of the simple pathway simulation exercises for the (maximum) rate with consistent with the external constraint, the (minimum) rate of growth to eradicate poverty and the (maximum) rate of growth consistent with environmental protection. Technical progress and structural change must be able to redefine elasticities by increasing genuine competitiveness (while sustaining formal employment); they must promote the energy transition and decarbonization; and they must be accompanied by income transfers from the richest decile to the poorest decile.
Table V.2 Latin America and the Caribbean: estimates and scenarios for growth, equality and ecological and environmental sustainability to 2030
Poverty (percentages)
Emissions (gigatons of CO2
equivalent) Required ratio between income elasticities of exports and imports2020 (estimate) 33.7 3.9
Target for 2030 0 4.0 unconditional3.5 conditional
Scenarios to 2030 Assumptions
Growth withouttransfers
4% growth 17.5 4.7 1.4
2.5% growth 21.9 4.1 0.9
Growth + transfers(basic income)
4% growth 0.0 4.7 1.4
2.5% growth 7.1 4.1 0.9
Growth + transfers + decarbonization
4% growth basic income; Duplication of decarbonization rate of the economy
0.0 4.0 1.4
2.5% growth basic income; Duplication of decarbonization rate of the economy
7.1 3.5 0.9
Source: Economic Commission for Latin America and the Caribbean (ECLAC).Note: A growth rate of 2.8% for the rest of the world is assumed for the calculation of the elasticity ratio of the external gap. Two growth scenarios are
included: one of high annual growth of 4.0% and one of medium annual growth of 2.5%. The scenario excluding transfers assumes a downtrend in the Gini index of 0.8% per year.
The upper part of table V.2 shows the 2020 levels for poverty and GHG emissions and the targets for 2030: eradicate poverty and bring emissions to 4 gigatons of CO2 equivalent (GtCO2eq) in the unconditional scenario and to 3.5 gigatons of CO2 equivalent in the scenario that is conditional on international assistance. The lower part of the table shows how each variable changes under different scenarios of growth, distribution and investment in the decarbonization of the economy. These scenarios are defined based on the following criteria:
(i) GDP growth rates in Latin America and the Caribbean (4.0% and 2.5%);
(ii) Existence or not of redistribution policies through income transfers;
(iii) Existence or not of investments in the decarbonization of the economy, which could double the historical decarbonization rate;6
6 Doubling the historical decarbonization rate, which was -1.9% from 1990 to 2017, would, for example, increase the share of renewable energy in the total primary energy supply from the current 25% to 45%. From a broader perspective, in addition to generating electricity from renewable energy, accelerating the decarbonization of the economy requires taking action in different areas: renewable energy generation, energy efficiency, electromobility and modal shifts in transport, reduction of deforestation, afforestation, sustainable agriculture and livestock, waste management and green buildings, among others (ECLAC, 2020a).

Economic Commission for Latin America and the Caribbean (ECLAC)
166 V
(iv) The final column of table V.2 shows the ratio between the income elasticities of exports and imports required to achieve growth rates of 4.0% and 2.5% with external balance, assuming global growth of 2.8%. The estimated ratios should be compared with those observed in the different subregions of Latin America and the Caribbean.
The results of the exercise are as follows:
(i) Poverty reduction targets would only be achieved in the scenario that combines strong redistribution with 4% growth.
(ii) However, this rate generates emissions above the level established in NDCs. For the 4% growth rate to comply with conditional NDCs, the region would have to double its decarbonization rate. The region would have to make major efforts in terms of technical progress and structural change, combining the energy transition with new production processes and a change in consumption patterns.
(iii) The growth rate compatible with external balance is lower than the growth rate needed for equality in South America and Mexico. To maintain external balance with a growth rate of 4.0%, the ratio between income elasticities of exports and imports would have to double from 0.7 to 1.4, assuming continued global growth of 2.8%. In Central America and the Caribbean, the ratio between the elasticities would allow growth of 4.0% maintaining external balance, but high debt levels mean that this calculation underestimates the effort that these subregions would have to make to attract foreign exchange in order to meet the growth targets without hitting the external constraint ceiling.
In conclusion, bringing the rates consistent with external balance and environmental sustainability into line with the growth rate needed to reduce poverty will require a leap in genuine competitiveness in the region —and the necessary leap in technology investment— as well as a shift in the direction and pace of technical progress, decarbonization and environmental protection. This path represents not only a radical change in the development pattern, which can only be achieved with an integrated package of strategies and policies such as those discussed in the sections below, but also a major political economy challenge. At the international level, cooperation must prevail over geopolitical rivalry and conflict; at the national level, political agreements in a context of democracy must transform the culture of privilege into a culture in which equality and innovation go hand in hand (ECLAC, 2018).
D. The sectors driving the big push for sustainabilityAs mentioned in the previous section, genuine competitiveness comes from the co-evolution between changes in the productive structure and the innovation and spread of technical progress throughout the productive structure as a whole. This competitiveness requires changes in the specialization pattern towards sectors that are more dynamic in terms of technology and in terms of effective domestic and global demand. Supply-side factors (pace of learning and innovation opportunities) and demand-side factors (changes in the ratio between the income elasticity of demand for exports and imports) go hand in hand in this approach. However, as mentioned above, it is not enough for structural change to position a country competitively in more dynamic sectors; this change must also be consistent with job creation, poverty reduction and environmental protection.
Productive transformation necessarily entails a specific sectoral component, so sectoral policies are a fundamental part of the policies for the big push for sustainability. ECLAC (2020a) has identified strategic sectors in the search for sustainable productive transformation. These sectors must be the main focus of industrial and technological policies.

167
Building forward better: action to strengthen the 2030 Agenda for Sustainable Development
V
1. The energy transition: renewable energies and reduction in the use of fossil fuels
Non-conventional renewable energies (biomass, solar, wind, geothermal and biogas) accounted for 5% of total primary energy consumption in Latin America and the Caribbean in 2018, while the world average was 4%. In sectoral terms, transport is the largest final energy consumer in the region: 99% of the energy it uses comes from fossil fuels (ECLAC, 2020a). Given the trend towards electrification of the transport, residential and industrial sectors, the most efficient way to reshape the energy mix is to focus efforts on the main supplier of this input: the electricity sector.
ECLAC (2020a) has analysed the complementarity of electrical systems and the use of renewable energies in the region in three scenarios: (i) a baseline scenario, where the penetration of renewable energies is based on national energy plans and there is little integration of transmission between countries to meet the demand projected for the region by 2032; (ii) a scenario which incorporates a high proportion of renewable energy (80%, including large-scale hydropower) but maintains the same interconnections as in the baseline scenario (RE); and (iii) another scenario with high penetration of renewables and a high level of interconnection (RE+INT).
The main results in terms of the level of penetration of renewable sources are:
• Baseline scenario: energy planning by countries in the region (2018–2032), with renewables (solar, geothermal, mini hydro, biomass and ocean (0% in 2018), not including large-scale hydropower) increasing their total share of electricity generation from 12.7% to 24.6%.
• RE scenario: renewables (excluding hydropower) increase their share of the total from 12.7% to 41.1%.
• RE+INT scenario: renewables (excluding hydropower) increase their share of the total from 12.7% to 39.5%.
In the RE+INT scenario, achieving a 39.5% penetration of variable renewable sources, with their corresponding infrastructure and maintenance, would require annual investments of close to 1% of the region’s GDP from 2019 to 2032, which is less than in the baseline scenario. In addition to the energy security and environmental benefits, the development of a sustainable electricity infrastructure to promote regional interconnection based on renewable energy is an opportunity to create approximately 7 million new skilled and unskilled jobs in the region by 2030, based on the deployment of solar and wind power and biomass technologies. Moreover, if the renewable energy capital goods industry were located in Latin America and the Caribbean, just the manufacture of the necessary solar panels and wind turbines would create almost 1 million new jobs. Overall, investment in renewable technologies is an opportunity to achieve rapid recovery in the post-pandemic period (ECLAC, 2020a).
2. Sustainable mobility and urban space
In Latin America and the Caribbean, 80% of the population live in urban areas, with high demands for mobility, housing and urban planning. Electromobility offers an extraordinary opportunity for the region’s automotive industry, with multiple social and environmental benefits. The region has advantages on which it should draw: experience in the manufacture of automobiles and autoparts in countries such as Brazil, Mexico and Argentina; its large reserves of lithium and copper; and the existence of large areas well equipped for solar and wind energy which would allow the sustainable production of hydrogen at very low costs. It is also important to consider the potential of converting diesel buses to electric power, as a way of bringing electromobility into the regional market, reducing the cost of investment (50% less than buying a new electric bus), promoting the circular economy and increasing local jobs.

Economic Commission for Latin America and the Caribbean (ECLAC)
168 V
The electrification and digitalization of transport and clean energy supply create a virtuous circle, which has to be supported by adequate spatial structure in cities. Mobility and sustainable urban construction bring great environmental benefits and create employment opportunities. Getting a local industry off the ground means creating a regional urban market that ensures predictable demand, initial incentives, harmonization of regulatory and technical requirements, and standardization agreements to allow the necessary scales to be achieved.
Urban policies must be inclusive. Public policies must consider the social function of public services and their externalities, regearing investment to develop less socially segmented cities and promoting those services with a smaller environmental footprint.
3. The digital revolution: universalizing access
Latin America and the Caribbean lags behind in access to and use of digital technologies, as analysed in chapter III. This gap is all the more serious because these are the technologies that determine competitiveness and will be necessary for many of the jobs in the future. To lag behind in these technologies is to be left with only the destruction aspect of the Schumpeterian process of creative destruction.
In the post-COVID-19 world, social welfare will not be possible without digital transformation. The new digital governance model must promote equality through inclusive digital transformation, encourage the digitalization of businesses and protect data privacy and security. It must also protect economic, social and labour rights, prevent the use of digital technologies from increasing precarious working conditions, and ensure that social protection systems and their benefits are provided through digital technologies in an efficient manner and according to criteria of accessibility and ease of use (ECLAC, 2020a).
Beyond efforts in infrastructure and education, ECLAC (2020a) has proposed the provision of a digital basket comprising a laptop or tablet, a smartphone and Internet plan for those who are currently excluded from the digital economy, which would have an estimated annual cost of 1% of GDP.
Various measures can be implemented to progress towards this objective of digital inclusion. Demand subsidies could be used to help lower-income households afford telecommunications services and the basket of access devices. A regulatory sandbox could be implemented in this area, with operators being allowed to directly manage some of the resources to be provided by universal access funds or other funds set up to expand telecommunications services on a mass scale, using them to cover the costs of providing services to lower-income households. Temporary reductions could be introduced in import duties and sales taxes such as VAT on devices specified by the regulator, and public–private partnerships with suppliers and manufacturers could be encouraged to produce devices at low cost in the region (ECLAC, 2020a).
Here, too, there are opportunities to strengthen regional integration. The architecture of regional digital cooperation lacks an institutional framework for discussing and designing common policies, rules and standards. On the basis of the agreements established in the Digital Agenda for Latin America and the Caribbean (eLAC2022), ECLAC is supporting the design of strategies relating to the deployment and ownership of digitalization. These include moving towards a regional digital market that would increase trade and strengthen the digital economy through incentives, regulatory consistency, digital infrastructure integration (including 5G networks), reduction of barriers to e-commerce, promotion of digital innovations and ventures (particularly in micro-, small- and medium size enterprises, MSMEs), design of tax regimes for the digital economy, universal broadband Internet access, data protection and digital security, and competition policies (ECLAC, 2020a).

169
Building forward better: action to strengthen the 2030 Agenda for Sustainable Development
V
4. The health-care manufacturing industry
In Latin America and the Caribbean, with few exceptions, the level of development and technological sophistication of the health-care manufacturing industry is low and, therefore, it is highly dependent on the production of multinational companies and on imports from countries outside the region. The weakness of this industry was laid bare in the COVID-19 crisis, which provides some lessons.
First, the pandemic has exposed weaknesses in health systems and supply chains for key public-health inputs and equipment. Second, it has revealed the response capacity and coordination of the public and private sectors to address and resolve supply shortfalls in very short periods of time. And third, it has laid the foundation for rethinking the development of the health-care manufacturing industry from a national and regional perspective.
The following are some suggested policy directions for strengthening the health care industry in Latin America and the Caribbean.
• Invest to reduce the trade deficit, particularly with regard to more advanced products.
• Forge public-private partnerships to respond to supply shortfalls without delay.
• Adopt national efforts with a regional perspective: develop a network of regional suppliers with standards of high-quality, safe and timely supply at reasonable prices; develop mission-oriented innovation programmes implemented by regional consortia; foster the integration of training and exchanges of students and researchers; formalize mutual recognition of drug registration; develop a regional platform of clinical trials to consolidate common and recognized regulatory standards.
• Promote an international waiver for the production of medicines and equipment.
The region has significant strengths that could make this possible, namely hubs of high-quality basic research and an incipient trend towards the creation of start-ups. The agreement for joint COVID-19 vaccine production between Mexico and Argentina is a step in the right direction.
5. The bioeconomy: sustainable development based on biological resources and natural ecosystems
To benefit from the potential of the bioeconomy, the region’s greatest strength lies in its abundance of undervalued biological resources and natural ecosystems. The bioeconomy can contribute to diversifying the productive structure and increasing value aggregation in a sustainable way; for example, on the basis of a transition to agroecology, the development of value chains and diversified systems of crops native to the region, and livestock production that is low in greenhouse gas (GHG) emissions. New production methods combining digital technologies and those derived from progress in the biological sciences are areas with bioeconomy potential in the region (ECLAC, 2020a).
In order to reorganize priorities and implement new policies and alternative ways of managing natural, human and financial resources, ECLAC (2020a) proposes to strengthen the following linkages: between the bioeconomy and the sustainable use and management of biodiversity; between agroecology and nature-based solutions within the framework of the bioeconomy; and between new technologies and traditional knowledge.
Tapping into the expansion of global markets of biology-based goods and services and the potential of the bioeconomy in the post-COVD-19 context requires knowledge of the biological resources available, related scientific and technological capabilities, market potential and consumer acceptance

Economic Commission for Latin America and the Caribbean (ECLAC)
170 V
of new products. The development of an inclusive, sustainable and competitive bioeconomy involves dealing with obstacles such as the lack of appropriate regulatory frameworks, insufficient coordination of technical capabilities, restrictions on market entry by small enterprises and the lack of funds to foster the creation of innovative businesses (Rodríguez, Rodrigues and Sotomayor (2019) quoted in ECLAC (2020a)). To resolve these limitations, measures are needed in the areas of policy and regulation, research and development, innovation and support for entrepreneurship, exploitation of biological resources in a way that adds value, and market access and development. In particular, a considerable effort is needed in R&D and in innovation, especially with a view to increasing the value added and complexity of production based on biological resources.
The regulatory environment is essential. Examples of the work to be done include: development of regulatory frameworks, particularly in areas where the progress of knowledge and the application of new technologies is more rapid; building capacities to comply with regulations in target markets for bioeconomy products; harmonization between conventional products and similar bioproducts; and harmonization of criteria for classifying new products related to the bioeconomy, such as functional foods and superfoods, biopharmaceuticals, agricultural bioinputs and industrial enzymes (ECLAC, 2020a).
6. Valuing and expanding the care economy
The care economy comprises relations between paid care work in the labour market and unpaid care work to meet the needs of members of the household, other family members or members of the community. The distribution of tasks associated with the care economy reflects a social organization in which women are overrepresented in care-related jobs and in unpaid care work, which is a product of the rigid sexual division of labour. Because it is not valued in monetary terms, domestic and care work is not taken into account: economies have been organized on the assumption that there is, and always will be, “an invisible hand” that supports social reproduction. Estimates of the economic valuation of unpaid household work in the countries of Latin America and the Caribbean show figures of between 15.7% and 24.2% of GDP (ECLAC, 2021a), with women accounting for nearly 75% of this value.
The resources allocated to the care economy have positive impacts on the rest of the economy, as they increase job creation in traditionally feminized sectors, improving the quantity and quality of jobs and the income level of workers in these sectors. Higher incomes mean an increase in households’ consumption capacity, which in turn boosts economic activity and leads to a return on investment in the form of tax revenues. Thus, it is estimated that investing 2% of GDP in the health sector and care economy would see the employment rate increase by between 1.2% and 3.2% (De Henau, Himmelweit and Perrons, 2017). For example, Mexico’s universal, free, good-quality childcare system for children under six would have an average annual cost of 1.2% of GDP at 2019 levels over a five-year implementation period. This would lead to a total increase in average annual gross production value of 1.8% and a 3.9% increase in employment (UN-Women/ECLAC, 2020). Narrowing gender gaps in the labour market would have a positive impact on reducing poverty and inequality. Closing the gaps in participation could reduce poverty by between 1 and 12 percentage points and inequality —measured by the Gini coefficient— could be reduced by between 1 and 4 percentage points (ECLAC, 2014b).
In the medium and long term, investment in care sectors has positive effects on the education level of the workforce and thence on its productivity. In addition, the provision of public and social care infrastructure also has the potential to reduce the educational inequalities affecting girls and boys, especially if the quality of community-based public and private care services is regulated and controlled.
With regard to the 2030 Agenda for Sustainable Development, investing in the care economy helps in the eradication of poverty and implementation of appropriate social protection systems and measures

171
Building forward better: action to strengthen the 2030 Agenda for Sustainable Development
V
for all (SDG 1), ensuring healthy lives (SDG 3), achieving gender equality (SDG 5), promoting inclusive and sustainable economic growth (SDG 8) and reducing inequalities (SDG 10).
Beyond boosting economies, the inclusion of the care economy in COVID-19 crisis mitigation and recovery plans would enable a transformative recovery with sustainability and equality. It is therefore urgent to move towards a care society that prioritizes the sustainability of life and guarantees the rights of the persons requiring care, as well as the rights of care providers; that seeks to prevent the precariousness of jobs in this sector, improve working conditions and encourage formalization; and that highlights the multiplier effects of the sector on well-being, distribution of income and time, tax revenues, employment and economic growth.
7. Developing the circular economy
The world needs to drastically reduce use of materials and generation of waste. Recycling rates are very low in Latin America and the Caribbean, and limited to a few products, such as paper and cardboard, scrap metal, some plastics and glass. Great potential therefore exists to develop activities related to the circular economy on the basis of local production chains and, in particular, the waste management and recycling sector. The high multiplier effects on employment and direct and indirect carry-over effects of the waste and recycling sector lead to the conclusion that, if it were to become a key sector in the region’s economies and had a municipal waste recycling rate equivalent to that of Germany, it could contribute to the green economic revival: almost 450,000 stable jobs would be created and the region’s GDP would increase by 0.35% (ECLAC, 2020a).
To develop the circular economy and reduce waste generation as much as possible, a comprehensive vision is needed that leads to changes in public policies and in management, investment and financing systems throughout the life cycle of products. Industrial policies need to be accompanied by standards on the efficient use, compatibility and recyclability of inputs, including restrictions on highly toxic or low-reusability substances. Several countries in the region have or are enacting Extended Producer Responsibility (EPR) laws and are regulating or banning the use of plastic bags, particularly single-use ones. These are notable advances in the right direction. Consumer awareness must also be raised, for which it is important to promote eco-labelling systems, update consumer legislation and encourage the sharing of appliances and products, and green public procurement. To make new business viable, it is important to foster innovation and training, to align fiscal policy with sustainable production and consumption objectives, applying the polluter pays principle, and to forge regional and subregional partnerships to increase the scale and potential of new activities, and the impact of common actions or regulations.
Without forgetting the necessary and urgent investments, the shortfall of infrastructure for waste management must be addressed by promoting circularity and seeking to convert waste into resources. Strengthening waste collection and sorting systems and increasing recycling, reuse and remanufacturing rates in areas where the informal economy is significant is also a way to provide decent, formal work for grassroots collectors and recyclers, among other parties, thus contributing to recovery with equality and sustainability.
8. Sustainable recovery in the tourism sector
Tourism is one of the sectors that has suffered the most from the pandemic. Starting in April 2020, international and domestic tourist arrivals came to a virtual standstill. This not only hit Caribbean economies and employment hard, but also many local communities in Latin America.

Economic Commission for Latin America and the Caribbean (ECLAC)
172 V
Various measures have been taken in the countries of the region to mitigate the economic and social effects of the pandemic on tourism and to prepare the sector for recovery. This sector is strategic for the generation of employment and foreign exchange in several countries in the region, especially the Caribbean countries. As this is one of the most severely affected activities and one in which the labour force is largely made up of vulnerable population groups, such as youth and women, specific mitigation and support measures must be taken for the tourism sector.
The initiatives proposed for the recovery of this sector and for its expansion with a new focus on sustainability are: protection of workers; support for business survival, particularly MSMEs, throughout the tourism value chain; facilitation of recovery in the sector in the short term; and strengthening its medium-term sustainability and resilience.
This crisis is an opportunity to increase the contribution of tourism to the attainment of the 17 SDGs of the 2030 Agenda for Sustainable Development, in particular SDG 8 (decent work and economic growth), SDG 13 (climate action), SDG 14 (life below water) and SDG 15 (life on land).
E. General macroeconomic, social and environmental policies
1. A new role for fiscal policy
Since the 2008 crisis, there has been a consensus on the need to expand the use of fiscal policy, and this concept gained traction in the wake of the sharp contraction resulting from the pandemic. In 2020, fiscal and monetary policies were the most important tool used by the countries of the region to respond to the economic and social effects of the pandemic. This was reflected in the significant increase in social spending in most of the countries, accompanied by tax relief measures and liquidity for the production sector, which influenced the evolution of the public accounts in 2020.
Central to the region’s ability to improve on its recent growth performance while moving towards sustainable development is the ability to maintain expansionary fiscal and monetary policies.
On the fiscal front, in a context of slow growth and rising social costs, recovery will only be achieved through expansionary fiscal policies within a framework of fiscal sustainability focused on strengthening revenues. This would require reducing the scope for tax evasion and avoidance that currently account for around 6.1% of regional GDP, evaluating and redirecting tax expenditures that represent 3.7% of GDP on average, consolidating personal and corporate income tax, expanding the scope of capital and property taxes, and taxing the digital economy and adopting environmental and health taxes. On the expenditure side, it is necessary to prioritize employment-intensive and environmentally sustainable investment, maintain income transfers, and continue to support financing for MSMEs and strategic sectors. A central social challenge is to prioritize spending that would enable the universalization of social protection systems.
Monetary policy should maintain a pragmatic approach by combining conventional and unconventional measures, leveraging the space provided by low levels of inflation to sustain expansionary monetary policies during the recovery phase. Likewise, the regulatory framework for macroprudential measures and capital controls must be adapted to avoid any undesired effects on capital flows.
Policies must aim to ensure the survival of MSMEs, which have been the hardest hit by the crisis, as analysed in chapter III. The loss of these companies and the jobs they generate will mean the loss not only of production capacity in the short term, but also of technological and productive capacities

173
Building forward better: action to strengthen the 2030 Agenda for Sustainable Development
V
that will be essential in the medium and long term. Policy capacity to act on the supply side must be maintained in order to be able to support economic recovery efforts and to respond to an eventual upsurge in demand. ECLAC points to the need for support to ensure the survival of these companies beyond increasing the availability of credit because debt could be an unsustainable burden in the future. Similarly, the bankruptcy of those large firms whose technological capabilities, job creation or exports make them a strategic component of the production structure must also be avoided.
2. Recovery and international financial cooperation
Although fiscal positions and vulnerabilities to debt vary widely across the region, the sharp decline in fiscal revenues coupled with the response of governments to the emergency has exacerbated the debt burden, especially in small economies such as Caribbean small island developing States (SIDS). This severely limits governments’ ability to respond to the COVID-19 crisis and, in the medium term, compromises their ability to build forward better. Moreover, multilateral responses to the needs of middle-income countries have been insufficient.
The challenges faced by Latin America and the Caribbean reflect the general issues affecting middle-income countries. Given the systemic importance of these countries (which account for 30% of global aggregate demand and 96% of developing country debt, excluding China and India), the risks they face can be a drag on world growth and disrupt global financial stability.
The international community must devise a plan to counter the economic contraction and to recognize financial stability with equality as a key global public good. The ECLAC proposal focuses on three interdependent areas of action: increased liquidity, debt relief and resilience-building.
The world will not return to pre-pandemic levels of per capita GDP growth unless there is a major redistribution of liquidity from developed to developing countries to relieve adjustment pressures on developing countries and expand their policy space. The most expedient, efficient and cost-effective way to increase liquidity is through a massive issuance of special drawing rights (SDRs) and, in the short term, a reallocation of unused SDRs. Developing countries would receive about 40% (7.9% in the case of Latin America and the Caribbean) of a new issuance of US$ 500 billion in SDRs, which would expand their reserves without creating additional debt.
SDRs can be complemented by other initiatives, such as the Fund to Alleviate COVID-19 Economics (FACE), proposed by the Government of Costa Rica. This fund, equivalent to merely 3% of the GDP of low- and middle-income countries, would offer concessional funds with long repayment periods and near-zero interest rates to low- and middle-income countries that are unable to immediately mobilize additional domestic resources. Increased lending to developing economies would be facilitated by the capitalization of multilateral, regional and national development banks, improving coordination among them and making lending terms more flexible.
In addition, all countries, regardless of their income level, should have the right to debt relief, including an unconditional debt moratorium and, where necessary, debt cancellation. The Debt Service Suspension Initiative (DSSI) must become a truly global initiative: it should be expanded to include all vulnerable middle-income economies, with consideration given to extending it beyond 2021, and include all relevant stakeholders, such as the private sector and multilateral institutions.
This calls for a change in how credit rating agencies assess sovereign risk; in turn, a review of the methodologies used and, perhaps more boldly, the creation of a public credit rating agency would be necessary. Financial stability is a global public good and should not be left exclusively in the hands of the private sector.
Economic Commission for Latin America and the Caribbean (ECLAC)
174 V
Debt relief cannot be granted only under emergency conditions. It must be a permanent policy alternative, tied to the fluctuations of the economic cycle and the structural vulnerability of economies. Contingent debt instruments, as well as hurricane bonds, diaspora bonds and SDG bonds would be in line with these requirements.
Lastly, recovery efforts must be associated with resilience-building efforts, as is the case with the Caribbean Resilience Fund. The Fund links debt relief to debt sustainability by using its resources to finance environmentally-friendly industrial policies, infrastructure and general resilience-building, all of which should be a crucial component of recovery efforts and an opportunity for diversification and job creation not just in Caribbean SIDS but also in the wider region. The Caribbean Resilience Fund can be financed by reducing the total public debt of Caribbean SIDS by 12.2%, which amounts to just US$ 6.9 billion.
The Caribbean Resilience Fund combines debt relief and debt swaps with climate resilience building. In addition, there are six development priorities for integrated resilience building:
1. Food security – greater investment in agriculture and aquaculture to increase food security and self-sufficiency in the Caribbean.
2. Strengthen health infrastructure – investment in the health sector and cooperation in procuring protective health equipment, tests and vaccines.
3. Expand broadband access and promote wider use of digital platforms – ensuring equitable broadband is important for remote work. Policies for investment to expand IT infrastructure requires urgent attention.
4. Risk assessment and disaster management – revamping the Caribbean’s long-term disaster management strategy will require targeted investment in disaster-proofing infrastructure, enforcement of building codes and improved insurance, including through the Caribbean Catastrophe Risk Insurance Facility Segregated Portfolio Company.
5. Promote economic diversification – the Caribbean should explore innovative strategies for diversifying their economies both vertically and horizontally, in order to increase resilience to external shocks.
6. Enhance social protection – the fallout from the pandemic has highlighted the importance of strong social protection. The Caribbean should ensure that social programmes address the needs of the most vulnerable groups in society (Bárcena, 2020a).
The current crisis should be seen as an opportunity to reach a broad political and social consensus around ambitious reforms leading to a process of building forward better, with equality and sustainability. These goals should be at the centre of recovery. This includes universal, good quality public services —including education, health, transportation, and environmental services— and expanding access to them, thereby strengthening people’s sense of belonging and reducing differences in well-being that ignited political and social discontent in many countries even before the pandemic.
The successful implementation of this project is not contingent on its funding requirements, which are modest by any standards, especially compared to the scale of stimulus packages adopted in developed countries, where financing costs are lower and fiscal space is greater. Rather, its chances of success lie in the recognition that the only way to respond to the immediate and medium-term challenges of the systemic crisis is through collective action and solidarity.

175
Building forward better: action to strengthen the 2030 Agenda for Sustainable Development
V
Box V.1Financing the response to the COVID-19 crisis Caribbean
Increased funding allocations and sources (see table) reflect the efforts made by the subregion and the international community in channelling new funding for the COVID-19 response. The Economic Commission for Latin America and the Caribbean (ECLAC) was a strong advocate for the Caribbean at the High-Level Event on Financing for Development in the Era of COVID-19 and Beyond, which was convened by the Governments of Canada and Jamaica and by the Secretary-General of the United Nations. To address the liquidity, solvency and debt challenges facing the Caribbean, ECLAC supported member States in advocating for new resources through access to concessional resources and/or grants and the establishment of a Caribbean Resilience Fund, along with other crucial financial measures to facilitate the necessary capital investment to rebuild economic and climate resilience. The initial capitalization required is US$ 6.9 billion (12.2% of regional debt). These debt-for-climate swap initiatives have the potential to increase adaptation action in the subregion, while linking debt service and a measure of the countries’ investment capacity.
The Caribbean: Funding sources for COVID-19 recovery programmes
Institution Facility Concessional status/purpose Eligibility Eligible countries in
the CaribbeanCaribbean Development Bank (CDB)
Policy-based loans (increased the limit by US$ 140 million)
Partly concessional All member countries Concessional finance is available for Belize, Dominica, Grenada, Guyana, Haiti, Jamaica, Montserrat, Saint Kitts and Nevis, Saint Lucia, Saint Vincent and the Grenadines and Suriname (other countries can receive it through regional projects)
European Union Pandemic financing - testing and protective equipment, and testing reagents
Grants European Union member States and overseas countries and territories linked to the member States
European Union RESEMBID COVID-19 Resilience Response Facility
Grants European Union member States and overseas countries and territories linked to the member States
Food and Agriculture Organization of the United Nations (FAO)
Preventing and responding to the impact of COVID-19 outbreak on food security
Grants/Multi-sector Country and region specific/updated over time
Inter-American Development Bank (IDB)
Reprogramming of resources to focus on four priority support areas
Partly concessional All member countries Concessional finance is available for Haiti and Guyana
IMF Rapid Credit Facility Concessional loan Low-income countries and some middle-income small countries or microstates.
Dominica, Grenada, Guyana, Haiti, Saint Lucia and Saint Vincent and the Grenadines
IMF Rapid Financing Instrument Non-concessional loan
All member countries All countries
IMF Catastrophe Containment and Relief Trust
Grants for debt relief Low-income countries and some lower middle-income small countries
HTI
United Nations Population Fund (UNFPA)
Mitigating and Responding to the COVID-19 Outbreak in humanitarian settings: from Health as per UNFPA
Grants/Health Country and region specific/updated over time
United Nations Children’s Fund (UNICEF)
COVID-19 response Grants Country and region specific/updated over time
United States USAID Global Health Emergency Reserve Fund
Grants Country and region specific/updated over time
United States USAID International Disaster Assistance account
Grants Country and region specific/updated over time
World Health Organization (WHO)
Early action response to global containment of Novel Coronavirus outbreak
Grants/Multi-sector All member countries All countries
World Bank COVID-19 Fast-Track Facility - IBRD (US$ 2.7 billion)
Non-concessional loan
Middle-income countries Antigua and Barbuda, Belize, Dominica, Grenada, Jamaica, Saint Kitts and Nevis, Saint Lucia, Saint Vincent and the Grenadines, Suriname and Trinidad and Tobago

Economic Commission for Latin America and the Caribbean (ECLAC)
176 V
Institution Facility Concessional status/purpose Eligibility Eligible countries in
the CaribbeanWorld Bank COVID-19 Fast-Track Facility -
IDA (US$ 3.3 billion)Concessional loan and grants
Low-income countries and some middle-income small island economies
Dominica, Grenada, Guyana, Haiti, Saint Lucia and Saint Vincent and the Grenadines
World Bank COVID-19 Fast-Track Facility - IFC (US$ 8 billion)
Support to the private sector
Private sector
World Bank Contingency Emergency Response Components (CERC)
Reallocation from existing projects
Countries that have projects with CERCs
Dominica, Saint Lucia, Saint Vincent and the Grenadines and Suriname used this facility
World Bank IBRD Catastrophe Deferred Drawdown Option
Non-concessional Middle-income countries (IBRD eligible countries; countries must have this arrangement in advance)
Dominica used this facility
World Bank IDA Catastrophe Deferred Drawdown Option
Concessional Low income and some middle-income small island economies (IDA eligible countries; countries must have this arrangement in advance)
Dominica, Grenada, Guyana, Haiti, Saint Lucia and Saint Vincent and the Grenadines
World Bank Pandemic Emergency Financing Facility
Grants Low income and some middle-income small island economies (IDA eligible countries)
Dominica, Grenada, Guyana, Haiti, Saint Lucia and Saint Vincent and the Grenadines
World Bank IDA Crisis Response Window Concessional finance
Low income and some middle-income small island economies (IDA eligible countries)
Dominica, Grenada, Guyana, Haiti, Saint Lucia and Saint Vincent and the Grenadines
World Bank Immediate Response Mechanism Rapid Concessional finance
Low income and some middle-income small island economies (IDA eligible countries)
Dominica, Grenada, Guyana, Haiti, Saint Lucia and Saint Vincent and the Grenadines
Source: Economic Commission for Latin America and the Caribbean (ECLAC).
Box V.1 (concluded)
3. Social policies: the overdue construction of a welfare state
Since the Second World War, expansionary monetary and fiscal policies have been the pragmatic response of economists of all theoretical persuasions to severe crises. This has spared the world another Great Depression like that of the 1930s. But there are differences between this Keynesianism and that which prevailed before financial liberalization. Since the 1980s, policies have been more effective in protecting financial asset values than in protecting employment and income, particularly in countries with high levels of foreign currency-denominated debt. 7 To advance towards sustainable development, fiscal expansion must be redirected towards building a welfare state and, as discussed in the next section, investment in the sectors that are strategic for the big push.
The development of a rights-based welfare state is the great pending task facing the region’s countries. This would require reporting on inequality in society, both before and after fiscal policy action, denouncing the distributive effects of tax privileges, and redirecting investment and, in general, public spending. It also entails combating all forms of discrimination, especially those based on gender or ethno-racial status, in order to move from a culture of privilege to one of equality and efficiency. A key element is social policies that are based on rights rather than on participation in formal employment (ECLAC, 2020a). The effective exercise of citizenship is dependent on universal access to health and education, and an expansion of the supply of public goods and services from which the lower-income sectors have been systematically excluded.
7 This was the case in Latin America and the Caribbean in the 1980s and Greece and Spain during the 2008 financial crisis. In those two European countries, the impact of the 2008 crisis on unemployment was more severe than the impact of the pandemic. Similarly, financial markets recovered faster than income and employment (Chwieroth and Walter, 2017).

177
Building forward better: action to strengthen the 2030 Agenda for Sustainable Development
V
The issue of access to education becomes particularly urgent in the context of a technological revolution and the consequent threat it poses to certain types of jobs. Technology is not necessarily synonymous with higher unemployment (at least not in the countries leading the technical change), but it does mean that the skills and knowledge needed will change. This is compounded by the fact that certain labour-intensive services (such as tourism, in-person dining in restaurants and in-store shopping) have suffered heavily from the physical distancing measures imposed because of the pandemic.
An important means of universalization consists in extending the payment of direct cash transfers to the population, especially in the extreme phases of the life cycle (early childhood and old age), and to move towards providing a universal basic income as an additional pillar of the welfare regime and the social protection system, in keeping with the characteristics of each country. As analysed in box V.2, prevention of hunger must be one of the first steps towards a welfare state. Universal social protection must redistribute and ensure universal access to education and health care, and guarantee incomes for those who lose their jobs in the process of the green or digital transition (ECLAC, 2020a). The pandemic has highlighted the shortcomings and inequalities that pervade the population’s exercise of the right to health and to quality education.
Box V.2 An anti-hunger grant
In mid-2020, the Economic Commission for Latin America and the Caribbean (ECLAC) and the Food and Agriculture Organization of the United Nations (FAO) proposed an anti-hunger grant to complement the emergency basic income proposed in ECLAC (2020). To calculate the cost of the anti-hunger grant, estimates of the number of people living in extreme poverty in 17 Latin American and Caribbean countries in 2020 were used. The amount of the anti-hunger grant would be equivalent to 70% of a regional extreme poverty line (EPL).
The costs of an anti-hunger grant were calculated for three different scenarios regarding those living in extreme poverty: (i) all people living in extreme poverty; (ii) persons aged under 15; and (iii) persons aged over 65. Since some countries could make larger transfers, transfer costs were also calculated for 100% of the extreme poverty line. The results for the region as a whole are presented in figures 1 and 2 and show the annual cost of the grant estimated in January 2021, with each country defining the duration of the policy according to the impacts of the pandemic on food security and its fiscal situation.
Figure 1 Latin America (17 countries): annual cost of the anti-hunger grant with grants equivalent to 100% and 70% of the regional extreme poverty line, by population group covered, in absolute values(Billions of dollars)
100% of extremepoverty line
70% of extremepoverty line
Total population in extreme poverty Population aged under 15in extreme poverty
Population aged over 65in extreme poverty
62.4
25.7
7.7
43.7
18.0
5.4
0
10
20
30
40
50
60
70
Source: Economic Commission for Latin America and the Caribbean (ECLAC).
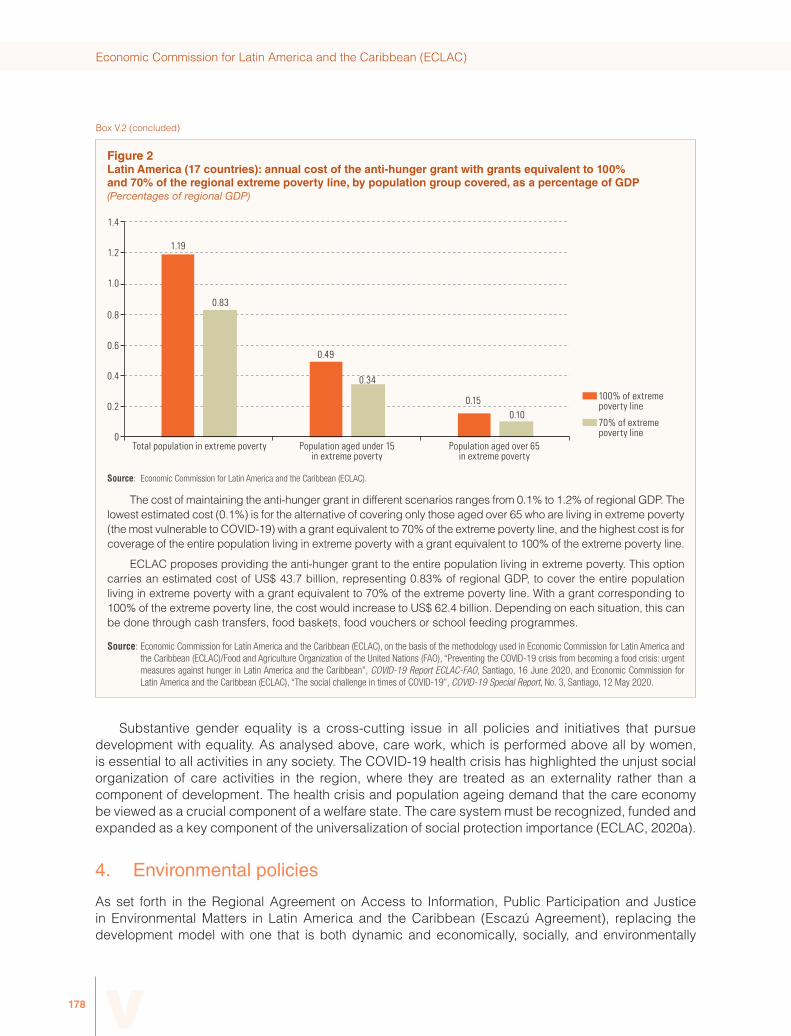
Economic Commission for Latin America and the Caribbean (ECLAC)
178 V
Box V.2 (concluded)
Figure 2 Latin America (17 countries): annual cost of the anti-hunger grant with grants equivalent to 100% and 70% of the regional extreme poverty line, by population group covered, as a percentage of GDP(Percentages of regional GDP)
100% of extremepoverty line
70% of extremepoverty line
1.19
0.49
0.15
0.83
0.34
0.10
0
0.2
0.4
0.6
0.8
1.0
1.2
1.4
Total population in extreme poverty Population aged under 15in extreme poverty
Population aged over 65in extreme poverty
Source: Economic Commission for Latin America and the Caribbean (ECLAC).
The cost of maintaining the anti-hunger grant in different scenarios ranges from 0.1% to 1.2% of regional GDP. The lowest estimated cost (0.1%) is for the alternative of covering only those aged over 65 who are living in extreme poverty (the most vulnerable to COVID-19) with a grant equivalent to 70% of the extreme poverty line, and the highest cost is for coverage of the entire population living in extreme poverty with a grant equivalent to 100% of the extreme poverty line.
ECLAC proposes providing the anti-hunger grant to the entire population living in extreme poverty. This option carries an estimated cost of US$ 43.7 billion, representing 0.83% of regional GDP, to cover the entire population living in extreme poverty with a grant equivalent to 70% of the extreme poverty line. With a grant corresponding to 100% of the extreme poverty line, the cost would increase to US$ 62.4 billion. Depending on each situation, this can be done through cash transfers, food baskets, food vouchers or school feeding programmes.
Source: Economic Commission for Latin America and the Caribbean (ECLAC), on the basis of the methodology used in Economic Commission for Latin America and the Caribbean (ECLAC)/Food and Agriculture Organization of the United Nations (FAO), “Preventing the COVID-19 crisis from becoming a food crisis: urgent measures against hunger in Latin America and the Caribbean”, COVID-19 Report ECLAC-FAO, Santiago, 16 June 2020, and Economic Commission for Latin America and the Caribbean (ECLAC), “The social challenge in times of COVID-19”, COVID-19 Special Report, No. 3, Santiago, 12 May 2020.
Substantive gender equality is a cross-cutting issue in all policies and initiatives that pursue development with equality. As analysed above, care work, which is performed above all by women, is essential to all activities in any society. The COVID-19 health crisis has highlighted the unjust social organization of care activities in the region, where they are treated as an externality rather than a component of development. The health crisis and population ageing demand that the care economy be viewed as a crucial component of a welfare state. The care system must be recognized, funded and expanded as a key component of the universalization of social protection importance (ECLAC, 2020a).
4. Environmental policies
As set forth in the Regional Agreement on Access to Information, Public Participation and Justice in Environmental Matters in Latin America and the Caribbean (Escazú Agreement), replacing the development model with one that is both dynamic and economically, socially, and environmentally

179
Building forward better: action to strengthen the 2030 Agenda for Sustainable Development
V
sustainable requires a population endowed with a greater understanding of the social and environmental footprints of the current development style, and of the implications of major investment decisions and their effects on climate change and biodiversity. The shift in relative profitability towards investments for sustainability requires the gradual elimination of illegitimate cost advantages or savings (externalities) in the production system, which are harmful to nature or health (ECLAC, 2020a).
There must be strong linkages between environmental policies and the fiscal policies mentioned above. The transformative recovery that ECLAC proposes calls for an expansionary fiscal policy that not only protects the employment and incomes of the most vulnerable groups but also helps to build the technological and productive foundations of a new growth pattern. Environmental sustainability must guide public investment and the framework for private investment incentives and technological innovation in the coming decades.
It is imperative to direct investment toward sectors that are strategic for the big push, which also have a high potential for job creation. Such investment should aim not only to mitigate the environmental impact of climate change but also to adapt to it —an issue that is especially important for Latin America and the Caribbean, which contributes little to generating climate change but is highly vulnerable to its effects.
Some policy instruments that contribute to this objective could include:
• Introduce environmental taxes or adjust existing ones to make resource use more efficient and shift the profitability of production and consumption patterns towards alternatives with a smaller environmental footprint (ECLAC, 2020a).
• Gradually eliminate unjustified tax incentives and perverse subsidies, especially inefficient and socially regressive subsidies on fossil fuels that benefit high- and middle-income sectors and power groups, such as those in energy-intensive industries and their distributors (ECLAC, 2020a).
• Develop and implement methodologies for investment evaluation that recognize environmental advantages, particularly in the case of public investment (Bárcena and others, 2020).
• Promote regulatory frameworks that support local production in the new sectors related to the energy transition and environmental sustainability, with a gradual increase in the requirements for domestic components in emerging value chains, tenders that allow producers to gain access to financing, and certainty in the demand for alternative production (ECLAC, 2020a).
• Promote reforestation and afforestation as well as the recovery of wetlands, degraded areas and the protection of aquifers; stop deforestation and desertification. These activities that can contribute significantly to employment generation. They have a major local impact and help to disseminate policies more widely. In the same vein, action must be taken to protect biodiversity and prevent the extinction of endangered species.
• Measure development and well-being, not just market transactions. When prices subsume all other values, they do not accurately reflect the value of well-being, nor the ecological value of protecting biodiversity; countries’ performance should not be measured by GDP alone. The United Nations, as the world’s statistical authority, should establish a methodology and set an effective date for moving from the current metric to a better official criterion, and adapt regular reports to reflect this change. This task would be undertaken in cooperation with other broad-scope statistical offices, such as the Statistical Office of the European Union (Eurostat) and the national statistical offices and institutes of the region, with the coordination of the Statistical Conference of the Americas (ECLAC, 2020a).

Economic Commission for Latin America and the Caribbean (ECLAC)
180 V
Environmental sustainability policies encompass education and changes in the concept of well-being on the consumption side, and structural change and technological innovation on the production side. The need to build endogenous technological capacities in the region is clear: ecological systems are complex systems that require research and specific solutions, and this in turn calls for a leap forward in local capacities. These capacities cannot be imported; expertise in research and development and production has to be developed. In parallel, local capacity creates employment and fosters social and policy support for environmental protection efforts. Such support helps to make policies more effective, particularly when there is trust between the various public and private stakeholders working together (see box V.3).
Box V.3 Building trust and encouraging fair treatment to streamline the implementation of the 2030 Agenda
In any compact for development, building social trust is essential for peaceful and inclusive societies, facilitating access to justice and building effective, accountable and inclusive institutions. Societies in which there is greater cooperation to achieve common goals and strong adherence to social norms are better prepared for emergencies such as the COVID-19 pandemic (Min, 2020). Relationships of trust with local communities are key for sustainable management of natural resources, as evidenced in mining projects (Moffat and Zhang, 2014; Global Witness, 2019). Social trust is an enabler in government programmes that aim for structural reforms. Amid the current climate emergency, investing in building social trust can have a positive effect on both the environment and development (see figure 1).
Figure 1 The relationship between environmental performance and trust
0
10
20
30
40
50
60
70
80
25 35 45 55 65 75 85 95
Trus
t
Environmental performance
Relationship between environmental performance and trust
Linear value
Source: Economic Commission for Latin America and the Caribbean (ECLAC), on the basis of C. Haerper and others, World Values Survey, 2020 [online database] https://www.worldvaluessurvey.org/WVSDocumentationWV7.jsp, and Yale University, “Environmental Performance Index”, 2020 [online] https://epi.yale.edu/.
Strengthening the rule of law, establishing fair and non-discriminatory treatment and creating the perception of equal treatment before the law for all are essential to building trust and lead to a reduction in illegal activities, corruption and bribery (see figure 2 on indicator 16.5.2 of the Global indicator framework for the Sustainable Development Goals and targets of the 2030 Agenda for Sustainable Development).
Legal guarantees of access to information and the protection of fundamental freedoms, particularly in times of a pandemic, facilitate the work of those who protect the environment and promote alternatives to development based exclusively on the extraction and exploitation of natural resources, and who have sometimes faced criminalization and persecution. In 2018, two thirds of the 212 global murders of environmental defenders occurred in Latin America (Global Witness, 2020). The region has made progress (see figure 3 on indicator 16.10.2) and 24 countries in Latin America and the Caribbean have signed the Escazú Agreement, a regional agreement to advance environmental democracy. The Agreement aims to reduce socio-environmental conflicts through the effective application of the rights of access to information, participation and justice in environmental matters, and will improve citizens’ trust in their institutions and policies to achieve sustainable development by strengthening democracy and regional integration.

181
Building forward better: action to strengthen the 2030 Agenda for Sustainable Development
V
Figure 2 Indicator 16.5.2: proportion of businesses that were asked for at least one bribe, 2018(Percentages)
0
2
4
6
8
10
12
Central America South America Latin America and the Caribbean
The Caribbean
Source: Economic Commission for Latin America and the Caribbean (ECLAC), on the basis of United Nations, Global Sustainable Development Goals Indicators Database, 2020 [online] https://unstats.un.org/sdgs/indicators/database/.
Figure 3 Indicator 16.10.2: number of countries that adopt and implement constitutional, statutory and/or policy guarantees for public access to information, by year of adoption
No data
Yes
Mexico, 2002
Argentina, 2016
Chile, 2008
Bolivia (Plur. State of), 2005
Peru, 2003
Ecuador, 2004Colombia, 1985
El Salvador, 2011
Guatemala, 2008
Uruguay, 2008
Paraguay, 2014
Brazil, 2011
Trinidad and Tobago, 1999
Panama, 2002
Dominican Rep., 2004
Nicaragua, 2007Honduras, 2006
Belize, 1994
Source: Economic Commission for Latin America and the Caribbean (ECLAC), Observatory on Principle 10 in Latin America and the Caribbean, 2021 [online] https://observatoriop10.cepal.org/en.
Source: Economic Commission for Latin America and the Caribbean (ECLAC), on the basis of de J. Min, “Does social trust slow down or speed up the transmission of COVID-19?”, PLOS ONE, vol. 15, No. 12, December 2020; K. Moffat and A. Zhang, “The paths to social licence to operate: an integrative model explaining community acceptance of mining”, Resources Policy, vol. 39, March 2014; and Global Witness, Enemies of the State? How Governments and Business Silence Land and Environmental Defenders, London, July 2019.
Box V.3 (concluded)

Economic Commission for Latin America and the Caribbean (ECLAC)
182 V
F. Conclusion: towards a sustainable global economy with national policies for a big push and multilateral coordination in the international system
This chapter set forth the arguments for a transformative recovery: the immediate response to the crisis must, at the same time, lay the foundations for the emerging development pattern to overcome the central problems of the old —inequality, slower and more unstable growth and environmental degradation. To this end, the response must encompass the social, economic and environmental dimensions. The policies for the big push for sustainability aim to provide such an integrated response, exploring the complementarities between various goals and, in particular, the virtuous circles that can be created between equality and local capacity-building.
In a world where externalities and increasing returns are widespread, the State has a fundamental role to play in coordinating the efforts of agents and in the direct or indirect provision of public goods. The 2008 crisis and the pandemic have greatly expanded the role of the State. This opens up significant space for using fiscal and industrial policies to promote structural change in the region. At the same time, it reinforces the importance of furthering equality and the democratic control of the State to ensure that its expanded powers are not used to serve the interests of the most powerful groups, especially because economic power is highly concentrated in the region.
Building trust and creating a common project and a culture of cooperation and rights —rather than a culture of privilege in which the rights of others are denied— is a challenge that the region will need to address in the coming years if the policies for the big push are to be effectively implemented.
Meanwhile, in a highly interdependent world, for national efforts to succeed there must also be international cooperation. The field of international relations is rife with examples of the prisoner’s dilemma: in this dilemma, cooperation strategies are the only way to avoid the less favourable outcomes that result from a failure to cooperate, with each player seeking their own short-term self-interest, which results in equilibriums that have a negative impact on the actors involved. Rivalry leads to what Amartya Sen (1986) defined as the world of “rational fools” (the absence of cooperation causes apparently rational actors to make decisions that undermine their own well-being). This is illustrated by two examples below.
The use of expansionary fiscal policies (for example, by means of public investment in the energy transition) can help sustain aggregate demand in a crisis. However, this expansion implies a higher demand for imports. If other countries do not pursue similarly expansionary fiscal policies, the external imbalance will force the country that implemented the counter-cyclical policy in the first place to abandon it in short order. This is especially true in countries that do not issue an international reserve currency and rely on external financing to correct current account imbalances. As a result, global growth slows. Moreover, large current account imbalances can fuel global financial flows that destabilize domestic and international financial markets. This can only be rectified with global cooperation, through coordinated expansionary fiscal policies and adjustments conducted by boosting the exports of deficit countries.
A second example can be seen in environmental protection policies. The pursuit of growth in many countries with little regard for the environmental cost means that the rest of the world is expected to make the necessary adjustments so that greenhouse gas levels and the destruction of natural resources will not lead to an environmental disaster. As a result, the environmental effort falls far short of what is needed to achieve the science-driven targets for avoiding such a disaster. Each country expects the other to control emissions, or at least aims to minimize its own contribution to this task.

183
Building forward better: action to strengthen the 2030 Agenda for Sustainable Development
V
The proposed Global Green New Deal aims to solve both of these prisoner’s dilemmas. Expansionary fiscal policies for environmentally-friendly investments should be coordinated at the international level so that deficit countries are not forced to make a recessionary adjustment that would compromise the goals of full employment and universal protection. At the same time, by guiding these investments —in line with industrial policies around the broad axes discussed above— growth would be kept within planetary boundaries. In both these examples, multilateral cooperation is indispensable: in the first, for producing a global public goods (a sound policy) that would result in more stable growth that is better balanced among countries, and in the second, for securing environmental services for this and future generations.
At the same time, a deal such as this should not be limited to environmental issues. It must also focus on tackling inequality and protecting full employment and the welfare state, the weakening of which has been one of the main drivers of discontent in advanced and developing economies alike. Issues related to access to technology, the barriers posed by the patent regime and the need for trade and investment agreements to leave space for development policies in the periphery are critical concerns for a renewed multilateral system.
Multilateral agreements for the provision of global public goods are political agreements and, as such, whether or not they are concluded depends on the outcome of clashes of interests and power between different stakeholders (public and private, government and non-governmental). In this sense, it should be noted that the region has been losing influence in the international system, as Latin America and the Caribbean has been eclipsed by the rising technological and market power of Asian countries. This could be offset, albeit partially, if the region spoke with one voice in the international arena. However, regional integration is at an inauspicious juncture, as rifts and a lack of open dialogue between governments persist. This is a reflection of political divisions and low intraregional trade, with countries in the region more concerned about their links with other parts of the world than with their neighbours. This stands in sharp contrast to the importance of intraregional trade in other regions. While there has been considerable progress in regional integration in Asia and Africa, in Latin America and the Caribbean it has stalled or even reversed.
In the analysis of sectoral policies for the big push, mention was made of the key role that regional integration could play, for example, in reducing energy costs and promoting intraregional specialization processes that would make it possible to produce certain goods and services in the strategic sectors for the big push. An additional advantage would be to strengthen the region’s voice in the global discussion on the new multilateralism. Regional integration is a part of development strategies and therefore involves the same dilemmas and scenarios discussed at the beginning of the chapter, namely the choice between business-as-usual, rivalry and cooperation. The benefits offered by cooperation are substantial, and it is this potential that may explain the resilience of the integration project, despite the many challenges and setbacks it has endured since the earliest efforts were undertaken, with the support of ECLAC, in the 1950s.

Economic Commission for Latin America and the Caribbean (ECLAC)
184 V
Bibliography
Acemoglu, D. and J. Robinson (2019), The Narrow Corridor: States, Societies, and the Fate of Liberty, New York, Penguin Press.
Bárcena, A. (2020a), “The Caribbean outlook: towards recovery and resilience building in the Caribbean post COVID-19”, document prepared for the thirty-eighth session of ECLAC, October [online] https://periododesesiones.cepal.org/38/sites/pses38/files/presentations/201026_final_caribbean_outlook_con_mapa_completo.pdf.
(2020b), “Construir un nuevo futuro: una recuperación transformadora con igualdad y sostenibilidad”, document prepared for the thirty-eighth session of ECLAC, October [online] https://www.cepal.org/sites/default/files/presentation/files/version_final_final_alicia_barcena_pses-construir_el_futuro.pdf.
Bárcena, A. and others (2020), The climate emergency in Latin America and the Caribbean: the path ahead – resignation or action?, ECLAC Books, No. 160 (LC/PUB.2019/23-P), Santiago, Economic Commission for Latin America and the Caribbean (ECLAC).
Blecker, R. and M. Setterfield (2019a), “Balance-of-payments-constrained growth I: Thirlwall’s law and extensions”, Heterodox Macroeconomics: Models of Demand, Distribution and Growth, Cheltenham, Edward Elgar Publishing.
(2019b), “Balance-of-payments-constrained growth II: critiques, alternatives and syntheses”, Heterodox Macroeconomics: Models of Demand, Distribution and Growth, Cheltenham, Edward Elgar Publishing.
Botta, A. (2018), “The long-run effects of portfolio capital inflow booms in developing countries: permanent structural hangovers after short-term financial euphoria”, Production Development series, No. 221, Santiago, Economic Commission for Latin America and the Caribbean (ECLAC).
Braudel, F. (1980), “History and the Social Sciences: the longue durée”, On History, Chicago, The University of Chicago Press.
Chwieroth, J. and A. Walter (2017), “Banking crises and politics: a long-run perspective”, International Affairs, vol. 93, No. 5, September.
ECLAC (Economic Commission for Latin America and the Caribbean) (2021a), Social Panorama of Latin America 2020, Santiago, forthcoming.
(2021b), “The economic autonomy of women in a sustainable recovery with equality”, COVID-19 Special Report, No. 9, Santiago, 10 February.
(2020a), Building a New Future: Transformative Recovery with Equality and Sustainability (LC/SES.38/3-P/Rev.1), Santiago.
(2020b), Preliminary Overview of the Economies of Latin America and the Caribbean, 2020 (LC/PUB.2020/17-P), Santiago.
(2020c), “Sectors and businesses facing COVID-19: emergency and reactivation”, COVID-19 Special Report, No. 4, Santiago, 2 July.
(2020d), “The social challenge in times of COVID-19”, COVID-19 Special Report, No. 3, Santiago, 12 May. (2018), The Inefficiency of Inequality (LC/SES.37/3-P), Santiago. (2014), Compacts for Equality: Towards a Sustainable Future (LC/G.2586(SES.35/3)), Santiago.ECLAC/FAO (Economic Commission for Latin America and the Caribbean/Food and Agriculture Organization of the
United Nations) (2020), “Preventing the COVID-19 crisis from becoming a food crisis: urgent measures against hunger in Latin America and the Caribbean”, COVID-19 Report ECLAC-FAO, Santiago, 16 June.
Evans, P. (1992), “The State as problem and solution: predation, embedded autonomy, and structural change”, The Politics of Economic Adjustment: International Constraints, Distributive Conflicts and the State, S. Haggard and R. Kaufman (eds.), Princeton, Princeton University Press.
IMF (International Monetary Fund) (2020), World Economic Outlook: a Long and Difficult Ascent, Washington, D.C., October.Rivarola Puntigliano, A. (2011), “‘Geopolitics of integration’ and the imagination of South America”, Geopolitics,
vol. 16, No. 4.Rodríguez, A., M. Rodrigues and O. Sotomayor (2019), “Towards a sustainable bioeconomy in Latin America and the
Caribbean: elements for a regional vision”, Natural Resources and Development series, No. 191 (LC/TS.2019/25), Santiago, Economic Commission for Latin America and the Caribbean (ECLAC), June.
Sen, A. (1977), “Rational fools: a critique of the behavioral foundations of economic theory”, Philosophy & Public Affairs, vol. 6, No. 4.
Sunkel, O. (2006), “En busca del desarrollo perdido”, Problemas del Desarrollo: Revista Latinoamericana de Economía, vol. 37, No. 147.

185
Concluding remarks
In an increasingly uncertain world, the decade of action for the implementation of the 2030 Agenda for Sustainable Development and its 17 Sustainable Development Goals (SDGs) is a reference point and a road map. In the face of growing tensions at both the domestic and international levels, the SDGs are an organizing framework that reflects the broad consensus of governments and civil society around sustainable development with equality at the centre and conflict reduction. This document recognizes that key reference, proposes strategies to bring Latin America and the Caribbean closer to achieving the SDGs, and estimates how much progress has been made and how much remains to be done to meet the targets. It thus contributes to the formulation of policies in line with the Goals and to the combination of the response to the structural problems of the region with the urgent need to address the critical situation arising from the COVID-19 pandemic. The remaining challenge is to determine the order of implementation and assess the synergies between the SDGs in order to move more effectively and quickly towards what ECLAC has called “a transformative recovery”.
The levels of uncertainty, conflict and instability seen in the last decade are not inevitable in the international system. They are the result of the political decisions taken since the collapse of the Bretton Woods system half a century ago. A new international order based on multilateral cooperation and the provision of global public goods, and the national policy spaces needed for balanced growth and the building (or expansion) of a welfare state, failed to materialize. Rather, global asymmetries have worsened and the divide between developed and developing countries has deepened. Moreover, the latter now include emerging economies or middle-income countries that face disparities with the developed world and, even so, are not duly considered in the framework of international cooperation, both in terms of financing and of combating and adapting to environmental emergencies.
Instead, hyperglobalization operated under the assumption that global order and stability would be guaranteed by the liberalization of markets, especially the financial markets. There would be global consumers and global producers, but no global citizens. Indeed, the very mantra of hyperglobalization —”there is no alternative”— so often cited in the 1990s, posited the end of politics and choice (except in the context of the market). The growing geopolitical rivalry in the international system, the worsening of inequality and the resurgence of authoritarian and xenophobic movements have shown the weakness of that strategy. This document reaffirms the importance of politics and the negotiation of agreements in a democratic State, and of a multilateral system based on cooperation.
The global economy and, in particular, the economies of Latin America and the Caribbean, were already experiencing structural problems, which were exacerbated by the crisis resulting from the pandemic. While achieving the SDGs was already an extremely difficult task before the crisis, the economic contraction it triggered, associated with rising unemployment and inequality, has made it even more unlikely that the Goals will be achieved (except, temporarily, those related to emissions). At the same time, the crisis has made political and economic actors more aware of the vulnerabilities of the previous development model, and of the need for international cooperation and solidarity to solve global problems such as climate change and the pandemic. The effects of the pandemic on health systems and the most vulnerable groups have highlighted the importance of the care economy and the asymmetrical burden on women, who have suffered the most from the economic and social repercussions of the crisis: they are on the front line in the response in the health sector, and have been particularly affected by the drastic fall in employment and income in the services sector.

Economic Commission for Latin America and the Caribbean (ECLAC)
186
The crisis has also shown the potential of public policies to address shocks and lessen their impacts. Responses to the crisis have included increasing public spending and income transfers to previously unthinkable levels, which has prevented economies from collapsing and enabled the nascent recovery. Some countries have not seen an explosion in poverty levels because of income transfers, and in many cases, jobs have been sustained as a result of direct public policy support. Even analysts and public and private institutions that traditionally opposed State action now recognize the need for such intervention. Although countries have responded differently and their experiences have been very mixed, the crisis has demonstrated society’s capacity to promote innovative and rapid solutions to shocks; the greater the political consensus and the greater the transparency of public intervention, the more effective these solutions have been. This document provides the countries of Latin America and the Caribbean with specific proposals in which the response to the crisis is coordinated with a change in the development model and short-term policies are linked to the solution of long-term structural problems: inequality, technological and productive gaps and environmental destruction. As the response to the pandemic has shown, the world and its institutions are not yet ready to address these issues collectively and simultaneously. Especially in the current climate, if the model for the production and distribution of vaccines against the virus remains unchanged, unequal access will create islands of immunity around the world that will make cooperation to defeat the pandemic even more difficult.
At the national level, the proposal for a big push for sustainability grants a key role to public investment and the building of endogenous capacities and a welfare state, based on the policies and sectors identified in the document. This must go hand in hand with a new multilateral order in which financing for development, global coordination of investments in the energy transition and the fight against climate change involve full recognition of the bonds of solidarity that must connect citizens of different countries, whose well-being depends on the resolution of global problems.
The Forum of the Countries of Latin America and Caribbean on Sustainable Development is the ideal setting to convey the message of this document: the need to re-establish politics and democratic agreements as an essential part of the solution to the economic and social problems of Latin American and Caribbean societies. The uncertainty and perplexity caused by the pandemic have been a painful reminder of the importance of agreements and collective action. In a world leaning towards greater regionalization, Latin America and the Caribbean must move beyond bilateral approaches and reinvigorate regional integration to foster a transformative recovery. Regional integration is necessary for a more rapid transition to a new development model, with lower costs and higher productivity, the leveraging of economies of scale in infrastructure investment, the creation of new economic activities and jobs and the encouragement of technological research and development for innovation. Moreover, integration would give the region a more influential voice in the debate about the international rules that would govern trade, investment, technology and the environment in the near future.
It is essential to restore the concept of citizenship and equal rights in order to structure a new cycle of development policies focused on growth, employment, sustainability and equality. Action to strengthen the 2030 Agenda, the SDGs and the decade of action is —and will increasingly be— the foundation for building forward better.

LC/FDS.4/3/Rev.1